In this weekly market update, we take a look at the state of the market – We also analyze setups in theBroad Market, Ethereum, Bitcoin, Teladoc, Shopify, Magnite, Twilio, Roku
In this weekly market update, we take a look at the state of the market – We also analyze setups in Ethereum, Bitcoin, Snap, Crowdstrike, Sea Limited, Fubo, Arkk, Atomera, Teladoc
Below is the LTBH webinar on Twilio for anyone who missed it. This is a 1-hour intensive and deep dive into a high conviction company that I hold once per month.
Quick note on the website: if you encounter any issues at all, please try clearing your cookies. We had a bug with some browsers after setting up the OAuth access with the forum.
Thanks – let’s see how Snap comes in this week.
Timestamps
02:33 – Intro
04:15 – Presentation Overview
07:12 – What is Twilio
08:34 – Overview on Twilio
10:39 – Is Twilio Reaching SAM
12:36 – Twilio’s Auspicious Position
15:26 – 3 things for the Win
17:29 – How does SendGrid fit in?
21:11 – What this achieves competitively – Breaks down silos
Below is the LTBH webinar on Twilio for anyone who missed it. This is a 1-hour intensive and deep dive into a high conviction company that I hold once per month.
Quick note on the website: if you encounter any issues at all, please try clearing your cookies. We had a bug with some browsers after setting up the OAuth access with the forum.
Thanks – let’s see how Snap comes in this week.
Timestamps
02:33 – Intro
04:15 – Presentation Overview
07:12 – What is Twilio
08:34 – Overview on Twilio
10:39 – Is Twilio Reaching SAM
12:36 – Twilio’s Auspicious Position
15:26 – 3 things for the Win
17:29 – How does SendGrid fit in?
21:11 – What this achieves competitively – Breaks down silos
In this market update, we outline some promising broad market signals, which support a potential leg higher – We also outline levels within the NASDAQ100, as well as a potential path forward.
We then outline setups in:
Ethereum, Voyager, Star Peak Energy, Futu, Fubo, Chainlink, Twilio
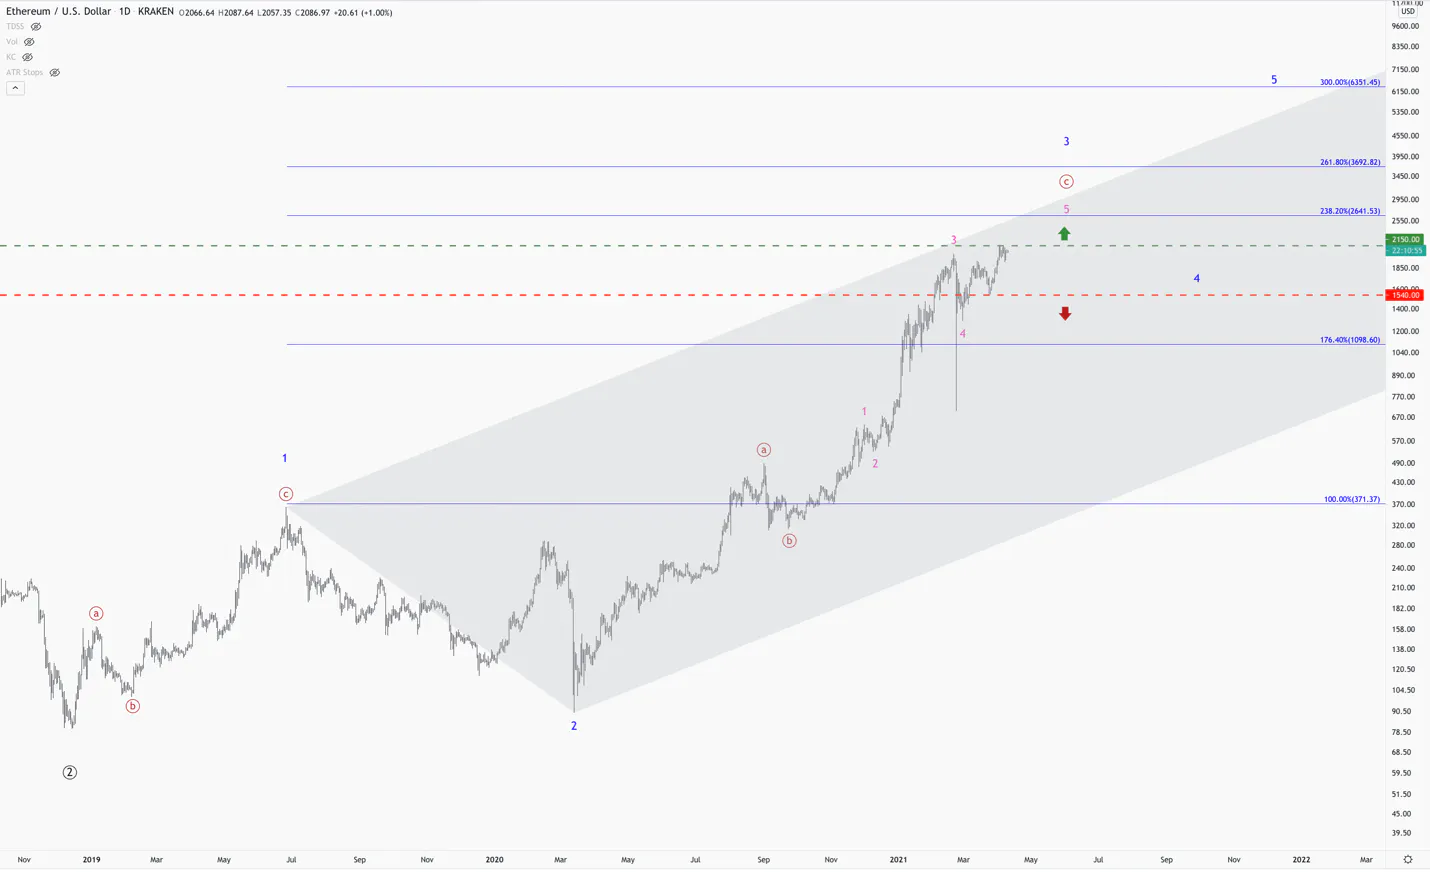
· After breaking out to all-time highs, ETHUSD is currently consolidating at the highs. This is bullish price action, and encouraging for a continued move higher.
· I believe Ethereum is in the final move of a smaller-degree 3rd wave (magenta).
· A breakout above 2150 will confirm this move. A break down below 1540 will suggest that this 3rd wave we are tracking is likely over. This scenario will give way to a large correction, which should setup a nice buying opportunity.
· We are allocated for both scenarios. If we move higher, we should see a nice gain with our 2% allocation. It appears that this is the higher probability scenario as of now. However, if the 4th wave correction happens early, we will use that opportunity to continue to build out our position.
· The long-term uptrend in ETHUSD is currently in line with the fundamental thesis that Beth laid out.
Voyager (VYGVF)
Summary
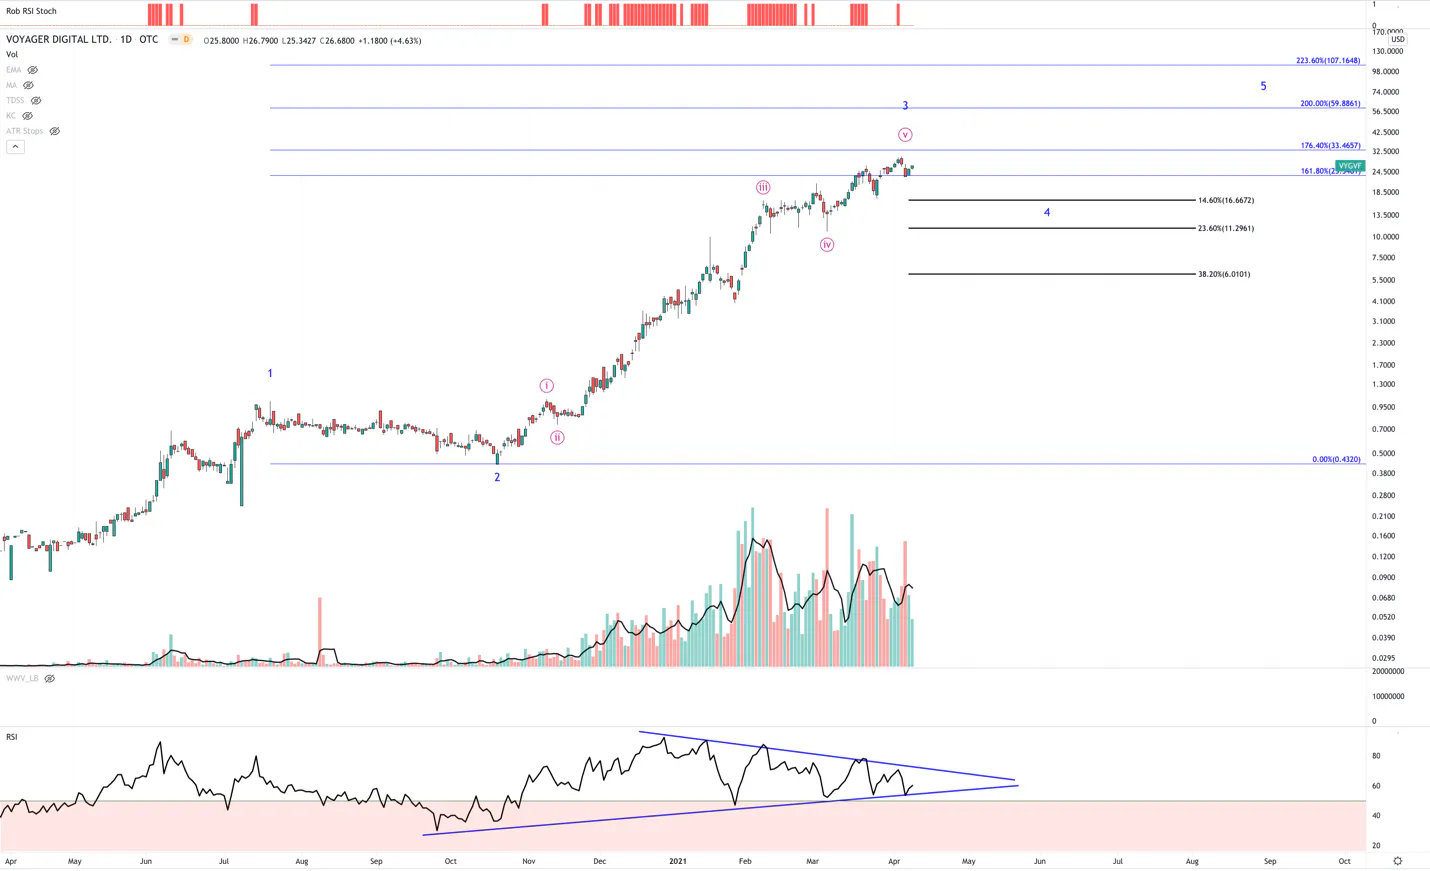
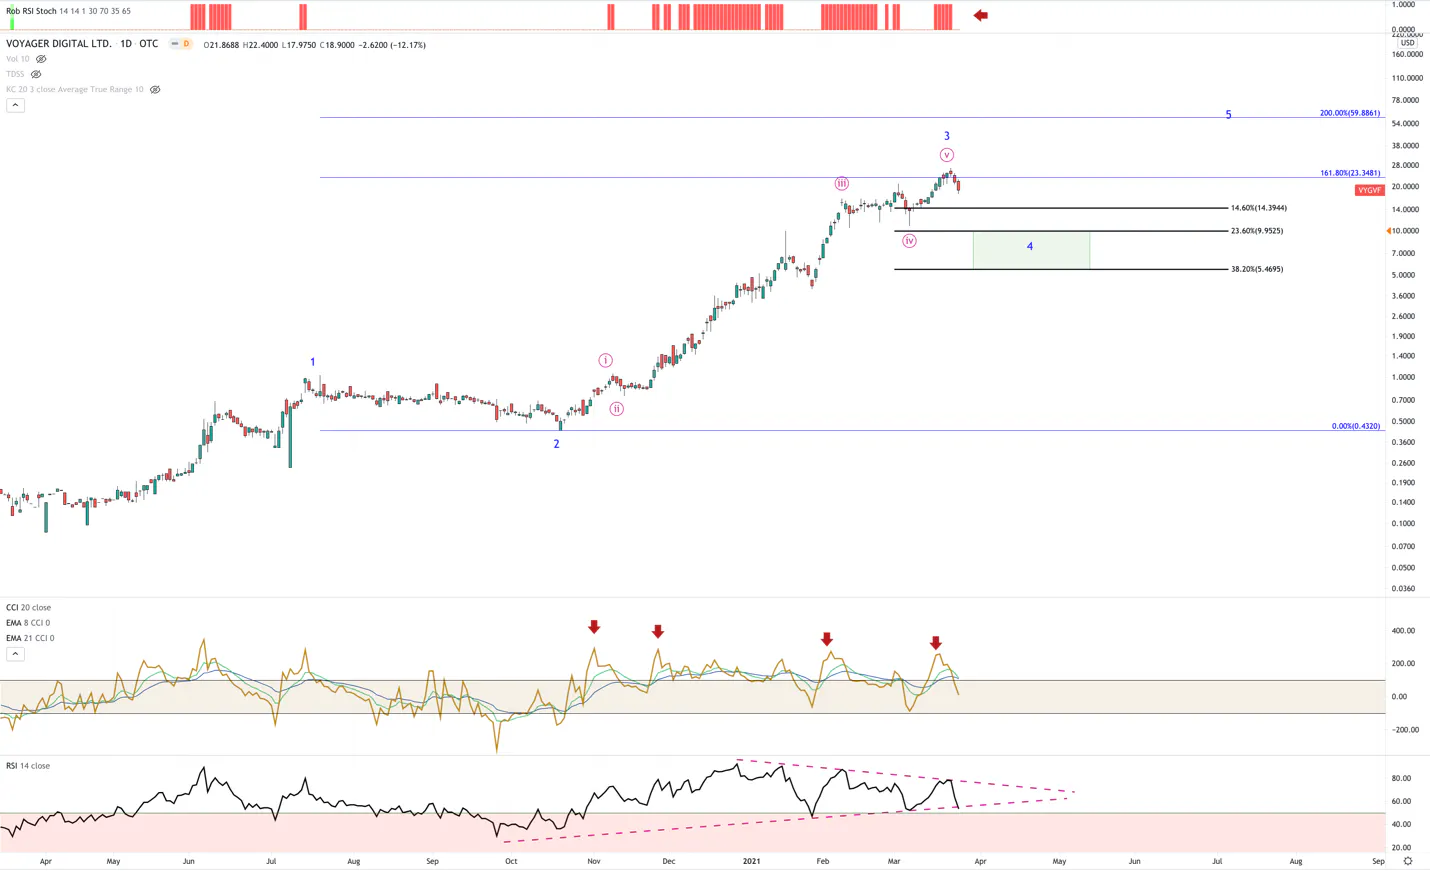
· Voyager continues to provide warnings of a potential 3rd wave top.
· First off, we are clearly in a 3rd wave – note the parabolic price trend, the volume rush, which is accompanied by peak technical momentum in the RSI.
· The question remains – can Voyager extend this trend?
· We do have a complete 5 wave pattern (in magenta) in place. Also, the price is currently at the most likely spot that we see 3rd waves end (the 161.8% extension in blue).
· Also, the internals are still quite weak. The RSI is coming to an inflection point after showing a strong negative divergence. The volume trend is slowing, with less buyers showing up at higher prices, and we have another cluster of overbought signals.
· The fundamental story is really strong, and we view any correction to be a buying opportunity.
· We will wait for this correction to manifest before adding to our position.
Star Peak Energy (STPK)
Summary
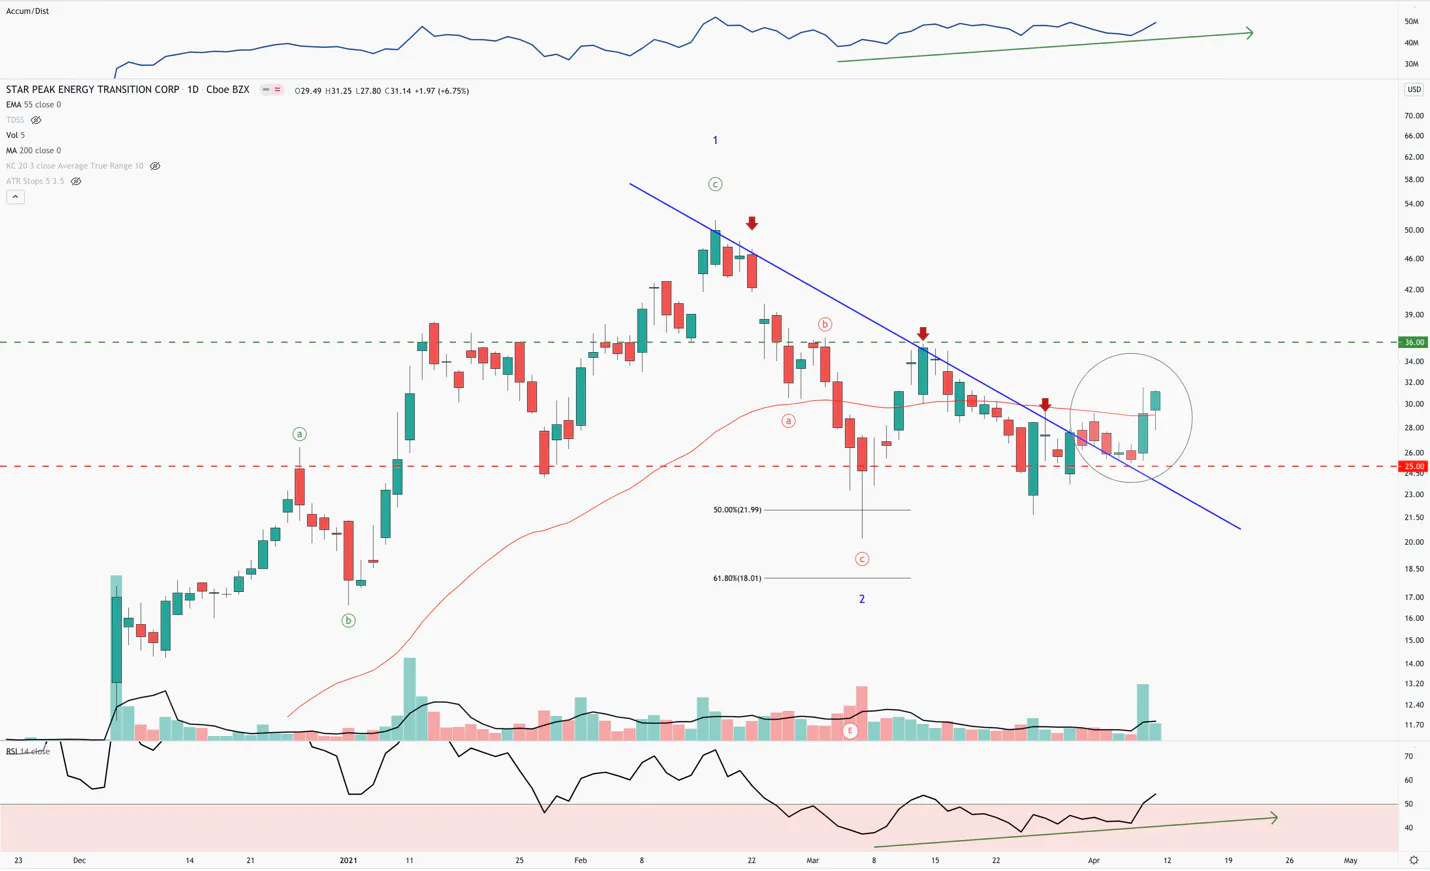
· STPK appears to have bottomed.
· We have a symmetrical 3 wave drawdown (follow the red a,b,c), as well as a potential bottom at the 50% – 61.8% retrace of the 1st wave. These are strong signs that usually accompany a 2nd waves bottom.
· Furthermore, note how the blue trend line has kept price bottled up.
· We recently had a breakout above this trendline, a retest of the breakout, and then a heavy volume move forward, which closed above the 55-day moving average (in red). This is bullish price action, which further supports a potential bottom being in place.
· Above $36 and we can say goodbye to this correction. A break below $25 and we can expect a lower low before this correction is over.
· We love this story and will likely look to continue to add to this position in time.
Futu (FUTU)
Summary
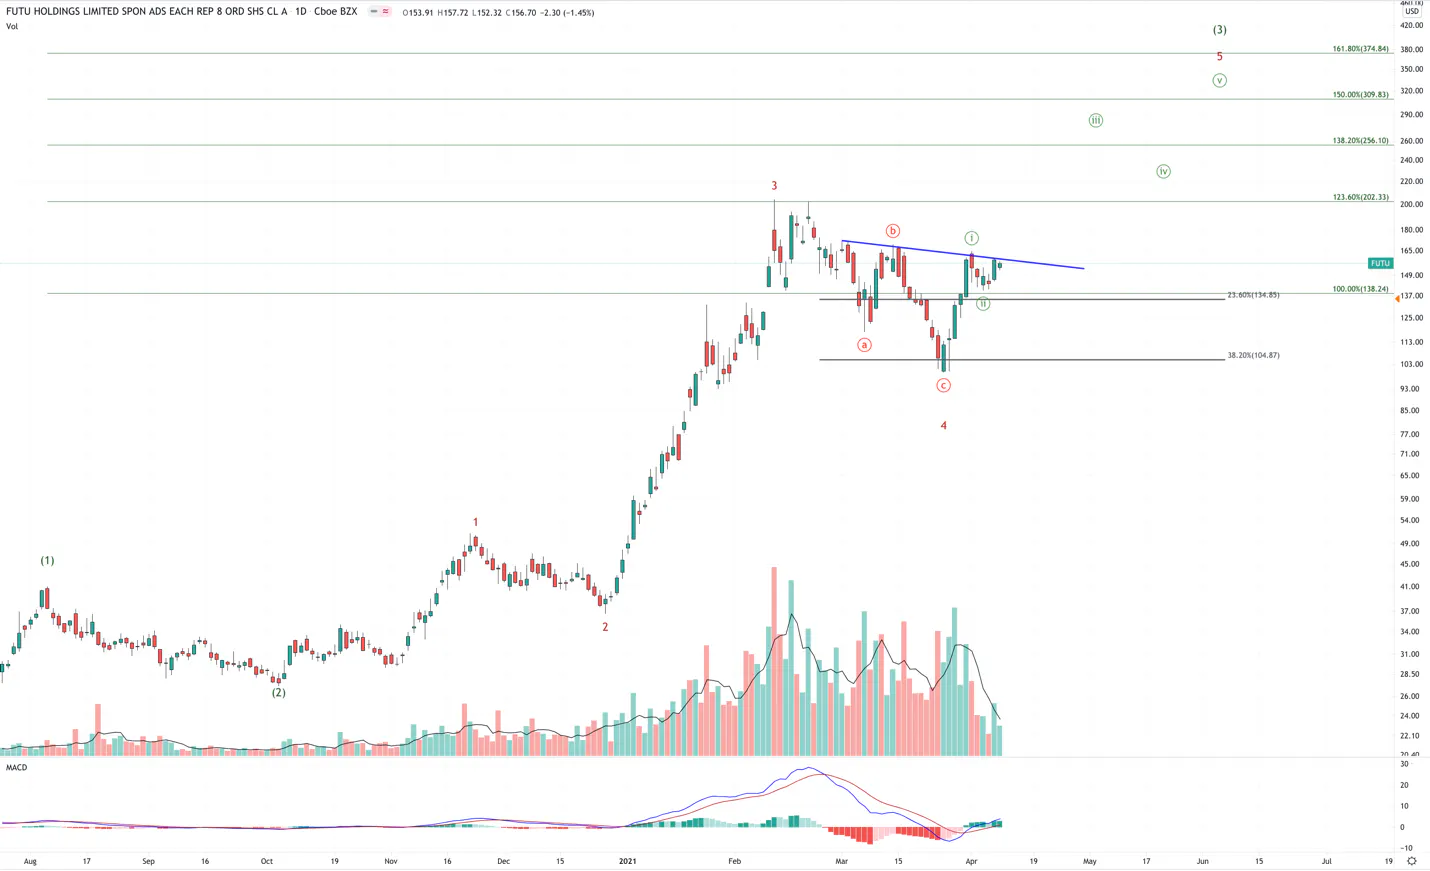
· FUTU is setting up for a breakout move.
· Using basic technical analysis, note the pattern that has formed below the blue trendline. It’s an inverse head and shoulder pattern, which is confirmed with the volume patterns as well as the smaller right shoulder.
· Elliott Wave will allow us to put some additional context to this pattern. After the 4th wave (in red) bottomed, we have a clear 5 wave move off the low with a slight 2nd wave pullback (in green).
· A breakout above $170 will confirm this bullish setup.
Fubo (FUBO)
Summary
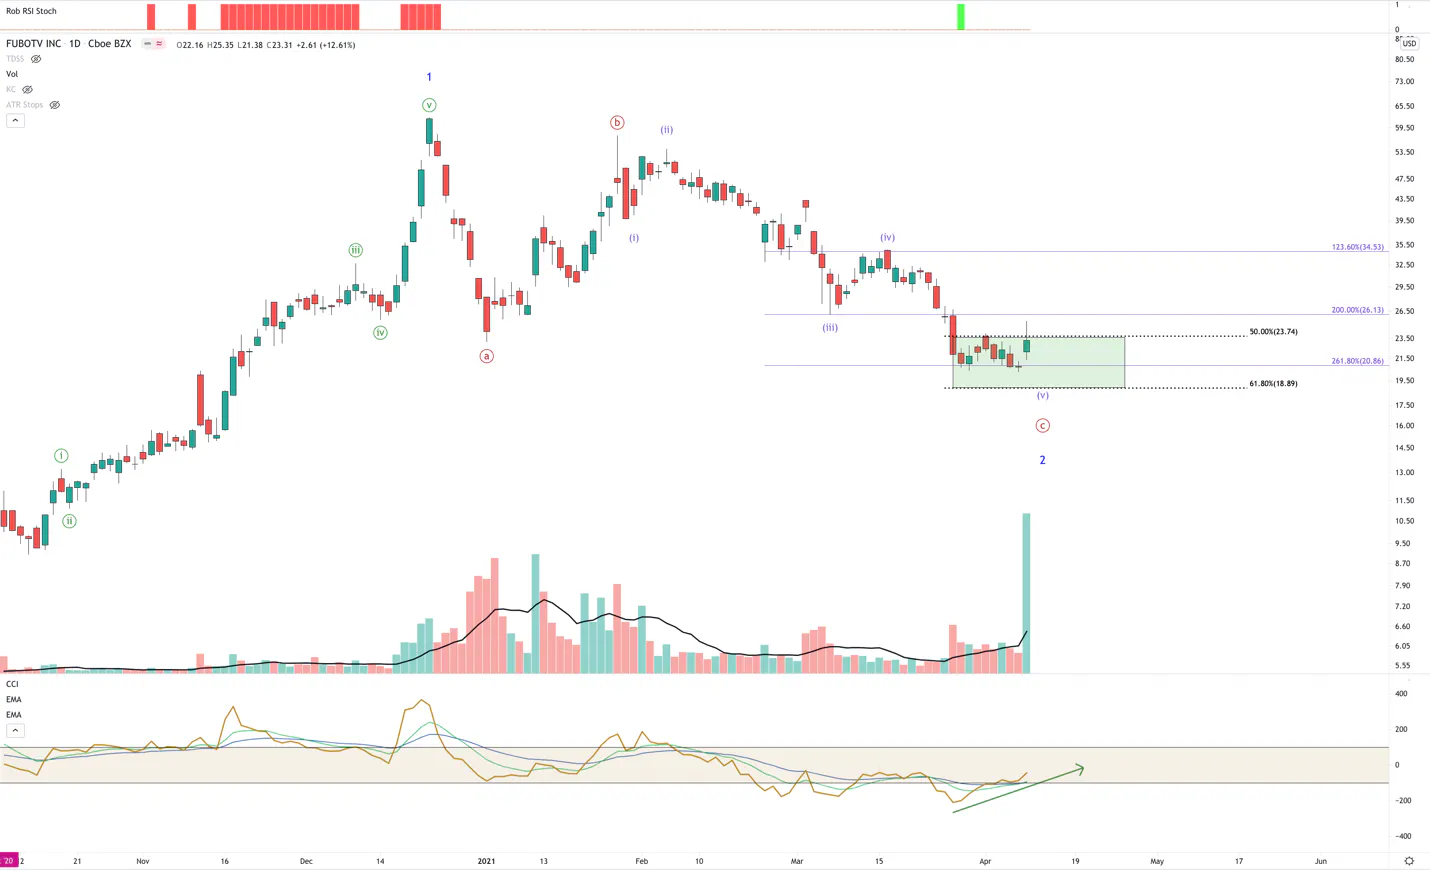
· We have been anticipating an end to Fubo’s large degree 2nd wave for several months.
· After confirming a lower low below the $23 support, our first target for a potential bottom was around the $21/$20 region.
· The reason for this was the confluence of important prices and extension that clustered in this region. Also, and most importantly, this region would confirm a perfectly symmetrical correction (corrections like symmetry).
· With Fubo currently building a nice base at this target zone, we also have the CCI showing a strong divergence as well. This is usually what we see prior to a bottom.
· Today’s heavy volume move off the low is promising, but we will want to see a continued follow through before we can put this large and complex 2nd wave behind us.
Chainlink (LINKUSD)
Summary
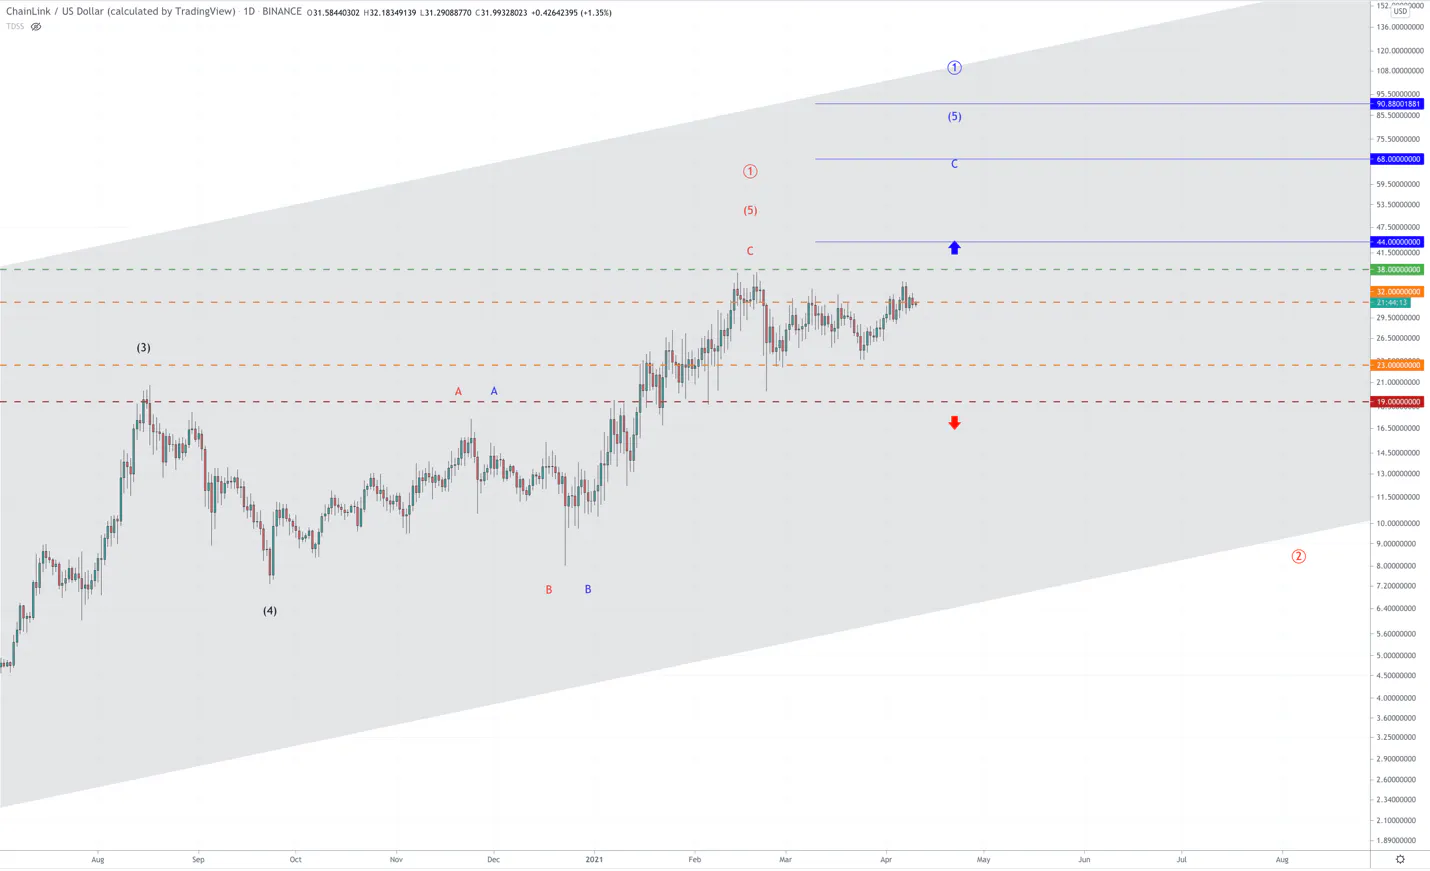
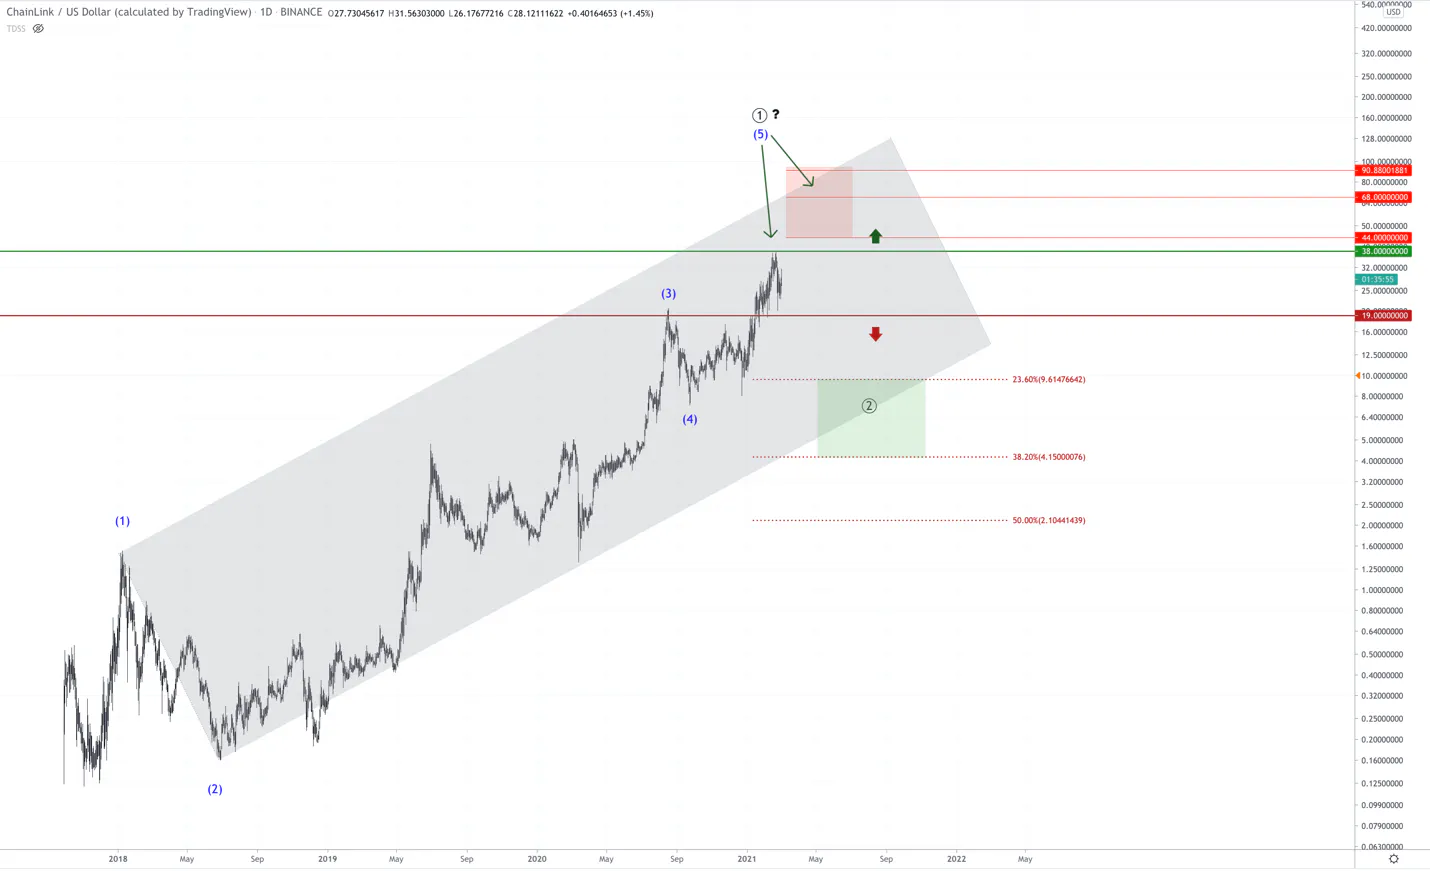
· Nothing has changed with LINKUSD since our last update.
· We have either topped out and are in the early stages of a multi-month 2nd wave correction (red count).
· Or, we have one more push, which could tag the $44, $68, or $90 region before the multi-month correction begins.
· Levels to watch: above $38 and we are in the blue count higher. Below $19, we are likely in the red count, or some variation of the red count lower.
· We view any capitulation in LINK to be a buying opportunity, which we will take advantage of.
Twilio (TWLO)
Summary
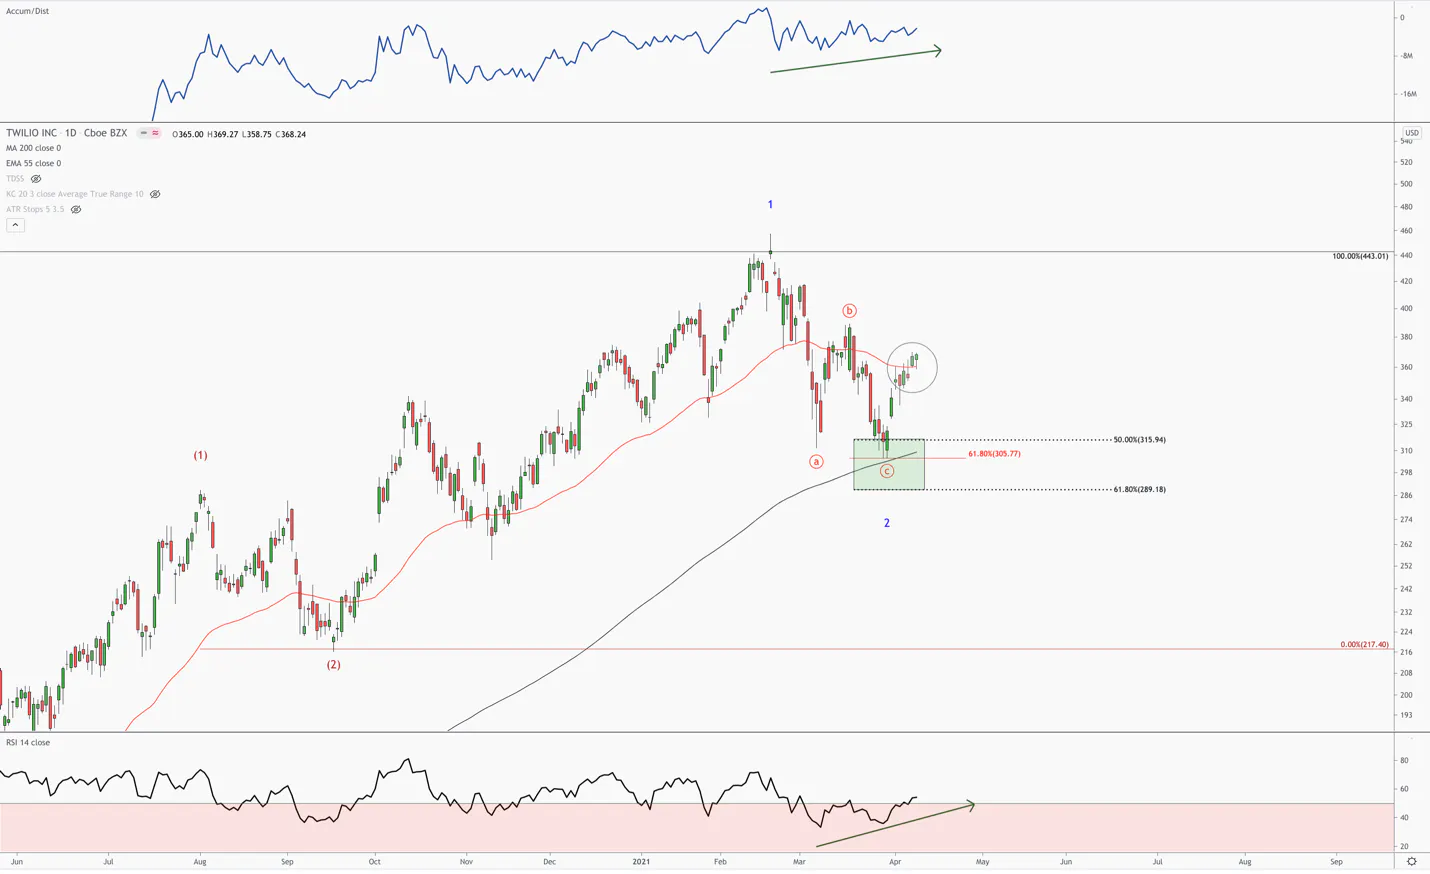
· Twilio’s uptrend appears be very bullish. We seem to be entering the heart of a large degree 3rd wave, which lines up well with Beth’s fundamental thesis.
· The correction, which I believe was a smaller degree 2nd wave (in blue), bottomed right at the 50% retrace of the first wave. We also have a symmetrical 3 wave correction (a,b,c), which found strong support at the 200-day moving average (in black).
· The bounce off this low has decisively broken through the 55-day moving average, which is further evidence that the correction could be over.
· Also, note the divergences in the A/D line as well as the RSI.
· All of these signals together make for a strong case for a bottom being in.
In this report we provide the updated charts as well as summarize the setups that we discussed on the recent zoom webinar.
The stocks in focus are:
SNAP, TSLA, ZM, XPEV, KC, VYGVF, MGNI
You can watch the replay of this webinar here:
Snap Inc. (SNAP)
Summary
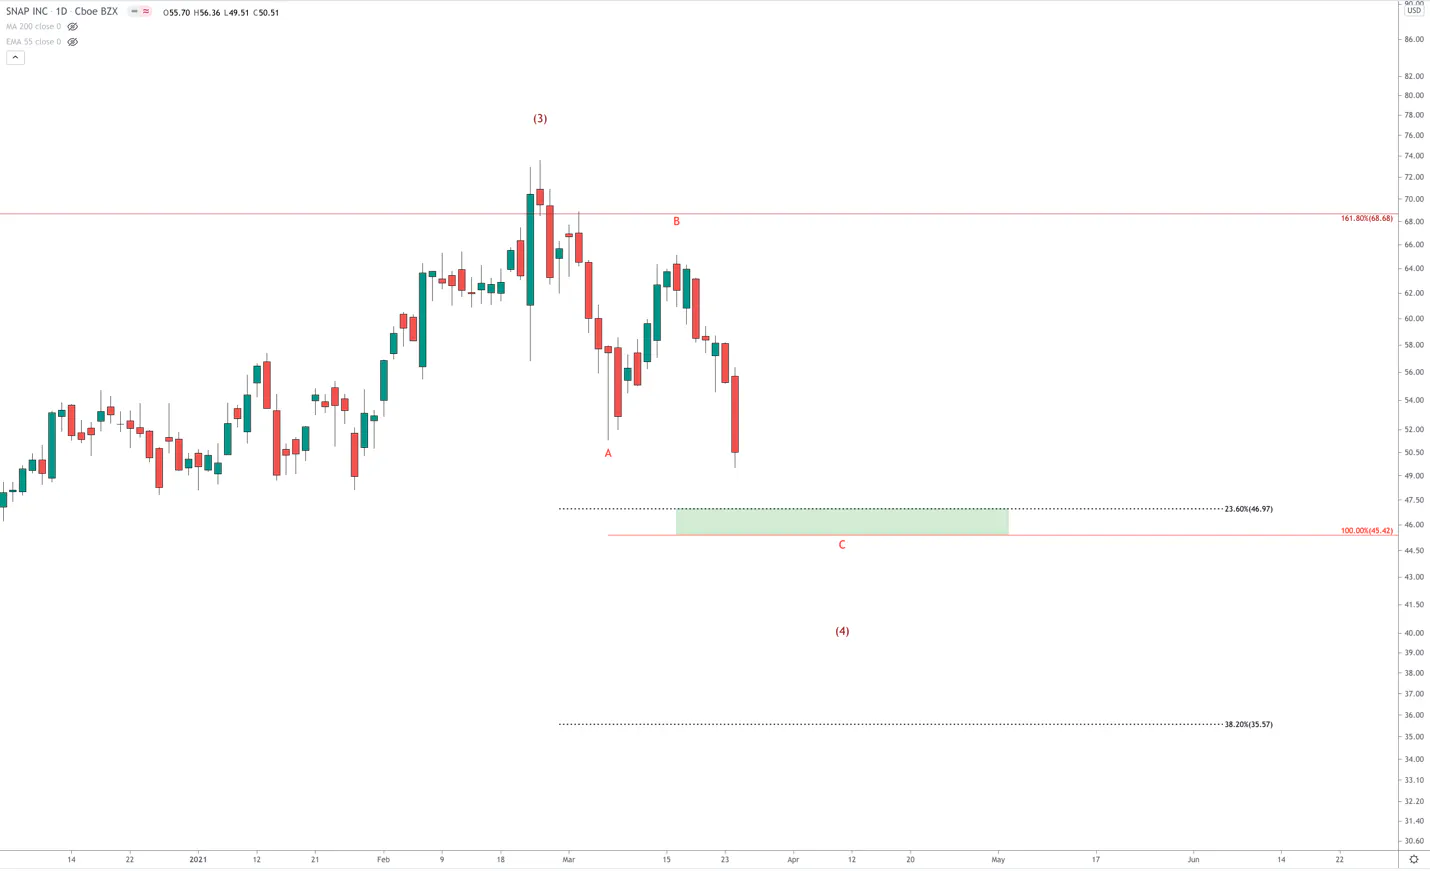
· Snap is clearly in a large degree 4th wave correction. For one, it topped at the exact price region where we see most 3rd waves top. We also saw peak technicals/momentum in its 3rd wave with the heaviest rush of volume activity. These are all 3rd wave behaviors.
· Now that SNAP has broken the March 5th low, we are in the middle of the final leg of this correction (C wave).
· The shallow target for the 4th wave correction is $47, and the deep level is around $36.
· However, the Accumulation/Distribution line is suggesting smart money is buying into SNAP. Also, there is a lot of important price clusters around $45-$47. We will likely take the $47 target, if we get there.
Tesla (TSLA)
Summary
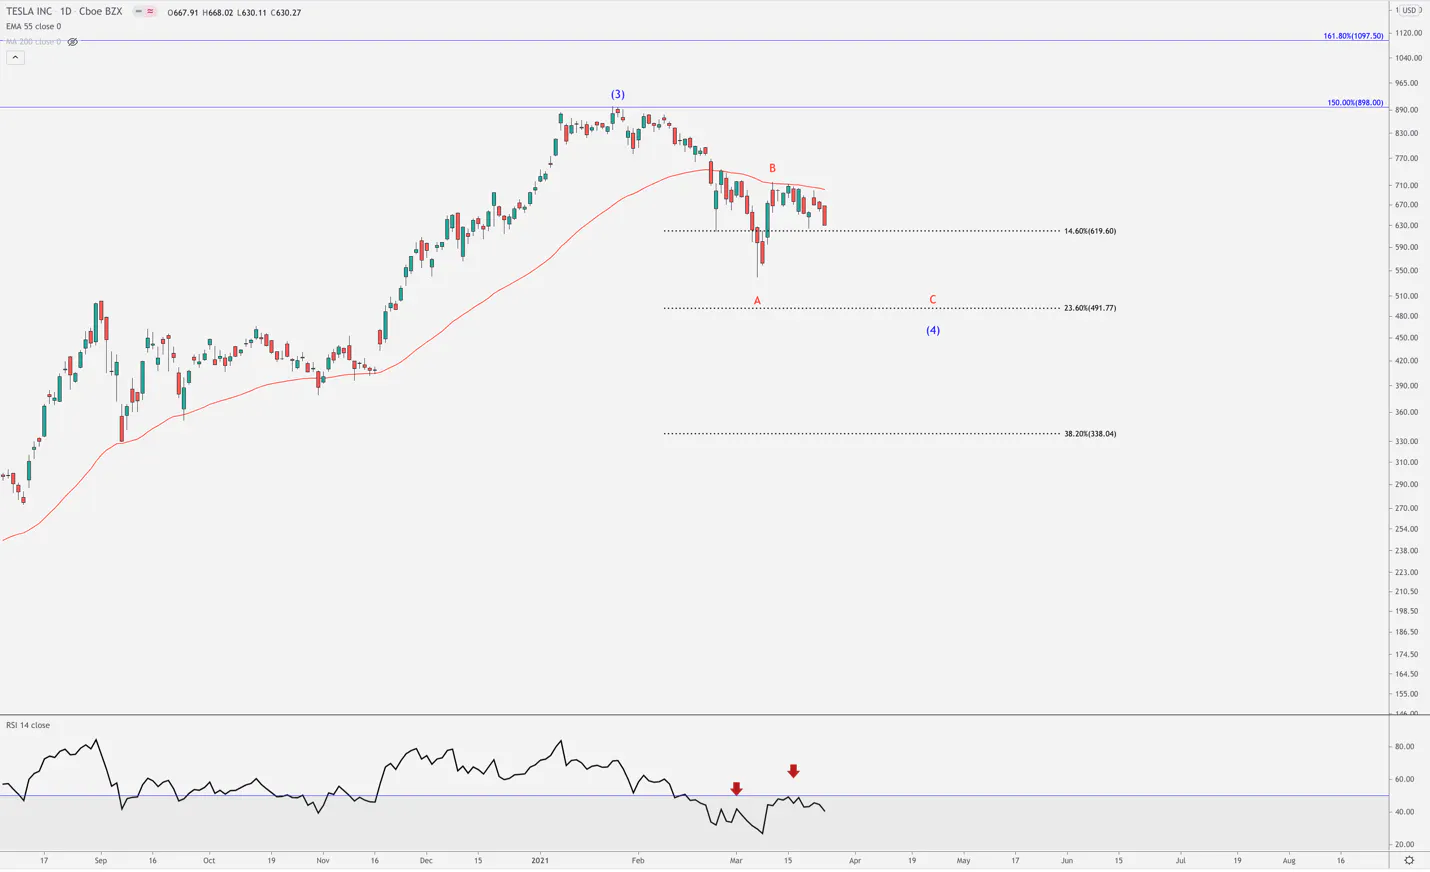
· Like SNAP, Tesla is well within its large degree 4th wave.
· The shallow target is around $490-$500. This level seemed unachievable a few weeks back. However, that target seems like it’s in reach
· TSLA is struggling to break above the downward sloping 55 day moving average (in red). This is clear resistance, and until price breakout above this moving average, we can expect more downside.
· The RSI is providing a clear reversal signal as well – RSI makes higher highs as price makes lower highs.
· We will target the $500 region for our next and final tranche.
Zoom (ZM)
Summary
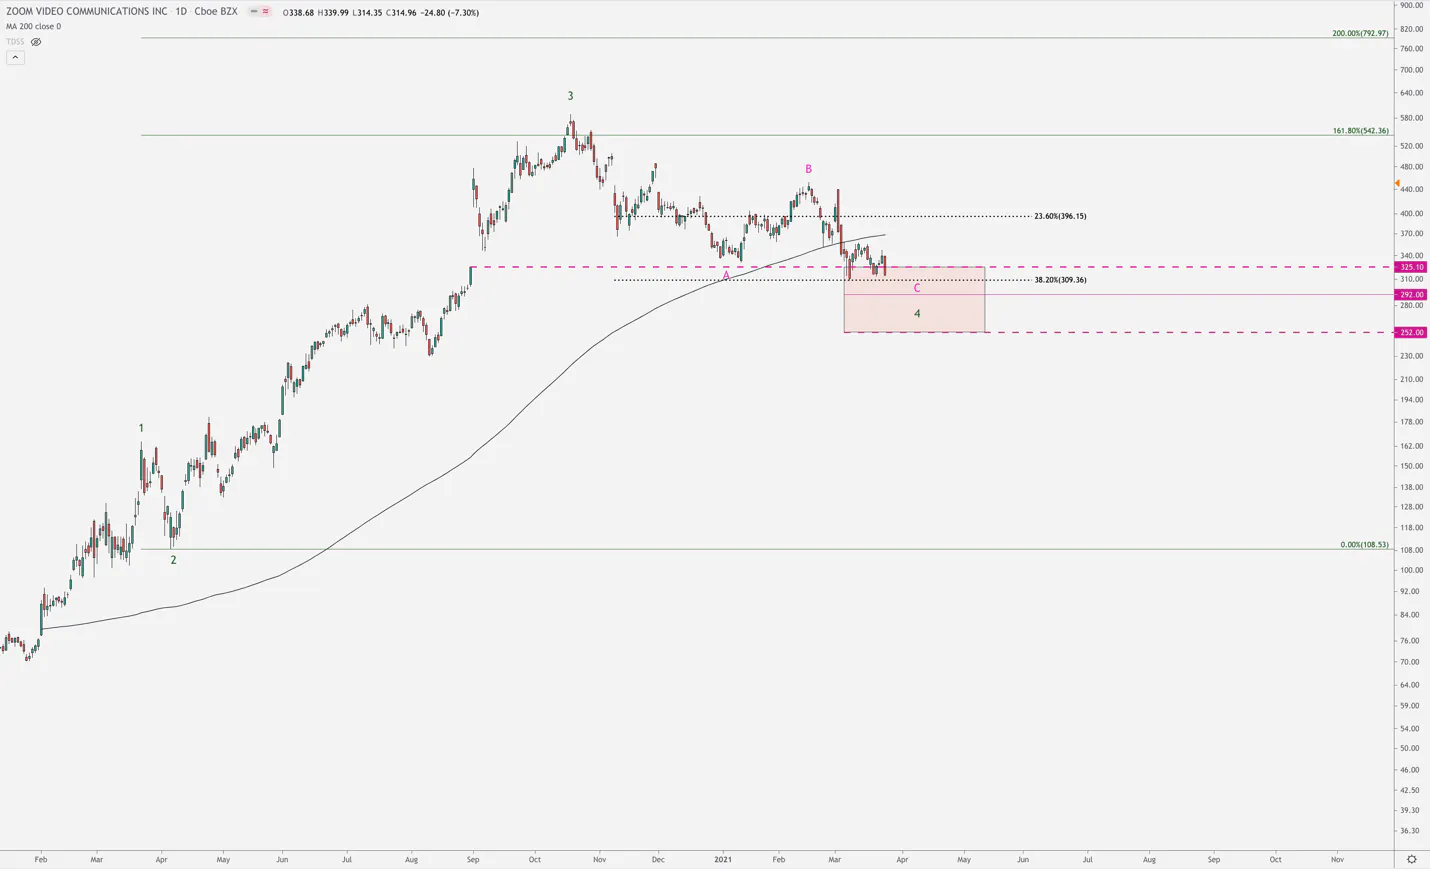
· Zoom is in the upper range of the target region we identified months ago.
· This has been a complex 4th wave, but we are expecting a bottom at one of the support regions: $309, $292, $252.
· Zoom is one of our on-going high conviction plays, and we consider Zoom below $300 a gift.
XPeng (XPEV)
Summary
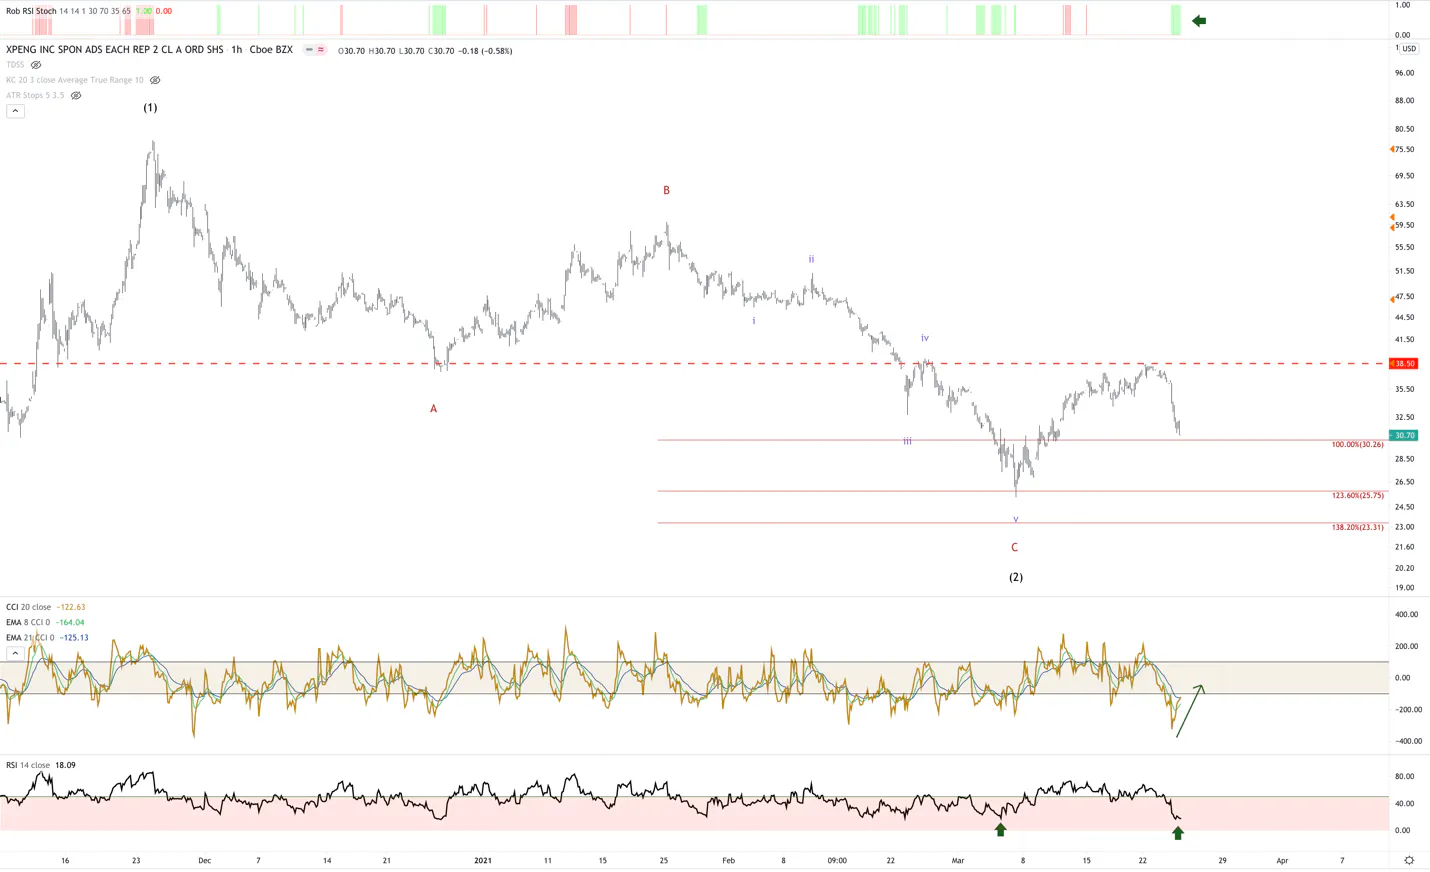
· We added our final tranche to XPEV today in the $31 region.
· The reason for this is both fundamental and technical. We believe it is grossly undervalued based on the growth we are forecasting. Also, technically, I believe the evidence supports a bottom on March 5th.
· We have a 5 wave pattern off the low. This would put the current drawdown as the 2nd wave, which should find support around the $31-$28 region.
· On the hourly chart, we are getting oversold signals, a divergence on the CCI and a rare positive RSI reversal pattern. These support that a bottom could be found soon.
· If we are wrong, and we do break the March 5th low, the next target down is around $25.
Kingsoft Cloud (KC)
Summary
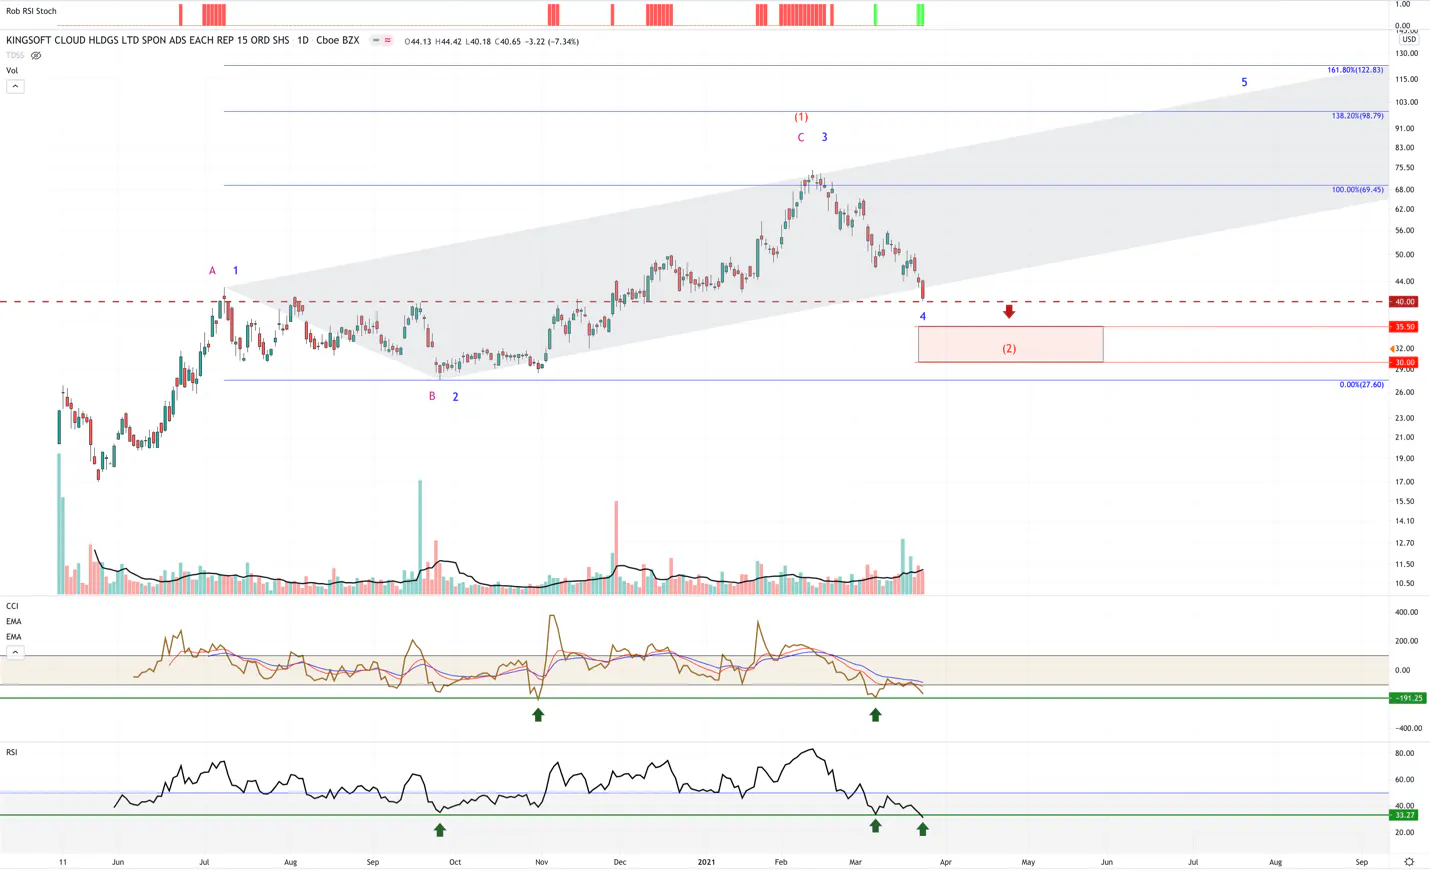
· There are two scenarios unfolding with KC.
· The blue count: we are at the end of the 4th wave within a 5 wave pattern. This pattern is a leading diagonal, which is very overlapping, and tracks a trend channel (in gray).
· The CCI is showing a positive divergence while just above the all-time low, which is major support. The RSI is also at the all-time low while we are getting a cluster of oversold signals on the daily chart.
· As long as price holds the $40 region, the blue count is in play.
· Below $40, and the red count is in play: we are in the 2nd wave of a much larger leading diagonal pattern. If this is in play, we would look for a bottom around $35.50 – $30.
Voyager Digital (VYGVF)
Summary
· Voyager appears to be in a topping process. I believe its 3rd wave topped out at the most common spot we see 3rd waves end. For Voyager, that is between the $23-$24 region.
· Evidence to support this move: strong cluster of sell signals at a key resistance level; the buying volume is fading as price increased; the RSI and CCI has been in a strong divergence from price; the RSI is about to break the trend line that has been support throughout the entire 3rd wave.
· The targets for the 4th wave are: $14, $10, $5.
Magnite (MGNI)
Summary
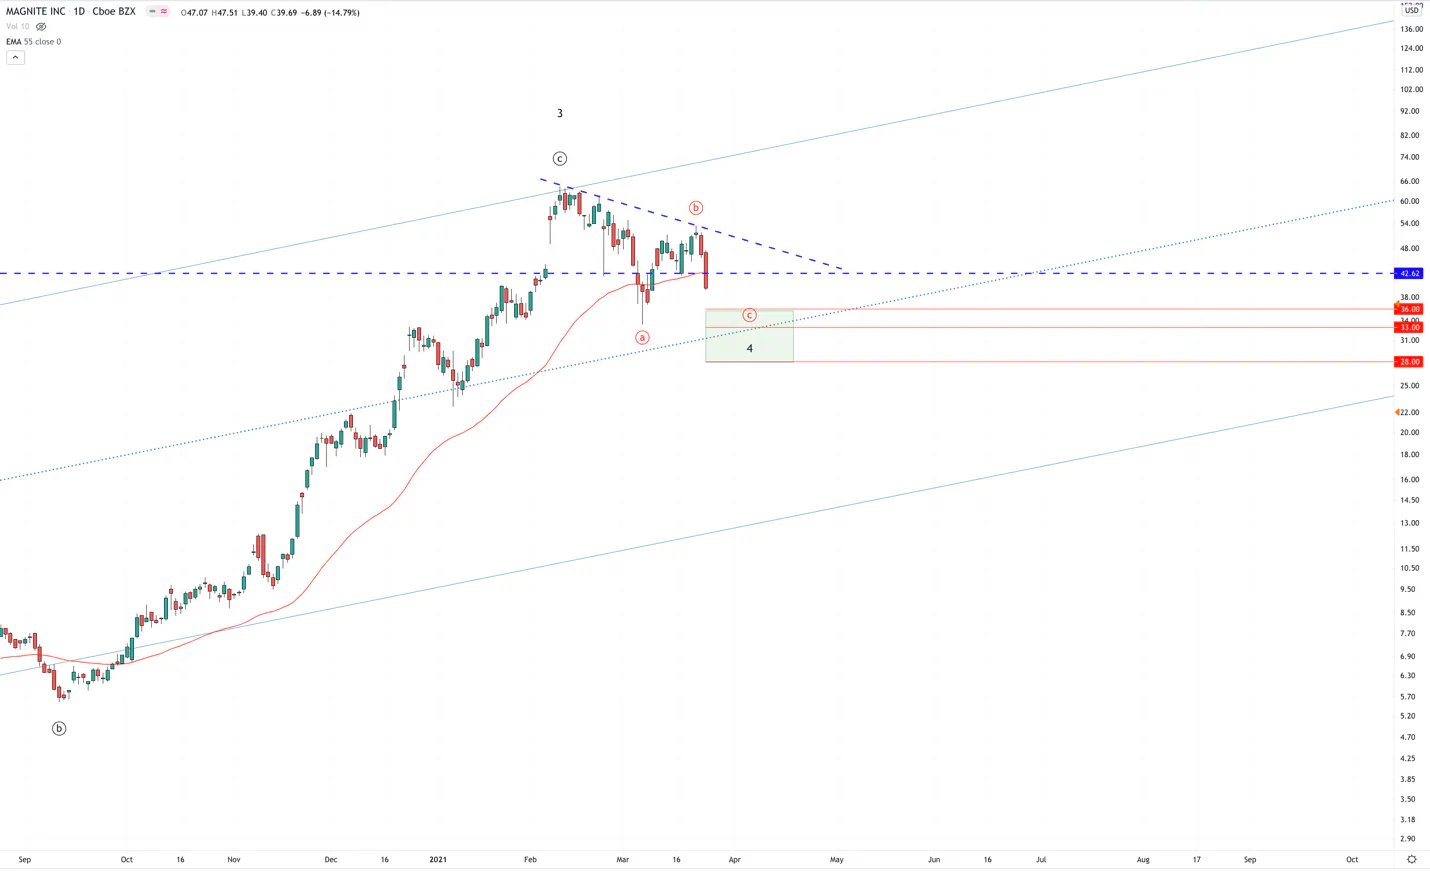
· Magnite broke the 55 day moving average (in red), which also coincides with major support at the $42.60 region.
· I believe that MGNI is in the final leg of its 4th wave drawdown.
Below is the LTBH Monthly Webinar on Chainlink for anyone who missed it. This is a 1-hour intensive and deep dive into a high conviction company that I plan to hold once per month.
Quick note on the website: There is about 50-80 subscribers who can’t get into the new site. We are working on this and I think you’ll be good to go by Friday. Please note, you must set a new password for the new website. You cannot use your previous password. Here is the link to set a new password: https://io-fund.com/welcome
If you’re having trouble signing into the forum from the new site, then please use the old site to get into the forum as we reset the single-sign on.
Thank you for signing up for I/O Fund’s Research Site. Our site provides a competitive edge in the world’s most valuable industry – technology. Due to the potential for enormous gains from this particular industry, we think it’s essential that every stock investor have a credible source who specializes in tech.
If you experience any issues while logging into the website, please email premium@io-fund.com.
In this report we provide the updated charts as well as summarize the setups that we discussed on the recent zoom webinar.
The stocks in focus are:
Bitcoin, Chainlink, Tesla, Roku, Lam Research, XPeng, Nio, AMDBitcoin, Chainlink, Tesla, Roku, Lam Research, XPeng, Nio, AMD
You can watch the replay of this webinar here:
Bitcoin (BTC)
Summary
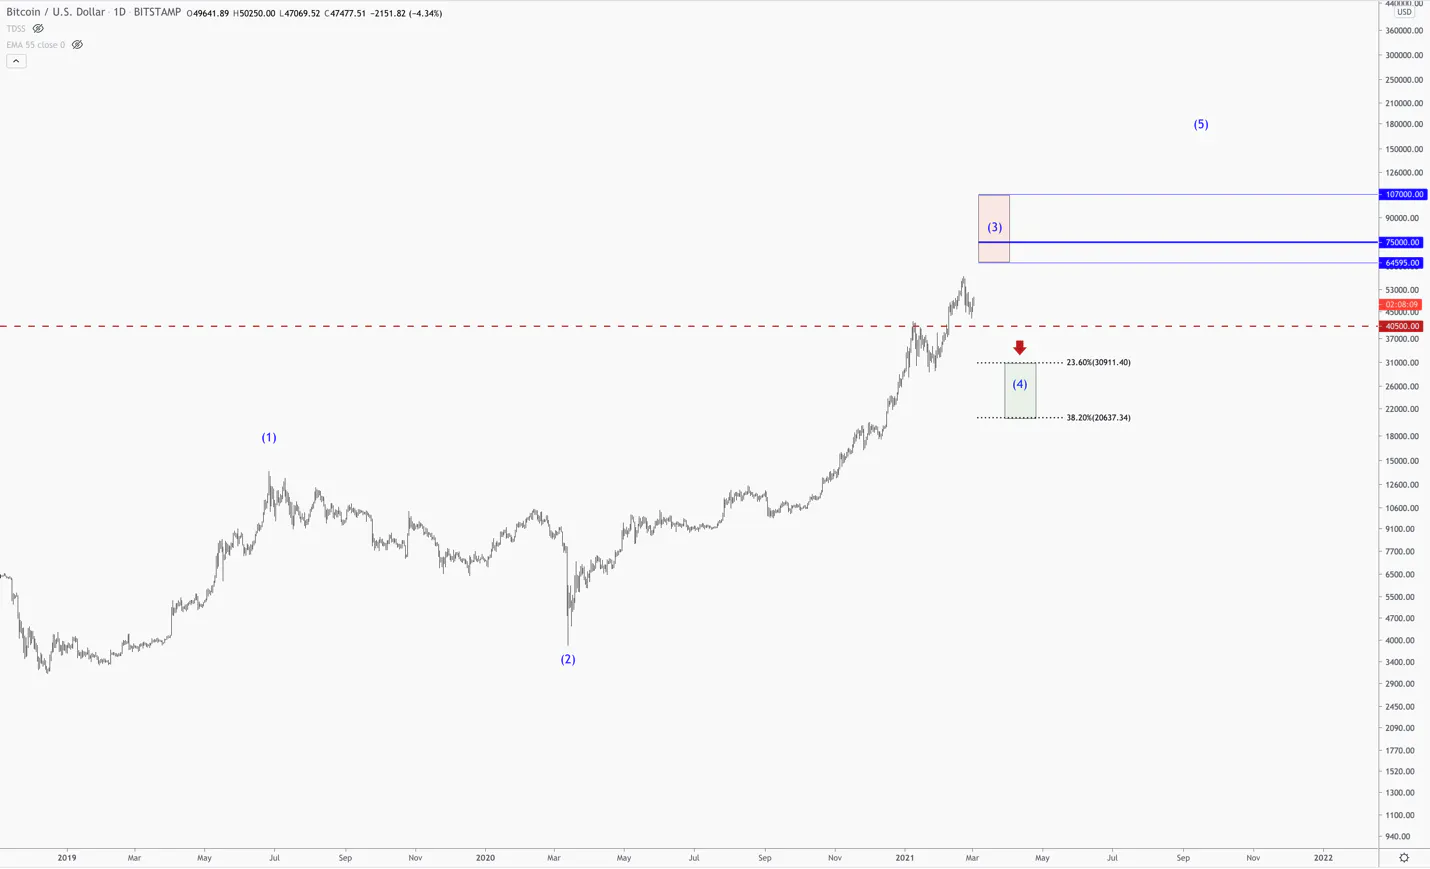
The above chart outlines the long-term trend that we are following.
This puts us in the final move of the 3rd wave (in blue), followed by a 4th wave correction.
As long as we hold $40,500, I’m expecting BTC to make a move into the $64,000, $75,000 and potentially $107,000 region before topping out. This is our primary expectation, as of now.
However, below $40,500, and I believe the odds tilt towards the 3rd wave completing at the prior high. This would put us in the 4th wave drawdown.
The shallow target for this move is $30,000, which we would be heavy buyers.
We began slightly reducing our exposure at $50k. As we approach the overhead targets we will likely take small gains as well.
We have no plan to close Bitcoin and, as of now, it will likely remain in our top 3 positions going forward.
Chainlink (LINK)
Summary
Chainlink has been one of our more profitable positions. It’s also the most volatile. In about 3.5 years, we’ve seen a +90% drawdown, and four +70% drawdowns.
LINK is likely approaching the end of its large degree first wave (in black). In fact, the recent volatility increased the probability that this thesis could be active.
There is still a path higher, and this is my primary expectation. If LINK can break above $38, we will look to the $45, $68, $90 region for the bigger top.
However, if LINK breaks $19, the odds that we are in this larger degree 2nd wave will become elevated.
Our plan was and is to reduce exposure in preparation for this move. However, we will likely never sell out completely. This is one of Beth’s highest convictions, which also lines up well with what I’m seeing technically.
In other words, what follows the 2nd wave – the 3rd wave, which we do not want to miss.
Tesla (TSLA)
Summary
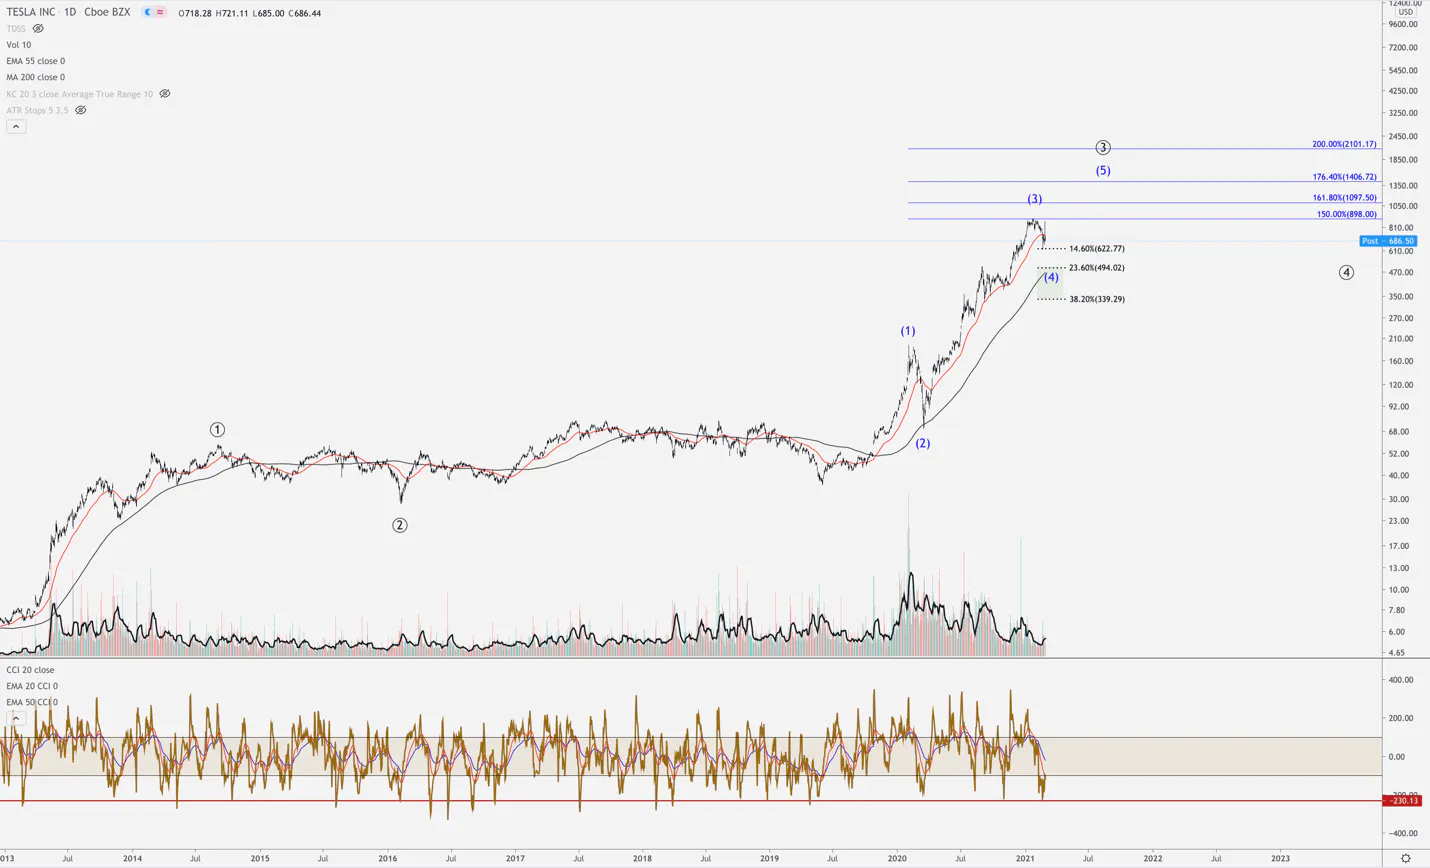
Tesla is clearly in the middle of a multi-year, large degree uptrend (in black).
On a smaller degree, I believe Tesla has finished the 3rd wave (in blue).
It has broken the 55 day moving average (in red). A test of the 200 day moving average (in black), would satisfy the 4th wave targets we are projecting for this move.
A break below $620 will confirm this thesis, and we will look to be buyers at the $500 region.
However, note the CCI. The red line indicates a region on the daily CCI that has marked many bottoms going back for years, including the March 2020 bottom. We are at this level now, which means that we may not get that lower level.
We will monitor the price around this region and potentially look to begin building a position in this region.
Roku (ROKU)
Summary
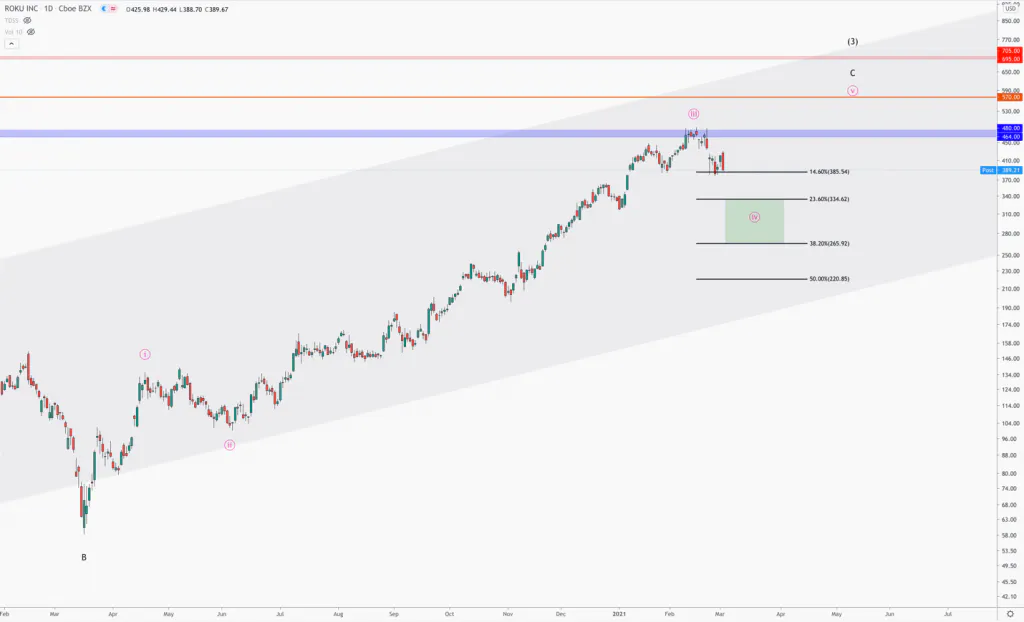
I believe Roku has topped out in its 3rd wave.
The 4th wave targets are $335 and $265.
A break below $380 will confirm this scenario.
Once this correction is over, and as long as we hold the $215 region, we will look to the $570, and $700 region for the completion of these 5 waves move that started at the March low.
We have no intention to sell or trim Roku.
Lam Research (LRCX)
Summary
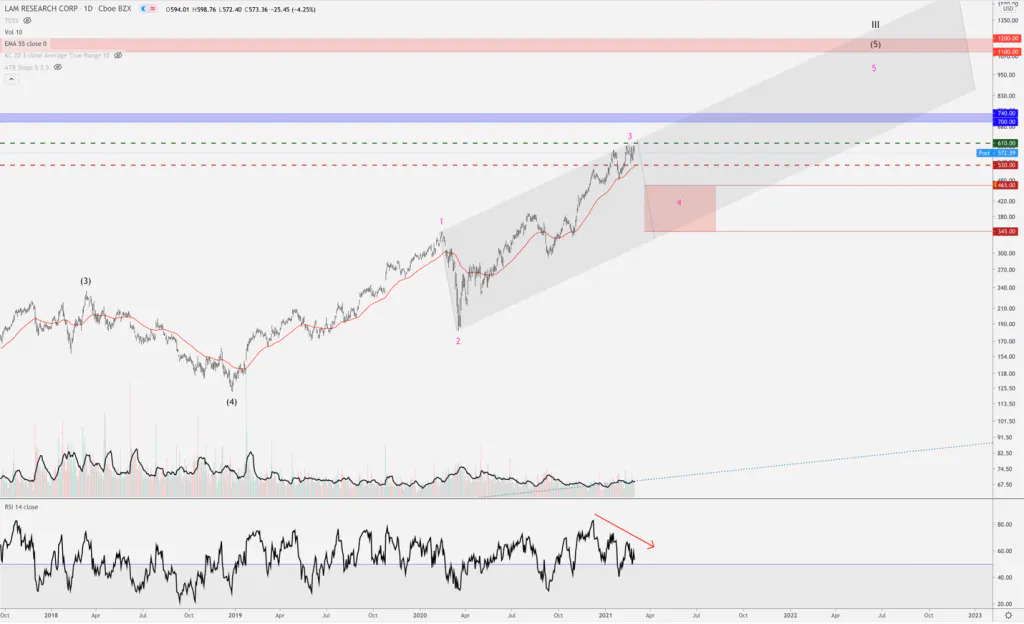
LRCX appears to be topping out in its 3rd wave.
Note the strong divergences in then RSI. These are warnings that the momentum/sentiment needs to reset for another push higher.
If LAM can break above $630, the 3rd wave will likely extend towards the $700/$740 region. This would also alter the levels and game plan that is outlined in the chart above.
However, if Lam breaks below $530, that will put us in the 4th wave scenario. If this happens, we will look to target a new entry around $465.
XPeng (XPEV)
Summary
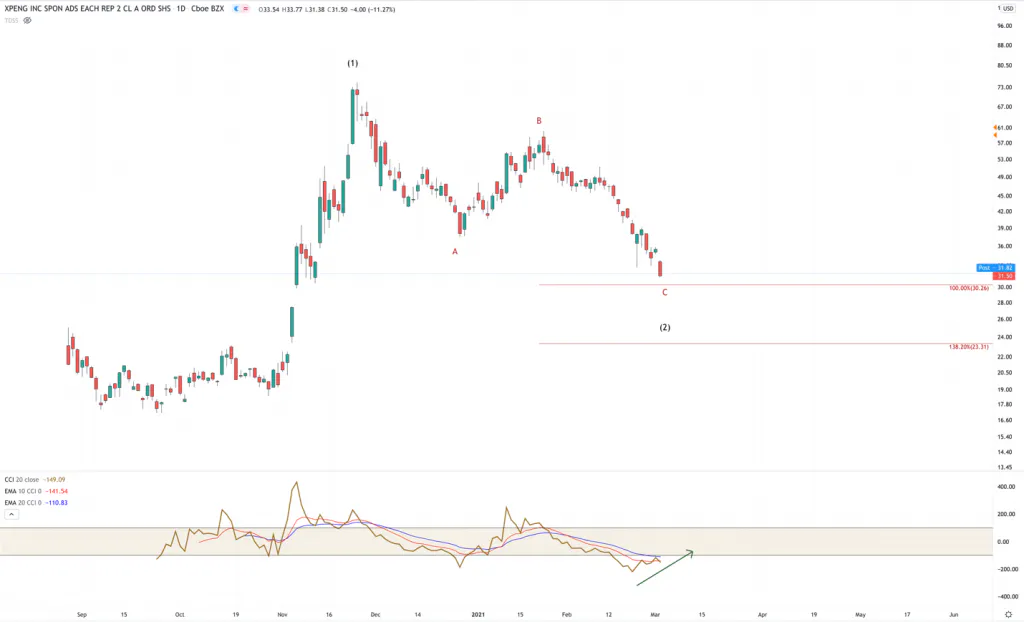
XPEV appears to be approaching the $30 support. Corrections love symmetry, and this region coincides with a gap as well as completing a perfectly symmetrical correction. In other words, the A wave went down 49%. At $30 region, the C wave would also correct exactly 49%.
Note the CCI divergence on the daily chart as well. I would look for a strong reaction at the $30 level.
We are still bullish on this play long-term, and believe that we are close to the end of this large correction.
Nio (NIO)
Summary
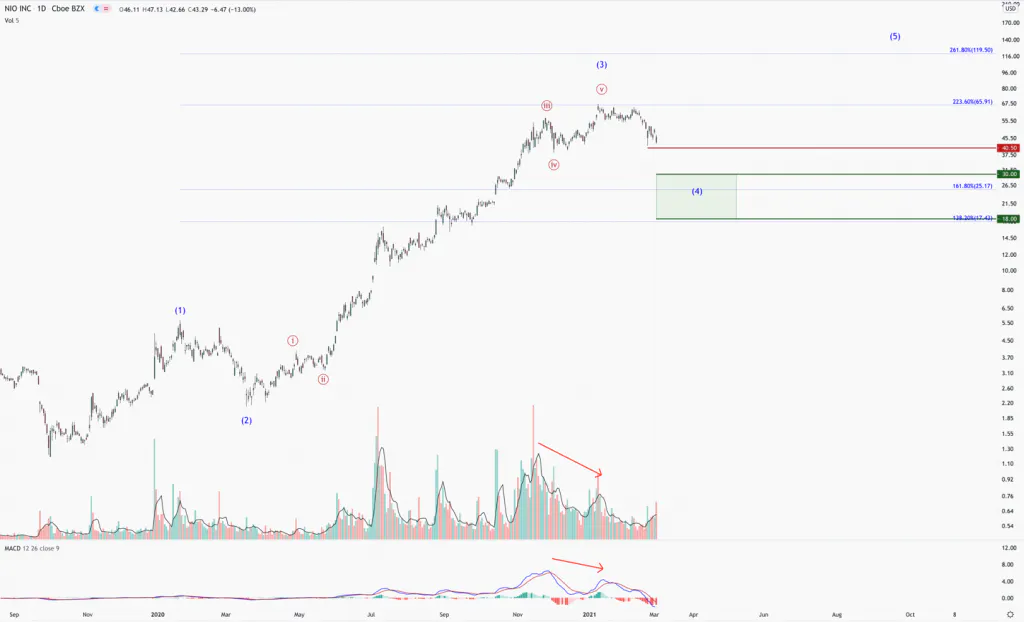
We have been patiently waiting to initiate in NIO, and believe the time is close for our first move into this stock.
Nio appears to have completed its extended 3rd wave (in blue).
The decelerating volume patterns as well as MACD from peak levels, provides a clue that we are now in the 4th wave.
As long as NIO holds the $40.50 region, it can push to new highs relatively soon. We may begin building a position at this level if we get buy signals.
Below this level, and I will be targeting the $30 region to complete the 4th wave drawdown.
Advanced Micro Devices (AMD)
Summary
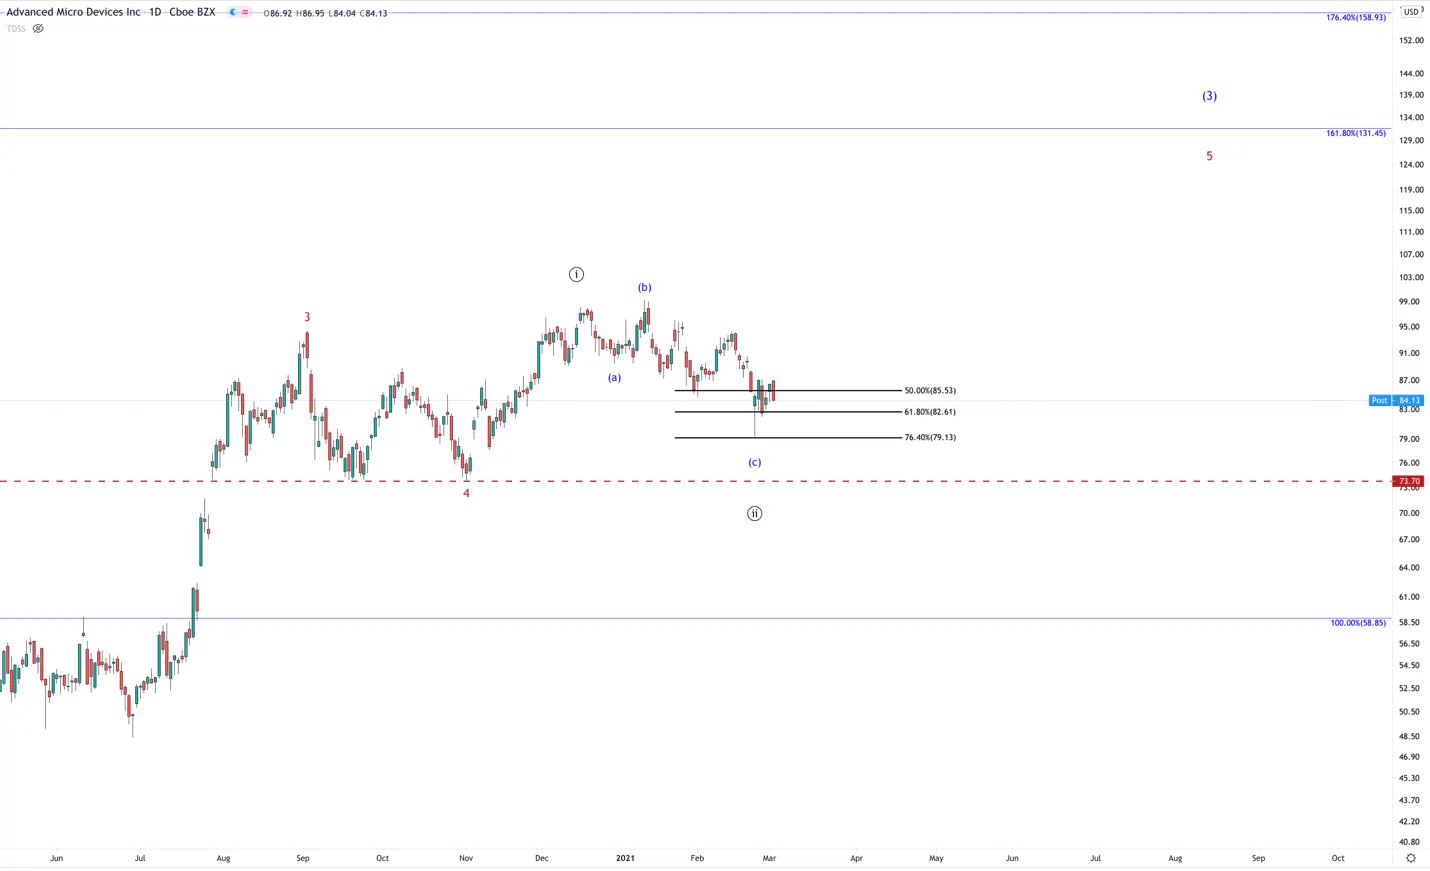
AMD appears to have just bottomed in its 2nd wave (in black).
As long as the $73.70 region holds on any further weakness, we will be targeting the $130 region next.
The long-term chart in AMD is promising, which also lines up with the fundamental thesis Beth laid out last year.
If we break below $73.70, something more complex may be at play, at which time we will update you with and changes. Until then, the above count is active.
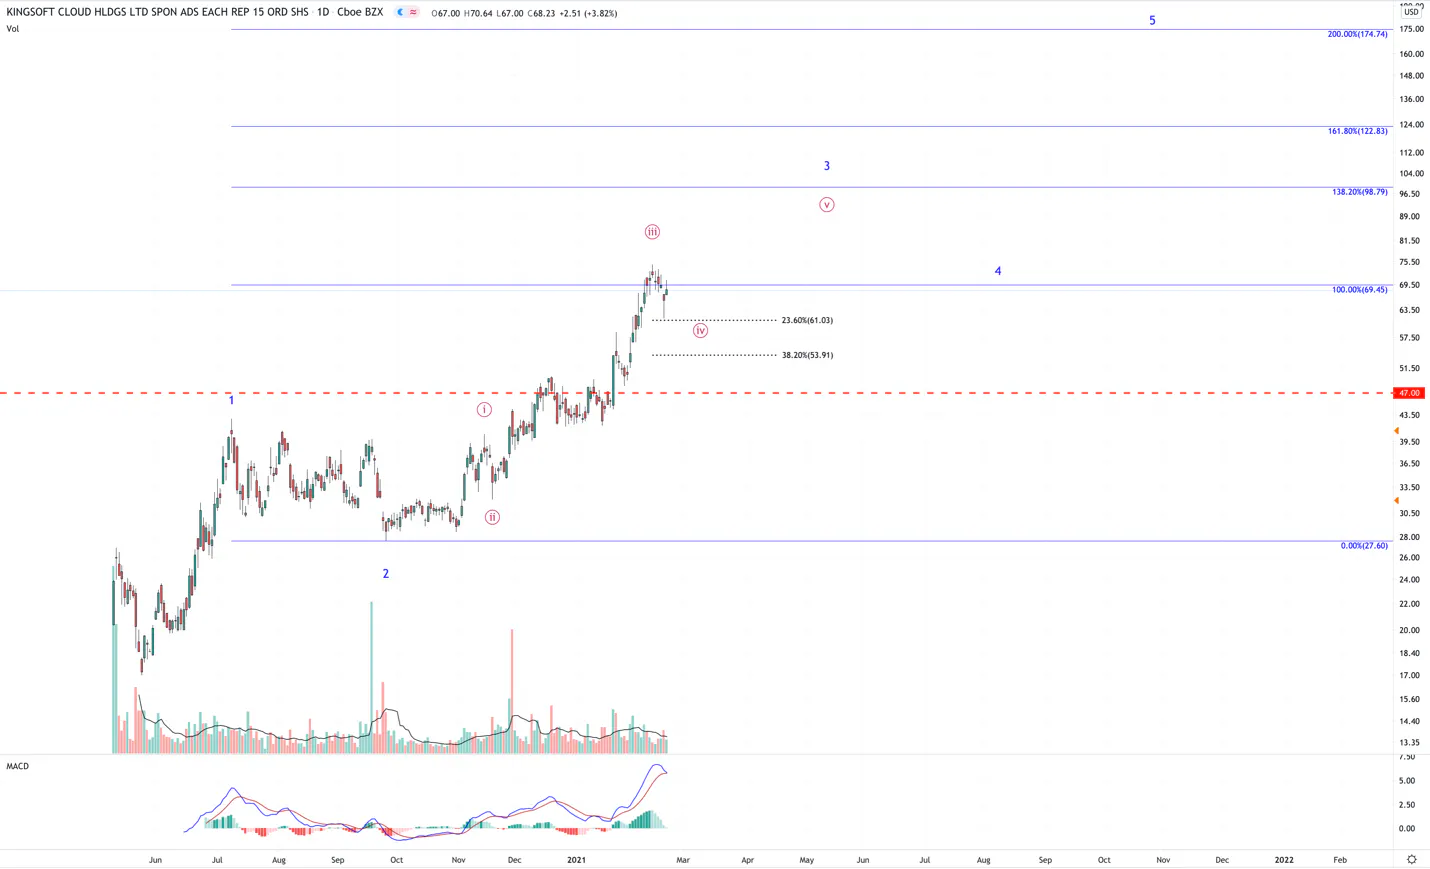
We are looking for a bottom to the current correction in the $62-$60 range, or the $52-$50 range.
We will continue to accumulate if KC breaks out to new highs, or if it tags the $50 region we just outlined.
As long as we hold the $47 region, the long-term uptrend (in blue) remains the general path we are tracking.
Plug Power (PLUG)
Summary
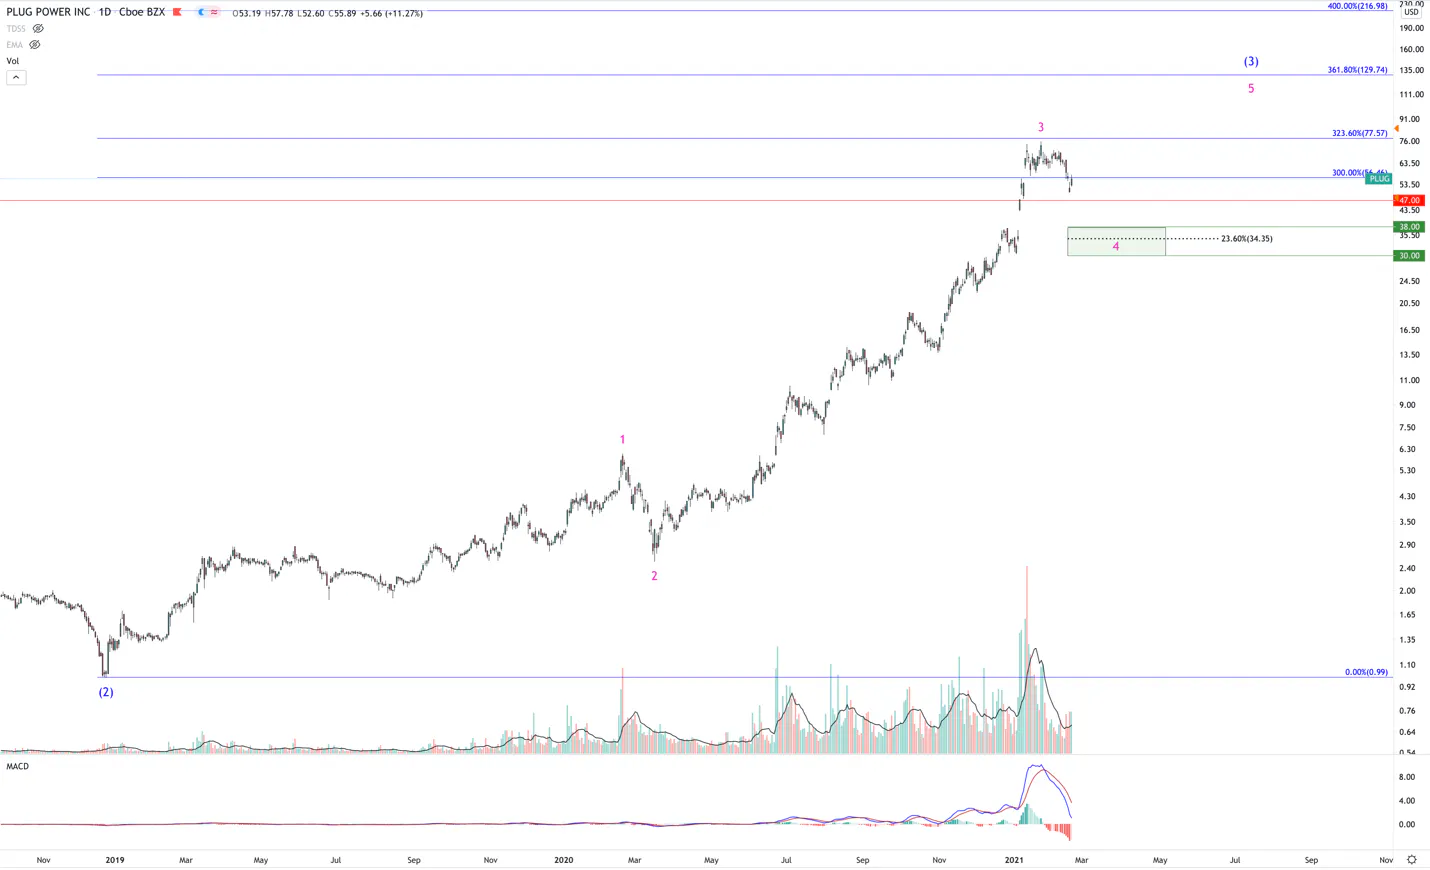
So far, PLUG is following a clear 5 wave pattern (in blue).
I believe we are in a small degree 4th wave correction (in magenta), which is targeting the $38-$40 range, $34 range, or $30 range.
The $47 range will also be a reasonable spot that we may start to slowly building our position, if we are in fact in this 4th wave correction.
There is also a chance that the 3rd wave is not over. If that is the case, we will likely buy the breakout to new highs, and build our position from there.
Twilio (TWLO)
Summary
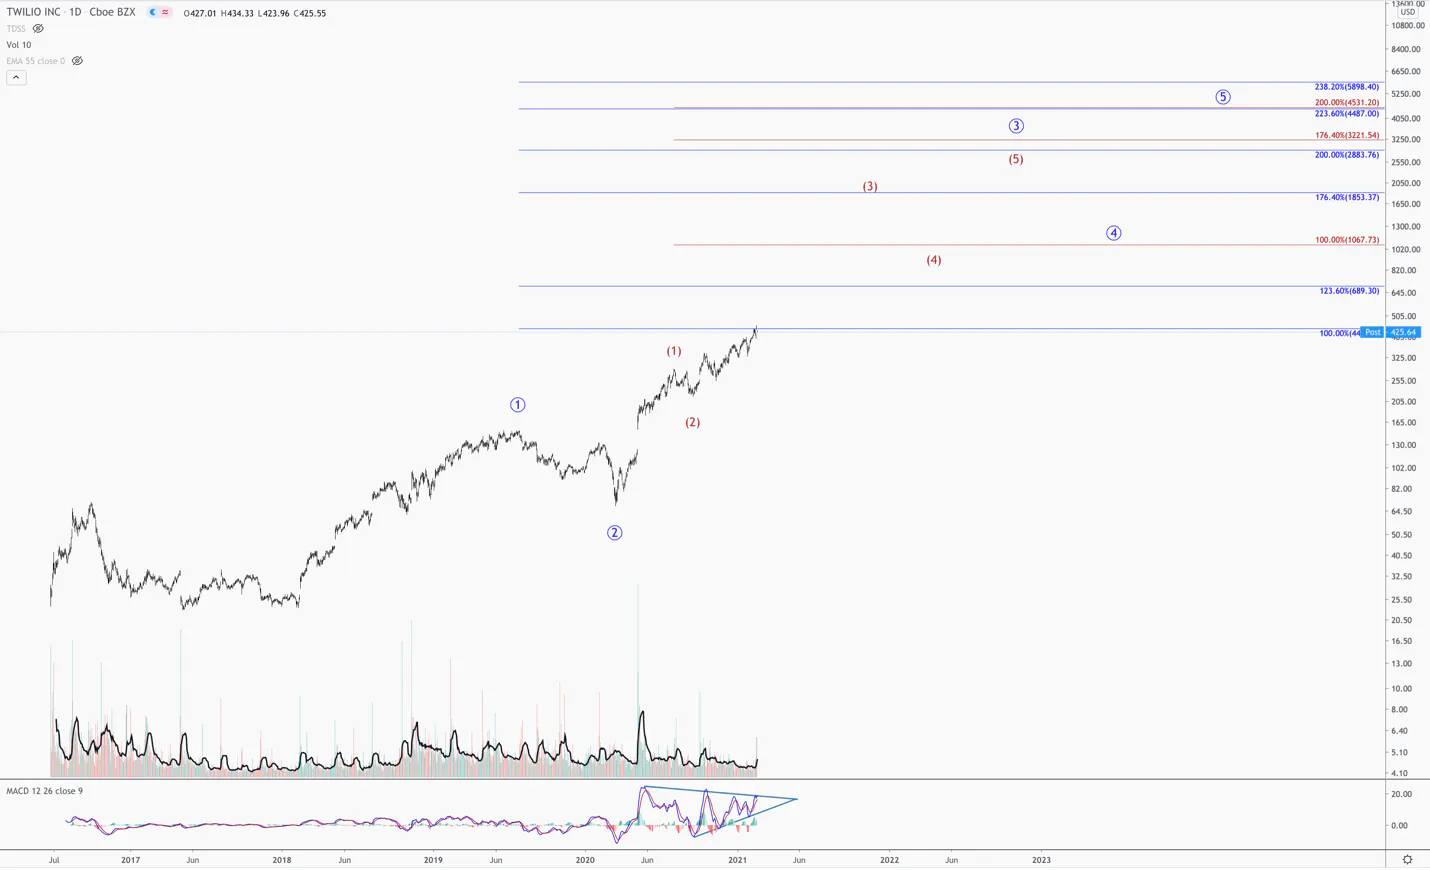
Twilio’s chart is not one that I would overthink. In fact, it reminds me of Google in 2011-2013.
We have a large degree 1st and 2nd wave in place (in blue). We also have the beginning stages of the 3rd wave in red.
The MACD is coiling and primed to breakout. I will be watching the breakout of the MACD from its triangle pattern for a potential new entry.
This price information suggests that TWLO could be setting up for a strong move up, after a brief pullback.
We will look at every dip as a potential entry.
Bitcoin (BTCUSD)
Summary
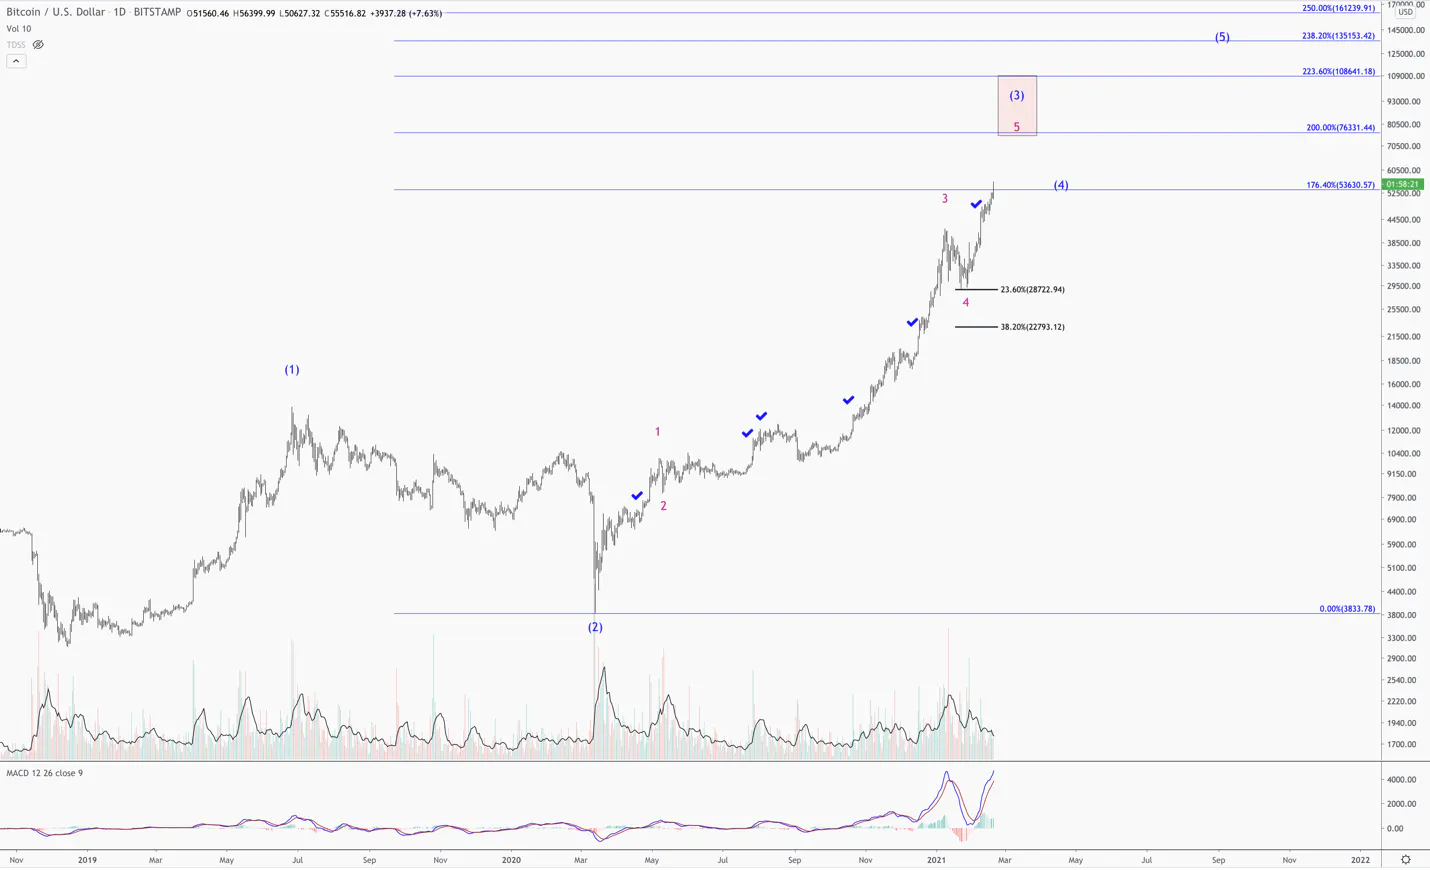
The above chart highlights the entries we have guided in Bitcoin this year (note the blue checkmarks). This is a great example of how we like to build positions – we start out small, and then build into strength. Bitcoin is now our of our largest positions, and will likely remain that way until we start seeing exhaustion at a key resistance level.
I believe we are in the final move of the larger 3rd wave (in blue). Bitcoin is known for extended 3rd waves, so the targets I set are on the conservative side, based on my experience with Bitcoin.
We have cleared the $56,000 region, and as long as the $42,000 region holds, we will continue to follow this count towards the $70,000 region.
Zoom (ZM)
Summary
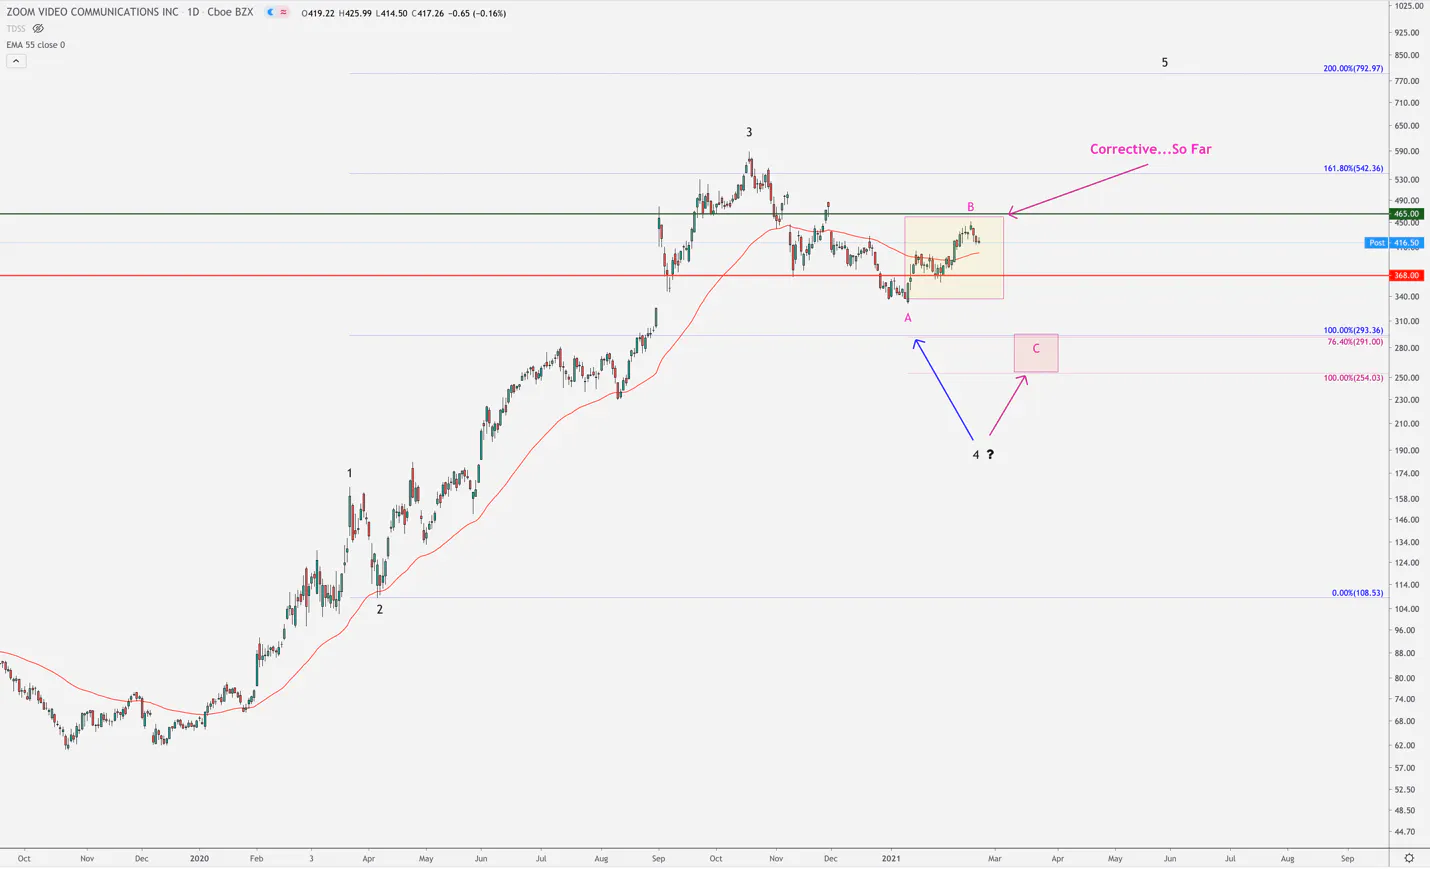
We have been targeting the $325-$296 region for Zoom for many weeks.
Even with the recent surge in price, this scenario is still not off the table.
I believe this could go either way.
undefined
undefined
We are bullish on Zoom, and will look to add at lower levels, if we get there. If it breaks key resistance levels, shifting the probability that the low is in, we will also look to add.
The long-term trend, both technically and fundamentally, still appears to be promising.
Teladoc (TDOC)
Summary
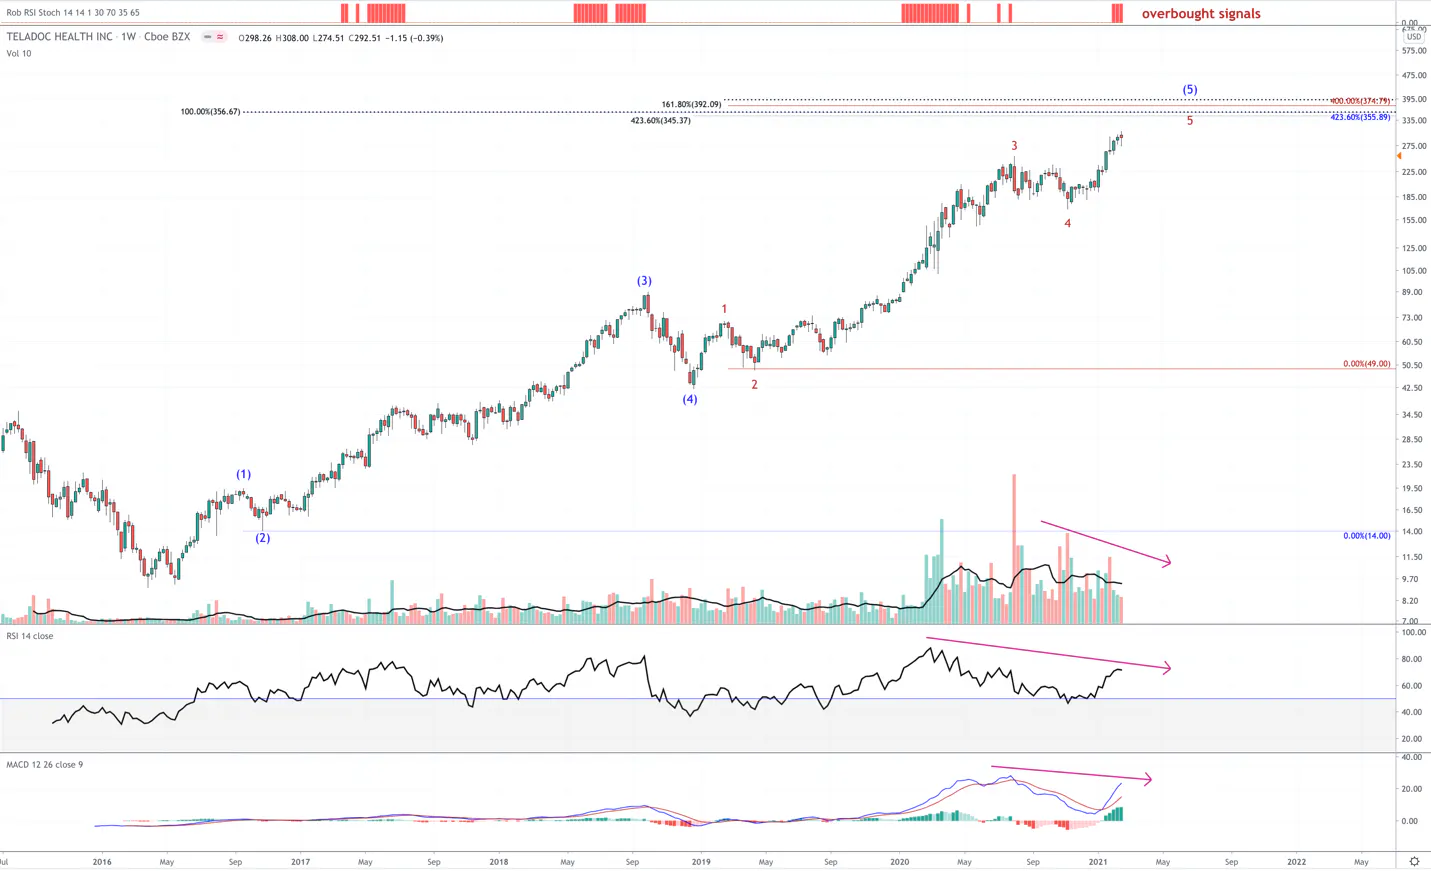
We trimmed our position in Teladoc last week. We are excited about the story and the microtrend in telehealth over the long-term time frame. However, the technicals warrant caution in the short to intermediate time frame.
Teladoc has a fully formed, large degree, 5 wave pattern off the 2016 low (in blue). The current uptrend exhibits every que we look for in 5th waves: decelerating volume, negative divergences in the MACD and RSI.
Also, there is a tight cluster of important prices between the $345-$390 region.
If TDOC can clear this zone, we will reassess the structure.
Fiverr (FVRR)
Summary
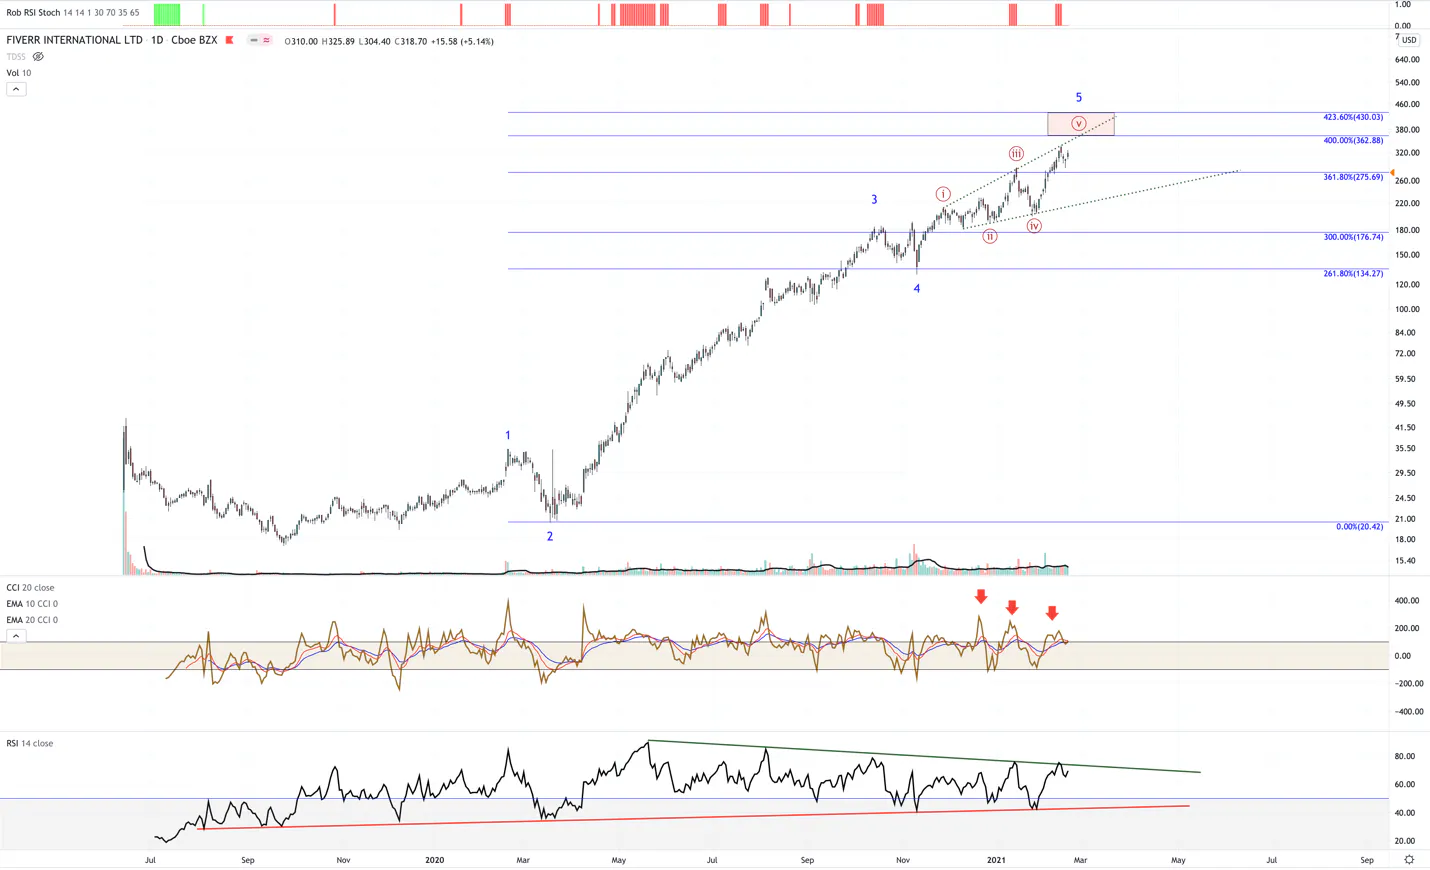
Like Teladoc, Fiverr also appears to be approaching the end of a large, 5 wave pattern.
The final 5th wave appears to be mapping out an overlapping, diagonal pattern, which also appears to be ending.
There is a chance we push higher into the target box. However, the internals are weak.
We are not looking to sell FVRR. Instead, we started small and will continue to build out this position, as it continues to become the leader in its microtrend.
XPeng (XPEV)
Summary
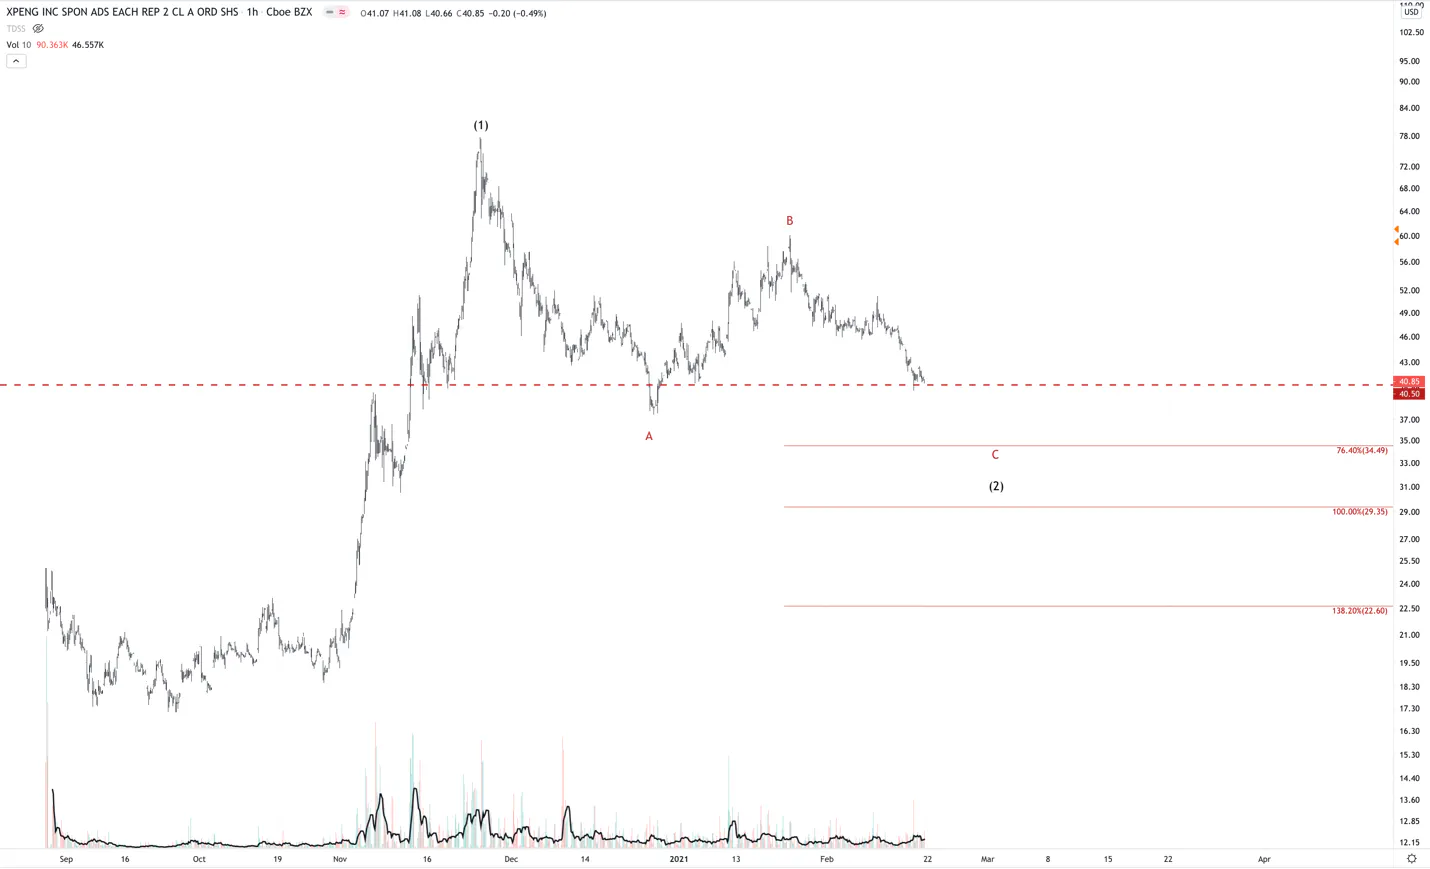
XPEV is at the must hold line, which is around the $40.50-$40 price region. A break below this level opens the door to the higher probability that we see a lower low before this 2nd wave correction is over.
XPEV is 1% of our portfolio and currently down ~20%. This continued move lower could see it down an additional 20-30%.
We practice safe position sizing in our portfolio management when starting new positions, which is why we are not as concerned. XPENG is currently around 1% of our portfolio.
We consciously decided to build out our position based on the 3 scenario that we outlined weeks ago. We believe in this story and the opportunity, so we plan to accumulate more if XPEV follows this path.
The good news: we have a 5 wave pattern up off the IPO low. This means that once we complete this 2nd wave, we will then be in the 3rd wave, which lines up with Beth’s thesis.