In the video below, I quickly go over Bill.com’s Q1 FY2022 results, which pushed the company’s stock to a new all-time high. Bill.com’s business model is bifurcated between subscription sales and transaction fee revenues, both of which accelerated in the most recent quarter. In fact, transaction revenues have exploded and grew over 300% YoY!
The company’s balance sheet is also clean as Bill.com operates an asset light business model. Cash is over $1 billion and the majority of assets on the balance sheet relate to cash held for clients. With sales accelerating and a strong cash balance, Bill.com appears poised for strong growth going forward. Watch the video below to find out more!
Sign up for I/O Fund's free newsletter with gains of up to 1100% -Click hereSign up for I/O Fund's free newsletter with gains of up to 1100% -Click hereClick here
In the analysis below, we give a brief overview of our universe of cloud stocks and discuss key metrics that investors should be aware of heading into Q3 earnings.
Cloud Stocks: Top 10 EV/FWD Revenue Multiples
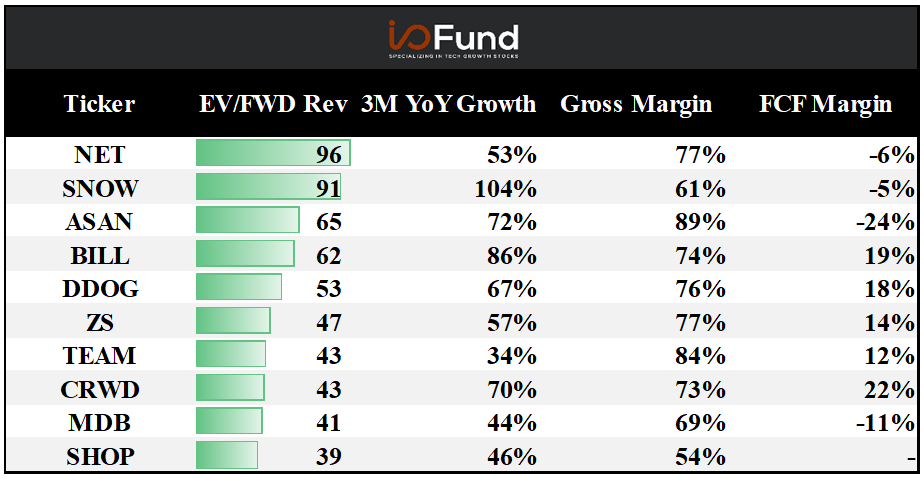
Below is a table of cloud stocks ranked by their EV/FWD sales multiples, along with their most recent YoY growth rate, gross and free cashflow (FCF) margins. Cloud has been a strong category for growth recently, which has rewarded the top performers with premium multiples
Cloudflare (NET) has the highest EV/FWD sales multiple in our universe of cloud stocks. The company has made some announcements around object storage costs recently, which could be impactful for the company going forward.
Snowflake is right behind Cloudflare at a 91x EV/FWD Revenue multiple. Snowflake grew sales over 100% in Q2, and its net revenue retention rate was 169% during the quarter, highlighting the company’s success in capturing market share. Management attributed the strong results to increased customer data consumption, a trend that will likely continue into the future.
Cloud Stocks: Top 10 Three-month Forward YoY Growth Rates
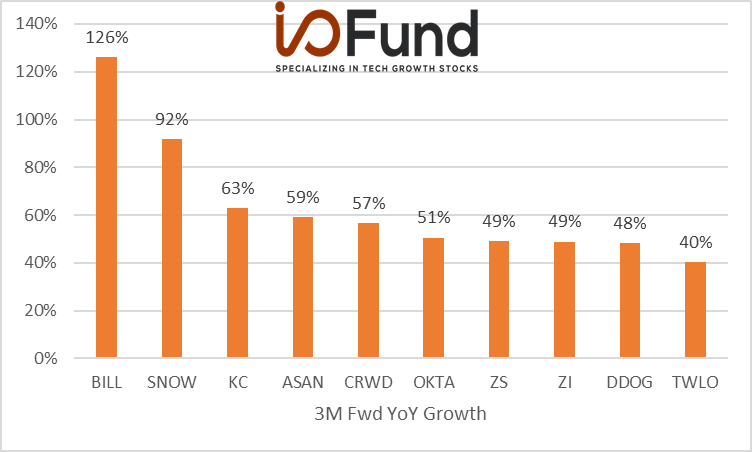
Looking forward, Bill.com (BILL) and Snowflake are expected to be the fastest growing cloud stocks in our universe. BILL’s expected growth rate is skewed by its recent acquisition of Divvy, and excluding the acquisition, organic growth is expected to be ~60% next quarter. Snowflake is expected to continue to report strong growth of 92%, similar to the 104% growth it reported in the most recent quarter. As mentioned above, Snowflake is benefitting from a secular tailwinds as enterprises increase their data consumption.
Top 10 Weekly Share Price Movements
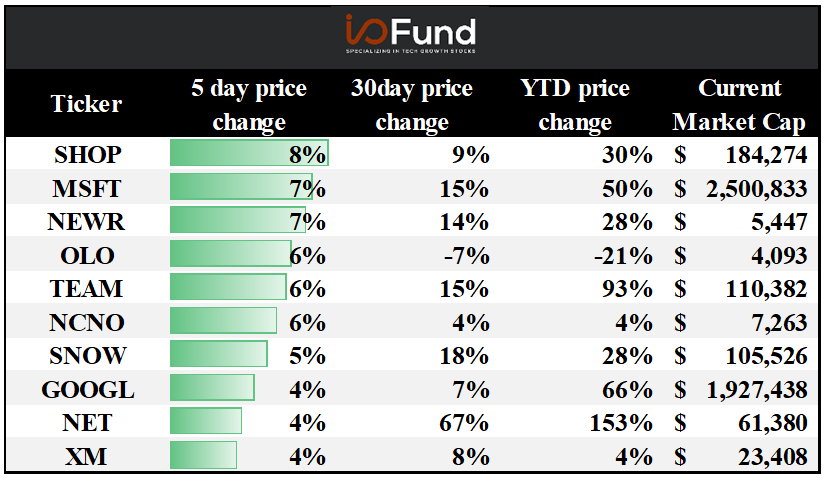
In the table below, we ranked the cloud stocks that saw the largest one week increase in their share price. Shopify (SHOP) has been a top performer this past week, as the stock rebounded after a slight sell-off following its Q3 results. Microsoft (MSFT) also reported last week and the market reacted by increasing its market cap to $2.5T, surpassing Apple as the most valuable company in the world.
Sign up for I/O Fund's free newsletter with gains of up to 1100% – Click hereSign up for I/O Fund's free newsletter with gains of up to 1100% – Click hereClick here
The I/O Fund has covered Microsoft in detail since 2018 when Beth explained Microsoft’s hybrid strategy when she boldly stated that Azure could overtake AWS on cloud IaaS. Microsoft’s hybrid cloud approach has allowed the company to outperform its peers and positions Microsoft well to continue to take share in the hyper-growth cloud market.
Top 10 Changes in sales growth estimates – last 90 days
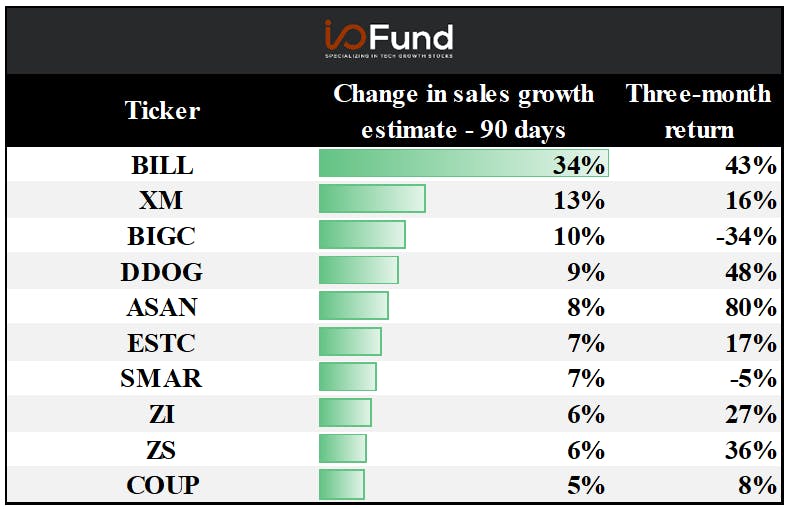
The table below ranks the cloud companies that have had the largest revisions to their forward topline growth expectations over the last 90 days. As mentioned above, Bill.com (BILL) recently completed a series of acquisitions which contributed to an outsized increase in its sales expectations. Similarly, Qualtrics (XM) recently completed its acquisition of Clarabridge, which has led to an upward adjustment in its growth rate. Datadog’s (DDOG) estimates have increased 9% over the last 90 days and its stock price has also increased nearly 50% over the same time period. The market is likely pricing in strong growth for the company as Datadog continues to lead in the cloud observability category.
Update on EV/Fwd revenue multiples:Update on EV/Fwd revenue multiples:
Overall stats:
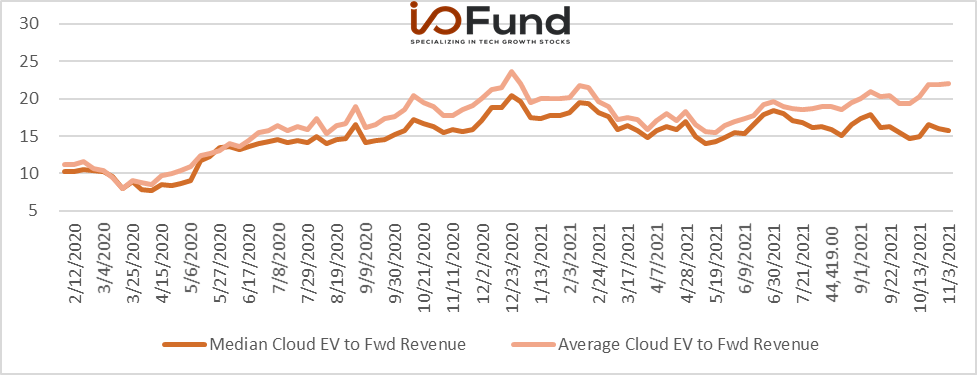
Overall Cloud forward median: 16x
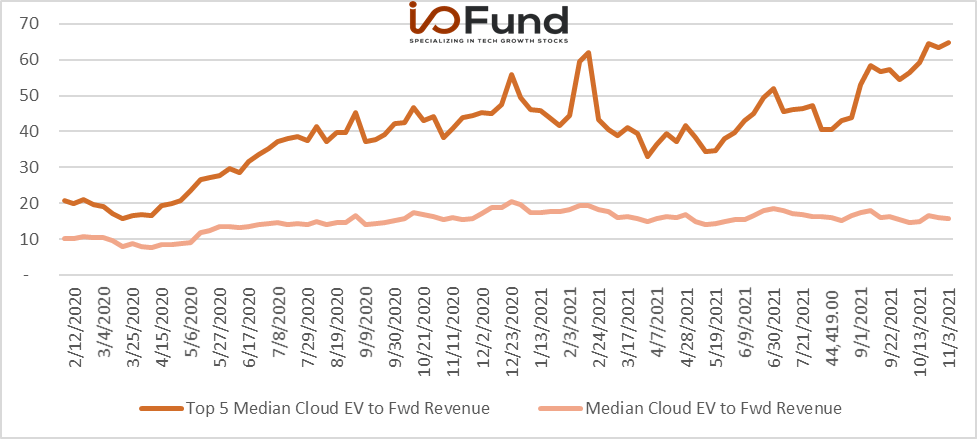
Top 5 Cloud forward median: 65x
Overall Cloud forward average: 22x
EV/FWD SALES:
As shown below, the median and average cloud EV/Fwd revenue multiple has trended up throughout the year. The average multiple has started to increase faster than the median, as the top valued cloud companies have experienced a sharp rise in their multiples in recent months.
Top 5 EV/FWD SALES:
In the chart below, we can more clearly see the large dispersion in cloud valuations, as the top 5 premium valued cloud stocks have had their EV/Fwd sales multiples rapidly expand since May 2021 and are now at new highs. The cloud category is often considered to a be a “winner gets most” market, where the market leader captures the majority of the addressable market. This dynamic helps explain why the top 5 valued cloud stocks have grown their multiples much faster than the median.
EV TO FWD SALES Growth Buckets:
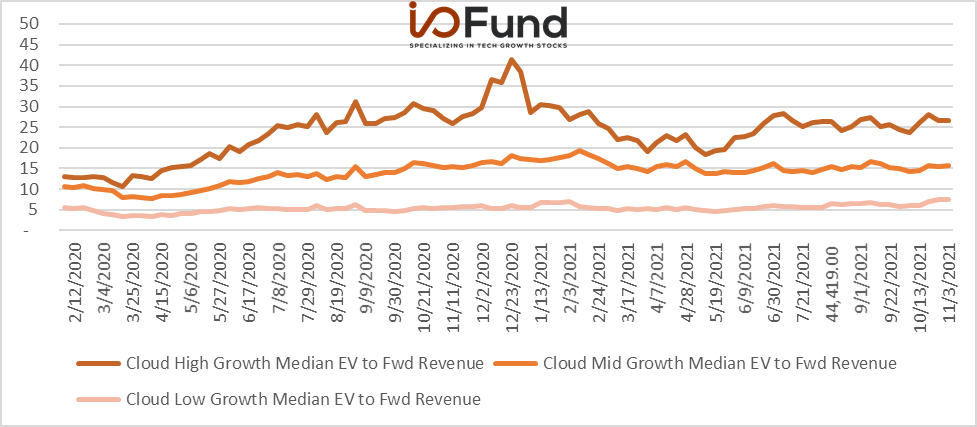
We can further dissect the changes in cloud valuations by breaking up the group into high growth (>30% growth), mid growth (>15% and <30%) and low growth (<15%). The below chart shows that higher growth cloud stocks receive a higher multiple from the Street. Furthermore, high growth stocks used to be valued more richly back in Q4 2020 but have since seen their valuations normalize to a lower multiple. If Q3 cloud earnings come in strong, then the market may push valuations back up to their historic highs.
Top 30 EV TO FWD SALES:
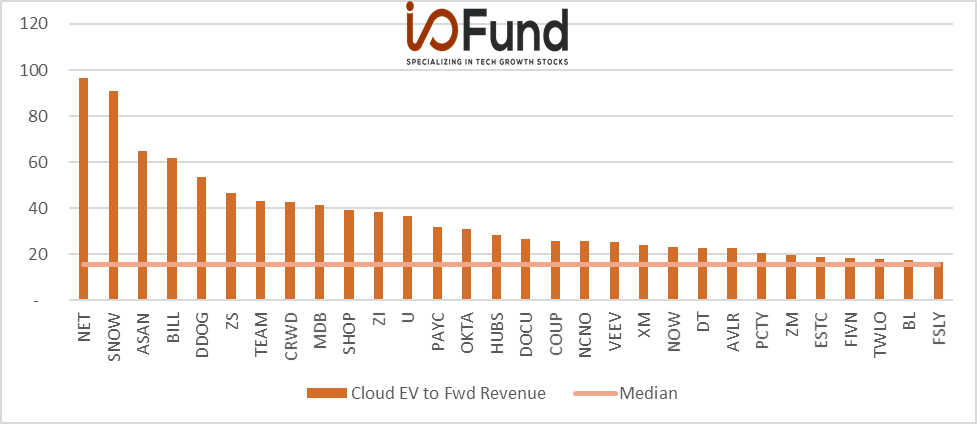
The below chart provides a more holistic view of the top 30 valued cloud stocks based on EV to Fwd revenue estimates. Cloudflare (NET) and Snowflake (SNOW) have the highest valuations of the group and are valued more than 500% higher than the cloud median of 15x. As mentioned above, NET and SNOW are benefitting from trends that are expected to continue to result in robust growth going forward, such as cloud storage costs and data consumption.
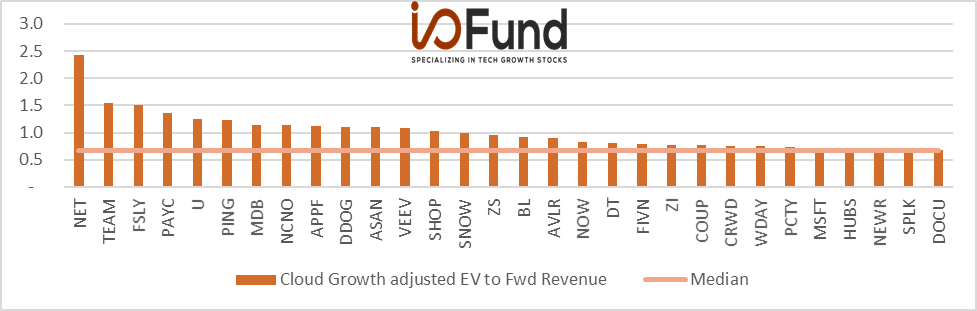
The last chart is based on EV to FWD sales but also takes into account forward growth expectations. By scaling valuation relative to forward growth, we can more clearly see which companies are cheapest relative to forward growth. A low value in the chart below means that a company is cheap relative to growth. For example, SNOW dropped from being one of the most expensive stocks to being valued closer to the median once we take into account its strong growth expected next quarter.
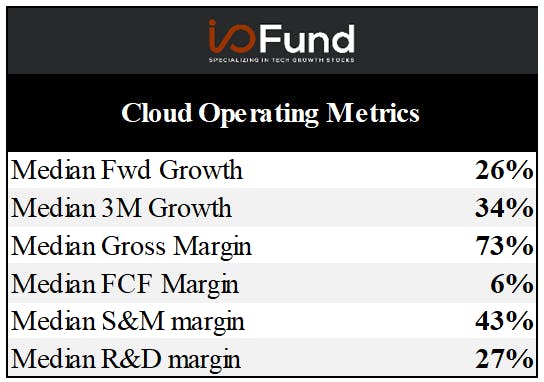
Finally, the last table we will be discussing includes aggregate cloud operating metrics. The below table shows that cloud is performing strongly as the median forward growth rate is above 20%, while gross margins are high at over 70%. The median cloud company is also FCF positive with a 6% FCF margin.
Strong growth and positive cashflows signal that the cloud category is healthy and performing well. The I/O Fund expects this strength to continue going forward. Find out which the Street has been saying about cloud stocks heading into earnings. “Overview of 6 Cloud Stocks for Q3 Earnings”
The I/O Fund is a team of analysts that share their research publicly as they build a portfolio of 30 stocks. Our team has record results for a retail Fund and we also have four-digit gains on some of our free newsletter coverage. You can learn more about our premium service by clicking here or sign up for our free newsletter here.premium service by clicking here or sign up for our free newsletter here.
Disclaimer: This is not financial advice. Please consult with your financial advisor in regards to any stocks you buy.
Cloud stocks continue to do well in the market as these companies are growing very fast. This quarter we chose Cloudflare, Datadog, Dropbox, Bill.com, Five9, and RingCentral with some already reporting today and some reporting soon.
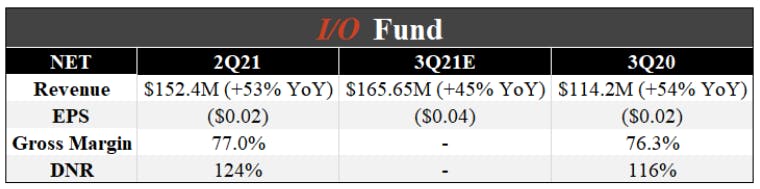
Cloudflare’s Q3 sales grew 51% YoY to $172 million, which beat the consensus estimate of $166 million by 4%. The company also expects Q4 sales to grow 47% YoY to $185 million, which is 5% higher than the Street’s initial forecast of $176 million.
Source: Earnings report and YCharts
Cloudflare’s revenue grew from $85M in 2016 to $431M in the year 2020, a compounded annual growth rate of 50% during the period. In the second quarter revenue grew 53% YoY to $152M, it was primarily helped by the strong growth in paying customers. At the end of the second quarter, it had 126,735 paying customers (+32% YoY) and it also witnessed a significant addition of large customers. This growth continued into Q3 as Cloudflare beat topline estimates by 4% after reporting strong YoY sales growth of 51% during the quarter.
Going into earning, Jefferies analyst Brent Thill had downgraded the company to a hold rating from a buy with a price target of $195. The analyst is concerned of the valuation after the strong share gains. However, he continues to view Cloudflare as the "most disruptive cyber vendor with strong fundamentals," he is of the view that “the company has the richest multiple in his coverage universe at 56 times enterprise value to consensus 2023 revenue estimates” and he "would look to get more constructive at a more reasonable valuation."
Needham analyst Alex Henderson has said that the company’s move into email security as a positive. He says “just one more example of why Cloudflare will become a major company.”
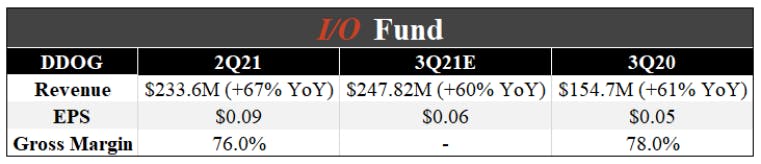
Datadog reported that Q3 sales grew 75% YoY to $270 million, which bested the consensus estimate of $248 million by 9%. The company expects Q4 sales to grow 64% YoY to $291 million, which is 10% higher than initial expectations.
Source: Earnings report and YCharts
In the prior quarter of Q2, Datadog reported strong second quarter results. It beat the analyst’s revenue estimates by $21M and the adjusted earnings by $0.06. The company had also raised the full-year revenue guidance to $938M-$944M, up from the previous guidance of $880M-$890M. Datadog continued this momentum and reported a 9% top line beat during Q3 and guided Q4 sales 10% higher than initially expected.
It also witnessed strong growth of large customers (annual recurring revenue of over $100,000) as they grew to 1,610 from 1,015 from the same period last year in Q2. This quarter, large customers grew to 1,800, up 66% from 1,082 in the prior year quarter.
RBC Capital analyst Matthew Hedberg has raised the company’s price target to $176 from $154 and has kept the Sector Perform rating on the shares. The analyst expects the company to report "strong" Q3 results with upside, building off last quarter's acceleration. The analyst adds that he expects Datadog to continue to benefit from continued traction in multi-module sales, strong new customer adds, and favorable cloud adoption trends.
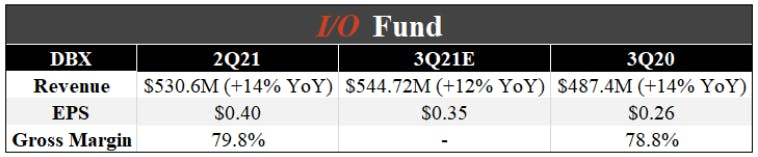
Dropbox reported Q3 sales of $550 million, which grew 13% YoY and came in 1% higher than the consensus estimate of $545 million. The company’s outlook for Q4 forecasted sales to grow 12% YoY to $563 million, 2% higher than the Street’s initial estimate of $553 million.
Source: Earnings report and YCharts
The company’s revenue growth is not very strong when compared to other cloud stocks. However, the company has got good free cash flow and it’s profitable. In the last quarter, the management has raised the full-year revenue guidance to $2.136B-$2.142B from $2.118B-$2.130B. It aims to generate annual free cash flow of $1B by the year 2024. The management revenue guidance for the third quarter is $543M-$546M, which represents a growth of 12% YoY at the mid-point.
Sign up for I/O Fund's free newsletter with gains of up to 1100% – Click hereSign up for I/O Fund's free newsletter with gains of up to 1100% – Click hereClick here
Jefferies analyst Brent Thill has a price target of $40 and a buy rating on the stock. He believes that the company’s increased full year guidance is still conservative.
Bill.com Holdings Inc reports on November 04th
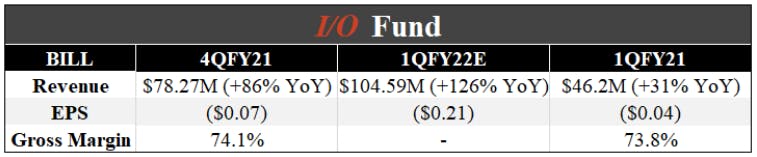
Bill’s Q1 FY22 sales were $116 million, which beat the consensus estimate by 11% and represented a 166% YoY growth rate (organic growth was 78% YoY). Bill.com guided for Q2 sales to grow 141% YoY to $131 million, which was 12% higher than initial estimates.
Source: Earnings report and YCharts
The consensus analyst’s revenue estimates are strong for the next quarter. However, we cannot compare to the previous periods as the results will include Divvy. It completed the acquisition of the spend management solutions provider Divvy, on June 01, 2021, and the 4Q results included Divvy results. The stock has been one of the best performers in the sector. However, it would be interesting to watch how the company faces competition from other players and justifies its valuation. Bill.com reported Q1 FY2022 sales that beat top line estimates by 11% and guided next quarter sales well above consensus estimates.
Jefferies analyst Samad Samana had a buy rating going into earnings and a price target of $350. The analyst anticipates organic core revenue growth to "decelerate modestly" against a tougher comp, but his 60% growth outlook is still "very healthy". Bill.com should be a "core" long-term growth holding, with the stock offering "solid upside" based on his potentially "conservative" assumptions.
Deutsche Bank analyst Bryan Keane initiated coverage of Bill.com with a Buy rating and $360 price target. He believes that “BILL is uniquely positioned in the market due to its end-to-end offering, including accounts payables (AP) and accounts receivables (AR) automation as well as electronic payment offerings like virtual cards, instant transfers and cross-border FX. He further states “We see potential for ~70% Y/Y core organic growth in 1Q22 and ~57% Y/Y for FY22 compared to guidance of ~60% Y/Y and ~45% Y/Y driven by new customers, higher engagement, and increasing take rates from mix shift with reported growth reaching as high as +124% Y/Y in FY22 including Divvy and Invoice2go.”
Five9 Inc reports on November 08th
Source: Earnings report and YCharts
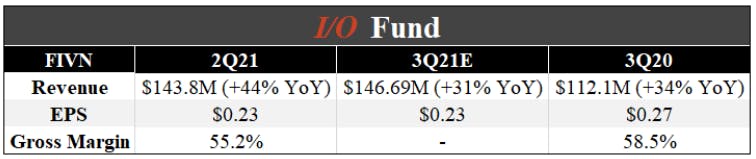
The consensus analyst’s revenue growth is slower than the second quarter and also from the previous year. The company did not have an earnings call in the last quarter due to the pending merger transaction and the next call would have more details about growth prospects as a standalone company.
Analysts have been positive after the Zoom-Five9 deal failed to materialize. Barclays upgraded FIVN to Overweight, saying the deal's breakdown refocuses the investment case back on fundamentals. And “We don’t think lack of a deal hurts Five9’s positioning with enterprise customers."
Evercore has an overweight rating on the stock and in the words of analyst Peter Levine, "firing on all cylinders, the pending acquisition was not a distraction, partner contributions remain strong, and the numbers released in the proxy are a fair representation of the current trends in the business."
Sign up for I/O Fund's free newsletter with gains of up to 1100% – Click hereSign up for I/O Fund's free newsletter with gains of up to 1100% – Click hereClick here
Jefferies analyst has a $180 price target and a hold rating. His checks throughout Q3 suggested demand remains solid across both UCaaS and CCaaS, he thinks Five9 "has a tough setup" given that management not providing guidance last quarter has resulted in "a wider than normal estimate dispersion." Management's 10-year financial plan in their merger proxy raised buyside expectations, but he does not expect the company to guide to the proxy levels, which may disappoint some investors.
We have covered Five9 stock in our premium site in the past.
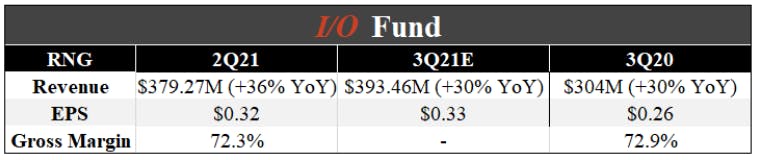
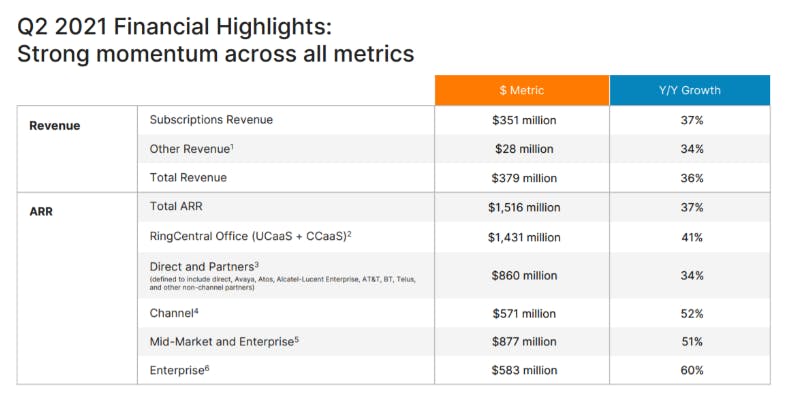
RingCentral has been showing steady growth. The management had raised the full-year revenue guidance to $1.539B to $1.545B, which represents a growth of 30% to 31%, which is up from the prior guidance of $1.5B to $1.51B. The third quarter revenue guidance is in the range of $390.5M to $393.5M.
Source: Earnings Slides
Jefferies analyst Samad Samana has a buy rating on the stock with a price target of $360. His checks throughout Q3 suggested demand remains solid across both UCaaS and CCaaS, which he thinks should translate into solid Q3 results.
Barclays analyst Ryan MacWilliams initiated coverage of RingCentral (RNG) with an Overweight rating and $350 price target. “RingCentral shares are attractive and RingCentral Office remains the most applicable as well as marketable solution for mid-market enterprise customers, even though Zoom Phone (ZM) and Microsoft (MSFT) Teams adoption has unfairly changed investor perception of the stock, leading to a disconnect in valuation to the company's recent quarterly performance.”
The I/O Fund is a team of analysts that share their research publicly as they build a portfolio of 30 stocks. Our team has record results for a retail Fund and we also have four-digit gains on some of our free newsletter coverage. You can learn more about our premium service by clicking here or sign up for our free newsletter here.by clicking here or sign up for our free newsletter here.
Disclaimer: This is not financial advice. Please consult with your financial advisor in regards to any stocks you buy.
ZoomInfo reported 11/1/2021 and beat on both the top and bottom -line. Q3 sales increased 60% YoY to $198 million, which was also 8% above the Q3 consensus estimate of $184 million. The 60% YoY growth rate represented an acceleration from the 57% and 50% YoY growth rates in Q2 and Q1 2021, respectively. However, after adjusting for recent acquisitions, organic sales grew 54% YoY in Q3, which was static to the 54% YoY organic growth rate in Q2. Enterprise customer count and organic bookings growth also deaccelerated during the quarter, which has moved us to the sidelines. I touch on these trends in more detail below.
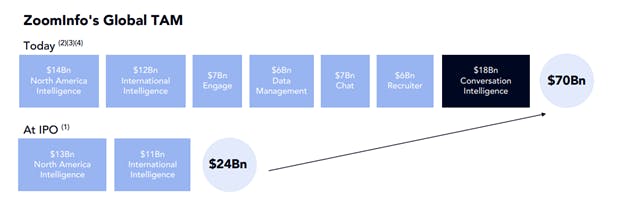
Continuing down the income statement, gross margin increased 250 bps YoY to 81% while adjusted operating margin fell YoY from 47% to 39%. A rapid 225% YoY increase in research and development expense drove the margin compression, as the company invests in new products such as conversational intelligence. On the Q3 call, CEO-Founder Henry Shuck explained that the company is investing heavily in conversational intelligence, a market that ZoomInfo believes can be an $18 billion opportunity. As shown below, recent acquisitions and expansion into new verticals such as conversational intelligence, recruiting, and training have expanded ZoomInfo’s total addressable market to $70 billion. Finally, adjusted Q3 EPS doubled YoY from $0.07 to $0.14 and also bested the consensus estimate of $0.12 by 2 cents.
During the quarter, management also cleaned up its corporate structure by eliminating its multi-class share structure, resulting in the same economic and voting interest for all shareholders. The improved corporate governance and reduced complexity is expected to enable the company to be included in stock indices, which should increase demand for its shares going forward. This event also created a taxable event as pre-IPO shareholders saw a step up in their cost basis. The company recorded a $4 billion tax asset and $3 billion tax liability as of Q3, with the net $1 billion tax asset lowering future cash taxes over time.
Increased Outlook and Strong Customer Metrics but a Slight Deacceleration in Growth
ZoomInfo’s topline beat also led to a rise in guidance. Management raised their FY2021 sales guide by 4% to $732 million (at the midpoint). The guide implies 54% YoY revenue growth, up from the prior guide of 48% and also implies an organic growth rate of 50%.
Given the recent challenges in the advertising market related to changes to IDFA, it is great to see that ZoomInfo continues to expect robust growth going forward. CEO-Founder Henry Shuck explained during the Q3 call that explained that “our continued investment in privacy is a competitive differentiator.” The company’s roll out of ‘privacy clusters’ in 2020 and its focus on B2B company data, rather than individual level data, has likely helped it navigate the changing market place around data and privacy.
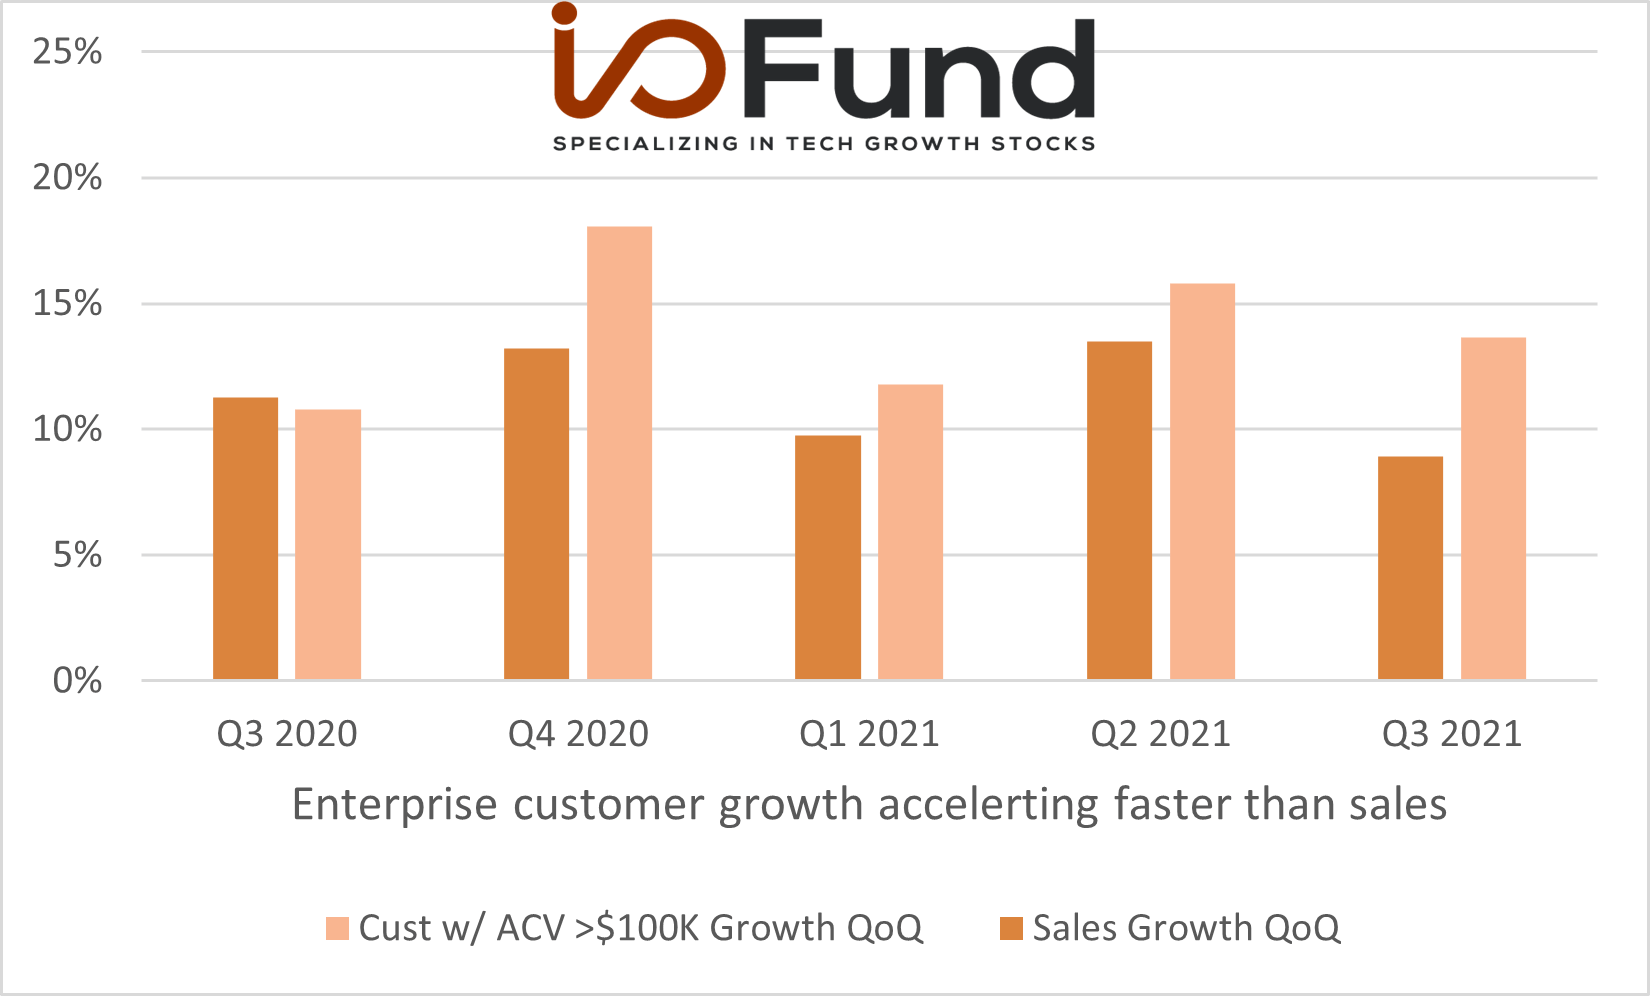
Furthermore, the company’s focus on B2B data is a direct result of its strong growth with enterprise customers. Customers with over $100,000 in annual contract values (a proxy for enterprise customers) grew 74% YoY to 1,250 customers, an acceleration from the 69% YoY growth in Q3 and also outpaced the 60% YoY growth in Q3 sales. The growth was also robust on a sequential basis, as enterprise customers increased 14% QoQ, however this was a slight deceleration from the 16% QoQ increase in Q2, but faster than the 9% QoQ rise in organic sales (shown below).
The acceleration in enterprise customer growth is important as it helps support a premium multiple and highlights how ZoomInfo is increasingly becoming known as a category-defining company in B2B sales and marketing. However, the deacceleration on a sequential basis is something to note and may signal that growth will slowdown in the near term. Dollar based net retention remained static at 108%, which has room to improve as ZoomInfo has made a series of acquisitions that have expanded the amount of products that customers can expand into.
Finally, the company’s revenue quality has also improved, which also supports a premium multiple. We can measure revenue quality by observing trends in both accounts receivables and deferred revenue. Accounts receivables increased just 22% YoY, while deferred revenue increased 63% YoY during Q3, which outpaced the 60% YoY increase in Q3 sales. The relatively faster pace of growth for deferred revenue signals that ZoomInfo is collecting more cash from its sales than in prior years, a sign of strength.
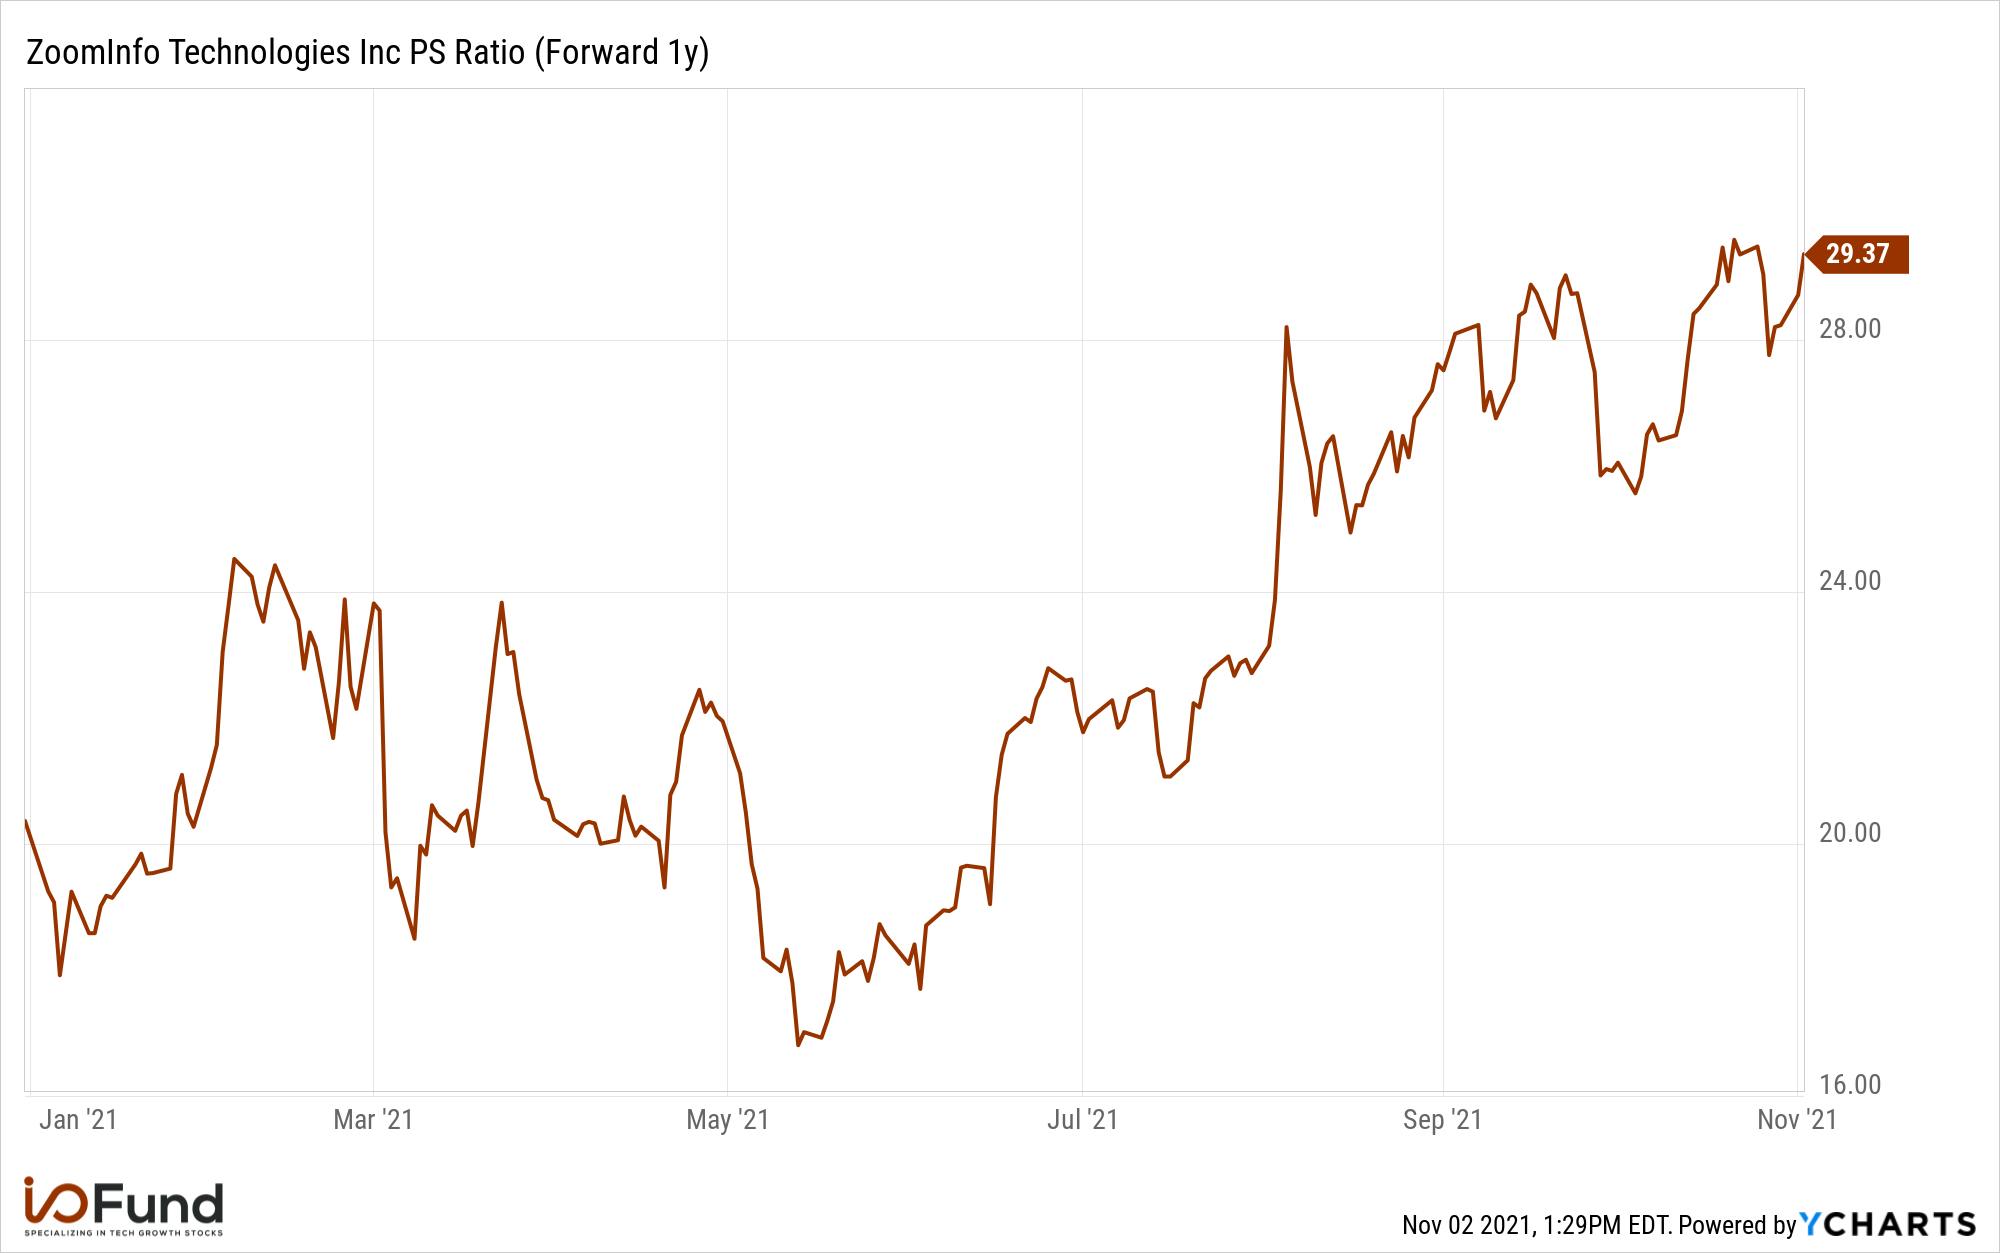
Bookings were also strong during Q3, but did deaccelerate during the quarter. For instance, Q3 organic bookings increased 49% YoY in Q3, a deacceleration from the 71% and 65% growth rates reported in Q2 and Q1, respectively. Bookings can be lumpy, and management stated on the Q3 call that bookings “can be imprecise metrics to assess in-period activity and forward momentum”. Nevertheless, the deacceleration in bookings is something we will need to be mindful of going forward, especially considering ZoomInfo’s premium forward sales multiple of 29x.
The deacceleration in organic growth, sequential enterprise customer growth and organic bookings moved ZoomInfo to the ‘chopping block’ as the company was in our momentum portfolio and we did not want to hold the company if growth starts to slow.
In summary, ZoomInfo beat both top and bottom -line Q3 estimates and also raised its FY21 sales guide. During the quarter, ZoomInfo reorganized its corporate structure, which allows the company to be included in more indices going forward. The company has also been able to navigate the changes to the data privacy landscape well, evident by the robust growth in enterprise customers. The strong growth with enterprise customers provides support for future sales growth. However, organic sales growth slightly deaccelerated during the quarter (growth was static at 54%), as did sequential enterprise customer growth and YoY organic bookings, a trend we will need to be mindful of going forward, especially considering ZoomInfo’s premium multiple. Since we do not want to hold a company in our momentum portfolio that may be slowing down, we decided to cut our ZoomInfo holdings.
In the short video below, I go over Lyft’s record Q3 results. The company appears poised to exit covid much stronger, as revenue per ride and contribution margin reach all time highs during the quarter. Adjusted EBITDA has also been positive for two quarters in a row, a trend that will likely continue going forward.
Key trends should improve in 2022, which should benefit Lyft’s top and bottom -line. For example, business travel is still subdued, and a continued recovery in business travel is expected as vaccination rates increase. This should support an increase in rides, allowing Lyft to continue to scale its operations. I also discuss broader macro trends that contribute to Lyft's business model. Watch the find out more!
Sign up for I/O Fund's free newsletter with gains of up to 1100% -Click hereSign up for I/O Fund's free newsletter with gains of up to 1100% -Click hereClick here
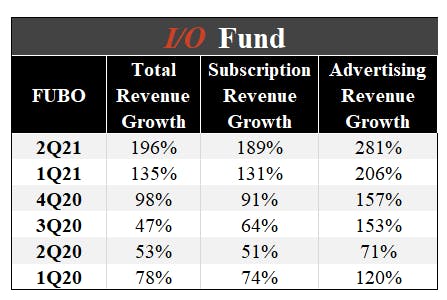
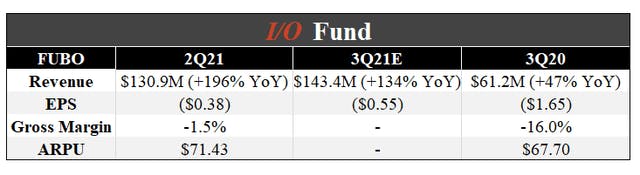
According to critics, the riskiest quarter for fuboTV (FUBO) ("Fubo") was Q2 due to the off-season for major sports in the United States. The company went on to report a 196% YoY jump in its revenue to $130.9M. It was primarily helped by the strong growth in subscription revenue and advertising revenue. Subscription revenue grew by 189% to $114.4M and advertising revenue grew by 281% YoY to $16.5M. It was the fastest advertising sales growth in the company's history.
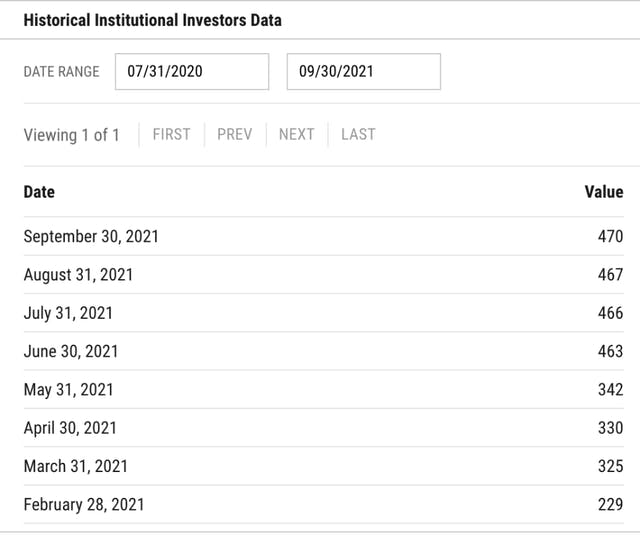
So much for a tough quarter – but how did Fubo accomplish this? That will be important to look at as the market has overlooked Fubo for its growth and the company has not been rewarded for the ongoing beats and guidance raise. We should clarify and say we think it's the retail market that has overlooked the company while institutions are quietly moving off the sidelines with ownership doubling since February from 229 to 470 institutions.
Source: Ycharts
Below, we will look at Fubo's recent history to form an opinion on why Q3 could be quite strong. We also pulled Apptopia data on downloads and sessions to look at engagement trends. Lastly, we revisit the major catalyst in Fubo's future: sports betting.
Why Fubo Crushed Q2
To call Q2 a seasonally light quarter for sports would mean only the United States is being factored into the analysis. This mistake was also made in Q1 when critics predicted the downfall of Fubo based on March Madness, a tournament that has roughly 17 million viewers.
Fubo's roots are in soccer. Fubo has the exclusive rights in the United States to stream the remaining 70 Qatar World Cup 2022 qualifying matches of the South American Football Confederation. This began in June. Obviously, Fubo will not capture this full TAM, but even a small percentage can have a larger impact than a tournament like March Madness.
Fubo was also able to score some major league baseball deals, such as a carriage agreement with Marquee Sports Network which gives access to the Chicago Cubs games.
Advertising grew from 10% of revenue to 13% of revenue for Fubo in Q2. We have seen the company re-accelerate from 70% during the Covid quarter to 281% in the most recent quarter (that is serious acceleration). Although those high triple-digit numbers can't last forever, it shows how the demand for advertising on the platform will help offset licensing costs as time goes on.
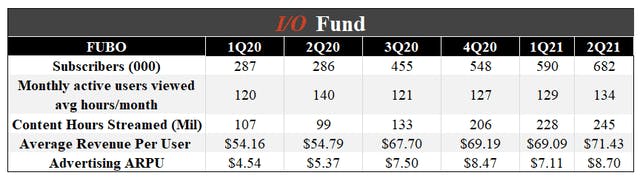
The average revenue per user (ARPU) increased 30% YoY to $71.43 and advertising average revenue per user showed a substantial 62% YoY growth to $8.70. Increasing ARPU and an increasing number of subscribers is a solid combination to have when taking market share as it shows the company does not need to discount the product to be competitive.
In addition to the advertising opportunity, the company is also the fastest-growing SVOD platform and is taking market share from competitors. The company had total subscribers of 681,721 (up 138% YoY) at the end of the June quarter, a net addition of 91,291 from the previous quarter. Meanwhile, according to the data from Statista, the global SVOD market in 2021 is expected to grow 23% YoY to $70.8B in 2021 and the US SVOD market is expected to grow 18% YoY to $32.1B.
This supports our original thesis in December that live sports audiences are the last to cut the cord and are the most coveted audience right now for this reason.
The streaming increased in the last quarter as monthly active users (MAUs) watched about 134 hours per month on average, which is reasonable considering Q2 2020 was a quarter where many people spent increased time indoors.
We have noted many times that the company is in a high growth stage and the street is discounting the company for its weak gross margins. However, the company's margins are improving.
In the last earnings call, it was mentioned by the CEO, "50% gross margins will be our long-term target. We will also look to target about $10 to $15 of advertising ARPU based on that 50% margin."
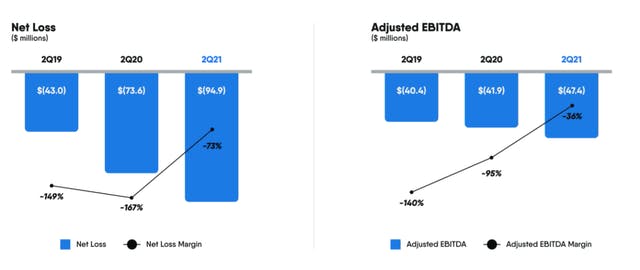
The net loss came at ($94.9M) when compared to ($73.6M) for the same quarter last year and adjusted EBITDA came at ($47.4M) when compared to ($41.9M) for the same period of the previous year. The adjusted EBITDA margin was -36% in Q2 2021 compared to -95% in Q2 2020.
Source: Earnings Presentation
The company's launch of Fubo Sportsbook is an important event to track in Q4. We've covered the sports betting opportunity in detail, including the projection that the industry could reach $155 billion by 2024. fuboTV has a better position than its rivals as they own their audience and it's an upsell rather than a new user acquisition loop. The company acquired Balto Sports and Vigtory to help release the free-to-play and sports wagering. When sports betting launches, we think we will then see Fubo's full monetization potential by combining subscriptions, advertising, and betting for global sports on one platform.
fuboTV CEO David Gandler predicts that nearly 40M to 50M people in the USA will subscribe to digitally delivered video networks in the next five years. He believes that his company can target about 10% of the market.
Q3 Earnings Preview with Apptopia Data
Fubo increased their full-year revenue guidance to $560-$570M, representing a 116% YoY growth at the mid-point, up from the previous guidance of $520-$530M. The subscribers for full-year 2021 are estimated at 910,000 to 920,000, up from the previous guidance of 830,000 to 850,000.
Third-quarter revenue guidance is between $140-$144M, representing 132% YoY growth. Subscribers are expected to be 810,000 to 820,000. The consensus analysts' revenue estimates are close to the higher end of management guidance.
In the past, we analyzed app downloads and sessions using Apptopia data to look at the health of the mobile app. Please keep in mind, this is not an earnings call as there can be other earnings surprises in terms of gross margins and profits that can cause a stock to sell off after an earnings report. We are also reporting on downloads and sessions, whereas Fubo reports subscribers.Please keep in mind, this is not an earnings call as there can be other earnings surprises in terms of gross margins and profits that can cause a stock to sell off after an earnings report. We are also reporting on downloads and sessions, whereas Fubo reports subscribers.
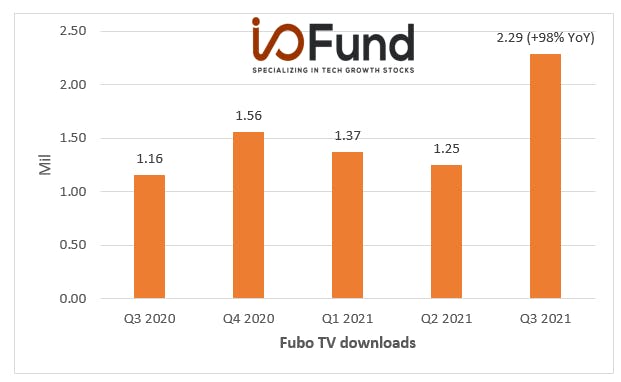
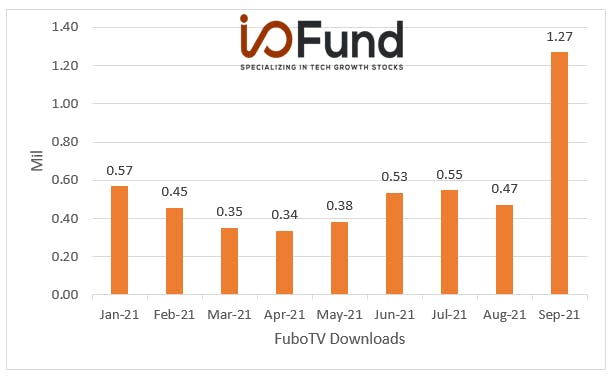
According to the Q3 data from Apptopia, Fubo's downloads accelerated 98% YoY and 82% QoQ to 2.29M.
Source: Apptopia
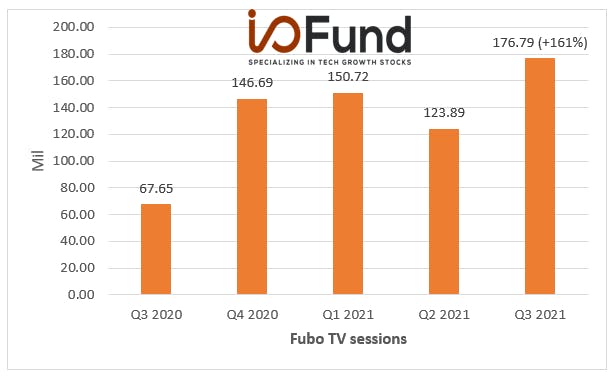
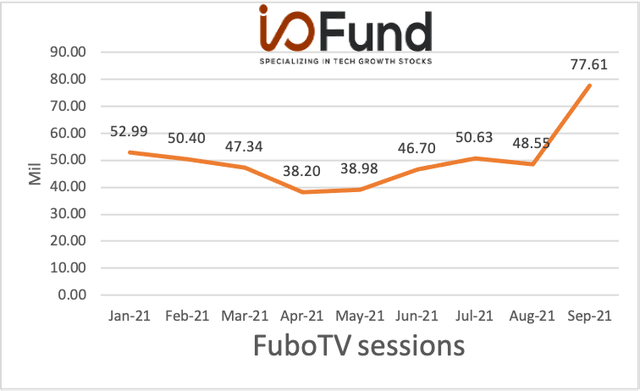
The sessions data shows 161% YoY growth and 43% QoQ growth to 176.79M. Please note, downloads show us a glimpse as to new activity but they do not represent subscribers who already have the app downloaded. Sessions help to provide more color, if we assume sessions were comparatively equal across subscribers in previous quarters.
The data below shows a spike in September. The start of the NFL season likely contributed, as well as exclusive coverage for the South American World Cup 2022 Qualifiers (CONMEBOL) in the US.
Fubo also announced its free-to-play games and FanView live stats feature for its September CONMEBOL matches. The players who answer questions correctly during the match get points and have the chance to win cash prizes. The integration of free games and FanView increased the engagement in fuboTV during its beta testing in June and this might also have led to the spike in demand in September.
In the words of David Gandler, co-founder and CEO of Fubo, "We believe this will mark the first time any company has integrated live streaming television, free games and live stats within the same platform, on the big screen. With free games and our upcoming Fubo Sportsbook real-money wagering app, we intend to deliver a truly interactive streaming experience, one that we expect will improve engagement and retention to fuboTV while also driving advertising revenue."
The most important thing we see in this data is that fuboTV broke out of its trendline on monthly sessions and downloads as the month of September marks an all-time high for the year. We will get a quarterly report from the company yet the data helps substantiate on a more granular level that Fubo is capable of sizable growth in a single month. The key takeaway is that September is 46% higher than the previous all-time high met in January during the Super Bowl.
As stated, downloads and sessions don't guarantee an earnings beat, however, as a long-term buy and hold investor, growth like this is what I look for. I also look for evidence that the thesis I formed is playing out. Therefore, I see this data as a positive and the flurry of announcements around sports betting is also a positive.
More Fubo Announcements …
While the market is aptly rewarding DraftKings with a 1-year forward P/S of 11, Fubo has quietly been gathering strength in sports betting while at a 1-year forward valuation of 4.4. We covered why we like Fubo better than DraftKings.
In the third quarter, Fubo completed the Market Access Agreement in Arizona. It also received approval to offer Online Sports Wagering in two states namely, Iowa and Arizona. On November 3rd, the company announced that Fubo Sportsbook is live in Iowa.
Fubo Sportsbook also entered a multi-year partnership with the New York Jets. There will also be a Fubo Sportsbook Lounge at MetLife Stadium for the NFL team's home games.
Fubo Gaming partnered with the Cleveland Cavaliers to promote its brands through various marketing avenues. More recently, it also announced a partnership with NASCAR (The National Association for Stock Car Auto Racing) to become the authorized gaming partner of NASCAR.
Fubo's distribution is also growing. The company announced in September that fuboTV will be available on VIZIO SmartCast TVs. Earlier in June, it launched in LG Smart TVs. fuboTV also announced a distribution agreement with AT&T SportsNet Rocky Mountain.
ROOT Sports and fuboTV announced a distribution agreement in September which will give fuboTV customers access to Seattle Mariners, Seattle Krakken, and Portland Trail Blazer Games. We think these regional adds are important to watch as one metro area has the capability to boost Fubo's user base.
Conclusion
According to the data, September was Fubo's best month this year by nearly 46% (i.e., it's not even a close call with January's Superbowl month). This does not guarantee quarterly performance but we certainly like to see growth trending upwards and we like it when this happens concurrently with new catalysts, such as sports betting. If you think of where this company was during the Covid quarters when live sports was shut down, the comeback has been quite incredible.
On that note, tech growth investing is not for the faint of heart and Fubo has certainly tested investors who prefer clearer financials. However, I've been analyzing OTT tech startups since 2011 and there are certain indicators I look for in terms of analyzing the strength of a product. Fubo hits on many of those indicators and I think investors will either relent if Fubo puts up a Q3 beat or they will get left behind in the dust once sports betting launches. One thing is clear, Fubo is not letting up.
Sunrun is an innovative solar company that pioneered the Solar-as-a-service model, where it finances the initial investment of installing solar panels for residential homeowners, and then leases the solar back to the homeowner. Homeowners benefit by getting a cheaper electric bill with no upfront investment. Sunrun benefits by securing long-term (20-25 year) recurring cashflows and tax credits that it can sell to institutional investors.
Since Sunrun is financing the initial cost of installing the solar, the cost of its capital (debt + equity financing) is very important to the sustainability of its business model. Recently, Sunrun has been able to drastically reduce its cost of capital, which will likely lead to strong growth going forward. I discuss the reasons for this in greater detail next.
Reduction in cost of capital leads to faster growth
Since Sunrun needs cash to finance the equipment and labor to install solar for its customers, cheaper capital means that Sunrun can grow faster and more efficiently. During the Q2 Earnings Call, Executive Chairman and Co-founder Ed Fenster disclosed that the company’s cost of capital has declined at an accelerated rate in 2021:
“While our capital costs have been steadily falling since inception, in the last year we've seen an acceleration in these improvements, which have been most pronounced in our non-recourse subordinated debt costs. Today, this market is pricing 175 to 350 basis points below where we've placed comparable loans over the last several years.”
Sunrun is a capital-intensive business with substantial amounts of debt and upfront costs. The recent decline in Sunrun’s cost of capital will lower one of Sunrun’s largest expenses: interest. With less cash going to interest, more cash can be invested in growth. This also allows the company to offer better pricing to customers, further accelerating growth.
The way Sunrun has been able to lower its cost of capital is by selling its long-term recurring cashflow streams to income investors, such as pension funds and other institutional investors. Due to the high collection rates and multiple years of data that span two recessions (2008 and 2020), the market has started to warm up to Sunrun’s financial products (its long-term solar leases) and is paying a premium for these cashflows.
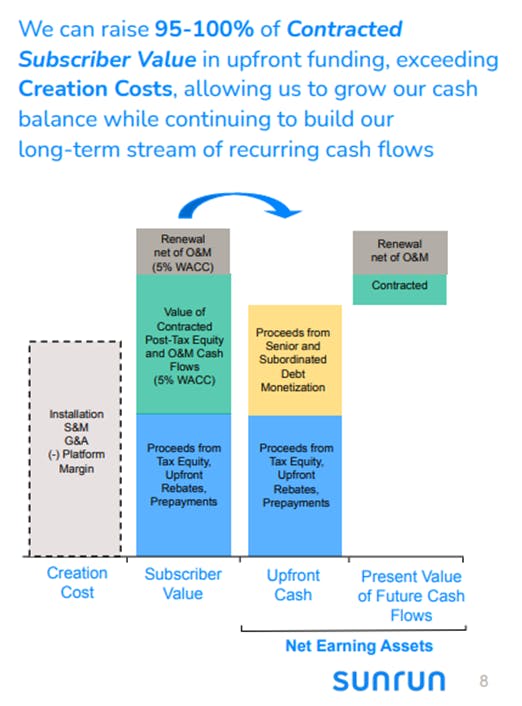
What is significant is that Sunrun now receives more cash from the sale of the long-term leases than it costs to install the leases. This means that Sunrun can finance solar installations for homeowners, and then turn around and sell the contracts for more than the “creation costs”, or the total costs to capture the customer and install the solar systems. This allows Sunrun to quickly realize returns in its solar investments, and to recycle the capital into new growth. This dynamic helps support an acceleration in growth going forward.
Sunrun illustrated this trend in the graphic below: the “Upfront Cash” bar, which is what Sunrun receives for selling its solar leases, is higher than the “Creation Cost” bar. This highlights how Sunrun can generate the necessary cash to fund its growth going forward by selling its solar leases at a higher cash value than its initial cash investment. Co-founder Fenster explained during the Q2 Earnings Call that this dynamic means that Sunrun no longer needs to issue equity financing, which will protect investors from dilution. I also believe that this helps support a premium multiple, as Sunrun should be able to self-sufficiently fund its growth going forward by selling its solar leases.
Source: Sunrun Q2 2021 Presentation
There are some caveats to this model. For example, leases that are “aged” for 5+ years generally receive a higher “Upfront Cash” value, so Sunrun needs to hold onto the leases for a few years before securitizing them. The financing deals are also complex and include tax equity financing, which is based on tax credits for solar installations. These tax credits are scheduled to be reduced in 2024, which I discuss in more detail further below in the risks section.
Sunrun’s financials are better than they seem
As mentioned above, Sunrun is a capital-intensive business, as it frontloads expenses but is paid for these services over multiple years. A quick glance at Sunrun’s income statement and cashflow statement shows a company deeply in the red, hemorrhaging cash. However, GAAP accounting does not properly showcase Sunrun’s business model, in my opinion. For example, the company must expense the majority of installation and marketing expenses upfront, but receives the cashflows over 20-25 years. This mismatch is expense and revenue recognition makes Sunrun’s earlier years appear unprofitable, but will make later years appear highly profitable.
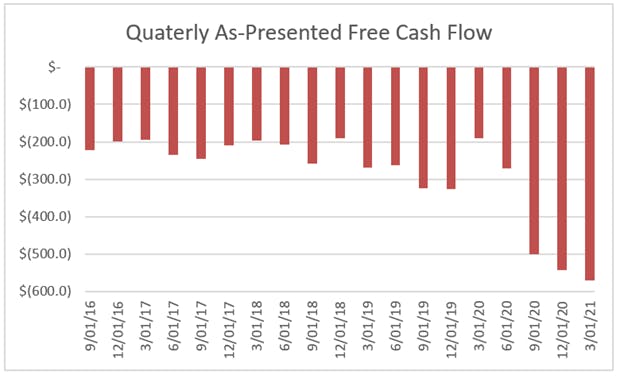
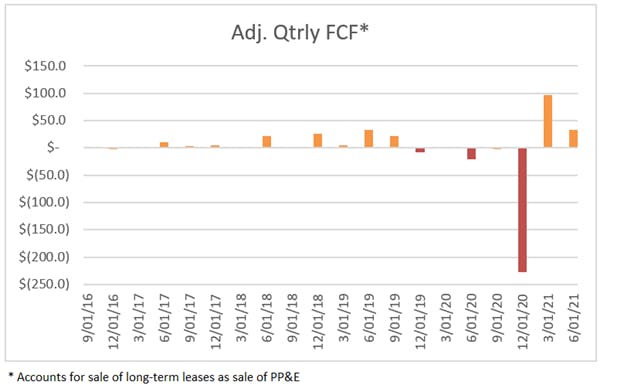
The company can also quickly monetize its solar leases by securitizing them (discussed above), but this is considered a financing activity and is not included in operating cashflows. This is a technicality of GAAP, and the argument can be made that the sale of the leases is similar to selling the solar equipment, which if that were the case, would drastically improve the presentation of Sunrun’s cash flows. As shown in the two charts below, Sunrun’s as-presented FCF is deeply negative as the firm finances the upfront costs of solar installations. In the second chart, if we account for the sale of the long-term solar leases (which are sold as mostly non-recourse debt) as sales of equipment, then Sunrun’s FCF looks more favorable. I believe that classifying the sale of the leases as “sale of equipment” more clearly demonstrates the sustainability of Sunrun’s business model, which is illustrated in Sunrun’s Adjusted Quarterly FCF chart below.
(Note: Q4 2020 Adj. Qtrly FCF was impacted by an acquisition completed during the year. If we include acquired cash of $537 million, then Q4 adj. Qtrly FCF would be an inflow of $309 million during the quarter)
Co-founder Ed Fenster stated during the Q2 Earnings Call that “under this financing strategy, over several quarters and especially next year, the cash flow generation of the business should be substantial.” The company has over $4.5 billion of net earning assets on its balance sheet, which represent the cash value Sunrun would receive today if it sold all of its leases. With $4.5 billion in available capital on its balance sheet, and lower costs of capital, Sunrun is becoming a more efficient company. We can see this in recent results, which have started to accelerate.
Recent results start to accelerate while funding costs continue to decline
Sunrun reports Q3 results on November 4th, so the following numbers are based on Q2 results. Notably, Q2 results accelerated from the prior quarter. For example, Q2 sales grew 20% QoQ, up from the 4% sequential growth in Q1. While Q2 sales typically accelerate relative to Q1 due to seasonal trends, this represented the fastest Q2 sequential growth rate in the last four years. Moreover, Q2 orders increased 25% QoQ, which outpaced the 10% QoQ increase in installations, signaling that demand has outpaced installations. The outsized growth in orders also supports a continued acceleration in sales going forward. Pro-forma customer count also accelerated, and grew 19% YoY in Q2 to 600,000 customers, an acceleration from the 18% YoY growth in Q1. The acceleration in Sunrun’s business led management to increase their 2021 sales outlook to 30% YoY growth (up from 25%-30%).
Sunrun reported that capital costs have come down even more since the close of Q2 which is a harbinger that growth will likely continue to accelerate. For instance, on 10/11/21, Sunrun announced its non-recourse lending facility increased by $1 billion (to $1.8 billion) while interest costs also fell by 50 bps. The non-recourse lending facility is used as a bridge to finance solar installations and are paid off once the solar leases are aged and can be securitized. The large increase in the lending facility coupled with the lower interest rates highlights how the bond market believes that Sunrun’s business model is sustainable. The increase in cheap capital should also drive strong growth going forward.
Sunrun also announced that its most recent securitization deal was at the lowest cost of capital and highest advance rates in the company’s history. What this means is that Sunrun’s growth is becoming cheaper and more efficient. Sunrun’s Co-founder Ed Fenster added that “these financings highlight that Sunrun can not only fund growth but also generate cash, despite incurring billions in capital expenditures and operating cost.” Looking forward, Sunrun’s cheap capital and unique financing model positions the company well to grow rapidly with the solar market.
Trends driving the adoption of solar
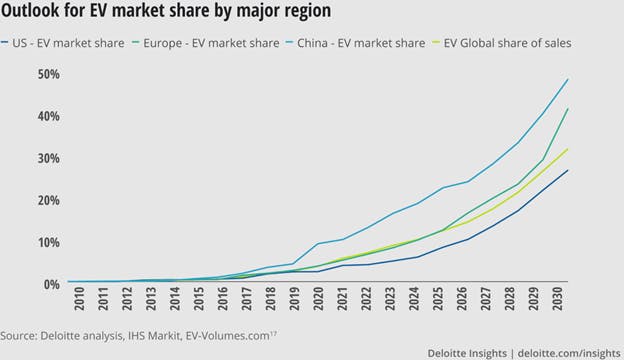
Climate change, the adoption of EVs and cheaper electric bills are all tailwinds that will drive the adoption of solar going forward. Recent surveys have shown that owners of electric vehicles are often adopters of solar. With the expected ramp in EVs going forward, solar adoption will likely follow. Sunrun’s CEO Lynn Jurich explained during the Q2 Earnings Call that around 40% of EV owners have adopted or are installing solar now. Deloitte forecasts that EVs will gain significant market share in the future, which will likely be a tailwind to solar adoption going forward
There are also tax incentives for adopting solar. For instance, the federal government currently offers an investment tax credit (ITC) for the installation of solar power facilities. Since Sunrun is the owner of the solar systems it installs, the company can claim these ITC benefits and receive a cash grant for them from the U.S. Treasury, or they can sell the ITCs to investors. The federal government also offers a personal income tax credit for solar installed by residential taxpayers who purchase the solar system outright as opposed to leasing them. These tax credits have supported demand for solar, and were recently extended by two years.
Another key benefit driving the adoption of solar is net metering, which allows solar powered homes to sell their excess power back to the grid, which lowers their electric bill. Sunrun states that upon solar installation, homeowners often realize a 10% reduction in their electric bills, which can be realized with no upfront costs. However, utilities are fighting to remove net metering, which I discuss in more detail next.
Risks and valuation
Sunrun’s main competitors are utility companies and utilities are fighting to change net metering policies. Sunrun disclosed in its 10K that it relies on net metering policies to offer competitive pricing, and changes to these policies may reduce demand for its solar offerings. Net metering is available in 39 states, but changes are on the horizon. Louisiana recently gutted its net metering policies, which is expected to lower the amount of savings homeowners will realize from adopting solar. California is also expected to change its net metering program in 2022, which is significant as 40% of all of Sunrun’s solar installations have been in California. While these risks are outside the control of management, there are some offsets that should dampen the impact from changes in net metering policies.
For instance, management disclosed that battery installations have dramatically increased in regions with unfavorable net metering policies. CEO Jurich explained on the Q2 call that battery adoption in the Bay area is almost 100%, and “some of the changes in California, around rates and [net metering] will be even more encouragement for batteries”. Sunrun reported that battery installations increased over 100% in Q2 to a record high. CEO Jurich added that Sunrun can “network these batteries together to form virtual power plants, providing incremental recurring revenue and offering an enhanced customer value proposition. This further differentiates Sunrun from companies that lack the scale, network density and technical capabilities to serve this market.”
Furthermore, California passed a bill that went into effect in 2020 that requires all new residential builds (three stories or less) to have solar installed. There is also a bill that is expected to be implemented in California that would require commercial buildings to install solar. These new mandates may help offset any demand loss from potential changes in net metering policies in 2022
Another key risk to Sunrun’s business model is changes to tax incentives. The US government currently offers favorable tax benefits, which were recently extended for another two years. The expected phase out of tax benefits may reduce demand for solar, which would be a headwind to growth for Sunrun. However, there are stipulations in the tax codes that allow the tax benefits to be accrued throughout 2026, which should provide enough time for Sunrun to continue to scale its business. Furthermore, efficiencies are driving down the costs of solar and batteries, which should help offset the need for government incentives in the future. While it is impossible to predict if incentives will be extended further, the global drive to reduce greenhouse gas emissions should motivate governments to incentivize solar going forward.
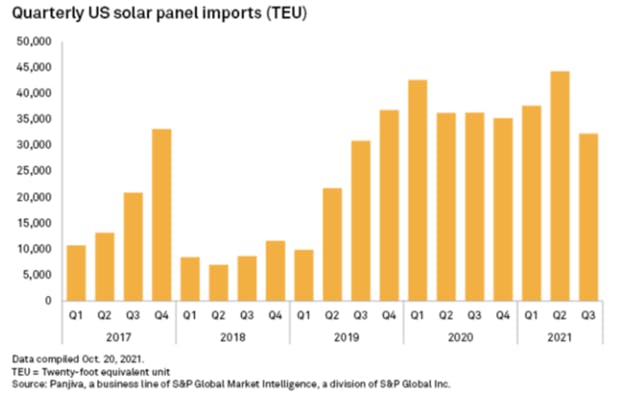
Lastly, supply chain issues present a risk in the near term to Sunrun’s ability to accelerate sales. Data gathered from S&P Global found that US solar panel imports fell in Q3 2021, possibly due to supply chain bottlenecks. This issue could lead to an increase in prices in the near term, which may cause a near term headwind to demand.
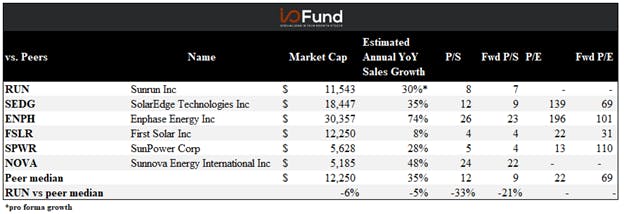
While there are many risks, Sunrun should be able to overcome them going forward. Looking at its valuation, Sunrun trades at an 8x P/S multiple, which is above its three and five -year median of 3x and 2x, respectively. The higher multiple relative to historical valuations is likely a reflection of the company’s improving financials, as the firm is now able to generate excess cash by securitizing its solar leases. Looking forward, Sunrun trades at a 6x fwd P/S multiple, which is slightly below the peer median of 7x. Sunrun appears reasonably valued relative to other solar-related peers.
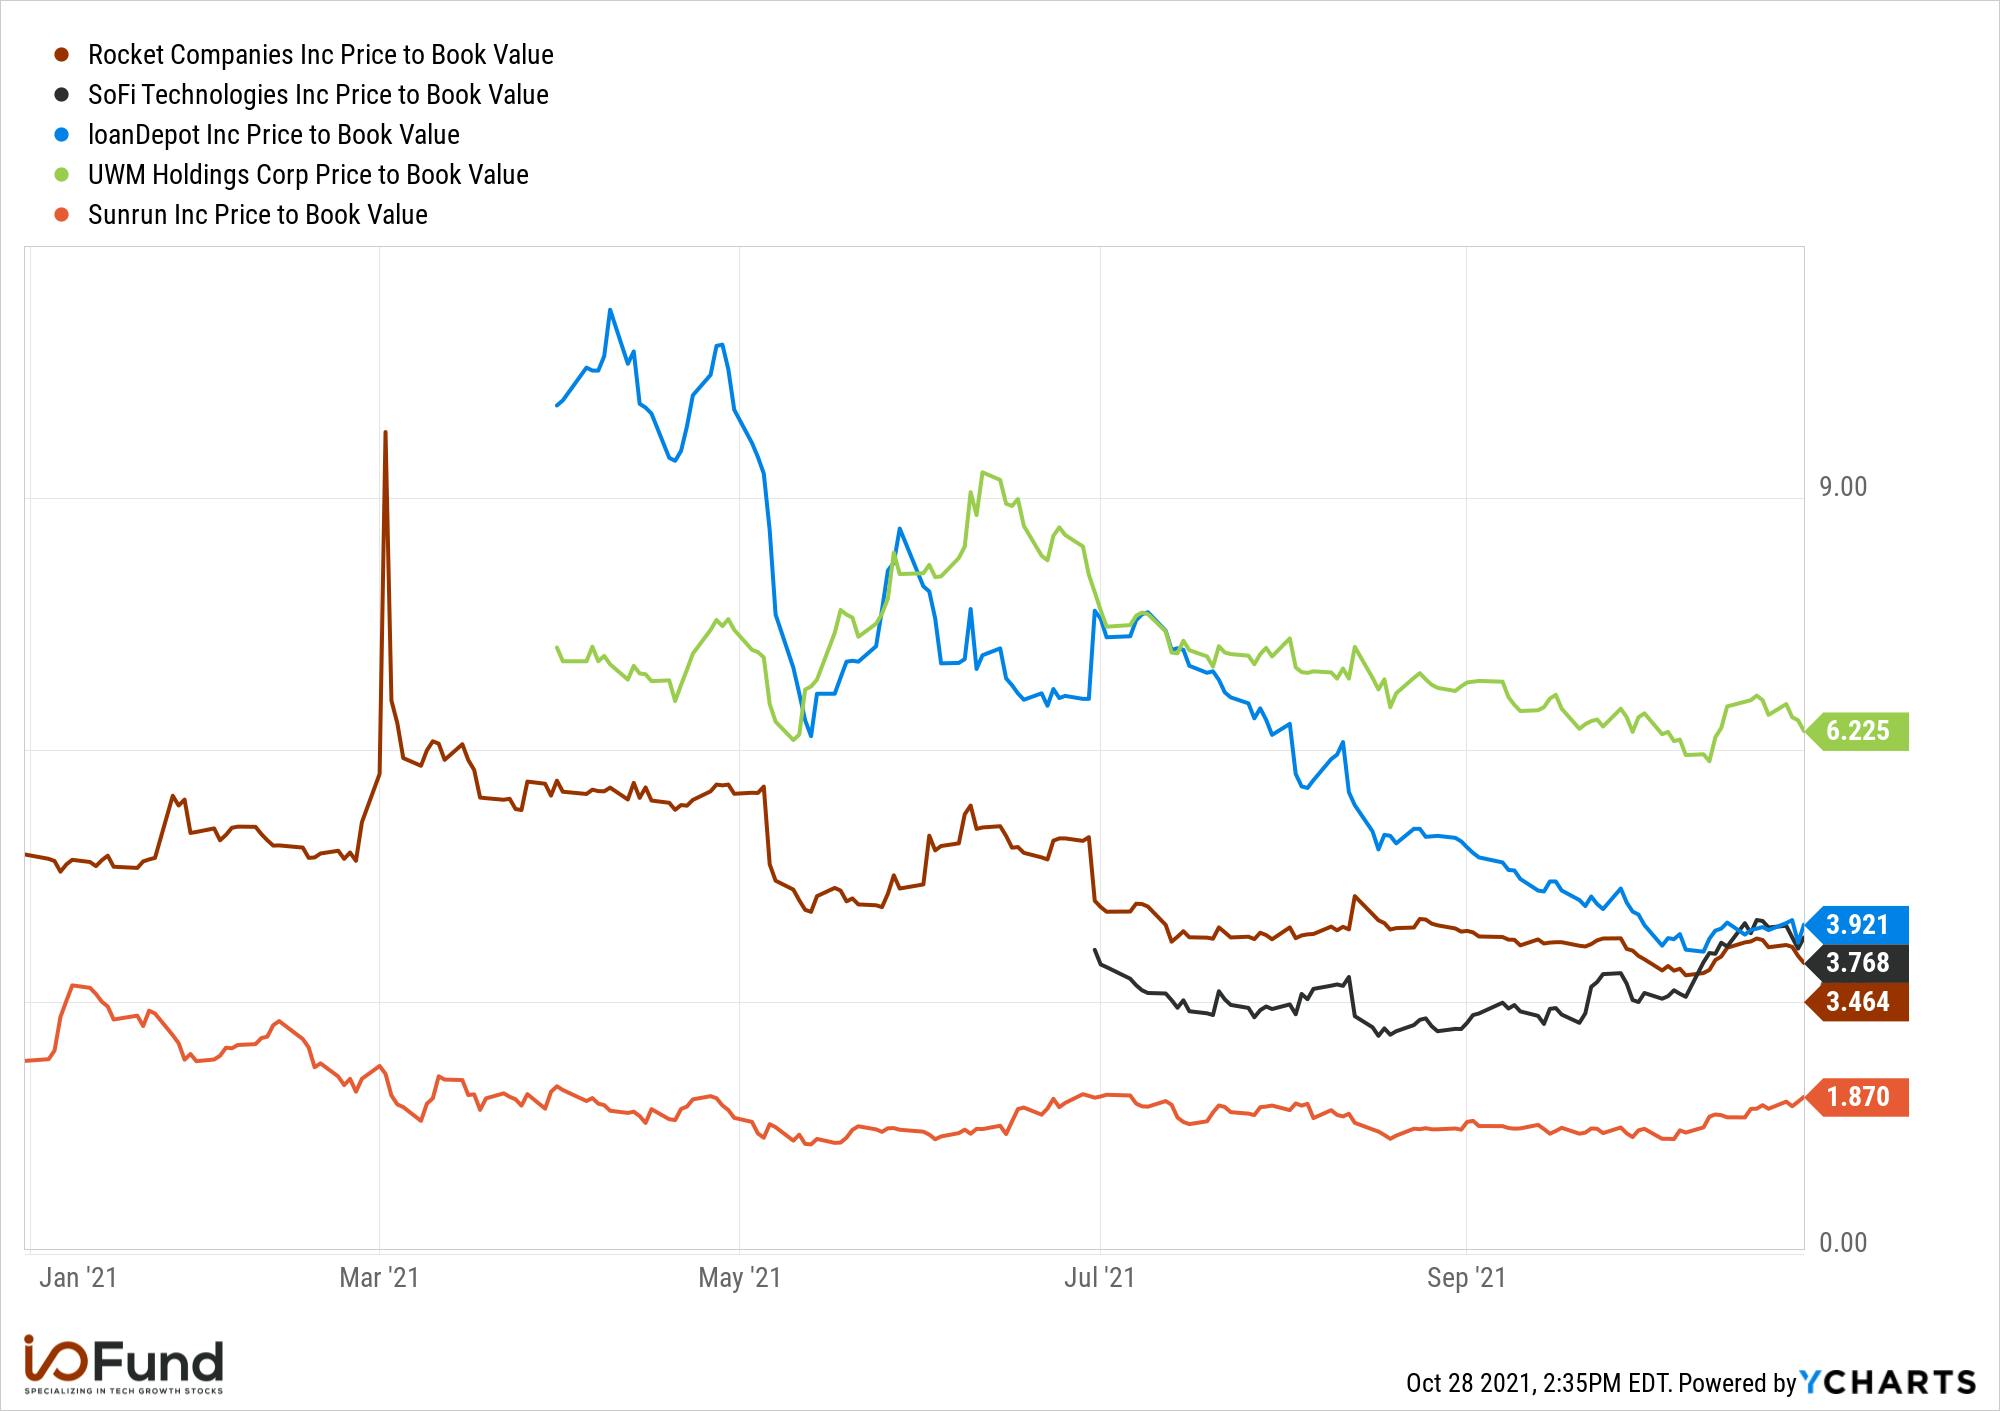
Another way to value Sunrun is to look at the company’s net earnings assets, which represent the present-value of future cashflows of its leases (less cost and debt) and is similar to book value. Since Sunrun is in the business of originating long-term loans and securitizing them, this is similar to wholesale mortgage lenders, which are commonly valued at Price to Book value multiples. Below are Price to BV multiples for some mortgage originators along with Sunrun, a solar lease originator. Mortgage originators have Fannie Mae backstopping their loans with implicit guarantees, which likely awards them higher multiples. Nonetheless, the business models of these companies are somewhat similar to Sunrun’s, however Sunrun trades at a substantial discount.
In conclusion, Sunrun pioneered a unique business model that allows residential homeowners to capture the benefits of solar without the large upfront investment. Sunrun has been able to securitize the long-term leases it signs with homeowners and is now in a position where it is receiving more upfront cash from the sale of these leases then it costs to capture the customer and install the equipment, making Sunrun self-efficient and no longer reliant on dilutive equity financing.
The company’s cost of capital, the main barrier to growth, has rapidly improved in 2021, and the improvement has continued into Q4. This improvement makes Sunrun more efficient and allows the company to accelerate growth going forward. While we have seen an acceleration in growth in Q2, the decrease in the company’s cost of capital and tailwinds from the adoption of solar should support strong growth going forward. While there are risks, such as changes to net metering policies and tax codes, there are offsets to these risks that should benefit the company going forward. The company also appears reasonably valued relative to peers.
Disclosure: Bradley Cipriano and the I/O Fund may own shares in Sunrun and may change their respective positions within the next 72 hours. You can access the I/O Fund’s positions herehere. The above article expresses the opinions of the author, and the author did not receive compensation from any of the discussed companies
In the short video discussion below, I check in on Eventbrite, a ticketing platform for events that took a hit due to restrictions put into place in response to the Covid-19 pandemic. While the company is still recovering, there are signs that Eventbrite will exit the Covid pandemic a more streamlined company with higher margins. For instance, gross margins increased to all-time highs in Q3 despite ticket volumes still below their pre-Covid levels.
Sign up for I/O Fund's free newsletter with gains of up to 1100% -Click hereSign up for I/O Fund's free newsletter with gains of up to 1100% -Click hereClick here
Looking forward, Eventbrite has released new products that leverage its first-party data to drive increased demand for creators on its platform. The company discussed that the majority of the tickets on its platform are free tickets, yet free event creators are still incentivized to have larger audiences. Eventbrite plans to leverage its first party data to drive demand to both paid and free events, which should further increase sales and margins going forward. Watch the short video below to find out more!
In the short video discussion below, I discuss Enphase's strong Q3 results which beat sales estimates and guidance also came in above consensus. The company released a new chip, the IQ8, which should drive strong demand for Enphase's products going forward. Furthermore, Enphase has also ramped up purchasing of raw materials, which supports management's statements that they anticipate elevated demand going forward. The raw material purchases signal that the company will soon ramp production of its new products, leading to higher sales going forward.
Sign up for I/O Fund's free newsletter with gains of up to 1100% -Click hereSign up for I/O Fund's free newsletter with gains of up to 1100% -Click hereClick here
Looking forward, Enphase has amble room for growth as its new technology will drive demand for the next few quarters. Management expects the IQ8 ramp to take about four to six quarters, which provides support for sales growth well into 2023. On top of the strong growth going forward, Enphase is also highly profitable and cash flows are positive and growing fast. Enphase's strong growth, profits and cashflows position the company well to continue to take share in the growing solar industry. Watch the short video below to find out more!
The market certainly has a way of instilling humility. As the I/O Fund was logging on to the Performance Webinar to present industry-leading returns (and to declare that a Retail Fund was kicking Wall Street butt!), we were simultaneously experiencing our largest AH drop following an earnings report on Snap.
We already had slides prepared to discuss what losses mean for portfolio returns. The first point we had planned to discuss is that all portfolios with sizable returns have losses. Part of our service is to show you that we hold through losses OR we cut them if the story isn’t playing out as we had predicted. We are not only a site that celebrates the wins, but we also show you how we handle our losses.
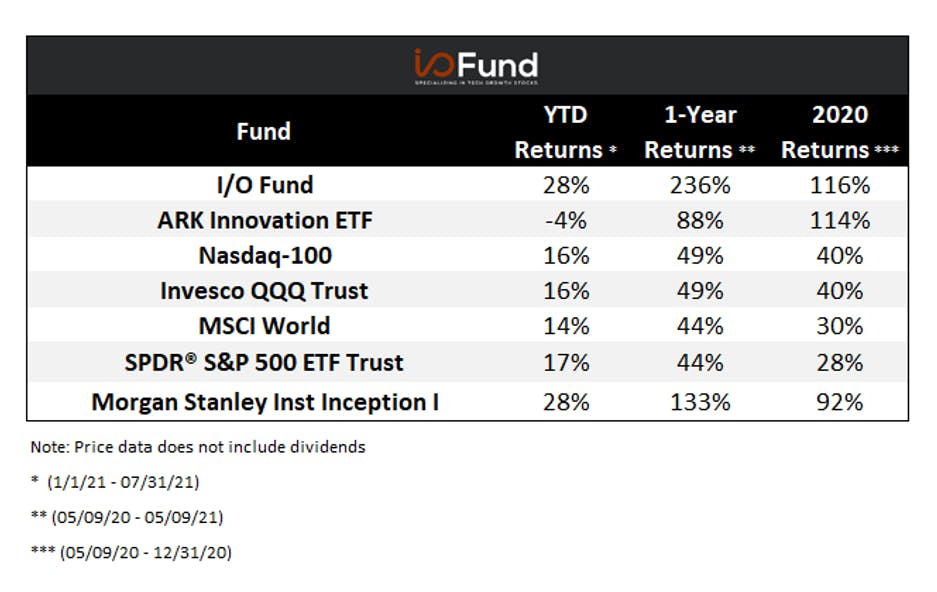
When we compare our results to institutions who also specialize in tech, we see that the I/O Fund is able to hang with Ark Innovation in the good years and then handily beat Ark Innovation in the drawdowns (at least so far). We have healthy respect for Ark and we certainly admire the bold move ARKK made in highly-shorted Tesla. Morgan Stanley’s Inception Fund has better returns than Ark this year due to their bold move going into Gamestop. This leading fund is now neck-and-neck with I/O Fund.
The I/O Fund’s bold move was placing blockchain assets, such as Bitcoin, Chainlink and Ethereum, into a stock portfolio with a leading allocation (approx. 10%/5%/5%) and then weathering the extreme volatility by adding near bottoms and trimming near tops. We began the process of taking gains in crypto from February through early May. We then began to buy again in the $42,000 – $31,000 region. Blockchain has always had a place in our long-term buy and hold portfolio and we didn’t budge on this even with large drawdowns of 40-50% whether it was 2019, 2020 or 2021.
The semis have held up our portfolio well compared to other high-growth portfolios. Datadog and Asana were also impressive choices. We still have some high fliers that we are hoping end the year strong. These were mentioned in the LTBH Top 10, such as Xpeng, Fubo and Magnite. If two out of three rally, we will be doing well. Our momentum portfolio is finding its wings again with nice gains in Affirm and also AEHR. These last two came in Q3 and are not reflected in the performance below.
We think this proves our fluency with tech and our ability to broadly form a winning portfolio. The issue with most tech ETFs is they are sector-specific whereas blending many tech trends into one portfolio is more advanced and can offer higher returns.
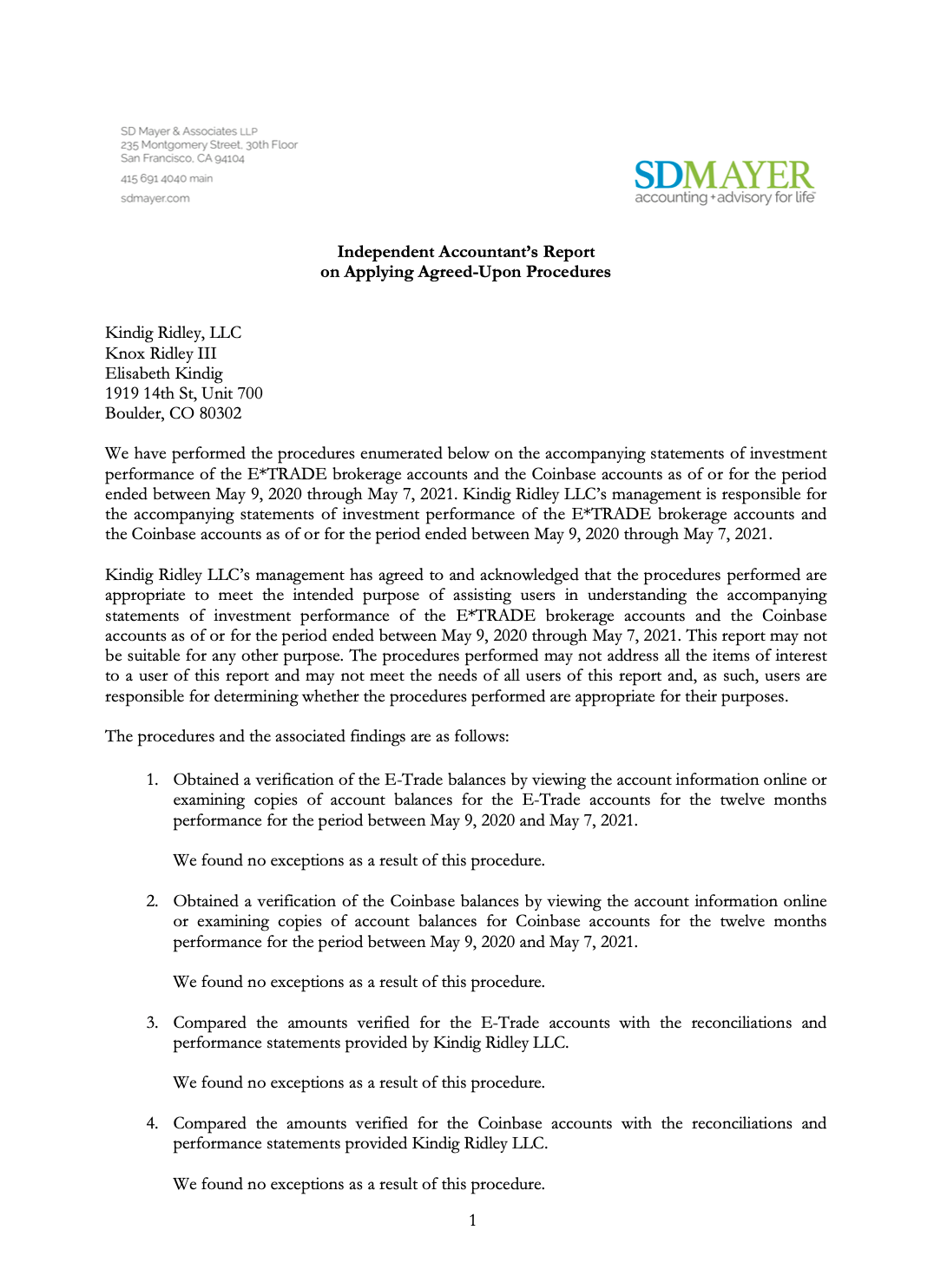
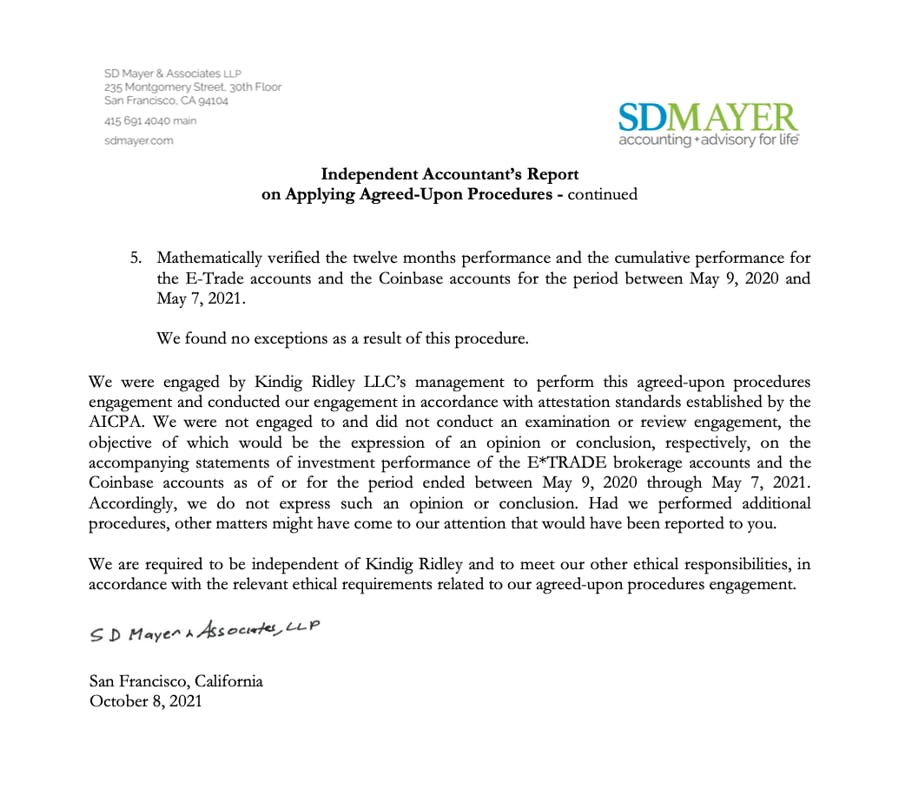
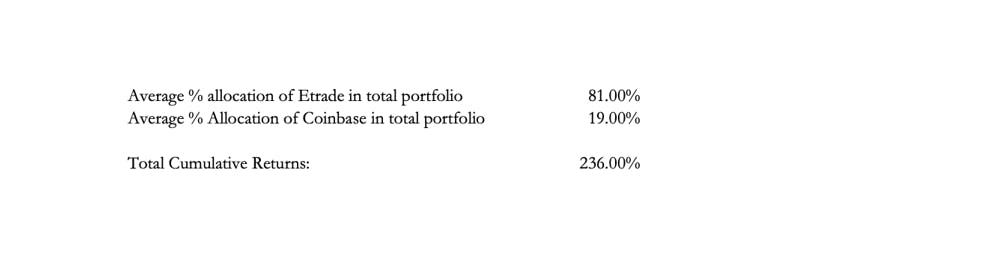
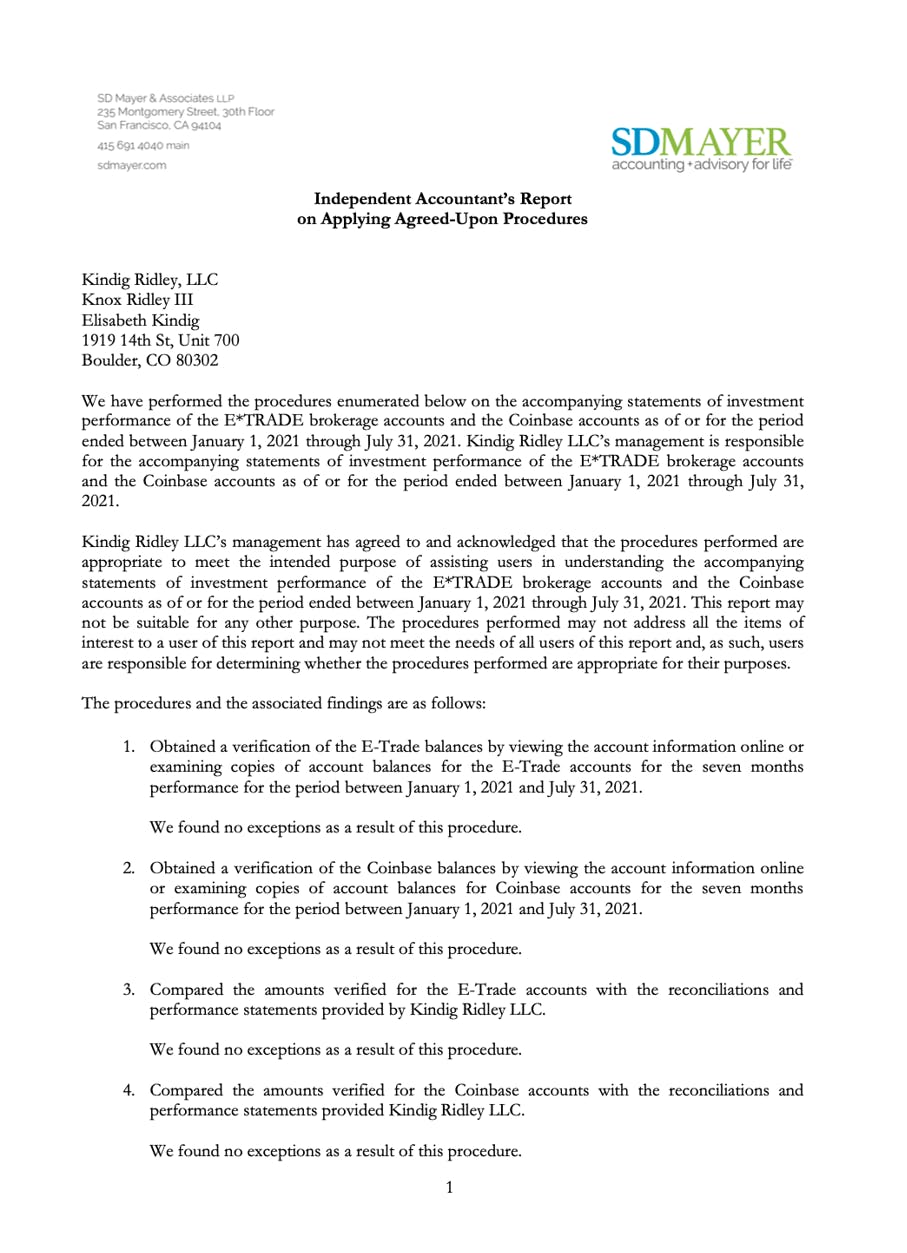
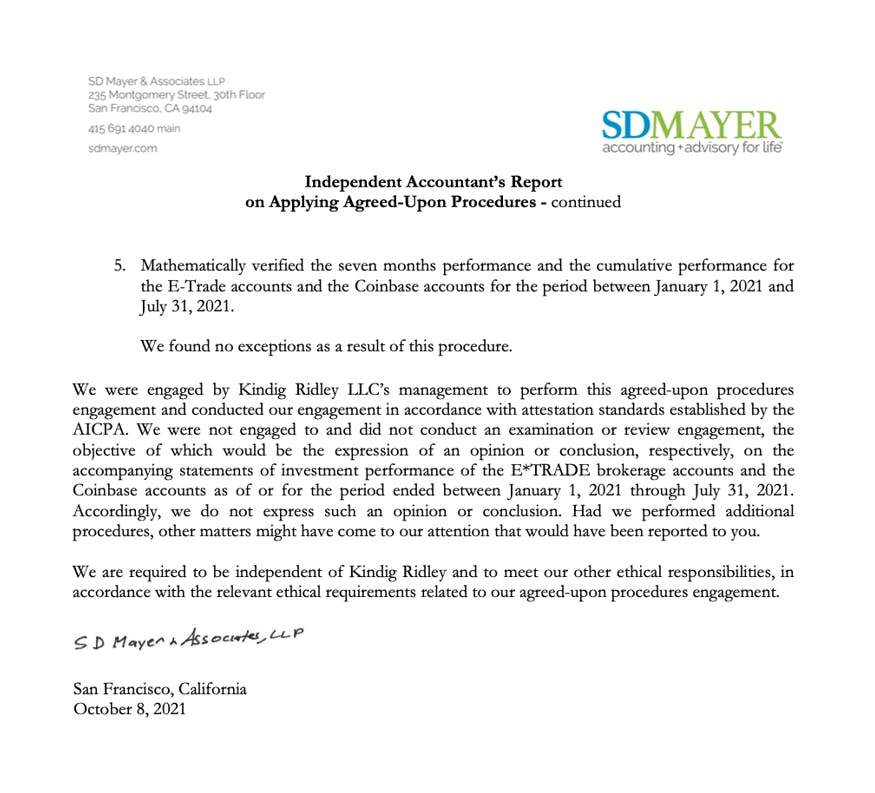
Our 1-year returns from May 9th through May 9th were 236%. Please note in the letter below, the accountant preferred to stop the 1-year performance at Friday May 7th, which designates the weekend when the market is closed. It doesn’t make sense to count gains in crypto which is open May 8 and May 9th 2021 but not count stocks. Therefore, performance for our portfolio ended on Friday May 7th since May 9th was a Sunday.
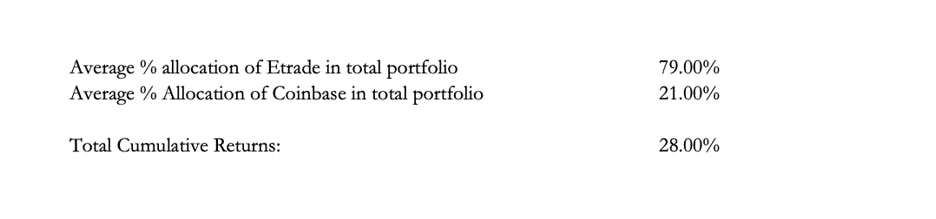
We also did a YTD from January 1st, 2021 through July 31st, 2021 to help provide some color as to how we are performing in a more challenging year for tech stocks. We are hanging with Morgan Stanley right now for top tech fund.
Please note, although we are sharing our performance with you as a courtesy, we own the report and we do not give consent for you to share this publicly. Although we will discuss our final number from time to time, the terms in which we do this are determined by our agreement with the accountant. It’s against trademark and other laws to advertise another firm’s name, such as an accounting firm.
We also don’t share the dollar value in our portfolio, so this has been omitted from the report. However, the performance numbers we show below are a direct screenshot of the report.
For comparison purposes, we do not calculate Total Returns on our account. Rather, this is a performance audit. Total Returns on Ark Innovation may slightly differ due to dividends or management fees being factored in. In the table below, we show you an apples-to-apples on our performance relative to other Funds with no additional income factored in.
The performance reviews take two to three months to complete. Therefore, we are showing you YTD through July 31st and our year-end performance for 2021 will likely come out in March, etcetera.
1-Year Performance:
YTD Performance:
How the I/O Fund Compares:
For comparison purposes, we do not calculate Total Returns on our account. As stated, Total Returns on Ark Innovation may slightly differ due to dividends or management fees being factored in. In the table below, we show you an apples-to-apples on our performance relative to other Funds with no additional income factored in other than stock performance.
“No great thing is accomplished alone.”
We want to stop and thank our Members for believing in a small team of Retailers. When we launched our retail fund, we were admittedly quite nervous as we are all trained to believe that “smart money” knows more than Retail. However, we wanted to set out and test this by forming a small team of experts who care very much about their chosen specialty. As my intro stated, the market knows how to keep you humble, and thus, we will continually strive to improve.
What’s Next for our Website:
We are going to split off Knox’s service to help separate fundamentals from technicals. There will be a Fundamentals chat room and a Technicals chat room on the forum. New prices will go into effect around the first of the year with anyone who subscribed 2019-2021 being locked in at the current rate. In addition to not mixing styles, the new price will also help cover costs for our real-time trade notifications.
We plan to launch a Beginners service to help make investing accessible to more people at a low price (5 stocks for a flat fee, something like that).
We launched YO/LO Fund. Please make sure to read through our Blockchain is Going to Eat the Internet report and we encourage you to keep an open mind as we find a few winners in this space.
We plan to release community moderation where 10 downvotes will cause a post to disappear so hang in there with moderation issues as this will roll out before the end of the year.
We think Q4 will be strong and are positioned accordingly. This could change as the market changes frequently. We will let you know if that’s the case.