Tech earnings season is long and extends over six weeks. We are finally nearing the end of Q3 earnings season as the last round of cloud companies are expected to report in early December. The I/O Fund had previously highlighted Six Cloud Stocks to Watch During Q3 Earnings, all of which have since reported Q3 results.
One of the notable performers we highlighted was Bill.com, which reported an 11% topline beat during the quarter. I/O Fund analyst Bradley Cipriano discussed the company’s strong Q3 results in a short video presentation here.
In the analysis that follows, we provide an update on the cloud category and review cloud stocks that have yet to report Q3 earnings. We also discuss key metrics that investors should be aware of heading into the final weeks of Q3 earnings season.
Cloud Stocks: Top 10 EV/FWD Revenue Multiples
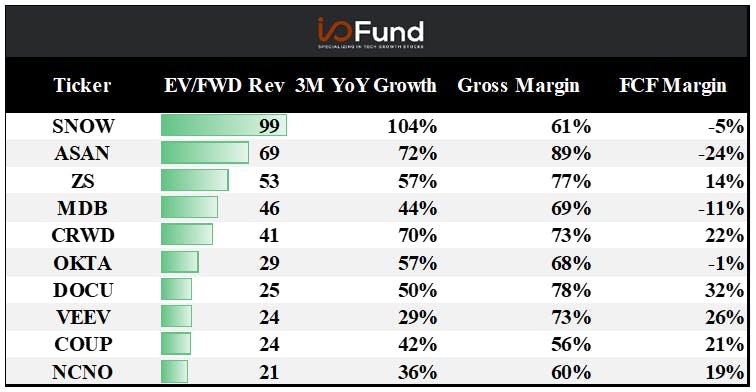
Below is a table of cloud stocks that have yet to report Q3 results, ranked by their EV/FWD sales multiples. Snowflake has the richest multiple out of the 26 remaining cloud stocks set to report in the next few weeks. As we mentioned in our initial Q3 Cloud Earnings Overview, Snowflake is benefitting from increasing rates of data consumption, a trend that will likely continue into the future.
Somewhat cheaper than Snowflake but still sporting a premium multiple are Asana, Zscaler, and MongoDB. Asana most recently grew 72% YoY, an acceleration from the 61% and 57% YoY growth rate in Q2 and Q1, respectively. Zscaler sales grew over 55% for three consecutive quarters and sales are expected to grow 50% in the upcoming quarter. MongoDB has reported an acceleration in sales for three consecutive quarters, and the most recent 44% YoY growth was the fastest pace of growth since Q1 2020. These strong growth trends help illustrate why these firms have premium valuations.
Cloud Stocks: Top 10 Three-Month Forward YoY Growth Rates
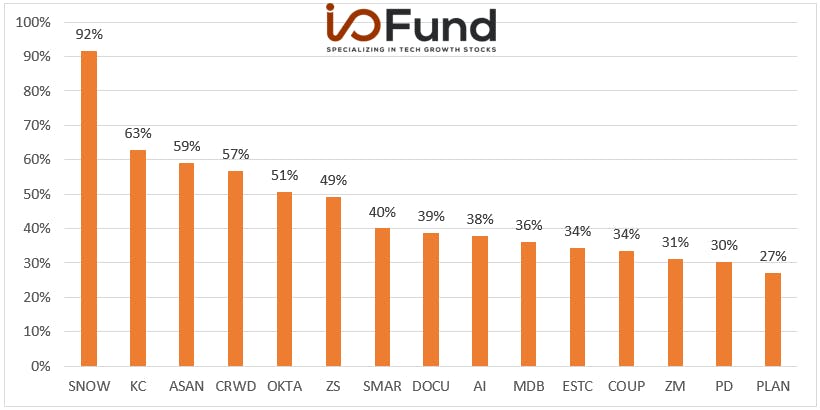
Below is a chart of forward sales growth expectations.
Out of the remaining cloud stocks that must report Q3 earnings, Snowflake and Kingsoft are expected to grow the fastest. Snowflake is expected to grow sales 92% YoY as the company continues to benefit from rising rates of data consumption.
Chinese cloud infrastructure company, Kingsoft, is also expected to grow sales strongly in Q3 as they quickly scale their operations.
Sign up for I/O Fund's free newsletter with gains of up to 1100% – Click hereSign up for I/O Fund's free newsletter with gains of up to 1100% – Click hereClick here
Other noteworthy mentions are CrowdStrike, Okta, and Zscaler, all of which have exposure to cyber security, a sector that has seen outsized growth recently. These three cyber security firms are expected to grow sales ~50% YoY heading into Q3 earnings, highlighting the overall strength in the cyber security market.
Top 10 Weekly Share Price Movements
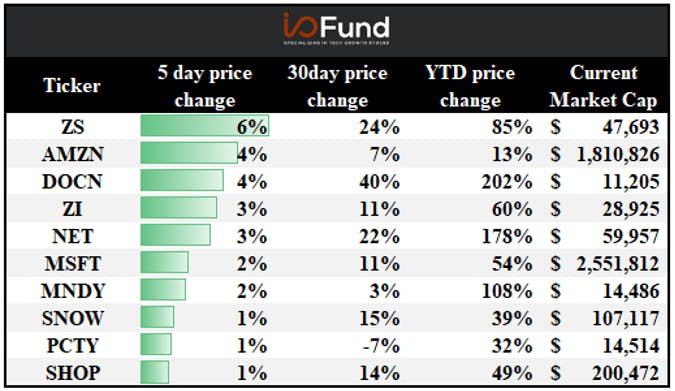
Below is a table of the weekly change in share price for our universe of cloud stocks (week ended 11/19). Zscaler is a notable stand out and increased 6% during the week. It is up 85% YTD. Out of the 26 cloud stocks that have yet to report Q3 earnings, Zscaler and Snowflake were the only stocks that advanced last week.
Top 10 Changes in Sales Growth Estimates – Last 90 Days
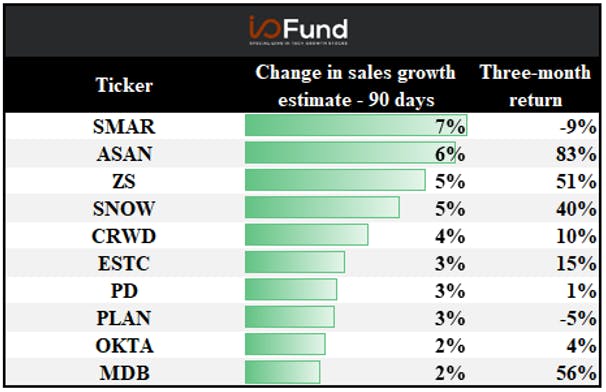
The table below ranks cloud companies that have yet to report Q3 earnings by their topline revisions over the last 90 days. An increase in topline revisions signals that the Street believes that the company will grow faster than initially believed.
Smartsheet (SMAR) has had the largest topline revision, as the company recently increased their Q3 sales guidance from 40% YoY growth to 46% YoY growth, citing a robust demand environment for its platform.
Zscaler also had its topline revisions increase 5% over the last 90 days, above other cyber security players such as CrowdStrike and Okta. This increase in expectations signals that Zscaler is likely expected to outperform its peers in the near term.
Update on Top 5 EV/Fwd Revenue Multiples:
Overall stats:
Overall Cloud forward median: 15x
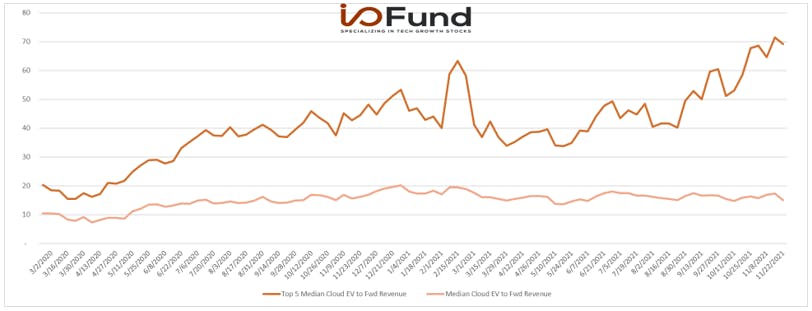
Top 5 Cloud forward median: 69x
Overall Cloud forward average: 22x
OVERVIEW OF EV/FWD SALES:
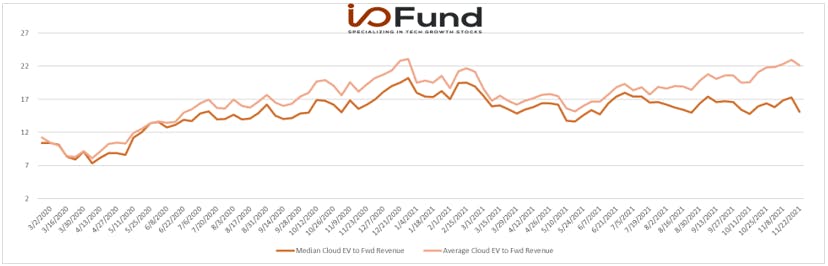
As shown below, the median and average cloud EV/Fwd revenue multiple has trended up throughout the year. Around June, the average multiple had started to increase faster than the median, and this bifurcation accelerated during Q3 earnings.
The average is being driven higher by premium valued cloud stocks (shown above). Since cloud has increasingly proven to be a sector where the leader ‘wins most’, this bifurcating trend may very well continue into the future.
TOP 5 HIGH-RANKING EV/FWD SALES:
In the chart below, we can more clearly see the large dispersion in cloud valuations, as the top 5 premium valued cloud stocks have had their EV/Fwd sales multiples rapidly expand through Q3 earnings. Investors likely continue to believe that cloud is a “winner gets most” market, where the market leader captures the majority of the addressable market. This dynamic helps explain why the top 5 valued cloud stocks have grown their multiples much faster than the median.
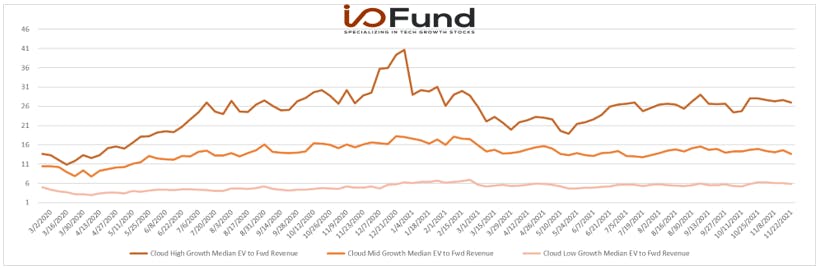
EV TO FWD SALES – Growth Buckets:
We can further dissect the changes in cloud valuations by breaking up the group into high growth (>30% growth), mid growth (>15% and <30%), and low growth (<15%). The below chart shows that higher growth cloud stocks receive a higher multiple from the Street. Furthermore, high growth stocks used to be valued more richly back in Q4 2020 but have since seen their valuations normalize to a lower multiple. If Q3 cloud earnings come in strong, then the market may push valuations back up to their historic highs.
WHO DELIVERS SUPERIOR EV TO FWD SALES?
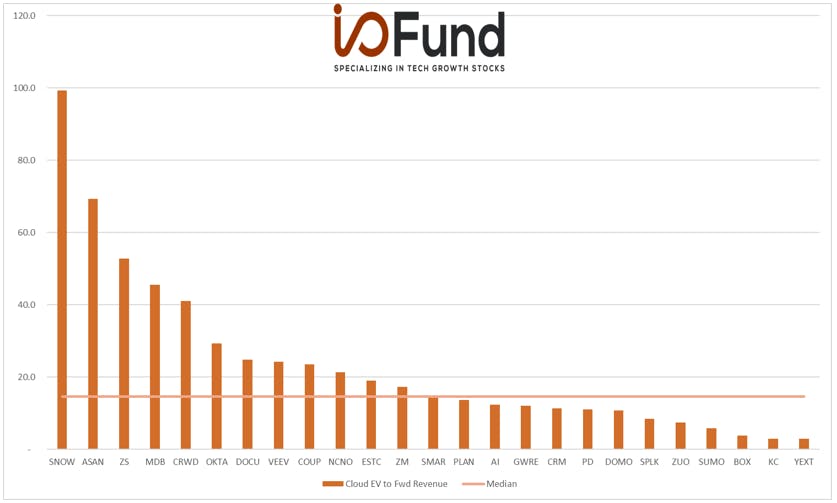
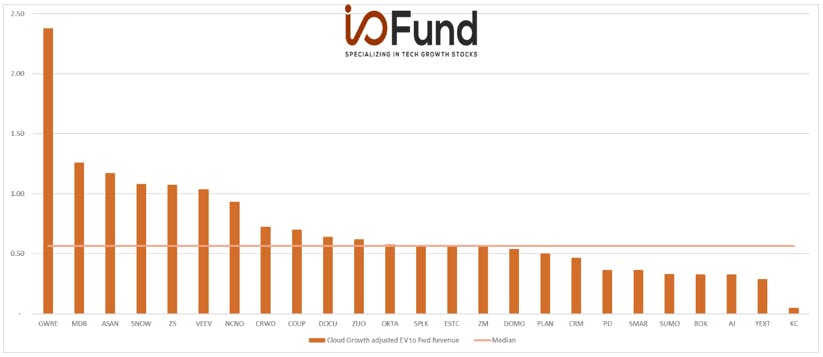
The below chart provides a more holistic view of the remaining cloud stocks that have yet to report Q3 results, sorted by their EV to Fwd revenue multiples.
As highlighted in the above tables, Snowflake (SNOW) has the highest valuation of the group and its multiple is more than 600% higher than the cloud median of 15x.
The last chart (below) is based on EV to FWD sales but also takes into account forward growth expectations.
By scaling valuation relative to forward growth, we can more clearly see which companies are cheapest, based on their expected growth rate. A low value in the chart below means that a company is cheap relative to growth.
For example, Snowflake can be considered cheaper than Asana once we consider its strong growth rate expected next quarter.
Kingsoft (KC) is evaluated as the cheapest; given its robust growth rate and low valuation, the company has very low margins, which warrants a cheaper valuation.
CLOUD OUTLOOK
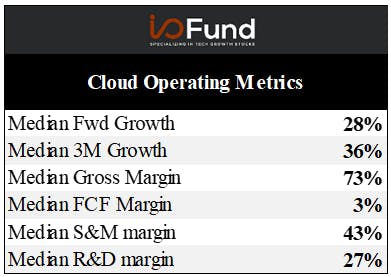
Finally, the last table we will be discussing includes aggregate cloud operating metrics.
The below table shows that cloud is performing strongly as the median forward growth rate is above 20%, while gross margins are high at over 70%. The median cloud company is also FCF positive with a 3% FCF margin.
Strong growth and positive cashflows signal that the cloud category is healthy and performing well. I/O Fund expects this strength to progress going forward.
I/O Fund is comprised of a team of analysts who share their research publicly as they build a portfolio of 30 stocks. Our team has record results for a retail Fund and we also have four-digit gains on some of our free newsletter coverage. You can learn more about our premium service by clicking here or sign up for our free newsletter here. clicking here or sign up for our free newsletter here.
Disclaimer: This is not financial advice. Please consult with your financial advisor in regards to any stocks you buy.
Datadog is a company that quietly appears every three months with earnings results that say: “Remember me?” We are looking to increase allocation to this LTBH position as this is a rare leader in the migration to the cloud and the observability that is required across increasingly complex architectures. If you want a simple thesis that you can share with your friends and family, it’s this: Datadog lets us directly participate in the growth of AWS, Azure and Google Cloud through a pureplay that cross-sells better than almost any other cloud company.
Product Overview:
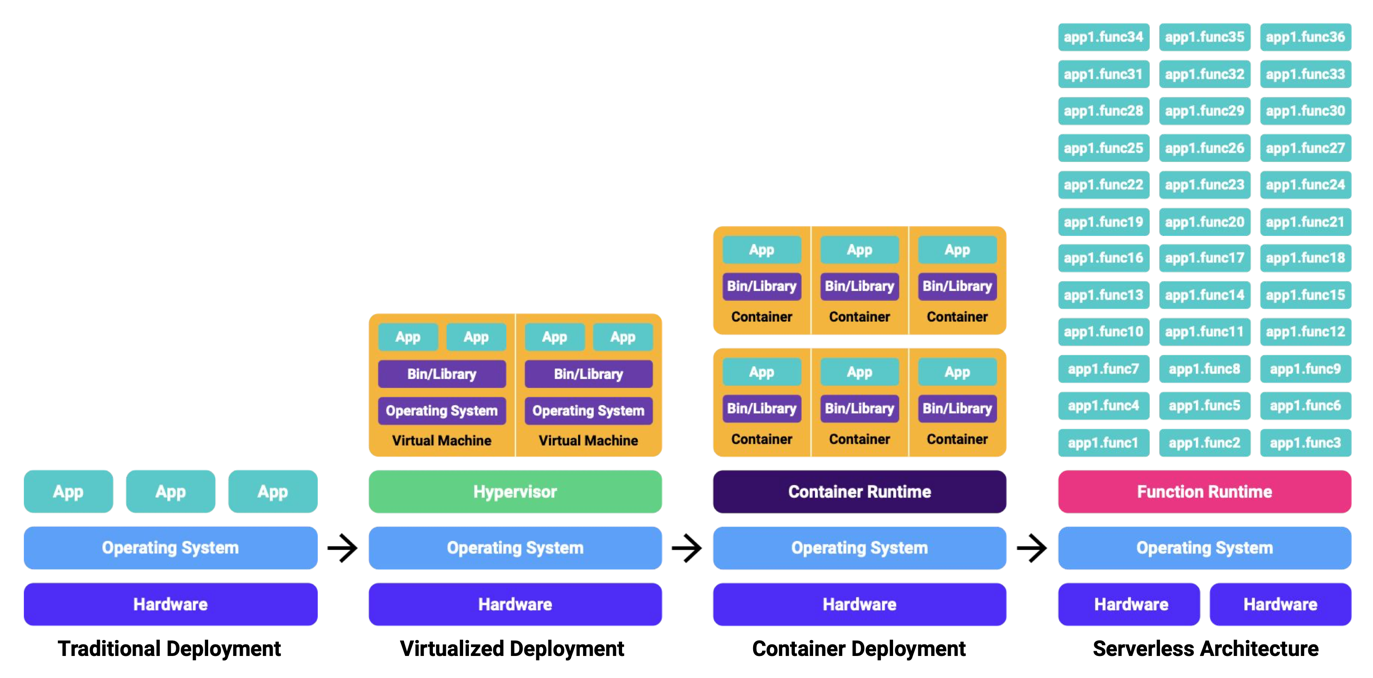
Datadog’s management team was very early to address the issue of silos in a cloud-native environment. As systems moved from on-premise to the public cloud to include virtualized machines and containers, the number of applications to monitor grew. Virtualized machines create more data from many more applications. The next iteration of the cloud, which was containers, exponentially grew the number of applications. Now that there are serverless architectures where every function needs to be tracked individually – which means the complexity has grown yet again.
Here's a picture of what I mean:
Datadog is a company that solves the complexity associated with the cloud as the products are able to observe and monitor any environment no matter how large the tech stack scales.
The second thing to understand about Datadog is that it’s not only cloud native but it also works well in a multi-cloud environment. This means Datadog is downstream from Azure, AWS and Google Cloud – no matter who a customer goes with and at what percentages for the deployment. The fact that companies prefer to work with more than one cloud vendor is actually a driving force for Datadog as it’s observability and security products can scale across any deployment a customer chooses and is flexible if the customer makes changes down the line.
The trend of multi-cloud and hybrid cloud is only going to accelerate from here which we covered in detail in our Big Data and Analytics analysis. It’s worth a read if you haven’t read it yet.
The company uses the word “standardization” to describe how the multi-cloud trend is a main driver for Datadog. We covered this in our last analysis but it bears repeating here as to why multi-cloud and hybrid cloud are important drivers for Datadog and how standardization plays a key role.
Standardizing means interoperability between various cloud environments and integrated interfaces. This is especially important with multi-cloud or hybrid cloud where companies have more than one environment. This is becoming the new normal to prevent vendor lock-in. The word standardization/ standardize was mentioned 20 times on the Q2 Earnings Call, highlighting its importance to Datadog’s story going forward. If corporations continue to standardize on Datadog’s platform, then the company will continue to capture market share.
Since dealing with multiple cloud vendors quickly becomes cumbersome, there is a natural tendency to standardize in tech, especially with software. Moreover, cloud applications need to communicate, so having everything on one platform can make detecting and resolving issues less complex and costly. We believe that we are on the cusp of this standardization trend with cloud software vendors, with Datadog leading the way. We believe that Datadog is best positioned to benefit from both the rise in cloud usage and the standardization of cloud software.”Moreover, cloud applications need to communicate, so having everything on one platform can make detecting and resolving issues less complex and costly. We believe that we are on the cusp of this standardization trend with cloud software vendors, with Datadog leading the way. We believe that Datadog is best positioned to benefit from both the rise in cloud usage and the standardization of cloud software.”
Datadog eliminates the need to work with many different vendors and pulls the entire DevOpsSec stack into one platform. This not only breaks down silos in terms of the observability framework yet also breaks down silos within the company.
Infrastructure Monitoring
At the point that companies migrate to the cloud from on-premise servers, how they monitor their infrastructure fundamentally changes. On-premise servers have fixed IP addresses and there are static servers and virtualized machines. Once you move to the cloud, this changes as servers are spun-up in the cloud and are not on-site and components are hosted across many regions.
At the start, Datadog helped monitor the hardware in cloud-native environments, the operating systems, and the application servers. Infrastructure monitoring is essential if there is a problem with the functionality of a cloud-native company on the back-end. It offers tools, such as CPU utilization, to determine if there’s sufficient processing capacity, memory utilization to determine if there’s memory capacity, and storage use which indicates the amount of disk that the host is using to store files and other content.
The goal of infrastructure monitoring is to prevent or troubleshoot performance issues and to lower costs. We’ve covered in the Big Data and ML analysis here the costs associated with cloud environments and why this is coming under pressure with more companies choosing hybrid architectures, including a mix of cloud and on-premise servers.
Datadog set out to disrupt on-premise solutions that monitored servers and virtualized machines. This is called “host-centric.” The primary issues with former infrastructure monitoring tools are that they do not scale for the cloud and it creates silos between departments. In the cloud, infrastructure monitoring uses an API for cloud-based metrics. Datadog’s products also remove the need for Secure Shell, or SSH, to log onto remote servers. As architectures evolved to serverless, legacy monitoring tools were even more outdated as there isn’t a server to run the code and install a monitoring agent.
One key thing about Datadog is the company allows for metadata to be tagged on backend components for better monitoring. These tags inform alerts and visualization tools. The company tags both the zones and the applications. Unified tagging limits the need for reconfiguration as a company scales. This is one of Datadog’s core competencies and their unique method approach to tagging is what they launched with in 2010. This aggregates and contextualizes the data no matter where the data comes from.
Another main selling point to many of Datadog’s features is a unified platform rather than many disparate tools or vendors. This is how Datadog has disrupted its competitors and crept into larger addressable markets. The unified platform works across all environments – on-premise, hybrid and cloud – and spans infrastructure monitoring, application monitoring, log management, observability and now security. By being so strong in the area of observability, Datadog can knock down its competitors by cross-selling 13 products from the key critical piece in the stack, which is monitoring and observability. With 450 integrations, Datadog leaves little reason to leave the platform and the dashboard for other tools.
The unified platform for complex architectures is also partly why Datadog is able to lead its competitors in standardization. The dashboard also offers AI to help customers move through the dashboard by recommending the next monitoring step. Here’s a direct quote from an analyst on the call that sums up Datadog’s positioning:
“Congrats on the solid quarter as well for me. But Oli, you’re already bigger than all your near-term or nearest competitors growing faster than all of them by a couple of magnitude. You talked about enterprise standardization trend that led to your largest deal in the company’s history.”
Application Performance Monitoring
As discussed, the number of applications that need monitoring began to exponentially grow with virtualized machines and containers. Infrastructure monitoring is incomplete in these architectures without application performance monitoring to assure applications and websites run as expected with optimal speeds across mobile platforms, cloud-native infrastructures, virtualized and containerized servers. Distributed application environments can cause numerous bottlenecks and it can be challenging to figure where the bottleneck is coming from. Meanwhile, slow speeds can cause customer drop-off.
APM also assures that the application is performing as it should and backend processes are executing as they should, including transaction processing, and detects bug or errors in the application code.
APM performs the following functions:
Digital user experience monitoring: determines if there are errors or downtime that could lead to a loss of revenue
Transaction profiling: analyzes the transaction flow to isolate the cause
Code-level diagnostics: According to DZone, 43% of application performance issues come from code. Diagnostics help to identify the line of code or query causing the issue.
Deep-dive analysis: Looks beyond code at the server and application infrastructure for problems such as insufficient memory or long wait times
Infrastructure monitoring: similar to deep drive analysis, ideally infrastructure monitoring is part of the APM package to monitor slow network connections or virtualization bottlenecks.
Datadog’s APM also comes with network performance monitoring to verify if the network is slowing down traffic or if there is a low connectivity issue. The 360-degree view of infrastructure, applications and networks helps diagnose issues more quickly and with more accuracy.
According to Gartner, the number of applications monitored with APM tools has increased from 5% in 2018 to 20% in 2021. Machine learning is also used to forecast usage patterns and to detect anomalies outside of manual alerts.
Observability
Where observability differs from APM is that it monitors external data across metrics, events, logging and tracing (MELT). It’s called observability because it provides visibility as the issue is occurring and ideally before there is a performance issue.
Observability tools work with telemetry data, which is this combination of logs, metrics and traces. Metrics are numerical measurements, such a transactions per second. Events are individual actions. Logs are application-specific structured and unstructured data. Tracing tracks how many requests flow through a system. This is achieved through APIs, such as the Tracer API or the Metric API.
An observability framework allows you to work with telemetry data with fast retrieval and good visualization. In this specific area, Datadog competes yet is also compatible with the open-source framework called OpenTelemetry. You could also argue the project erodes some of Datadog’s moat as it reduces vendor lock-in but it’s the end-to-end tools that draws customers to Datadog rather than only the telemetry data. We covered this here in Q2.
Because Datadog is an end-to-end tool, it can be compatible with OpenTelemetry by allowing the open-sourced SDK to connect to the platform for telemetry data. The company also supports other open-source projects under the OpenTelemetry umbrella, such as OpenTracing, OpenCensus and OpenMetrics. This has created a standard set of APIs and libraries for observability and allows for the telemetry data to be easily migrated between vendors. Datadog has contributed to the project with its auto-instrumentation libraries.
Kubernetes and the rise of microservice-based architectures increase application reliability and efficiency; however, developers need the ability to monitor these architectures. Microservices benefit from Observability as it helps understand how microservices communicate. This keeps track of metadata for performance purposes and also distributed traces or requests. Observability allows for a more holistic picture so developers can connect data to monitoring tools and solve issues quickly.
Datadog has a new product that offers observability before code goes to production called CI Visibility. The launch of the CI Visibility product follows the acquisition of Undefined Labs. Datadog talks about “shifting left” which means moving more into the development phase prior to production.
Continuous integration and continuous delivery (CI/CD) provide a shared repository of code for an automated build process with regular intervals. This helps speed up development by deploying smaller batches of code. In data science machine learning models, projects are based on code and also the data used to train the model. The CI/CD data pipelines help to deliver machine learning models and this is another opportunity for Datadog’s observability tools to serve a growing demand.
Security Platform
Datadog’s core product is observability and security is an additional catalyst (or an accelerant). Datadog’s positioning with observability puts the products into the right place in the tech stack for threat detection. Cloud environments have an increased attack surface across infrastructure, containers and applications. As teams seek simplified operations, there are more third-party managed services being deployed which reduces visibility. Datadog offers a few security products to allow teams to detect real-time threats to applications and infrastructure, track compliance posture, and also workload security across infrastructure or workloads, such as Kubernetes clusters. With security monitoring, engineering teams have end-to-end analytics coverage from a unified dashboard. This increases time to resolution and also means you can find threats buried deep in the architecture.
As we covered in our previous write-up, the Sqreen acquisition helps Datadog take advantage of the trend towards microservices and Kubernetes rather than monolithic architectures. Generally speaking, Kubernetes can introduce vulnerable clusters due to default configurations. In the past, demonstrations at BlackHat, the annual security conference held in Las Vegas, have exploited features in Kubernetes default attack surface rather than bugs. Sqreen specializes in protecting code-level risks across distributed applications by protecting application logic. Sqreen’s main goal is to deliver security solutions to developers and the operations teams, as well, i.e., to “democratize” and emphasize security testing and implementation during the development process, often called DevSecOps. These are the two main points on this acquisition – more market share across security for microservices and more stakeholders at a company who can buy and deploy Datadog products outside of the security team.
The breakdown between developers, operations and security called DevSecOps is a transition that Datadog plans to capture similar to how the company captured DevOps. Applications and infrastructure security is new to Datadog yet management has hinted towards it becoming as big as the observability market, which is at $38 billion in 2021.
Datadog’s Financials
Datadog accelerated revenue growth during a year of tough covid comps. This shows remarkable product strength. The company’s revenue is up 75% year-over-year to $270 million, an acceleration from 66.81% last quarter, and 61.35% revenue growth in the year-ago quarter. The revenue comfortably beat estimates by 10% and was up 16% QoQ.
The company has an adjusted operating margin of 16% and adjusted EPS of $0.13. The company also had free cash flow of $57.1 million which is an increase from last quarter’s $52 million. This proves the company can grow the top line and invest heavily in R&D but not at the expense of the bottom line. The company has $1.5 billion in cash and cash equivalents.
The company issued guidance of $291 million in revenue, or 52.3% growth in the fourth quarter and EPS of $0.11. For the full year, the company is guiding for $994 million, at the midpoint, and adjusted EPS of $0.39-$0.40. According to the company, usage is down for them seasonally in Q4 as employees and businesses take holiday breaks.
It’s the underlying key metrics on customer growth that help forecast strength for Datadog as we move into 2022. The company has 17,500 total customers of which 1,800 have a ARR of $100K or more, up 66%. These accounts make up 80% of ARR, so growth in the <$100K segment is key. The other key driver of growth for Datadog is the cross-selling of products. The company is unusually strong here with 77% of customers using two or more products, up from 71% a year ago. The number of customers who use four or more products is at 31%, up from 20% a year-ago. The company also stated that net dollar retention rate is above 130 for the 17th consecutive quarter.
Annual recurring revenue helps gauge what level of revenue a company is expecting. According to management, “We also had a record quarter of ARR adds, including record ARR adds in all of our major products. And we saw strong growth across geographical regions, with all regions accelerated on a year-over-year basis compared to Q2.”
Although billings contract terms have fluctuated due to Covid with shorter terms in 2020 that are slowly returning to a more normal length. This helped drive Billings growth of 98% year-over-year. Increased contract duration to annual and multi-year partly contributed to remaining performance obligations (RPO) growth of 127%. On a more normalized basis, the company mentioned current RPO growth was closer to 100%. Revenue still remains the primary way to value Datadog, however, this under-the-hood growth certainly helps understand the strength of the company and how customers view the products as we move into 2022.
The company is investing “significantly in R&D” and plans to spend on travel and conferences in the coming year. The R&D expenses were up 80% in Q3 which management explained by saying, “It’s important to go fast when scaling those teams because there’s quite a bit of a lead time between the time when you hire engineers and the time when you get new products on the other hand. I’ve mentioned in other calls like maybe hiring now is a good predictor of output two years from now on the engineering side. So we should get started. That’s why we’re doing it.”
Notably, we like companies that invest in their engineering teams. Datadog points towards pricing power and cross-selling as to why they’re able to invest heavily in R&D and still remain profitable.
Conclusion:
As someone had said on the forum following the stellar earnings report: “Who let the Dog out?!”
To be literal, it’s AWS, Azure and Google Cloud that let the dog out. Our simplified thesis as we rounded the corner into tough Q2 covid comps was specifically, “If the tech giants are communicating that cloud infrastructure-as-a-service is one of the most critical markets in the future, then who are we to argue with this by not investing in the leader across cloud monitoring products?”
Observability is not exactly the most conversational topic, but hopefully it’s understood that architectures are becoming more complex in terms of monitoring and observability. I’m also hoping it’s clear from this analysis that Datadog has additional tailwinds from the trend towards hybrid and multi-cloud. Lastly, the management has not only executed before, during, and after Covid, yet has also grown its product suite to leverage its key positioning at the observability layer. Many companies will begin here and remain with Datadog for other products.
Valuation is high at 43X forward P/S. We rarely buy above 50 forward P/S and much prefer under 40. However, you’ll get buy alerts as we go along to help communicate when the risk/reward looks favorable as we continue to build this position.
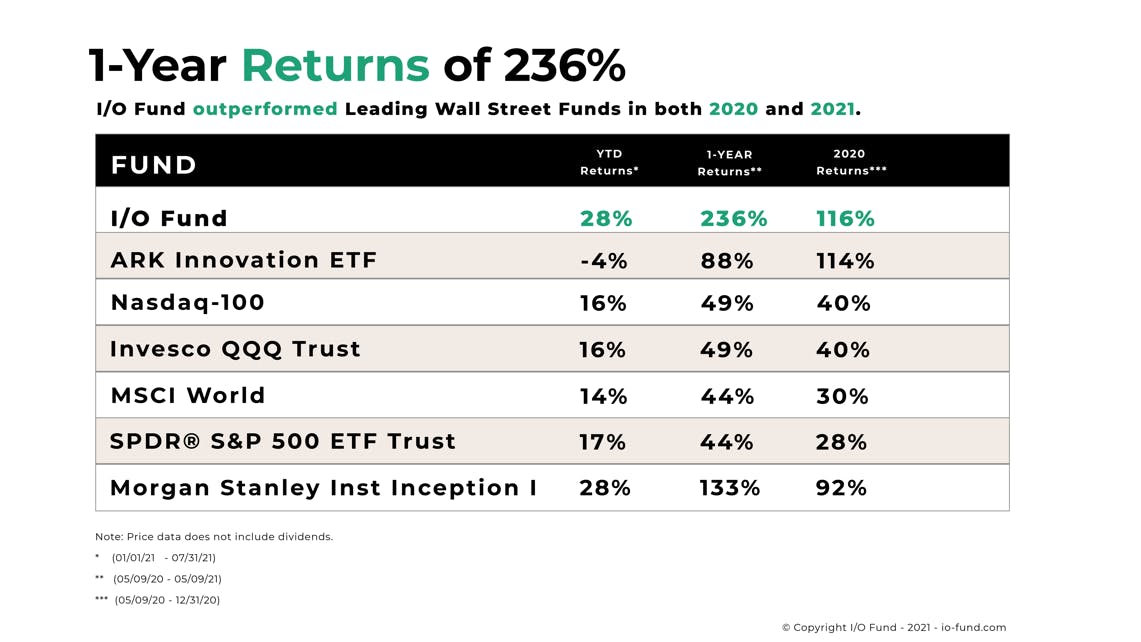
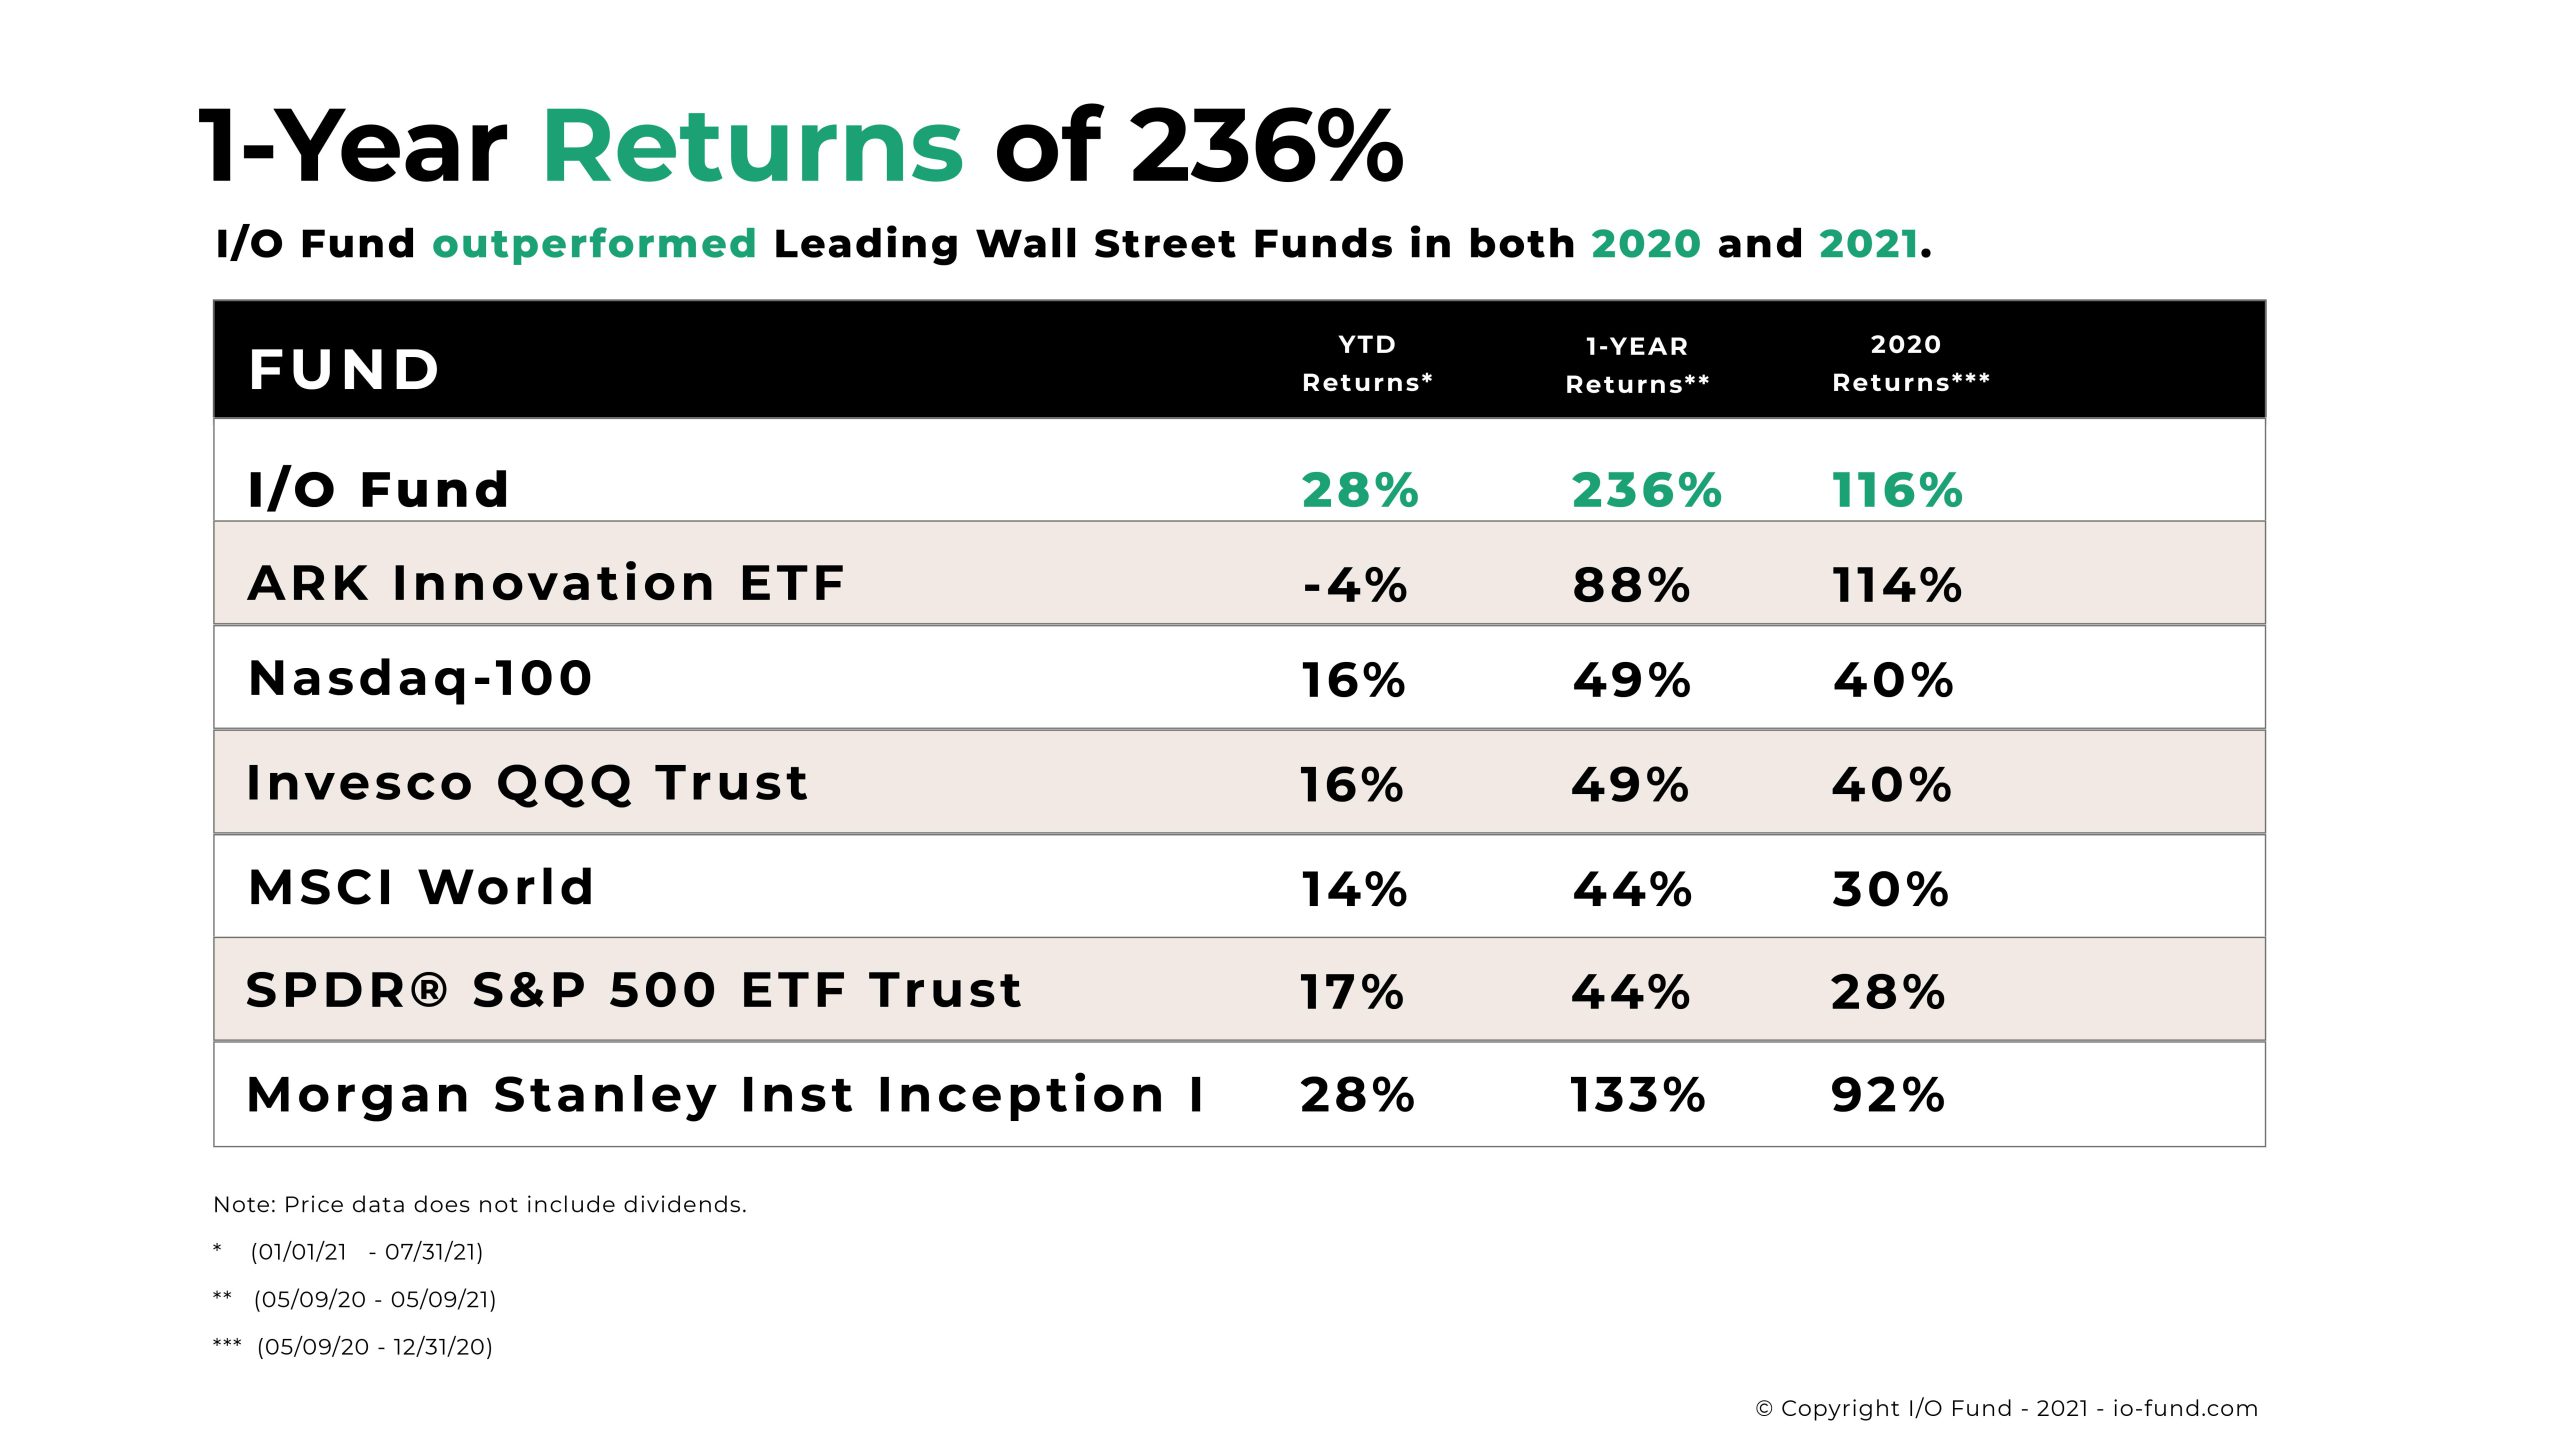
I/O Fund is once again proud to announce our record performance. The 1-year return since the inception of our portfolio on May 9, 2020, through May 7, 2021, is 236%, and the year-to-date cumulative return is 28% through July 31, 2021. We either beat $ARKK and other Wall Street Funds by a wide margin or tied the leading funds. After completion of an audit by an independent accounting firm, we are releasing our results.
Beth.Technology was rebranded to I/O Fund earlier this year. I/O Fund stands for input-output and this term is used across all computing. In addition to our recent name change, we have also introduced new features to premium members. Since then, we have been seeing growth in premium memberships globally.
I/O Fund has always shared its wins and losses with its premium members. We have a live portfolio that our members can view and we also send trade notifications to our members. Our intentional transparency builds trust with our members who eagerly await our views on various stocks.
We have developed a niche in tech investing and we continue to strive to be a market leader.
I/O Fund Performance
As you can see in the table below, our performance has far exceeded that of notable Wall Street Funds and broader market indices. For comparison purposes, we do not calculate total returns with dividends or management fees. In the table below, we show you an apples-to-apples comparison with no additional income factored in. As a reminder, this is our second audited result. The first was done earlier this year for the period May 9, 2020 to December 31, 2020, which showed a return of 116%.
Which Trends Worked?
One reason behind I/O Fund’s stellar performance is the firm’s ability to navigate tech trends successfully. We were one of the first to have exposure in blockchain, semiconductors, ad-tech, and cloud before the broader market identified these trends. This advantage led to solid gains when money flowed into these sectors. We were also bold enough to maintain up to 21% exposure in a single category.
We started to build a position on Bitcoin in 2019. I/O Fund successfully weathered the volatility so characteristic of cryptocurrencies by adding near bottoms and trimming near tops. We predicted long-term value in cryptocurrency so we stuck with our investments despite drawdowns. We have also recently launched YO/LO Fund, which is exclusive to cryptocurrency. YO/LO stands for “You Only Live Once” to help encourage our readers to take a chance in the cryptocurrency market. Our premium readers receive regular updates on cryptocurrency.
Since 2019, our firm successfully built a position in Nvidia. Our thesis was that Nvidia would become an AI leader in data centers. Back in 2019, our analysis was highly contested because, at the time, Nvidia’s data center revenues were declining.
More recently, our portfolio stocks have done well, regardless of supply chain-induced panic in the markets. Such curveballs only bolster our steady, strong conviction on a given thesis and we stand firm during market drawdowns.
In addition to our long-term buy and hold (LTBH) portfolio of about 20 positions, we also successful in momentum stocks, which we skillfully enter on a more short-term time frame.
“While most are dreaming of success, winners wake up and work hard to achieve it.” – Anonymous
How the I/O Fund Team Identifies Winners
I/O Fund is led by lead tech analyst Beth Kindig who has over a decade of experience in analyzing technology stocks. She has a large following on Twitter which shows her growing popularity among investors. Earlier in her career, Beth started to write about private companies and her analysis was very well received by readers and she began to garner press for her coverage of tech products in 2014.
Beth’s stock recommendations have been successful because she understands tech better than most financial analysts in the market today. Prolific knowledge and experience from attending tech conferences in Silicon Valley and writing an abundance of white papers and analyst reports for deals in the private sector cemented a strong foundation for her to accurately identify stock winners in the tech sector. She has also worked as an enterprise tech company’s product evangelist where she spoke about tech products to large audiences. She cares deeply about individual investors having access to the same quality of information as institutions in the industry so that they can maneuver the markets as adeptly as institutional entities can.
In the words of Beth Kindig, Founder and CEO of I/O Fund, “At I/O Fund, we believe tech requires a lead analyst with direct yet broad experience in the industry.” She further states, “This makes our investment strategy more advanced and can lead to higher returns.”
Knox Ridley is the Portfolio Manager of I/O Fund, who specializes in technical analysis. Tech stocks are volatile and there are often large drawdowns, so technical analysis is equally important. It's crucial to enter a select stock at the right time and sell at the right time. Knox and Beth pooled their money in May 2020 and launched the fund we know today.
Sign up for I/O Fund's free newsletter with gains of up to 1100% – Click hereSign up for I/O Fund's free newsletter with gains of up to 1100% – Click hereClick here
Knox started his career as an ETF wholesaler in 2007 before becoming a portfolio consultant for large RIA’s, FAs, and Institutional accounts. He is very keen on macro trends and is known for increasing and decreasing allocations for record returns. Knox is very popular in our forum where he posts daily and weekly webinars where he reviews entries and exits the portfolio plans to make.
“Conviction is key to sticking with a company over the long-haul, regardless of drawdowns; however, the market will always tell you what sectors and stocks are being favored today, which is where we shift focus,” said Knox Ridley, Portfolio Manager of I/O Fund. “We use relative strength screens to add to winners, as well as technical analysis to help us reduce risk when sentiment appears to be shifting.”
Some of his real-time trades on our premium site include Roku at $28.10 and $30, Nvidia at $31.50 and $51.20, Zoom Video at $62.40 and $73.50, Snap at $41.20, Magnite at $10, Datadog at $34.90, Asana at $33.20, and AMD at $48.40.
Beth Kindig and Knox Ridley expanded I/O Fund with a dedicated core team of analysts and marketing, technical, and account services to best serve their premium members.
Free Newsletter
In addition to our premium website, we publish articles every week to the general public. Our readership has grown significantly and we have more than 22,000 subscribers to our weekly newsletter. It was not an overnight success, rising gradually out of many endeavors to give credible information to the investor community in the most exciting industry– technology.
It’s our privilege to share that our subscribers have gains of up to 1150% from our free newsletter. Many of our competitors send free articles that are, essentially, clickbait for their premium services. In contrast, we spend hours researching informative, quality analysis that we then publish for free.
Some returns include +1150% for Roku, +560% for Nvidia, and +162% on Zoom. We have also correctly predicted trends like that involving Microsoft winning market share in the cloud market.
To wrap up, we would like to thank each and every one of you for your support over the years. Should you wish to sign up for our premium services, kindly click on this link. Please find below a brief snapshot of our suite of services.
Blogs and Deep Dives: Dig Through the Best Research on the Market
Portfolio: Premium members can view the live portfolio
Trade Notifications: Members can sign up for trade alerts
Forum: This is a moderated, interactive space to meet like-minded individuals and discuss stocks
Webinars: Hear Directly from the Team and Listen On-the-Go
DLocal reported Q3 earnings recently and I/O Fund analyst Bradley Cipriano discusses what these earnings mean for the burgeoning company. DLocal offers alternative payment methods to emerging market consumers who may not have access to debit or credit and are more likely to own a smartphone. DLocal's business model has enabled the company to see rapid growth.
Emerging markets, their global relevance, and lively consumers in those areas aren't going away any time soon. Watch the video below to see why DLocal's sales should continue to grow rapidly.
Sign up for I/O Fund's free newsletter with gains of up to 1100% -Click hereSign up for I/O Fund's free newsletter with gains of up to 1100% -Click hereClick here
SAN FRANCISCO–(BUSINESS WIRE)–I/O Fund, an actively managed tech portfolio that provides in-depth stock investing research and real-time trade alerts for retail investors, announces a 236% 1-year return from its inception through May 7, 2021*, and a year-to-date cumulative return of 28% through July 31. Both figures do not include dividends. These results, confirmed through recently completed independent audits, reflect I/O Fund’s record as a performance leader in actively managed funds.
I/O Fund credits much of the positive gains to being first to trends across blockchain, semiconductors, cloud and ad-tech, and being confident in holding high allocations of up to 21% in a single category. The fund’s performance across three reviews in its first 18 months is reflective of the company’s fluency with the ever-expanding tech landscape and ability to form a winning portfolio.
I/O Fund’s team of experts championed how to add Bitcoin to a stock portfolio in 2019 and properly allocated to this asset. The fund saw gains from these assets in February through early May, trimmed in the $52,000 to $58,000 region and then began to buy back into the asset when it was valued between $31,000 and $40,000. Entries and exits are shared with premium subscribers in real-time. I/O Fund’s analysts saw long-term value in cryptocurrency, sticking with the investments despite drawdowns of 40% to 50%.
The company also built a leading Nvidia position starting in 2019 with a 9% allocation to-date by using in-depth technical stock analysis to predict Nvidia would become an AI leader in the data center. This analysis was highly contested as Nvidia had declining data center revenue in 2019 when the I/O Fund built this key position.
“At I/O Fund, we believe tech requires a lead analyst with direct yet broad experience in the industry,” said Beth Kindig, founder and CEO of I/O Fund, who also serves as the company’s lead tech analyst. “This makes our investment strategy more advanced and can lead to higher returns.”
I/O Fund’s performance over its first year blew away the competition. Its portfolio return of 236% bested the closest institutional competitor by more than 100% and other funds by even larger margins over the May 9, 2020, to May 7, 2021, time frame.
The 2021 YTD report proves that I/O Fund kept its momentum as a leader in researching and forecasting tech growth stocks. Its 28% return, amid a difficult year for tech stocks, either tied or surpassed every other competitor.
“Conviction is key to sticking with a company over the long-haul, regardless of drawdowns; however, the market will always tell you what sectors and stocks are being favored today, which is where we shift focus,” said Knox Ridley, Portfolio Manager of I/O Fund. “We use relative strength screens to add to winners, as well as technical analysis to help us reduce risk when sentiment appears to be shifting.”
Kindig and her team credit I/O Fund’s retail influence to its growing, passionate base of stock newsletter and premium subscribers. The team is dedicated every day to continue outperforming the large corporations I/O Fund competes with.
Sign up for I/O Fund's free newsletter with gains of up to 403% – Click hereSign up for I/O Fund's free newsletter with gains of up to 403% – Click hereClick here
“We are all trained to believe that ‘smart money’ knows more than retail,” Kindig noted. “However, we wanted to test that notion by forming a small team of experts who care very much about their chosen specialty. The market knows how to keep you humble and so we will continually strive to improve. We are not only a site that celebrates the wins, but we also show you how we manage losses – all in real-time.”
"The market knows how to keep you humble and so we will continually strive to improve. We are not only a site that celebrates the wins, but we also show you how we manage losses – all in real-time.” – Beth Kindig
I/O Fund hired an independent accounting firm to conduct all three audits. It reviewed statements dating back to May 2020 from the fund’s brokerage and blockchain accounts and found no discrepancies.
*Corrections: We had a 236% 1-year return from inception through May 7, 2021, not May 7, 2020.
You can learn more about the IO Fund’s 2021 performance here. In it, we discuss which trends worked for our investment strategy, and how we pick winners in the different tech industries. We also discuss our crypto strategy: YO/LO, which stands for “You Only Live Once” to help encourage our readers enter the cryptocurrency market.
About I/O Fund
I/O Fund is an actively managed portfolio that offers in-depth research within and real-time trades. We specialize in tech microtrends and have outperformed popular tech-focused innovation funds since our inception in 2020 with audited performance results. I/O Fund empowers retail investors by offering a transparent portfolio alongside institution-level research and real-time notification of entries and exits. We also offer a free public newsletter with past stock coverage that included Roku at $33, Zoom at $137 and Nvidia at $31.50. Premium members are notified of lower entries, including Zoom at $62 and Bitcoin at $7,700.
This article was originally published on Forbes on October 29, 2021, 12:07am EDToriginally published on Forbes on October 29, 2021, 12:07am EDT
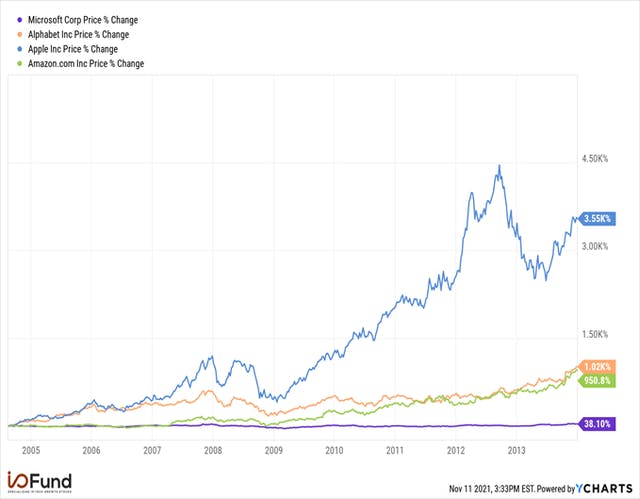
Microsoft has taken the coveted top spot as the world’s largest company by market capitalization – passing even stock market darling Apple. Microsoft was nearly left for dead, like peers IBM or General Electric, as one of the leaders from previous decades that couldn’t innovate fast enough to keep up. The period after the dot-com bubble and then the financial crisis of 2008 were difficult years for Microsoft’s stock as the company greatly lagged its peers in gains.
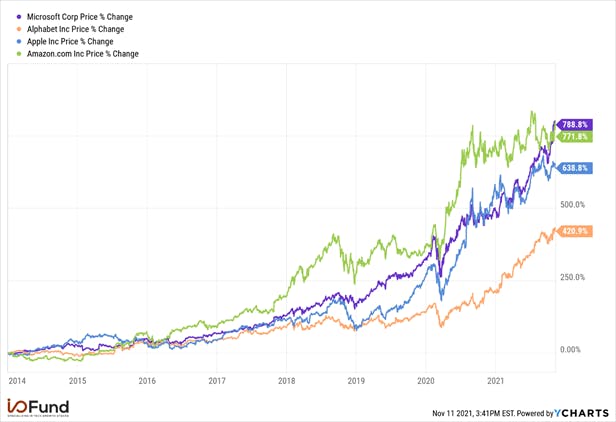
Source: YCharts: Microsoft, Alphabet, Apple and Amazon Stock performance 2014-2020
This trajectory began to change when Satya Nadella, formally of the Azure division, became CEO in 2014 after working his way up through the company over the course of 19 years to president of the cloud business. The stock is up nearly 800% since the new CEO took over. Nadella’s multi-decade cloud experience and intense focus is what has helped Microsoft climb out of the hole that Bill Gates and Steve Balmer following decades of fighting open-source communities and anti-trust issues.
Source: YCharts: Microsoft, Alphabet, Apple and Amazon Stock performance 2014-2020
We’ve analysed earnings calls to see how Microsoft’s cloud focus compares to a company like Alphabet, which is diversified across many sectors, such as advertising. The contrast is remarkable in terms of how determined Microsoft’s management is on staking their ground on cloud computing with nearly every statement in the hour-long calls tying back to this sector.
Amazon Web Services could arguably be the hardest competitor in technology and Microsoft accepted this challenge despite AWS having a nearly four-year head start. Growth rates for both companies’ cloud divisions are in the 35% to 40% range.
Since 2018, we’ve covered in detail Microsoft’s hybrid cloud computing strategy and why we thought this strategy would be enough to propel Microsoft’s stock past its peers. Nearly three years after our coverage of this hybrid strategy began, we are now looking to the bellwether to analyse what trends we should pay attention to next across the cloud ecosystem.
Why Microsoft Azure Has Doubled Its Market Share
According to Gartner, cloud growth will remain robust next year on already large numbers. Public cloud services forecast on end-user spending will reach $482 billion in 2022, up from $396 billion in 2021 for growth of 21.7%.
Cloud IaaS will outpace this growth at 32.9% from $91.5 billion to $121.7 billion. Gartner also points out that public cloud spending will exceed 45% of all enterprise IT spending, up from 17% in 2021.
Amazon Web Services, Azure and Google Cloud are the top three IaaS players in the market with Azure nearly doubling its market share from a low of 11.2% in 2018 to 21% in the most recent quarter. We can see that despite this growth, AWS has not given up any turf and has remained level at 32% market share while the overall cloud IaaS market has grown substantially over time, affording others such as Azure an opportunity to capture this growth.
Primarily, it’s hybrid cloud computing that has helped drive Azure’s market share. We first covered this in 2018 and expanded on Microsoft’s strategy in 2019 when we stated:
“Investors should pay close attention to hybrid cloud when looking at Microsoft. Looking at it carefully will give them perspectives about how the company is positioned to set itself apart from other cloud companies like Amazon and Google.
Hybrid cloud is a technology which enables companies to store some of their data on their own servers while simultaneously sending other data to the private and public cloud. Companies love hybrid cloud because it is cost-efficient, transparent, and safe. Azure’s strength in hybrid computing has made it the main player in the industry. The product is used by 95% of Fortune 500 companies.”
Satya Nadella pointed out another important key aspect as to why Microsoft’s stock price has done well in the current environment where there are inflationary fears: “Digital technology is a deflationary force in an inflationary economy. Businesses – small and large – can improve productivity and the affordability of their products and services by building tech intensity. The Microsoft Cloud delivers the end-to-end platforms and tools organizations need to navigate this time of transition and change.”
I made this point over two years ago prior to the pandemic when the market was greatly doubting cloud and I said the following: “My prediction is this may be one of the last cycles when tech is considered less safe than value stocks. As the market will find out (the hard way), cloud software is actually very safe. It is insulated from trade wars and overseas manufacturing issues. It reduces costs for enterprises, which is ideal for a recession. Cloud software is at the beginning of a rapid growth cycle compared to its counterparts in tech — such as mobile, e-commerce and advertising — which are reaching saturation, are finding themselves in the cross hairs of anti-trust and are susceptible to consumer spending changes.”
Microsoft acquired Github in 2018, which helped Microsoft address its weakness of a poor reputation in open-source communities and lacking in developer relationships. Developers help determine the cloud IaaS service an enterprise or SMB customer will choose, so in-roads into this community via an acquisition has likely helped Microsoft hedge the developer favorite, AWS.
4 Key Trends from Microsoft Ignite 2021
As one of the bellwethers for cloud, Microsoft is a key company to monitor for trends that are leading the market. At Ignite 2021 Satya Nadella said, “we’re moving from a mobile and cloud era to an era of ubiquitous computing and ambient intelligence.” This next growth phase includes four key trends.
The first is the hybrid work-from-home trend with 73% of employees wanting flexible remote work options and 67% want more in-person connections. Microsoft believes the future will support both a collaboration between the physical world and digital world. Microsoft Mesh, which the company calls the Metaverse platform, can be embedded in Teams. Mesh introduces 2D and 3D meetings with personalized avatars that use AI to imitate movements even when the camera is off. Organizations can also create virtual spaces that resemble the physical office environment.
Sign up for I/O Fund's free newsletter with gains of up to 403% – Click hereSign up for I/O Fund's free newsletter with gains of up to 403% – Click hereClick here
Microsoft Loop is a new collaboration app that will expand Office. Through Microsoft Teams Connect, the company plans to make cross-organization communication easy and secure when there are meetings outside of an organization.
The second trend Microsoft pointed towards in the keynote is hyper-connected businesses. This refers to a “business process transformation” where supply and demand is informed by data and AI to help improve outcomes, such as the supply chain issues the market has experienced this year. At Ignite, the company announced Azure OpenAI Service with a video clip that showed how real-time summaries can be generated during the WNBA play-off. This will help content editors choose the right content in a few seconds using AI. Notably, Microsoft introduced the world’s first AI supercomputer five years ago during Ignite 2016 and today has some of the most powerful AI supercomputers in the cloud.
The third trend for the next phase of growth is that digital business will drive multi-cloud and multi-edge infrastructure. The company has already partnered with telecom operators like AT&T, Verizon, Telefonica, BG, Telstra, and SingTel to use its cloud services. Earlier this year, AT&T decided to move its 5G network to Microsoft Cloud. 5G and the Internet of Things could get a further boost recently as the Infrastructure Bill has been passed. The bill is expected to cost $1.2 trillion over eight years, which includes $110 billion for roads, bridges, and infrastructure, and $65 billion for broadband.
The final trend is the requirement for strong end-to-end security. The pandemic has increased digital transformation and with every business being operated remotely, the complexity has increased. According to the company, Cybercrime costs about $6 trillion per year and is expected to reach $10 trillion by 2025. In the earnings call Satya Nadella mentioned, “Our goal is to help every organization strengthen its defense through the zero trust architecture built on end-to-end solutions that span all clouds and all platforms. We analyze over 24 trillion signals across email, endpoints, and identities each day and translate this intelligence into innovative features to protect our customers.” The company has nearly 650,000 customers using its security solutions, which is up 50% YoY.
Microsoft Fiscal Q1 FY 2022 Report
The company’s revenue in fiscal Q1 FY 2022 increased by 22% YoY to $45.3B, which beat the consensus estimates by 3%.
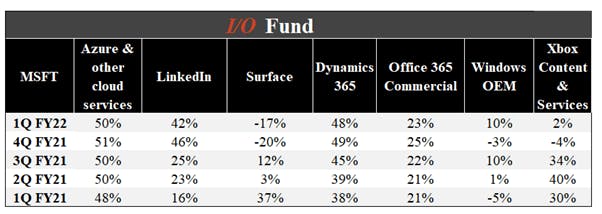
All the three business segments showed promising growth. Revenue in the Productivity and Business Processes segment increased by 22% YoY to $15B primarily helped by the growth in Office products and LinkedIn revenue. Intelligent Cloud segment revenue increased by 31% YoY to $17B, it was primarily helped by the 50% YoY growth in Azure & other cloud services. The Personal Computing segment increased by 12% YoY to $13.3B.
Total cloud revenue growth was 36% YoY to $20.7B in comparison to Amazon Web Services 39% YoY growth to $16.1B. Notably, Microsoft does not break out Azure revenue.
78% of the Fortune 500 companies use the company’s hybrid offerings. This quarter GE Healthcare and Procter & Gamble migrated their critical workloads to Azure.
The company also updated in the earnings call that GitHub has 73 million developers. 84% of the Fortune 100 companies use GitHub.
LinkedIn has nearly 800 million members and hiring on the platform rose 160% YoY. LinkedIn revenue grew 42% YoY.
Microsoft Teams is also growing steadily. 138 organizations have more than 100,000 users of Teams. Due to the hybrid work environment Teams chats increased 50% YoY. Schlumberger, Westpac, and SAP have chosen Teams Phone in this quarter. Microsoft 365 subscribers reached 54.1M at the end of the quarter.
The company had a free cash flow of $18.7B. Net income grew 48% YoY to $20.5B and adjusted net income grew by 24% YoY to $17.2B. Earnings per share came in at $2.71 and adjusted earnings per share came at $2.27, which beat the consensus estimates by $0.19.
Management’s revenue guidance for the next quarter is $50.6 billion across all three segments, which represents year-over-year growth of 17%. The analysts’ consensus is $50.47 billion with adjusted earnings per share of $2.31.
Conclusion:
Microsoft’s strategic bet on cloud became clear when the company placed the president of the cloud division as CEO. There is a stark change in terms of Microsoft’s performance as a public company since 2014 and we believe this new era where Microsoft leads could be just beginning. Apple must contend with consumer sentiment (and China) and must also break into new markets to maintain growth, Alphabet is spread thin across many segments with little overlap, and Amazon’s e-commerce weighs on AWS profits. Meanwhile, Microsoft’s singular focus provides a rare pure play at a $2.5 trillion market cap while cloud is setting up to capture gains from artificial intelligence.
Royston Roche contributed to this article
Please note: The I/O Fund conducts research and draws conclusions for the Fund’s positions. We then share that information with our readers. This is not a guarantee of a stock’s performance. Please consult your personal financial advisor before buying any stock in the companies mentioned in this analysis.
Affirm’s Q1 Results and Exclusive Agreement with Amazon
Affirm reported strong Q1 FY2022 results that beat on the topline as sales grew 55% YoY to $269 million. Management also raised its guide for FY2022 sales to grow 42% YoY to $1.2 billion, up from its prior guide of 35% YoY growth. On top of the strong growth, Affirm announced an exclusive agreement with Amazon to be the only BNPL payment option on the e-commerce platform for at least the next two years, just in time for the holidays. This exclusive agreement is not yet included in management’s FY2022 sales guide.
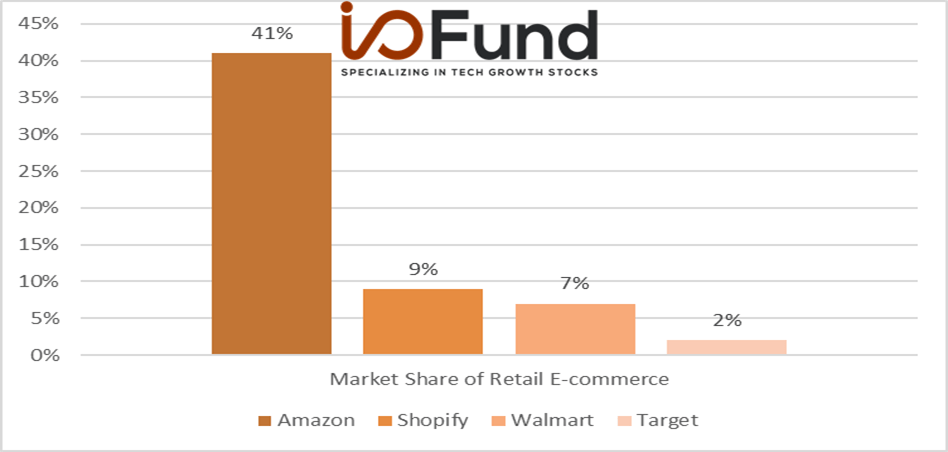
The Amazon partnership was initially announced in August but was made exclusive in November. The exclusive agreement with Amazon follows partnerships with Shopify, Walmart and Target, all since June 2021 and before the holiday shopping season ramps. As shown below, Affirm has exposure to >60% of total retail e-commerce market share following these partnerships.
However, these partnerships do have a cost. In exchange for the exclusive agreement, Amazon is receiving up to 15 million warrants of Affirm equity with a strike price of $100. While this is a hefty price to pay, it does create a mutual interest in Affirm’s success on Amazon’s platform. For example, Amazon will conduct its own marketing to encourage the conversion and adoption of the Affirm program.
The terms of the agreement highlighted a few different marketing strategies that Amazon may use to promote BNPL to its customers, such as promoting BNPL to Prime members when they use credit cards; include cashback for Prime members that use BNPL; email Prime members about Affirm’s BNPL offering; and even use packing tape to promote the program (AFRM 8k, 11/10/2021). The exclusive agreement has Amazon working to encourage adoption of Affirm’s payment methods, because if Affirm succeeds, Amazon will also benefit. Considering that Affirm wants to quickly scale, this was a huge win for the company.
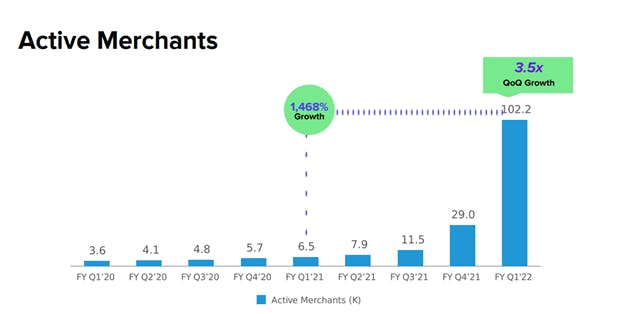
In the chart below, we can clearly see the benefits that these partnerships have on Affirm’s growth. Active merchants surged nearly 1,500% YoY to 102,200. Active merchant growth is important, because it is the primary driver of consumer growth. Merchant growth is a forward looking metric that supports sales growth in the future. Importantly, the rapid rise in active merchants shown below was driven by the Shopify agreement signed in June 2021, implying that merchant growth will likely continue to ramp following the Amazon agreement discussed above.
Affirm’s Q1 FY2022 Financial Results
Following the rapid growth in active merchants, Affirm’s topline growth also came in strong. Q1 sales increased 55% YoY to $269 million, which beat estimates by $20 million. Network fees, which are fees paid by merchants, increased 13% YoY to $112 million and interest income and gains on sale of loans increased 116% and 89% YoY to $117 million and $31 million, respectively. To be complete, servicing revenue increased 132% YoY to $10 million.
Gross merchandise volume (GMV) increased 83% YoY to $2.7 billion, and this growth flowed into loans, as loans held for investment increased 62% YoY to $2.1 billion. However, expenses also rose, driven in part by stock based compensation (SBC) from the recent IPO and a change in estimates. Q1 net loss was -$307 million, and excluding $87 million in SBC following the IPO and $142 million due to changes acquisition related expenses, adjusted net loss was $78 million, or -$0.29/share, slightly ahead of estimates at -$0.30.
Management also raised their guide for the year. The midpoint of its GMV guide was raised 5% to $13.3 billion for the year, while the mid-point of its FY2022 sales guide was also raised 5% to $1.2 billion, implying a 42% YoY growth rate. Adjusted operated loss is guided to be -13% of revenues, slightly higher than the initial -12% guide.
Importantly, management’s guide is somewhat conservative as it does not include any contribution from the exclusive Amazon agreement discussed above (however the dilution from the warrants is included in the EPS guide). Once Affirm has gathered sufficient data from the program, they will incorporate that into their guide going forward. Based on management’s current guide and Affirm’s stock price, Affirm trades at ~35x P/S.
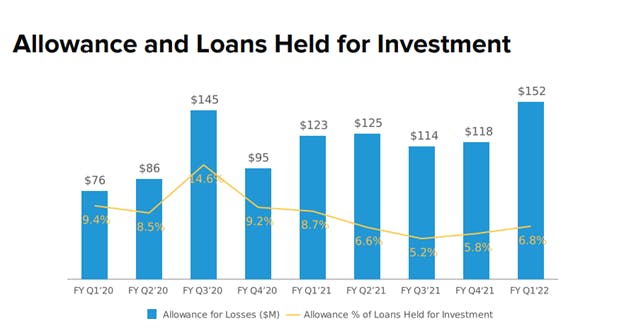
Finally, the company’s credit metrics appear healthy. Provisions for loan losses increased 133% YoY to $64 million, which was skewed by a low base period due to provision releases in the prior year quarter. The rise in provisions drove allowance for loan losses up 24% YoY to $152 million, or 7% of total loans. The rise in allowance for loan losses provides a ‘safety net’ in case defaults begin to rise in the future. As shown below, Affirm’s allowance for loan losses is near its historical average of ~9% of total loans.
Affirm’s reserves for loan losses has trended up with the company’s rapid growth, which provides downside protection from rising defaults. As Affirm’s credit risk model is proven overtime, the company’s reserve for loan losses may decline relative to loan growth, which would fuel earnings growth in the future.
The company’s recent partnerships with major online retailers such as Shopify and Amazon, positions the company well for strong growth going forward. The company’s credit metrics appear healthy and growth should continue to be robust as we enter the holiday shopping season.
Update on Palantir
Palantir reported Q3 results on 11/9/21 and sales grew 36% YoY to $392 million which beat topline estimates by $5 million. Commercial sales accelerated to 37% YoY growth in Q3, up from 28%, 19% and 4% YoY growth rates in Q2, Q1 and Q4 2020, respectively, while government sales increased 33% YoY to $218 million.
On the call, Palantir COO Shyam Sankar explained that the company’s commercial offerings have been robust and that the Foundry tool (primarily used in commercial offerings) has benefited from three key trends: 1) defense industrial 2) automotive and mobility and 3) healthcare. Specifically, defense and healthcare are benefitting from increased spending while automotive and mobility are benefitting from the ramp in EVs and the large amounts of data that this secular trend is creating.
Continuing down the income statement, adjusted gross margin was 82%, up from 81% in the prior year quarter. Q3 operating margin was a slight loss of 1% while adjusted operating profit margin was 30%, its 4th consecutive quarter at or above 30%. Adjusted EBITDA increased 59% YoY to $119 million and adjusted EBITDA margin increased YoY from 26% to 30%. Non-GAAP earnings were $0.04, which met the consensus estimate.
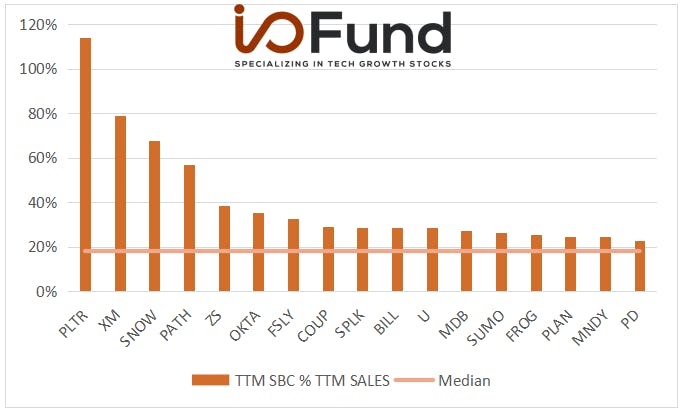
Adjusted earnings exclude large amounts of SBC, but SBC has materially declined and was down 78% YoY to $184 million during the most recent quarter. The normalization of Palantir’s high SBC is due to the outsized levels from last year following its IPO, and a continued normalization in this trend should benefit shareholders going forward as dilution slows.
Looking ahead, management guided for Q4 sales to increase 30% YoY to $418 million, which was 4% higher than initial estimates. For the full year 2021, sales are expected to grow 40% YoY to $1.5 billion, 2% higher than initially expected. Management also raised their adjusted FCF guide to be in excess of $400 million, up from the prior guide of $300 million. The company continues to expect long-term topline growth of 30% or more through 2025.
While Palantir largely came in as expected, there were some concerns with Palantir’s results. For instance, sales growth slowed relative to the prior two quarters. Furthermore, cashflows from customers was lumpy, as deferred revenue and customer deposits decreased relative to sales growth. However, this was offset with a sharp rise in backlog, as RPO to be completed in the next twelve months increased 111% YoY to $393 million, while bookings increased 56% YoY to $510 million. The outsized growth in NTM RPO and bookings relative to sales suggests that there is ample support for future sales growth.
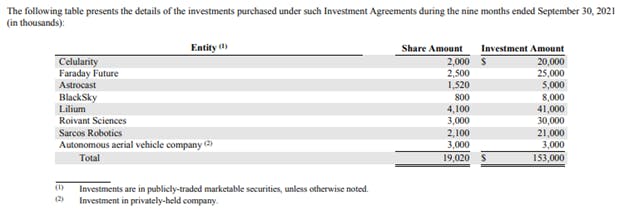
Palantir has also made a series of investments that could further help fuel topline growth going forward. The company invests in commercial customers that gives Palantir exposure to their success if they benefit from Palantir’s tools. As shown below, the company has invested $153 million in commercial partnerships YTD, with a maximum potential revenue from these contracts of $640 million.
Investments in commercial customers is similar to what Amazon has done with Affirm (discussed above), as Palantir gets exposure to companies that can materially benefit from its tools. While Palantir has a robust toolset that can transform data into actionable insights, it takes time for commercial customers to find uses for the products. These investment agreements can help accelerate the time it takes for commercial customers to realize the strength in Palantir’s services. These investments are not without risks, however, because if the company fails then Palantir will be required to write off the investments, impacting earnings.
Looking forward, Palantir’s guide appears reasonable as it has amble support from backlog and bookings to continue to grow 30%+. The company’s commercial segment has been robust, which has been aided by the company’s investments in commercial customers. While growth slightly slowed relative to prior periods, if government spending begins to ramp, then Palantir’s sales growth will likely reaccelerate in the future.
In the short video below, I give an overview of SailPoint's Q3 results, which I think are much stronger than they initially appear. Growth has been artificially subdued recently as SailPoint undergoes a billing model transition to a subscription service. This transition is largely complete, and subscription sales are growing much faster than as-reported sales.
The market may not fully understand SailPoint's true growth rate due to the impact of the billing model transition. Watch the video below to quickly learn why SailPoint is positioned for accelerating growth going forward and why this matters to investors.
Sign up for I/O Fund's free newsletter with gains of up to 1100% -Click hereSign up for I/O Fund's free newsletter with gains of up to 1100% -Click hereClick here
The chess pieces are being rearranged in ad-tech and I don’t think this quarter is very meaningful in terms of where this will go long-term. These shifts can take a while but our strategy from the beginning has been to stick close to first-party data companies. Magnite is given access to first-party data by representing publishers and the rest of our stocks are firmly cemented in first-party data.
I think it is a false assumption that we have all of the information from 10 days of IDFA changes and iOS 15 being live. The migration towards or away from certain ad platforms can take months, quarters or years. But there is certainly evidence that the shift has begun.
Regarding who will do well long-term, it will be those who work with first party data. There is quite a bit of evidence that this is where the advertising world is headed. Listen to Twilio’s call and you’ll see they are a cloud company banking on this shift.
“Digital growth and digital personalization or how businesses are building their businesses is a tremendous opportunity. And that opportunity is actually accelerated by the [Indiscernible] changes, like on the world of IDFA tags and third-party cookies, and all those things getting change because companies here rely on what's just honestly shenanigans. Like in the changes that have been going on, whether cookies or IDFA tags, these privacy changes are on the right side of history. And so, what Twilio's providing is the antidote to all those changes, which is a personalization and marketing system that starts with first-party data.”like on the world of IDFA tags and third-party cookies, and all those things getting change because companies here rely on what's just honestly shenanigans. Like in the changes that have been going on, whether cookies or IDFA tags, these privacy changes are on the right side of history. And so, what Twilio's providing is the antidote to all those changes, which is a personalization and marketing system that starts with first-party data.”
Here is what Magnite said in their recent call: “It’s been a third-party cookie world with third-party data that has really ruled the ecosystem. And I think publishers are clearly seeing a shift and buyers are starting to acknowledge this is really good information [first-party data]. They have a direct relationship with the consumer.”It’s been a third-party cookie world with third-party data that has really ruled the ecosystem. And I think publishers are clearly seeing a shift and buyers are starting to acknowledge this is really good information [first-party data]. They have a direct relationship with the consumer.” My original thesis on Magnite was centered around first-party data.
Here is what Roku said regarding the shift from third-party data to first-party data in their earnings call, “Yes, as you alluded to and the way you framed up the question, the disruption and the noise around the loss of cookies and device IDs like Apple's IDFA in general is a net benefit to Roku, really for two reasons. First, independent ad tech is very challenged in an environment, where these identifiers are getting more scarce because, they don't have these identifiers. They don't have a direct consumer relationship, whereas Roku does. And so we're always working on our platform with our own first-party data and it's a fundamental advantage for us and ultimately is bringing brands to us.”They don't have a direct consumer relationship, whereas Roku does. And so we're always working on our platform with our own first-party data and it's a fundamental advantage for us and ultimately is bringing brands to us.”
This is what you’ll need to ask yourself – are all of these management teams wrong or is the market wrong? Because clearly the market is penalizing these first-party data companies while rewarding third-party data companies (Snap deeply penalized compared to Facebook which is excessive on third-party data AND Roku penalized vs The Trade Desk which is only third-party data). Granted, the Trade Desk would be more affected by browser cookies being eliminated (this could happen end of 2023) but to have no affects long-term compared to Roku is not the correct outcome.
Hopefully by now, you know we would close a position if we thought the story was materially weaker than we previously estimated. When we close a position, our goal is to move that money into a compounder. However, I also don’t mind standing in front of a train and saying the market is wrong if I think the product isn’t fully understood. How many times will I have to do this with Roku? We can add Q3 2021 to the long string of misunderstood moments in Roku’s history!
We already covered Snap following earnings here, but I will tell you that October 2021 is now branded in my mind as another example of how the market lives in an alternate reality of two extremes. When Snap was experiencing its biggest one day loss, the company was simultaneously launching the most bullish product in the company’s history – Arcadia. This product helps Snap scale AR brand ads beyond its own platform. It’s a critical moment when an advertising company is able to monetize audiences outside of its own feed (or channel), and therefore, it’s bizarre to see a double digit drop during the month of Arcadia’s launch (but will provide a great editorial someday).
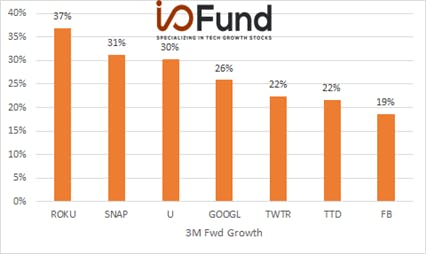
Magnite has always been a high flier for us; one where we are counting on the whole being greater than the sum of its two parts. If CTV ads were at saturation like mobile or desktop, then we would not be in Magnite or maybe even Roku. It’s this tailwind that has been able to overcome the current headwinds. Magnite not pictured because a pro-forma was not offered, however, we believe the pro forma growth rate for Magnite is around 25% placing the company between Google and Twitter.
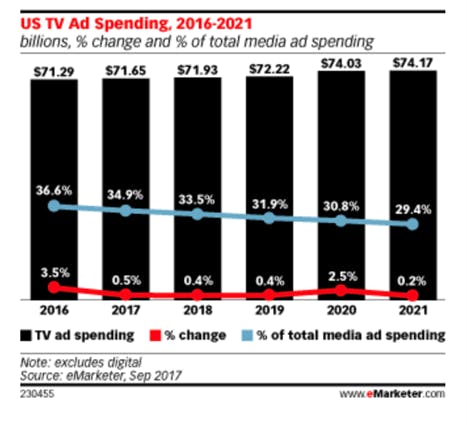
Here is Pay TV ad spend in the United States alone compared to CTV ad spend of $24 billion. When Pay TV ad budgets stars declining like cable TV subscribers has declined, then we know we are finally in the true market for CTV ads.
Roku Earnings
There is a lot to unpack with Roku. Despite headwinds, it’s technically the strongest ad-tech company in terms of forward growth yet the market is going through a serious (and intense) period of doubt. We will need to discuss Player revenue, what supply shortages mean for smart TVs and dongles and competitors such as Google and Amazon and. The supply shortages affect Roku’s active accounts but Netflix also made it clear during Covid that there was a pull forward in terms of subscribers, which is similar to Roku’s situation.
Even despite these near-term risks, Roku is guiding for 37% growth which is the highest of all ad-tech companies above $20 billion in market cap. Notably, Roku is guiding high (comparatively) on a very large revenue base of $890 million at the midpoint for next quarter. Compare this with The Trade Desk, guiding for 21% on revenue of $339 million.
We will quickly go over the financials before breaking down the main issues that the market is concerned about. Then, we revisit our thesis to see if Roku is still on track. The goal is to always figure out where the market is wrong and being inefficient.
Financials:
Roku’s total revenue grew 50% year-over-year to $680 million. Platform revenue increased 82%to $583 million. Gross profit increased 69% and active accounts increased 23% year-over-year. Sequentially, active accounts were low at 1.3 million adds.
Average revenue per user (ARPU) is at $40, representing an increase of 49%. To grow ARPU from $27.00 to $40.00 in roughly a year is unheard of. Here is how Facebook’s ARPU compares with it taking the company 16 years to reach $40 ARPU while it took Roku four years from the launch of its ad exchange to achieve this ARPU. You’ll see the jump from $27.00 ARPU to $40.00 took a few tries between 2017 and 2020 for Facebook while Roku has nailed this incredible monetization growth in one year.
Clearly, Roku does not have billions of users like Facebook but ARPU is a vital sign as to the strength of an ad platform. It’s also helps to elucidate why Roku management is taking it on the chin with Player revenue (see below) and what they mean by flywheel across Roku’s diversified product line, which is an operating system, an ad exchange that extends to mobile and the web, and a publisher.
The $40 ARPU means that Roku can take losses growing its audience and will be able to make up for those losses over time – and that’s exactly what Roku intends to do.
Player revenue is down 26% year-over-year. There are also losses on the player from $20.2 million in profit in the year-ago quarter to $97.4 million in losses in the current quarter. The company stated the following regarding these losses, “While Roku player unit sales were down year-over-year in Q3 2021 (following the extraordinary demand spike we saw in Q3 2020), unit sales were above pre-COVID Q3 2019 levels. Our player unit costs were impacted by the supply chain disruptions. However, we chose to insulate our consumers from these increased costs to prioritize account growth, resulting in Player gross margin decreasing to -15%. We view this Player gross margin erosion as temporary.”
Regardless of transitory issues with player revenue, the substantial increase in ARPU is helping the margins quite a bit with gross margins of 53.5% up from 47.6% in the year-ago quarter and adjusted EBITDA up 132% from $56.2 million to $130.1 million. The gross margins for next quarter are forecast to be weaker at 43% and adjusted EBITDA will be lower between $65 million to $75 million compared to $113 million in Q4 2020. The company explained that the lower EBITDA is from “investing in headcount, product development, and sales & marketing to drive future growth.”
Roku is guiding for quarterly revenue of $885 million to $900 million next quarter or 37% growth, up from $649.9 million in the year-ago quarter. The company is guiding for gross profit of $385 million, or 26% growth year-over-year. To reiterate, what the market doesn’t like is that margin decrease from giving players away at a loss.
Player sales is the main reason that Roku got clobbered. I don’t believe it was over active users as they were up 23% year-over-year, which in the face of declining player sales is quite impressive. It’s important to remember that earnings are relative and Q3 of last year saw very strong Covid tailwinds where users were buying hardware and staying home. Apple is the bellwether on this issue of the electronics and consumer hardware boom that is now tapering off.
Roku management emphasized the fact the growth is stronger this quarter than pre-Covid levels. “Meanwhile Roku player unit sales remained above pre-COVID levels and the average selling price decreased 7% year-over-year as we chose to insulate consumers from higher costs.” However, with player unit sales down 26% in the face of tough Covid comps, the market is concerned.
Logically, analysts and investors know they are not invested in Roku for the player yet the player can weigh on margins. The gross margin in this quarter was strong for Roku at of 53.5% but the guide of 43% is why there was a sell-off (in my opinion). Wall Street has always been worried about Roku’s margins relative to its player revenue.
Roku is a growth machine – comparatively speaking, it’s heads and shoulders above other ad-tech companies in terms of revenue size (roughly $900 million for Q4) with the strongest guide in our universe at 37%. This communicates how management views headwinds or tailwinds – both are an opportunity for a land grab. Here’s one way Roku is seizing the supply shortage: “As mentioned earlier, we chose to insulate our consumers from increased component and logistics costs, resulting in player gross margin decreasing to negative 15% in Q3.” In addition, the company plans to keep dongles stocked so that if smart TVs sell-out or are too expensive for consumers, they can upgrade their current television with a Roku player.
Here's a question from Laura Martin on the call that is important to understand why Roku could come out ahead in light of supply issues: “But if you're going to sell out of those [dongles] anyway because TVs are running out why would you cut price [of the dongles]? Why wouldn't you double price and still sell out and just and still add as many subs, but at a higher price because you've got dongles in stock when all the TVs smart TVs are running out of inventory at the retail level?”
Here was the answer: “So the supply chain — in the case of players we're not — our goal wasn't to not sell out. We are paying more for expedited shipping for — to get chips get in front of the line for chips. So the results of all that is our costs are going up. But we haven't sold out yet. We've just been paying for air shipping and we've been spending money to insulate the retailer and the end customer from pricing issues and supply issues. So far we've been doing that relatively effectively.”
The translation is that they can air ship boxes of dongles and keep them on the shelves because of their small size while TVs sell-out and/or are cost prohibitive for consumers with average of 42% increase in price. “That [TV sales] is down. The market is down 31% year-over-year in part because pricing on U.S. TVs on average is up 42%. And the U.S. TV market is actually down below pre-COVID levels in the corresponding period in 2019.”
When asked why they aren’t doubling the price given the supply constraints (i.e., and appeasing Wall Street on the margins), the answer is that they are actually going to take a hit on the players at about (15%) because they want to keep costs low, which in turn, will grow active accounts. This goes back to the $40 ARPU. Once someone is a Roku user, there are high switching costs and Roku’s advertising flywheel can make up for the loss on hardware.
Competitors:
What management said on the call exactly matches my understanding, which is that Roku has always been competing against Google and Amazon. There is no change to the story here. Here is what an analyst asked: “First, just coming back to TVs for a second. Obviously, there's some new kind of incremental competition in market between Google TCL, Amazon Fire TV branded TVs and kind of what Comcast is doing. It remains to be seen how successful that will be. But I guess the question is that that narrative is there and I'm curious what you guys think about to kind of offset that narrative?”, there's some new kind of incremental competition in market between Google TCL, Amazon Fire TV branded TVs and kind of what Comcast is doing. It remains to be seen how successful that will be. But I guess the question is that that narrative is there and I'm curious what you guys think about to kind of offset that narrative?”
Here is what management said, “But we've been competing very successfully with large companies, all the companies you mentioned since the beginning. And if you look at where we are in terms of that competition, we've gone from no market share in TVs to the number one licensed TV OS brand in the US with about a-third of all TVs sold now running the Roku operating system. We've built an incredibly strong brands around streaming. We've achieved large scale with lots I believe lots of scale growth to continue in front of us. Most of our growth is in front of us.
…So we've been competing very effectively. We take competition very seriously. I don't see any particular dramatic change in the competitive landscape, with all the stuff that's going on. It's just more of the same, and we will continue to compete in market share.”I don't see any particular dramatic change in the competitive landscape, with all the stuff that's going on. It's just more of the same, and we will continue to compete in market share.”
They also stated Amazon Prime was not up for negotiation at this time. “As for the — your Amazon question, we have renewal discussions with hundreds of partners each year. It's normal course of business. Our goal in these discussions is always to reach an agreement that's good for our partner, good for our customers, delivers a great user experience. Despite what you may have read, our Amazon agreement is not up for renewal or in negotiations at this time.”
We had a Member post on recent stats on the Wire from Conviva. Here is what Roku’s lead looks like:
Here is how Roku looks on a Global scale – Roku is green, Amazon is white and Samsung is yellow.
That picture is worth a thousand words as to why we are long Roku. Our thesis here is that Roku is the royal flush in terms of its positioning. You can view our webinar here.
Lawsuit with Google:
Who hasn’t Roku fought (and won against?) – Peacock, HBO Max and Fox have all threatened to remove access before eventually folding. Google is especially in a bad position here as they are asking for search data from Roku customers to be shared with them, which Roku does not do for other apps. They also want preferential treatment in search results. Keep in mind, that YouTube TV has been off Roku platform since April and Google created a workaround for YouTube TV to be accessed through the YouTube app. The percentages shown above help illustrate why Roku fights these apps – they are the top dog in this space.
The chances that Google goes up against a well-informed tech CEO in the court of law on data requests and preferential treatment with search results is very low. Roku can expose Google in ways that a Congress Vs. Zuckerberg was not able to as Congress does not know enough about data collection to handle Zuckerberg. Meanwhile, Roku representatives can easily describe the issues with Google. The discovery process will be enough for Google to fold, in my opinion, so let’s see if this prediction turns out to be true. It will also leave Google wide open to have an example made of the company in terms of Big Tech’s overreach. Google tends to play things safe in this regard as there’s a whole lot of data issues lurking beneath the surface; no reason to wake a monster.
CNBC and others are also publishing favorably for Roku, including viewing a 2019 email that shows Google did ask for preferential treatment: “But a 2019 email from Google to Roku that was viewed by CNBC shows Google did ask for preferential treatment for YouTube in Roku’s search results.” And, two members of Congress are already salivating at the idea of taking Big Tech to court.
Let’s Revisit the Thesis:
Now that we’ve dissected why Player revenue is struggling and why Google is small beans in the Connected TV world (and very unlikely to go to court), let’s revisit why we are here. What management said towards the end of the call sums it up: “I mean, if you think about the big picture, we believe all TV is going to be streamed. That means, there's one billion broadband households around the world. They're going to get all their TV through streaming. So, a pretty small percent of those are actually doing that todayThat means, there's one billion broadband households around the world. They're going to get all their TV through streaming. So, a pretty small percent of those are actually doing that today.”
Here's another way to frame the growth that is in front of Roku: “I think if you just think about the drivers of our ad business because some of your questions were about our ad business, the biggest driver of the ad business is not these kinds of details. It's the fact that if you look at TV time in the US today adults 18 to 49 spend 42% of their TV time streaming. But if you look at the amount of ad spend on streaming versus traditional TV, it's only 22% has moved to streaming. So there's this big gap still and that gap is starting to close, but has a long way to go. That — the rate of that closure because they will catch up eventually and the rate of all viewers moving to streaming those are the biggest drivers of our ad business which is a $60 billion opportunity.”It's the fact that if you look at TV time in the US today adults 18 to 49 spend 42% of their TV time streaming. But if you look at the amount of ad spend on streaming versus traditional TV, it's only 22% has moved to streaming. So there's this big gap still and that gap is starting to close, but has a long way to go. That — the rate of that closure because they will catch up eventually and the rate of all viewers moving to streaming those are the biggest drivers of our ad business which is a $60 billion opportunity.”
Magnite Earnings
Magnite has gone through a streak of acquisitions (2020-2021) following a large merger in the previous year (2019) and also a name change. The company uses pro-forma to indicate growth for the combined company of Magnite and SpotX. Ex-TAC refers to revenue that excludes acquisition costs. For our purposes, pro-forma is what the Street will be judging Magnite on moving forward.
If the acquisition comes together nicely then we can reasonably expect this growth to accelerate (assuming the whole is greater than the sum of its two parts). Usually in tech growth, acquisitions are strategic rather than accretive yet financial analysts are only able to model the accretive growth post-acquisition. Magnite’s strategy is to become the strongest supply-side player globally and to circumvent the need to figure out hardware (like Roku) by going direct to publishers.
SpotX was a strong company coming into the acquisition and it almost resembles more of a merger in that regard. This is why pro-forma growth is low in the first year at 26% in Q3 and CTV revenue is up 51% on a pro-forma basis. Compare this to 290% CTV growth if we look at only Magnite last year. SpotX brings about $30 million per quarter to Magnite and this is primarily CTV revenue.
Losses are widening on Magnite to a total of $24.3 million, up from $10.5 million. The adjusted EBITDA margin of 35% is based off ex-TAC revenue, so the comparison to last year pre-SpotX is not as meaningful. Operating cash flow was $34 million in Q3.
Magnite did state in normal conditions, they calculate the growth for CTV ads would have been about 40% year-over-year in the upcoming quarter. “From a comp perspective, if you were to remove political from 2020 Q4, our guide – so our guide straight up is about a 23% year-over-year growth in CTV. If you were to remove the political comp, you get to the low 30s in a year-over-year growth scenario. And if we look at the weakness that Michael mentioned in travel, in automotive, we believe that’s impacting us to perhaps $3 million to $4 million in CTV in Q4. And if you factor that in, we’re at about a 40% year-over-year growth rate.”
For Magnite, the company was more insulated because Android revenue helped make up for any loss on iOS revenue. The company estimates that their exposure is in the single digits and they are seeing a high opt-in rate (likely through the publishers). Magnite’s big risk comes at the end of 2023 when Google will end cookies on Chrome. In the meantime, Magnite plans to build solutions for “first-party publisher segments collected in a privacy compliant manner.” It’s something to monitor but not a concern at this time as it’s two years away.
Magnite’s earnings call is one of my favorites to listen to as the management is often asked industry questions and they give very insightful answers about what they think is going on in the ad industry. Here’s an example of where they were asked about Snap and Facebook.
Analyst: “Hi guys. Obviously, Snap and Facebook felt the brunt of Apple’s privacy changes. And I think you kind of alluded to this and talked about it before, but do you believe ad spend shifted out of social media in totality where you don’t play and into the open Internet or CTV as you talked about earlier? And does that – did that benefit results at all, or it sounds like this could be a long-term issue for social media players. So, is this a catalyst for the open Internet as we push forward?”
Answer: “Yes, Nick, this is Michael. Good question. I believe so long-term, yes. But there is a class of advertisers that really became expert at advertising in the mobile ecosystem and relied heavily upon IDFA that they are not going to be able to shift their spend overnight, right. They are just so used to that ecosystem, the attribution measurements. They have grown to trust their models are based upon from a conversion and lifetime value of the acquisition. All those things have to be reworked not unlike an advertiser that’s lived on Nielsen household ratings and linear TV having to get used to more of the measurement in CTV. And so – so, I think there is no question in the open web will be a beneficiary from that. I just think there will be an evolutionary – an evolution period where these marketers will have to treat their models, get comfortable with new methodology, new attribution and continue from there.”
Here's another explanation:
“We read a lot about the advertisers that have stalled their campaigns or stock spend or decreased spend because they are having a really challenging time working with attribution and customer acquisition costs, etcetera. Those guys are extraordinarily lower funnel. They are extremely sophisticated mobile advertisers. To think that they might jump from that world right into the world of CTV is probably a bit of a stretch. And those are the guys that spend $1,000 a day, $5,000 a day on the Facebook, Instagram, etcetera. But then there is a whole other slew of marketers that do social video advertising, that have much larger campaigns, that also take into account brand attribution, that I think are perfect. And our team is set up for that, Jason.”To think that they might jump from that world right into the world of CTV is probably a bit of a stretch. And those are the guys that spend $1,000 a day, $5,000 a day on the Facebook, Instagram, etcetera. But then there is a whole other slew of marketers that do social video advertising, that have much larger campaigns, that also take into account brand attribution, that I think are perfect. And our team is set up for that, Jason.”
Those quotes are actually bullish for Snap as what Magnite is communicating is that savvy mobile marketers need time to rework measurement and attribution but that doesn’t necessarily mean they will jump ship to CTV ads. They did indicate the push for CTV ads could come from smaller advertisers and we saw this with Roku’s Shopify announcement, as well.
· Regarding Atomera, this story centers around the announcement of the JDA. Until that happens, there’s not much to update. Knox is watching this one closely on technicals.
· Keep an eye on the forum for a Palantir update today/tomorrow and any others that would require a response on what the ER offered. If there’s a beat, we actually de-prioritize these as it means our thesis is playing out and we prefer to spend our time writing analysis on any misses.
We are looking to close Atomera and will look to get back in when the timing is better. We feel the message in the earnings call is that during supply shortages, things are moving slowly for Atomera. Meanwhile, small caps are looking like they could break out (follow Knox on the forum and on webinars) and we prefer to put our money elsewhere for now. Atomera could still move but we have to make these decisions to keep the portfolio at a reasonable size.
There’s a chance we re-enter Vuzix as small caps are starting to break out. Knox might be seeing a setup he wants to take and the company had some good quarters in the past. Note: this is likely good news for many small caps, not only the ones we own.
Confluent is a strong company. We stepped aside until the lockup expires as a matter of discipline. Look for us to put MongoDB in the LTBH portfolio and Confluent at some point, as well. We are encouraged by cloud results so far this earnings season (so far, so good).
Palantir Analysis:
We break down Palantir’s product below and we believe the Apollo layer is especially interesting, competitively speaking. We also point out that government contracts will likely boost the company’s revenue in the near term. The Obama Administration used Palantir for many government projects and we believe the Biden Administration is a tailwind for the company in the near-term. With a company that is two-thirds deal value from the government, this piece cannot be ignored.
The company has as many risks as opportunities. We go through those risks below, mainly the price of the product, the unusually high stock based compensation, widespread ethical concerns (for 10+ years), and more agile AI/ML competitors sprouting up to compete for commercialized accounts. Due to these risks, we may not hold for the 3-5 year time frame that we typically target, rather are entering as a LTBH for the 6-month to 1-year tailwinds that we are expecting from increased government spending. This is distinguished from momentum positions that are often higher beta and/or moving in price. In this case, we think Palantir being off 50% from its all-time high of 39.00 does not reflect the current tailwinds from the government segment. We are encouraged by the commercial growth, as well, but it’s the government spending in the near-term that could cause a material change to the story. The upcoming earnings report will tell us more.
Palantir has two platforms: Gotham and Foundry. There is a layer between the two platforms and applications called Apollo. The Apollo layer is where innovation has been rapidly occurring and helps contribute to Palantir’s competitive edge (more on this below).
Gotham and Foundry create a unified data set for actionable insights across industries such as manufacturing, product development, and customer experience. The data that Palantir gets is from the customer database although the company may use other data sets for government customers, such as scraping social media or other publicly available information on the web. The traditional deployment includes hosting Palantir’s servers in a customer’s data center.
The difference between Palantir and competitors, such as Tableau, Alteryx or Cloudera is that Palantir is able to answer questions a model cannot answer. Traditional business intelligence companies require a complete data set whereas Palantir is able to tackle situations where there is not a complete data set.
Palantir Gotham was the company’s first platform, built for government operatives in defense and intelligence sectors. The platform enables users to identify patterns hidden deep within datasets using semantic, temporal, geospatial and full-text analysis.
The Graph product allows data to be seen as nodes and edges to visualize and plot characteristics in a logical manner.
Map brings geospatial capabilities to track geo-located objects and events and to create heatmaps for the density of the objects.
Object Explorer is powered by the Horizon in-memory database, which competes with Apache Spark for letting users query billions of objects. The data provides further analysis for Map and Graph data.
Browser: This enables search queries for investigations and surfaces information, runs relevant searches, displays key data points and answers analytical questions.
Palantir Foundry is the commercial offering and has four layers of tooling: Foundry Core, Data Foundation, Ontology and Workflows.
This four-step process does the following:
brings volumes of data into one place,
transforms the data into a format that analysts can work with and enables validation in a number of programming languages
the “ontology layer” allows datasets to be turned into real-world concepts
workflows is where it all comes together in an integrated environment for object exploration, point-and-click top down analysis, code authoring, time series analysis, data science and application development. When a user has a question, it answers it using all layers and tools available.
Palantir describes Gotham and Foundry as the “ability to construct a model of the real world from countless data points.” Unlike a SQL database, natural language is used to query data and return results in real-time rather than through strings.
Apollo is the Linchpin:
The company has a third platform or layer called Apollo and also Apollo for Edge AI. This product provides continuous delivery and an automated configuration layer that allows Foundry and Gotham to work across all cloud environments and also in places where there is little to no connectivity. On top of Palantir being able to form conclusions from incomplete data sets, the company can also deploy its platform and applications anywhere.
Palantir’s marketing team says Apollo “goes where no SaaS has gone before” because it allows what is done on-premise to also run on multi-cloud SaaS with code that is deployed across all environments rather than written for a specific environment. The orchestration allows for on-hardware AI models to consume real-time data from sensors, radio, geo-data and time series data. Where bandwidth is not an issue, the company transmits all raw inputs and enriched metadata from models. Where there are constraints, the platform transmits meta-data only which can reduce bitrate by 20X. At times, a simulated environment can be created with Palantir’s Edge AI from historical data to help train AI models. The simulated environment is then deployed at the edge. With Apollo, Palantir’s centralized operations team is capable of 41,000 updates per week at no additional cost.
Apollo Edge AI links together satellites to lower latency for the AI-enabled decision chain by orchestrating up to 237 satellites in what the company is calling a “meta-constellation.” This meta-constellation optimizes hundreds of orbital sensors and AI models to power Palantir’s models. One example they provide is tracking submarines that pose a threat to the U.S. and its allies. In this case, submarines are being tracked on a granular level in areas where there is no bandwidth available. These are the kinds of obstacles that Palantir overcomes while being independent of one cloud environment, such as AWS or Azure.
Financials:
Palantir is growing its annual revenue of roughly $1 billion by 50% for estimates of $1.5 billion in 2021. This looks like it will be accomplished with the last two quarters at revenue growth of 49% year-over-year growth. Current estimates for Palantir in the upcoming quarter are at $386.53 million, or growth of 33.5%. To me, these estimates seem low considering the commercial growth the company has been posting. On top of revenue > $1 billion and growth > 40%, Palantir is free cash flow positive with a 13% adjusted free cash flow margin and adjusted EPS of $0.04.
The main metric for Palantir is commercial revenue, which has accelerated nicely over the past few quarters. In the last quarter, commercial revenue grew 90% year-over-year. The company is also adding commercial customers faster than overall customers at 32% compared to 13% for total customers. In the quarter ending in March, the company reported revenue growth of 72% year-over-year. This was slightly lower than government revenue growth of 83% YoY.
The company also grew total contract value booked from $337 million to $925 million, although this is a mix of both government and commercial contracts. According to the fine print, the maximum potential revenue from commercial contracts is $348 million and an additional $195 million in commercial contracts that are subject to negotiation and approval.
The deal value also increased 63% to $3.4 billion, however, of this $428 million comes from commercial contracts and $195 million comes from commercial contracts currently under negotiation. Therefore, the majority of the deal value increase came from the government.
For FY 2021, the company plans to double its adjusted free cash flow in the upcoming quarter from $150 million to $300 million.
Stock Based Compensation:
Palantir has some of the highest rates of SBC in the cloud universe. Over the last twelve months, SBC was 114% of sales, which is well above the peer median of ~18%. The issuance of SBC is dilutive to shareholders and can weigh on the share price in the near term. However, Palantir recently completed its IPO, which is typically a period of outsized stock-based compensation.
Looking forward, Palantir’s rate of SBC will likely normalize to a more sustainable rate, which will lessen the impact of dilution and should benefit shareholders going forward.
A key benefit of high SBC is that employees become owners in the company and have a vested interest in the company’s success, which can even help reduce turnover and improve productivity. The biggest concern Bradley sees with high rates of SBC is if the SBC is repurchased via stock buybacks but is still excluded from adjusted EBITDA and earnings. This accounting trick can cosmetically improve the presentation of profitability by excluding payroll expense from non-GAAP metrics. However, Palantir does not appear to be playing these games, as it has not repurchased any stock during the year.
Catalysts:
Some real-world uses for Palantir include Hershey’s using the software for global food distribution and to correlate weather patterns with snack consumption. Chase Bank and other financial firms have used Palantir’s data analysis to identify troubled properties and ensure employees are not committing fraud (and in turn, the management team was actually spied on instead).
Pharmaceutical companies use Palantir to expedite the development of new drugs – this being a substantial use case during Covid and partly why Palantir’s revenue has accelerated. In the last earnings report, Palantir discussed companies leveraging Palantir’s software for R&D and manufacturing to accelerate development. The software helps health care data be shared to share trial data.
Utility companies use Palantir to monitor equipment, such as to monitor equipment in mining shafts or for grid management and safety. The powerlines from PG&E in California created wildfires and experience ongoing power outages during heavy winds. PG&E partnered with Palantir in early 2021 to help assess where the most danger is for power shutoffs and for wildfire risk assessments.
Climate change initiatives coming from the government will also be a tailwind for Palantir as the company’s software is used to help companies de-carbonize and achieve low carbon footprints. The more spent here, the more Palantir will see additional tailwinds.
DataRobot is a popular company used for unifying data for AI and they are partnered with Palantir to help forecast demand.
As stated, Palantir was first hired by Obama for border patrol with the New York Times reporting “Palantir’s technology was used extensively by the Obama Administration.” It is not clear as to whether the Trump Administration used Palantir or if the agencies, such as the FBI and CIA did during the years the Trump Administration was in Office. In other words, I am not sure if Palantir is bipartisan or not but my understanding is the company saw more government contracts during Obama and now Biden. We also saw Biden place a former Palantir advisor as the director of national intelligence. The DNC is headquartered in Denver and the company recently moved to this city. Alex Karp attempted to state sensational reasons for this move, which I called out as simply creating headlines. I believe the move was strategic for Palantir to be closer to the money.
Risks:
The closest competitor for Palantir is Semantic AI, which supplies graph-based analytical platforms to the DoD and other government agencies. There will likely be more competitors in the near future as the AI/ML market is built out. For instance, there is energy-specific software such as Stem that uses AI software to optimize energy resources and battery usage by using algorithms to issue forecasts that then work across the grid, batteries and solar for optimal output. Stem claims to have taken over 100 energy storage systems that were previously managed by competitors and is also used across Big Tech, such as Facebook, Amazon, Apple and Home Depot. In this case, one could argue Stem serves the commercial market whereas Palantir is more suited for larger utility companies due to its government-sized solution. Essentially, the risk is that Palantir could be “too much product” for commercialized companies that prefer a simple solution. You can read our analysis regarding Stem here.
Tiberius is a database used for administering the Covid vaccine. USA Today reported complaints from a few healthcare agencies that Tiberius was often wrong and did not improve results compared to their own in-house databases.
Palantir greatly centralizes datasets and AI/ML — which is a risk. You’ve likely read my analysis on the Blockchain is Going to Eat the Internet and why decentralization is important. Using Palantir for defense is one thing, but now that Palantir is beginning to move into other industries, the blurring of the lines as to where the government ends and the free market begins is problematic with a company like Palantir. Palantir’s greater loyalty will be with the government (it’s biggest customer) yet their software is now inside company databases. The United States tends to prefer a separation across government bodies whether it’s church/state or state/federal or judicial/executive/legislative, when possible. What Palantir is proposing is that a heavily government-funded company be the middleman.
What affect could this have? Already, Palantir has been used to hunt down illegal immigrants and to enter their homes for arrests. This article is worth a read for more information. Uber has been in a string of never-ending lawsuits over the independent contractor/employee debates – another human rights issue that a tech company faced. These lawsuits threaten Uber’s business model, and even after getting the measure on a ballot which passed in California, the class action lawsuits are still ongoing after the State of California decided to sue the company. We predicted this would be troublesome long-term for Uber as part of our bear thesis at the time of IPO. As Palantir moves outside the government, I expect we could see some States and non-profits fight the company on the use of its software. There is a history of non-profits, such as Amnesty International, calling out Palantir on how the software is used in terms of targeting specific individuals. The bigger Palantir gets, the more the public and critics will see how powerful (and invasive) the software can be. As of now, Palantir has chosen to target illegal immigrants who can’t bring a class action lawsuit – hence non-profits stepping in. If the company were to target United States citizens, I would fully expect lawsuits to pop up.
To help illustrate, the week Palantir went public, Hootsuite stated the company would terminate its ICE contract due to disagreements within the company. The CEO of Hootsuite tweeted: “We typically do not make public facing statements about specific customers or contracts. However, due to the attention around this particular case we can confirm that Hootsuite has decided not to do business with the U.S. Immigration and Customs Enforcement.” Tech companies often see employees engage in protests when a company contracts with the government on AI-driven war missions and privacy issues.
In the past, Google ended a contract with the Pentagon when employees protested using AI for lethal purposes. Karp became controversial and challenged Google on this decision, saying it was a “loser” position. Palantir could become subject to competing for talent with companies that are more privacy-compliant or viewed as being more ethical. Here’s an example about how they describe their hiring process: “We spend time thinking about exactly what gamma radiation your incoming Bruce Banner needs to turn into the Incredible Hulk. And then we irradiate them.” The hyperbolic description of using “gamma radiation” is likely just the stock-based compensation.
Conclusion:
The stars (and satellites) are aligning for Palantir, and with government spending, it has the ingredients to become a stock market darling if the revenue accelerates. The product is often framed as captivating and the company will likely sell Wall Street on commercial growth. Regardless, the ethical issues can mire the company long-term, and at its core, Palantir is still a government contractor. We are more likely to be 3-10 year bulls for decentralized blockchain companies that handle data in privacy compliant ways over a heavily centralized company. However, for the sake of the current tailwinds, we have entered the stock and added it to our LTBH portfolio.