April Stock Tip: Our Netflix Buy/Sell Plan

Netflix is coming into a nail biter of a report. The ad tier will be under pressure in terms of how it’s performed in various regions when the company rolled it out in January. There is a report from Bloomberg that Netflix added 1 million in their first two months. An analyst noted below is expecting 1.75M total for the quarter. Overall, the goal is to reach 13M by Q3 2023.

Fundamentally, Netflix has become a different stock over the past year. In addition to the new advertising tier, which we hope is a catalyst, we own Netflix due to the underlying fundamental strength. According to analyst estimates, Netflix bottomed on revenue growth last quarter with noticeable improvement in H2 2023. The company has been transparent on how they will meet guidance on margins, including free cash flow.

The EPS is also rebounding with analyst consensus showing a 100% increase on EPS over the next two years. This is subject to change, but helps complete the picture as to why we’ve been covering Netflix closely.

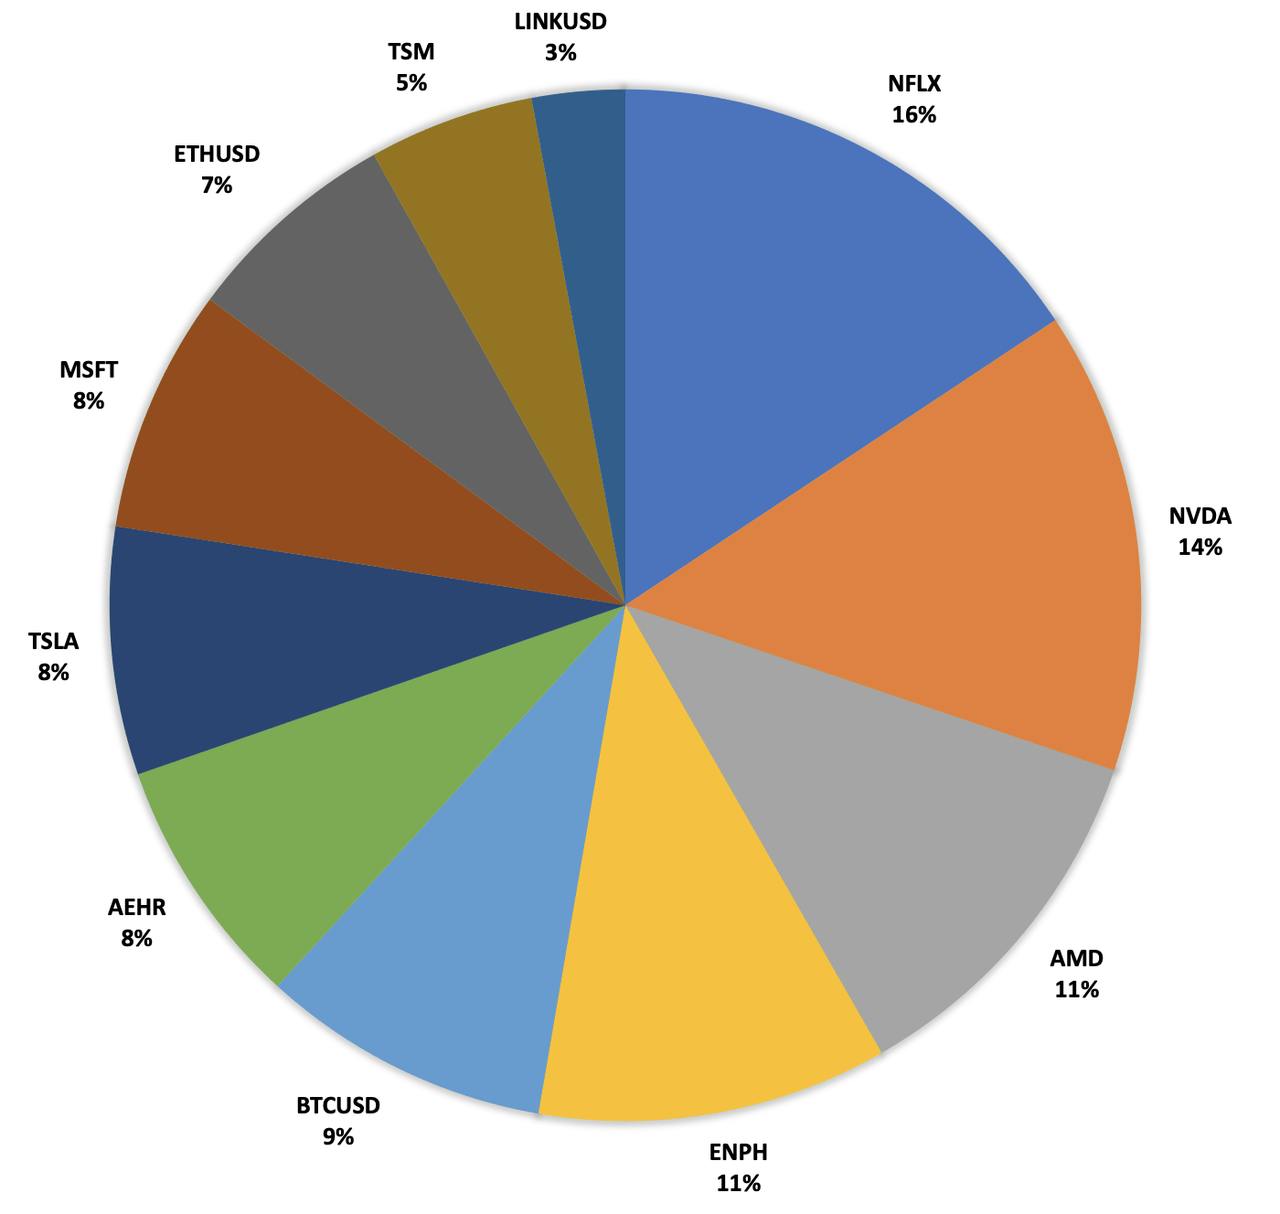
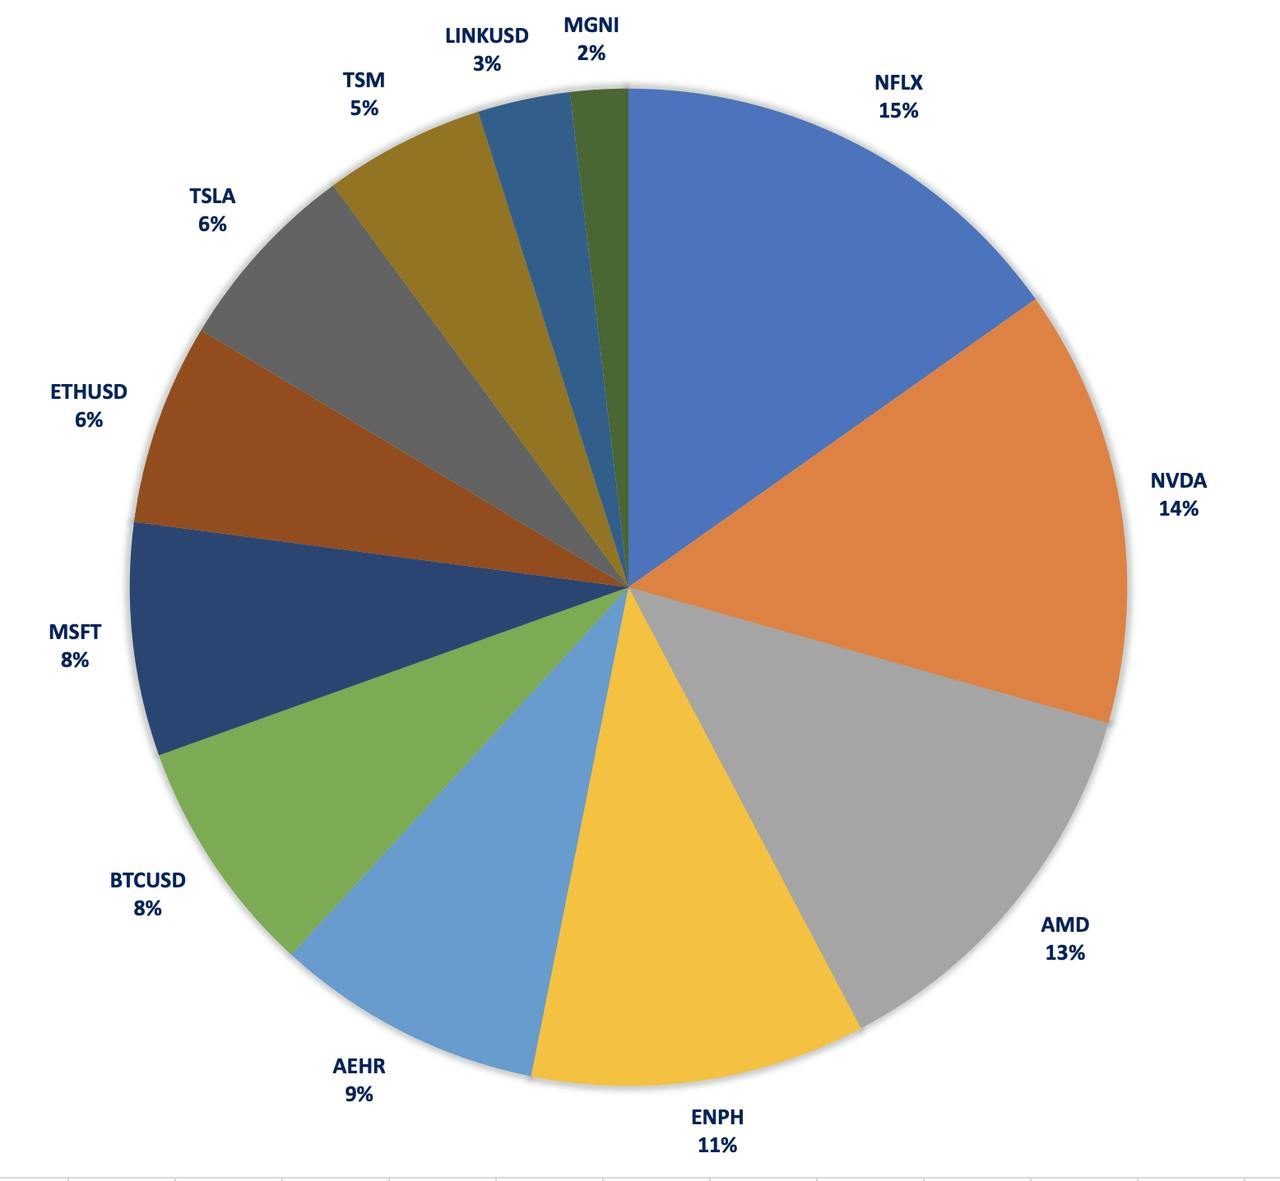
Netflix is our largest position right now, thus we guard it closely. Our service is setup to show our Members what it looks like to realistically manage a portfolio. We do not provide an endless pipeline of stock tips. We carefully build positions and we carefully take gains, at times. We will gladly talk about the same stock dozens of times if it’s going to make us money.

Those who are addicted to a constant stream of information, and who are addicted to new stock tips, will get hurt in 2023. There simply aren’t that many great tech stocks in the current macro environment. If there’s anything you get from our service, I hope it’s that one important take away. 2023 is the year to hold fewer stocks, and to know them well.

Active management helps to participate in the gains. For example, to illustrate — Netflix is down (42%) from Jan 1st, 2022 and it’s up 61% from October 11th. This is why active management is well worth our time.

Buy Plan/Sell Plan – April Stock Tip:

By Knox Ridley

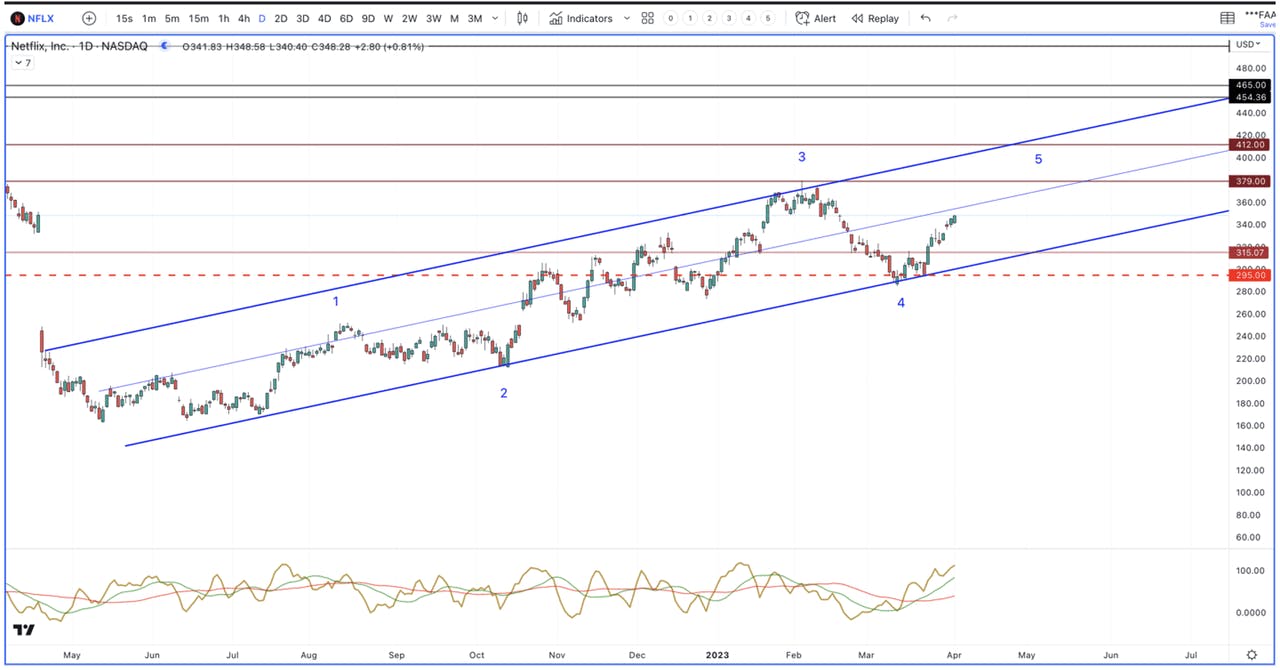
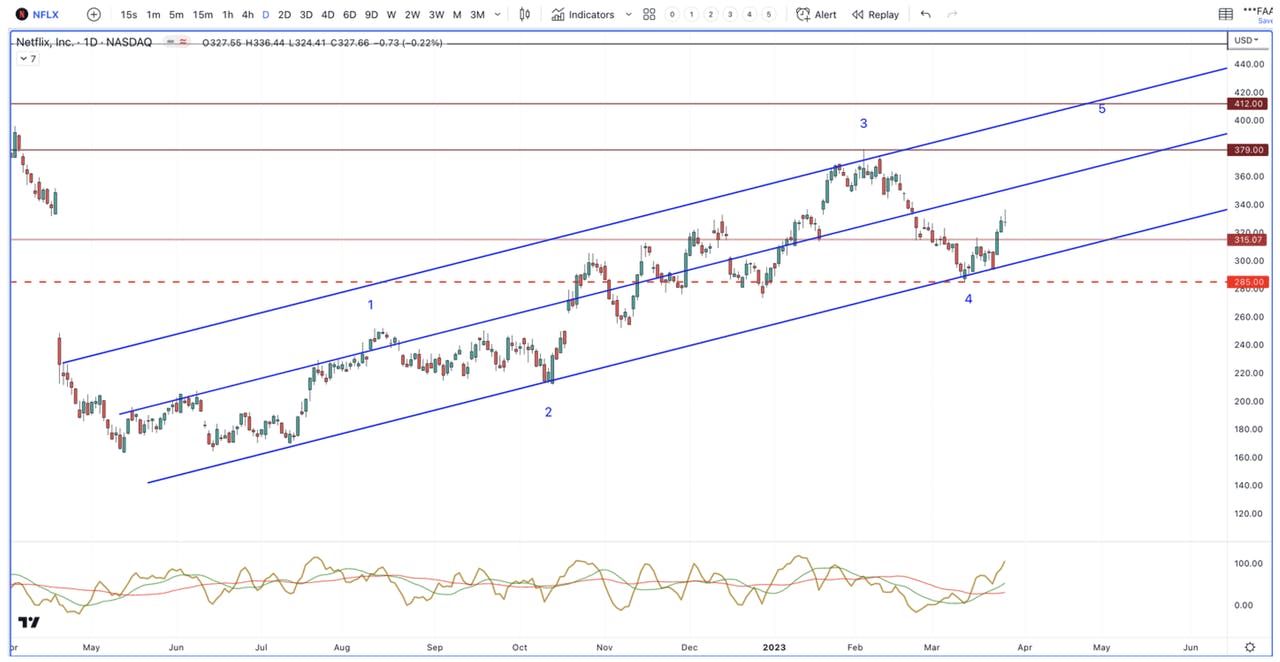
Between $379-$420, Netflix will be in the high-risk zone. Do not be shocked to see us cut NFLX in half if we get into that zone. If we do get there, this will be a 20% to 30% gain from when we recommended the stock for Essentials and a gain of 75% gain from our first entry in August on the Pro/Advanced side. Normally, our Essentials plan would have participated in the higher gains, but we had not launched the service yet. Our Essentials Newsletter went live around Thanksgiving.
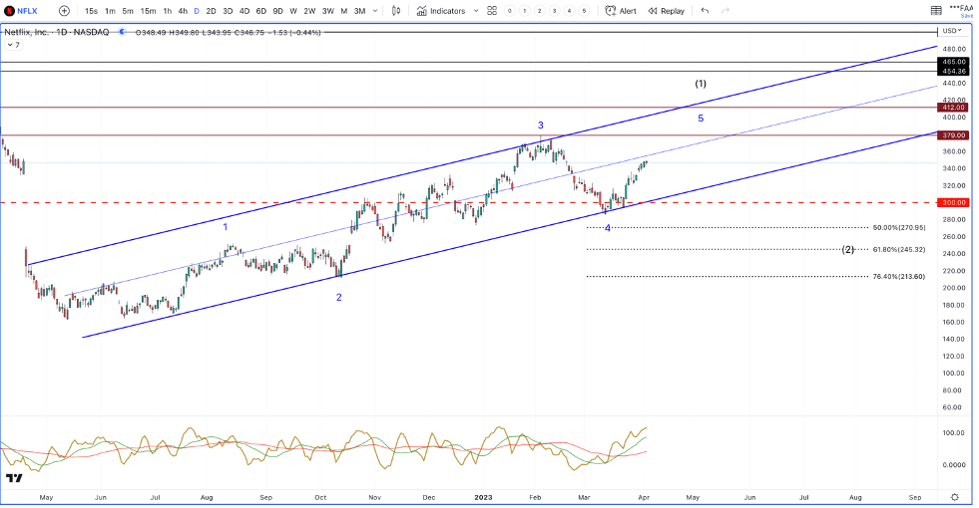
Netflix is working on the final 5th wave of a very large degree pattern. It bottomed in May of 2022, so it has taken this pattern almost a full year to complete. Once NFLX gets into the $379-$412 region, the pattern will have met the minimum requirements for completion. We would consider that region to come with heightened risk. In fact, we expect to reduce our position substantially if we get to that price target. This will remain our primary thesis as long as price holds the $300 region. For long-term buyers, we believe the time to accumulate is not now.

What we are watching for:

  • There is outsized pressure on the advertising tier given the global rollout in test regions. Although password sharing was cutoff mid-quarter, Wall Street will want to see evidence this strategic move will be accretive. Per channel checks noted below, the Street is expecting 1.75M subscribers from the ad tier, although notably, Netflix no longer reports subscriber numbers.

    Per Forbes/Bloomberg: “After a slow start Netflix ad tier has been gaining traction with U.S. subscribers. After analyzing their internal data, BloombergBloomberg reported in its first two months, Netflix had one million active users. Before its launch, Netflix had projected 1.1 million by year end 2022 increasing to 13.3 million by the third quarter 2023. Industry analysts project Netflix could eventually wind up with 30 million U.S. subscribers on its ad supported tier. The U.S. is one of the 12 markets where Netflix is now selling ads. At its most recent earnings report Netflix had 74 million total U.S. subscribers with 231 million worldwide.”

  • Netflix has been cutting costs this quarter. We want to see the company maintain bottom line strength. For Netflix, sometimes misses on the bottom line are due to FX headwinds, and other times they’re due to lumpy content costs.
  • Q1 is expected to be a weaker quarter for the year on operating margins with management stating “For Q1’23, we expect operating margin to be down year over year (20% vs. 25%) due primarily to the timing of content spend.” This would be 18-20% operating margin, down from a 25% margin in the year ago quarter.
  • Social media has a hard time dissecting the lumpiness in the new macro. Nvidia was a target for shorts because of this, what they didn’t realize is that NVDA had bottomed fundamentally in the prior quarter. In a nutshell, if the bottom-line miss is transitory – FX headwinds or lumpy content costs – the market will be more forgiving.
  • If Netflix’s management has guided correctly, the company has bottomed. I explain this more below (this depends on how management guided). Notably, this is the first quarter without Reed Hastings as CEO although the C-suite team has been working with Hastings for years on this transition.
  • The guide I’m referring to from the last earnings call is this: “So, that all lends itself to our focus, which is kind of healthy growing double-digit revenue growth and accelerating that revenue growth throughout the year, expanding our – both our absolute profit and profit margin and then growing positive free cash flow.

Financials:

Per analyst consensus, the expected acceleration is the following:

Estimated Revenue & Estimated EPS:

  • Q4: 1.9% Actual
  • Q1E: 3.86%
  • Q2E: 6.37%
  • Q3E: 10.57%
  • Q4E: 13.5%

On a fiscal year basis, Netflix is expected to report:

  • FY2022 Actual: 6.46%
  • FY2023E: 8.5%
  • FY2024E: 11.9%

This is not a hypergrowth profile, rather what the market will want to see is quality growth. For our purposes, this can be roughly defined as an acceleration in growth that doesn’t come at the expense of the bottom line.

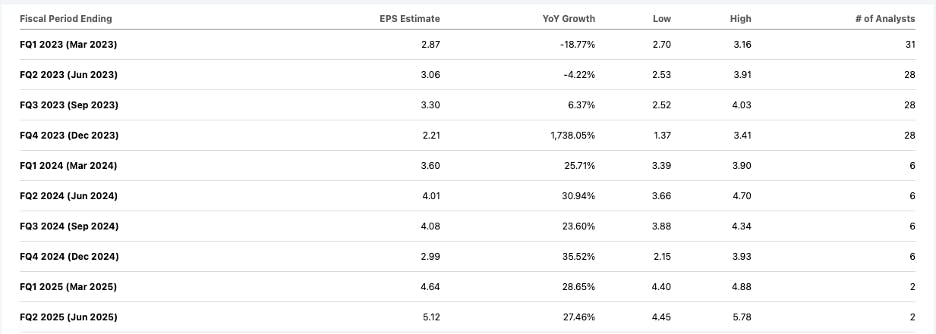
For EPS, Netflix is expected to report:

  • Q3 Actual: $2.16 EPS
  • Q4 Actual: $0.51 EPS
  • Q1E: $2.87 EPS
  • Q2E: $3.06 EPS
  • Q3E: $3.30 EPS

I included Q3 since Q4 is often much lower than the other quarters. Although the revenue acceleration may be mild for growth investors, the bottom line is expected to grow well through FY2025. There’s a lot that has to happen between now and FY2025, but it’s good to see analysts have confidence that Netflix could double its bottom line over the next two years. 

Q3 Actual was $2.16 EPS and consensus from six analysts is EPS of $4.08 in Q3 Sep 2024.
Gentle reminder that FX can result in an advertised EPS number being very low/big miss. Last quarter, the $1.15 EPS was reported as $0.12. Per the write-up: “

“FX can be a lot to unpack but I believe the market is taking into account the $462 million FX remeasurement and seeing this as $1.15 EPS rather than $0.12 EPS. This is why we want to do proper due diligence (and steer clear of social media for investment research — that's an understatement) as there was some confusion over this that negatively spiraled on Twitter.”

Margins:

Regarding margins, this is what the management said in full: “We have been targeting a FY23 operating margin of 19%-20% based on F/X rates at the beginning of 2022. We now expect to deliver roughly 21%-22% operating margin on this basis (above the 19%-20% range). Rolling forward to F/X rates as of January 1, 2023, this translates into a FY23 operating margin target of 18%-20%. For Q1’23, we expect operating margin to be down year over year (20% vs. 25%) due primarily to the timing of content spend.”

  • Last quarter, Netflix had a gross margin of 31%
  • The operating margin guide works out to 18% to 20% margin, down from 25% in the year ago quarter.
  • Due to FX headwinds, the FY2023 operating margin will be in the 18% to 20% range. The market has been forgiving FX headwinds, partly due to a global company being desirable for diversification while the United States see a weak consumer.
  • The net margin can be low at first glance due to FX headwinds. It was 20% in the year ago quarter yet was 1% with FX last quarter. Without FX, it was 6.5% last quarter. This included a $462M non-cash FX remeasurement.

Cash Flow:

Cash flow for FY2022 came in at $1.6B and management guided for $3 billion in FY2023. Last year, Q1 and Q3 were very strong on FCF and Q2 and Q4 were weaker. This goes back to lumpy content spend, so investors should be prepared for this and not expect a linear path to the $3 billion.

“But that’s what plays through and then also plays through that cash flow generation that you see, where we believe with all those dynamics and managing at about the same level of cash content spend that we will have more than $3 billion, at least $3 billion of free cash flow in the year.

The $1.6B in FY2022 compares to ($158) million for FY2021. Overall, this is a very different Netflix today as the company lost over ($3) billion in free cash flow in 2019.

The in-house moderator also hinted toward “$4 billion plus in 2024” and management did not correct her. We would need an official guide but I have this number penciled in for next year. 

The company’s gross debt is $14.3 billion and the company’s net debt is $8.37 billion or 1.3X LTM EBITDA with $6.05 billion in cash. You’ll notice the LTM slightly ticked up from 1.2X LTM last quarter. To reiterate, this is because Q4 tends to be weaker than other quarters. With the $3B in FCF expected in FY2023, Netflix can get the LTM below 1X. 

The gross debt will still outweigh cash for some time. The company has stated investors can continue to expect $10 to $15 billion in gross debt. According to the last 10-Q, the company’s next payment of $400 million is due in October of 2024.

It’s understandable if you’re scratching your head at Netflix’s debt. This is part and parcel with Netflix’s business model. The market has come to accept this over the past decade-plus. You’ll have to decide for yourself if the business model works for your risk profile.

Noteworthy:

The upfront season starts in May. We covered this in December when we said:

The Second Chess Move is called The Upfront Season 

Every year, advertisers and agencies negotiate and sign year-long deals with TV networks as well as connected TV platforms to commit to spend an agreed amount on ads. They call this the upfront season. Last year, NBCUniversal clocked $7 billion in the upfront season and Roku grew it’s upfront spend from$500 million to $1 billion.

The 2023-2024 upfront season will take place in the late Spring and early summer of 2023.”

Reed Hastings has stepped down. Ted Sarandos and Greg Peters are Co-CEOs. Ted Sarandos became Co-CEO in July of 2020.

The revenue drivers being closely watched are the paid sharing (cutoff passwords) and the ad tier. Management stated they are expecting modest growth for Q1 on paid net adds for subscribers and a larger net add quarter in Q2. Seasonally, Q2 is a softer quarter for Netflix. Regardless, Netflix is no longer going to report on net adds. Instead, they expect analysts and investors to rely on revenue growth. 

“As discussed in previous letters, we are increasingly focused on revenue as our primary top line metric. This will become particularly important heading into 2023 as we develop new revenue streams like advertising and paid sharing, where membership is just one component of our revenue growth. So, starting with our Q4’22 letter in January of 2023, we’ll continue to provide guidance for revenue, operating income, operating margin, net income, EPS and fully diluted shares outstanding for the following quarter, but not paid membership. Similar to our regional membership disclosure, we’ll continue to report our global and regional membership each quarter as part of our earnings release.” 

Recent Headlines:

Per Bloomberg, Netflix’s ad tier reached 1M MAU after the second month. According to the report: “Most of the people signing up for the ad tier are new customers or lapsed customers, not people who immediately changed plans. The ad tier now accounts for about 20% of new sign-ups in the US, per Antenna.”

Also, per the Bloomberg report: “Netflix already has 74 million customers in the US, which means it doesn’t have that many potential new viewers. Analysts estimate the ad tier could bring in between 15 million and 30 million customers in the US, but that won’t be right away.”

My note: If it materializes, that’s some serious growth for a company that had plateaued. Reference above where management told advertisers to expect 1.75M by Q1 and Bloomberg reported up to 13 million by Q3 2023.

In February, Netflix tested lowering prices in a few regions. Per Reuters, “the price cuts took place in some countries in the Middle East, sub-Saharan African, Latin America and Asia.” See analyst note below where this was successful in India last December.

The company is scaling back on costs by restructuring its film group. Per Reuters, “Netflix will combine its small and mid-sized picture production units, cut a few jobs, scale back its output to ensure high quality titles and centralize decision-making.”

Netflix offers a video game service on smartphones and tablets, and is now bringing the video game service to televisions. Per Bloomberg: “Code hidden within Netflix’s app includes references to games played on TVs, signaling that such a plan is in motion. The code also mentions using phones as video-game controllers.” Per the report, the goal would be to attract and retain more subscribers.

Per TechCrunch, Netflix has 40 games ready to launch this year and 70 games in development.

What Analysts are Saying/Channel Checks:

“Netflix has told advertisers in the past 10 days that new sign-ups for the tier with ads had doubled in January over December, though Netflix didn't tell advertisers how many sign-ups that amounted to, people familiar with the matter told The Information's Sahil Patel. Last fall, when first pitching the ad offering, the company had told advertisers it expected the tier would draw 1.75M subscribers by the end of the first quarter, the equivalent of just 2.4% of Netflix's North American subscriber base at the end of December, the report noted.”

“Guggenheim analyst Michael Morris notes that over the past week, there have been several reports regarding Netflix pricing cuts across various markets in Eastern Europe, Latin America, and Southeast Asia, which is not the first time the company has changed prices. In December 2021, Netflix cut prices in India as it faced competition from other streaming services. Last week, co-CEO Ted Sarandos highlighted the company's success in India over the past year with viewership up 30% in 2022 and revenue increasing 25%, Guggenheim says. The firm believes Netflix is looking to extend this strategy across similar markets around the world. Guggenheim has a Buy rating on the shares.” 

“Oppenheimer analyst Jason Helfstein thinks Netflix shares are at attractive levels after dropping 22% from the post-Q4 highs on fears around higher churn from enforcing password sharing and a slower advertising launch. The company's Q1 engagement is trending weaker than the previous two quarters, but in line with Netflix's previous six-quarter average, the analyst tells investors in a research note.” 

“Citi analyst Jason Bazinet raised the firm's price target on Netflix to $400 from $395 and keeps a Buy rating on the shares. Netflix recently cut prices by 50% across 100 smaller markets, which represent 6% of its subscribers, the analyst tells investors in a research note. The firm believes "such dramatic" price reductions across so many markets "confused the Street." Citi thinks the price cuts are linked to password sharing enforcement and could boost Netflix's aggregate revenue by 1%. It says the "far more interesting question" is what Netflix will do in the 90 markets that do not have an advertising tier and have not received a large price cut. Netflix can either not enforce password sharing rules, launch an ad tier, or expand the price cuts, according to Citi. The firm updated its model to reflect the price reductions and updated current rates.” 

“JPMorgan says there has been "considerable early pushback" around Netflix's Paid Sharing launches in select international markets, which is driving greater concerns around near-term churn. Apptopia downloads data suggests increased volatility across all four Paid Sharing markets since the rollout, and the headlines may also be impacting other markets where Paid Sharing has not yet been rolled out, including the U.S., the analyst tells investors in a research note. The firm sees potential risk to Netflix's projection for more net adds in Q2 than Q1. However, JPMorgan expects Netflix to continue down the path of transitioning users away from widespread account sharing. Ultimately it expects Netflix to generate more revenue through the combination of extra members and new standalone accounts. The firm recognizes the near-term "noise" but keeps an Overweight rating on the shares with a $390 price target.”

Deep dives, trade alerts, a forum and weekly webinars on the I/O Fund portfolio are offered on our premium service, you can find out more information here.here.
Amdocs (DOX) – Software Downstream from Big Telecom Capex

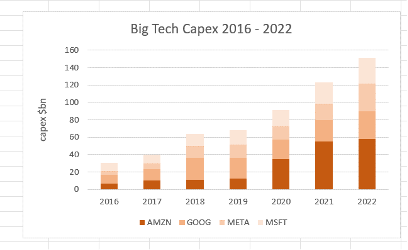
In February, we wrote about Big Tech capex shifting it’s spend to AI-related infrastructure. We've been tracking Big Tech capex since 2021 as a proxy for our semiconductor positions. Although the Big 3 are expected to be flat-ish YoY on absolute spend, these companies (plus Meta), are expected to increase AI investments in 2023. 

Below is a chart of the yearly Big Tech capex spending from 2016 to 2022.

During Covid, Big Tech capex was needed to support the surge in enterprises that migrated to public cloud and hybrid cloud architectures overnight. As offices closed, companies scrambled to provide work-from-home environments supported by the Big 3 cloud hyperscalers, plus these cloud environments directly funneled to security, operations, marketing and sales tech stacks offered by the hyperscalers.

In addition to this, hyperscalers offered instant scale and elasticity for consumer applications. Whether it was streaming content, online shopping and e-commerce sites or gaming, hyperscalers were ramping capex to support this surge in demand. 

Fast forward, and today, the capex spending continues to support the AI/ML ambitions for Big Tech. For example, Microsoft had to use tens of thousands  of Nvidia’s A100 graphic chips to power its AI.

This demand has had a domino effect and spurred capex in other sectors. 

Big Tech meet Big Tele: Can You Hear Me Now?

For example, this consumer demand has been an important driver behind capex Big Telecom (“Big Tele”). Big Tele refers to the large established US telecom companies AT&T, T-Mobile and Verizon. Together they have over 90% of the US market. AT&T has the highest at about 45%.

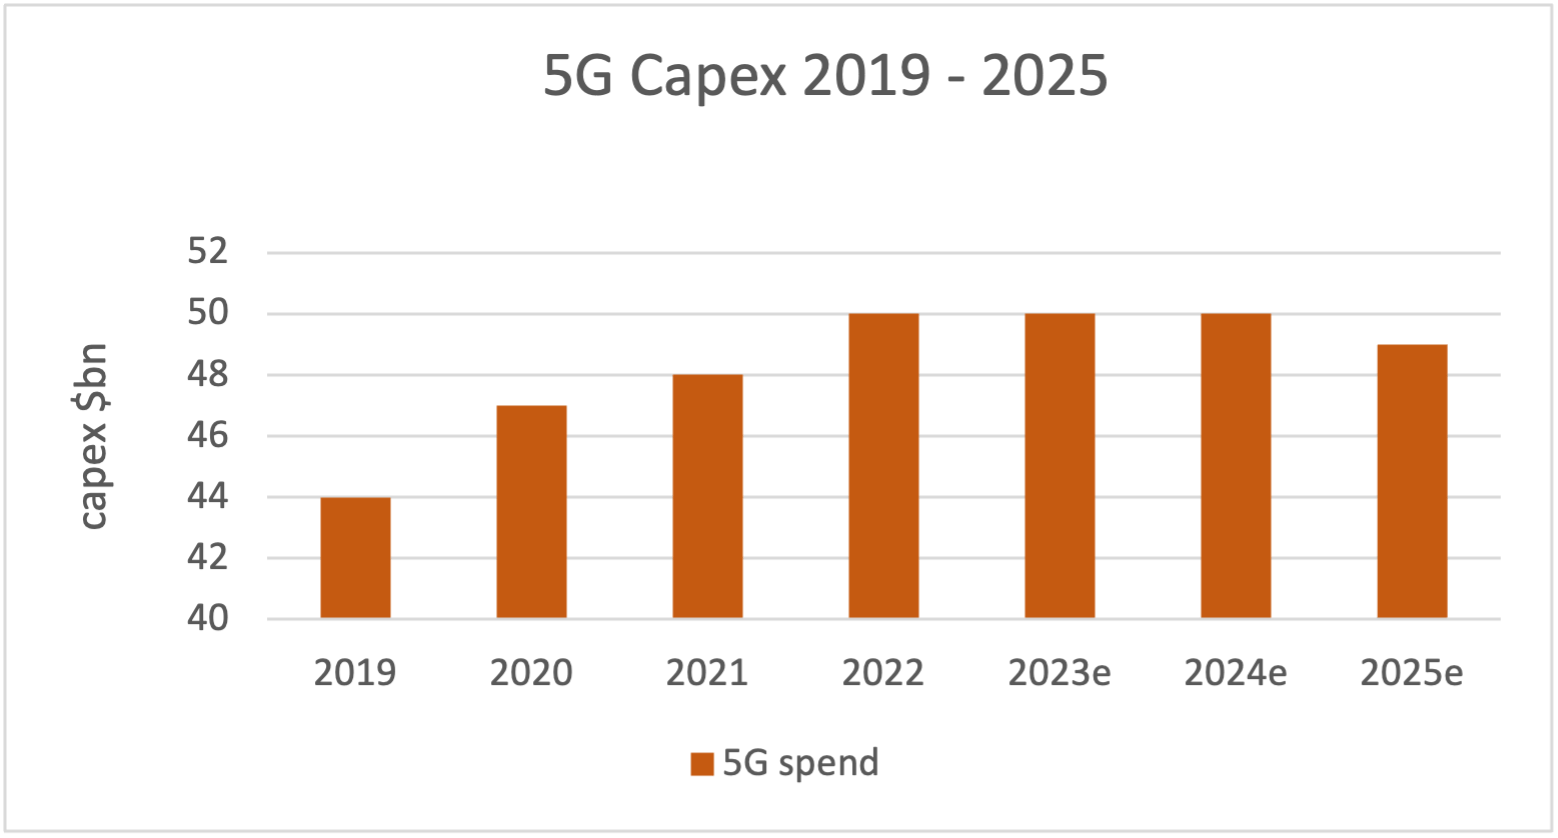
Big Tele are in the process of upgrading their networks from 4G to 5G. This will enable faster download speeds and increased connectivity between different types of devices. Below are Statista’s estimates of 5G capex since 2019.  This spending began in earnest in 2019 of which Big Tele has been the biggest spender. Similar to Big Tech, Big Tele capex has been multi-year at about 1/3 the size.

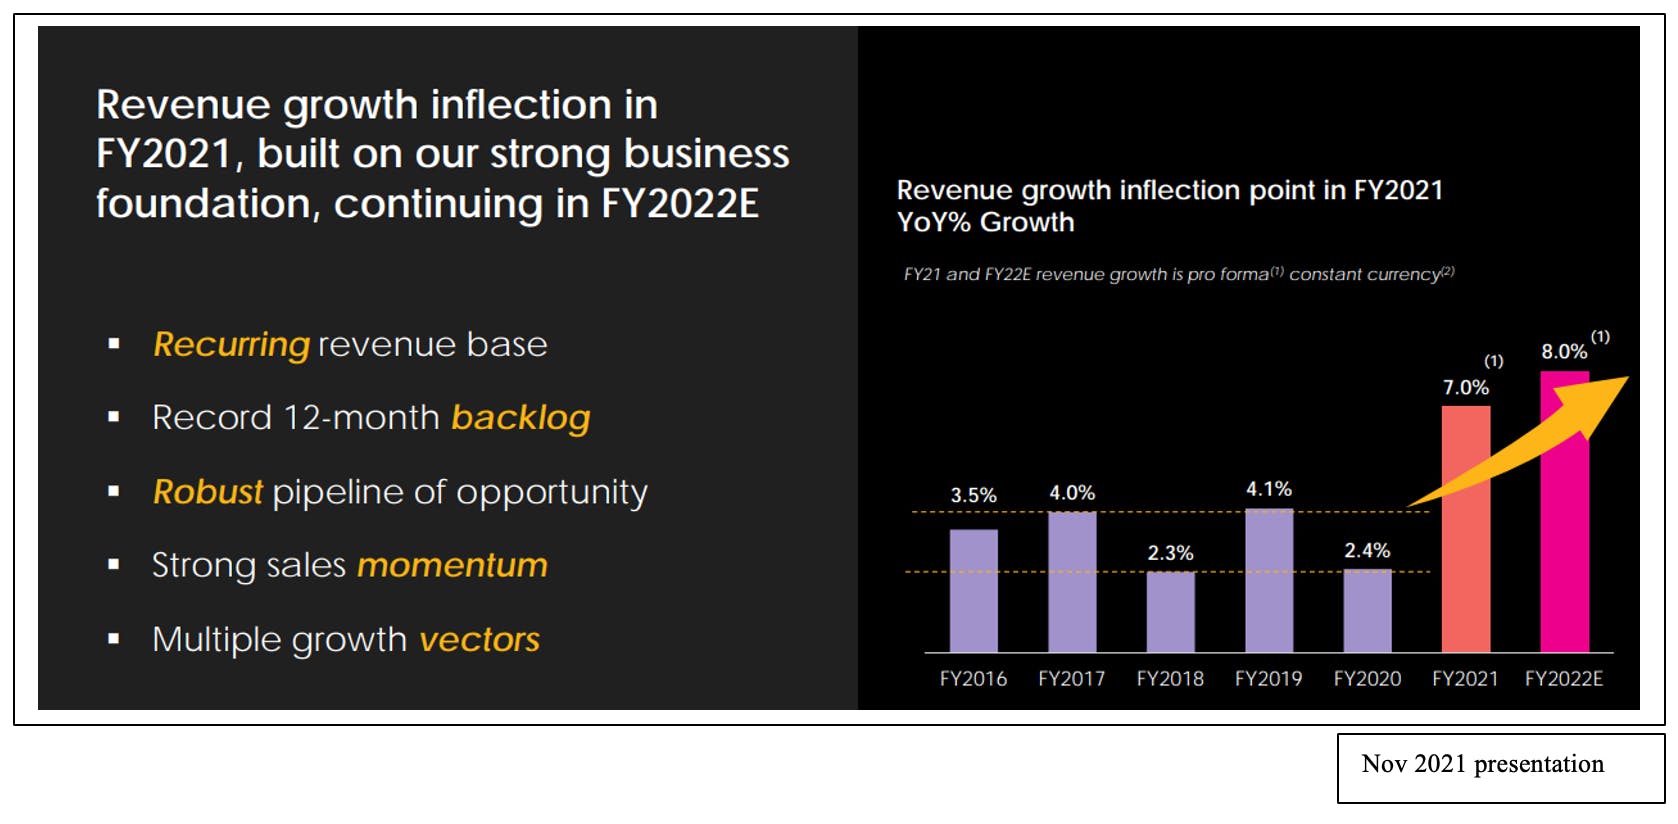
We evaluated stocks that could potentially benefit from Big Tele’s capex. One company we identified is Amdocs (DOX, $11B mkt cap). We have focused on software rather than hardware. In part, because after the hardware has been implemented, the software requirements tend to be recurring and the engagements multi-year. In the case of Amdocs, revenue reached an inflection point in 2021, two years after Big Tele 5G capex began.

Who are Amdoc’s customers and what are they looking for?

Amdocs is benefiting from Big Tele upgrading their networks to 5G because as they undergo these hardware upgrades, they need to upgrade their software needs. This includes moving their legacy systems/processes/billing to the cloud and utilizing methods to better monetize their subscribers through ancillary services and offerings. 

The majority of Amdocs clients are Big Tele and International telecom providers. Amdocs receives about 50% of its revenues from ATT and T-Mobile. Currently, Big Tele is focused on growing new revenue streams, cost reduction, and driving more efficient operations because of the ongoing trends of digital transformation, migration to the cloud and next-generation networks. Efforts all aimed at enhancing and monetizing the digital experience for the consumer, much like Big Tech.

Big Tele is investing in 5G and fiber rollout to meet the demand for increased bandwidth and innovation for digital services. This network modernization includes migrating their operational and business systems to the cloud and offering innovative new services for both enterprise and individual consumers that they can monetize.

5G will enable Big Tele to expand within existing and non-traditional business models. For example, Big Tele is partnering with leading suppliers to offer their customers a rich portfolio of offerings including media; entertainment, enterprise enablement; Internet of Things, and digital lifestyle services, all of which are driving Big Tele’s demand for multi-modal customer engagement capabilities and data.

One of the implementation challenges Big Tele faces is trying to rapidly introduce new cloud based applications while still operating legacy systems. Hence, Big Tele needs software providers that can provide modular expansion capabilities as it grows, to reduce these implementation risks.

In a presentation, at the Morgan Stanly Technology conference this month, Amdocs called Big Tele’s 5G initiatives as part of a wider megatrend which includes Cloud and Network Automation.presentation, at the Morgan Stanly Technology conference this month, Amdocs called Big Tele’s 5G initiatives as part of a wider megatrend which includes Cloud and Network Automation.

How does Amdocs help?

As a result, Big Tele is looking for software vendors such as Amdocs that can offer the right software and also provide managed services and end-to-end systems integration. Amdoc’s technological capabilities include individual products for commerce, catalog management, monetization, subscription management, Internet of Things, AI, services and network automation and network development and optimization.

For example, Amdoc’s eSIM Cloud enables Big Tele to launch Internet of Things solutions and monetize experiences on devices from Apple, Samsung, Microsoft, Google and other devices manufacturers.

Amdoc’s cloud based CES21 software suite enables Big Tele to build, deliver and monetize advanced services, leveraging their investments as a 5G standalone network, muti-access edge computing (MEC), software-defined networks (SDN), artificial intelligence (AI) and machine learning (ML). This technology is a visual software development approach that requires little to no coding skill on the part of the user, allowing the rapid development of applications with minimal dependency on IT and code developers. The suite also includes carrier-grade AI/ML based user cases to optimize the customer experience.

This is how Amdocs described their role in the most recent q123 call.

  • Amdocs is helping service providers to modernize and build agility in the 5G era by enabling the rapid launch and monetization of new 5G products
  • We see a growing number of service providers embarking on multi-year cloud migration journeys that Amdocs is supporting with our end-to-end suite of cloud platforms and services

Financial Impact

The “trickledown” effect from Big Tele’s 5G capex and demand for Amdocs software offerings can be seen through two key data points – orderbook and sales. Recall, Amdocs gets about 50% of its revenue from AT&T and T-Mobile.

Order book

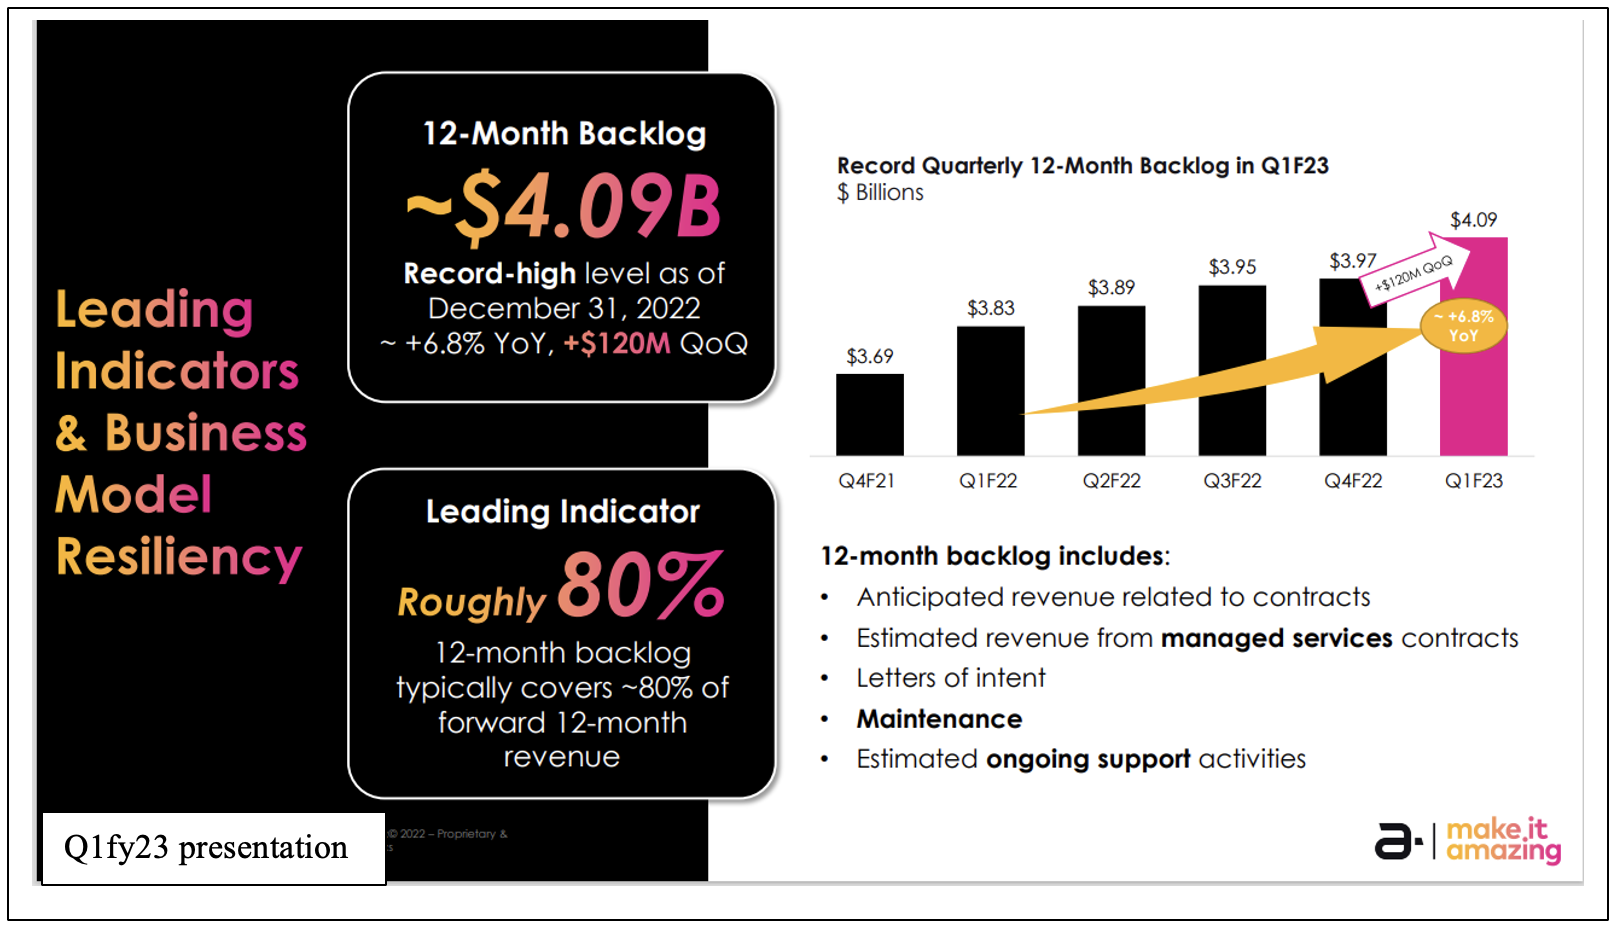
There’s been a steady increase in the order book in the past few quarters, which provides strong revenue visibility. As of Q123, the 12-month backlog stood at $4b.

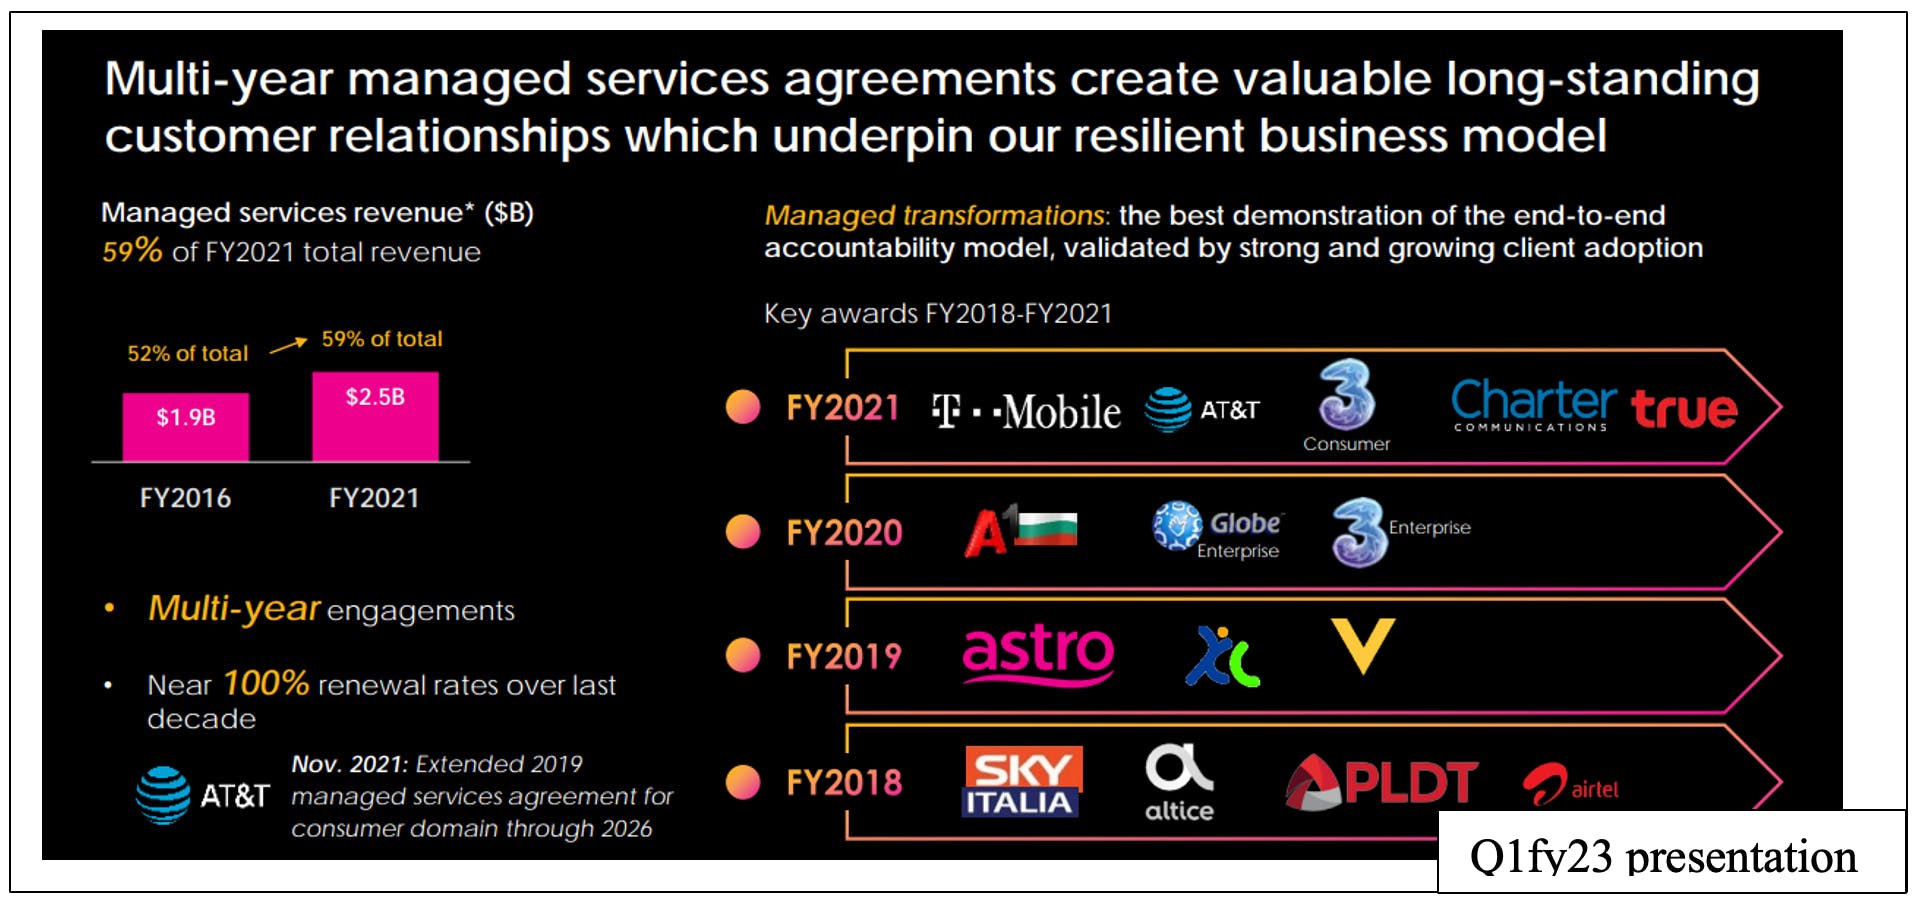
A portion of this consists of ‘Managed Services’ which are typically multi-year and have almost 100% renewal rates.

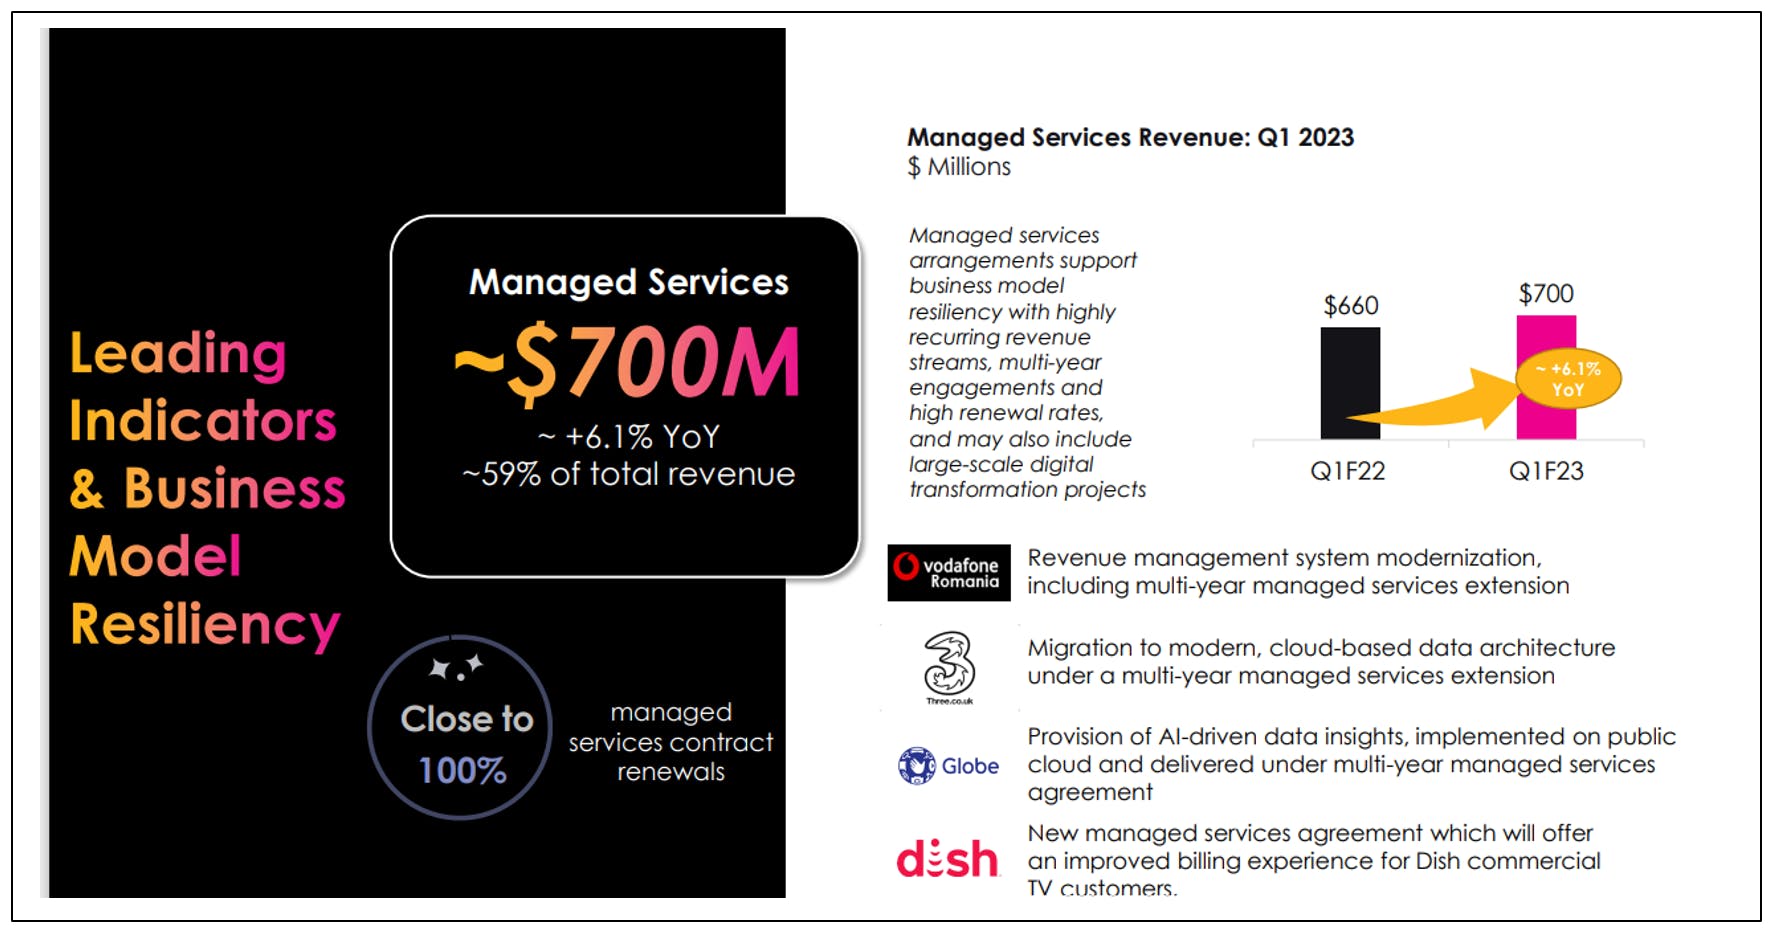
For example, of the 1.2B in Q1FY23 sales, 60% came from managed services which tend to be recurring. Overall, Amdocs estimates 75% of the total revenue is recurring.

Sales

Big Tele’s capex can also be seen in the inflection in Amdoc’s sales growth in 2021. For FY 2023, Amdocs has guided for a range of 6 – 10% sales growth. In FY 2022, sales grew almost 10%. This inflection point in 2021 occurred about 2 years after Big Tele’s 5G capex began.

What stock attributes do we like?

There are several stocks attributes we find attractive. In addition to the order book visibility and recurring revenues, the following stand out.

FCF generation

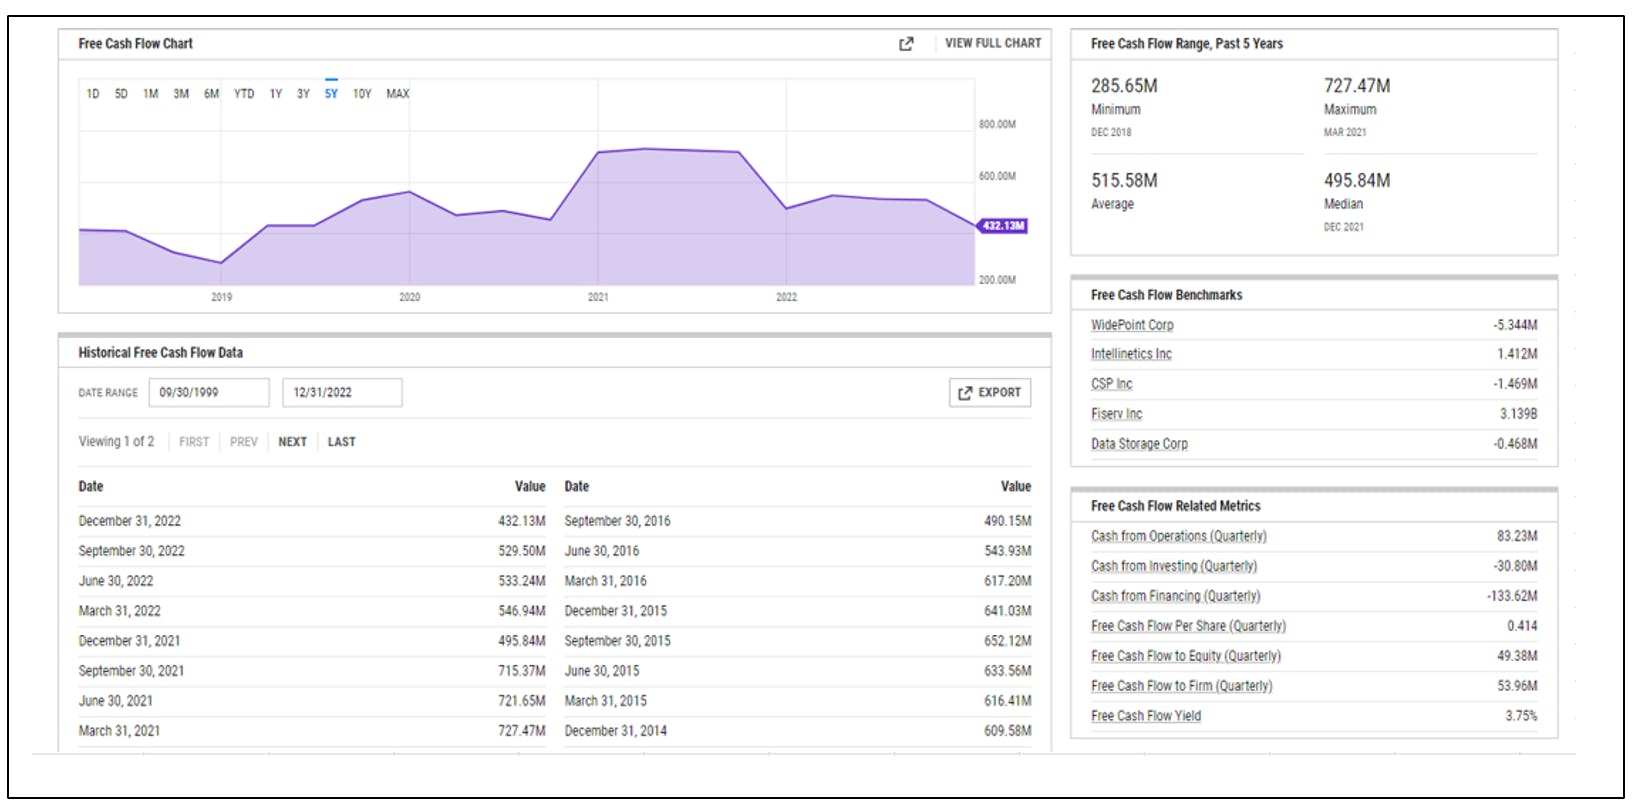
Currently, Amdocs has consistently generated free cash flow. The current FCF yield is almost 4% and pays a dividend of 1.8%.

Profitability – Gross Margins and Operating Margins

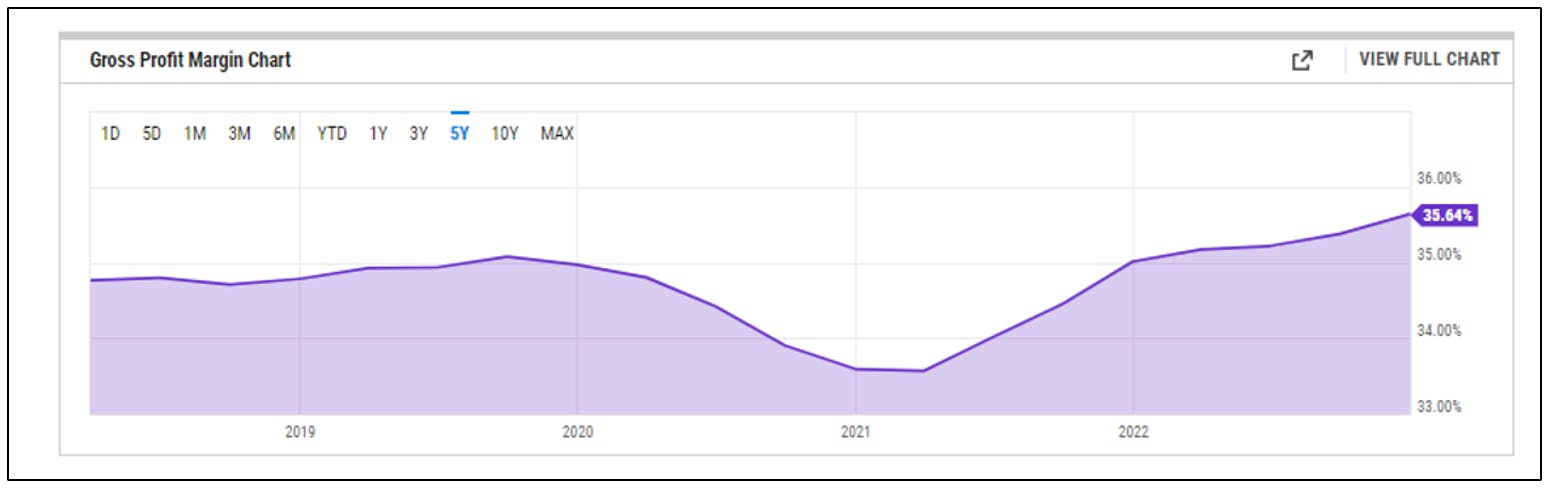
The inflection point in sales can also be seen in profitability. Gross margins have been steadily increasing since 2021 and through 2022 which was a difficult environment for many tech companies.

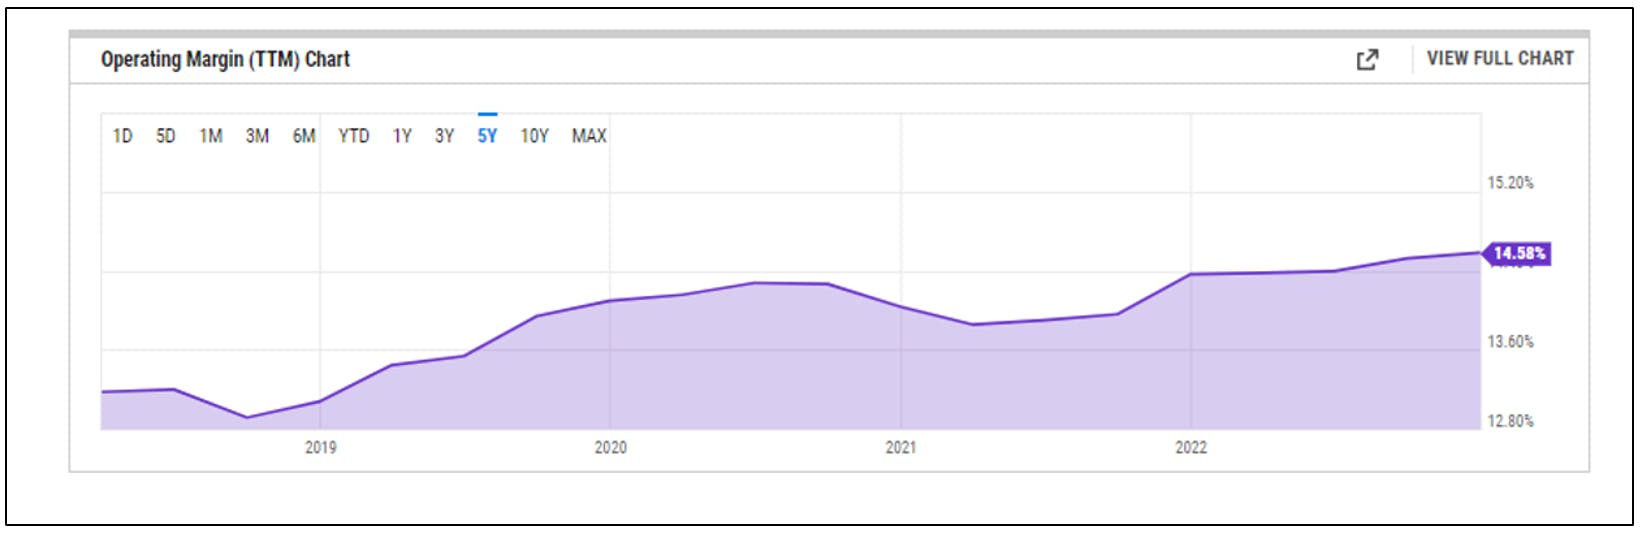
The same trend can be seen in GAAP OPM. Non-GAAP OPM have a similar trajectory and currently stand at almost 18%.

One of the attractions of Amdocs is its high portion of recurring revenue streams. Although not subscription based, the recurring nature has a similar impact on operating margins in terms of providing stability in different market environments. 

In 2022, Amdocs’s saw a steady improvement in margins at a time when other companies’ operating margins – such as cloud companies – were declining.  We discussed the differences of a subscription vs consumption model (Insert 12/10/22 blog link?)(Insert 12/10/22 blog link?)

EPS and Sales visibility

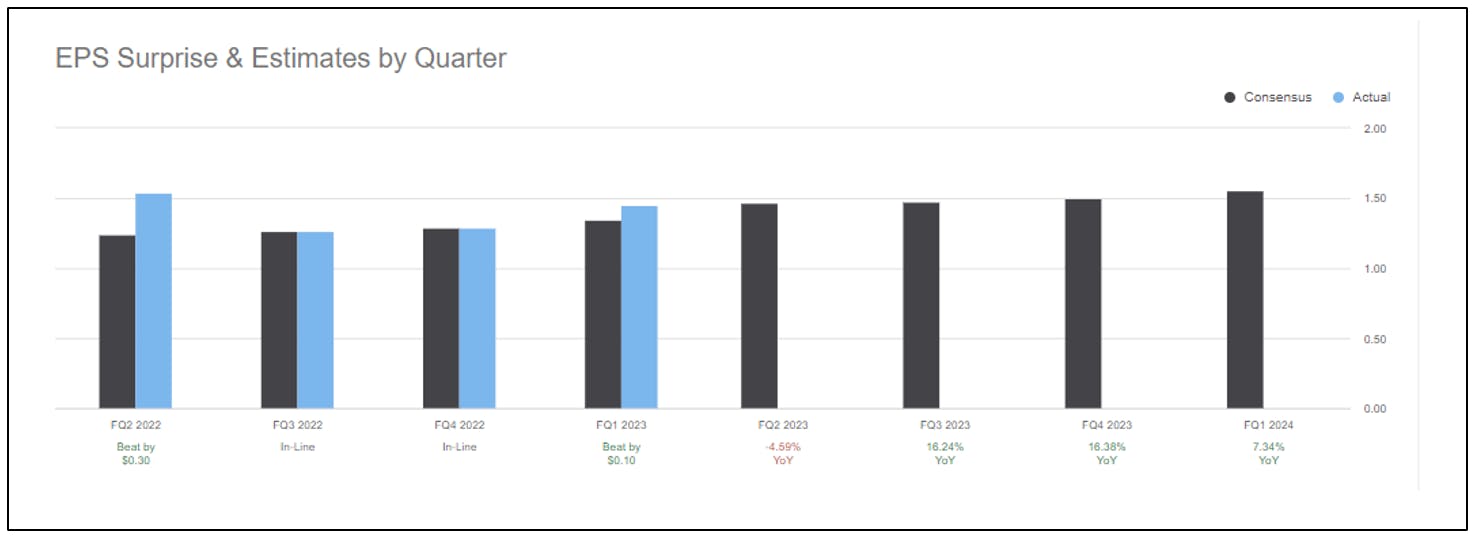
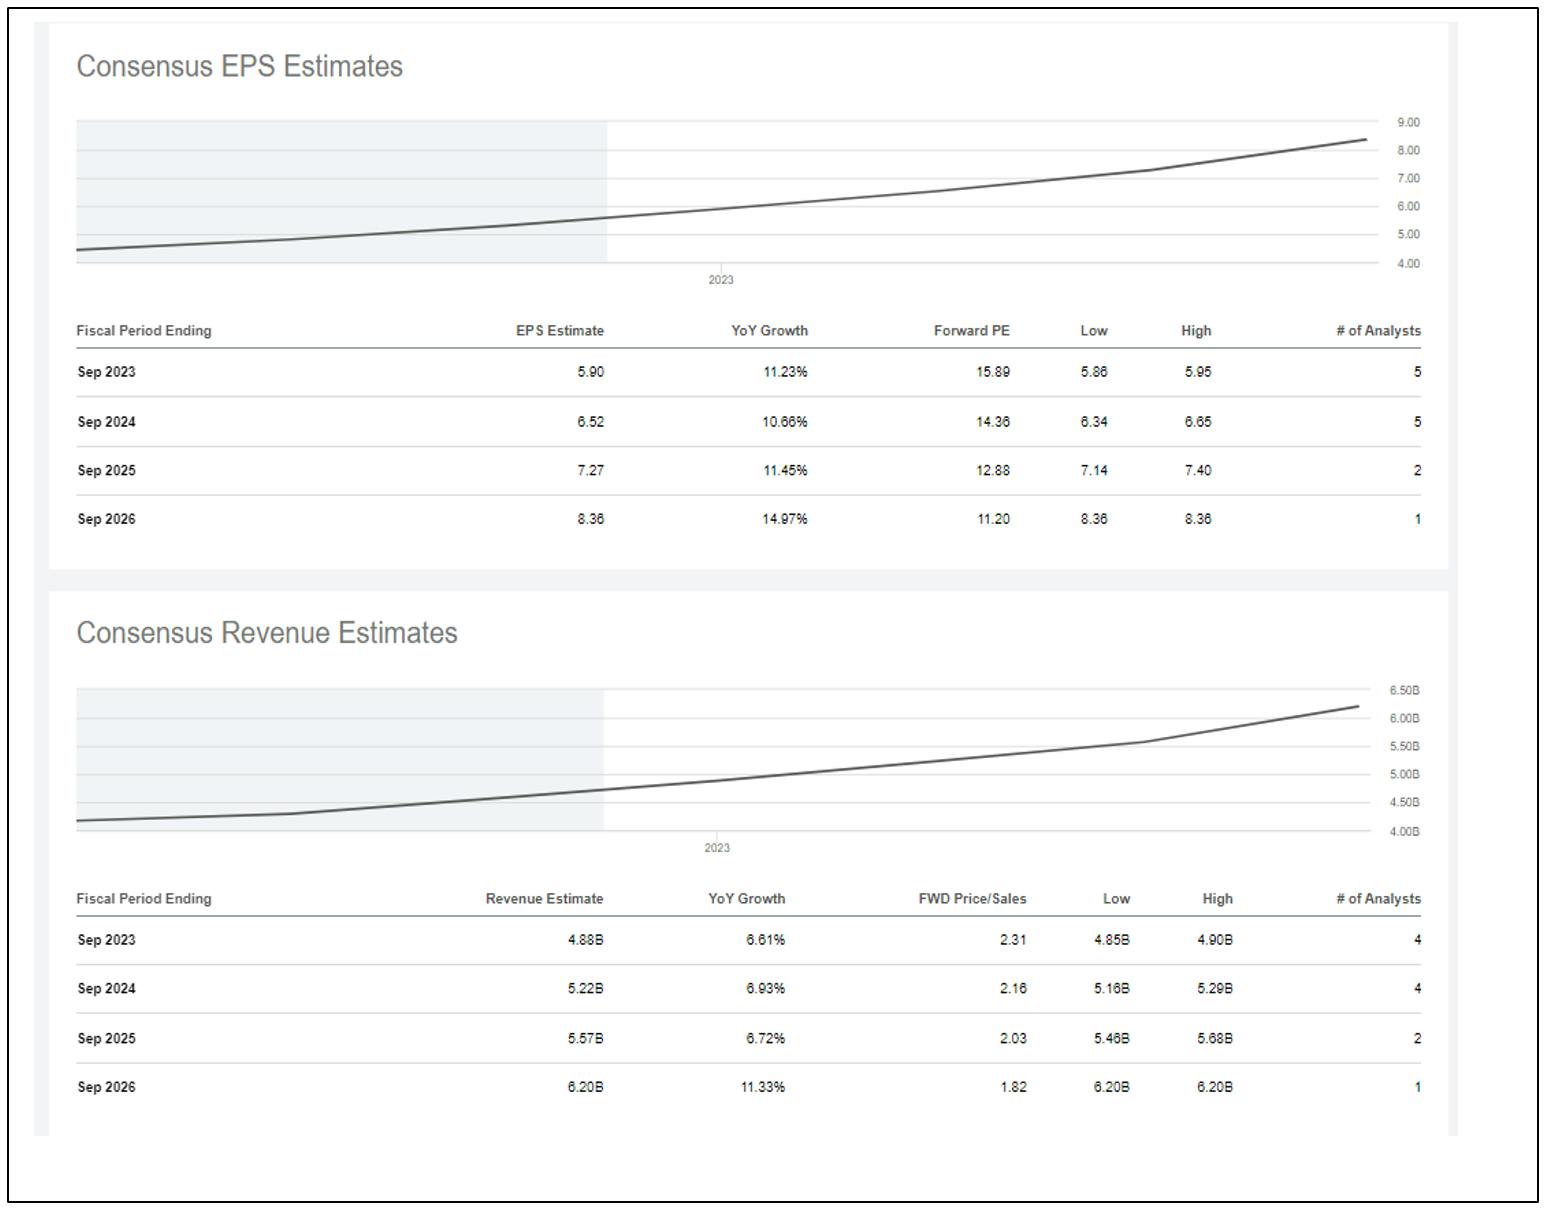
Amdocs order book visibility and recurring revenue can be seen in Amdocs positive and defensive earnings growth in 2022 (light blue bar). At a time when many tech companies were revising down estimates, Amdocs either beat or reported in-line earnings. Consensus earnings and sales forecasts – from 2023 to 2026 – paint a similar steady earnings profile.

Amdocs recently reported their q1fy23 earnings where they beat and revised up forecasts. Amdocs stated “Overall, our financial year is off to a strong start, positioning Amdocs to deliver consistent and profitable growth in fiscal 2023 within a global macroeconomic backdrop that remains challenging and uncertain.”. Amdocs reiterated their sales growth target of up to 10%.

Consensus has conservatively modeled 6% y/y sales growth, which provides an opportunity for upside surprise. In 2022, Amdocs had 10% sales growth.

Investment Summary

Taking all these factors into consideration. These are the investment attributes that we find attractive.

  • Well capitalized customer base – Big Tele is well funded and has embarked on strategic investments. Amdocs provides critical software to allow them to compete 
  • High switching costs – Once Big Tele begins to work with Amdocs, it makes it harder for them to switch to another provider given the type of mission critical support that Amdocs has provided. Amdocs has close to 100% retention rate
  • Revenue visibility – Amdocs has 12 month revenue backlog of $4.1B long which provides strong visibility into future earnings and is a positive reflection of the current demand environment 
  • Recurring revenue – Amdocs estimates that 75% of its revenue is recurring which means earnings will be more resilient in difficult macro environments
  • Steady and increasing profitability – given the strong visibility on top line growth, Amdocs has been able to focus on profitability. Operating margins have gradually increased through different market cycles. Amdocs has guided for 18% opm in 2023.
  • Financially strong – Amdocs generates healthy cash flow used to buy back shares and pay dividends. It targets 100% fcf conversion and has forecasted $700m in fcf which equates to a 6% fcf yield.
  • Consolidation beneficiary – When Big Tele acquires another competitor, Amdocs helps in the processes involved in migrating customer information, billing etc. For example, Amdocs should benefit from T-Mobil’s recently announced acquisition of Ryan Reynold’s Mint Mobile 

How does valuation look?

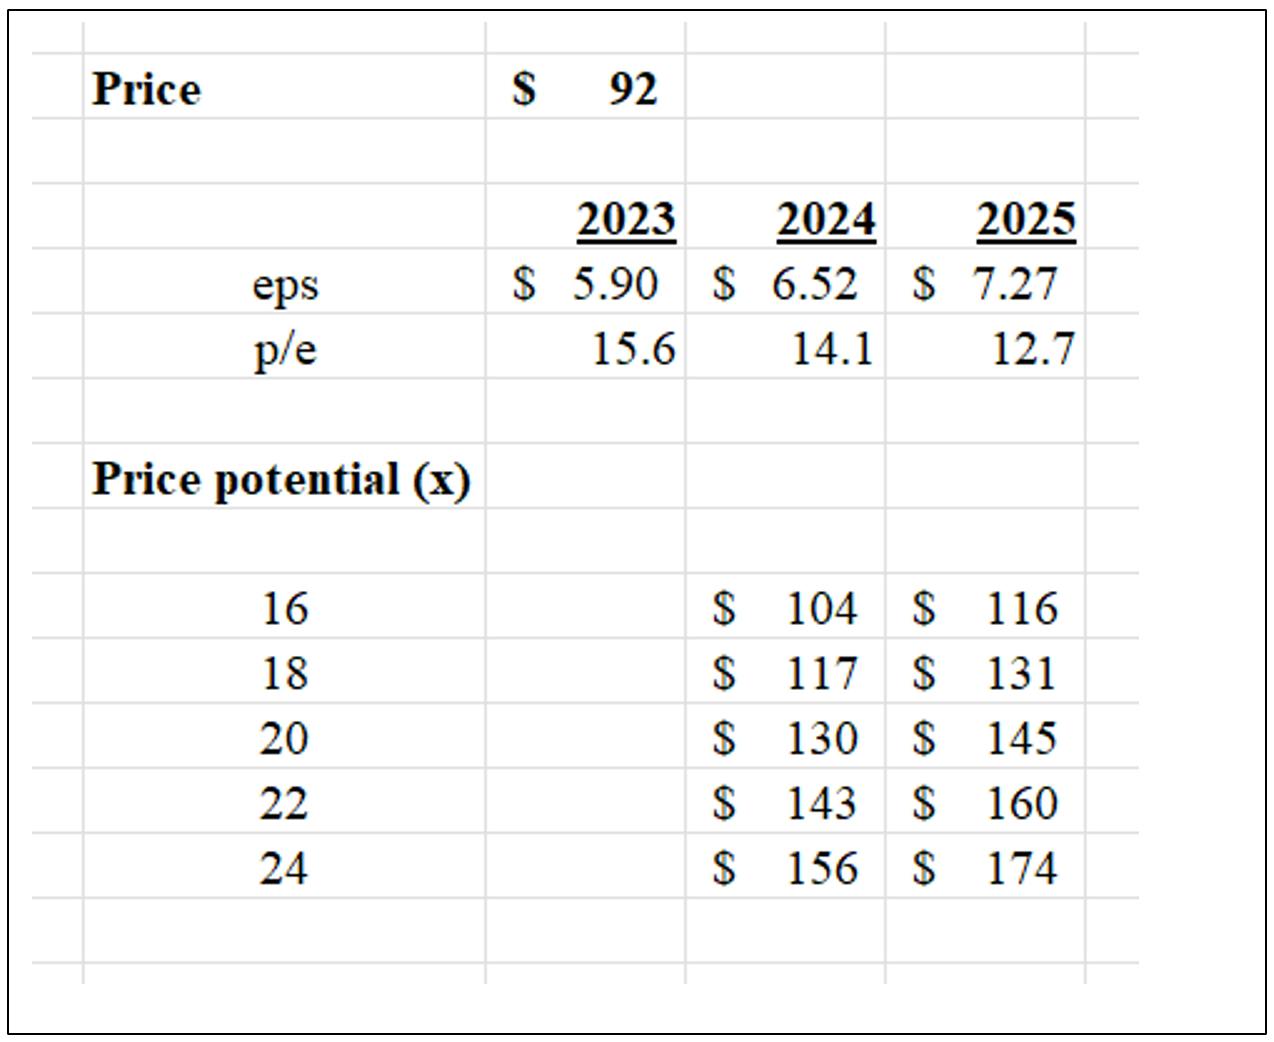
Currently, DOX’s valuation is not demanding based on 2024 EPS and trades at discount to the SPX. It has traded as high as 20x earnings in the past. Given the defensive nature of DOX’s earnings, strong balance sheet and FCF generation, we believe the market will pay a higher multiple for this type of business model and earnings visibility in the current economic environment.

We see a valuation potential of between $120 to $130. 

Amdocs Technicals

By Knox Ridley

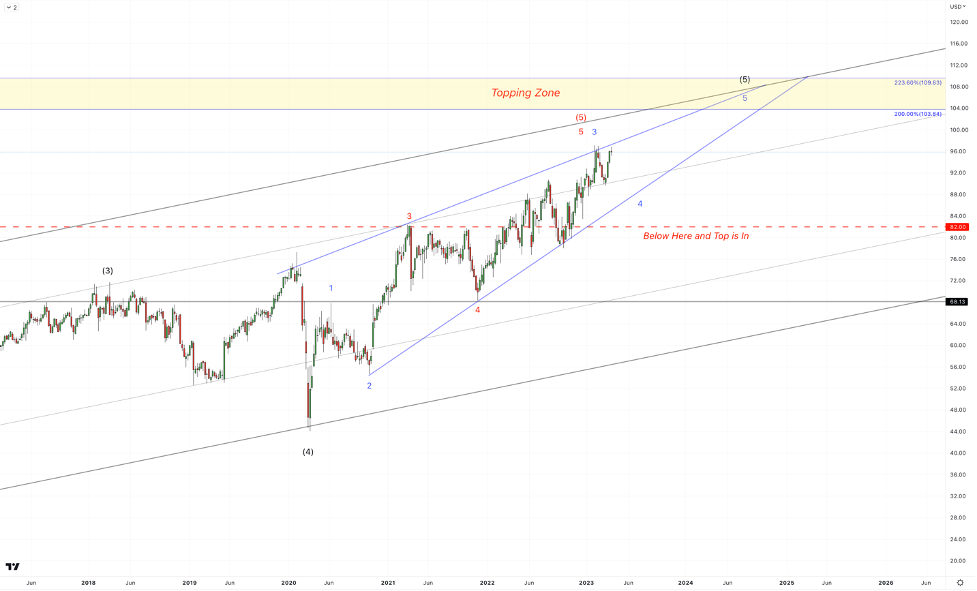
Since the COVID low, DOX has been tracing a very large termination wedge pattern. The question remains – has it topped, or does it have one more larger swing before we complete the pattern? As long as any weakness holds the $82-$80 region, we could see a possible buying opportunity for the push into the $103-$110 region. If we break below the $82-$80 region, the odds favor the top being in. Like many stocks, DOX is marching towards a bigger top. We believe for the long-term investors, patience and lower prices will pay off handsomely for quality stocks.

Bitcoin Vs Banks: Here’s Where the Price Goes Next

On December 9th, we announced that we are buying Bitcoin and laid out the reasons why in a free article that was quite clearly named: “Bitcoin is Going to Rally Again: Here’s What You Need to Know.” Since stating that in that article that Bitcoin was at a meaningful low, Bitcoin is up ~62%. Here is what I said: 

“Though we are in the 4th bear cycle in Bitcoin's history, the prior 3 cycles suggest where we are is a rare buying opportunity. There is ample evidence to support the $15,500 level is either a major low or very close to a major low. Both the technical and on-chain analysis support this.”

We then followed up that article on January 9th, stating that Bitcoin is likely in the early stages of a cyclical uptrend, and that we are continuing to buy at current prices. Since then, the price is up ~40%. 

Not only is the on-chain analysis lining up with our technical analysis, but the fundamental story behind Bitcoin’s intended purpose is starting to manifest. Most forget that Bitcoin’s white paper was first introduced on the heels of a banking crisis that nearly brought down the global financial system. The intended purpose of Bitcoin was to be a hedge against failing banks, as stated by its creator in 2009.

“The root problem with conventional currency is all the trust that's required to make it work. The central bank must be trusted not to debase the currency, but the history of fiat currencies is full of breaches of that trust. Banks must be trusted to hold our money and transfer it electronically, but they lend it out in waves of credit bubbles with barely a fraction in reserve.”

The recent decoupling of Bitcoin from equities, we believe, is the start of a new uptrend that appears to be inversely correlated to the financial sector.

The financial media would have us believe that the current banking crisis is mostly US centric, and localized to regional banks. However, as we look at various charts from these banks, a different story emerges. This is not just a US problem, and it is not limited to regional banks. As more and more investors realize their deposits, once again, may not be safe, we should see an increase in Bitcoin’s demand, which is supported by the on-chain and technical analysis provided below.

Bitcoin and Banks

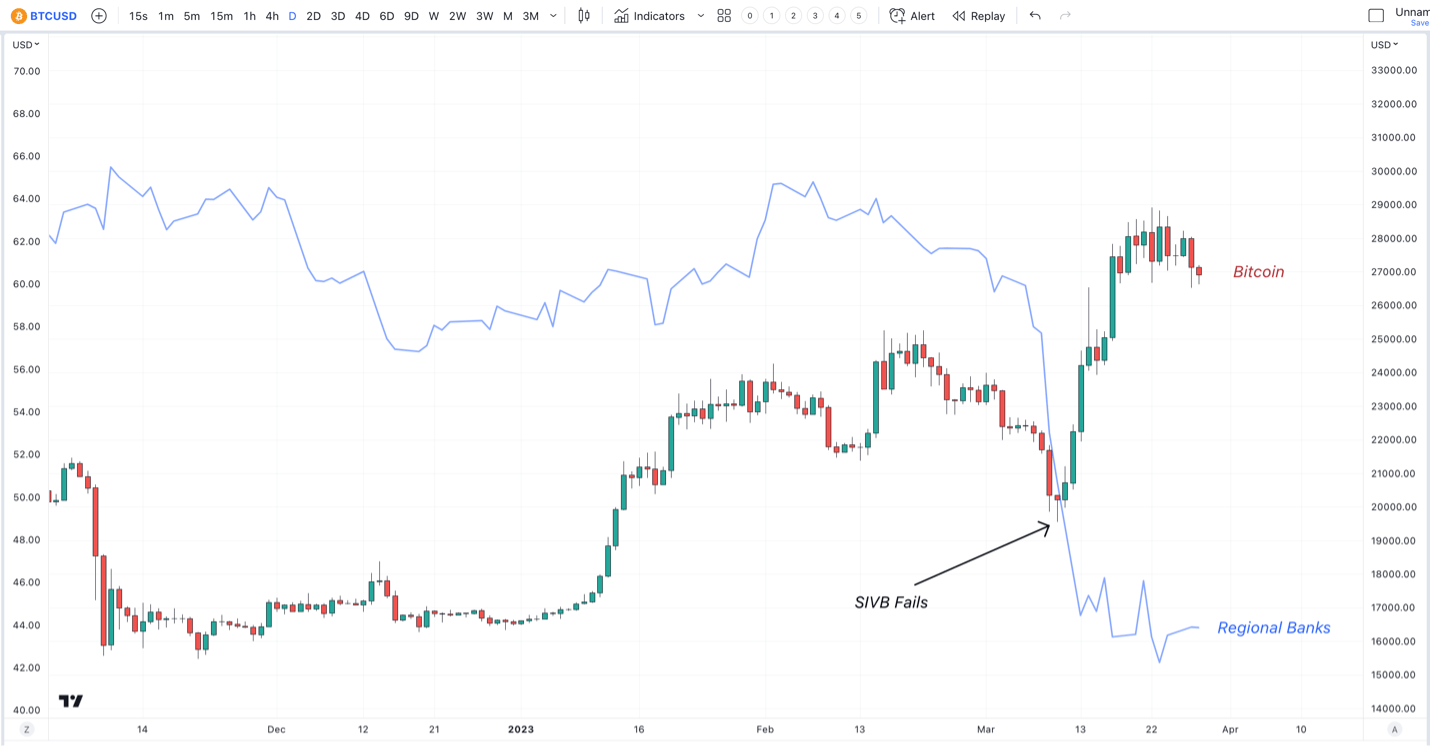
On Friday, March 10th, Silicon Valley Bank (SIVB) failed. With over $200 Billion in deposits, SIVB was one of the largest banks in the US, and therefore one of the largest bank failures in US history. This was quickly followed by the failure of Signature Bank in New York, with deposits of over $110 Billion. What followed was a mini panic out of regional bank stocks, as we soon saw depositors fleeing the more vulnerable regional banks and into the Too Big to Fail banks.

Interestingly, on March 10th, Bitcoin bottomed and began one of the sharpest jumps we’ve seen since 2021. 

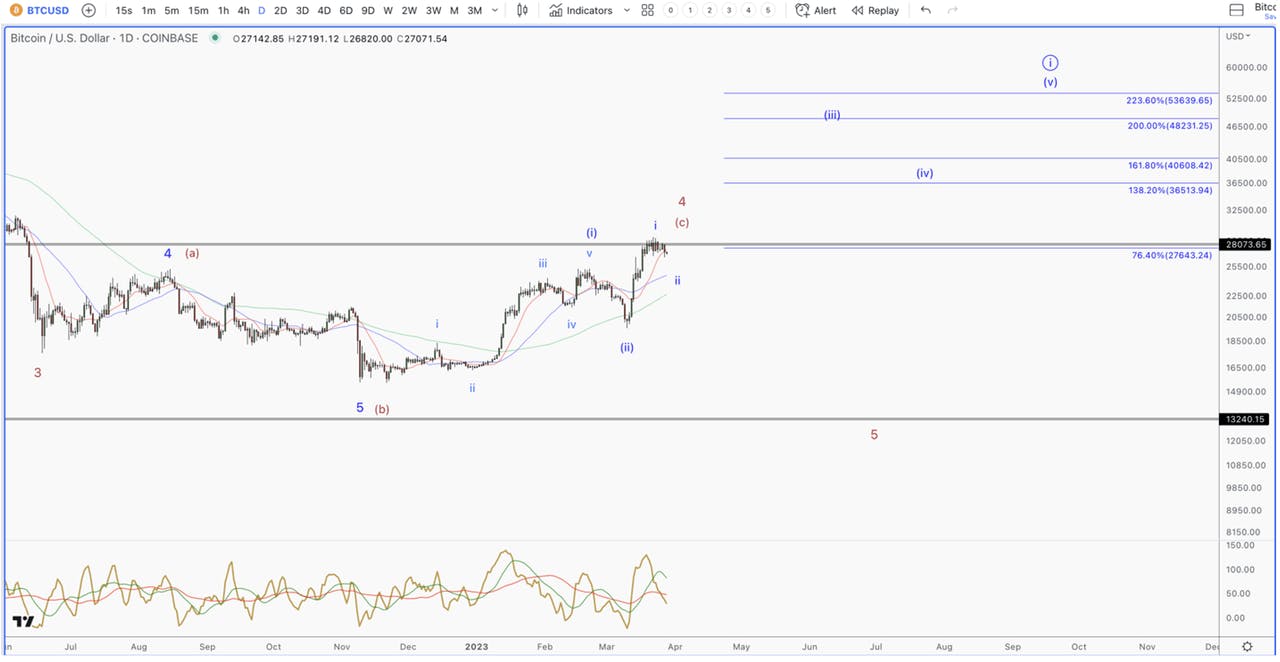
Bitcoin chart

This may seem like a random occurrence, yet this move lines up with Bitcoin’s original white paper, first published on the heels of the Great Financial Crisis (GFC) by the mysterious Satoshi Nakamoto. The original intent of Bitcoin was to create a true peer-to-peer electronic payment network that did not rely on centralized institutions to facilitate transactions. In short, it was the first real attempt to disrupt the banking system, and remove the inherent risks in a centralized banking system.

Coincidentally, this white paper was released in February, 2009, which was at the height of despair from the global banking system melting down. Most people assumed their money was safe in a bank and that it would be there when they need it. Most people had no idea about fractional banking, let alone credit default swaps and collaterized debt obligations. What they did realize on a primal level in 2008 was that their money was at the mercy of a centralized system that was much more complex than they thought and not as safe as they previously believed.

What we are seeing today is a repeat of the same realization, only with different details. The popular narrative regarding the current banking crisis is that deposits are fleeing regional banks at a record pace and moving into the “Too Big to Fail” banks, like JP Morgan, Citigroup, Bank of America. Therefore, any additional weakness in banks should be localized to regional banks while the big banks continue to thrive, which should offset the current weakness.

This sounds plausible, and fits within the relative calm we’ve had since the FED has fenced off the problem banks. However, if we look at the big banks that should be receiving this tailwind of deposits, another picture emerges.

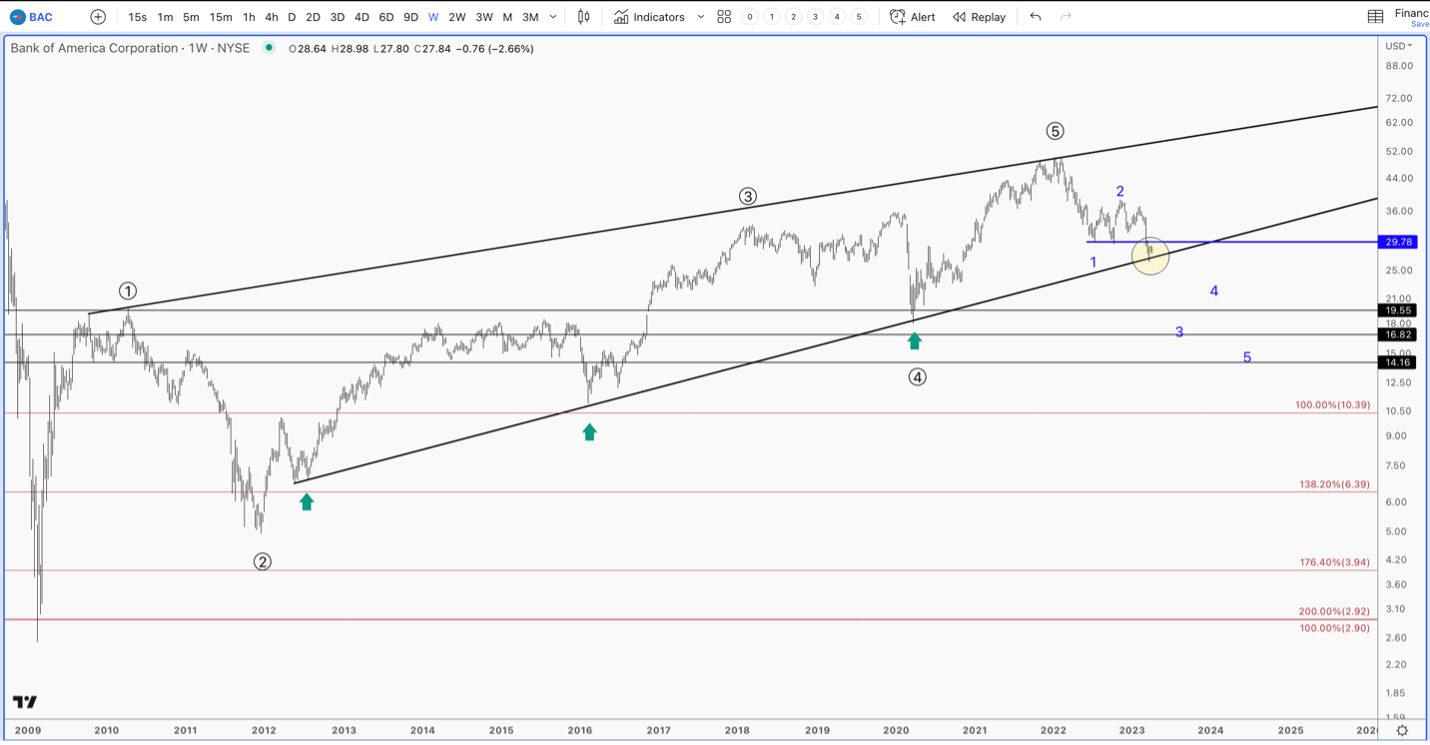
Bank of America (BAC) is one of the largest and most important banks in the US. After the epic consolidation from the GFC in 2008, it was deemed, along with a handful of other banks to be Too Big to Fail, and it remains so today. Just a simple glance at the price chart and we can see that BAC is comfortably below its October low with no buyers stepping in at a critical support level.

Bank of America chart

BAC is threatening to break a trendline that has kept the stock trending up since 2012. What is also concerning is that BAC has completed a large degree 5 wave uptrend off the 2009 low. Furthermore, the corrective pattern that began in late 2021 is incomplete and suggesting a test of the COVID lows is needed before some kind of meaningful low can be found. The failure to find buyers at such important support is alarming.

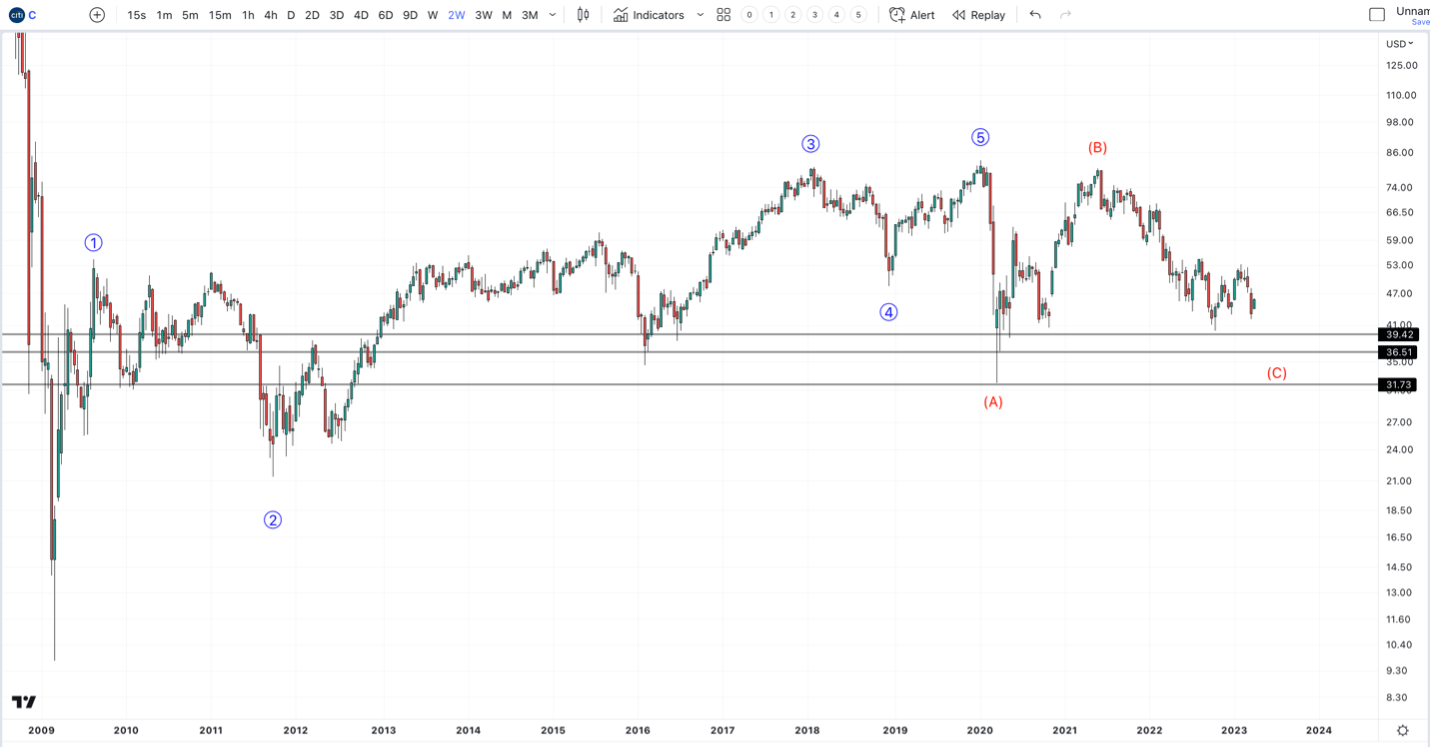
Another “Too Big to Fail” Bank is Citigroup (C). This chart is significantly weak, and has basically trended sideways since the 2009 low.

Citigroup bank chart

Like BAC, it has completed 5 waves up off the 2009 low; however, it topped in 2019, failing to make a new high during the COVID bull market. Also, like BAC, it appears to be pointing towards the COVID low to complete a large degree correction.

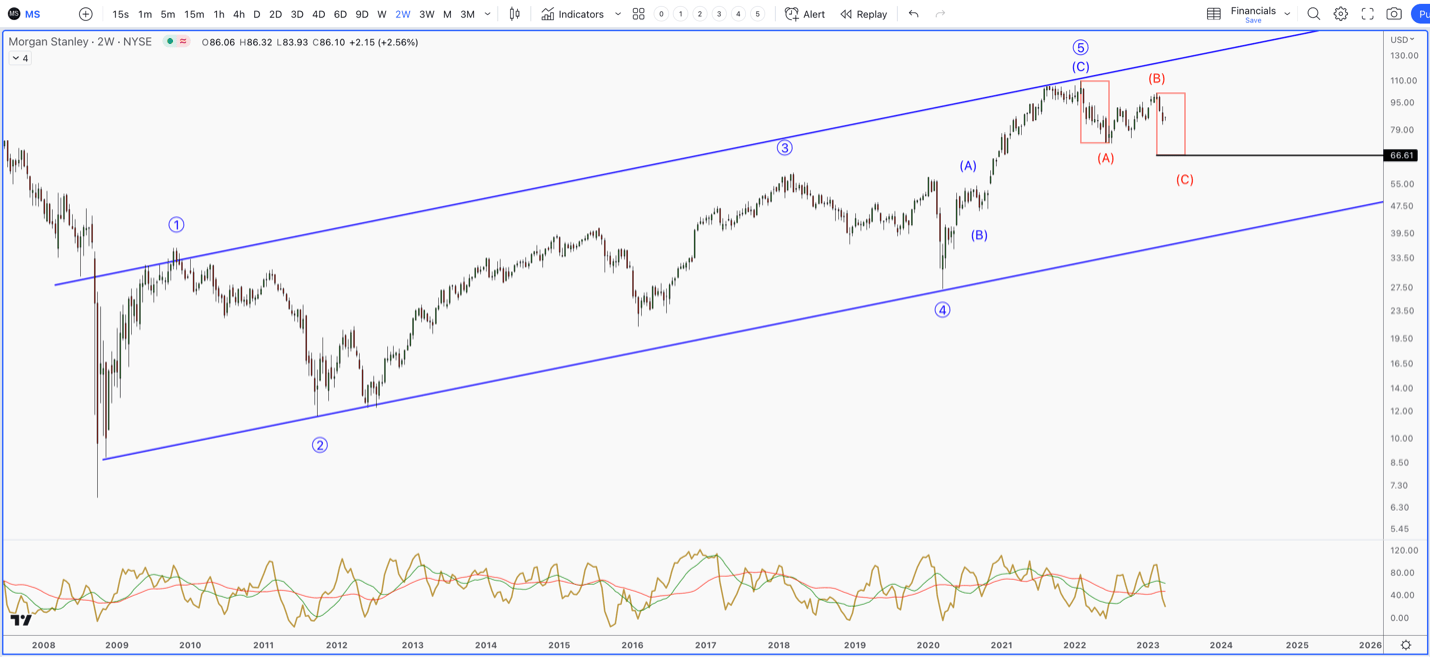
Another Bank deemed “Too Big to Fail” is Morgan Stanley (MS). It is also in a precarious position.

Morgan Stanley Bank chart

Though it is relatively stronger than BAC and C, it has also completed a large 5 wave uptrend off the 2009 low. The following correction, like most bank stocks, has not completed its corrective pattern and looks to be targeting a price below the October low of 2022.

These large banks have quite unhealthy and concerning charts. They suggest that what is going on in the banking sector may not be a tailwind for them, but in fact, a headwind that will offset any increase in deposits.

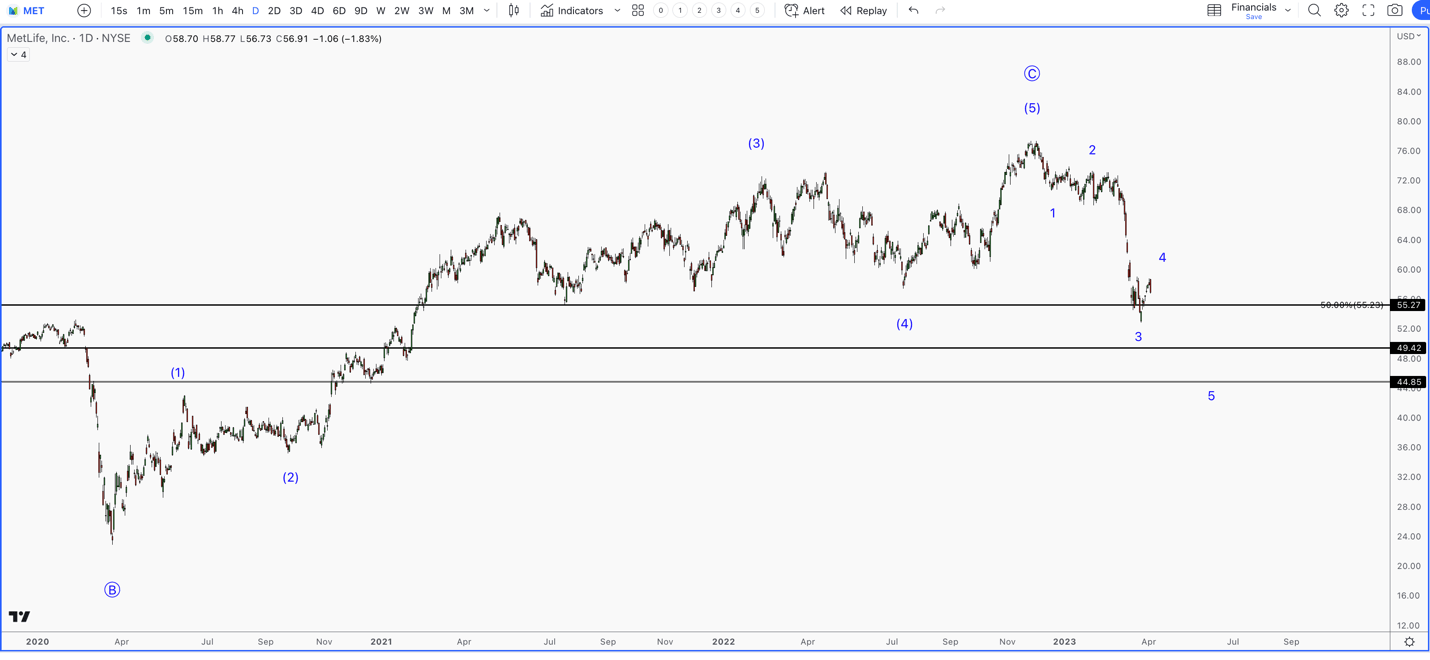
What’s more concerning is that the banking issues do not seem to be localized to just the banks. The below chart is Metlife (MET), one of the largest insurance providers in the US.

Metlife bank chart

This is one of the weakest charts in the mega cap financial spaces, as the stock cannot catch a bid at major support. The corrective pattern looks to be a 5 wave move down that is incomplete. If accurate, it suggests that MET has put in a major top.

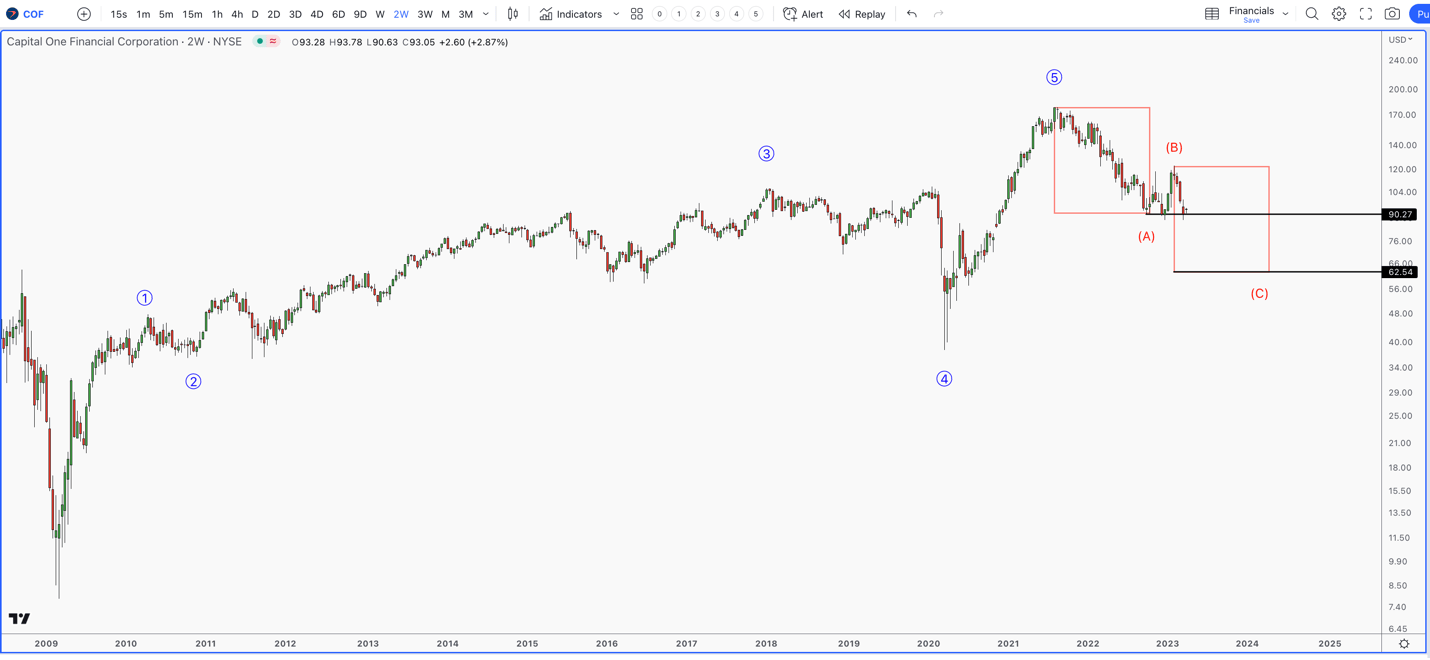
Capital One (COF) is another big financial stock that looks like it is in trouble. As a credit card and banking company, its chart looks to be heading much lower, as it attempts to find buyers at a key support level.

Capital One bank chart

Furthermore, the issue is obviously not localized to the US, proven by the collapse of Credit Suisse. However, if we look at various charts from global banks, a similar pattern emerges. 

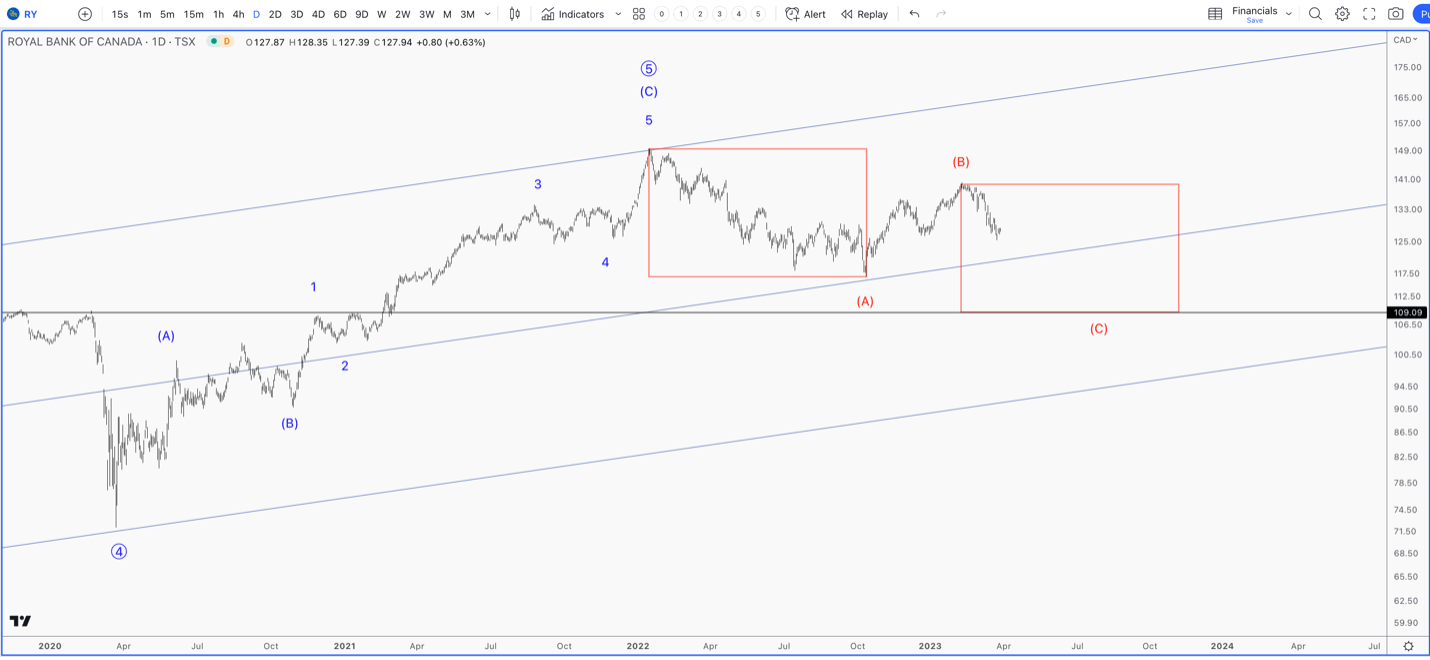
The Royal Bank of Canada (YT) looks a lot like some of the bigger banks in the US. After completing a large 5 wave uptrend into the late 2021 high, we have an incomplete corrective pattern that should take us well below the October 2022 low.

Royal Bank of Canada chart

A few additional bullets on the global banks:

  • Deutsche Bank announced that they will redeem $1.5 Billion of notes due in 2028. As a result, the cost of their credit default swaps increased sharply, much like we saw with Credit Suisse prior to their collapse. European banks have been down across the board on this news, as Deutsche Bank saw a 14% drop that day, and is down ~25% from its February high.
  • The French CAC has been one of the stronger indexes in Europe; however, under the hood, the banking sector is the weakest sector, much like in the US. BNP Paribas, Frances largest bank, for example, is down ~18% from its March high.
  • Now, UBS is being probed and possibly sanctioned due to their support of Russian Oligarchs.
  • Two of Japan’s largest banks, Mitsubishi UFC Sumitomo and Mitsui Financial, are down between 14% – 17% from March 9th.
  • The largest bank in Australia, the Commonwealth Bank of Australia, is down ~13% since March 14th, while England’s largest bank, HSBC, is down ~14% since late February.
  • Itaú Unibanco, Brasil’s top bank, is down ~15% since late February and over 25% since last November.

The point is that whatever is unfolding in the banking sector is not localized to US regional banks, and is certainly a global concern. The more uncertainty in the centralized banking system, the more that Bitcoin will fulfill its true purpose.

In our last free article, we discussed that inflation pressures are still quite high, especially within the service sector. Evidence is building that crude and gasoline are looking to breakout to higher levels, which was confirmed with OPEC announcing surprise production cuts this week.

Sign up for I/O Fund's free newsletter with gains of up to 221% -Click hereSign up for I/O Fund's free newsletter with gains of up to 221% -Click hereClick here

While the market is pricing in a FED pivot, we are getting mixed messages from the prior hawkish FOMC statement and a dovish speech that followed by the FED chair. If energy does break out, as we believe it will, we could see an unexpected inflation impulse at the worst time. With a Global Debt-to-GDP sitting at 338%, and an on-going global campaign to aggressively fight stubborn inflationary pressures, it’s no wonder that we are seeing cracks within the system.

If what the charts are suggesting does unfold, once again, most people will be confronted with the harsh reality their deposits are possibly not safe, which will only bolster the underlying purpose of Bitcoin. Not only is it a hedge against inflation, but it’s a simple and efficient means to store wealth, which can provide an alternative to gold.

Bullish Until

Analyzing price action is especially important in Bitcoin. It does not have earnings reports, and rarely has news events to move price. So, the majority of swings that we see in this asset happens based on sentiment. Because of this, it lends itself well to technical analysis. Our firm outperforms in this regard with active management and real-time trade alerts.

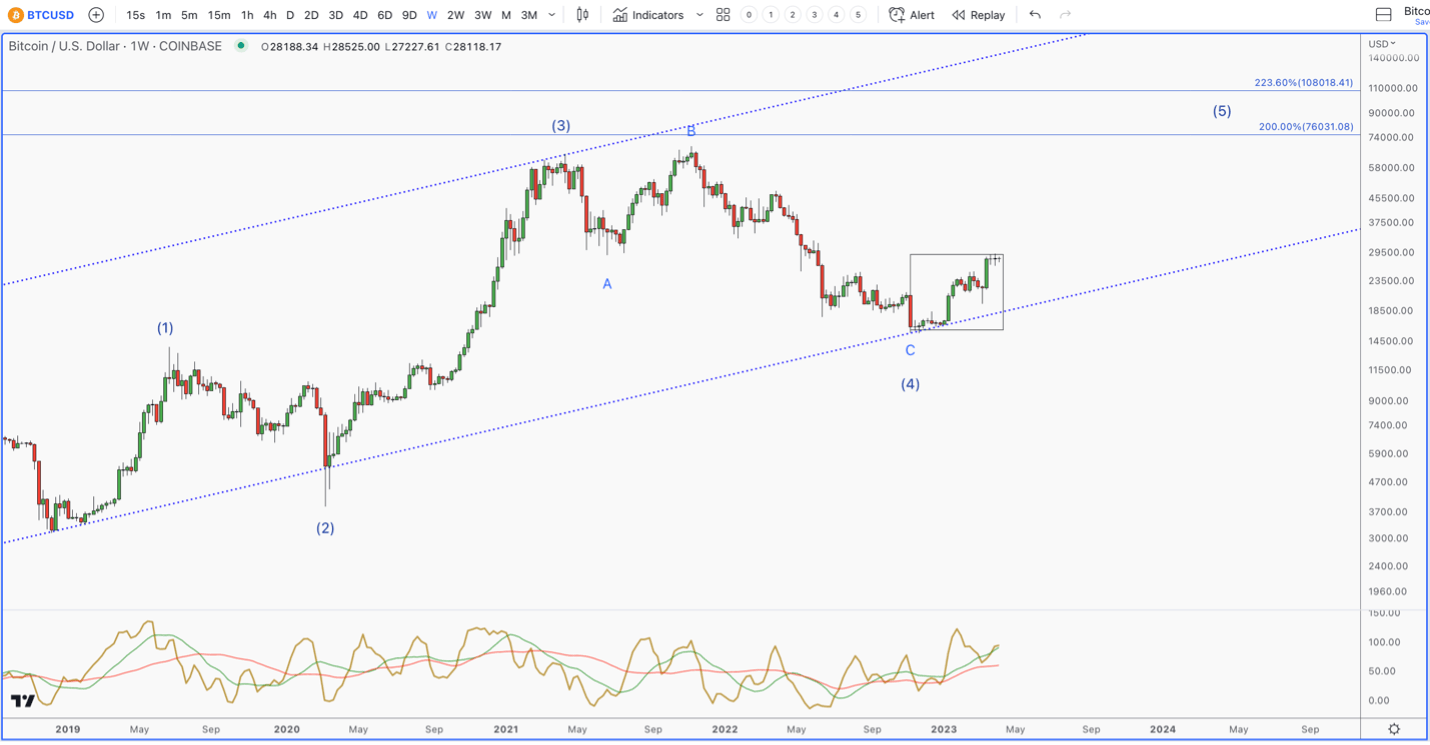
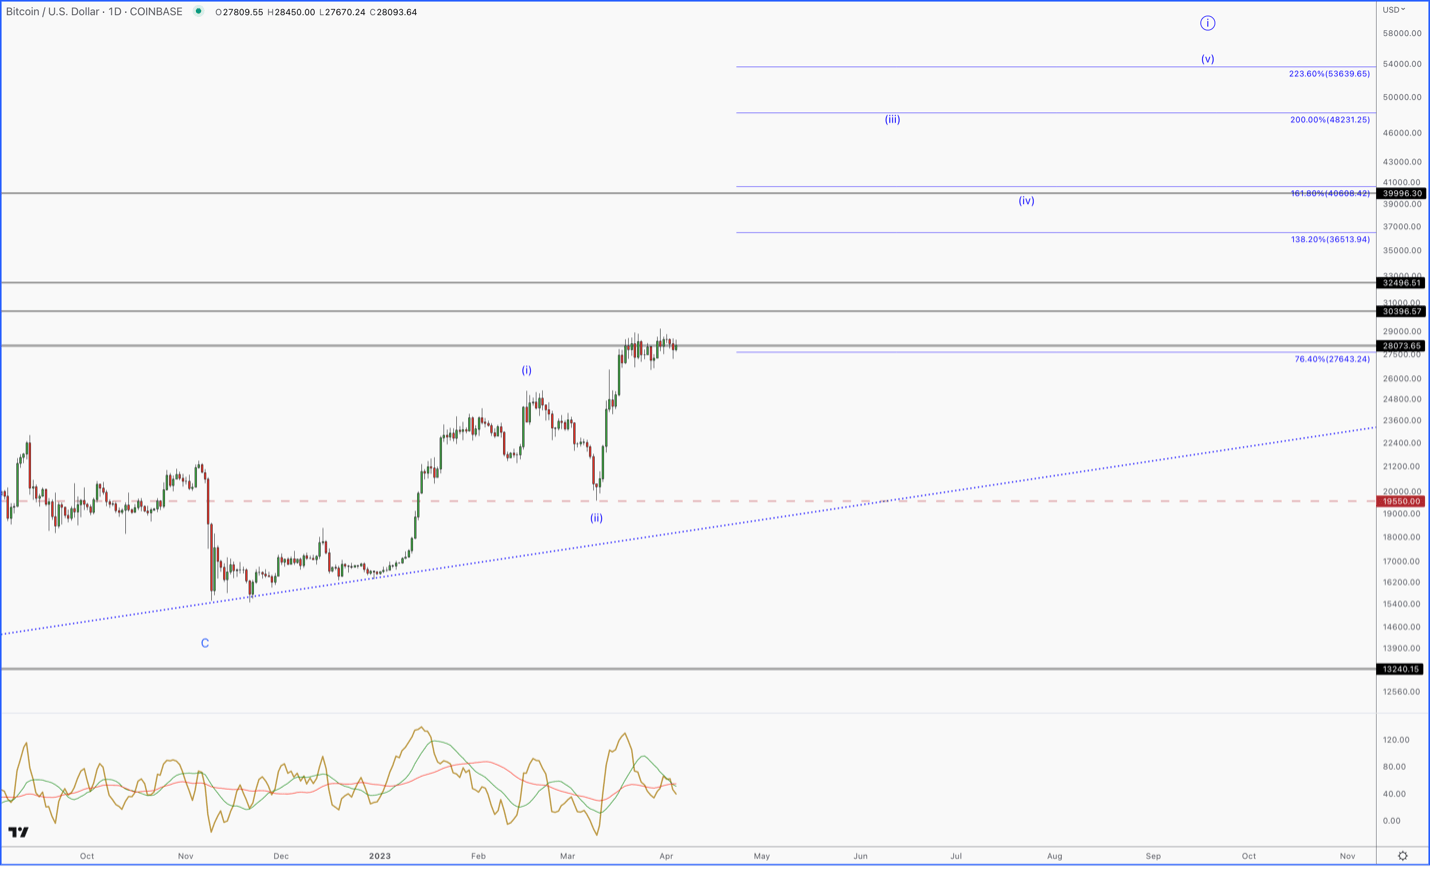
The big picture has Bitcoin starting its final 5th wave of a large degree uptrend that started in late 2018.

Bitcoin chart showing final 5th wave

This will remain my thesis as long as any weakness holds above $19,550. We’ll now zoom in on the current uptrend, which is the boxed off region on the chart above.

Bitcoin vs Dollar chart

What you can clearly see is a completed 5 wave pattern off of Bitcoin’s low. This is usually bullish. As long as $19,550 holds, any breakout above the current consolidation would be considered a buy from our analysis.

On-Chain Analysis

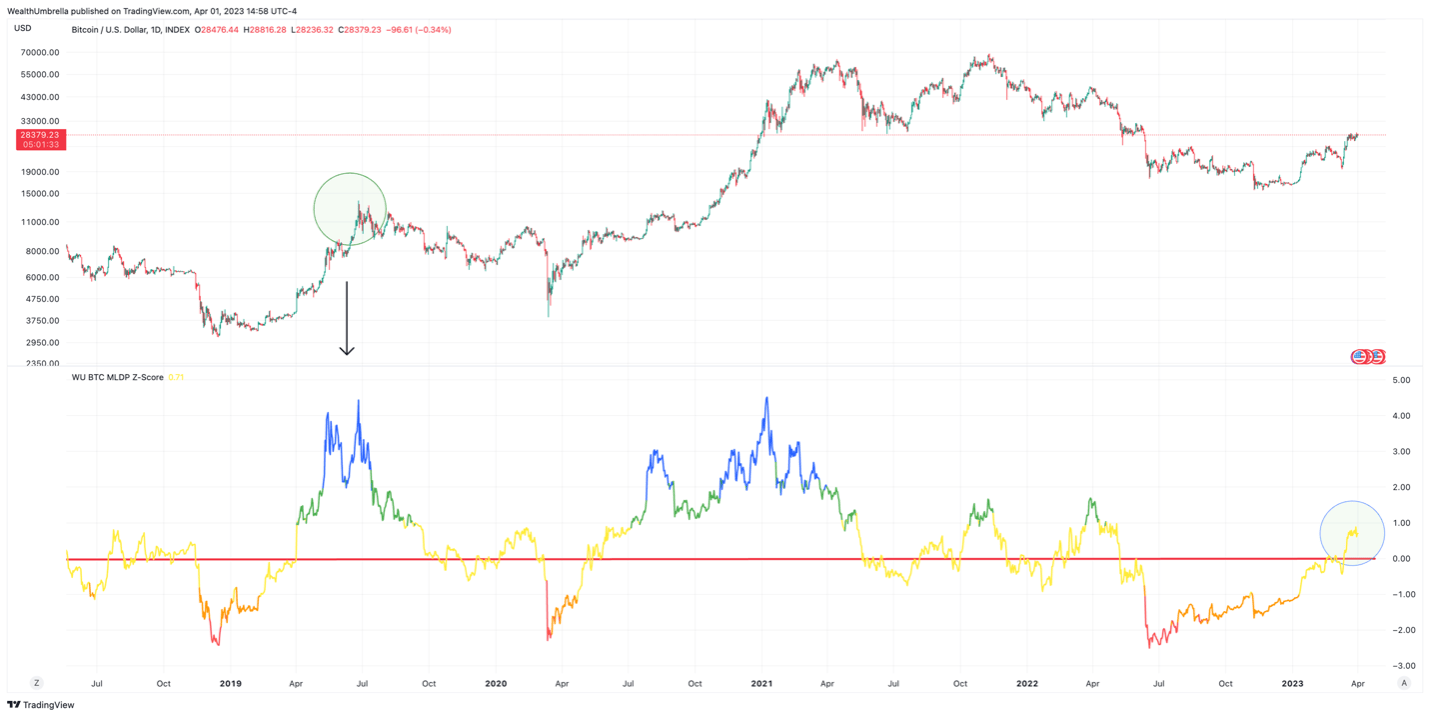
Our risk management partners, WealthUmbrella, are a team of AI and Machine Learning engineers and professors who have spent months analyzing all of the on-chain metrics in Bitcoin. The net result of their research led to a rather advanced risk-on/risk-off signal available to retail investors. The below analysis is the conclusion from their research. 

We previously mentioned that many of our on-chain indicators suggested that the November 2022 low might be the cyclical bottom. Since then, the price surge in Bitcoin has confirmed this low, as we have now moved into what we call the “green environment.”

This environment has historically been where we see the start of a new cyclical uptrend. In such an environment, it's generally better, from our research, to stay in the market. However, just because we believe that the bear market is likely over, doesn't mean we are ready for a moonshot. Historically, once we initially move into our green environment, what follows has typically been quite uneventful. We tend to see price action trade sideways-to-up for many months with relatively low volatility.

This doesn't mean that, given the context, we couldn't see another black swan event interrupt the green environment. We saw this when COVID suddenly pushed us back into our “red environment” in 2020. This was an unusual event that is accounted for in probabilities, which are historically low.

That being said, now that we have a nearly 90% increase from the November low, we must conclude that this appears to be more than just a bear market bounce. In fact, many of our on-chain metrics (InvestorCap, RealizedCap, ThermoCap) are now out of their bottoming zone. This is telling us that the overall ecosystem's economic has recovered significantly.

What Our On-Chain Metrics Are Signaling

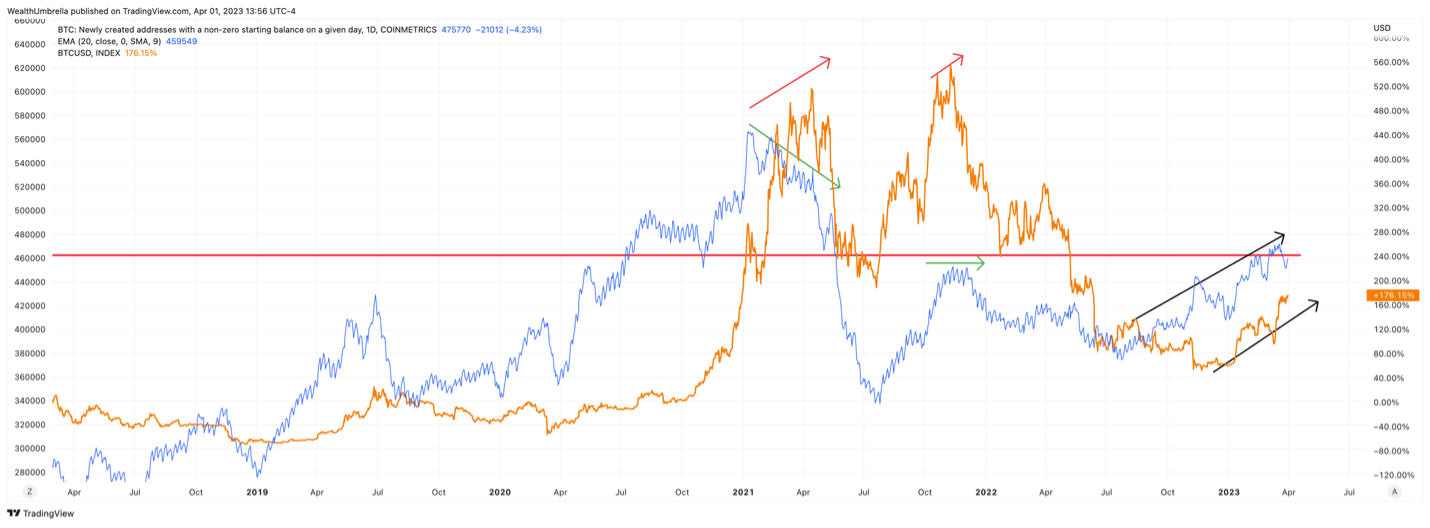
There is a popular saying in finance – “when there is no one left to sell, there is only direction the asset can go” Interestingly, this saying can be quantified through analysis of on-chain metrics and patterns. One way to monitor this is by looking at the number of newly created BTC addresses.

After the 2018 bear market, large upward moves in price were accompanied with a sharp increase of first time buyers in Bitcoin. The below chart measures newly created Bitcoin addresses with a starting balance of $0 (in blue) compared to Bitcoin’s price (in orange).

After a small dip in price in late 2021, we returned almost to the local high, but this time the number of new addresses decreased significantly. The same pattern occurred with the 2020 cyclical top, which saw a progressive loss of interest from newcomers. However, this is currently not the case, as we continue to see an upward trend in this metric in sync with the price action.

WealthUmbrella Bitcoin chart

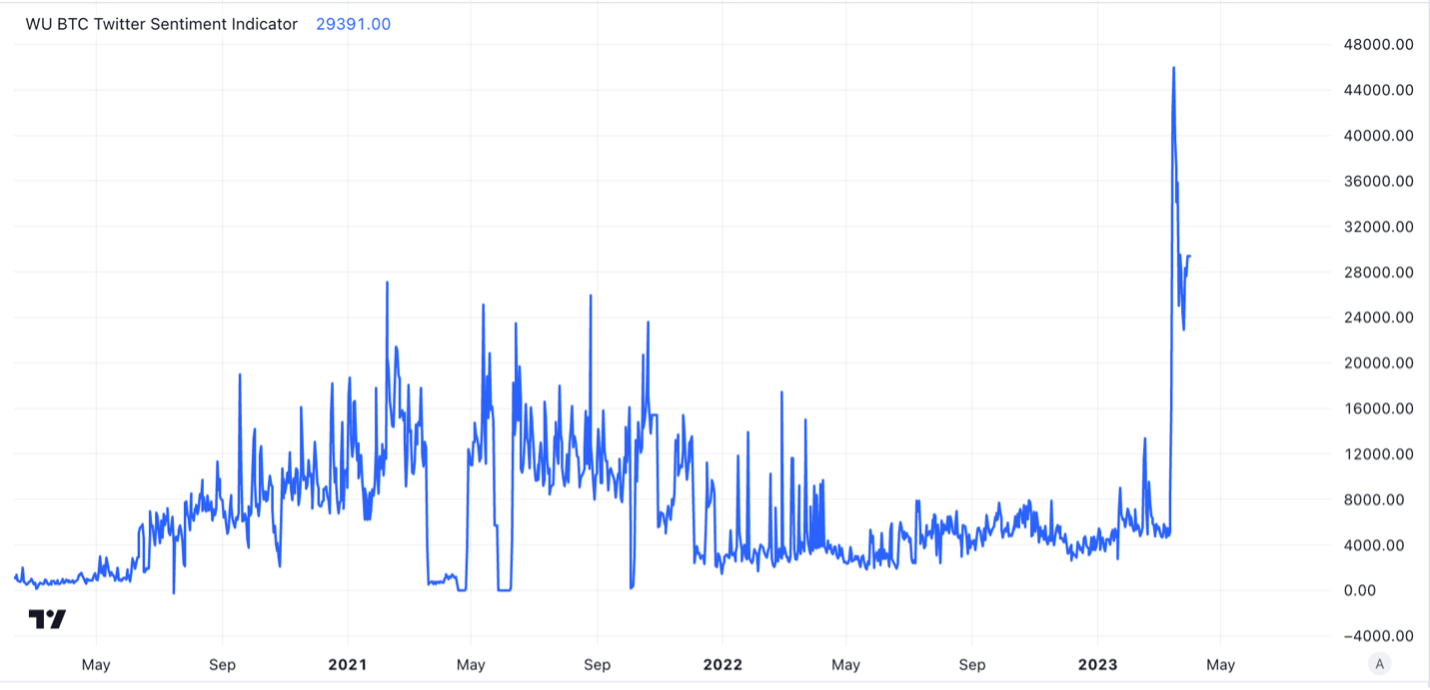
This increase in interest with Bitcoin is being accompanied with the largest spike in net positive posts about Bitcoin. Our Bitcoin Twitter Sentiment indicator recently clocked all-time record of 46,000 net positive Twitter posts about Bitcoin on March 16th, which was around the time the banking crisis in the US was at its peak. 

WealthUmbrella BTC Twitter Sentiment chart

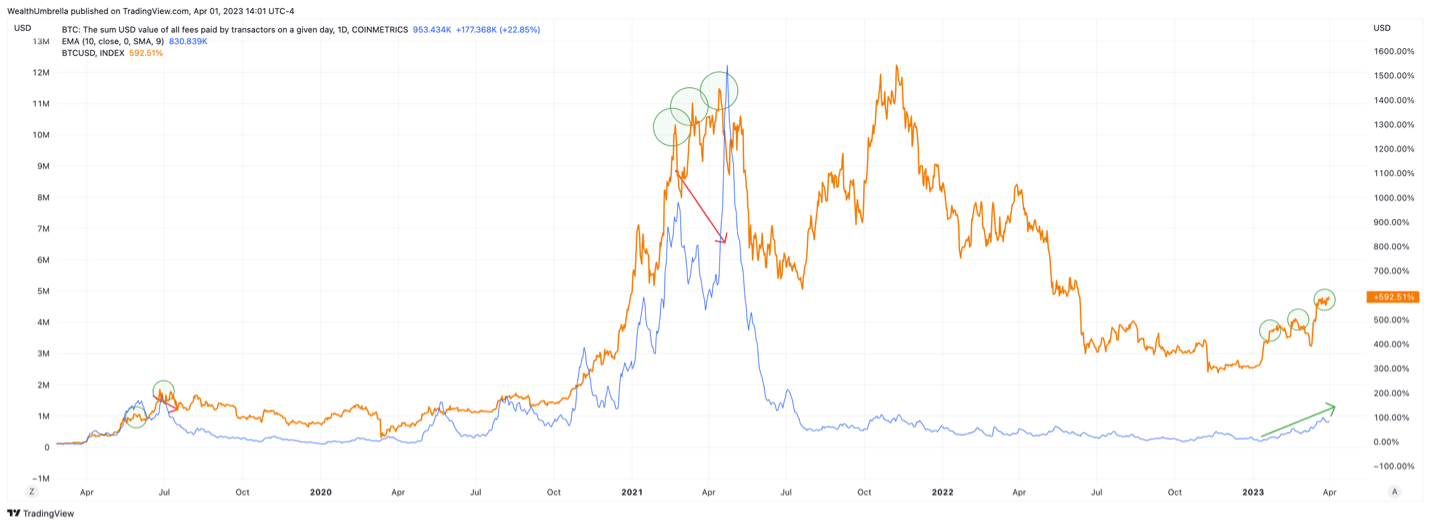
Another interesting pattern can be found by analyzing the daily cost in US dollars to complete a Bitcoin transaction. Usually, as the price of Bitcoin rises, the cost to complete that transaction rises as well. Near a top, these fees often diverge and trend downward while the price continues higher. This is caused by fewer transactions being processed on the network. The current setup regarding this metric is supporting the bullish narrative, as both the price and this metric are trending in the same upward direction.

WealthUmbrella Bitcoin chart

One of our personal metrics that we created to help us identify normal overbought/oversold conditions vs. cyclical tops/bottoms is called the Metcalfe Law premium/discount metric. This indicator is telling us that Bitcoin is currently priced just slightly above its fair value, and that it  has ample room to run before we should get concerned. 

Bitcoin vs US Dollar chart

Another interesting phenomenon going on right now is that as price has been pushing up, we consistently made new all-time highs in the percentage of supply that hasn't moved in more than a year. This is encouraging because it not only signals a reduction in Bitcoin’s supply, but follows the same pattern we have seen throughout history during each significant price increase in Bitcoin.

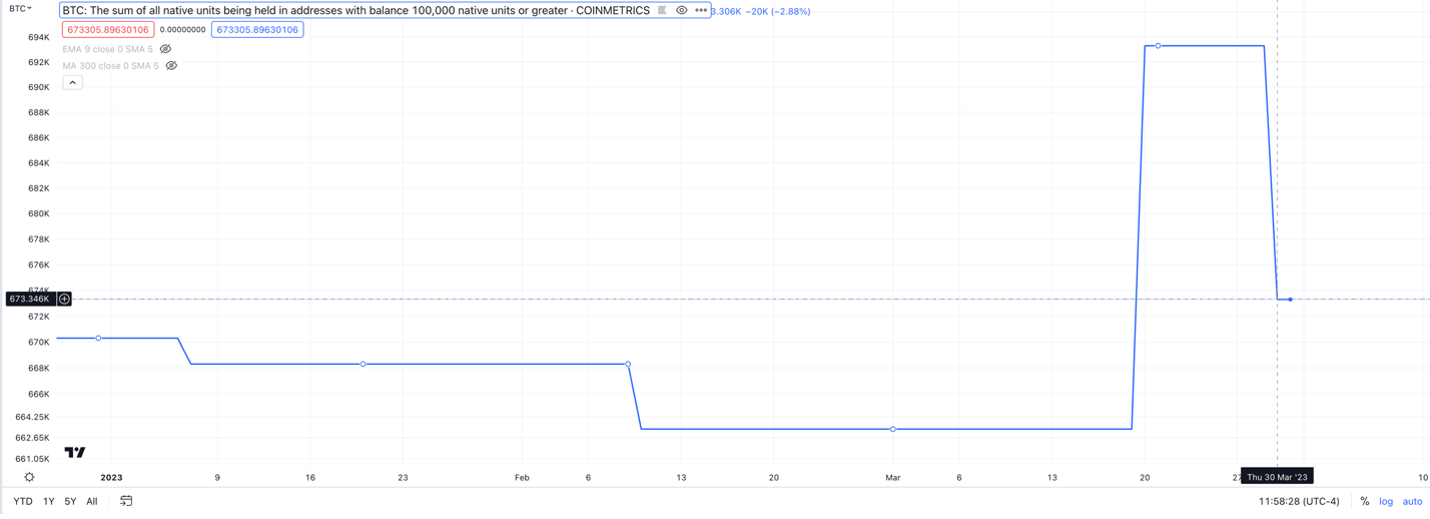
When Bitcoin starts to rise, this number tends to rise with price, further decreasing supply. As of recently, 68.09% of the supply in Bitcoin hasn't moved in more than a year, which is encouraging.

Also worth noting, the supply that hasn’t moved in over a year came down to 67.17% on Thursday, March 30th, 2023, due to a whale dumping around 20,000 bitcoins.

Bitcoin chart

Our analysis confirmed that this was sold for a significant loss. There is something strangely bullish about a whale dumping a large amount of Bitcoin at a loss, and the market barely dipping, then recovering within a day. Similar significant dumps have previously resulted in massive downward moves that continued for weeks.

Conclusion:

In Conclusion, according to Bitcoin’s creator, the asset’s true purpose is to solve the inherent risks within a centralized banking system. We have had no reason to truly question the need for this thesis in 13 years. However, recent bank failure, coupled with concerning financial charts around the world, could be confirming the potential realization of this original thesis. We believe that if this banking crisis spirals, it will be the catalyst for Bitcoin to push higher. Interestingly, this narrative is being supported with on-chain analysis and technical analysis pointing in the same direction. 

As long as WealthUmbrella’s signal stays in the “green environment” and price holds above $19,550, we will continue adding carefully to our Bitcoin position with real-time trade alerts sent to our research premium members.

What's next

My team’s impeccable track record on Bitcoin dates back to when we first launched our service in 2019. We’ve held Bitcoin at high allocations with the confidence that we will know when it’s time to add or time to trim substantially.

Knox Twit BTC

Twitter post: https://twitter.com/knox_ridley/status/1370959682584543237

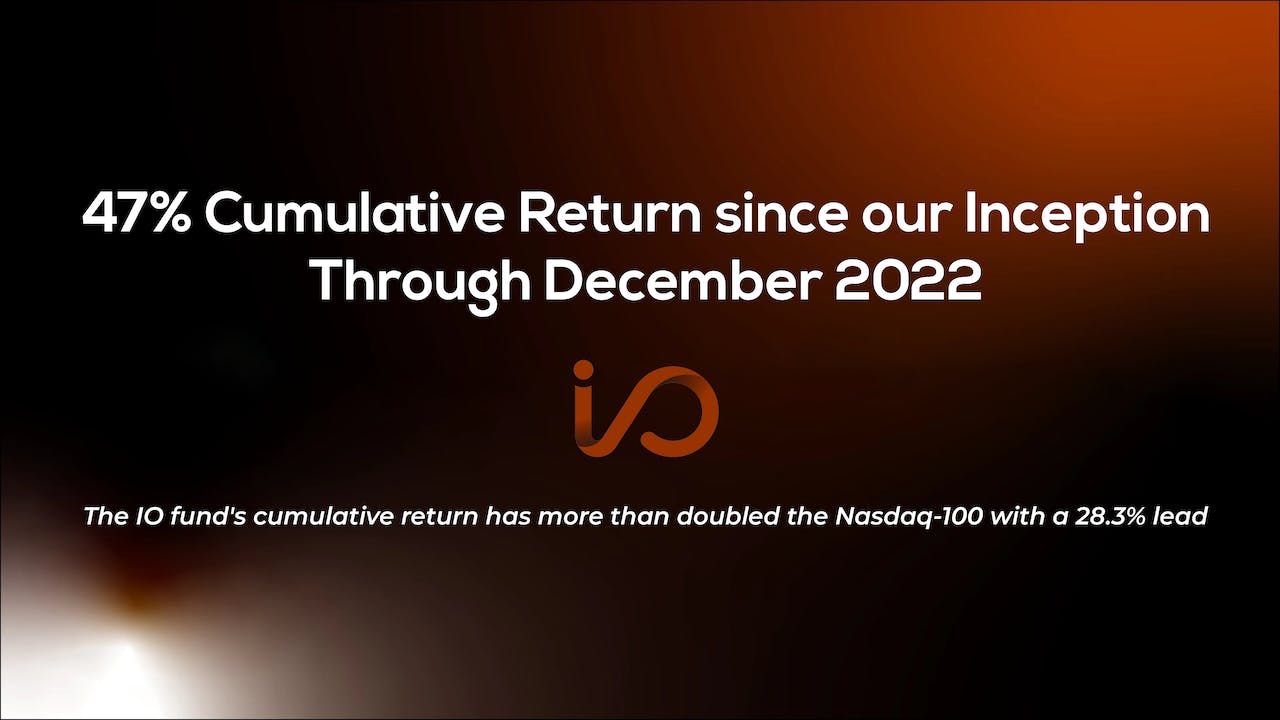
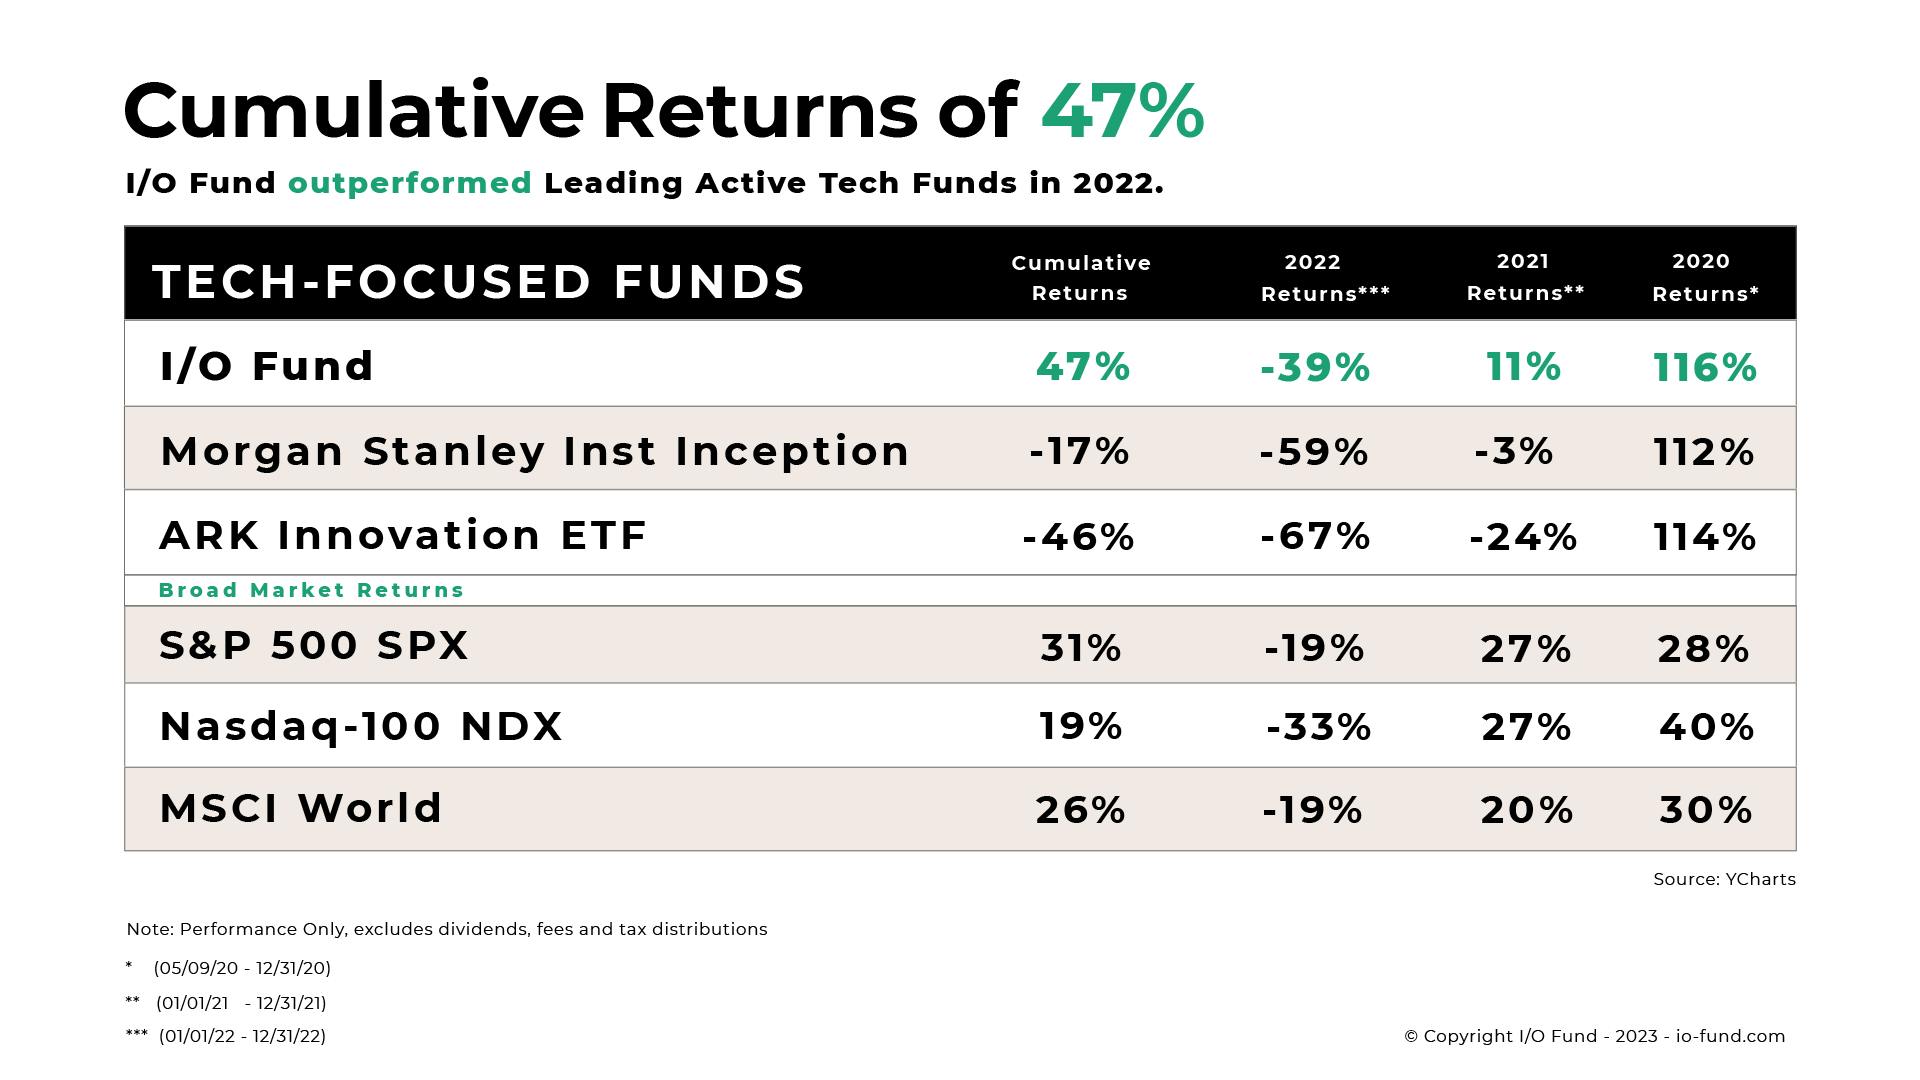
This helped us announce an audited cumulative return of +47% through 2022 when most all-tech portfolios were negative during the same time period.

Next Thursday, 4/13/23, at 4:30 pm Eastern, I will be holding a webinar for premium members to discuss the I/O Fund portfolio, plus if we will be buying, selling or hedging according to broad market signals and our automated hedge.

Not only did we identify a strong buy signal in Bitcoin in December, but we also identified Nvidia’s bottom in October. Bitcoin is a leading asset YTD in the market, and Nvidia is the leading stock in the S&P 500. We take gains often and we discuss this in our weekly webinars and on our premium site. Our automated hedging signal was developed by WealthUmbrella. All of this is offered in our premium service.

WealthUmbrella team contributed to this article.

POSITIONS REPORT – 4/3/23

For reference to terminology used, please look at technical analysis under our resources section here. Regarding the charts below, the vertical tan shades represent time factors. These are inflection points where we have high odds of something significant happening. More times than not, (3/4 of the time), they mark a turning point in the trend. So, what matters is the direction we are trending into these periods. Regarding the vertical lines, black lines represent strong support/resistance, while dark red lines mark very strong support/resistance.here. Regarding the charts below, the vertical tan shades represent time factors. These are inflection points where we have high odds of something significant happening. More times than not, (3/4 of the time), they mark a turning point in the trend. So, what matters is the direction we are trending into these periods. Regarding the vertical lines, black lines represent strong support/resistance, while dark red lines mark very strong support/resistance.

Elliott Wave count are meant to provide context. There is a pattern unfolding in real-time, one of which will play out. By monitoring price levels that are held/broken, it will help us figure out which one is in play

Broad Market

Weekly Chart

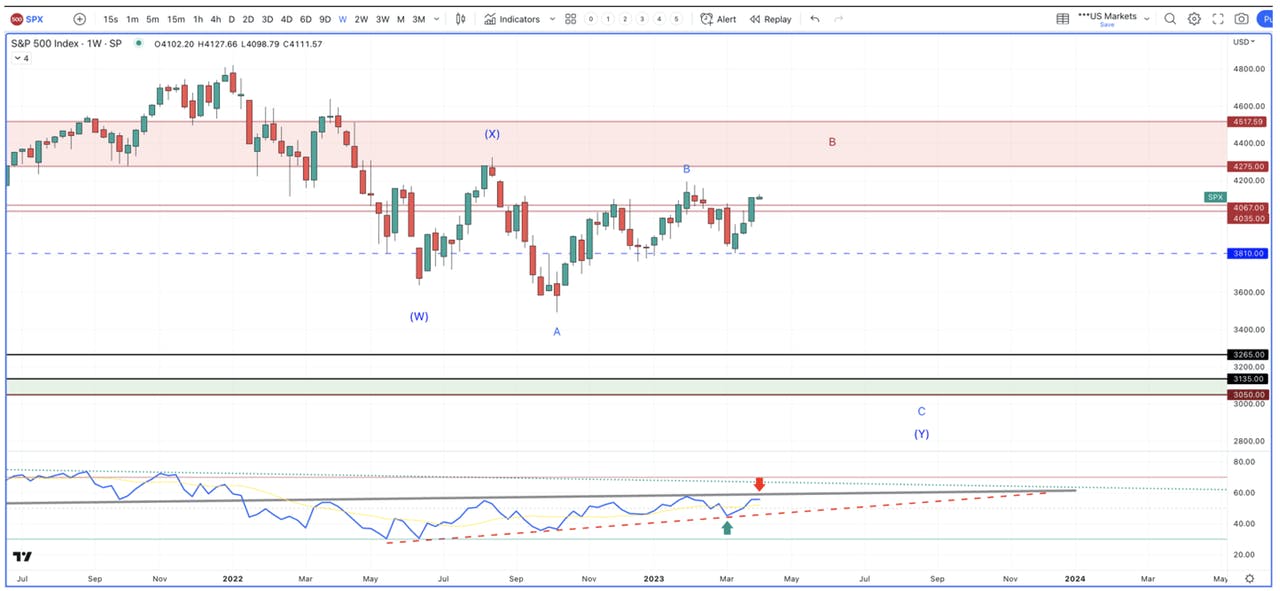
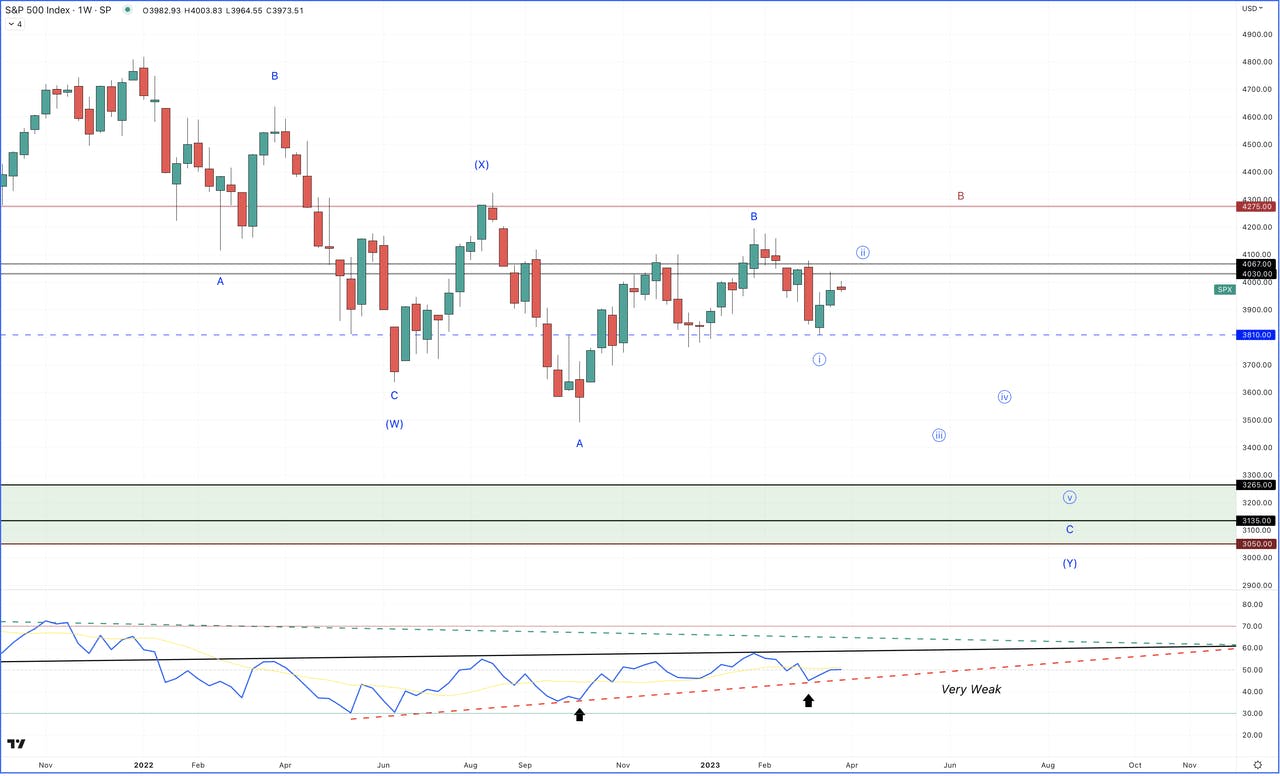
My perspective remains unchanged – have we topped, or do we have one more rally before a major top gets put in place? What has changed, which I will go into, is the possibility for a multiweek rally that could put my original target ~4400 SPX back on the table.

Please note the weekly RSI above. It is still within a bear market internal range. More times than not, the weekly RSI tips its hat first. We have clear price levels as well as RSI levels to help us determine what count will unfold.

Daily Chart

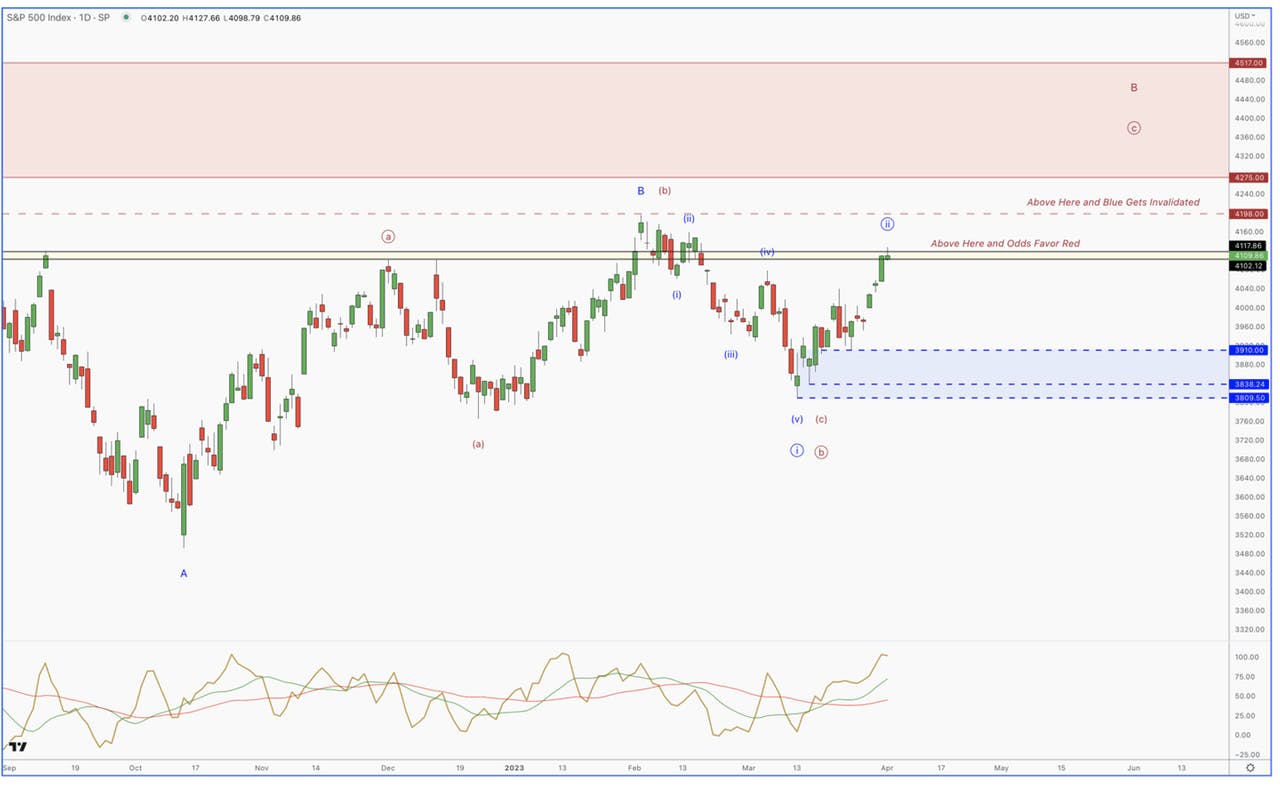
If we zoom in on the structure from the October low until now, we clearly have 3 waves up off of that low. This greatly supports that a bear market rally, to some degree, is developing.

The two counts I have in play are below:

Blue (Primary): we have topped and are working on a deep 2nd wave pullback. The higher this goes, the less likely that it is playing out. We have blown through the 4067 resistance and are now working on the 4118 region. Above the 4118 region and the odds of blue playing out go down substantially. We need to go above the start of wave 1 to completely invalidate it.

Red (Alternative): We have only completed two of three waves in a large degree bear market rally. This would have us in the early stages of the final push higher. From an Elliot Wave perspective, this final push higher will be a C wave, which always takes the form of a 5 wave structure. Wave 1 of 5 is complete, and April will be a 2nd wave retrace. The problem with this count is that wave 1 is relying on a rare pattern (discussed below) called a leading diagonal. These are not very common, and more times than not, fail, leading to a continuation of the predominant trend, which is down.

15 Minute Chart

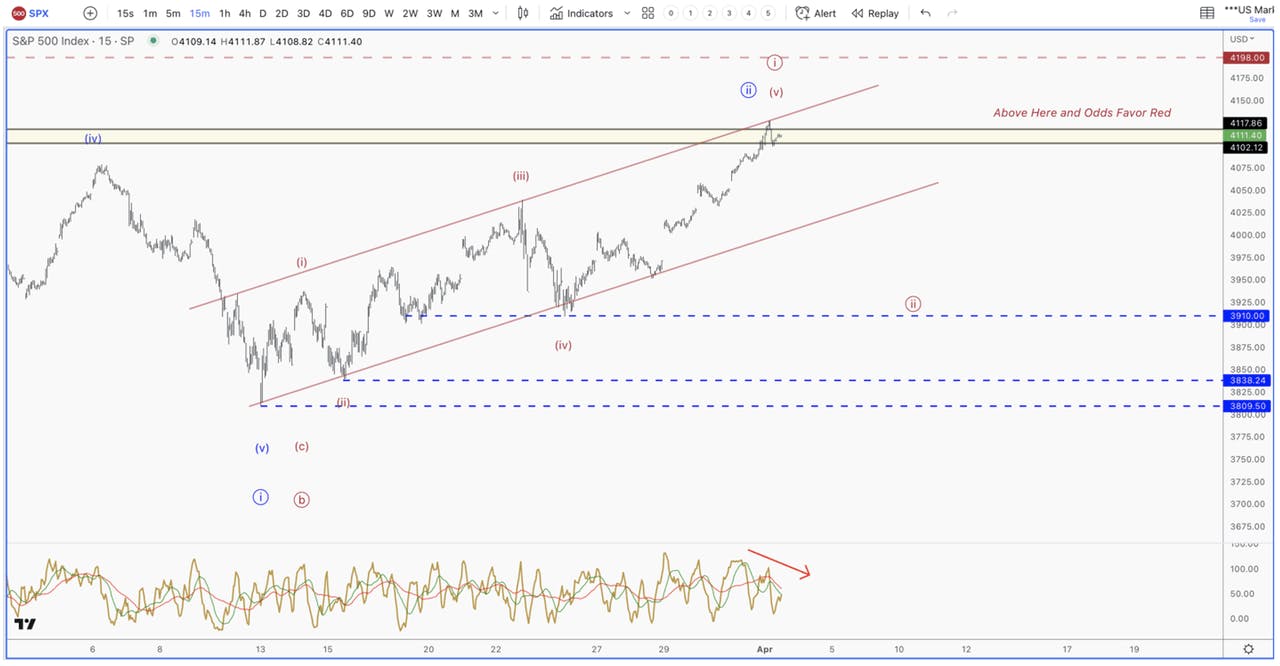
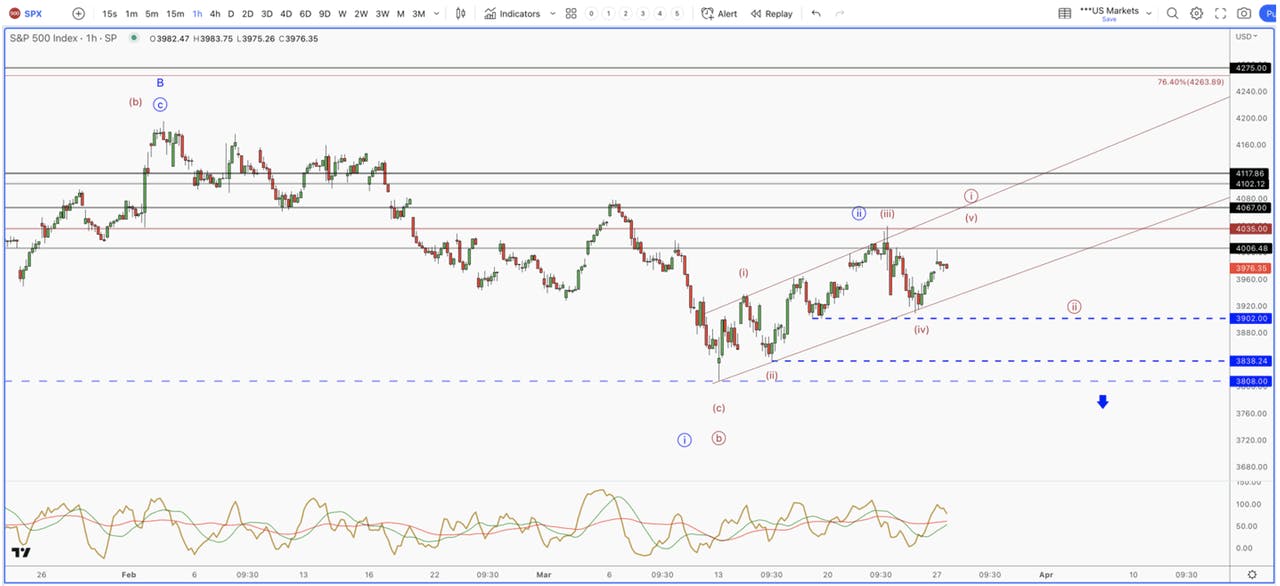
If we zoom in closer, we can see the leading diagonal pattern as wave 1 of the final C wave pushing higher.

What is interesting is that the pattern is complete. We have a 5 wave pattern that is very overlapping, and stays within a defined trend channel. In order to fully confirm that the red count is in play, we now need a 3 wave pullback in April that holds 3838, then a 5 wave uptrend that breaks above the 4118 level. We still have a lot to prove, so patience is required.

Price levels to monitor: Above 4118 favors Red. Below 3838 favors blue. Expect April to be bumpy.

Supporting Markets

NASDAQ-100

On a shorter time frame, note the termination wedge for the 5th wave, which is happening on decelerating momentum. This is clearly an end move for the uptrend in place, and it is clearly a 5th wave, which will be followed by a drop. How we drop will be very important, and probably the ultimate theme of this report.

If we see a 5 wave move from this top, it will support my blue count. If instead we see a 3 wave drop that holds the bear market trendline, then the red count, or some variation of the red count will become my primary, and we should have a large push higher into late Spring.

The only count that does not feel forced on NDX is the same complex bear market pattern playing out in SPX. However, I also cannot deny that a potential leading diagonal is in place for a larger 1st wave up. The parameters are in place to help us get on the right side of what follows – 5 waves down and the bear market continues; 3 waves down and we can start putting more cash to work.

Dow Jones Industrial

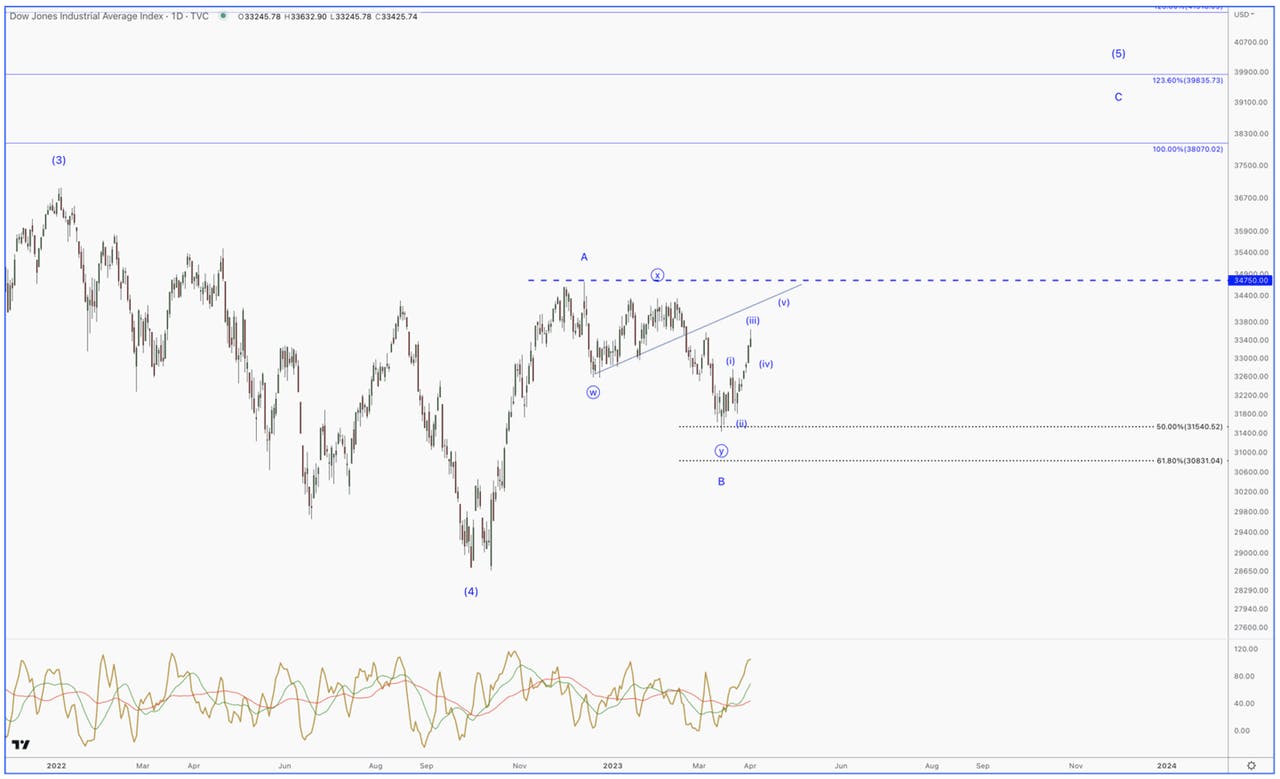
I have not talked about this index for some time. However, it was the leading index off the October low, and my larger count still suggests one more high is needed to complete the final 5th wave off the COVID low.

Note how messy the correction has been so far. We have not seen a clean 5 wave drop from the February top, which supports the scenario where we see a bigger uptrend over the next several months.

Also, note how the current bounce has only given us 3 waves up. If this morphs into 5 waves up, it will signal that the first wave of the larger C wave is in place. This will be a strong clue that we could be in for a bigger bounce, which supports the Alternative Red Count in the broader market.

Financials

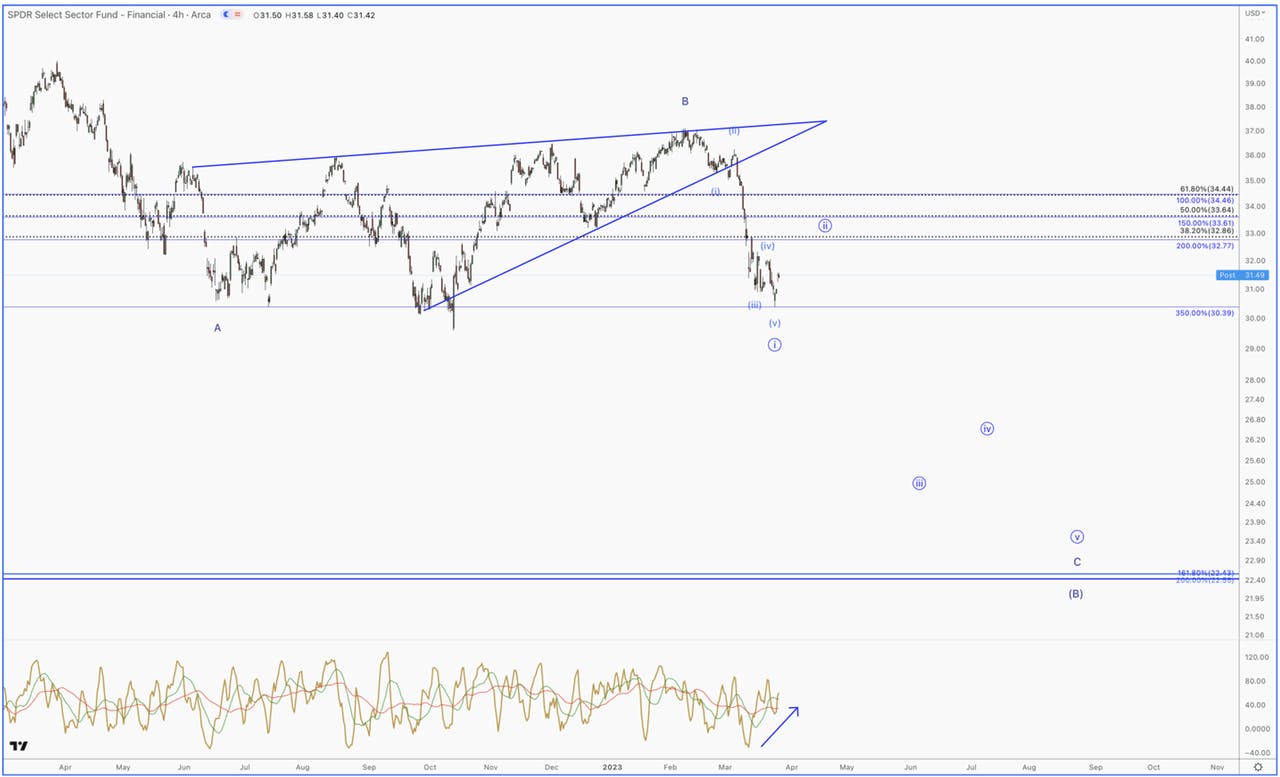
XLF continues to be the most important chart in the market. I believe it is leading the rest of the market. So, any new uptrend will likely only be temporary, which is supported by the macro environment.

XLF looks like it has given us a sharp 5 wave drop after breaking down from a large degree bear pennant.

This would line up with the SPX red count, in that a larger 2nd wave rally would unfold that fails to make a new high. As long as no more issues unfold in the banking sector, we could see this larger rally unfold.

However, it should be very clear that this rally would lead to large divergences, and likely not be the start of a new bull market. As long as XLF stays below the breakdown levels we saw just prior to SIVB collapsing, expectations for a new bull market should be muted.

Conclusion: if the SPX blue count gets invalidated, and we are setting up for a larger push into the 4275-4500 region, expect this rally to be limited in time, price and sectors that fully participate. We could see indices like the Dow make a push to all time highs, while the Russell 2000, S&P 500, and possibly the NASDAQ-100 make lower highs. The divergences will be key, if this plays out.

More Evidence to Support the SPX Red Count

Most readers prefer a strong thesis, and unwavering support for that thesis regardless of what unfolds. This would be similar to buying a stock based on a story and holding it without a stop. Investing is never that easy, and one lesson I learned throughout 2022 is to hold a strong thesis loosely.

As a portfolio manager, I am always asking myself where I am wrong, what will it take to flip, etc.? We are not in the business of being right, but in the business of maximizing profits and reducing risk.

Therefore, what you are seeing in this report is an active thought process that lays out levels, and markets that would determine us flipping to my Alternative Red Count discussed above in the Broad Market section.

I’ve been discussing how bad the banking sector looks through various charts. It is my belief that the banking sector has put in a major top and is coming close to bottoming out in the 1st large degree wave pointing down. This should give way to a rather large rally in the form of a 2nd wave, where we see many lower highs in the sector.

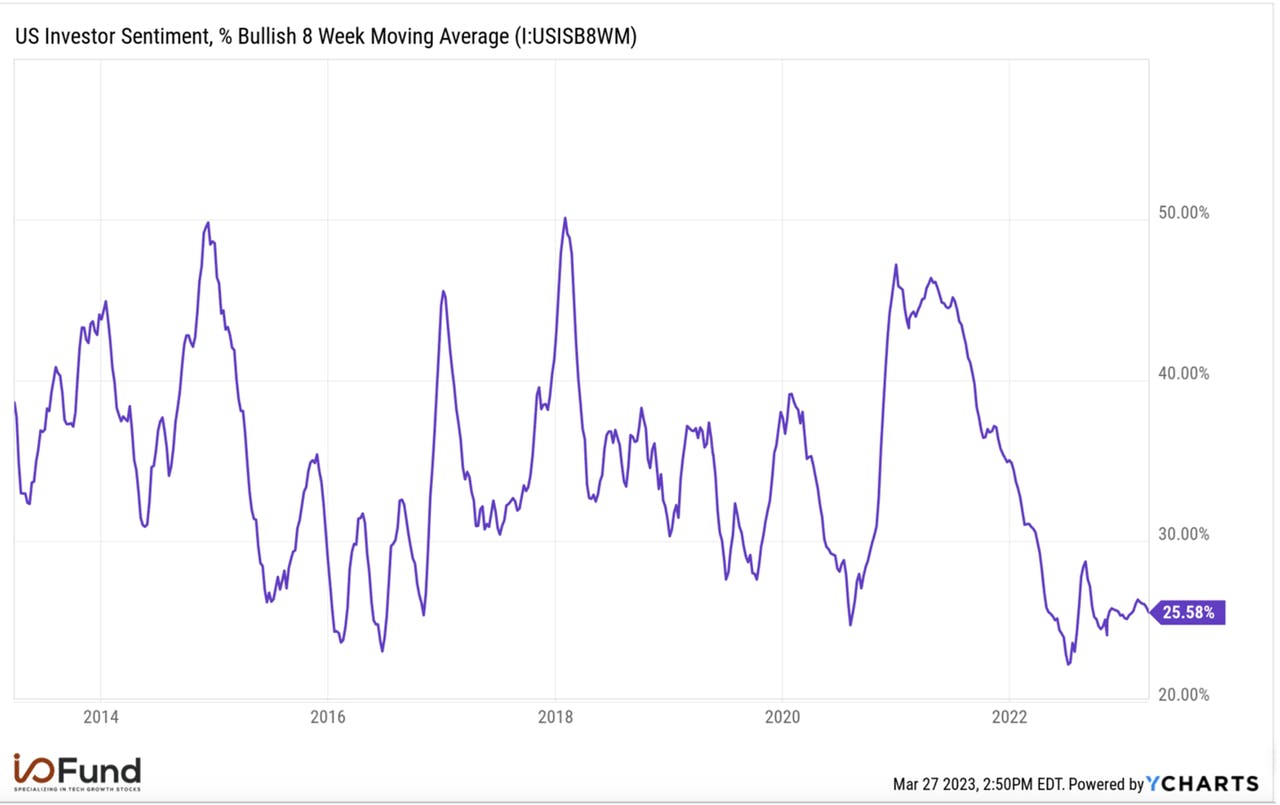
However, what cannot be ignored is that the rest of the market is NOT crashing with the banks. In fact, some sectors and stocks have moved higher while banks continue to crash. This coupled with the extreme bearishness that we discussed last week could be setting us up for a bigger rally into Spring.

Improving Breadth

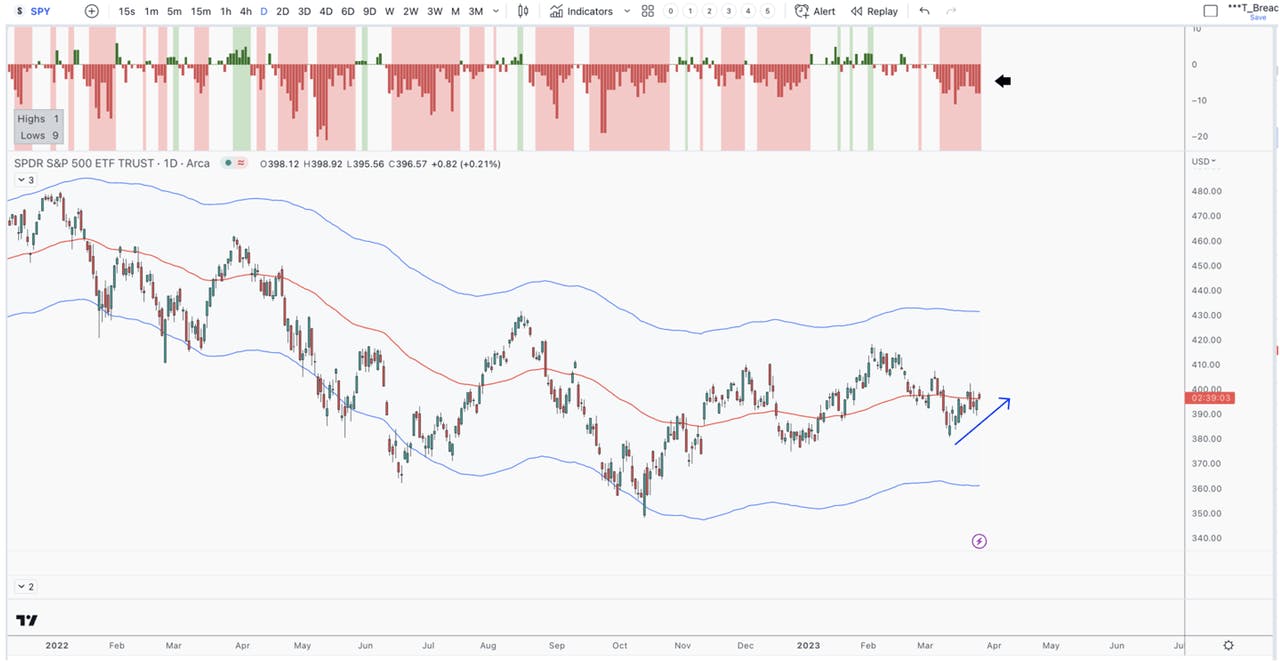
We’ve seen some bullish signals with improved breadth in the markets. While MSFT and AAPL were holding up the indexes for the last couple of weeks, we are now seeing an expansion of buys throughout the market.

The below chart tracks two of the three breadth indicators that I like to tracks. The one on the bottom is called the McClellan Summation Index. It’s a slow moving index that measures breadth within the broader markets. What is important to note is that it bottomed in an area that has led to many bounces, and it is clearly pointing up. An uptrend in this oscilator from these levels can lead to a bounce that lasts between 4-6 weeks, on average.

The second indicator is a volume oscillator that measures buying/selling volume within the NYSE. I use many techniques to gauge cycles and inflection points, Gann’s Time Factors being my primary. However, one that I pay attention to when it triggers is known as T-Theory.

The basic idea is here that we should see equal periods in time of cash leaving the markets as we do with cash entering the markets. This creates one cycle, and has an eerie accuracy on helping determine periods of strength into the future.

For those interested in the subject, the inventor of the theory, Terry Laundry, has years of his analysis and use of the theory on line here. I’ve also found this blog helpful in understanding more modern applications of the technique.here. I’ve also found this blog helpful in understanding more modern applications of the technique.

That being said, note how the volume oscillator has moved beyond the prior peak and into positive territory. This implies a period of strength into the May 19th region. As long as the prior low in the oscillator holds, this will remain intact. Below that low, and we tend to see sharp reversals in the price trend. If this happens into the April time factor, we will know what to do.

Dow Cycles

At the beginning of the year, I laid out a general path using an amalgam of various Gann Cycles. They are weighted towards the more important cycles. These roadmaps have a history of providing key dates as well as general paths throughout the year. This is what we posted at the start of the year for the Dow.

I put this roadmap in the background because the rally in January was muted on the cycle. However, it called for weakness in February and a low in late March, which has been shockingly accurate. If this roadmap is playing out, we should see the April Time Factor that I have been discussing as a 3rd wave breakout with a topping pattern into late -May/early-June. Note how the top here lines up with the top in the T-Theory chart above.

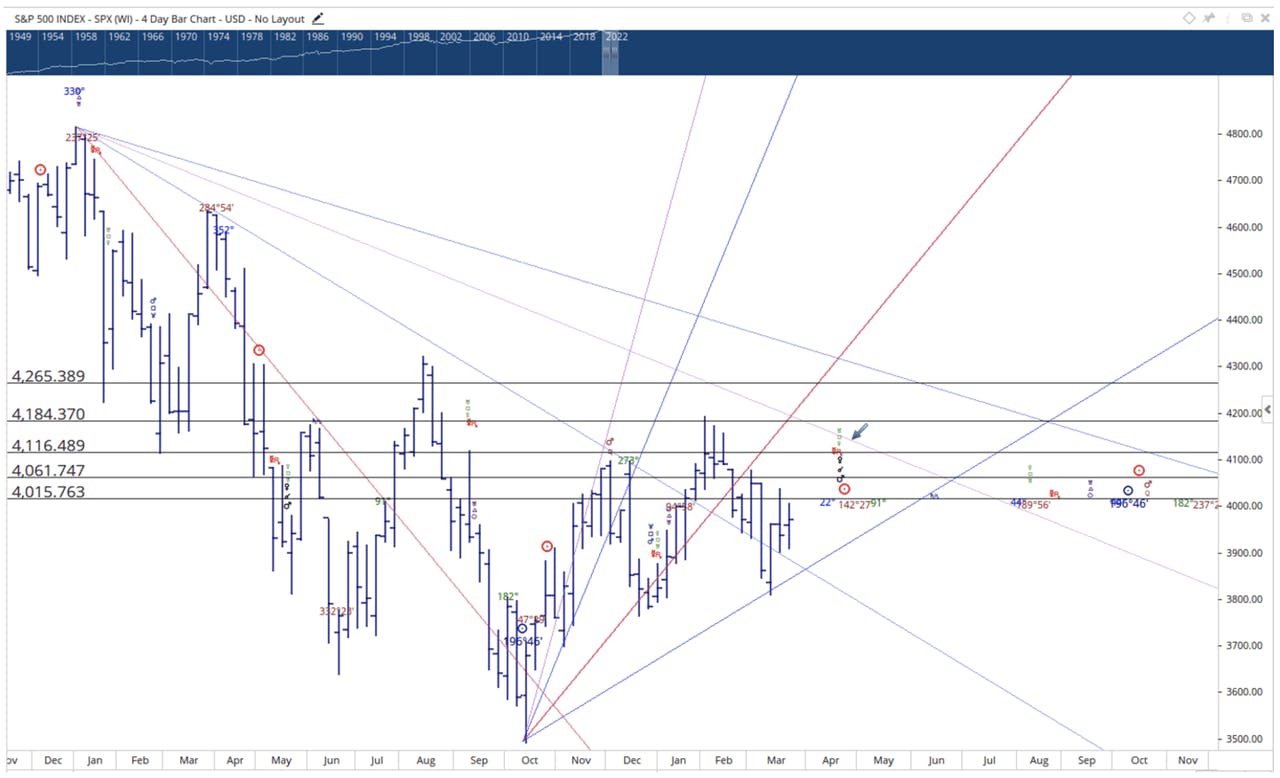
SPX Time Factors

Without question, one of two of the biggest time factors for 2022 is April 12-28 (August being the next big one).

You can see the stacked cluster of cycles in the chart above. These stacked cycles tend to mark major inflection points. In short, they tell you when to look for something important. The "what" is always determined by how we are trending into the time factor. So, if we are trending down into that cluster, then we should look for a low, or vice-versa.

There is also a single cycle for SPX in late May that lines up with the period outlined above. I have a hard time imagining the mega cycle cluster in April will not be as important as the lone cycle in May. But, let’s say that we do see a 3rd wave breakout in April, or some kind of a 2nd wave low taking shape into the April time factor. We will then know that, with high odds, the SPX red count is likely taking us into late-May/early June. So, unbiased, we have to be as objective as possible as we move into April. Knowing when to look for a big inflection point is very valuable information to have.

Macro

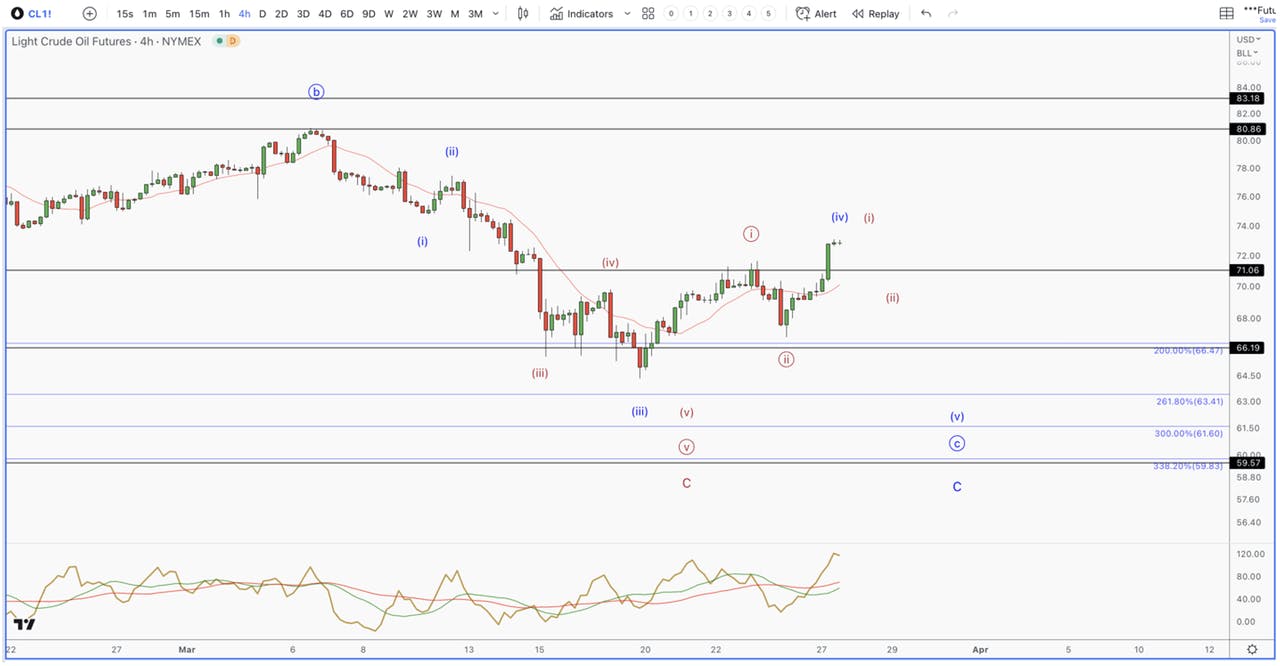
OPEC announced a surprise cut to the world’s oil production. We have been talking about the bullish setups in Crude as well as Gasoline for many weeks. These bullish setups have been developing in light of very deflationary forces hitting the market, and we may be getting the trigger needed to confirm this thesis.

Crude

Today’s gap should mark wave 3. We need a 4 then a 5 to new highs to fully signal a low is in. If this happens, then my lone thesis that oil is setting up for a push to new highs is likely in its early stages.

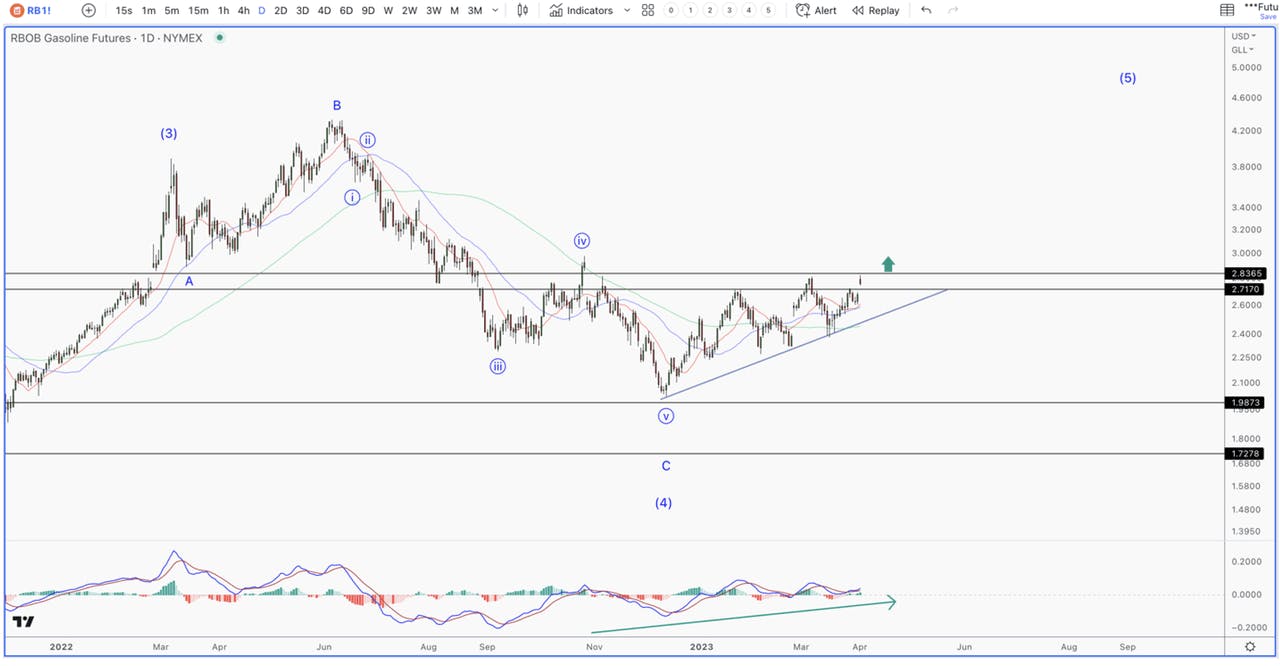
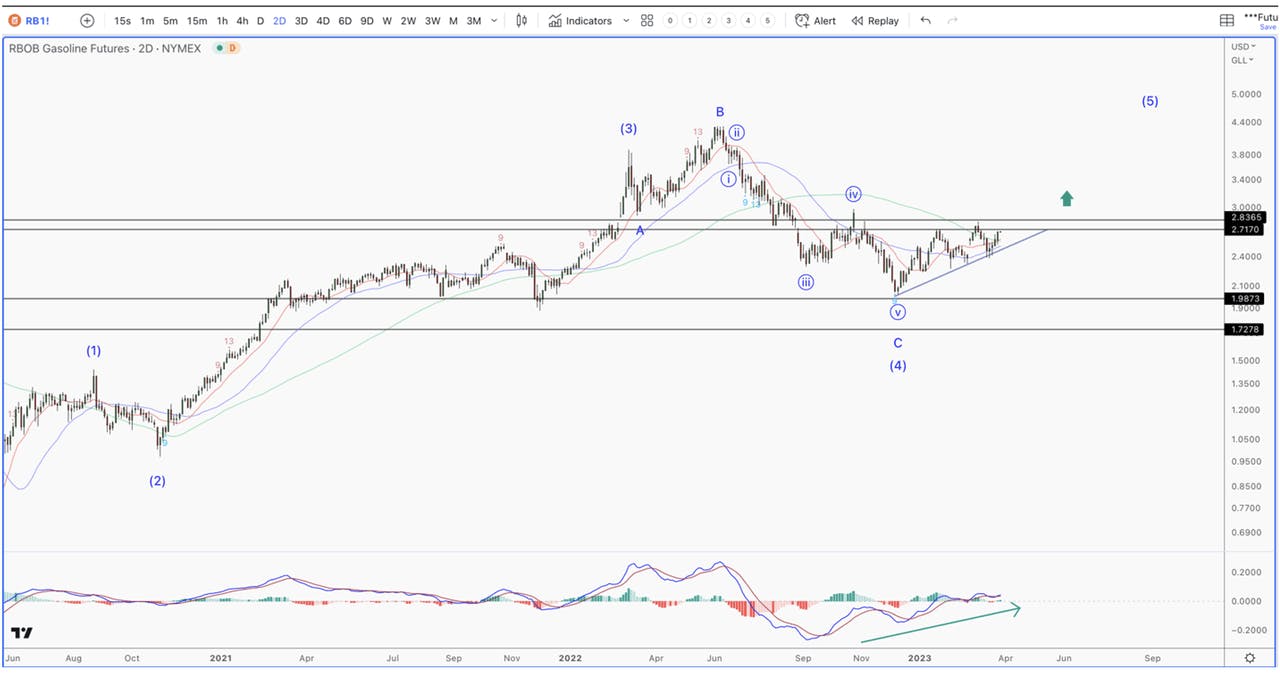
Gasoline

This would line up with Gas breaking above the $2.8 barrier.

If these two things happen, expect an inflation impulse to return, and at exactly the worst time for the FED. The market is rallying on a pivot with a terminal rate below 5%.

The FED decided in their last meeting that banks are sound, and inflation is still too high. There was a split tone in a hawkish FOMC statement and a dovish speech by Powell that followed. James Bullard, President of the St. Louis Federal Reserve Bank, and voting member of the FOMC, stated last Friday the need to increase rates along with the terminal rate by year end. If energy does break out, coupled with the Wednesday PMI Services coming in too hot, along with a jobs report on Friday, we could see equities get hit, especially high beta stocks.

Furthermore, of the 14 countries that reported manufacturing PMIs for March, 10 countries slowed, and 7 were in contraction. For those arguing that a China reopening will offset global monetary policy, this data is not encouraging. Eventually, the recession in global manufacturing will spill over into services, which will trigger the recession being told in the bond market.

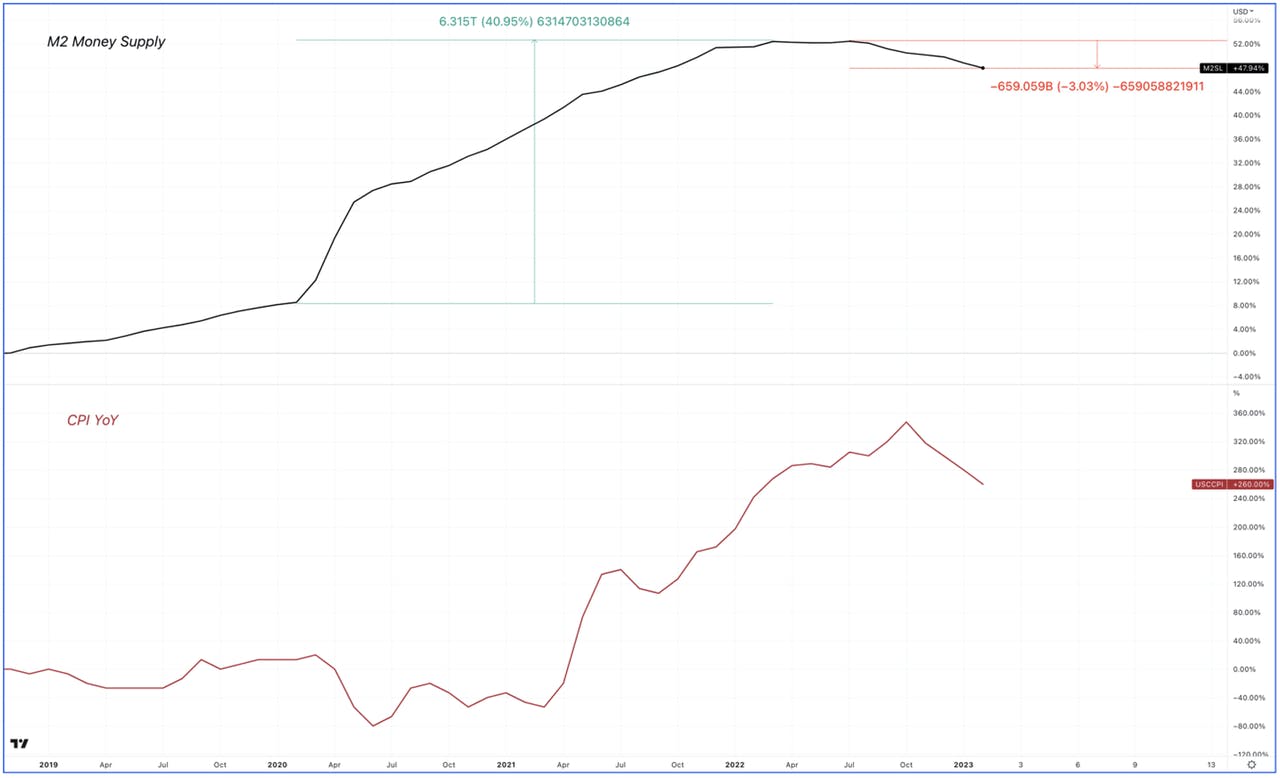
It’s also worth noting what is happening with the M2 money supply. First off, we are seeing the largest drop in the money supply since 1930. M2 has gone flat and had minor dips, but it has remained relatively consistent in how it has expanded. So, to see any contraction is quite concerning, especially one as large and consistent as the current one.

Milton Friedman taught us that inflation is a monetary phenomenon, and that the M2 layer of the money supply is arguably the most important for tracking inflation, disinflation and deflation.

The FED controls bank reserves, not deposits. In order for bank reserves to become bank deposits, which is one aspect of M2, banks have to loan money out. The COVID rescue plans, were fiscal injections directly into the M2 money supply. We saw M2 increase by 40%, which has never happened in modern market history. This led to a sizable increase in money market funds, bank deposits, as well as brokerage accounts. This is liquid money ready to be used within the economy.

The interesting aspect about M2 is that it is a leading indicator. We tend to see the increase long before we feel it in the economy. Note how M2 began increasing a full year before it showed up in the CPI print above. Also, as we are learning the hard way, it takes a lot of time for this increase to work its way through the economy.

Once the decelerating M2 hits the economy, we should see it affect business fundamentals in a noticeable way. This should lead to unemployment as well as revisions downward. It is not the type of macro factor that has historically led to expansions, and is one more factor among many that has painted the worst macro environment in decades.

I/O Fund Portfolio

Please keep in mind that our largest position is currently cash. Though we have reduced our cash positions from 30% – 22%, we do not plan to be fully allocated if the SPX Red Count plays out. We will stay in an elevated cash position until we see evidence that a new bull market is starting through: 1) favorable price action in global markets; 2) a new Liquidity Cycle is starting (discount window borrowing is NOT QE); 3) an averted Credit Cycle within the banks. As of now, neither of these things are supporting a new bull market.

Hedge Signal

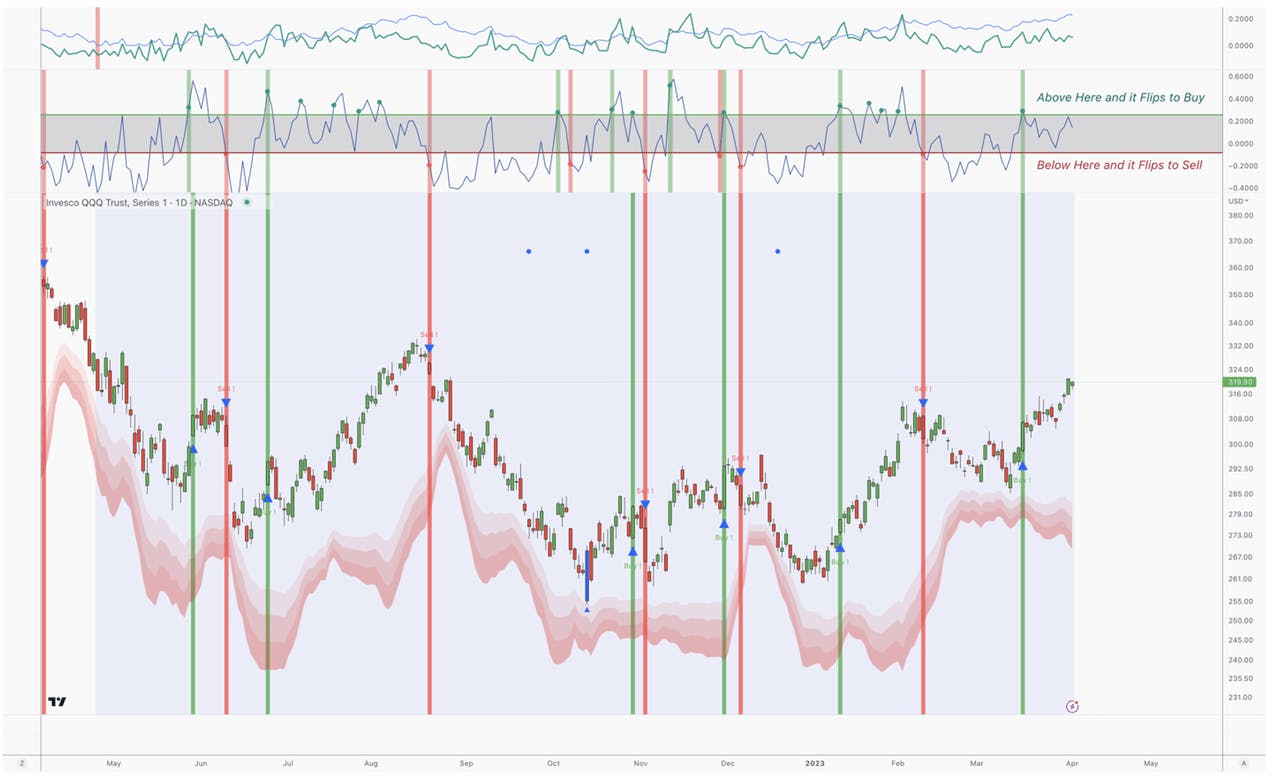
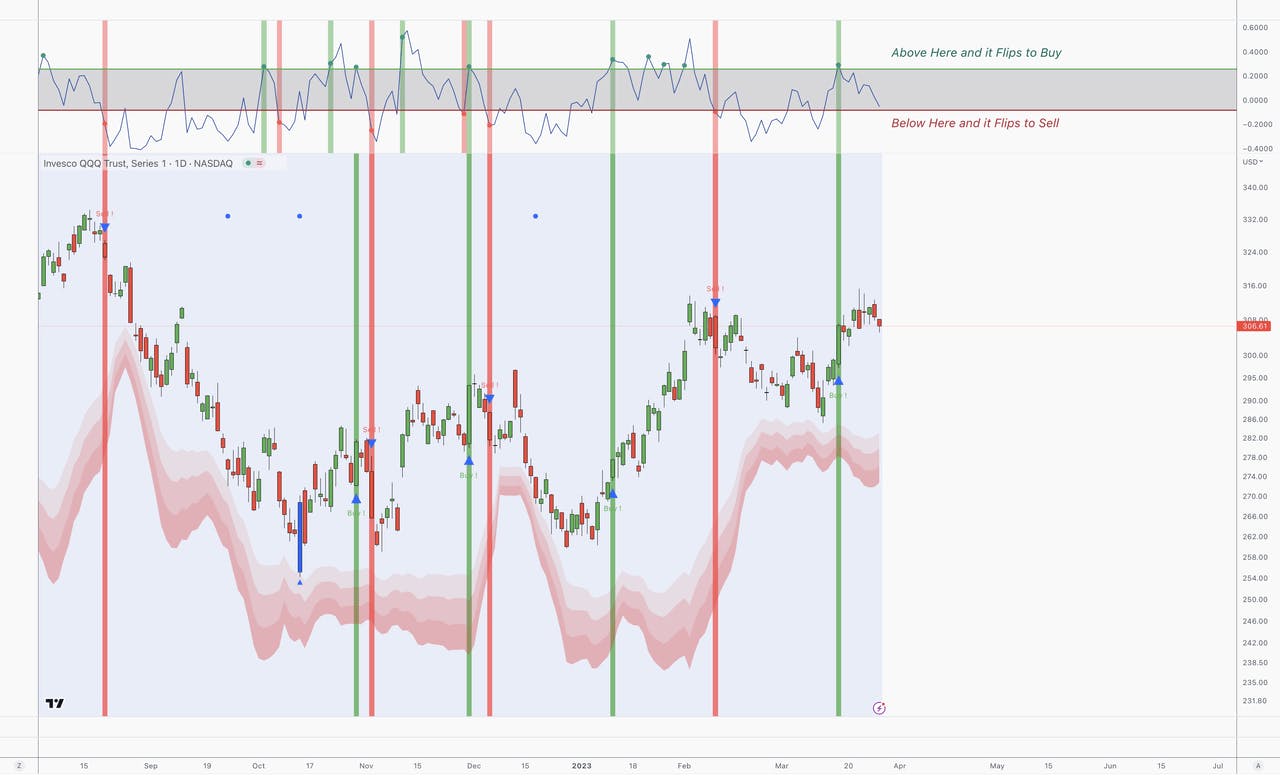
Our hedge signal remains in Bear Market Bounce mode. So, expect more whipsaws than normal, as we lean into it to tell us when to get more cautious. The positions we have purchased over the last month all have stops that will move up with price.

NFLX

Between $379-$420 will be the high risk zone. Do not be shocked to see us cut NFLX in half if we get into that zone.

NVDA

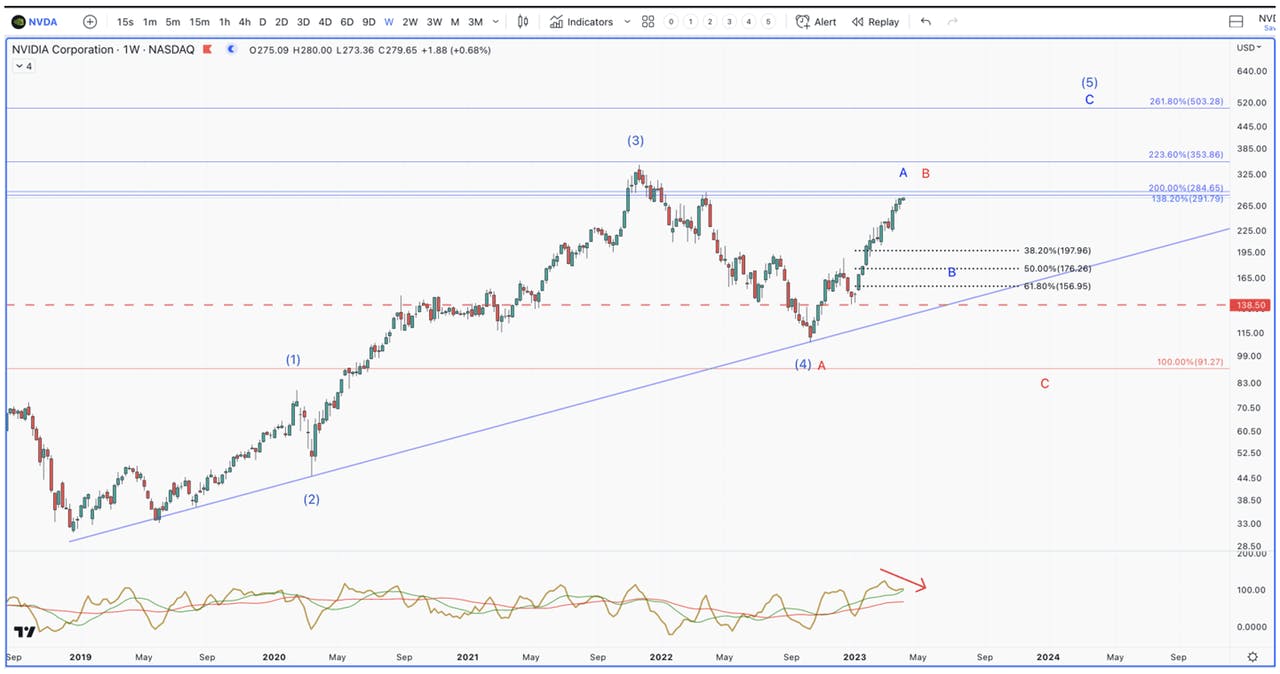
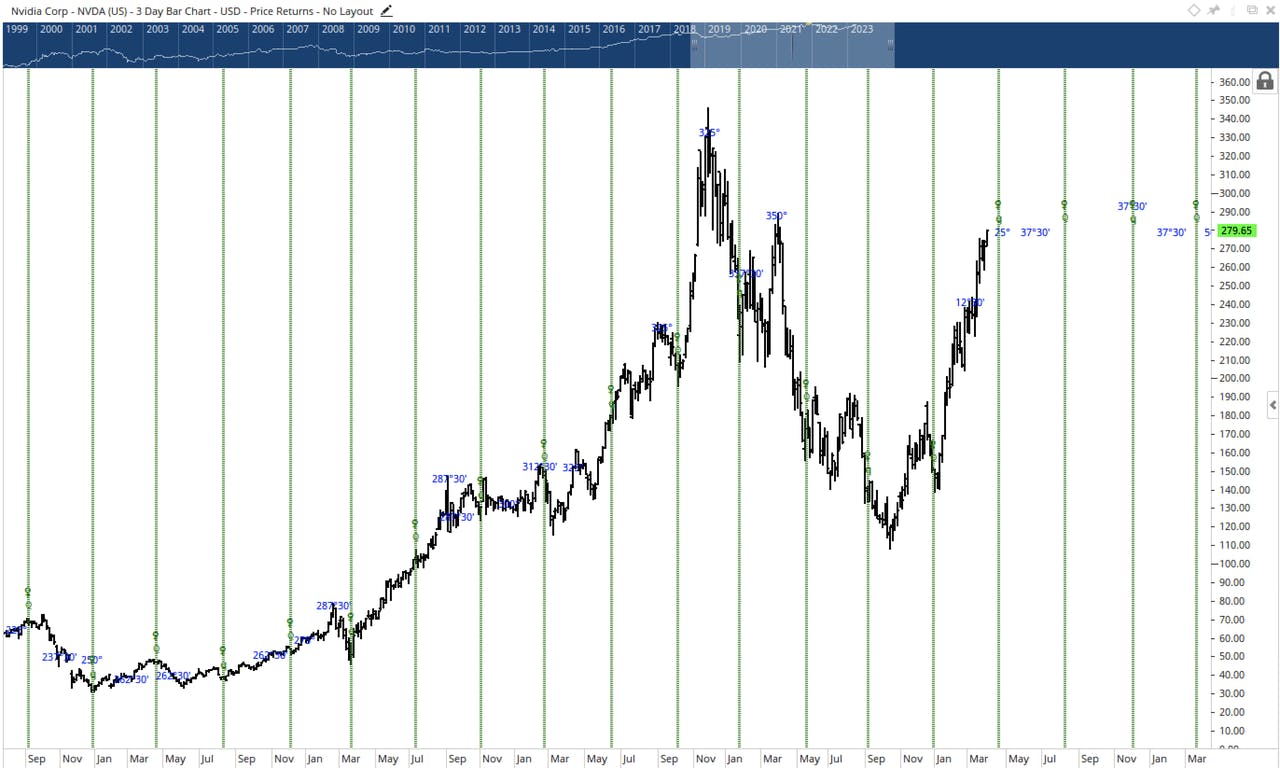
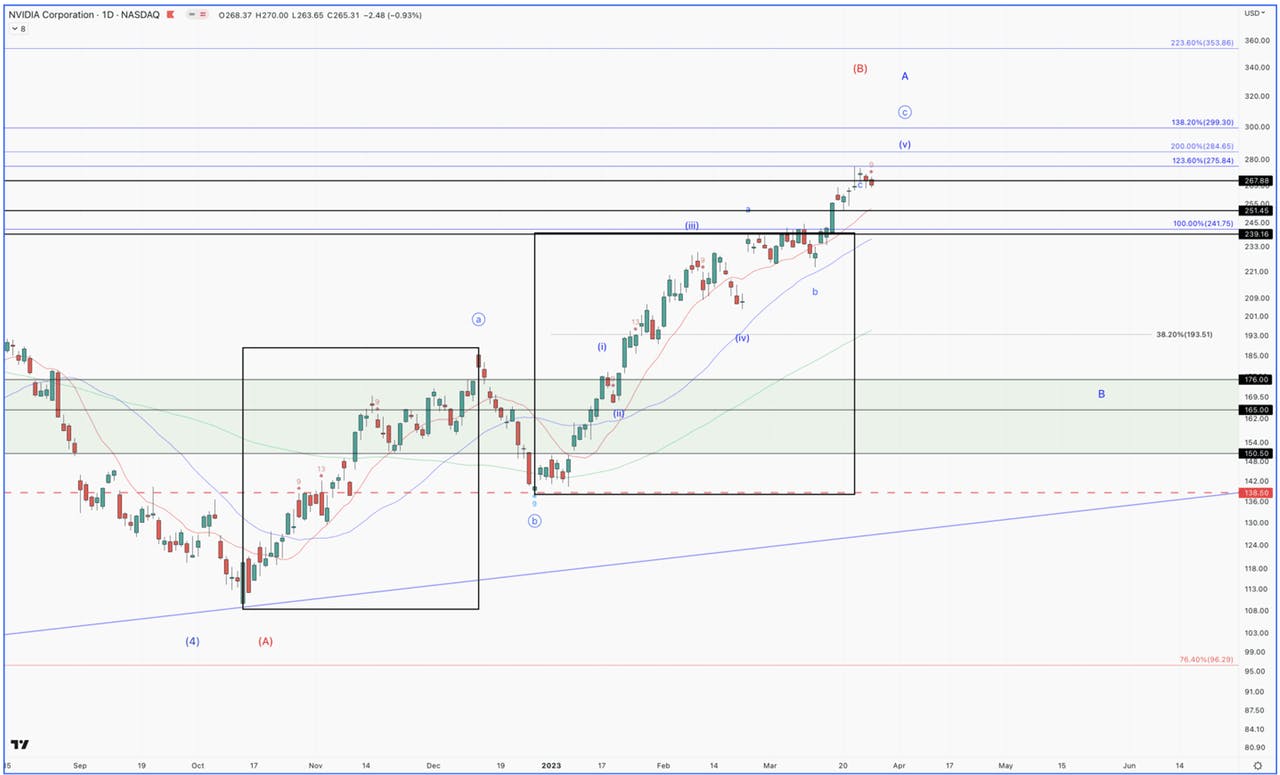
We’ll step back on NVDA. I’m still counting this move as the A wave of a larger 5th wave. The pattern since the 2018 low has been a large degree ending diagonal. So, this move will be a 3 wave uptrend. So far, we only have the A wave in place. We will look to add on the B wave retrace. If the retrace is a 5 wave pattern down, then the red count will become my primary.

One of my favorite cycles is coming up with NVDA – green vertical line below. It tends to create strong swings in this stock, and NVDA has another cycle stacked on the same day – blue. Look for a top/low of sorts in late April for this stock.

AMD

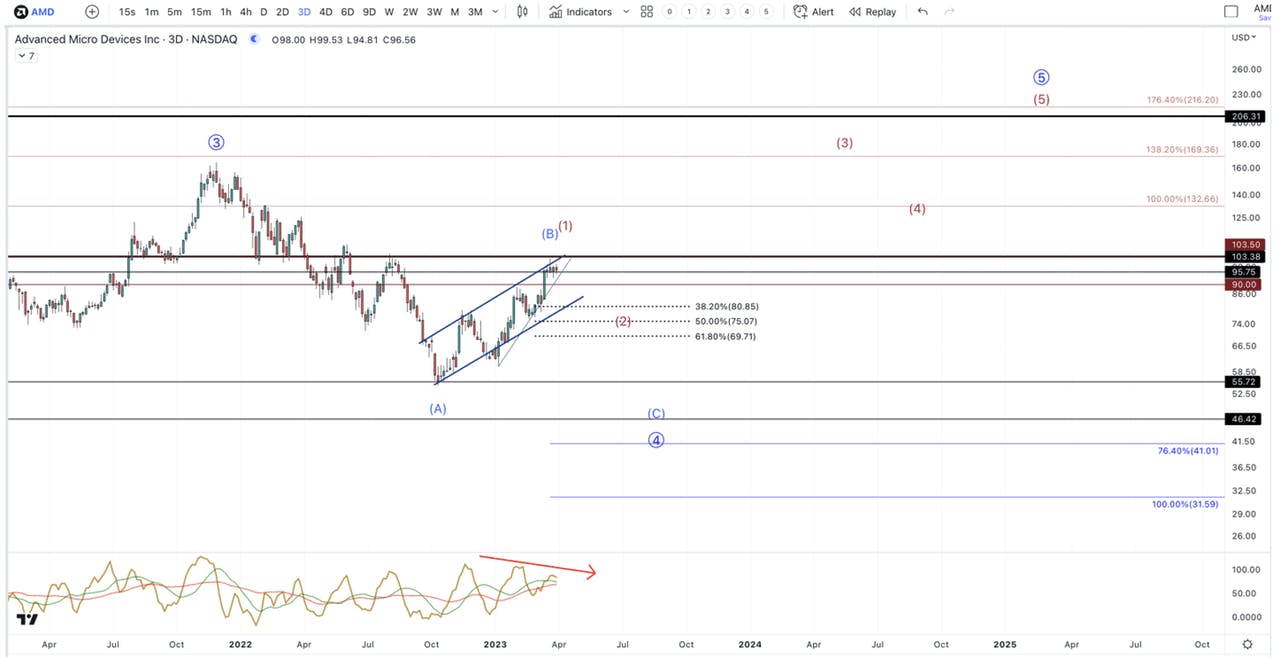
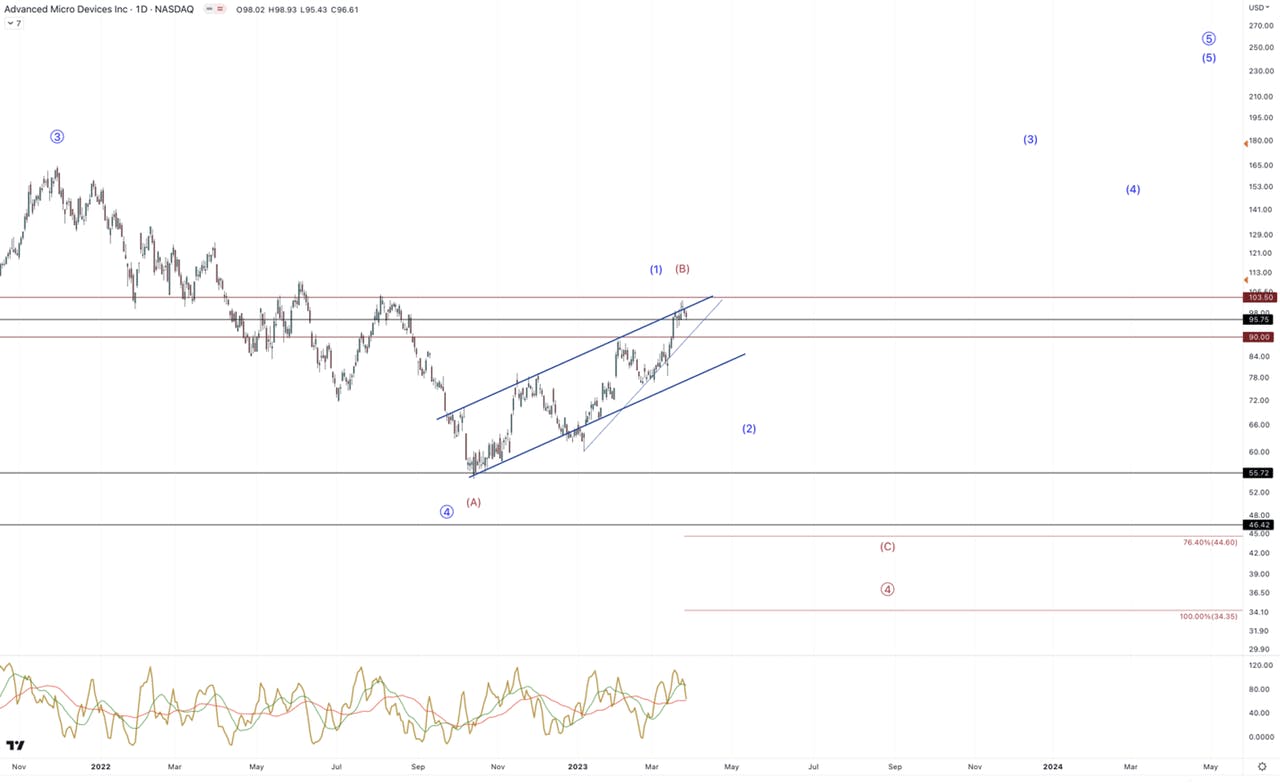
If the coming pullback breaks below $69, we will have an excellent opportunity to buy at new lows. If this does happen, as will be true for all stocks, buying at new lows will be emotionally very difficult.

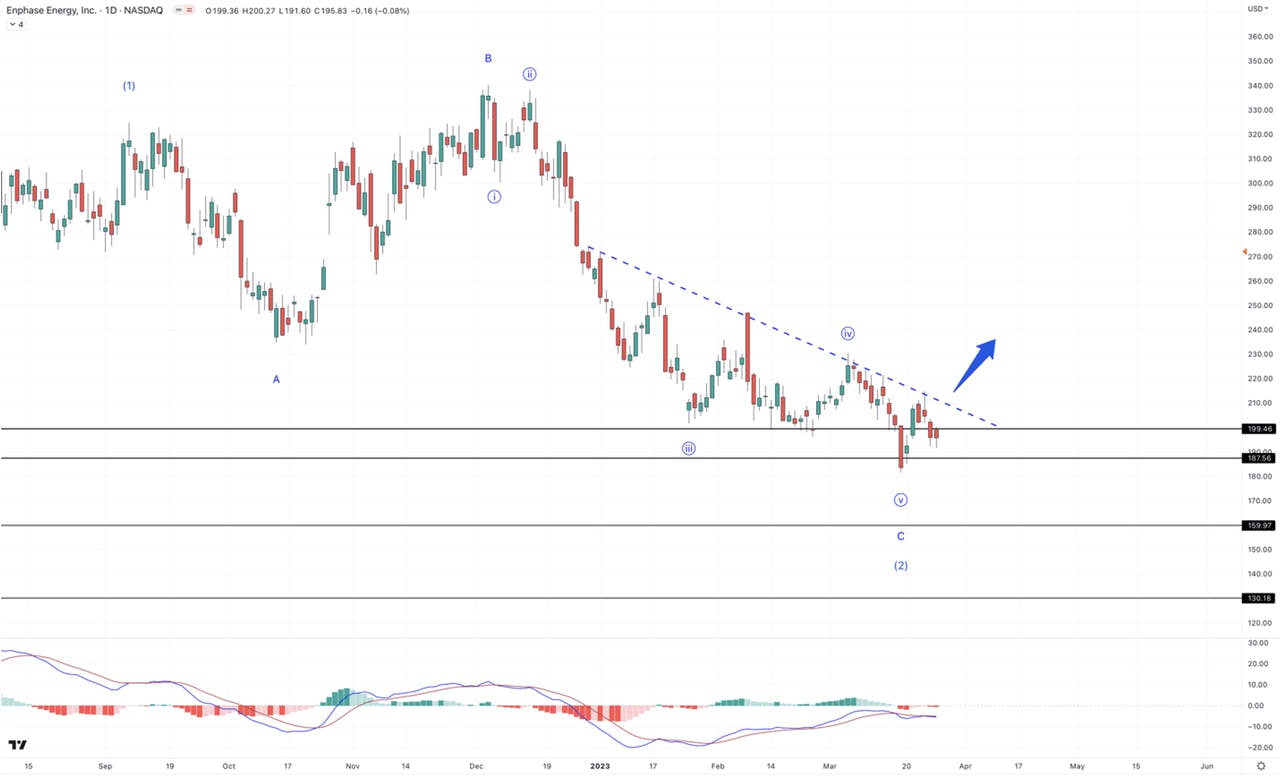
ENPH

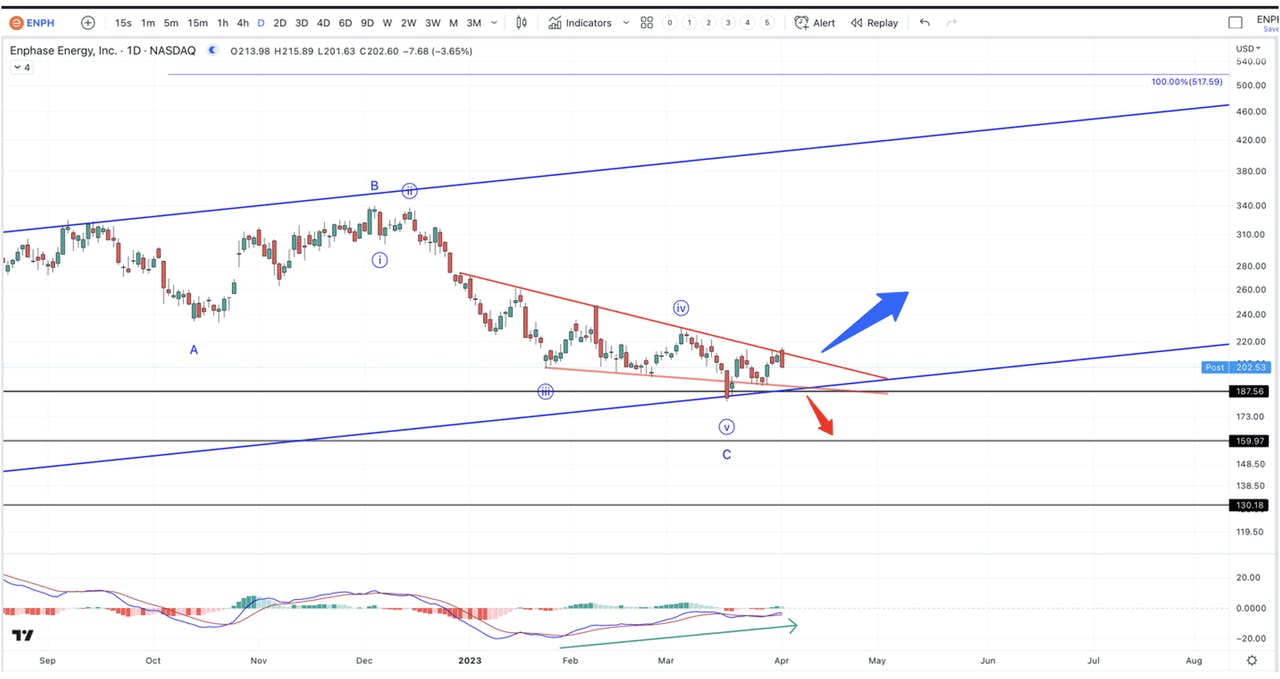
Very clear parameters. We should know very soon the direction ENPH will break.

Bitcoin

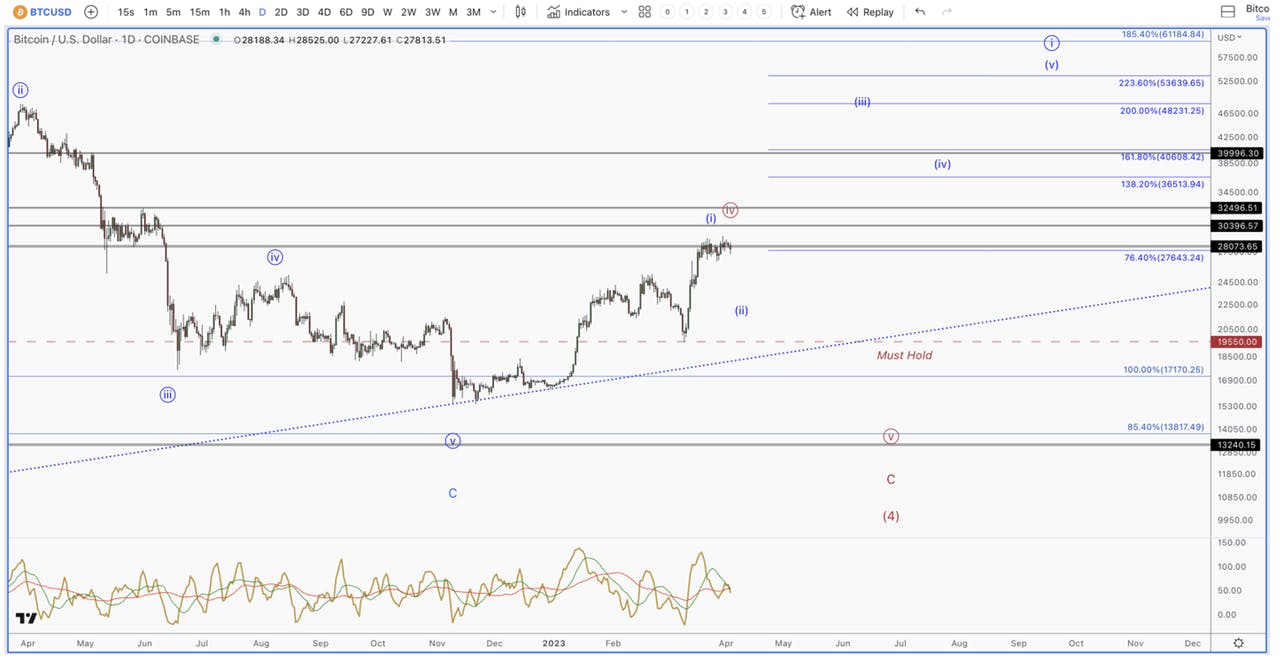
Consolidating at the high is rarely a bad thing. We have our levels, as well as the WealthUmbrella signal to guide us on this move.

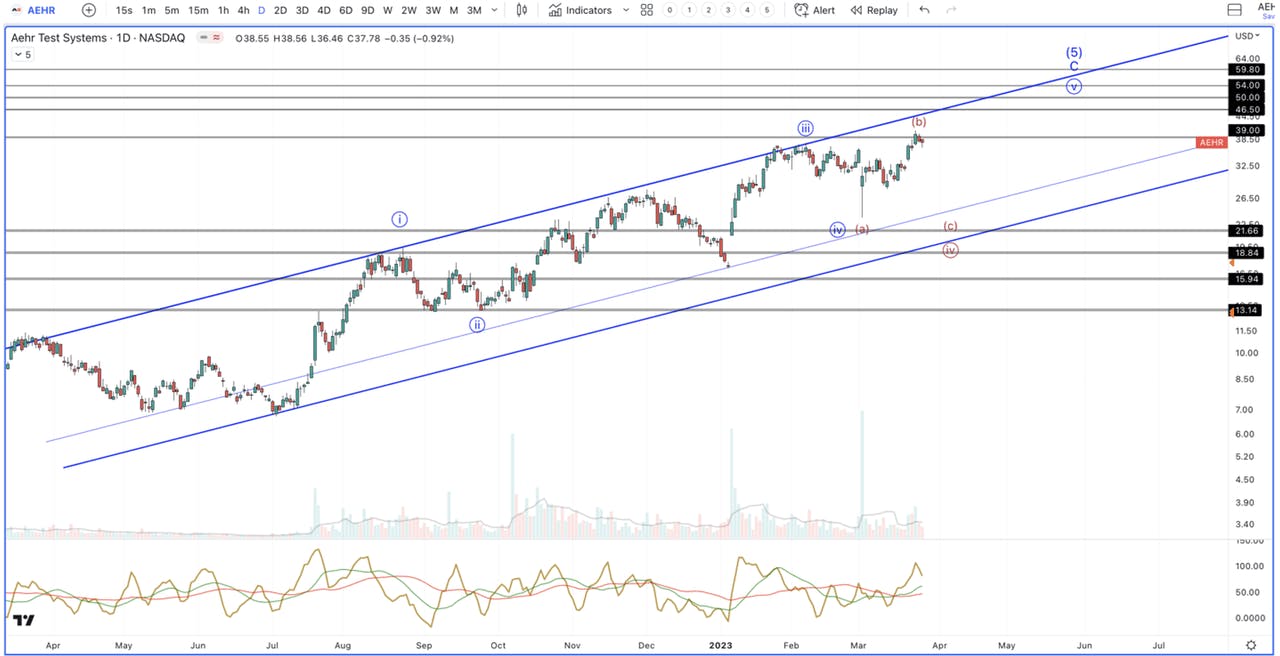
AEHR

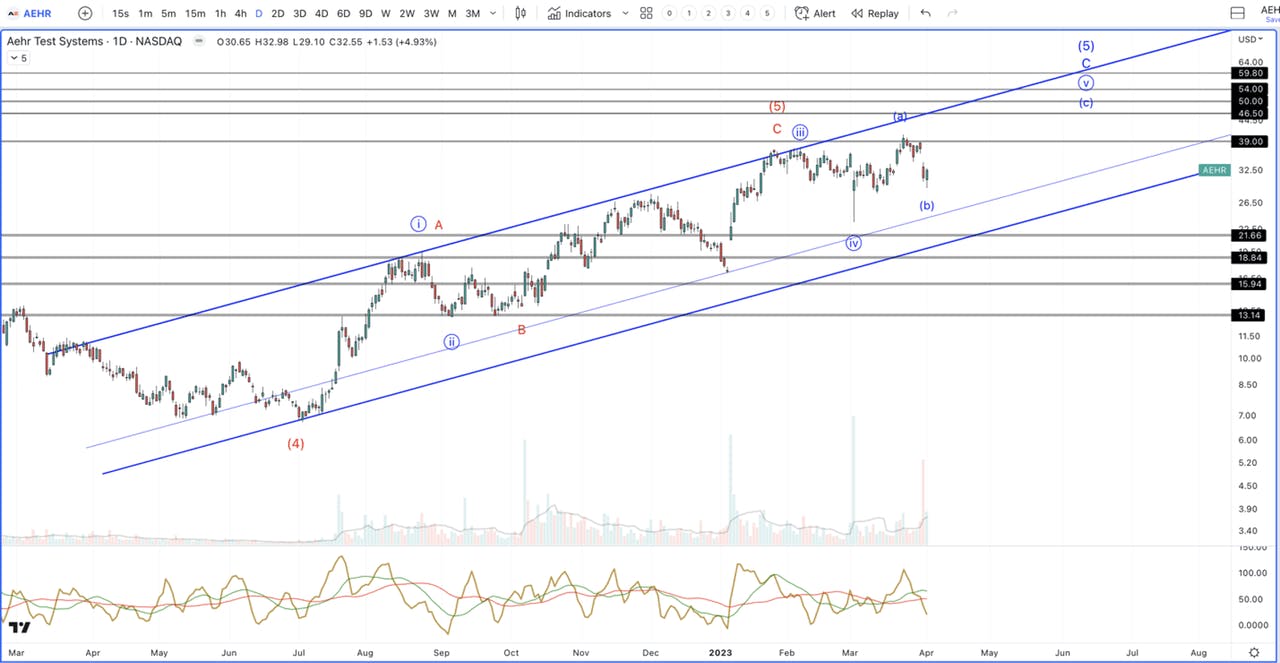
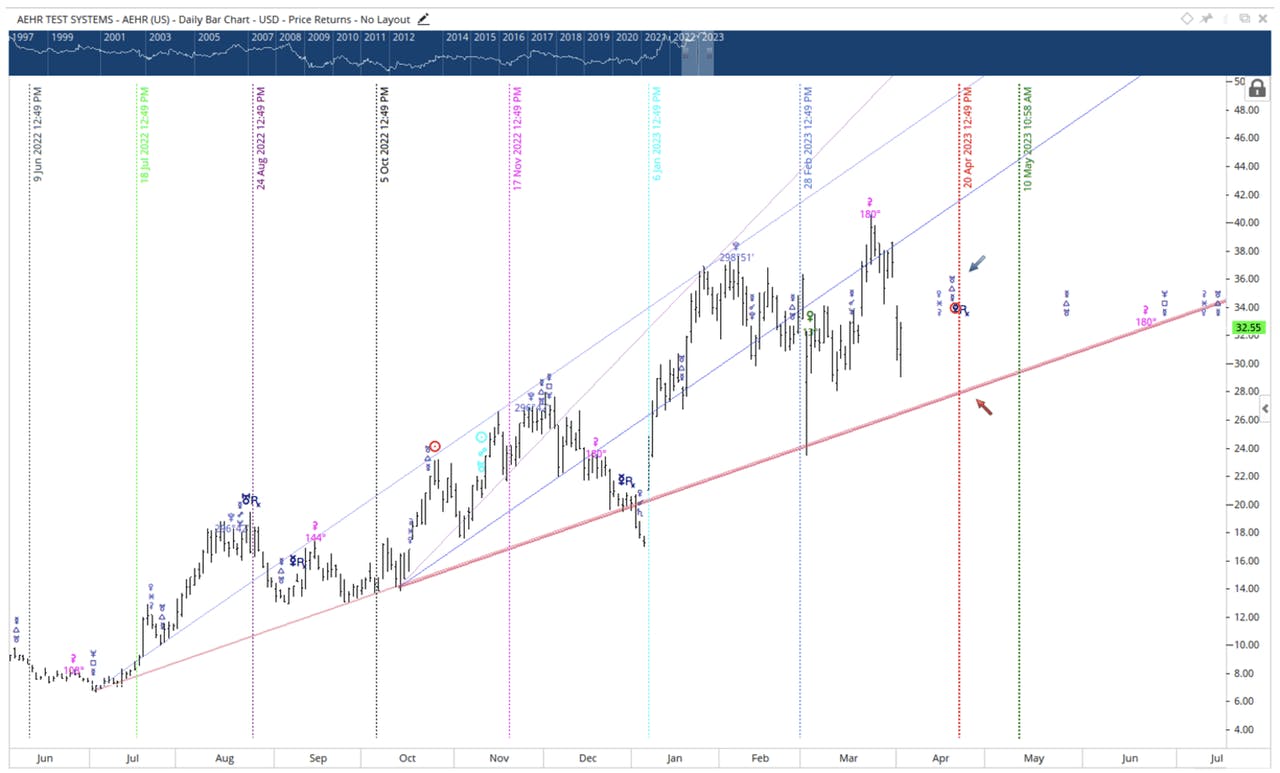
Either we’ve topped or we have one more large push to new highs.

April 18 – 22 will be an important time factor to watch for AEHR. Either we break below that 1×1 line around $26, or we’ll see a blow off top.

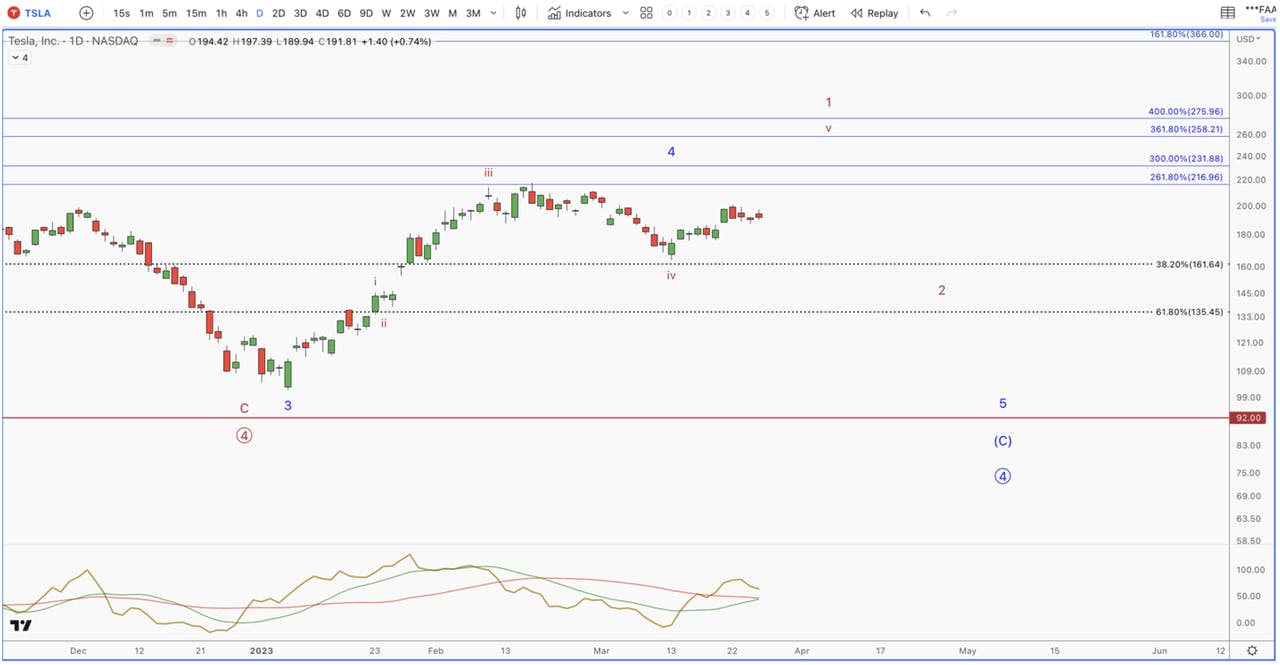
TSLA

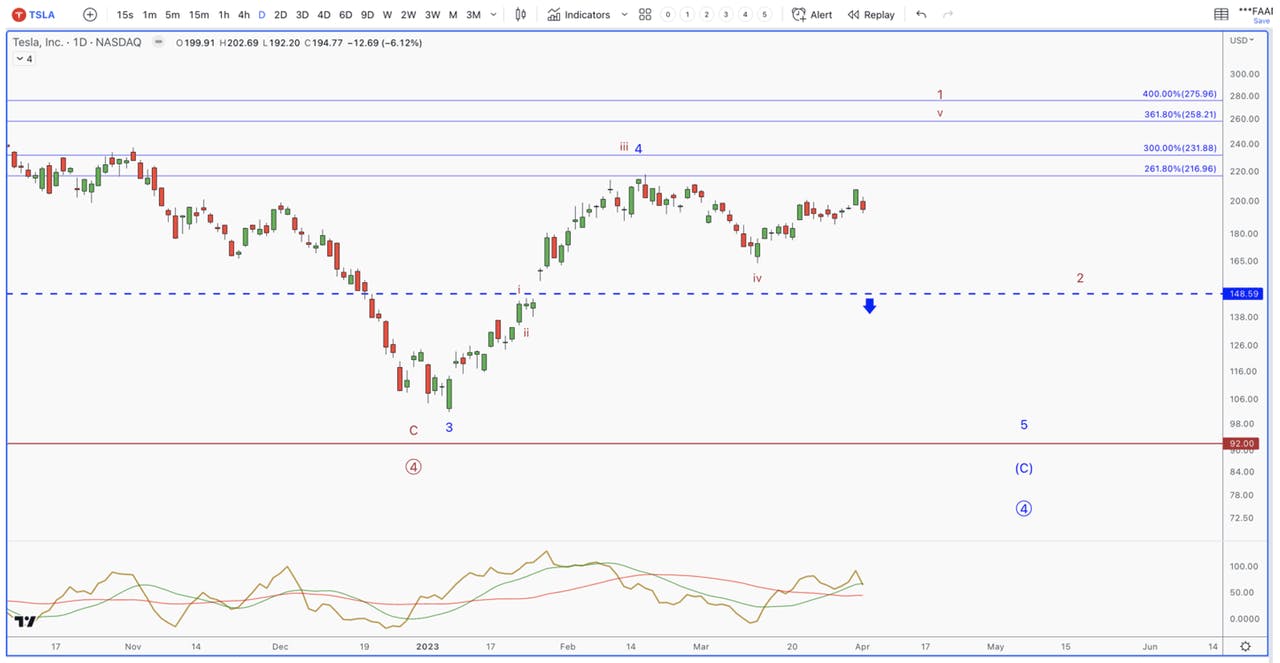
We’re adding due to fundamental reasons as well as the prospect of the 4th wave being shallower than expected. If we see a 5th wave higher, we may reduce our position.

MSFT

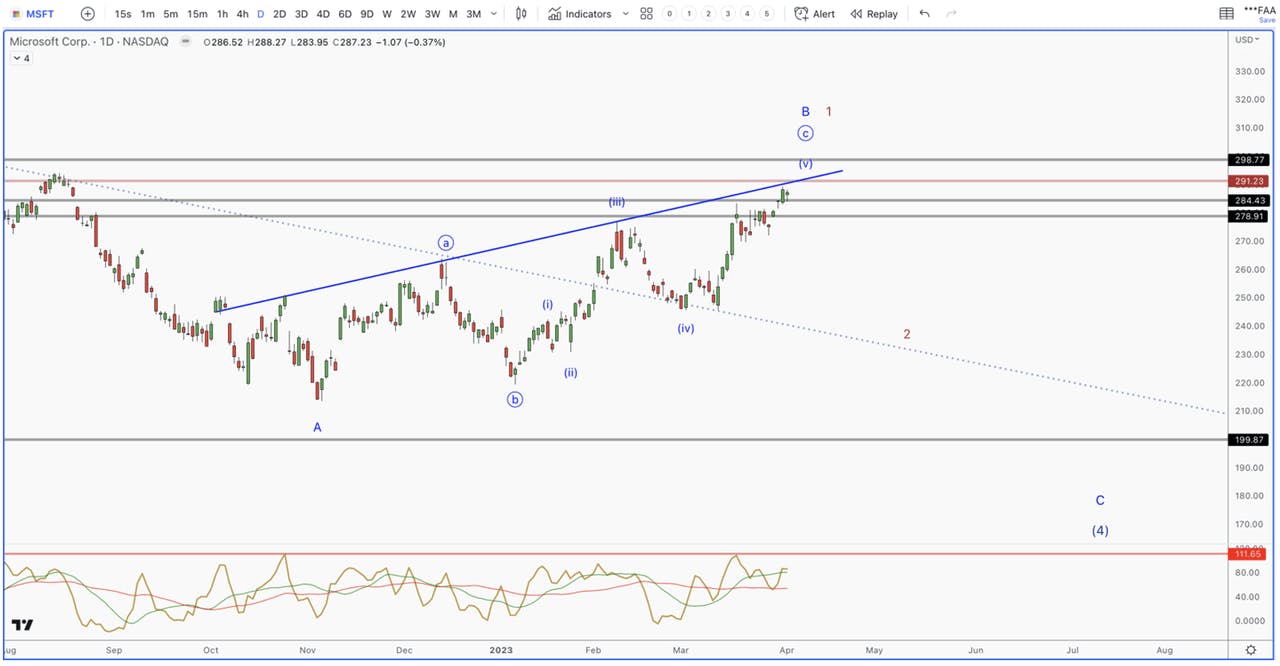
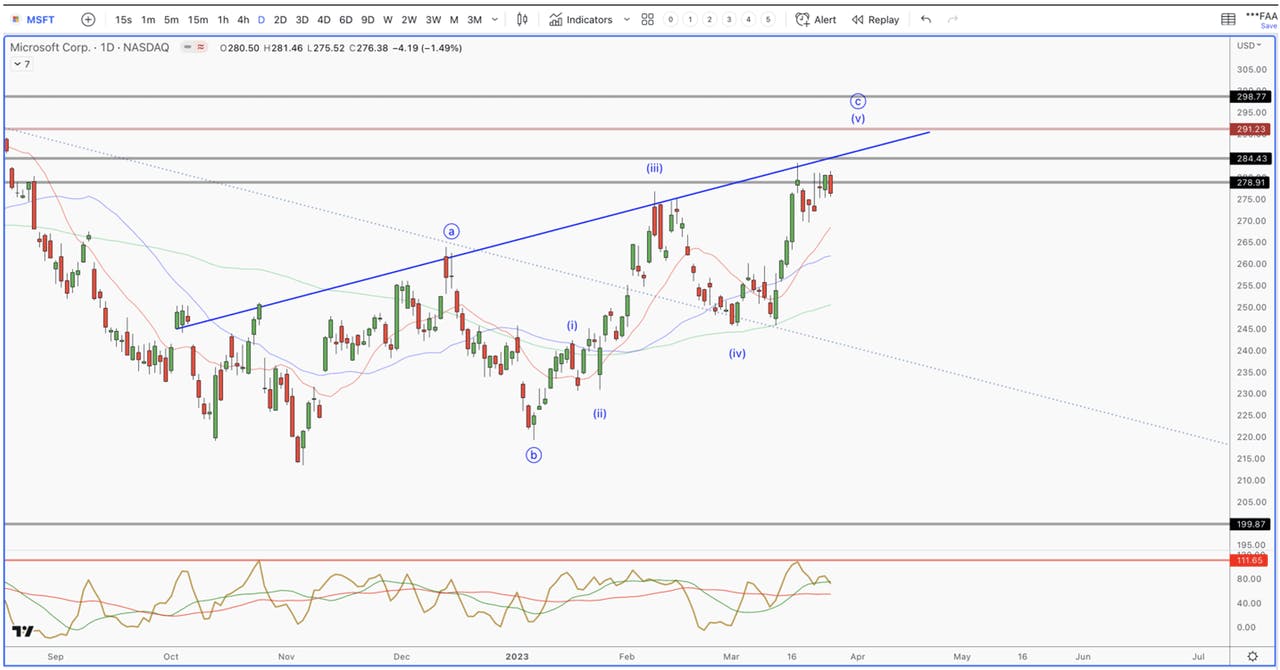
The theme is clear for most stocks – if April’s volatility is a 3 wave drop that holds the downward trendline, it’s very bullish. If it is 5 waves down, we are going to new lows. It’s hard to get super excited over such a messy/overlapping structure. We need to see follow through on the coming drop – i.e., 3 waves that hold the low.

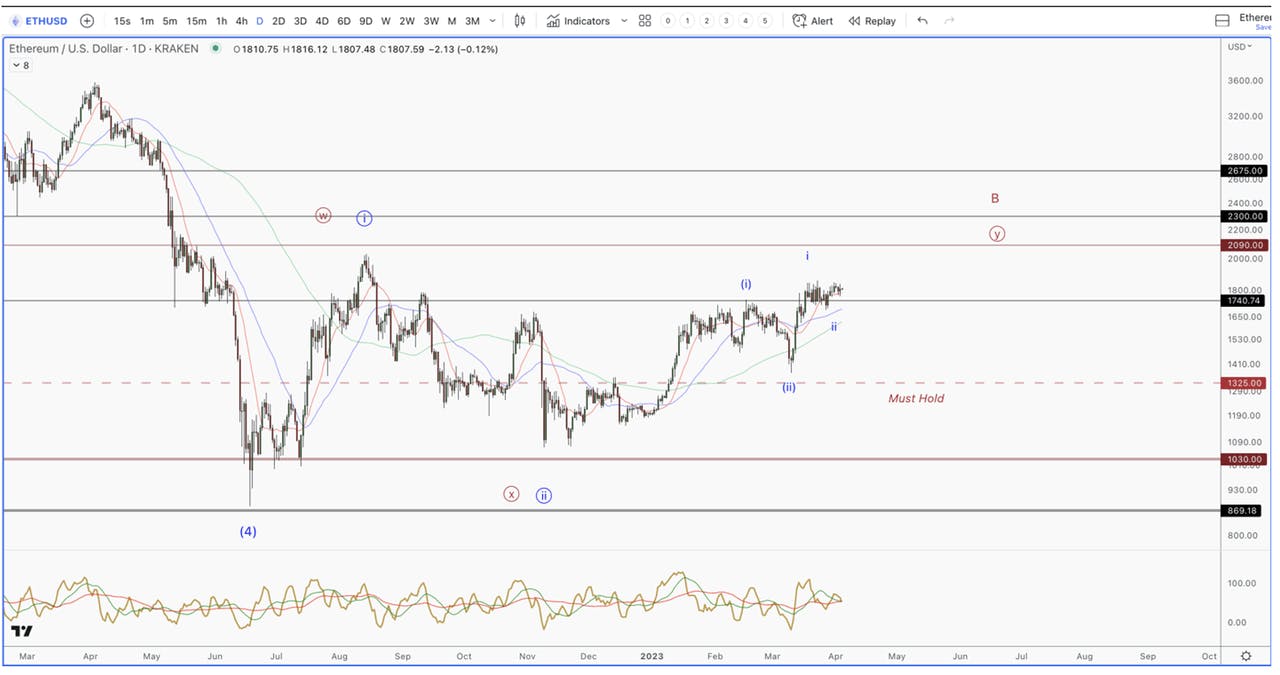
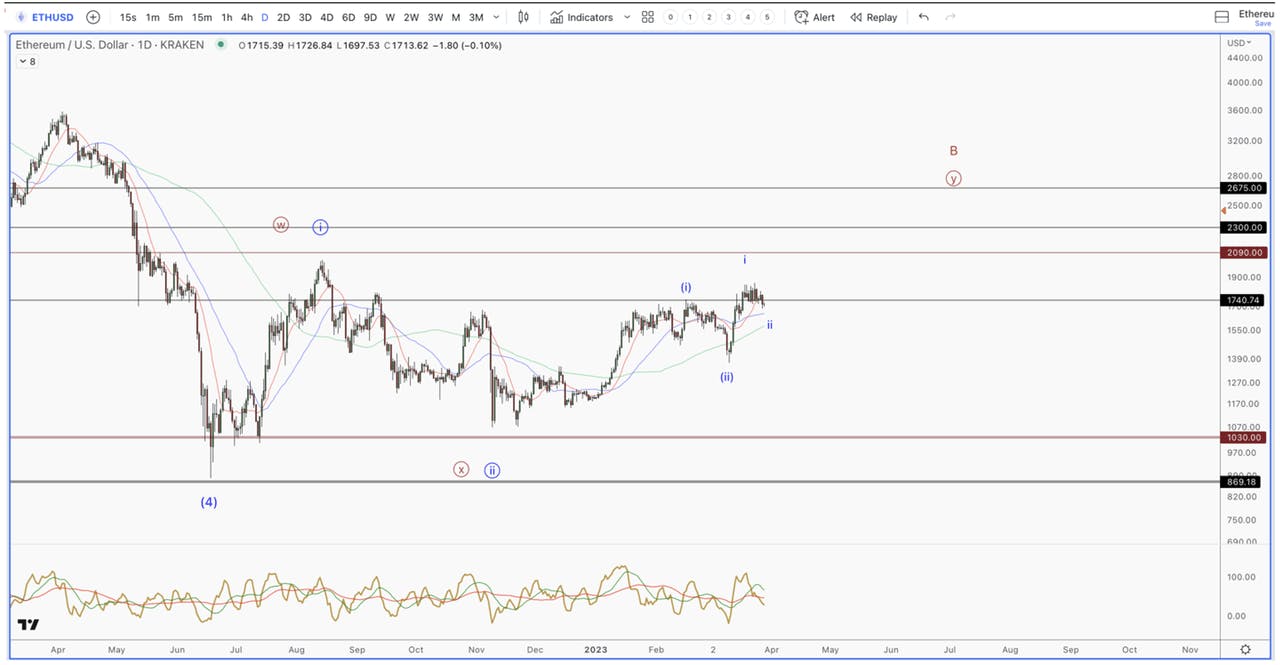
Ethereum

There is an explosive setup in place here. We have 3 degrees of 1st and 2nd waves. A setup like this, if it triggers, tends to result in a big push higher from here. We’ll see if ETH takes the setup or not really soon.

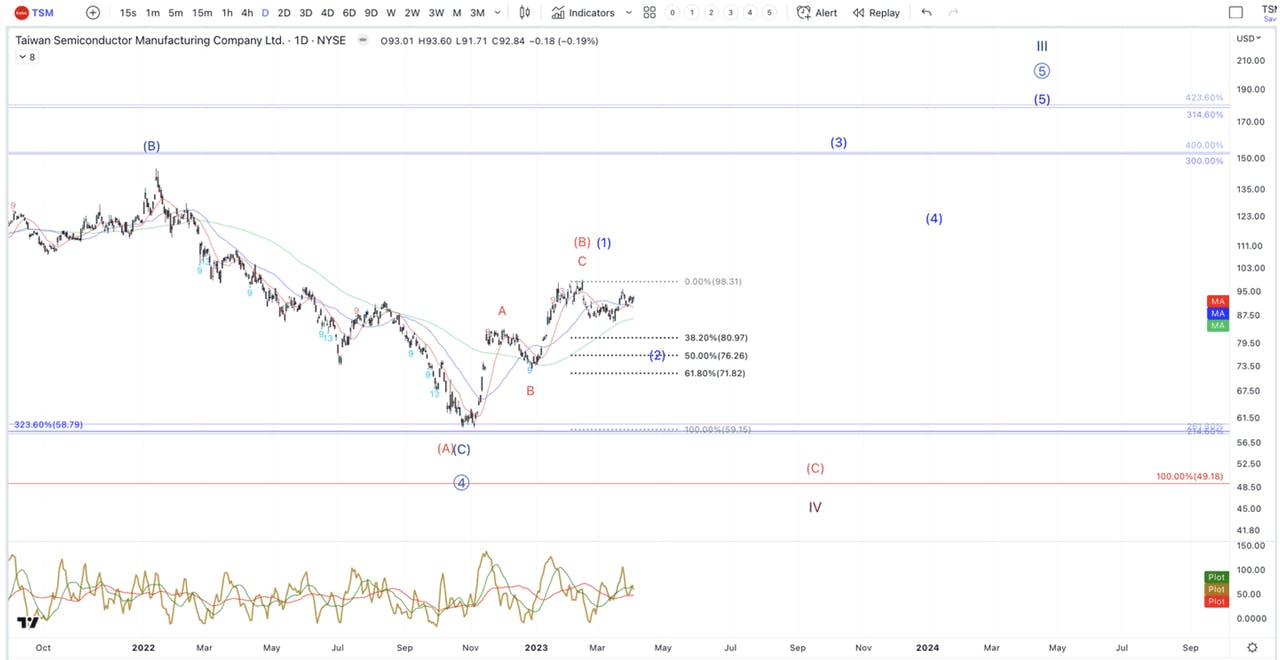
TSM

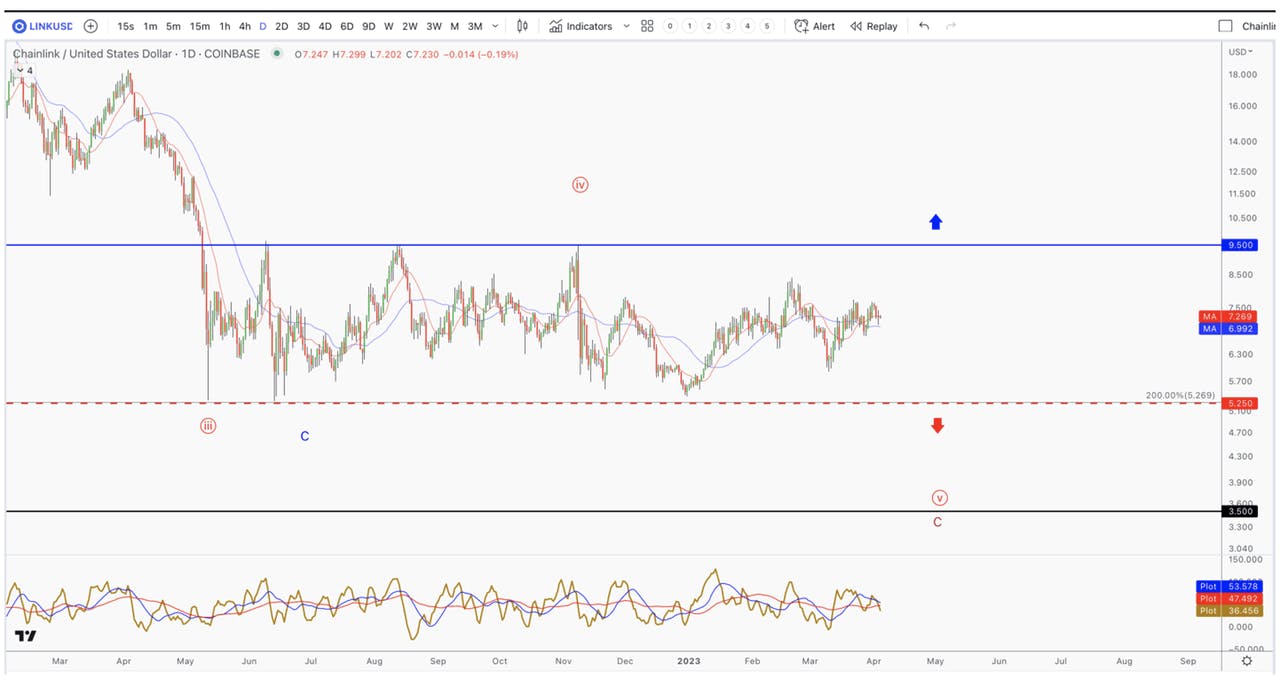
Chainlink

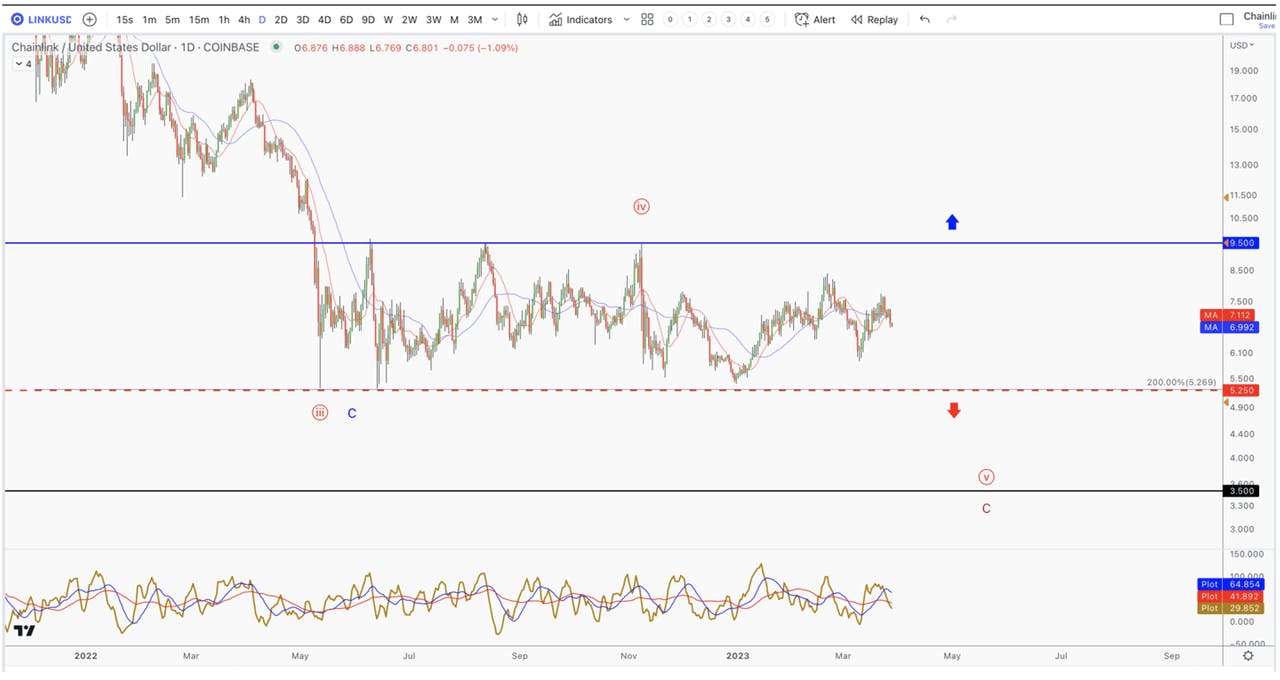
The consolidation in LINKUSD is approaching 1 year in length. This is a lot of pressure building. Whatever way we break, expect a big move.

Cloud Earnings Review: Digging Deeper on Best-of-Breed

This is a continuation of our article Slowdown in Cloud on Thin Ice Following Q1 Guides. Here’s a quick recap”

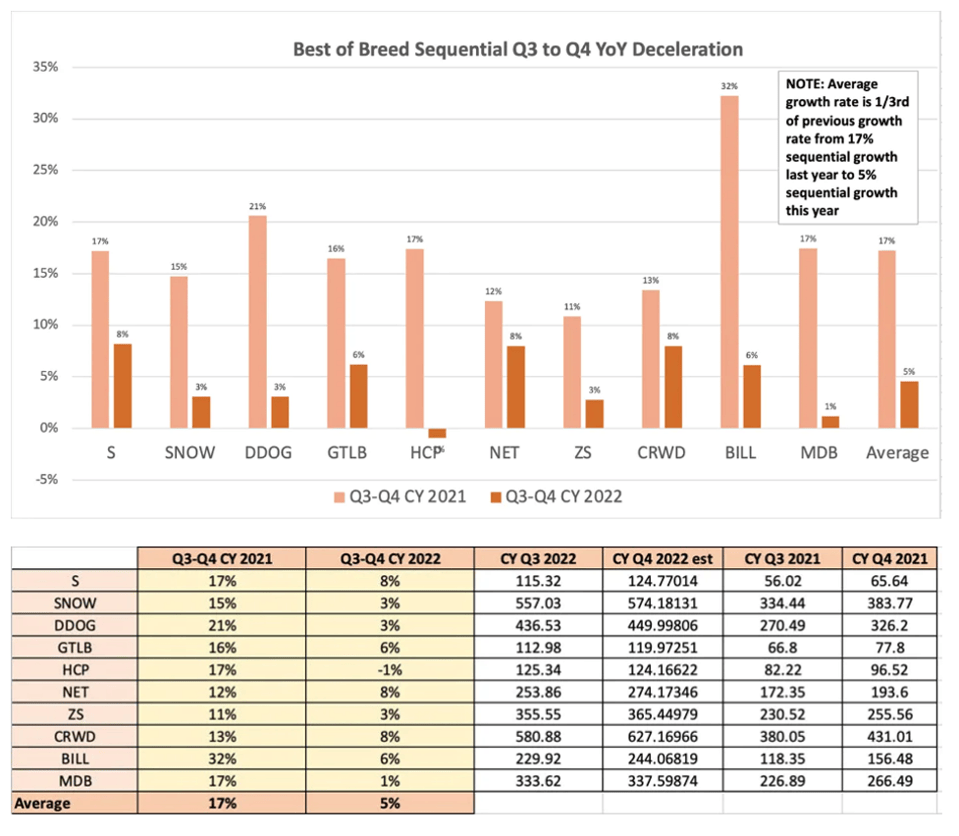
“Following the most recent earnings reports, our prediction is playing out that the slowdown we had predicted in Cloud would worsen. For example, best-of-breed cloud reported a 71% slowdown in QoQ/YoY growth for Q4 guides and is now guiding for an 83% slowdown in QoQ/YoY growth for Q1 guides.  

This is important because the cloud category has treated investors quite well with recurring revenue, resiliency during Covid, and some of the strongest examples of product-market fit available on the public markets. However, not even this can overcome the effects of lower budgets and cloud spend, which is the top driver in terms of year-over-year comparisons.”

Digging Deeper on Best-of-Breed

Our analysis on cloud best-of-breed should not be confused for excessive bearishness. We like this category quite a bit and will continue to watch it closely to build position(s) in the future. Rather, we prefer to not stand in front of the train (which for growth stocks, can be defined as rapid deceleration on the top line) and to simply wait for a signal that growth will resume. Others will choose to remain invested for the long-term story, and that may fit another investment profile.

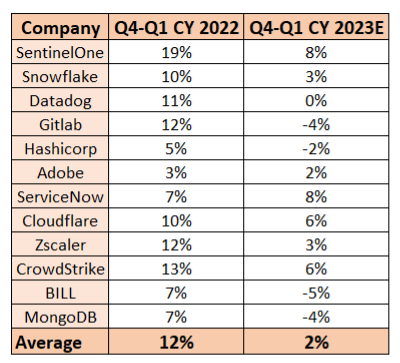
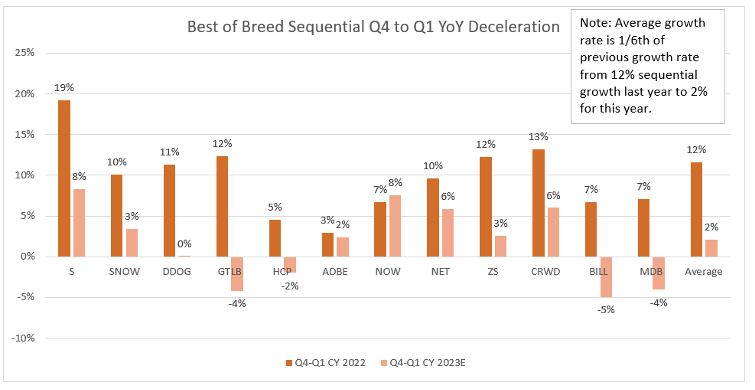
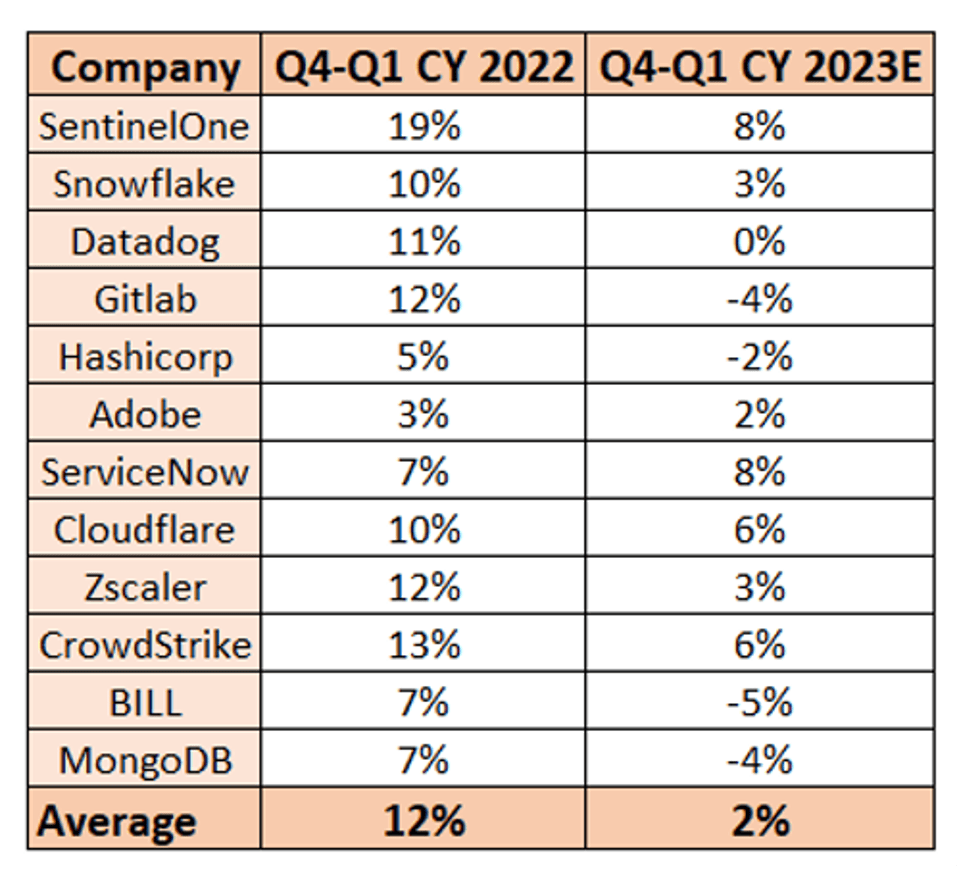
We took a sample of the top-ranking cloud stocks on revenue growth, free cash flow, adjusted operating margin and/or valuations. Among the best-of-breed cloud stocks, only ServiceNow’s guide shows sequential growth. The company’s QoQ growth was 7% last year and is expected to be 8% this year. In this article we want to expand the data below to see which companies are outperforming and underperforming based on the various metrics.

Source: YCharts 

Source: YCharts

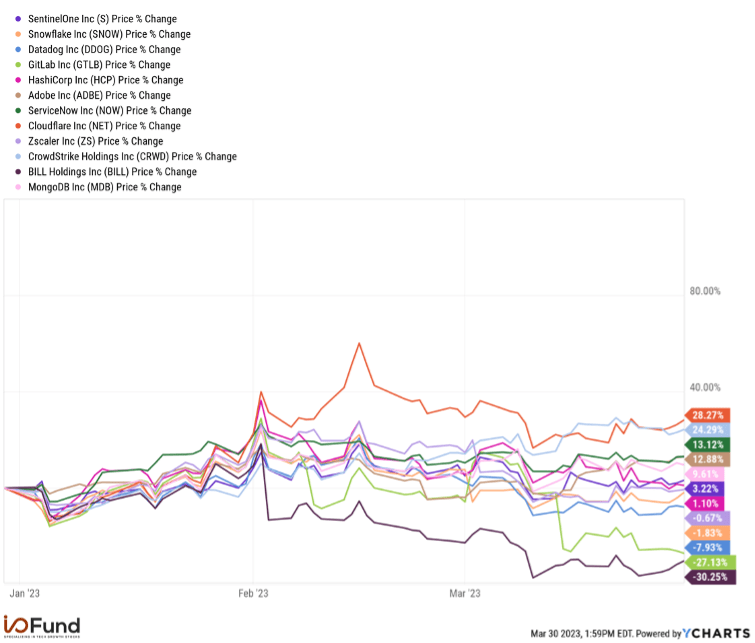
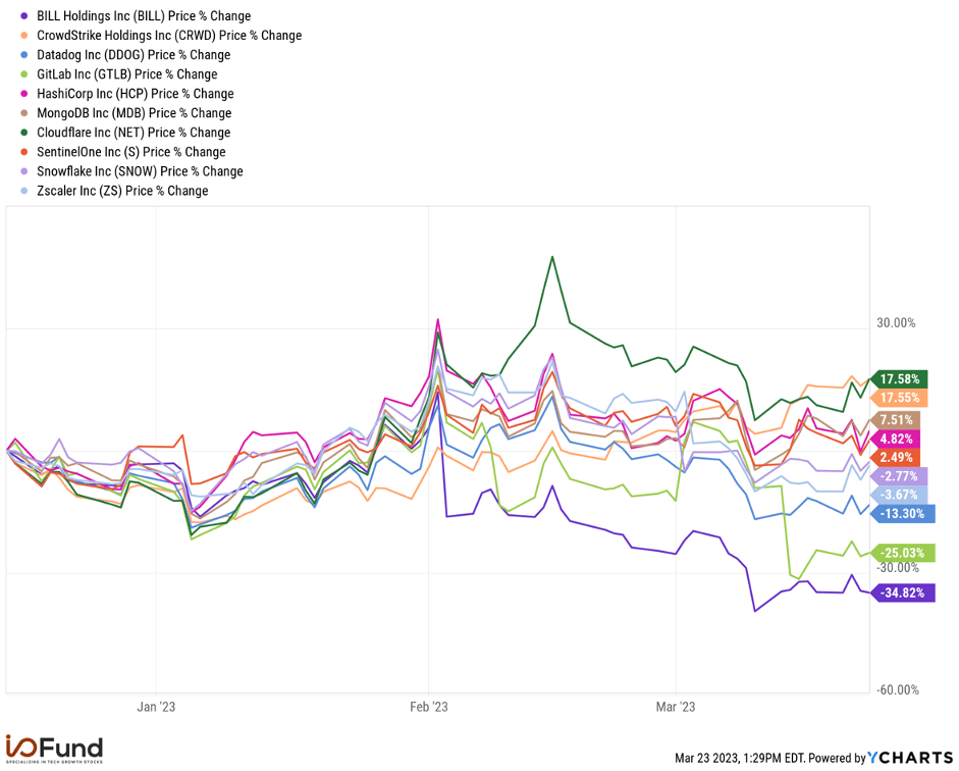
We did a similar analysis in December. Since then, Gitlab stands out for its revenue growth profile that increased from a 10% decel to a 16% decel expected for Q1 from the previous year. If this continues, Gitlab will see an approximate 50% decel from FY2022. HashiCorp is also turning negative in terms of QoQ/YoY, as is Bill.com and MongoDB. Two of these stocks lag cloud on YTD returns with Bill down (30.25%) and Gitlab down (27.13%).

Source: YCharts

Earnings Beats

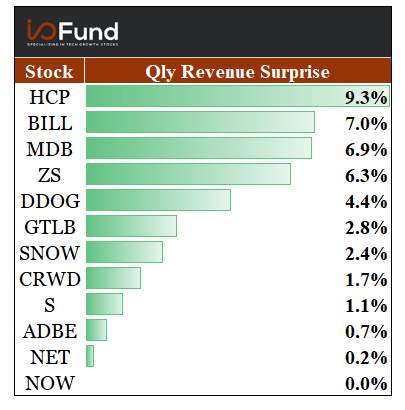
Below we look at companies that beat revenue and adjusted EPS. HashiCorp was the leading cloud stock to have the highest revenue beat. The company’s revenue grew by 41% YoY to $135.79 million and beat estimates by 9.3%. BILL revenue grew by 66% YoY to $260 million and beat estimates by 7%. MongoDB revenue grew by 36% YoY to $361.31 million and beat estimates by 6.9%.

Source: YCharts

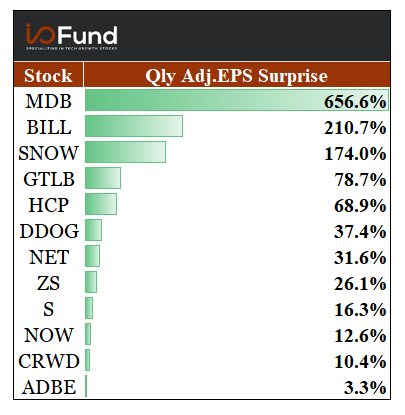
MongoDB’s adjusted EPS was $0.57 compared to $0.10 for the same quarter last year. It beat analyst estimates by 656.6%.

BILL adjusted EPS came at $0.42 compared to break even for the same quarter last year. It beat analyst estimates by 210.7%.

Source: YCharts

Both MongoDB and BILL, despite the top-line and bottom-line beat, dropped after the earnings due to decelerating revenue. Per Barclays analyst Raimo Lenschow, who has an overweight rating on MongoDB, the guidance only implies 16% growth and a meaningful slowdown in the company's Atlas and Enterprise Advanced segments.

We do not place much weight on earnings beats in the current macro environment. This helps to perfectly illustrate why beats can actually be a dangerous way to evaluate a stock. In all cases – HCP, MDB and BILL, the companies were beating on decelerating revenue and/or bottom lines. We had pointed this out in our January Q1 Webinar when we stated: “We won’t be buying beats on decelerating top line or beats on deceleration bottom line.”

Bottom Line and Free Cash Flow

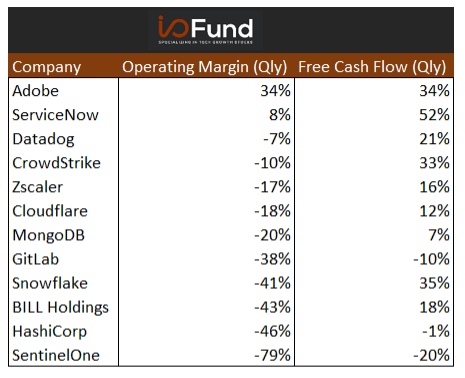
Below we look at the best-of-breed cloud stock’s GAAP operating margin and free cash flow margin. Note that some cloud companies are reporting better free cash margins.

Snowflake reported a higher free cash flow margin of 35% when compared to 15% in the same period last year. ServiceNow has an impressive 52% free cash flow margin when compared to 46% in the year-ago period.

GAAP profitability is another important metric to closely monitor, especially with macroeconomic uncertainty. Adobe ranks the highest in the best-of-breed cloud companies with an operating margin of 34% and ServiceNow ranks second with an operating margin of 8%.

Source: YCharts

Cloud investors should remain cautious as cutting back on expenses may weigh on growth long-term. We do not have all of the information yet on how these companies will perform a year out when they’ve decreased head count, gone remote, cut back on sales and marketing and/or cut back on R&D. During the bull market, cloud was spending for growth and this had a direct relation to helping the top line. The effects of pulling back on this spending will not be immediately seen. We are very new to cloud deceleration, which I estimate began to occur in Q3 2022. We’ve stated various reasons for this being the quarter where earnings were a bit unusual, including the Q2 beats weren’t being carried through to a full year raise on guidance.

As stated on Real Vision, this was a flag to us and we began to decrease our exposure to cloud around this time. I think we will need at least a year to 18 months to see the full effects of reduced spending in relation to the top line. Our December cloud report had said – do not be surprised if we see best-of-breed dip below 20% — and we are already quicker than I thought was possible with MDB reporting 16% growth. Perhaps I should update this and say – do not be surprised if best-of-breed reports below 10% growth. With the information we have today, we are headed in this direction.

More on Margins:

The below chart shows the GAAP operating margins of the best-of-breed cloud companies. Apart from ServiceNow and Adobe, other cloud names have negative GAAP operating margins.

Datadog was GAAP profitable but recently lost their positive margin from +3% to (7%). CrowdStrike is low negative single digits at (5%). Datadog’s management had stated in the earnings call that the previous year’s operating margin benefitted from less in-person office costs and travel costs due to Covid policies.

Source: YCharts

Stock-Based Compensation

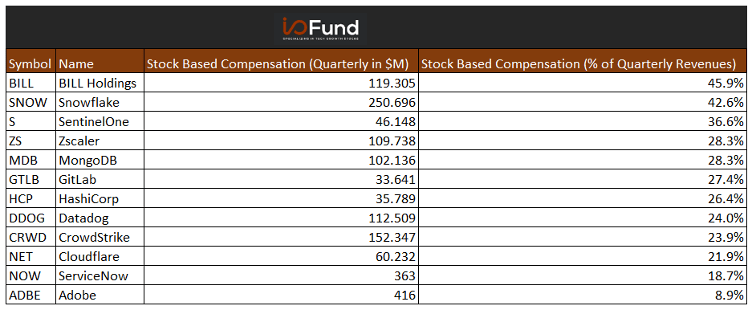
Most of the names listed below that are unprofitable on a GAAP basis are paying high stock-based compensation. BILL has the highest percentage of stock-based compensation at 45.9%, followed by Snowflake at 42.6%, and 36.6% for SentinelOne.

The high stock-based compensation is something to be on watch for, because when companies report, they will overemphasize non-GAAP earnings. For example, BILL has a GAAP operating margin of (43%) and an adjusted operating margin of 12%, with the primary difference being stock-based compensation.

Stock-based compensation is a non-cash expense added back to adjusted earnings. However, in practice this is an expense as per GAAP rules. Warren Buffet said the following, which relates to the importance of GAAP earnings over adjusted earnings when stock-based compensation is involved. “If options aren’t a form of compensation, what are they? If compensation isn’t an expense, what is it? And if expenses should not go into the calculation of earnings, where in the world should they go?”

Source: YCharts

Valuations

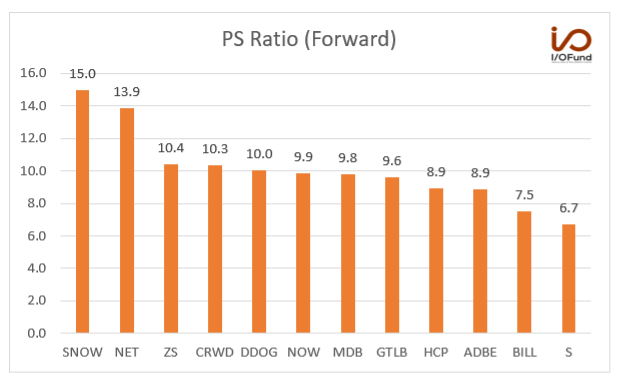
In the below chart, we ranked companies based on the forward P/S ratio. Snowflake and Cloudflare have the highest forward P/S ratio. These have come down considerably over the past few months. Eventually, cloud will hit a bottom on valuations and be cheap enough for risk-adverse investors to consider.

Source: YCharts

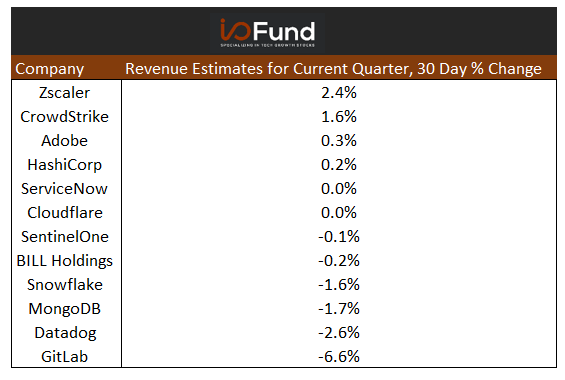
Ranking based on revenue estimates change for current quarter.

Zscaler’s revenue estimates have been revised up 2.4% and CrowdStrike’s revenue estimates have been revised up 1.6% in the past 30 days. On the other hand, GitLab’s revenue estimates have been revised down (6.6%), Datadog’s revenue estimates have been revised down (2.6%), and MongoDB’s revenue has been revised down (1.7%). This is another reason that earnings beats are not the best way to determine the outcome of an earnings report. Because the market is forward-looking, you’ll see a company beat current estimates while being revised down on forward estimates. This is a trap that retail should try to avoid at all costs.

Source: YCharts

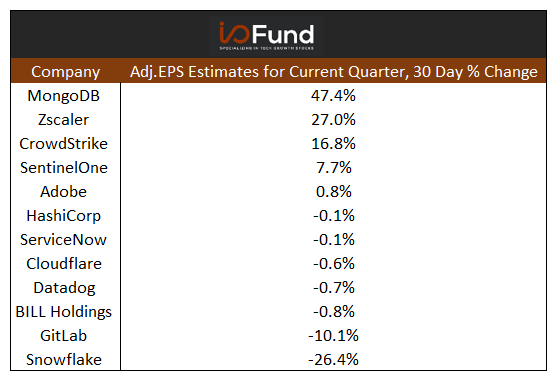
Ranking based on adjusted EPS estimates change for the current quarter.

MongoDB’s adjusted EPS has been revised up 47.4% in the past 30 days. We also noted earlier in our analysis that the company had a very strong adjusted EPS beat in the recent quarter. Similarly, Zscaler’s estimates have been revised up 27%, and CrowdStrike’s by 16.8%. On the other hand, Snowflake’s estimates have been revised down (26.4%) and Gitlab’s by (10.1%).

Source: YCharts

A Few Best-of-Breed highlights and lowlights in Q4.

According to the data above, Adobe and ServiceNow are best positioned to weather the new macro. This is due to favorable bottom lines, which includes the elusive GAAP profitability for this category. Their stock-based compensation ranks margin lowest on our list and their respective GAAP operating margins reflects this.

ServiceNow and Adobe also have two of the strongest free cash flow margins in the category and are essentially flat QoQ/YoY on the top line while many cloud stocks are deeply decelerating.

Crowdstrike is guiding for QoQ growth from Q4 to Q1 on both the top line and bottom line.

CrowdStrike revenue grew by 48% YoY to $637.4 million (beat estimates by 1.7%) and adjusted EPS was $0.47 (beat estimates by 10.4%). The free cash flow was also strong as it grew by 65% YoY to $209.5 million with a free cash flow margin of 33%.

Crowdstrike guided for $676M, at the midpoint and EPS of $0.50 to $0.51.

Wedbush analyst Taz Koujalgi said, "We calculate that the [annual recurring revenue] guide appears conservative, and if macro conditions do not deteriorate, net new [annual recurring revenue] growth if high single digits are doable."

The management also highlighted that the company had been ranked No.1 for the third consecutive year in IDC’s annual Worldwide Modern Endpoint Security Market. The company was able to increase its market share by 3.8% to 17.7%.

Cloudflare Grows Free Cash Flow Margin

Cloudflare revenue grew by 42% YoY to $274.7 million (beat estimates by 0.23%) and adjusted EPS was $0.06 (beat estimates by 31.6%).

The company had a free cash flow of $33.66 million with a free cash flow margin of 12% compared to a free cash flow of $8.64 million with a free cash flow margin of 4% in the year-ago quarter.

The management highlighted some of the key deals in the quarter, particularly a leading generative AI company signing a one year $1 million deal. The AI company has been a user of free tier since 2017. Cloudflare was also awarded a five-year deal of $7.2 million to operate the .gov registry. The company also got the moderate status of the FedRAMP authorization in December.

Zscaler Grows Free Cash Flow but Billings Slow

Zscaler revenue grew by 52% YoY to $387.6 million (beat estimates by 6.3%) and adjusted EPS was $0.37 (beat estimates by 26.1%). The free cash flow grew by 113% YoY to $62.8 million with a free cash flow margin of 16%. However, the weak point in the company’s report was the calculated billings that grew by 34% in the quarter from 37% growth reported in Q3 and 59% growth reported in the year-ago quarter.

The management mentioned in the earnings call, “Billings were impacted by new customers being more deliberate about their large purchasing decisions at the start of the calendar year. These deals have not gone away, and we have closed a few already in February.” The billings guide for the next quarter was also low. “For Q3 (Q1), we are assuming billings to decline by approximately 9% sequentially, compared to the mid-single digit percentage declines we have seen in the last few years.”

Conclusion

The cloud sector has many moving parts as it mixes strong product stories with weak bottom lines. In addition to this, eventually the valuations will become attractive especially for those that can weather the new macro by cutting costs and maintaining category-leading growth. Across the board, cloud investors should be prepared for a sustained slowdown on the top line. This could worsen over the next year, as typically there’s a direct relationship between spending/investing in growth and top line results 12-18 months later. The opposite will also be true, cutting back on spending/investing in growth will lead to a lower top line.

Our preference is to remain on the side lines for now while identifying the strongest one or two cloud stocks fundamentally for when the technicals show give us a clear signal that it’s time to hold exposure here again. This could happen quickly so we prefer to be prepared in advance with what companies’ charts should take priority.

Deep dives plus trade alerts and weekly webinars are offered on our premium service, you can find out more information here.

Cloud Earnings Review: Digging Deeper on Best-of-Breed

This is a continuation of our article Slowdown in Cloud on Thin Ice Following Q1 Guides. Here’s a quick recap”

“Following the most recent earnings reports, our prediction is playing out that the slowdown we had predicted in Cloud would worsen. For example, best-of-breed cloud reported a 71% slowdown in QoQ/YoY growth for Q4 guides and is now guiding for an 83% slowdown in QoQ/YoY growth for Q1 guides.  

This is important because the cloud category has treated investors quite well with recurring revenue, resiliency during Covid, and some of the strongest examples of product-market fit available on the public markets. However, not even this can overcome the effects of lower budgets and cloud spend, which is the top driver in terms of year-over-year comparisons.”

Digging Deeper on Best-of-Breed

Our analysis on cloud best-of-breed should not be confused for excessive bearishness. We like this category quite a bit and will continue to watch it closely to build position(s) in the future. Rather, we prefer to not stand in front of the train (which for growth stocks, can be defined as rapid deceleration on the top line) and to simply wait for a signal that growth will resume. Others will choose to remain invested for the long-term story, and that may fit another investment profile.

We took a sample of the top-ranking cloud stocks on revenue growth, free cash flow, adjusted operating margin and/or valuations. Among the best-of-breed cloud stocks, only ServiceNow’s guide shows sequential growth. The company’s QoQ growth was 7% last year and is expected to be 8% this year. In this article we want to expand the data below to see which companies are outperforming and underperforming based on the various metrics.

Source: YCharts 

Source: YCharts

We did a similar analysis in December. Since then, Gitlab stands out for its revenue growth profile that increased from a 10% decel to a 16% decel expected for Q1 from the previous year. If this continues, Gitlab will see an approximate 50% decel from FY2022. HashiCorp is also turning negative in terms of QoQ/YoY, as is Bill.com and MongoDB. Two of these stocks lag cloud on YTD returns with Bill down (30.25%) and Gitlab down (27.13%).

Source: YCharts

Earnings Beats

Below we look at companies that beat revenue and adjusted EPS. HashiCorp was the leading cloud stock to have the highest revenue beat. The company’s revenue grew by 41% YoY to $135.79 million and beat estimates by 9.3%. BILL revenue grew by 66% YoY to $260 million and beat estimates by 7%. MongoDB revenue grew by 36% YoY to $361.31 million and beat estimates by 6.9%.

Source: YCharts

MongoDB’s adjusted EPS was $0.57 compared to $0.10 for the same quarter last year. It beat analyst estimates by 656.6%.

BILL adjusted EPS came at $0.42 compared to break even for the same quarter last year. It beat analyst estimates by 210.7%.

Source: YCharts

Both MongoDB and BILL, despite the top-line and bottom-line beat, dropped after the earnings due to decelerating revenue. Per Barclays analyst Raimo Lenschow, who has an overweight rating on MongoDB, the guidance only implies 16% growth and a meaningful slowdown in the company's Atlas and Enterprise Advanced segments.

We do not place much weight on earnings beats in the current macro environment. This helps to perfectly illustrate why beats can actually be a dangerous way to evaluate a stock. In all cases – HCP, MDB and BILL, the companies were beating on decelerating revenue and/or bottom lines. We had pointed this out in our January Q1 Webinar when we stated: “We won’t be buying beats on decelerating top line or beats on deceleration bottom line.”

Bottom Line and Free Cash Flow

Below we look at the best-of-breed cloud stock’s GAAP operating margin and free cash flow margin. Note that some cloud companies are reporting better free cash margins.

Snowflake reported a higher free cash flow margin of 35% when compared to 15% in the same period last year. ServiceNow has an impressive 52% free cash flow margin when compared to 46% in the year-ago period.

GAAP profitability is another important metric to closely monitor, especially with macroeconomic uncertainty. Adobe ranks the highest in the best-of-breed cloud companies with an operating margin of 34% and ServiceNow ranks second with an operating margin of 8%.

Source: YCharts

Cloud investors should remain cautious as cutting back on expenses may weigh on growth long-term. We do not have all of the information yet on how these companies will perform a year out when they’ve decreased head count, gone remote, cut back on sales and marketing and/or cut back on R&D. During the bull market, cloud was spending for growth and this had a direct relation to helping the top line. The effects of pulling back on this spending will not be immediately seen. We are very new to cloud deceleration, which I estimate began to occur in Q3 2022. We’ve stated various reasons for this being the quarter where earnings were a bit unusual, including the Q2 beats weren’t being carried through to a full year raise on guidance.

As stated on Real Vision, this was a flag to us and we began to decrease our exposure to cloud around this time. I think we will need at least a year to 18 months to see the full effects of reduced spending in relation to the top line. Our December cloud report had said – do not be surprised if we see best-of-breed dip below 20% — and we are already quicker than I thought was possible with MDB reporting 16% growth. Perhaps I should update this and say – do not be surprised if best-of-breed reports below 10% growth. With the information we have today, we are headed in this direction.

More on Margins:

The below chart shows the GAAP operating margins of the best-of-breed cloud companies. Apart from ServiceNow and Adobe, other cloud names have negative GAAP operating margins.

Datadog was GAAP profitable but recently lost their positive margin from +3% to (7%). CrowdStrike is low negative single digits at (5%). Datadog’s management had stated in the earnings call that the previous year’s operating margin benefitted from less in-person office costs and travel costs due to Covid policies.

Source: YCharts

Stock-Based Compensation

Most of the names listed below that are unprofitable on a GAAP basis are paying high stock-based compensation. BILL has the highest percentage of stock-based compensation at 45.9%, followed by Snowflake at 42.6%, and 36.6% for SentinelOne.

The high stock-based compensation is something to be on watch for, because when companies report, they will overemphasize non-GAAP earnings. For example, BILL has a GAAP operating margin of (43%) and an adjusted operating margin of 12%, with the primary difference being stock-based compensation.

Stock-based compensation is a non-cash expense added back to adjusted earnings. However, in practice this is an expense as per GAAP rules. Warren Buffet said the following, which relates to the importance of GAAP earnings over adjusted earnings when stock-based compensation is involved. “If options aren’t a form of compensation, what are they? If compensation isn’t an expense, what is it? And if expenses should not go into the calculation of earnings, where in the world should they go?”

Source: YCharts

Valuations

In the below chart, we ranked companies based on the forward P/S ratio. Snowflake and Cloudflare have the highest forward P/S ratio. These have come down considerably over the past few months. Eventually, cloud will hit a bottom on valuations and be cheap enough for risk-adverse investors to consider.

Source: YCharts

Ranking based on revenue estimates change for current quarter.

Zscaler’s revenue estimates have been revised up 2.4% and CrowdStrike’s revenue estimates have been revised up 1.6% in the past 30 days. On the other hand, GitLab’s revenue estimates have been revised down (6.6%), Datadog’s revenue estimates have been revised down (2.6%), and MongoDB’s revenue has been revised down (1.7%). This is another reason that earnings beats are not the best way to determine the outcome of an earnings report. Because the market is forward-looking, you’ll see a company beat current estimates while being revised down on forward estimates. This is a trap that retail should try to avoid at all costs.

Source: YCharts

Ranking based on adjusted EPS estimates change for the current quarter.

MongoDB’s adjusted EPS has been revised up 47.4% in the past 30 days. We also noted earlier in our analysis that the company had a very strong adjusted EPS beat in the recent quarter. Similarly, Zscaler’s estimates have been revised up 27%, and CrowdStrike’s by 16.8%. On the other hand, Snowflake’s estimates have been revised down (26.4%) and Gitlab’s by (10.1%).

Source: YCharts

A Few Best-of-Breed highlights and lowlights in Q4.

According to the data above, Adobe and ServiceNow are best positioned to weather the new macro. This is due to favorable bottom lines, which includes the elusive GAAP profitability for this category. Their stock-based compensation ranks margin lowest on our list and their respective GAAP operating margins reflects this.

ServiceNow and Adobe also have two of the strongest free cash flow margins in the category and are essentially flat QoQ/YoY on the top line while many cloud stocks are deeply decelerating.

Crowdstrike is guiding for QoQ growth from Q4 to Q1 on both the top line and bottom line.

CrowdStrike revenue grew by 48% YoY to $637.4 million (beat estimates by 1.7%) and adjusted EPS was $0.47 (beat estimates by 10.4%). The free cash flow was also strong as it grew by 65% YoY to $209.5 million with a free cash flow margin of 33%.

Crowdstrike guided for $676M, at the midpoint and EPS of $0.50 to $0.51.

Wedbush analyst Taz Koujalgi said, "We calculate that the [annual recurring revenue] guide appears conservative, and if macro conditions do not deteriorate, net new [annual recurring revenue] growth if high single digits are doable."

The management also highlighted that the company had been ranked No.1 for the third consecutive year in IDC’s annual Worldwide Modern Endpoint Security Market. The company was able to increase its market share by 3.8% to 17.7%.

Cloudflare Grows Free Cash Flow Margin

Cloudflare revenue grew by 42% YoY to $274.7 million (beat estimates by 0.23%) and adjusted EPS was $0.06 (beat estimates by 31.6%).

The company had a free cash flow of $33.66 million with a free cash flow margin of 12% compared to a free cash flow of $8.64 million with a free cash flow margin of 4% in the year-ago quarter.

The management highlighted some of the key deals in the quarter, particularly a leading generative AI company signing a one year $1 million deal. The AI company has been a user of free tier since 2017. Cloudflare was also awarded a five-year deal of $7.2 million to operate the .gov registry. The company also got the moderate status of the FedRAMP authorization in December.

Zscaler Grows Free Cash Flow but Billings Slow

Zscaler revenue grew by 52% YoY to $387.6 million (beat estimates by 6.3%) and adjusted EPS was $0.37 (beat estimates by 26.1%). The free cash flow grew by 113% YoY to $62.8 million with a free cash flow margin of 16%. However, the weak point in the company’s report was the calculated billings that grew by 34% in the quarter from 37% growth reported in Q3 and 59% growth reported in the year-ago quarter.

The management mentioned in the earnings call, “Billings were impacted by new customers being more deliberate about their large purchasing decisions at the start of the calendar year. These deals have not gone away, and we have closed a few already in February.” The billings guide for the next quarter was also low. “For Q3 (Q1), we are assuming billings to decline by approximately 9% sequentially, compared to the mid-single digit percentage declines we have seen in the last few years.”

Conclusion

The cloud sector has many moving parts as it mixes strong product stories with weak bottom lines. In addition to this, eventually the valuations will become attractive especially for those that can weather the new macro by cutting costs and maintaining category-leading growth. Across the board, cloud investors should be prepared for a sustained slowdown on the top line. This could worsen over the next year, as typically there’s a direct relationship between spending/investing in growth and top line results 12-18 months later. The opposite will also be true, cutting back on spending/investing in growth will lead to a lower top line.

Our preference is to remain on the side lines for now while identifying the strongest one or two cloud stocks fundamentally for when the technicals show give us a clear signal that it’s time to hold exposure here again. This could happen quickly so we prefer to be prepared in advance with what companies’ charts should take priority.

Of these names, we plan to do a deep dive in April for our premium members on the front runner(s). Stay tuned.

AEHR Fiscal Q3: Strong Earnings Report, All Eyes on Next Fiscal Guide

Aehr has been a wild ride since it’s last earnings report. The orders that came in were substantial, including a $25 million order from ON Semi. This order alone is 50% of last year’s $50M in revenue. The company was in the crosshairs of Tesla’s comments about a reduction in silicon carbide in their lower-tier models, and was also in the crosshairs of the failure of Silicon Valley Bank. When it seemed the stock simply couldn’t go any higher, it defied the odds, and marched higher.

Now, the market is shaking the stock loose on an excellent earnings report. Welcome to the world of small caps. The headlines are pointing toward the CFO leaving, but it’s not a real concern as he’s retiring and not moving onto a new company.

In a nutshell, the company beat on the top line and the bottom line plus reported strong margin expansion year-over-year. Compared to fiscal Q2, the margins were softer by 220 bps on gross margin, 150 bps on operating margin and 150 bps on net margin. This would be nitpicking the report, because on a YoY basis, the margins have expanded nicely (more below).

AEHR is not raising full year guidance despite beating on the top line. This implies $17.3 million to $27.3 million in revenue for next quarter. This compares to $17.2 million this quarter and $20.2 million in the year ago quarter. The high end of this guidance is not a problem given it would represent YoY and QoQ growth. However, given Aehr’s valuation, next year’s fiscal guide from management is where the market may be a touch nervous.

Bookings and backlog were very healthy this quarter (best in company history), which helps in the absence of management pulling forward the current quarter’s revenue beat. One thing to watch is that customer deposits were down, I quote the CEO on this below.

I do think it’s “all eyes” on the next fiscal year guide in July for a few reasons.

  • There are only two analysts covering the stock. Management’s input on what to expect is outsized, in this case. The fiscal year consensus for the 2 analysts is $102.3 million, for growth of 56.8%. This is a sizable hurdle to clear (will be up from roughly 29% growth this year), and with 1 quarter to go before management gives it’s guide, the market likely wants confirmation they can clear this expectation. 
  • Management has referenced a strong H2 2023/2024 and this will help quantify those comments.
  • The valuation is quite high, and to support this, a fiscal year guide from management is very much needed come July.

Financials:

Aehr reported revenue of $17.2 million, for growth of 13% year-over-year and sequential growth of 16%. As stated above, the company did not raise full year guidance, rather reiterated “total revenue of at least $60 to $70 million, representing growth of 18% to 38% YoY, with strong profit margins similar to last year.”

EPS of $0.16 came in slightly higher than expected. This is up from $0.14 EPS from a year ago. The margins saw a turnaround in CY2021 (post-Covid) when margins were negative. This quarter was aligned with the new trend toward margin expansion for the company.

Margins:

  • Gross margin of 51.6% up from 48.6% in the year ago quarter. Last quarter, the GM was 53.40% softer by 180 bps
  • Operating margin of 22% up from 14.8% in the year ago quarter. Last quarter, the OPM was 23.50% softer by 150 bps
  • Net income margin of 23.8% is up from 14.7% in the year ago quarter. Last quarter, net  profit margin was 25.30%.

On the margins, management pointed toward a slight increase in SG&A and R&D for the QoQ change. On net income, the GAAP includes a $1M adjustment for excess and obsolete inventory.

Cash:

Free cash flow will be available in the 10-Q that is filed over the next two weeks.

The August quarter reported cash flow margins of 50% which offset the other quarters:

  • In the year ago quarter ending in February, the company reported operating cash flow of (19.2%) and FCF margin of (19.7%). This was roughly ($3M)
  • Last quarter, the company reported operating cash flow of (1.3%) and free cash flow of (1.4%). This was roughly ($200K).

The cash has increased to $42.8 million, up from $36.6 million last quarter. This is due to the agreement for a $25 million at-the-market offering, of which $7.3 million was sold last month at a share price of $34.78. This leaves $17.7M remaining. There is dilution of 2.4%. 

Key Metrics:

This earnings report stood out in terms of key metrics. Bookings were the highest in company history at $33 million, up from $10.8 million last quarter. This puts the three quarters of fiscal year to-date at $72 million, compared to $62.2 million for the entire fiscal year last year.

The backlog is at $31.6 million with an effective backlog of $41 million. The backlog in the year ago quarter was $26.9 million, and the effective backlog was “over $30 million.”

Inventories are ticking up, which can often be seen as a negative (company like Micron participating in a cyclical slowdown). For Aehr, it’s good to have inventory on-hand for any spikes in demand. Inventories were at $21.6 million, up from $3.6 million last quarter and up $6.5 million in the year ago quarter. This is only 1/5th of next year’s fiscal consensus estimate of $102 million.

In the last earnings call, the following was stated:

“This quarter, AEHR discussed ramping inventory by an additional $5 million (so far) year-over-year in Q2: “We are increasing inventory to support our expected growth in the second half of fiscal 2023, and we continue to purchase inventory to ensure adequate supply to meet current customer and future customer market demand.”

Aehr’s management is optimistic for H2, which we reported on in the last earnings write-up.

“The company mentioned “momentum into 2024” in this call: “And as we had — if you look at the amount of capacity that everybody’s talking about to hit in 2025 calendar-wise, most people are just really focused on second half 2023 and into 2024 is where just a lot of capacity is coming online and so it may be less to do with the timing of us as the timing of that silicon carbide ramp. And our goal is to get qualified before that ramp happens and have a ton of capacity and material on hand to be able to address it.”

This quarter, Aehr discussed ramping inventory by an additional $5 million (so far) year-over-year in Q2: “We are increasing inventory to support our expected growth in the second half of fiscal 2023, and we continue to purchase inventory to ensure adequate supply to meet current customer and future customer market demand.”

Earnings Call: 

Current Fiscal Year Guide:

Here’s a question from one of the analysts that cover the stock on the current fiscal year guide still looking conservative and he also notes the wide range:

 “Jed Dorsheimer

So I guess first question, Gayn or maybe Ken, maybe you want to take either one. But the guide and kind of reiterating the numbers suggest a pretty wide variance at this stage in the game, $17 million to $27 million […] And I know that there were two tools with the — that we weren’t — that you weren’t sure were not you get the rev rec to fall into the quarter. But I am wondering, is that the only thing that sort of kind of the difference of that $10 million or is there something else that you can probably provide a bit more color on?”

Gayn Erickson

“Aehr Test along with most, I think, all capital equipment companies have revenue recognition policies related to when you can score revenue and that is different than when you get paid by the way. Our policy, I think, is very conservative. If we have a new product, particularly to a new customer, but if we have a brand new product that has never been proven or installed and accepted by the customer, we simply don’t take revenue for it until that milestone, even though we know it’s working here, it’s been completely proven out, et cetera, but until the customer actually signs off on it, we won’t score revenue recognition. And we gave that as a pretty big heads-up going in. That’s why a lot more detail than normal, and candidly, we will probably be pulling back on detail related to things. It’s just to make sure that our shareholders understand that we have got some pretty large revenue number of things that are shipping during the quarter, but may or may not score revenue.

And you have several multimillion-dollar tool that misses by a few days and it’s pretty easy. What I want to make sure that and I will be explicit even though it’s just been implied, we are just talking about whether it comes in, in Q4 or Q1. So that’s the bulk of it.” 

Jed Dorsheimer

No. The color is helpful. So thank you. I guess if you could just help me reconcile just two moving parts. Inventory, not surprisingly picked up as you talked about in terms of ramping some of these products, but customer deposits dropped off on the balance sheet. I was wondering if you could just provide a bit more color there. Is that a timing issue or how should we read those two vectors, if you will? 

Gayn Erickson

Yeah. That’s a good observation and good to move in [ph]. So we actually have taken with some specific terms and conditions with customers. There are circumstances where we do not take down payments. It’s a pretty good threshold contractually for them to actually do that.

I have also at times on a brand-new product with a new customer, waived the down payment to begin with, because it’s a little odd to tell them we guarantee it’s going to work and then at the same time, we holding their money.

And candidly, people are pushing back harder and harder on some of those deposits. Ken, I think, a lot of it is that they can earn a lot more money on that too. But there’s a little bit of examples where some of the backlog is not all out of deposit and that’s what you are seeing. 

New Customers, New Products and New Markets:

Aehr has four committed customers for silicon carbide. Per the CEO: “We have actually announced a total of four customers in silicon carbide so far. We expect production orders from all of them during the next fiscal year.” One of these customers has not announced it’s in the silicon carbide market yet.

Gallium Nitride is getting more air time on the earnings call. From the sound of it, this will be the next market Aehr participates in a meaningful way.

“In addition to our momentum in silicon carbide, we are now engaged with several gallium nitride semiconductor suppliers ranging from radio frequency or RF devices to power devices. Since our last call, we also received a firm commitment from a very large multinational semiconductor supplier to move forward with a full wafer level evaluation of gallium nitride devices. This evaluation includes our new high voltage option for doing the critical HTRB stress needed for gallium nitride MOSFETs and amplifiers. 

We believe gallium nitride will be a significant market, driven by some of the very — some very high volume applications such as RF amplifiers, consumer, electronic power converters and chargers, solar power inverters and charger and converter applications in both standard and electric vehicles. Feedback from companies has been that several of these applications will require production burn-in to meet the application’s critical quality and reliability needs.”

On the topic of silicon photonics … the CEO said “while we believe this transition is still several years out”, yet did state they have 6 potential customers: “Aehr currently has systems installed at over half a dozen customers for 100% test and burn-in of silicon photonics devices used in 5G infrastructure, data and telecommunication transceivers and a few additional applications yet to be introduced.” They also specifically name dropped Intel, Nvidia and AMD for plans to “integrate silicon photonics transceivers into their microprocessors, graphics processors and chipsets.”

China was talked about quite a bit.

The far majority of Aehr’s business comes from outside of China, but Aehr believes over time, the company will serve this market for silicon carbide.

We are also talking to suppliers in China, as well as OEMs in China. So we are kind of making our way up the food chain, if you will, with several conversations with Tier 1s and OEMs, which as people that are close to this realize that is a completely new thing.

Prior to COVID, none of the automotive guys talk to the semiconductor guys, right? They all worked with Tier 1s and then the Tier 1s bought from the semiconductor guys. But with all the craziness that went on supply chain, automotive guys who realize they need to go directly to and talk to the semiconductor guys. Well, we are taking a step further, they are talking to us […] Having said that, we are very confident in next year and how things are going and candidly, without trying to be in a significant portion of it, I would say that would be upside to our plans.”

Please note:

These new markets, new products and new customers are exciting, yet we have emphasized many times that the majority of Aehr’s revenue comes from one customer today — On Semi. There is customer concentration risk. We want to weigh what drives revenue at the company today alongside what can move the needle over the next year. We are comfortable with this risk, each I/O Fund Member will need to decide for themselves what their risk tolerance is around high customer concentration.   

Conclusion:

Aehr is a company where technicals are going to be of utmost importance as we surf the silicon carbide wave. Per our last earnings report write-up: “We took gains in AEHR recently because we felt it was the responsible thing to do. The small cap had grown to be the top leading position in our portfolio. However, we’d like to build back at key times as the company is doing all the right things.” 

Some rough numbers: The stock is up 68% since the last earnings report when I stated we took gains – that 68% includes today’s (15% pullback). We have been reducing our position since late November, not out of lack of conviction, but because we feel it’s the responsible thing to do. We then attempted a 1% breakout.

My point is that small caps are one where investors should determine how they want to play this. Going long and strong with a company that has this kind of TAM is understandable. SiC wafer market is expected to grow 35X by 2030 – that’s not a typo. “Forecast from William Blair estimate that the silicon carbide market for devices in electric vehicles alone, such as traction inverters and onboard chargers is expected to grow from 119,000 6-inch equivalent silicon carbide wafers for EVs in 2021 to more than 4.1 million 6-inch equivalent wafers in 2030, representing a compound annual growth rate of 48.4%. This equates to almost 35 times larger in 2030 than in 2021.”

Notably, Aehr’s wheels fell off last year and it dropped (70%) with no real notable change in the story. Many investors will look for a “why” but it’s the nature of small caps facing macro headwinds, which results in a risk-off appetite. Even if an investor thinks they are mentally prepared for this, it’s extremely uncomfortable when a selloff in small caps (and other larger tech stocks) actually happens.

We prefer to be in the middle with this stock – we are going to participate heavily at times (it grew to be our number one position) but also try to take gains when we can. The company is trading at a forward P/S of 13. The stock is much safer under a 10 forward P/S and safer yet under a 6 forward P/S. If we get into this range, you’ll probably see quite a few buy alerts. 

The Forward PE Ratio is similar – not much history holding at this level.

The fiscal year guide is very important because it will lay the foundation for the stock’s valuation. If the guide is higher than analysts are forecasting, then these valuations get cheaper overnight. The orders that are announced throughout the quarter help, in this regard. The risk would be a lower FY2024 guide (given only two analysts cover the stock) and valuations will be forced to get cheaper. Hence, there is some buildup going into the July call. 

Additional Information on Orders and Recent Headlines:

Note: we’ve spoken about this throughout the quarter, listed here for reference purposes.

For a small cap, Aehr has had to weather quite a few headlines this past quarter.

Aehr holds a credit line and checking account at Silicon Valley Bank. The official statement from the company is the following:

  • “Aehr Test does have a checking account at SVB with a current balance of under $2.5 million, which is less than 6% of our total of $41.8M in cash and short-term liquid assets”
  • “Aehr has over $39.3 million in another financial institution which includes over $9.7 million in cash and $29.6 million in short term US Government backed Treasury Bonds.”
  • “Aehr has no outstanding balance on its line of credit with Silicon Valley Bank and foresees no need to draw on the line in the near future. Aehr believes that there is no impact to our operations, customers, vendors, or employees. We are taking all appropriate steps to prevent any impact on our operations.”

The second headline, which had a larger impact on daily price movement, was Elon Musk’s comments about reducing the need for silicon carbide. Management was quick to respond with the following:

  •  “Tesla clarified that this will not impact the current high-performance model platforms including the Model S/X and Model 3/Y vehicles. Also, we believe that the new chips in the lower cost models will be 100 Amps per device versus 50 Amps per device today and likely 50% or more larger in surface area; therefore, the number of wafers required will be less impacted
  • This is important as Aehr’s total available market is primarily driven by the number of wafers required, not the number of devices”
  • “It is also important to understand that a 100A device using today’s generation of silicon carbide devices is approximately 50% larger than the devices used in the current Telsa inverters. So, while this new lower performance 800 kVa inverter only uses 12 die or 75% less than the current 48 die design, the die themselves are estimated to be about 50% larger, or require 50% more wafers for the same number of die.”
  • “In addition, during the Q&A session, Tesla further clarified that the new inverters would be made from a new Tesla-proprietary custom module package, and that Tesla would purchase the die from multiple manufacturers and package them in this Tesla-proprietary custom module. Again, Aehr sees this as a natural roadmap and consistent with the roadmaps stated by major manufacturers of silicon carbide where the electric vehicle inverters will migrate multi-chip modules to reduce power conversion losses, improve thermal performance, simplify design, and lower overall cost of the inverter system. As companies migrate to silicon carbide modules with multiple die in a single module package, the need for wafer level test and burn-in become critical to ensuring automotive quality and reliability as well as cost as the yield loss as a result of the stress test induced failures during burn-in become extremely expensive as a single die failure in a module results in throwing away the entire module including the other die in the module. Therefore, we believe the business use case for our solution actually increases. Wafer level test and burn in of 100% of die and extended burn in times will be required to earn Tesla’s business

Orders Since the Last Earnings Report

  • In January, AEHR received a $25.1 million order for FOX-XP Test and Burn-in Systems. This will include a later order of the WaferPaks (the razor-razor blade model). The customer was ON Semi, per the CEO stating it came from their “lead silicon carbide customer”
  • A little more than a week ago, AEHR received a Volume Production Order from a “Major Silicon Carbide Customer” – this was not ON Semi as it was stated it came from Aehr’s “second major silicon carbide semiconductor customer.” The shipments are expected to begin March 1st.
  • In March, Aehr also received an additional $6.7 million order from ON Semi.
  • In January, Aehr announced a new customer that supplies both silicon carbide and gallium nitride semiconductors.

Official Press Release: I/O Fund’s Cumulative Returns Double the Nasdaq Following a Tough 2022

Actively managed portfolio and research site announces its largest cumulative lead over institutional all-tech portfolios. The I/O Fund defies a challenging market, outperforming peers and providing innovative tools to level the playing field for retail investors.

I/O Fund, a tech research site that actively manages a real time portfolio, announces a cumulative return of 46.92% since inception versus the Nasdaq-100’s 18.65% return during the same time period.

Impressive Performance in a Challenging Year for Tech (and the Market as a Whole)

A few important highlights of the I/O Fund’s performance include:

  • Cumulative return of 46.92% since inception, compared to the Nasdaq-100’s 18.65% return during the same time period
  • More than doubled the Nasdaq since 2020 with an outperformance of 28.27%
  • 2022 performance of (-38.8%), rivaling the Nasdaq-100 performance of (-32.9%)
  • Relative outperformance in 2022 surpassing institutional all-tech portfolios by as much as 85%
  • Since inception, the I/O Fund has a lead over institutional technology portfolios by as much as 174% including those who manage billions of assets under management (AuM)

Typically, in a risk-off environment, the indexes are known to protect investors to the downside. It also helps to gauge the overall cost of owning tech in a historic year for losses in the stock market. Meaning, even the most conservative tech investors lost (32.9%) in 2022, defined by those that hold their exposure to NDX through QQQ.

Notably, losses are geometric in nature, so a portfolio that is down (67%) has to go up 85% to catch up with our 2022 performance of (38.8%). Since inception, to catch up with the I/O Fund compared to other all-tech portfolios, you’d have to make up 174%. 

Our 2022 relative outperformance followed an outperformance in 2021, with gains of 11.4% compared to many tech funds that were down (23%) or more. On a cumulative basis, we currently have the largest lead over Ark that we’ve ever had since inception. 

Ark is not the only all-tech portfolio peer that we are outperforming on a cumulative basis. The portfolios listed below are managed by highly regarded portfolio managers, are reserved for high-wealth individuals only, and have billions of assets under management (AuM).

I/O Fund's 2022 Audited Returns chart

Pictured above: If you had invested $10,000 with the I/O Fund's picks versus other all-tech portfolios at inception, the difference would be a portfolio value of $14,692 with IOF versus $5,358 with institutional tech-focused portfolios. The difference in value is 174%.

You can read the official Business Wire press release here. A copy of the auditor’s engagement letter including verified procedures and the verified performance percentage is shared with I/O Fund customers in the paywall article “2022 Audited Returns.” To become a customer of the I/O Fund, learn more here.here. A copy of the auditor’s engagement letter including verified procedures and the verified performance percentage is shared with I/O Fund customers in the paywall article “2022 Audited Returns.” To become a customer of the I/O Fund, learn more here.
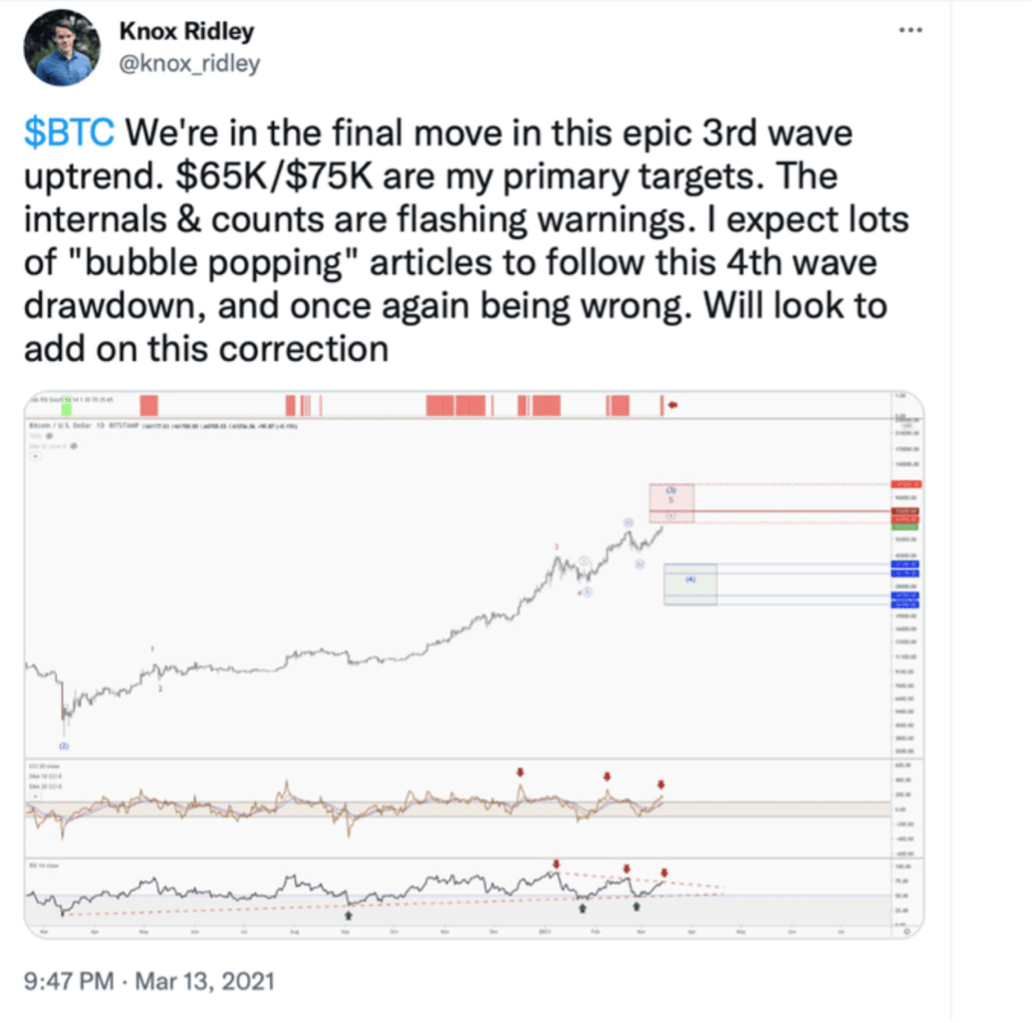
How the I/O Fund was Able to Rival the Nasdaq During a Historic Bear Market for Tech

Our firm is well-known for carefully choosing allocations as an important risk management tool. Lead Tech Analyst, Beth Kindig, has over a decade of experience analyzing tech. Her deep dive research helped the firm build its highest allocations in the complex semiconductor industry, which was the best performing sector in tech in 2021 and 2022.

Kindig has made contrarian, bullish calls on Nvidia in her free newsletter. Her analysis led to the I/O Fund buying at the October low for a 35% gain by year end, which has turned into more than 140% gains. Year-to-date, Nvidia is the best performing S&P 500 stock on the market, and remains the I/O Fund’s top position. Notably, the firm takes gains throughout the year on their positions and issues real-time trade alerts to this effect.

“We stayed focused and pivoted to hedging in April which helped us stage a strong comeback. In addition to hedging, we built a defensive tech portfolio that included two of the tech industry’s leading stocks. We held these winners at some of our highest allocations in Q3 2022 with gains of 33% and 43% on our initial entries.” -Business Wire press release, Lead Tech Analyst, Beth Kindig

I/O Fund also owes its lead over other all-tech portfolios to technical analysis. Portfolio Manager, Knox Ridley, actively manages the portfolio in real-time, providing readers with weekly webinars and charts to show where the I/O Fund plans to buy and sell key positions.

Ridley is known for managing high-risk assets in 2022, such as Bitcoin, Nvidia, and Netflix, with a near-perfect track record. This led to outperformance during a historic selloff across tech stocks. Ridley issues real-time trade alerts to research subscribers for every stock entry and exit plus offers a pie chart of the portfolio’s allocations.

“Given that 2022 destroyed more wealth on record than any other time in modern history, beating the Nasdaq on a cumulative basis cannot be overstated. The far majority of our competitors cannot say the same. Our performance reflects our ability to outperform in any market condition,” said Portfolio Manager Knox Ridley.

Note: Knox Ridley holds weekly webinars that discusses the broad market and I/O Fund’s positions, including the positions the I/O Fund plans to trim, add, sell or buy. He also goes through details on the automated hedge weekly. Learn more here.Learn more here.

In April, the I/O Fund partnered with Vincent Duchaine of WealthUmbrella to develop an automated hedging signal. Duchaine is an A.I. and Machine Learning University Professor who worked with Ridley to create an automated risk-on/risk-off signal for retail investors. This marked an important turnaround for the I/O Fund as the team expanded their risk management tools during a critical year to stave off losses.

Sign up for I/O Fund's free newsletter with gains of up to 221% -Click hereSign up for I/O Fund's free newsletter with gains of up to 221% -Click hereClick here

Strategic Approach and Focus on Top-performing Stocks & Sectors

In 2022, we made a strategic shift by leveraging hedging strategies with exposure to top-performing sectors within the tech industry plus top performing stocks.

  • The I/O Fund held a 30%+ allocation to semiconductors in 2022, which despite all odds, has been one of the top performing sectors in tech in 2021, 2022 and YTD 2023. Beth Kindig’s expertise in the tech industry helped the I/O Fund feel confident allocating 10% and even 15% positions in this complex sector over the past few years.
  • As early as June last year, Beth shared bullish commentary on one of our most significant current portfolio holdings in the article “Netflix Stock Could Rally with Ad-Supported Content.” Since I/O Fund’s original entry, the stock was up 33% in 2022. The firm held up to a 9% allocation. We offered our free newsletter subscribers an in-depth analysis and investment rationale, enabling them to take advantage of this top performer in the second half of the year.
  • As stated above, Kindig made contrarian, bullish calls on Nvidia in her free newsletter. Her analysis led to the I/O Fund buying at the October low for a 35% gain by year end, which turned into more than 140% gains total. This position and the others noted above helped the I/O Fund rival the Nasdaq’s performance in 2022.

Cutting-edge Analysis and Innovative Partnership Tools with a Focus on Hedging

The year 2022 marked an important turnaround for our firm as we gave up what I would call “retail idealism” which centers around the idea that holding a stock for a long period of time is retail’s only defense. This works during times of economic expansion, but this can go (horribly) wrong when a new, more challenging macro can change the outlook for any given company.

This year, we partnered with Vincent Duchaine of WealthUmbrella to develop an automated hedging strategy, which helped us successfully bridge the gap between human-driven actions and objective, emotionless machines. Ray Dalio calls this the “man and machine approach.”

With the automated hedging strategies, the I/O Fund was able to hedge up to 100% of our portfolio at times, focusing on playing defense rather than offense during last year’s market extremes. This hedge not only mitigated some of the most significant market drops after April but also set the stage for our relative outperformance towards the end of 2022.

As the market experienced a steep downtrend all year even into year's close, our portfolio manager Knox Ridley provided two long-term bullish scenarios, along with a detailed analysis of global market trends, divergences, and new market leadership. Knox also accurately predicted the August to September pullback and the October market bottom, helping investors make timely decisions in a demanding market environment. As the articles illustrate, Knox publicly navigated the broad market for free newsletter subscribers while reserving his real-time trade alerts for premium members.

A few of the biggest moves from the hedge in 2022 are detailed in the article “The Best of I/O Fund’s Newsletter in 2022” with more information including daily real-time trade alerts provided behind the paywall. The Best of I/O Fund’s Newsletter in 2022” with more information including daily real-time trade alerts provided behind the paywall.

Commitment to Transparency and Accountability

At the heart of I/O Fund, we believe that transparency is key to our success. We keep our members in the loop with real-time trade alerts and audited performance reviews. This raises the bar on accountability as no other retail site goes to these lengths by offering an actively managed and transparent portfolio.

Over the past three years, the I/O Fund has invested over $130,000 into accountability and transparency for our Members. When we launched in July of 2019, for the first year or so, we used a forum hosted by Tribe for our trade alerts, but by January of 2021, we had migrated to SMS and email tools that are least likely to experience an outage for our real-time trade alerts. This costs us $40,000 per year.

In addition to this, we use an auditor from a large firm in San Francisco to mathematically review and verify the performance of our I/O Fund portfolio trading account and crypto account. The process is quite extensive and it takes up to four months to complete. This costs $4,500 per audit and we’ve completed four audits for a total of $18,000 spent on this process. Premium members can access the verified procedures, verified performance and engagement letter here.

I/O Fund Analyst, Beth Kindig, recently wrote “The Importance of Verified Returns and Risk Management for Retail” which identifies three key reasons retail tends to underperform professional investors. The I/O Fund has worked diligently and made sizable investments to empower retail by addressing these issues which include automation, risk management tools and being the only retail firm to offer a verified performance.

The I/O Fund Experiment: Empowering Retail Investors

The I/O Fund's mission is to help retail investors beat Wall Street in the competitive tech sector. Our experiment in providing institutional-level research and tools to retail investors has been successful since we launched in 2019. This includes beating our other all-tech portfolios in the tough years of 2021 and 2022.

Previous press releases:

I/O Fund Announces Impressive 1-Year and 2021 YTD Returns

I/O Fund Outperforms Leading Active Tech Funds in 2021

I/O Fund Cumulative Returns Double the Nasdaq Following a Tough 2022

Join the I/O Fund Community Today!

If you are ready to optimize your investment strategies, join the I/O Fund Community and experience the advantages of accountability, innovation, and exceptional performance. Subscribe to our premium analysis service to access real-time trade alerts, weekly webinars that review our positions plus the broad market, a forum to connect with other skillful investors, and deep dive research from a Silicon Valley trained analyst who is frequently in Tier 1 media. Learn about our Premium Services here or Explore Pricing Options here.

Please note: The I/O Fund conducts research and draws conclusions for the Fund’s positions. We then share that information with our readers. This is not a guarantee of a stock’s performance. Please consult your personal financial advisor before buying any stock in the companies mentioned in this analysis.

POSITIONS REPORT – 3/28/23

For reference to terminology used, please look at technical analysis under our resources section here. Regarding the charts below, the vertical tan shades represent time factors. These are inflection points where we have high odds of something significant happening. More times than not, (3/4 of the time), they mark a turning point in the trend. So, what matters is the direction we are trending into these periods. Regarding the vertical lines, black lines represent strong support/resistance, while dark red lines mark very strong support/resistance.here. Regarding the charts below, the vertical tan shades represent time factors. These are inflection points where we have high odds of something significant happening. More times than not, (3/4 of the time), they mark a turning point in the trend. So, what matters is the direction we are trending into these periods. Regarding the vertical lines, black lines represent strong support/resistance, while dark red lines mark very strong support/resistance.
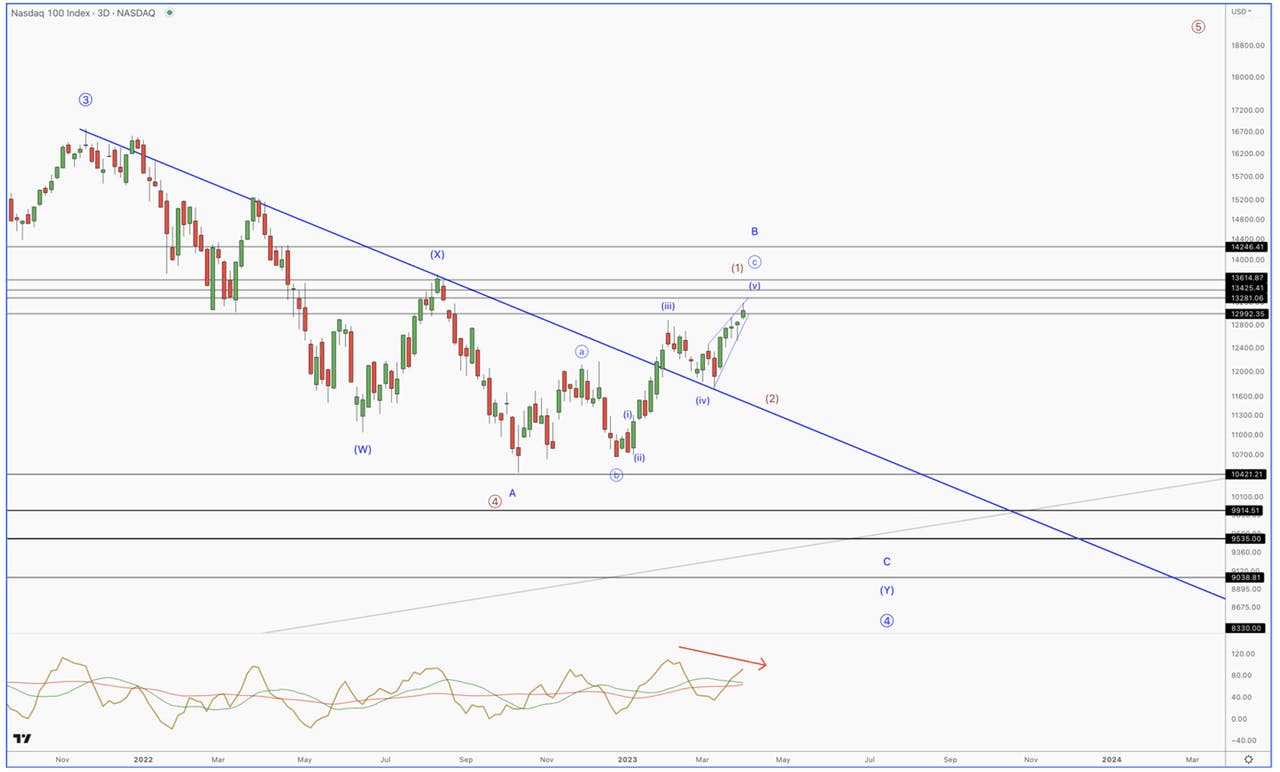
Elliott Wave count are meant to provide context. There is a pattern unfolding in real-time, one of which will play out. By monitoring price levels that are held/broken, it will help us figure out which one is in play

Broad Market

Nothing has changed from last week. My primary case is that we have topped, and are attempting one more push higher before the bear market continues lower. My alternative case is that this push higher can morph into a multi-month uptrend that takes us to at least 4275. However, both scenarios categorize the move higher from the October 13th low as a corrective rally in a larger bear market.

The internals of this bounce are quite week. Note the weakly RSI above. It can’t even break above the black resistance zone that has suppressed all attempts at a larger thrust higher. If the below red dashed line breaks to the downside, this will be an early warning that the downtrend is about to continue.

If we zoom in on the chart below, first off, the structure off the February high is a clear 5 wave pattern. This leaves us with two alternatives on what is unfolding in the current bounce:

Blue – This is a 2nd wave bounce. The probabilities support this. More times than not, an overlapping, messy bounce is a correction in a larger downtrend.

Red – We are starting a new uptrend to at least 4275. However, the only pattern that this first wave could be is a rare pattern called a leading diagonal pattern. This is a 5 wave pattern that is overlapping and messy.

In order for a leading diagonal to be trusted, we need to see: (1) a 5th wave higher, preferably to our 4067 target, (2) a 3 wave retrace that holds the 3900 low; (3) a breakout above where the 5thwave tops. This is a lot to ask, and one should be cautious on getting too overly bullish until the above criteria is met.

Critical supports: 3900, 3835, 3808. For each level that breaks, risk increases substantially. Below 3808, and the bear market resumes.

Do not underestimate the importance of price action here. The bulls must thread a thin needle by completing this rare leading diagonal pattern in order to push us higher. If they do this, we will be monitoring and may add to our longs. Short of this, pay close attention to the key support levels previously outlined for clues.
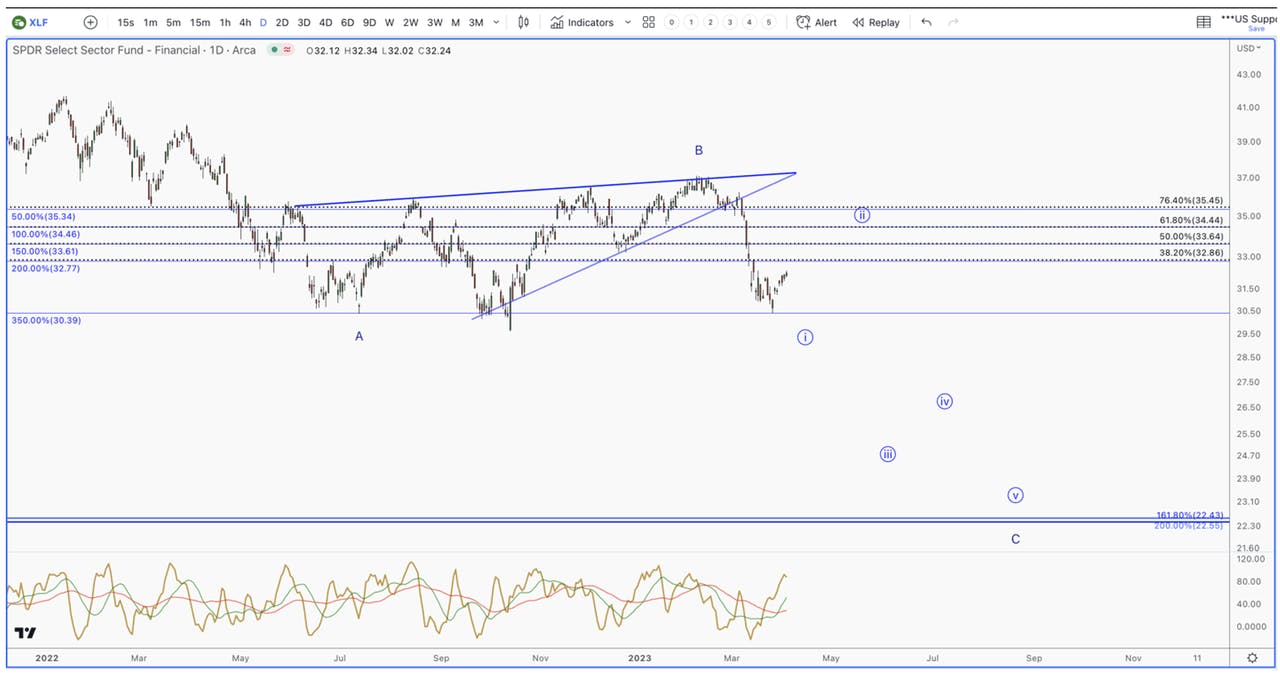
Commentary on Contrarian Investing

Support for the Red can be found in the excessive positioning into defensive assets as well as various sentiment gauges. This would be the contrarian bet, and more times than not, the market does not reward the herd at inflection points.

Sentiment is currently hovering at bearish extremes. There are many ways to gauge this, one that I like is the AAII survey that asks investors if their perspective is bullish or bearish over the next few months. The 8-day moving average of the bullish % is hovering at a historically low extreme, which is unusual.

Not only do most investors feel terrible about the markets right now, but they are positioned accordingly. There is currently $5.1 Trillion in money market funds, which is more than we saw at the COVID extremes.

BofA Global Research takes this one step further to show money managers are positioned. As you can see, equities are the most hated asset, while cash is the most liked.

However, if we look in the options market what you are seeing is not what the above contrarian information should suggests. With excessive worry should come excessive negative bets in the form of implied volatility. On a nominal basis, there is a heightened implied volatility, but this only matters in relation to the actual volatility in the markets (realized volatility). Now, when we compare the implied volatility to the realized volatility, we are not seeing the type of contrarian signal you would expect.

The reason for this is due to realized volatility being uncomfortably high. This implies that there is not a healthy level of liquidity in the markets, which makes us more susceptible to see large intraday swings. The rule is that where realized volatility is today, go back in time and find periods when it was at similar levels, and you can get an idea of the type of move it can lead to.

One more point about contrarian investing. Anyone that looks back in time, can find periods where defensive positioning/extreme sentiment readings were actually right. In early-to-mid 2008, we saw excessive defensive bets and sentiment in the basement, much like now. Then October of 2008 happened. We saw similar readings in early 2022, I being one of the contrarians that was leaning into this data at the time. However, much like 2008, the contrarians in early 2022 also got steamrolled.

Macro

The popular narrative in the Financial Media is that the current banking issues in the US are localized to regional banks, it is largely under control, and mega banks should be the beneficiaries to the exodus of deposits from regional banks. The charts are telling a much different story.

XLF is an ETF that tracks The Financial Sector Index. This is an index that is comprised of the largest banks and insurance companies, not regional banks. It appears to be in a precarious position. After completing a large degree bear pennant (B wave), we have gotten an extended and obvious 5 wave drop from the point of breakdown.

We are now coming to the end of the 1st wave down, so a multi-week bounce may have already started. If we see this bounce retrace into the above targets, and the structure is a 3 wave bounce, I would be cautious of ANY financial holdings. What this implies is that the panic-drop we recently saw was the 3rd wave of a larger 1st wave. That means the larger 3rd wave will be more intense.

Keep in mind the above chart tracks the US financial sector, so the largest banks and insurance companies in the US are in it. We are being told this is localized in regional banks, while the above chart suggests otherwise. Now, let’s look globally.

  • Deutsche Bank announced that they will redeem $1.5 Billion of notes due in 2028. As a result, the cost of their credit default swaps increased sharply, much like what we saw with Credit Suisse prior to their collapse. European banks were down across the board on this news, as Deutsche Bank saw a 14% drop last Friday.
  • The French CAC has been one of the stronger indexes in Europe; however, under the hood, the banking sector is the weakest sector, much like in the US. BPN Paribas, France's largest bank, for example, is down 26% from its February high.
  • Now UBS is being probed and possibly sanctioned due to their support of Russian Oligarchs.
  • Two of Japan’s largest banks, Mitsubishi UFC Sumitomo and Mitsui Financial, are down between 15% – 17% from March 9th.
  • The largest bank in Australia, the Commonwealth Bank of Australia, is down 14% since March 14th, while England’s largest bank, HSBC, is down 15% since late February.
  • Itaú Unibanco, Brasil’s top bank, is down 15% since late February and over 25% since last November.

I could go on, but my point is that this is not a US centric, regional bank problem. It is a global problem regarding the banking sector. They are not catching substantial bids at major support regions, while most bank charts look like XLF, to a large degree sharp drop, that traces a 5 wave pattern down. If this is what’s unfolding, it warrants caution on this next bounce higher.

Furthermore, the US markets are quite unhealthy. Only a handful of stocks are holding up the rest of the indexes.

Note how the S&P 500 continues to push higher while at the same time we have seen net new 52 week lows day after day. This is possible because of the weighting of the S&P 500. Apple and Microsoft, for example, account for over 12% of the total weighing of the S&P 500, and they have been quite strong while most stocks are continuing in downtrends.

APRIL 11-28

I’ve been talking about the excessive amount of cycles stacking up in mid-late April. Every FAANG, semi, bond, commodity and global market that I track is pointing to this period on time. Take a look the SPX chart below.

That’s five cycles in a 4-day period, with two more on each side of that period in April. When you see cycles stacked like this, it is a period that we should pay specific attention to. As always, what will matter the most is how we are trending into this region.

Hedge

Our hedge is inching closer to triggering. It would likely trigger long before we even test 3900, if we take that path. If this happens, we will go back to being hedged.

I/O Fund Portfolio

Our cash has been reduced down to about 22% and added to our longs in case the red count is about to unfold. Our move into crypto and ENPH is an attempt to position into specialized uptrends, regardless of what happens to equities. We are looking to add another 2% to Bitcoin and another 2% to ENPH, if it breaks out.

NFLX

If NFLX can break above $379, we will take heavy gains. This will complete a very large leading diagonal off the low.

NVDA

The strength in NVDA is quite incredible. It has blown past the $241 region, and inching higher above more and more resistance zones. Though we love NVDA, we are not looking to buy up here. Instead, we have taken consistent gains. No matter how you slice it, we only have 3 waves up, while being incredibly stretched fundamentally and technically.
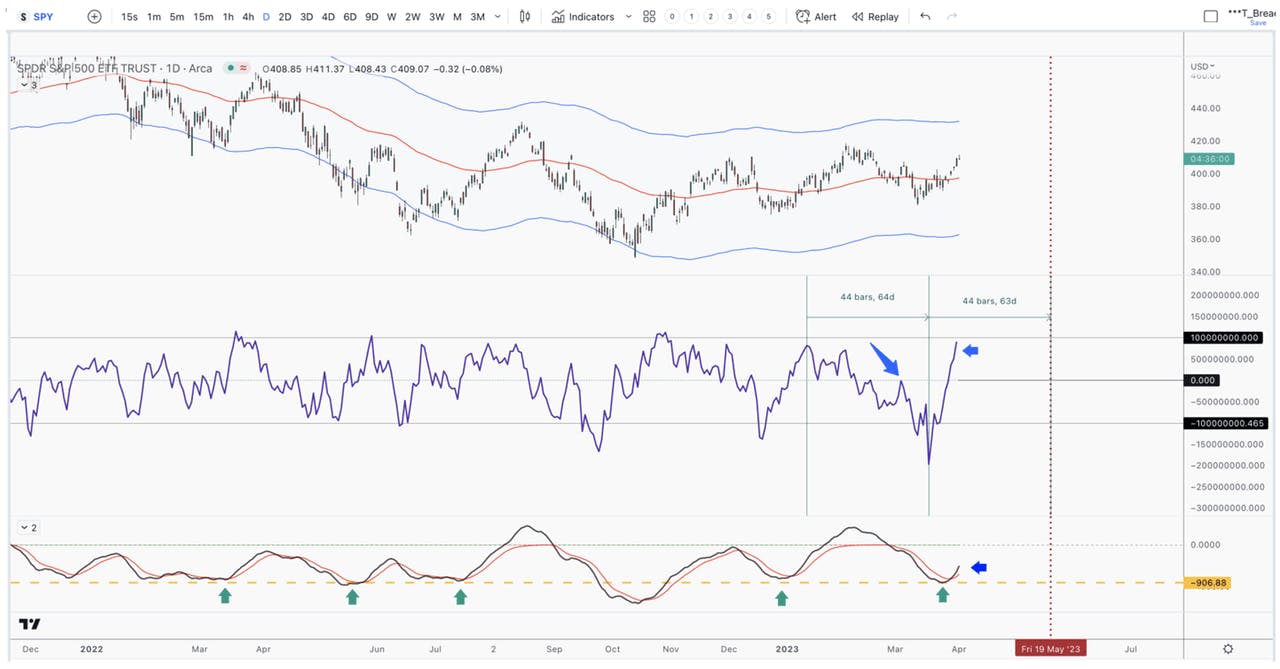
AMD

That’s 5 waves up off the low. Risk is high up here until we see the structure of the pullback – 3 waves down is good, 5 waves down is bad.

ENPH

ENPH continues to track energy commodities. As a whole, they continue to be setting up for what looks like a breakout. Regarding ENPH, a break out above this trendline will signal our next buy.

Oil and Gas

These are two charts I’m tracking that have had a strong correlation to the general direction of ENPH. Gas is looking ready to breakout; however, it is probably waiting for crude to bottom, which should be soon. If the next dip is shallow, then followed by a noticeably bullish push higher, the low is in for crude.

AEHR

Bitcoin

We are leaning into Bitcoin right now, considering the banks. It is separating from equities, which is very interesting. We have a stop on some of our Bitcoin holdings, in case this is a head fake, and the red count unfolds instead.

MSFT

Looks like one more high is possible in MSFT. A deeper pullback is needed if we are going to push higher. If that pullback is 5 waves down, the market is setting up for a fresh low.

Ethereum

TSLA

TSM

Chainlink

MGNI

Slowdown In Cloud Stocks On Thin Ice Following Q1 Guides

This article was originally published on Forbes on Mar 23, 2023,09:56pm EDTForbes Forbes on Mar 23, 2023,09:56pm EDT

Following last quarter’s earnings, we published an analysis on cloud that showed hyperscalers were slowing (5%) sequentially and best-of-breed was slowing (12%) sequentially, based on Q4 guides.

What was most important for tech investors to realize, is that this is out of character for cloud, as Q4 is typically the strongest quarter. We concluded that this foreshadows a weaker-than-expected Q1 and also a weaker FY2023 than was currently baked into estimates.

Following the most recent earnings reports, our prediction is playing out that the slowdown we had predicted would worsen after the current quarter results.

This is important because the cloud category has treated investors quite well with recurring revenue, resiliency during Covid, and some of the strongest examples of product-market fit available on the public markets. However, not even this can overcome the effects of lower budgets and cloud spend, which is the top driver in terms of year-over-year comparisons.

Below, we discuss the fundamental weakness apparent in the most recent earnings reports. For our Premium Research Members, we are extending the analysis next week to include a few outliers that seem more resilient than others in the category, and those that are definitively the weakest.

Often times, identifying one or two strong companies in a category and patiently waiting can pay off, as the cloud category will put downward pressure on the stock price, including the outliers. Our goal is to buy the outlier(s) after they’ve been unduly penalized.

Sign up for I/O Fund's free newsletter with gains of up to 221% – Click hereSign up for I/O Fund's free newsletter with gains of up to 221% – Click hereClick here

Big Tech: Bellwethers for Cloud Spend

Big Tech competes with best-of-breed cloud companies in nearly every capacity. For example, although most think of Azure when looking at Microsoft’s earnings reports, the company has a formidable presence in cybersecurity worth over $20 billion in revenue. Google’s BigQuery is one of Snowflake’s largest competitors, as is Amazon’s RedShift. I covered the differences between the three for Forbes here.
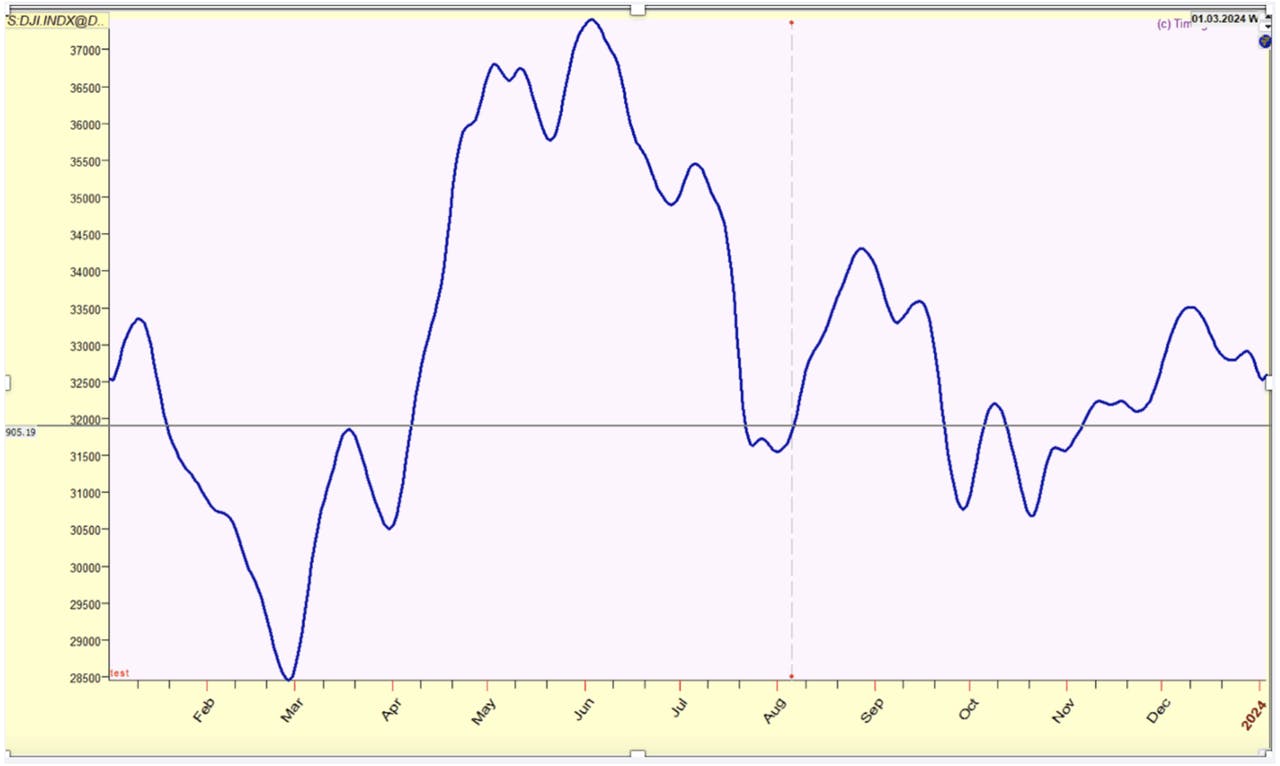
We also made the following point about why the Big 3 is an important proxy in our analysis: “Slowing Growth in Cloud Stocks: When Will We Hit a Bottom”

“The Big 3 are the best proxy because their reports represent the layer in the tech stack that tends to be the most resilient in terms of churn. The switching costs are quite high for cloud IaaS services. The Big 3 also afford a more concentrated view by owning 66% of market share across three companies whereas SaaS is spread across thousands of companies.”

The slowdown over the past four quarters is quite visible:

Cloud Slowdown over past four quarters

The Cloud slowdown over the past four quarters is quite visible – I/O FUND

Cloud Slowdown in Four Quarters

The Cloud slowdown over the past four quarters – COMPANY RESULTS

Key Highlights from the Cloud Hyperscalers:

AWS:

  • AWS sales grew by 20% YoY to $21.4 billion in Q4, down from 27% YoY growth reported in Q3 and down from 33% YoY reported in Q2
  • Q4 2022 growth rate of 20% was halved as AWS sales grew by 40% YoY in Q4 2021
  • AWS revenue also missed the management guidance of 25% growth
  • Guidance for Q1 was not provided, however, it was stated the YoY growth rates in January were “in the mid-teens”

Azure:

  • Microsoft Azure revenue grew by 31% YoY and was down from 35% in Q3. In constant currency, it grew 38% and beat the management guidance by 1%.
  • Microsoft Azure revenue grew by 46% YoY and also in CC basis in Q4 2021.
  • The management provided guidance of 30% to 31% growth rate for the March quarter, down from 38% this quarter and down from 49% on a CC basis in the year ago March quarter.
  • You may recall the 5-point deceleration announced in the October report caused concern in the market. This is technically a steeper deceleration.

GCP:

  • Google Cloud revenue grew by 32% YoY to $7.3 billion and was down from 38% growth in Q3. Revenue missed the analyst consensus estimates by 1.5%.
  • The growth rate was also significantly lower than last year’s growth (down about 1/3rd) when Google Cloud revenue grew by 45% YoY in Q4 2021.

What Big 3 Management Teams are Saying

When there’s evidence of a deceleration, analysts will typically ask the management teams to elaborate on the call with the idea of identifying how much more deceleration may be reported in the future and for how long.

Here’s a question regarding AWS’s slowdown:

Mark Mahaney

[…] Brian, just any color on why mid-teens is kind of a holdable growth rate for AWS over the next couple of quarters, given what looks like pretty clearly, continuing deterioration in enterprise demand?

Brian Olsavsky (CFO)

So on the AWS growth rate, I'm not sure I can forecast for you with any level of certainty what is going to happen beyond this quarter. You kind of — this is a bit uncharted territories economically. And as we mentioned, there's some unique things going on with the customer base that I think many in this industry are all seeing the same thing.

[..] And whether there's short term, perhaps short-term belt tightening in the infrastructure expense by a lot of companies, I think the long-term trends are still there. And I think the quickest way to save money is to get to the cloud, quite frankly.”
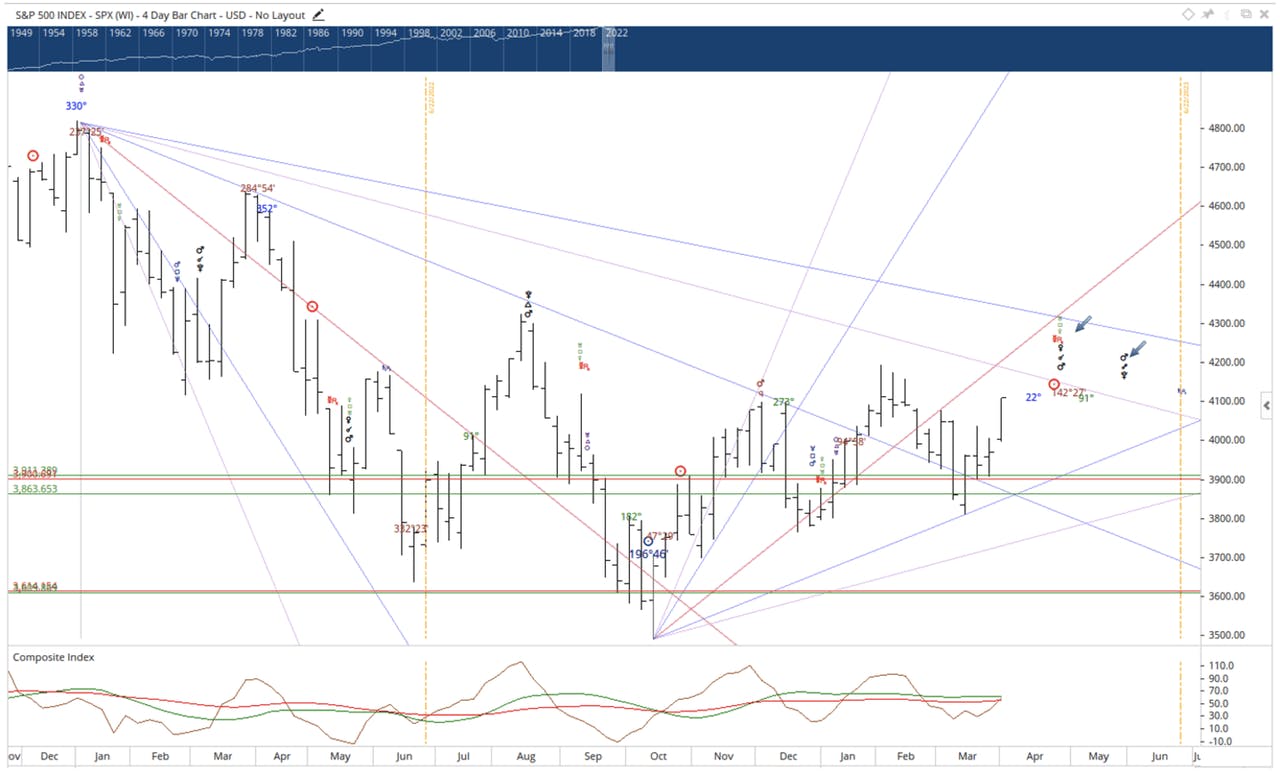
Amazon’s management also volunteered the following in their opening remarks:

“Starting back in the middle of the third quarter of 2022, we saw our year-over-year growth rates slow as enterprises of all sizes evaluated ways to optimize their cloud spending in response to the tough macroeconomic conditions. As expected, these optimization efforts continued into the fourth quarter.”
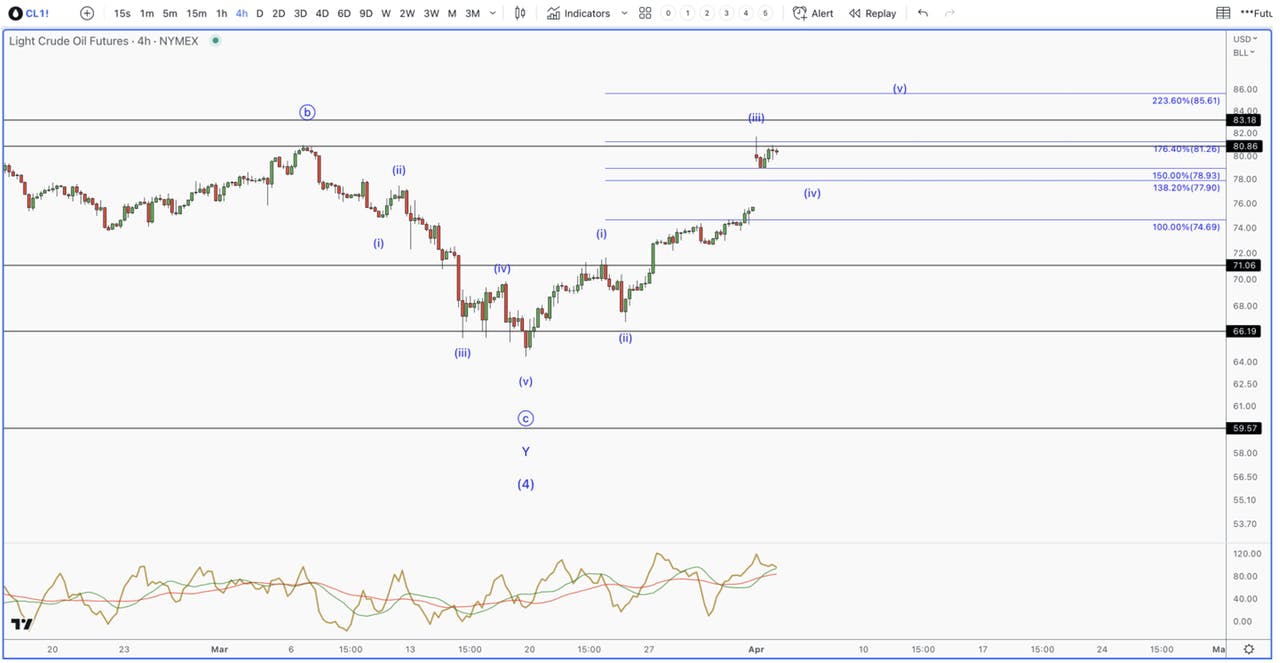
They expect the optimization efforts to continue at least for the next couple of quarters and, in the absence of proper guidance for Q1, said that the YoY growth rates in January were in the mid-teens.”

Per management: “As we look ahead, we expect these optimization efforts will continue to be a headwind to AWS growth in at least the next couple of quarters. So far in the first month of the year, AWS year-over-year revenue growth is in the mid-teens.”

Here’s what Microsoft’s CEO, Satya Nadella, said in the first part of his opening comments:

“As I meet with customers and partners, a few things are increasingly clear. Just as we saw customers accelerate their digital spend during the pandemic, we are now seeing them optimize that spend. Also, organizations are exercising caution given the macroeconomic uncertainty.”

Later in the call the CFO mentions, “As noted earlier, growth continued to moderate, particularly in December, and we exited the quarter with Azure constant currency growth in the mid-30s.”

The I/O Fund has launched a new $99/year Premium Newsletter called "Essentials" — this newsletter delivers premium samples for our readers who want more actionable analysis for their tech portfolios. This month, we released a stock pick that we believe will be a leader in 2023 plus a video with the buy plan.$99/year Premium Newsletter$99/year Premium Newsletter called "Essentials" — this newsletter delivers premium samples for our readers who want more actionable analysis for their tech portfolios. This month, we released a stock pick that we believe will be a leader in 2023 plus a video with the buy planbuy plan.

My Translation:

Cloud will see belt tightening in 2023 and investors will have to gamble on the timing for when this turns around. It could be in the next few quarters or it could take years. Most of this will depend on the economy, as the common denominator for cloud stocks is budgets.

To be clear, the category has the potential to be quite resilient, which we covered in 2019 when we said, “My prediction is this may be one of the last cycles when tech is considered less safe than value stocks. As the market will find out (the hard way), cloud software is actually very safe. It is insulated from trade wars and overseas manufacturing issues. It reduces costs for enterprises, which is ideal for a recession. Lastly, cloud software is at the beginning of a rapid growth cycle compared to its counterparts in tech — such as mobile, e-commerce and advertising — which are reaching saturation, are finding themselves in the cross hairs of anti-trust and are susceptible to consumer spending changes.”

There are a lot of cloud software bulls and for good reason, this category has treated investors well with predictable revenue growth. Cloud software is resilient because it drives down costs and increases productivity. We know this scenario well as we wrote about it many times in the past few years to defend cloud. Often, cloud selloffs were welcomed to position for a 6-month bounce back after the category sold off (40%) or more. I pointed this out in the past on the free side and here on MarketWatch (behind paywall) in 2019 (i.e., when we weren’t facing a brick wall on growth).

The issue with this assumption is that Cloud growth is actually slowing downCloud growth is actually slowing down —- that is the reality of things —- and this wasn’t true in 2019 and hasn’t been true in the last decade. Couple this with weak bottom lines that require cash injections, and what get is a sector that is largely out of favor.

What Analysts are Saying about the Big 3

Institutional analysts are able to do channel checks. It doesn’t hurt to see if there is more information available directly from large cloud customers.

Here are some recent analyst notes:

BMO Capital analyst Keith Bachman said until Azure growth stabilizes, the shares are likely to be range bound. The firm believes there is too much remaining uncertainty on Azure, which represents about 31% of BMO's revenue estimates.

Piper Sandler analyst Thomas Champion said that the Alphabet’s Q4 revenue and EBITDA missed across the board with advertising trends slightly weaker than expected, driven especially by Network. Search growth also slowed and Cloud growth decelerated 550 basis points. He further said Alphabet is transitioning the cost base for slower growth.

Piper Sandler analyst said that the Amazon’s Q4 results were mostly positive with revenues topping the high end of the guidance range. However, Amazon's guidance was slightly weak as Consumers sound cautious and the Cloud deceleration cadence appears to be landing in the mid-teens for Q1. The analyst believes management comments suggest the company is still navigating a difficult stretch.

Interesting enough, Dan Ives lowered his price target on Microsoft following earnings, yet has raised the price target again recently stating:

[…] [Wedbush is] "seeing steady cloud enterprise spending for Microsoft that has stabilized from the softness we saw in the month of December." Wedbush added that Microsoft, along with cloud competitors such as Amazon (AMZN), Google (GOOG), Oracle (ORCL), and IBM (IBM), are "seeing a surge of Beltway cloud deal activity in 2023 with a major shift to cloud underway from the Pentagon to civil agencies in the 202 area code."

More on Best-of-Breed

To help illustrate how the deceleration is quite steep for some best-of-breed names, we took a sample of the top-ranking cloud stocks on revenue growth, free cash flow, adjusted operating margin and/or valuations.

Among the best-of-breed cloud stocks, only ServiceNow’s guide shows sequential growth. The company’s QoQ growth was 7% last year and is expected to be 8% this year. The largest deceleration was in GitLab, with revenue that grew 12% QoQ last year, is expected to decline (4%) sequentially this year.

Overall, the category is slowing down sequentially (a rather drastic) 83% for Q1 guides compared to the previous year — from an average of 12% QoQ last year to 2% QoQ growth this year.

As stated in our previous analysis, it’s assumed that H1 2022 was strong so YoY is less important than QoQ/YoY. This is because the cloud slowdown happened later in the market cycle with first management comments appearing in Q3.

For example, best-of-breed cloud reported a 71% slowdown in QoQ/YoY growth for Q4 guides and is now guiding for a 83% slowdown in QoQ/YoY growth for Q1 guides.

Best of Breed Cloud Report

Best-of-breed cloud reported a 71% slowdown in QoQ/YoY growth for Q4 guides and is now guiding for a 83% slowdown in QoQ/YoY growth for Q1 guides. – YCHARTS

Here is how this compares to last quarter when we were seeing a 2/3 slowdown from 17% to 5% when I stated:

“Yet, the Q4 guidance is out of character as we see a 2/3 decline in average sequential growth rate from 17% to 5%. This is the more severe drop off because Q4 2021 was much better than Q2 2022 in terms of the economy. However, my contention is that Q4 could be reflecting what is to come in 2023 rather a reflection of budgets from 2022 as the slowdown is more pronounced in Q4 than it has been in previous quarters from 2022.”

Q4 Guidance

Source: YCHARTS

Conclusion

Below is cloud’s price action since we last covered the weakness in this sector. This is despite a surprisingly strong January and February for tech.

Cloud's Price Action

Above is cloud’s price action since we last covered the weakness in this sector. This is despite a surprisingly strong January and February for tech. – YCHARTS

Both Bill.com and GitLab saw weak price action compared to the others, and coincidentally, both saw sequential growth turn negative. Prior to the current earnings reports, I spoke about Bill.com and GitLab specifically with Samuel Burke of Real Vision when I forecast there would be further weakness in this category.

Many cloud stocks are on thin ice in this regard, and I imagine that if/when more cloud stocks turn negative on a QoQ/YoY basis compared to last year, weak price action will follow.

Real Vision Tweet

Source: Beth Kindig speaks with Real Vision about the cloud slowdown – REAL VISIONBeth Kindig speaks with Real Vision about the cloud slowdown – REAL VISION

Every investor must determine their personal risk tolerance. The I/O Fund noticed unusually weak fundamentals in cloud in Q3 and re-allocated our positions to other sectors within tech at that time. However, we are hard at work in determining the one or two cloud positions we’d like to buy when this category reaches a bottom. We share our stock picks plus entries and exits with our premium members. You can learn more here.
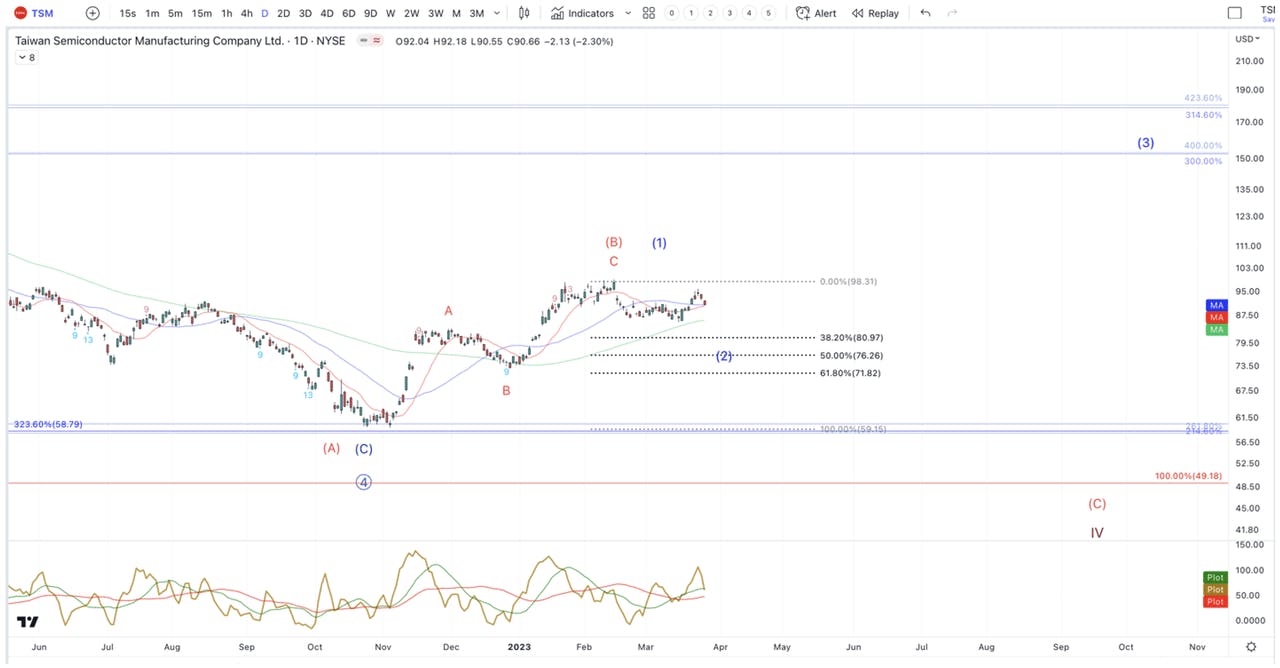
Royston Roche, Equity Analyst at the I/O Fund, contributed to this article.

Please note: The I/O Fund conducts research and draws conclusions for the Fund’s positions. We then share that information with our readers. This is not a guarantee of a stock’s performance. Please consult your personal financial advisor before buying any stock in the companies mentioned in this analysis.