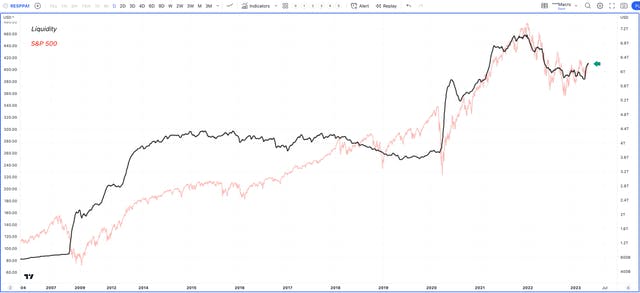
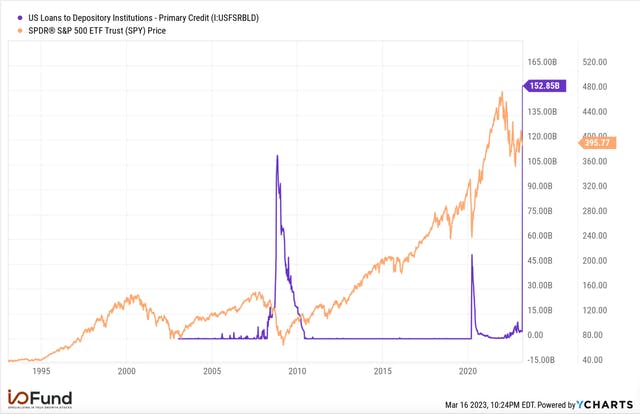
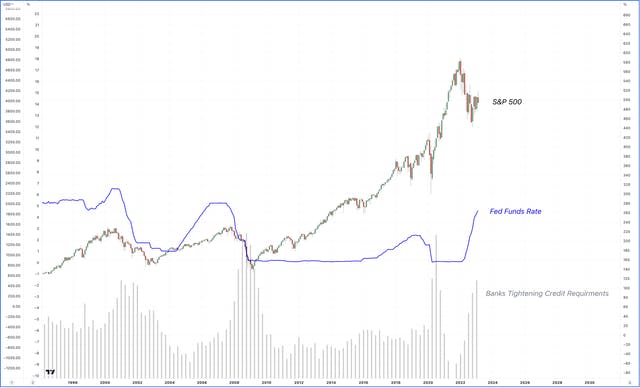
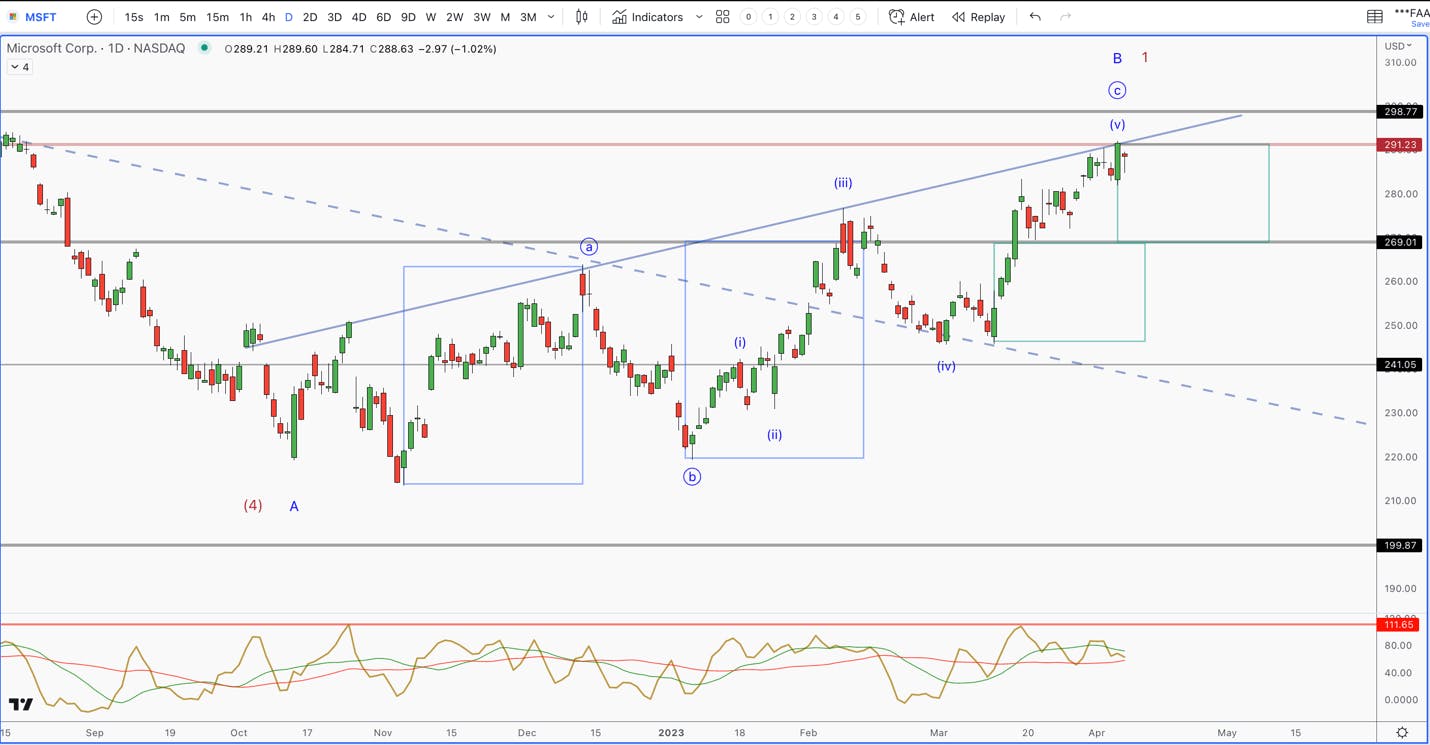
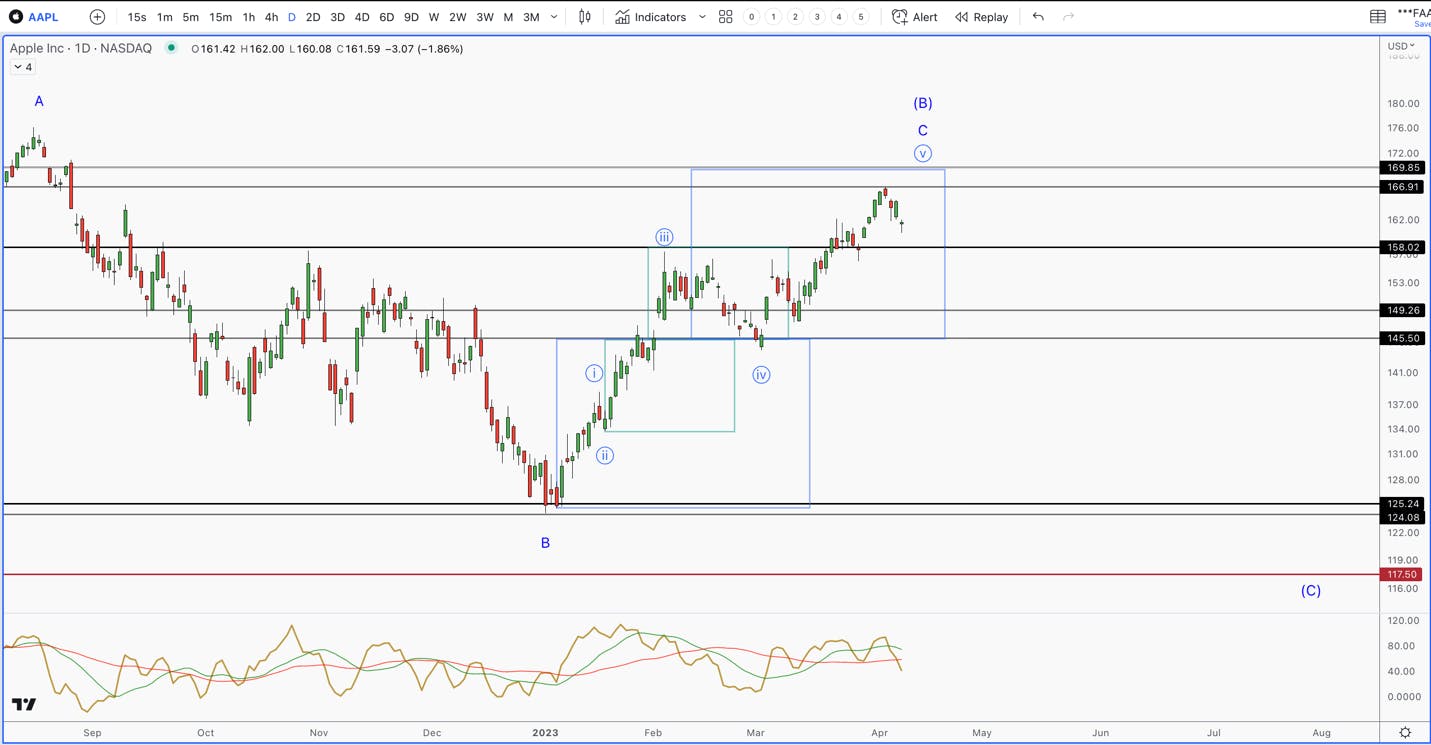
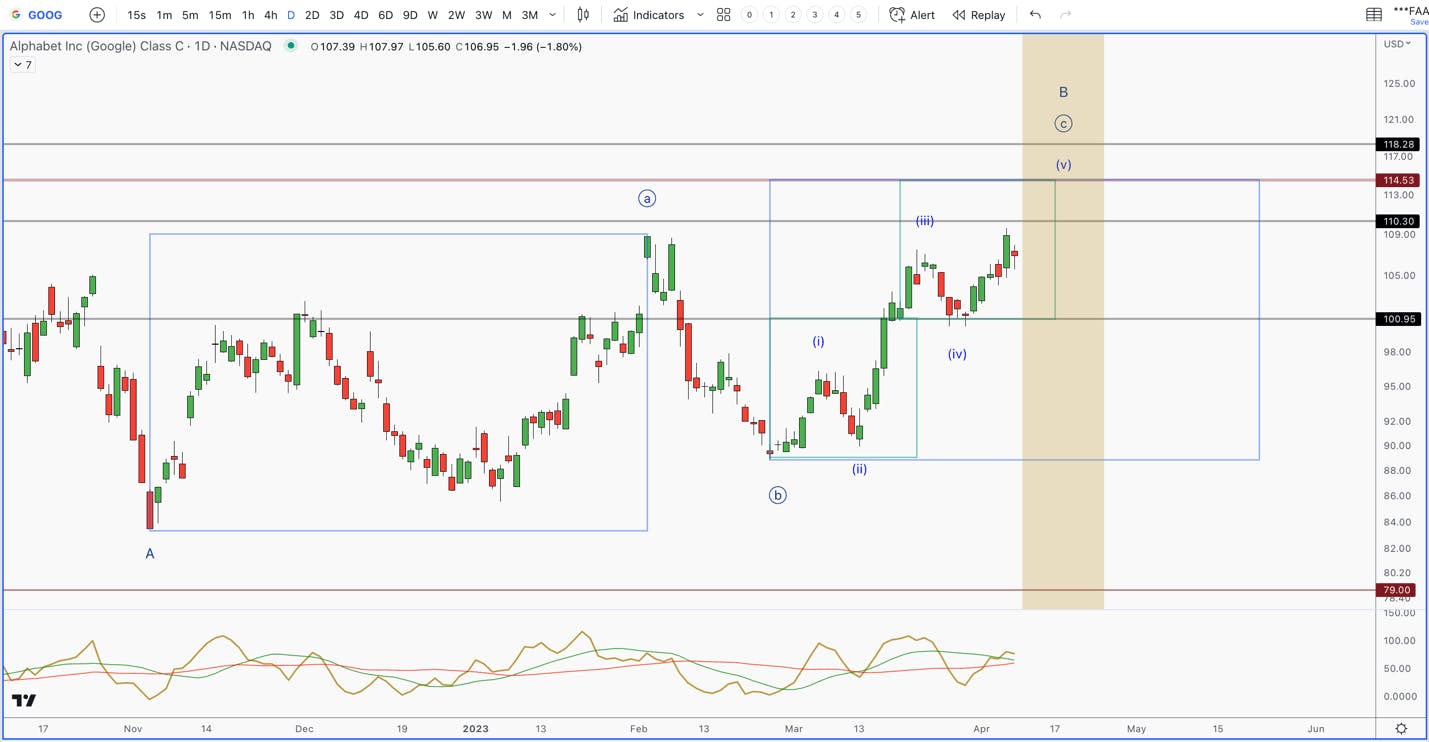
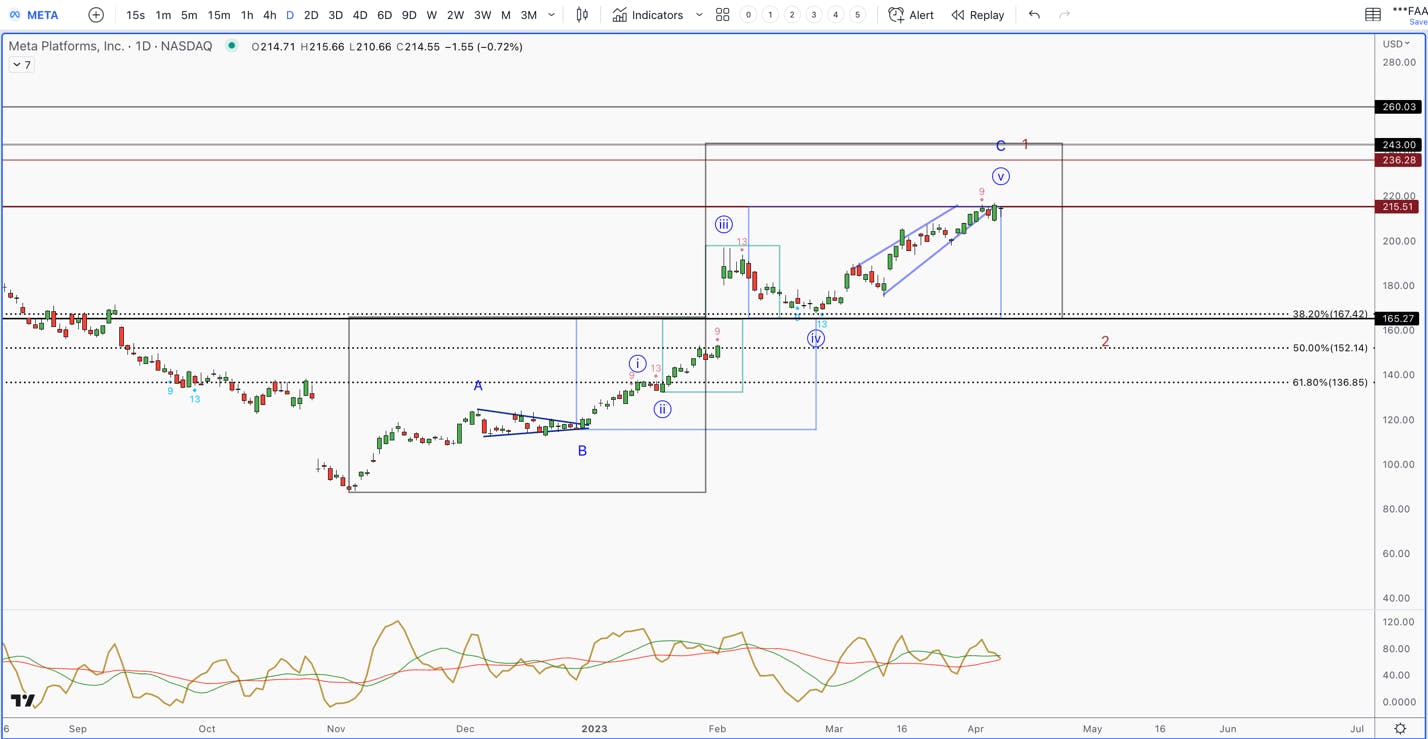
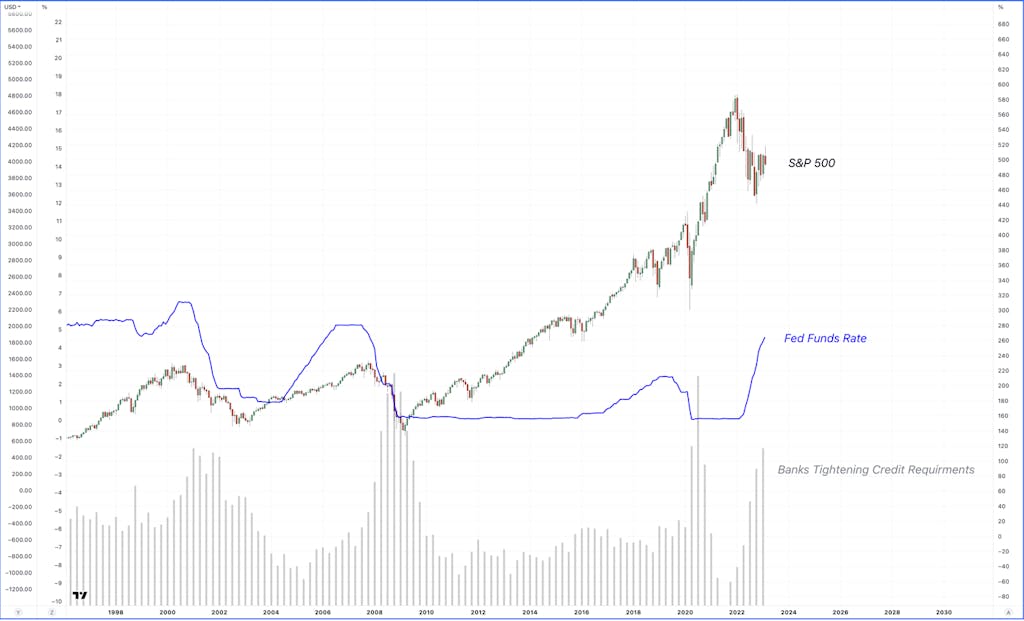
Amidst the growing skepticism in our banking sector, we thought it would be helpful to introduce an alternative way to both protect and diversify one’s assets. The information below discusses a method the I/O Fund uses to hold its cash, which is safer than banks, and yields 4.5% or higher.
The I/O Fund is an actively managed portfolio. We are not financial advisors, rather we discuss openly and in great detail what we are doing with our money through weekly webinars and real-time trade alerts. This has led to 174% better returns compared to Ark and results that are double the Nasdaq in the same time period.
Banks failing presents a new problem for investors, which is where to hold cash. We shared our thoughts on Treasury Direct accounts with our premium members last month, where we explained that opening a TreasuryDirect account allows anyone to directly purchase savings bonds and Treasuries (Notes, Bonds, Bills, TIPS, and FRNs) directly from the U.S. government.
This offers an option that is outside of the banking system, offers a decent yield, and is very liquid. This article is offered as a guide that will walk you through the process of opening a TreasuryDirect account and how it can potentially help secure your cash in these uncertain times.
Below is a brief video clip from our premium webinar. For more detailed information, please reference the article below.
More Concern in the Financial Sector & Why Having a Plan for Cash is Important
The current news cycle and media narrative suggests that it’s just regional banks that are facing challenges due to interest rate risk and depositors withdrawing funds to go to larger "too big to fail" banks. However, taking a closer look at the charts reveals that the situation may be more complex and not limited to just U.S. regional banks.
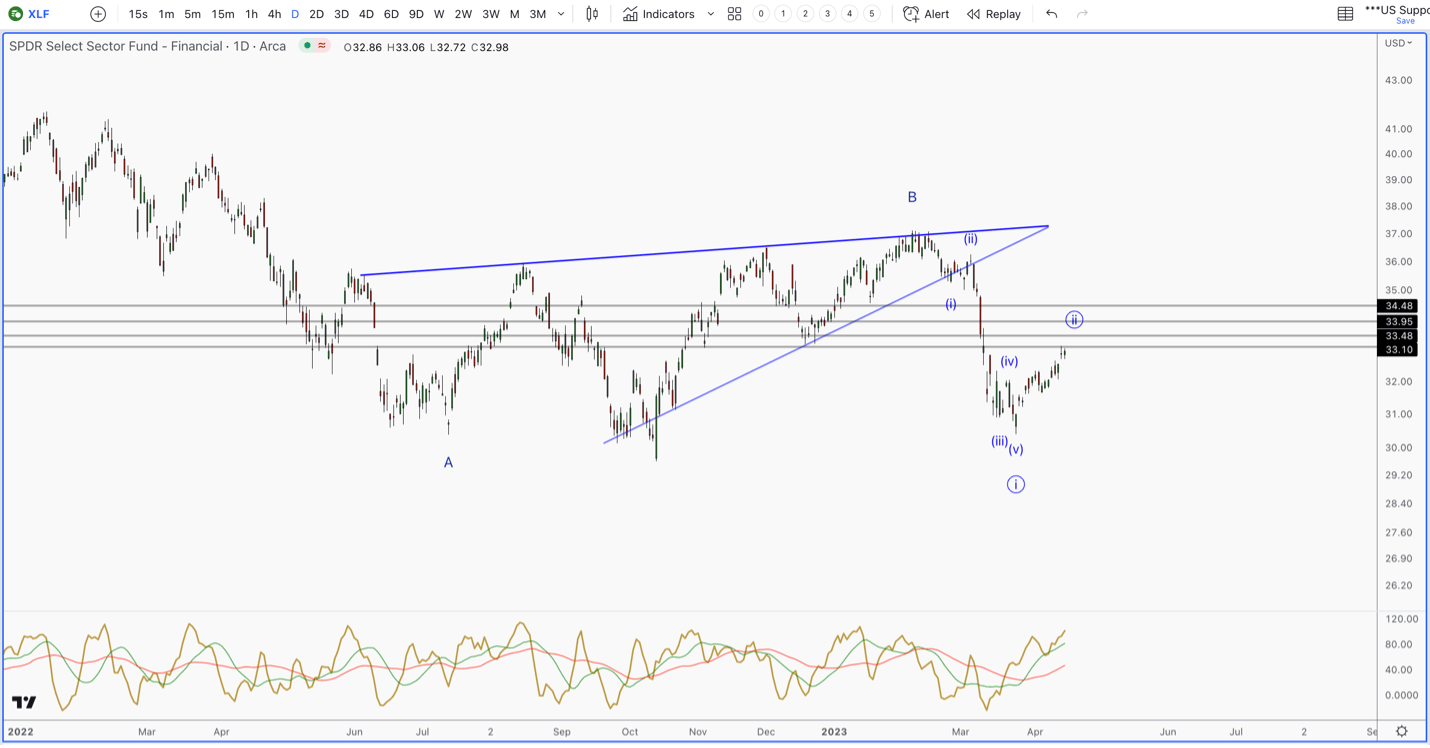
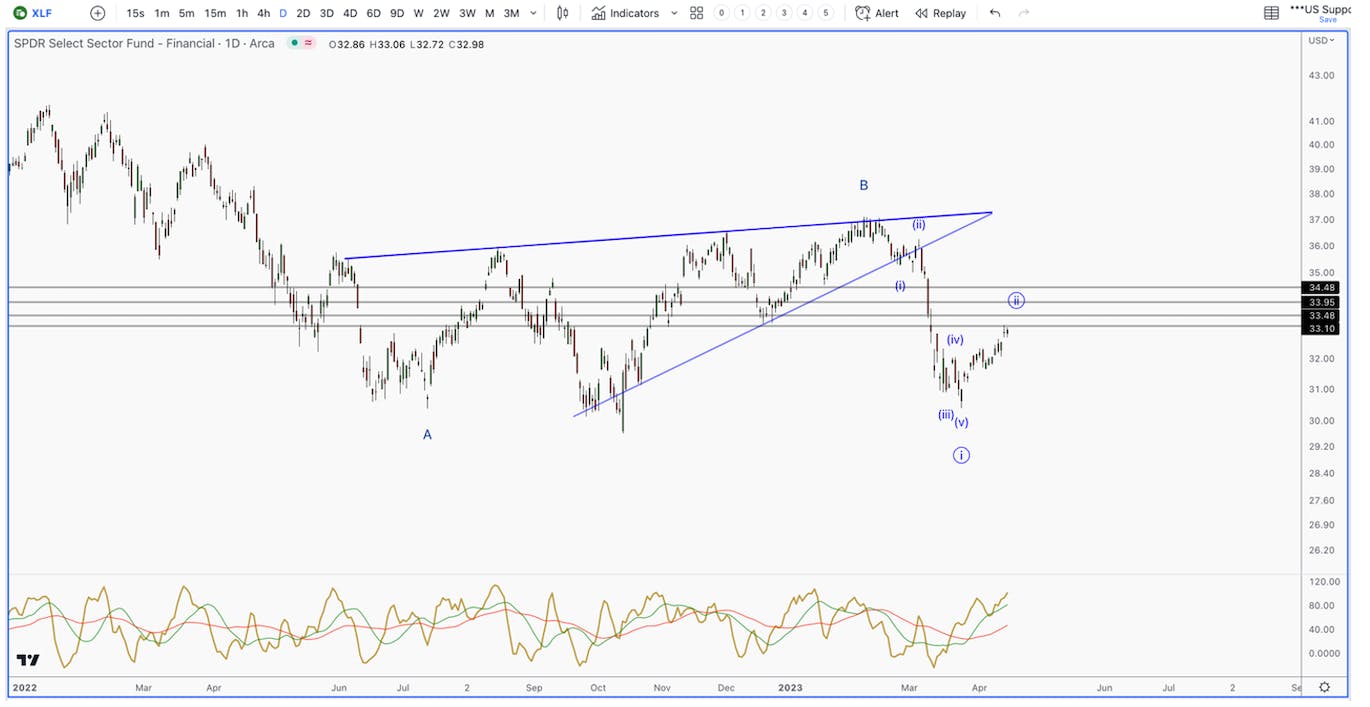
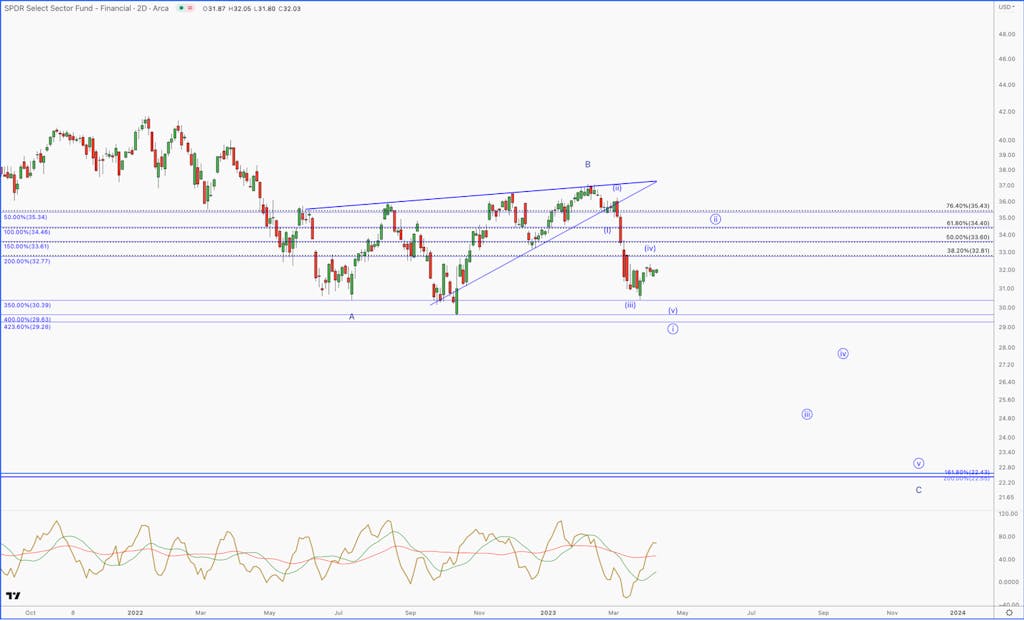
This is what appears to going on in Financial Sector in the US (XLF), which is comprised of the largest and most recognizable financial institutions in the US.
After breaking down from a bear pennant, we have a clean 5 wave drop from the February high. Until XLF can reclaim the $36 region, which is about 8.5% from current prices, then risk remains high.
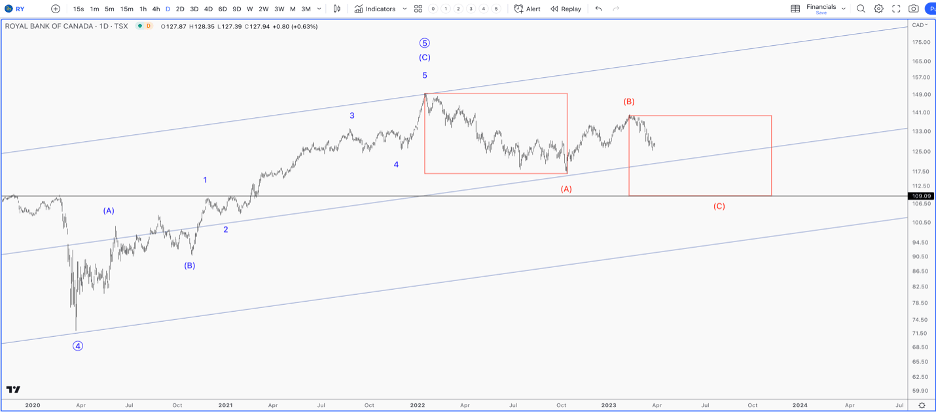
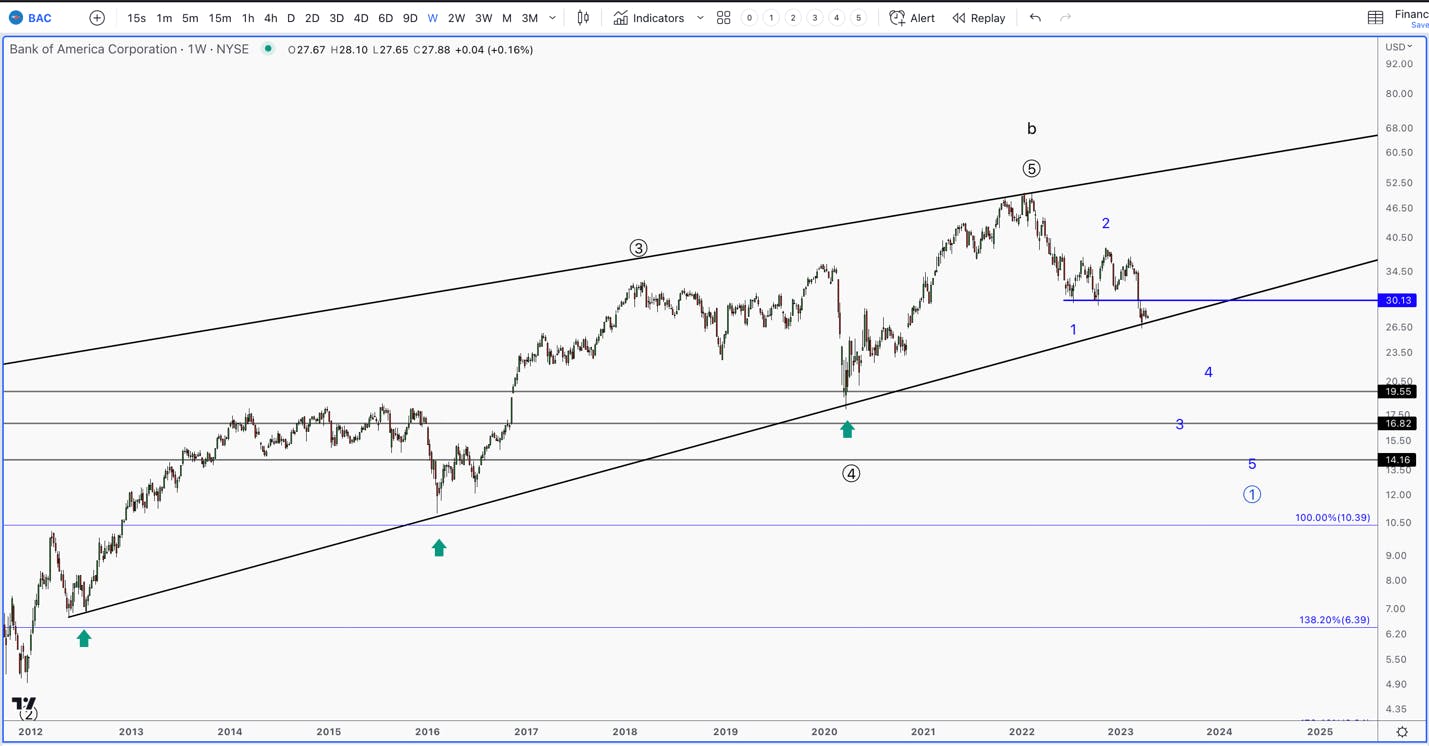
International banks like the Royal Bank of Canada ($RY) also are exhibiting similar ugly trends. In fact, warnings are present in most major banks around the world. Here are some quick bullet points:
Japanese banks Mitsubishi UFJ Sumitomo and Mitsui Financial are down 15%-17% since March 9th.
The Commonwealth Bank of Australia is down ~12% since March 14th, and HSBC in England is down ~14% since late February.
Itaú Unibanco, Brazil's top bank, is down ~18% since last November.
Deutsche Bank is down another 21% from it January high, while the largest bank in France, BNP Paribas, is down 14% from its February high.
It appears that the risk doesn’t stop at the regional bank level but is international as well. Global banks are facing significant challenges, and it is unlikely the banking problems are over.
The Royal Bank of Canada ($RY) looks a lot like some of the bigger banks in the US.
An Alternative Solution to Uncertainty: A TreasuryDirect Account for an Extra Layer of Security
To tackle potential issues in the banking sector, we are taking a proactive approach with some of our cash. We are purchasing T-Bills directly from the U.S. government through a TreasuryDirect account, eliminating counter-party risks with banks. If the banking situation deteriorates or becomes systemic, funds in these accounts remain safe and secure.
The Appeal for T-bills vs. Bonds
Investing in four-week T-bills might be the prudent choice in this situation, as they carry no default risk compared to bonds and do not tie up your cash for a long period of time. As an example of what to expect, the four-week Treasury bill rate is around 4.5%, compared to 0.15% last year. This is much higher than the long-term average of 1.22%.
Sign up for I/O Fund's free newsletter with gains of up to 221% – Click hereSign up for I/O Fund's free newsletter with gains of up to 221% – Click hereClick here
It is true that the U.S. government has never defaulted on its federal debt, which includes the umbrella of Treasury bonds, bills, and notes. However, it is also true that countries around the world default on their debt obligations, either partially or entirely, all of the time. We saw Iceland default on their external debt in 2008, and even recently Argentina defaulted on their sovereign debt in 2020 smack dab in the middle of the pandemic. In the event that the U.S. defaults on its debt, it’s speculated that T-bills are safer then bonds because of their shorter-maturity periods, lower interest rate risk, higher liquidity, and general overall market perception.
Opening a TreasuryDirect Account: A Step-by-Step Guide
Here is a link to a video that we gave to our premium subscribers, where I go throguh step-by-step on how to open a TresuryDirect Account.
1. Visit the TreasuryDirect website: Navigate to the official TreasuryDirect website (www.treasurydirect.gov) and click on "Open An Account."
2. Choose account type: Select the appropriate account type (individual, entity, or minor) and fill out the online application form: this essentially like a brokerage account with the government, so you will need your Social Security Number (SSN), email address, and bank account details.
3. Create a password and security questions: Choose a strong password and security questions to ensure the security of your account… this account will hold your cash and security should be prioritized just like your bank account ect.
4. Simply review and submit: Double-check the information you filled-out and submit the account application.
5. Check your email for a confirmation message from TreasuryDirect and follow the instructions to verify your account and email address.
6. Access your account: Use your account number, password, and the one-time passcode sent to your email to log in to your TreasuryDirect account.
7. Purchase bonds and T-bills: Once logged in, navigate to the "BuyDirect" tab and select the desired security type (T-bills, notes, bonds, etc.). Follow the on-screen instructions to complete your purchase.
Lessons from the 2008 Crisis: “History never repeats itself, but it does often rhyme.”
The 2008 financial crisis exposed the banking system's fragile backend to the public in a fast and violent sweep, catching many people unprepared. Most people had no idea what fractional banking was, nor how complex their banks had become. These banks have only grown in size and complexity since.
We rely on banks to store money, but it does come with some risks. When a bank fails, individuals can depend on government-backed insurance (FDIC) to recover their deposits and restore stability in our banking system. However, this process can be lengthy and challenging. As we saw in 2008, no one wants to wait on a Gov’t backed insurance timeline to get money back that they thought was being safely stored in a bank account.
Conclusion:
Considering the current risks within the banking sector, going through the process of opening a TreasuryDirect account offers a safe alternative for people to store their cash in. This guide was written to help you navigate the process of buying Treasury marketable securities and really to show just how simple it is to get started securing your cash with bonds and T-bills. It is important to stay informed and protect what you have worked hard for, we wanted to shine light on something we felt hasn’t gotten enough spotlight in the investment world.
What’s Next:
This Thursday at 4:30 pm Eastern, I will be holding a webinar for premium Tech Insider Network members to discuss how I plan to navigate the broad market, as well as various tech entries including Tesla. We offer trade alerts plus an automated hedging signal. In addition, we are an audited portfolio with 174% better returns than Ark and are results are double the Nasdaq in the same time period.
We identified a strong buy signal in Bitcoin in December, and we also identified Nvidia's (NVDA) bottom in October. Bitcoin is a leading asset YTD in the market, and Nvidia is the leading stock in the S&P 500. We take gains often and we discuss this in our weekly webinars and on our premium site, one of which is scheduled for next Thursday, April 27th.
Netflix’s pivots – which is the password sharing and ad tier – are expected to show up in Q2 for password sharing and then Q3/Q4 for the ad tier whereas previously the goal was to have impact by Q1 and Q2. The initial signs of PW sharing are encouraging. More on this below. The ad tier is too early to have any initial impressions or data to work with, although long-term it will be accretive to margins and should have a positive impact on the top line, as well.
FCF was impressive at $2.17 billion with management raising the FY guidance to $3.5 billion.
Over the past few quarters, Netflix’s after hour price activity can be volatile. I believe this is due to FX headwinds, which are often reported as a miss, but then the market proves to be forgiving of the lower revenue/EPS numbers in favor of constant currency. This is my best guess as it’s been volatile for a few quarters, which leads me to believe machines are trying to catch up to the reported numbers versus constant currency basis. Notably, the stock price regained its losses before the earnings call was released.
The ad tier could see a flurry of headlines next month for the upfront season. The upfront season’s best-case scenario is committed upfront spend for 13 million subscribers, which is a small audience compared to Netflix’s roughly 220 million subscribers. Our plan is to follow price for this stock and to be patient long-term as we are optimistic on the outcome.
The Netflix pre-Earnings report found here has additional information to supplement the post-earnings report below.
Financials:
Netflix missed on revenue and was inline on EPS. FX headwinds create mixed reactions to this particular earnings report, and I suspect the strong cash flow also helped price after hours. Last quarter, a large EPS miss was reported whereas it was due to a FX adjustment.
This quarter, revenue was $8.162 billion or $8.5 billion on a constant currency basis compared to $8.18 billion estimated. This is widely reported as a miss, but on the other hand, the market has been forgiving of FX headwinds with other companies.
The guide was lower than expected at $8.24 billion compared to $8.48 billion expected. The company is pushing out its expectations for the new ad tier to drive top line growth in Q3 whereas the previous expectation is that this would start to show up in Q2. Password sharing will be “broadly” rolled out including in the United States in Q2.
EPS of $2.88 was in line. EPS for next quarter is a miss at $3.06 EPS expected versus $2.84 EPS guided.
The gross margin is 400 bps lower this year at 41.20% with flat gross profit of $3.35 billion compared to $3.5 billion last year. The operating margin of 21% was also lower compared to last year’s 25% OPM yet this met management’s guide for an operating margin of 18% to 20%. Notably, management had stated last quarter that “operating margin to be down YoY due to timing of content spend.” Similar to operating margin, net margin and adjusted EBITDA were lower but within expectations.
In the comments on the forum, you can read from forum members on why margins are the most important line item for Netflix moving forward.
Netflix exceeded on free cash flow at $2.1 billion compared to $3 billion for the full year last year. The company is raising full year guidance on free cash flow to $3.5 billion. The free cash flow margin is more than double from last year at 25.9% compared to 10.19% in the year ago quarter.
Gross debt is still high at $14.5 billion, which is inherent to the business model. However, net debt is improving at 1.1X compared to 1.3X last quarter with net debt of $6.7 billion compared to $8.37 billion last quarter.
Netflix still trails other FAANGs on its investment rating, yet it’s notable the company has seen an upgrade from Moody’s from junk to investment grade. Netflix has been the black sheep of the FAANGs in this regard, however, a large part of our thesis is based on the company’s change in profile in terms of bottom-line strength.
On another positive note, Moody’s stated the following regarding Netflix’s ad tier: “Moody’s anticipates that growth in subscribers from the recently launched ad supported service will be gradual but steady and provide a strong long-term opportunity for revenue growth.”
Key Metrics & Additional Notes:
Password Sharing & Geographic Regions:
Global paid adds of 1.75M came in slightly shy of analyst estimates of 1.8M.
For password sharing, Latin America provides some clues as to how a broader rollout will perform. According to management there was a cancel reaction which later eased. The region reported a loss of net adds of (0.4M) compared to net adds of 1.76M in Latin American last quarter, yet the revenue was up 7% YoY (+13% on constant currency basis).
The company stated that other regions, such as Canada, were “directionally consistent with what we saw in Latin America.”
There was a similar pattern in the United States Canada (UCAN) region where there was low net adds yet higher revenue growth. The region reported 0.1 net additions with revenue up 8% YoY.
In the year ago quarter, these regions were flat or reported a decline. There can also be churn coming out of Q4 for Netflix since that quarter has high net adds.
Another observation is that LatAm and UCAN both had expanding Arm, or average revenue per membership, whereas the other two regions saw a lower Arm. This could be encouraging in terms of a broader rollout on password sharing driving more top line growth in the second half of the year.
UCAN up +9% from $14.91 to $16.18
LatAm up +3% from $8.37 to $8.60
EMEA down (6%) at $10.89 this quarter compared to $11.56 in the year ago quarter
APAC down (13%) at $8.03 this quarter compared to $9.21 a year ago
Notably, average paid membership increased in APAC, which were up 17%. This is clearly a large region but there’s been some attention on India specifically where Netflix has lowered prices. This would make sense to where net adds increased but ARM decreased.
Ad Tier:
Upfront season is coming, which means Netflix will likely have to state the company’s expected scale for the ad tier come Q3/Q4. Right now, the company is not guiding for this but analysts believe it will be in the 13M range.
We covered this in our Essentials Pre-ER write up. Per Forbes/Bloomberg: “After a slow start Netflix ad tier has been gaining traction with U.S. subscribers. After analyzing their internal data, BloombergBloomberg reported in its first two months, Netflix had one million active users. Before its launch, Netflix had projected 1.1 million by year end 2022 increasing to 13.3 million by the third quarter 2023. Industry analysts project Netflix could eventually wind up with 30 million U.S. subscribers on its ad supported tier. The U.S. is one of the 12 markets where Netflix is now selling ads. At its most recent earnings report Netflix had 74 million total U.S. subscribers with 231 million worldwide.”
The company continues to believe the ad tier will be accretive to the bottom line, especially considering the ad tier will monetize better than its basic and standard plans. The ad tier will be $6.99 per month plus ad dollars. With that, management believes there will be “50% or more incremental profit contribution to the business.”
Earnings Call:
According to management on the call, Q2 is the quarter to watch for password sharing.
“Yeah. So that launch we are doing in Q2 is a very broad launch, it includes the United States, includes many, many other countries. I mean, we reserve the right for some countries where we think there’s a different approach. But I would say the bulk of our countries, and certainly, when you think about it from a revenue perspective, the vast majority will be rolling out in Q2.”
The ad tier is expected to be accretive to the company’s margins at 50% or higher.
“Jessica Reif Erlich (moderator)
And then I just wanted to clarify something, Spence, I think you said, this is a 50% margin. I mean, typically, advertising could be as high as 80% or 85% margins. Is that — do you expect to build up to that or do you think it’s really just a 50%-plus business?
Spence Neumann
Well, I put plus in there. So I said at least 50% and it was really just to highlight the fact that we are still in startup mode of this business and so leaning a little conservative. But, yes, our expectations over time is that it would be meaningfully over 50%, but I don’t want to give a specific number yet.”
Conclusion:
The impact from password sharing and the ad tier is later than originally anticipated (Q2 for PW sharing and Q3/Q4 for the ad tier), but it’s not that surprising because these are monumental changes that require time. In this regard, we are happy to be patient. Part of the thesis was the bottom line and the cash flow, and the company has been performing here, as expected.
However, price was already looking stretched and we may trim the position according to technicals. The stock is up about 100% from the June low so the market may be getting antsy to pocket some of the gains from the second half of last year.
For reference to terminology used, please look at technical analysis under our resources section here.
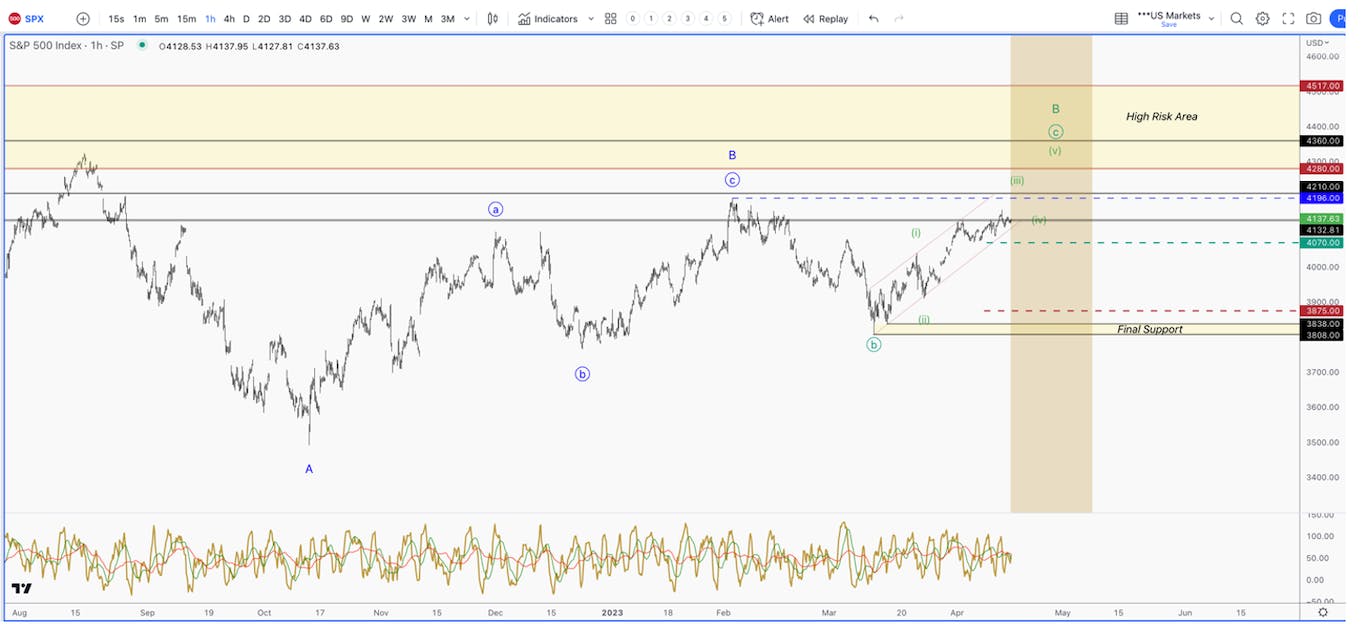
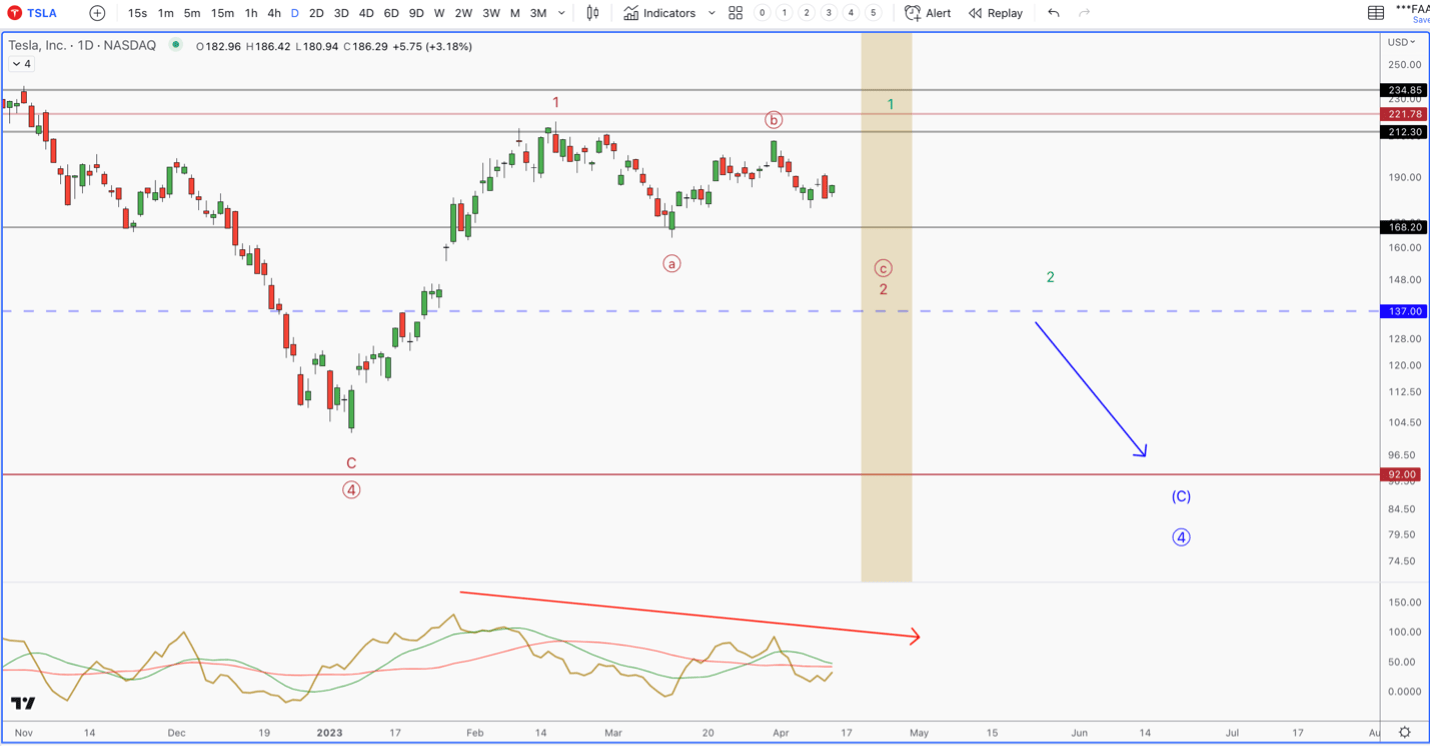
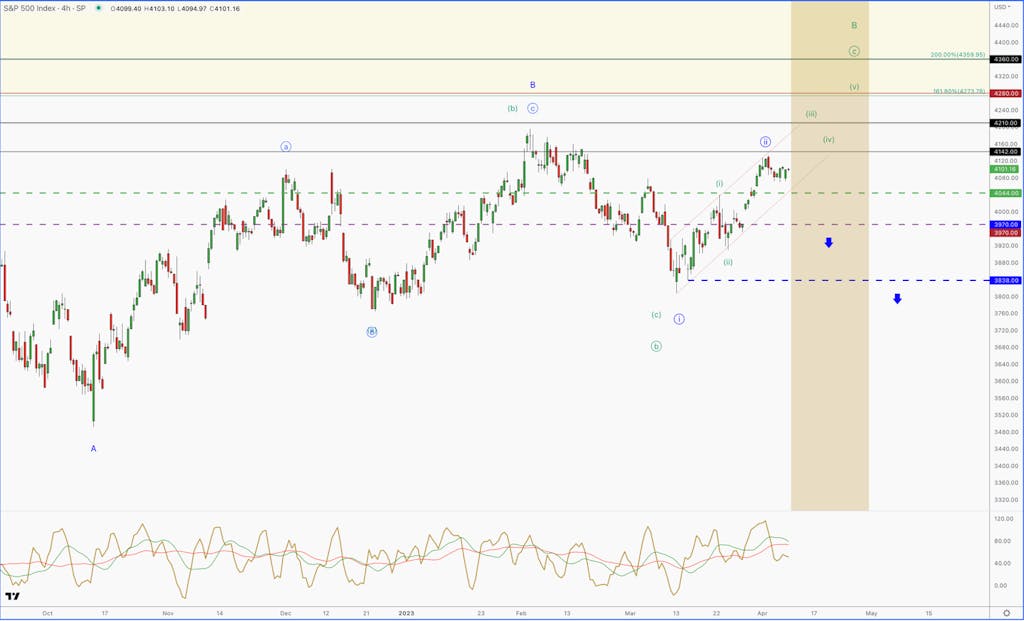
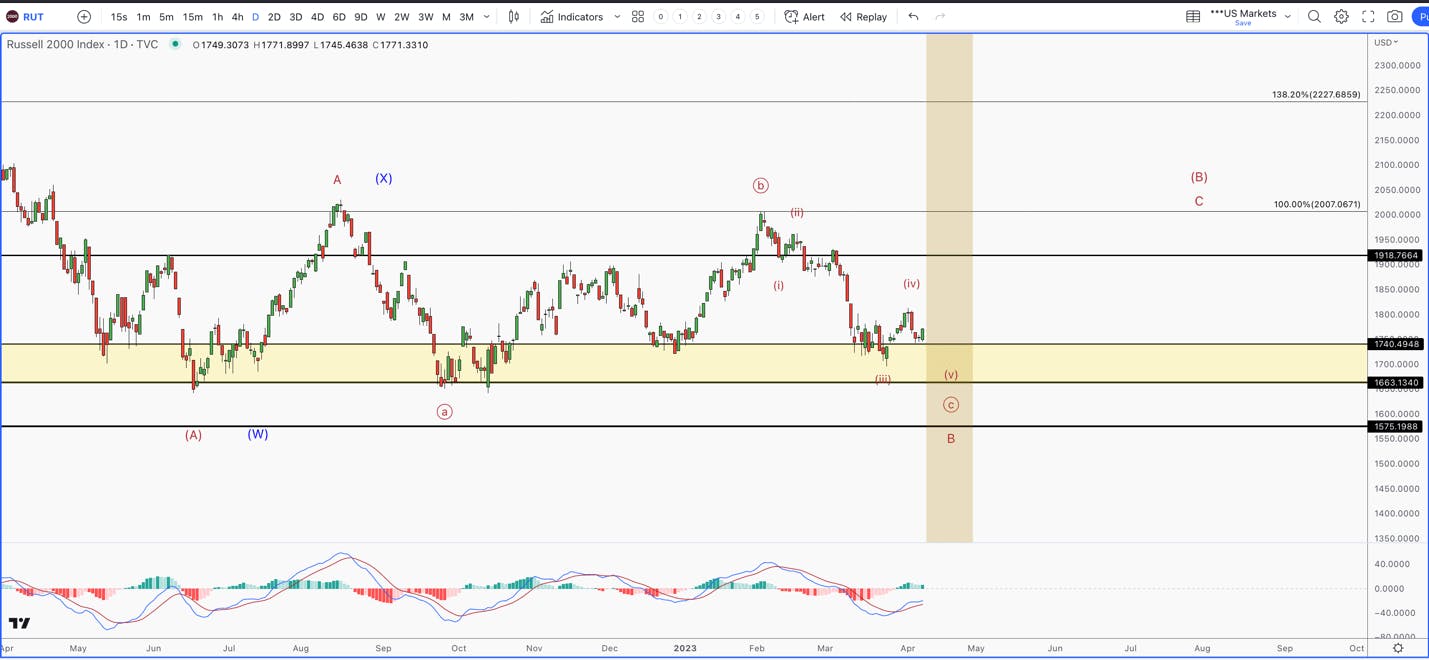
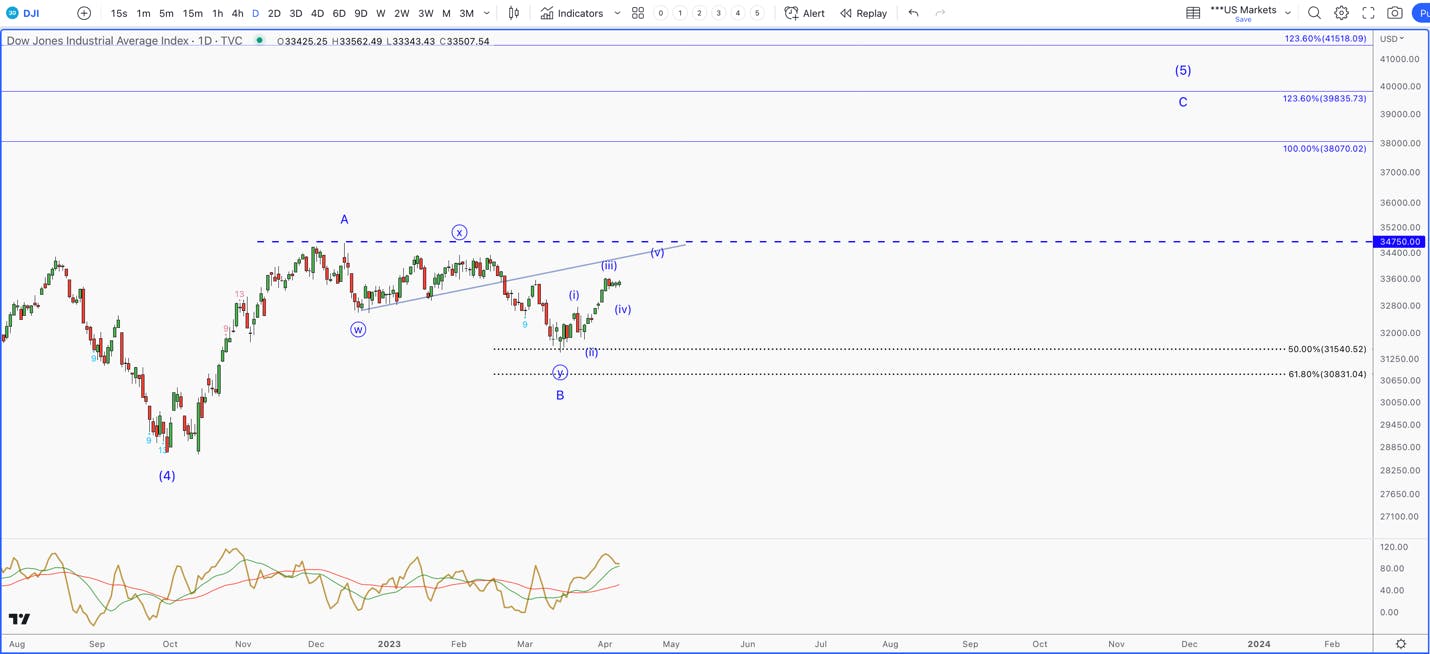
Regarding the charts below, the vertical tan shades represent time factors. These are inflection points where we have high odds of something significant happening. More times than not, (3/4 of the time), they mark a turning point in the trend. So, what matters is the direction we are trending into these periods. Regarding the vertical lines, black lines represent strong support/resistance, while dark red lines mark very strong support/resistance.
Elliott Wave count are meant to provide context. There is a pattern unfolding in real-time, one of which will play out. By monitoring price levels that are held/broken, it will help us figure out which one is in play
Broad Market
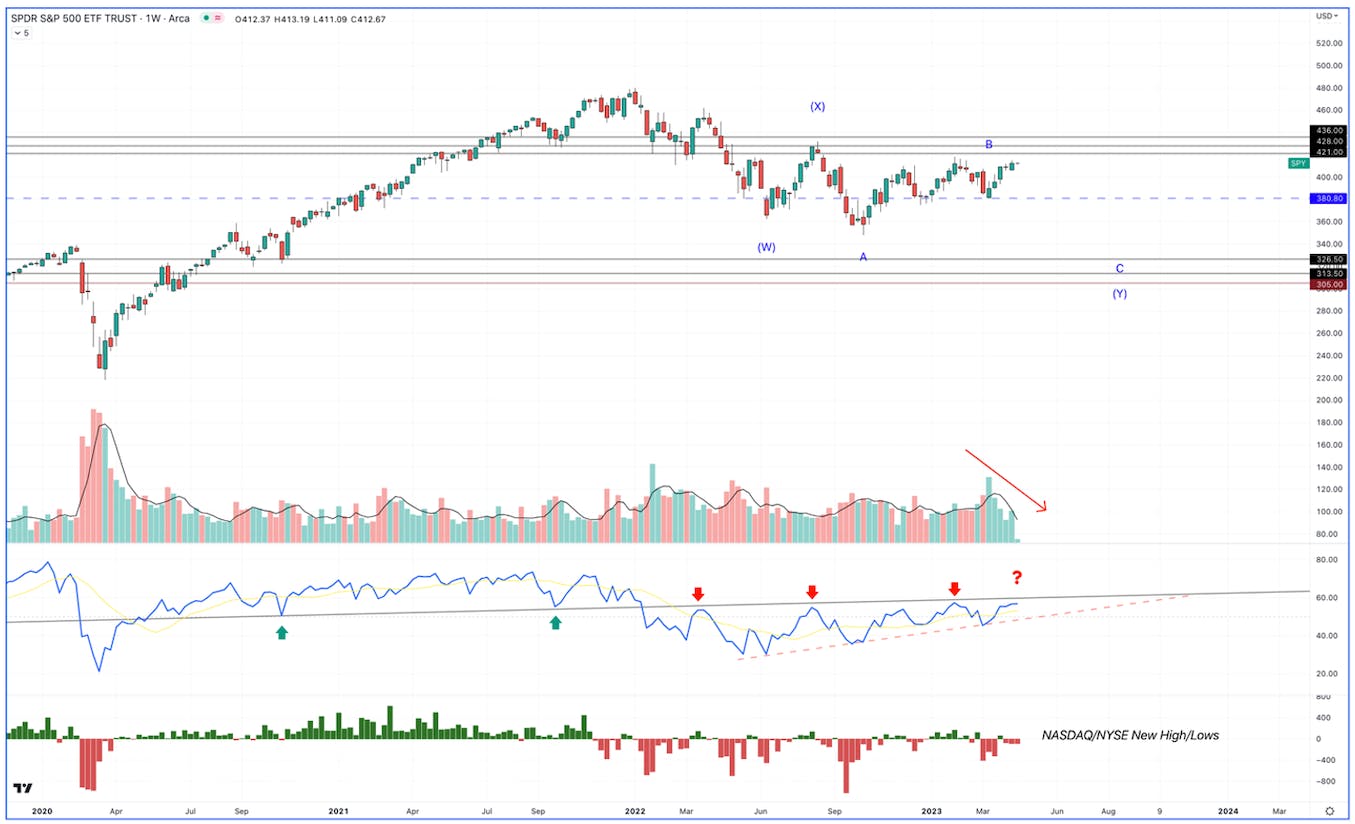
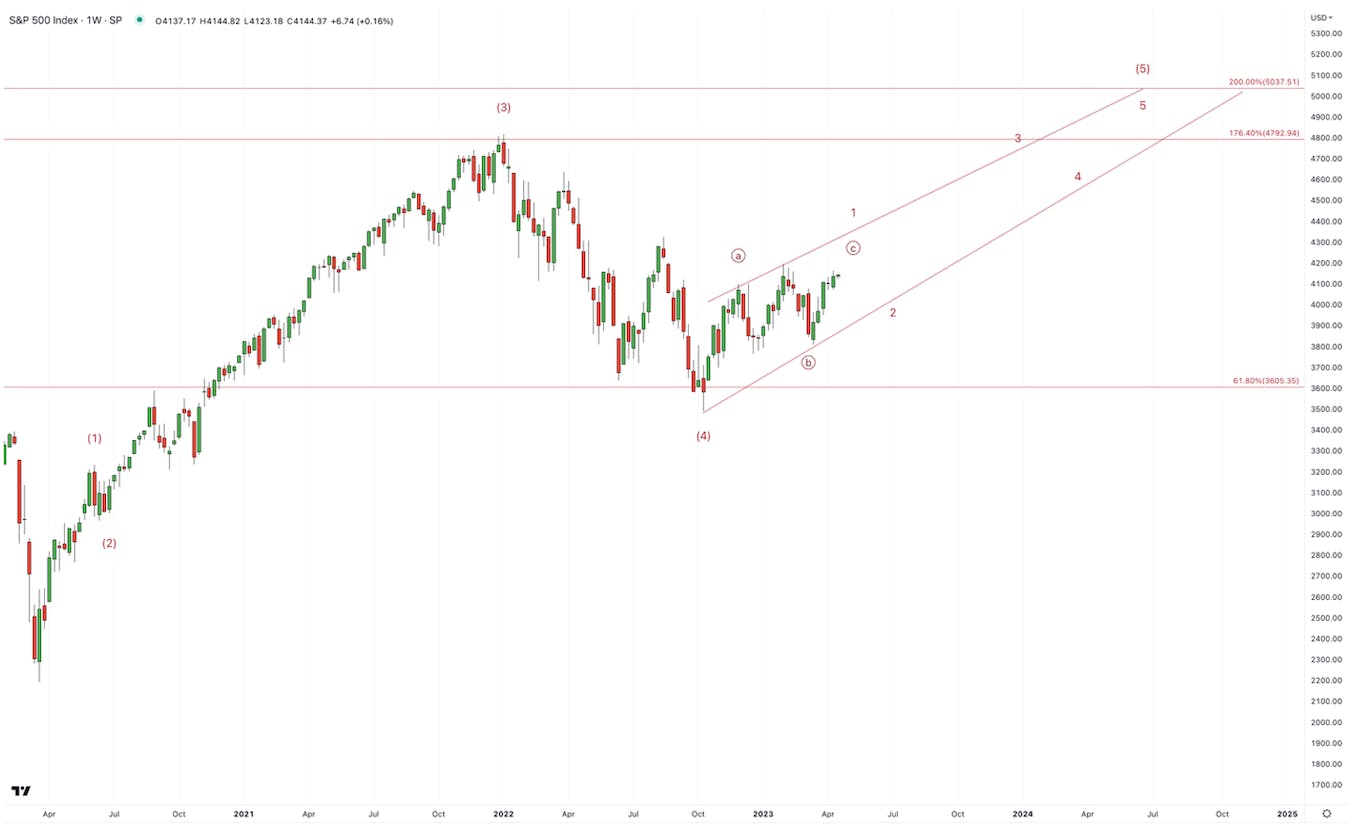
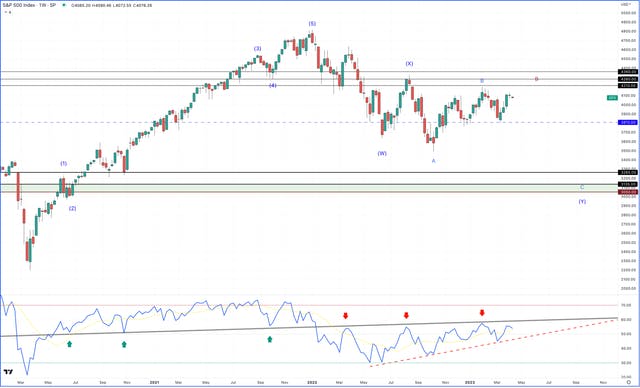
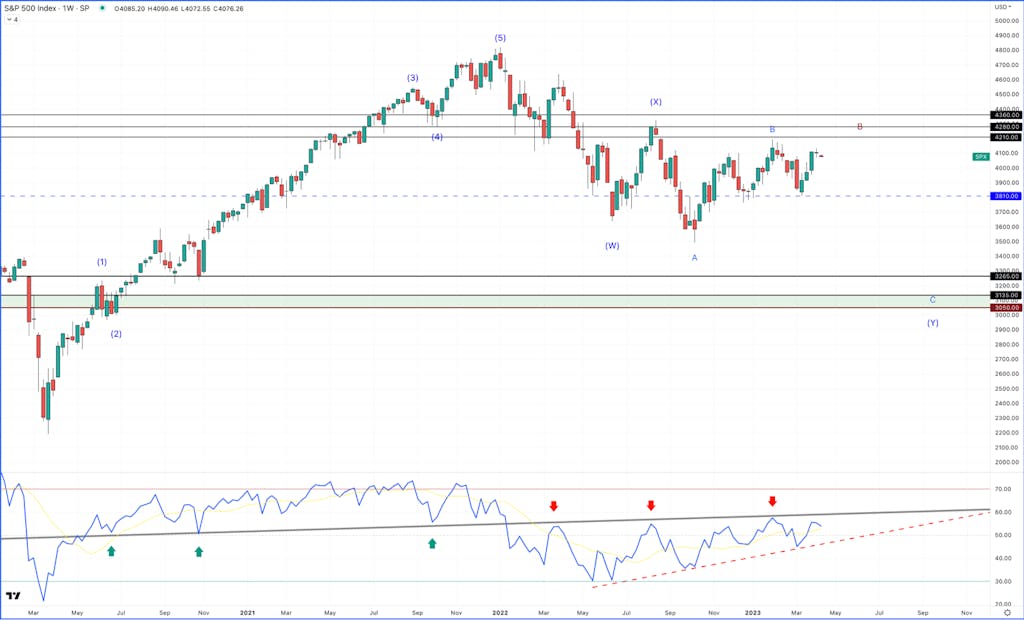
The evidence still supports, at minimum, heightened risk from a technical perspective. The market appears to be tracing out a complex corrective pattern that started in early 2022, and it suggests one more large drop to new lows in order to complete the pattern. Our target, as of now, is 3050 SPX. The current low and following uptrend we have been in does not have the type of characteristics that tend to coincide with a new bull market developing. Here are a few:
Breadth has been quite weak in the recent push higher into April. The NYSE+NASDAQ has given us net new 52-week lows five out of the past six weeks, all while price continues higher. This tells me that many stocks are still in a down trend, while a handful of bigger names are holding the indexes up.
Volume continues to trend below average, as less and less buyers are showing up at current levels.
The market internals are still in a bear market pattern. Once the weekly RSI can break above that resistance line, it will be an early signal that a meaningful low could be in. Until then, the momentum in the market is quite weak.
What Would a New Bull Market Look Like?What Would a New Bull Market Look Like?
Another problem that we have to address is that we only have a 3 wave pattern off the October 13th low. Why this matters is because if we were going into an obvious new bull market, that pattern would likely be in the form of a 5 wave pattern.
Three waves up, more times than not, is a correction in a larger down trend. This is what the probabilities support, and this is one of several reasons why we decided to be cautious. The good news about having a 3 wave pattern is that if a new bull market is starting, it can ONLY be in the form of an ending diagonal pattern.
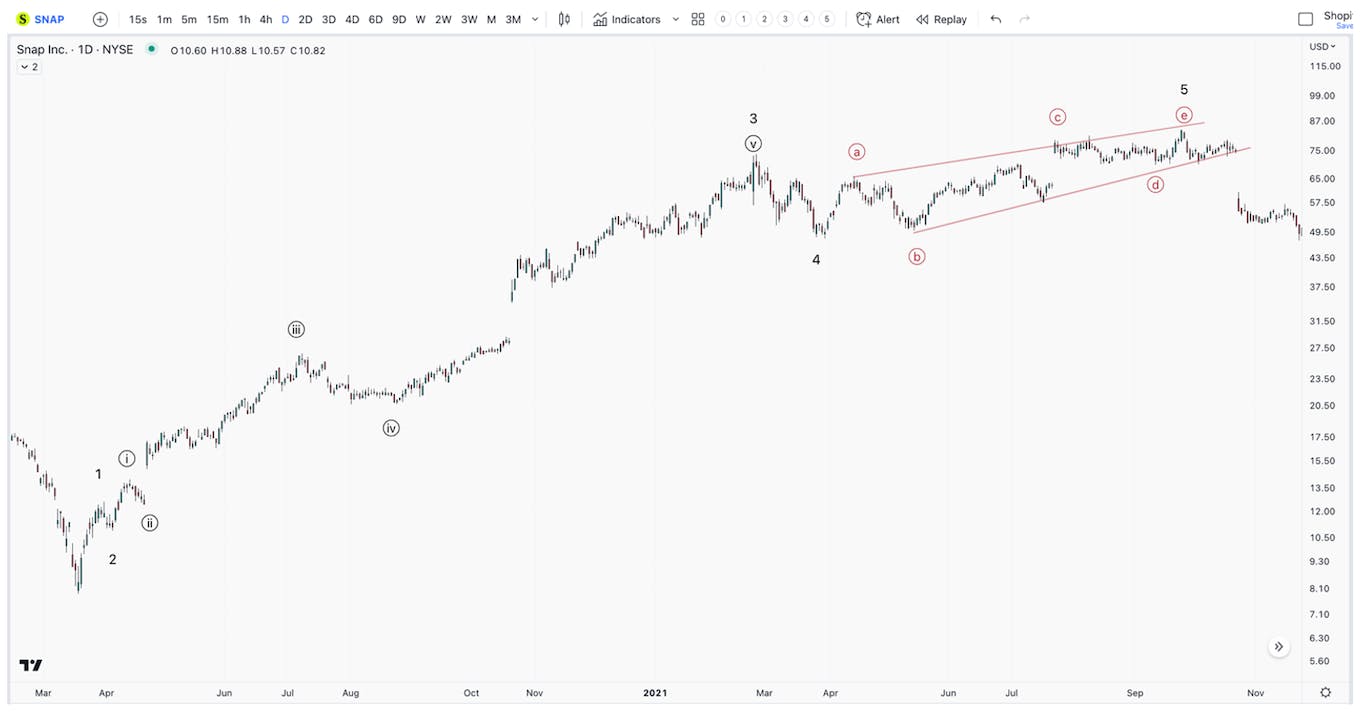
An ending diagonal pattern is the final move in a larger pattern. So, in a 5 wave pattern, it would be the 5th wave. This pattern tends to trace a trend channel, consist of 5 waves, where each wave is an overlapping 3 wave pattern. Here is an example in SNAP’s chart. Note the red pattern in the 5th wave.
You can see how it is a messy, overlapping pattern that traces a trend channel and is a series of 3 wave moves in both directions. Now, if this pattern were going to play out on a larger scale in the broad market, it would look something like this in the S&P 500.
This is the very general path that this type of pattern would take, and it is still too early to confirm if this is playing out. What is important to understand about this pattern is that if it is in play, and we did put in a major low in October, we have likely not even completed the 1st wave. And, we will need a confirmed 2nd wave drop in order to fully confirm it is in play.
Many investors get FOMO, and chase trends based on these emotions. This information should embolden investors that if we are wrong, and a new bull market is playing out, we still have the vast majority of this bull market to capture, once we get confirmation.
This market has literally been range bounce for 6 months. Neither the bulls nor bears can take control. And, based on the underlying structure of this uptrend, if the bulls are going to push us into a new bull market, it will have to be after a deep 2nd wave retrace.
The current Time Factor will likely mark a major top or a low/break out that can push us higher for the next couple of months. We are getting mixed messages in the supporting markets, but what seems to be quite universal is how the coming pullback unfolds will be the biggest tell.
If we do see a low and break out, it will result in the final bullish swing of the current larger pattern that started October 13th. Once we top, if we haven’t already, how the market turns down will determine what will play out. If it is a 5 wave pattern, then the bear market will likely resume. If it is a 3 wave pattern, we will establish an alternative buying plan along with targets.
Take Away: markets do not move in random ways. All trends develop into repeatable patterns on all time scales. The fact that we only have a 3 wave bounce off the October 13th low has reduced the possible patterns that a new bull market will take. If the coming top turns down in a 3 wave pattern, it will strongly support that a new bull market is developing, as we will have a much better opportunity to buy stocks at lower levels.
I do not believe this scenario is likely. However, I want to explain to our readers how this type of analysis can reduce risk, and help you get on the right side of a trend early. We have no confirmation of a new bull market, and if we do, you will see us pivot aggressively.
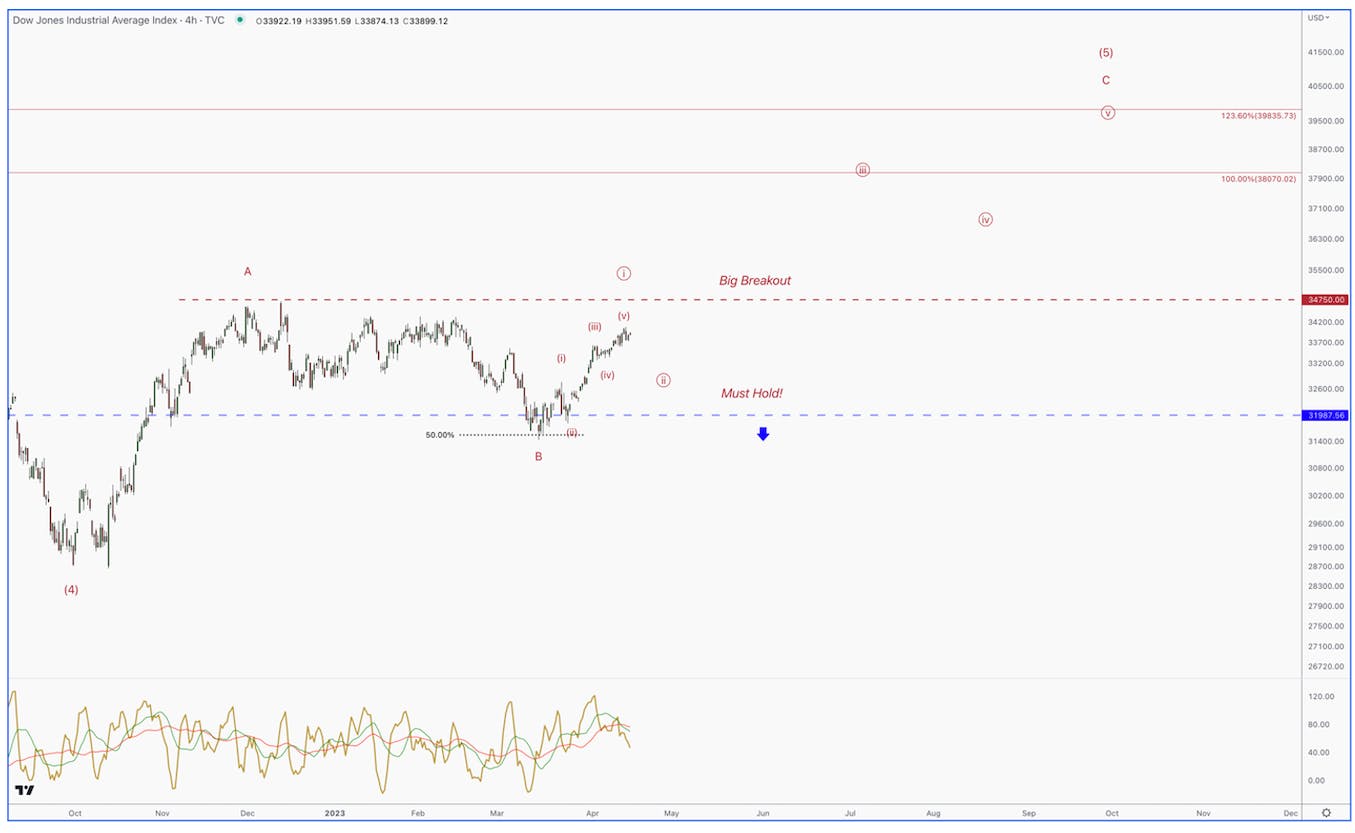
DJI was leading the market higher into early 2023. Since then, it has fallen behind. What is interesting is that the pattern lower is very messy and overlapping. In other words, it fits the characteristics of a B wave, with a C wave to new highs on deck.
If we are in a C wave, remember, C waves are always 5 wave patterns. The bounce in April, so far, looks to be 5 waves pointing up. This would be wave 1 of the large C. If this is playing out, we need to see a 3 wave pullback that holds the 31,987 supports, then a breakout above the December high at 34,750. If this happens, then we should expect, at minimum, another multi-week to multi-month push higher into summer.
At minimum, if we get confirmation of the above, we should expect to see some stocks/markets make new highs, while others make lower highs. As bullish as they may seem, this will be the last swings higher that complete the large degree pattern off the COVID low. Many markets and stocks have already topped.
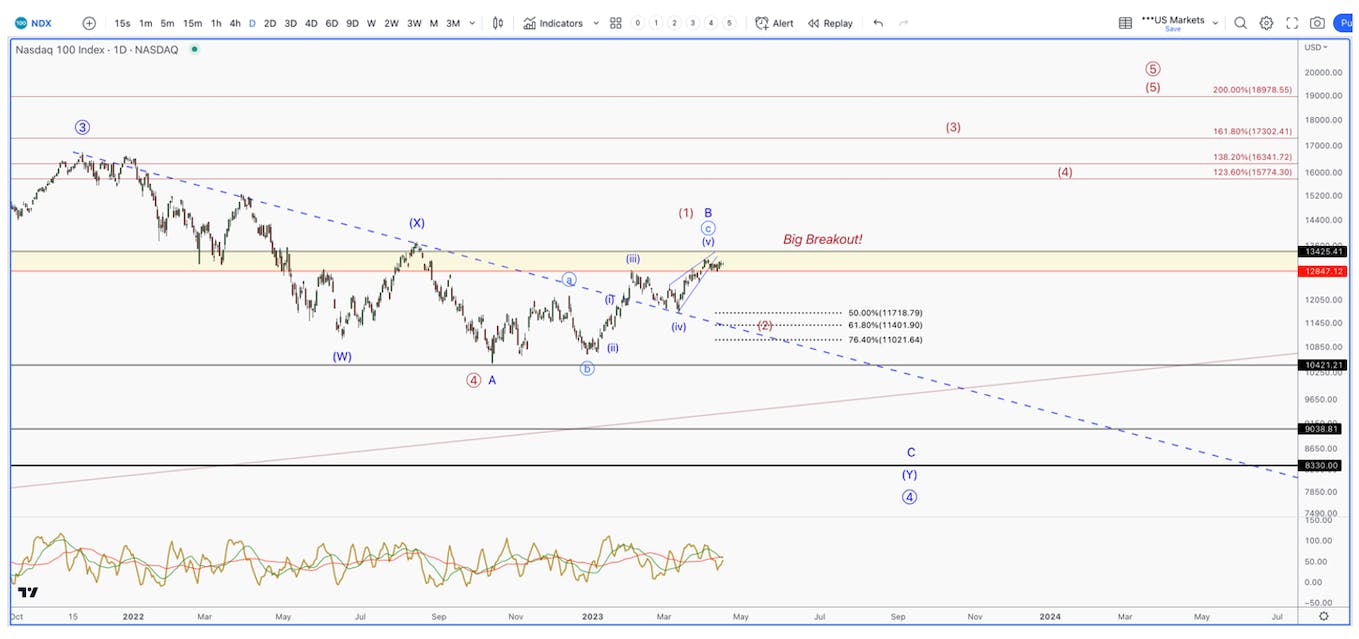
Like the DOW, NDX appears to be topping out, to some degree. The NASDAQ-100 doesn’t look like it has room for one more swing higher, like the green count in SPX suggests. This is better confirmed with the various FAANGs that I have been discussing.
If we do see a breakout above 13,425, we would likely need to see some pullback first. If this pullback is a 3 wave drop that is relatively shallow, it will support the push into May/June that is suggested in the Dow, and also in SPX.
The levels to monitor for the NASDAQ-100 – NDX needs to hold the bear market trendline, or 11,200 to support this thesis. If we instead see a 5 wave drop, it will be a big warning of new lows on the horizon.
FinancialsFinancials
Financials more than confirm that any push higher will likely be limited. After completing a large bear pennant, XLF has completed a clean 5 wave drop from that breakdown. Keep in mind, XLF is in a C wave down, so that pattern will be in a 5 wave format, which is what we are seeing. So, this is a big warning, until proven otherwise.
From the 5 wave drop, we are now seeing only a 3 wave bounce, which further supports this thesis. This would suggest we are in a 2ndwave of 5 pointing down. The 2nd wave bounce could be shallow, at which point we would see a sharp drop soon, or it can morph into a bigger 2ndwave that could take us higher and into Summer. In order to negate this downside setup, we need to see XLF break above $36.
Furthermore, the more financial charts I view, the more concerned I become. No one is talking about insurance companies, yet. From what I can tell, they will be. My guess based on the combined charting is that we have many 5 wave drops from the Jan-Feb top. We should see a 2ndwave bounce that can take us into late Spring/early Summer, which lines up with Dow and SPX. During this time, I imagine the sentiment will be that all is safe, and it was an isolated instance. The countless charts I’m looking at on a regional, national and international level strongly suggest otherwise.
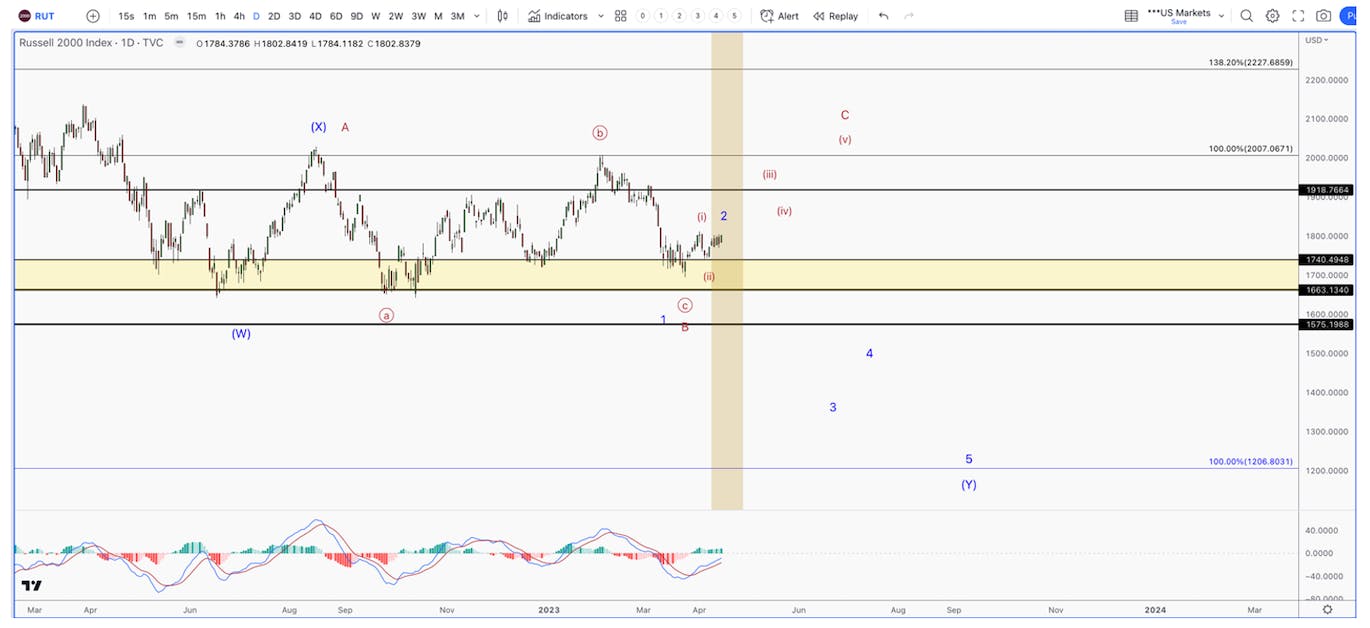
Small CapsSmall Caps
Most regional banks reside in the small cap universe. For this reason, the Russell 2000 (RUT) is quite weak. Usually, we see high beta/small caps lead us out of bear markets. This is not the case today. Note how, like XLF, we have a full 5 wave pattern drop from the February highs. We are trending up into the current April time factor, so we should see a 3rdwave breakout, or another large drop, confirming that we are heading to new lows. Because of the current setup, I believe RUT will be a big tell on what’s to come.
Putting it all together: either we will see some type of top or breakout this week/next week. The NASDAQ-100 suggests that it will be a top, while RUT could go either way. If the drop is a 3 wave pattern, we could be setting up for a bigger push into summer. This will push the Dow to new highs, while many stocks/sectors fail to make new highs. If NDX and DJI turn down in 5 waves, then the top is in and we will raise cash. The financial sector will be the most important to monitor. It is throwing off big warnings on a wide scale.
Macro
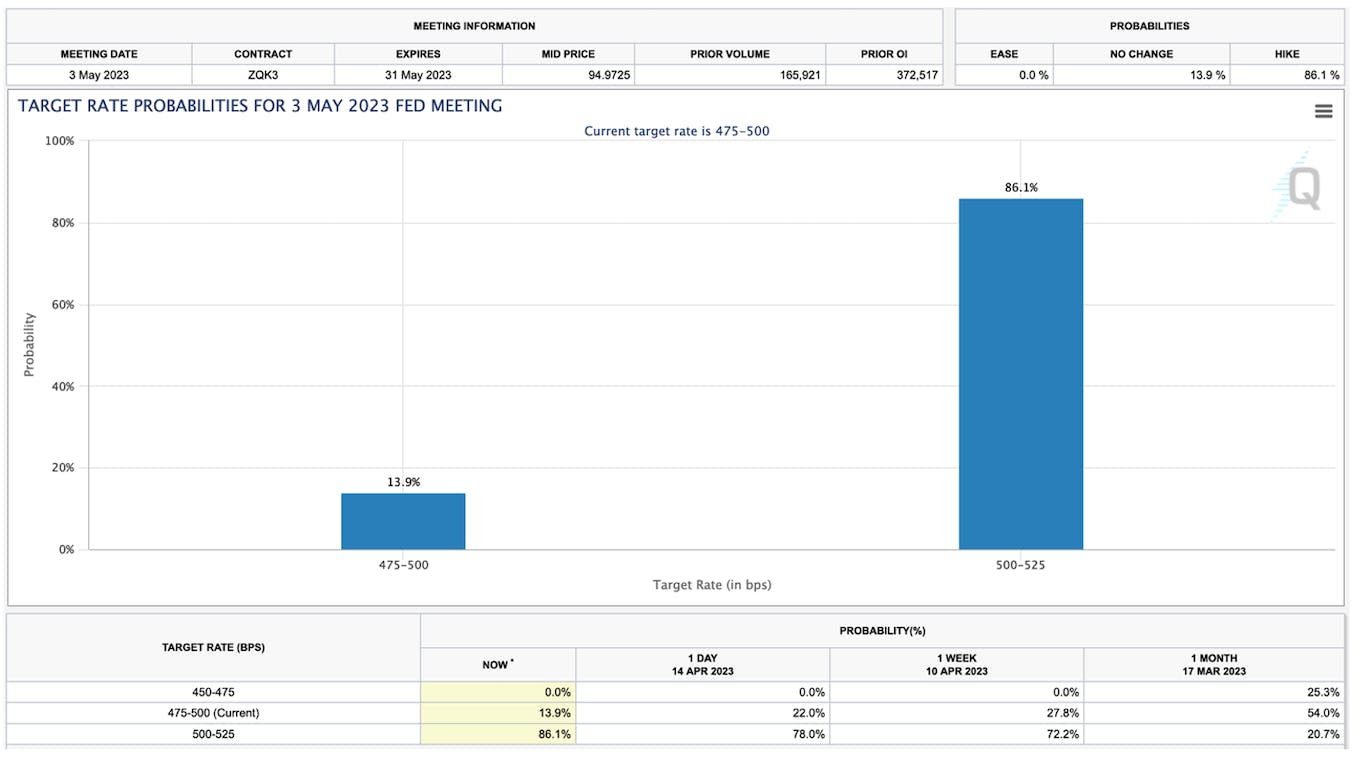
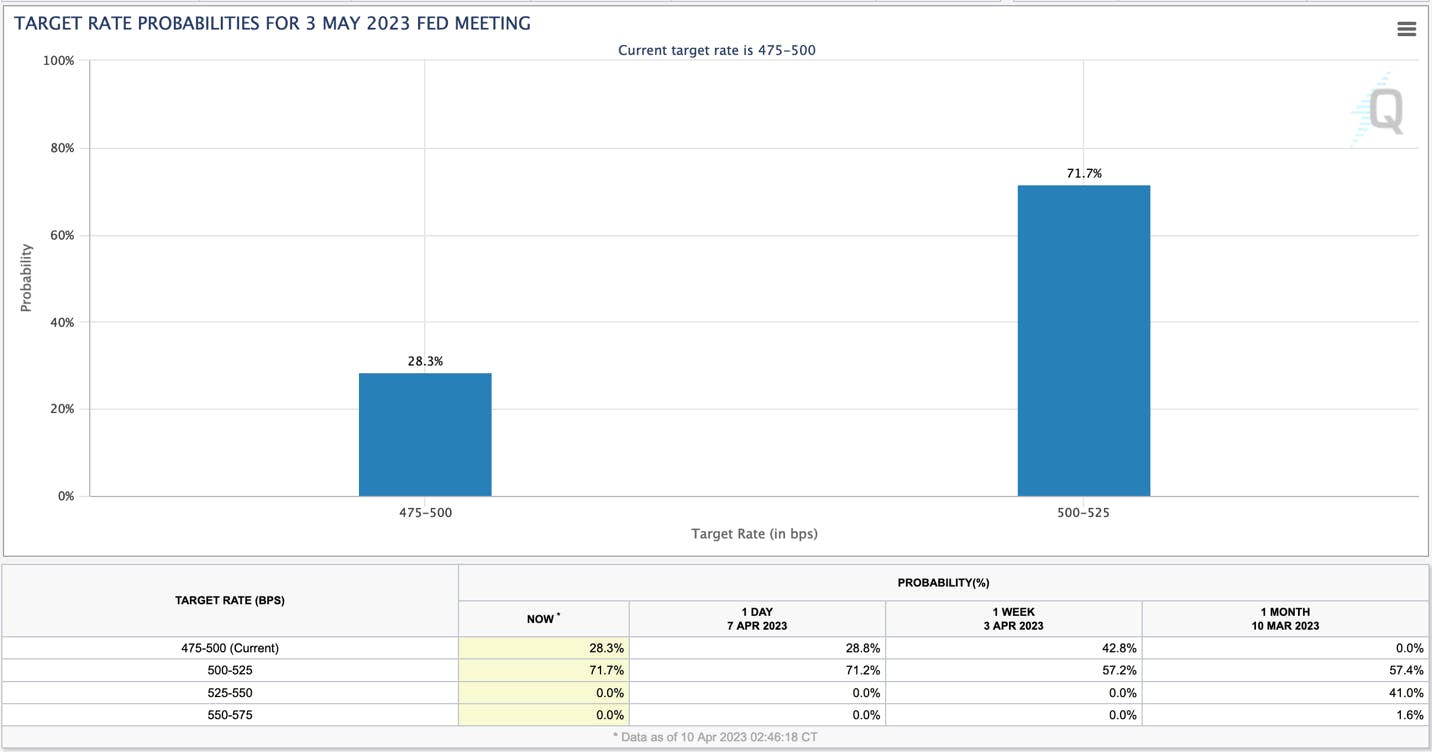
This week will be filled with FED interviews. We have a speaker every day, which should be interesting. Due to the fact that the current FED Fund Futures projections for a rate hike in May is now 86%.
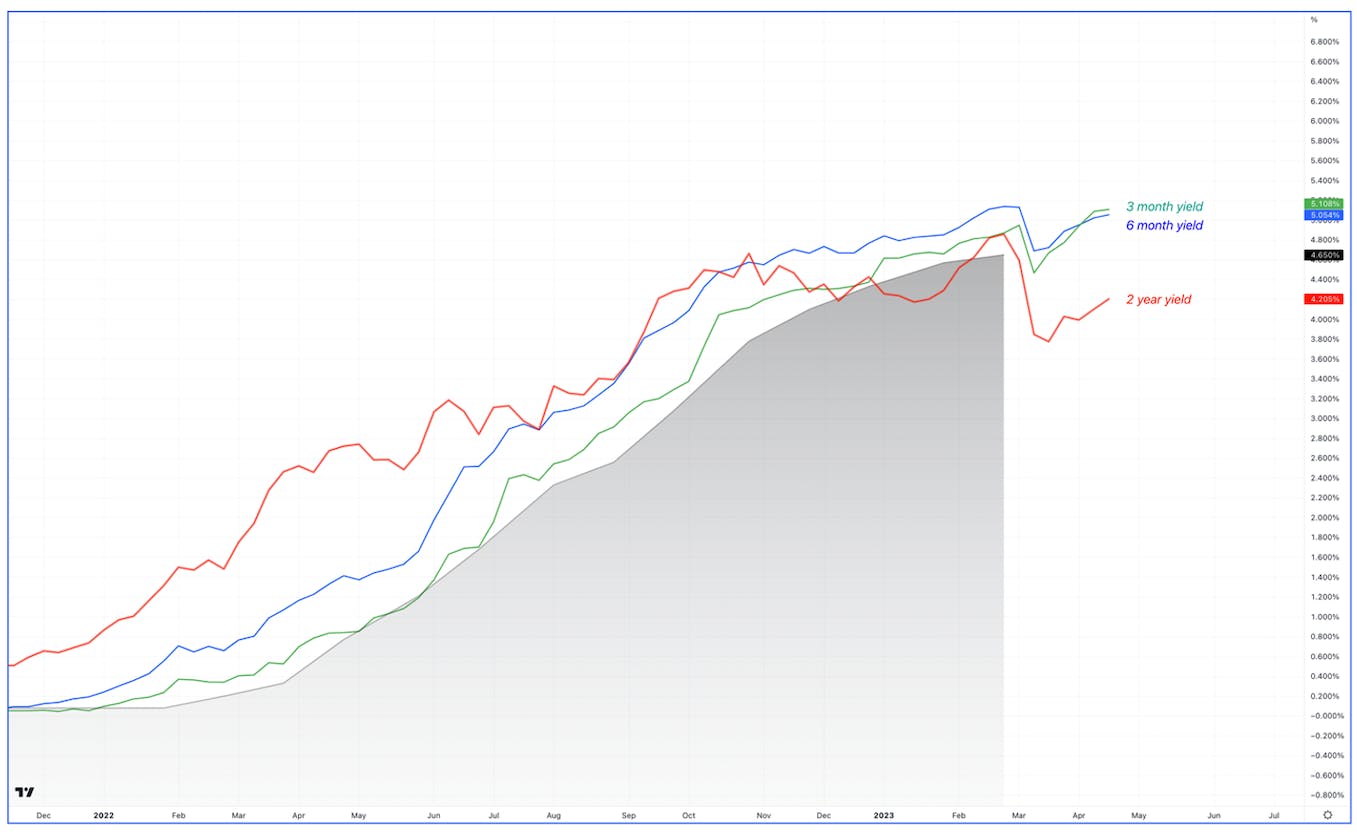
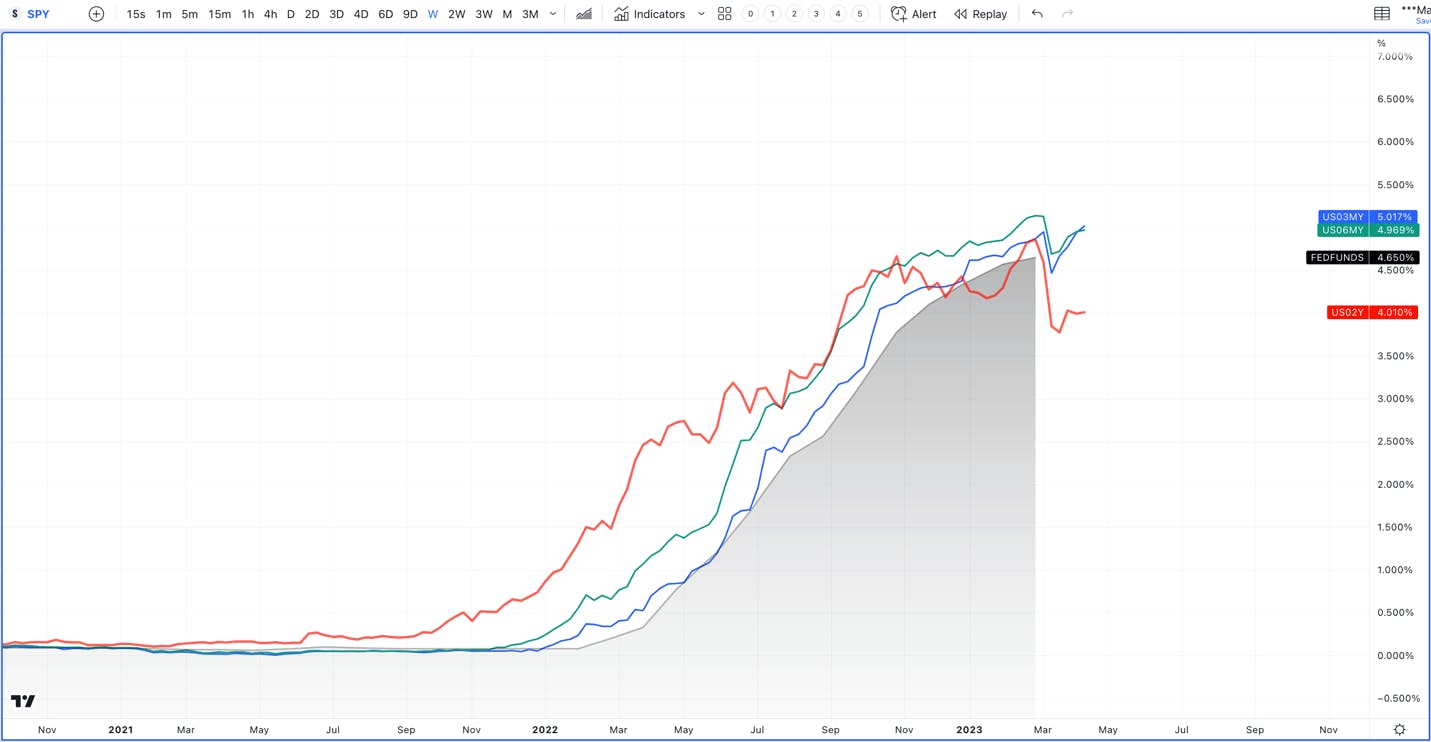
Even more interesting, the projections for an additional rate hike into June is above 25%. We can further see this confirmation in the bond market where the 3-month yield has made a fresh high.
However, the 6-month and 2-year yields are seeing a reversal/pivot soon after this hike. Based on the recent inflation data, I believe the 6-month will push to new highs, as the FED announces that they will have to increase the terminal rate soon. This could be the catalyst for the next leg down in stocks that the NASDAQ-100 is picking up on.
For reference, the shorter the duration, the more controlled by FED policy. So, it’s important to monitor the 2-year and 6-month yields in relation to the 3-month yield. The 3-month yield is signaling more rate hikes, while the 2-year yield and 6-month yields not making a new highs, are saying that we are closer to a pivot than most think. Once the 3-month and 6-month yields collapse, you will know that we are close to a FED pivot, regardless of what they are saying. If this happens sooner than most expect, especially with the inflation data we have been getting, investors should be concerned.
The high frequency data that has been coming out has not been encouraging for the immanent FED Pivot narrative. For one, the CPI print was not as dovish as the headline numbers celebrated.
The only reason it came in so favorably was because of reduced energy costs. When you strip out energy/food, core CPI rose 0.4%, led by rent costs. Rent still has a long way to go to catch up to housing prices, so this will likely continue to put upward pressure on inflation numbers. The Super Core, which is the FED’s preferred means of tracking progress with inflation, came in at 0.4%. This metric is up 5.2% on an annualized basis for the first half of 2023, showing no progress.
Regarding the PPI, this told a slightly different story. PPI is more forward-looking as it measures the input costs of producers/manufacturers. This could be foreseeing a push forward of the decline in M2, which for those that are not aware, we have seen the largest M2 decline since 1930. When this does hit the economy, it will not be pleasant. However, energy costs were still a big part of the lower numbers. Though the trend is undoubtedly down, it is still well above the 2% target. Take goods, for example; it was down 0.1%. When you strip out energy, which was down 6.4% (led by gasoline, which was down 11.7%), you actually have an increase of 0.4%.
This was backed up by industrial production coming in better than expected, which was on the heels of two prior upward revisions. This was led by the Utilities segment, which posted the only gain, while manufacturing continued its decline.
Retail Sales logged a decline of 1%; however, retail sales are up 2.9% on a YoY basis. More importantly, it is still trending well above the average on a 3 month, annualized basis.
The more resilient the US economy remains, the stickier inflation becomes, as shown in the services and super core segments of the inflation data. This will likely embolden the FED to not only raise the terminal rate, but increase rates higher, which will further exacerbate whatever damage they have already caused to the economy in their battle to beat inflation. We expect this type of rhetoric to be on full display this week, as the FED continues to address inflationary pressures.
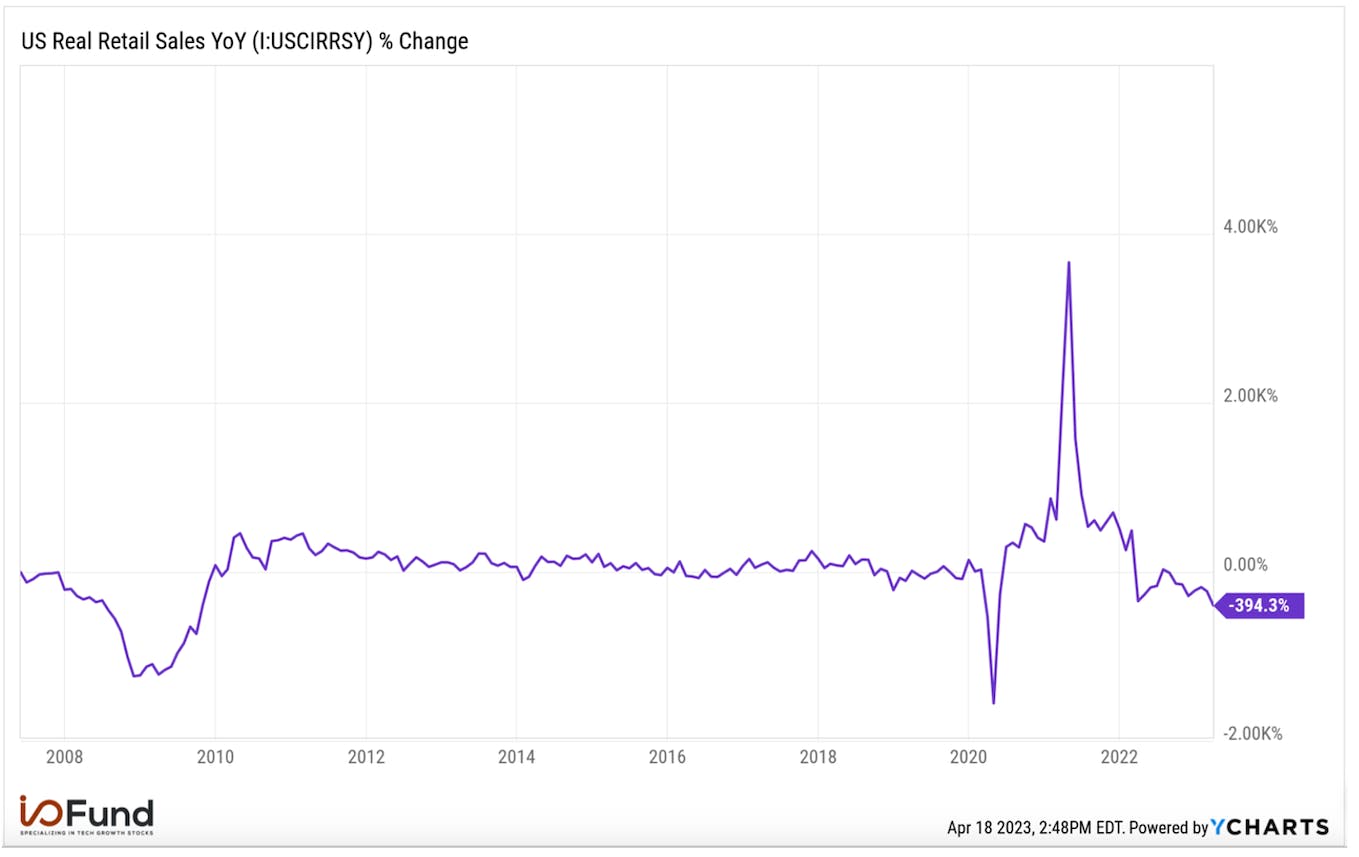
Now, let’s look at retail sales on a YoY basis stiped of inflation. When we look at Real Retail Sales, it is quite alarming. The headline retail sales numbers are including inflation. Without inflation we are trending well into contraction territory from prior cycles.
This concerns me because the FOMC is waiting very deep into this business cycle to lower rates, and they have to because of how stubborn inflation is. We are seeing many data points like the one above, all while inflation remains well elevated above the 2% target. The fact that they have to raise rates into this type of weak economy is concerning because of the lag time it takes for rate hikes, and cuts to filter into the system. This, amongst several other data points, suggests that the “mild recession” the FED is now forecasting will likely not be mild.
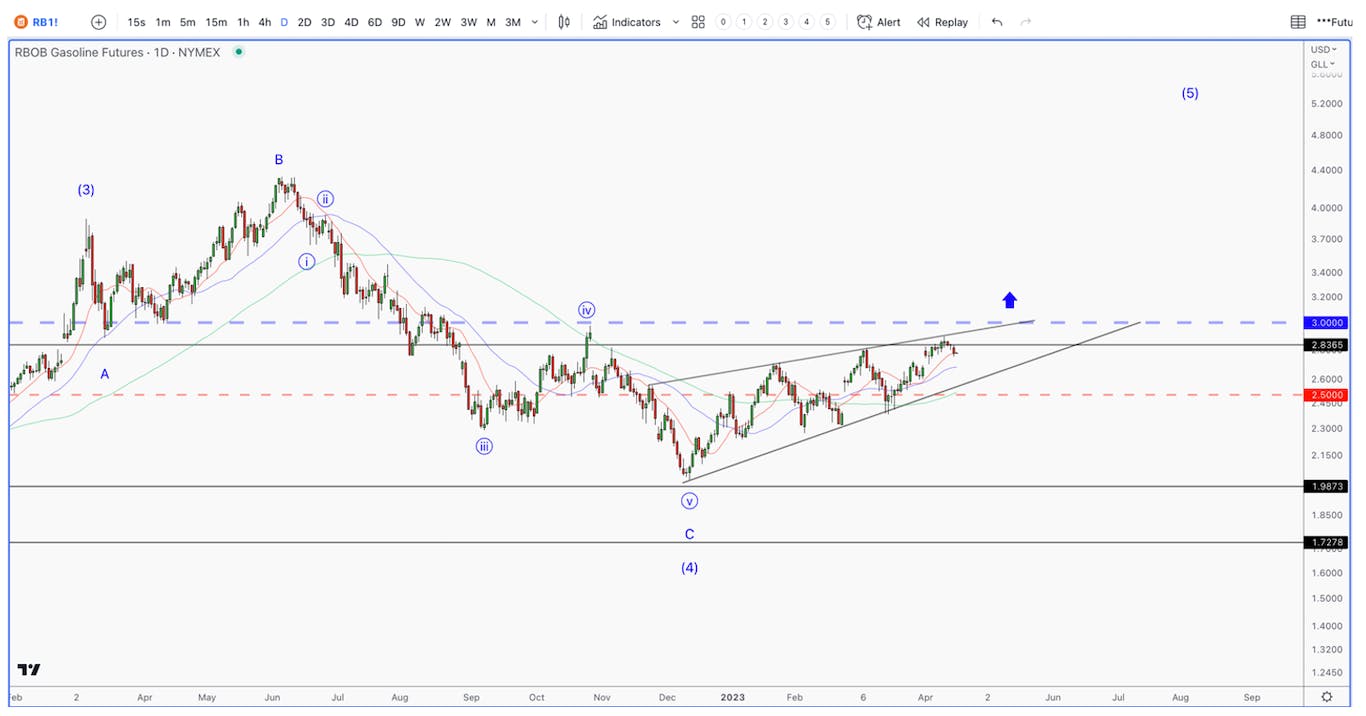
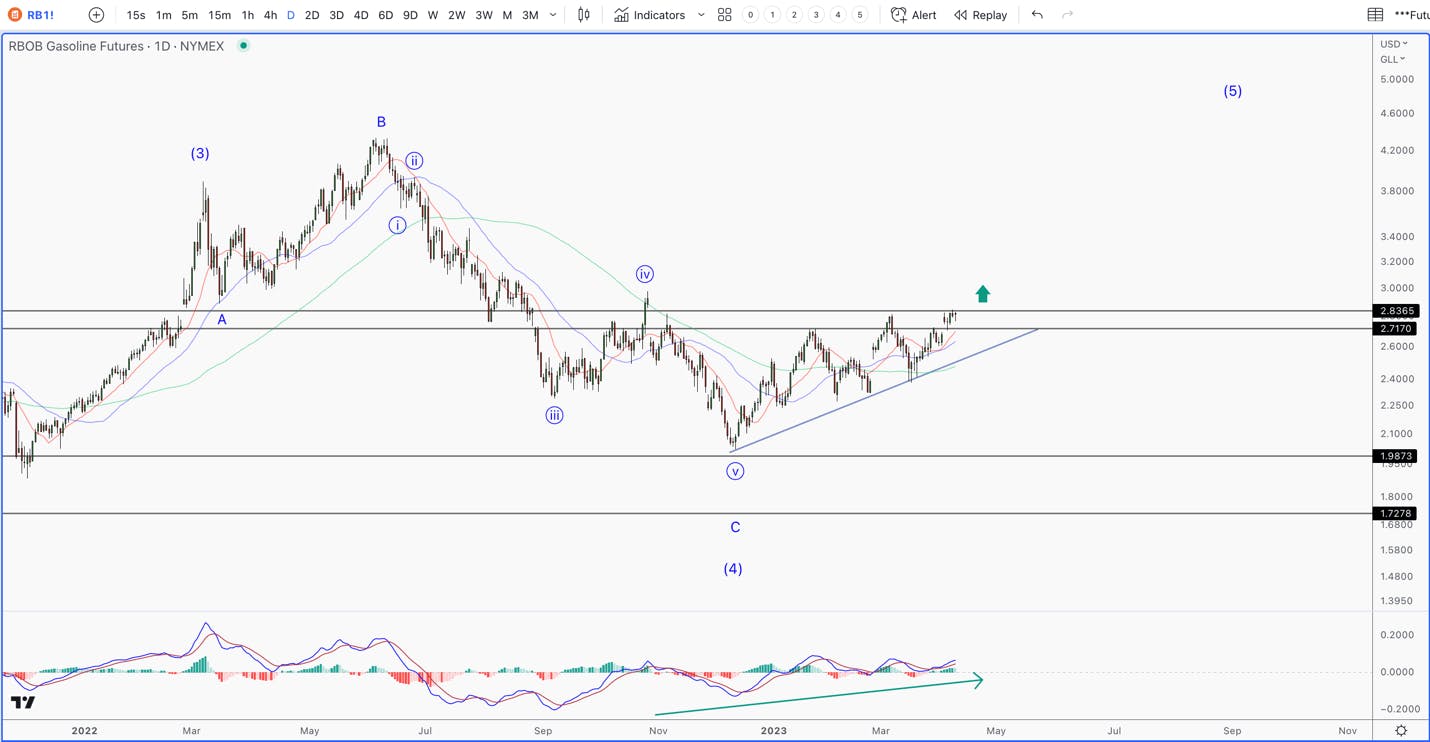
One additional point on inflation, core and super core data remains flat, at best. While the headline numbers continue to fall. This means that energy and food is the primary reason for favorable inflation data numbers. However, if we look at energy futures, a concerning picture continues to unfold.
GasolineGasoline
We have been showing this pattern developing for several months. If gasoline can get above $3, then a clear path to new highs will become probable. On the other hand, if we break down below $2.5, then the odds of this scenario playing out falls drastically.
Crude OilCrude Oil
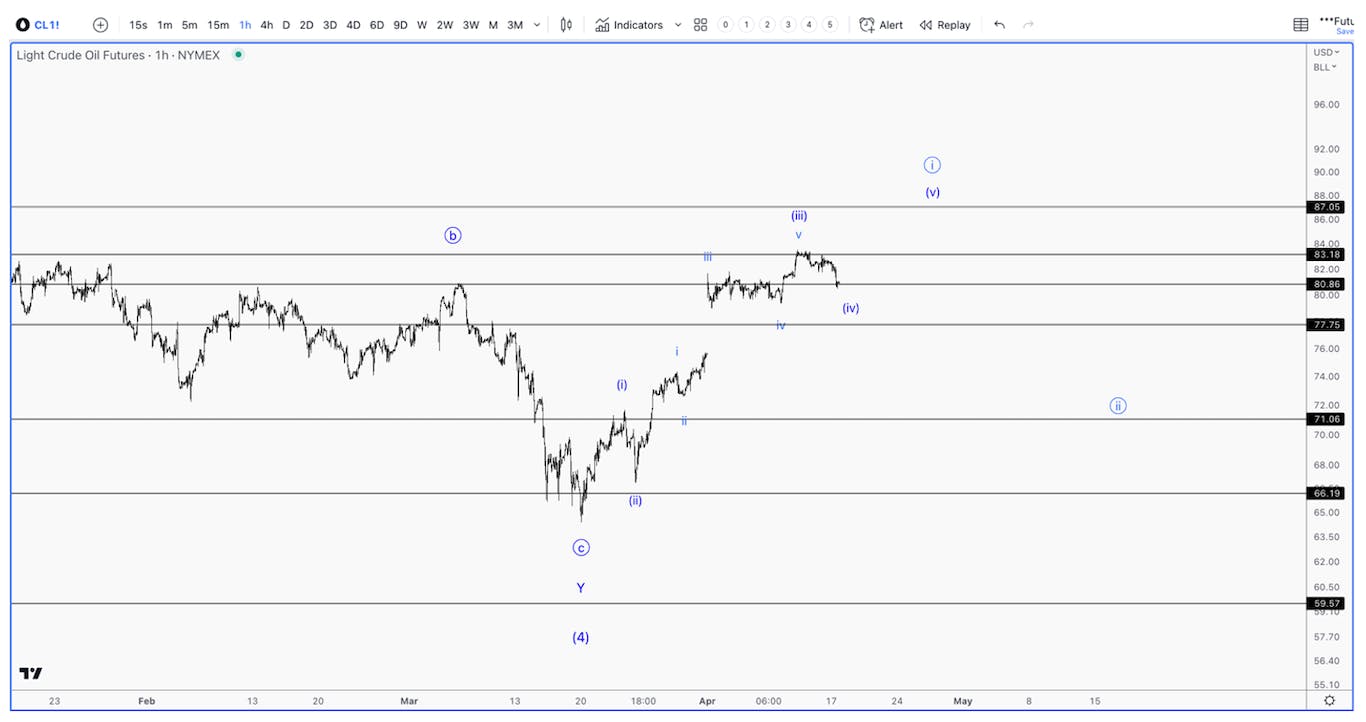
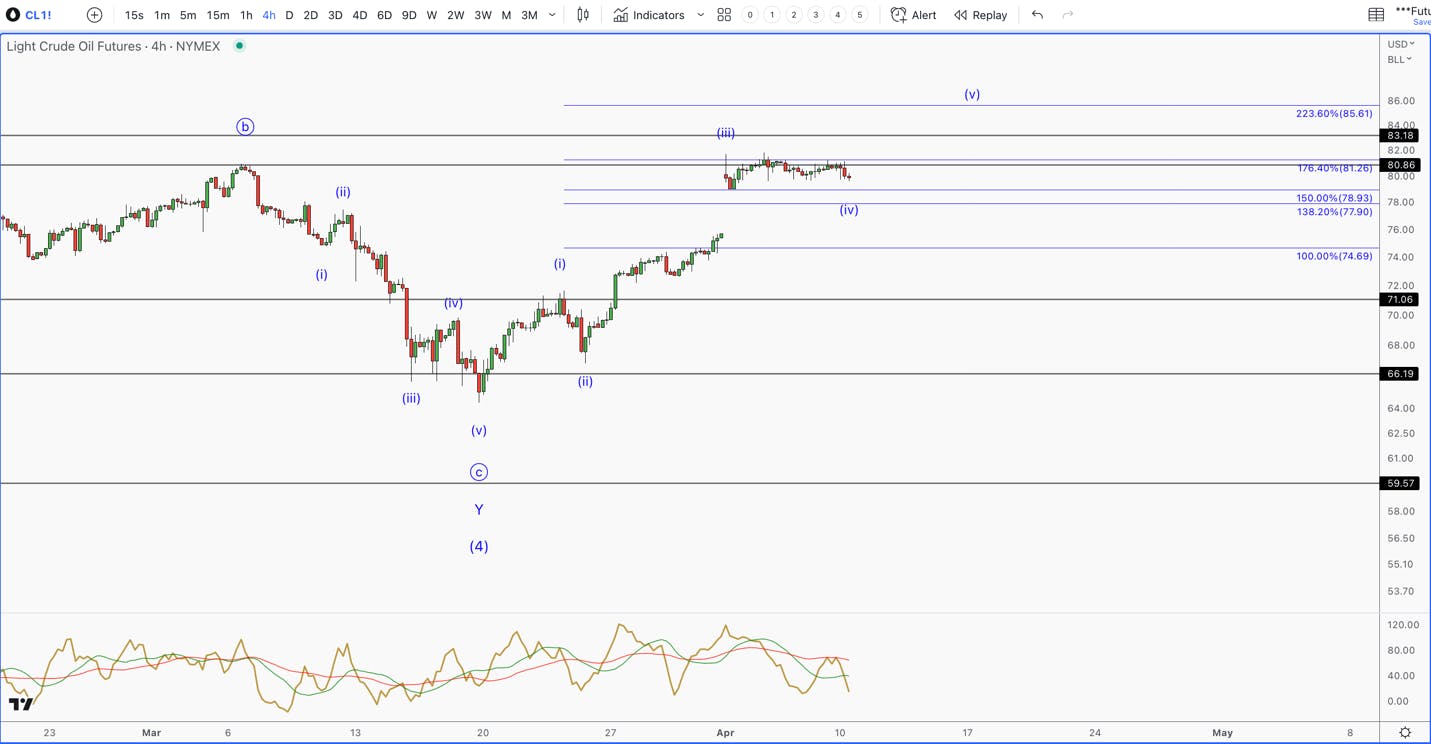
Crude oil is targeting $87 in a very nice and developing 5 wave move off the low. If this pattern gets to $87, then provides a 3 wave retrace, then crude is setting up for a run to new highs. This scenario is not being factored into equity prices, and until it is negated, risk remains elevated.
If we look at food futures, another major contributor to inflation, we can see a similar theme playing out.
Cattle and WheatCattle and Wheat
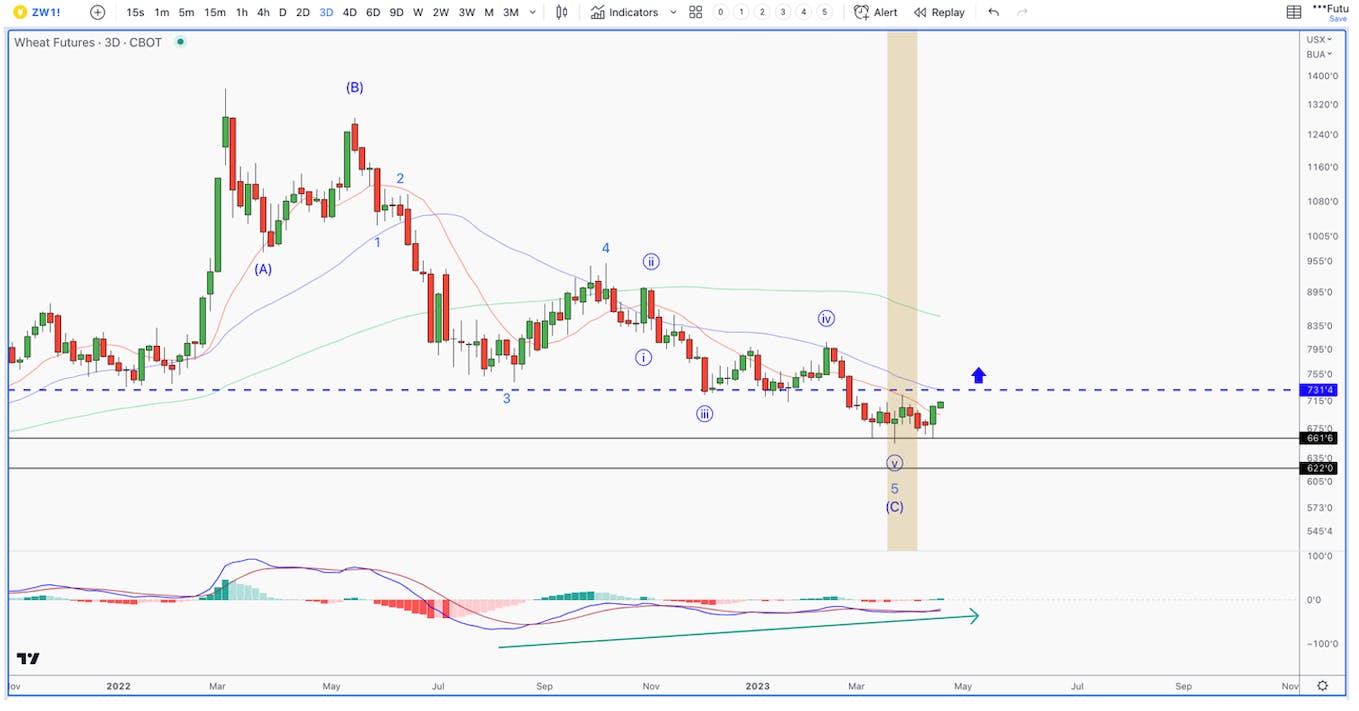
Cattle prices have just broken out to all-time highs, and holding at these levels. This has been offset by wheat prices cratering. However, after a very stretched corrective pattern, wheat appears to be putting in a bottoming and setting up for potential breakout. If wheat breaks above $731.50, it could be a problem for food prices in future inflation data.
I/O Fund Portfolio
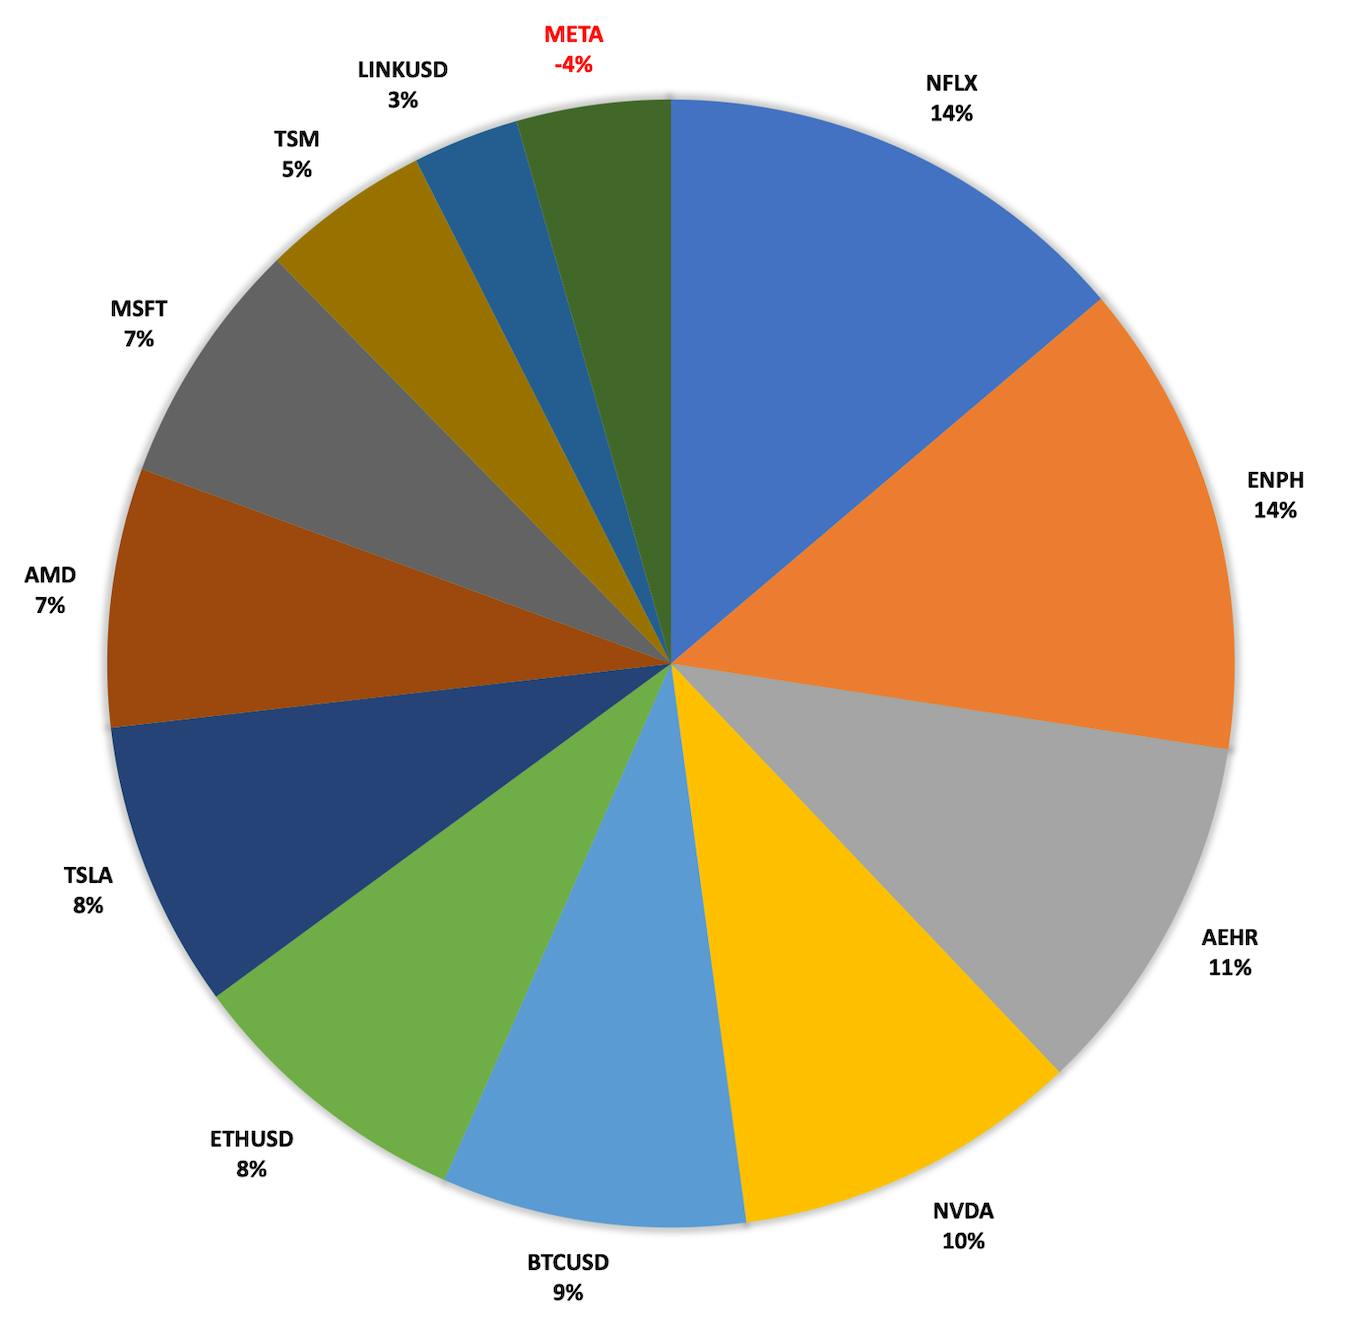
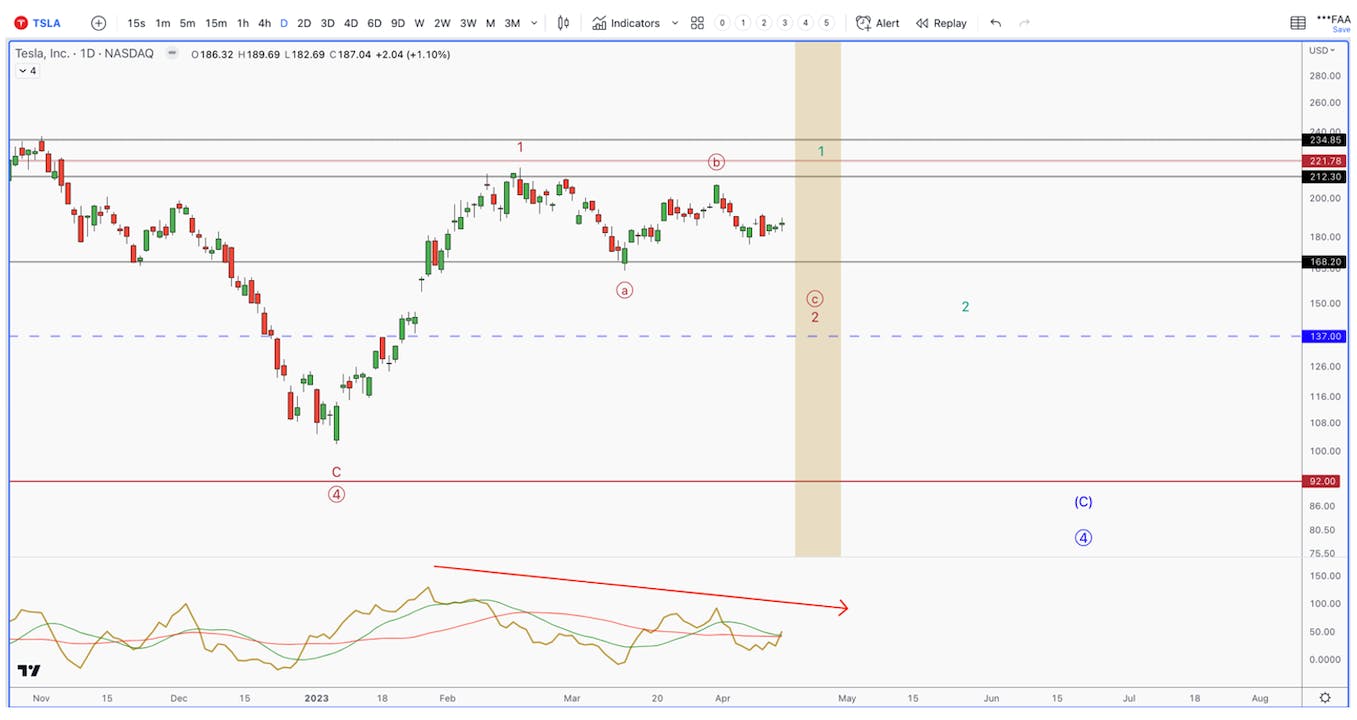
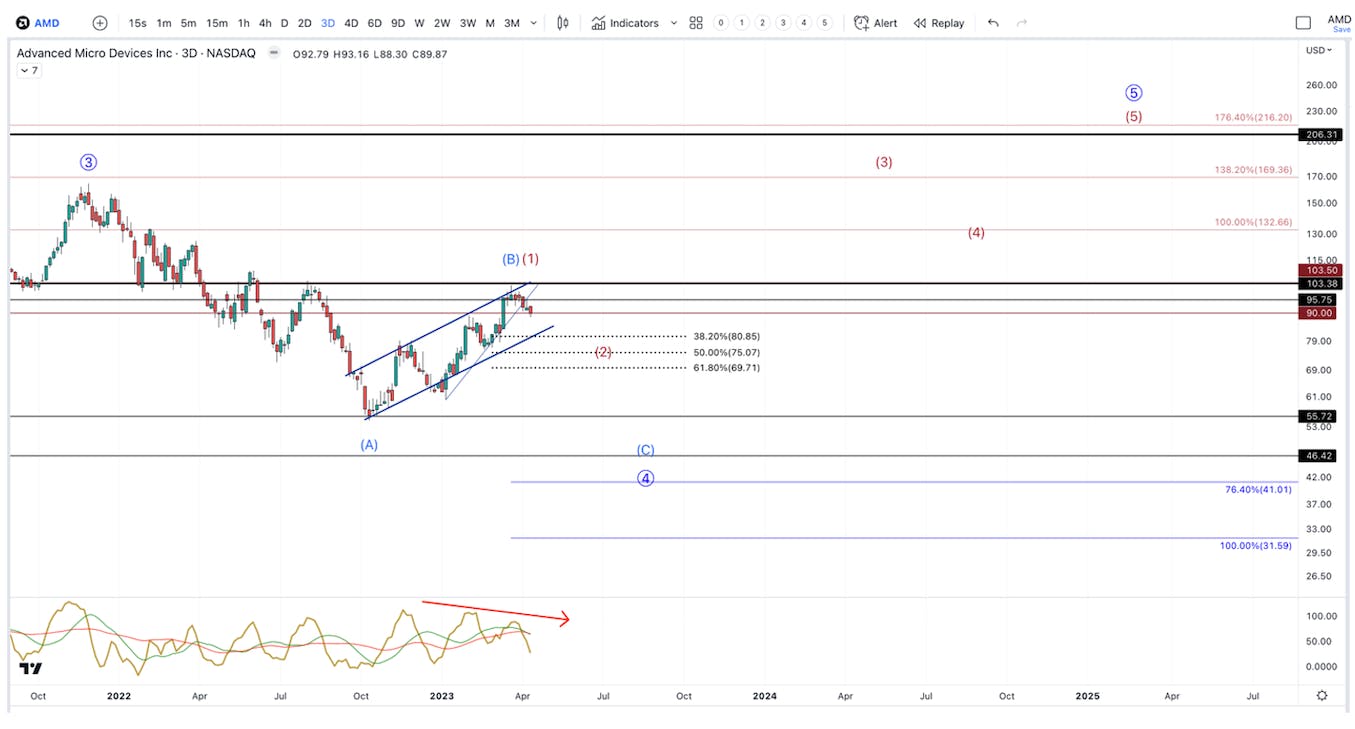
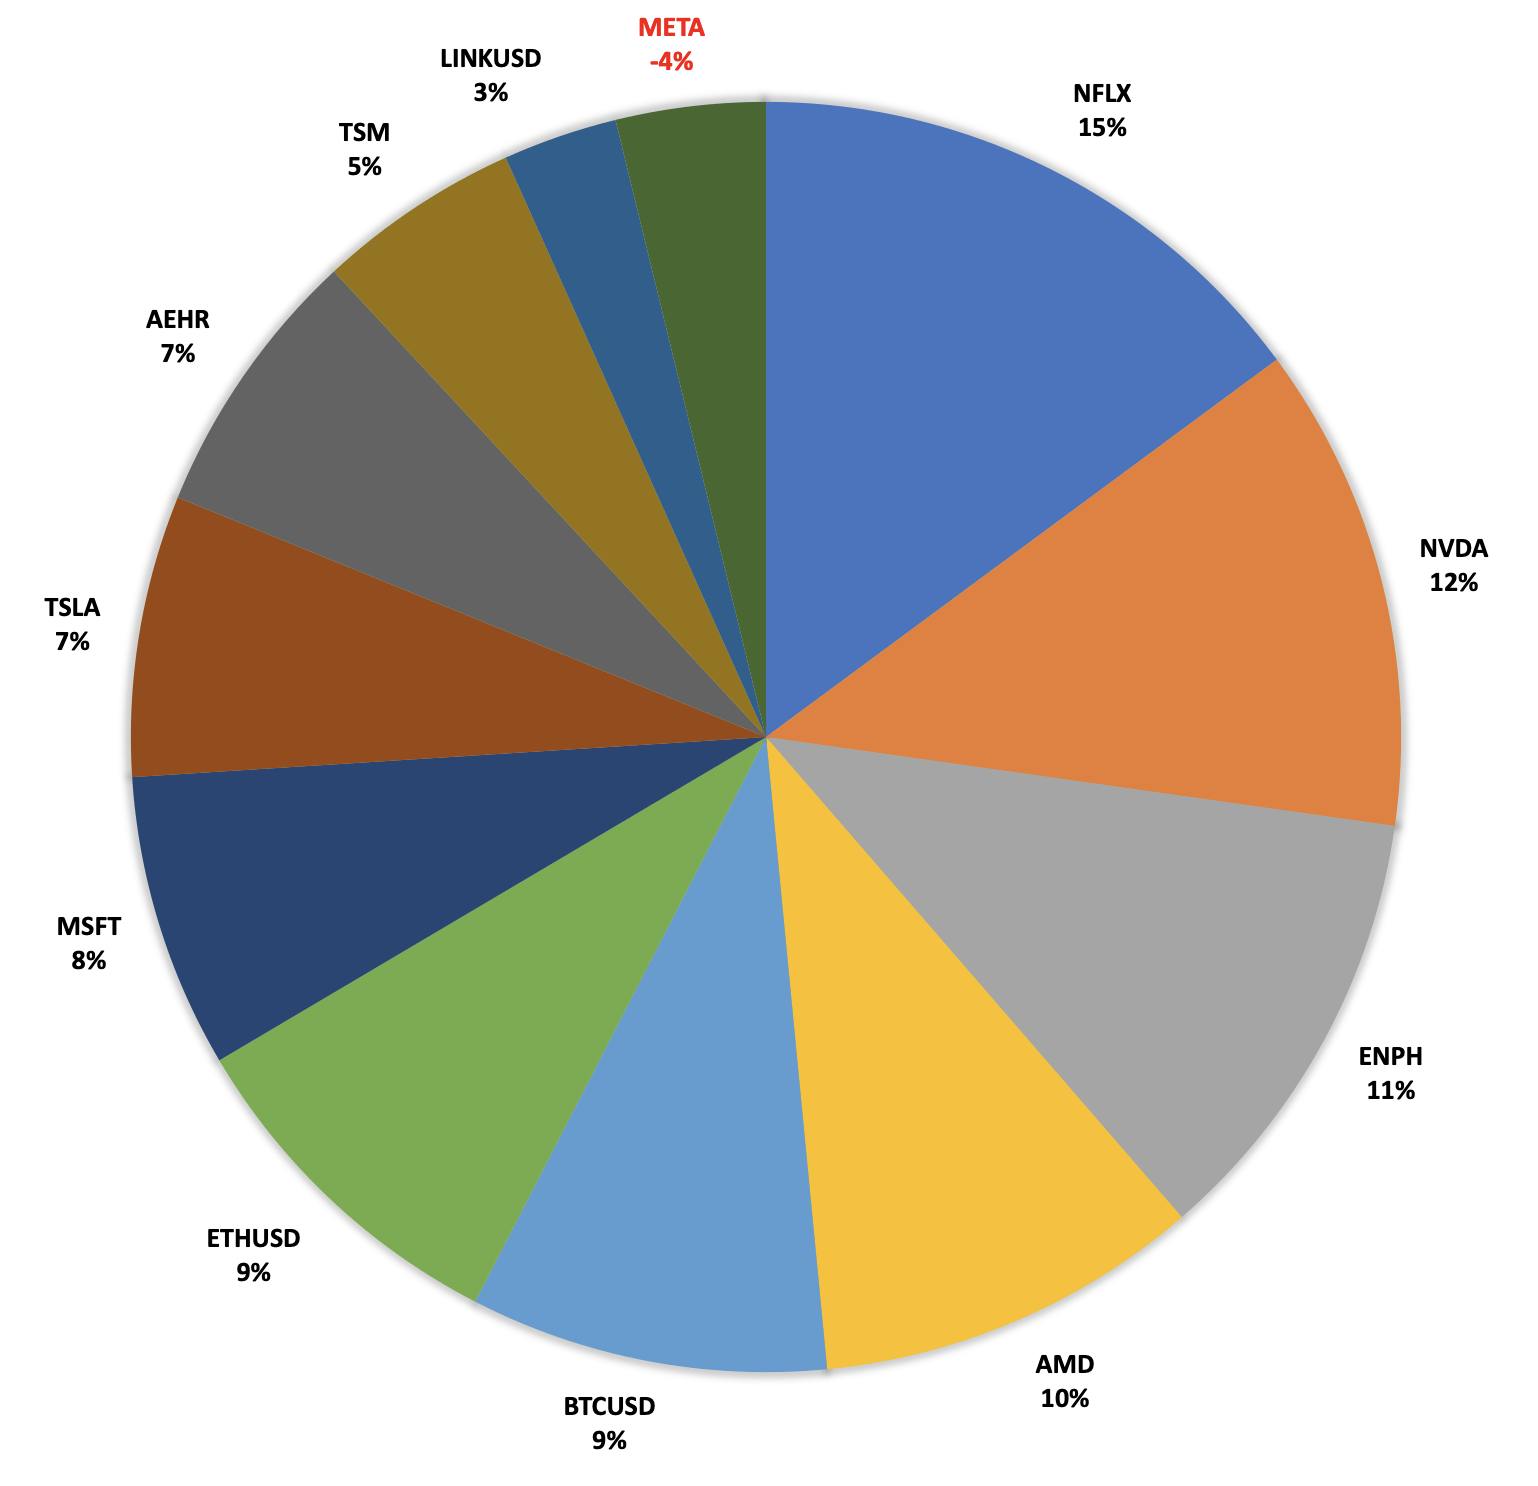
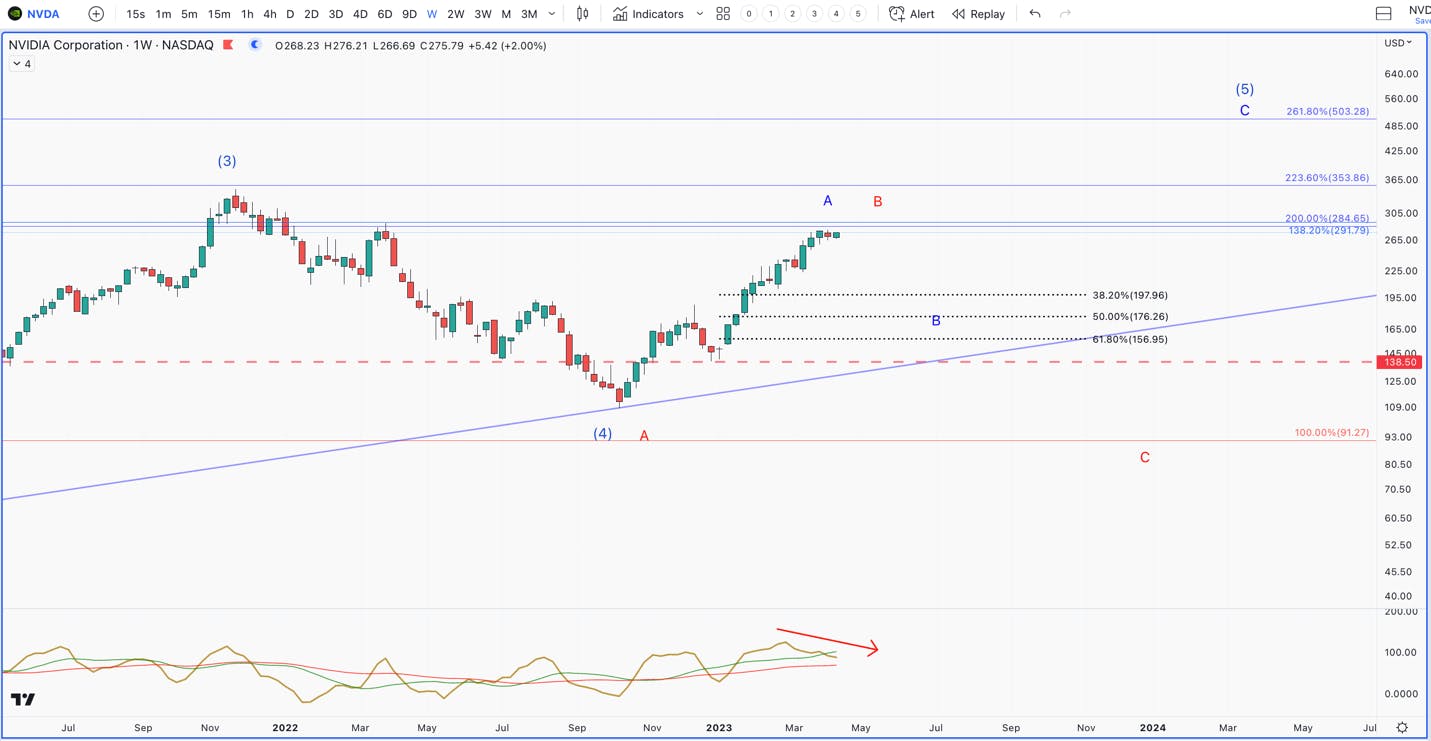
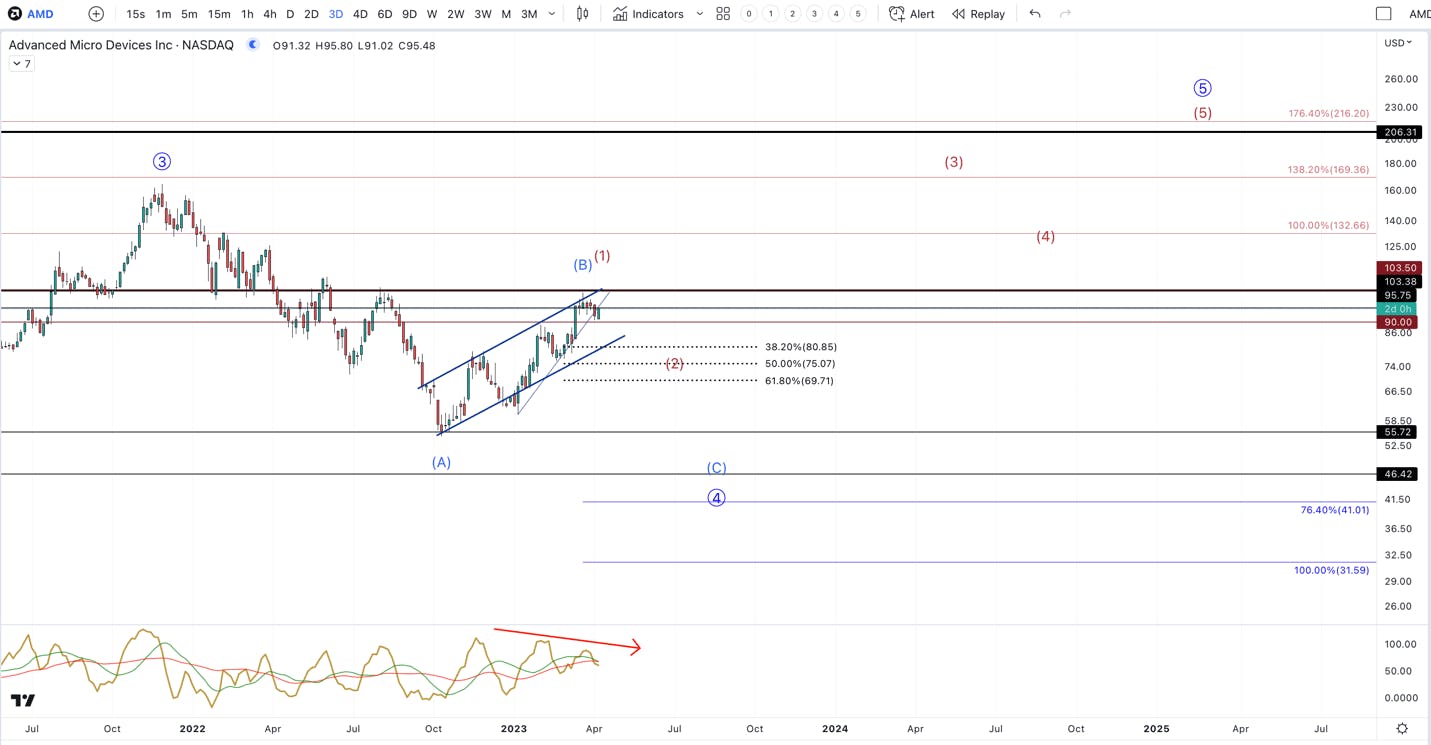
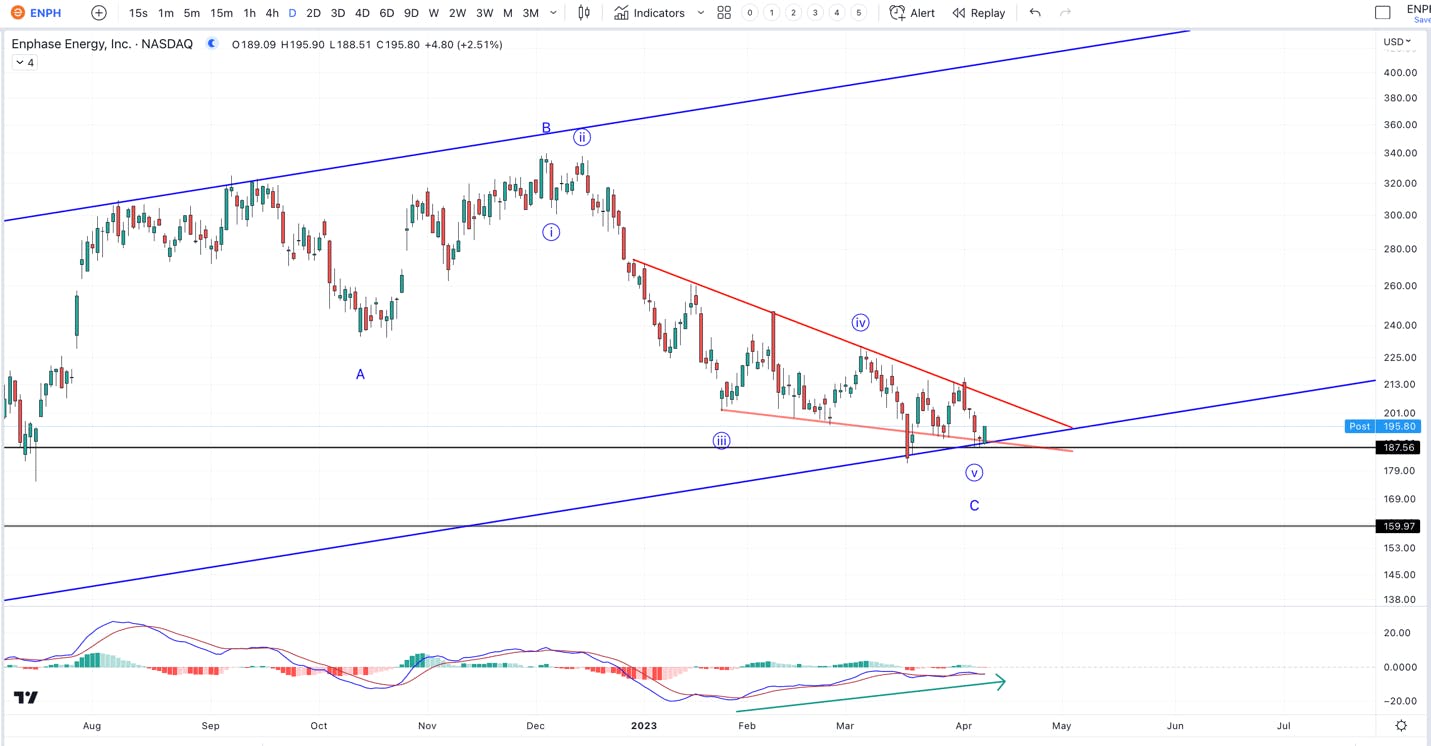
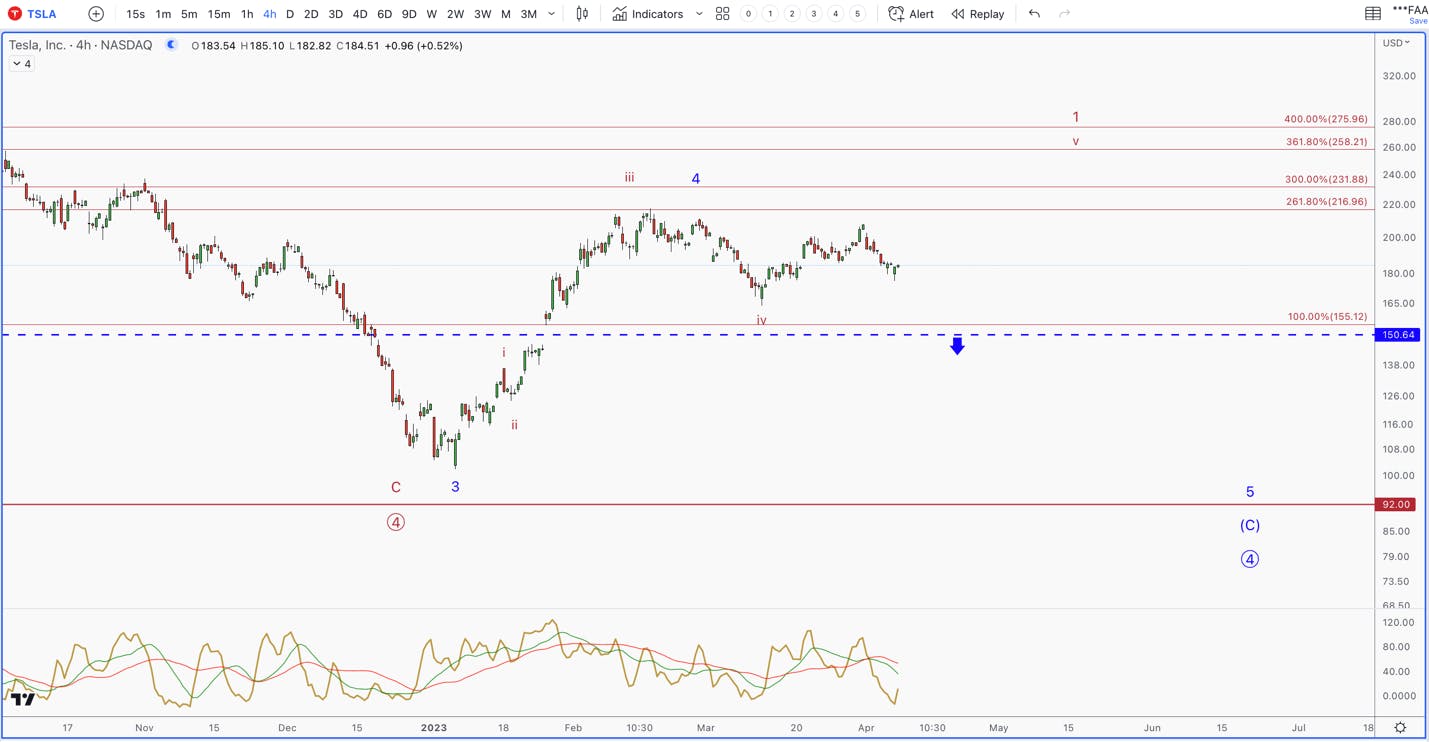
Our largest position remains cash, where we are holding about 18% of cash. We have taken considerable gains in NVDA and AMD, as they appear to be topping out after giving us an incredible run since the October low. We have allocated more money to AEHR due to a sizable increase for futures revenue and EPS estimates. We also have added to ENPH on its recent, and long-time coming, breakout. If we add more cash into the markets, we plan to target TSLA as well as Bitcoin.
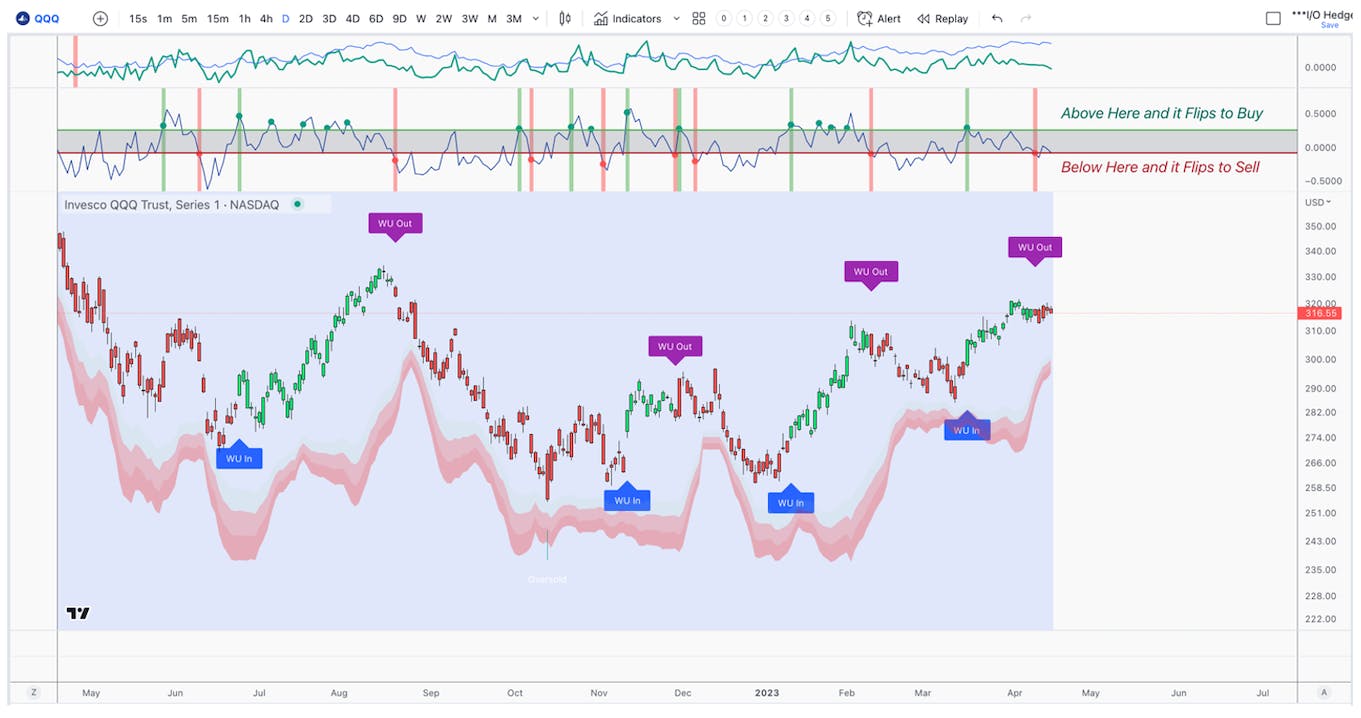
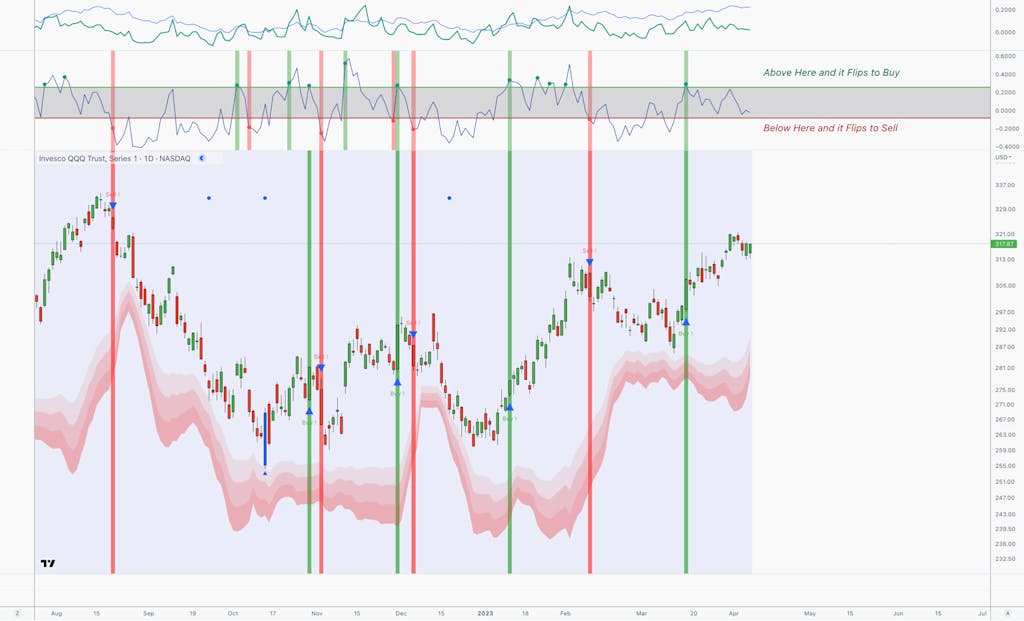
HedgeHedge
Our hedge has been on point during this overlapping and messy rally. It has caught every swing higher, and gotten us out close to the top. The more we see it work in real-time, the more confidence we have in it. As of now, it is still in bear market mode, and recently flipped to sell.
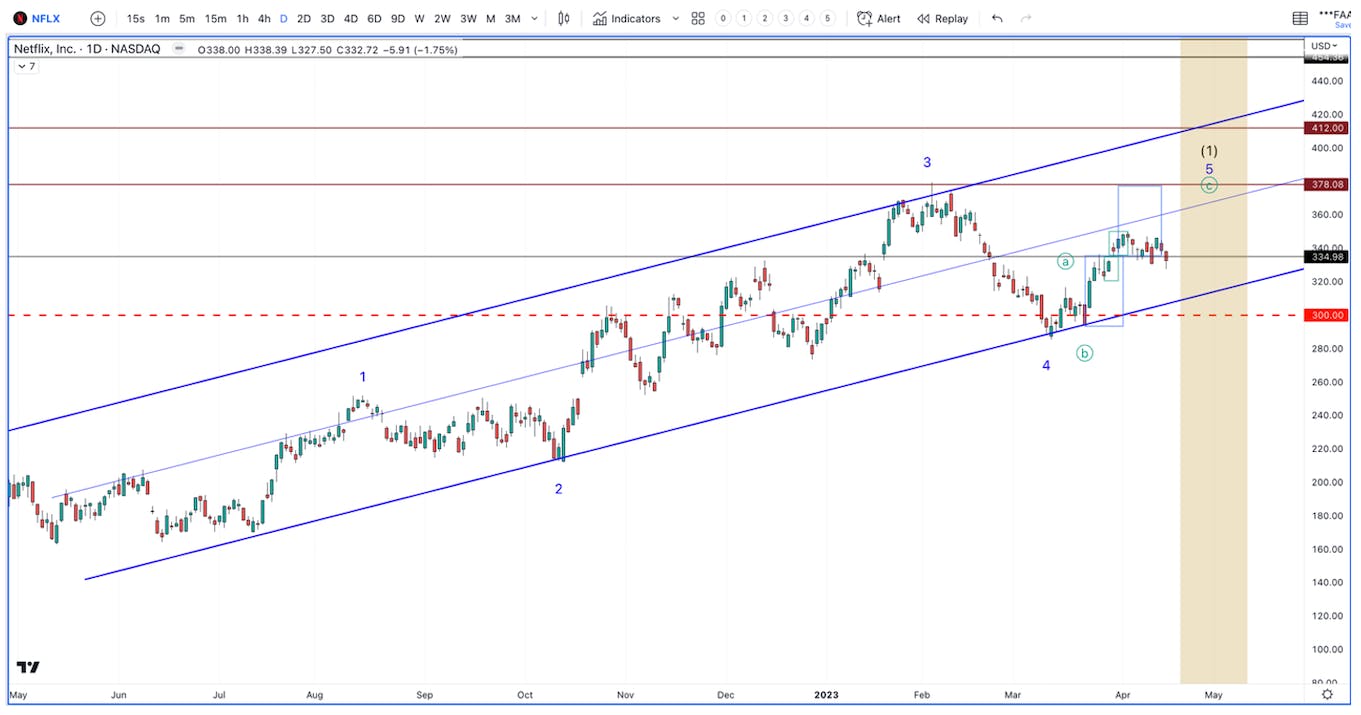
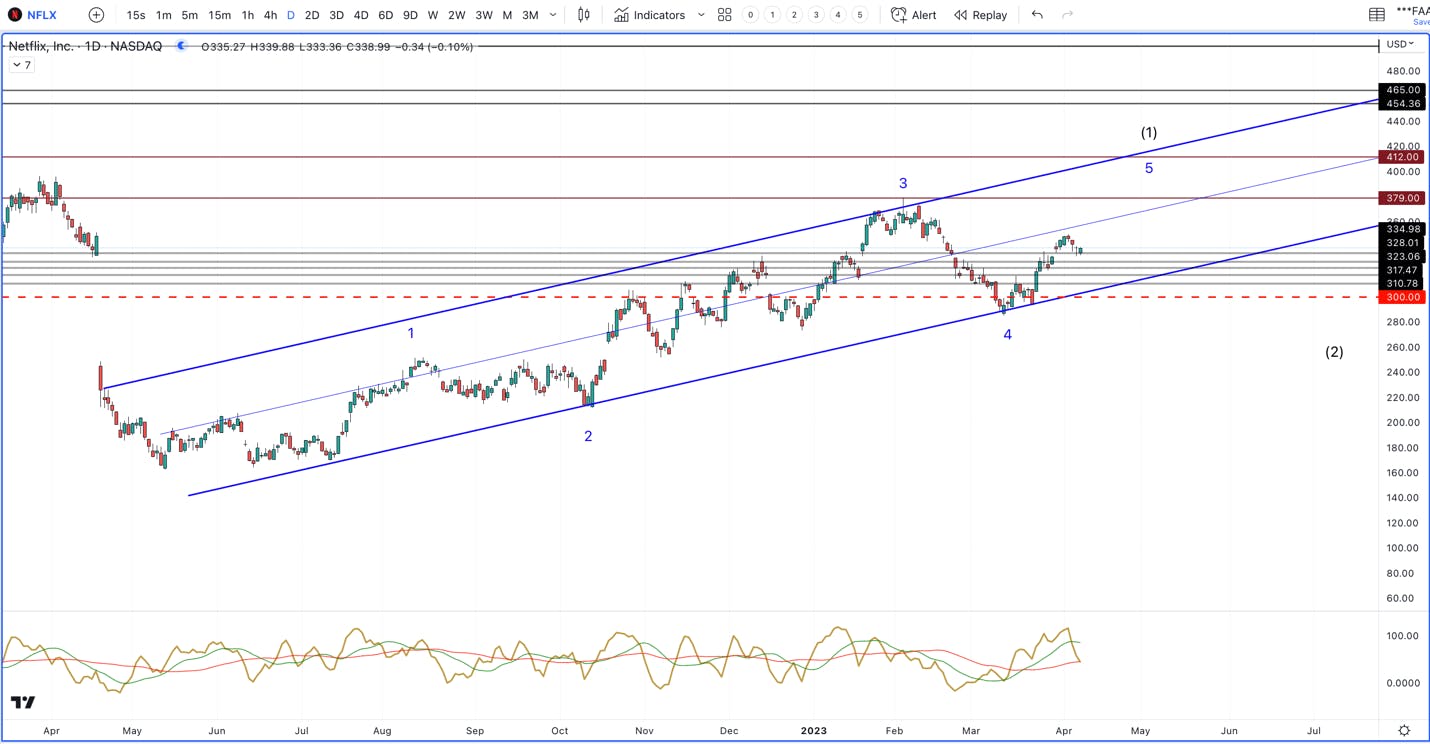
NFLX continues to trace the pattern we laid out many months ago. It appears to be setting up for the final swing in a very large leading diagonal pattern. The $378 region will be very strong resistance, if we get there.
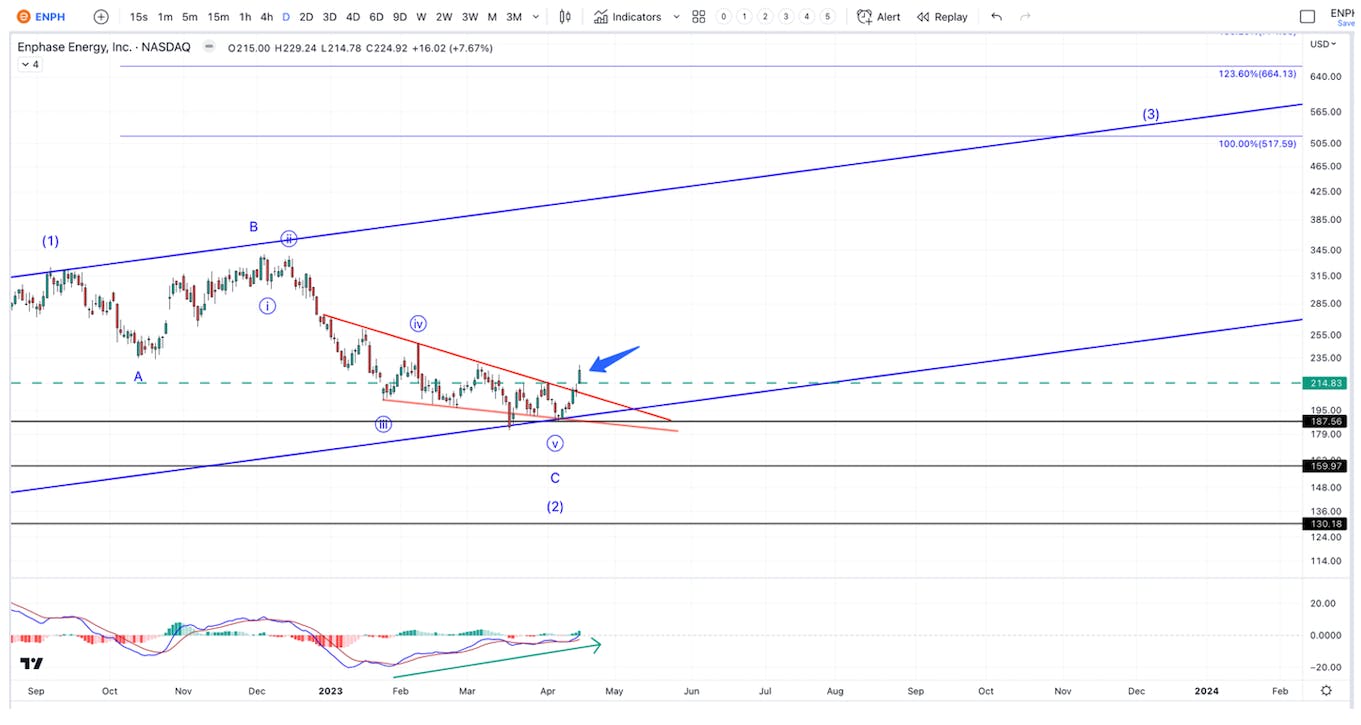
It’s hard to imagine ENPH pushing higher if we really are in a bear market bounce. Keep in mind, ENPH continued in an uptrend in 2022 while tech cratered. This is because ENPH is tied to inflation, specifically energy futures. If inflation does have a new impulse, driven by energy and food futures, expect tech to fall while ENPH continues higher.
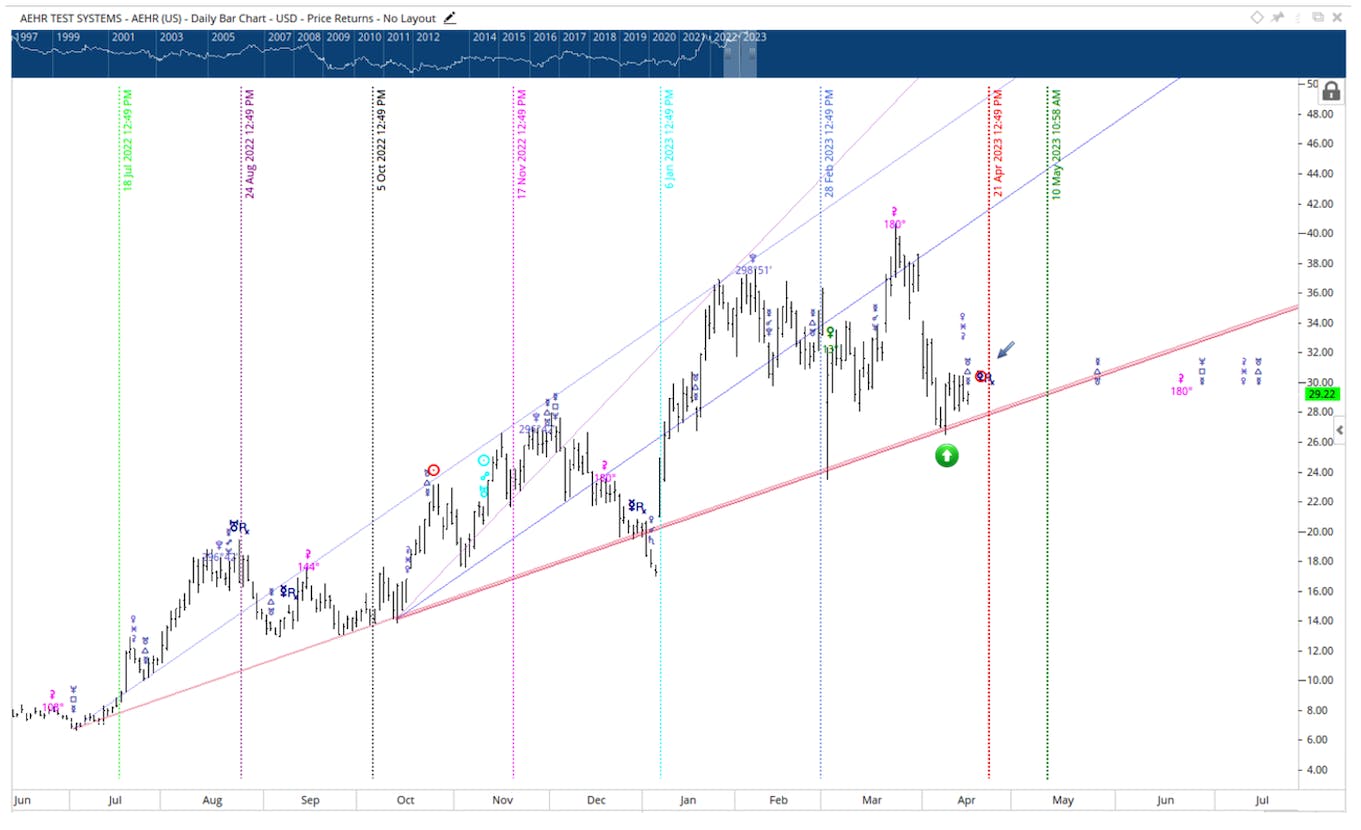
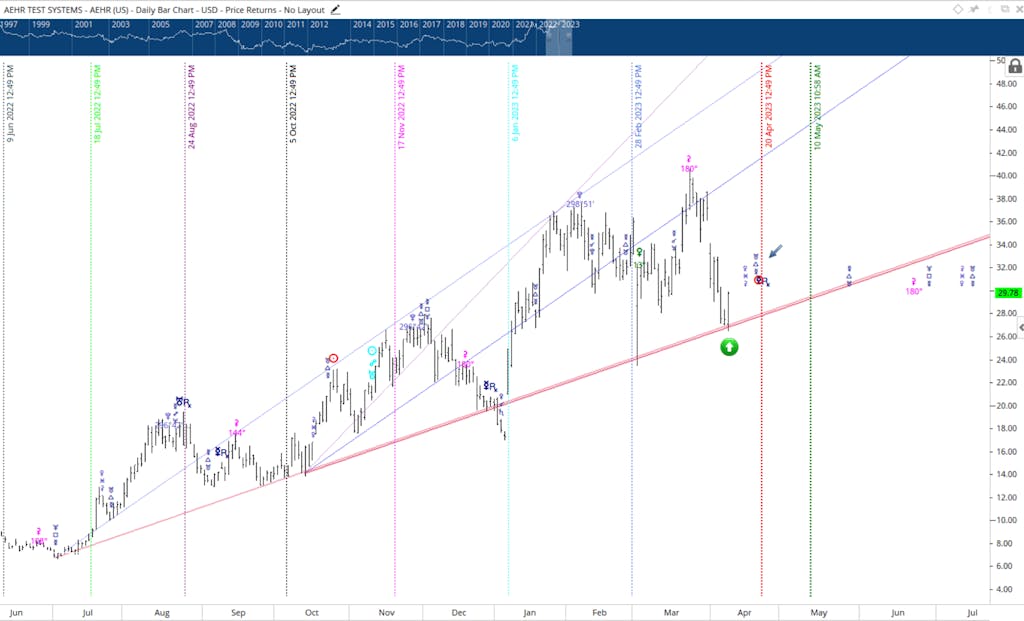
AEHR found support on the Gann 1×1 line (in red). As long as this level holds, we expect higher prices. Note how AEHR is moving into a time factor soon. If this signals a top and break down below the 1×1 line, we will stop out of a lot of our position. If it marks, instead, a breakout, we may add.
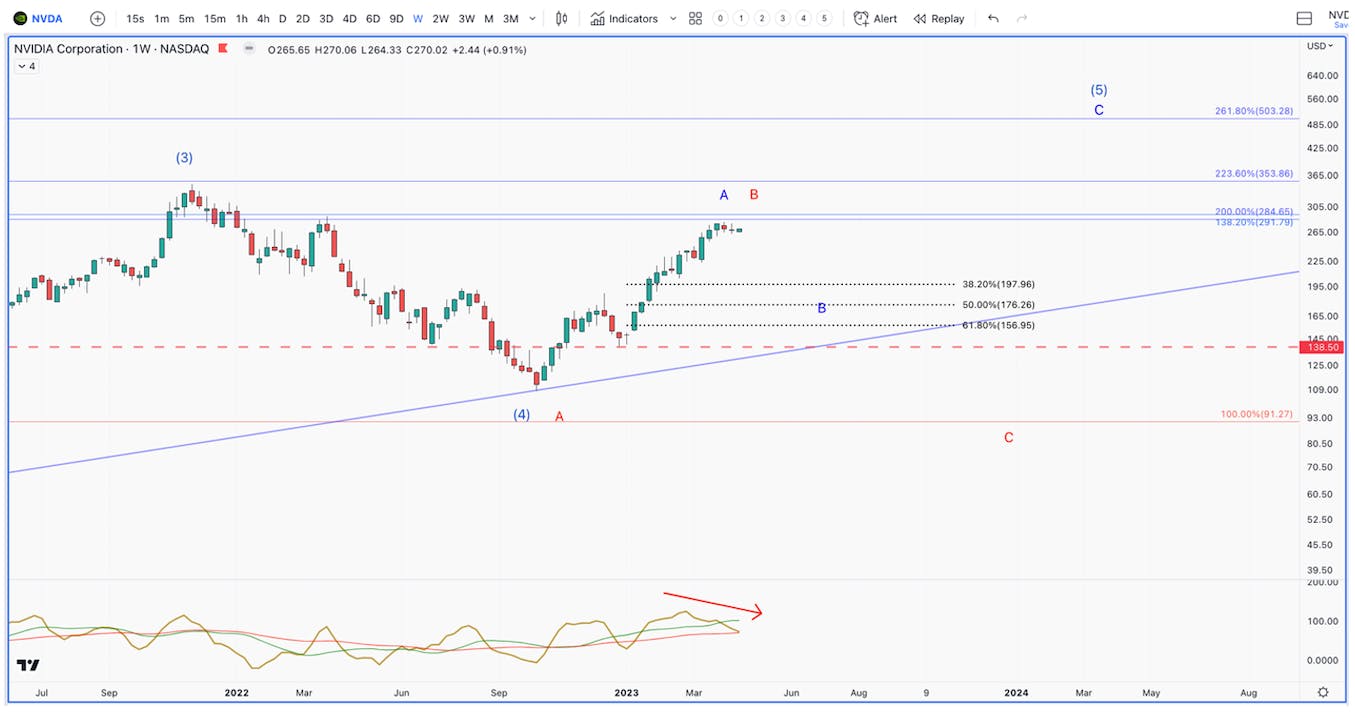
NVDA continues to exhibit topping patterns after a very large 3 wave bounce. Even if the low is in, a sizable retrace needs to happen before the next leg higher. April 19 – 25 is a big time factor for NVDA.
Bitcoin (BTCUSD)
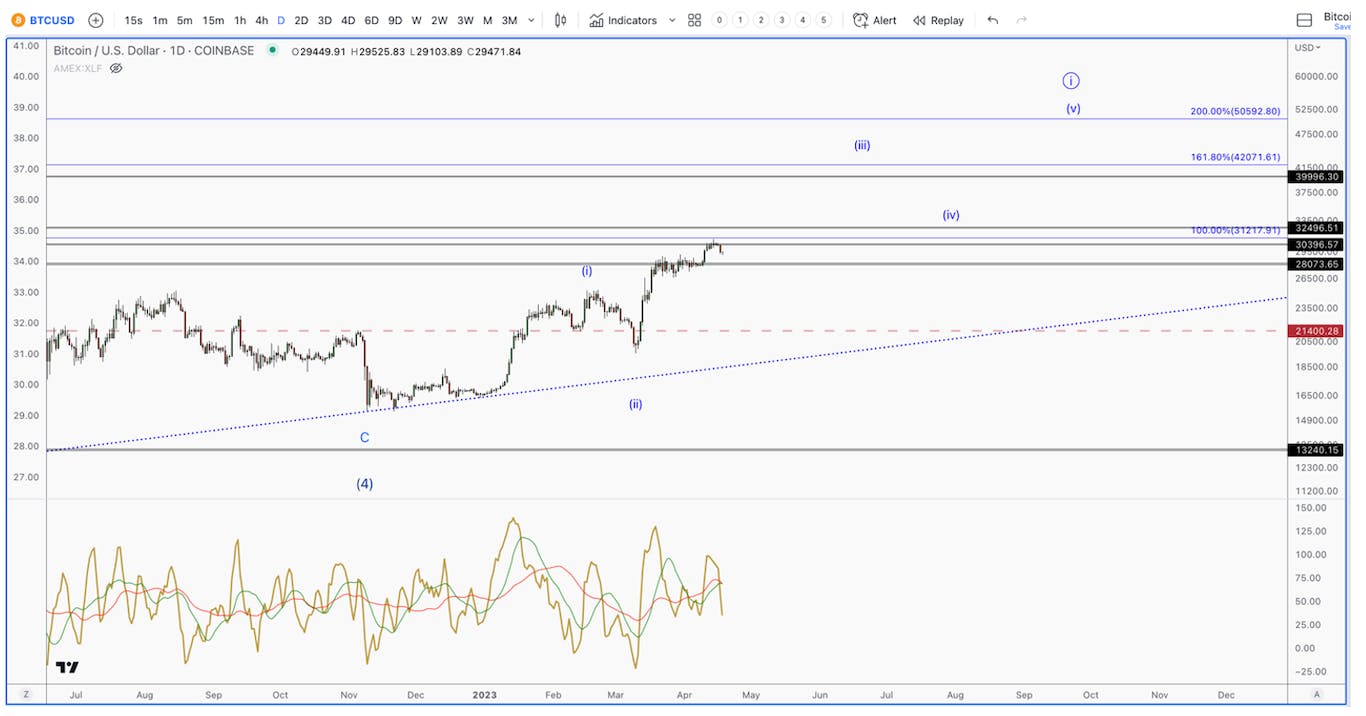
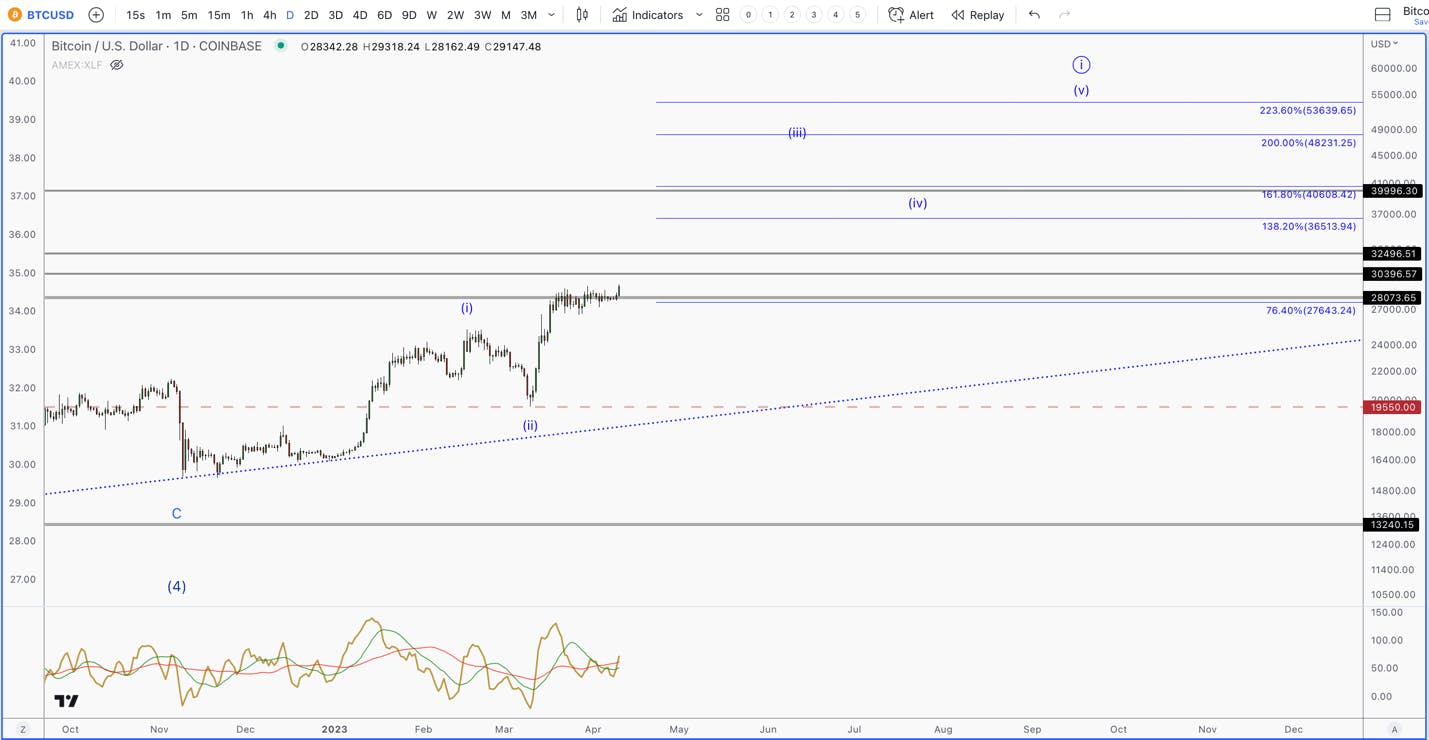
Bitcoin is at a key spot. We need to see escape velocity soon with minimal pullbacks, in order to confirm the bullish count below. I do find it interesting that Bitcoin looks to be in the middle of a move while Big Tech/Semis look to be at the end of a move. Either one is telling the truth or the correlation broke.
Ethereum (ETHUSD)
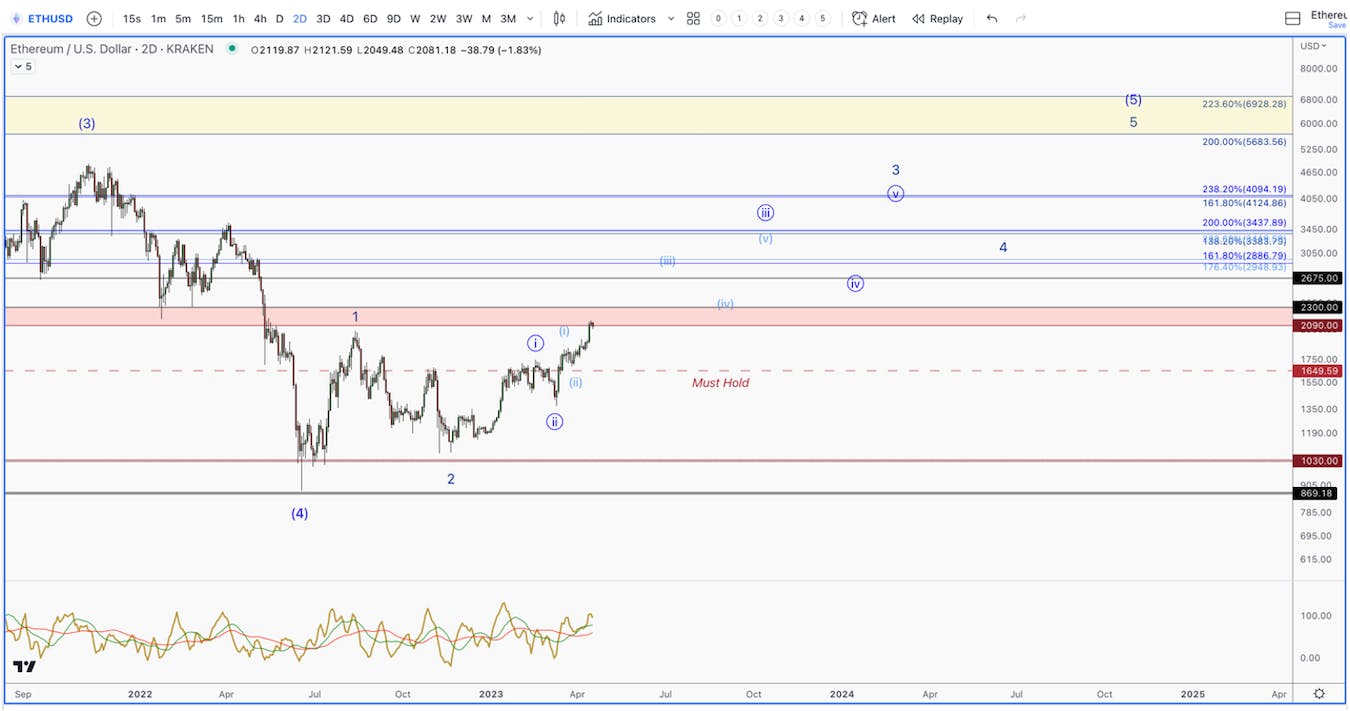
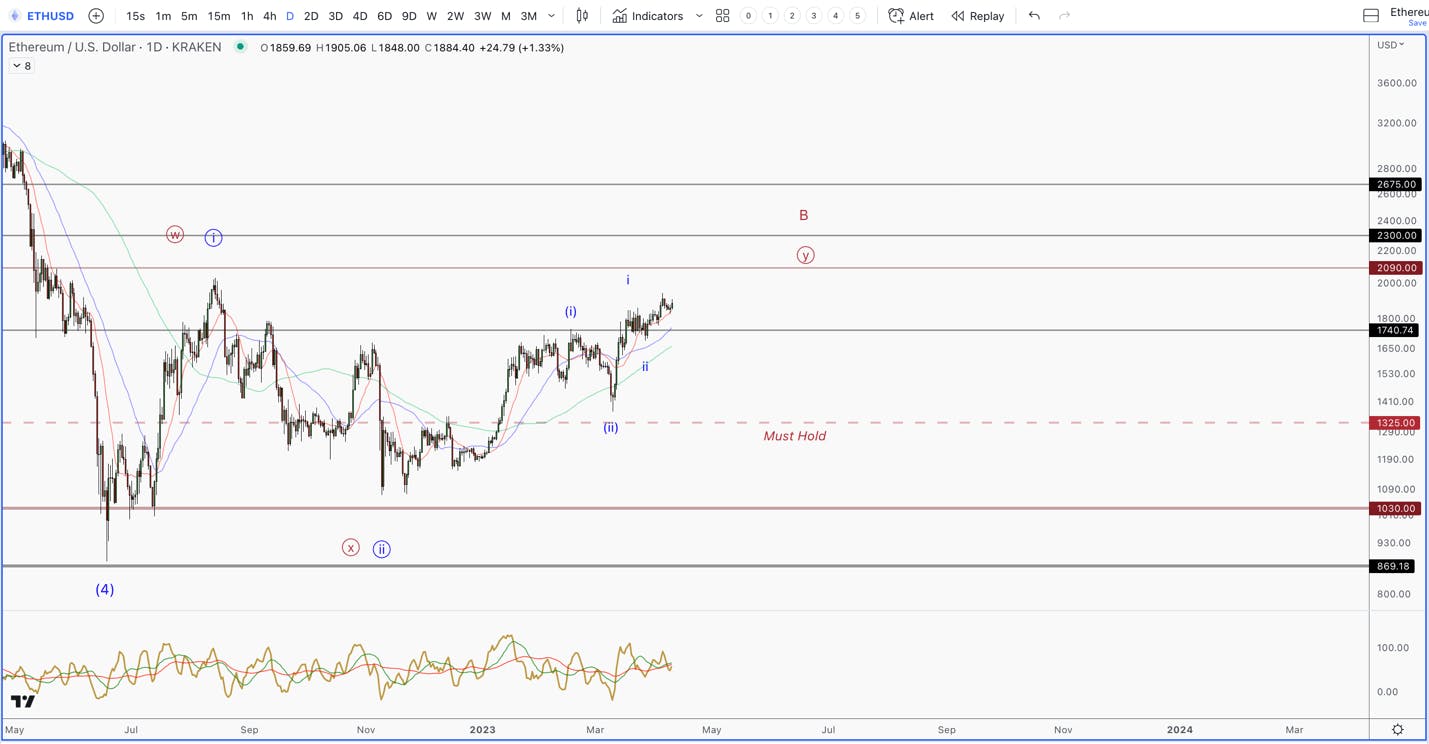
If we can power above $2300, the moonshot count below becomes a much higher probability.
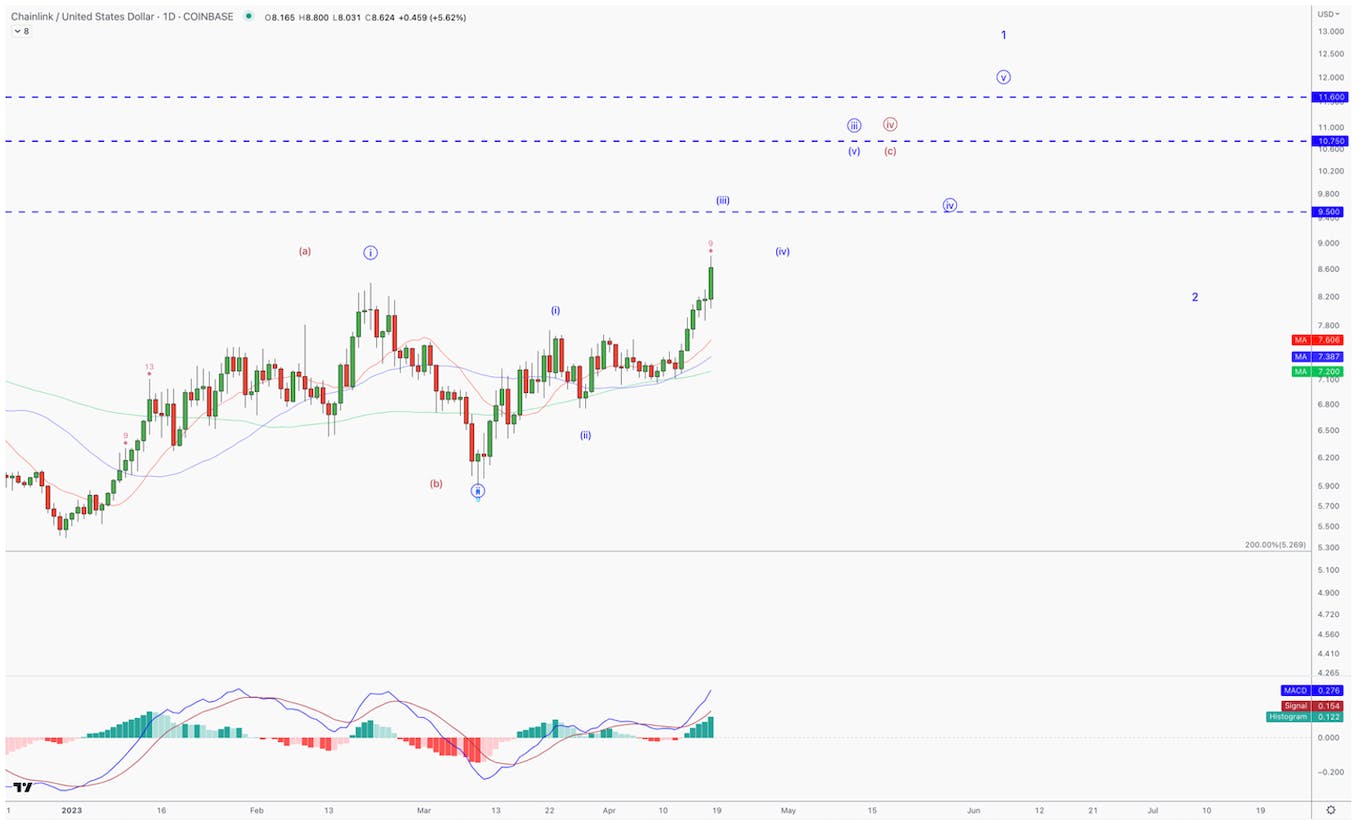
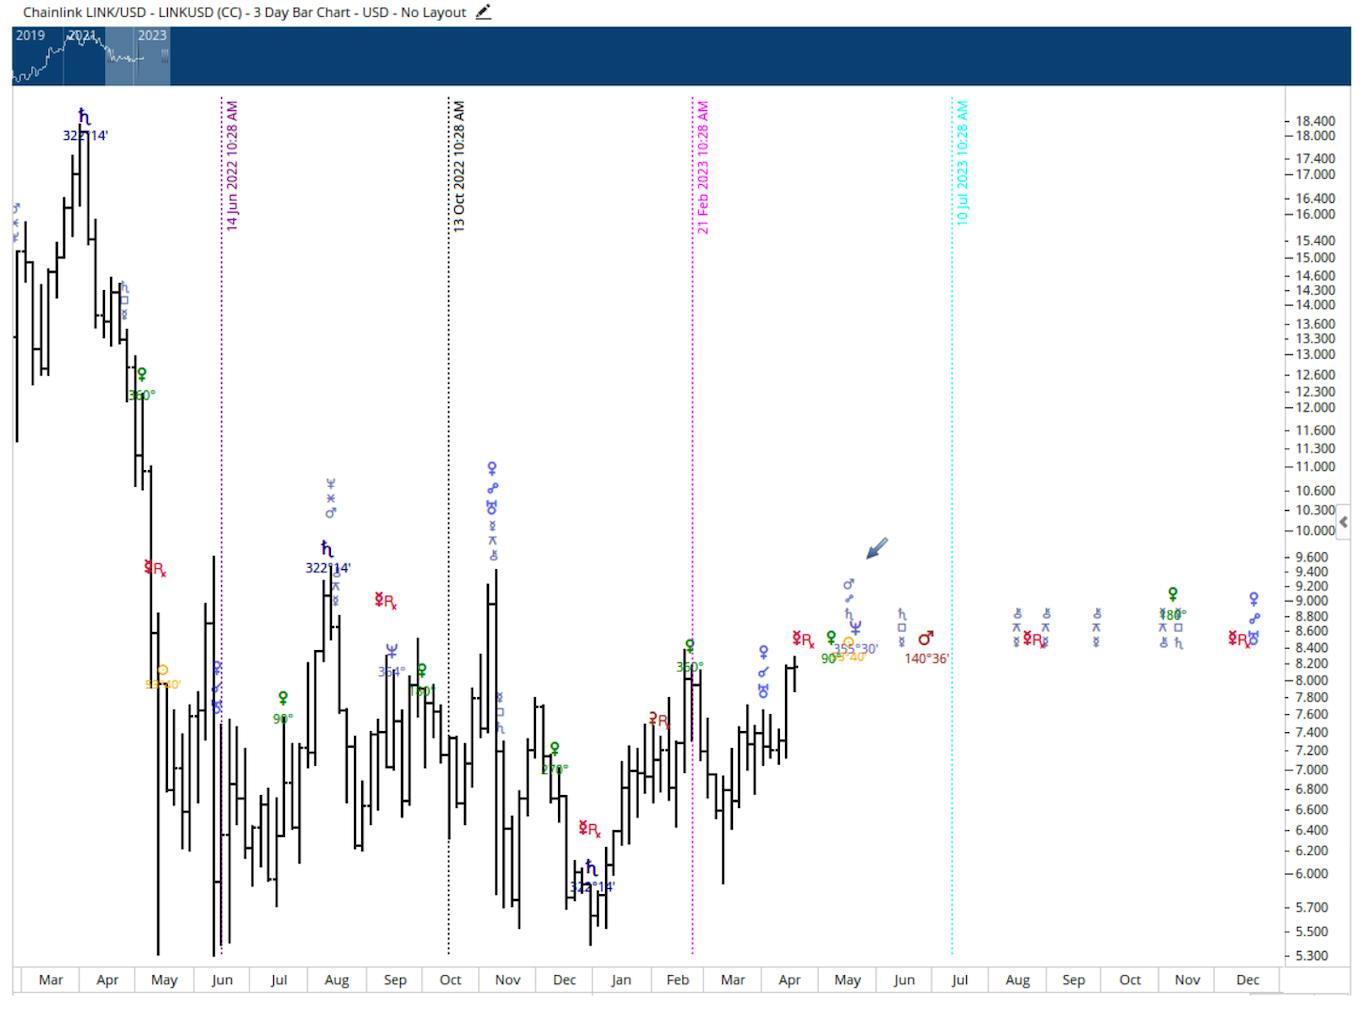
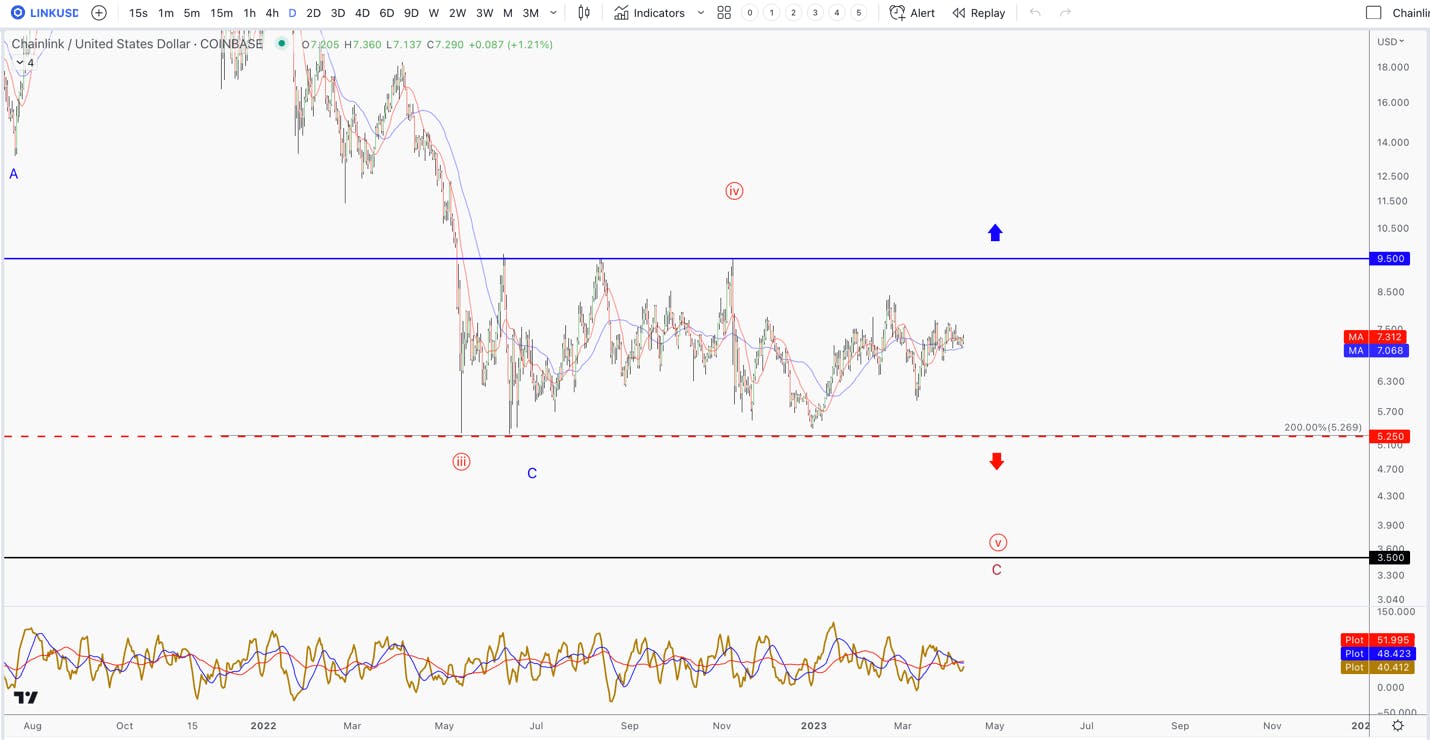
If this is the real thing for LINKUSD, and not a 4thwave fake-out, we need to see a large 5 wave pattern develop. The blue path below is what that would look like. The blue lines overhead are the breakout spots to monitor. If we do break above $11.6 in a 5th wave move, that would be your large 1st wave. You would want to wait for the 2ndwave retrace to get aggressive.
Also, LINK has a big time factor coming up in May 10 – 8.
Netflix’s pivots – which is the password sharing and ad tier – are expected to show up in Q2 for password sharing and then Q3/Q4 for the ad tier whereas previously the goal was to have impact by Q1 and Q2. The initial signs of PW sharing are encouraging. More on this below. The ad tier is too early to have any initial impressions or data to work with, although long-term it will be accretive to margins and should have a positive impact on the top line, as well.
FCF was impressive at $2.17 billion with management raising the FY guidance to $3.5 billion.
Over the past few quarters, Netflix’s after hour price activity can be volatile. I believe this is due to FX headwinds, which are often reported as a miss, but then the market proves to be forgiving of the lower revenue/EPS numbers in favor of constant currency. This is my best guess as it’s been volatile for a few quarters, which leads me to believe machines are trying to catch up to the reported numbers versus constant currency basis. Notably, the stock price regained its losses before the earnings call was released.
The ad tier could see a flurry of headlines next month for the upfront season. The upfront season’s best-case scenario is committed upfront spend for 13 million subscribers, which is a small audience compared to Netflix’s roughly 220 million subscribers. Our plan is to follow price for this stock and to be patient long-term as we are optimistic on the outcome.
The Netflix pre-Earnings report found here has additional information to supplement the post-earnings report below.
Financials:
Netflix missed on revenue and was inline on EPS. FX headwinds create mixed reactions to this particular earnings report, and I suspect the strong cash flow also helped price after hours. Last quarter, a large EPS miss was reported whereas it was due to a FX adjustment.
This quarter, revenue was $8.162 billion or $8.5 billion on a constant currency basis compared to $8.18 billion estimated. This is widely reported as a miss, but on the other hand, the market has been forgiving of FX headwinds with other companies.
The guide was lower than expected at $8.24 billion compared to $8.48 billion expected. The company is pushing out its expectations for the new ad tier to drive top line growth in Q3 whereas the previous expectation is that this would start to show up in Q2. Password sharing will be “broadly” rolled out including in the United States in Q2.
EPS of $2.88 was in line. EPS for next quarter is a miss at $3.06 EPS expected versus $2.84 EPS guided.
The gross margin is 400 bps lower this year at 41.20% with flat gross profit of $3.35 billion compared to $3.5 billion last year. The operating margin of 21% was also lower compared to last year’s 25% OPM yet this met management’s guide for an operating margin of 18% to 20%. Notably, management had stated last quarter that “operating margin to be down YoY due to timing of content spend.” Similar to operating margin, net margin and adjusted EBITDA were lower but within expectations.
In the comments on the forum, you can read from forum members on why margins are the most important line item for Netflix moving forward.
Netflix exceeded on free cash flow at $2.1 billion compared to $3 billion for the full year last year. The company is raising full year guidance on free cash flow to $3.5 billion. The free cash flow margin is more than double from last year at 25.9% compared to 10.19% in the year ago quarter.
Gross debt is still high at $14.5 billion, which is inherent to the business model. However, net debt is improving at 1.1X compared to 1.3X last quarter with net debt of $6.7 billion compared to $8.37 billion last quarter.
Netflix still trails other FAANGs on its investment rating, yet it’s notable the company has seen an upgrade from Moody’s from junk to investment grade. Netflix has been the black sheep of the FAANGs in this regard, however, a large part of our thesis is based on the company’s change in profile in terms of bottom-line strength.
On another positive note, Moody’s stated the following regarding Netflix’s ad tier: “Moody’s anticipates that growth in subscribers from the recently launched ad supported service will be gradual but steady and provide a strong long-term opportunity for revenue growth.”
Key Metrics & Additional Notes:
Password Sharing & Geographic Regions:
Global paid adds of 1.75M came in slightly shy of analyst estimates of 1.8M.
For password sharing, Latin America provides some clues as to how a broader rollout will perform. According to management there was a cancel reaction which later eased. The region reported a loss of net adds of (0.4M) compared to net adds of 1.76M in Latin American last quarter, yet the revenue was up 7% YoY (+13% on constant currency basis).
The company stated that other regions, such as Canada, were “directionally consistent with what we saw in Latin America.”
There was a similar pattern in the United States Canada (UCAN) region where there was low net adds yet higher revenue growth. The region reported 0.1 net additions with revenue up 8% YoY.
In the year ago quarter, these regions were flat or reported a decline. There can also be churn coming out of Q4 for Netflix since that quarter has high net adds.
Another observation is that LatAm and UCAN both had expanding Arm, or average revenue per membership, whereas the other two regions saw a lower Arm. This could be encouraging in terms of a broader rollout on password sharing driving more top line growth in the second half of the year.
UCAN up +9% from $14.91 to $16.18
LatAm up +3% from $8.37 to $8.60
EMEA down (6%) at $10.89 this quarter compared to $11.56 in the year ago quarter
APAC down (13%) at $8.03 this quarter compared to $9.21 a year ago
Notably, average paid membership increased in APAC, which were up 17%. This is clearly a large region but there’s been some attention on India specifically where Netflix has lowered prices. This would make sense to where net adds increased but ARM decreased.
Ad Tier:
Upfront season is coming, which means Netflix will likely have to state the company’s expected scale for the ad tier come Q3/Q4. Right now, the company is not guiding for this but analysts believe it will be in the 13M range.
We covered this in our Essentials Pre-ER write up. Per Forbes/Bloomberg: “After a slow start Netflix ad tier has been gaining traction with U.S. subscribers. After analyzing their internal data, BloombergBloomberg reported in its first two months, Netflix had one million active users. Before its launch, Netflix had projected 1.1 million by year end 2022 increasing to 13.3 million by the third quarter 2023. Industry analysts project Netflix could eventually wind up with 30 million U.S. subscribers on its ad supported tier. The U.S. is one of the 12 markets where Netflix is now selling ads. At its most recent earnings report Netflix had 74 million total U.S. subscribers with 231 million worldwide.”
The company continues to believe the ad tier will be accretive to the bottom line, especially considering the ad tier will monetize better than its basic and standard plans. The ad tier will be $6.99 per month plus ad dollars. With that, management believes there will be “50% or more incremental profit contribution to the business.”
Earnings Call:
According to management on the call, Q2 is the quarter to watch for password sharing.
“Yeah. So that launch we are doing in Q2 is a very broad launch, it includes the United States, includes many, many other countries. I mean, we reserve the right for some countries where we think there’s a different approach. But I would say the bulk of our countries, and certainly, when you think about it from a revenue perspective, the vast majority will be rolling out in Q2.”
The ad tier is expected to be accretive to the company’s margins at 50% or higher.
“Jessica Reif Erlich (moderator)
And then I just wanted to clarify something, Spence, I think you said, this is a 50% margin. I mean, typically, advertising could be as high as 80% or 85% margins. Is that — do you expect to build up to that or do you think it’s really just a 50%-plus business?
Spence Neumann
Well, I put plus in there. So I said at least 50% and it was really just to highlight the fact that we are still in startup mode of this business and so leaning a little conservative. But, yes, our expectations over time is that it would be meaningfully over 50%, but I don’t want to give a specific number yet.”
Conclusion:
The impact from password sharing and the ad tier is later than originally anticipated (Q2 for PW sharing and Q3/Q4 for the ad tier), but it’s not that surprising because these are monumental changes that require time. In this regard, we are happy to be patient. Part of the thesis was the bottom line and the cash flow, and the company has been performing here, as expected.
However, price was already looking stretched and we may trim the position according to technicals. The stock is up about 100% from the June low so the market may be getting antsy to pocket some of the gains from the second half of last year.
When we provide coverage to our readers, our goal is to discuss what is of highest value to an investor group. Although there were many exciting things announced during Nvidia’s GTC conference, one of the topics that AI semiconductor investors should take the time to discuss is the launch of cuLitho as it pertains to extreme ultraviolet (EUV) lithography.
At GTC, Nvidia announced a new cuLitho library to extend support for GPUs into its lithography software products. The future goal of this partnership is to move beyond the advanced 3nm node and to achieve a 2nm or smaller by “pushing the limits of physics” by combining EUV lithography process GPUs and software to employ algorithms that simulate the production process.
Years ago, we discussed Huang’s Law on the I/O Fund Forum. This was around 2020 when the Wall Street Journal published a paywall article entitled: “Huang’s Law is the New Moore’s Law.” The article was also discussed on Mother Jones where it pointed toward Nvidia’s pace of innovation on GPUs exceeding Moore’s Law. In 2018, Jensen Huang stated at GTC that GPUs were “25 times faster than five years ago” whereas Moore’s Law would have resulted in only a ten-fold increase. The more important part of Huang’s Law as it relates to ASML is that Huang stated: “The innovation isn't just about chips — it's about the entire stack."
Particularly, as microchips become smaller, it becomes harder for chip advancement to meet the speed of Moore’s Law. As investors, we felt that Moore’s Law running out of room, so to speak, would narrow the road for the winners. The thoughts we’ve been publishing for many years point toward entering an era of excellence where the most talented teams/competitive designs would forge forward by combining advances in architecture, interconnects, memory and algorithms. However, we have to give a solid nod toward the process in how these chips are made, as well – especially the chips that are surpassing the limitations of Moore’s Law.
To say the semi war is heating up is true, but it’s equally important to understood who the victors will be and why. This is why we’ve dedicated an enormous amount of time to writing about Nvidia’s A100 and H100 GPUs (27 articles in 4+ years!), and AMD’s Zen architecture. For ASML, we want to dig deeper into the tools and processes that power the market-leading foundries that are producing advanced semiconductors.
What is EUV and DUV Lithography:
Note: I’ve bolded the main points for easier reading.
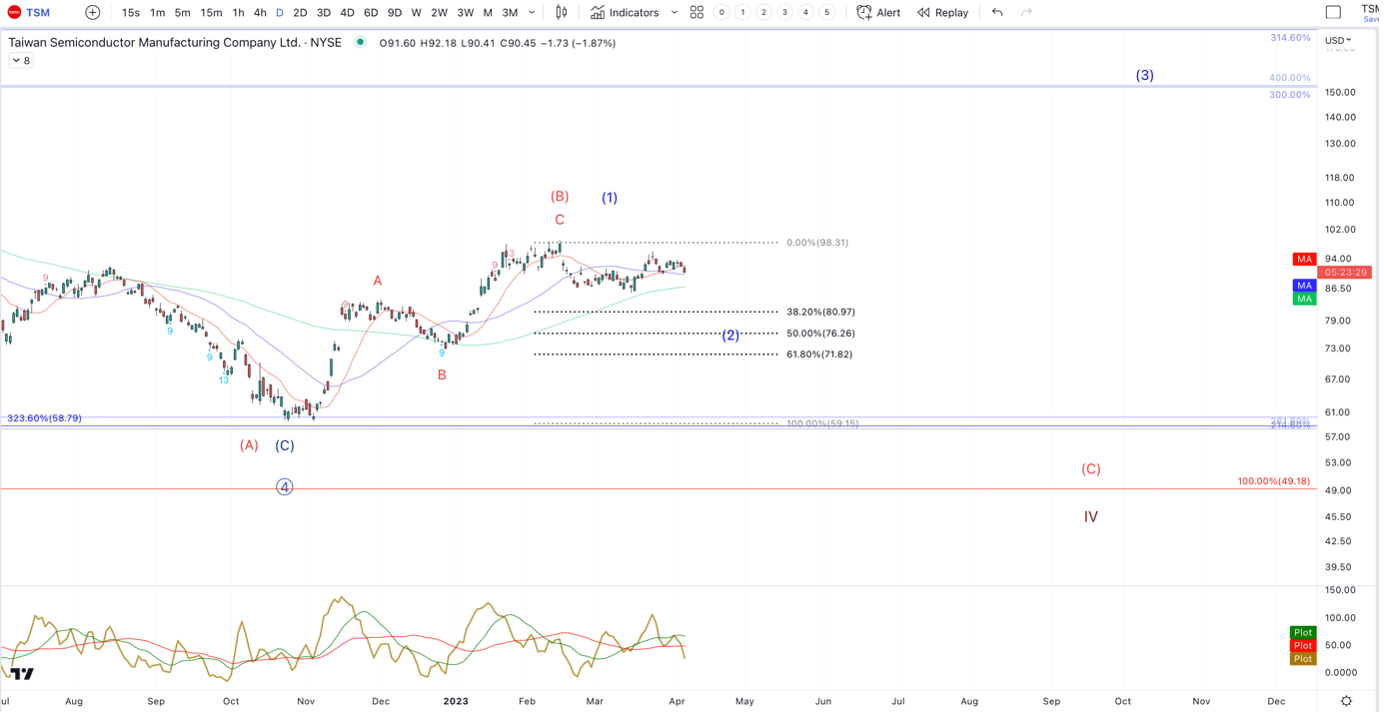
Taiwan Semiconductor is the global leader in manufacturing advanced nodes, which are defined as those less than 10nm. Currently, TSM is producing a 3 nm chip compared to competitors who are delayed at the 7nm size. Powering TSM’s ability to shrink node size are ASML’s EUV lithography machines. We use words such as “A100 Ampere” or “H100 Hopper” or “Genoa,” “Milan,” “Bergamo” for AMD – but helping to drive the robust demand for these designs is the advanced node, or nanometer size.
Extreme ultraviolet lithography builds on ASML’s success with DUV lithography, or deep ultraviolet lithography. The word lithography means to “write on stones.” In the semiconductor industry, lithography uses a light-sensitive polymer or “photoresist” to write patterns on silicon wafers. Light is projected through the blueprint of the pattern that is printed. When the pattern is encoded in light, the system’s optics shrink and focus the pattern onto a photosensitive silicon wafer. After the pattern is printed, the system moves the wafer and makes another copy. Lithography creates the formation of 3D images on the substrate for the transfer of the pattern to the substrate (or the base of the silicon wafer). For each circuit, the lithography and pattern transfer are repeated anywhere from 10 to 30 times.
In simple terms, each silicon wafer has dozens of thin layers that make up billions of transistors. These layers are printed with lithography – which are extremely precise rays of light projected through a mask of the chip design. When light hits the surface, it prints the miniscule designs. Keep in mind, Apple has 10 billion transistors in each iPhone.
EUV is a new process that is needed for more advanced nodes, whereas DUV has been powering semiconductor fabs for decades. Deep ultraviolet lithography uses a 254 to 193 nm light whereas EUV uses a 13.5 nm light. This is 14X shorter than DUV lithography. As the wavelength of the light source becomes very narrow, fabs can produce chips with smaller features. Hence, the smaller nodes that TSM produces (3nm, 5nm).
EUV lithography machines are only produced by ASML as the process of creating EUV light is very complexvery complex. Outside of ASML’s machines, EUV only exists in outer space.
Per the company, “in our laser-produced plasma (LPP) source, molten tin droplets of around 25 microns in diameter are ejected from a generator at 70 meters per second. As they fall, the droplets are hit first by a low-intensity laser pulse that flattens them into a pancake shape. Then a more powerful laser pulse vaporizes the flattened droplet to create a plasma that emits EUV light. To produce enough light to manufacture microchips, this process is repeated 50,000 times every second.”
According to TSMC, “the aim is so precise that it’s like shining a laser from the moon to hit a coin from the earththe aim is so precise that it’s like shining a laser from the moon to hit a coin from the earth.”
Mirrors are an important component to how ASML achieves precision “down to the atom.”
ASML is partnered with a company called ZEISS for high-precision lenses and mirrors. The numerical aperture (NA) measures how much light the lens system can collect and focus. This is important because ASML is creating a machine called High-NA that will increase the numerical aperture from 0.33 to 0.55. High-NA is especially important at the advanced node level of 3nm or smaller. TSM is expected to have High-NA machines by 2024.
EUV lithography uses mirrors instead of lenses. According to ASML, these mirrors are the flattest surface on earth with smoothness that is less than one atom thick.
Production:
EUV machines produce 3,000 wafers per day, and there can be hundreds of chips on a 300-millimeter wafter, and up to 10 billion transistors per chip. The machines cost $200 million and are expected to reach an average sales price of $300 million in the future. Due to this cost, ASML has very few customers albeit large customers. TSMC makes up 40% of ASML’s revenue. Intel and Samsung are the second and third largest customers.
ASML’s Customers
ASML supplies fabrication plants, which produce semiconductor chips for design companies. Due to the cost of the machines and complexity of the process, ASML has exactly five customers. A few of the biggest fabs in the world are ASML customers: TSMC, Intel and Samsung. The other two are memory suppliers, Micron and SK Hynix.
ASML is capable of producing around 50 units of EUV equipment per year with a lead time of one year to six months. This is leading to a strong pipeline for both EUV and the next-gen High-NA lithography equipment. The company is expected to grow production capacity to 60 billion units in 2023. Management has stated (quite clearly) that average sales price (ASPs) will increase over time, for example, what was a $200 million machine will eventually cost $300 million.
Here is the production capacity ASML is expecting:
“[We have] plans of 600 DUV (deep ultraviolet), 90 EUV systems by 2025-2026 and 20 EUV High-NA systems by 2027-2028.”
TSMC:
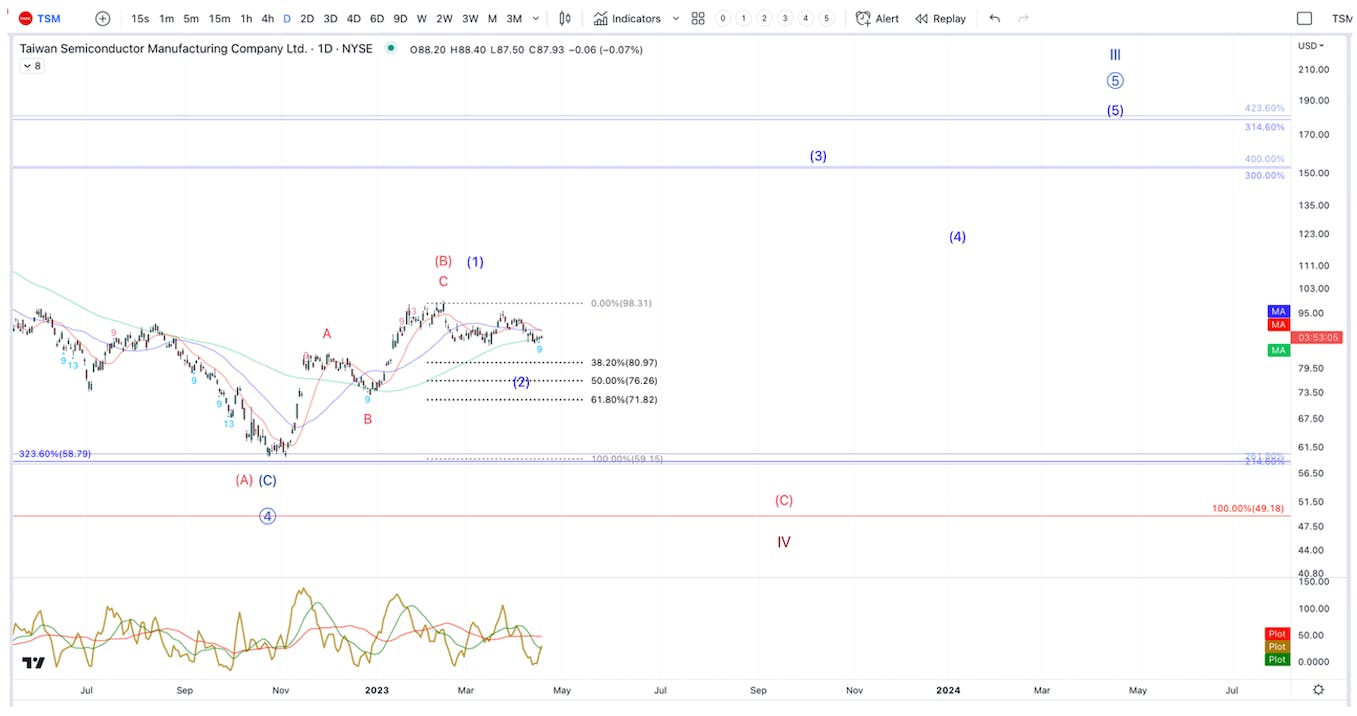
We own TSMC stock but we’ve also been clear there is geopolitical risk to weigh. Taiwan operates in grey area where it has its own constitution and democratically-elected leaders, yet Beijing considers Taiwan as its territory. The island hosts the world’s most important foundry for advanced node semiconductors, and China is seeking a “reunification” with Taiwan. Meanwhile the United States is at odds with China by supporting TSMC in building two chip plants worth $40 billion in Arizona.
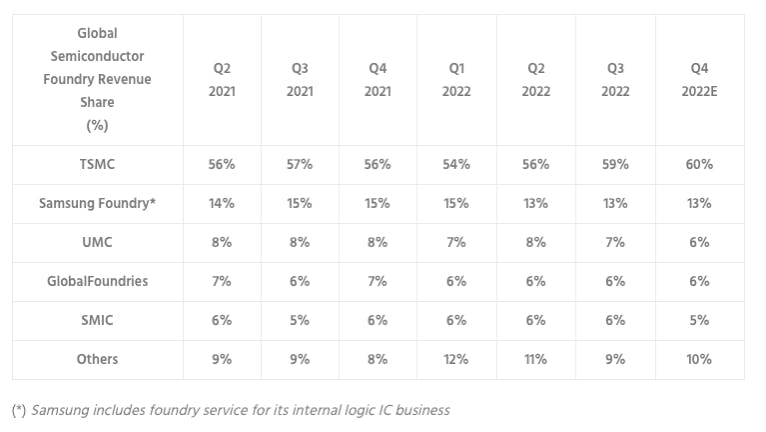
Taiwan Semiconductor, or TSMC, is ASML’s largest customer making up 40% of sales. In terms of advanced nodes, 90% are produced by TSMC. Customers include Apple, Qualcomm, Nvidia and AMD. Per the chart below, TSMC owns 60% of the foundry market.
TSMC is able to supply advanced nodes at high volume — such as 7nm or smaller — due to ASML’s EUV lithography technology. TSMC plans to introduce High-NA technology from ASML for the first time in 2024 to produce 1.8 nm chips.
Samsung:
Samsung is the world’s second largest foundry. According to BusinessKorea, Samsung ordered 18 of ASML’s 55 EUV machines in 2022. The company is investing over $4 trillion in EUV lithography equipment. Samsung has roughly half the EUV machines that TSMC has.
Samsung produces memory chips, plus GPUs for Nvidia, CPUs for IBM, smartphone processors for Qualcomm, and is also working with Baidu on AI chips for its cloud data centers. In 2021, the company used EUV technology to mass produce a 14 nm double data rate (DDR5) memory chip. This was the smallest chip to be produced in the memory industry. This memory chip is capable of powering AI/ML applications. The DDR5 chip increases wafer productivity, lowers power consumption, and doubles data processing speeds. At the time, a third-party analyst stated DDR5 would account for 41% of the world’s global DRAM market, up from 0.1% in 2021.
Micron and SK Hynix compete with Samsung on memory chips and are also ASML customers.
Intel:
Intel is building two fabrication plants worth a combined $20 billion, located in Ohio and Arizona. In 2022, Intel placed its first order for an advanced chipmaking tool “worth more than $340 million.” The Q4 2021 results indicated a customer had ordered five EUV lithography machines plus one order for the High-NA machine, due in 2025. This order was generally understood to be Intel, per the Reuters report.
Side note: I’ve had fun throwing shade on Intel on this site from a design perspective, however, I would not write Intel off as a foundry on American soil.
Computational Lithography & cuLitho Announcement at GTC:
The need for accuracy increases with smaller nodes. Computational lithography can help by optimizing the scanner, masks and processes. Rather than only relying on the design, AI lithography improves the process by using algorithmic models of the manufacturing process. ASML is able to produce a replica of the desired chip patterns on the wafer, which helps to meet the accuracy required for nanoscale chips.
At GTC, Nvidia announced a partnership with ASML and TSMC to launch a library called “cuLITHO.” The goal of cuLitho is to use software to optimize the lithography process. There will be increasing demand pressure on ASML to produce their coveted machines into the foreseeable future. cuLitho allows computational lithography to improve the process to make the most of each machine.
Each device requires a mask set of photomasks that mask the architect of the design to physical features. The cost of a mask set is becoming very expensive. For example, a 10 nm requires about 76 individual photomasks and this number increases as the chip gets smaller. According to SemiAnalysis, “at 90 nm to 45 nm, mask sets cost on the order of hundreds of thousands of dollars. At 28nm it moves beyond $1M. With 7nm, the cost increases beyond $10M, and now, as we cross the 3nm barrier, mask sets will begin to push into the $40M range.”
cuLitho offers what’s called inverse lithography to speed up the photomask process and drive down costs. By using software and algorithms, photomasks that took two weeks to process can be generated overnight. This will be especially important as designs move from 3nm to the 1.8nm. For Nvidia, the goal is to sell more GPUs as the need for lithography increases. The company advertises that 500 Nvidia Hopper GPUs that run CuLitho can do the work of 40,0000 CPUs.
For ASML, the company is dependent on CPUs and can now start to support GPUs. ASML has stated computational lithography is especially important for the High-NA EUV lithography due for production at TSMC in 2024 and at Intel in 2025.
TSMC’s motivation is to stay at the cutting edge as a foundry and to drive down costs by moving the expensive operations from CPUs to GPUs.
According to Nvidia’s Advanced Technology Group VP Vivek Singh: “If a silicon foundry has three data centers, it'll need 100 data centers by the end of this decade if the trend of the last 15 years continues – that's not feasible. And what about power? 45 megawatts might be okay, but 45 gigawatts? Something's gotta give."
By moving the patterning, lithography process to GPUs, companies can make 3-5X more photomasks using 9X less power.
Geopolitical Export Controls
ASML is not allowed to sell EUV technology to China. This began in 2018 when ASML signed a Chinese customer for its EUV lithography machines. The Trump Administration worked with the Dutch government to block the sale and to enforce export controls. The Dutch government did not renew ASML’s export license, which effectively stopped the sale. Rumors are that the customer was SMIC, China’s biggest chip-making foundry.
The export controls on ASML have continued under Biden by requiring “advanced computing semiconductors or related manufacturing equipment” to apply for a license if they want to export to China.
Financials and Q4 Earnings Call:
ASML’s earnings are this week. We don’t own the stock yet so those we do own have a higher priority – “i.e., bird in hand.” In addition to this, TSM is reportedly lowering its capex right now. Therefore, ASML’s timing for entry may be a bit better in H2.
Revenue:
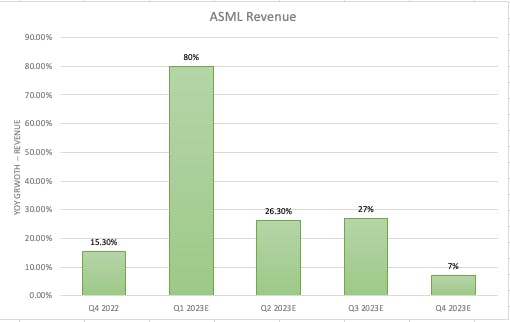
Revenue can be lumpy for ASML. The company is expected to report revenue growth of 80% in the upcoming quarter for a total of $7.08 billion, up from 15.30% last quarter.
The next two quarters – June and September – are expected to be at 26.3% and 27% revenue growth. This will be $7.09 billion and $7.25 billion, respectively.
Pictured Above: ASML has lumpy revenue (but a strong backlog alleviates this concern)
Annual revenue is expected to track at 25% for FY2023 and 13.40% for FY2024.
There was negative revenue in the September 2022 quarter. This happens because ASML must source many parts to deliver one machine. The company is especially susceptible to supply chain issues. However, the company has a lot of visibility due to the backlog (see below) and a quarter of lumpiness is not a big concern to the longer-term story.
Earnings:
Earnings have been trending up nicely for ASML. Quarterly EPS was in the $2.00 range in 2021 and is now in the $3.00 to $4.00 EPS range. This bottom-line growth trend is expected to continue into the foreseeable future, hitting $5.00 Quarterly EPS in 2023 and up to $8.00 EPS by 2025.
Margins:
Gross Margin in the 50% range. This can be affected if ASML impacted by the Deep UV mix effect versus higher margins from EUV.
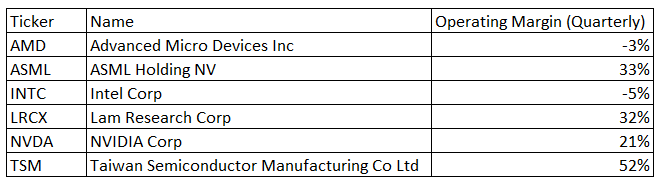
Operating Margin in the 33% range. R&D Spending is around 15% of sales and this has been consistent.
Net margin of 29% leaving net income at $1.94 billion. Net profit has been consistent and the company has been buying back shares.
Cash and Buybacks:
Free cash flow for the year 2022 was €7.2 billion or $7.56 billion. The company had announced a new share buyback program in November 2022 to be executed by December 31, 2025, for an amount of €12 billion.
The company had cash and investments of €7.4 billion or $7.91 billion and debt of €4.57 billion at the end of the December quarter.
Key Metrics:
Backlog:
Backlog is a key metric for ASML. At the end of 2022, ASML grew backlog by 67% for a total of $40.4 billion Euro, or $43 billion USD.
Net bookings were $6.3 billion Euro, which was $3.4 billion EUV and $2.9 billion Non-EUV. Logic drove 66% of bookings and memory 34% of bookings.
Product Mix:
The company shipped 54 EUV systems in FY2022, up from 40 systems.
Per the earnings call, the product mix for EUV bookings is about 75% logic and 25% memory.
DUV systems grew 13% to $7.7 billion Euro
Revenue mix is as follows:
Logic System Revenue contributes $10 billion and grew at a rate of 4%
Memory System Revenue contributes $5.5 billion and grew at a rate of 34%
Installed Base Revenue contributes $5.7 billion and grew at a rate of 16%.
Earnings Call:
Comments on Strong Backlog:
“We've experienced several quarters of very strong bookings, which now provides backlog coverage significantly beyond 2023, which is almost twice the expected 2023 system sales. Based on discussions with our customers and continued improvements in the capability of our supply chain, we are planning to increase our output capability this year. We're planning to ship around 60 EUV systems and around 375 deep UV systems in 2023, with around 25% of the deep UV systems to be immersion. We still plan a significant number of fast shipments this year, which under the current way of working will result in a similar amount of delayed revenue out of 2023 that came into 2023.”
Comments on Expected Growth of Product Mix and ASPs:
“And for the people that weren't really carefully listening, what that really means in terms of ASP for EUV, we talked about it before. Originally, we were looking at €160 million. We've then been talking about €165 million to recognize also increased functionality, I think, with the increases on ASP on the inflation. I think it's good to go somewhere between €165 million and €170 million. I think that's, on average, I think, the right way to go.”
There was a second comment on the call about revenue growth:
“Also presented during our Investor Day last November, we see an opportunity based on different market scenarios to reach an annual revenue in 2025 between €30 billion and €40 billion and in 2030, an annual revenue between €44 billion and €60 billion.”
More on the Demand and Backlog:
“Having said that, of course, last year, we kept informing you that the demand on us significantly exceeded our build capacity, sometimes to 40%, 50% […] I think — and that gives us a lot of visibility into 2024 also. Customers give us orders throughout the year, very significant levels of orders, which actually have over €40 billion in the backlog, which is almost twice the system sales that we expect to have in 2023.”
Quick Note on TSMC Capex:
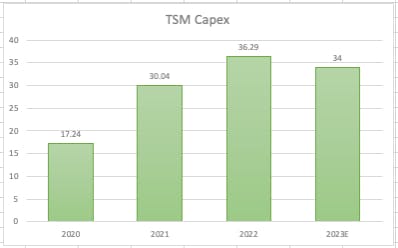
We are on the eve of ASML’s earnings report and TSMC will officially report the next day. There has been a pre-announcement which we covered here. However, per a Barron’s report, TSMC may be lowering its capex. Right now, 2023E for capex is for $32 to $36 billion, or $34 billion at the midpoint.
Pictured above: Management guidance for 2023 is $32B to $36B, representing a YoY decline of 6.3% at the mid-point
Per an article behind Barron’s paywall, one analyst is expecting TSM to further reduce its capex in the upcoming earnings report. We will see what happens and plan an entry into ASML accordingly. Although ASML serves other foundries, it’s likely TSM has to participate for renewed stock price action as it contributes 40% of revenue.
Conclusion:
The main takeaway is that the future of chips will be powered by ASML’s full monopoly on EUV lithography machines and there is no competitor at this moment (literally not one competitor). With a deep and undeniable moat, the restraint on stock price, if you will, is that production capacity is limited as ASML can only produce a certain number of machines every year.
We feel it’s best to buy this stock when we see capex increase across leading foundries. Right now, we are seeing some indication foundries are going to reduce their capex in the near term, yet this AI semiconductor train is headed in only one direction, which is up. Some finesse on entry now will pay off, coupled with strong due diligence on the entries we are seeking.
ASML’s estimates are likely based on capex estimates. If the AI war heats up, ASML may be able to charge higher ASPs, while doubling its bottom line. Overall, ASML offers lower risk than most tech stocks while serving overwhelming demand. Should we continue to see demand dry up in other tech verticals, ASML’s rare, bottlenecked backlog will stand out in the current macro environment.
Below, we discuss what our premium members need to know going into Q1 earnings in regards to these make-or-break data points.
1. Is Tesla on track to meet their 1.8m unit 2023 production target?
2. Impact of January and April price reductions on overall ASP? Will ASP stay above $47k?
3. Impact of recent lower raw material costs?
4. Automotive gross margins – will they reach Tesla’s guidance of greater than 20%?
5. Earnings relative to consensus expectations
6. Any potential benefit from the Inflation Reduction Act corporate tax credits?
7. Inventory and Cash Flow
8. What is the technical analysis now telling us?
Key conclusion – Based on our analysis, there are reasons to be optimistic that Tesla’s stated goal of gross automotive margins, excluding leases and credits, of greater than 20% are attainable. If so, the market will react positively to the news.
1. Production target
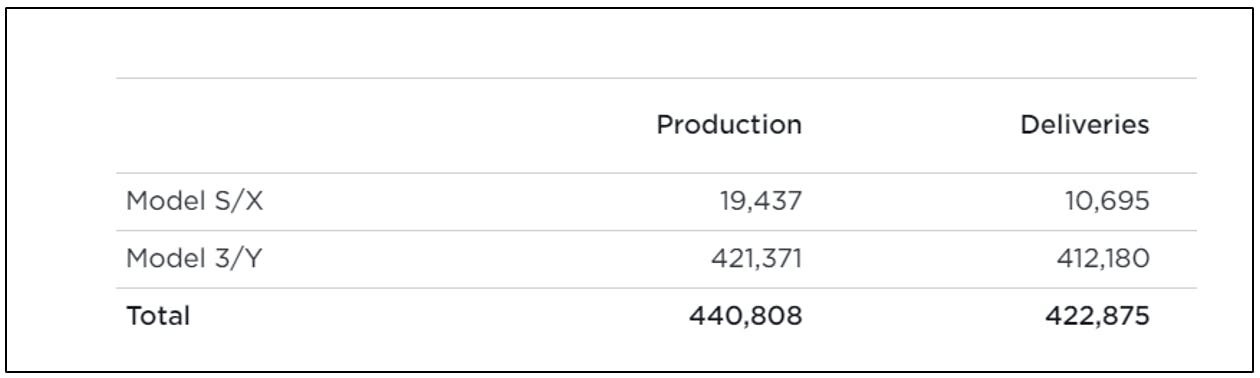
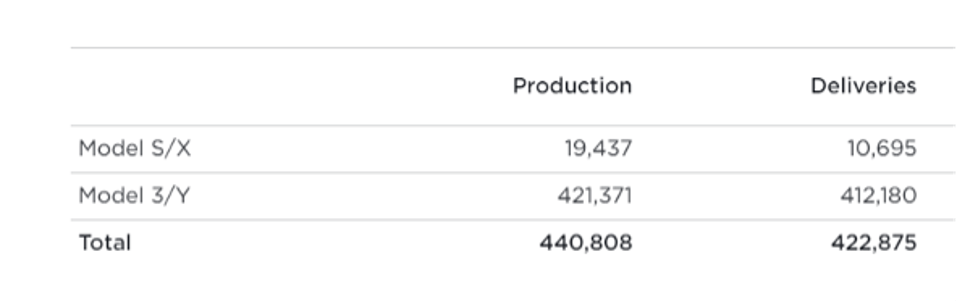
Tesla has a production target of 1.8m car units in 2023, which would be an average of 450,000 per quarter. On April 3, 2023, Tesla released their q123 production and deliveries. Although the 440,808 units is slightly below the quarterly average, it was in-line with market expectations and on track to meet 2023 goal.
We will look for updates to quarterly production and/or any changes to the 1.8m units 2023 target.
2. Impact of price cuts on overall ASP
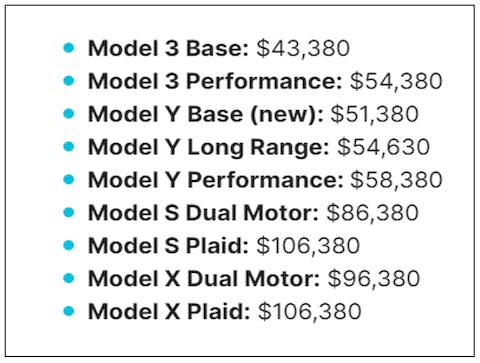
After announcing price cuts in January so that certain models would qualify for the EV tax credit. Tesla announced further price reductions before the Easter holiday. These were smaller than in the January. The April reductions were as follows
Model 3 by $1,000
Model Y by $2,000
Model S & Y range from between $5,000 to $10,000
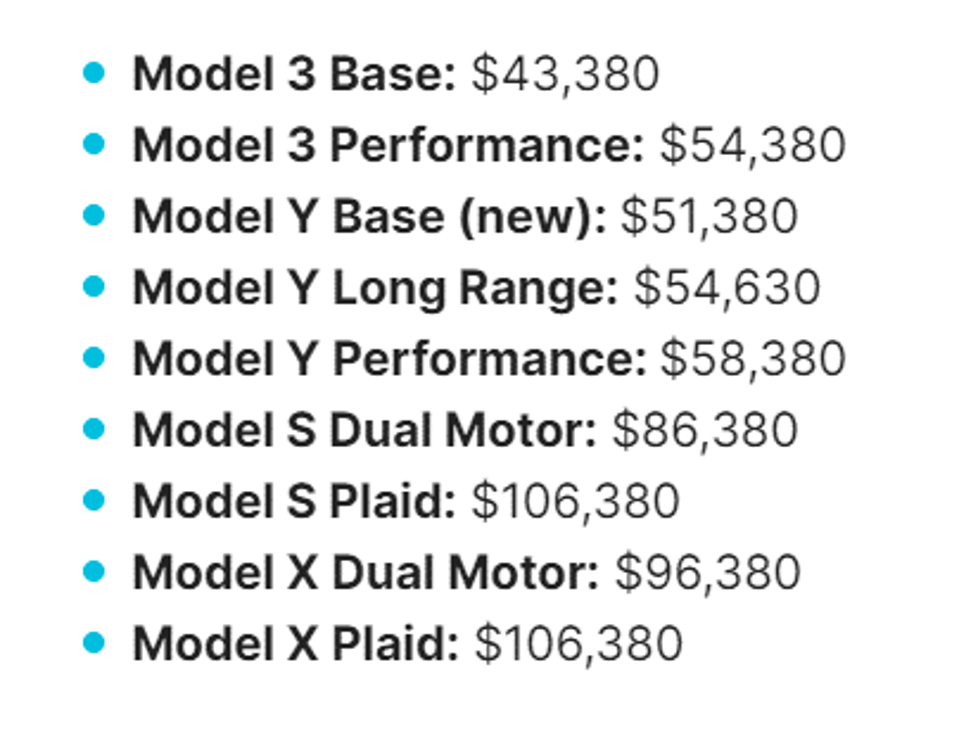
Models 3 and Y comprise the vast majority of overall production and the price cuts were fairly modest. After the announced price reductions, this is the estimated starting price levels as of 4/10/23 by cars.com
After the January price reductions, Tesla stated that they expect ASP across all models to be above $47,000. Following the recent April price reductions, we will listen to management commentary if they reiterate this $47,000 ASP target.
3. Impact of lower raw materials
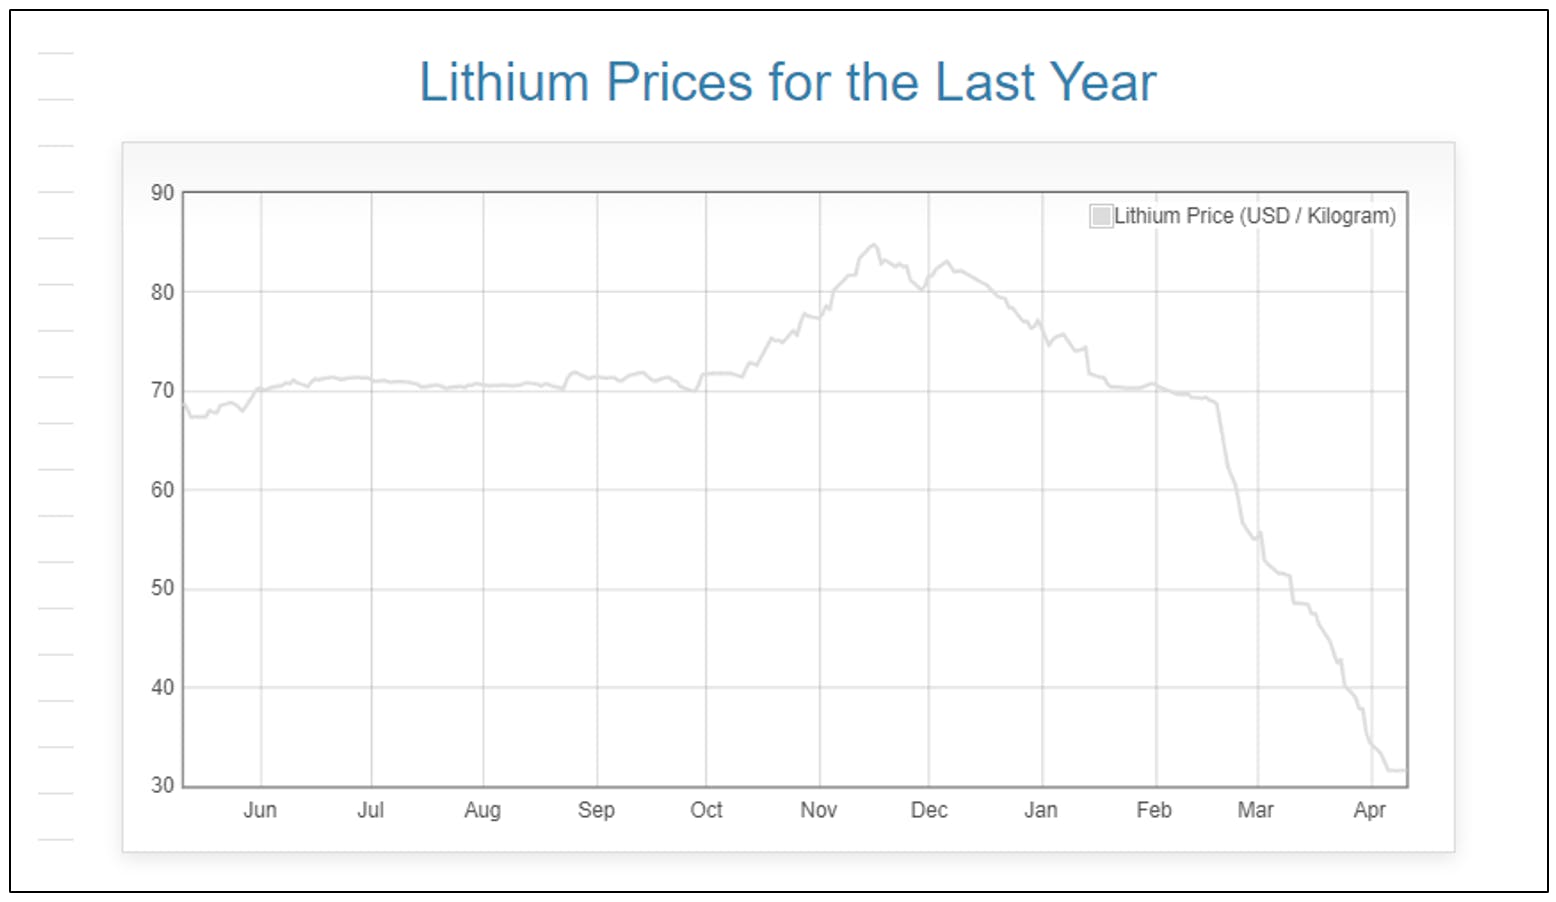
Two important raw materials costs – lithium used in batteries and aluminum used in car frames – have declined in 2023. Both are potential positive tailwinds going forward. According to Daily Metal Price, on a USD/Kilogram basis, lithium is down over 60% ytd. China stopped cash subsidies for EV purchases which had led to an oversupply. Tesla’s last commentary on raw material costs was before lithium’s rapid price decline that started in February.
Rather than Investor’s Day, what is more important for Tesla are two key data points in the upcoming earnings report.
In February, our firm stated:
“The stakes are high for Tesla because if the margins remain healthy, the stock will do quite well. However, if the margins contract, then the bears will be in control. This is a big moment for Tesla, as high average sales price has been a contentious issue for meeting its addressable market. Wall Street will want to see it's possible to do both — serve a wider total addressable market (TAM) with more affordable prices while maintaining a healthy bottom line.”
Automotive gross margins will be the key focus for the earnings call. There are two different metrics. Automotive gross margins, excluding leases and credits, and reported automotive gross margins that are released with earnings. We estimate that the former ended q422 at about 18%. Typically, this margin is discussed during the earnings question and answer. It is the margin we will focus on in our analysis. It goes without saying that any improvement will be reflected in the reported automotive gross margins which ended q422 at 25.9%.
Two key drivers of automotive gross margins, excluding leases and credits, are ASP and COGS per vehicle. In the q422 conference call this is how Tesla guided future automotive gross margins. They stated ASP will be above $47k and gross automotive margins above 20%.
Question:“The next question from investors is, after recent price cuts, analyst released expectations that Tesla automotive gross margin, excluding leasing and credits, will drop below 20% and average selling price around $47,000 across all models. Where do you see average selling price and gross margins after the price cuts?
Zachary Kirkhorn, CFO
So there is certainly a lot of uncertainty about how the year will unfold, but I'll share what's in our current forecast for a moment. So based upon these metrics here, we believe that we'll be above both of the metrics that are stated in the question, so 20% automotive gross margin, excluding leases and rent credits and then $47,000 ASP across all models.I'll share what's in our current forecast for a moment. So based upon these metrics here, we believe that we'll be above both of the metrics that are stated in the question, so 20% automotive gross margin, excluding leases and rent credits and then $47,000 ASP across all models.
There was a follow-up if cogs could go back down to $36,000. This exchange provided further insight.
Question:Excellent. Zach, actually, I'd like to follow up on the data point you just gave on cost. If I look back at the COGS per car, you guys bottom close to $36,000 in the middle of 2021. And then the number went up as you had to face with inflation in input costs and the ramp of Berlin and Texas. And this quarter, I think we are close to $40,000 and we peaked maybe close to $42,000 at some point last year.then the number went up as you had to face with inflation in input costs and the ramp of Berlin and Texas. And this quarter, I think we are close to $40,000 and we peaked maybe close to $42,000 at some point last year.
And so my question from here is, how much time do you think it takes you to get back to this kind of $36,000, which would mean Berlin and Texas and those input costs, all that stuff is normalizing, is that like — and that would be like a kind of like a 10% decline in the COGS per car? Is that something we can hope to see this year or is that too optimistic?
Zachary Kirkhorn, CFO
On the raw materials and inflation side, where lithium is the large driver there and this was a meaningful source of cost increase for us, we'll have to see where lithium prices go. And we're not fully exposed to lithium prices, but I think in general, is what we've seen from our forecast here, cost per car of lithium in 2023 will be higher than 2022. So that's a headwind that would have to be overcome to return back to those levels. So, I don't think we'll get there this year, but I think we'll make progress. And we'll continue to find ways to offset these raw material costs that we don't have control over. [Indiscernible] is there anything on that?lithium is the large driver there and this was a meaningful source of cost increase for us, we'll have to see where lithium prices go. And we're not fully exposed to lithium prices, but I think in general, is what we've seen from our forecast here, cost per car of lithium in 2023 will be higher than 2022. So that's a headwind that would have to be overcome to return back to those levels. So, I don't think we'll get there this year, but I think we'll make progress. And we'll continue to find ways to offset these raw material costs that we don't have control over. [Indiscernible] is there anything on that?
The key takeaway is that Tesla’s “current forecast at the moment” and “our forecast here, cost per car of lithium in 2023 will higher than 2022” comments were made before the March declines in lithium and aluminum and April price reductions. At the time, lithium was trading $70/kg, currently it is almost $30/kg. “current forecast at the moment” and “our forecast here, cost per car of lithium in 2023 will higher than 2022” comments weremade before the March declines in lithium and aluminum and April price reductions. At the time, lithium was trading $70/kg, currently it is almost $30/kg.
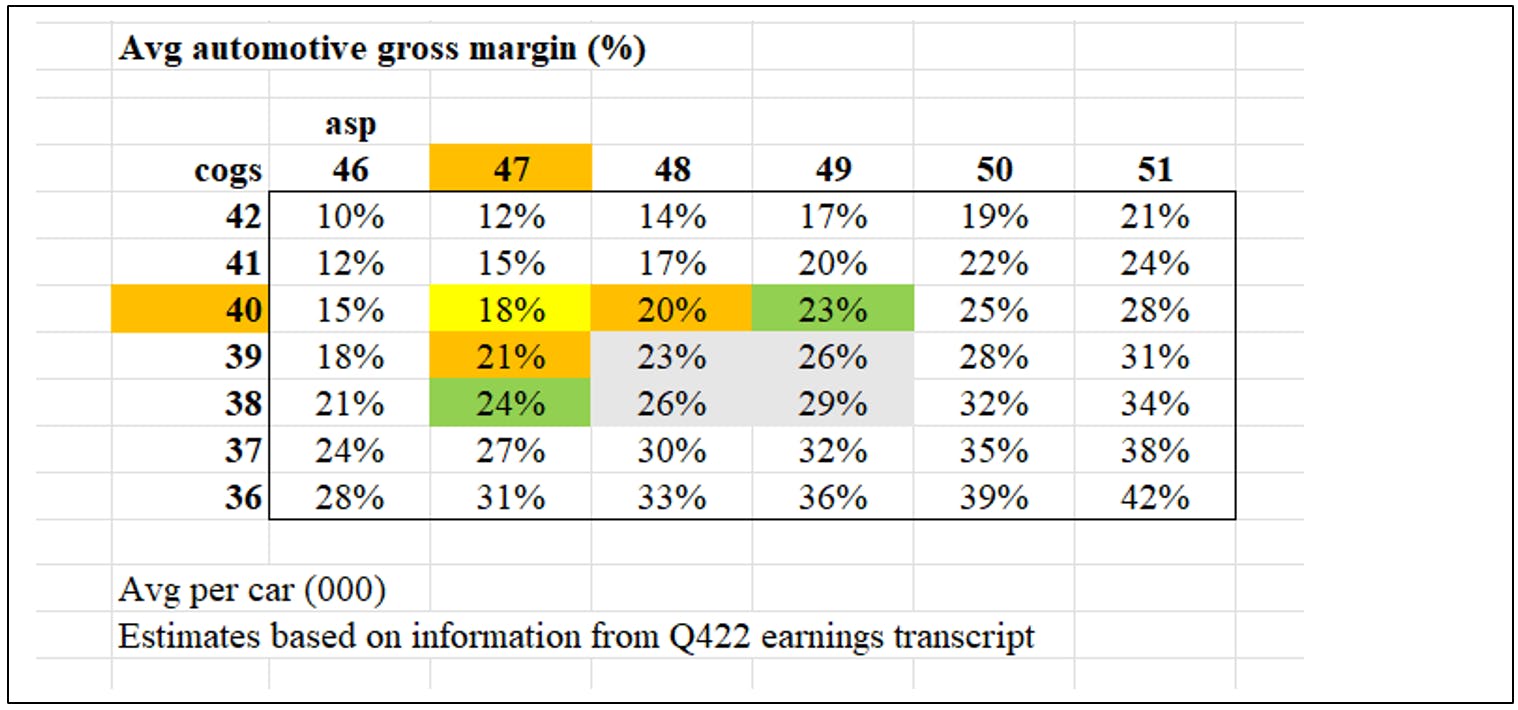
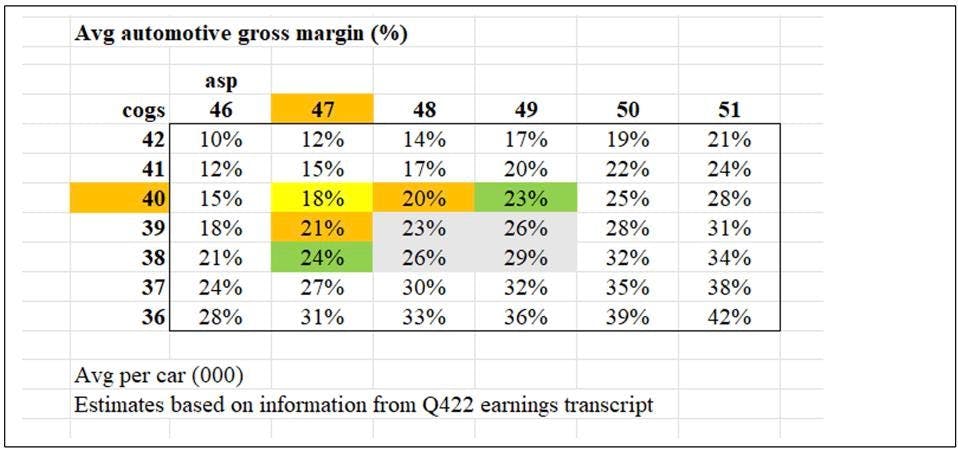
Based on this information, we put together a simple sensitivity analysis between average ASPs and COGS to determine a range of potential automotive gross margins, excluding leases and credits.
Based on the information given in the q4 call, we estimate that margins ended q422 at 18% (yellow, 47,000-40,000/40,000). At the time, Tesla guided for ASPs greater than $47,000 and margins of greater than 20% (orange highlights) and was assuming higher lithium prices in 2023. Hence, in our prior analysis, we assumed that COGS per car would remain constant at around $40k and that higher ASP would be the key driver behind margins above 20%. For example, an ASP of $48k and $49K results in 20% and 23% margins with COGS steady at $40k.
However, given the recent weakness in lithium and aluminum after the q4 call. There is the potential that Tesla’s margins may benefit even if the ASP remains at $47k. For example, if ASP remain at $47k and COG go down to $39k and $38k, margins improve to 21% and 24%, respectively. For reference, the recent low in COGS was $36k.
The ideal scenario is if ASP increased (i.e. $48k) and COGS decreased (i.e. $39k). In this case, the automotive margin will be 23% (gray box)
Put another way, Tesla potentially now has two levers in can pull to increase automotive gross margins – Pricing and lower COGS per car. Now either one or both can contribute to automotive gross margins above 20%. This will remove short-term uncertainty and importantly earn the management credibility.
Perhaps the modest April price reductions in the Model 3 and Y are a reflection of management’s confidence in increasing gross margins on the back of lower raw materials costs.
It is important to point out that given timing differences, this COGS improvement may not be seen until after Q1. There is typically a lag from changes in input costs to when it’s reflected in their financial reporting. This is how Tesla described the timing effect in the q4 call.
Roshan Thomas, VP of Supply Chain
“.. on the non-cells raw material, we begin to capture benefits of indexes tapering out, but due to the length of various supply chains, it does take time before this is reflected in our financials. And while alumina is down like 20% year-over-year, steel is about 30% down year-over-year, the global non-cells raw materials market continues to be influenced by geopolitical situations in Europe, high production cost due to labor cost increases and energy spikes and disruptions due to natural disasters like typhoon in Korea four months ago, pandemic lockdowns.
So, we believe that meaningful price corrections will ultimately come, but it remains uncertain exactly when. In the meantime, we continue to redesign supply chain to make it more efficient and work with our supplier partners to find more efficiencies, streamline logistics and transportation to reduce costs.”
If the potential raw material benefit is not yet reflected in the Q1 financials. To the extent Tesla discusses the potential lower COGS benefit on future automotive margins, the stock will react positively.
Recent comments by Wall Street Tesla analysts
Wolfe Research analyst Rod Lache said this past week that Tesla lowered prices of the Model 3 by $1,000, Model Y by $2,000, and the S and X by $5,000. Notably, these announcements came after Tesla confirmed that U.S. consumers will remain eligible for $7,500 U.S. government purchase credits for most of the Model 3/Y lineup, the analyst tells investors in a research note. While the price cuts in the U.S. may raise questions about vehicle demand, there is "significant cost reduction ahead" for Tesla, the analyst tells investors in a research note. The firm says new investments in Tesla Energy are likely underappreciated by investors.
Deutsche Bank analyst Emmanuel Rosner maintained a Buy rating and $250 price target on Tesla after the Q1 deliveries of 422.9K units were slightly better than consensus. For the rest of 2023, the firm is maintaining its 1.78M unit forecast of 20.6% automotive margins and has confidence that Tesla will deliver on cost and operating efficiencies with its next generation platform, helping deepen its competitive moat.
Earnings expectations
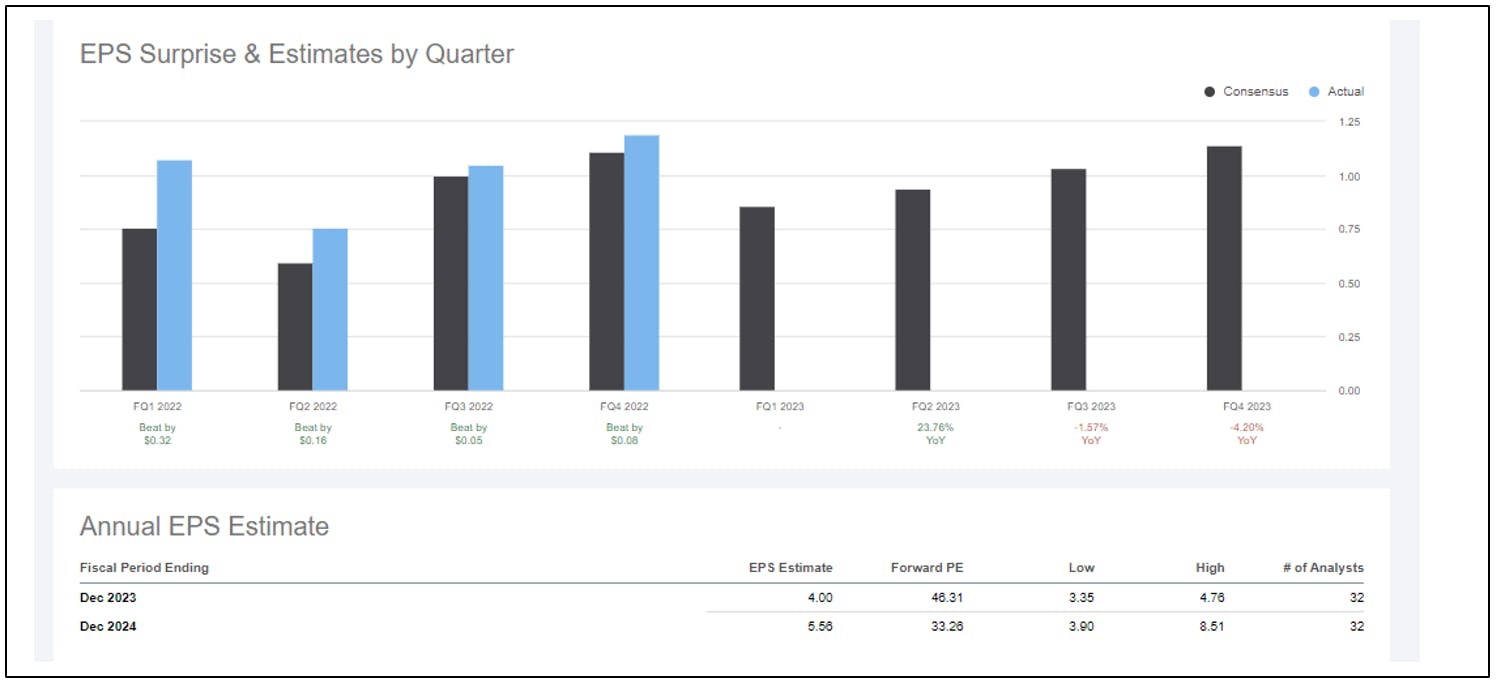
In 2022, Tesla exceeded consensus expectation in each quarter. The reported eps (light blue bar) exceeded consensus (black bar). Going into Q123, consensus have been revising their estimates downward. Currently, consensus is forecasting $0.86 for q123 with a gradual increase over the next 3 quarters.
Given the recent earnings revisions trends despite lower raw materials costs, expectations are fairly muted. Taking into Tesla’s record of beating earnings expectations, we are optimistic that their streak will continue.
Tesla’s 20% gross automotive margin guidance was based on much higher lithium prices. To the extent that Tesla gives any indications that the recent raw material tailwind is sustainable through the rest of the year, consensus will likely have to raise their q2 to q4 earnings estimates.
Cash Flow and Inventory
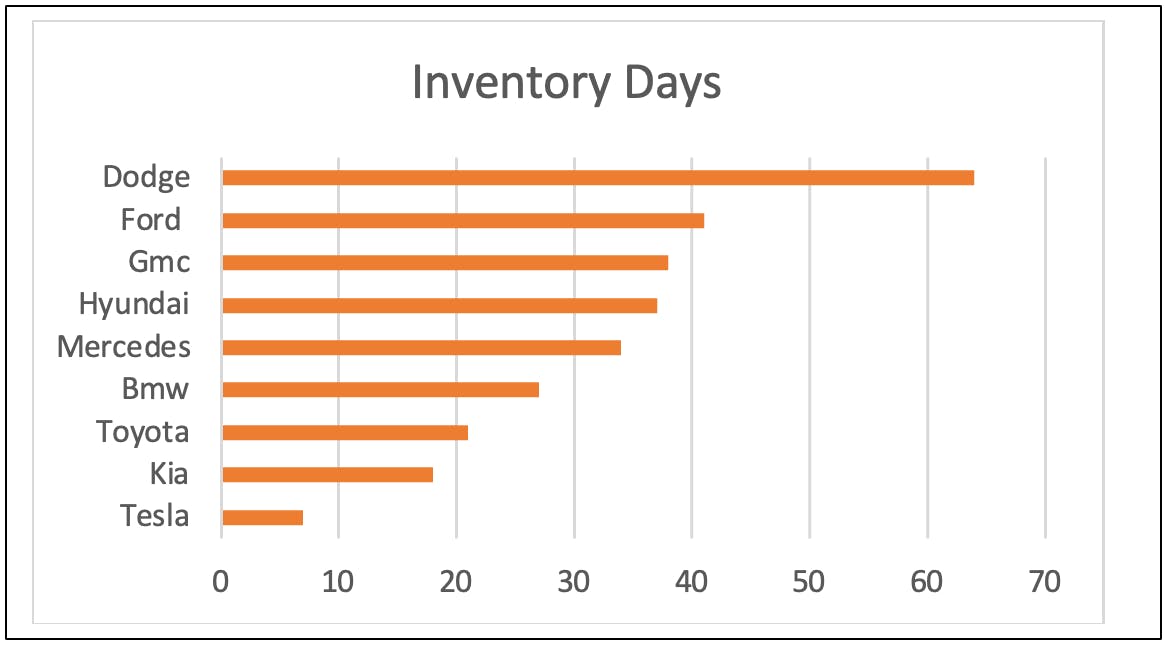
We will be looking for improvements in FCF that were impacted by an increase in inventory build and a $4.4B purchase in marketable securities. Despite the increase in q4, Tesla’s inventory levels are still much lower than its peers.
Impact of Inflation Reduction ACT (IRA) via Consumer and Corporate tax credit
We recently wrote about the IRA, its key provisions and the potential beneficiaries here. We focused mainly on the corporate tax credit available to corporations. As we discussed, clean energy companies with domestic based manufacturing capacity are the best positioned. Companies that qualify can deduct these tax credits from their costs of sales which has a direct impact on gross margins and earnings per share.
As of now, Tesla has not given any indications if any of their domestic manufacturing qualifies and if they are eligible to collect any of these corporate tax credits. For example, does Tesla’s US energy storage and solar business qualify. To the extent they do provide any financial guidance, this will lead to a re-rating of the stock as it’s not reflected in earnings estimates.
At the moment, Tesla is indirectly benefiting from IRA tax credits that consumers can claim by buying electric vehicles. It is why Tesla enacted the January price reductions so that their cars would qualify for the $7,500 IRA consumer tax credit. Tesla’s models 3 and Y will benefit from higher sales volumes.
How I/O Fund Plans to Manage our Tesla Position:
From a technical perspective, Tesla has bottomed out post the investor day. It appears to be setting up for a fresh high before seeing a bigger pullback on the horizon. Tesla is trading in line with tech equites, so it can be affected by deteriorating macro forces, if this happens, we could see $92 as the next likely target for a major low. As long as we hold $137, this scenario can be avoided.
We could see one more swing high into late April. We do not see this as a buying opportunity. The $231-$235 region will be very strong resistance, which will occur on lower momentum. If this happens, we will look for the following pullback to add.
If instead, we continue to drop from here, as long as any pullback holds the $137 level, we can continue to see the uptrend develop throughout 2023. Below that level, and the odds will start to favor a retest of the low, and likely beyond. In this case, we would stop out, and look for a more favorable entry.
This article was originally published on Forbes on Forbes Forbes on Apr 14, 2023,06:45am EDT
Two months ago, we wrote that after realizing gains of 31%, it was time to take a time out on Tesla at the $208.31 price when our firm stated: “Right now, our technical analysis is at odds with our fundamental analysis, which is often good news, as it means we will be afforded a lower entry on a stock position we plan to build.”
This analysis proved accurate as the stock topped around the time our last article was written and is trading at $180 today. Price action is key, yet what’s most important from our last article is that we clearly laid out the hurdle that is in front of Tesla – a hurdle that the Investor Day could not clear – as evidenced by a lower price following the action-packed annual event.
Rather than Investor Day, what is more important for Tesla are two key data points in the upcoming earnings report. In February, our firm stated:
“The stakes are high for Tesla because if the margins remain healthy, the stock will do quite well. However, if the margins contract, then the bears will be in control. This is a big moment for Tesla, as high average sales price has been a contentious issue for meeting its addressable market. Wall Street will want to see it's possible to do both —- serve a wider total addressable market (TAM) with more affordable prices while maintaining a healthy bottom line.”
Automotive gross margins will be the key focus for the earnings call. There are two different metrics. Automotive gross margins, excluding leases and credits, and reported Automotive gross margins that are released with earnings.
Below, we discuss what Tesla stock investors (and spectators) need to know going into Q1 Earnings in regards to these make-or-break data points.
Sign up for I/O Fund's free newsletter with gains of up to 221% – Click hereClick hereClick here
Production target:
Tesla has a production target of 1.8m car units in 2023 and average of 450,000 per quarter. On April 3, 2023, Tesla released their q123 production and deliveries. Although the 440,808 units is slightly below the quarterly average, it was in line with market expectations and on track to meet 2023 goal.
Source: I/O FUND
We will look for indications that quarterly production will increase, if its 2nd half weighted and whether the 1.8m target is attainable.
Impact of price cuts on overall ASP:
After announcing price cuts in January, Tesla announced price reductions before the Easter holiday. The April reductions were smaller than the January ones that were implemented so that certain models would qualify for the EV car tax credit. The April reductions were as follows
Model 3 by $1,000
Model Y by $2,000
Model S & Y range from between $5,000 to $10,000
Models 3 and Y comprise the vast majority of overall production. After the announced price reductions, this is the estimated starting price levels as of 4/10/23 by cars.com.
After the January price reductions, Tesla stated that they expect ASP across all models to be above $47,000. After the April price reductions, we will monitor if Tesla reiterates this ASP target.
The I/O Fund has launched a new$99/year Premium Newsletter called "Essentials" — this newsletter delivers premium samples for our readers who want more actionable analysis for their tech portfolios. This month, we released a stock pick that we believe will be a leader in 2023 plus a video with the buy plan.$99/year Premium Newsletter $99/year Premium Newsletter called "Essentials" — this newsletter delivers premium samples for our readers who want more actionable analysis for their tech portfolios. This month, we released a stock pick that we believe will be a leader in 2023 plus a video with the buy planbuy plan.
Automotive Gross Margins
Automotive gross margins will be the key focus for the earnings call. There are two different metrics. Automotive gross margins, excluding leases and credits, and reported Automotive gross margins that are released with earnings. The former ended q422 at about 18% and is typically discussed during the earnings question and answer. It is the margin we will focus on. Any improvement will be reflected in the reported Automotive gross margins which ended q422 at 25.9%.
The key to Automotive gross margins, excluding leases and credits, are ASPS and COGS per vehicle. In the q422 conference call this is how Tesla guided future automotive gross margins. They stated ASPS will be above $47k and automotive margins above 20%.
Question
“The next question from investors is, after recent price cuts, analyst released expectations that Tesla automotive gross margin, excluding leasing and credits, will drop below 20% and average selling price around $47,000 across all models. Where do you see average selling price and gross margins after the price cuts?Tesla automotive gross margin, excluding leasing and credits, will drop below 20% and average selling price around $47,000 across all models. Where do you see average selling price and gross margins after the price cuts?
Zachary Kirkhorn, CFO
So there is certainly a lot of uncertainty about how the year will unfold, but I'll share what's in our current forecast for a moment. So based upon these metrics here, we believe that we'll be above both of the metrics that are stated in the question, so 20% automotive gross margin, excluding leases and rent credits and then $47,000 ASP across all models.we believe that we'll be above both of the metrics that are stated in the question, so 20% automotive gross margin, excluding leases and rent credits and then $47,000 ASP across all models.
There was a follow-up if cogs could go back down to $36,000. This exchange provided further insight.
Excellent. Zach, actually, I'd like to follow up on the data point you just gave on cost. If I look back at the COGS per car, you guys bottom close to $36,000 in the middle of 2021. And then the number went up as you had to face with inflation in input costs and the ramp of Berlin and Texas. And this quarter, I think we are close to $40,000 and we peaked maybe close to $42,000 at some point last year.
Based on this information, we put together a simple sensitivity analysis between average ASPs and COGs to determine a range of potential automotive gross margins. We estimate that margins ended q422 at 18% (yellow). Tesla has guided for ASPs greater than $47,000 and margins of greater than 20% (orange highlights). In our prior analysis, we assumed that COGs per car would remain at $40k and that higher ASP would result in margins above 20%. For example, an ASP of $48k and $49K result in 20% and 23% margins with COGS steady at $40k.
Source: I/O FUND
However, given the recent weakness in Lithium and Aluminum after the q4 call. There is the potential that Tesla’s margins may benefit even if ASPs remain at $47k. For example, if ASPS remain at 47k and COG go down to $39k and $38k, margins improve to 21% and 24%, respectively. For reference, the recent low in COGS was $36k. Given timing differences, this COGS improvement may not be seen until after Q1. If it’s not seen in Q1, to the extent Tesla discusses the potential lower COGS benefit on automotive margins, the stock will react positively.
Put another way, Tesla potentially now has two levers in can pull to increase automotive gross margins – Pricing and lower COGs per car. Either one or both can contribute to higher automotive gross margins. The result will be the same in that a gross automotive above 20% will remove short-term uncertainty.
How I/O Fund Plans to Manage our Tesla Position:
From a technical perspective, Tesla has bottomed out post Investor Day. It appears to be setting up for a fresh high before seeing a bigger pullback on the horizon. Tesla is trading in line with tech equites, so it can be affected by deteriorating macro forces, if this happens, we could see $92 as the next likely target for a major low. As long as we hold $137, this scenario can be avoided.
We could see one more swing high into late April. We do not see this as a buying opportunity. The $231-$235 region will be very strong resistance, which will occur on lower momentum. If this happens, we will look for the following pullback to add.
We have a buy level in mind, which we share with our premium research members. We believe this buy level will set us up for gains in Tesla stock in 2023. We provide in depth macro and individual stock analysis so that readers can better understand why we buy/sell. In this market, we frequently take gains. We also issue real-time trade alerts when we enter and exit stocks. YTD, our firm has held the two top performing assets in the tech industry – Nvidia and Bitcoin — at high allocations. You can learn more here.
Source: I/O FUND
Please note: The I/O Fund conducts research and draws conclusions for the Fund’s positions. We then share that information with our readers. This is not a guarantee of a stock’s performance. Please consult your personal financial advisor before buying any stock in the companies mentioned in this analysis.
We are expecting the company to confirm a rebound in the second half of the year. Even though 2023 will be a challenging year, the company will continue to grow faster than the industry. The company’s CEO, C.C. Wei, mentioned in the Q4 earnings call, “For the full year of 2023, we forecast the semiconductor market, excluding memory, to decline approximately 4%, while foundry industry is forecast to decline 3%. For TSMC, supported by our strong technology leadership and differentiation, we will continue to expand our customer product portfolio and increase our addressable market and we expect 2023 to be a slight growth year for TSMC in U.S. dollar terms.”
We like TSM as it has developed market leadership in the foundry industry, particularly with advanced nodes, which are nodes defined as 7nm and below. The advanced nodes have strong demand by top design companies, such as Apple and Nvidia, particularly in high-performance computing and smartphones. The company should also benefit from the recent generative AI trend and help withstand any slowdown in the macroeconomy.
Please note: Tensions with China are outside the scope of a fundamental analysis. It’s important to acknowledge that TSMC’s $40B Arizona plant will increase tensions, we prefer to use technical analysis to gauge sentiment around this issue as it’s impossible to predict China’s reaction. We include the price levels we are watching below.
What we are watching:
H2 rebound confirmation. In the earnings call, C.C. Wei said, “We forecast the semiconductor cycle to bottom sometimes in first half 2023 and to see a healthy recovery in second half this year. In the second half of 2023, we expect our revenue to increase over the same period last year in U.S. dollar terms.”semiconductor cycle to bottom sometimes in first half 2023 and to see a healthy recovery in second half this year. In the second half of 2023, we expect our revenue to increase over the same period last year in U.S. dollar terms.”
The June quarter is expected to report $16.5 billion and the September quarter is expected to report $19.8 billion. This QoQ growth is important to watch and for the analyst estimates to hold here, particularly, for the H2 rebound.
The management mentioned in the last earnings call that N7 and N6 chips demand outlook was weaker than expected due to end-market weakness in smartphone and PCs.
The management updates on 3nm chips. The company expects sizable N3 revenue contribution to start in Q3 and contribute to single-digit percentage to the wafer revenue for the year 2023.
The margins will be lower in 2023, as the management mentioned in the last earnings call. “We have just guided our first quarter gross margin to be 54.5% at the midpoint mainly due to a lower capacity utilization rate as customers further adjust their inventory levels and a less favorable foreign exchange rate. In 2023, our gross margin faces challenges from lower capacity utilization due to semiconductor cyclicality, the ramp-up of entry, overseas fab expansion and inflationary cost.” We will look in the call for more insights. The company has leading margins, so it is not a major concern.
Financials
The company reported the March monthly numbers on April 10th. March revenue declined by (15.4%) YoY to NT$145.4 billion. The consolidated Q1 2023 revenue grew by 3.6% YoY to NT$508.63 billion. In US dollar terms, the Q1 2023 revenue comes to approximately $16.74 billion by using the average exchange rate of 1 US dollar to 30.39 NT dollars. (Please note that the company’s official exchange rate could vary slightly). The revenue declined (4.7%) YoY and came at the lower end of the management guidance. We will look for more details when the company reports its results on April 20th.
The weakness in the consumer market could be one of the reasons for the company to report at the lower end of the guidance. According to the preliminary results by IDC, there was a YoY decline of (29%) in the shipments of traditional PCs in Q1 2023 due to weaker demand and excess inventory. IDC expects growth after 2023.
Q4 revenue grew by 26.7% YoY to $19.93 billion. The management revenue guidance for Q1 is $16.7 billion to $17.5 billion, representing a YoY decline of 2.7% at the mid-point of the guidance. The company’s CFO Wendell Huang said in the Q4 earnings call “As overall macroeconomic conditions remain weak, we expect our business to be further impacted by continued end market demand softness and customers’ further inventory adjustment.”
Below is a screenshot of the analyst’s revenue estimates which will vary due to the foreign exchange calculation. We use the estimates to understand the trend and use the company’s IR revenue USD figures in our reports. The analysts expect revenue to grow 1.8% YoY to $17.19 billion in Q1 and to decline (7.7%) YoY to $16.46 billion in Q2.
Source: Seeking Alpha
On a yearly basis the analysts expect revenue to grow 0.8% in 2023, 19.8% in 2024, and 14.7% in 2025.
The adjusted EPS is expected to decline this year and then rebound next year. The analyst expect GAAP EPS of $1.21 for Q1 and $1.11 for Q2.
Source: Seeking Alpha
The gross profit in Q4 came in at $12.4 billion compared to $8.29 billion in the same period last year. Gross profit margin improved to 62.2% from 60.4% in Q3 2022 and 52.7% in Q4 2021. It was higher than the management guidance of 59.5% to 61.5%. It was higher due to cost improvements and favorable foreign exchange rate, partially offset by lower utilization rates. The Q1 2023 management guidance for the gross margin is between 53.5% to 55.5%. The company reported 55.6% in Q1 2022.
The company has industry-leading operating margins. In addition, the company is working on cost improvements and in the past has been able to negotiate better prices with its customers.
Source: YCharts and Company IR
The operating income was $10.36 billion compared to $6.56 billion in the same period last year. Operating margin improved to 52% from 50.6% in Q3 2022 and 41.70% in Q4 2021. It was higher than the management guidance of 49% to 51%. For Q1 2023, the management guidance is between 41.5% to 43.5%. It is lower than the operating margin of 45.6% in Q1 2022.
The management mentioned in the last earnings call, “R&D expenses accounted for 7.2% of our net revenue in 2022. In 2023, as we increase our focus on technology development and add more resources, we expect R&D expenses to increase by about 20% year-on-year and account for 8% to 8.5% of our net revenue.”
In addition, the management also answered to an analyst’s question on the reason for the rise in R&D expenses. “We’re the technology leader, and we intend to continue to maintain the leadership. Therefore, we are devoting more and more resources in R&D, including people and other kind of resource. That’s the reason why our R&D expense will increase in 2023 and probably beyond.”technology leader, and we intend to continue to maintain the leadership. Therefore, we are devoting more and more resources in R&D, including people and other kind of resource. That’s the reason why our R&D expense will increase in 2023 and probably beyond.”
So, we understand that the margins will be lower due to higher R&D expenses along with lower utilization due to inventory adjustments, ramp-up, overseas fab expansion, and inflationary pressures.
The net income was $9.43 billion compared to $5.97 billion in the same period last year. Net profit margin improved to 47.30% from 37.90% in Q4 2021. The EPADR (Earnings per American Depository Receipt) came at $1.82 compared to $1.15 for Q4 2021.
The company has good free cash flow. The free cash flow was $4.78 billion with a free cash flow margin of 24%, compared to a free cash flow of $4.84 billion (free cash flow margin 24%) in Q3 2022 and $5.12 billion (free cash flow margin of 33%) in Q4 2021.
The company has also cut capex for 2023 due to the anticipated slowdown, which is a positive. The company had spent $36.3 billion in capex in 2022 and for the year 2023 it expects between $32 billion to $36 billion.
The company has a stable balance sheet. The company has cash & marketable securities of $50.84 billion and debt of $27.8 billion.
The company is trading at a P/E ratio of 14.10 and is lower than the average five-year P/E ratio of 22.97. The P/S ratio is 6.31 and below its five-year average P/S ratio of 8.4. This is positive that the company is trading below its historical average. The forward P/E ratio is 16.5 and forward P/S ratio is 6.34.
Noteworthy:
Analyst Gokul Hariharan in the Q4 earnings call, asked a question on the outlook for 2023. “Could we have some more color on what is that gives you the confidence for such a strong rebound in the second half of the year to get us back to like a flattish revenue growth for the year?”
The company’s CEO, C.C. Wei, replied, “The inventory correction actually began last year. And at the peak of the third quarter, and we think the inventory has been picked in third quarter last year and gradually reduced in the fourth quarter, and we did see some inventory reduced sharply recently, and it will continue to be so to first half of this year. So that’s why we say we have confidence that in the second half, the business will rebound. But is that a very strong V shape? We didn’t know yet, but certainly, it’s not a U shape for the business to recover in the second half.”But is that a very strong V shape? We didn’t know yet, but certainly, it’s not a U shape for the business to recover in the second half.”
The 3-nanometer process technology is the current most advanced chip production technology. The company is expected to have strong demand in the coming years driven by HPC and smartphone applications. The management mentioned in the earnings call, “Our 3-nanometer technology is the most advanced semiconductor technology in both PPA and transistor technology, thus, we expect customers a strong demand in 2023, 2024, 2025 and beyond for our 3-nanometer technologies and are confident that our N3 family will be another large and non-large node for TSMC.”we expect customers a strong demand in 2023, 2024, 2025 and beyond for our 3-nanometer technologies and are confident that our N3 family will be another large and non-large node for TSMC.”
Recent Headlines
Nvidia is expected to benefit from the strong demand for Artificial Intelligence chips and the company has recently increased orders for AI chips with TSMC.
DigiTimes reported that Microsoft has approached TSMC to use the company’s CoWoS packaging for its own AI chip.
Apple is expected to use TSMC’s 3nm technology for its first self-made 5G modem chips to be used in iPhone 16 series. Previously, Apple used to purchase 5G modem chips from Qualcomm.
Berkshire Hathaway slashed its stake in the company in February. We have proactively trimmed our position due to geopolitical tensions related to China and due to the Warren Buffet sale.
What Analysts are Saying/Channel Checks
Bernstein analysts highlighted the 1Q23 revenue miss but noted the results still "met the low-end of the guide." The analysts reiterated an Outperform rating on the TSM stock.
KGI Securities resumed coverage of TSMC with an Outperform rating and NT$603 price target. The analysts said that the demand for high-performance computing, fueled by increasing adoption of AI in various applications, has led to a significant increase in silicon dollar content per chip or socket and TSMC stands to benefit.
Bank of America had a positive note on the company due to AI. "We think the generative AI should act as one of the greatest drivers, thanks to the substantial computational requirements for running and training the AI models," the analysts wrote.
"Datacenter (including supercomputing) related revenue currently accounts for ~10% of the revenue, and we estimate that CPU/GPU/accelerator upside for generative AI could potentially contribute 1%-2% initially and likely up to 8% in a bull case," they added.
They also believe there are structural long-term opportunities for the company.
"With rising computing power demand to shorten the time to market and provide better service quality with a faster response time, we believe the pursuit of leading-edge technology will not decelerate. Advanced packaging adoption will also grow. TSMC, with tech leadership in both, will ride on the structural uptrend," they concluded.
Our Plan
The recent escalation between China and Taiwan is something we are monitoring and will use TA to help navigate. This will hit TSM especially hard, but it will have effects on our semis like NVDA and AMD, plus AAPL. We reduced our position in TSM around $87 in late February. We currently hold it in a low allocation in our portfolio, and are targeting better entries. We believe TSM should, at minimum, go back into the $70s, and possibly lower.
Until we get clarity on the path TSM will take, we plan to hedge our current allocation and wait for clarity so that we can get a better entry in this excellent company.
Last Friday, we decided to log gains in both NVDA and AMD, while keeping NFLX on hold. We logged a 24.45% gain in NVDA and a 20.78% gain in AMD. Our conviction on NVDA and AMD is as high as any stocks we’ve covered in our service, so it may seem odd that we are closing these positions today.
The simple explanation was best expressed by the famous investor, Howard Marks, when he stated, “It’s not what you buy, it’s what you pay for it that determines whether something is a good investment.” Because of the current macro environment, coupled with stretched valuations in both stocks, we believe that we will be able to get much better prices in the coming months. In order to confirm a return to good times, we would like to see favorable price action in the markets, a new liquidity cycle start in the economy, and avoiding the looming credit cycle. As of now, all three of these factors are not suggesting a new bull market is starting.
On December 30th, we alerted our readers to the strength in the semiconductor sector. We stated that, “we believe that semiconductor stocks are signaling that they are ready to resume their leadership role going into 2023.” Since then, not only was the semiconductor sector the strongest tech sector, but it has turned out to be one of the best places to invest in for 2023.
This call has proven to be very timely, both as a general theme and in how we decided to play this trend. Our starting cost basis in NVDA was $212.65 on 2/11/23, and $76.37 for AMD on 11/15/22. However, in our premium service, we have a much lower cost basis in both. We started buying NVDA at $108.51 on October 13th, while our starting cost basis for AMD was $57.34 the day after.
We mention this to our readers because we believe that through our process, we can help navigate when to add/trim/sell/start a position in great tech stocks. Our goal is to own great companies at great prices for the long-haul. However, we believe the time to get defensive is a prudent position to take for following three macro reasons:
The Market Price Action Is Risky
The structure of the broad market since the October low is a clear 3 wave bounce. This is a risky structure, as it tends to suggest we are in a corrective bounce in a larger downtrend. Since February, we have seen many major banks stocks suggest a top is in, while many tech names appear to be putting in a topping pattern. Our primary case is that the broad market tops out over the next couple of weeks/months, and begins its push towards the 3000 level SPX. There is a chance that we see a push to new highs first, but it is uncertain whether that happens or not.
Note in the above chart the Relative Strength Index (RSI) below the price chart. This is a momentum indicator that produces very important patterns. Note how the post-COVID bull market held the black trendline as support. It then broke this support, which has been resistance in the following bear market. As of now, we are not seeing internal momentum that is suggesting a new bull market is developing. This is a further warning to the bulls, as the technical picture is not as healthy as some make it out to be.
Discount Window Borrowing Is Not a New Liquidity Cycle
Liquidity can be measured in the economy based on the Federal Reserve’s Policies as well as the Treasury’s general account balance. When you measure the liquidity in the economy against the S&P 500, you can see a clear correlation between the two.
As the FED starts a new liquidity cycle (black line going up), stocks eventually follow. Some may be encouraged by the sudden rise in the FED’s balance sheet as a sign that a new liquidity cycle is starting. This assumption would be a mistake.
Yes, the FED’s balance sheet expanded, but the FED’s balance sheet consists of many facets beyond quantitative easing (QE). In QE, the FED actively seeks out to buy long-duration bonds in exchange for bank deposits (not money). Their intention is to control the yield curve on the long end, to encourage economic activity, and it is an intentional action.
The part of the balance sheet that just expanded is what's called primary credit, or short term loans through the FED's Discount Window. The Discount Window is one of the FED's original purposes – to be the lender of last resort to banks that need liquidity now. This is a stigma for banks when they have to use it, because it means they are in dire straits and desperately need liquidity to maintain daily operations. These loans must be backed by collateral and have a very high yield that must be paid, which is about 4.6% right now. This is very expensive money that no bank takes unless it's absolutely necessary.
That being said, if we isolate the part of the FED's balance sheet that is primary credit, here is what we get.
These are expensive loans that banks do not want to hang onto for long. So, they typically get paid back quickly. Also, note when these spikes happen, and it is not during good times. They are the result of liquidity drying up and banks needing expensive injections to survive daily operations. The largest bump in weekly primary credit happened a few weeks ago – $152B vs. the prior high in 2008 at $111B.
Most importantly, we can see that during the same time the FED continued to engage in quantitative tightening (QT) while continuing to raise rates. Even though banks are taping the Discount Window, the FED is practicing restrictive monetary policy, and thus not starting a new liquidity cycle.
Don’t Forget About the Credit Cycle
It has been nearly 14 years since we have experienced a true credit cycle, so many investors have not experienced one. Due to low inflation, the FED has been able to flood the markets with liquidity in several periods of weakness, allowing the economy to avert a credit cycle. This resulted in relatively short, while sometimes deep, corrections that were bought up quickly.
However, due to inflation being at a 40 year high, the FED does not have this convenience anymore. They have thus engaged in one of the most aggressive rate hiking cycles we’ve seen since the 1970s.
What many forget is that rate hikes cause damage to the economy, and by some measures, it can take up to a year for those rate hikes to actually effect the economy. The bulls are betting that the rate hikes that are still happening, will somehow not affect the economy in a material way, which history does not support.
In the chart below, I compare the Fed Funds Rate (BLUE) to the S&P 500. The below gray bars show the lending standards for banks. As banks get more concerned about the economy, the less loans they provide, causing a cascade of defaults.
Note how the FED starts a new liquidity cycle usually around the top in equity markets. They start lowering rates, knowing that it will also take time for these lower rates to filter into the economy. However, once rates go up too high, the damage is done, and the economy as well as the markets must go through a credit cycle before a new expansion period can start. What’s concerning is that the FED is still hiking rates, meaning that this credit cycle could take longer to cycle through than most think.
In conclusion, bull markets do not happen in vacuums. They require expanding credit and expanding liquidity, both of which are not happening now. The price action in the broad market is also not favorable to the bulls, which has us playing defense. NVDA is up over 150% off its low, while AMD is up over 75% off its low. These two, at best, are due for a pullback. But, considering the macro environment, we believe taking gains now will provide us more cash to buy these great stocks lower in the coming months.
For reference to terminology used, please look at technical analysis under our resources section here. Regarding the charts below, the vertical tan shades represent time factors. These are inflection points where we have high odds of something significant happening. More times than not, (3/4 of the time), they mark a turning point in the trend. So, what matters is the direction we are trending into these periods. Regarding the vertical lines, black lines represent strong support/resistance, while dark red lines mark very strong support/resistance.here. Regarding the charts below, the vertical tan shades represent time factors. These are inflection points where we have high odds of something significant happening. More times than not, (3/4 of the time), they mark a turning point in the trend. So, what matters is the direction we are trending into these periods. Regarding the vertical lines, black lines represent strong support/resistance, while dark red lines mark very strong support/resistance.
Elliott Wave count are meant to provide context. There is a pattern unfolding in real-time, one of which will play out. By monitoring price levels that are held/broken, it will help us figure out which one is in play
Broad Market
Nothing has changed from last week. We believe the bounce from the October low is a bear market rally, and that we are at the tail end of this rally. The question remains whether the market has topped or has one more push to new highs before petering out.
I laid out the case for this push to new highs last week, which could take us back towards the 4300 SPX level, and last through May/June. As of now, we do not have confirmation of this scenario playing out.
Note in the above chart the Relative Strength Index (RSI) below the weekly price chart. This is a momentum indicator that produces very important patterns on longer time horizons. You can see how the post-COVID bull market held the black trendline as support. It then broke this support, which has been its resistance in the following bear market. As of now, we are not seeing internal momentum that is suggesting a new bull market is developing. This is a further warning to the bulls, as the technical picture is not as healthy as some may believe.
Potential Paths
My primary count is in blue. This count has the top in and is only waiting for a trigger to push us below the confirmation level of 3838 SPX. Below this level and the risk will be very high.
Last week I, introduced the green count. This is a variation of the bullish red count I’ve been tracking for many weeks. I’m favoring this one as an alternative because it would have the market top into our major cycle cluster from April 11-28.
Regarding the green count, this would have us in wave 3 of 3 of the final C-wave in this bear market rally. As long as price stays above 4044 SPX, and then pushes above last week’s high, this will remain my alternative count.
The red count has been altered because of the strength of the most recent swing higher. It’s not typical that the 5th wave of a leading diagonal is so strong, meaning that it would likely have to be the 3rd wave in a much bigger leading diagonal pattern. For this reason, I’m not considering this as a possibility as long as price stays above 3970 SPX. Below here, and it will become my alternative count again.
April 11-28 Time Factor
We do extensive cycle work to help us know when to expect a market inflection point. As strange as this may sound to many, of all the technical tools I use, it is the most reliable. Since I first introduced these Gann Time Factors, they’ve had a near perfect track record in identifying these inflection points.
Regarding these time factors, they are simply repetitive cycles that a stock/market reacts too. There are two things that I look for that helps me determine if a time factor is likely to be a big inflection point. For one, I’m looking for the same period being shown across many markets/stocks. The second thing is if we have multiple cycles coming together at the same time to make a cluster.
In the S&P 500 chart below, each symbol represents a time factor/cycle that has an effect on the S&P 500. Note how we have a large cluster coming together next week. This, more times than not, tends to mark a big inflection point worth monitoring.
Regarding other markets/key stocks that I track, here is where they are showing a time factor in the coming weeks:
NASDAQ-100: 26th – 1st
Russell 2000: 18th – 24th
ARKK: 12th – 18th
XLF: 20th – 28th
BTCUSD: 18th – 21st
TSLA: 11th – 28th
NFLX: 18th – 26th
AAPL: 11th – 14th
GOOGL – 17th – 21st
AMZN: 13th – 21st
META: 11th – 21st
NVDA: 14th – 21st
FDX: 6th-17th
So, we have a large cycle cluster, coupled with several important markets and key stocks pointing towards this same period. So, we should see a notable inflection point coming up.
Typically, what matters the most with these time factors is how we are trending into these periods. About 75% of the time, we see a reversal of the trend moving into the time factor. The other 25% of the time, we see a 3rd wave breakout. Regardless, I believe a lot more clarity on what count is leading will manifest in the coming weeks.
Supporting Markets
The Russell 2000 (RUT)
Small caps have been exceptionally weak, mostly because this is where most regional banks reside. The structure of RUT appears to be shaping up as a developing 5 wave pattern pointing down. If this is accurate, we should see one more drop into this week/next week, followed by a reversal upwards. This would suggest that this April time factor would be a significant low, supporting the SPX red count, or potentially an extended green count.
However, a breakdown below that yellow region on my RUT chart will signal that the top is in, and support the blue count in SPX.
The Dow also supports the red/extended green count. The drop from the December high has been very messy and overlapping, which favors a B wave with a C wave to new highs coming. In order to confirm this, we need two things: 1) the developing pattern off of the recent low needs to become a 5 wave pattern. So far, it’s only 4 waves. 2) we must break above the December top.
If we see a 5th wave develop, followed by a 3 wave retrace into our April time factor, then we might start shifting towards the limited bull case – red/green on SPX.
FAANGs
The FAANGs, on the other hand, appear to suggest something else entirely. Microsoft appears to have met our target at $291. It could have a spill over to the $298/$300 region, but that would be it before we see a bigger pullback take hold.
AAPL and GOOGL suggest that they have one more swing high in them worth monitoring. AAPL has hit our first range of targets and turned down. The structure of AAPL’s uptrend suggests that it could be targeting the $169-$170 region. This would likely complete a very full, upward pattern, which would lead to a bigger decline.
GOOGL has broken out to new highs, but looks to have limited upside potential from here. The geometry looks to be targeting $114-$116 region before we see a larger reversal.
META has reached our target at $216, which had us initiate a short position. According to my count, this should be it for META; however, the alternative count would have us targeting ~$243 before the bigger pullback takes hold.
At best, the FAANGs appear to be topping out. So, the question remains – are small caps and financials leading us lower or is big Tech leading us higher? As stated last week, the structure of the coming pullback is what will determine how bearish/bullish we get.
Since the bear counts have to be in the form of a large C wave pointing down, it will be in the form of a 5 wave pattern. if we see 5 wave drops across the board, then we have an early confirmation to get defensive. On the other hand, if these drops come in the form of 3 wave drops into our April Time Factor, no matter how bearish things look, the market will likely be setting up for a larger push higher – SPX red/green count.
Financials
Let’s not forget about the most important sector in the market – financials. Due to the strength in tech, most have shrugged off what’s going on here. If financials didn’t look so bad, I’d be more inclined to shift into the red/green counts for SPX.
XLF has given us the minimum waves to be a 5 wave drop from the February high; however, my count has us in a 4th wave with one more drop to come. This will line up with the green/red count in SPX and a low in the Russell 2000. As XLF pushes higher in a larger 2nd wave, we can see other markets/stocks play catch-up and top out later in the year as we get one more swing high.
However, it’s worth being on alert. We do have a 5 wave pattern down and a very small 3 wave retrace, which could be a very small 2nd wave. If we see a gap down on heavy volume in financials, it will confirm that the blue count is farther along than originally thought.
I continue to believe XLF is one of the most important markets to watch. This is not a collection of regional banks, but the largest financial institutions in the world. If we do get another drop, the 5 wave pattern will be very filled out, and dropping from what appears to be a bear pennant B wave. If this happens, any uptrend that follows will be on borrowed time.
Bank of America (BAK), being one of the larger banks in America, has one of the more concerning charts. It looks like waves 1 and 2 are in, and we are on the verge of a 3rd wave break down. As long as BAC stays below $31, this setup is in place. If we break that trendline that has held up BAC since 2012, expect the markets to follow.
Macro
The Fed Funds Futures now has odds of a 25 bps rate hike around 71% during the next FOMC meeting in May. This has risen from around 50% just prior to the recent jobs report last Friday.
The jobs report was perceived as strong, but under the hood, the results were actually mixed. What was strong was that private sector labor income came in at 9.1% on a 3 month annualized basis. This is the highest increase since April of 2022. Furthermore, civilian employment jobs increase by 577,000, with a 480,000 increase in the labor force. This pushed up the participation rate in the economy to just north of 62%, which was the highest we’ve seen since March of 2020, just after the pandemic started.
However, as we’ve stated time and time again, the most important metric is not the increase in jobs, but the number of hours worked. With all the increase in jobs, the number of hours worked actually went down on a MoM basis of 0.1%. This tells us that businesses were hiring, but they have less work that needs to be done, which is not good.
Employment is the last metric to go in a recession, and we are seeing the metrics that matter continue to trend lower. Regardless, the FED’s aggressive rate hikes have yet to address a rather resilient labor market, meaning that they will continue to press rates, further intensifying the interest rate risk we are seeing with banks.
What is the bond market telling us about the recent data? The 3-month yield just pushed to new highs, while the 6-month yield is very close to making a new high. In other words, the bond market is confirming the FED will push rates higher in May.
However, look at the 2-year yield (red below). It’s still suggesting a top in rates, and continues to suggest a reversal/pivot quickly after the FED raises in May.
The shorter the duration, the more of an effect the yield has on FED policy. Once we see the 6-month and 3-month start to crater like the 2-year, a FED pivot, and likely reversal will be close.
I do not see a pivot as a positive occurrence, though most will. In fact, we could see the equity market rally hard on this news, confirming our red count in SPX. We’ve been trained over the last 14 years to only focus on liquidity. With inflation low, the FED has been able to support equities with multiple liquidity cycles, leading to short, but sometimes deep corrections.
With inflation at a 40-year high, they embarked on the most aggressive rate hike campaign since the 1970s. This was accompanied with global central banks following along.
What investors are forgetting about is the effect rate hikes have on the economy, and the lag time it takes for hikes to be felt in the economy. Some estimates claim that it can take up to a year before the full effect of a hike is felt; however, the consensus is that it’s anywhere between 6-9 months. This would imply that we are just starting to feel the effects of the current rate hiking cycle.
Historically, the FED pivots around market tops, starting a new liquidity cycle. However, the combined effects of the multi-month to multi-year rate hike campaign triggers an unavoidable credit cycle, which appears to be unavoidable in the coming months.
In the chart below, I compare the Fed Funds Rate (BLUE) to the S&P 500. The below gray bars show the lending standards for banks. As banks get more concerned about the economy, the less loans they provide, causing a cascade of defaults.
Note how the FED starts a new liquidity cycle usually around the top in equity markets. They start lowering rates, knowing that it will also take time for these lower rates to filter into the economy. However, once rates go up too high, the damage is done, and the economy as well as the markets must go through a credit cycle before a new expansion period can start. What’s concerning in the current cycle is that the FED is still hiking rates and engaging in QT, meaning that this credit cycle could take longer to cycle through than most think.
In conclusion, price action, liquidity cycle and credit cycle do not support a renewed bull market developing. If we start seeing evidence to the contrary, we will happily pivot. We will continue to lean into our hedge signal, while holding heightened levels of cash until more clarity is presented in the market’s direction.
I/O Fund Positions
We have positioned some of our portfolio for the potential of the SPX green/red counts playing out. We currently hold just north of 20% cash, with a ~4% short position in META.
Hedge
Our hedge has provided us three intra-day sell signals over the last couple of weeks. However, we need to close the day on a sell signal for us to act. This means that buyers have stepped in towards the afternoon session on weak trading days. We are close to triggering a sell signal, and another down day that closes on the low will likely do it.
Netflix, by default, has become our largest position. The structure looks like it needs one more push into the $379-$410 region to complete the 1-year long, leading diagonal pattern. If this happens, we will cut our position significantly. In fact, we may front run this move if we push a little higher.
There are simply no significant sellers in NVDA, as it is now +158% from our October 13th tranche at $108. We still only have 3 waves up off the low, and expect some event to trigger a sell off. If we see 5 waves down on this drop, it’s a big warning, while 3 waves down will set up the next great buying opportunity, sooner rather than later.
AMD is also topping out. The same analysis that applies to NVDA (and many stocks), applies here – 5 waves down is not good; 3 waves down will set up a great buying opportunity.
We don’t want to see the $187-$180 region broken. Below there and the bullish setup in ENPH could be in jeopardy.
It continues to act like energy commodities, and like the below energy commodities I track, it appears to be bottoming/setting up for a breakout.
Crude Oil
Crude continues to consolidate at the recent high in what looks like a 4th wave. Any push above $81.90 will confirm a 5th wave, as well as a major low being put in.
Gasoline
Gas is close to breaking out above $2.8. The final test will be $2.95. If it clears these hurdles, I’ll be looking for new highs in gasoline, as strange as that may sound, considering the macro environment.
Bitcoin (BTCUSD)
Bitcoin is moving in an inverse correlation to the banks, which is very interesting. We will continue to follow the WealthUmbrella signal to help us navigate this move. Technically, as long as BTCUSD stays above $19,550 on any weakness, we are still looking up.
Ethereum (ETHUSD)
ETHUSD has a more bullish posture than Bitcoin. However, the $2100-$2300 level will be an important pivot for ETHUSD to clear. We could see a pop into that region, followed by a failure. If we can clear this region, the upwards target on ETHUSD is worth buying into.
TSLA appears to be bottoming out, which favors the red count. If we get a full 5 waves up off the low, regardless of what unfolds in the broader market, a strong case can be made for a major low being put in.
I believe the Gann chart below is the most telling. Note the buyers stepped in at the double 1×1 line in red below. If this line breaks, we will likely reduce AEHR in our portfolio. Also, note the cycle cluster coming up between April 18th – 25th. If we are trending up into this region, that will also be a signal to reduce our exposure to AEHR.
The recent escalation between China and Taiwan is concerning. This will hit TSM especially hard, but it will have effects on most semis, including AAPL. Regardless, this is an amazing company, and we look forward to building our position into strength or weakness.