The tech giant reveals cutting-edge AI advancements, a powerful cloud based Omniverse platform, and strategic collaborations in the automotive industry.
This year at the GPU Technology Conference (GTC) 2023, NVIDIA unveiled a series of groundbreaking AI innovations, talked about upgrades to their Omniverse platform, and highlighted new partnerships that promise to revolutionize the world of computing and automotive manufacturing.
AI Breakthroughs and Applications
NVIDIA showcased its first PCIe dual-GPU in years with applications to train the latest generative AI models, GPT4. NVIDIA has been involved with the training function of these models which have the potential to transform many industries, from language processing to visual content creation and even biology. The company also demonstrated AI Foundations, a new set of cloud services that enables the creation of custom language models and generative AI. Partnerships with Getty Images, Shutterstock, and Adobe highlight the potential of these new AI tools in creative fields.
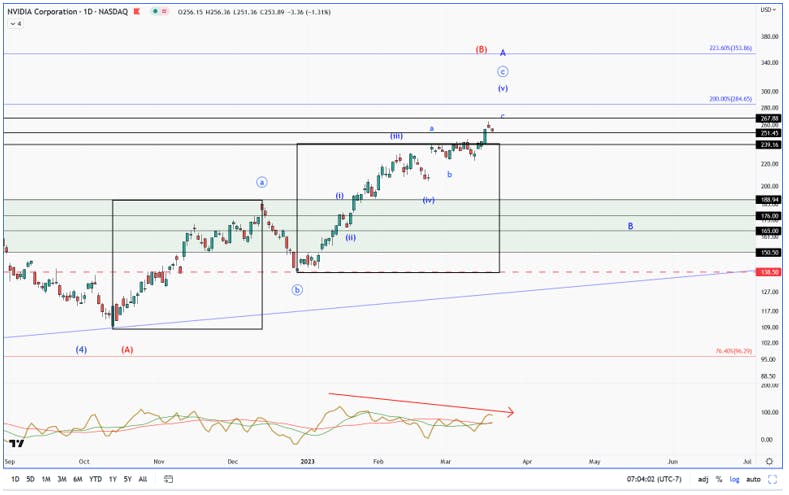
Our first coverage of Nvidia’s AI thesis began nearly five years ago in the analysis “Holding Nvidia Stock Will Pay Off Due to Two Impenetrable Moats” Since then, the stock has returned 436%. More recently, in January, I discussed why Nvidia powering OpenAI and Microsoft is a great way to play this trend in my interview with Real Vision. Watch the Video here.
NVIDIA Omniverse: Unifying Global Industries
The conference spotlighted NVIDIA's Omniverse, a digital twin platform that allows industries to simulate, optimize, and plan their operations in a virtual environment. The platform has already been adopted by major automotive manufacturers like BMW, Toyota, and Mercedes-Benz to optimize their assembly lines, plan operations across multiple factories, and accelerate digitalization.
Collaborations with companies such as Rimac and Lucid Motors further demonstrate the versatility of the Omniverse platform in creating digital stores and facilitating virtual planning sessions for the automotive industry.
I spoke with VP of Omniverse and Development Platform, Richard Kerris, in a candid one-on-one interview last year. You can view the full-length interview here: “How to Value the Metaverse.”
In our conversation, I asked Kerris about CEO Huang’s well-publicized comment that the “Omniverse or Metaverse is going to be a new economy that is larger than our current economy.” – essentially, what I wanted to know is how can the Metaverse grow to this size considering the dominant influence the internet has on the global population?
Here is what Kerris said:
“[The Metaverse] is going to be many times bigger than the web because of what a virtual world can do for business, for education, for medical, for all sorts of things including entertainment; we’ve just begun to scratch the surface of these possibilities […] You’ve probably heard the term digital twin. One example is what it’s going to do to revolutionize the industrial market, design and manufacturing. Well, a digital twin is a true-to-reality twin in synthetic worlds of what happens in the physical world. We are seeing this transform these things because when you can make decisions in that synthetic world before you commit to it in the physical world, you have a lot of cost savings.” –Richard Kerris
New Hardware, Systems, and Cloud Services
NVIDIA unveiled its latest hardware, including the Ada RTX GPUs and the OVX servers, designed to run the Omniverse platform efficiently. The company also introduced new chips, Grace, Grace-Hopper, and BlueField-3, engineered specifically for energy-efficient focused data centers.
The tech giant announced the NVIDIA Omniverse Cloud, a fully managed cloud service in partnership with Microsoft Azure. The Omniverse Cloud will be integrated with Microsoft 365 and Azure IoT Digital Twins services, connecting hundreds of millions of Microsoft 365 and Azure users. This is a key partnership and a remarkable highlight from the event for public investors.
Spearheading the AI revolution, NVIDIA's DGX H100 AI supercomputer provides the processing power needed for mass-scale AI applications. The company expanded its business model with NVIDIA DGX Cloud, partnering with Microsoft Azure, Google GCP, and Oracle OCI to bring AI supercomputing to companies via a browser.
A few months back, I encouraged investors to stay long Nvidia through the crypto mining selloff with an editorial in September “Nvidia is Ready to Rumble with RTX 40 Series and H100 GPUs” – the stock has returned 113% in roughly 6 months and is the number one performing stock in the S&P 500.
With a focus on energy efficiency, strategic collaborations, and wide-ranging applications, NVIDIA's accelerated computing ecosystem is poised to play a significant role in shaping the future of industries globally. By combining the power of AI, digital twin technology, and strategic partnerships, NVIDIA continues to show that it will push boundaries of what's possible in technology and industry.
This year's GTC demonstrated NVIDIA's commitment to moving industries forward, improving energy efficiency, and driving innovation through AI and advanced computing technologies. As the entire world races toward digitalization, NVIDIA stands at the cutting edge, helping businesses tackle the challenges and opportunities that lie ahead.
The AI thesis is important for the long-term thesis. In the near-term, Nvidia needs to recover the $2.5 billion decline that occurred following Ethereum’s merge to Proof-of-Stake (PoS) last August. I wrote about this in an editorial “Nvidia Stock: Evidence Gaming Has Bottomed and Why It’s Important” with the conclusion “The company’s swift and concise answer to the crypto mining selloff helps illustrate why Nvidia stands apart from its peers – primarily, that its products are superior, end-market demand remains strong, and management has many levers it can pull to quickly reverse a bottom. Since this article was written, the stock has returned 67%
What’s Next for Nvidia
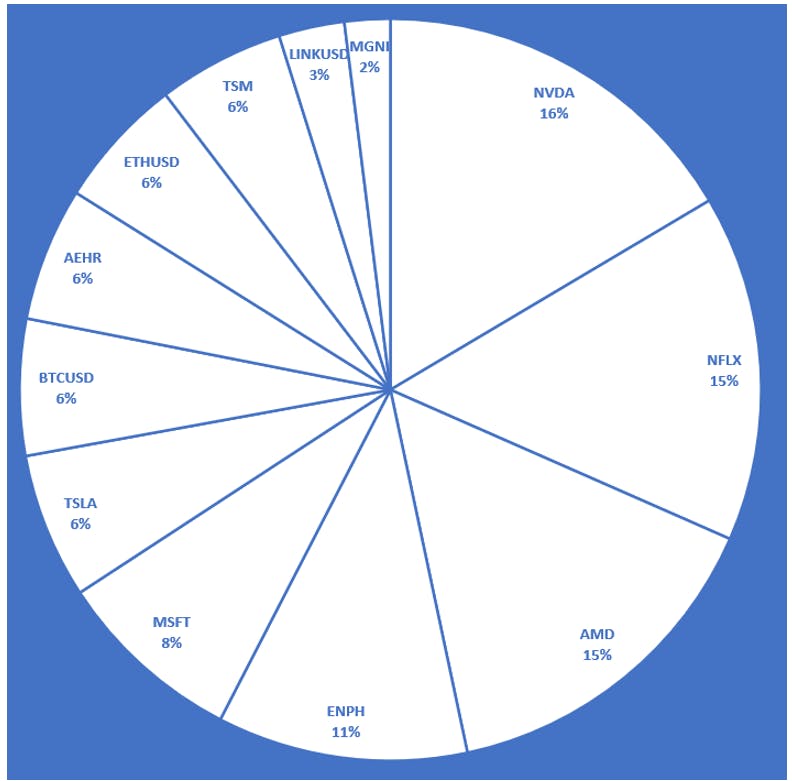
The I/O Fund is an actively managed portfolio. We sent a trim alert last week on Nvidia and took gains. This is a position we have managed for 5 years, building up to 15% allocation and taking gains near the top, while layering in at the bottom. You can learn more about our Research Services here and our Verified Returns here.
We’ve issued a press release today in BusinessWire on our full year 2022 returns, which you can find here.
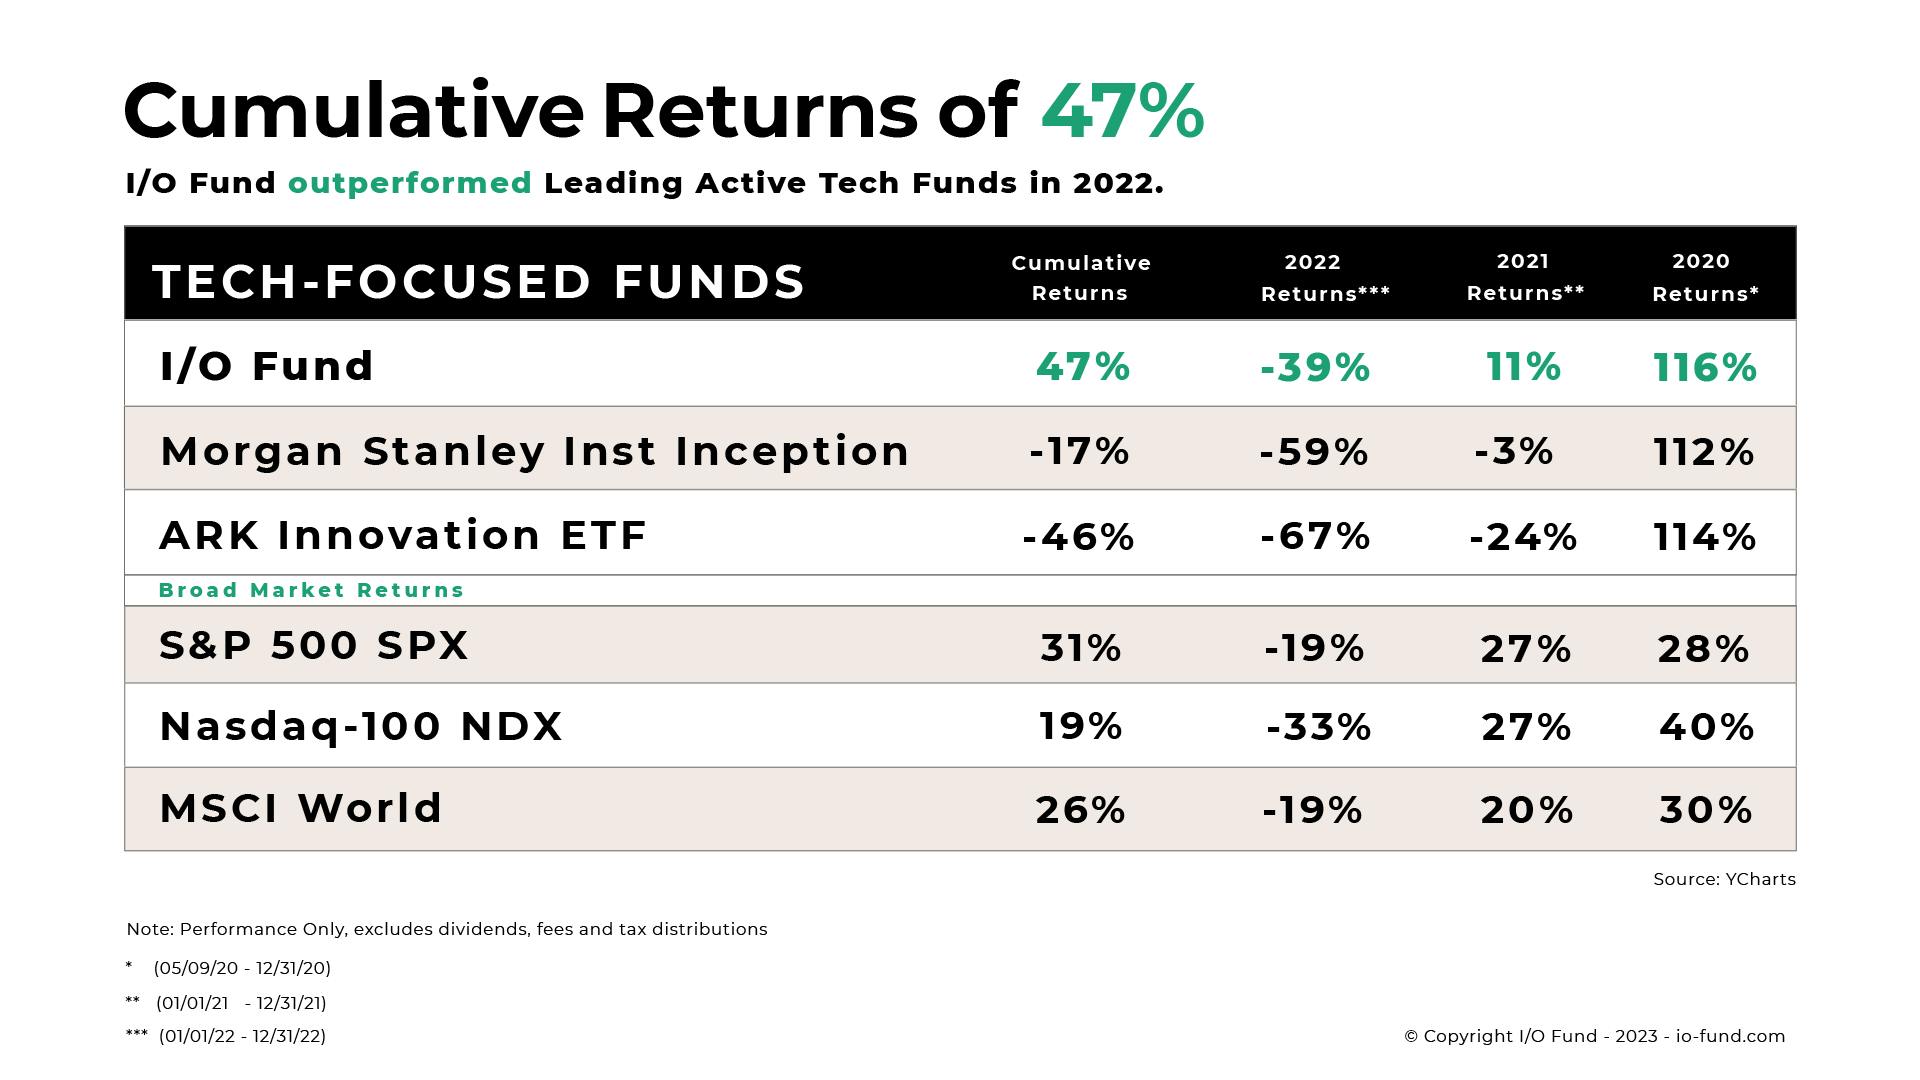
Due to a 180-degree pivot in May, the I/O Fund ended the year at (38.8%). This places us within roughly 6% of the Nasdaq-100 (NDX) which helps illustrate the comeback that occurred starting in May. Typically, in a risk-off environment, the indexes are known to protect investors to the downside. It also helps to gauge the overall cost of owning tech in a historic year for losses in the stock market. Meaning, even the most conservative tech investors lost (32.9%) in 2022, defined by those that hold their exposure to NDX through QQQ.
Notably, losses are geometric in nature, so a portfolio that is down (67%) has to go up 85% to catch up with our 2022 performance of (38.8%). To catch up with the I/O Fund compared to other all-tech portfolios since inception, you’d have to make up 174%.
Our 2022 relative outperformance followed an outperformance in 2021, with gains of 11.4% compared to many tech funds that were down (23%) or more. On a cumulative basis, we currently have the largest lead over Ark that we’ve ever had since inception.
Ark is not the only all-tech portfolio peer that we are outperforming on a cumulative basis. The portfolios listed below are managed by highly regarded portfolio managers, are reserved for high-wealth individuals only, and have billions of assets under management (AuM).
“If you had invested $10,000 with the I/O Fund's picks versus other all-tech portfolios at inception, the difference would be a portfolio value of $14,692 with IOF versus $5,358 with institutional tech-focused portfolios. The difference in value is 174%”
Our mission statement is to help Retail beat Wall Street in the challenging sector of technology.
When we set out on this mission, it was purely an experiment. The statistics show that Retail often fails to such a high degree that we felt any improvement here would be worth the attempt.
Past performance is not a guarantee of future performance. The I/O Fund is a publishing company. The analysts are not money managers and we are not financial advisors. Please consult with your financial advisor for every trade you do.
A few important stats on our Performance:
The I/O Fund announces a cumulative return of 46.92% since inception versus the Nasdaq-100’s 18.65% return during the same time period.
The I/O Fund’s cumulative returns of 46.92% have more than doubled the Nasdaq since 2020 with an outperformance of 28.27%
I/O Fund’s 2022 performance of (38.8%) rivaled the Nasdaq-100 performance of (32.9%)
The I/O Fund’s relative outperformance in 2022 surpassed institutional all-tech portfolios by as much as 85%
Since inception, the I/O Fund has a lead over institutional technology portfolios by as much as 174%
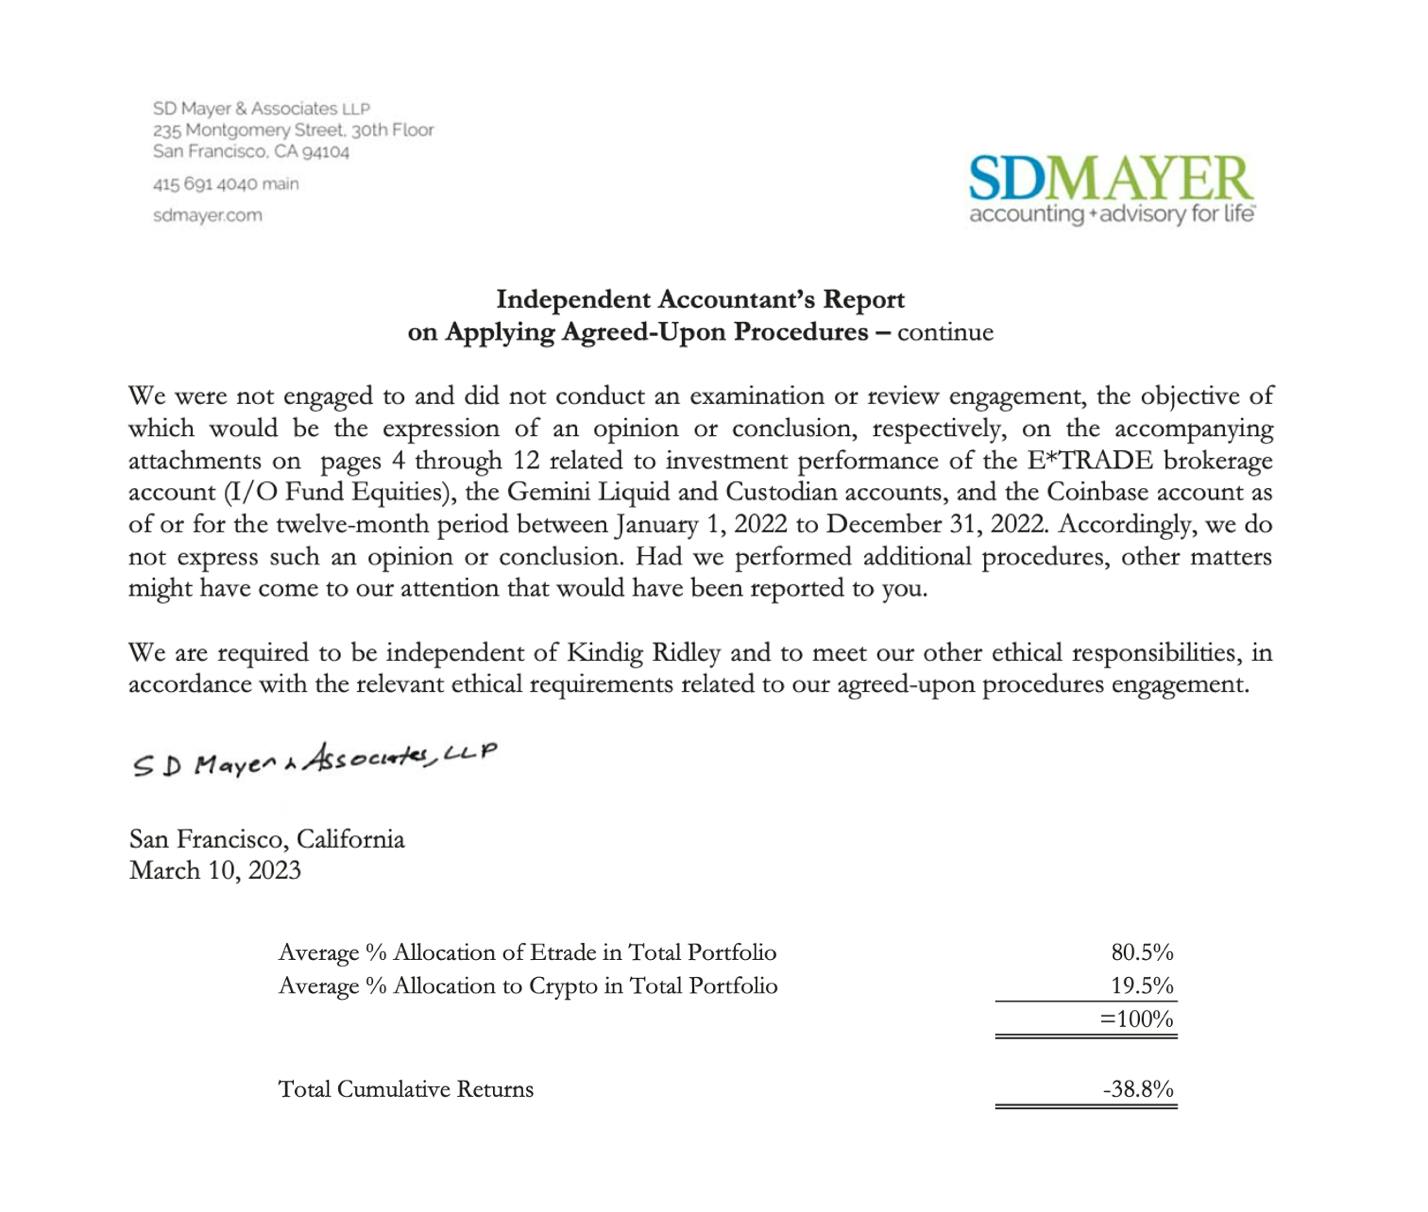
Please note, anything stated outside of our performance review are estimates.The only official, verified number we provide is from the Engagement Letter listed below of (38.8%).
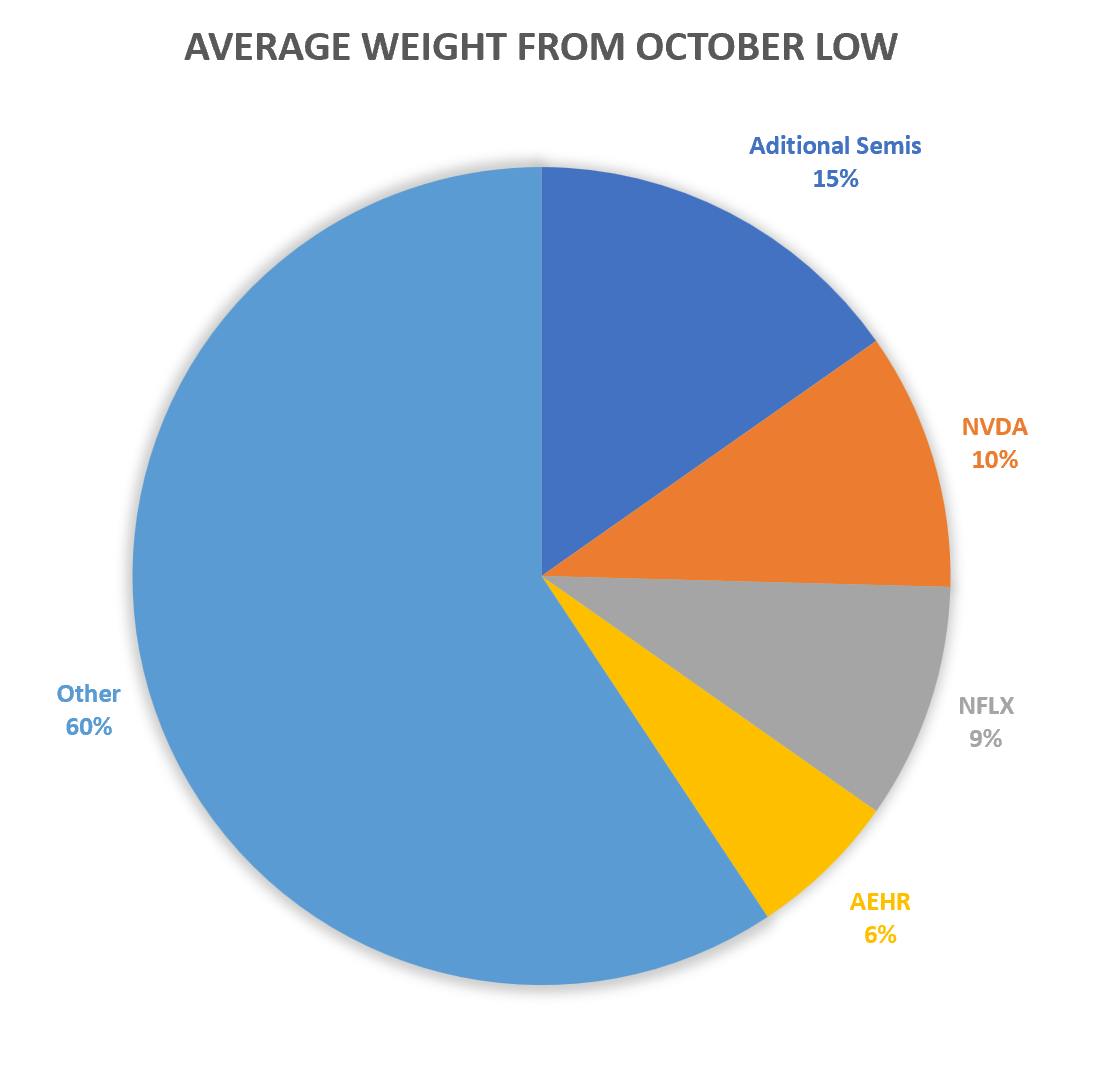
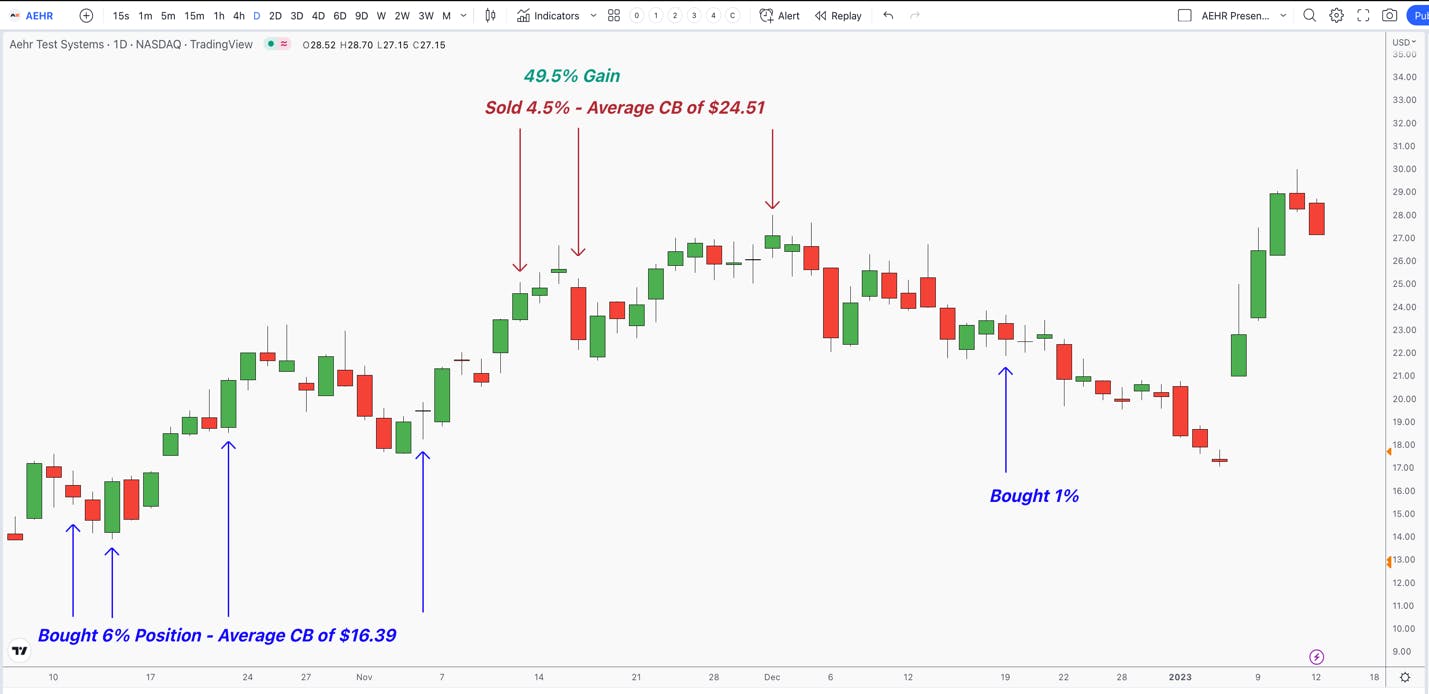
AEHR: 6% Allocation in October-December
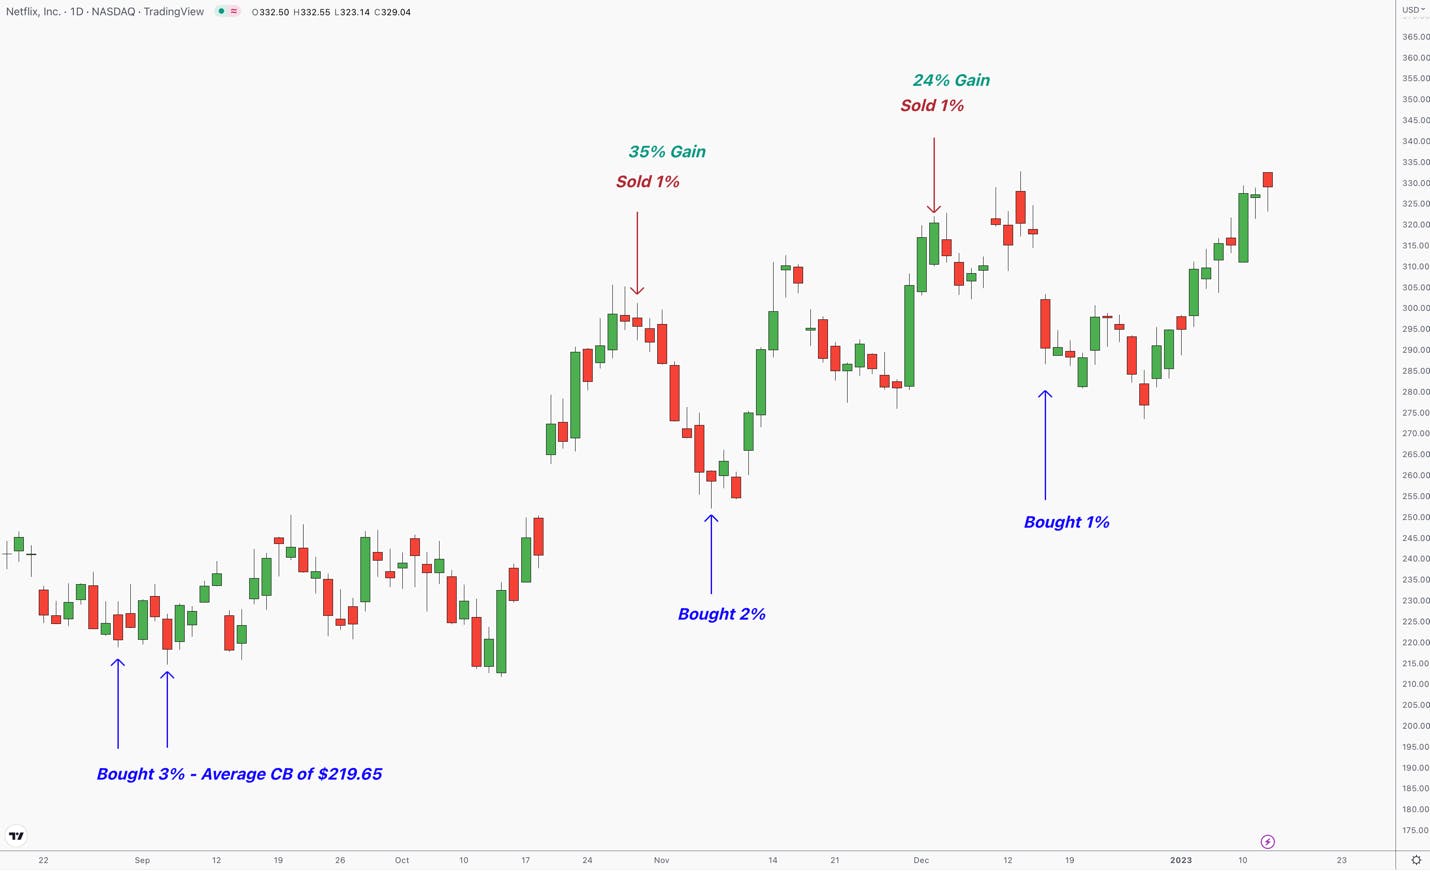
NFLX: 9% Allocation in October-December
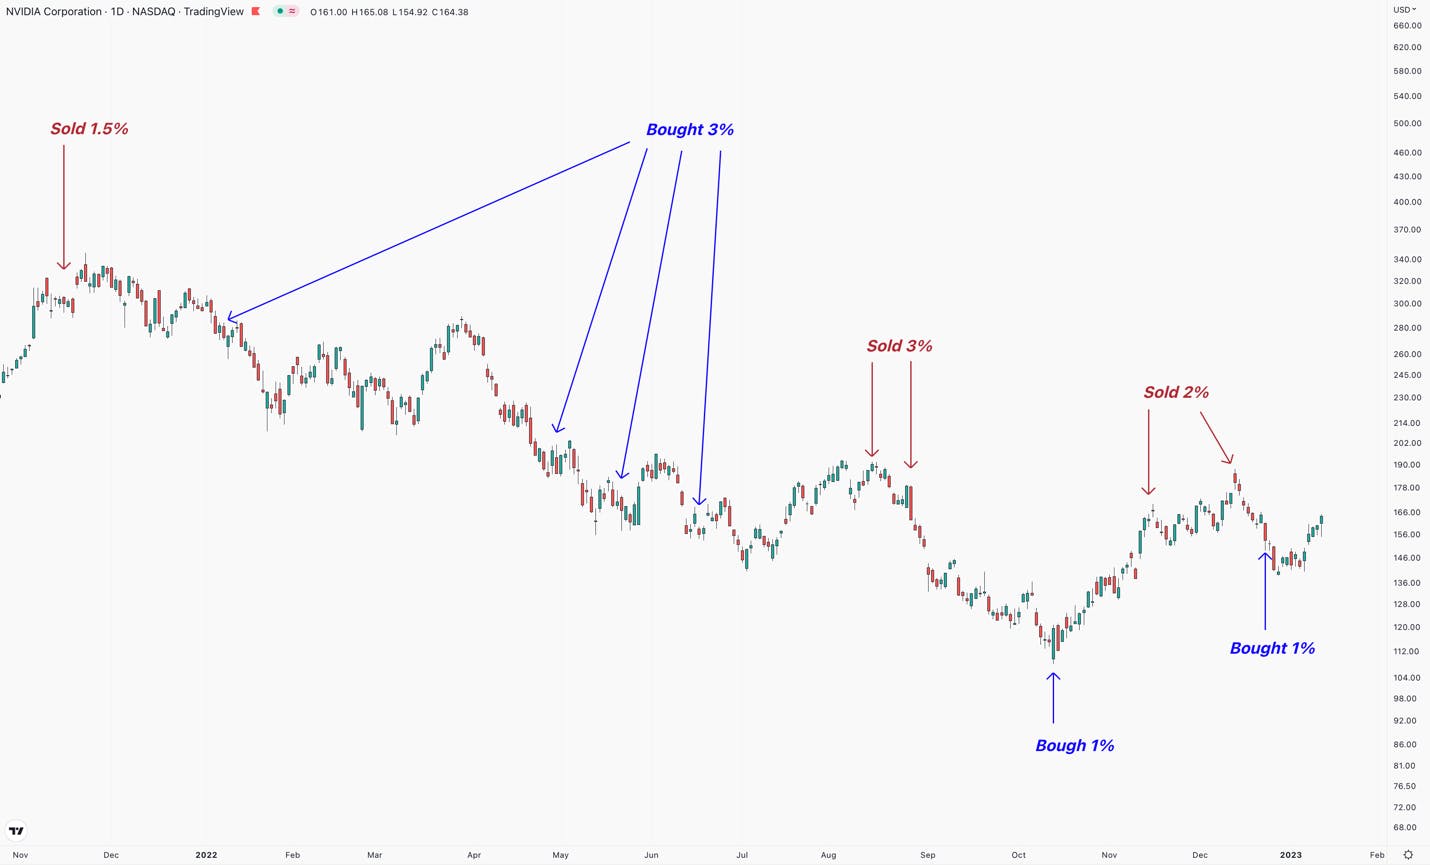
NVDA: 10% Allocation throughout 2022 with active management
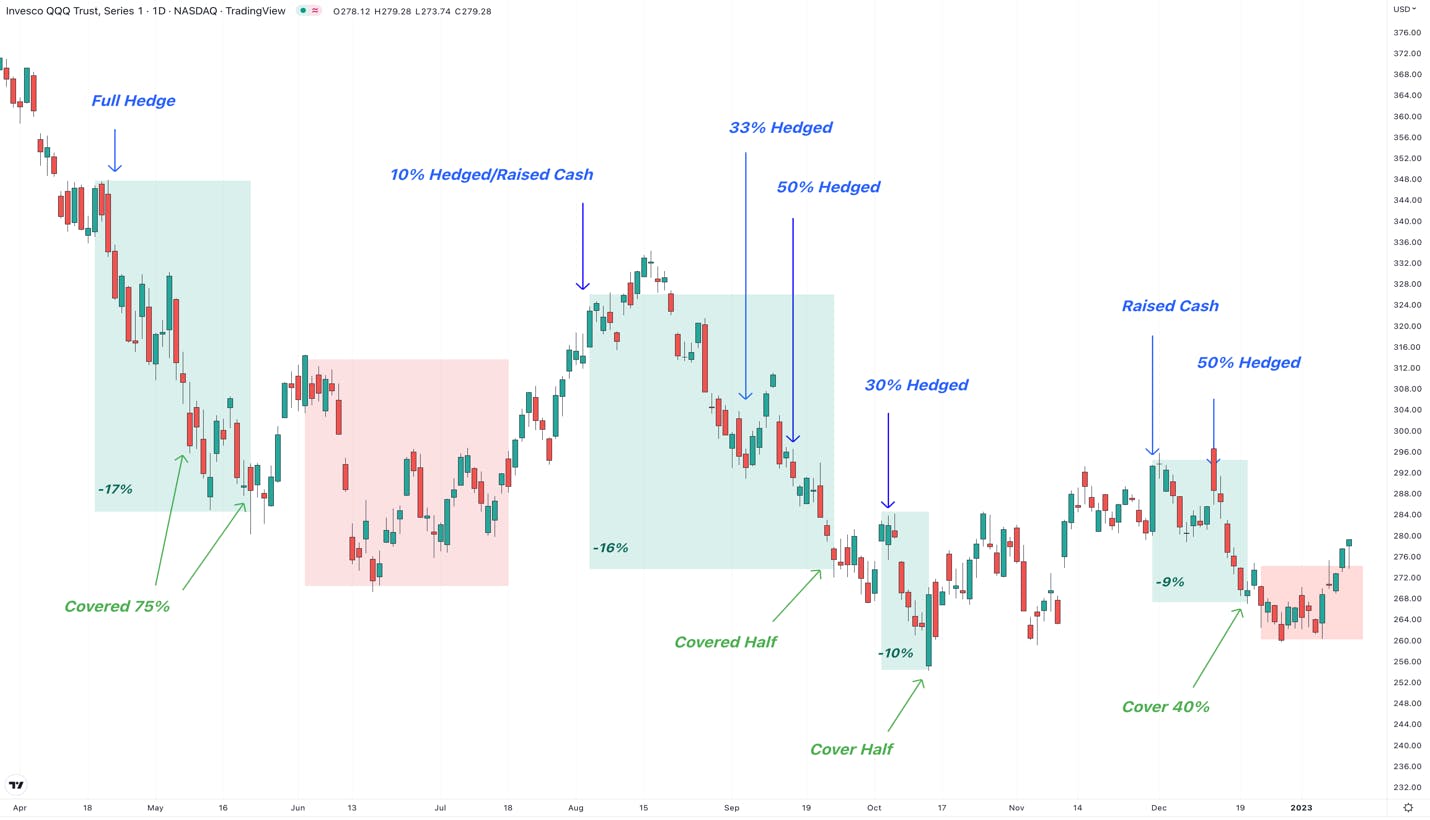
Hedge: mitigated some of the largest drops after April. The biggest moves from our hedge in 2022 are below. The green indicates periods where we mitigated the drawdowns, while red indicates periods where we had to close our hedge for a loss.
Hedging
In an environment where the odds can be stacked against Retail, the I/O Fund is committed to leveraging tools that institutional-level money managers are unable to leverage.
The primary tool we leveraged for Retail in 2022 was hedging. In 2021, the tool we leveraged for Retail was to actively manage crypto. A few of the all-tech portfolios listed in our comparison chart are not able to leverage these tools. For example, ETFs such as QQQ (tracks the NASDAQ-100) and ARKK do not hedge and do not hold crypto.
In 2022 we partnered with Vincent Duchaine of WealthUmbrella. The automated hedge that Duchaine built helped the I/O Fund close the gap between human-driven actions and emotionless machines. This marked an important turnaround for our firm as we gave up what I would call “retail idealism” which centers around the idea that holding a stock for a long period of time is retail’s only defense. This works during times of economic expansion, but this can go (horribly) wrong when a new, more challenging macro can change the outlook for any given company.
I’ll be the first to point out that success is a team effort, and these Knox and Vincent repeatedly ran the ball into the end zone in the third and fourth quarter. If half the battle is just showing up, then most of you noticed Knox and Vincent did not let our Members down in this regard.
April of 2022 marks the end of the I/O Fund relying on stock picks as the primary, offensive measure. It marks the beginning of what I would call IOF 2.0, more officially known as “man and machine” and “woman and machine.” After partnering with WealthUmbrella on an automated hedge, the I/O Fund hedged successfully up to 100% of our portfolio, at times.
We pivoted to playing defense rather than offense. Those who watch team sports will understand this transition well, as the strategy changes from attempting to make money (or make a goal) to a strategy that prevents losses (or prevents a goal).
With Vincent’s help, the I/O Fund has reduced whipsaws. The automation tool has also freed up Knox’s time to work on broad market and identify circuit breakers, which are the broad market levels that must hold. Together, these two launched an incredible tool for retail.
Performance Review
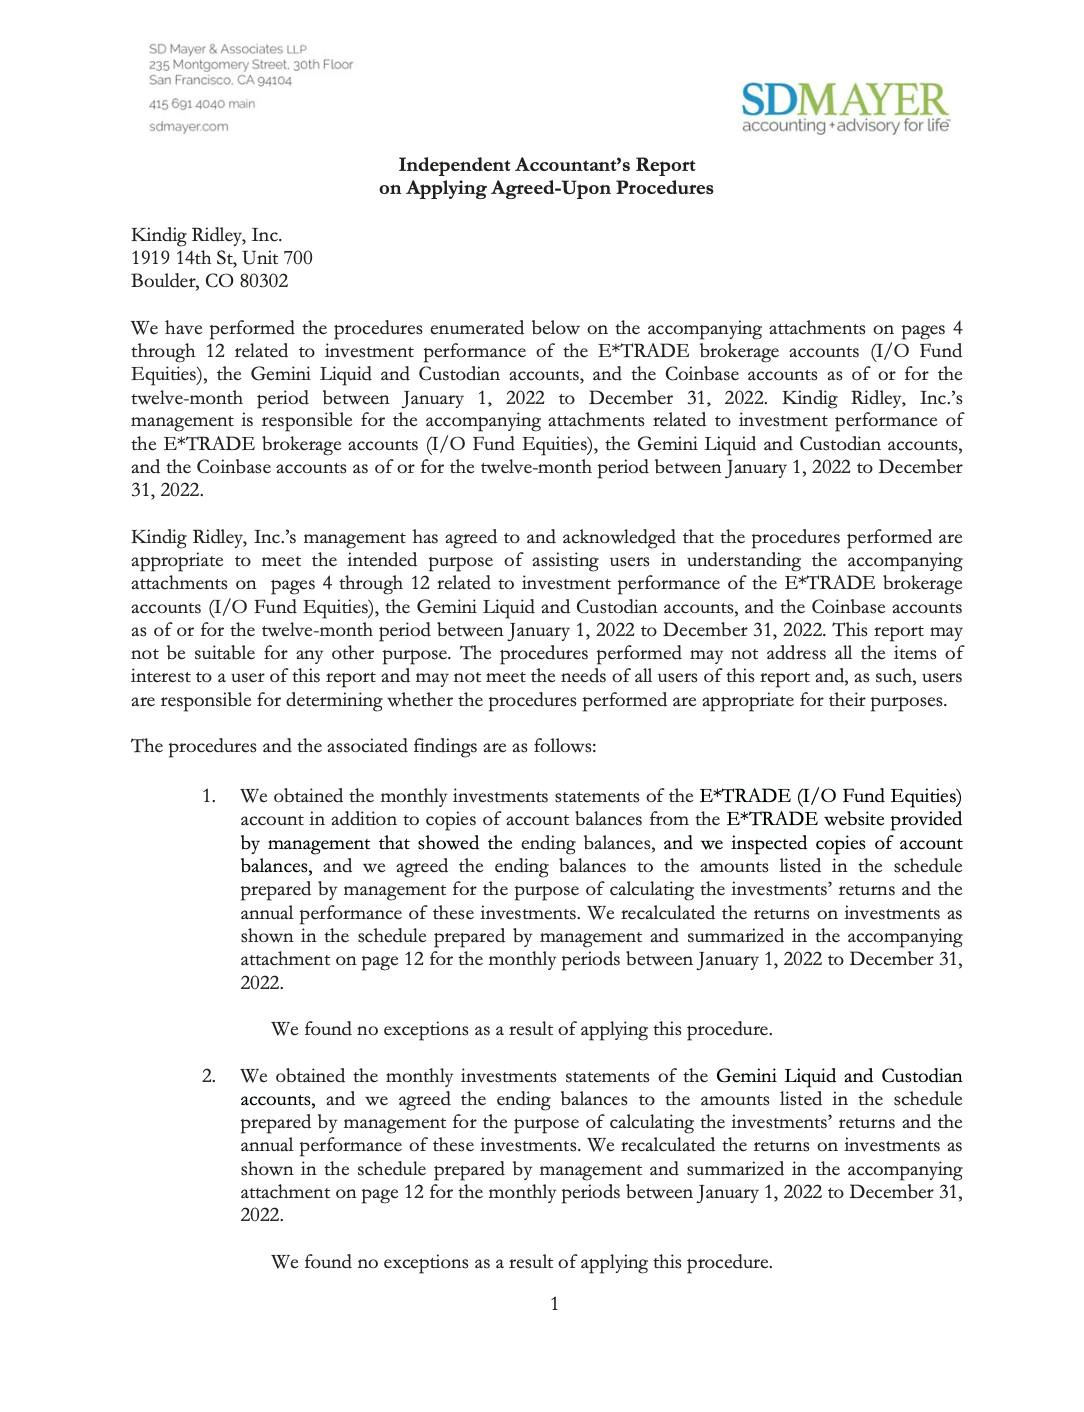
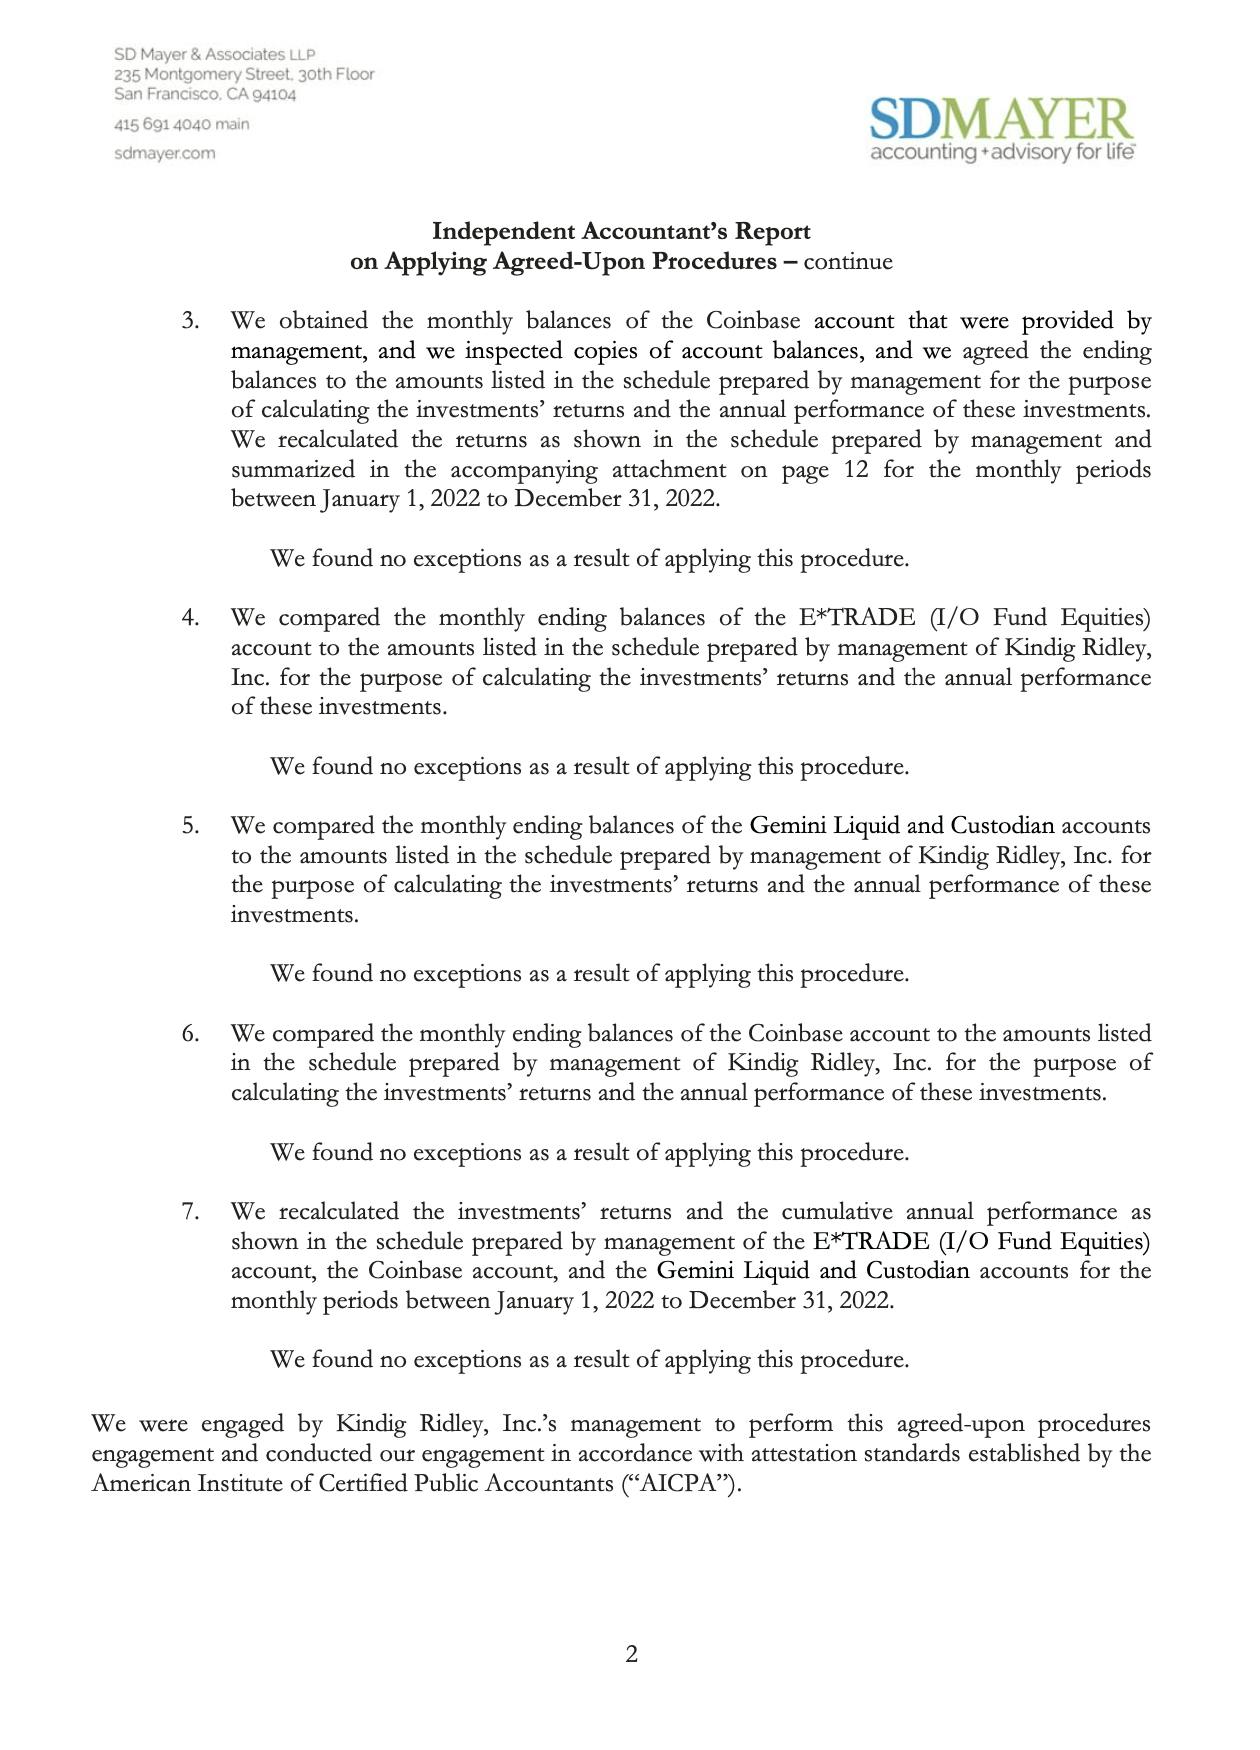
Below is the engagement letter from the firm that reviews and verifies our performance. Our terms and conditions with the accounting firm state that this engagement letter is to only be shared with paying customers. For that reason, our performance letter resides behind our paywall.
With that said, any paying customer can access the engagement letter which is posted on io-fund.com/premium and io-fund.com/essentials for this purpose.
The I/O Fund owns the performance review and we do not authorize our customers or any person on our site to share a confidential engagement letter or performance review outside of our paywall. As the owner of the report, we will at times market our performance number outside of the paywall. The terms and conditions can be found here.
The I/O Fund Experiment
Our site and services remain an experiment to see if Retail can beat Wall Street. There is no guarantee the experiment will work out in the future. Humility is the one adjective that best describes the market and we had a heavy dose of this last May.
I believe our site’s edge is the accountability and transparency we offer. By tracking every trade in real-time, we were forced into instant accountability on every action we were taking. What resulted was rapid self-improvement, similar to athletes who track every mile they run, or every swing of the bat. By measuring every single daily action, our accountability went through the roof as did our drive to improve.
Real-time trade alerts and an audited performance are extremely uncomfortable when you’re not performing well. However, it was this very thing that forced us to become better during a landslide in tech.
We made the case that this is partly why retail performs so poorly. There are simply too few resources available that mirror what real money managers do. With that said, most professional money managers resemble what Knox does on the I/O Fund site, which is actively managing positions, with lots of activity, pivots and course corrections. This is the reality even if Retail is sold on utopian idea that you can buy one stock and hold into eternity. In some cases, this is the correct thing to do, but it’s rare.
2022 Was Still Negative = The I/O Fund Has More Work to Do
In our webinar, we pointed out the Lessons Learned from 2022. The methodologies and processes from pre-2022 simply weren’t working, and perhaps due to our high level of accountability, we felt this more than most. For a live presentation on this important pivot plus the Lessons We Learned from 2022, please reference our premium webinar here.
Here is a brief summary, the full list can be found/heard on the webinar.
Lack of flexibility was our number one mistake last year. We need to be more willing to change.
Cold, Hard Facts Vs Hopium. We were ignoring obvious facts and relying on hopium instead (hopium most dangerous around earnings)
100% Offensive instead of a mix of Defensive = put making money above protecting money
How the I/O Fund Sets a High Bar for Accountability
In addition to a lack of risk management tools, we believe a lack of verified returns in the retail space contributes to the losses this investor type experiences. Smart money is careful about who they consider a good investor — they do not take someone’s word they are a good investor; they make the investors or firms they follow prove it. Every single hedge fund has to report their returns, which reduces the chances of posturing.
Retail is not offered these checks and balances, and instead, this investor type follows many influencers and research sites who verbally state their performance without proper verification. Across the board, retail is offered a very low amount of accountability – this includes unverified month-end reviews, a list of stock tickers, unchecked screenshots, or other methods that are easy to manipulate. This widespread acceptance of loosely stating a stock performance is odd, to say the least, considering the finance industry is more inclined than any other industry toward deceptive practices.
Over the past three years, the I/O Fund has invested over $130,000 into accountability and transparency for our Members. When we launched in July of 2019, for the first year or so, we used a forum hosted by Tribe for our trade alerts, but by January of 2021, we had migrated to SMS and email tools that were the least likely to experience an outage for our real-time trade alerts. This costs us $40,000 per year.
In addition to this, we use an auditor from a large firm in San Francisco to mathematically review and verify the performance of our I/O Fund portfolio trading account and crypto account. The process is quite extensive and it takes up to four months to complete. This costs $4,500 per audit and we’ve completed four audits for a total of $18,000 spent on this process.
We want to thank our members for believing in a small team that is focused on beating Wall Street. The sense of community we all have created together and the support we received during a tough 2022 was extraordinary. When we launched our retail-focused fund, we aspired to bring institutional level research to investors by forming a small, focused team that cares very much about their chosen specialty. We continue to improve upon our processes and look to strengthen our returns going forward.
Please note: The I/O Fund conducts research and draws conclusions for the Fund’s positions. We then share that information with our readers. This is not a guarantee of a stock’s performance. Please consult your personal financial advisor before buying any stock in the companies mentioned in this analysis.
We’ve issued a press release today in BusinessWire on our full year 2022 returns, which you can find here.
Due to a 180-degree pivot in May, the I/O Fund ended the year at (38.8%). This places us within roughly 6% of the Nasdaq-100 (NDX) which helps illustrate the comeback that occurred starting in May. Typically, in a risk-off environment, the indexes are known to protect investors to the downside. It also helps to gauge the overall cost of owning tech in a historic year for losses in the stock market. Meaning, even the most conservative tech investors lost (32.9%) in 2022, defined by those that hold their exposure to NDX through QQQ.
Notably, losses are geometric in nature, so a portfolio that is down (67%) has to go up 85% to catch up with our 2022 performance of (38.8%). To catch up with the I/O Fund compared to other all-tech portfolios since inception, you’d have to make up 174%.
Our 2022 relative outperformance followed an outperformance in 2021, with gains of 11.4% compared to many tech funds that were down (23%) or more. On a cumulative basis, we currently have the largest lead over Ark that we’ve ever had since inception.
Ark is not the only all-tech portfolio peer that we are outperforming on a cumulative basis. The portfolios listed below are managed by highly regarded portfolio managers, are reserved for high-wealth individuals only, and have billions of assets under management (AuM).
“If you had invested $10,000 with the I/O Fund's picks versus other all-tech portfolios at inception, the difference would be a portfolio value of $14,692 with IOF versus $5,358 with institutional tech-focused portfolios. The difference in value is 174%”
Our mission statement is to help Retail beat Wall Street in the challenging sector of technology.
When we set out on this mission, it was purely an experiment. The statistics show that Retail often fails to such a high degree that we felt any improvement here would be worth the attempt.
Past performance is not a guarantee of future performance. The I/O Fund is a publishing company. The analysts are not money managers and we are not financial advisors. Please consult with your financial advisor for every trade you do.
A few important stats on our Performance:
The I/O Fund announces a cumulative return of 46.92% since inception versus the Nasdaq-100’s 18.65% return during the same time period.
The I/O Fund’s cumulative returns of 46.92% have more than doubled the Nasdaq since 2020 with an outperformance of 28.27%
I/O Fund’s 2022 performance of (38.8%) rivaled the Nasdaq-100 performance of (32.9%)
The I/O Fund’s relative outperformance in 2022 surpassed institutional all-tech portfolios by as much as 85%
Since inception, the I/O Fund has a lead over institutional technology portfolios by as much as 174%
Please note, anything stated outside of our performance review are estimates.The only official, verified number we provide is from the Engagement Letter listed below of (38.8%).
AEHR: 6% Allocation in October-December
NFLX: 9% Allocation in October-December
NVDA: 10% Allocation throughout 2022 with active management
Hedge: mitigated some of the largest drops after April. The biggest moves from our hedge in 2022 are below. The green indicates periods where we mitigated the drawdowns, while red indicates periods where we had to close our hedge for a loss.
Hedging
In an environment where the odds can be stacked against Retail, the I/O Fund is committed to leveraging tools that institutional-level money managers are unable to leverage.
The primary tool we leveraged for Retail in 2022 was hedging. In 2021, the tool we leveraged for Retail was to actively manage crypto. A few of the all-tech portfolios listed in our comparison chart are not able to leverage these tools. For example, ETFs such as QQQ (tracks the NASDAQ-100) and ARKK do not hedge and do not hold crypto.
In 2022 we partnered with Vincent Duchaine of WealthUmbrella. The automated hedge that Duchaine built helped the I/O Fund close the gap between human-driven actions and emotionless machines. This marked an important turnaround for our firm as we gave up what I would call “retail idealism” which centers around the idea that holding a stock for a long period of time is retail’s only defense. This works during times of economic expansion, but this can go (horribly) wrong when a new, more challenging macro can change the outlook for any given company.
I’ll be the first to point out that success is a team effort, and these Knox and Vincent repeatedly ran the ball into the end zone in the third and fourth quarter. If half the battle is just showing up, then most of you noticed Knox and Vincent did not let our Members down in this regard.
April of 2022 marks the end of the I/O Fund relying on stock picks as the primary, offensive measure. It marks the beginning of what I would call IOF 2.0, more officially known as “man and machine” and “woman and machine.” After partnering with WealthUmbrella on an automated hedge, the I/O Fund hedged successfully up to 100% of our portfolio, at times.
We pivoted to playing defense rather than offense. Those who watch team sports will understand this transition well, as the strategy changes from attempting to make money (or make a goal) to a strategy that prevents losses (or prevents a goal).
With Vincent’s help, the I/O Fund has reduced whipsaws. The automation tool has also freed up Knox’s time to work on broad market and identify circuit breakers, which are the broad market levels that must hold. Together, these two launched an incredible tool for retail.
Performance Review
Below is the engagement letter from the firm that reviews and verifies our performance. Our terms and conditions with the accounting firm state that this engagement letter is to only be shared with paying customers. For that reason, our performance letter resides behind our paywall.
With that said, any paying customer can access the engagement letter which is posted on io-fund.com/premium and io-fund.com/essentials for this purpose.
The I/O Fund owns the performance review and we do not authorize our customers or any person on our site to share a confidential engagement letter or performance review outside of our paywall. As the owner of the report, we will at times market our performance number outside of the paywall. The terms and conditions can be found here.
The I/O Fund Experiment
Our site and services remain an experiment to see if Retail can beat Wall Street. There is no guarantee the experiment will work out in the future. Humility is the one adjective that best describes the market and we had a heavy dose of this last May.
I believe our site’s edge is the accountability and transparency we offer. By tracking every trade in real-time, we were forced into instant accountability on every action we were taking. What resulted was rapid self-improvement, similar to athletes who track every mile they run, or every swing of the bat. By measuring every single daily action, our accountability went through the roof as did our drive to improve.
Real-time trade alerts and an audited performance are extremely uncomfortable when you’re not performing well. However, it was this very thing that forced us to become better during a landslide in tech.
We made the case that this is partly why retail performs so poorly. There are simply too few resources available that mirror what real money managers do. With that said, most professional money managers resemble what Knox does on the I/O Fund site, which is actively managing positions, with lots of activity, pivots and course corrections. This is the reality even if Retail is sold on utopian idea that you can buy one stock and hold into eternity. In some cases, this is the correct thing to do, but it’s rare.
2022 Was Still Negative = The I/O Fund Has More Work to Do
In our webinar, we pointed out the Lessons Learned from 2022. The methodologies and processes from pre-2022 simply weren’t working, and perhaps due to our high level of accountability, we felt this more than most. For a live presentation on this important pivot plus the Lessons We Learned from 2022, please reference our premium webinar here.
Here is a brief summary, the full list can be found/heard on the webinar.
Lack of flexibility was our number one mistake last year. We need to be more willing to change.
Cold, Hard Facts Vs Hopium. We were ignoring obvious facts and relying on hopium instead (hopium most dangerous around earnings)
100% Offensive instead of a mix of Defensive = put making money above protecting money
Complacent that tech (FAANGs) will always lead
Retiring the term LTBH and simply referring to it as “I/O Fund Portfolio”
How the I/O Fund Sets a High Bar for Accountability
In addition to a lack of risk management tools, we believe a lack of verified returns in the retail space contributes to the losses this investor type experiences. Smart money is careful about who they consider a good investor — they do not take someone’s word they are a good investor; they make the investors or firms they follow prove it. Every single hedge fund has to report their returns, which reduces the chances of posturing.
Retail is not offered these checks and balances, and instead, this investor type follows many influencers and research sites who verbally state their performance without proper verification. Across the board, retail is offered a very low amount of accountability – this includes unverified month-end reviews, a list of stock tickers, unchecked screenshots, or other methods that are easy to manipulate. This widespread acceptance of loosely stating a stock performance is odd, to say the least, considering the finance industry is more inclined than any other industry toward deceptive practices.
Over the past three years, the I/O Fund has invested over $130,000 into accountability and transparency for our Members. When we launched in July of 2019, for the first year or so, we used a forum hosted by Tribe for our trade alerts, but by January of 2021, we had migrated to SMS and email tools that were the least likely to experience an outage for our real-time trade alerts. This costs us $40,000 per year.
In addition to this, we use an auditor from a large firm in San Francisco to mathematically review and verify the performance of our I/O Fund portfolio trading account and crypto account. The process is quite extensive and it takes up to four months to complete. This costs $4,500 per audit and we’ve completed four audits for a total of $18,000 spent on this process.
We want to thank our members for believing in a small team that is focused on beating Wall Street. The sense of community we all have created together and the support we received during a tough 2022 was extraordinary. When we launched our retail-focused fund, we aspired to bring institutional level research to investors by forming a small, focused team that cares very much about their chosen specialty. We continue to improve upon our processes and look to strengthen our returns going forward.
It may feel like the words “Google” and “lawsuit” are commonplace, but the trial in September carries enormous weight and is unlike the lawsuits of the past. Not only do we want to keep an eye on ad-tech names that could benefit should Google’s monopoly be broken up and the juggernaut come out weaker, but we also want to be prepared if the tech giant is able to hold off regulators.
Considering that Google is sitting on the world’s very best consumer data, which is not an exaggeration in the least bit, its ability to lead on artificial intelligence and large language models should not be underestimated. For our purposes, the company is far from sitting on its laurels and there’s a predictable path where the company competes in a duopoly with Microsoft.
Therein lies the issue. Google undisputedly has the world’s best consumer data, but did this grow to become part and parcel with operating a monopoly? The Department of Justice has asserted anti-trust violations against Google with the trial beginning in September 2023. The trial is expected to last ten to 12 weeks, although a lawyer for the DOJ told CNBC it could be as brief as five weeks.
Why it matters:
With Google and other ad-tech companies trading this low, one of two outcomes will happen. The antitrust outcome will be mild, and Google will be empowered to continue to dominate. Or, the outcome will require the ad properties to be broken up, leading to a weaker stance for Google. This could benefit smaller ad-tech players.
The Goal — Looking back:
A few years back, I analyzed the potential outcome of a government decision when the Pentagon was evaluating cloud providers. Clearly, this decision is far outside of anyone’s control and requires some speculation. At the time, I speculated Azure would be a winner. For a year or so, Microsoft did secure the Pentagon contract over the more-favored Amazon. This decision was ultimately reversed, and the contract was split between four tech companies.
The exact outcome of the Pentagon contract was not particularly important because the analysis led to my conclusion that Microsoft’s hybrid computing was a material advantage and this would be the path Nadella would most likely use to take market share from AWS’s heavily-slanted public cloud strategy.
I’m hoping for something similar, which is to acknowledge something very important is going on with ad-tech, which is Google’s antitrust case. This is not a headline to simply dismiss. It’s the first time the DOJ has brought a case of this kind against a technology company since Microsoft. If there are even minor cracks in Google’s monopoly, there could stand to be a stock or two that starts a new trajectory.
On similar note, Cambridge Analytica is what sparked my coverage on Facebook. Similar to Google’s antitrust case, it became apparent to me that Facebook was peaking in terms of its ability to monetize through third party data. I covered this extensively, for example here and here.
Brief Overview of Antitrust Case:
According to Lanier Law Firm, which is the litigation team for the State of Texas in the state coalition case, a primary argument against Google is that the company went above and beyond to become the default search engine on iOS devices by paying Apple $12 billion per year.
The lawsuit includes other deals that Google struck with Apple’s Safari browser, the Mozilla browser and Android device manufacturers where Google either paid up or imposed restrictions on Android device makers to strongarm having their suite of apps pre-installed on the home screen.
The company has already lost an antitrust case in Europe in 2018 with a $4.4 billion Euro fine for forcing Android manufacturers to pre-install Google’s bundle of apps on the device, including Chrome, Maps and the Play Store.
Google’s market share of Search is at 91% and the argument is being made this was accomplished through anti-competitive practices, especially since Google owns Android and had leverage over the many device makers that used this operating system.
In addition to being pre-installed and the default browser/search engine, Google also attempts to keep people on its search engine by using a website’s data on its page. For example, if you look up “Best Dog Breed” Google scrapes Wikipedia and puts the results onto the search page instead of sending you to Wikipedia. This is seen as anti-competitive as it takes a website’s data to profit from it, rather than directing the traffic to the rightful copyright owner, which is the function of a search engine.
Part of Microsoft’s antitrust case was based on Microsoft using its dominance on Windows to force a Microsoft Explorer to be the default browser. At the time, the decision was that default settings are anticompetitive.
The secondary argument filed by a 10-state group led by Texas, is that Google leverages its properties to be the buyer and the seller via its ad exchange. Per Lanier Law Firm, the Texas case states Google and Facebook “unreasonably restrained trade and harmed competition through an unlawful agreement to allocate auction wins and to fix prices in violation of Section 1 of the Sherman Act, 15 U.S.C. § 1”
This is where it gets very messy, and so I’ve dedicated a specific section below to break down these details. The purpose of understanding the minutiae is not to only determine if we should buy Google and when, but also what companies could stand to benefit if Google’s products are shutdown or broken up.
My long-ago analysis on Facebook pointed toward a conflict of interest in the company owning a third-party ad network called Audience Network while also being publisher. At the very least, the conflict of interest created a risk since Facebook was essentially siphoning oil from real estate the company didn’t own (iOS users). This was a serious, material risk for investors that played out over time (note: it certainly wasn’t immediate, it took four years from the first time I covered the topic).
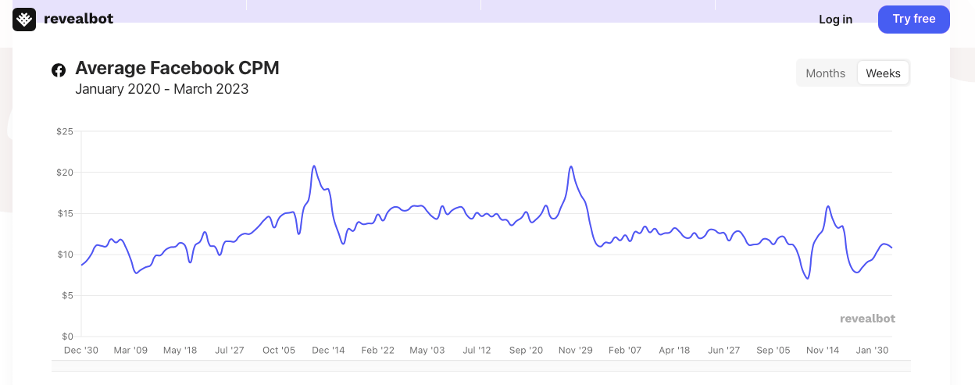
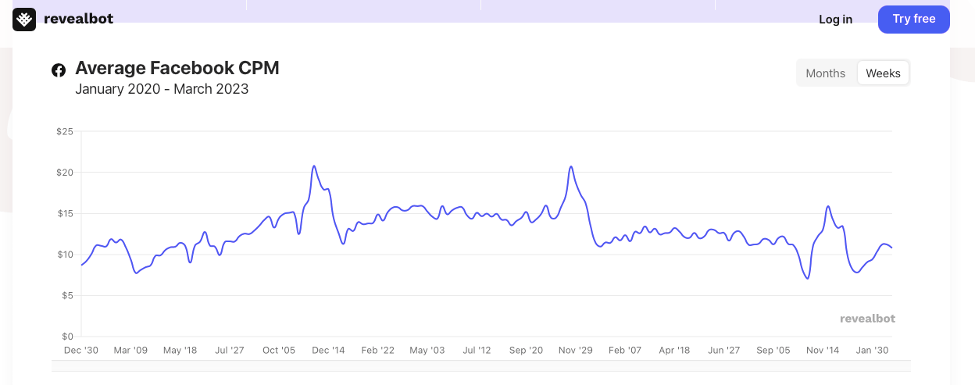
If you’re a Meta investor, you’ll want to watch the CPMs on the company and make sure the erosion below is not permanent. Despite Apple only impacting third-party data, it’s unclear how much of that third-party data was informing its first party data. The unusually high CPMs that Meta charged points towards enhanced targeting – that in my opinion – was likely due to mixing both first-party data with third-party data. This means there will be an eventual erosion, over time, of the CPMs Facebook can charge even on its own applications.
Pictured above: Although subtle, there is an erosion to Facebook’s otherwise high CPMs. You can see that Nov 2022 made a lower high over Black Friday compared to the two previous years. Many factors could be at play, such as lower ad budgets, but it’s something investors should keep a close eye on.
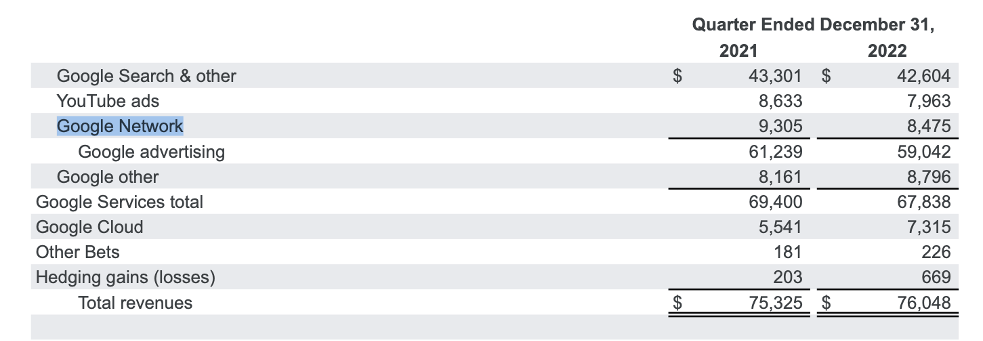
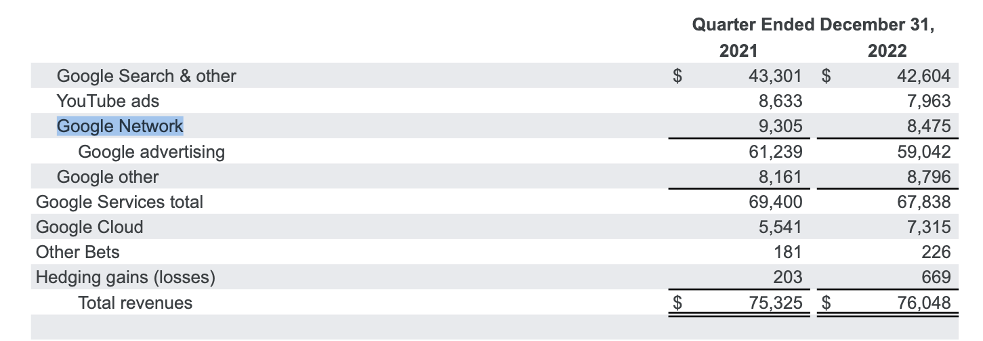
Google currently does the same thing that Facebook used to do, which is to run an ad exchange that is undeniably a conflict of interest. The difference is that rather than renting real estate, like Facebook did with iOS, Google is a real estate tycoon. There isn’t a tech company that can kick Google off their turf because Google owns all of the turf – primarily Chrome, Android, Google Search, and YouTube.cBy conflict of interest, I’m referring to AdX, DoubleClick and DV360, collectively known as the Google Network.
Below, you can see Google Network is a $32 billion annual revenue stream. Not exactly peanuts.
To further the lawsuit, a 30-state coalition has issued a third claim that Google uses its monopoly to rip off smaller companies, such as Yelp, DoorDash, and Kayak. You can see evidence of this when Google Search returns flight searches powered by Google at the top, with a large embedded format, rather than producing a fair search result that includes competitors. Yelp has been in a battle with Google over this for over a decade. After Google Reviews were launched, Google pushed Yelp down the page in terms of search results.
The two search engine allegations are fairly straight forward. Most of us who use Google Search can reasonably understand those arguments.
The Messy, Blackbox that is AdExchange (AdX):
DoubleClick was acquired in 2007 for $3.1 billion. As author Tony Yiu points out on Toward Data Science, this was twice the amount paid for YouTube a year earlier. Google Network is a by-product of many acquisitions including AdMob for $750 million and AdMeld for $400 million, among others, yet DoubleClick truly set the supply side dominance in motion as the company owned 60% of the desktop publisher market at the time of acquisition.
DoubleClick allows Google to set a cookie on a website so that online publishers can better target visitors with ads. The DoubleClick cookie provides the time and date a user saw an advertisement, as well as a unique ID that identifies a user by their browser. Publishers are then able to auction inventory to advertisers.
DoubleClick was a major move by Google to expand beyond search advertising. This was the first time Google entered the market on display ads. As stated, DoubleClick owned 60% of the publisher market when it was acquired, which means Google would eventually profit from monetizing millions of websites.
This led to a concentration of power for Google, because with this advantage, it was able to grow quickly as a predominant ad server for publishers. Naturally, Google wanted to maximize this advantage, and so the company made the appropriate acquisitions to operate on the demand side (advertiser side) in addition to the publisher side.
Through a series of acquisitions, Google built DV360, which allows advertisers to use their own data to target customers across publisher inventory. Google always has strong ties to data, in this case powering DV360 with Google Analytics 360. In addition to this, Google’s AdX allows advertisers to create campaigns across Google-owned properties in addition to millions of websites from third-party publishers on the DoubleClick publisher side, as mentioned above.
An easy analogy here would be to compare it to a real estate transaction, since ads are transactional between a buyer and seller. In this case, Google was representing both the buyer and the seller, and in some cases brokered its own real estate to the buyers. You can imagine due to Google’s scale of doing millions of transactions a day, things might get unethical real quick.
Here’s how a Google executive put it:
“[I]s there a deeper issue with us owning the platform, the exchange, and a huge network?” the executive allegedly asked. “The analogy would be if Goldman or Citibank owned the NYSE.”
With that in mind, let’s continue because the depth of Google’s black box is quite deep.
The product AdSense further pools the data provided by publishers. When millions of websites join AdSense to pool data, Google can record more information on a person’s browsing history. It provides a complete view of the consumer for more enhanced targeting. Another area that Google allegedly monopolizes the market is that the company mixes its first party data with this third party data, but only in instances where Google will benefit.
The AdMob acquisition in 2009 provided a similar strategy as DoubleClick but on mobile. It deepened Google’s reach on the supply side for the mobile market. This, of course, was especially advantageous considering Google bought Android in 2005.
You can imagine, that the depth of Google’s data on desktop users and mobile users is deep (and likely quite dark). Meaning, Google knows more about you than you know about yourself. Now, take that depth of data and add the serious conflict of interest that can occur when Google bids against competitors.
Where Google (Allegedly) Went Wrong with AdX
Despite the allegations below that Google was unethical, I want to point out that antitrust could be harder to prove for AdX. This is because many corporations combine first-party publisher data with a third-party ad exchange, such as Amazon, Facebook, Disney and Comcast. Microsoft is building its ad exchange, as well right now, after acquiring Xandr from AT&T. However, Xandr/Microsoft’s strategy is to support the “free and open web” by adopting the Unified ID.
Point being, if the product AdX is found to be anticompetitive, it could have far-reaching implications for other companies. This wasn’t the case with Microsoft, as the company was rather isolated on its throne in the late 90s. With that said, Google is the worst offender in terms of the sheer advantages it has compared to other corporations with large media properties.
Here are some of the more unethical things Google is being accused of:
According to the lawsuit, there was a 65% drop in revenue if publishers chose to not use Google on the demand side. Advertisers are also stating this was a conflict of interest as Google restricted inventory in this case. This would be like a real estate agent refusing to show a house if they did not have both the buyer and the seller to double-end the transaction.
Google also allegedly circumvented waterfall auctions to prioritize their own bids on AdX. Waterfalls were prevalent throughout the ecosystem because they allow exchanges to be ranked by bids. Based on historical bids, if the ad exchange in the number one position doesn’t buy the inventory, it goes to the next ad exchange in the waterfall (the number two position).
Where Google may have manipulated the bidding is by allowing their exchange to meet only floor prices to win the bid, even when another exchange would have bidded higher in a waterfall-like auction. This would be like a real estate agent only presenting their Buyer’s offer to a Seller even if they knew they could get higher offers from another agent.
Due to DoubleClick and AdX waterfalls having the issues described above, programmatic header bidding was introduced to offer true, real-time bidding to increase publisher yield. It essentially increased competition by holding an open auction rather than a closed, blackbox auction that pushes inventory back and forth in an attempt to sell the inventory.
Per Digiday written in 2015: “One notable side effect of header bidding adoption is that it puts pressure on Google’s DoubleClick for Publishers ad server, which, through its dynamic allocation feature, lets AdX — but no other exchange — see and bid on every impression.”
That sentence and general understandingand general understanding of what AdX did to manipulate the waterfall process nicely sums up where Google could face trouble in a courtroom. According to the lawsuit, publishers saw 30% to 40% more revenue through header bidding by simply removing Google’s ability to manipulate the waterfall auction. I bolded “general understanding” because Google is so powerful that the ad ecosystem knew full and well that it was using its monopoly in anticompetitive ways but there was nothing any publisher or advertiser could do about it.
Google has tens of thousands of engineers and is a very advanced company, which is why the allegations are quite complex. The lawsuit points out that Google then later manipulated header bidding by allowing AdX to bid last. As long as AdX beat the previous bids, then it would win the bid. Going back to the real estate agent scenario, this would be like having multiple offers on a house, and the listing agent going to their exclusive buyers to reveal what the prices are to help the buyers win the bidding war.
Google is also accused of using more acquisitions for ad technology that would later be leveraged to subsidize bids. This means Google paid the difference on an advertiser’s bid in order to be the winning bid. In this case, Google simply increased its margin or cut in order to make up for the amount that was subsidized.
Google’s DSP called DV360 was also allegedly engineered to decrease bids from competing ad exchanges, including those who were using header bidding for a more fair auction process. This was done by setting the highest competing bid at the floor price while AdX was able to bid higher.
Google is accused of suppressing header bidding through covert mechanisms by reducing header bids by up to 90%. Meanwhile, Google’s own DV360 bid was not decreased. This was done even when Publishers attempted to set a lower floor for competing ad exchanges, meaning, Publishers were without recourse even if they agreed to a lower bid.
Conclusion:
Given the sheer impact a weaker Google could have on the ad-tech ecosystem, we wanted to do a deep dive and get in front of this. I believe this is the number one catalyst across ad-tech this year and we want our readers to benefit no matter the outcome. As the market can often do, there may be some price movements ahead of the trial, and if so, we will be watching for entries closely.
We offer an Advanced service with specific stock picks that may benefit from Google’s lawsuit and we also offer real-time trade alerts for all of our portfolio entries and exits. You can learn more about this service here.about this service here.
We’d like to set our sights on a few ad-tech names that may benefit from the Google antitrust lawsuit. It may feel like the words “Google” and “lawsuit” are commonplace, but the trial in September carries enormous weight and is unlike the lawsuits of the past. Not only do we want to identify what ad-tech names could benefit should Google’s monopoly be broken up and the juggernaut come out weaker, but we also want to be prepared if the tech giant is able to hold off regulators.
Considering that Google is sitting on the world’s very best consumer data, which is not an exaggeration in the least bit, its ability to lead on artificial intelligence and large language models should not be underestimated. For our purposes, the company is far from sitting on its laurels and there’s a predictable path where the company competes in a duopoly with Microsoft.
Therein lies the issue. Google undisputedly has the world’s best consumer data, but did this grow to become part and parcel with operating a monopoly? The Department of Justice has asserted anti-trust violations against Google with the trial beginning in September 2023. The trial is expected to last ten to 12 weeks, although a lawyer for the DOJ told CNBC it could be as brief as five weeks.
Why it matters:
With Google and other ad-tech companies trading this low, one of two outcomes will happen. The antitrust outcome will be mild, and Google will be empowered to continue to dominate. Or, the outcome will require the ad properties to be broken up, leading to a weaker stance for Google. This could benefit smaller ad-tech players.
The Goal — Looking back:
A few years back, I analyzed the potential outcome of a government decision when the Pentagon was evaluating cloud providers. Clearly, this decision is far outside of anyone’s control and requires some speculation. At the time, I speculated Azure would be a winner. For a year or so, Microsoft did secure the Pentagon contract over the more-favored Amazon. This decision was ultimately reversed, and the contract was split between four tech companies.
The exact outcome of the Pentagon contract was not particularly important because the analysis led to my conclusion that Microsoft’s hybrid computing was a material advantage and this would be the path Nadella would most likely use to take market share from AWS’s heavily-slanted public cloud strategy.
I’m hoping for something similar, which is to acknowledge something very important is going on with ad-tech, which is Google’s antitrust case. This is not a headline to simply dismiss. It’s the first time the DOJ has brought a case of this kind against a technology company since Microsoft. If there are even minor cracks in Google’s monopoly, there could stand to be a stock or two that starts a new trajectory.
On similar note, Cambridge Analytica is what sparked my coverage on Facebook. Similar to Google’s antitrust case, it became apparent to me that Facebook was peaking in terms of its ability to monetize through third party data. I covered this extensively, for example here and here.
Brief Overview of Antitrust Case:
According to Lanier Law Firm, which is the litigation team for the State of Texas in the state coalition case, a primary argument against Google is that the company went above and beyond to become the default search engine on iOS devices by paying Apple $12 billion per year.
The lawsuit includes other deals that Google struck with Apple’s Safari browser, the Mozilla browser and Android device manufacturers where Google either paid up or imposed restrictions on Android device makers to strongarm having their suite of apps pre-installed on the home screen.
The company has already lost an antitrust case in Europe in 2018 with a $4.4 billion Euro fine for forcing Android manufacturers to pre-install Google’s bundle of apps on the device, including Chrome, Maps and the Play Store.
Google’s market share of Search is at 91% and the argument is being made this was accomplished through anti-competitive practices, especially since Google owns Android and had leverage over the many device makers that used this operating system.
In addition to being pre-installed and the default browser/search engine, Google also attempts to keep people on its search engine by using a website’s data on its page. For example, if you look up “Best Dog Breed” Google scrapes Wikipedia and puts the results onto the search page instead of sending you to Wikipedia. This is seen as anti-competitive as it takes a website’s data to profit from it, rather than directing the traffic to the rightful copyright owner, which is the function of a search engine.
Part of Microsoft’s antitrust case was based on Microsoft using its dominance on Windows to force a Microsoft Explorer to be the default browser. At the time, the decision was that default settings are anticompetitive.
The secondary argument filed by a 10-state group led by Texas, is that Google leverages its properties to be the buyer and the seller via its ad exchange. Per Lanier Law Firm, the Texas case states Google and Facebook “unreasonably restrained trade and harmed competition through an unlawful agreement to allocate auction wins and to fix prices in violation of Section 1 of the Sherman Act, 15 U.S.C. § 1”
This is where it gets very messy, and so I’ve dedicated a specific section below to break down these details. The purpose of understanding the minutiae is not to only determine if we should buy Google and when, but also what companies could stand to benefit if Google’s products are shutdown or broken up.
My long-ago analysis on Facebook pointed toward a conflict of interest in the company owning a third-party ad network called Audience Network while also being publisher. At the very least, the conflict of interest created a risk since Facebook was essentially siphoning oil from real estate the company didn’t own (iOS users). This was a serious, material risk for investors that played out over time (note: it certainly wasn’t immediate, it took four years from the first time I covered the topic).
If you’re a Meta investor, you’ll want to watch the CPMs on the company and make sure the erosion below is not permanent. Despite Apple only impacting third-party data, it’s unclear how much of that third-party data was informing its first party data. The unusually high CPMs that Meta charged points towards enhanced targeting – that in my opinion – was likely due to mixing both first-party data with third-party data. This means there will be an eventual erosion, over time, of the CPMs Facebook can charge even on its own applications.
Pictured above: Although subtle, there is an erosion to Facebook’s otherwise high CPMs. You can see that Nov 2022 made a lower high over Black Friday compared to the two previous years. Many factors could be at play, such as lower ad budgets, but it’s something investors should keep a close eye on.
Google currently does the same thing that Facebook used to do, which is to run an ad exchange that is undeniably a conflict of interest. The difference is that rather than renting real estate, like Facebook did with iOS, Google is a real estate tycoon. There isn’t a tech company that can kick Google off their turf because Google owns all of the turf – primarily Chrome, Android, Google Search, and YouTube.cBy conflict of interest, I’m referring to AdX, DoubleClick and DV360, collectively known as the Google Network.
Below, you can see Google Network is a $32 billion annual revenue stream. Not exactly peanuts.
To further the lawsuit, a 30-state coalition has issued a third claim that Google uses its monopoly to rip off smaller companies, such as Yelp, DoorDash, and Kayak. You can see evidence of this when Google Search returns flight searches powered by Google at the top, with a large embedded format, rather than producing a fair search result that includes competitors. Yelp has been in a battle with Google over this for over a decade. After Google Reviews were launched, Google pushed Yelp down the page in terms of search results.
The two search engine allegations are fairly straight forward. Most of us who use Google Search can reasonably understand those arguments.
The Messy, Blackbox that is AdExchange (AdX):
DoubleClick was acquired in 2007 for $3.1 billion. As author Tony Yiu points out on Toward Data Science, this was twice the amount paid for YouTube a year earlier. Google Network is a by-product of many acquisitions including AdMob for $750 million and AdMeld for $400 million, among others, yet DoubleClick truly set the supply side dominance in motion as the company owned 60% of the desktop publisher market at the time of acquisition.
DoubleClick allows Google to set a cookie on a website so that online publishers can better target visitors with ads. The DoubleClick cookie provides the time and date a user saw an advertisement, as well as a unique ID that identifies a user by their browser. Publishers are then able to auction inventory to advertisers.
DoubleClick was a major move by Google to expand beyond search advertising. This was the first time Google entered the market on display ads. As stated, DoubleClick owned 60% of the publisher market when it was acquired, which means Google would eventually profit from monetizing millions of websites.
This led to a concentration of power for Google, because with this advantage, it was able to grow quickly as a predominant ad server for publishers. Naturally, Google wanted to maximize this advantage, and so the company made the appropriate acquisitions to operate on the demand side (advertiser side) in addition to the publisher side.
Through a series of acquisitions, Google built DV360, which allows advertisers to use their own data to target customers across publisher inventory. Google always has strong ties to data, in this case powering DV360 with Google Analytics 360. In addition to this, Google’s AdX allows advertisers to create campaigns across Google-owned properties in addition to millions of websites from third-party publishers on the DoubleClick publisher side, as mentioned above.
An easy analogy here would be to compare it to a real estate transaction, since ads are transactional between a buyer and seller. In this case, Google was representing both the buyer and the seller, and in some cases brokered its own real estate to the buyers. You can imagine due to Google’s scale of doing millions of transactions a day, things might get unethical real quick.
Here’s how a Google executive put it:
“[I]s there a deeper issue with us owning the platform, the exchange, and a huge network?” the executive allegedly asked. “The analogy would be if Goldman or Citibank owned the NYSE.”
With that in mind, let’s continue because the depth of Google’s black box is quite deep.
The product AdSense further pools the data provided by publishers. When millions of websites join AdSense to pool data, Google can record more information on a person’s browsing history. It provides a complete view of the consumer for more enhanced targeting. Another area that Google allegedly monopolizes the market is that the company mixes its first party data with this third party data, but only in instances where Google will benefit.
The AdMob acquisition in 2009 provided a similar strategy as DoubleClick but on mobile. It deepened Google’s reach on the supply side for the mobile market. This, of course, was especially advantageous considering Google bought Android in 2005.
You can imagine, that the depth of Google’s data on desktop users and mobile users is deep (and likely quite dark). Meaning, Google knows more about you than you know about yourself. Now, take that depth of data and add the serious conflict of interest that can occur when Google bids against competitors.
Where Google (Allegedly) Went Wrong with AdX
Despite the allegations below that Google was unethical, I want to point out that antitrust could be harder to prove for AdX. This is because many corporations combine first-party publisher data with a third-party ad exchange, such as Amazon, Facebook, Disney and Comcast. Microsoft is building its ad exchange, as well right now, after acquiring Xandr from AT&T. However, Xandr/Microsoft’s strategy is to support the “free and open web” by adopting the Unified ID.
Point being, if the product AdX is found to be anticompetitive, it could have far-reaching implications for other companies. This wasn’t the case with Microsoft, as the company was rather isolated on its throne in the late 90s. With that said, Google is the worst offender in terms of the sheer advantages it has compared to other corporations with large media properties.
Here are some of the more unethical things Google is being accused of:
According to the lawsuit, there was a 65% drop in revenue if publishers chose to not use Google on the demand side. Advertisers are also stating this was a conflict of interest as Google restricted inventory in this case. This would be like a real estate agent refusing to show a house if they did not have both the buyer and the seller to double-end the transaction.
Google also allegedly circumvented waterfall auctions to prioritize their own bids on AdX. Waterfalls were prevalent throughout the ecosystem because they allow exchanges to be ranked by bids. Based on historical bids, if the ad exchange in the number one position doesn’t buy the inventory, it goes to the next ad exchange in the waterfall (the number two position).
Where Google may have manipulated the bidding is by allowing their exchange to meet only floor prices to win the bid, even when another exchange would have bidded higher in a waterfall-like auction. This would be like a real estate agent only presenting their Buyer’s offer to a Seller even if they knew they could get higher offers from another agent.
Due to DoubleClick and AdX waterfalls having the issues described above, programmatic header bidding was introduced to offer true, real-time bidding to increase publisher yield. It essentially increased competition by holding an open auction rather than a closed, blackbox auction that pushes inventory back and forth in an attempt to sell the inventory.
Per Digiday written in 2015: “One notable side effect of header bidding adoption is that it puts pressure on Google’s DoubleClick for Publishers ad server, which, through its dynamic allocation feature, lets AdX — but no other exchange — see and bid on every impression.”
That sentence and general understandingand general understanding of what AdX did to manipulate the waterfall process nicely sums up where Google could face trouble in a courtroom. According to the lawsuit, publishers saw 30% to 40% more revenue through header bidding by simply removing Google’s ability to manipulate the waterfall auction. I bolded “general understanding” because Google is so powerful that the ad ecosystem knew full and well that it was using its monopoly in anticompetitive ways but there was nothing any publisher or advertiser could do about it.
Google has tens of thousands of engineers and is a very advanced company, which is why the allegations are quite complex. The lawsuit points out that Google then later manipulated header bidding by allowing AdX to bid last. As long as AdX beat the previous bids, then it would win the bid. Going back to the real estate agent scenario, this would be like having multiple offers on a house, and the listing agent going to their exclusive buyers to reveal what the prices are to help the buyers win the bidding war.
Google is also accused of using more acquisitions for ad technology that would later be leveraged to subsidize bids. This means Google paid the difference on an advertiser’s bid in order to be the winning bid. In this case, Google simply increased its margin or cut in order to make up for the amount that was subsidized.
Google’s DSP called DV360 was also allegedly engineered to decrease bids from competing ad exchanges, including those who were using header bidding for a more fair auction process. This was done by setting the highest competing bid at the floor price while AdX was able to bid higher.
Google is accused of suppressing header bidding through covert mechanisms by reducing header bids by up to 90%. Meanwhile, Google’s own DV360 bid was not decreased. This was done even when Publishers attempted to set a lower floor for competing ad exchanges, meaning, Publishers were without recourse even if they agreed to a lower bid.
Possible Outcomes
The outcome that many competing supply-side platforms (SSPs) and demand-side platforms (DSPs) are hoping for is the adoption of the Unified Ad ID 2.0 (UID2). There are many investors in The Trade Desk on our site, so this term is likely very familiar to our IOF Members.
The Unified Ad ID is essentially a replacement for cookies that uses email-based identifiers. There are a few hurdles here, such as users would have to opt-in and it brings up privacy issues to have ad exchanges passing a more persistent signal, such as anonymized IDs based on emails. What UID does solve for is any anticompetitive practices as there are many companies in the ecosystem that have signed on to support the open web initiative.
There are more companies than just The Trade Desk that would benefit if this happens – companies like Magnite, PubMatic, Microsoft/Xandr, to name a few.
To be clear, I’m not sure UID2 is realistic because of the privacy hurdles. The ad ecosystem may be “all-in”, but consumers are not likely to opt-in to having a persistent signal.
Another possible outcome is that Google Network is not broken up because what the company did was perhaps unethical but not anticompetitive since many corporations do something similar – which is mix first-party data with third-party data, and otherwise wield their large, corporate publisher dominance.
Instead, there could be regulations that force more transparency in the pricing structure. Or, perhaps Google has to choose a side in the transaction (publisher or advertiser) but cannot serve both.
It’s also possible that Google is not allowed to compete as a Search Engine across other verticals, such as flights, reviews, or dining reservations and must direct the traffic to web pages.
Companies that Challenge the Walled Garden
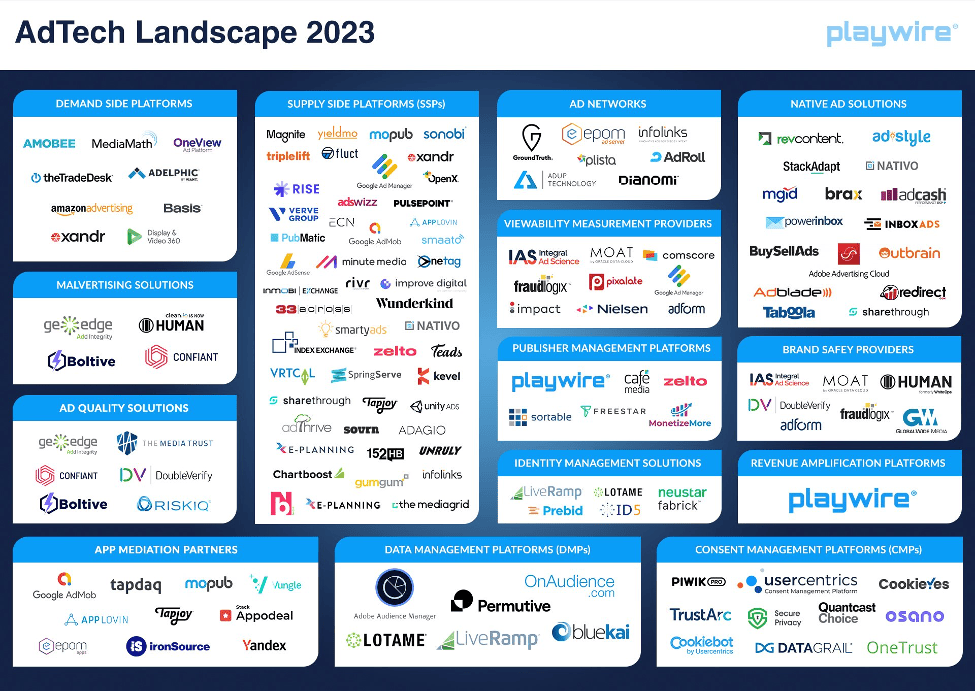
The ad ecosystem is quite large, although there are only a handful of public companies for us to discuss. Below is a view of the 2023 ecosystem per Publisher Management company Playwire. Most of these companies stand to benefit in some manner should Google be broken up or otherwise made weaker.
As stated, Google Network generated $32.8 billion in 2022. The DOJ is asking for divestiture ‘at minimum’ to divest the Google Ad Manager, including its publisher ad server (DFP) and the ad exchange (AdX).
In addition, the search engine is in the crosshairs for anti-competitive behavior, such as requiring mobile OEMs to make Google the default search engine. When Microsoft did this by requiring Microsoft Explorer to be the default browser across PCs, the behavior was found to be anti-competitive.
We believe the following companies stand to benefit:
Perion Network is partnered with Microsoft Bing. For this reason, the company is considered a beneficiary of Chat-GPT. If Google Search is forced to play fair, it’s likely Bing would see an incremental increase in its market share. In addition to this, Perion does not rely on cookies. As cookies are phased out, ETA around Jan 2024 (assuming no further delays), Perion will stand out in this regard, as well. Perion uses search intent insights to create audiences or “SmartGroups” for targeting purposes. Perion can help any search function, so imagine the search you might perform on Pinterest or Expedia. This is unique because search intent is often a superior signal compared to other forms of behavioral targeting.
The Trade Desk sits on the demand side and is in direct competition with Google’s DSP. If Google has been strongarming publishers into using its exchange for ads, per the allegations noted above, then breaking this up would be an immediate tailwind to The Trade Desk. Essentially, Google is penalizing publishers in various ways if they use another DSP.
If it becomes a more equitable ecosystem, to where publishers are rewarded equally no matter which DSP they use, then The Trade Desk will be able to fairly compete with Google on their publisher inventory. This assumes that Google will be able to keep the supply side ad machine it acquired from DoubleClick for Publishers. Clearly, The Trade Desk has done well in a walled garden environment despite all odds. It’s reasonable to assume The Trade Desk will do better if those walled gardens become weaker.
Notably, as stated above, The Trade Desk has two hurdles – the second one being the elimination of cookies and IDs. This is a separate issue entirely and does not relate to the antitrust case, it just happens to be timed to where the antitrust case is in 2023 and cookies will be phased out in 2024.
The goal is for Unified ID to be accepted as part of the open web, but there are privacy hurdles here that don’t relate to anticompetitive practices. In 2021, 96% of iOS users opted-out of tracking. The same can happen to UID 2.0. In other words, Google could be broken up but this may not do much for allowing the demand-side to access third-party IDs for attribution and measurement.
Magnite and PubMatic compete with Google on the supply side. Publishers have an outsized advantage when they use Google on the publisher side as the company mixes its first party data with third party data to drive the industry’s best targeting. Similar to Meta’s Audience Network covered here, it’s nearly impossible to compete as a SSP when a publisher of Google’s magnitude combines its data and brokers for a pool of publishers.
If this is broken up, then those who specialize on the publisher side — while also not directly competing with publishers — stand to benefit. Because Google is the largest publisher in the world while also competing with smaller publishers for ad inventory, it seems a likely outcome will be the breakup of the SSP side, at the very least.
The hurdle the SSP side must clear is that many corporations do this – with that said, Google is by far the largest offender due to its commanding properties of Android, Chrome, Search and YouTube. It’s also not clear if the other corporations (Comcast, Disney, etc.) have leveraged their position to penalize publishers who use other SSPs.
Ad-Tech Fundamentals
Below, we go into brief overviews of each company’s financials. The goal of combing over these companies during a lull in earnings is to accomplish a few things. First, to acknowledge that this antitrust lawsuit should not be overlooked. The ramifications could be quite advantageous to a few small cap companies. Secondly, to cautiously watch the charts ahead of the trial. We don’t want to front run but we also don’t want to be complacent. Third, is to understand Google a bit more. In the avalanche of Chat-GPT coverage, we want to be realistic about a potential position in Google, and look at the brass tacks of this important lawsuit.
Ultimately, I believe the outcome of the antitrust lawsuit is more important than the hype of the chatbots in the near term – that goes for both Google Search and Bing. AI chatbots are great for early adopters but search engines serve the masses. In addition to this, considering Google Network is worth $32 billion, and we have some small caps that could stand to benefit, we want to be prepared if there is a favorable outcome for the smaller players.
Perion Network
Perion Network is a digital advertising company headquartered in Holon, Israel. The company offers digital solutions in three primary channels of digital advertising: ad search, social media, and display/video/CTV advertising.
Perion helps brands and publishers to identify and reach customers through the company’s proprietary Intelligent HUB (iHub), which processes billions of signals, and powers the cookieless solution SORT. By mixing contextual data with user insights, Perion is able to forego cookies by using this data with AI-based clustering techniques. SORT stands for Smart Optimization of Responsive Traits, which translates to categorizing customers into 1 of 30 Smart Groups through shared traits.
The primary sources of data are contextual – so what a customer is reading at the moment, why they’re reading it, how long they’re reading it and/or what search words brought them to the content. This is combined with signals such as time of day, weather, browser, device, etc. Ultimately, what Perion’s technology does is calculates the similarities between groups, and then to target the group that performs the highest in terms of converting. The model is deemed effective when one group has a significantly higher click-through-rate (CTR).
Second, SORT then optimizes the bids so that it’s a cost-effective solution. SORT analyzes the bid of each publisher and selects the price that is likely to win. If the price is too high, SORT finds another publisher with a similar audience as the SmartGroup. The entire process happens in real-time.
Doron Gerstel, CEO of the company, said in the Q2 2022 earnings call, “iHub sits in the center of the supply and the demand side of the market. This is an innovative model that no one else in the industry has, aggregate data signals from all channels and from both sides of the open web to create the model that eliminates waste and rewards clients. The data goes into Perion’s privacy first cookieless solution known as SORT.”
This is important because cookies are expected to be phased out from Chrome in 2024. Cookies have already been phased out by Mozilla Firefox and Apple Safari.
In addition to this, Perion has partnered with Microsoft Bing. CodeFuel is the Perion product that powers intent-based monetization. When you go to search for something on a search engine, Perion’s CodeFuel can power the search results in an optimal way for conversion. This has led to a strategic partnership between Microsoft and Perion that was renewed in 2020 for four years.
Per the recent earnings call, “If the new Bing search with ChatGPT sparks even modest share gains, Microsoft can do very well in the business. As their CFO, Amy Hood said yesterday, every percentage point of share it gains in search equals roughly $2 billion in additional advertising revenue, and as a strategic partner of Microsoft Bing, I’m sure we will be benefiting from this increase.”I’m sure we will be benefiting from this increase.”
Notably, there is a risk that Microsoft does not renew its partnership next year. However, this risk is muted a bit since Perion was named “Global Supply Partner of the Year” by Microsoft in 2022.
What’s interesting about Perion is that the company is fundamentally one of the strongest ad-tech companies on the public markets due to a strong bottom line and a top line that was more resilient than its peers. Any windfall here could very interesting for a company that already proven operational efficiency with a 20% operating margin while maintaining 30%+ growth in the tough year of 2022. Notably, the top line is decelerating but a catalyst that could lead to a reversal here could be quite interesting
The company’s revenue in the recent quarter grew by 33% YoY to $209.7 million. Display advertising revenue grew 24% YoY to $123.8 million and search advertising revenue grew 49% YoY to $85.9 million. The company had an operating margin of 20% compared to 13% in the same period last year.
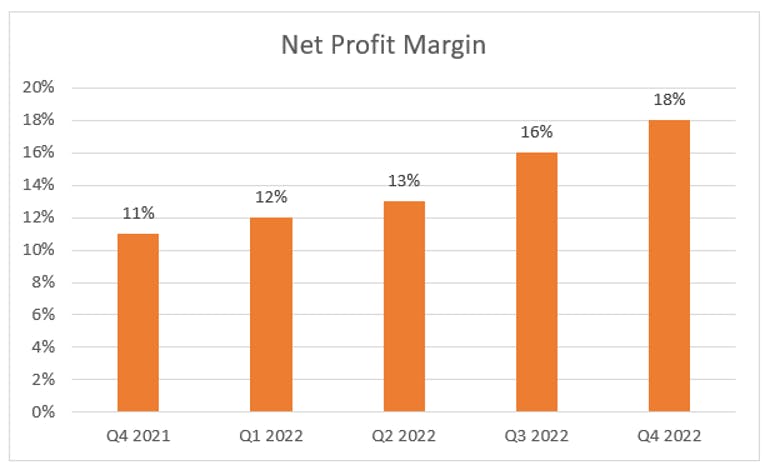
The company is GAAP profitable, and margins are improving. The net profit margin improved to 18% from 11% in the same period last year. The adjusted EBITDA margin was 23% compared to 18% in the same period last year.
Source: Company IR
The company has free cash flow of $37.90 million representing a free cash flow margin of 18%. Perion had cash and bank deposits of $429.6 million and no debt at the end of December 2022.
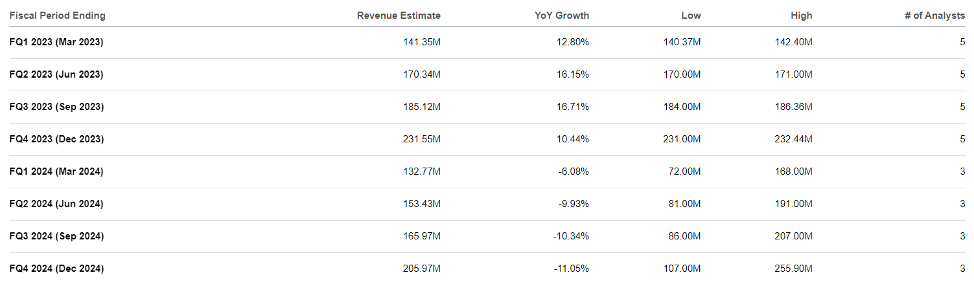
Revenue growth is expected to slow, as seen below. The company’s revenue grew above 30% in all four quarters in 2022, and it grew 34% YoY to $640.3 million for the full year of 2022. This is expected to level off quite a bit, presumably due to industry-wide headwinds.
Source: Seeking Alpha
Magnite
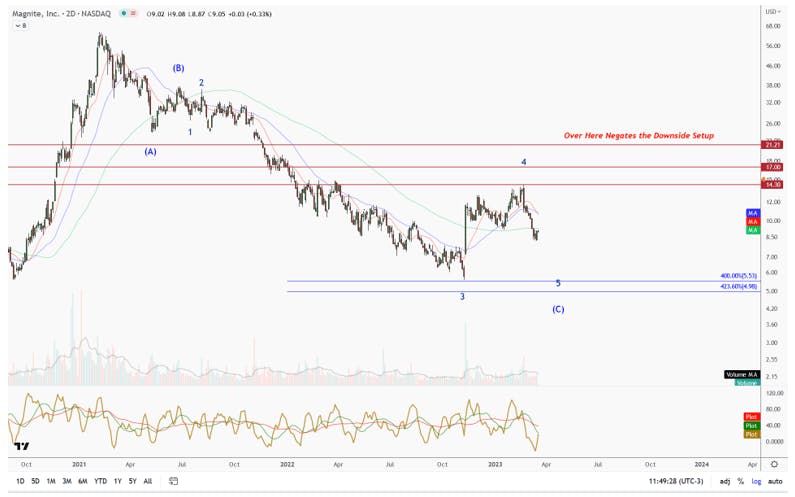
Magnite is another ad-tech company that is a potential beneficiary. Magnite is a sell-side platform (SSP) that offers exposure to a higher mix of CTV ads from an independent SSP than what is currently on the market.
We previously discussed Magnite is both an ad server and a Supply Side Platform. Strategically, this allows Magnite to compete with FreeWheel and Google and helps them maintain their position “as the largest independent programmatic CTV marketplace.” The SSP allows for programmatic and private market place bidding while the ad server stores the creatives and serves the ads. The SSP facilitates the selling/bidding (auction) while the ad server actually manages, stores and serves the ads. SpringServe is ad server that Magnite acquired for $31 million. The acquisition came from SpotX’s option to buy.
In their recent earnings call, the management highlighted that Disney has renewed their agreement to use Magnite as Disney’s global programmatic SSP partner. “As you may recall, our relationship with them started with Hulu. We have since grown the relationship to include the full portfolio of Disney properties.”
The company’s Q4 2022 revenue ex-TAC grew by 10% YoY to $156.6 million. The operating margin was (16%) compared to +2% in the same period last year.
Net losses are increasing to ($36.4) million with a net margin of (21%). This compares to $453,000 in net profit for a flat net margin in the year-ago quarter.
The company reported GAAP EPS of ($0.27) compared to GAAP EPS estimates of $0.02. The adjusted EPS also missed at $0.24 versus $0.32 expected.
Our recent analysis discussed that the company missed on the bottom line due to the new CTV ad platform that was launched in February. The newly launched Magnite Streaming is a single supply-side platform that merges the technology from Magnite CTV and SpotX platform. Magnite Streaming led to a $35 million accelerated amortization.
Cash flow was the strongest line item in Magnite’s report. Free cash flow margin was 28% compared to 34% in the year-ago quarter. The company has $326.3 million in cash on the balance sheet with $726.4 million in debt for net debt of $400.1 million.
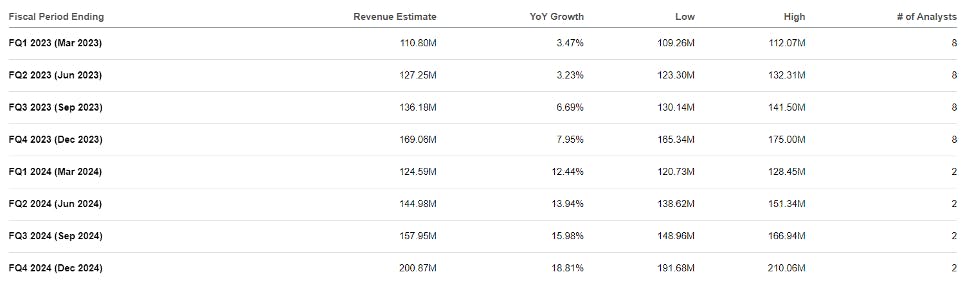
Below are the analyst’s ex-TAC revenue estimates. Magnite’s revenue is also decelerating.
Source: Seeking Alpha
PubMatic
PubMatic is another sell-side platform that is a potential beneficiary. The company works with over 1,600 publishers. In the recent earnings call, the management highlighted new partnerships with Roku, TiVo, and Kroger.
Rajeev Goel, CEO and co-founder, pointed out that the company has increased its market share from 2-3% at time of IPO in Dec 2020, “We ended 2022 with an estimated market share of 4% to 4.5%, significantly up from when we went public just over two years ago. We are well on our way to our stated goal from the time of our IPO of 20% market share, and we intend to use the downturn to further accelerate our gains.”
The CEO pointed out that Google’s antitrust case could help them achieve the (lofty) 20% goal: “Advertisers and publishers continue to seek alternatives to the walled gardens. This tailwind, along with structural changes, including ongoing antitrust activities, will only expand our total addressable market as an independent technology provider.”
The company’s revenue in the recent quarter declined by (1.7)% YoY to $74.3 million. The operating margin was 22% compared to 37% in the same period last year. The drop in revenue led to lower margins when we compare it to the year-ago quarter. However, the Q4 operating margin was the highest for the year 2022. Net margin was 17% compared to 37% in the same period last year.
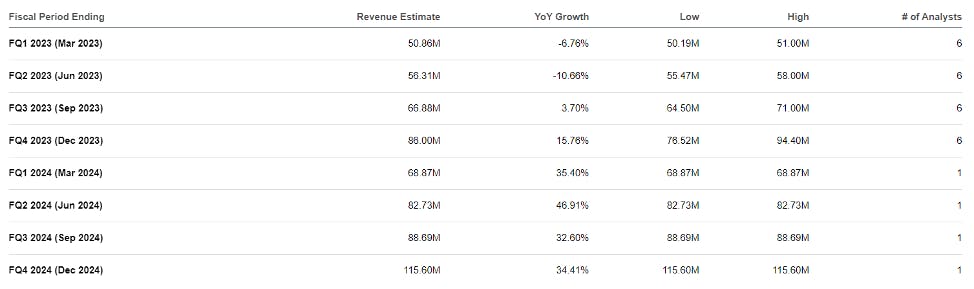
The free cash flow in the recent quarter was $7.02 million, with a free cash flow margin of 9% compared to a free cash flow of $18.72 with a free cash flow margin of 25% in the year-ago quarter. The company has cash and marketable securities of $174.4 million with no debt. The analysts expect revenue to decline in the next two quarters. In the earnings call, management was cautious about the macro environment.
Source: Seeking Alpha
The Trade Desk
The Trade Desk is an independent demand side ad platform. We discussed the Universal ID in August 2019. “Strong drivers for The Trade Desk include omnichannel capabilities, which is the ability to buy ads across many channels, such as mobile, video, audio, display, social and native. The universal ad ID is another important differentiation as it offers an anonymized ID that helps track users, target audiences and provide attribution.”
The Trade Desk has benefitted from its omnichannel approach that also focuses on CTV. Jeff Green, CEO and founder of the company, said in the recent earnings call. “CTV continued to be our strongest growth driver as more content owners from around the world are moving beyond ad-free subscription models and offering ad-supported options for viewers.”
Jeff Green mentioned in fourth quarter last year, about 15% of the Trade Desk’s third-party data had UID2 associated with it and expects it to be in the 75% range in the first half of this year. “In fact, I would say again that it becomes about 10x more valuable than with cookies, simply because UID2 solves the needle in the haystack problem that came with cookies, because advertisers can now match their customer data with accuracy across the open Internet more effectively than ever before.”
Jeff Green also sounded confident in the earnings call that the outcome of the DoJ will benefit the company. “I know there is some at Google who tried to suggest that we have been through this three or four times before. I do believe that this is fundamentally different. And part of that is just because of how detailed I think the case is outlined.”
The Trade Desk has illustrated a strong bottom line despite a tough 2022. The company’s Q4 revenue grew by 24% YoY to $491 million. The operating margin was 20% compared to (6%) in the same period last year. The net margin was 15% compared to 2% in the same period last year. The adjusted EBITDA margin was 50% compared to 48% in the same period last year.
The company has free cash flow of $123 million with a free cash flow margin of 25% compared to $151 million compared to a free cash flow margin of 38% in the year-ago quarter. The company had cash and short-term investments of $1.4 billion with no debt.
Below are analyst revenue estimates for the next few quarters. Analysts expect the revenue of the company to grow faster when compared to the other ad-tech companies we covered, and the company also has a premium valuation.
Source: Seeking Alpha
The Trade Desk has a forward P/S ratio of 15.14 compared to 2.53 for PubMatic, 2.47 for Magnite, and 2.22 for Perion Network.
Given the sheer impact a weaker Google could have on the ad-tech ecosystem, we wanted to do a deep dive and get in front of this. Most of the names listed are familiar to our Members, yet these names may be seeing the biggest catalyst in their respective company’s history. This will depend on outcome of the antitrust lawsuit and the severity of the DOJ’s actions.
Perhaps the opposite will happen. Perhaps Google’s deep pocketbooks will provide top tier lawyers who can defend the case accordingly. As investors, it’s not our job to take sides but to find where ad dollars may be flowing next.
Ultimately, I believe this is the number one catalyst across ad-tech this year and we want our readers to benefit no matter the outcome. As the market can often do, there may be some price movements ahead of the trial, and if so, we will be watching for entries closely.
Experts pay attention to FOMC meetings in order to help navigate the financial markets and their positions with more confidence. Our FOMC meeting cheat sheet will help equip you with everything you need to know about the Federal Reserve's key decisions and how they may impact your investments.
The Importance of FOMC Meetings for Investors
FOMC meetings are crucial in determining the direction of U.S. monetary policy. The decisions made during these meetings significantly influence interest rates and asset prices. By understanding the FOMC's actions, investors can make more informed decisions and better manage their portfolios.
Key Components and Terminology in FOMC Meetings
Three critical elements drive FOMC meetings and monetary policy: the federal funds rate, open market operations, and quantitative easing/tightening (QE/QT). The Federal Funds rate is the primary tool for conducting monetary policy and affects other interest rates in the economy. Open market operations involve buying or selling government securities, influencing the federal funds rate and the banking system's reserves. Quantitative easing entails large-scale purchases of government bonds and mortgage backed securities, aiming to lower long-term interest rates and stimulate the economy.
Economic Indicators to Watch
Stay informed by monitoring vital economic indicators, such as Gross Domestic Product (GDP), inflation rates (CPI and PCE), unemployment rate, labor force participation rate, average hourly earnings, and housing market indicators. These factors play a crucial role in shaping the FOMC's policy decisions.
Navigating the FOMC Meeting Schedule and Resources
The FOMC meets eight times a year, with meeting minutes released three weeks after each session. Four times a year, the FOMC releases its Summary of Economic Projections (SEP). Additionally, the FOMC Chair holds press conferences after scheduled meetings, providing further insights into the committee's decision-making process.
Understanding the FOMC's Dual Mandate
The FOMC operates under a dual mandate from Congress, which includes ensuring maximum employment and maintaining stable prices with a long-term inflation target of 2%. Striking a balance between these goals requires the FOMC to carefully consider various economic indicators and policy tools.
Note: For a Limited Time, I/O FundNote: For a Limited Time, I/O Fundis offering a $99/year Premium Newsletter plan that provides one actionable stock tip per month and analysis from a top performing, audited team. Click here for more details is offering a $99/year Premium Newsletter plan that provides one actionable stock tip per month and analysis from a top performing, audited team. Click here for more details Click here for more details
The Impact of Forward Guidance
The FOMC utilizes forward guidance to communicate its future policy intentions. This communication method influences market expectations and long-term interest rates, enabling investors to better understand the FOMC's monetary policy approach.
Insights into FOMC Members and Voting Structure
The FOMC consists of 12 voting members, including the Chair, Vice-Chair, New York Fed President, and other regional Fed Bank presidents. Investors can gain valuable insights into these members' views on economic conditions and policy by following their speeches and comments.
Preparing for FOMC Meetings
To effectively prepare for FOMC meetings, one might consider reviewing recent economic indicators, assessing the impact of global events on the U.S. economy, studying FOMC members' speeches, monitoring market expectations for policy decisions, familiarizing yourself with the latest SEP and dot plot, and reviewing previous meeting minutes for context.
How FOMC Decisions Could Affect Your Investments
FOMC policy decisions can create market volatility and impact asset prices. By understanding the FOMC's actions, you can make more informed investment decisions and align your portfolio with your risk tolerance and market outlook.
The I/O Fund is a publishing company. The analysis, strategies, reports, activity and all other features of our service is provided for informational and educational purposes only, and should not be construed as personalized investment advice. Hedging is an advanced method of trading stocks, sudden losses can occur, and hedging should only be pursued under the supervision of your personal financial advisor.
Want a cheat sheet that looks like this in .PDF form?
For reference to terminology used, please look at technical analysis under our resources section here. Regarding the charts below, the vertical tan shades represent time factors. These are inflection points where we have high odds of something significant happening. More times than not, (3/4 of the time), they mark a turning point in the trend. So, what matters is the direction we are trending into these periods. Regarding the vertical lines, black lines represent strong support/resistance, while dark red lines mark very strong support/resistance.here. Regarding the charts below, the vertical tan shades represent time factors. These are inflection points where we have high odds of something significant happening. More times than not, (3/4 of the time), they mark a turning point in the trend. So, what matters is the direction we are trending into these periods. Regarding the vertical lines, black lines represent strong support/resistance, while dark red lines mark very strong support/resistance.
Elliott Wave count are meant to provide context. There is a pattern unfolding in real-time, one of which will play out. By monitoring price levels that are held/broken, it will help us figure out which one is in play
Broad Market
My primary perspective is that we are continuing to trace a complex corrective pattern in this ongoing bear market. For the non-Elliott Wavers, all that you need to know is that this pattern is not complete until we get a sharp 5 wave drop towards the SPX 3050 region. The only question I have is determining if we topped, or will we have one more push higher?
Do you see the wavy/overlapping pattern inside the red box? That could be counted as a corrective pattern in an ongoing uptrend. This would imply one more push to at least 4275 before the wheels fall off. If this plays out, we will remove our hedge (more below), and hold a high cash position.
1-2, i-ii
In Elliott Wave analysis, the 3rd wave is typically the largest and most powerful move in a trend. This is what you want to capture on the upside, and really avoid on the downside. That being said, there is a phrase called a “1-2, i-ii setup." This simply means that waves 1 and 2 are in place, and we are setting up for the heart of the 3rd wave move, usually on some gap. If you’ve ever heard of a cup and handle pattern, this is just a simplified version of a 1-2, i-ii setup.
Keeping that in mind, let’s take this one step at a time. In the picture above, look at the structure of the move off the October low. It is clearly 3 waves up. Whenever you see a 3 wave move, the vast majority of the time it is a corrective move in a larger trend; in this case, that trend is down. What follows a 3 wave bounce (B wave) is a 5 wave drop (C wave). So, this C wave will be a 5 wave move, which will necessarily develop into a 1-2, i-ii setup before really letting go.
Well, that setup is in place.
The above chart can be counted as a 1st wave down, 2nd wave up; followed by another 5 waves down and 3 waves up. I cannot stress the level of risk this setup presents us right now. Just because this setup is in place does not mean the market will take it. As long as price stays below the 4035-4067 region, this window will remain open. So, below this level and the risk in the markets remains quite high.
To simplify the risk levels, there are three final supports to monitor before the blue primary count is fully confirmed: 3902, 3835, 3808. Each level that gets taken by price increases the risk in the markets. Once we go below 3808, we should be in the heart of the 3rd wave drop pointing us towards the 3050 SPX region.
On the other hand, if the bulls can muster a rally that takes us through 4035-4067, then this window pointing us down will be closed, for now. What this means is that in order to drop us back towards that region, a new setup will have to develop, likely after we move to the 4275 region.
Now, let’s look at the red alternative scenario where we do break through the 4035-4067 region. The only structure that will take us there has collapsed into a low-quality pattern called a leading diagonal. Remember how I said that when you see a 3 wave bounce, the odds greatly favor it is a correction in a bigger downtrend? Well, look below at the bounce we are in. It’s only 3 waves.
The only bullish alternative is a rare pattern called a leading diagonal pattern, which is a messy, overlapping 5 wave pattern. The rule with leading diagonals is that you should not believe them until you get all 5 waves in place, and then see a bigger pullback that holds the low. So, this pattern, if it is playing out, has a lot to prove.
Macro
With the recent fall of Silicon Valley Bank (SIVB), followed by Signature Bank (SBNY), we saw the 2nd and 3rd largest bank failures in US history. In fact, the run on SIVB was the largest bank run in US history, with $2 Billion withdrawn in one day. Prior to this run, Washington Mutual was the largest run, with $16.7 Billion over 10 days.
According to the markets, the problem is not localized. The below chart is a handful of larger regional banks in the S&P 500 as well as the SPYDR Regional Bank ETF (KRE). This type of drop off is not the sign of a healthy stock, and we are seeing them across the board.
However, we learned over the weekend that the current banking crisis is not limited to US regional banks. Credit Suisse, one of the largest international banks, sold to their Swiss competitor, UBS, for a little more than $2 Billion (or $0.54/share). On Friday, it was priced more than $7 Billion dollars (or around $3/share). This will mark Europe’s largest bank merger since the 2008 financial crisis.
Regardless of the details, what this signals is that the current banking crisis is not a US problem, and not just a regional bank problem. This is more than apparent when we look through various charts within the financials sector.
BAC is being portrayed in the news in a position of strength. It was one of a handful of banks that bailed out First Republic, and has recently been mentioned as a potential buyer of Signature Bank. However, if we look at the chart below, this is a very concerning pattern unfolding.
First off, BAC is below its October low. More concerning, we can count a 5 wave drop from the 2022 high, followed by a 3 wave retrace that ended right before the current drop. If BAC breaks below $22.70, the COVID low will be in discussion.
MET is one of the largest insurance companies in the US. The chart below is telling me that this banking crisis is not localized to just Banks.
The above chart is showing zero bids as MET is in the process of breaking a major support zone. What is concerning, which can be seen on many charts right now, is that this drop is preceded by a clear 5 wave uptrend from the COVID low. We are at the completion of a large degree 5 wave pattern and are beginning a large degree correction.
MS is a very large investment bank as well as a robust wealth management firm. They recently acquired ETrade, which gets them into the retail space. Their chart is also closing on the lows after completing a clear bear pennant from the October lows. At best, this should play out as an A,B,C pattern, where the C wave that just stated is equal in length to the A wave.
If we are in the beginning stages of something larger unfolding, we would expect the FOMC to drop rates and begin a fresh QE program to support equities. However, considering all the problems unfolding, the FED Futures on what this week’s decision is sitting at 63% chance of raising rates by 25 bps!
This is probably quite shocking to most, considering the headline CPI number was celebrated by the equity markets. However, the bond market sold off sharply on the CPI news. What the headlines were not discussing was that the CPI print was actually much hotter than the YoY print was suggesting. Inflation is best measured on a sequential basis, not a YoY basis. What matters is the trend, not annual comparison. It’s much more important to see if inflation is improving from month to month, not year over year, when tracking the trend.
I prefer to take the 3-month annualized readings to get the best feel for the actual trend. When you add up the prior 3 month readings and annualize them, the number comes out to 4.08%, compared with last month’s reading at 3.4%. This is a concerning rate of acceleration, and marks the 2nd month in a row of an accelerated trend within the CPI data.
Even more concerning, we are seeing a similar acceleration in energy, core prices, core goods, shelter, as well as services, which has been the biggest concern regarding inflation. The reason why services is so concerning is because it accounts for ~85% of the US GDP and it is still expanding above its 12-month trend.
With an on-going economic expansion comes inflation, which continues to show up in the CPI numbers. There is no question the FED, short of a banking crisis, would have to increase their terminal rate well above 5%, considering both the resilience of the US economy and the stubbornness of inflationary pressures in the services sector.
So, if the FED does drop rates prematurely, we risk a replay of the 1970s, when that FED also dropped rates due to market pressures, leaving inflation intact to roar back repeatedly for over a decade. In light of this history, which Powell has alluded to multiple times as the primary guiding force behind their decisions, if they decide to drop rates soon, investors should be concerned.
I’ve been discussing the bullish posture in various futures. Another interesting chart to monitor is the 10-year yield. Remember, if the FED is about to drop rates, and a banking crisis is upon us, then bonds would be one of the primary assets to own going forward. This would mean that yields would fall, as inflation is no longer as much of a concern as deflation.
According to our analysis, the 10 Yr. Yield’s uptrend looks incomplete. The current consolidation looks like a 4th wave with a 5th wave targeting just over 4.5%. This would imply, like various futures, that inflation is not behind us.
Hedge
Our hedge signal flipped to buy on last Thursday’s rally. We decided to follow our risk levels to put the hedge back on while the signal is in buy. If we break above last week’s high, we will remove it and go in line with our signal. Considering the risk in the market, we are being more cautious. If our worries are justified, the signal in bear mode is quite sensitive, so it should flip back relatively close to where we are.
I/O Fund Positions
We added some cash back into NFLX, ENPH and TSLA. These are attempts to position for the possibility of the above red count playing out, so these new entries have stops. However, we are currently tracking crypto to add a heavy allocation towards (more below).
NVDANVDA
NVDA found a way through the $241 resistance. However, it still appears to be closer to the end of a move than the beginning of one.
NFLXNFLX
If NFLX breaks below $285, we’ll stop out of our 2% allocation from last week. Also, it will change the count, as one more high will become less likely.
AMDAMD
This move up in AMD has completed what can be counted as a leading diagonal. As a rule, we now need to see a 3 wave pullback that holds the October low. AMD is now a candidate for a stock that has bottomed, no matter what plays out. It is now over 80% off its low.
ENPHENPH
Enphase is a play on energy. Its breakdown last week was in line with the breakdown we saw in crude and natural gas. We are early to this thesis, but we still believe it is likely to play out.
Crude OilCrude Oil
GasolineGasoline
MSFTMSFT
That's quite a key reversal candle in MSFT from a key resistance level. This has given us 5 waves up in an ugly C wave.
TSLATSLA
This correction is starting to get too stretched to be a 4th wave. However, the count works best, like NFLX, with one more high. My primary analysis is that TSLA will go towards $92 before the larger drawdown is over.
BTCUSDBTCUSD
This chart is interesting. I’m counting this as a large degree 4th wave with a move towards $13,000 in the future. However, we also have 5 waves up off the low and an interesting divergence from equities. Our original thesis that Bitcoin is a path out of a failing centralized money system could be finally playing out, so we will give this thesis a chance. What we want to see from this high is a 3 wave retrace, not 5 waves down. If we see 3 waves down, we will likely add aggressively to Bitcoin, with a stop in place.
AEHRAEHR
ETHUSDETHUSD
ETH has a very bullish posture, which we will give the benefit of the doubt. The next pullback should be a small 3 wave retrace then a very big breakout to confirm
We thought it may be helpful to our readers to share our initial thoughts after the SIVB bailout. As we write this, CSFB has reported material weakness in its financial reporting so we’ll see if this will create further stress on the financial system.
In response to the SIVB collapse, the Fed had no choice but to take decisive action to further stem deposit outflows and the potential risks to the banking system. The Fed’s response was a comprehensive pledging of cash in exchange for all Treasuries, agency debt and mortgage-backed bonds without any discount being applied to face value. Commentators have described these actions as akin to quantitative easing on demand for the financial system.
Below is a chart of the Fed Funds rate dating back to the 1950s. As recent history shows, the Fed had embarked on a policy of ultra-low interest rates – brought on by the GFC and again by the Covid pandemic – that were unprecedented in scale and duration. This created unintended consequences and fueled asset bubbles and inflationary pressures throughout the economy.
Similarly, as the Fed aggressively raised interest rates in 2022, this has also created unintended consequences. The collapse of SIVB. While SIVB’s demise seems not to pose a systemic financial risk at the moment. Its overnight collapse is a reminder that the banking sector remains vulnerable to sharply rising funding costs after years of operating in a low rate environment.
SIVB’s demise has been well covered in the financial press, we’ll touch upon some salient details. There were red flags, a couple that were somewhat unique to SIVB.
Greg Becker, SIVB’S former CEO, served on the board of the Federal Reserve Bank of San Francisco until the day of the collapse. He had lobbied that that banks of SIVB’s size should not be subject to as much regulation as the mega banks
In 2018, a bipartisan bill was passed that exempted banks with $100 billion to $250 billion in assets – Silicon Valley's size – from requirements that included regular examinations of how they would fare in tough economic times, known as 'stress tests.'. The 2018 law also provided the Fed with more discretion in its bank oversight. The central bank subsequently voted to further reduce regulation for banks the size of Silicon Valley. In October 2019, the Fed voted to effectively reduce the capital those banks had to hold in reserve.
The bank had grown rapidly. Its assets quadrupled in five years to $209 billion, making it the 16th-largest bank in the country. And roughly 94 percent of its deposits were uninsured because they exceeded the Federal Deposit Insurance Corporation's $250,000 insurance cap. That percentage was the second highest among banks with more than $50 billion in assets, according to ratings agency S&P. Signature had the fourth-highest percentage of uninsured deposits – which uncoincidentally also failed. Signature had large exposure to crypto clients.
According to analysis done by UBS. SIVB had 52% of its deposits from venture capital and private equity related businesses and funds. First Republic Bank, another California-based lender that dropped more than 60% in pre-market trading on Monday, only 8% of its deposits to those types of clients.
Ultimately SIVB’s risk management, or the lack-thereof, proved it’s undoing. It’s not uncommon for banks to have unrealized losses due to their bond holdings. According to Bloomberg, US banks had booked $620 billion in unrealized losses on their available-for-sale and held-to-maturity portfolios at the end of last year, according to filings with the FDIC. But SIVB’s investment portfolio had swelled to 57% of its total assets. No other competitor among 74 major US banks had more than 42%. It was this toxic brew of a very large unrealized losses on Treasuries and mortgage bonds combined with a concentrated depositor base that proved fatal.
This was exacerbated by SIVB’s failure to hedge the interest rate risk on these holdings and an upcoming credit downgrade. Once it was made known to the market that SIVB may raise equity to pre-empt the downgrade, this was the catalyst for deposits to be withdrawn which worsened their credit standing. It became a self-fulling prophecy.
So as technology focused investors, how do we assess the current situation?
Let’s start with the macro. I have written extensively on concerns over the broad market from both a technical and macro perspective. The latter namely due to the Fed’s inability to combat super-core inflation and the over-leveraged consumer. I and the rest of the team have been monitoring for further signs of weakness.
Financial Sector Earnings
Within the overall S&P 500 earnings, it is estimated that Technology contributes the most at about 25%, while the second largest is Financials at 19%. The S&P 500’s decline in the SPX has in part been driven by reductions in earnings for the Technology sector. The SIVB fallout could lead to a reduction in earnings estimates across the financial sector. These downgrades can be driven by a number of factors such as lending margins being squeezed as cost of bank deposits are still catching up with rate rises that have already happened, higher regulatory costs and higher loan loss provisions, just to name a few. This could be another headwind for S&P 500 earnings in the future.
Banks are a transmission mechanism for the economy. To the extent that is hindered, there will be a negative trickle down effect for the economy that are yet to be seen. Somewhat ironically, the SIVB collapse may help Fed Chairman Powell’s goal to reduce supercore inflation driven by the sticky services component through aggressive interest rate hikes. Albeit clearly not the way he intended.
Technically, the Financials ETF has broken down.
What will the Fed do in the next meeting?
Given the recent CPI data, the Fed has every justification to continue to raise interest rates, which we discussed here. However, will the SIVB failure give them a reason to pause? The futures market has the odds at a resounding no.
And the reason is that under the headline CPI number, we are seeing the 2nd month in a row of 3 MoM annualized acceleration. If you combine the prior 3 months and annualized them, the number comes out to 4.08%, compared to last month’s reading at 3.4%. Furthermore, energy, goods, core, shelter and services all showed similar accelerations.
How to invest in technology in current environment?
In the public markets, the technology sector was already facing headwinds as higher rates impacted valuation. Meanwhile those with consumer exposed businesses have also had earnings impacted. The SIVB fallout adds additional headwinds. SVB’s demise has revealed the extent of the damage rising interest rates might cause on companies and banks that had grown accustomed to years of cheap money. Startups are especially vulnerable to any systemic drop in confidence, given their reliance on investors’ faith in their long-term potential when profitability might be years away.
Private markets will face a tougher funding environment. There is a talk of ‘day-of-reckoning’ for the private equity/venture capital-funded universe and may force PE funds to mark down private books sooner than they’d like to.
Softbank is a good public and sentiment proxy for the private markets. Before the meltdown, Masayoshi Son’s investment powerhouse — which has poured more than $140 billion into names from WeWork to ByteDance Ltd. and DoorDash Inc. — had already been reeling from the post-pandemic economic downturn.
SoftBank, similarly central to the global VC arena, has lost around 7% or $5 billion of its value since news of SVB’s difficulties emerged. Its credit default swaps are surging for the second straight day, and speculation is growing on what asset sales might be ahead should SoftBank need to help out portfolio companies.
SoftBank sees little impact from SVB’s failure on its portfolio companies, a SoftBank spokesperson said, adding that the company expects no impact on its own finances. Most Vision Fund portfolio companies are cash-rich, the company said during its earnings call last month. However, if we look at the chart, the market disagrees, as it is ~63% off its 2021 high, and only ~32% from testing its COVID low.
Attributes of stocks that we are looking for
This past week, I/O Fund analysts held a webinar that discussed “How to Build a Defensible Tech Portfolio.” Although macro continues to throw curveballs, we believe a defensible portfolio can help alleviate any concerns.
Defensible means the portfolio should be overweight the bottom line. For tech investors, stocks that do not materially cash burn are ideal right now. Per Silicon Valley Bank’s CEO Gregory Becker: “While VC (venture capital) deployment has tracked our expectations, client cash burn has remained elevated and increased further in February, resulting in lower deposits than forecasted.”
Per the same Reuters report, Silicon Valley Bank is selling assets to position for higher interest rates and faster cash burn: “We are taking these actions because we expect continued higher interest rates, pressured public and private markets, and elevated cash burn levels from our clients.”
Elevated cash burn is something the public markets will be very sensitive toward into the foreseeable future. We have found that expanding operating margins and GAAP profitability was rewarded last year, and we believe this is the best way to position for an unpredictable 2023. At the very least, while the FED raises rates, cash burn will continue and we believe it will surprise investors at times just how cash strapped the tech sector truly is. This is why we have built a defensible tech portfolio, as outlined in this webinar here.
We thought it may be helpful to our readers to share our initial thoughts after the SIVB bailout. As we write this, CSFB has reported material weakness in its financial reporting so we’ll see if this will create further stress on the financial system.
In response to the SIVB collapse, the Fed had no choice but to take decisive action to further stem deposit outflows and the potential risks to the banking system. The Fed’s response was a comprehensive pledging of cash in exchange for all Treasuries, agency debt and mortgage-backed bonds without any discount being applied to face value. Commentators have described these actions as akin to quantitative easing on demand for the financial system.
Below is a chart of the Fed Funds rate dating back to the 1950s. As recent history shows, the Fed had embarked on a policy of ultra-low interest rates – brought on by the GFC and again by the Covid pandemic – that were unprecedented in scale and duration. This created unintended consequences and fueled asset bubbles and inflationary pressures throughout the economy.
Similarly, as the Fed aggressively raised interest rates in 2022, this has also created unintended consequences. The collapse of SIVB. While SIVB’s demise seems not to pose a systemic financial risk at the moment. Its overnight collapse is a reminder that the banking sector remains vulnerable to sharply rising funding costs after years of operating in a low rate environment.
SIVB’s demise has been well covered in the financial press, we’ll touch upon some salient details. There were red flags, a couple that were somewhat unique to SIVB.
Greg Becker, SIVB’S former CEO, served on the board of the Federal Reserve Bank of San Francisco until the day of the collapse. He had lobbied that that banks of SIVB’s size should not be subject to as much regulation as the mega banks
In 2018, a bipartisan bill was passed that exempted banks with $100 billion to $250 billion in assets – Silicon Valley's size – from requirements that included regular examinations of how they would fare in tough economic times, known as 'stress tests.'. The 2018 law also provided the Fed with more discretion in its bank oversight. The central bank subsequently voted to further reduce regulation for banks the size of Silicon Valley. In October 2019, the Fed voted to effectively reduce the capital those banks had to hold in reserve.
The bank had grown rapidly. Its assets quadrupled in five years to $209 billion, making it the 16th-largest bank in the country. And roughly 94 percent of its deposits were uninsured because they exceeded the Federal Deposit Insurance Corporation's $250,000 insurance cap. That percentage was the second highest among banks with more than $50 billion in assets, according to ratings agency S&P. Signature had the fourth-highest percentage of uninsured deposits – which uncoincidentally also failed. Signature had large exposure to crypto clients.
According to analysis done by UBS. SIVB had 52% of its deposits from venture capital and private equity related businesses and funds. First Republic Bank, another California-based lender that dropped more than 60% in pre-market trading on Monday, only 8% of its deposits to those types of clients.
Ultimately SIVB’s risk management, or the lack-thereof, proved it’s undoing. It’s not uncommon for banks to have unrealized losses due to their bond holdings. According to Bloomberg, US banks had booked $620 billion in unrealized losses on their available-for-sale and held-to-maturity portfolios at the end of last year, according to filings with the FDIC. But SIVB’s investment portfolio had swelled to 57% of its total assets. No other competitor among 74 major US banks had more than 42%. It was this toxic brew of a very large unrealized losses on Treasuries and mortgage bonds combined with a concentrated depositor base that proved fatal.
This was exacerbated by SIVB’s failure to hedge the interest rate risk on these holdings and an upcoming credit downgrade. Once it was made known to the market that SIVB may raise equity to pre-empt the downgrade, this was the catalyst for deposits to be withdrawn which worsened their credit standing. It became a self-fulling prophecy.
So as technology focused investors, how do we assess the current situation?
Let’s start with the macro. I have written extensively on concerns over the broad market from both a technical and macro perspective. The latter namely due to the Fed’s inability to combat super-core inflation and the over-leveraged consumer. I and the rest of the team have been monitoring for further signs of weakness.
Financial Sector Earnings
Within the overall S&P 500 earnings, it is estimated that Technology contributes the most at about 25%, while the second largest is Financials at 19%. The S&P 500’s decline in the SPX has in part been driven by reductions in earnings for the Technology sector. The SIVB fallout could lead to a reduction in earnings estimates across the financial sector. These downgrades can be driven by a number of factors such as lending margins being squeezed as cost of bank deposits are still catching up with rate rises that have already happened, higher regulatory costs and higher loan loss provisions, just to name a few. This could be another headwind for S&P 500 earnings in the future.
Banks are a transmission mechanism for the economy. To the extent that is hindered, there will be a negative trickle down effect for the economy that are yet to be seen. Somewhat ironically, the SIVB collapse may help Fed Chairman Powell’s goal to reduce supercore inflation driven by the sticky services component through aggressive interest rate hikes. Albeit clearly not the way he intended.
Technically, the Financials ETF has broken down.
What will the Fed do in the next meeting?
Given the recent CPI data, the Fed has every justification to continue to raise interest rates, which we discussed here. However, will the SIVB failure give them a reason to pause? The futures market has the odds at a resounding no.
And the reason is that under the headline CPI number, we are seeing the 2nd month in a row of 3 MoM annualized acceleration. If you combine the prior 3 months and annualized them, the number comes out to 4.08%, compared to last month’s reading at 3.4%. Furthermore, energy, goods, core, shelter and services all showed similar accelerations.
How to invest in technology in current environment?
In the public markets, the technology sector was already facing headwinds as higher rates impacted valuation. Meanwhile those with consumer exposed businesses have also had earnings impacted. The SIVB fallout adds additional headwinds. SVB’s demise has revealed the extent of the damage rising interest rates might cause on companies and banks that had grown accustomed to years of cheap money. Startups are especially vulnerable to any systemic drop in confidence, given their reliance on investors’ faith in their long-term potential when profitability might be years away.
Private markets will face a tougher funding environment. There is a talk of ‘day-of-reckoning’ for the private equity/venture capital-funded universe and may force PE funds to mark down private books sooner than they’d like to.
Softbank is a good public and sentiment proxy for the private markets. Before the meltdown, Masayoshi Son’s investment powerhouse — which has poured more than $140 billion into names from WeWork to ByteDance Ltd. and DoorDash Inc. — had already been reeling from the post-pandemic economic downturn.
SoftBank, similarly central to the global VC arena, has lost around 7% or $5 billion of its value since news of SVB’s difficulties emerged. Its credit default swaps are surging for the second straight day, and speculation is growing on what asset sales might be ahead should SoftBank need to help out portfolio companies.
SoftBank sees little impact from SVB’s failure on its portfolio companies, a SoftBank spokesperson said, adding that the company expects no impact on its own finances. Most Vision Fund portfolio companies are cash-rich, the company said during its earnings call last month. However, if we look at the chart, the market disagrees, as it is ~63% off its 2021 high, and only ~32% from testing its COVID low.
Attributes of stocks that we are looking for
This past week, I/O Fund analysts held a webinar that discussed “How to Build a Defensible Tech Portfolio.” Although macro continues to throw curveballs, we believe a defensible portfolio can help alleviate any concerns.
Defensible means the portfolio should be overweight the bottom line. For tech investors, stocks that do not materially cash burn are ideal right now. Per Silicon Valley Bank’s CEO Gregory Becker: “While VC (venture capital) deployment has tracked our expectations, client cash burn has remained elevated and increased further in February, resulting in lower deposits than forecasted.”
Per the same Reuters report, Silicon Valley Bank is selling assets to position for higher interest rates and faster cash burn: “We are taking these actions because we expect continued higher interest rates, pressured public and private markets, and elevated cash burn levels from our clients.”
Elevated cash burn is something the public markets will be very sensitive toward into the foreseeable future. We have found that expanding operating margins and GAAP profitability was rewarded last year, and we believe this is the best way to position for an unpredictable 2023. At the very least, while the FED raises rates, cash burn will continue and we believe it will surprise investors at times just how cash strapped the tech sector truly is. This is why we have built a defensible tech portfolio, as outlined in this webinar here.
The bear market is not over. This has been our probable thesis since the start of 2023. With the 10-year rates breaking out to new highs, and on-going inflation reports showing a re-acceleration under the headline numbers, it was apparent that the FOMC would need to raise the terminal rate to further fight stubborn inflationary pressures. This realization marked the February top, which has since been intensified by the unforeseen collapse of two large regional banks.
We are open to the bullish narrative; however, it would require a clear and dramatic reversal in the monthly inflationary trends, coupled with no more banks coming under pressure. The needle the FOMC must thread is one of the most delicate in modern history. With inflation still elevated and showing little signs of decelerating in key areas, how much can the FED drop rates, short of a bank contagion? Either way, it does not look good for equities, and until we get signs of this bullish scenario playing out, we will remain cautious and defensive.
Broad Market Analysis
We have been warning our members since early 2023 that this market is unhealthy. Our automated hedge signal went to sell, and we have been hedged since early February; however, the warnings were present long before. We were seeing warning signs in Financials long before the current regional banking crisis. On February 22nd, we even posted a public warning about this sector flashing warning signals.
We were seeing a clear bearish pattern forming off the October low, which was confirmed over the last 2 weeks.
We were also seeing similar warnings in international markets. The reason this was concerning was that if we were on the verge of starting a new bull market, this would likely be signaled across the globe. This was not what we were seeing.
For example, the Canadian TSX has a long history of leading the US markets. This was a very clear bear pennant playing out, which has now been confirmed.
European markets have been relatively strong this year. For those watching, it was actually just a little behind US markets. In other words, the same bearish setup was playing out, just with a lag. So, while many were talking about a US breakout, we were seeing topping patterns in European markets, which did not line up with a new bull market forming.
So, where does that leave the US markets? From a technical perspective, the 2022 bear market does not appear to be over. We seem to be tracing a rather complex pattern, which suggests one more large degree 5 wave drop to complete the pattern.
These complex patterns tend to have shallow recovery rallies, much like we saw in July/August, and then again in October/January. Also, another key feature is that the length of each leg tends to be proportionate.
Note: For a Limited Time, I/O FundNote: For a Limited Time, I/O Fundis offering a $99/year Premium Newsletter plan that provides one actionable stock tip per month and analysis from a top performing, audited team. Click here for more detailsis offering a $99/year Premium Newsletter plan that provides one actionable stock tip per month and analysis from a top performing, audited team. Click here for more detailsClick here for more details
For the first leg, which is marked “W” in the chart below, it broke down into 3 legs, marked A,B,C. Note how the C wave, which bottomed in June, is exactly 150% the length of the A. Regarding the 2nd leg of this bear market, which is marked “Y”, we should expect similar proportions.
Interestingly, if we apply the same measurements, from the recent top in February of 2023, 150% targets the 3050 SPX region. This lines up with several techniques pointing out the significance of this support region. If this pattern is playing out, we will loosely target this zone for some signs of a low being put in.
However, we need confirmation that this leg is playing out. The primary pivot will be 3765-3750. If we break below here, I would expect the drop to unfold rather rapidly. As long as we stay above this pivot, there is an off chance that we could see one more attempt at a bullish push higher, before the next leg lower.
Peak Inflation?
On Tuesday, the market celebrated a YoY CPI reading that was in line with expectations. While equities were up, long duration bonds on the other hand were down, which was a warning. This is interesting because what drives the price of long duration bonds is not the FED, but the growth and inflation outlook set by the bond market. With the FED trying to lower rates, and the CPI print coming in as expected, signaling inflation is cooling, you would think the bond market would rally with equities.
What the headlines were not discussing was that the CPI print was actually much hotter than the YoY print was suggesting. Inflation is best measured on a sequential basis, not a YoY basis. What matters is the trend, not annual comparison. It’s much more important to see if inflation is improving from month to month, not year over year, when tracking the trend.
I prefer to take the 3-month annualized readings to get the best feel for the actual trend. When you add up the prior 3 month readings and annualize them, the number comes out to 4.08%, compared with last month’s reading at 3.4%. This is a concerning rate of acceleration, and marks the 2nd month in a row of an accelerated trend within the CPI data.
Even more concerning, we are seeing a similar acceleration in energy, core prices, core goods, shelter, as well as services, which has been the biggest concern regarding inflation. The reason why services is so concerning is because it accounts for ~85% of the US GDP and it is still expanding above its 12 month trend.
With an on-going economic expansion comes inflation, which continues to show up in the CPI numbers. There is no question the FED, short of a banking crisis, would have to increase their terminal rate well above 5%, considering both the resilience of the US economy and the stubbornness of inflationary pressures in the services sector. This is why, in light of the troubles in the banking sector, the futures market is still priced in a 25 bps raise at a 50% chance.
What’s more concerning is that the current inflation readings were for February, which was done with Wheat and Energy commodities at subdued prices. If we look at these charts, from a technical perspective, they appear to be either coming to the end of their large downtrends, or in bullish postures, suggesting a bigger breakout is brewing.
Take gasoline, for example. It’s holding the ascending triangle pattern on bullish momentum.
If we see a breakout $2.8-$3 price point, we should see a sharp move higher, which would mean higher gas prices. The same can be said with Wheat, which appears to be coming to the end of a large degree correction.
These charts are suggesting a move higher on the horizon, which would not be good for future inflation readings.
Banks Matter
When the market bottomed on October 13th, 2022, it did so on the day that major banks began reporting their earnings for Q3, 2022. Interestingly, some of the larger banks surprised to the upside and even raised their 2023 guidance. What became apparent was that larger banks were thriving in the elevated rate environment.
Through various FOMC policies like 0% interest rates, operation twist, QE programs, etc., banks have not seen 30-year mortgage rates this high in a very long time. Being artificially suppressed, this affected the margins. So, this change was actually a windfall for banks that have been starved for years to make more money on the difference they take in for loans and then pay out on liabilities, also called net interest income (NII).
For example, JP Morgan in Q3 of 2022 reported NII of $17.6 billion, and guided for NII of $61.5 Billion for the year, beating expectations of $58 Billion. Even more astounding, JP Morgan announced that they currently have $1.2 Trillion in excess cash at the time. But, JPM was not the only bank reporting similar growth, we saw similar stories around the October lows from most major banks.
As a result, financials led the market higher into late November, which was signaling a stronger economy than most were anticipating. This was one of the primary reasons why we went on a spending spree in mid-late October. What’s important to note is that when financials are strong, the market tends to be strong, and vice versa.
For reference, there have been two bear markets that saw a greater than 50% drawdown in modern market history: 1929, 2008. They are extremely rare events that have one common theme running throughout each narrative – a banking crisis.
In each instance we saw a rare phenomenon that can be summed up as a loss of confidence in the banking sector. Each instance also saw the credit windows shut for even reasonably capitalized companies, which only intensified the accompanied recessions.
Note: For a Limited Time, I/O FundNote: For a Limited Time, I/O Fundis offering a $99/year Premium Newsletter plan that provides one actionable stock tip per month and analysis from a top performing, audited team. Click here for more detailsis offering a $99/year Premium Newsletter plan that provides one actionable stock tip per month and analysis from a top performing, audited team. Click here for more detailsClick here for more details
It’s easy to dismiss the financial sector in today’s tech focused market. After all, financials only account for 11% of the total market cap of the S&P 500, with 3 sectors ahead of it. However, all companies depend on loans, and when banks get scared, the credit window shuts, which tends to lead to outsized bankruptcies. Bankruptcies lead to unemployment, which leads to less spending, which snowballs the process into a panic.
With the recent fall of Silicon Valley Bank (SIVB), followed by Signature Bank (SBNY), we saw the 2nd and 3rd largest bank failures in US history. In fact, the run on SIVB was the largest bank run in US history, with $2 Billion withdrawn in one day. Prior to this run, Washington Mutual was the largest run, with $16.7 Billion over 10 days.
According to the markets, the problem is not localized. The below chart is a handful of larger regional banks in the S&P 500 as well as the SPYDR Regional Bank ETF (KRE). This type of drop off is not the sign of a healthy stock, and we are seeing them across the board.
No one knows what will ultimately play out. We could see no further bank failures, accompanied with inflation continuing to trend towards the FED’s 2%. This would allow them the freedom to start a fresh liquidity cycle and rescue equities from any additional volatility. However, the above charts are quite telling and very unhealthy. They appear to be incomplete, and if they break below the recent panic low, expect the banking crisis to only intensify.
In conclusion, markets climb a wall of worry. This was the phrase that championed one of the greatest bull markets in US history from 2009-2022. After all, the market shrugged off Grexit, Brexit, the downgrading of US debt, two global slowdowns, China crash 1 and 2, as well as a global pandemic (!) Why would investors not believe it could shrug off a regional banking crisis as well as inflation?
However, the one common theme within the last bull market was that the FED was allowed to maintain an expansive liquidity cycle due to low inflation. Even in 2016, 2019 and 2020, the FED was able to start fresh liquidity cycles before the selloff lead to severe damage in the markets and economy. Today, the FED is aggressively draining liquidity from the system as a means to fight inflation, as shown in the below chart that compares liquidity in the system to the S&P 500
What’s troubling is that the aggressive actions taken by the FED are starting to affect the banking sector. However, these aggressive actions are simply not doing enough to quell inflation.
It could be argued that the FOMC will drop rates, start a new liquidity cycle and save the day. History suggests that this is not the case once the damage is done. It takes months for rate changes to filter into the economy, and once an aggressive hiking cycle breaks something, it tends to run its course in the equity markets before a bottom is found. The below chart compares the Fed Funds rate to the S&P 500. Note when the FED started lowering rates, which started a fresh liquidity cycle. Then look at how long it takes for equities to finally respond.
Maybe inflation will trend lower going forward, and maybe no more banks will have trouble; maybe, we are missing out on an opportunity to buy equities at lower prices just before a new bull market is about to start up. This is a very thin needle that must be threaded, and until we get evidence it is manifesting, we remain cautious.
Join us every Thursday, at 4:40 EST, when we host a webinar for our premium members. We go over various markets, outline what we are seeing and what we need to see in order to reverse our perspective. We also go through the charts of tech stocks and some cryptos that we are targeting to buy or trim. You can sign up here.
Note: For a Limited Time, I/O FundNote: For a Limited Time, I/O Fundis offering a $99/year Premium Newsletter plan that provides one actionable stock tip per month and analysis from a top performing, audited team. Click here for more detailsis offering a $99/year Premium Newsletter plan that provides one actionable stock tip per month and analysis from a top performing, audited team. Click here for more detailsClick here for more details
The I/O Fund is a publishing company. The analysis, strategies, reports, activity and all other features of our service is provided for informational and educational purposes only, and should not be construed as personalized investment advice. Hedging is an advanced method of trading stocks, sudden losses can occur, and hedging should only be pursued under the supervision of your personal financial advisor.