Microsoft Q4FY23 Pre-ER: Looking to build AI momentum into FY24

We recently wrote about Microsoft’s $100B revenue opportunity in AI and the potential valuation impact of its strategic AI initiatives that go beyond traditional valuation metrics. One approach treated the opportunity as a separate business unit aka Microsoft AI. Using conservative margin assumptions under this approach, we estimated that MSFT AI could earn $4-5 in eps and our bull case price of MSFT + MSFT AI is about $485 (+40%).

As you know, we are incredibly bullish on AI and these are starting points, not ending points. Specifically for Microsoft, we stated that it’s enterprise customer base would propel the company forward as an AI leader because enterprises are the perfect customer for AI. This is because enterprises can drive down costs and increase productivity for immediate ROI whereas consumers may be slower to adopt AI and/or see how it benefits them directly. The ability to directly monetize enterprise customers with AI features faster than peers is materializing with the $30/month CoPilot 365 plan.

MSFT is just beginning to incorporate AI into its core offerings – starting with Microsoft Bing Chat enterprise and Microsoft Co-Pilot 365 – which by its own estimates AI will only contribute 1% to its Azure division in q4. For example, based on an analysis done by Macquarie bank, AI could add $14B to sales in its first full year. 

We anticipate that MSFT will build upon its momentum from Q3 into Q4FY23. Meanwhile, 1hFY24 comps will also be supportive. MSFT’S commentary on the AI potential across its businesses in FY24 will be a clear, key focus. The upcoming quarters will be important to follow the growth and stability in Azure, Productivity and Intelligent Cloud businesses, as well, while looking for signs of the bottom in the Personal Computing division.

Fundamentally, we will monitor the impact on revenues and over time the margin impact on these units.

Here are the Q4 estimates going into earnings announcement on 7/25 (amc).

EPS

  • Q4FY23 consensus earnings of $2.54
  • Q1FY24 consensus of $2.60

Group Sales

  • Q4FY23 MSFT midpoint guidance of $55.35B (+7 y/y) vs Consensus of $55.42B
  • Q1FY24 consensus of $54.9 – we will want commentary on FY2024 in the call, not sure if CFO will provide as recently MSFT has pulled full year guidance given uncertainty in PCs

Microsoft sales guidance by division

  • Azure & other cloud – +26-27% y/y in constant currency, includes about 1% from AI services
  • Productivity & Business Processes – $17.8B to $18.28B, +8.7 y/y at the midpoint. CC guidance is 10% to 12% 
  • Intelligent Cloud – $23.6B to $23.9B up 13.6% y/y at the midpoint, CC guidance is 15-16%
  • Personal Computing – $13.35B to 13.75B, (-5.6%) y/y at midpoint

Margins

  • Q4FY23 MSFT gross margin of guidance of 69.5% vs Q323 of 69.5% actual vs Q223 of 67% actual
  • Q4FY23 MSFT operating margin of guidance of 42.1% vs Q323 of 42.3% actual vs Q223 of 41% actual

Cash flow + Cash

  • Q3FY23 operating and free cash flow was $24.5B and $17.8B for a margin of 46% and 34%, respectively
  • Q3FY23 cash stood at $104B and $48B in debt

Here are the things we’ll be looking for:

  • Microsoft Bing Chat and Microsoft Co-Pilot 365 – further insights into AI products, how it expects to impact sales, how it may evolve and the “domino” effect it may have on its other businesses
  • Big Tech has prioritized higher ROI capex (i.e., AI infrastructure) in 2023 calendar year. Analysts may ask CFO about FY2024 capex.
  • FY24 and Q124 guidance – MSFT will likely provide qualitative 2024 FY and financial Q1FY24 guidance. Meanwhile consensus is estimating a decline in sales in q4/q1. Anything better will be viewed positively. Consensus is forecasting FY2024 sales and eps growth 11.8% and 14.2%, respectively. Neither of which appear to be demanding given the underlying secular demand drivers.
  • FY2024 profitability outlook – In FY2023, MSFT pulled several levers to manage its margins from corporate restructurings to accounting change to equipment useful life. We will look for the key drivers that will drive FY2024 margins.  
  • Azure and cloud competitive dynamics and growth – is MSFT taking market share in its Azure cloud related businesses and what is the growth outlook. Plus, comments on the overall corporate IT spending environment.
  • Current PC environment, the channel inventory situation and if it’s closer to the bottom. Macro and how it’s impacting its consumer related businesses
  • Update on Activision merger – recently Microsoft and Activision Blizzard jointly agreed to extend the merger agreement deadline from July 18, 2023, to October 18, 2023, to allow for additional time to resolve remaining regulatory concerns.

Here’s what analysts are saying

Stifel raised the firm's price target on Microsoft to $380 from $320 and keeps a Buy rating on the shares. The firm believes Azure should post "solid upside" to management's 26%-27% year-over-year constant currency growth guidance given strong enterprise checks, management's commentary that implied optimization activity should begin to abate as customers lap initial efforts and the firm's expectation of greater than expected AI contribution. The firm expects new Cloud project go-live growth to stabilize as customer's return to reinvesting into cloud migrations

Citi raised the firm's price target on Microsoft to $425 from $340 and keeps a Buy rating on the shares. The analyst remains positive on the shares into the company's fiscal Q4 results. Citi's reseller survey shows improving target achievement levels and an expected acceleration in growth into fiscal 2024, the analyst tells investors in a research note. To reflect signs of improving channel partner inputs and generative artificial intelligence tailwinds, the firm raised estimates "more substantially" across Office 365 Commercial and Azure.

Mizuho analyst Gregg Moskowitz raised the firm's price target on Microsoft to $420 from $390 and keeps a Buy rating on the shares. The big news from day one of Microsoft Inspire came in the form of a $30 per user per month add-on for Microsoft 365 Copilot, the analyst tells investors in a research note. The firm estimates the cumulative incremental revenue from Microsoft 365 Copilot by the end of fiscal 2025 could exceed $9B using a 20% attach rate, and approach $19B using a 40% attach rate. It remains confident that Microsoft's growth opportunities over the medium term and beyond are "greater than many realize."

JPMorgan raised the firm's price target on Microsoft to $385 from $350 and keeps an Overweight rating on the shares. The analyst left the company's Inspire conference "incrementally positive" on its category leadership in artificial intelligence. The announced M365 Copilot pricing of $30 per user per month is an "upside shocker" versus investor expectations closer to $10, the analyst tells investors in a research note. The price point aligns with the perspective that Copilots are far exceeding expectations in the private preview stage

BofA analyst Brad Sills raised the firm's price target on Microsoft to $405 from $340 and keeps a Buy rating on the shares. BofA expects Microsoft to report "healthy 1% upside" to the firm's Q4 revenue estimate of $55.45B, based on Azure and O365 strength. The firm also expects upside to its Azure estimate of 27% year-over-year constant currency growth due to better AI/ML workloads and baseline migration strength, the analyst tells investors in an earnings preview note. BofA forecasts double digit constant currency FY24 revenue growth guidance, assuming "conservative" low 20s percentage Azure growth, low/mid-teens O365 growth and Windows OEM growth of 2%.

Bernstein analyst Mark Moerdler notes that Microsoft announced Bing Chat Enterprise and Microsoft 365 Copilot pricing earlier, which is higher than the firm expected, at $30 per user per month for Microsoft 365 E3, E5, Business Standard, and Business Premium editions. This is a price uplift of 53% to 240%, to list price of these SKUs, depending on what Microsoft 365 edition being used. The price lift is similar to that of Microsoft GitHub Copilot. It is important to note that this announcement is only for Microsoft 365 and not Office 365, Bernstein notes. While Microsoft offers Office 365, their go-to-market focus has been in driving the Microsoft 365 bundle, Bernstein has an Outperform rating and a price target of $380.

The I/O Fund Analyst Team contributed to this analysis
Recommended Readings:

Google Q2 2023 – Year of Execution

As the women’s world cup commences, perhaps it’s apropos that both Microsoft and Google will report on 7/25 (amc). It will be a Big Tech “battle” of who can generate the most excitement on the AI opportunity and how that may impact their businesses in the future.

Given its cyclical exposure to advertising, Google’s valuation declined until it bottomed in early 2023, and has since increased due to the resilience of Search and optimism that AI will help strengthen it. Meanwhile,  there are hopes that YouTube and the Network advertising businesses will stabilize. An aggressive focus on the stabilizing costs was another catalyst.

We recently initiated a position and we’ll discuss a few things we’ll be looking for in order to add to the position.

Here are the Q2FY23 estimates going into earnings announcement on 7/25 (amc).

EPS

  • Q2FY23 consensus earnings of vs $1.34 (+11% y/y) vs Q123 $1.17 actual
  • Q3FY23 consensus of $1.34

Group Sales

  • Q2FY23 consensus of $72.75B (+4.4% y/y)
  • Q3FY23 consensus of $74.3B

Sales by division in Q123

  • Google Search and other advertising  – $40.4B, +2% y/y
  • YouTube advertising  – $6.7B (-3%) y/y  
  • Network advertising – $7.5B (-8%) y/y
  • Other – $7.4B +9% y/y
  • Google Cloud – $7.5B, +28% y/y

Margins –

  • Q1FY23 gross margin of 56.1%% vs Q422 of 53.5% vs Q323 of 54.9%
  • Q1FY23 operating margin of 25% vs Q422 of 23.9% vs Q322 of 24.6%

Cash flow + Cash

  • Q1FY23 operating and free cash flow was $23.5B and $17.2B for a margin of 33.7% and 24.7%, respectively
  • Q1FY23 cash stood at $115B and $14B in debt

One of the reasons the IO Fund has invested in larger cap stocks is that they are in a better position to navigate downturns. Big Tech also has more levers to pull to manage margins such as reducing operating expenses. Importantly, at the same time they have the financial strength to make the investments required to capitalize on the AI opportunity and take market from its weaker competitors. The medium term bull case is that once top-line begins to meaningfully reaccelerate, the combination of right-sizing costs and efficiencies garnered from technology investments leads to expanding margins. 

In Q123, this is how Ruth Porat, Google CFO, characterized the impact of focusing on opex that began in late 2022.

Question

“And then, Ruth, backing out the one-time charges, it looks like OpEx growth is now 8%, so real progress there. Could you give us a flavor of where you are, you think in your optimization cycle?”

Ruth Porat

“We remain extremely focused on these various work streams that we have talked about. It starts with the pace of hiring. It goes to the various work streams that both Sundar and I referenced around using AI and automation to improve productivity, all that we are doing with suppliers and vendors to be as efficient as possible, all that we are doing around optimizing how and where we work. You have seen some of those announcements this quarter beyond the workforce reduction, things that we are doing in, for example, office services, and we are executing against each of these various work streams. So, our view is that there is more to do. And as we try to be clear, we are in execution mode. You will see some of the benefit in ‘23. You will see more of it in ‘24, and we are going to continue building against it beyond.”

Meta has described 2023 as the Year of Efficiency. We’ll refer to Google’s 2023 as the Year of Execution.

Here are the things we’ll be looking for:

  • Google AI integration and impact across its business – This year Google introduced its chatbot BARD. Organizations are using large language models integrated within Google’s Search, Cloud, Workspace and Cybersecurity platforms.

    To improve targeting in Core Search, Google has updated search keyword relevance using the latest natural language processing from MUM models to improve the relevance and performance of shown ads. Smart Bidding uses machine learning tools to optimize the bid of the advertisers. ML tools can analyze millions of data signals and can better predict future ad conversions.

    We wrote about the potential impact AI may have here.
    here.

  • Google Search – Q1 results demonstrated the resilience of search with its unique ability to surface demand and deliver measurable ROI. We will look for signs of accelerating growth.
  • YouTube – look for continued signs of stabilization in its advertising exposed businesses and growth in its subscription based services. This is how Ruth Porat described it:

    “YouTube, we saw signs of stabilization in ad spend on a sequential basis.”

  • Network advertising – look for signs of stabilization and improvement. According to the CFO, investors can expect YouTube to be somewhat stabilized whereas Network is still decelerating: “And I would contrast that last quarter, we talked about both a pullback in YouTube and Network, and we were pleased that we saw the stabilization in ad spend on a sequential basis in YouTube. We still saw an ongoing pullback in Network, which tends to be a mix of businesses, as you know well.”
  • Continued momentum in its Cloud business – for the first time Google had an operating profit in its cloud division. Q123 operating margins were 2.6% and represented 11% of sales. This is how Ruth Porat described it (which is bullish for AI accelerators from NVDA and potentially AMD and MRVL in the future):

    “At the same time, I think at the core of your question, and what we were trying to convey is we will continue to invest to support long-term growth, in particular, given the opportunities we see delivering AI capabilities to our customers.”

    However, the 28% growth rate may not be the bottom for Google Cloud:

    “That being said, in Q1, we continued to see slower growth of consumption as customers optimized GCP costs reflecting the macro backdrop, which remains uncertain. In terms of operating performance, we remain focused on driving long-term profitable growth in Cloud, while continuing to invest given the substantial opportunity.”

  • Capex outlook for FY 2023 – in Q1 Google raised their capex outlook and stated:

    “Finally, as it relates to CapEx, for 2023, we now expect total CapEx to be modestly higher than in 2022. As discussed last quarter, CapEx this year will include a meaningful increase in technical infrastructure versus a decline in office facilities.”

    This was reiterated later: “And then as we talked about last quarter, the increase in CapEx for the full year 2023 reflects the sizable increase in technical infrastructure investment, on the flip side, a decline in office facilities relative to last year.”

  • FY2023 profitability and beyond – Now that Google is half way through their Year of Execution, we will look for any indications on this how may improve profitability once Network and YouTube advertising begin to improve.
  • September 2023 anti-trust trial – We don’t expect anything from the call but wanted to remind our Members as that date is fast approaching. We wrote about the possible ramifications here.

Here’s what analysts are saying:

Stifel raised the firm's price target on Alphabet to $135 from $130 and keeps a Buy rating on the shares ahead of the company's upcoming earnings report. The firm is "slightly" revising higher its digital advertising growth forecasts for 2023 and 2024, though it is only expecting "slightly better results" for ad-based names relative to the top-line outperformance witnessed in Q1 

BofA raised the firm's price target on Alphabet to $142 from $128 and keeps a Buy rating on the shares ahead of the company's Q2 report due on July 25. BofA forecasts revenue and GAAP EPS at $60.7B and $1.42 versus the Street at $60.4B and $1.34, respectively. The firm is constructive on stable search share trends, which it thinks will enable Google to control the pace of large language model integration

Jefferies said the firm's checks indicate overall higher ad spend growth in Q2 for larger platforms after a cautious start to the year due to economic uncertainties and core Google search holding up, "albeit still at muted growth rates." Alphabet is up 41% year-to-date and the firm notes higher expectations, but argues the valuation is "still low" and it believes the stock "could work" into the second half thanks to improved ad checks in Q2 and the advertiser outlook for the second half. The firm, which expects a beat from Alphabet and has a $150 price target on the shares. 

KeyBanc analyst Justin Patterson raised the firm's price target on Alphabet to $140 from $122 and keeps an Overweight rating on the shares ahead of quarterly results. The firm believes Q2 is largely improved and growth should re-accelerate. In its conversations, investors perceive Alphabet as a "grind higher" stock given there is likely more limited upside to revenue from Search's vertical exposures and a theoretical ceiling on the multiple due to AI risk. That said, most investors acknowledge Street EPS forecasts appear conservative and that re-accelerating revenue growth provides some near-term reasons for optimism 

Credit Suisse analyst Stephen Ju raised the firm's price target on Alphabet to $150 from $135 and keeps an Outperform rating on the shares ahead of quarterly results. Conservatively assuming ongoing headwinds in 2024 and normalization in 2025, the takeaway for Alphabet's shares is that even leaving upside potential from improving monetization potential for YouTube, Maps, and other non-Search surfaces off the table, the firm arrives at a positive investment conclusion. Switching focus to the more near-term, Credit Suisse's checks suggest an acceleration of year-over-year Search budget growth for Q2, as would be expected given easing comparisons. As for YouTube, the firm has received improving advertiser feedback quarter-over-quarter of increasing ad budgets, as CPG vertical spend recovers coinciding with what looks to be increasing ad loads.

Jefferies said the firm's checks indicate overall higher ad spend growth in Q2 for larger platforms after a cautious start to the year due to economic uncertainties and core Google search holding up, "albeit still at muted growth rates." Alphabet is up 41% year-to-date and the firm notes higher expectations, but argues the valuation is "still low" and it believes the stock "could work" into the second half thanks to improved ad checks in Q2 and the advertiser outlook for the second half. The firm, which expects a beat from Alphabet, maintains a Buy rating and $150 price target on the shares.

The I/O Fund Analyst Team contributed to this analysis
Recommended Readings:

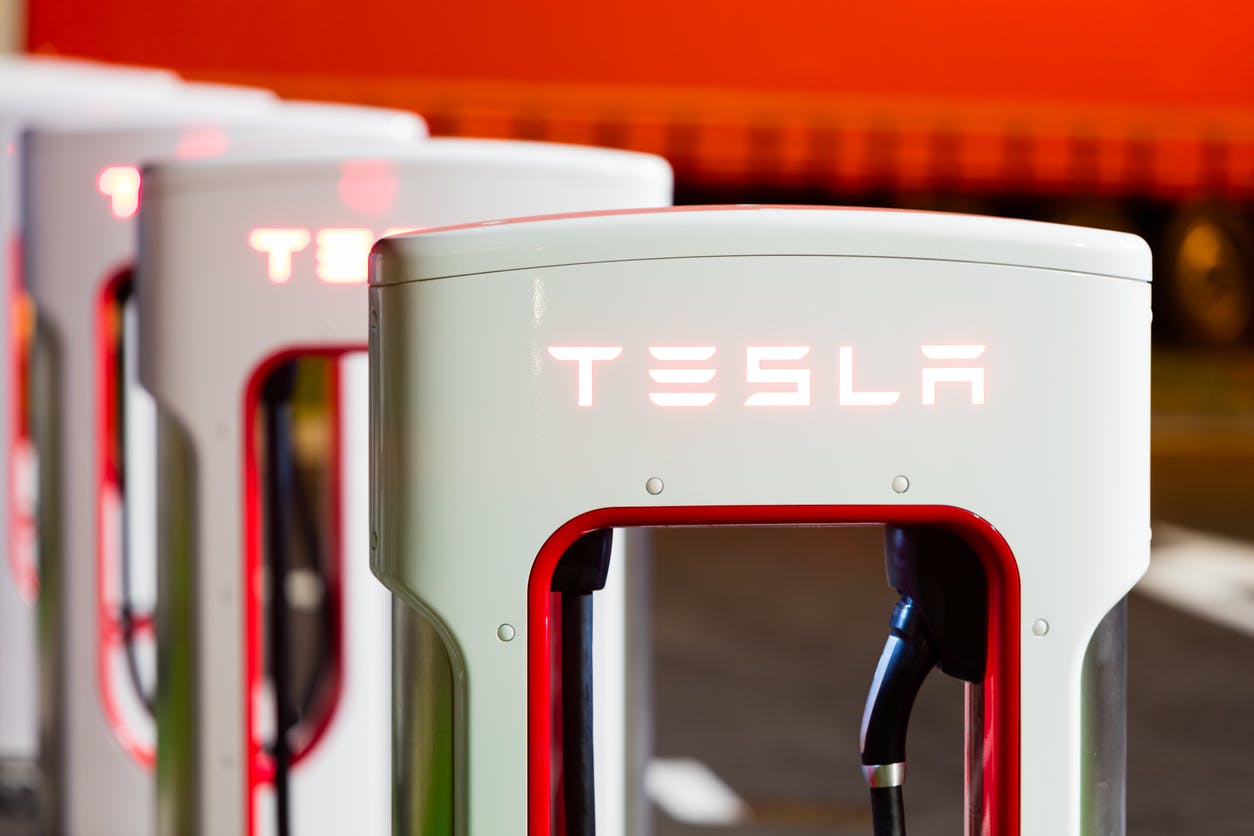
Tesla Q2 Earnings – It’s About Margins

This article was originally published on Forbes on Forbes Forbes on Jul 21, 2023,08:15am EDT

After the strong rally, it appears the market is taking profits on commentary around the outlook for margins. It’s not only that they were lower quarter-over-quarter (QoQ), but also Tesla provided zero insight as to how much lower margins can go. The market does not like uncertainty. It’s somewhat ironic that during the call Musk can wax poetic about the complexities of AI, neural net training, the 6-million dollar man, and robotic taxis yet when it comes to basic profitability drivers, he can’t say anything. The former drove the price post Q123 and the latter is driving the price today.

Did reported automotive gross margins bottom?

Likely not.

Telsa had a reported Q223 automotive gross margin of 19.2% vs Q123 of 21.10% vs Q422 of 25.90%. Meanwhile, Q223 group operating margins were of 9.6% vs Q123 of 11% vs Q422 of 16%.

Reported automotive gross margins and operating margins peaked in Q222 at 32.9% and 19.3% respectively. Since then, both have been steadily declining downward. The stock is weaker today because the market does not know where or when these two metrics will ultimately bottom.

Looking ahead, Tesla will continue to focus on volumes through lower prices and at the expense of margins. Here’s what Zachary Kirkhorn, CFO said:

“Second, we continue to work towards our goals of maximizing volumes on both, our vehicle and energy business, but most importantly, doing so in a way that generates the capital to continue our pace of R&D and capital investments. This requires a strong focus on per unit COGS reductions in each of our key businesses, as well as working capital improvements on raw materials, work in process inventory and customer AR, all of which progressed appropriately in Q2.

If we look specifically at our automotive business, our gross margin showed a modest reduction and remained healthy, despite action taken to further improve vehicle affordability early in the quarter. We recognized – we realized per unit cost improvements in nearly every category, including material cost and commodities, manufacturing costs and logistics”

Sign up for I/O Fund's free newsletter with gains of up to 221% – Click hereClick hereClick here

In response to a question on pricing, Tesla continues the point that the company is having to lower prices due to the higher interest rate environment

Question:

“How has the order intake trended relatively to production levels during Q2? And how has it trended in the quarter-to-date period? Conceptually, how does Tesla decide when is it appropriate to reduce prices or at other sales incentives to increase demand?”

Elon Musk

“[…] Buying a new car is a big decision for vast majority of people. So, any time there’s economic uncertainty, people generally pause on new car buying at least to see what happens. And then obviously, another challenge is the interest rate environment. As interest rates rise, the affordability of anything bought with debt decreases, so effectively increasing the price of the car.

So when interest rates rise dramatically, we actually have to reduce the price of the car because the interest payments increase the price of the car. And this is — at least up until recently, it was, I believe, the sharpest interest rate rise in history. So, we had to do something about that […]

When asked again about automotive margins, management did not provide a direct answer. For our purposes, we prefer management teams to answer directly as it increases uncertainty to not provide visibility into contracting margins.

Question:

“With the emphasis of price cuts to drive volume growth eating into automotive gross margin, can investors expect to see automotive gross margin stabilize or even rise due to efficiencies outpacing the cuts? And if so, when?”

Elon Musk:

“Where’s that crystal ball, again? If I may, look, the short-term variances in gross margin and profitability really are minor relative to the long-term picture. Autonomy will make all of these numbers look silly.

Zachary Kirkhorn

“I fully agree with you. I mean, I think the only thing in the short term that matters is what I said in my opening remarks, which is are we generating enough money to continue to invest. And the portfolio of products and technologies that the technical teams are investing in right now, this is intense. It’s intense in terms of investment; it’s intense in terms of potential.”

Every Thursday at 4:30 pm Eastern, the I/O Fund team holds a webinar for premium members to discuss how to navigate the broad market, as well as various stock entries and exits. We offer trade alerts plus an automated hedging signal. The I/O Fund team is one of the only audited portfolios available to individual investors. Learn more here.Learn more hereLearn more here.

Conclusion:

The sentiment post Q223 isn’t much different than in Q123. As we all know, Tesla rallied after Q1. This time around, given the stock is at higher levels, there may be less AI sentiment to support it in the short term. Q3 won’t be a catalyst and analysts will likely reduce numbers.

While many will argue that Tesla is one of the most advanced AI companies in the world, my response is “sure” but Tesla is also heavily exposed to consumer spending — and this is entirely out of their control. The comment on interest rates is the most important comment from the call as high interest rates mean Tesla must lower prices. In a way, management is agreeing that quite a bit about the current situation is out of management’s control. While some will talk about recurring software revenue from robotaxis as the most important catalyst, the harsh reality is that the FED lowering rates is the most important catalyst for Tesla today. That may not be as exciting as AI, but Tesla is one of many tech stocks whose revenue growth and profitability is on borrowed time until the Fed instills a more dovish policy.

The I/O Fund Analyst Team contributed to this analysis.

Recommended Readings:

Tesla Q2 2023 Earnings – It’s About Margins

After the strong rally, it appears the market is taking profits on commentary around the outlook for margins. It’s not only that they were lower q/q, but also Tesla provided zero insight as to how much lower margins can go. The market does not like uncertainty. It’s somewhat ironic that during the call Musk can wax poetic about the complexities of AI, neural net training, the 6-million dollar man, and robotic taxis yet when it comes to basic profitability drivers, he can’t say anything. The former drove the price post Q123 and the latter is driving the price today.

Earnings estimates had been steadily reduced since Q123 so the hurdle to beat was not very high.

Revenue and EPS both beat in the current quarter:

  • Q2 revenue of $24.97B vs $24.6B consensus
  • Q2 adjusted of  $0.91 vs $0.85 consensus

Margins contracted, which you’ve likely heard by now:

  • Q223 gross margins of 18.2% vs Q123 of 19.3% vs Q422 of 23.8%  
  • Q223 reported automotive gross margin of 19.2% vs  Q123 of 21.10% vs Q422 of 25.90%   
  • Q223 opm of 9.6% vs Q123 of 11% vs Q422 of 16%

Cash Flow was strong:

  • Q223 operating cash flow of $3.1B vs Q123 of $2.5B
  • Q223 free cash flow of $1B vs Q123 of $441
  • Q223 cash of 23.1B vs Q123 of  $22.4B in cash

Production and deliveries are strong and in line with management’s FY guidance of 1.8 million electric vehicles:

  • Q123 produced 440,808k vehicles (+44%) and delivered 422,875 (+36%)
  • Q223, TSLA produced 479,700 vehicles (+83%) and delivered 466,140 (83%)

What were we watching for and what happened?

We outlined what we were watching for in this write-up here. Our portfolio criteria is sensitive to contracting margins. We stated the following: “After guiding to a minimum of gross automotive margins ex-credits of at least 20% in 2023 during their q422 call. Tesla did a 180 in q123 and said that they had decided to lower prices to sell more vehicles and sacrifice margins. We wrote about this about this here and here. In addition, Tesla signaled that automotive gross margins may continue to go lower in the short term. From a longer term perspective, this shift from a pricing to market share focus does have its strategic merits but TSLA has not communicated the profitability impact.”

Did reported automotive gross margins bottom?

Likely not. 

Telsa had a reported Q223 automotive gross margin of 19.2% vs Q123 of 21.10% vs Q422 of 25.90%. Meanwhile, Q223 group operating margins were of 9.6% vs Q123 of 11% vs Q422 of 16%.

Reported automotive gross margins and operating margins peaked in Q222 at 32.9% and 19.3% respectively.  Since then, both have been steadily declining downward. The stock is weaker today because the market does not know where or when these two metrics will ultimately bottom.

Looking ahead, Tesla will continue to focus on volumes through lower prices and at the expense of margins. Here’s what Zachary Kirkhorn, CFO said:

“Second, we continue to work towards our goals of maximizing volumes on both, our vehicle and energy business, but most importantly, doing so in a way that generates the capital to continue our pace of R&D and capital investments. This requires a strong focus on per unit COGS reductions in each of our key businesses, as well as working capital improvements on raw materials, work in process inventory and customer AR, all of which progressed appropriately in Q2.

If we look specifically at our automotive business, our gross margin showed a modest reduction and remained healthy, despite action taken to further improve vehicle affordability early in the quarter. We recognized – we realized per unit cost improvements in nearly every category, including material cost and commodities, manufacturing costs and logistics”

In response to a question on pricing, Tesla continues the point that the company is having to lower prices due to the higher interest rate environment

Question:

“How has the order intake trended relatively to production levels during Q2? And how has it trended in the quarter-to-date period? Conceptually, how does Tesla decide when is it appropriate to reduce prices or at other sales incentives to increase demand?”

Elon Musk

“[…] Buying a new car is a big decision for vast majority of people. So, any time there’s economic uncertainty, people generally pause on new car buying at least to see what happens. And then obviously, another challenge is the interest rate environment. As interest rates rise, the affordability of anything bought with debt decreases, so effectively increasing the price of the car.

So when interest rates rise dramatically, we actually have to reduce the price of the car because the interest payments increase the price of the car. And this is — at least up until recently, it was, I believe, the sharpest interest rate rise in history. So, we had to do something about that […]

When asked again about automotive margins, management did not provide a direct answer. For our purposes, we prefer management teams to answer directly as it increases uncertainty to not provide visibility into contracting margins. 

Question:

“With the emphasis of price cuts to drive volume growth eating into automotive gross margin, can investors expect to see automotive gross margin stabilize or even rise due to efficiencies outpacing the cuts? And if so, when?”

Elon Musk:

“Where’s that crystal ball, again? If I may, look, the short-term variances in gross margin and profitability really are minor relative to the long-term picture. Autonomy will make all of these numbers look silly.

Zachary Kirkhorn

“I fully agree with you. I mean, I think the only thing in the short term that matters is what I said in my opening remarks, which is are we generating enough money to continue to invest. And the portfolio of products and technologies that the technical teams are investing in right now, this is intense. It’s intense in terms of investment; it’s intense in terms of potential.”

Additionally, management discussed that there will be factory downtime related to upgrades. This will have a cost impact.

“As we look forward to the rest of the year, I want to reiterate Elon’s comments on Q3 volumes driven by planned downtimes for factory upgrades. These upgrades will also carry some amount of factory idle cost. However, we are working to minimize as much as possible.”

Our take:Our take:

If Tesla has a pricing strategy, they aren’t sharing it. The take-away is that Tesla will continue to lower prices to offset higher interest rates and focus on volume price over to take in cashflow. And Tesla will tell you that any short-term margin variability is not a big deal because the margins on autonomy will be much bigger in the future.

Taking this all together, we believe the reported automotive gross margins and operating margin will be lower in Q323 vs Q223. Consensus will likely reduce their estimates as well.

Did they benefit from the IRATC and lower commodity prices?

Yes, they did.

Question

“Could you quantify the benefits to COGS per unit from the IRA battery manufacturing incentives; and secondly, battery raw material declines year-to-date?”

Zachary Kirkhorn

“All right. I can take that. On the first part of the question for IRA manufacturing incentives, we provided previous guidance that we expect these to be for the course of this year in the range of $150 million to $250 million per quarter. […] Lithium is the most notable improvement so far. I think I commented on this on the last call, because typically, we see this coming about a quarter before it actually is realized in our financials. […] We’re also seeing benefits in aluminum and steel, which I think is great. Not as large as the lithium impacts, but they contribute nonetheless. So, if we add up the total impact of this in Q2 relative to prior quarter, it’s about the same size and magnitude as the IRA benefits that we also received.”

Our take:Our take:

Tesla has and will likely use these benefits as ammunition to lower prices.

Free Cash Flow and Inventory Improved

Q223 free cash flow was $1B vs Q123 of $441.

Inventory days although higher, went from 15 to 16 days. A deceleration compared to prior quarters.

The I/O Fund’s Plans:

The sentiment post Q223 isn’t much different than in Q123. As we all know, Tesla rallied after Q1. This time around, given the stock is at higher levels, there may be less AI sentiment to support it in the short term. Q3 won’t be a catalyst and analysts will likely reduce numbers.

We will review if we have the right allocation given the current environment. I’m guessing we will trim when Knox finds the appropriate moment. While many will argue that Tesla is one of the most advanced AI companies in the world, my response is “sure” but Tesla is also heavily exposed to consumer spending — and this is entirely out of their control. The comment on interest rates is the most important comment from the call as high interest rates mean Tesla must lower prices. In a way, management is agreeing that quite a bit about the current situation is out of management’s control. While some will talk about recurring software revenue from robotaxis as the most important catalyst, the harsh reality is that the FED lowering rates is the most important catalyst for Tesla today. That may not be as exciting as AI, but Tesla is one of many tech stocks whose revenue growth and profitability is on borrowed time until the Fed instills a more dovish policy.

The I/O Fund Analyst Team contributed to this analysis.

Recommended Readings:

Netflix Q2 2023 Earnings: UCAN Region Flat on Revenue

Netflix’s report had some puts and takes.

Positives:

EPS was a beat at $3.29 versus $2.86 expected. The previous free cash flow guide for FY2023 was at $3.5 billion, and the full year guide is now raised to $5 billion this year. The company beat on paid net adds at 5.9 million compared to 2.1 million expected. Notably, the beat on net adds is coming from paid sharing, to where you can pay a lower fee to be added to someone’s account. The beat is not coming from the ad tier.

There was a marginal miss on revenue at $8.18 billion compared to $8.29 billion expected. There was also a marginal miss on forward revenue at $8.52 billion management guidance versus $8.68 billion expected. These things may seem insignificant, but most tech stocks are priced to perfection right now. 

The question is why did Netflix have such a big beat on net adds but not on revenue? 

Negatives: 

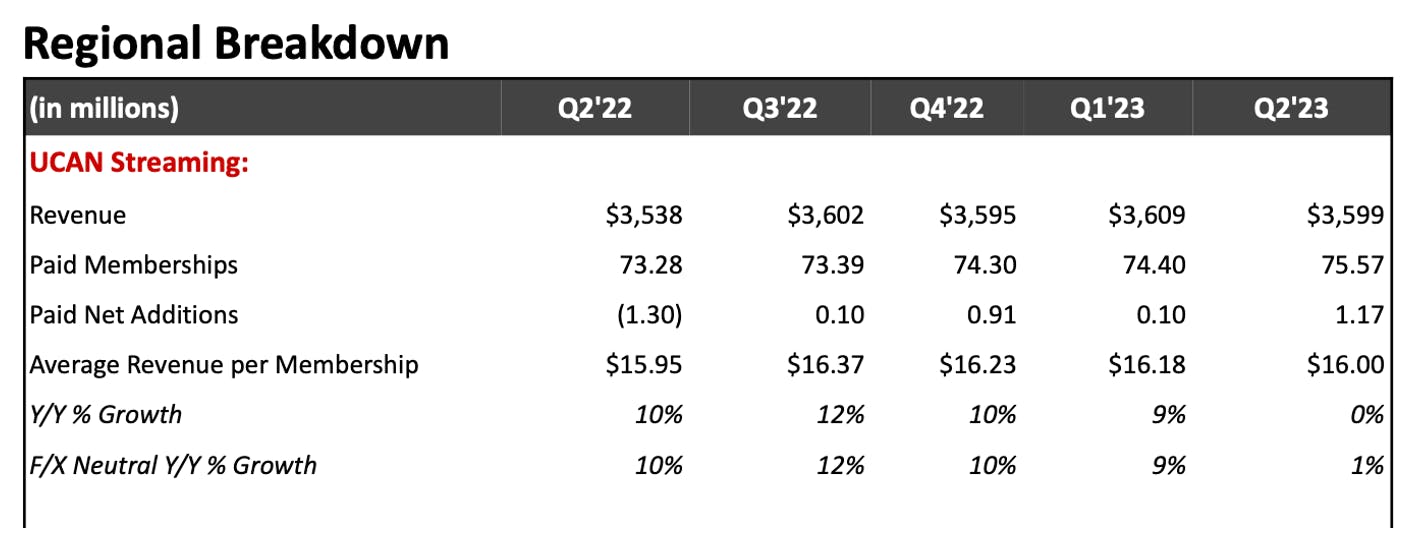
This is a blemish because in the past, the region grew 10% in revenue with similar net paid adds (reference Dec 2022 quarter), or there were no new net adds and still grew 9% in revenue (reference September 2022 quarter). Notably, even when Netflix lost 1.3 million subscribers, the company grew UCAN by 10% YoY on CC Basis. Therefore, it is unusual that Netflix did not grow revenue YoY in UCAN region, especially given the net adds.

Almost half of Netflix’s revenue comes from UCAN and so it’s watched closely. According to management, the UCAN region had benefited from increased pricing and is now only reflecting paid sharing plans. The UCAN region resulted in overall ARM being down 1%.

Today, separate from the earnings report, Netflix removed the basic, ad-free option for new subscribers in the United States and United Kingdom. New subscribers will have to pay $6.99 with ads or $15.49 without ads, eliminating the $9.99 tier.

On a side note, the ads ARM is expected to be $8.50, per management comments in the call.

Margins:

Margins were strong. Gross margin was flat yet operating margin was a beat by 330 basis points for an operating margin of 22.3% and operating income of $1.827 billion. Net margin also surpassed expectations by 260 basis points, which flowed to the beat on EPS.

Cash:

As stated, cash was quite strong at $1.44 billion in the quarter, up from $103 million a year ago. Management raised guidance from $3.5 billion in FCF for the fiscal year to $5 billion in the current fiscal year.

Earnings Call:

As stated, the primary blemish is related to UCAN. In the call, management emphasized overall revenue will accelerate yet could have been more clear about UCAN specifically.

This was stated at one point regarding ARM being down next quarter, as well: “But if you think about the drivers of average revenue per member, starting with the revenue drivers that we spoke about a moment ago, you can see our FX neutral, ARM is — it was down 1%, FX neutral in Q2 and we expect similar in Q3, flat to slightly down. That's mostly due to the limited price adjustments we mentioned over the past year in our big revenue markets in advance of rolling out paid sharing.”

Jessica Reif Ehrlich:

“Well, maybe you can help us think through like in UCAN, how much of the ARM growth is a function of add-on members to existing accounts versus new subs signing up to higher priced plans. And it sounds like from your letter that ARM will accelerate in the second half as you get further along in password sharing. Is that correct?”

Spencer Neumann:

“Yeah. Maybe just broadly thinking about our kind of revenue in Q2 and going forward. Jessica, the key is that we delivered revenue in line in Q2 with our expectations and we're on track to accelerate that revenue in Q3 and further accelerated in Q4. That's really our primary objective around revenue acceleration and we're set to deliver on it. But if we step back on thinking about our revenue growth and components overall or within a given region, it's driven by a combination of pricing, volume and new revenue streams like ads.

So if we think about each one of those, so we're now more than a year out from any price adjustments in our big revenue countries. We largely paused them during paid sharing rollout and so that's to be expected. For ads, that new revenue stream, we've expected a gradual revenue build and so that's not expected to be a big contributor this year. So continues to be on target. So most of our revenue growth this year is from growth in volume through new paid memberships and that's largely driven by our paid sharing rollout.”

The Hollywood strike is also a concern although management was bit vague about the implications other than saying: “These strikes, this strike is not an outcome that we wanted” and did not answer the question directly as to how much content they have in the pipeline before they run out. My takeaway was that Netflix’s stock will be impacted the longer the strike continues.

Conclusion:

Having a large beat on paid net adds but not translating that to revenue is not ideal. The company is being clear about revenue acceleration into the back half of the year, which means investors are being asked to be patient. We will likely be patient to some extent, but probably not at this allocation and with these gains. Overall, I imagine we will trim on this report. The stock has done quite well and we’d like to keep some of those gains given the weaker-than-expected quarterly report.

Recommended Readings:

Netflix Q2 2023 Earnings: UCAN Region Flat on Revenue

Netflix’s report had some puts and takes.

Positives:

EPS was a beat at $3.29 versus $2.86 expected. The previous free cash flow guide for FY2023 was at $3.5 billion, and the full year guide is now raised to $5 billion this year. The company beat on paid net adds at 5.9 million compared to 2.1 million expected. Notably, the beat on net adds is coming from paid sharing, to where you can pay a lower fee to be added to someone’s account. The beat is not coming from the ad tier.

There was a marginal miss on revenue at $8.18 billion compared to $8.29 billion expected. There was also a marginal miss on forward revenue at $8.52 billion management guidance versus $8.68 billion expected. These things may seem insignificant, but most tech stocks are priced to perfection right now. 

The question is why did Netflix have such a big beat on net adds but not on revenue? 

Negatives: 

This is a blemish because in the past, the region grew 10% in revenue with similar net paid adds (reference Dec 2022 quarter), or there were no new net adds and still grew 9% in revenue (reference September 2022 quarter). Notably, even when Netflix lost 1.3 million subscribers, the company grew UCAN by 10% YoY on CC Basis. Therefore, it is unusual that Netflix did not grow revenue YoY in UCAN region, especially given the net adds.

Almost half of Netflix’s revenue comes from UCAN and so it’s watched closely. According to management, the UCAN region had benefited from increased pricing and is now only reflecting paid sharing plans. The UCAN region resulted in overall ARM being down 1%.

Today, separate from the earnings report, Netflix removed the basic, ad-free option for new subscribers in the United States and United Kingdom. New subscribers will have to pay $6.99 with ads or $15.49 without ads, eliminating the $9.99 tier.

On a side note, the ads ARM is expected to be $8.50, per management comments in the call.

Margins:

Margins were strong. Gross margin was flat yet operating margin was a beat by 330 basis points for an operating margin of 22.3% and operating income of $1.827 billion. Net margin also surpassed expectations by 260 basis points, which flowed to the beat on EPS.

Cash:

As stated, cash was quite strong at $1.44 billion in the quarter, up from $103 million a year ago. Management raised guidance from $3.5 billion in FCF for the fiscal year to $5 billion in the current fiscal year.

Earnings Call:

As stated, the primary blemish is related to UCAN. In the call, management emphasized overall revenue will accelerate yet could have been more clear about UCAN specifically.

This was stated at one point regarding ARM being down next quarter, as well: “But if you think about the drivers of average revenue per member, starting with the revenue drivers that we spoke about a moment ago, you can see our FX neutral, ARM is — it was down 1%, FX neutral in Q2 and we expect similar in Q3, flat to slightly down. That's mostly due to the limited price adjustments we mentioned over the past year in our big revenue markets in advance of rolling out paid sharing.”

Jessica Reif Ehrlich:

“Well, maybe you can help us think through like in UCAN, how much of the ARM growth is a function of add-on members to existing accounts versus new subs signing up to higher priced plans. And it sounds like from your letter that ARM will accelerate in the second half as you get further along in password sharing. Is that correct?”

Spencer Neumann:

“Yeah. Maybe just broadly thinking about our kind of revenue in Q2 and going forward. Jessica, the key is that we delivered revenue in line in Q2 with our expectations and we're on track to accelerate that revenue in Q3 and further accelerated in Q4. That's really our primary objective around revenue acceleration and we're set to deliver on it. But if we step back on thinking about our revenue growth and components overall or within a given region, it's driven by a combination of pricing, volume and new revenue streams like ads.

So if we think about each one of those, so we're now more than a year out from any price adjustments in our big revenue countries. We largely paused them during paid sharing rollout and so that's to be expected. For ads, that new revenue stream, we've expected a gradual revenue build and so that's not expected to be a big contributor this year. So continues to be on target. So most of our revenue growth this year is from growth in volume through new paid memberships and that's largely driven by our paid sharing rollout.”

The Hollywood strike is also a concern although management was bit vague about the implications other than saying: “These strikes, this strike is not an outcome that we wanted” and did not answer the question directly as to how much content they have in the pipeline before they run out. My takeaway was that Netflix’s stock will be impacted the longer the strike continues.

Conclusion:

Having a large beat on paid net adds but not translating that to revenue is not ideal. The company is being clear about revenue acceleration into the back half of the year, which means investors are being asked to be patient. We will likely be patient to some extent, but probably not at this allocation and with these gains. Overall, I imagine we will trim on this report. The stock has done quite well and we’d like to keep some of those gains given the weaker-than-expected quarterly report.

Recommended Readings:

Semiconductor Stocks: Q2 Sector Overview

This article was originally published on Forbes on Jul 13, 2023,07:05pm EDTForbes Forbes on Jul 13, 2023,07:05pm EDT

Semiconductors are the common denominator across the burgeoning technology trends of the next decade. Artificial Intelligence, 5G, high-performance computing, Internet-of-Things, gaming, electric vehicles, and robotics, among others, all require semiconductors to power them. These trends make semiconductor stocks an ideal investment and perhaps the most important space for tech investors to monitor.

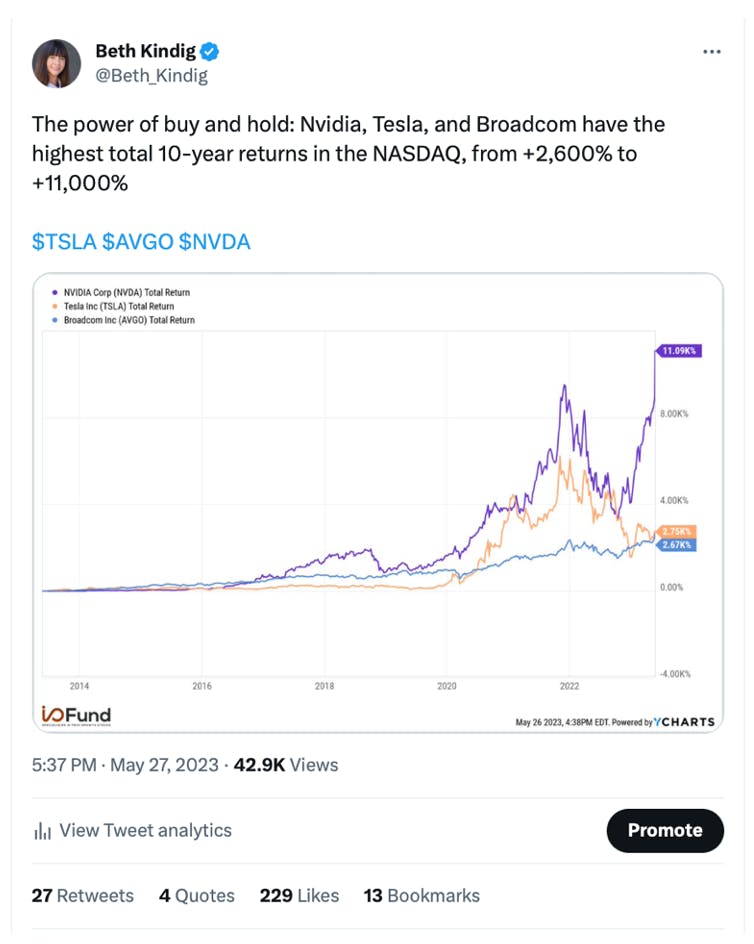
For years now, we have published on semiconductors as leaders in tech– even when cloud, e-commerce, connected TV and others were more favored. In fact, we have been pointing out quite clearly that semiconductors are the sector that has provided the most returns in the past decade.

Beth Kindig's Twitter Post

Source: Beth Kindig

Below, we update our semiconductor sector analysis to look at which companies have performed well in the most recent quarter, and also which companies stand out on a forward-basis with revenue growth estimates, profits, cash flows, earnings surprises, and we also look into management insights.

Top Semiconductor Stocks with the highest revenue growth rates in Q1

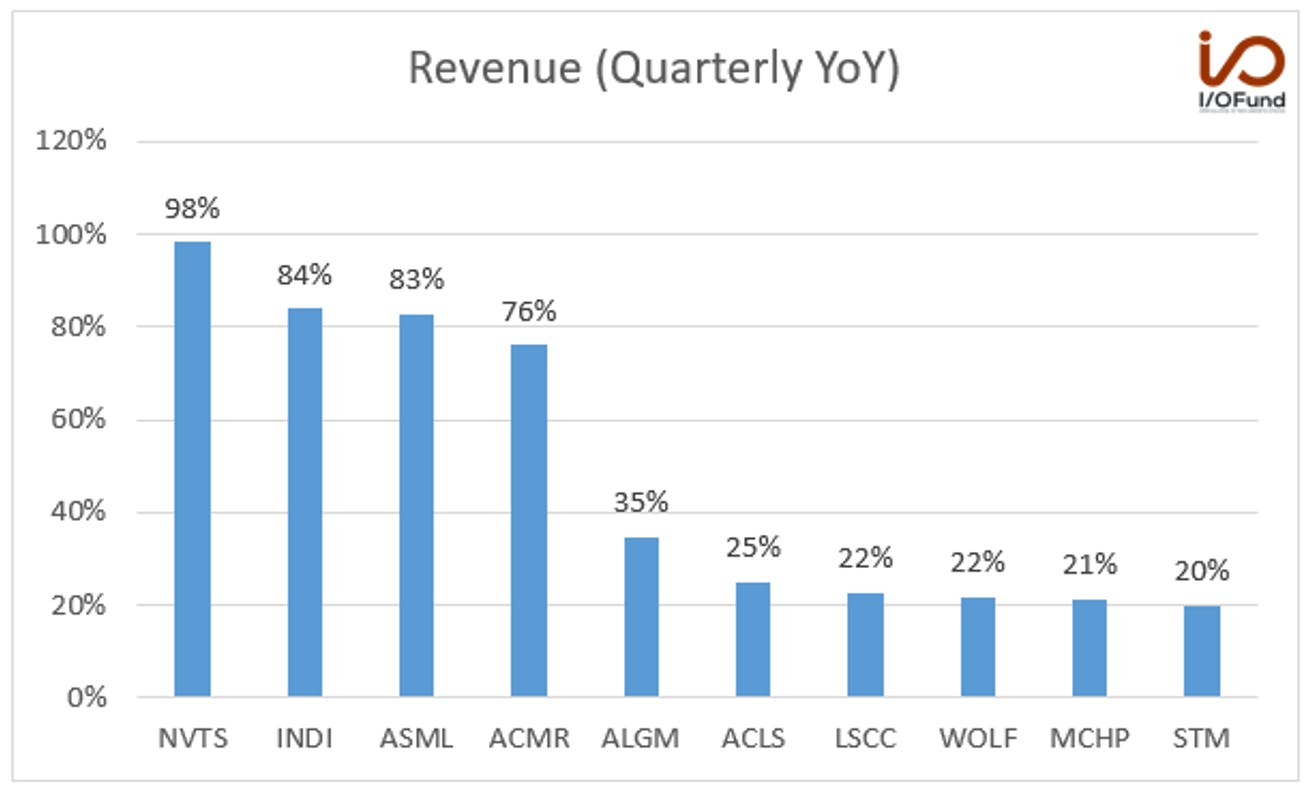
Quarterly YoY Revenue

Source: YCHARTS

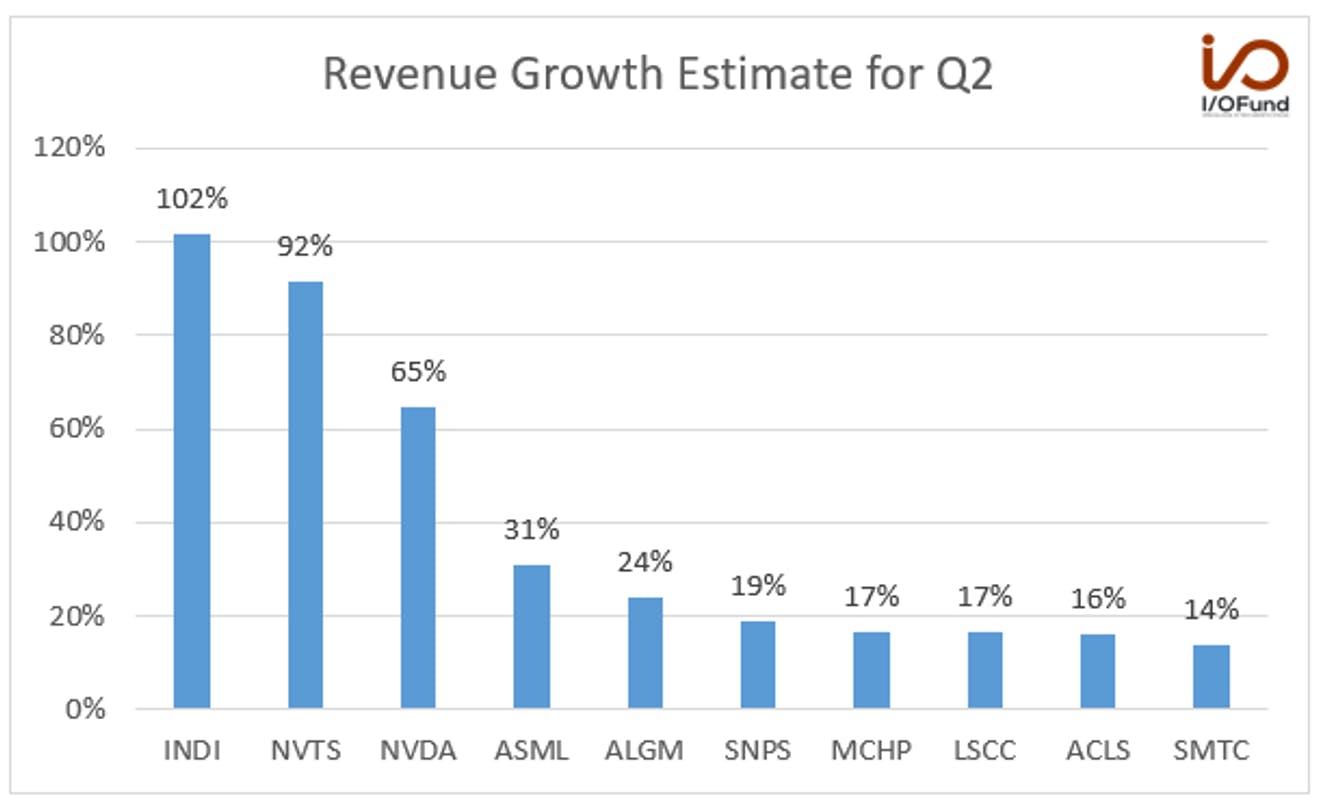
Navitas Semiconductor had the highest revenue growth among semiconductor stocks in the recent quarter. The company’s revenue grew by 98% YoY to $13.4 million. Management’s revenue guidance for next quarter is $16 million to $17 million, representing YoY growth of 92% at the mid-point.

Ron Shelton, CFO of the company, said in the earnings call, “Our guidance is based on robust strength in EV, solar, appliance/industrial, and the beginnings of a recovery in the mobile and consumer market, all further evidenced by a more than 50% increase in backlog during the quarter.”

The company acquired GeneSiC Semiconductor in August last year and helped to diversify into the fast-growing Silicon Carbide market. Navitas has a strong pipeline of $760 million with $432 million of this recognized by fiscal year 2026.

Analysts expect revenue in the next quarter to grow 92% YoY to $16.51 million and robust revenue growth close to or over 100% on a YoY basis for the next several quarters. The risk to consider is that the bottom line is weak. Analysts don’t expect Navitas to be profitable on an adjusted basis until Q1 2025 and GAAP profitable roughly around 2027.

Sign up for I/O Fund's free newsletter with gains of up to 221% – Click hereClick hereClick here

Semi Stocks Q1 Revenue Surprise

Quarterly Revenue Surprise

Source: YCHARTS

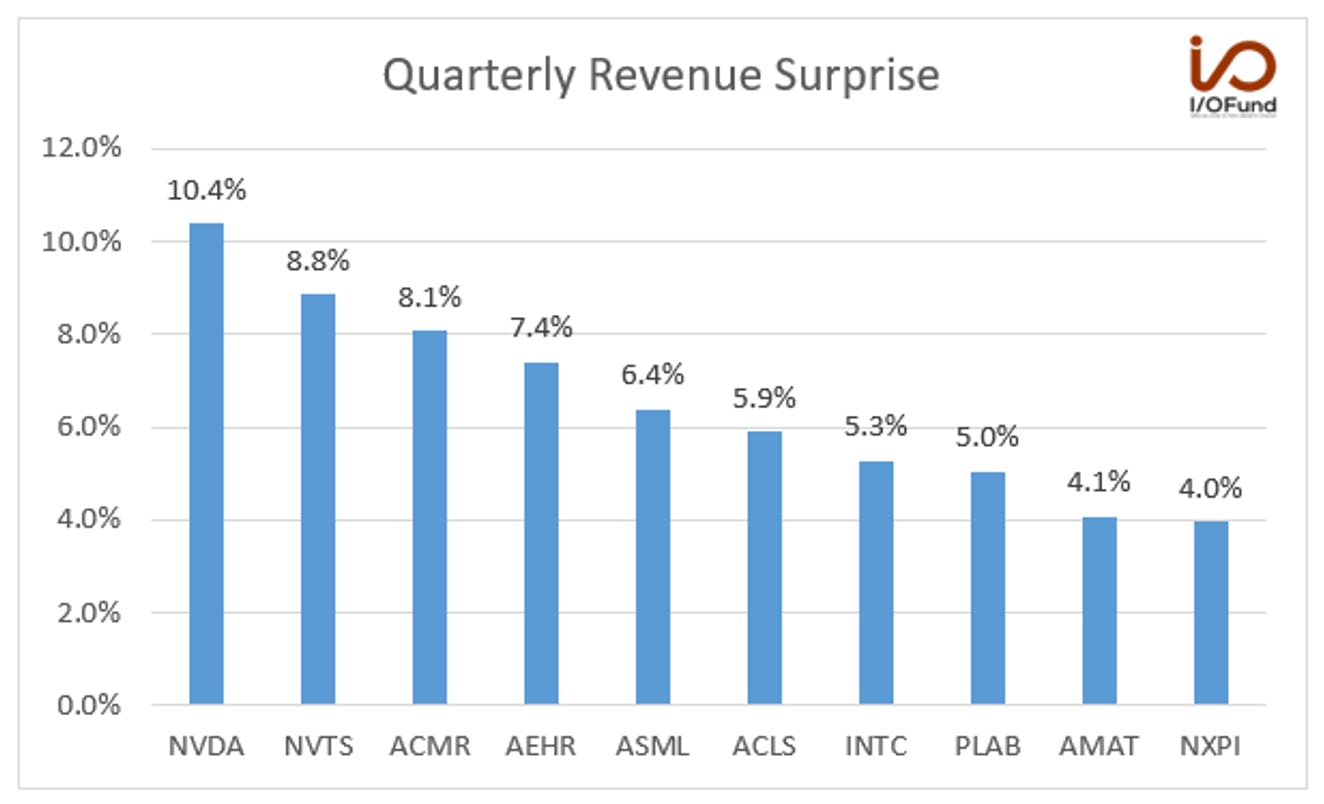
Nvidia crushed analysts’ revenue estimates by 10.4%. The company’s revenue declined by (13%) YoY and is up 19% QoQ to $7.19 billion.

The strong sequential growth was led by record data center revenue, primarily helped by accelerated computing. The company’s CFO, Colette Kress, said in the earnings call, “Generative AI drove significant upside in demand for our products, creating opportunities and broad-based global growth across our markets.” Gaming and professional visualization segments also witnessed improvement from the inventory correction.

If Nvidia is adding roughly $4 billion in revenue, primarily driven by the data center, then Q2’s data center growth will accelerate to an incredible 100% growth rate, up from $3.8 billion in the year ago quarter. It also means the data center will roughly double from the first quarter (sequentially) as the segment was $4.28B in the current quarter.

Put another way, this means Nvidia’s data center segment in the upcoming quarter will be as large as the company’s entire revenue this quarter – if we assume $7.75B in the data center compared to $7.2B total revenue this quarter.

We have highlighted in the past that AI will add $15 trillion to GDP compared to mobile’s $4.4 trillion. Mobile brought us three FAANGs: Apple, Google, and Facebook. It has been my stance for years that AI will bring us a new set of FAANGs, one of which will be Nvidia.

The company’s revenue guidance for the next quarter is $11 billion, representing YoY growth of 64% at the midpoint. The Q2 guidance was 53% higher than consensus. The historic beat in estimates is driven by data center revenue doubling from $4.28 billion in revenue in Q1 to $8 billion in revenue in Q2.

Semiconductor Stocks Q2 Revenue Growth Estimates

Revenue Growth Estimate for Q2

Source: YCHARTS

Indie Semiconductor has the highest expected revenue growth rate for Q2. The company’s recent quarter revenue grew by 84% YoY to $40.5 million. The company has guided for 102% YoY revenue growth in the next quarter.

Analysts expect revenue to grow 102% YoY to $51.97 million. The company is benefiting from growth trends in advanced-driver assistance systems (ADAS) and electric vehicles. indie has a large Serviceable Addressable Market (SAM) of $56 billion by 2028. The company is on track to be profitable on an adjusted basis this year.

Donald McClymont, indie’s co-founder and CEO, said, “Our growth trajectory reflects continued design win momentum spanning ADAS, vehicle electrification and user experience applications. At the same time, our deeper R&D investments and targeted acquisitions are beginning to contribute, enabling us to sharply outpace our peer group. Accordingly, today we are even better positioned to capitalize on the 2025 Autotech market opportunity of $42 billion.”

Every Thursday at 4:30 pm Eastern, the I/O Fund team holds a webinar for premium members to discuss how to navigate the broad market, as well as various stock entries and exits. We offer trade alerts plus an automated hedging signal. The I/O Fund team is one of the only audited portfolios available to individual investors. Learn more here.Learn more hereLearn more here.

Revenue Growth Estimates for Current Fiscal Year: Navitas and indie Semiconductor

Revenue Growth Estimate for Current Fiscal Year

Source: YCHARTS

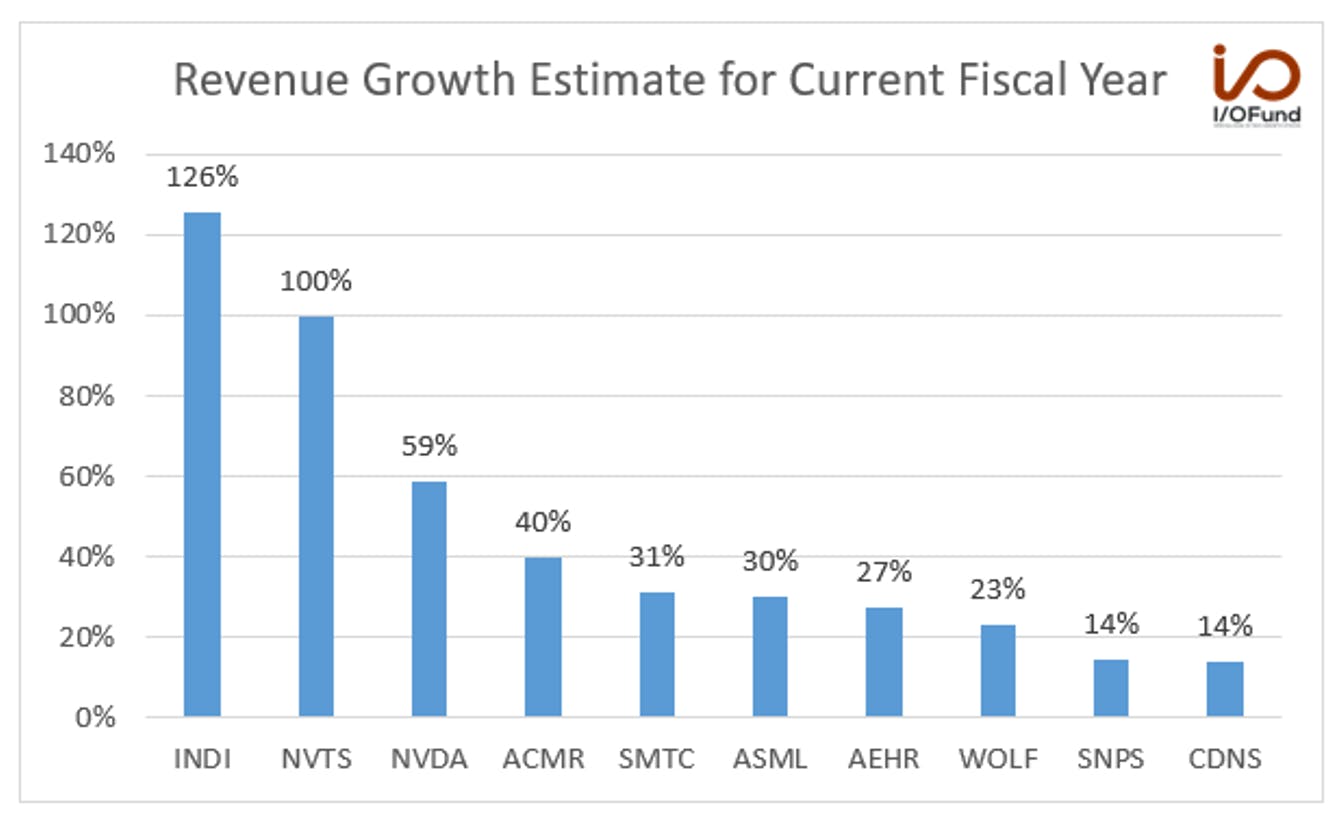
For the current fiscal year, analysts expect indie Semiconductor to have the highest revenue growth estimate among the semiconductor stocks. It is followed by Navitas Semiconductor, which analysts expect to grow 100%. Among more established players, Nvidia leads and is expected to grow by 59%.

Semiconductor equipment provider ACM Research ranks fourth and is expected to grow 40% in the current fiscal year. The company’s revenue in the recent quarter grew by 76% YoY to $74.3 million. The management’s FY23 revenue guidance is in the range of $515 million to $585 million, representing YoY growth of 41% at the midpoint.

Needham Analyst Quinn Bolton mentioned in his note, “As the fastest growing SemiCap stock in our coverage with ~$400MM in cash and very little debt, we believe a 12.5x multiple is more than fair. The stock is currently receiving little attention from investors due to its high-exposure to China. However, we believe this ACMR sentiment will change over time as its growth proves too difficult to ignore.”

Semiconductor Top Line Valuations

P/S Ratio (Forward)

Source: YCHARTS

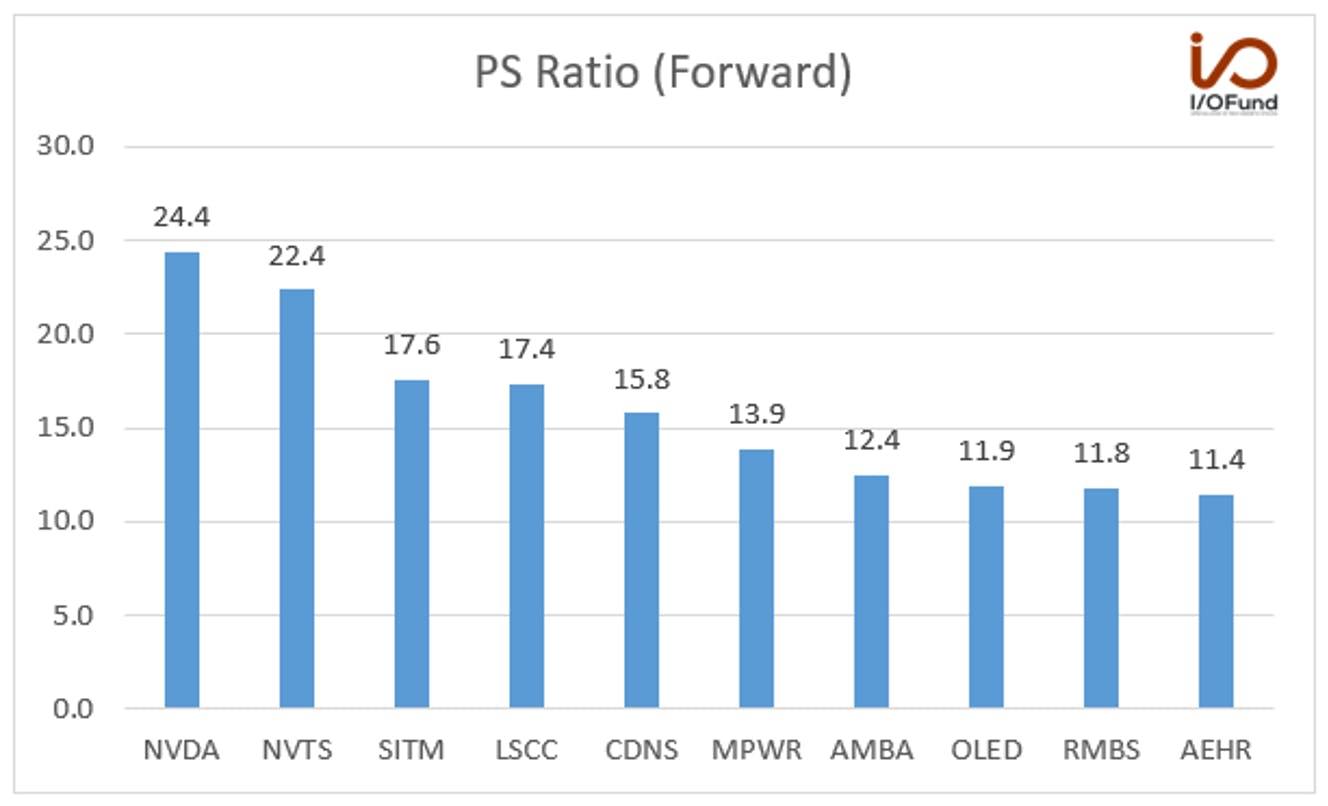
Nvidia has the highest forward P/S ratio of 24.4 among the semiconductor stocks. The company has commanded a premium valuation due to its unrivaled position on GPUs. It is followed by Navitas, which has a forward P/S ratio of 22.4.

Per our analysis, Navitas is expected to have strong revenue growth in the next several quarters.

Free Cash Flow Margin

Free Cash Flow Margin (Qly)

Source: YCHARTS

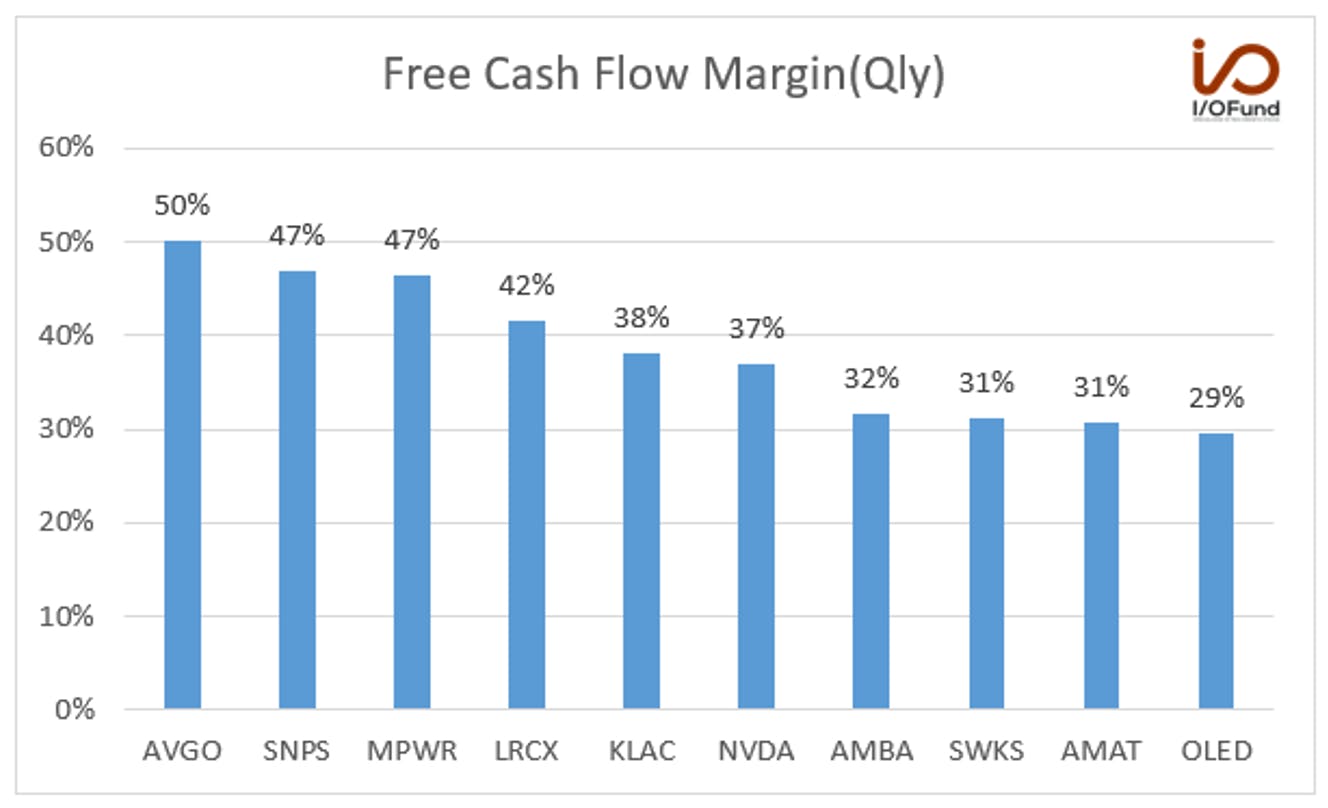
The majority of semiconductor stocks have positive free cash flow margins. Among the semiconductor stocks we track, 16 companies have more than 20% free cash flow margin. During times of macro uncertainty, stocks with strong free cash flows are considered a safer bet.

Broadcom leads the semiconductor sector with a free cash flow margin of 50%, followed by 47% for Synopsys and 47% for Monolithic Power Systems. Broadcom’s free cash flow in the recent quarter grew by 5% YoY to $4.4 billion. The management also expects cash flows to be strong in the next quarter.

Operating Margin

Operating Margin (Qly)

Source: YCHARTS

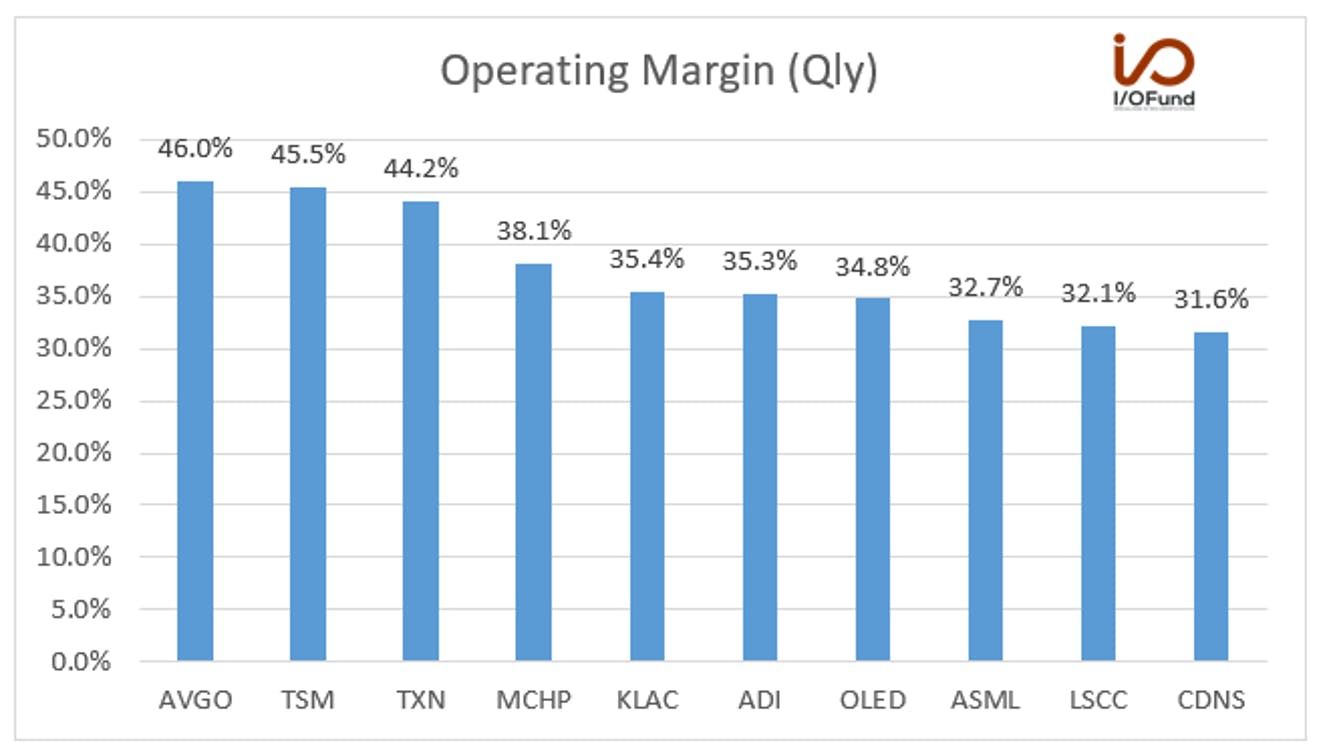
Broadcom leads the semiconductor stocks with an operating margin of 46%, followed by 45.5% for Taiwan Semiconductor Manufacturing and 44.2% for Texas Instruments.

TSM’s operating margin of 45.5% was higher than management’s guidance of 41.5% to 43.5%. The company’s cost control efforts led to a reduction in operating expenses.

Wendell Huang, CFO of the company, said in the earnings call, “Total operating expenses accounted for 10.8% of net revenue, which is lower than the 12% implied in our first quarter guidance mainly due to stringent expense control and lower employee profit sharing”. Management guidance for Q2 is 39.5% to 41.5%.

Due to its leadership position in manufacturing advanced chips, TSM is able to negotiate better prices with its customers. Cost improvements also help the company to maintain strong margins.

Conclusion:

Nvidia is a well-known semiconductor stock at the moment, yet there are others in the semiconductor space that are outperforming, as well. Broadcom and Taiwan Semiconductor continue to be defensive stocks with strong bottom lines. Navitas and indie Semiconductor are high beta stocks that are putting up nearly triple digit growth (notably, their margins are in the red until they reach scale). 

Recommended Reading:

AEHR: Strong Top Line & Strong Bottom Line – Fiscal Q4 2023 Earnings

AEHR is the rare small cap that has top line growth coupled with bottom line strength. We recently discussed what comprises a defensible portfolio in tech in our recent Q3 Kickoff webinar. AEHR fits the criteria we outlined in the webinar, and is one of our largest holdings because of how many boxes it ticks.

It’s both the consistent revenue growth andand the bottom-line growth that causes this stock to defy the odds. The FY2024 guide is for 50% growth on the top line and 90% growth on the bottom line. In addition to this fiscal year 2023 cash flow grew over 500% from $1.51 million in FY2022 to $10M in FY2023.

In our pre-earnings write-up we had stated: “Aehr is within $1m of last year’s entire GAAP earnings by the end of Q3, so with the forecasted revenues for fiscal Q4 conservative net profit on revenue, Aehr will clearly grow net profit and GAAP earnings at a higher percentage than revenue growth.”

The revenue growth can be seasonal, which is why we had said “All Eyes on FY2024 Guide” in our last earnings review. The fiscal year guide in July tends to be a baseline as it’s likely the company receives more orders in the next few months and fills these in FY2024.

I believe management is doing the responsible thing – guiding to what they know today. Because the company has a small amount of revenue, a minor miss can be substantial. To avoid this, they lean “conservative.” This was discussed in the earnings call (see below).

Financials:

FY2023 and Q4 revenue were both in line at $65 million and $22.3 million, respectively. This represents FY revenue growth of 28% and quarterly revenue growth of 9.9%. EPS also came in as expected at $0.59 and $0.23, on an adjusted basis.

The FY2024 guide represents growth of 50% for revenue of $100 million. The two analysts covering the stock had a consensus of $102.5 million for growth of 58%. The FY2024 guide on the bottom line is for GAAP net income of $28 million and at least 90% in earnings growth. 

Margins were flat to slightly contracted. 51.5% on gross margin was flat from a year ago. Operating margin of 25.2% was slightly lower compared to 28.7% a year ago. Net margin of 27.3% was also lower compared to 28.6% last year.

Regarding the margins, management pointed toward R&D as a primary reason the margins were down, plus product mix, material and transportation costs. At the current FY2024 guide, management is implying flat margins YoY and that’s a positive given the GAAP margins are very strong (i.e., opposite of “growth at any cost”, this is growth while maintaining a strong bottom line). G&A will increase this year as AEHR is a $1 billion market cap and auditing costs are expected to increase.

The company has $47.9 million in cash, up from $31.5 million a year ago and up from $4.6M two years ago. Operating cash flow of $5.8 million in Q4 was up considerably from (-$0.77) million a year ago. For AEHR, the exact cash flow figures are available when the company files their 10-Q/10-K. Since it's the end of a fiscal year, AEHR will be filing a 10-K.

Last quarter, AEHR had reported $33.3 million, the highest bookings in company history. The fiscal year-to-date was $72.5 million, exceeding full prior fiscal year of $62.2 million. The current effective backlog is $40 million with $15 million added in the first six weeks of the fiscal year, which started June 1st.

Earnings Call:

The main questions to focus on from the earnings call was regarding number of customers and customer concentration, hints toward if the guide was purposely low, plus product optionality with gallium nitride, higher power voltages and silicon photonics.

Number of Customers and Customer Concentration:

AEHR’s top risk remains its high customer concentration. When asked about this on the forum, I’ve stated it’s different from semiconductor companies compared to cloud software or fintech, for example. For a semiconductor company like Aehr, the supply chain limits the number of customers they have to probably a dozen or so for its total addressable market. This is different than a software company that will have thousands of customers at scale. 

Regardless, it’s a risk and one we’ve covered many times. In the call, it was discussed that the primary customer (which is generally known to be ON Semiconductor) represents 79% of revenue. When we first covered AEHR, ON was about 100% of revenue.

In FY2023, the customer concentration improved to three customers representing: 79%/10%/10%. In other words, AEHR had two 10% customers. In FY2024, the company is expected to have “three or four” 10% customers.

Overall, the discussions around AEHR’s customer growth are quite bullish and likely contributed to the positive price action. For example, this was stated:

“With the addition of this latest new customer, we've significantly expanded our customer base by adding a total of four new silicon carbide customers this year. Each of these new customers is already ramping or plans to ramp our products into high volume production using our multi-wafer test and burn-in systems.

We believe this customer who serves several significant markets that include the electric vehicle industry as well as other industrial applications will purchase a large number of our FOX-XP systems to meet their publicly announced significant increase in plant capacity and revenue growth over the next several years and through the end of the decade and longer.”

Questions on FY2024 Guidance:

It was discussed (by an analyst) that the guide should be particularly easy to hit given the customer mix. The analyst felt the $40 million in backlog was especially where the guide/current information is too low.

“And specifically, if we look at this past year and your largest customer being 52 million based on the 79% and their targets of growing 300% over the next few years. I would assume that creates a solid base for your business. So, as you look at already having 8 million to 10 million booked on that, number two, you're really talking about a 30 million incremental number to hit that minimum threshold and you've already got three customers.” 

Management’s response was “I felt like you were going to end it with why we're such sandbaggers but anyhow” and then went on to state that timing orders is too difficult for their business in order to guide aggressively: “It's interesting even with current customers candidly their ability to forecast is all over the map. And so, I think we've taken a conservative stance here. But it provides us with confidence to be able to hit that number. And we don't need any miracles to happen, if you will.

Total Addressable Market:

AEHR is a company where a few different TAMs are thrown around in the earnings calls. All of them are sizable, and perhaps the highest TAMs of any company we cover relative to AEHR’s size, and the products being in a unique niche with virtually no competitors.

We’ve discussed the TAM many times but here is what was most recently stated:

“William Blair forecast total demand for silicon carbide wafer is just for electric vehicles, which include EV, inverters onboard and offboard chargers to grow from 220,000 wafers in 2022 to over 4.5 million six-inch equivalent wafers in 2030, a greater than 45% compound annual growth rate and over 20 times larger in 2030 than in 2022.

In addition, William Blair expects demand for industrial applications, trains, energy conversion and RF amplifiers of silicon carbide to drive another 2.8 million wafers in 2030. This expands our silicon carbide test and burn-in market even more.”

Combined, the market for AEHR could be as large as 7.3 million wafers, up from 220,000. This is 33.2X growth. Notably, this assumes AEHR takes the entire market, which is not likely to happen even with a superior product. The product is superior because wafer level testing is up to 9 times faster than competitors as customers can test and burn-in/stabilize nine 300mm wafers at the same time compared to one wafer with competitors at 3.5 kilowatts of power per wafer.

Product Optionality:

There were discussions about AEHR’s next two major markets, silicon photonics and gallium nitride. For background on these two new markets, which would extend AEHR’s total addressable market beyond silicon carbide, please read this analysis here.

Per the earnings call, AEHR has officially received their first silicon photonics order whereas gallium nitride is in the more nascent phase of “customer inquiries.”

This system can test new high power density devices that can be used in new optical I/O or heterogeneous integrated packages. This customer is one of the world's largest semiconductor manufacturers and we expect to receive orders for additional production systems as they have increased production of these devices.”

Conclusion:

With AEHR, we broke a few of our portfolio rules. First, we have held a small cap at a high allocation. Secondly, we are holding it beyond the 10% allocation limit most portfolios (including the I/O Fund) adhere to for risk management purposes. Third, we bought close to earnings. It’s not ideal to break this many portfolio rules unless the stock is special. Clearly, we think AEHR is special. To reiterate, it’s special not only for its top line growth but primarily for its bottom-line growth, total addressable market and product optionality.

 Recommended Readings:

Ad-Tech Sector: Q2 2023 Overview

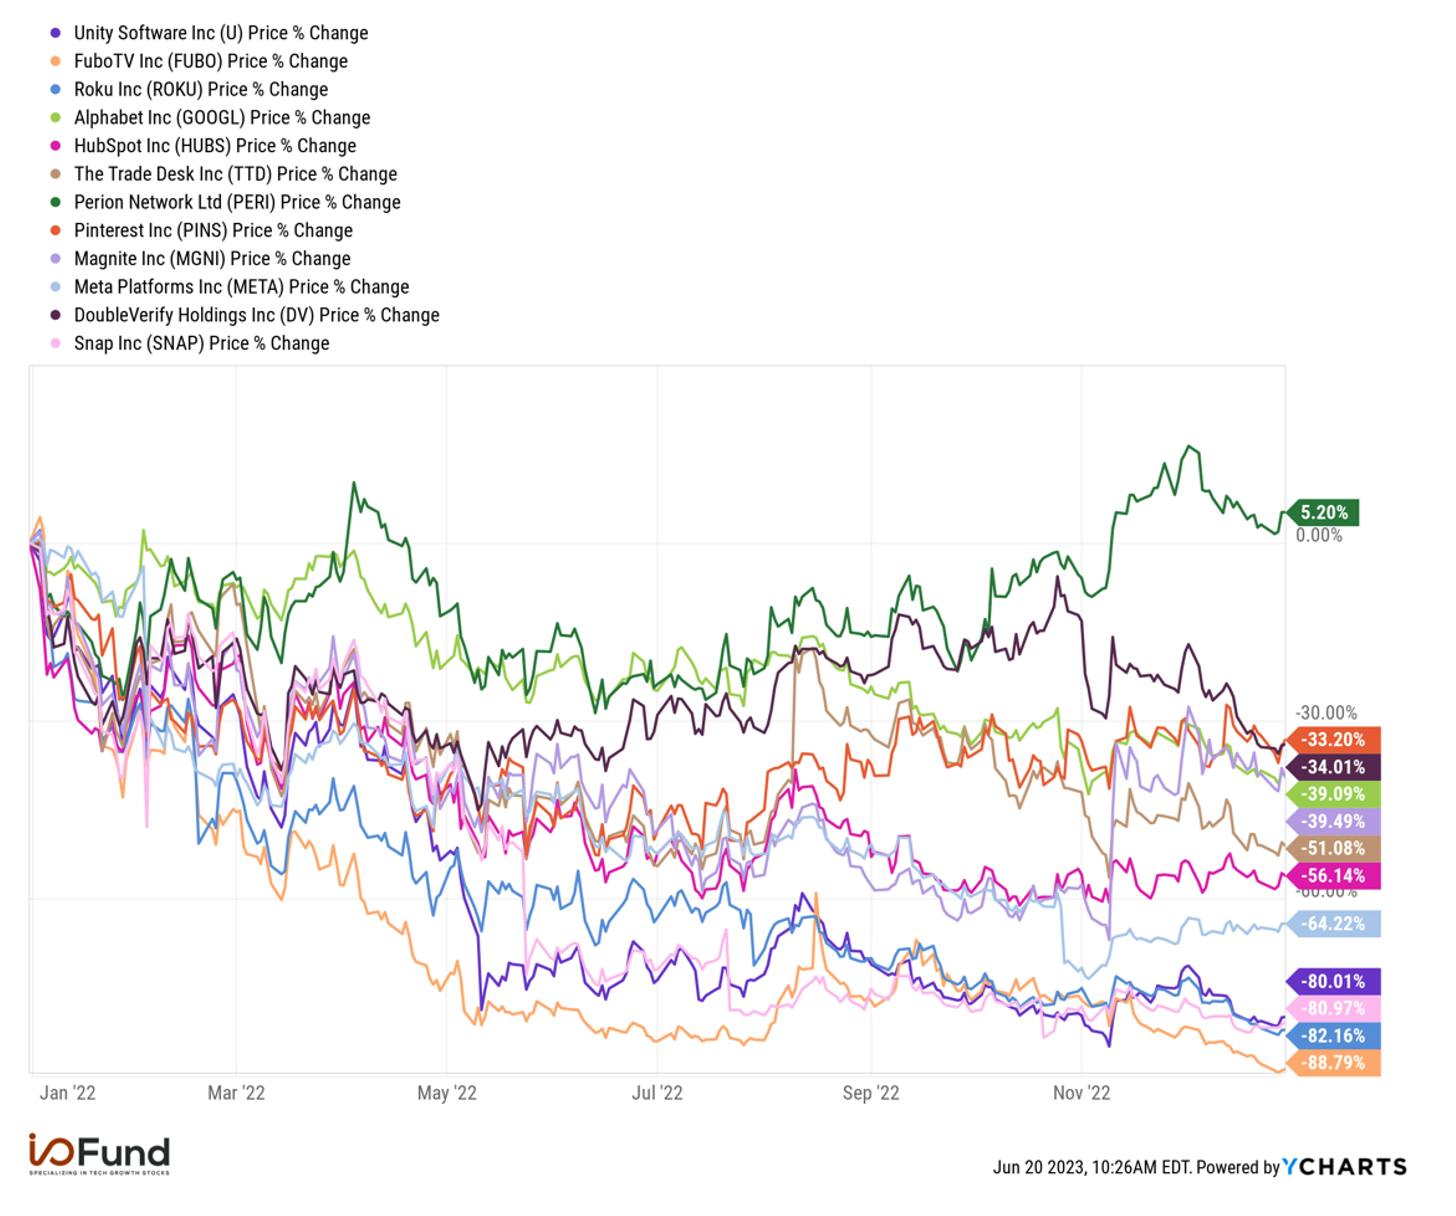
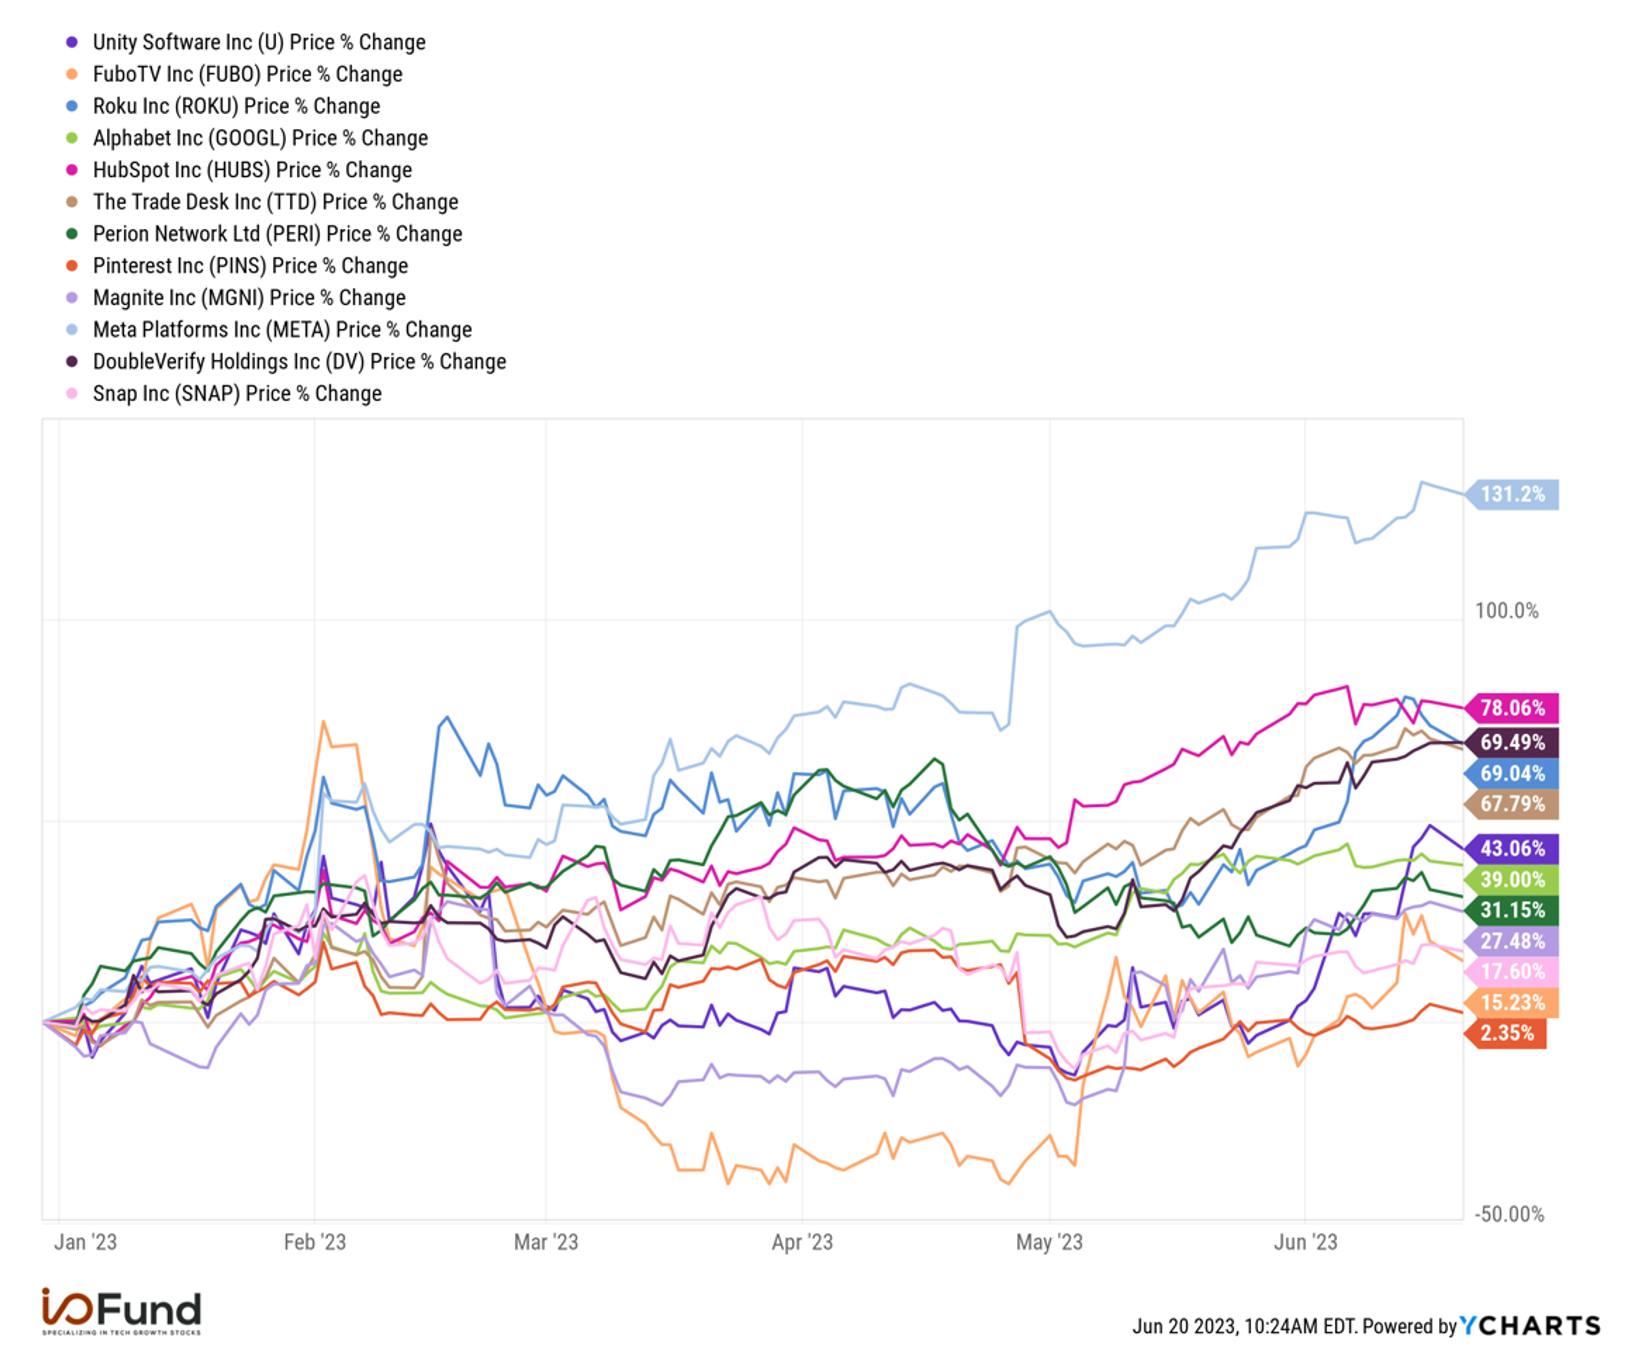
Adtech has seen extreme volatility over the past few years with Covid causing some stocks to see 1,000% gains in a brief period of time between 2019-2021, and then plummet by up to 80% in 2022. For the current year-to-date, many have rebounded despite reporting depressed growth levels.

Below, we review the stocks in the ad-tech sector to find out which companies have performed well in the recent quarter results and which companies stand out in revenue growth estimates, profits, cash flows, earnings surprise, and we also look into management insights.

Pictured Above: Ad-tech returns from Jan 1, 2022 to Dec 31, 2022. Source: YCharts 

Pictured Above: Ad-tech returns since Jan 1, 2023 Source: YCharts

Top Ad-Tech Stocks with the highest revenue growth rates in Q1

Source: YCharts

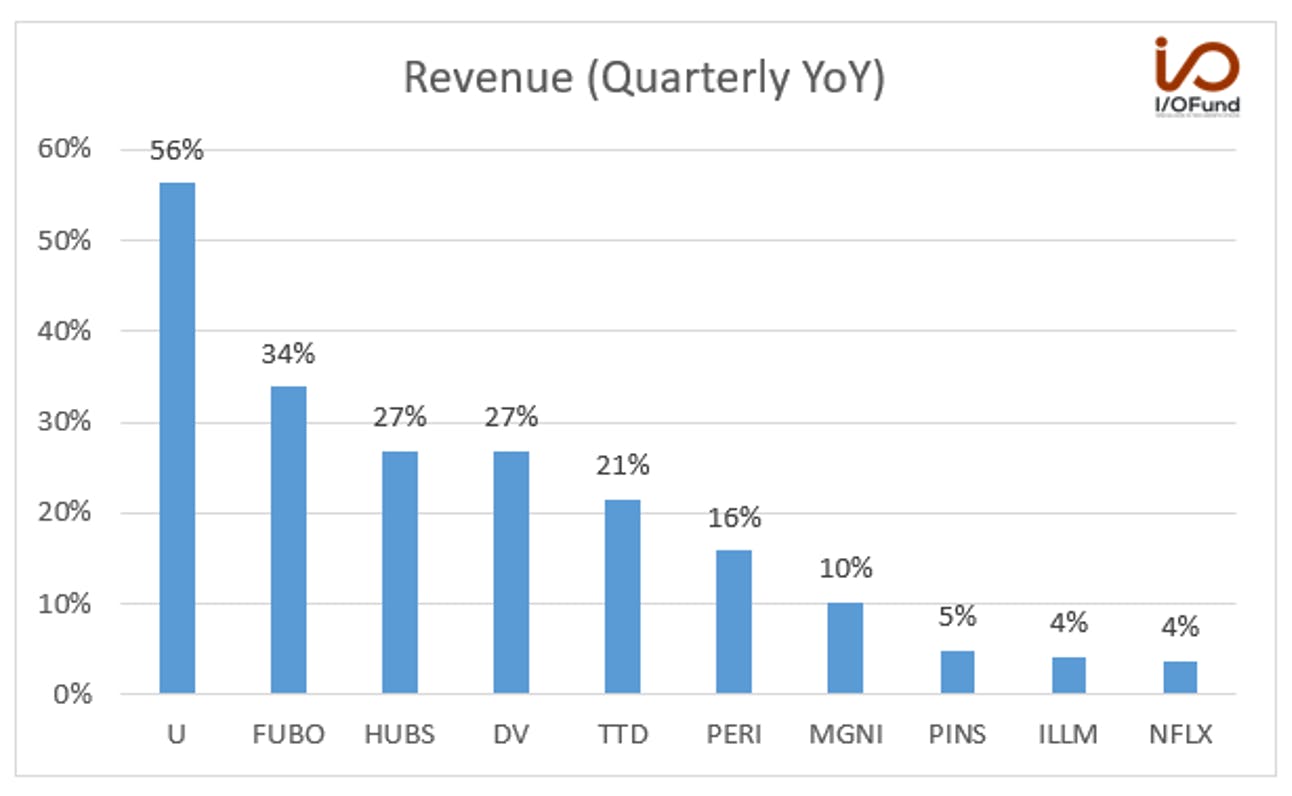
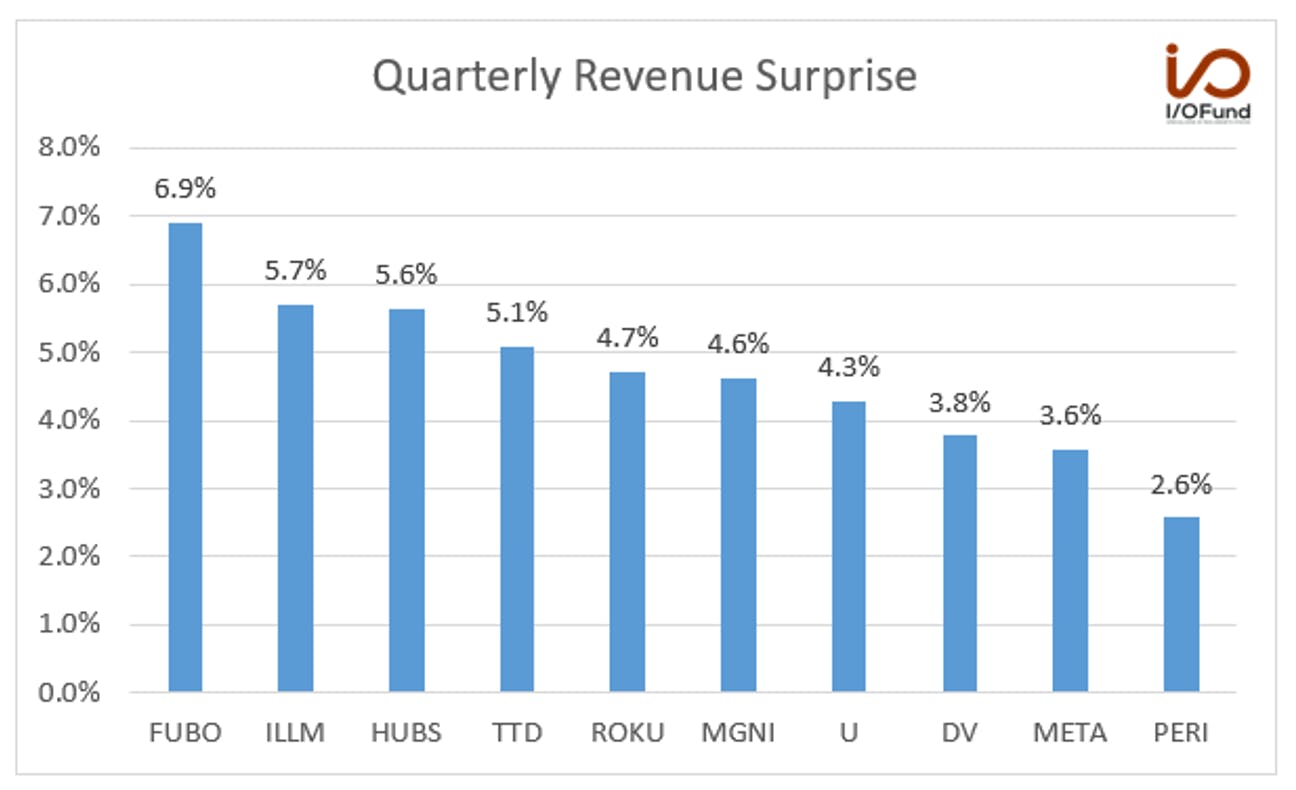
Unity sits at the cross-section of cloud and ad-tech. The company’s revenue grew by 56% YoY to $500 million in the recent quarter, however, the revenue was down (2%) YoY on a pro-forma basis to reflect the ironSource merger that was completed in November 2022. The company beat its own guidance of $470 million to $480 million and the analyst’s revenue estimates by 4.3%.

Unity’s guidance for the next quarter is $510 million to $520 million, representing a YoY growth of 72% to 75% and 6% to 8% YoY on a pro-forma basis. Management is expecting the overall advertisement sector to be flat QoQ. Per the macro-outlook, they are still cautious, as the company’s CFO Luis Visoso said in the earnings call that “the economic environment is still volatile and uncertain.”

Perion Network is a small cap ad-tech stock with a market cap of $1.4 billion that has sustained a stronger bottom line than its peers. We covered this stock here. Revenue grew 16% YoY to $145.2 million. Management stated the company is likely to raise its revenue growth in 2023, when CEO Gerstel stated: “Given our current visibility, and the sustainability and predictability of our business model, we feel confident in raising annual guidance for the full year 2023.”

The company’s new 2023 revenue guidance is $725 million to $745 million, representing YoY growth of 15% at the mid-point, up from the previous guidance of $720 million to $740 million.

Quarterly Revenue Surprise.

Source: YCharts

Fubo beat analyst revenue estimates by 6.9% in the Q1 results, which led the ad-tech sector. The company’s revenue grew by 34% YoY to $324.4 million, and its North American business grew by 34% YoY to $316.5 million.

The company’s North American revenue guidance for the next quarter is $292.5 million to $297.5 million, representing a YoY growth of 36% at the mid-point. It also raised FY2023 North American revenue guidance to $1.235 billion to $1.265 billion, representing YoY growth of 27% at the mid-point, up from the previous guidance of $1.195 billion to $1.225 billion. It also reiterated its goal of being cash flow and adjusted EBITDA positive by 2025.

The company sees some improvement in its advertising business as the company’s CFO, John Janedis, answered to an analyst question on CTV advertisement demand trends. “And so when we looked at our Q1 results, to your point, we came in about flat on ad revenue. From a monthly perspective, let me just talk you through that and then I'll also go through 2Q in some of the categories. March was better than February, which is better than January. And I'd say if I sort of give you some of the numbers around that, January was down slightly, February, call it, flattish and then March was up a bit, maybe call it mid-singles. And then we're seeing further acceleration now into April and 2Q and so far April, I think finished up in the double-digits. So, we're encouraged by what we're seeing in terms of some of the trends.”

Revenue Growth Estimates for Q2

Source: YCharts

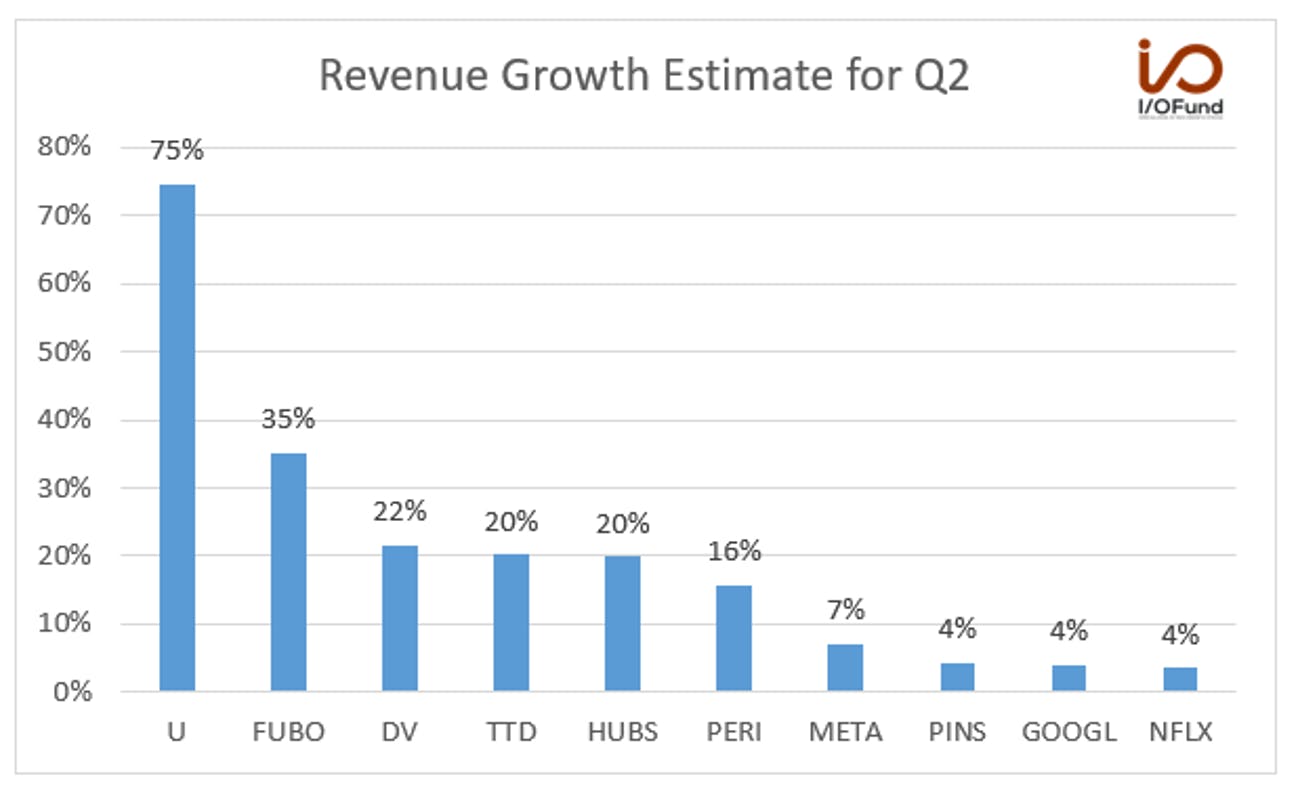
Unity leads with the highest growth estimate for the next quarter. Per what was already discussed, this is due to the ironSource acquisition. Unity is followed by Fubo and DoubleVerify. DoubleVerify’s revenue grew by 27% YoY to $122.6 million.

Revenue guidance for the next quarter is $131 million to $135 million, representing YoY growth of 21% at the mid-point. Analysts expect revenue to grow 22% YoY to $133.5 million.

Needham analyst Laura Martin raised the firm's price target on DoubleVerify (DV) to $45 from $35 and kept a Buy rating on the shares after attending an investor call with its CEO Mark Zagorski.

According to her note, Meta Platforms (META) accounts for half of the company's total social revenue, and the firm now believes that measurement revenue from Meta could double over the next 12-24 months after DoubleVerify adds brand safety suitability to its product suite, the analyst told investors in a research note. Retail media networks will drive total addressable market and revenue upside for DoubleVerify as more brands insist on closing the loop between ad spending and sales, the firm added.

Revenue Growth Estimate for Current Fiscal Year

Source: YCharts

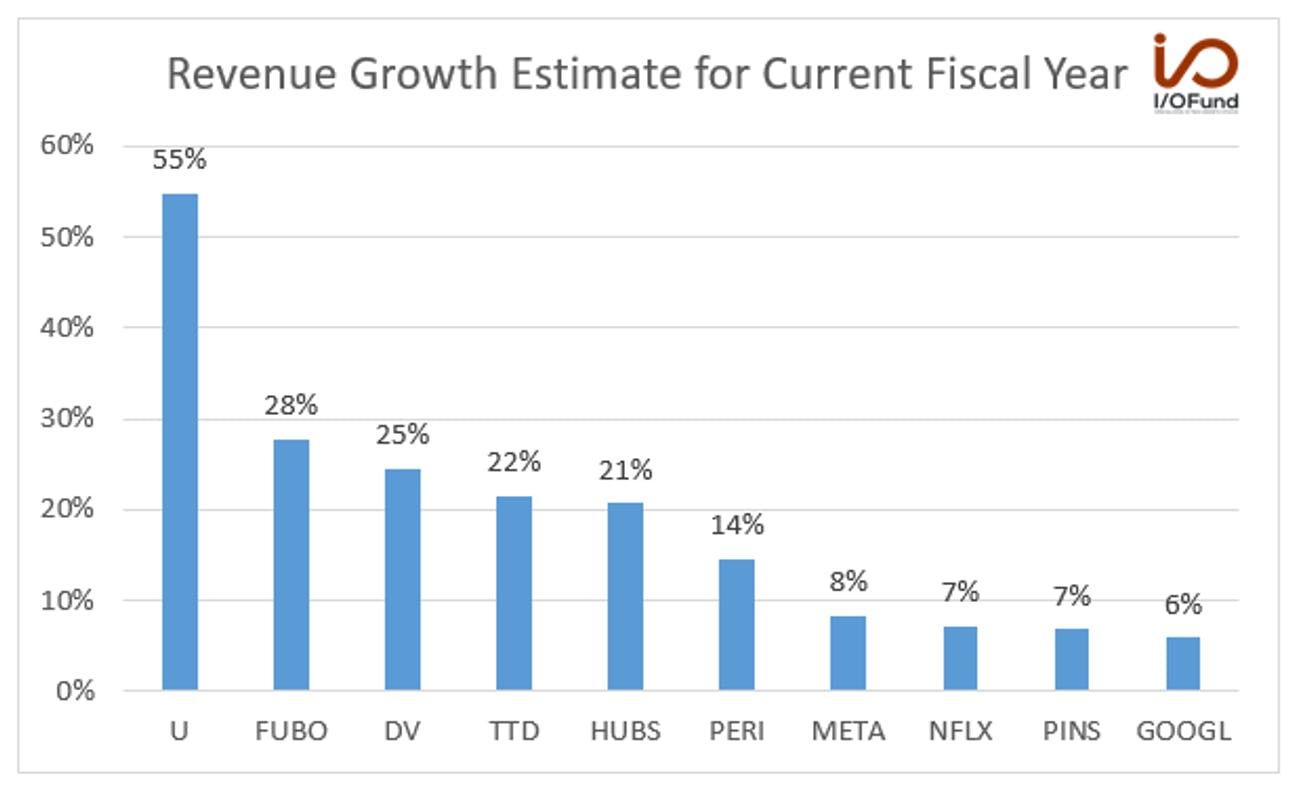
For the current fiscal year, analysts expect Unity to have the highest revenue growth estimate among ad-tech stocks. It is followed by Fubo, which analysts expect to grow by 28% and DoubleVerify is expected to grow by 25%.

P/S Ratio (Forward)

Source: YCharts

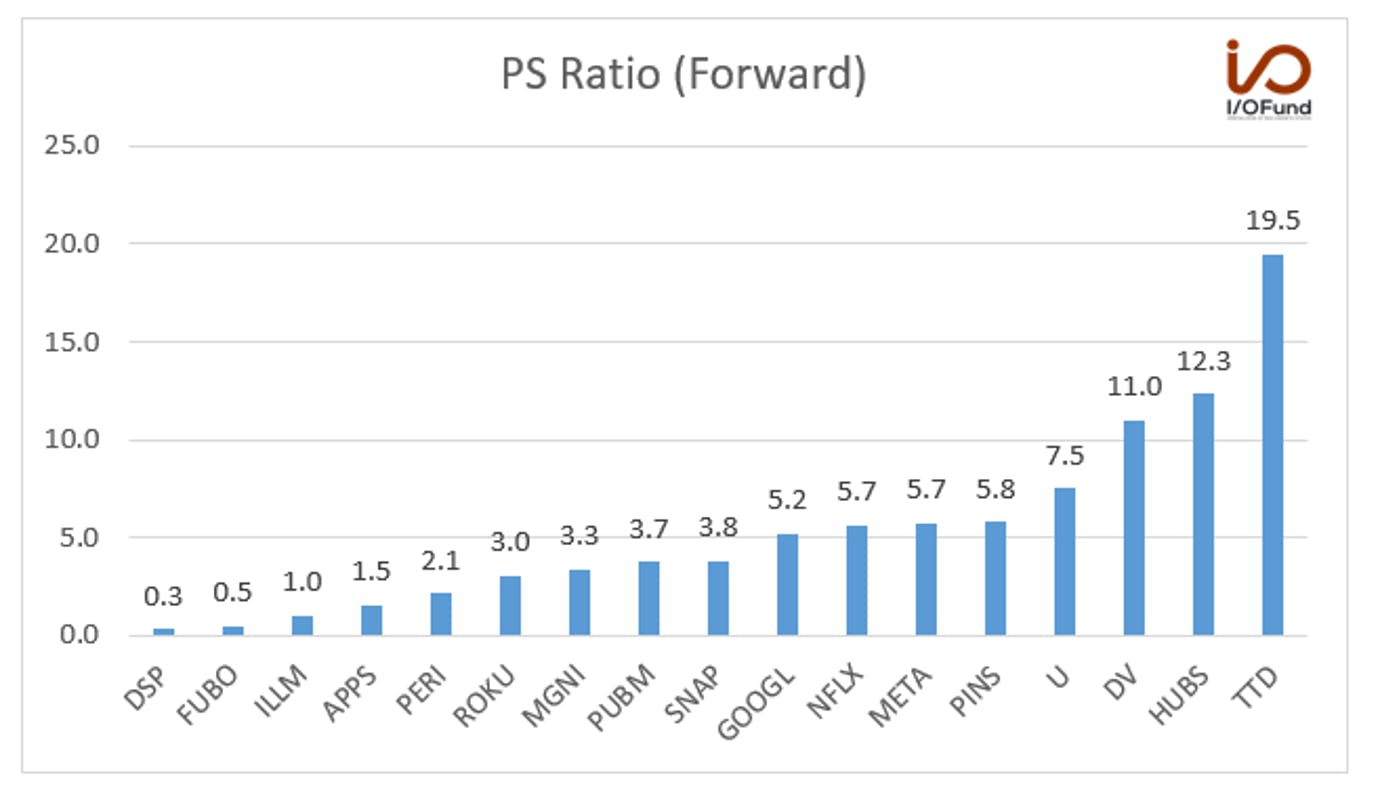
Most ad-tech stocks are trading at a low valuation. The Trade Desk has the highest forward P/S ratio of 19.5. The Trade Desk has been trading at a premium valuation as its revenue growth has been stronger and its bottom line is better than its peers. The company’s 2022 revenue grew by 32% YoY to $1.58 billion. This revenue growth was exceptional while other ad companies struggled with growth last year, such as Meta, which reported a decline of (1%) in revenue.

The company’s CEO and Founder, Jeff Green, highlighted in the Q4 earnings call, “Specifically in the last 6 months of 2022, The Trade Desk started to separate from much of the digital advertising market in terms of relative outperformance. In the third quarter, we have reported 31% growth while our competitors were either in retreat or posting single-digit growth. That same trend continued into the fourth quarter as we grew 24% and most of our large competitors were posting between negative 9% and negative 2% growth. I don’t think we have ever had the level of industry outperformance in our 6 years or so as a public company as we did in 2022.”

Analysts expect revenue to grow 22% in FY2023 and continue to grow over 20% till 2030, with a revenue growth forecast of 30% for FY2028.

The company’s recent quarter revenue grew by 21% YoY to $383 million. While macro conditions remain uncertain and advertising budgets are carefully scrutinized, the management sees some improved visibility. Laura Schenkein, the new CFO of the company, said in the earnings call, “Turning now to our outlook for the second quarter. While macro conditions remain uncertain, visibility has improved slightly since the beginning of the year. We are cautiously optimistic and estimate Q2 revenue to be at least $452 million which would represent growth of 20% on a year-over-year basis.”

The company reported an operating loss of ($23.3) million compared to ($17.1) million for the same period last year. The increase in operating loss was due to increased operating expenses related to in-person events and travel this year that was stopped briefly post Covid. We have noted later in our article that ad-tech stocks have a weak bottom line. The company has a better bottom line than most adtech stocks, and in the recent quarter, it ranks 7 in the operating margin among the 17 stocks we track in the sector. The company reported an adjusted EBITDA margin of 28% compared to 38% in the same period last year.

Morgan Stanley analysts recently upgraded the stock to overweight from equal weight. “We see growth in ad-supported streaming and retail media as two of the strongest growth areas in online advertising and see the US CTV market growing at a ~18% '22-'25 CAGR while we forecast retail media (global ex-China) to grow at a ~17% CAGR. As the leading independent demand-side platform (DSP), TTD is well positioned to benefit from both trends,” the analysts said in a client note. “We believe TTD will be able [to] leverage its position as an independent player to sign more retail media partners…and ultimately be a leader in offsite retail media advertising,” they added.

Free Cash Flow Margin

Source: YCharts

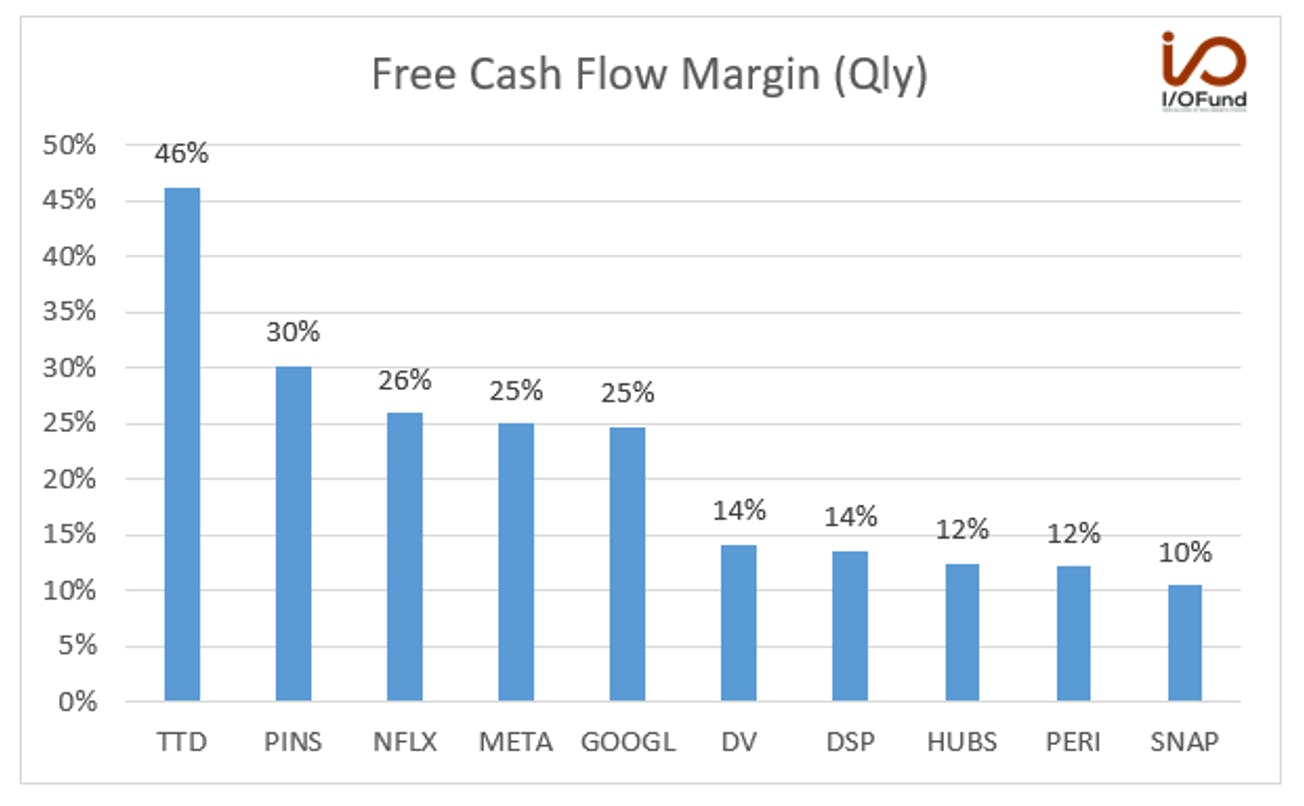
Ad-tech is a very cash-efficient industry, evidenced by the robust free cash flow (FCF) margins, as seen in the above chart. The Trade Desk has the highest free cash flow margin of 46%, followed by Pinterest with 30%, and Netflix with 26%.

We had highlighted the Netflix’s cash flow turnaround in our editorial in July 2022 when we said, “The most important line item for Netflix is the company’s cash flow. Looking back, this has been troublesome for Netflix as the company lost $3.3 billion in cash in 2019 as it built up its original content pipeline. However, the company is on an entirely new trajectory with $1 billion in free cash flow expected this year and “substantial” free cash flow in 2023, per Netflix management.”

Operating Margin

Source: YCharts

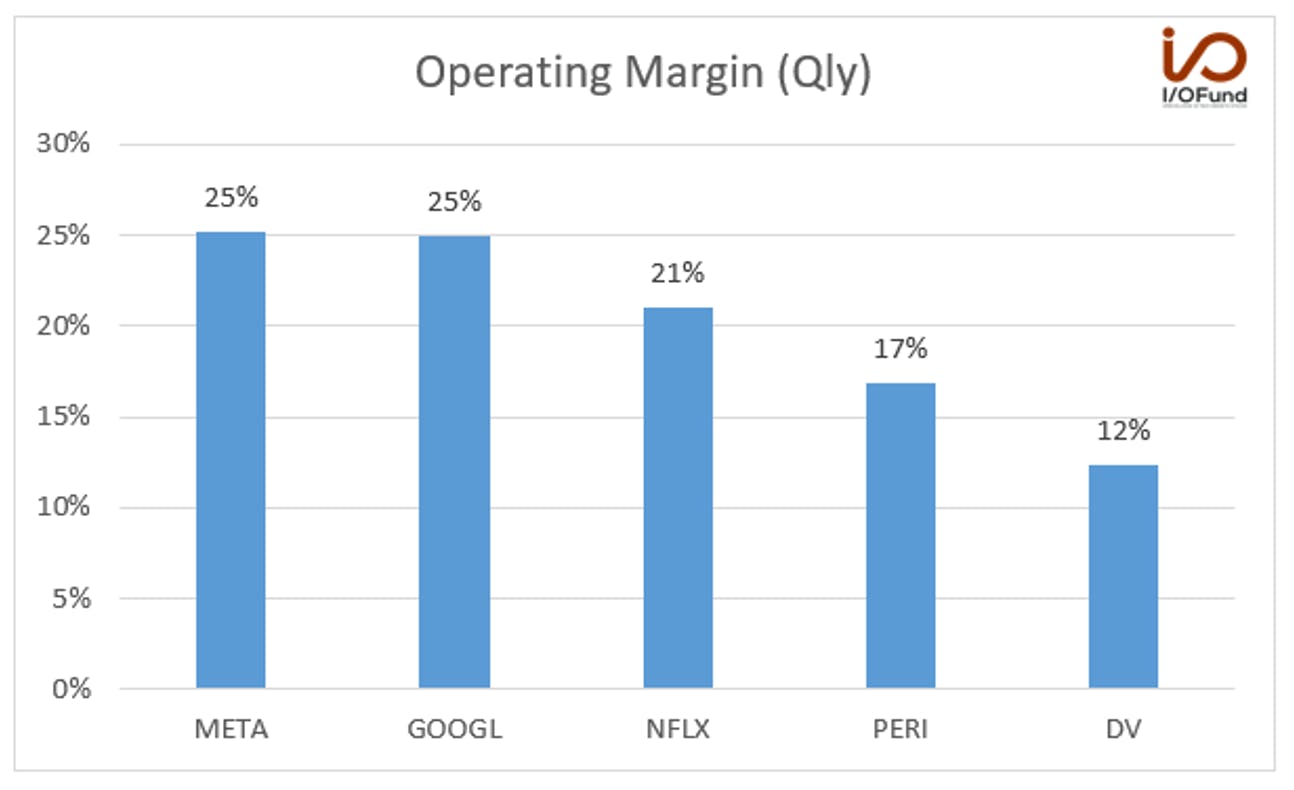
Only five of the ad-tech stocks have positive GAAP operating margins in the recent quarter. Meta leads the sector, followed by Google and Netflix. We believe focusing on profitable companies or those with strong profitability paths is prudent during a time of current macro uncertainty.

Recommended Readings: