AMD is Ready to Rival on AI Acceleration

AMD is more complex than Nvidia as I can simply say “near-monopoly on GPUs” or “deep moat from CUDA” and that summarizes quite nicely why Nvidia is an AI leader. Of course, there is much more to the products, and that complexity has worked in our favor.

However, AMD is far less straight forward, and coupled with the complexity of the chip market, I am not surprised there was a muted reaction to the AI conference this month. Wall Street was quite late to Nvidia’s H100 release, in fact, Nvidia’s stock was at a deep discount the very month the H100 shipped. One can only hope that AMD will be at a similar deep discount when the MI300 ships in volume in Q4 2023.

I’ve said “I’m Still Feeling Zen” with AMD during the PC-slump – a play on AMD’s Zen Architecture — and I’ve also called the company “The Dark Horse,” which refers to being an underestimated competitor.  The Dark Horse reference is becoming less noteworthy given its penetration in the data center has grown 5-6X since we first started referring to the company as underestimated.

In October, I had said Nvidia was Ready to Rumble. At the exact time that Nvidia has been named AI King, I’m going to say that AMD is Ready to Rival.

Below, I go through the product lines you can expect to be Phase 1 of AMD’s AI Acceleration strategy. I believe what is described below will take us through the next two years of gains as AMD will primarily rely on the MI300A and MI300X to nibble at Nvidia’s GPU monopoly. There is also exciting things happening in CPUs with the Zen 4/4c release in the second half of the year, including a cloud optimized processor.

Later down the line, in Phase 2, AMD will benefit from recurring software revenue, hybrid AI, edge computing, FPGAs/Xilinx and Automotive. However, maintaining CPU growth coupled with a competitive GPU strategy is most important right now and I think it’s prudent to focus entirely here for the time being as our current position depends on this.

Notably, the revenue potential from Phase 2 will be quite substantial after the GPU strategy materializes. The main point to know is that major design companies will do quite well outside of the data center, so what you’re seeing now and next year will only multiply.

The goal of this particular analysis is to describe what AMD is setting out to accomplish with GPUs in as lucid a manner as possible. The opportunity in front of AMD is exciting. But, let’s first start with the risks before we go into the larger analysis as I want to make sure the risks are fully understood.

Here are the hurdles that AMD must clear to become a major AI contender – I expand on these points below.

  • Lacks a popular software platform and CUDA competitor. AMD’s recently released software platform ROCM is promising but is no CUDA.
  • AMD is later to market on AI acceleration in terms of GPUs. Although AMD has accomplished what is nearly impossible by being a second-place contender that crushed first-place Intel, the reality is that being in second place is a major obstacle.
  • On that note, the company has its hands full competing against Intel on CPUs. It will now go up against Nvidia on GPUs. Lisa Su is one of the best CEOs in the history of the tech industry, but can she and her team take on both at the same time?

There are also a few major positives that are in AMD’s favor – I expand on these points below.

  • The MI300s should be able to compete on performance once the GPUs are benchmarked as AMD’s GPUs power the world’s largest supercomputers.
  • AMD is exceptional at undercutting on price. This is primarily how AMD overtook Intel coupled with a better design (the Zen 2 architecture)
  • AMD’s designs are excellent at improving power efficiency. Power efficiency is important for total cost of ownership. Not only will AMD’s GPUs likely be cheaper (no confirmation on pricing just yet) but they will also cost less to own over a four-year life span.
  • Hyperscalers will support competition to Nvidia. You can think of Nvidia as more of a frenemy to Big Tech. This is due to pricing power, CUDA being closed source, and also now Nvidia will be competing with Big Tech in some areas. For example, Omniverse will compete with Meta’s metaverse ambitions. I don’t think it’s a coincidence that one of AMD’s largest customers is Meta. For the MI300 release, AMD is primarily focused on hyperscalers with the CDNA GPUs and not consumer-level RDNA GPUs.
  • Victor Peng, former CEO of Xilinx and now President of AMD, is an ace of spades in AMD’s pocket, as is Forrest Norrod and Jean Hu. As any epic CEO should do, Lisa Su has loaded up her team with a strong C-suite.

Brief Background on AMD-Powered Supercomputers

To understand AMD’s beginnings on AI acceleration, we have to start the discussion with supercomputers.

Supercomputers are the world’s most powerful computers and are government owned by the Department of Energy at national laboratories. Currently, Frontier is the world’s fastest supercomputer, and this is powered by AMD’s EPYC Milan CPUs and AMD’s MI250X GPUs. Infinity Fabric is essential to AMD’s architecture as it links functions of the CPUs and GPUs by providing interconnects for purposes of data exchange and memory.

Supercomputers are important for national defense purposes. Per the announcement from the Lawrence laboratory: “Besides supporting the nuclear stockpile, El Capitan will perform secondary national security missions, including nuclear nonproliferation and counterterrorism. NNSA laboratories are building machine learning and AI into computational techniques and analysis that will benefit NNSA’s primary missions and unclassified projects such as climate modeling and cancer research for DOE.”

Last year, the AMD-powered Frontier supercomputer broke Japan’s record at a speed of 1.1 exaflops, which is two times faster than the record held by Japan for two years. By breaking the 1.0 ExaFLOP/s barrier in the HPL benchmark test, AMD-powered Frontier became the world’s first exascale computer. This speed is greater than a quintillion calculations per second. 

This year, AMD will be powering the launch of a new and highly anticipated supercomputer called El Capitan located in Livermore, California. The ambitious goal for El Capitan is to exceed 2 exaFLOPS of “double-precision” processing power. This supercomputer is powered by AMD EPYC Genoa CPUs and AMD’s MI300A GPUs. El Capitan will also feature AMD’s ROCm open compute software platform.

AMD’s first real-go at competing with Nvidia on commercialized AI acceleration will be this year, however, the company has been powering the world’s top performing computer for five years. I think answering this question — why did the Frontier and El Capitan projects choose AMD — is critical for understanding why AMD can rival Nvidia on GPUs in the near future. The analysis below is aimed at discussing a few advantages AMD has in terms of design. 

Also, investors should note that AMD’s new GPUs will be shipping around the same time that El Capitan will launch (ETA: Oct/Nov 2023).

AMD’s CPU Zen Architecture

We’ve covered AMD’s Zen Architecture in depth a few times, including about two years ago in a 1-hour webinar on AMD and three years ago in a premium report here. The 2020 report is important because it was real-time on discussing the bullish thesis that AMD could take substantial market share from Intel in the data center. At the time, the company had 4% CPU server market share and now has over 20% market share.

We need to revisit how AMD was able to take on an 800 lb. gorilla in order to piece together how AMD plans to do it again.

Here is what was said a couple of years back – I’ve bolded what is important for the purposes of this analysis:

“In August of 2019, AMD released a competitive 7nm chip while Intel was still producing 14nm chips with a 10nm chip on the way. Essentially, AMD leapfrogged the incumbent with a product that is more power efficient and allows for more cores per chip. Because 7nm are twice as dense as 14nm, AMD was able to release a 64-core server chip and 128 threads rather than AMD’s previous 32-core server chip. Up until early 2019, Intel’s offering has been a 28-core server chip and 64 threads. […] AMD has blatantly stated the second-generation EPYC server processors had 1.8 to 2 times the performance advantage of Intel’s Xeon processor line and is half the cost in some instances.”

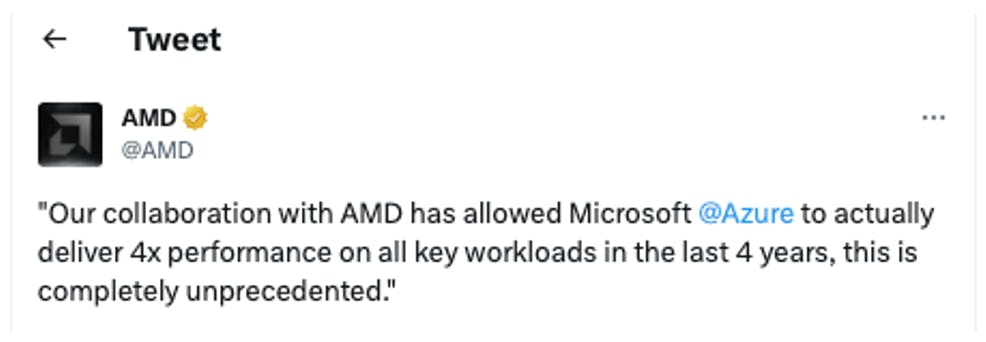
Here is a recent statement from Microsoft on the dramatic results from AMD’s Zen Architecture:
Source: Twitter

So, how was AMD able to outpace Intel on computing power, memory and energy use — at half the cost?

The Zen-2 architecture introduced a multi-chip module that used the most advanced technology where it’s needed most by combining 7nm chiplets with a 14nm die. This was quite a competitive leap as Intel was still using a monolithic design.

In this case, the 14nm was leveraged for memory controllers because the central hub runs input/output (I/O) and memory better. This helped AMD beat Intel on memory bandwidth. The design also greatly improved performance by putting the L2 cache on the core and the L3 cache across the core. Overall, these design improvements lower the power required while increasing the performance as it requires fewer NUMA hops, which in turn, increases instructions per clock, and this ultimately reduces latency.

From there, AMD undercut Intel on price, which becomes a virtuous cyclebecomes a virtuous cycle as driving down costs means more chips will be bought from AMD. We also mentioned in the 2021 webinar that at the time, a third-party analyst named Michael Larabel benchmarked AMD as being 14% faster than Intel while costing about 30% less.

In what can a be an industry full of jargon, this is most important point in my previous AMD analysis as to why AMD went from 2-4% CPU server share to 20%+ when AMD’s Rome went up against Intel Xeon Cascade Lake: 

“It’s estimated that for every $1.00 in Rome chip sales, Intel loses $2.25 on average in Intel Xeon SP sales. The savings are then deployed to buy more Rome chips, which can further depress Intel’s revenue.”$1.00 in Rome chip sales, Intel loses $2.25 on average in Intel Xeon SP sales. The savings are then deployed to buy more Rome chips, which can further depress Intel’s revenue.”

The older Rome Series Zen 2 architecture is what was discussed in our webinar. Meanwhile, the Milan Series is the current series driving forward AMD’s data center growth. The Milan Series Zen 3 architecture has made improvements in performance largely due to 3D stacking. By incorporating 3D stacking in Zen 3, AMD was able to triple the L3 cache size while only adding four clock cycles of latency. When 3D stacking is incorporated with GPUs, the result is computers that train neural nets up to 40 percent faster with 16 percent less energy.

Next up is Bergamo, the CPU line specifically designed for cloud native workloads. In this case, Bergamo will have less cache and more performance per watt. During the conference, Meta was on stage with AMD to attest to Bergamo having 2.5X better throughput performance. Part of the upcoming release includes Siena, which will drive more dollar performance per watt at the edge for telco customers. Notably, Genoa and Genoa-X will continue to provide more cache for general purpose workloads.

Total Cost of Ownership:

Total cost of ownership (TCO) refers to the total cost to own and operate equipment over its useful life span. TCO is a motivating factor for hyperscalers when evaluating equipment as it factors in not only the acquisition cost but also the costs associated with owning and operating the equipment over the hardware life cycle. 

For example, Spiceworks reported that “in 2010, the research firm Gartner estimated that for a desktop PC priced at $1,000, the total cost of ownership works out to at least $2,680 per year when you factor in things like capital expenditures, labor expenses of supporting the computer, and indirect costs such as lost end-user productivity due to downtime.” Over a four-year lifespan, the costs are estimated to be $9,800 to $17,600.

We will have to get the benchmarks after the MI300s are released, but power consumption is a major contributor to higher TCO. In addition to this, if a company has to buy more GPUs to train and run similar size LLMs, then this would (theoretically) also contribute to a higher TCO for Nvidia equipment.

In the past, AMD advertised up to 20% Capex savings compared to Intel based on Epyc processors delivering more performance from a single chip compared to Intel’s dual-processor powered by two CPUs. Big Tech has capex budgets into the tens of billions. Although it’s not specifically disclosed exactly how much goes toward AI acceleration, we know that Big Tech is driving forward Nvidia’s GPU sales at $8 billion per quarter or $35 billion to $40 billion per year.

Here is the thesis in a nutshell: If a competitor can deliver 20% savings on this kind of budget with similar performance, then it will turn heads. We can geek out all day long on the computing performance of Nvidia’s H100 GPU, however, if the MI300s drive down total cost of ownership through low unit pricing, better power efficiency and reducing the number of GPUs required, then hyperscalers will line up to support this.

What Google, Amazon, Microsoft, Meta and large enterprises want most of all is to build incredible AI systems but at a manageable cost. This goes back to the virtuous cycle. The more they save, the more they can build.

If Big Tech capex goes further with AMD, then that will be something Nvidia will be forced to address. Nvidia is unrivaled right now on GPUs, which means their pricing power is unrivaled. The H100 is in short supply, and the A100 may be being stockpiled by China before United States sanctions take effect. The lead times on the H100 and A100 are into 2024 at this point, which means there is no better time for AMD to enter the market and undercut on price/TCO than right now.

In the next section, we discuss how the MI300A and MI300X GPUs may be following a similar path as the Rome, Milan and Genoa CPUs.

MI300A and MI300X GPUs

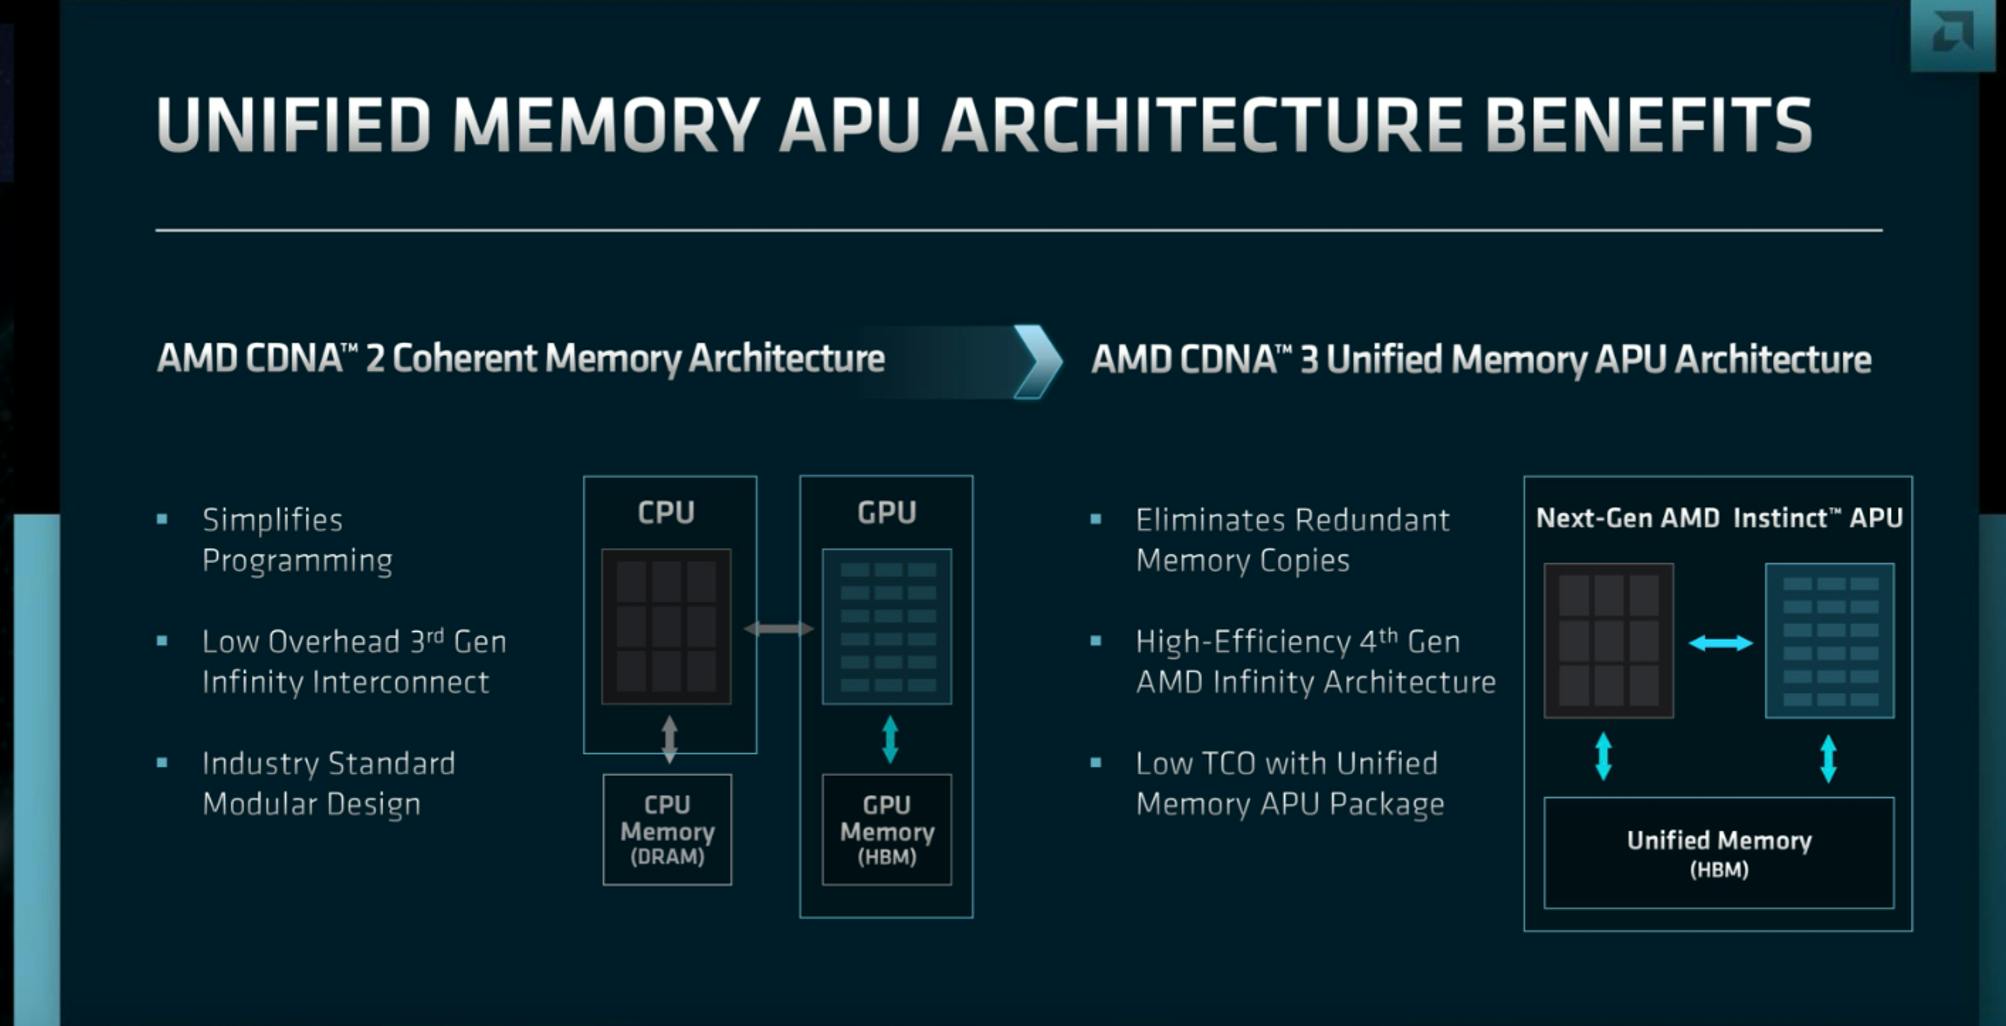
The El Capitan Supercomputer is expected to launch this Fall. When it launches, El Capitan is expected to follow a similar system as Frontier which is (1) AMD Epyc CPU with (4) MI300 GPUs with Infinity Fabric. The “A” in the MI300 stands for APU, which refers to a CPU being combined with a GPU. Nvidia has only recently attempted this at the HPC level with the Grace CPU and H100 GPU, but this is technically two discrete devices with separate memories.

By having a fully shared, coherent memory, the MI300A architecture reduces latency while enabling high bandwidth. The high-speed, low-latency unified memory helps improve speed while allowing the CPU and GPU to do what they do best. By allowing both processor types to access shared memory, HPC programming is more efficient. 

Notably, AMD has been successful in releasing APUs for PCs and gaming. Technically, APUs underperform GPUs when it comes to gaming but outperform on PCs as they don’t use as much power as dedicated GPUs.

Here are the specs:

  • 24 CPU Cores comprised of three Genoa eight-core chiplets
  • 128 GB HBM3 memory with approx. 5TB/second of memory bandwidth
  • (9) 5nm compute logic chiplets and (4) 6nm base dies
  • Shared memory

MI300X

According to AMD, the MI300X will have 2.4X the memory density of the H100 and 1.6X the memory bandwidth. The reason that the MI300X was able to run the popular Falcon-40B large language model (LLM) with 40 parameters is because the neural network was ran entirely in memory without the need to move data back-and-forth with the external memory. AMD also stated the MI300X will be able to run up to 80B parameters on a single chip.

  • (8) 5nm GPUs and (4) 6nm base dies
  • 153 billion transistors
  • 192GB of HMB3 memory. 5TB/second of memory bandwidth
  • Ran a 40B parameter large language model (LLM) on a single GPU (unprecedented)
  • Can scale up to 8 accelerators in a single package for cutting-edge generative AI LLMs

The MI300X requires more power than its predecessor MI250X at 750 watts, and this is higher than Nvidia’s H100 at 700 watts. However, it’s not an apples-to-apples because what the MI300X promises to deliver is running compute-intensive large language models with fewer GPUs than is required with the H100s due to offering roughly double the memory.

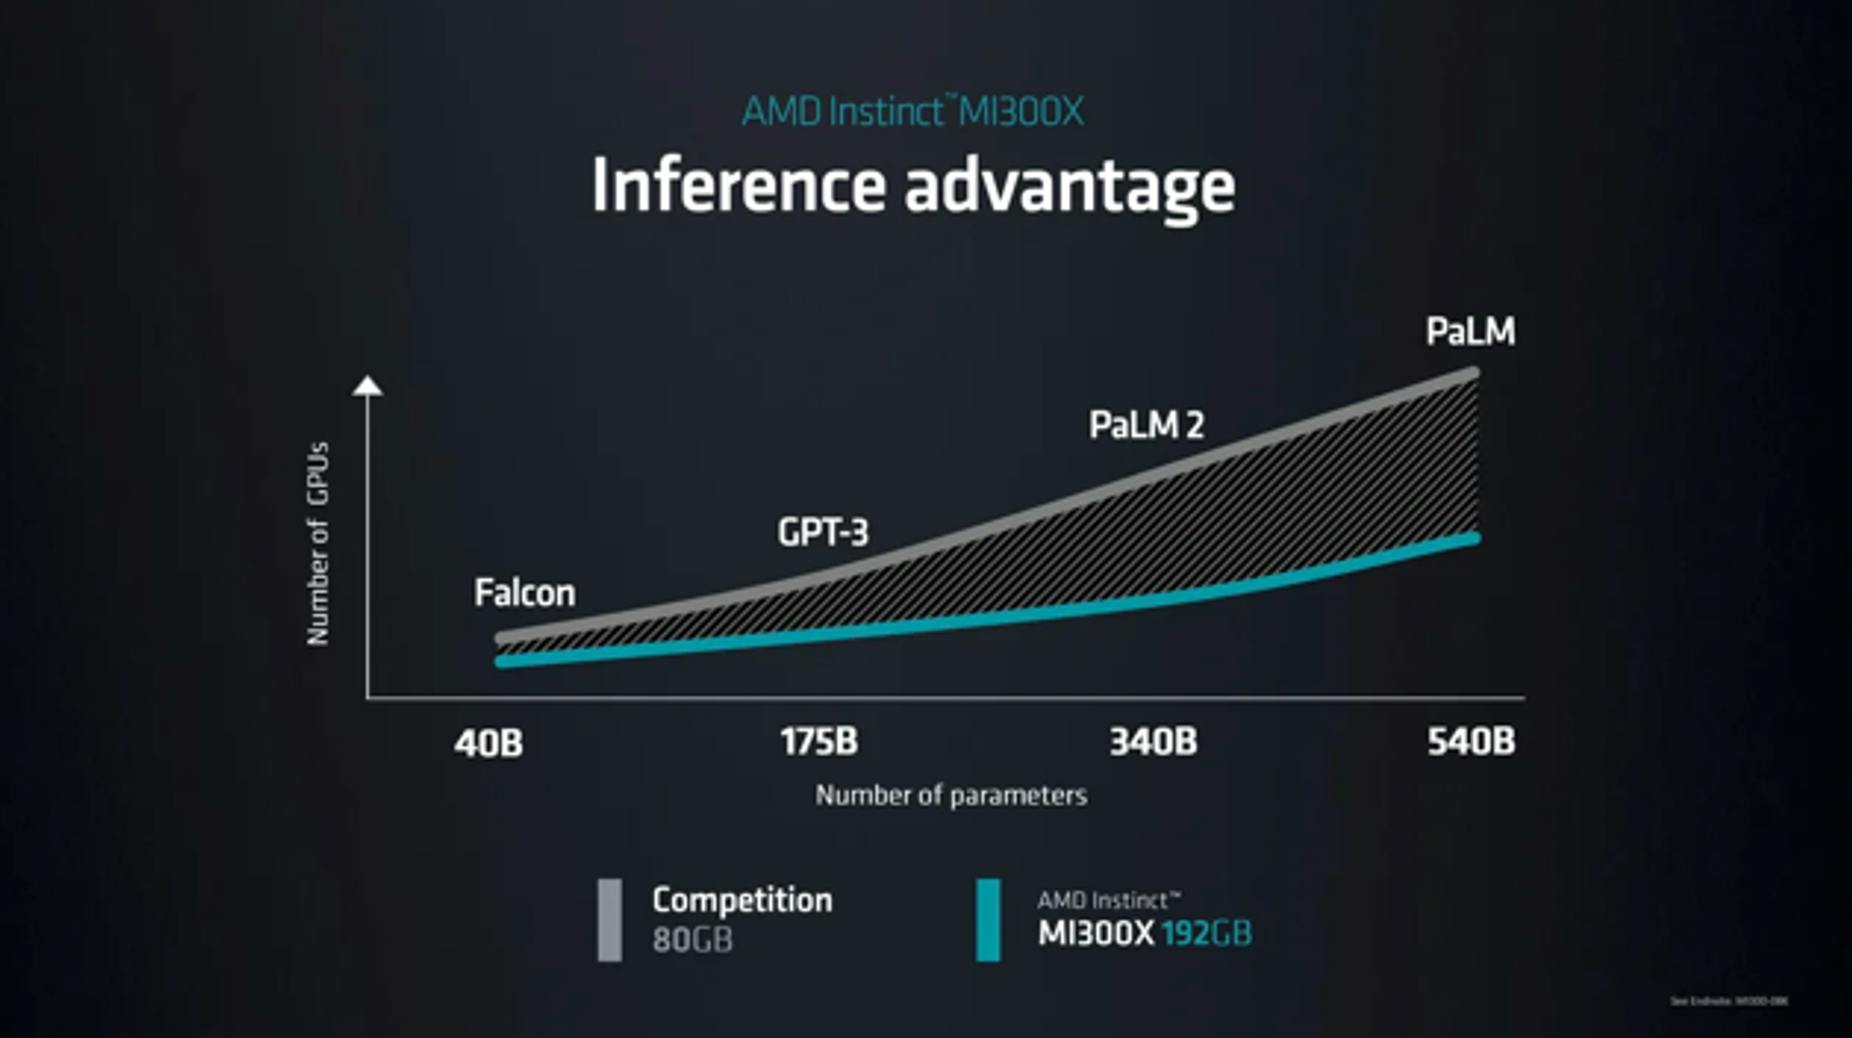
The need for fewer GPUs is accomplished by running LLMs in the memory. The image below shows why having 2.4X memory at 192GB compared to Nvidia’s 80GB will reduce the number of GPUs required for running popular large language models.
Here is what Dr. Lisa Su said at the recent AI conference:

“For the largest models, that actually reduces the number of GPUs you need, significantly speeding up the performance, especially for inference, as well as reducing the total cost of ownership."

In terms of the MI250X versus the MI300X, the newer model is powering nearly three times more transistors than its predecessor. There is also a lower power variant of the MI300X expected in early 2024. In addition to this, AMD offers chiplet and packaging technologies that reduce power requirements.

To compete with Nvidia’s DGX systems, AMD is also releasing the AMD Instinct Platform which will combine eight MI300X systems with 1.5B terabytes of HBM3 memory. The server utilizes the Open Compute Platform specifications so that it’s compatible with existing hyperscaler infrastructure (more on this below).

Quick note on AMD Radeon RX Series Gaming GPUs

We are invested in AMD for the company’s AI potential. However, it makes sense to touch base on gaming as graphics processing units (GPUs) are first and foremost gaming chips. At the time that Nvidia was founded in the early 1990s, and up until recently, gaming was one of the most computationally challenging use cases for hardware.

Nvidia is the inventor of GPUs, and for the first two decades or so, NVDA was primarily a gaming stock. Part of our original thesis was that the AI era would be upon us when AI revenue overtakes gaming revenue for Nvidia, as this would help pinpoint when Nvidia’s industry had officially changed. It’s a big moment when something like this happens (Mac/PC overtaken by iPhone/Mobile revenue, etc.). 

Since gaming is what led to Nvidia’s GPU positioning for AI/ML, it makes sense to note that AMD is a decent contender on gaming GPUs. Here’s a snapshot of how gaming GPUs rank in 2023 from industry-expert Tom’s Hardware:

PC Gamer stated that AMD has 9% of market share compared to Nvidia’s roughly 82%. This is hard to rely on for concrete numbers as GPUs are down nearly 50% year-over-year and both Nvidia and AMD’s bigger gaming releases occurred in Q4. The upcoming 2023 numbers will represent the market share a bit better. In the past, we’ve reported that Peddie’s numbers were 25% AMD and 75% Nvidia. According to PC Gamer, Intel may be eating into AMD’s market share, but we won’t know this definitively until there’s reports on Radeon RX 7900 numbers.

Open Accelerator Module (OAM):

In 2019, Meta and Microsoft led a coalition to create open standards that allow for choice in processor and accelerator. The OAM came together to design packaging and motherboard socketing technology that allows accelerators with different sockets and thermals to be consistently deployed. 

The OAM form factor replaces the PCIe form factor accelerator cards. The OAM form factor is also ideal for interoperability across custom silicon, such as ASICs, which experience excessive signal insertion loss to PCIe connectors and the baseboard.

AMD’s Instinct GPU accelerators feature OAM baseboards. These universal hardware design standards allow IT departments to choose a new GPU architecture with a more simplified installation and provides the ability to upgrade at any time. The IT departments may or may not choose AMD over Nvidia but the process is easier with OAMs and open standards.

ROCm Open Software (AMD) versus CUDA (Nvidia) & Other AMD Weaknesses

Are you feeling bulled up? If only it were so simple! The predominant weakness AMD must address is ROCm open software versus CUDA. Our original thesis on Nvidia in 2018 pointed toward developers/CUDA being the primary moatthe primary moat. The CUDA software moat will be tougher to disrupt than Nvidia’s A100 and H100 hardware lead. This is because developers have to install new drivers, compilers, and will have to learn new libraries and tools. Meanwhile, Nvidia’s closed source CUDA has everything a developer needs to support code development. So, why would a developer switch? Answering this will not be so easy for AMD to answer compared to GPU performance, power efficiency, and total cost of ownership.

The long history of support CUDA that CUDA offers will be very hard for AMD to shake as it requires time to build up proper support, including libraries and frameworks. AMD’s ROCm has only a fraction of the libraries that CUDA offers. Meanwhile, software engineers in AI/ML lack only one thing: time. It’s a very competitive and fast-moving space, and AI engineers are in high demand. AI startups are getting more funding than any other type of startup right now. Money is tight for startups everywhere – except in AI.

Speaking of startups, AMD is particularly lacking in terms of bottom-up adoption and revenue, which refers to employees at a lower level helping to drive adoption rather than top-down from the C-suite. This is because AMD is weaker in terms of its consumer-level RDNA cards as they lack matrix cores for machine learning purposes.

In December, the company released RDNA3 which has more matrix operations, but does not compare to dedicated matrix cores. The CDNA GPUs from AMD are aimed at hyperscalers and fully satisfy AI/ML operations in this regard, however, the price is prohibitive for individual developers and smaller startups.

An example of ROCm lacking support is that the open source development platform underperforms with the popular 3D modeling program called Blender and does not offer support for bugs. Currently there is a statement on the wiki linux page: “ROCm HIP is known to currently have issuesissues with cycles in the while in the 3D Viewport (refer to the "issue" cited before to find workarounds), however rendering with Render > Render Image or F12 should work fine.”

Overall, developers not only must take the time to learn a new development platform but are likely to encounter roadblocks in terms of support for popular programs.

Pytorch is a popular, deep learning framework that has natively supported ROCm since 2021 and also supports CUDA directly in the interface. In June of 2022, ROCm 5.3 moved from Beta to Stable on the Pytorch 1.12 framework. This a good date to work with (June of 2022) in terms of when ROCm officially launched for AI/ML development.
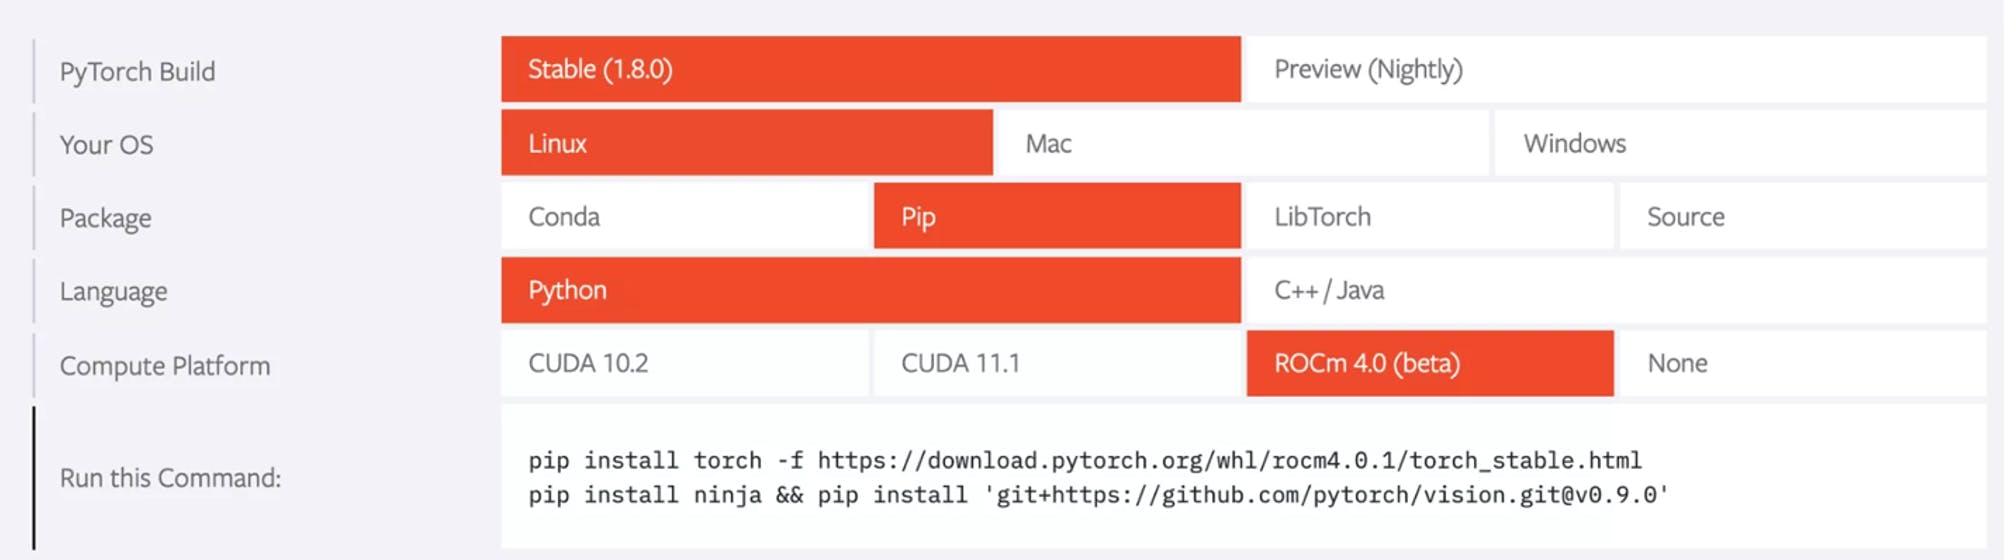
PyTorch was founded by Meta’s AI research team, and it quickly overtook Google’s framework TensorFlow. The current version PyTorch 2.0 utilizes OpenAI’s Triton software stack. OpenAI open-sourced Triton in an effort to circumvent Nvidia’s closed source CUDA libraries.
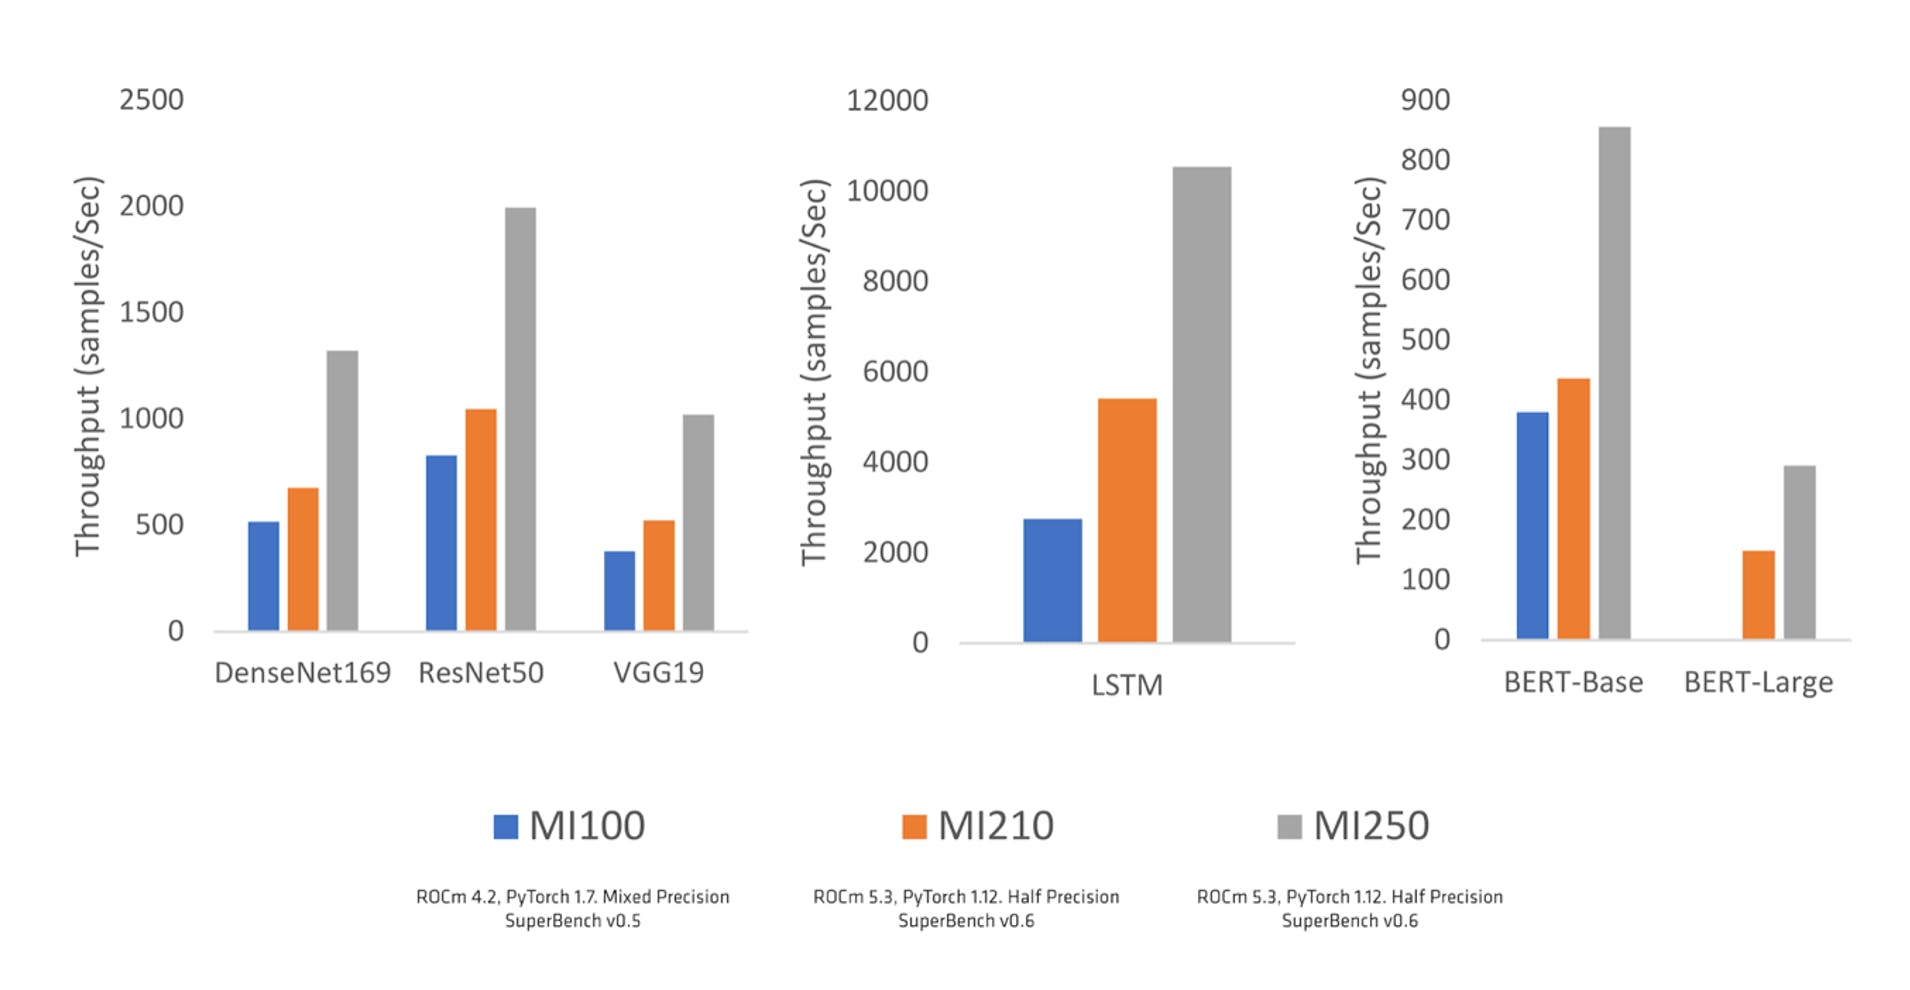
Pictured Above: Beta tested throughput performance for AMD’s CDNA architecture with ROCm software platform and PyTorch Framework and libraries. You can expect this to increase dramatically with the MI300.throughput performance for AMD’s CDNA architecture with ROCm software platform and PyTorch Framework and libraries. You can expect this to increase dramatically with the MI300.

What we discussed earlier in the analysis is that the MI300A GPUs are unique due to the unified, coherent memory. It’s expected that AMD will offer memory models on the PyTorch framework to help developers optimize memory usage in AI acceleration.

ROCm is currently only supported on Linux but is expected to support Windows soon. This further prevents adoption as a serious contender to CUDA should be supported on both major operating systems.

Conclusion:

The MI300s are on the way and there is pent-up demand for GPUs. Prices are high, lead times are long, and the race for AI is fierce. AMD is an equation where strong management + strong track record on CPUs + lower prices, lower power usage, and fewer GPUs for LLMs = the one and only contender that can take on Nvidia. The MI300s have been in development for longer than one might assume and they arrive in volume in Q4.

Let’s get ready to rumble! –Michael Buffer

Recommended Readings:

Where Nvidia’s Stock Price Will Go Next

This article was originally published on Forbes on Forbes Forbes on Jun 29, 2023, 08:52 pm EDT

The market is like the weather, it changes often. The market’s fickle nature is partly why stocks often lead to losses for retail investors. By going “all-in’ or “all-out,” individual investors can often be overexposed to the sudden changes the market brings. This is especially true when the market has treated investors well as it creates a sense of security – or worse, complacency.

Our site is unique in that we provide active management. This has helped us outperform across four audit periods. Our stance is the weather will always change – from good times to bad times, and from bad times to good times. Therefore, we are not over exposed in either direction.

An example of this is Nvidia, our largest position. As the allocation grew well beyond 10%, we took gains. Even after taking gains, the company is currently at a 17% allocation. In May and June, I stated that our firm was not buying Nvidia right now. Well, similar to the weather, this has changed. My firm bought a small tranche of Nvidia yesterday for $410. This tranche will come with a stop, meaning if the stock sells off, we will close this 2% tranche while hedging the 15% original position.

Sign up for I/O Fund's free newsletter with gains of up to 221% – Click hereClick here

Our Current Nvidia Trade:

With the cash we raised throughout 2022, NVDA was the primary target of deploying some of this cash once our analysis signaled a bottom was in place. The below is a real-time trade notification we sent to our members on the October 13th.

Nvidia Buy Signal

Source: I/O FUND

The above alert was 1 of 9 alerts we sent out from 2021 – 2022 to buy NVDA below $200. However, since February of 2023, we have been systematically taking gains at key levels based on technical and macro warnings. Even with logging sizable wins while raising cash, it in the top position in 2023.

In our pre-earnings buy-plan for NVDA, we stated that “It is our belief that NVDA is setting up for a sizable pullback, which we believe will open the door for better long-term entries.” Though we do believe that lower levels will manifest in time, the recent earnings report moved forward expectations regarding AI, which is showing up in the price action. We have been discussing that Nvidia will be an AI leader for years with an allocation to match, yet predicting the exact day and month the market would finally price in this thesis is impossible to predict (and timing to this level is not necessary when holding a large longer-term position)

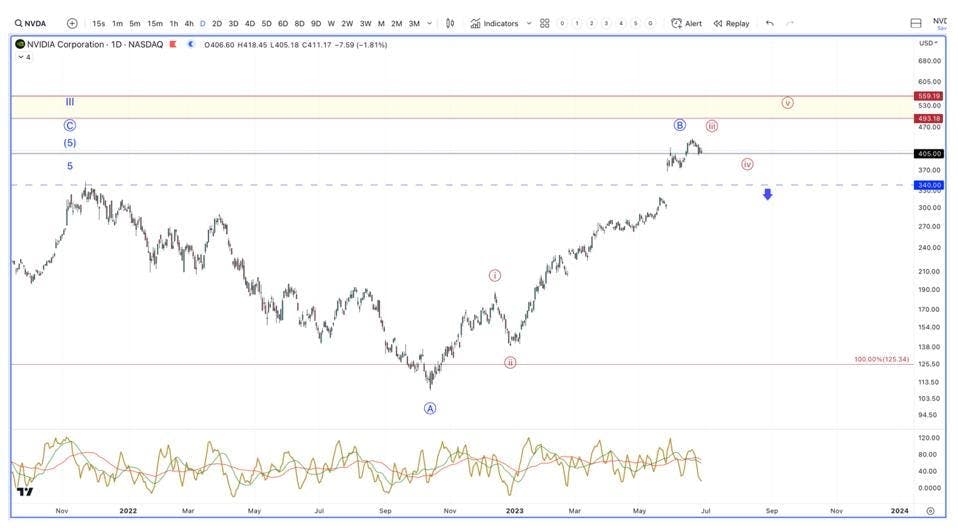
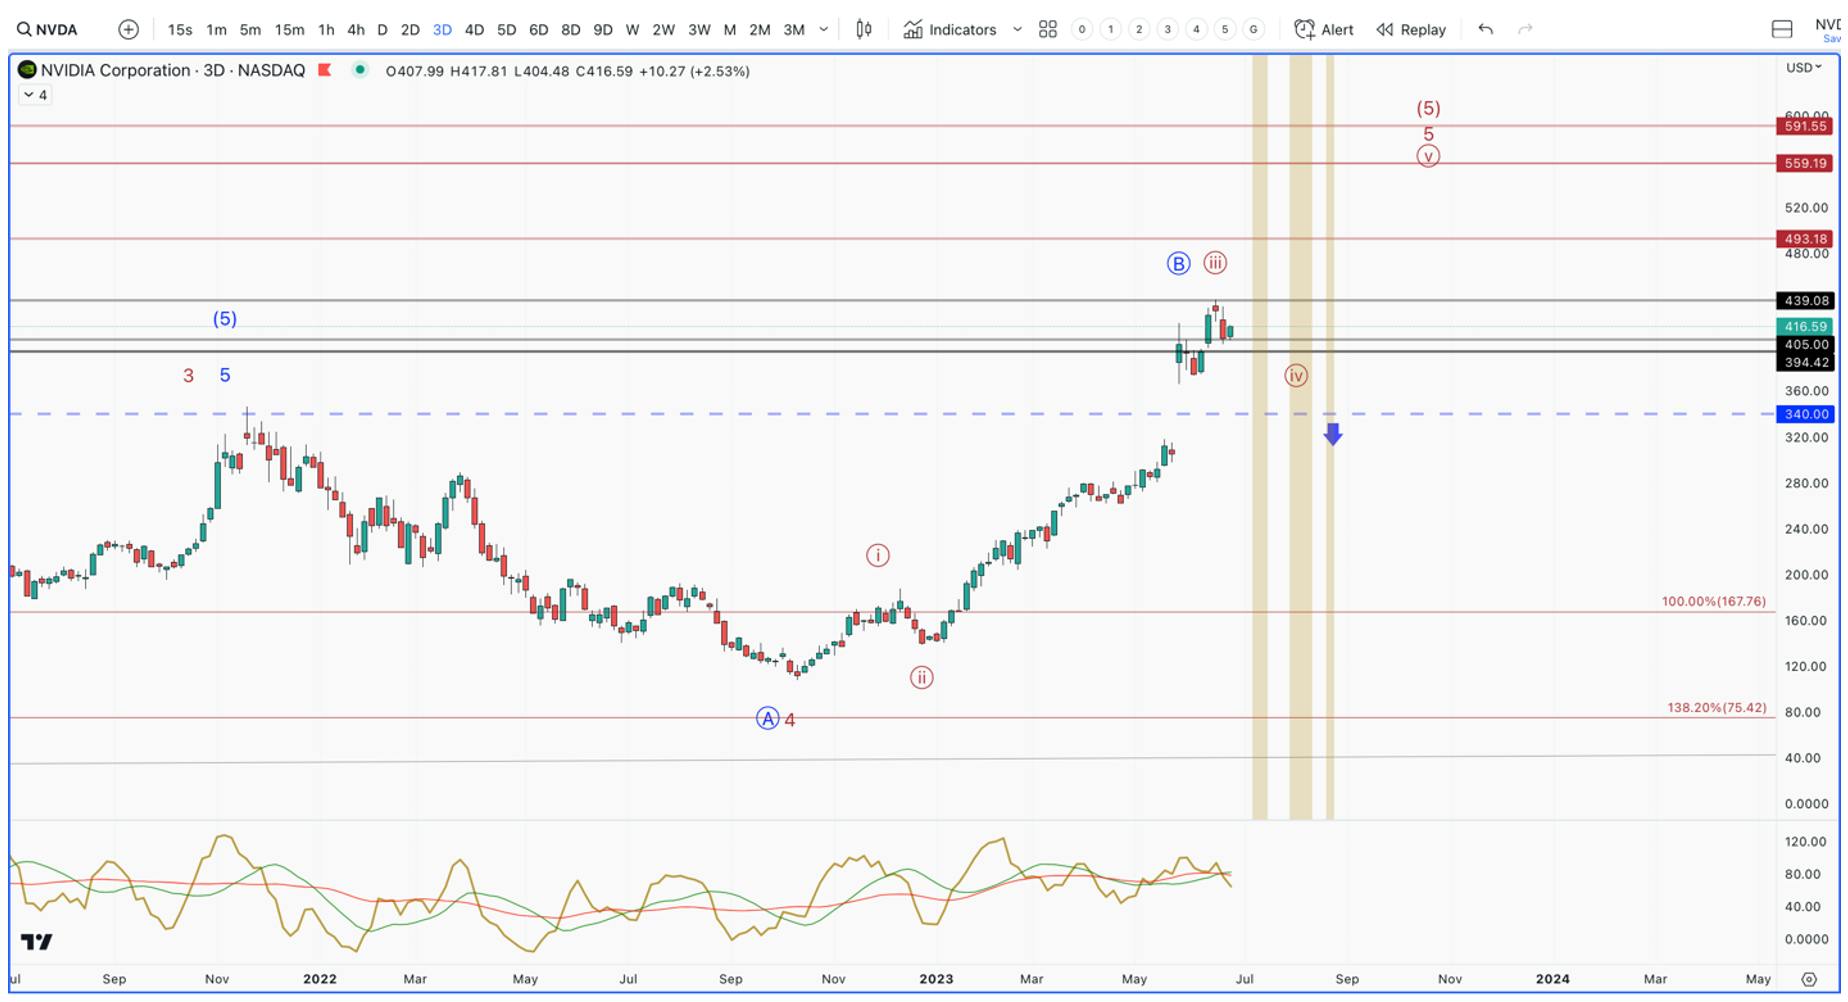
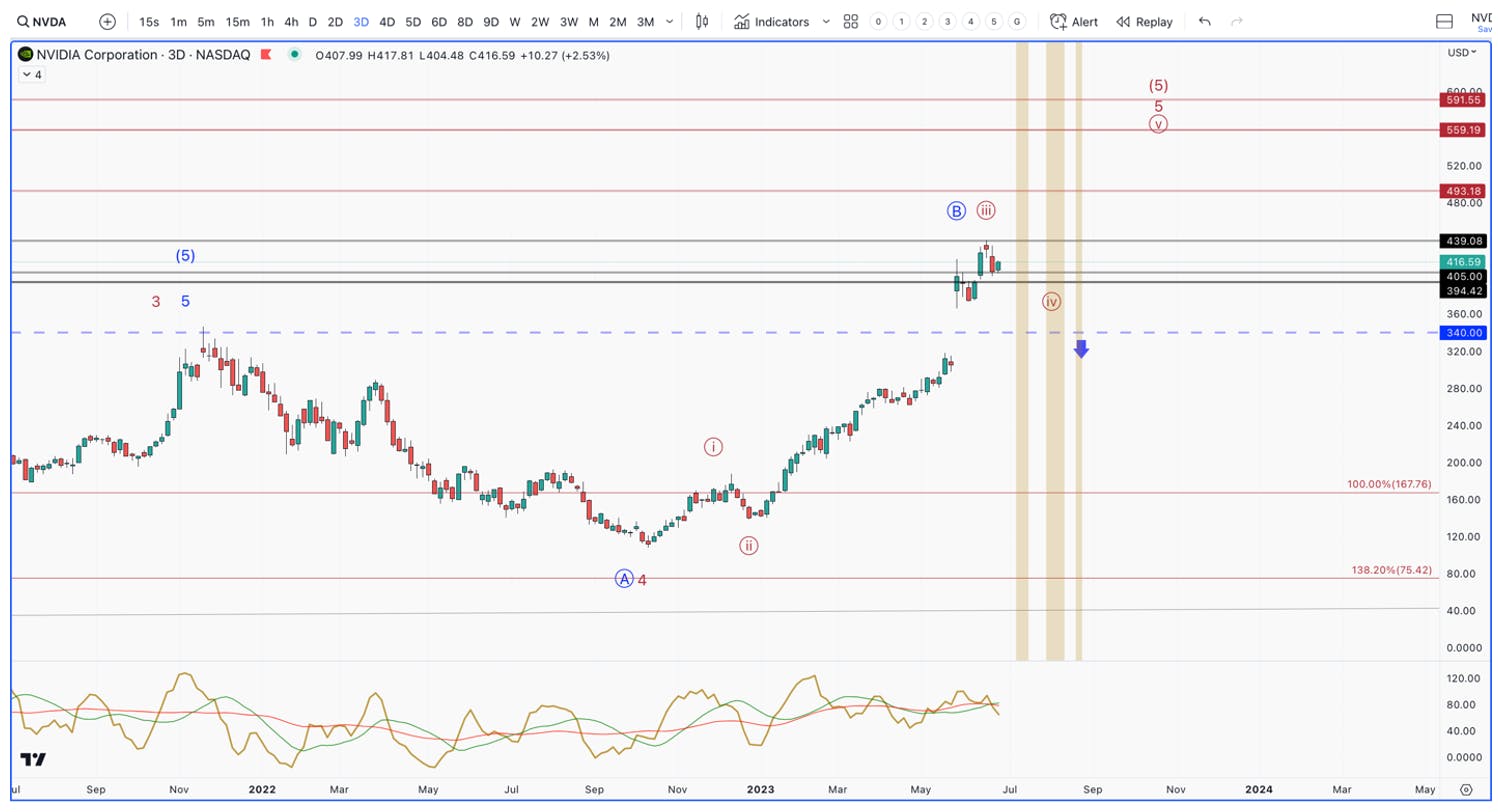
Regarding price, we work in probabilities, and when the market changes, so do we. The key to NVDA today is the large gap from their earnings report. This gap is either a breakaway gap, or an exhaustion gap. If it is a breakaway gap, which is represented by our red count below, then it is the halfway point in this push higher. On the other hand, if price breaks below $340, likely on some type of “event,” then the gap is an exhaustion gap, and will mark a larger top. This is represented by our blue count.

Every Thursday at 4:30 pm Eastern, the I/O Fund team holds a webinar for premium members to discuss how to navigate the broad market, as well as various stock entries and exits. We offer trade alerts plus an automated hedging signal. The I/O Fund team is one of the only audited portfolios available to individual investors. Learn more here.Learn more here.

Nvidia Chart analysis

Source: I/O Fund

The $405 – $395 region will likely continue to act as strong support for the red count. This is where we added back in anticipation for a ~38% push higher. Our stop for this move will be a break below the $340 critical support region, which is ~14% lower than our entry.

Unlike many, we do not believe AI is a bubble, nor do we think the valuations in some of these names is stretched, as many believe. What does concern us regarding possible “events” are: 1) geo-political tensions forcing a ban of selling NVDA’s chips to China – which Beth spoke about in May with Bloomberg Asia; 2) the inevitable recession that will likely start to be priced into equities in Q4/Q1, but could get pushed forward due to an unforeseen event.

Because of these risks, we are buying with an exit plan for any new entries. It is our belief, based on the economic data, that a recession is a more likely than not for the US economy. However, based on current projections on timing, we could see a continued push in AI leadership through year-end. This is what we are further positioning our portfolio for, with the realization that we could top out sooner than anticipated.

The I/O Fund has been beating the drum about AI for 5 years. Now that it is here, we are targeting choice mid-cap to mega-cap names in the coming pullback. Once this exuberance runs its course, and the market gives up on AI, we will be buying the dip for this once-in-a-lifetime tech trend that is just starting. Join us the week following the holiday, Thursday, 7/13, at 4:30 EST where we will go over the specific AI stocks we are targeting. We will provide the macro backdrop, along with entry prices.about AI for 5 years. Now that it is here, we are targeting choice mid-cap to mega-cap names in the coming pullback. Once this exuberance runs its course, and the market gives up on AI, we will be buying the dip for this once-in-a-lifetime tech trend that is just starting. Join us the week following the holiday, Thursday, 7/13, at 4:30 EST where we will go over the specific AI stocks we are targeting. We will provide the macro backdrop, along with entry prices.

Recommended Reading:

Beth Kindig Discusses AI Stocks with Tier 1 Media

Tier 1 Media outlets such as Fox Business News, Bloomberg and Real Vision interviewed Beth four times over the past month about her call on Nvidia and also picked her brain on other AI-related topics.

Below are clips of Beth Kindig’s Tier 1 media coverage in the month of May and June.

Background:

I/O Fund Lead Tech Analyst Beth Kindig was early to Nvidia’s AI story with five years of coverage dating back to 2018 on the very specific thesis that this company would one day lead on AI. Beth’s prescient call on Nvidia and a handful of others led to the I/O Fund portfolio being positioned with a 45% allocation to AI stocks going into May. Compare this to Stanley Drunkenmiller, who had 29.5% allocationhad 29.5% allocation in AI, and has been covered by the press as the leading AI investor.

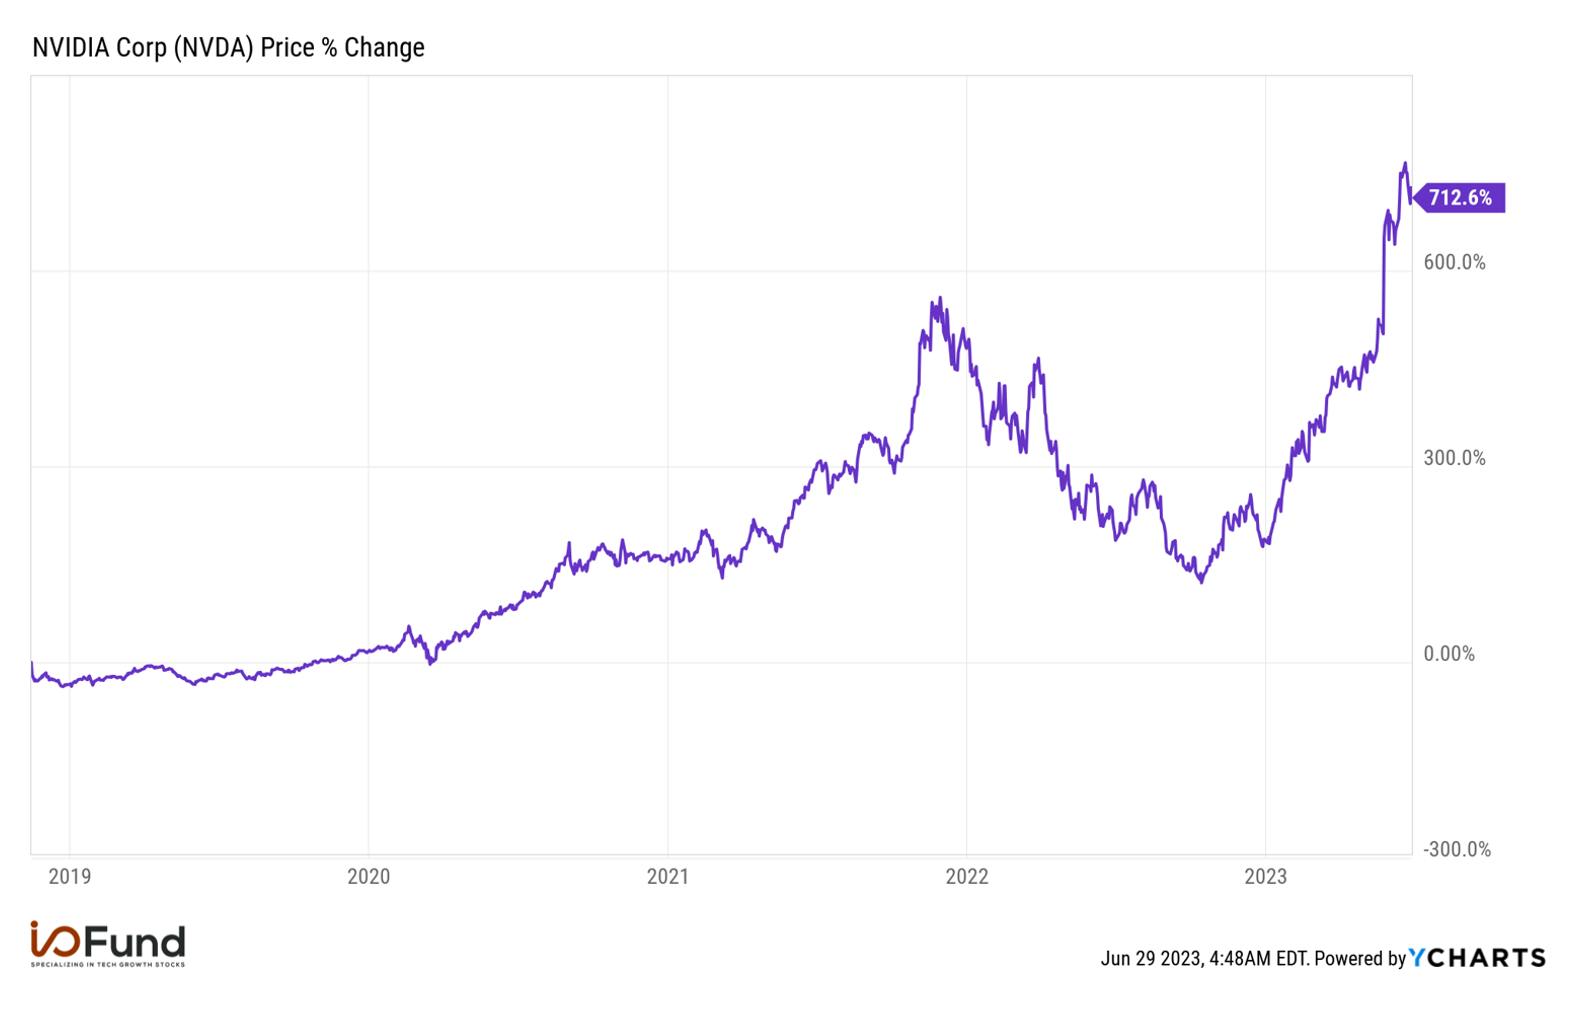
The stock is up 710% since her coverage five years ago when she stated: “Nvidia is already the universal platform for development, but this won’t become obvious until innovation in artificial intelligence matures. Developers are programming the future of artificial intelligence applications on Nvidia because GPUs are easier and more flexible than customized TPU chips from Google or FPGA chips used by Microsoft […] Data center revenue stands at 24% and is rapidly growing. When artificial intelligence matures, you can expect data center revenue to be Nvidia’s top revenue segment. Despite the corrections we’ve seen in the technology sector, and with Nvidia stock specifically, investors who remain patient will have a sizeable return in the future.

Nvidia price chart

Source: YCharts

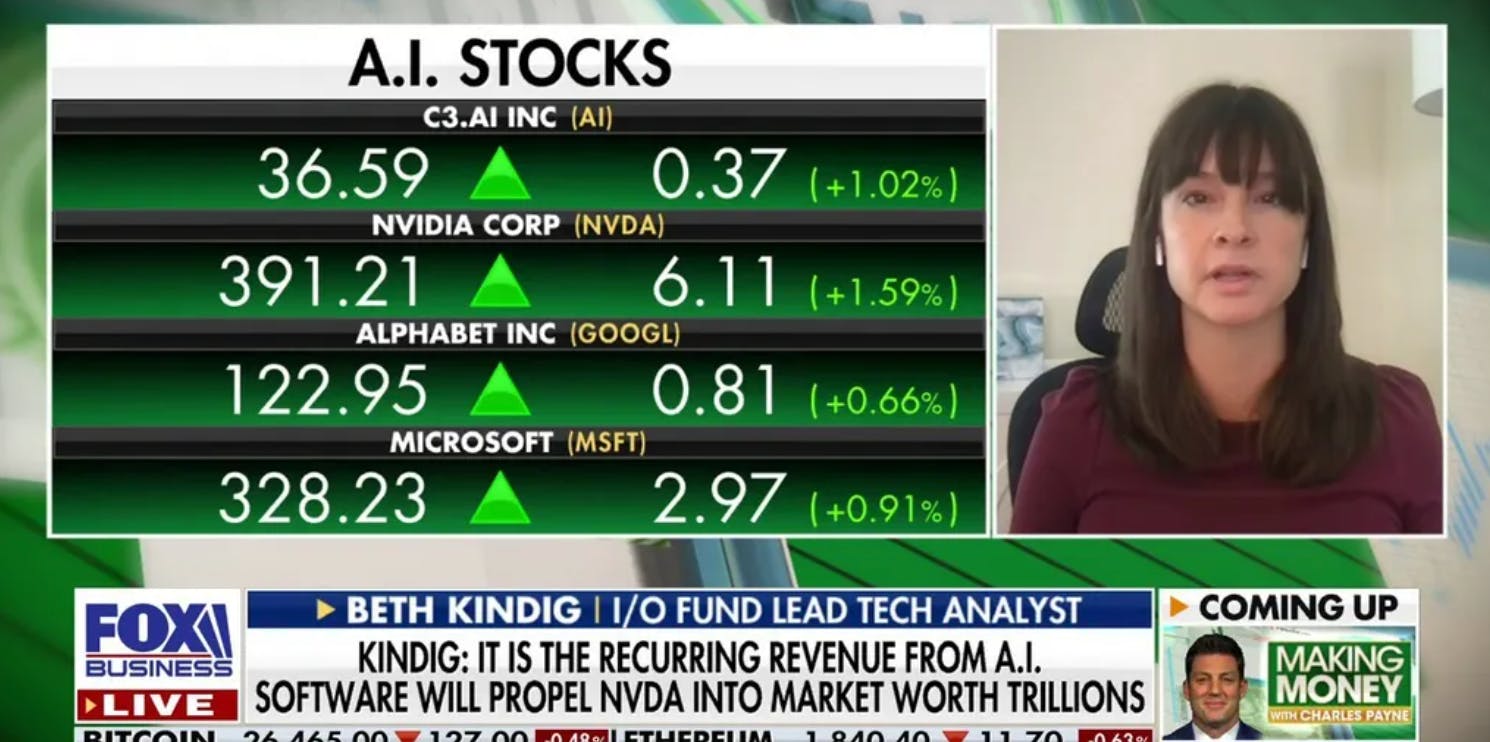
Beth on Fox Business News: Nvidia’s future AI dominance will be propelled by Software

In the clip below, Beth Kindig discusses with Charles Payne of Fox Business News how “it was a hardware that provided the $950 billion to $1 trillion market cap we see today [for Nvidia], but it will be software that will propels Nvidia into the Trillions for market cap.”

She specifically points toward DGX Cloud and AI-as-a-service for Nvidia’s software layer and how this is expected to eventually eclipse its hardware revenue. The cost of AI supercomputers can be several million dollars and Nvidia will help to lower the costs of AI development by allowing enterprises and startups to rent a supercomputer in the cloud for roughly $40,000 a month. Kindig states this is likely to be popular not only because the costs of AI development are prohibitive but because AI is a race in terms of time to market, as well.

The video below was originally recorded on June 9, 2023.

AI stocks I/O Fund

Click here to watch videoClick here to watch videoClick here to watch video

Beth on Fox Business News: AI will drive $100 billion in revenue for Microsoft

Microsoft is another AI stock that Charles Payne interviewed Beth Kindig about later in the month of June. Payne specifically asked Kindig about her research note that stated the company is well positioned to increase revenue by $100 Billion. She cites Microsoft CoPilot as a primary driver as it can immediately increase enterprise spend on the Office 365 productivity suite, as well Bing Search which will add $2 billion in revenue for every 1% of market share that Bing takes from Google as a result of Chat-GPT. In addition to this, cybersecurity is a $15 billion market and it can easily double by 2027 with the help of AI.

The video below was originally recorded on June 15, 2023. You can view the clip here.

artificial intelligence fox business news

Click here to watch videoClick here to watch videoClick here to watch video

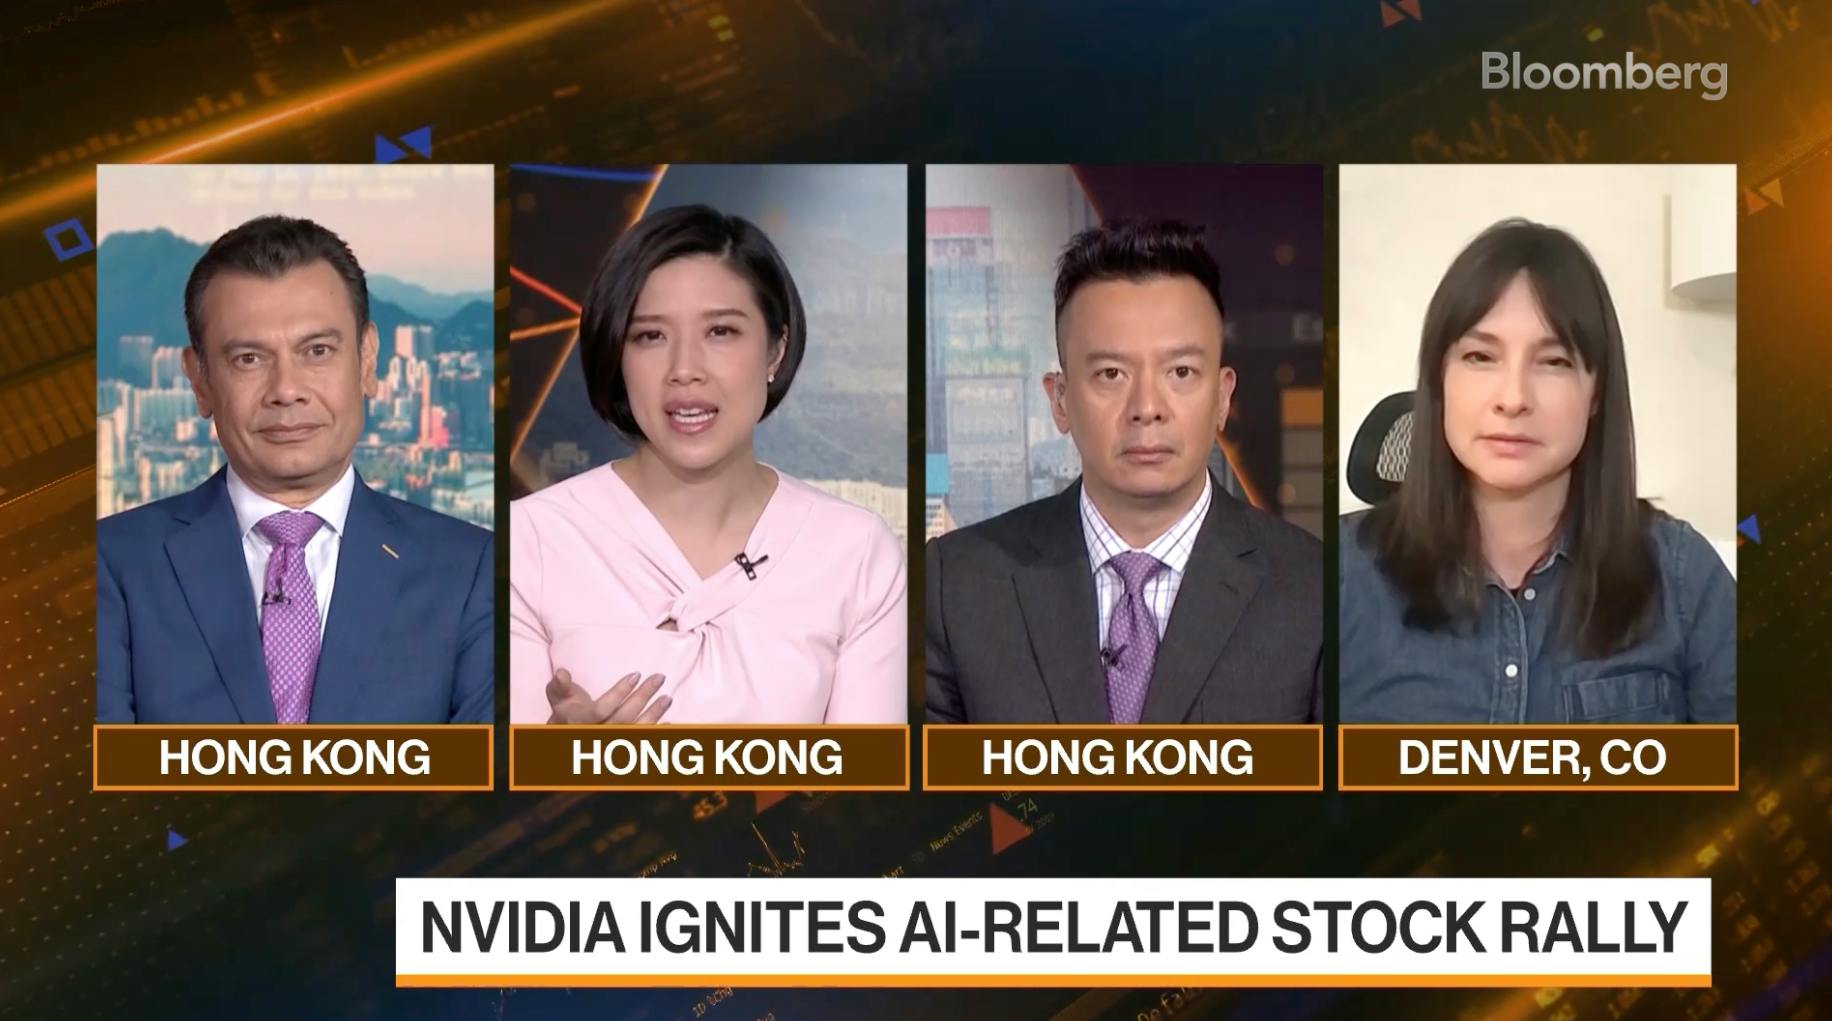
Beth on Bloomberg Markets: Nvidia benefits from Accelerated Computing and Generative AI

Beth Kindig discusses Nvidia's competitive strength and AI. She speaks with Rishaad Salamat, David Ingles, and Yvonne Man on "Bloomberg Markets: China Open." Beth Kindig highlights that the company is very resilient and insulated. The reason is that companies have been saving cash to buy accelerated computing for the data center and Generative AI applications. Most tech companies are coming under tighter tech budgets, but the one area of growth is specifically AI within Big Tech capex budgets. This is the market Nvidia serves.

Every Thursday at 4:30 pm Eastern, the I/O Fund team holds a webinar for premium members to discuss how to navigate the broad market, as well as various stock entries and exits. We offer trade alerts plus an automated hedging signal. The I/O Fund team is one of the only audited portfolios available to individual investors. Learn more here >>Learn more here >>

Beth said that semiconductors will continue to be winners because this is what is enabling accelerated computing. In the past, data center investment was focused on processors. Now, they have to move to accelerated computing, and that’s where Nvidia benefits because NVDA is the leader in parallel processing.

At minute 3:00, Beth outlines the risks for China, stating that any long-term Nvidia investor should be prepared for China to be the primary threat for this company. “This can rock the stock, so to speak,” she stated. AI is an immense opportunity but “for these major design companies which includes AMD, China could not be more important.” 

The video was originally recorded on May 25, 2023.

Nvidia ignites AI-related stock rally

Click here to watch videoClick here to watch videoClick here to watch video

Real Vision

Beth was also interviewed by Real Vision, where she followed up on her initial call in January to buy Nvidia. At the time, she was asked what would cause her to sell the stock and she “absolutely nothing except maybe World War 3.” Fast forward, and today Beth has the highest returns from the 3 Ideas Series on Real Vision. The follow up is behind a paywall, but those with a Real Vision membership can view it here:

The video was originally recorded on May 25, 2023.

Nvidia update Beth Kindig Real Vision interview

Click here to watch videoClick here to watch videoClick here to watch video

As stated in the article, Beth Kindig and I/O Fund currently own shares of NVDA. This is not financial advice. Please consult with your financial advisor in regards to any stocks you buy.

Recommended Readings:

July Positions Report — Essentials

Big Picture

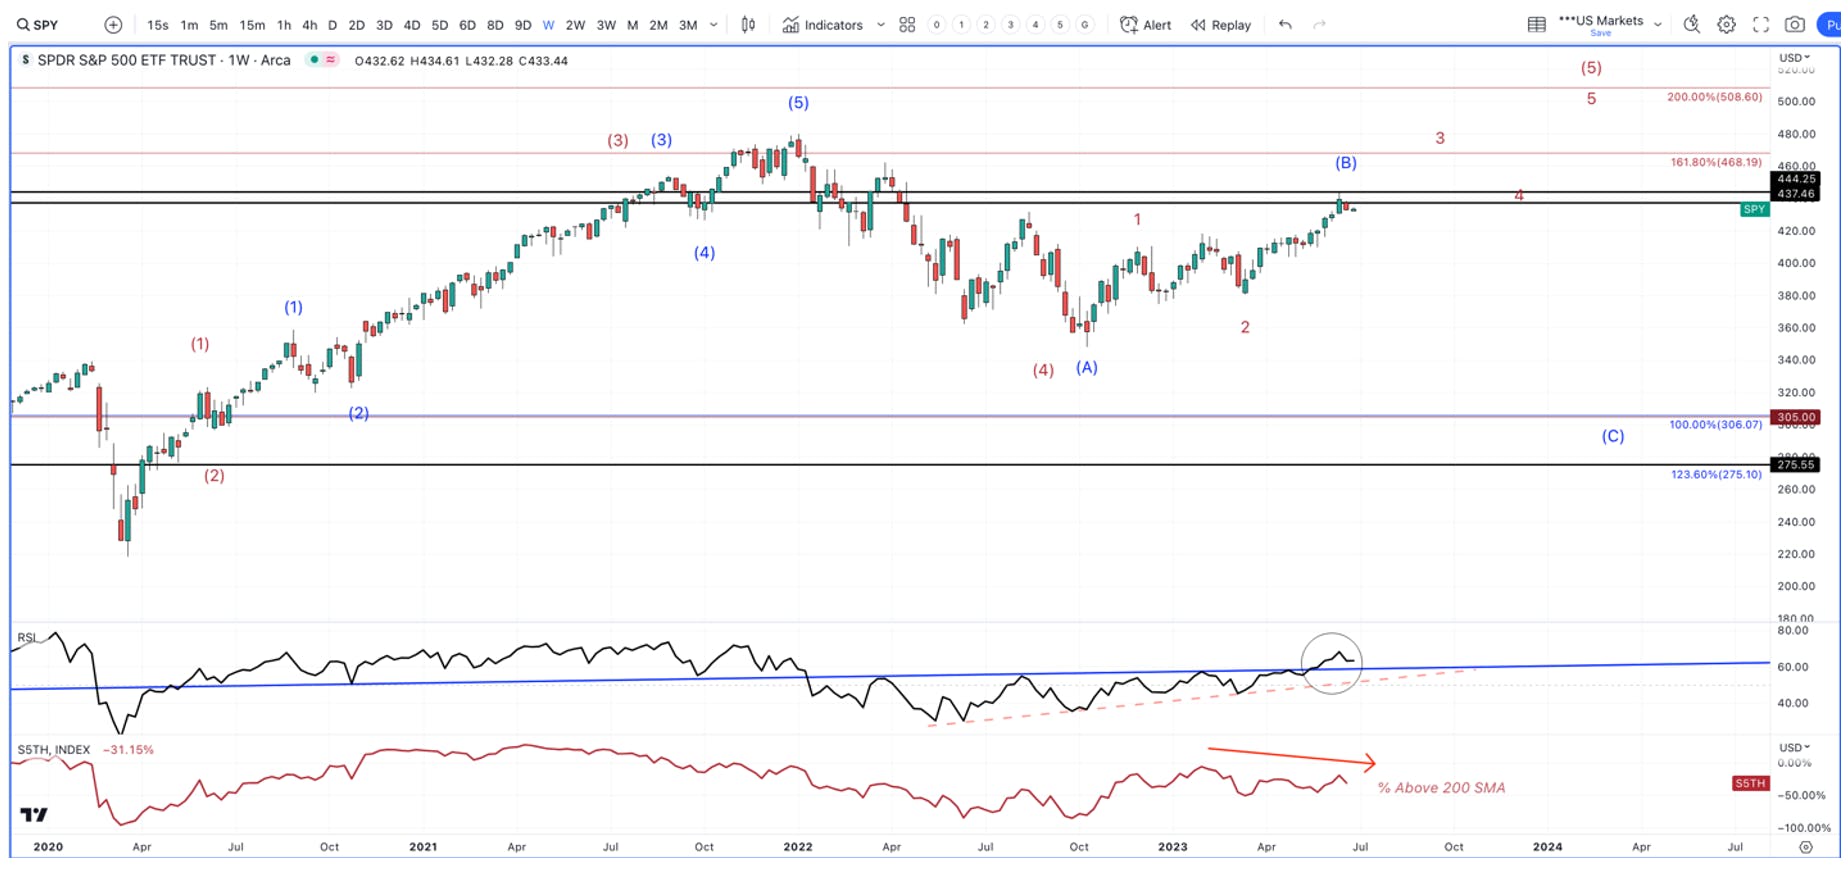
Back in March, we laid out an alternative count that the market could take. In this report, we stated

“Alternative (Red) – We have just completed the 2nd leg within a larger B wave (bear market rally). This will lead to the final 3rd leg of the bear market rally, which is targeting +4400 SPX.”

This count was based on the fact that the market would shrug off the bank failures and push higher into the 4280 – 4420 region before topping out. The market has now powered into this target region, and even punched through the upper boundary of this target zone, momentarily. This recent price action has forced me to alter my current alternative count, which we are starting to risk manage around., which I will discuss below in detail. Here are the most probable paths the market will likely take based on current price action:

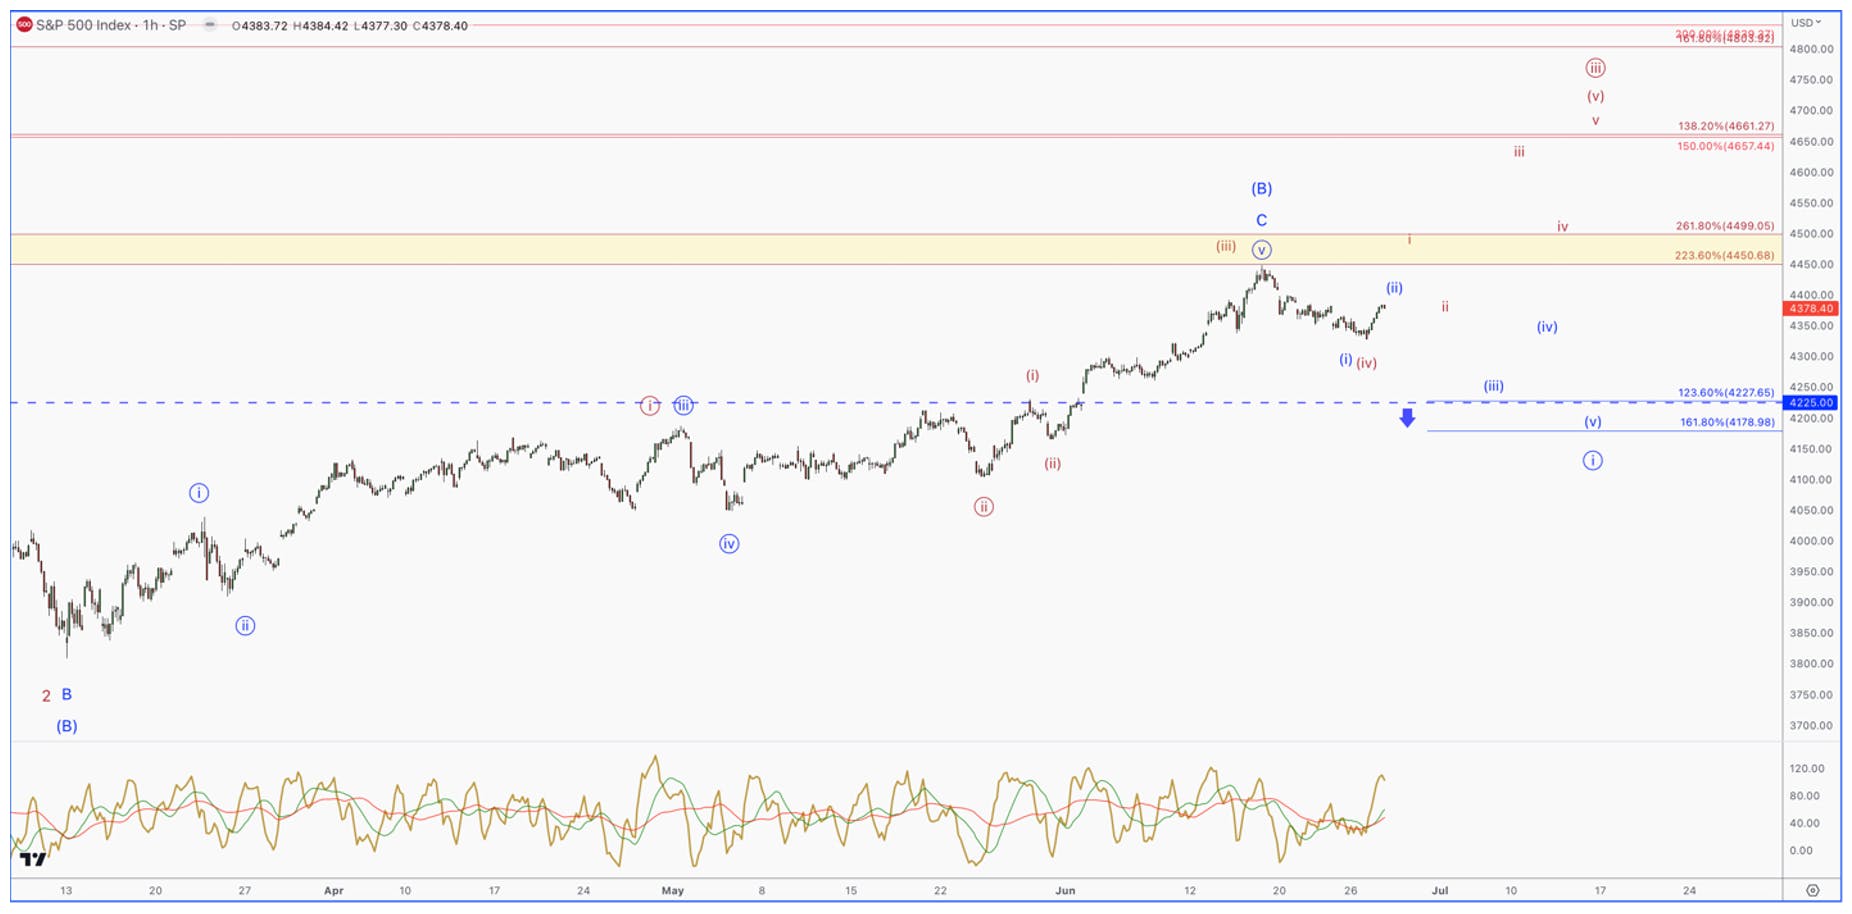
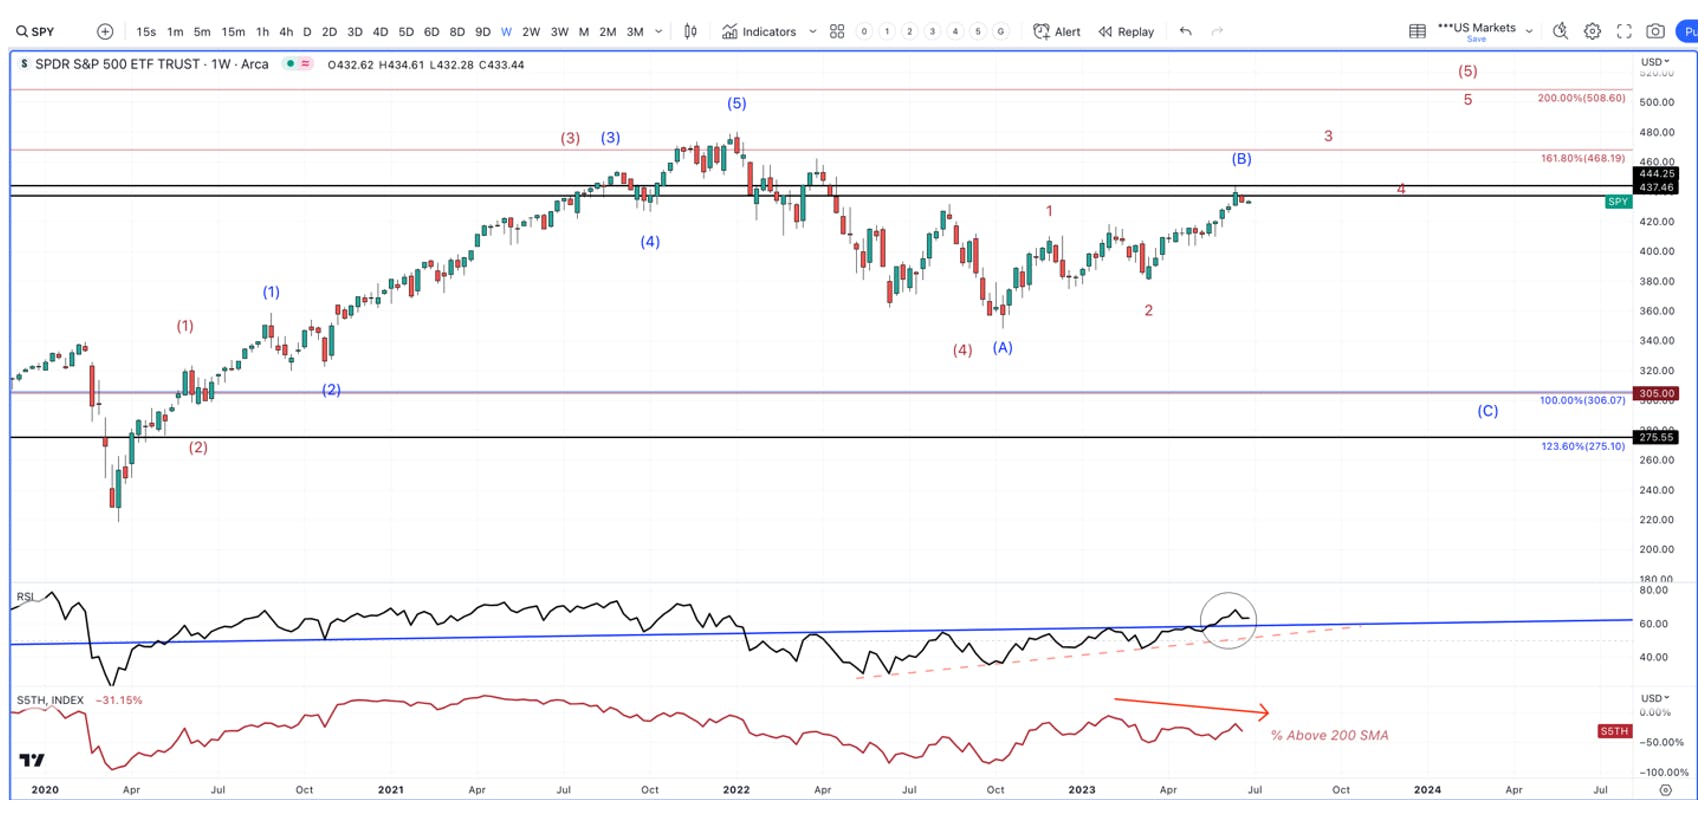
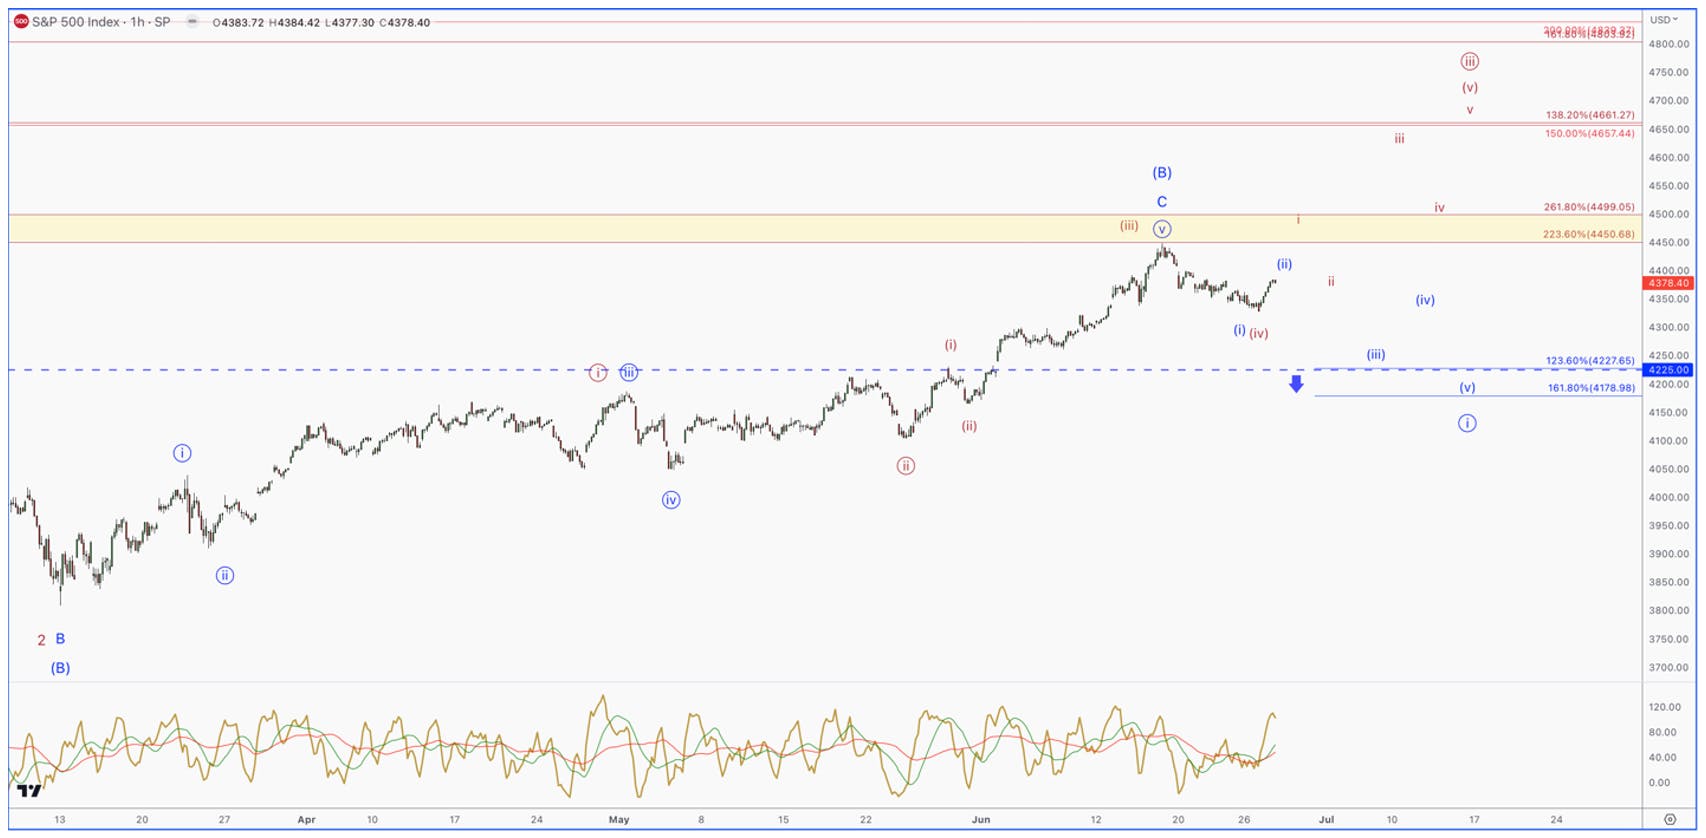
  • Option 1 is noted in Blue below and is my primary count – Corrective Pattern: The biggest tell that this pattern is playing out will be a clear 5 wave drop from current levels that breaks below 4225 SPX.
  • Option 2 is noted in Red below and is my alternative count – We are at the halfway point on a path that will lead to new highs. The biggest tell that this pattern is playing out will be a 3 wave drop that holds 4225, and turns back up to make a fresh high. If confirmed, our targets will be around 5000 SPX.

Breadth is weak and there are other factors that make the Red scenario less probable, for now. On the other hand, price action has moved above our upper target range. As a technical analyst, I have to respect price action.

Major Inflection Point

What will help us determine what count is playing out can be best seen on a smaller time scale.

The brief answer is what happens at 4225 is key. If we see a 5 wave drop that breaks below 4225 SPX, then the odds will start to greatly favor the blue count, and a top being in place. If we see a 3 wave drop that holds above 4225, and then turns back up sharply, then the odds will favor the alternative red count. 

I/O Fund Portfolio

We provide a few samples of our portfolio for Essentials Members. In our Advanced service we offer more in depth and on-going research for the below stocks, as well as many others that make up the I/O Fund portfolio. We also offer real-time trade alerts on when we are buying and selling based on the price targets we identify in advance. You can upgrade to Advanced to get more information on our positions. 

Advanced Micro Device (AMD)

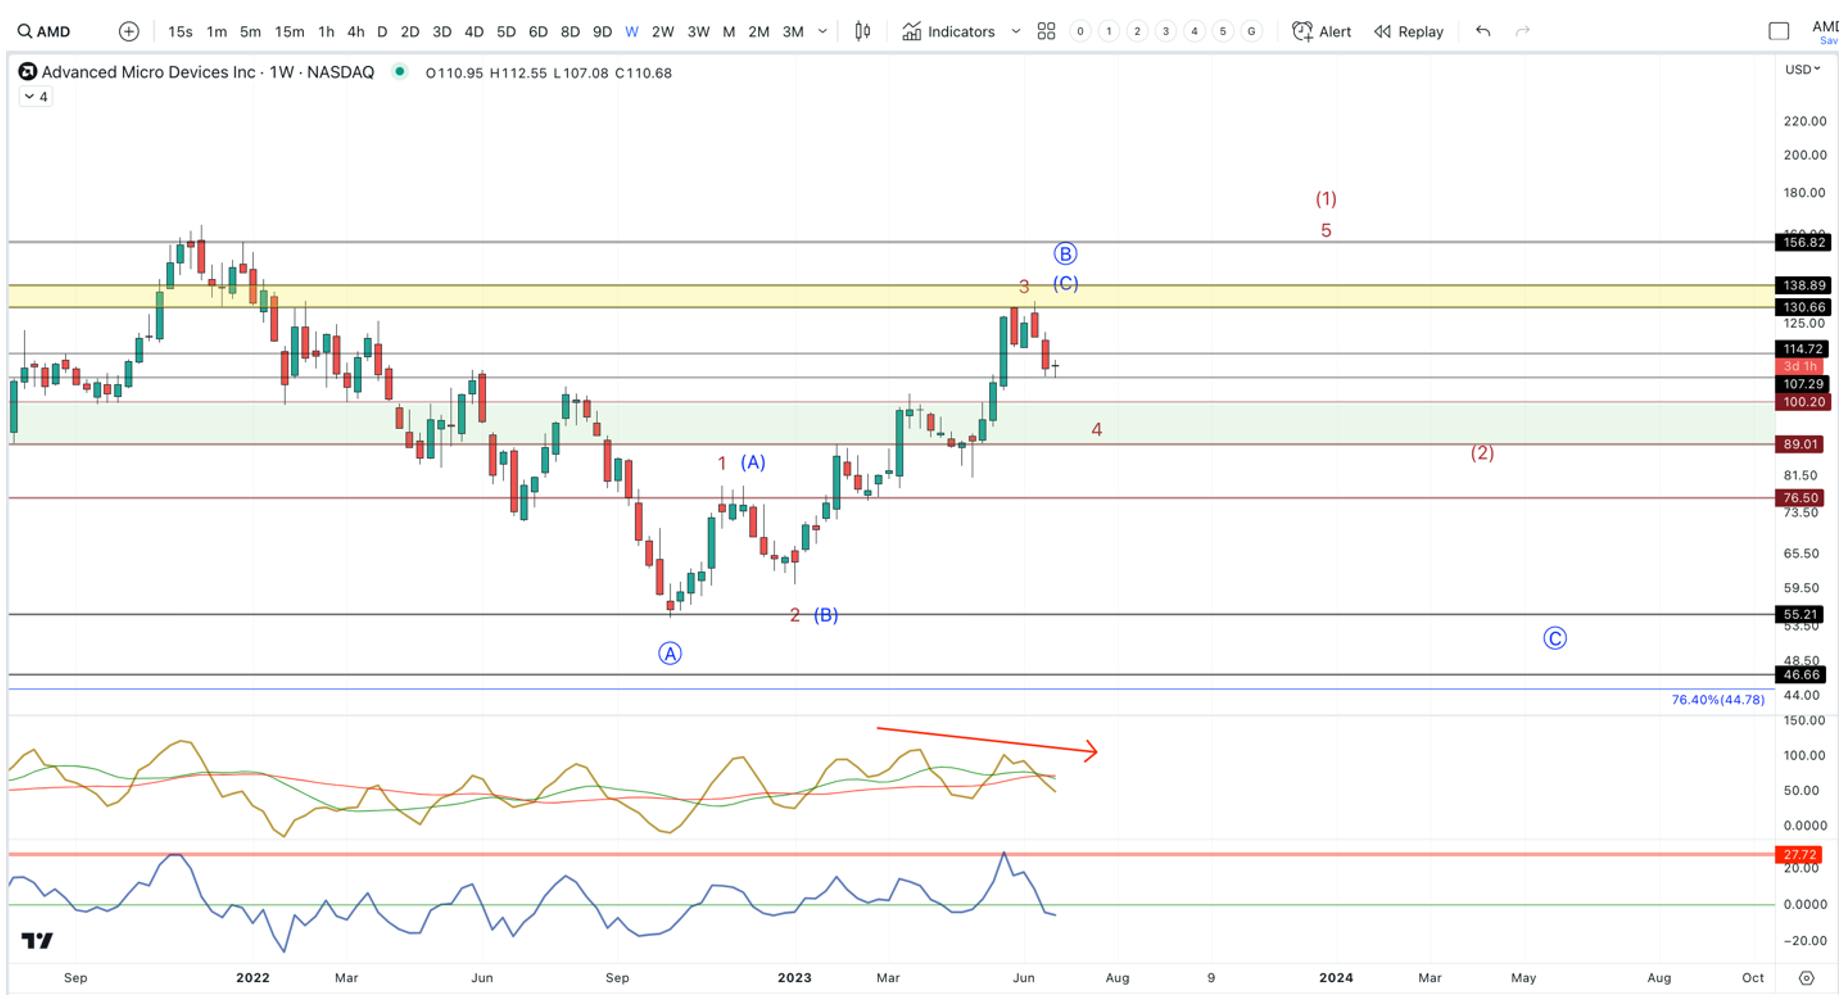
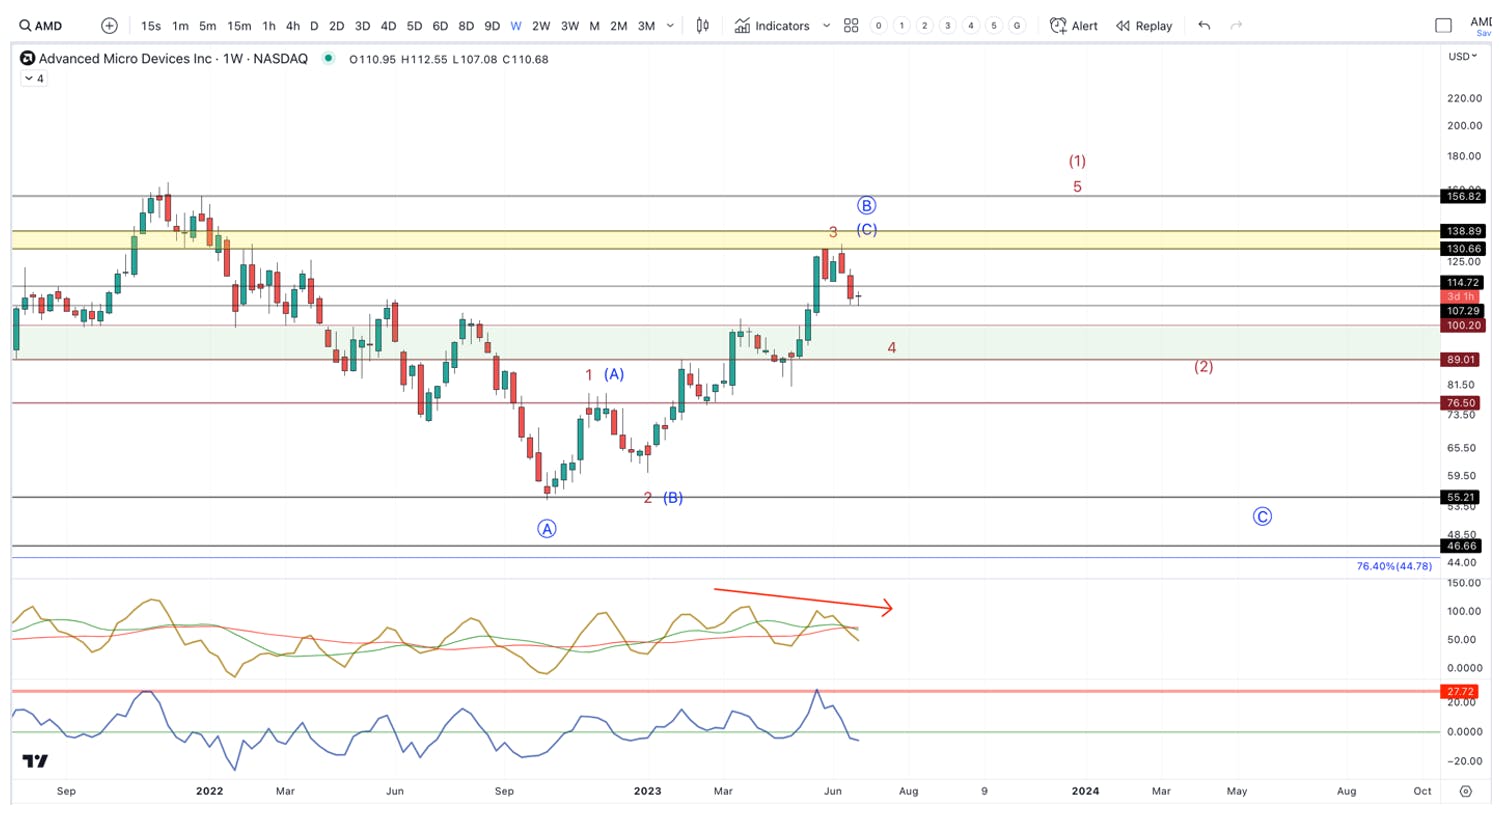
AMD’s uptrend off of the 2022 low is an overlapping pattern that looks corrective. Our red count has this pattern as a large degree leading diagonal as a 1st wave with a large 2nd wave that will likely line up the credit cycle downturn. We’re also moving our upper target to fall in line with what a blow-off would look like. This correction in AMD, so far, looks to be corrective, which supports the red count. AMD has to hold above $88 for a continuation higher.  As long as this holds on any weakness, a push to new highs is expected.

Nvidia (NVDA)

Our blow-off target is in the mid-$550s to low $600s. As long as NVDA stays above $340, this is our expectation. Below $340, and we will start identifying lower levels to target. Also, this little dip, so far, is just not enough to be all of our 4th wave. It should last longer and deeper, which we are using to identify a good buy spot.

Netflix (NFLX)

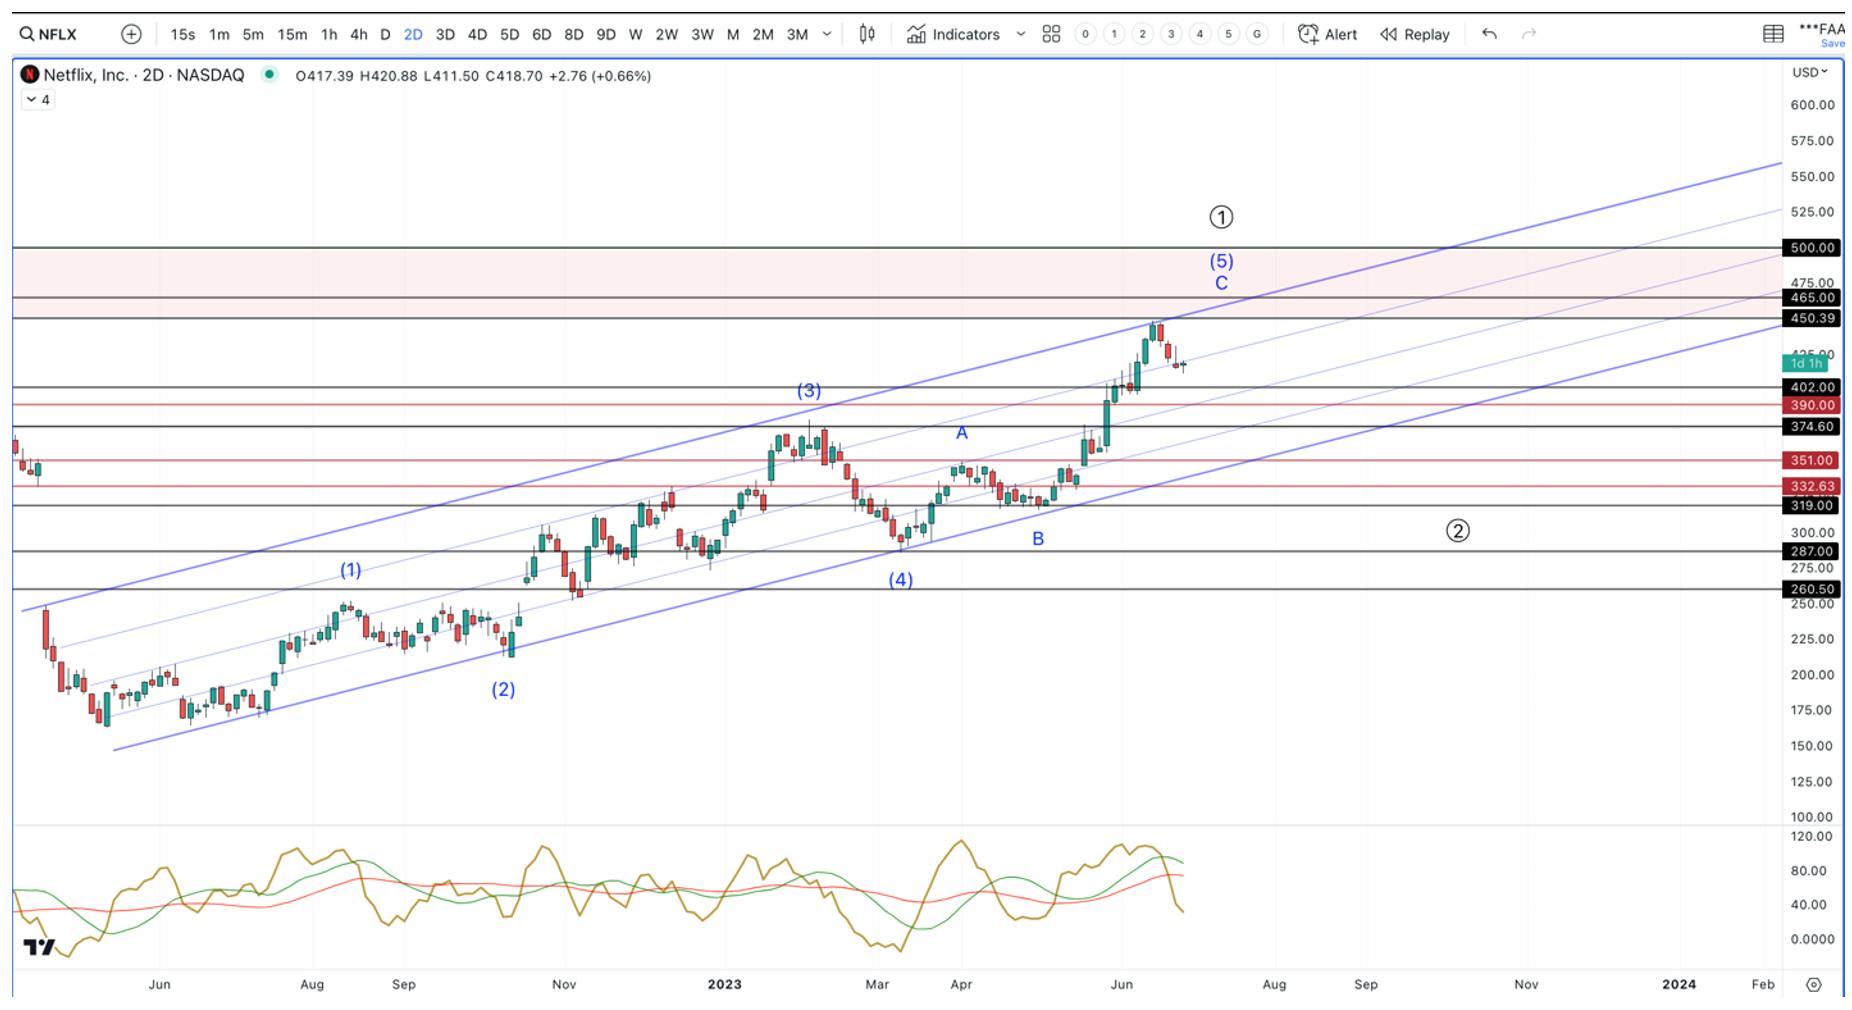
NFLX bottomed many months before the rest of the market in 2022, and has continued higher in what appears to be a very large leading diagonal. The good news is that this move would only be the 1st wave in a very large 5 wave uptrend. The bad news is that we need a large 2nd wave retrace next. We are waiting for this larger 2nd wave to manifest before adding back to our position. Regarding current price levels, as long as any weakness holds $370, then we expect NFLX to make another swing higher into the $450-$500 region. Below $370 and the larger 2nd wave pullback is underway.

Recommended Readings:

July Positions Report

For reference to terminology used, please look at technical analysis under our resources section here. Regarding the horizontal lines, black lines represent strong support/resistance, while dark red lines mark very strong support/resistance.here. Regarding the horizontal lines, black lines represent strong support/resistance, while dark red lines mark very strong support/resistance.

Elliott Wave count are meant to provide context. There is a pattern unfolding in real-time, one of which will play out. By monitoring price levels that are held/broken, it will help us figure out which one is in play

Big Picture

Back in March, we laid out an alternative count that the market could take. In this report, we stated:

“Alternative (Red) – We have just completed the 2nd leg within a larger B wave (bear market rally). This will lead to the final 3rd leg of the bear market rally, which is targeting +4400 SPX.”

This count was based on the fact that the market would shrug off the bank failures and push higher into the 4280 – 4420 region before topping out. The market has now powered into this target region, and even punched through the upper boundary of this target zone, momentarily. Here are the most probable paths the market will likely take next based on current price action:

  • Option 1 is noted in Blue below and is my primary count – Corrective Pattern: The biggest tell that this pattern is playing out will be a clear 5 wave drop from current levels that breaks below 4225 SPX. 
  • Option 2 is noted in Red below and is my alternative count – We are at the halfway point on a path that will lead to new highs. The biggest tell that this pattern is playing out will be a 3 wave drop that holds 4225, and turns back up to make a fresh high. If confirmed, our targets will be around 5000 SPX.

Breadth is weak and there are other factors that make the Red scenario less probable. On the other hand, price action has moved above our upper target range, and in a direct fashion. As a technical analyst, I have to respect price action, which is why we are starting to game plan around the potential for this playing out. 

If our new alternative red count becomes more probable, we will further pivot our portfolio and use our cash to go extra long for a blowoff top. However, as I will discuss in the macro section, there is no liquidity cycle and an impending credit cycle that is likely to be troublesome in the near future. Therefore, I want to be clear on the distinction between a “blow off top” and a “new bull market.” I will be firmly positioned for a blow off top until breadth improves.

This means if the red count is confirmed, you can expect the I/O Fund to move heavily into AI stocks and then we will plan to take gains as the market marches higher. What will invalidate the blow off top and confirm a bull market is if breadth improves. For our purposes, breadth is too weak to go long indefinitely. The time will come for this, but for our investment goals, that time is not now.

Regarding the blue count, which today is my primary expectation (note: this can change quickly and be replaced by the alternate red count), we will hedge to protect our AI positions if the blue count materializes. As you already know, we have been positioning for AI for many years – since 2018. Our plan is to remain in these positions even if a worst-case scenario plays out. The I/O Fund’s hard-won analysisThe I/O Fund’s hard-won analysis points toward AI being the correct microtrend to participate in for our eventual retirement (roughly 10 years from today). It’s easier to hold these positions and put a single hedge on, then remove this single hedge, than to time many entries and exits on stocks we have a very high conviction on.

To review our most up-to-date theses on our I/O Fund portfolio positions, please click here – we highly recommend newer Members browse this list of our previous analysis listed by Portfolio Position. For existing Members, this pinned post will serve as a new table of contents and reference point for the most pertinent thesis for each position we own.To review our most up-to-date theses on our I/O Fund portfolio positions, please click here – we highly recommend newer Members browse this list of our previous analysis listed by Portfolio Position. For existing Members, this pinned post will serve as a new table of contents and reference point for the most pertinent thesis for each position we own.please click here – we highly recommend newer Members browse this list of our previous analysis listed by Portfolio Position. For existing Members, this pinned post will serve as a new table of contents and reference point for the most pertinent thesis for each position we own.

Major Inflection Point

What will help us determine what count is playing out can be best seen on a smaller time scale.

The brief answer is what happens at 4225 is key. If we see a 5 wave drop that breaks below 4225 SPX, then the odds will start to greatly favor the blue count, and a top being in place. If we see a 3 wave drop that holds above 4225, and then turns back up sharply, then the odds will favor the alternative red count.

Supporting Markets

NASDAQ-100 (NDX)

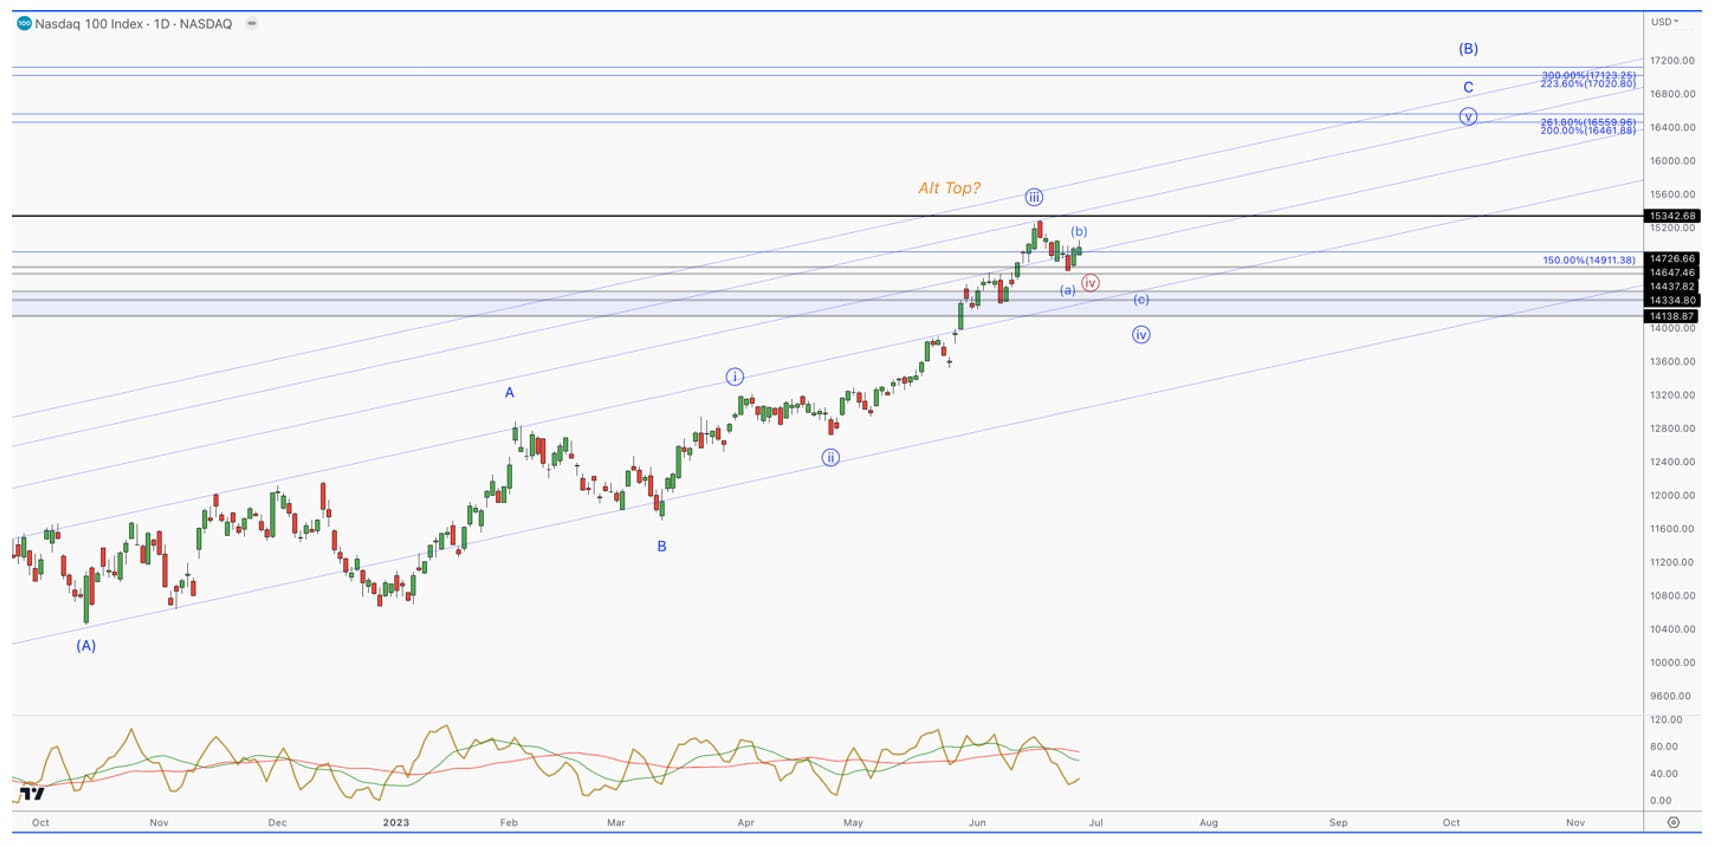
The bifurcation in this market continues, with many stocks and sectors still below their February high, while the NASDAQ-100 took back that high and continued to power higher. Regardless, NDX appears to be in a 4th wave. The question I have is that this all we are going to get before we resume higher in a 5th wave, or will we get one more swing lower?

JapanJapan 

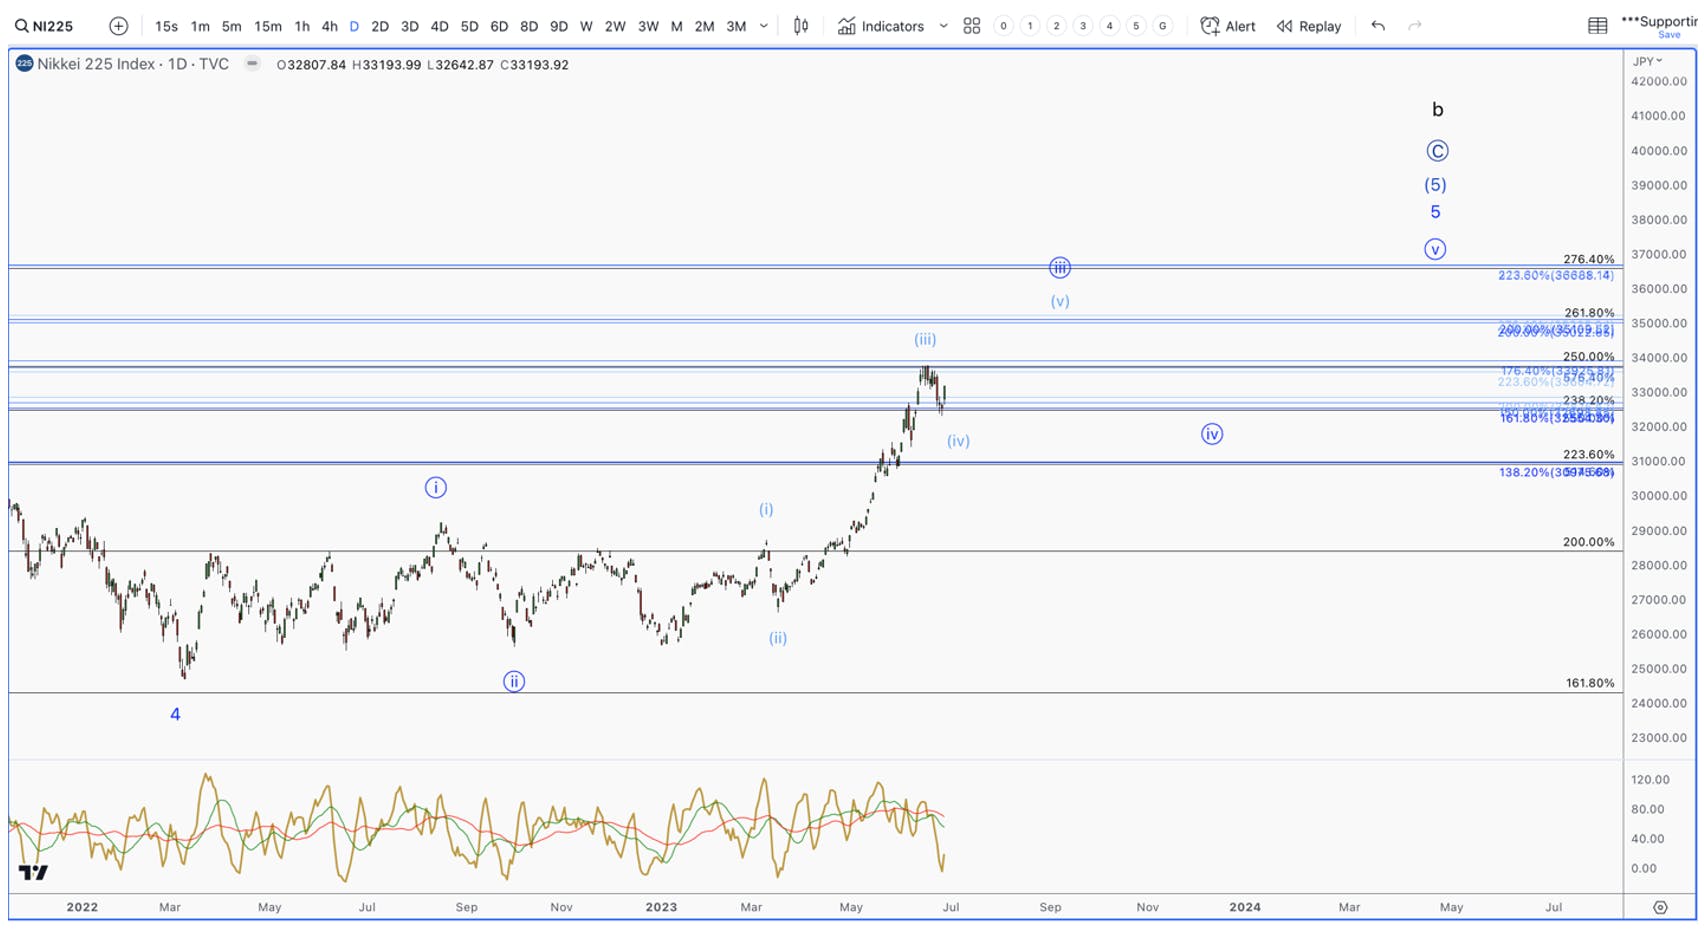
While many global markets are not supporting a long-lasting uptrend, and some, in fact, appear to have topped, we can still see the red count in SPX play out. This is supported by the Nikkei, which has historically led the NASDAQ for many years. The Nikkei looks a lot like the NDX above. 

When we move to the rest of the US market, we continue to see warnings against the narrative that a multi-year bull market is starting. At best, they suggests any continued push higher will likely be a continuation of the same leadership we are seeing now.

Small Caps (IWM)Small Caps (IWM)

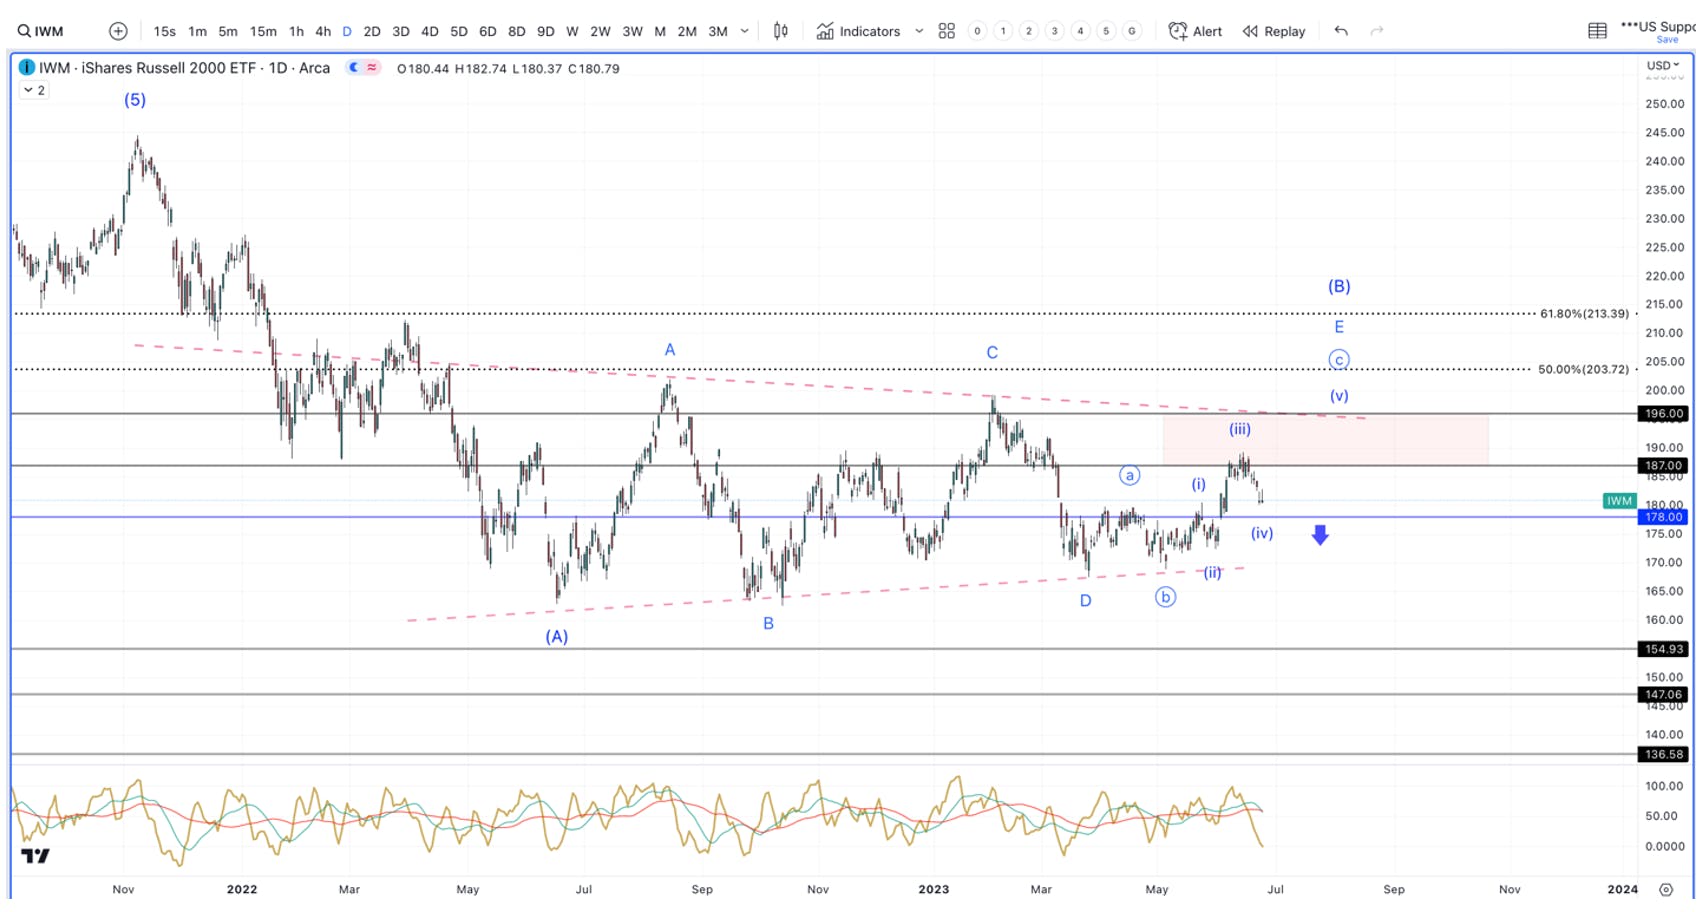
Small Caps are more economically sensitive than large caps who can diversify their revenue across multiple products, as well as geographies. Because of this, we usually see this segment of the market lead us into a bear market and out of one. This is not what we are seeing today. Small caps have remained very weak, relatively, and appear to be tracing a large degree triangle pattern. These patterns are typical in B waves, and once completed, we should see a push to new lows follow. In order to invalidate this pattern, I’d like to see IWM push above $205. If this happens, it could be suggesting a much bigger uptrend is unfolding in the markets.

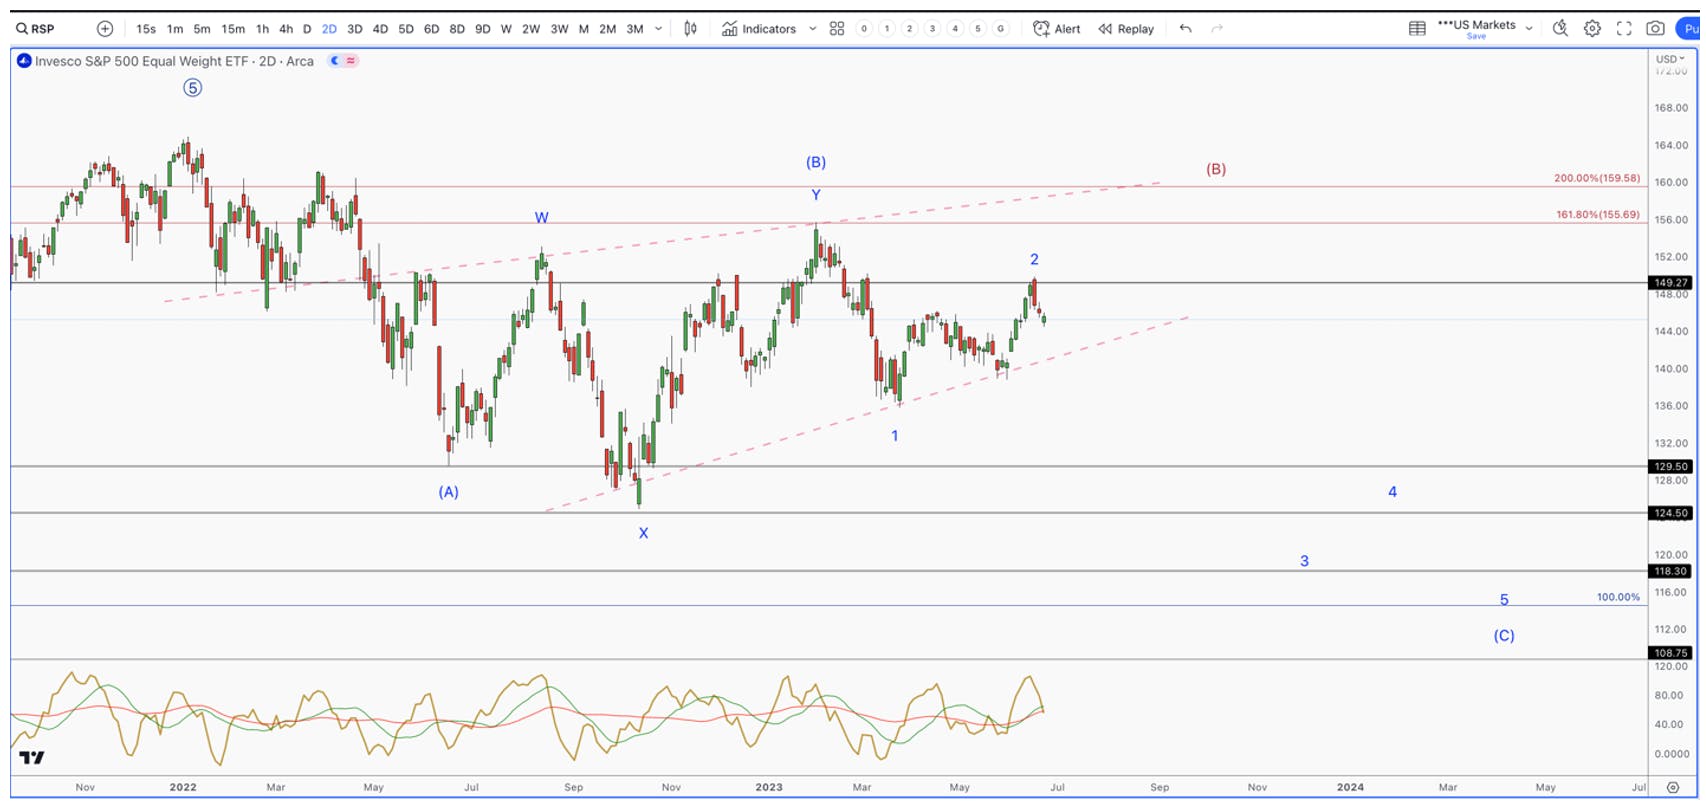
Equal Weight S&P 500 (RSP)Equal Weight S&P 500 (RSP)

There are roughly 8 stocks pushing the S&P 500 higher. Big Tech, especially Big Tech that has a focus in AI, is up significantly this year, while many sectors and stocks outside of tech are between barely up to barley negative. In an expanding economy coupled with an expanding liquidity cycle, your more economically sensitive stocks tend to lead on the way out of a bear market, which is just not the pattern we are seeing in 2023.

Because the equal weighted S&P 500 index gives the same weighting to Apple as it does to stocks like Under Armor and Autozone, it tends to outperform the market cap weighted Index in a healthy economy. For this reason, I tend to focus on this index in the macro environment we are in. Either the equal weighted index will play catch, or Big Tech/AI will eventually stop holding up the market and push lower.

As of now, the equal weighted S&P 500 has a very risky downward setup in place. Note the blue count below. There is a clear 5-wave drop from the February high. This is now being followed by a 3 wave bounce. So, this means waves 1 and 2 pointing down are in place. If RSP can get above $156, then this setup will be invalidated, and it would support the continued push higher.

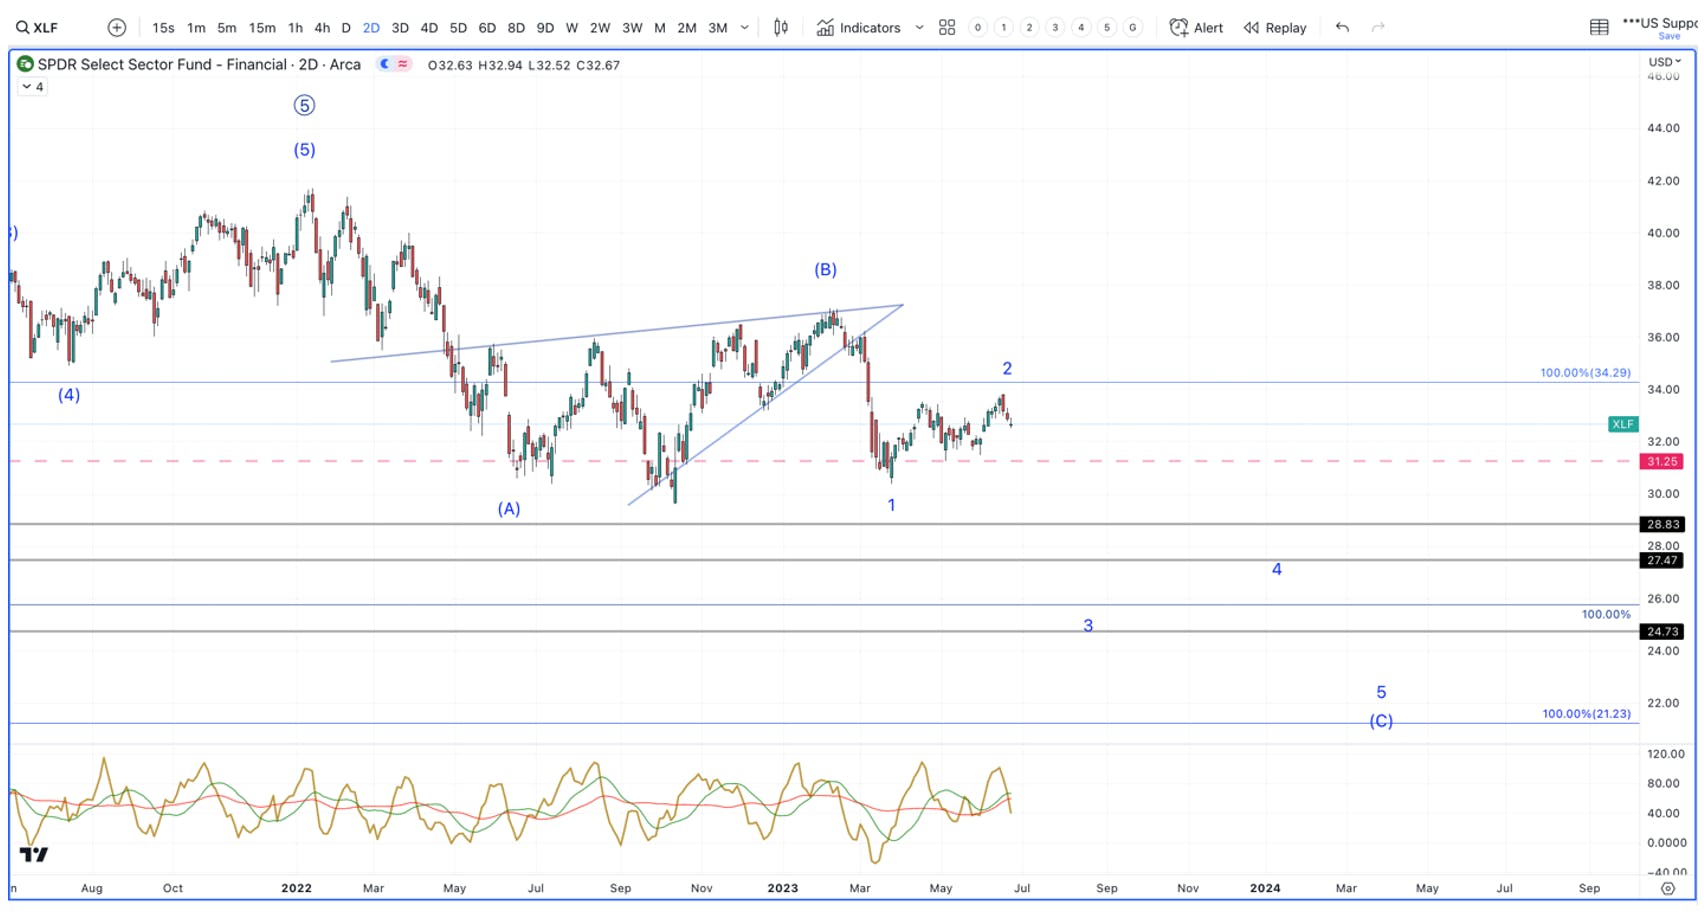
Financials (XLF) 

I continue to believe the forgotten financials sector is leading the market. Like RSP above, note the 5-wave drop from the February high, followed by the clear 3 wave retrace. It also has a the same high risk setup in place. This setup will be confirmed below $31.25. We need to see XLF move above $36 to invalidate this setup, which would also suggest higher levels into late 2023-2024.

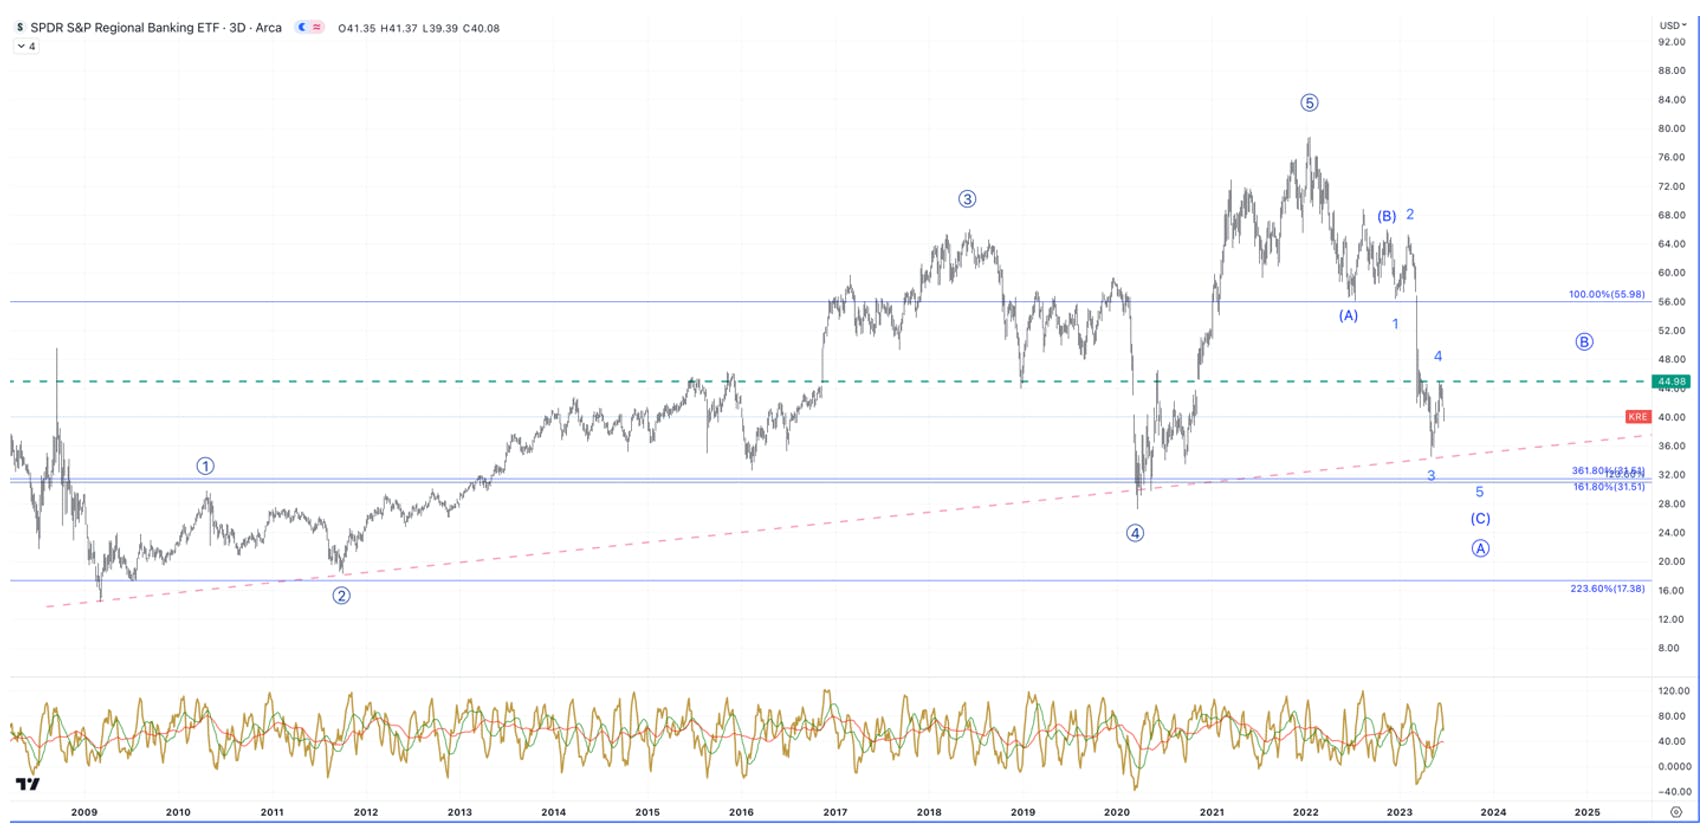
Regional Banks (KRE)

The regional bank ETF is working on what looks like an incomplete downward pattern. If accurate, we just finished the 4th wave and should be starting wave 5. This should break the long-term trend line that started in 2009 before a bigger push higher begins.

Macro

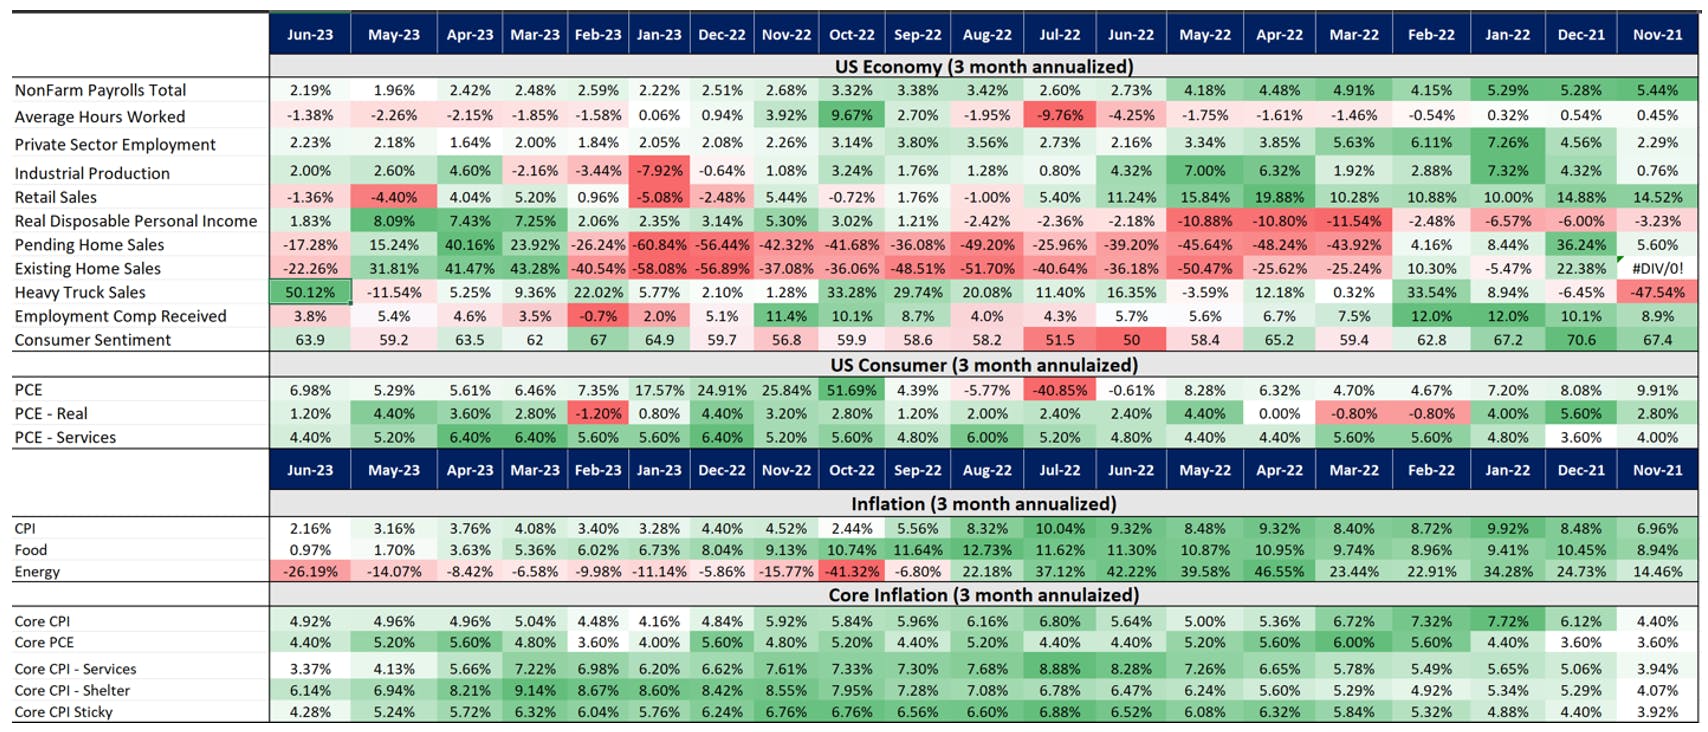
We will position for either the Blue Corrective Count above or the Red more Bullish Count listed above based on what happens during the current pullback. However, with that said, it is our stance that a recession is inevitable due to the fact that strong/stubborn economic growth means strong/stubborn inflation. The chart below compares the 3-month annualized growth in various economic metrics as well as inflation metrics. What’s notable below is that core CPI remains elevated, and have been elevated for over a year at 5%. My thoughts are there will need to be more progress on core CPI if the United States is going to avoid a recession. In fact, going back to the 1940s, the only event that reverses Core CPI has been a recession.

All lasting bull markets have been accompanied with an expansive liquidity cycle. Because core inflation has remained around 5% sequentially for nearly a year, the FED is unable to start this liquidity cycle, and instead is forced to maintain a restrictive liquidity stance. It is likely inflation starts to surprise to the upside again in the second half of 2023, further supporting the need for continued tightening until the economy enters a recession in Q4/Q1.

In the meantime, a lot can happen with equities prior to a recession getting priced into stocks. 

The Bond Market

The market is very forward-looking, and therefore it has rallied in anticipated of a pivot far in advance of the FED’s actual pivot. Based on where inflation is, the FED may not pivot as soon as the market hopes.

The reason for this is that from the FED’s perspective, the bigger risk to the economy is not equities taking another hit, but the FED losing control of the bond market. The last time the FED started a liquidity cycle too soon was in the late 1960s. They lost control of the bond market for over a decade, as rates remained very high due to ongoing inflationary pressures. Higher rates compound into lower growth. This is a much bigger risk to the economy than equities continuing lower, especially with the level of debt in the system.

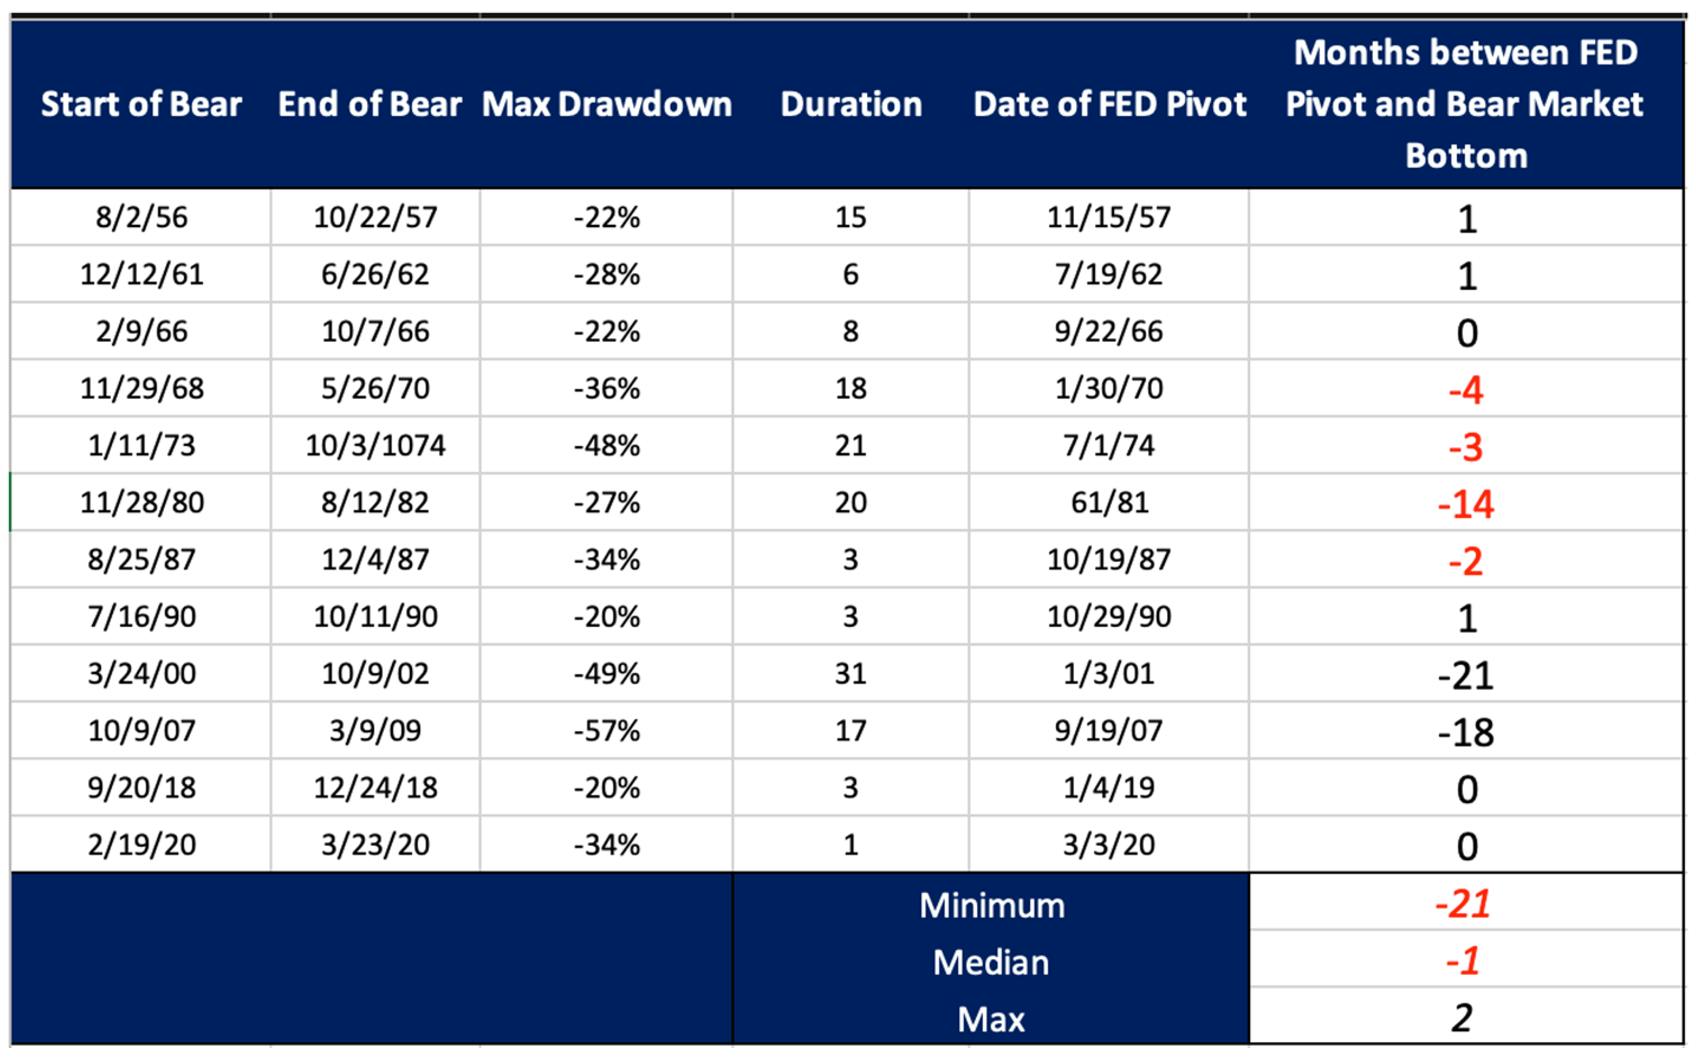
The below chart compares when prior bear markets have bottomed in relation to the FED’s pivot, which is the start of a new liquidity cycle.

What the above chart shows is that when the FED starts a new liquidity cycle, the market tends to bottom within a 1-2 month spread of the actual pivot. There are instances where the FED’s pivot is not enough to offset the credit cycle within the recession, like in 2008, 2001, and 1981, and a bottom isn’t found in equities until the credit cycle ends. However, there is no instance in time where the market bottoms more than 1 month from the FED’s pivot, which starts a new liquidity cycle. 

For there to be a new bull market, the market would have had to bottom +8 months before a FED pivot. Per the data above, this would be an extreme statistical outlier that has not occurred at any time in the past.

From my perspective, the more likely scenario is that the due to the speed of the hikes, it has taken longer than normal to filter into the economy. We do not believe an upcoming rally will mark a new bull market, so some of our long positions will have stops while other long positions will be geared only toward our highest convictions. Notably, our highest convictions have been and will continue to be AI-related where demand is much healthier than the weak pockets in tech.

I/O Fund Portfolio

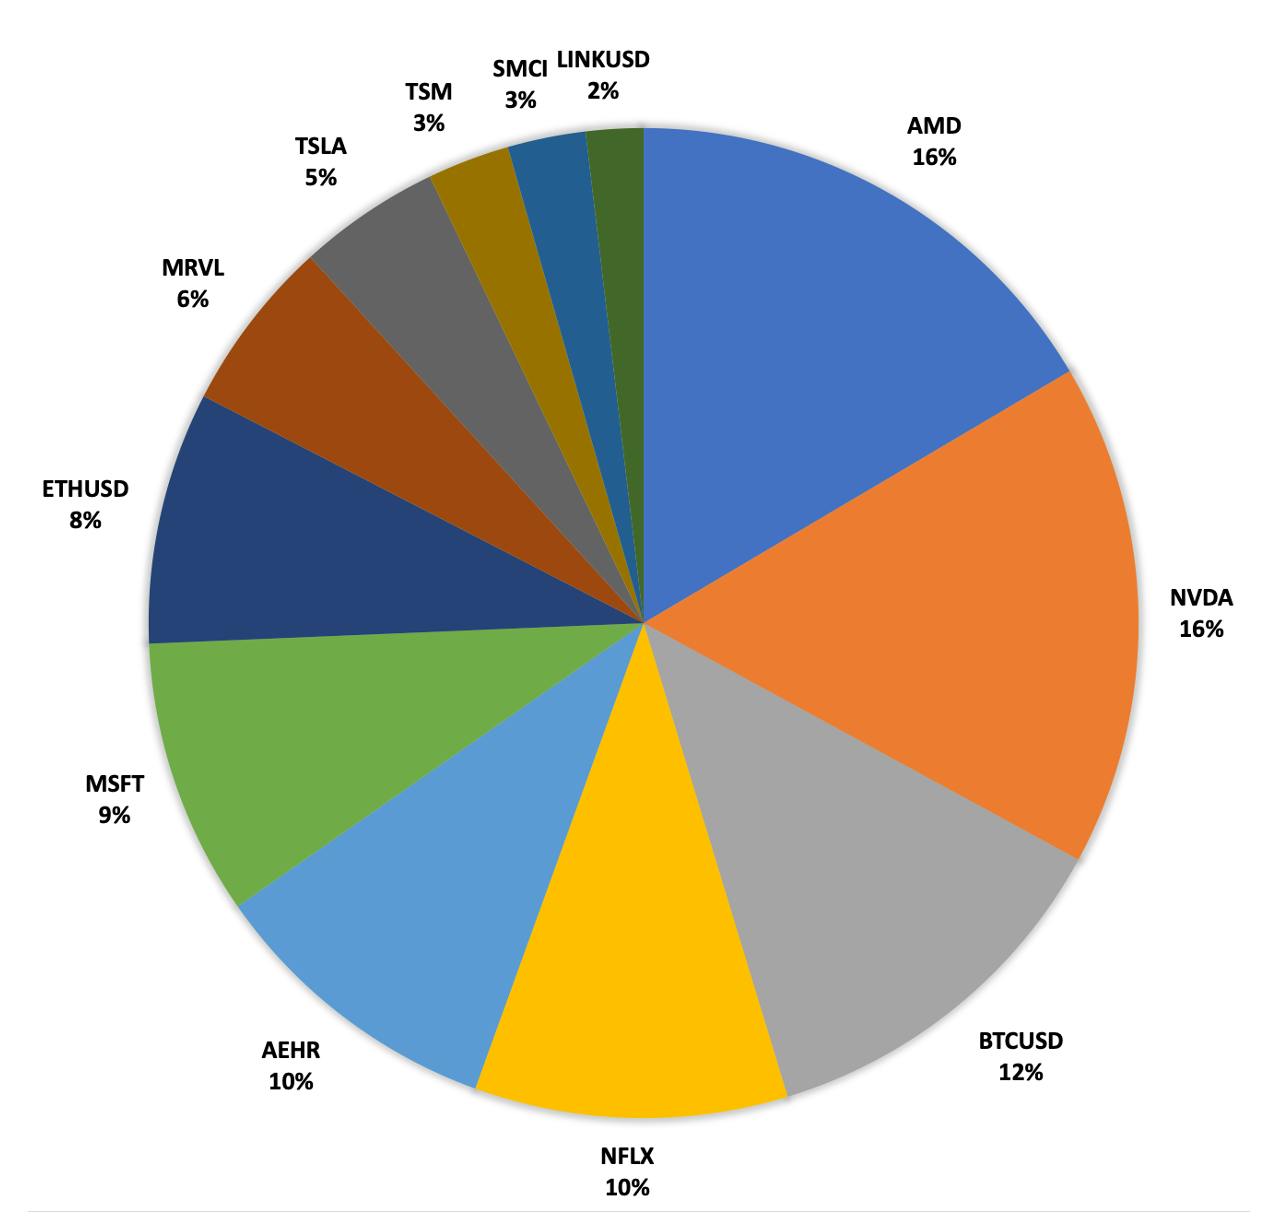
We have added some of our cash back into the market. We recently sold ENPH and trimmed NFLX, then waited for weakness and added those funds to our AI portfolio – SMCI, AMD, MRVL. We are also targeting NVDA, AEHR and GOOGL.

Advanced Micro Device (AMD)Advanced Micro Device (AMD)

AMD’s uptrend off of the 2022 low is an overlapping pattern that looks corrective. Our red count has this pattern as a large degree leading diagonal as a 1st wave with a large 2nd wave that will likely line up the credit cycle downturn. We’re also moving our upper target to fall in line with what a blow-off would look like. This correction in AMD, so far, looks to be corrective, which supports the red count. AMD has to hold above $88 for a continuation higher.  As long as this holds on any weakness, a push to new highs is expected.

Nvidia (NVDA) Nvidia (NVDA) 

Our blow-off target is in the mid-$550s to low $600s. As long as NVDA stays above $340, this is our expectation. Below $340, and we will start identifying lower levels to target. Also, this little dip, so far, is just not enough to be all of our 4th wave. It should last longer and deeper, which we are using to identify a good buy spot.

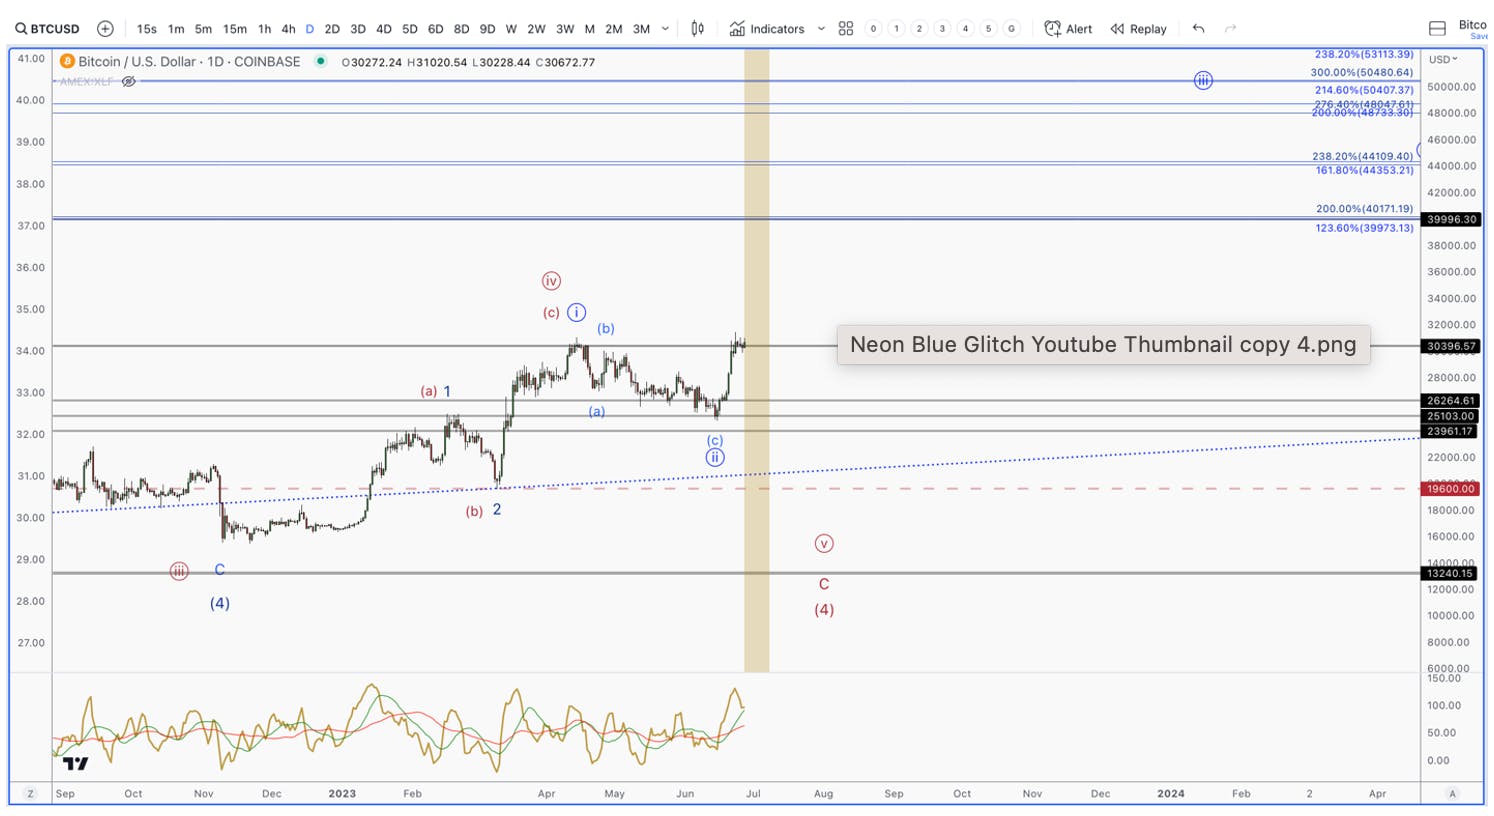
Bitcoin (BTCUSD)Bitcoin (BTCUSD)

It’s do-or-die time for Bitcoin. We bought at the lows on this dip, and price is now consolidating at the highs. For this to be a 3rd wave, we need to see a very sharp move higher from here. Until then, we are leaving the red count on the board. $19,600 continues to be the critical support for our bullish blue count.

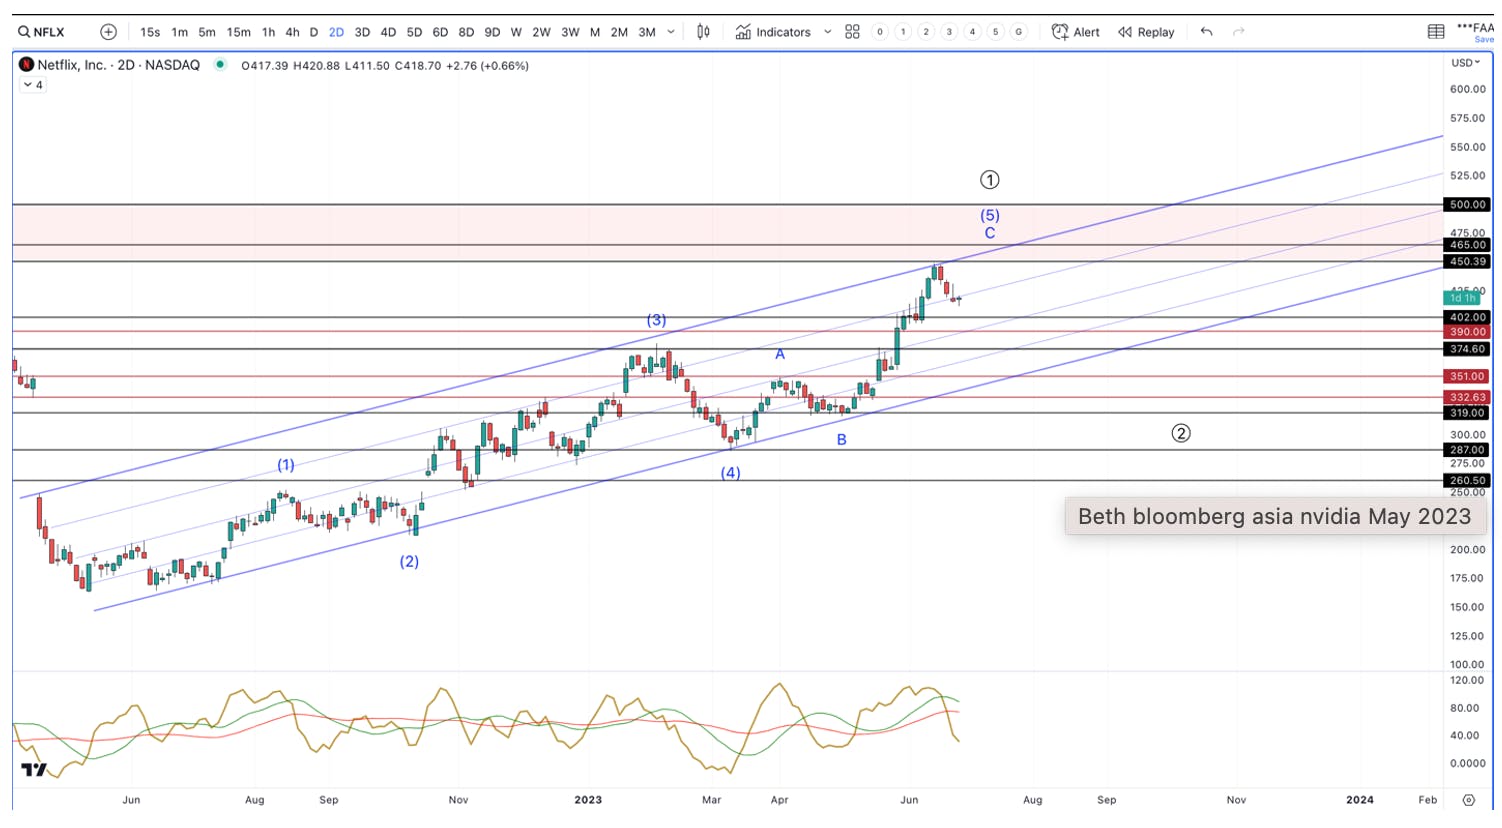
Netflix (NFLX)Netflix (NFLX) 

NFLX bottomed many months before the rest of the market in 2022, and has continued higher in what appears to be a very large leading diagonal. The good news is that this move would only be the 1st wave in a very large 5 wave uptrend. The bad news is that we need a large 2nd wave retrace next. We are waiting for this larger 2nd wave to manifest before adding back to our position. Regarding current price levels, as long as any weakness holds $370, then we expect NFLX to make another swing higher into the $450-$500 region. Below $370 and the larger 2nd wave pullback is underway.

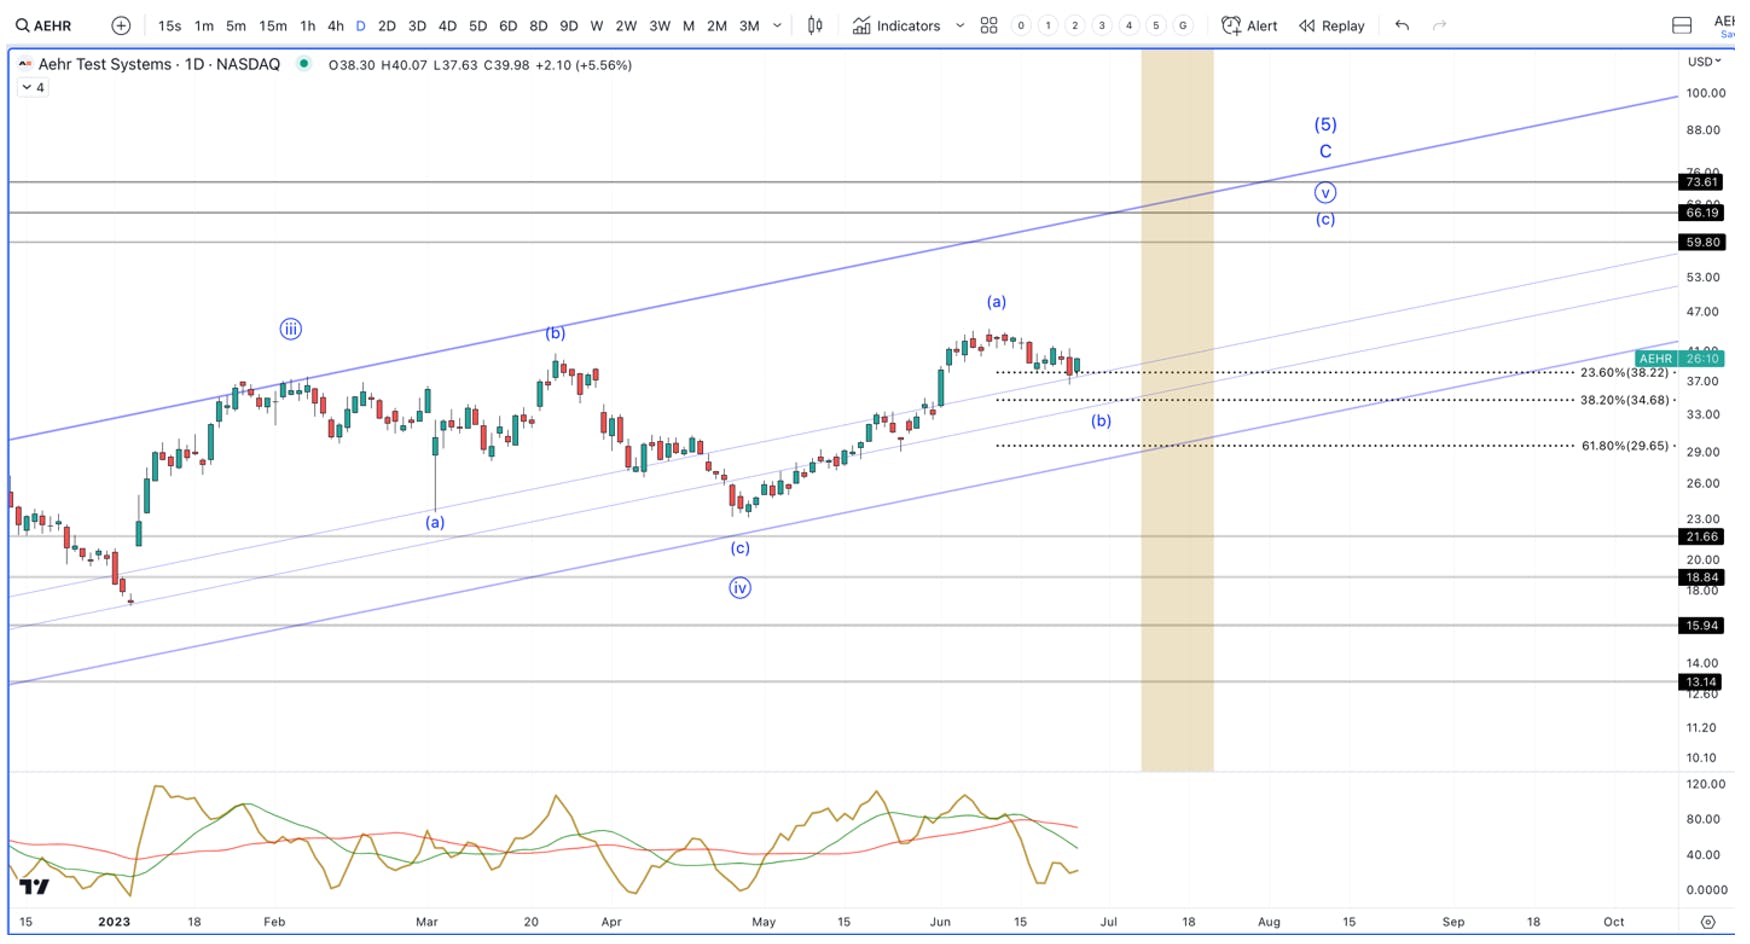
Aehr Test Systems (AEHR)Aehr Test Systems (AEHR)

The fundamentals and techncials seem to be at odds on AEHR. While I have us moving towards a larger top, the fundamentals suggest AEHR could take off from current levels and never look back. When this happens, we tend to lean into the fundamentals. Technically, we appear to be in a small b wave that could see one more low into the high-mid $30 before resuming up. If we see this, we will add. On the other hand, if AEHR punches above $42, it will signal a break out buy for us, as we start to target the $58 region next. If AEHR breaks below $29, then the odds of this swing higher will go down and we could be looking at a bigger top taking shape.

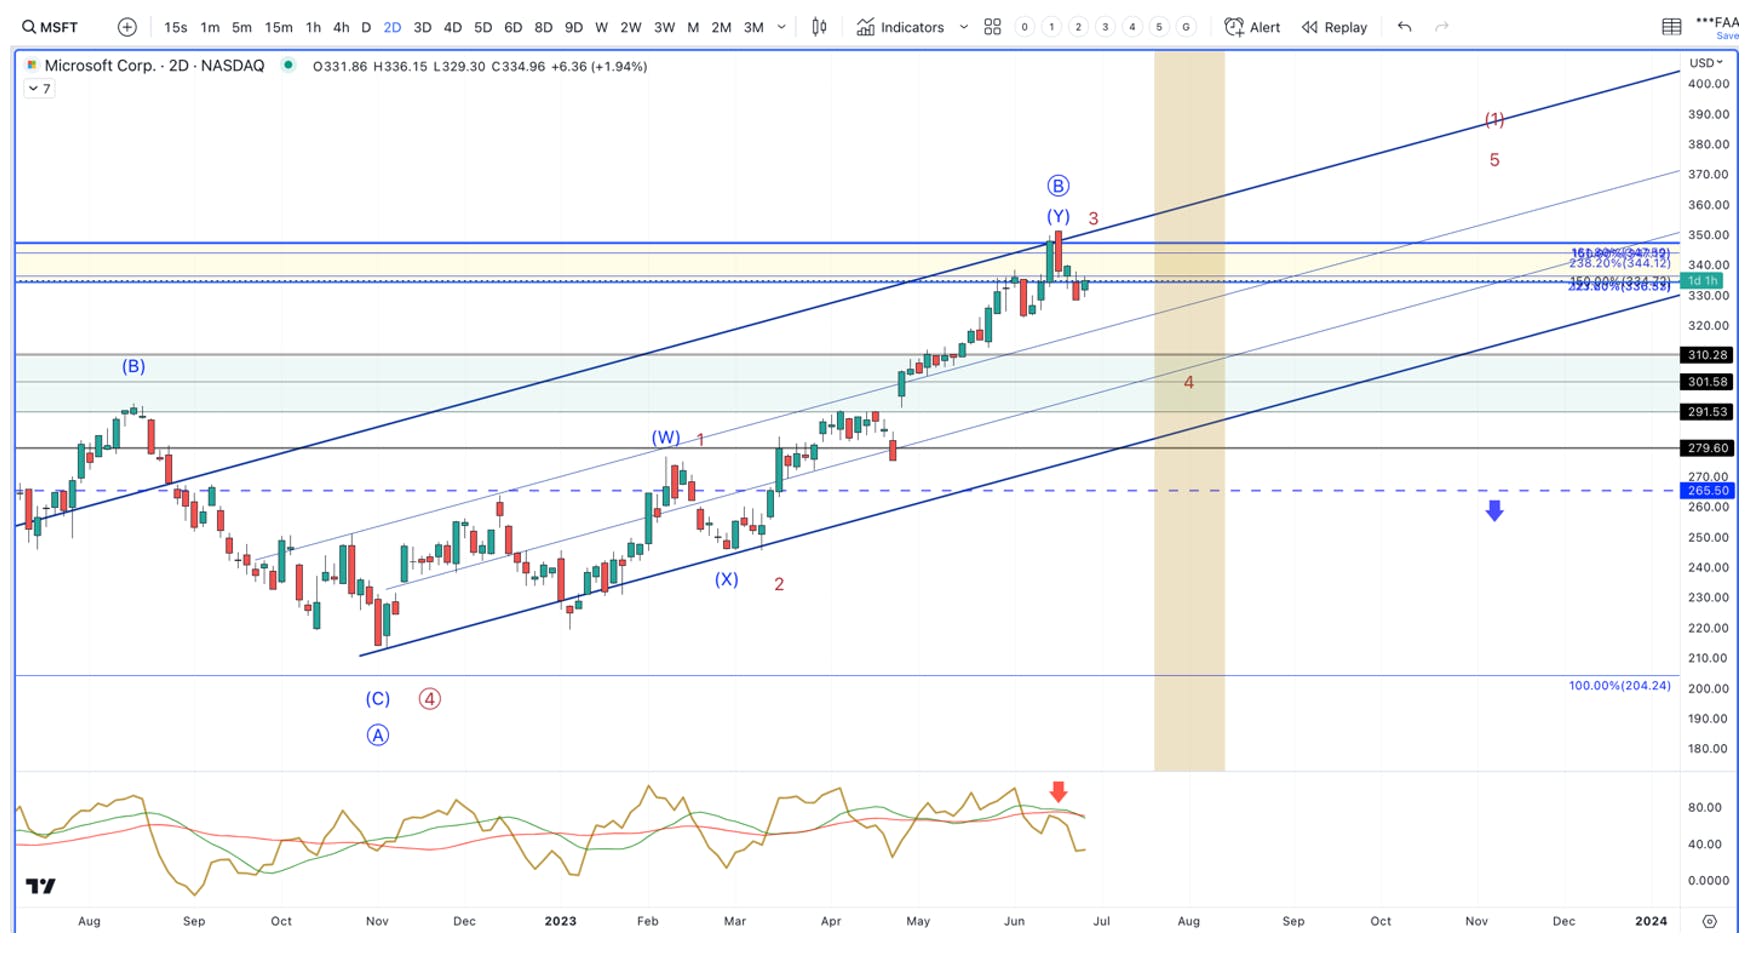
Microsoft (MSFT)Microsoft (MSFT)

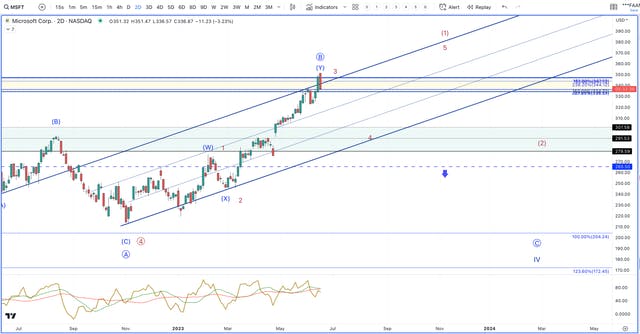
We’re raising the target box for MSFT. Like many stocks, the current dip is too small to be the 4th wave we are looking for. If we get one more high, it will likely be setting up for a bigger drop into the summer, which would be buyable. If MSFT breaks below $322, then the larger pullback is underway, and we will target $310-$290. If MSFT does see this deeper pullback and then makes one more high, the low is likely in, and we will be expect a higher low in the coming credit cycle.

Ethereum (ETHUSD)Ethereum (ETHUSD)

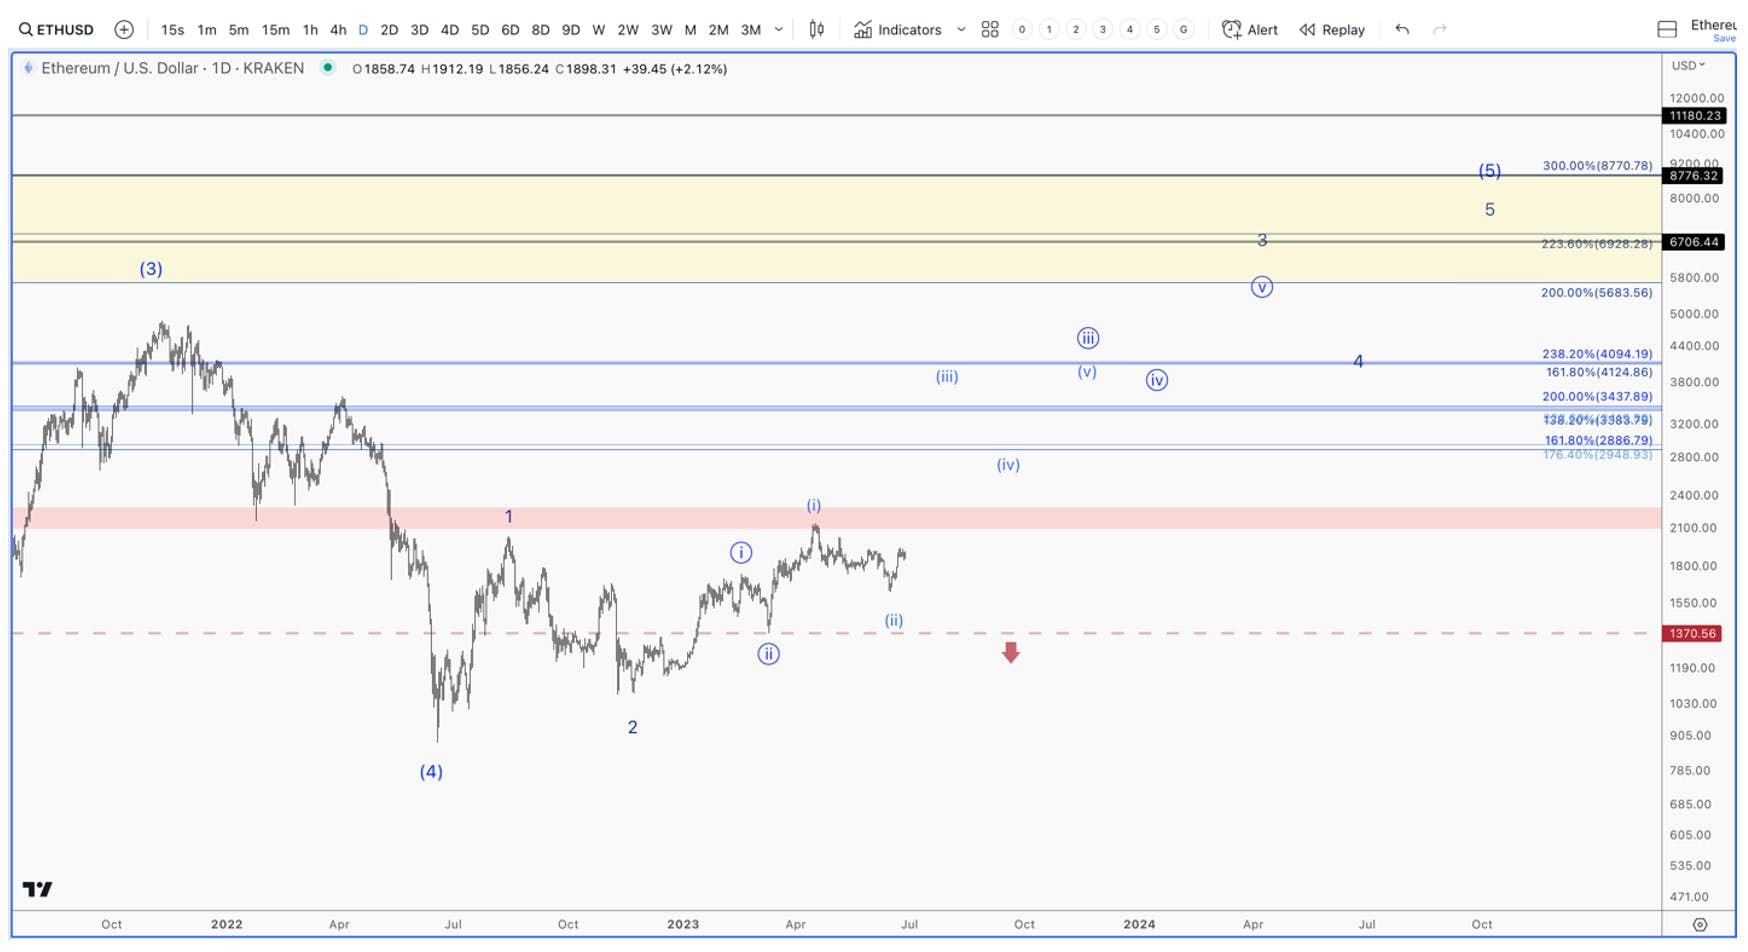
In the bigger picture, ETHUSD is moving in lockstep with Bitcoin. This is not true for most alt-coins. On a smaller time frame, ETHUSD is diverging from BTCUSD. Note how ETHUSD is not as close to making a new high as Bitcoin is. We really need to see both ETHUSD and BTCUSD move sharply higher above their April highs to confirm our bullish count. If Ethereum instead breaks below $1370, we could be setting up for fresh lows.

Marvell (MRVL)Marvell (MRVL)

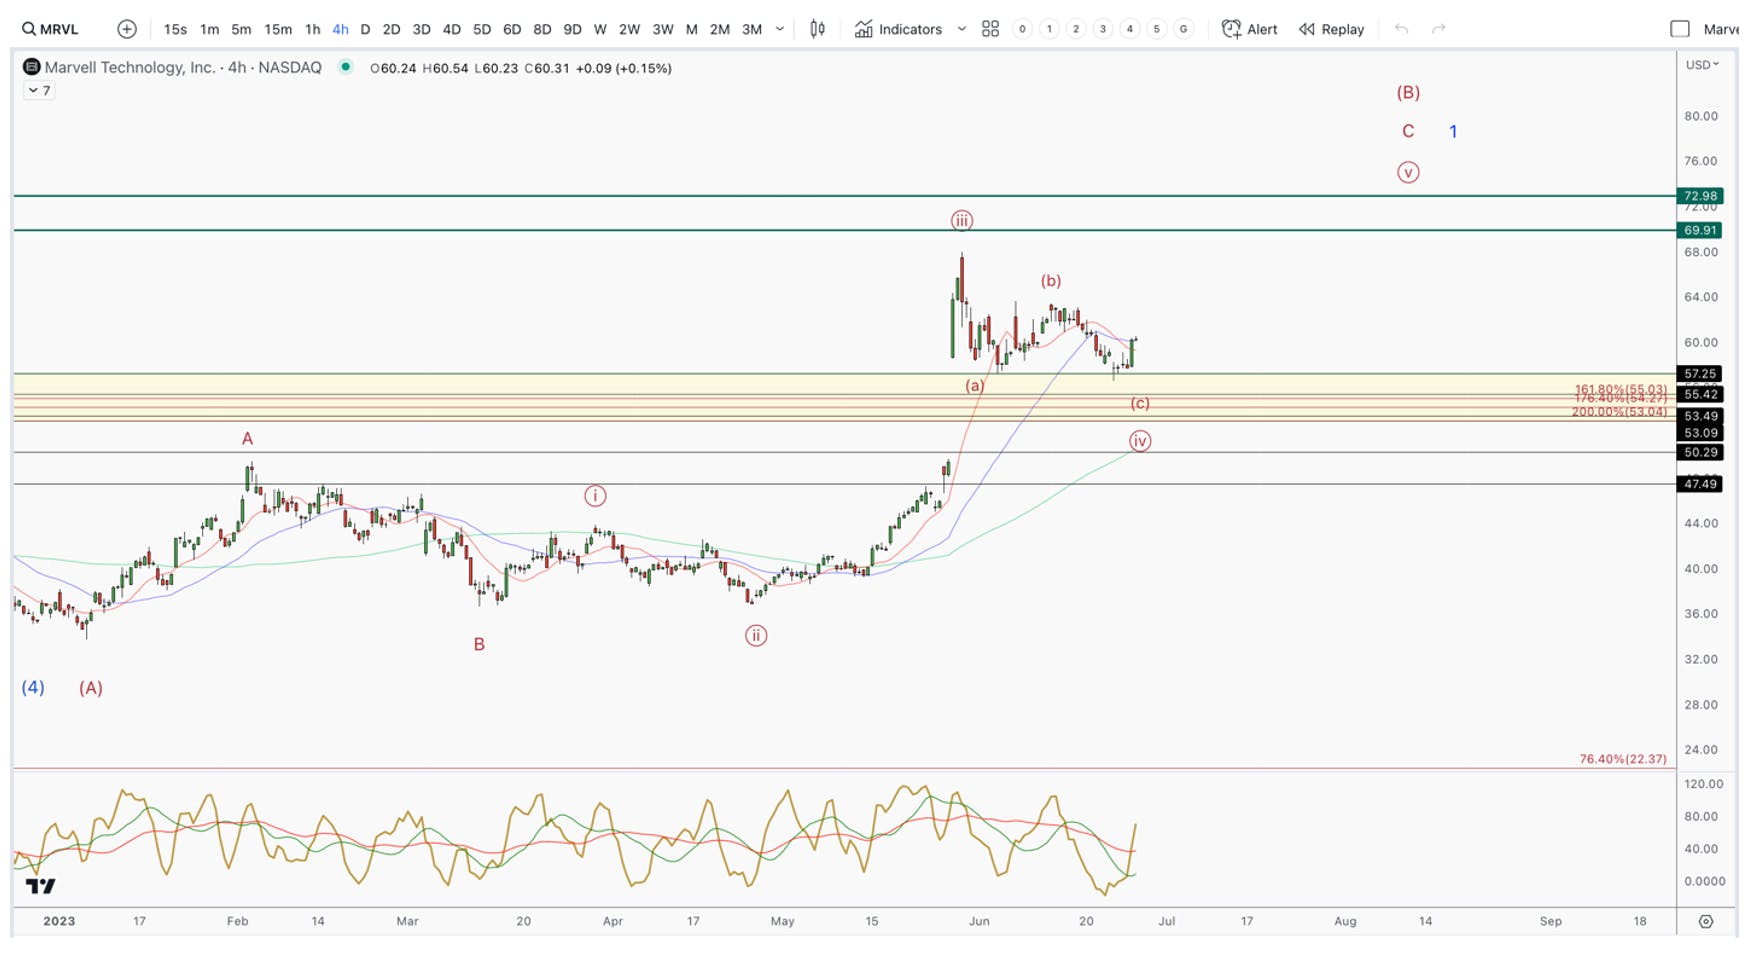
So far, we caught MRVL at the recent lows, as it appears to be setting up for another swing higher. Also, worth noting, the 3rd and 8th largest trades in MRVL’s history also happened around the levels we recently bought. This supports our general thesis about AI and specific thesis regarding MRVL. As long as MRVL holds above $50, we expect this uptrend to continue.

Tesla (TSLA)Tesla (TSLA)

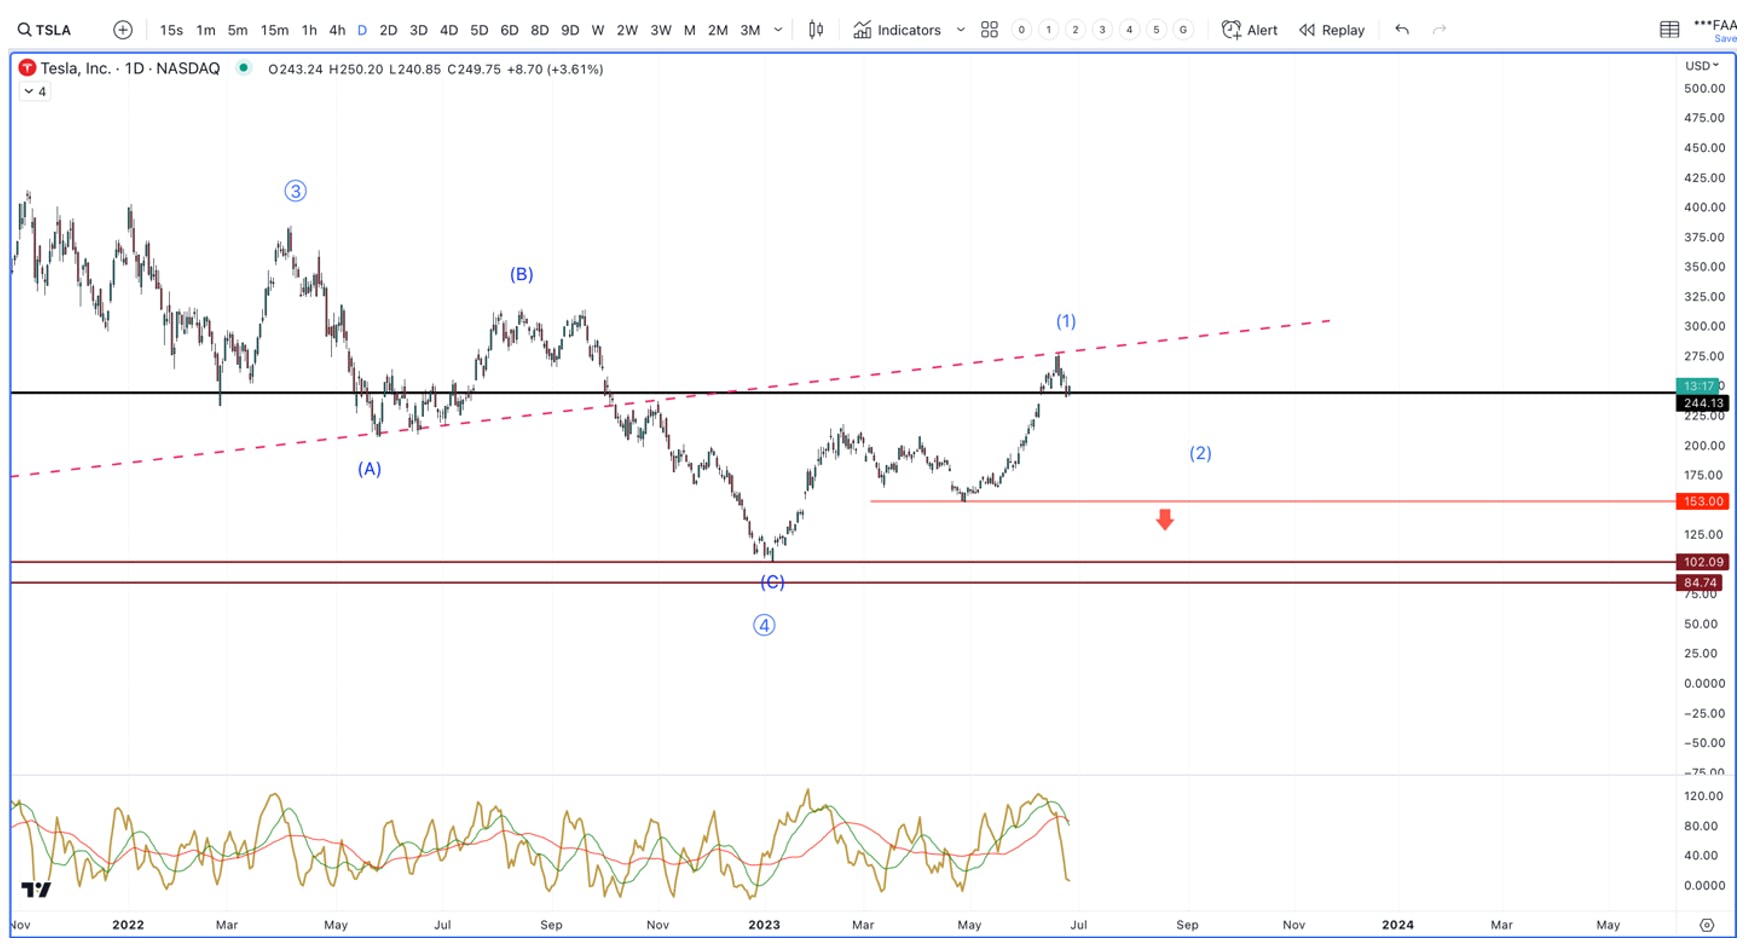
TSLA is shrugging off its earnings report and participating in the AI trend. What concerns me is that the move off the low is a clear 3 wave move. This tends to suggest a corrective move in a larger downtrend. So, if the next bigger drop that is coming is also a 3 wave move down, it could be setting a potential buy. If it is a 5 wave move down, then our original targets sub-$100 will come back into play.

Taiwan Semiconductor (TSM)Taiwan Semiconductor (TSM)

TSM’s pattern off of the October low appears to be corrective. Note the overlapping uptrend. As long as TSM holds $81, we expect to see a continued push into the $120-$138 region. Below $81 and a bigger top is in.

Super Micro (SMCI)Super Micro (SMCI)

SMCI is avoiding the obvious head and shoulders pattern, so far. When these patterns fail, they lead to sharp rebounds. We added some at the neckline and will add the rest on a breakout or a breakdown. If we see a further breakdown, below $215, then the $191 price will be the region we plan to buy. If our bullish count is validated, $325 is not an unreasonable target for the next swing higher.

Chainlink (LINKUSD)Chainlink (LINKUSD)

Not much to add. We saw a breakdown below the critical support zone with a moderate rebound. I expect us to hit $3.5, which is where we are targeting our next buy. I won’t consider the low being in as long as we stay below $9.6

Recommended Readings:

July Positions Report

For reference to terminology used, please look at technical analysis under our resources section here. Regarding the horizontal lines, black lines represent strong support/resistance, while dark red lines mark very strong support/resistance.here. Regarding the horizontal lines, black lines represent strong support/resistance, while dark red lines mark very strong support/resistance.

Elliott Wave count are meant to provide context. There is a pattern unfolding in real-time, one of which will play out. By monitoring price levels that are held/broken, it will help us figure out which one is in play

Big Picture

Back in March, we laid out an alternative count that the market could take. In this report, we stated:

“Alternative (Red) – We have just completed the 2nd leg within a larger B wave (bear market rally). This will lead to the final 3rd leg of the bear market rally, which is targeting +4400 SPX.”

This count was based on the fact that the market would shrug off the bank failures and push higher into the 4280 – 4420 region before topping out. The market has now powered into this target region, and even punched through the upper boundary of this target zone, momentarily. Here are the most probable paths the market will likely take next based on current price action:

  • Option 1 is noted in Blue below and is my primary count – Corrective Pattern: The biggest tell that this pattern is playing out will be a clear 5 wave drop from current levels that breaks below 4225 SPX. 
  • Option 2 is noted in Red below and is my alternative count – We are at the halfway point on a path that will lead to new highs. The biggest tell that this pattern is playing out will be a 3 wave drop that holds 4225, and turns back up to make a fresh high. If confirmed, our targets will be around 5000 SPX.

Breadth is weak and there are other factors that make the Red scenario less probable. On the other hand, price action has moved above our upper target range, and in a direct fashion. As a technical analyst, I have to respect price action, which is why we are starting to game plan around the potential for this playing out. 

If our new alternative red count becomes more probable, we will further pivot our portfolio and use our cash to go extra long for a blowoff top. However, as I will discuss in the macro section, there is no liquidity cycle and an impending credit cycle that is likely to be troublesome in the near future. Therefore, I want to be clear on the distinction between a “blow off top” and a “new bull market.” I will be firmly positioned for a blow off top until breadth improves.

This means if the red count is confirmed, you can expect the I/O Fund to move heavily into AI stocks and then we will plan to take gains as the market marches higher. What will invalidate the blow off top and confirm a bull market is if breadth improves. For our purposes, breadth is too weak to go long indefinitely. The time will come for this, but for our investment goals, that time is not now.

Regarding the blue count, which today is my primary expectation (note: this can change quickly and be replaced by the alternate red count), we will hedge to protect our AI positions if the blue count materializes. As you already know, we have been positioning for AI for many years – since 2018. Our plan is to remain in these positions even if a worst-case scenario plays out. The I/O Fund’s hard-won analysisThe I/O Fund’s hard-won analysis points toward AI being the correct microtrend to participate in for our eventual retirement (roughly 10 years from today). It’s easier to hold these positions and put a single hedge on, then remove this single hedge, than to time many entries and exits on stocks we have a very high conviction on.

To review our most up-to-date theses on our I/O Fund portfolio positions, please click here – we highly recommend newer Members browse this list of our previous analysis listed by Portfolio Position. For existing Members, this pinned post will serve as a new table of contents and reference point for the most pertinent thesis for each position we own.To review our most up-to-date theses on our I/O Fund portfolio positions, please click here – we highly recommend newer Members browse this list of our previous analysis listed by Portfolio Position. For existing Members, this pinned post will serve as a new table of contents and reference point for the most pertinent thesis for each position we own.please click here – we highly recommend newer Members browse this list of our previous analysis listed by Portfolio Position. For existing Members, this pinned post will serve as a new table of contents and reference point for the most pertinent thesis for each position we own.

Major Inflection Point

What will help us determine what count is playing out can be best seen on a smaller time scale.

The brief answer is what happens at 4225 is key. If we see a 5 wave drop that breaks below 4225 SPX, then the odds will start to greatly favor the blue count, and a top being in place. If we see a 3 wave drop that holds above 4225, and then turns back up sharply, then the odds will favor the alternative red count.

Supporting Markets

NASDAQ-100 (NDX)

The bifurcation in this market continues, with many stocks and sectors still below their February high, while the NASDAQ-100 took back that high and continued to power higher. Regardless, NDX appears to be in a 4th wave. The question I have is that this all we are going to get before we resume higher in a 5th wave, or will we get one more swing lower?

JapanJapan 

While many global markets are not supporting a long-lasting uptrend, and some, in fact, appear to have topped, we can still see the red count in SPX play out. This is supported by the Nikkei, which has historically led the NASDAQ for many years. The Nikkei looks a lot like the NDX above. 

When we move to the rest of the US market, we continue to see warnings against the narrative that a multi-year bull market is starting. At best, they suggests any continued push higher will likely be a continuation of the same leadership we are seeing now.

Small Caps (IWM)Small Caps (IWM)

Small Caps are more economically sensitive than large caps who can diversify their revenue across multiple products, as well as geographies. Because of this, we usually see this segment of the market lead us into a bear market and out of one. This is not what we are seeing today. Small caps have remained very weak, relatively, and appear to be tracing a large degree triangle pattern. These patterns are typical in B waves, and once completed, we should see a push to new lows follow. In order to invalidate this pattern, I’d like to see IWM push above $205. If this happens, it could be suggesting a much bigger uptrend is unfolding in the markets.

Equal Weight S&P 500 (RSP)Equal Weight S&P 500 (RSP)

There are roughly 8 stocks pushing the S&P 500 higher. Big Tech, especially Big Tech that has a focus in AI, is up significantly this year, while many sectors and stocks outside of tech are between barely up to barley negative. In an expanding economy coupled with an expanding liquidity cycle, your more economically sensitive stocks tend to lead on the way out of a bear market, which is just not the pattern we are seeing in 2023.

Because the equal weighted S&P 500 index gives the same weighting to Apple as it does to stocks like Under Armor and Autozone, it tends to outperform the market cap weighted Index in a healthy economy. For this reason, I tend to focus on this index in the macro environment we are in. Either the equal weighted index will play catch, or Big Tech/AI will eventually stop holding up the market and push lower.

As of now, the equal weighted S&P 500 has a very risky downward setup in place. Note the blue count below. There is a clear 5-wave drop from the February high. This is now being followed by a 3 wave bounce. So, this means waves 1 and 2 pointing down are in place. If RSP can get above $156, then this setup will be invalidated, and it would support the continued push higher.

Financials (XLF) 

I continue to believe the forgotten financials sector is leading the market. Like RSP above, note the 5-wave drop from the February high, followed by the clear 3 wave retrace. It also has a the same high risk setup in place. This setup will be confirmed below $31.25. We need to see XLF move above $36 to invalidate this setup, which would also suggest higher levels into late 2023-2024.

Regional Banks (KRE)

The regional bank ETF is working on what looks like an incomplete downward pattern. If accurate, we just finished the 4th wave and should be starting wave 5. This should break the long-term trend line that started in 2009 before a bigger push higher begins.

Macro

We will position for either the Blue Corrective Count above or the Red more Bullish Count listed above based on what happens during the current pullback. However, with that said, it is our stance that a recession is inevitable due to the fact that strong/stubborn economic growth means strong/stubborn inflation. The chart below compares the 3-month annualized growth in various economic metrics as well as inflation metrics. What’s notable below is that core CPI remains elevated, and have been elevated for over a year at 5%. My thoughts are there will need to be more progress on core CPI if the United States is going to avoid a recession. In fact, going back to the 1940s, the only event that reverses Core CPI has been a recession.

All lasting bull markets have been accompanied with an expansive liquidity cycle. Because core inflation has remained around 5% sequentially for nearly a year, the FED is unable to start this liquidity cycle, and instead is forced to maintain a restrictive liquidity stance. It is likely inflation starts to surprise to the upside again in the second half of 2023, further supporting the need for continued tightening until the economy enters a recession in Q4/Q1.

In the meantime, a lot can happen with equities prior to a recession getting priced into stocks. 

The Bond Market

The market is very forward-looking, and therefore it has rallied in anticipated of a pivot far in advance of the FED’s actual pivot. Based on where inflation is, the FED may not pivot as soon as the market hopes.

The reason for this is that from the FED’s perspective, the bigger risk to the economy is not equities taking another hit, but the FED losing control of the bond market. The last time the FED started a liquidity cycle too soon was in the late 1960s. They lost control of the bond market for over a decade, as rates remained very high due to ongoing inflationary pressures. Higher rates compound into lower growth. This is a much bigger risk to the economy than equities continuing lower, especially with the level of debt in the system.

The below chart compares when prior bear markets have bottomed in relation to the FED’s pivot, which is the start of a new liquidity cycle.

What the above chart shows is that when the FED starts a new liquidity cycle, the market tends to bottom within a 1-2 month spread of the actual pivot. There are instances where the FED’s pivot is not enough to offset the credit cycle within the recession, like in 2008, 2001, and 1981, and a bottom isn’t found in equities until the credit cycle ends. However, there is no instance in time where the market bottoms more than 1 month from the FED’s pivot, which starts a new liquidity cycle. 

For there to be a new bull market, the market would have had to bottom +8 months before a FED pivot. Per the data above, this would be an extreme statistical outlier that has not occurred at any time in the past.

From my perspective, the more likely scenario is that the due to the speed of the hikes, it has taken longer than normal to filter into the economy. We do not believe an upcoming rally will mark a new bull market, so some of our long positions will have stops while other long positions will be geared only toward our highest convictions. Notably, our highest convictions have been and will continue to be AI-related where demand is much healthier than the weak pockets in tech.

I/O Fund Portfolio

We have added some of our cash back into the market. We recently sold ENPH and trimmed NFLX, then waited for weakness and added those funds to our AI portfolio – SMCI, AMD, MRVL. We are also targeting NVDA, AEHR and GOOGL.

Advanced Micro Device (AMD)Advanced Micro Device (AMD)

AMD’s uptrend off of the 2022 low is an overlapping pattern that looks corrective. Our red count has this pattern as a large degree leading diagonal as a 1st wave with a large 2nd wave that will likely line up the credit cycle downturn. We’re also moving our upper target to fall in line with what a blow-off would look like. This correction in AMD, so far, looks to be corrective, which supports the red count. AMD has to hold above $88 for a continuation higher.  As long as this holds on any weakness, a push to new highs is expected.

Nvidia (NVDA) Nvidia (NVDA) 

Our blow-off target is in the mid-$550s to low $600s. As long as NVDA stays above $340, this is our expectation. Below $340, and we will start identifying lower levels to target. Also, this little dip, so far, is just not enough to be all of our 4th wave. It should last longer and deeper, which we are using to identify a good buy spot.

Bitcoin (BTCUSD)Bitcoin (BTCUSD)

It’s do-or-die time for Bitcoin. We bought at the lows on this dip, and price is now consolidating at the highs. For this to be a 3rd wave, we need to see a very sharp move higher from here. Until then, we are leaving the red count on the board. $19,600 continues to be the critical support for our bullish blue count.

Netflix (NFLX)Netflix (NFLX) 

NFLX bottomed many months before the rest of the market in 2022, and has continued higher in what appears to be a very large leading diagonal. The good news is that this move would only be the 1st wave in a very large 5 wave uptrend. The bad news is that we need a large 2nd wave retrace next. We are waiting for this larger 2nd wave to manifest before adding back to our position. Regarding current price levels, as long as any weakness holds $370, then we expect NFLX to make another swing higher into the $450-$500 region. Below $370 and the larger 2nd wave pullback is underway.

Aehr Test Systems (AEHR)Aehr Test Systems (AEHR)

The fundamentals and techncials seem to be at odds on AEHR. While I have us moving towards a larger top, the fundamentals suggest AEHR could take off from current levels and never look back. When this happens, we tend to lean into the fundamentals. Technically, we appear to be in a small b wave that could see one more low into the high-mid $30 before resuming up. If we see this, we will add. On the other hand, if AEHR punches above $42, it will signal a break out buy for us, as we start to target the $58 region next. If AEHR breaks below $29, then the odds of this swing higher will go down and we could be looking at a bigger top taking shape.

Microsoft (MSFT)Microsoft (MSFT)

We’re raising the target box for MSFT. Like many stocks, the current dip is too small to be the 4th wave we are looking for. If we get one more high, it will likely be setting up for a bigger drop into the summer, which would be buyable. If MSFT breaks below $322, then the larger pullback is underway, and we will target $310-$290. If MSFT does see this deeper pullback and then makes one more high, the low is likely in, and we will be expect a higher low in the coming credit cycle.

Ethereum (ETHUSD)Ethereum (ETHUSD)

In the bigger picture, ETHUSD is moving in lockstep with Bitcoin. This is not true for most alt-coins. On a smaller time frame, ETHUSD is diverging from BTCUSD. Note how ETHUSD is not as close to making a new high as Bitcoin is. We really need to see both ETHUSD and BTCUSD move sharply higher above their April highs to confirm our bullish count. If Ethereum instead breaks below $1370, we could be setting up for fresh lows.

Marvell (MRVL)Marvell (MRVL)

So far, we caught MRVL at the recent lows, as it appears to be setting up for another swing higher. Also, worth noting, the 3rd and 8th largest trades in MRVL’s history also happened around the levels we recently bought. This supports our general thesis about AI and specific thesis regarding MRVL. As long as MRVL holds above $50, we expect this uptrend to continue.

Tesla (TSLA)Tesla (TSLA)

TSLA is shrugging off its earnings report and participating in the AI trend. What concerns me is that the move off the low is a clear 3 wave move. This tends to suggest a corrective move in a larger downtrend. So, if the next bigger drop that is coming is also a 3 wave move down, it could be setting a potential buy. If it is a 5 wave move down, then our original targets sub-$100 will come back into play.

Taiwan Semiconductor (TSM)Taiwan Semiconductor (TSM)

TSM’s pattern off of the October low appears to be corrective. Note the overlapping uptrend. As long as TSM holds $81, we expect to see a continued push into the $120-$138 region. Below $81 and a bigger top is in.

Super Micro (SMCI)Super Micro (SMCI)

SMCI is avoiding the obvious head and shoulders pattern, so far. When these patterns fail, they lead to sharp rebounds. We added some at the neckline and will add the rest on a breakout or a breakdown. If we see a further breakdown, below $215, then the $191 price will be the region we plan to buy. If our bullish count is validated, $325 is not an unreasonable target for the next swing higher.

Chainlink (LINKUSD)Chainlink (LINKUSD)

Not much to add. We saw a breakdown below the critical support zone with a moderate rebound. I expect us to hit $3.5, which is where we are targeting our next buy. I won’t consider the low being in as long as we stay below $9.6

This is a sample of what we provide on our Advanced Service with macro analysis plus entries and exits. In addition to detailed information on when we plan to enter, exit, trim or add, we offer real-time trade alerts and weekly webinars to review our portfolio. Learn more hereLearn more here

Recommended Readings:

Renewable Energy Stocks That Benefit From $400 Billion IRA Bill

This article was originally published on Forbes on Jun 22, 2023,09:31 pm EDTForbes Forbes on Jun 22, 2023,09:31 pm EDT

China’s 2001 entry into the WTO marked the beginning of the golden age of globalization. This was the catalyst that led to the global outsourcing of domestic manufacturing capacity to lower cost regions around the world. As a result, world economies became more interlinked.

In 2016, President Trump began his administration by imposing tariffs on China, one of the United States’ largest trading partners. This signaled globalization’s peak and the beginning of a shift downward. This shift has continued with the Biden administration and the passing of the Bipartisan Infrastructure Law (BIL) ($550B) and the CHIPS and Science Act ($53B). The legislative goal is to improve US economic competition, innovation, and industrial productivity.

On August 16, 2022, Biden signed the Inflation Reduction Act (IRA). It directs new federal spending toward reducing carbon emissions. The IRA’s primary objective is to spur investments in US domestic manufacturing capacity. This most recent legislative action is another step toward the “Made in America” goal and increasing manufacturing-related national security. Its signing was a boon for the alternative energy sector’s 2022 performance.

2023 has been marked by higher volatility as the final legislative details, implementation and earnings impact of the IRA have slowly crystalized. Meanwhile, threats made against parts of the bill during last-minute legislative horse trading in the debt ceiling negotiations also created uncertainty. With that signed, we have a clearer roadmap as to how to best position for the IRA from an investment perspective.

We believe those companies that have these three characteristics stand to benefit the most. 1) Meaningfully collect the IRA corporate tax credit 2) Established US based manufacturing operations and 3) Viewed as important players in the IRA.

Based on these criteria, we believe First Solar stands to benefit. Furthermore, we believe that First Solar has positioned itself as one of the national champions in its implementation. In First Solar’s Q422 earnings call, they provided initial guidance as to the positive financial impact the credit would have in 2023. At the time the stock was trading $170 and rallied 30% to $220. The stock has given back a portion of these gains and currently trades at $187.

At current levels, we see a compelling risk/reward. Our medium price target indicates 30% upside versus 7% downside. Longer term, we see over 50% upside to our price target. We have a preference for companies who are selling to utilities such as First Solar rather than those selling to consumers via installers, such as Enphase. Enphase will not immediately benefit and the impact will be smaller, plus management pointed out near-term macro concerns due to higher interest rates affecting their business. Tesla may potentially benefit from its battery operations which could provide a buffer to its automotive margins if it continues to lower prices to gain share.
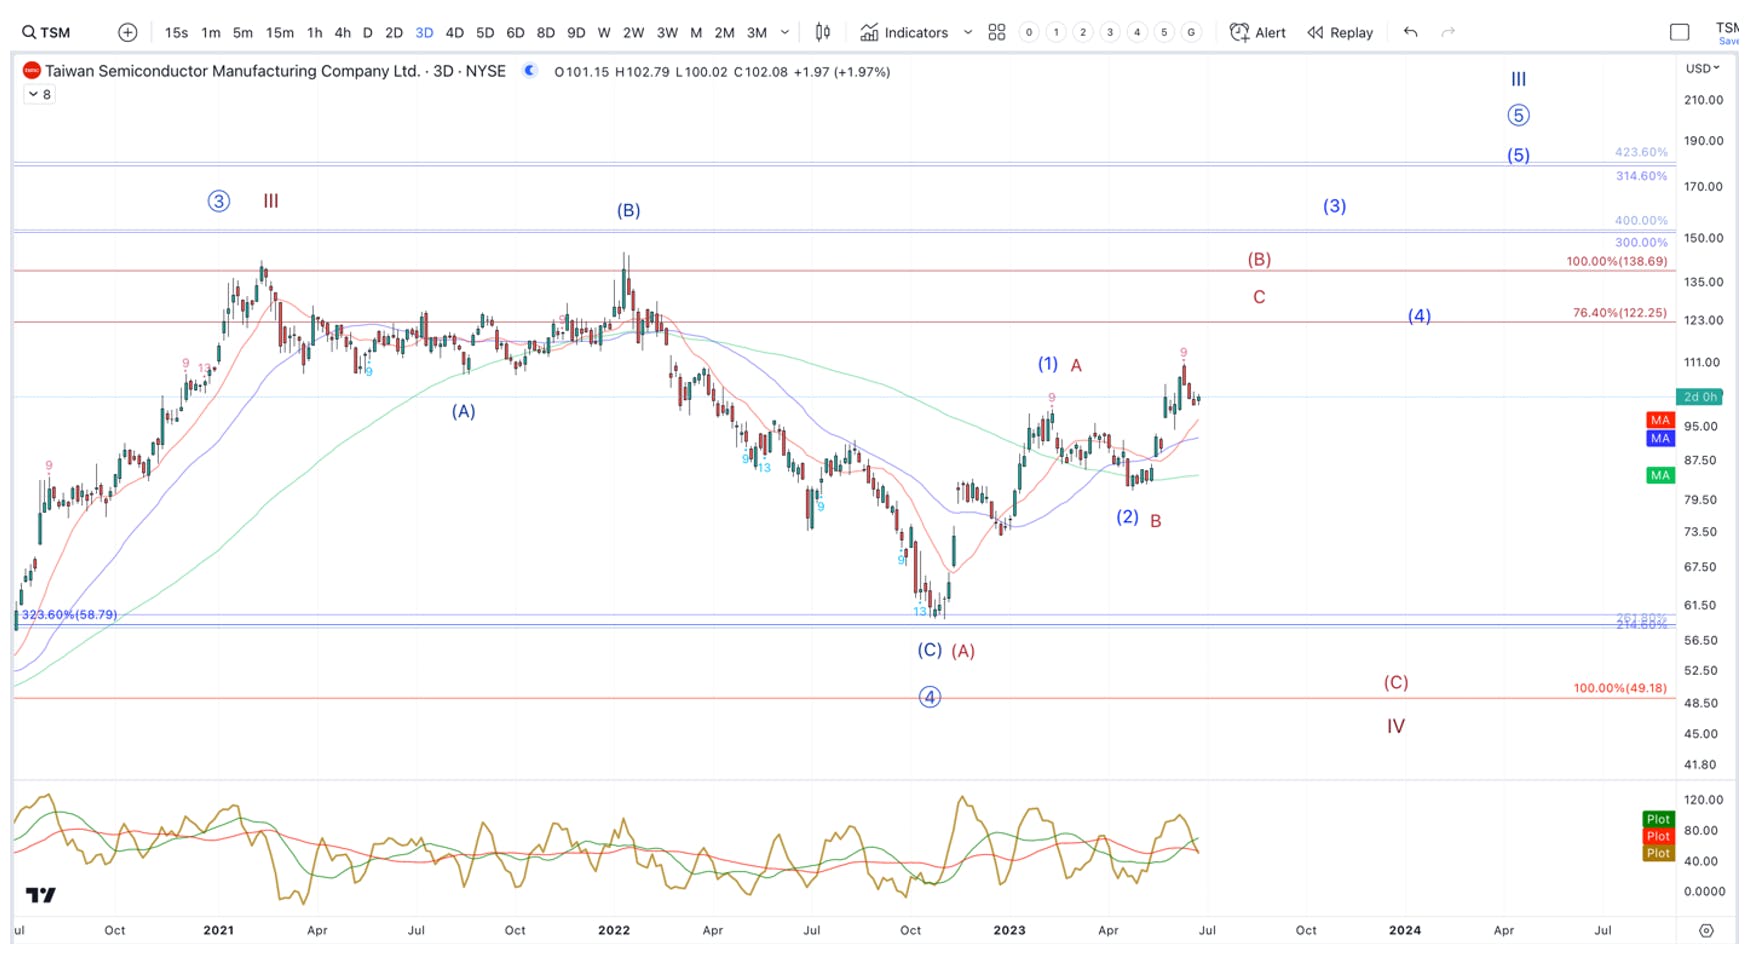
What is the IRA?

Based on an analysis by McKinsey and Company , the IRA directs nearly $400B in federal funding to clean energy, with the goal of substantially lowering the US’s carbon emission by the end of this decade. The funds will be dispersed via a mix of tax incentives, grants and loan guarantees. Clean electricity and transmission will receive the highest funding, followed by clean transportation, including electric-vehicle (EV) incentives.

In the past, the US has generally relied on imports for solar equipment. This law will encourage more production at home with incentives for domestic solar panels and inverter manufacturing. It is also designed to support the construction of renewable electricity plants.

Sign up for I/O Fund's free newsletter with gains of up to 221% – Click hereClick hereClick here

Who benefits from it the most?

In the McKinsey report, there are estimates that the majority of the $394B in energy and climate funding will be in the form of tax credits. Corporations with US manufacturing capacity are the biggest beneficiaries with an estimated $216 billion worth of tax incentives available. They are meant to provide an incentive for private domestic investment in clean energy, transport and manufacturing. Many of the tax incentives are direct pay, meaning they can claim their credit in that tax year and be paid the following year.

Energy and climate change funding in the Inflation Reduction Act

Source: MCKINSEY

How does the IRA impact earnings?

The IRA should provide an earnings tailwind for the clean energy sector. Companies are now just beginning to discuss the potential earnings impact in their commentary. Some have provided more details than others.

From an investment perspective, the key is to identify companies with US based manufacturing capacity that are eligible to directly collect a portion of the Corporate Tax Incentive ($216b) rather than those companies that will indirectly benefit from consumers claiming the Consumer Tax Incentive ($43b).

Critically, it’s important to identify those companies whose earnings will be significantly impacted by the Corporate Tax Incentive. For example, this is the potential impact the IRATC will have on First Solar’s gross margins. Its gross margins more than double. The intent of the IRA bill is clear. Provide companies with a profitable financial incentive to install domestic manufacturing capacity.

First Solar's gross margins

Source: I/O FUND

One of the reasons that First Solar stands out is due, in no part, to the fact that they have provided the most visibility as to how the IRA will impact their earnings. In doing so, they have provided a useful investment framework to assess how other companies may benefit. Not every company will have this type of impact on their profitability.

Companies are eligible to claim these claims starting in 2023 through 2030. It is still very early stages on assessing the full impact this may have on the years to come. Those that are positioned to meaningfully collect them will outperform those that aren’t.

How does the IRA Tax Credit (IRATC) work?

This is how First Solar described how the IRATC will work with the benefit first recorded in Q1 of 2023:

“Following consultation review with outside advisers, our auditors and the SEC, we expect to recognize these credits as a reduction to cost of sales in the period such modules and the integrated eligible components are sold to customers.”, we expect to recognize these credits as a reduction to cost of sales in the period such modules and the integrated eligible components are sold to customers.”

In their 2023 guidance, they went on to say

“I’ll now cover the full year 2023 guidance ranges. Our net sales guidance is between $3.4 billion and $3.6 billion; gross margin is expected to be between $1.2 billion and $1.3 billion, which includes $660 million to $710 million of advanced manufacturing production tax credits under Section 45X of the IRA; and $110 million to $130 million of ramp and underutilization costs. This results in a full year 2023 earnings per diluted share guidance range of $7 to $8.”which includes $660 million to $710 million of advanced manufacturing production tax credits under Section 45X of the IRA; and $110 million to $130 million of ramp and underutilization costs. This results in a full year 2023 earnings per diluted share guidance range of $7 to $8.”

The best way to appreciate the impact of the IRATC is to analyze the impact on profitability with and without the IRATC.

FSLR’s guidance provides insight on the impact of the IRATC. To simplify the analysis, we’ve taken the mid-point and excluded the ramp-up related costs.

2023 First Solar guidance

Source: I/O FUND

As we pointed out earlier, First Solar’s gross margins will more than double. Another way to look at it is that in addition to the First Solar’s current estimated 2023 average sales price of $0.29 per watt. First Solar will receive an additional $0.17 per watt in the form of the IRATC. An effective 59% increase in its sales price.

This is how FSLR broke down the 2023 IRATC in the Q422 call.

“Given our fully integrated thin film manufacturing process, we expect that this guidance will entitle us to integrated tax credits for wafers, cells and module assembly, which we estimate will equal approximately $0.17 per watt for modules produced in the United States and sold to a third-party.”which we estimate will equal approximately $0.17 per watt for modules produced in the United States and sold to a third-party.”

Because First Solar has been advised to treat the IRATC as a reduction in costs of sales, it’s important to focus on their growth in earnings per share. Assuming other companies adopt the same reporting standard, the same investment parameters will apply.

The impact on earnings is significant. Consensus earnings are expected to increase 80% from 2023 to 2024 and 50% from 2024 to 2025. Comparing it to 2022 is not an apples-to-apples comparison as there was no IRATC benefit in 2022 while gross margins were impacted by higher than expected logistic related costs. There were mainly penalty costs related to exceeding dock waiting times due to Covid supply-chain issues. FSLR has indicated that these and other costs will trend back down toward pre-pandemic levels over the course of the year.

Not every company will capture a similar level of profitability uplift. Generally speaking, those with higher domestic content can claim more of the IRATC. Companies will seek to capture as much of the IRATC as possible. And from an investment perspective, companies that have existing domestic capacity and can claim the IRATC in 2023 will be the stocks that benefit the most in the short-term.

In Q422, FSLR provided insights on domestic capacity expansion as it relates to collecting the IRATC.

“… we believe that the intent of IRA is to create enduring long-term supply chains, which would therefore motivate and align the incentives to true manufacturing in the U.S., more than just final module assembly with all the build material being sourced from international locations.

And if everything lines up along those lines, then that sort of helps inform our view there as it relates to the inherent value of more domestic manufacturing, plus we want to make sure that, while we believe we're fully entitled to the vertically integrated manufacturing tax credit, to the extent that we can get confirmation through guidance from IRS and Treasury, that would be very beneficial as we think about factory expansion.”we believe we're fully entitled to the vertically integrated manufacturing tax credit, to the extent that we can get confirmation through guidance from IRS and Treasury, that would be very beneficial as we think about factory expansion.”

The key word is “vertically integrated”. The more that a company’s US based manufacturing is vertically integrated, the more of the IRATC it can claim.

Every Thursday at 4:30 pm Eastern, the I/O Fund team holds a webinar for premium members to discuss how to navigate the broad market, as well as various stock entries and exits. We offer trade alerts plus an automated hedging signal. The I/O Fund team is one of the only audited portfolios available to individual investors. Learn more here.Learn more hereLearn more here.
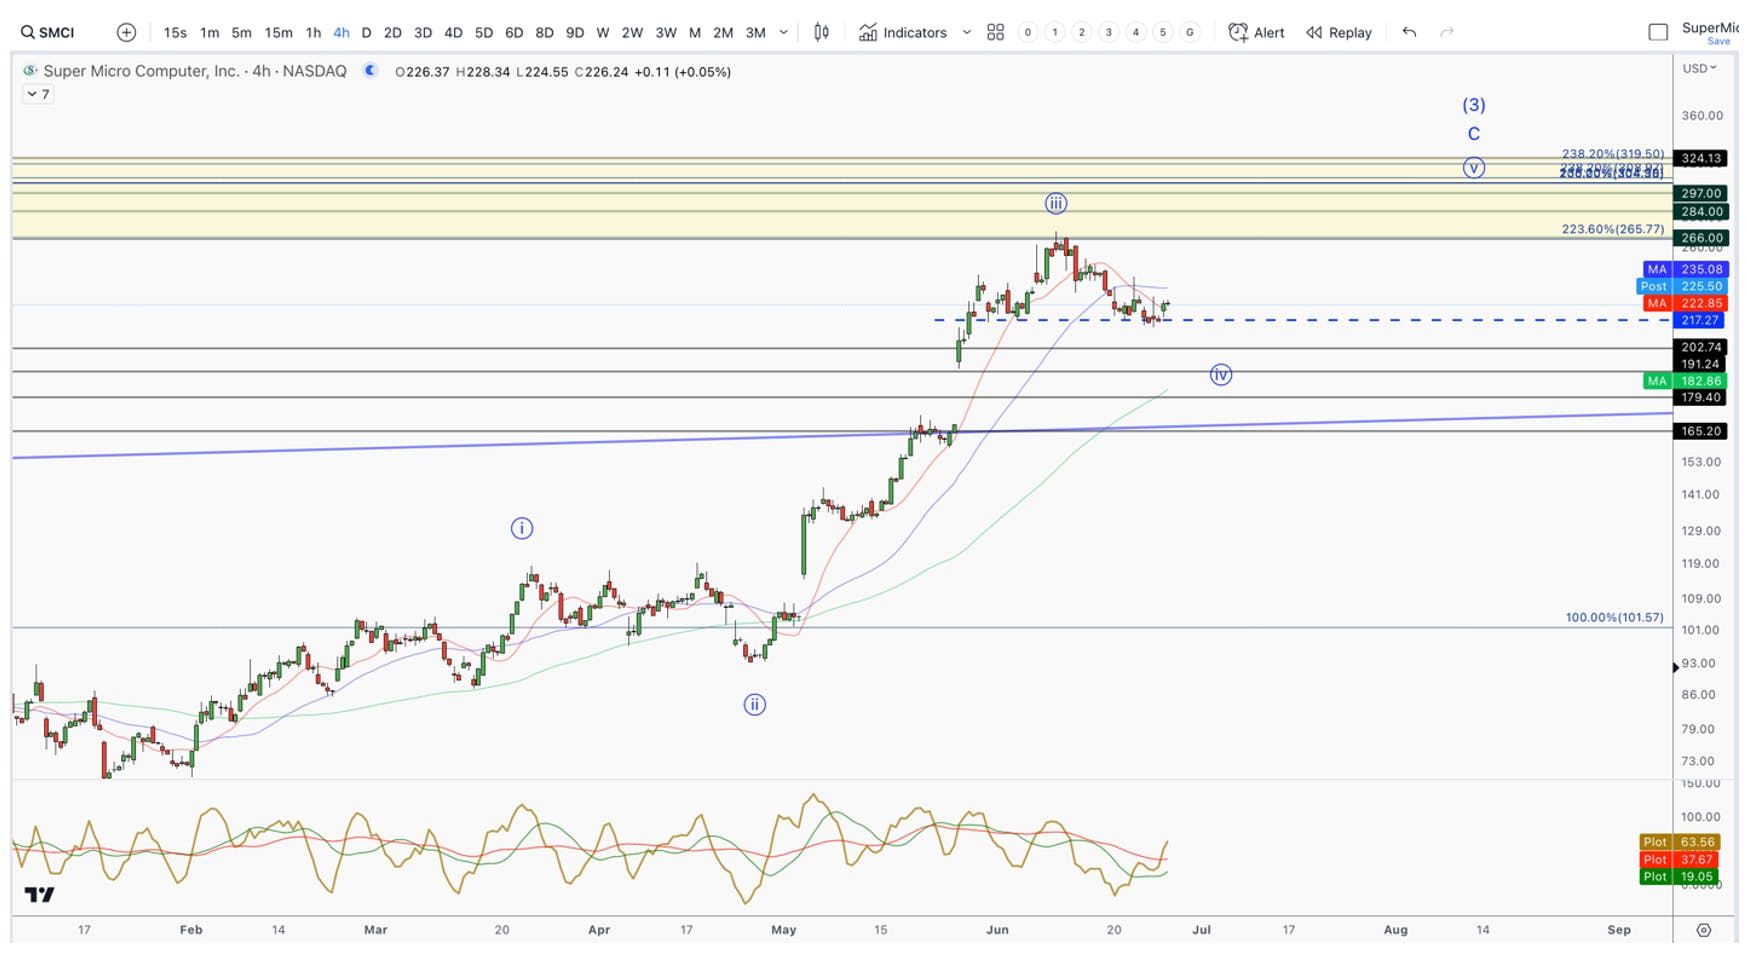
Making of a National Champion

FSLR manufactures solar modules based on thin film Cadmium Telluride (CadTel) photovoltaic (PV) technology demonstrated to have lower cost, superior scalability, and a higher theoretical efficiency limit over conventional technologies, like crystalline silicon (c-Si). Solar module sales represented 93% of total sales and the majority of sales were to developers and operators of systems in the United States. A few of its largest customers include Intersect Power, Lightsource BP, and NextEra Energy.

FSLR will benefit as its clients have an incentive to build out their own capacity to capture the IRATC. We have preference toward those companies that will benefit from the corporate IRATC rather than the consumer IRATC. The former includes utilities while the latter includes installers that are reliant on consumers to make the financial outlay to install solar panels etc.

It goes without saying that the IRA is an important piece of legislature. First Solar is positioning themselves as one of the National Champions to help in the IRA’s implementation. As we’ve seen internationally, National Champions typically get to provide input into and beneficial treatment from the government and other regulatory bodies. We believe the amount of IRATC visibility that FSLR has provided, in contrast to others thus far, is a reflection of that.

A further case in point, in the Q123 call First Solar cited remaining legislative hurdles. There was a tug-of-war to finalize the details of the IRA bill between the Treasury and Congress. It came down to Assembled vs Made in the USA. The former relates to companies that apply for waivers to procure certain components overseas, assemble the final product domestically and then attempt to qualify for the IRATC.

“As it relates to capacity expansion, look, the — as we said, the primary engaging factor right now is clarity on policy. And I said it in my prepared remarks, if we — if the domestic content stays true to the Congressional intent of IRA and it truly requires a highly manufacturable component here in the U.S. in order to qualify and the bonus being truly a bonus and not trying to create some form of entitlement, which we believe that should include at least the cell, if not beyond the cell as part of the domestic content requirements to be manufactured here in the U.S. That's going to be a key determining factor in terms of new capacity”As it relates to capacity expansion, look, the — as we said, the primary engaging factor right now is clarity on policy. And I said it in my prepared remarks, if we — if the domestic content stays true to the Congressional intent of IRA and it truly requires a highly manufacturable component here in the U.S. in order to qualify and the bonus being truly a bonus and not trying to create some form of entitlement, which we believe that should include at least the cell, if not beyond the cell as part of the domestic content requirements to be manufactured here in the U.S. That's going to be a key determining factor in terms of new capacity”

After that comment, an IRATC Bonus was announced that heavily favors and appeases “National Champions” like First Solar who are in the best position to collect the IRATC bonus that is tied to the use of US steel in their manufacturing. We estimate that the IRATC Bonus is worth another $0.03 to $0.05 per watt.

So breaking it all down, this is the estimated impact the IRATC and IRATC Bonus will have on First Solar’s estimated effective “total selling price” before domestic price escalators. A 75% increase from its $0.295 estimated ASP.

First Solar total selling price per watt

Source: I/O FUND

Resetting 2023 Expectations

In Q422, FSLR guided for about $700m in 2023 IRATC. The stock rallied higher but has been very volatile and now has given up most of its gains. We believe this has been somewhat self-inflicted. If First Solar management can be criticized for one thing is that they could have done a better job of managing expectations. For example, as part of its $700 guidance, it stated

“Section 45X credits, recognized, will increase after Q1, driven by both the timing of volumes sold as well as the inventory lag, whereby products sold in the early part of 2023 may have been manufactured in 2022.”

Despite this, market expectations were likely elevated going into Q1 and the market did not appreciate these timing differences. Additionally, logistic costs that were elevated during the pandemic have not quite returned to normalized levels and were still a drag on gross margins. While FSLR did not provide any Q1 guidance, it did miss consensus by a significant margin. Q123 sales were $583 million, up 49% y/y and down 45% sequentially. Q123 sales missed consensus expectations of $713m and eps was $0.47 vs consensus expectations of $0.86

Despite this Q123 miss, FSLR management did not change their full year 2023 guidance and stated: “we anticipate our earnings profile will be higher in the second half of the year.”

Putting this all together, we can see the timing on consensus eps and FSLR IRATC recognition. It’s still very much 2h23 weighted. In light of the timing differences and the fact that legislation had not yet been finalized at the time of their 2023 IRATC guidance given in Q4. If FLSR could do it all over again, we suspect they likely would have provided more conservative FY2023 IRATC guidance and wait to revise it up as the final legislative details were cemented.

Timing on consensus eps and FSLR IRATC recognition

Source: I/O FUND

Q2 Earnings and Forward

Although from an earnings and IRATC contribution perspective, Q223 will not make a large contribution. It is important in terms of FSLR reestablishing credibility to their 2023 earnings guidance and confidence in the potential earnings power in 2024 and 2025.

Unlike Q123, expectations are muted going into Q2. The IRATC Bonus may provide FSLR another lever to at least meet Q223 consensus. Importantly, the IRATC bonus may provide an opportunity for FSLR to revise up their $700 IRATC guidance. The stock would react positively in this situation. However, the one factor worth noting is that the CEO has recently sold about $8m worth of stock.

At current levels around $185, we see a compelling risk/reward. Our medium price target indicates 30% upside versus 7% downside. Longer term, we see over 50% upside to our price target once we gain more confidence the 2025 eps is attainable; where on consensus estimates, valuation is not demanding.

Will Tesla benefit from the IRATC?

Tesla stands to benefit indirectly from the Consumer IRA tax credit as it may spur demand for its EVs. The IRA provides consumers a maximum $7,500 tax credit to incentivize the purchase of EV over combustion engine cars. Not every automaker’s EV will quality for the tax credit. In the case of Tesla, their Model 3 and Model Y qualify for the full credit.

Consumers have to meet certain criteria to claim the full $7,500. For example, married couples filing jointly can’t make more than $300,000 and $150,000 for singles. Importantly, you have to have paid at least $7,500 in federal taxes in order to claim the full $7,500 credit in your tax return. In states like California, Tesla cars qualify for the Cleaner Vehicle Rebate which ranges from $2,000 to $7,000, this is an actual cash rebate rather than a tax reduction.

For those consumers who were already interested in buying a Tesla, these two programs provide further incentives.

On the corporate tax credit side, we have been waiting to see if Tesla will provide guidance as to whether their battery manufacturing qualifies for section 45x of the Inflation Reduction Act Tax Credits (IRATC). Given the accounting treatment of the IRATC, the credit lifts both gross and operating margins.

Benchmark Mineral Intelligence estimates that Tesla will receive $1.8b in IRATC in 2023. To provide some context, Tesla reported $2.7b in gaap operating profit in q123. This works out to $1,000 IRATC per car based on Tesla’s 1.8 million unit production guidance,

If Benchmark’s estimate is accurate, this is very important for Tesla’s stock price. Currently, the market is concerned that Tesla will sacrifice automotive margins in the short term by lowering its prices to gain market share. The IRATC potentially will provide a cushion so that Tesla’s margins are impacted less by lowering prices. Or put another way, it may provide Tesla ammunition to further lower prices. Perhaps an unintended consequence of the IRA whereby the US government is providing a company financial support to attack the major US auto manufacturers.

However, Tesla has not yet provided any official guidance. They may do so in Q223.

Will Installers benefit from the IRATC?

Our analysis points towards less of a benefit for module/inverter companies, such as Enphase, who typically manufacture overseas and then sell through installers who then sell to US consumers.

Enphase outsources the actual manufacturing of its solar inverters to overseas electronic contract manufacturers (ECM). Enphase is in the process of using a US based ECM in order to qualify for parts of the IRATC. However, ENPH will have to give-up a portion of the IRATC to the ECM. This US operation should be fully up and running in 2024 and will contribute about 50% of Enphase’s total manufacturing capacity. So Enphase won’t benefit from the IRATC until sometime next year. Based on Enphase’s initial guidance, we estimate this could add additional 2-5% to Enphase’s gross margins which currently stand at about 43%.

Conclusion:

The IRATC is in place until 2030. The last remaining details of the bill were just finalized. Taking a baseball analogy, the game is not even in the first inning. This will unfold over the next several years. The Inflation Reduction Act is an important piece of legislation and is supportive of the alternative energy sector. We prefer companies that have more direct earnings exposure to the IRATC and to corporate (i.e., utility) rather than consumer capex.

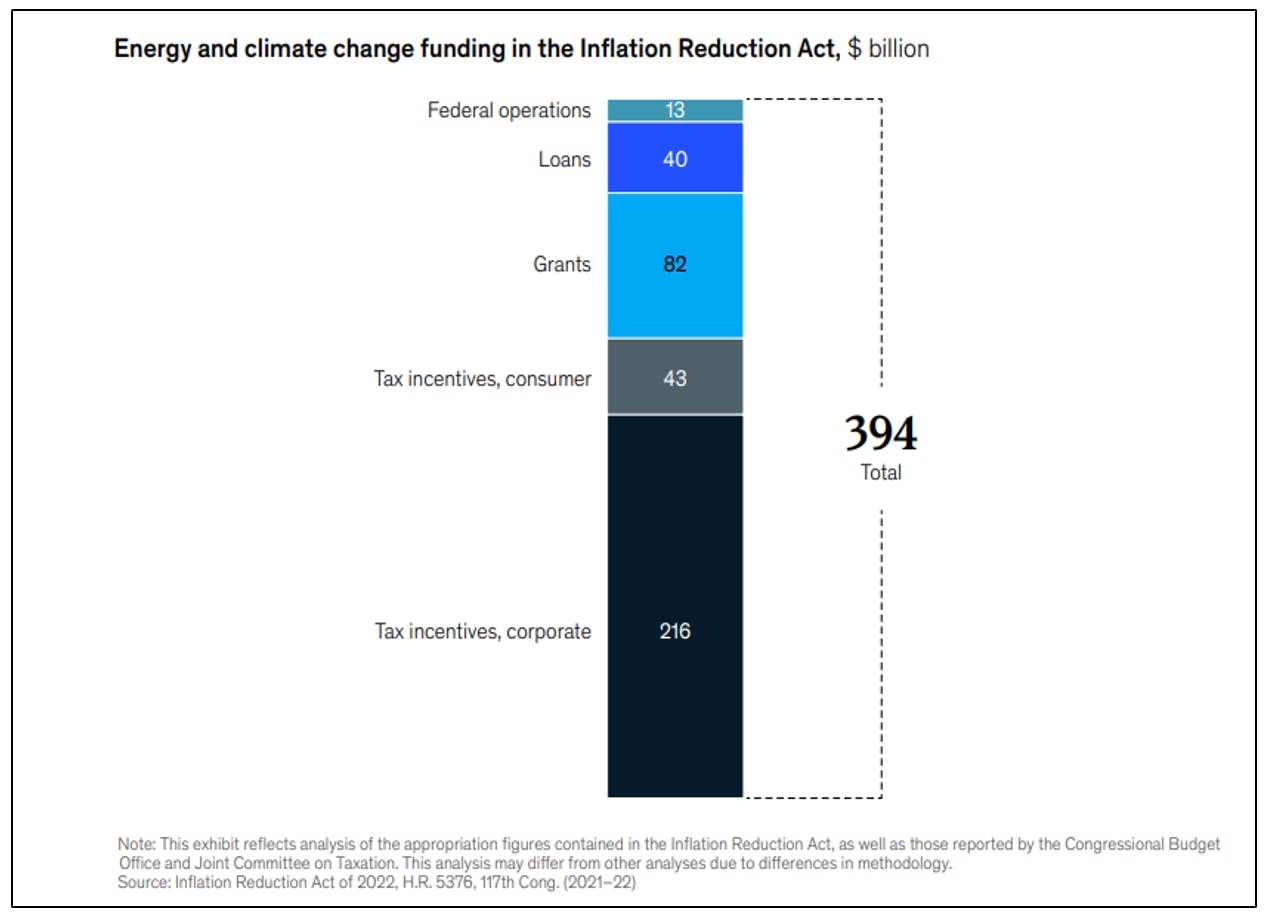
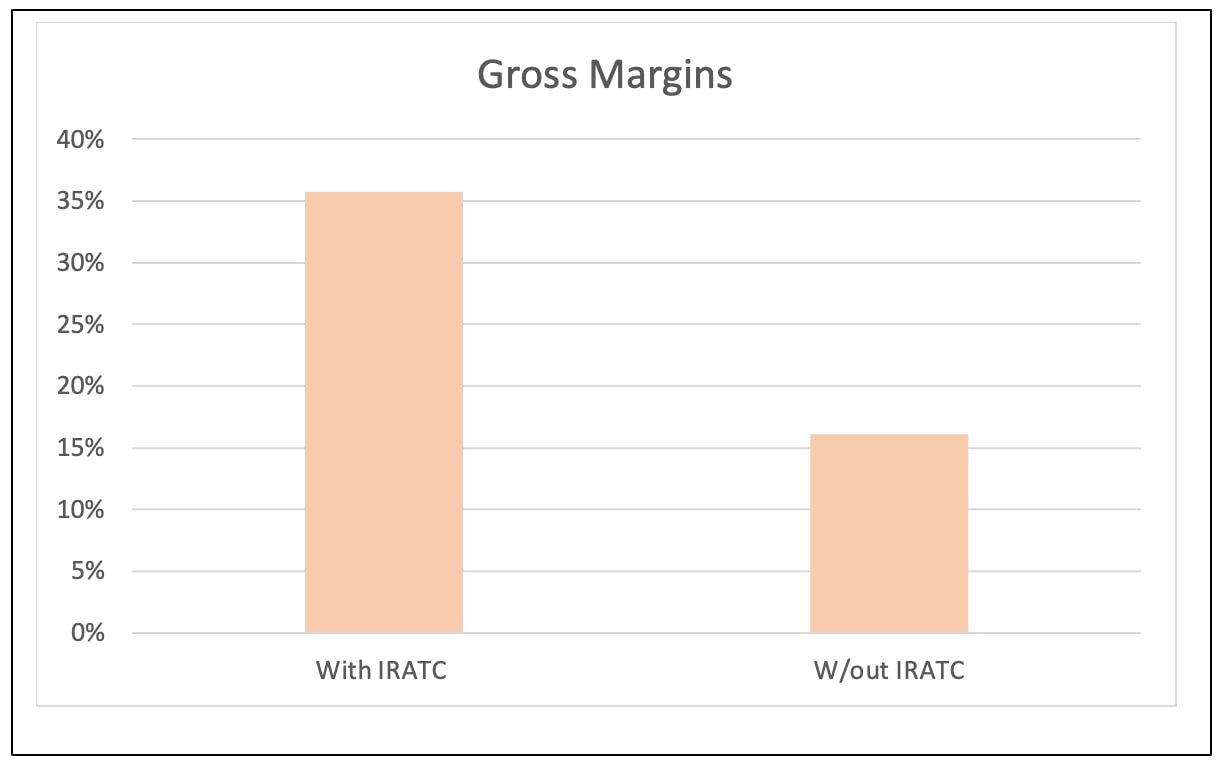
For a potential entry, we’d like to see if price can break above $230. If it can, then it could reset the current downward bias. We would consider that a clear breakout buy. On the other hand, if we do fail to break above this level, we will be looking to $145 for our first target buy. We share buy plans such as this one every week in our premium webinars held on Thursdays at 4:30 pm EST. We also issue real-time trade alerts when we do buy and are one of the only audited portfolios available to retail investors. Our performance exceeds institutional all-tech portfolios. Learn more here.

Please note: The I/O Fund conducts research and draws conclusions for the Fund’s positions. We then share that information with our readers. This is not a guarantee of a stock’s performance. Please consult your personal financial advisor before buying any stock in the companies mentioned in this analysis.

Recommended Readings:

June Stock Tip: Microsoft Valuation And Buy Plan

Please reference our fundamental analysis on Microsoft here: “Microsoft: AI Will Help Drive $100 Billion in Revenue.”

Valuation:

In the case of Microsoft, we have used a sum-of-the parts valuation model alongside traditional metrics to determine a price target. The SUTP helps to separate and value the three main businesses – Intelligent Cloud, Productivity and Personal Computing – as each have different growth profiles. 

Factoring in the AI/ML drivers we’ve described, we revisited our sum-of-the parts analysis. These drivers will have the biggest impact on the Productivity and Intelligent Cloud Businesses.

We believe the implied market multiple assigned to the Intelligent Cloud and Productivity businesses still undervalues the potential revenue opportunities.

As Microsoft continues to further integrate AI/ML into its offerings, this will further strengthen its core offerings and be the catalyst for new ones. This will provide new revenue opportunities from its installed Fortune 500 client base which we believe warrants a higher multiple. 

Under our base case scenario, these drivers increase the SUTP by $40 per share and under the bull case by $70 leading to a total SUTP of between $360 and $390 versus the current price of $330. 

Conservatively assuming that Microsoft’s group operating margins remain at current levels, a $100 billion increase in revenue could potentially add an additional in $40B in operating profit.

Based on this scenario, MSFT AI could earn $4.67 (vs MSFT consensus of $9.65 FY 2023). Placing a 30x multiple on gets you about $140 per share. So MSFT + MSFT AI = $485.

To be conservative for now, we can say MSFT AI may generate between $4.00 to $5.00 per share in earnings.

We can also take the avg of the 2 SUTP (390 + 485) for a SUTP value of about $440 over the next few years under the 100B AI scenario.

Buy Plan:

Considering where we are in the business cycle, it’s best to understand Microsoft within the context of the broader market. Our general market outlook is that the market will likely experience a bout of volatility into the summer.

As long as the S&P 500 holds the 4225-4200 region, we can continue to see a continued bullish swing into later 2023/early 2024, before the recession starts to get priced into equities. Until the FED starts a fresh liquidity cycle, and we get eyes on the extent of damage the 2022 rate cycle caused in the economy, we expect choppy price action with a downward bias, with the potential for one more-larger push higher, at most. If this plays out, we could see the NASDAQ-100, and even the S&P 500 make new highs; however, small caps, financials, and many other economically sensitive areas of the market have likely topped.

That being said, there are two general paths we are tracking in MSFT:

Blue – As bullish as price action in Microsoft has been, we only have a 3-wave move off of the January low in Microsoft. This leaves the door open to the uptrend in 2023 being the corrective bounce in a much larger corrective pattern that began in early 2022. The catalyst would likely be macro, as it relates to the manifestation of a credit cycle downturn that is not currently being priced into equities right now. We would need to see price break below $260.50 in the coming summer volatility. If this happens, then we will be targeting a retest of the January lows.

Red – On the other hand, this 3-wave move off the January low, can turn into a 5 wave move. This would require the summer volatility to hold within the green target box below, and then turn back up to make a fresh high. If this happens, then THE low is likely in for MSFT. 

Our buy plan is to accumulate based on both scenarios playing out. So, we will start adding to our position in the $300 – $265 region.

We share buy plans such as this one every week in our premium webinars held on Thursdays at 4:30 pm EST. We also issue real-time trade alerts when we do buy and are one of the only audited portfolios available to retail investors. Our performance exceeds institutional all-tech portfolios. Learn more here.Learn more here.

Recommended Reading:

Cadence Design Systems – Generative AI For Chips and Systems

AI continues to be an investment theme in all investor’s minds. NVDA’s recent results only added fuel to the fire. We’re continually analyzing the AI stack to find other companies that will benefit. We’ve identified companies such as Nvidia, AMD, Microsoft, Taiwan Semiconductor, which we’ve written about on several occasions, plus ASML and Super Micro, more recently. Note: We also covered Marvell on our forum, which you can read here.which you can read here.

Summary of Cadence: AI-Based EDA

Cadence Design Systems provides semiconductor chip design and printed circuit board design tools. In the era of AI, the company has expanded to AI-Based EDA, which stands for AI-Based Electronic Design Automation.

Cadence’s tools eliminate defects in semiconductors early-on during the verification process, which is quite valuable, as catching a bug too late can be exponentially expensive and problematic for design companies.

In addition to improving product quality, there is also a large opportunity for Cadence in reducing the time required to design chips, especially as design companies move quickly toward smaller node sizes. In the past, semiconductor companies, pursued time-consuming methods such as transistor-level and cell-based designs. More recently, Design Reuse has been a popular design method to increase productivity, which is taking an IP block and dropping this into the new chip. 

Cadence’s AI-Based EDA will greatly increase productivity by leveraging AI to augment human engineering. This is especially important as the nodes are shrinking, which increases the costs for the physical design process (dark blue in the chart below) and verification (dark green in the chart below).

Source: Cadence Design Systems, CadenceLIVE

Management made these general comments on the demand environment:

“Exploding chip and system design complexity will drive a significant non-linear growth in the workload requirements, opening up a massive opportunity for computational software to help realize these innovative products by investing more of the R&D spend in automation.”

Cadence offers a wide range of AI-based tools for digital implementation, regression and verification testing, or cell library characterization. However, more importantly, Cadence is moving into AI platforms which wrap the AI-based tools into frameworks. This expands the ways Cadence’s tools can be used.

Stock attributes that we like  

  1. Exposed to mission critical capex  – Chips are shrinking, which adds complexity to the design. Before actually spending millions on a chip or system, hyperscalers and design companies need to ensure that the chips and systems will work. Computational Software is an integral part of that process to design and verify that the chips will operate as intended. Clients include not only the semiconductor heavyweights such as Nvidia, AMD, Samsung and Broadcom but across other industries, such as Electric Vehicle systems.
  2. High switching costs for customers – After a client designs a successful chip using Cadence software. It’s less likely the client will switch to another software provider to design the next generation. This increases the likelihood that the client will renew the software licenses
  3. Subscription model – 85% of revenue is recurring with a visible backlog which contributes to consistent FCF generation and steady operating margins

AI Platforms for EDA:

Cerebrus: Digital Design and Optimization – 28% of Revenue

Uses training data from reinforcement machine for full flow optimization. What reinforcement machine learning does well is trying new options and learning what works, which lowers the human effort in the design process. This platform can be used for both at the system level and for silicon optimization. If you think of a car, it has a large system that combines many components and it has chips and circuit boards. In this case, Cadence can be used for the system or the chips.

Among others, [Cerebrus] is now deployed at 10 of the top 20 semiconductor companies, including 7 of the top 10 semis and at several major hyperscalers. In Q4, we successfully delivered an advanced HPC design and a CPU design using our digital full flow and Cadence Cerebrus on TSMC N5 process technology, delivering 8% reduced power and a 9% area improvement while significantly improving engineering productivity. In 2022, several market-shaping customers, including Intel, NVIDIA, Broadcom, Samsung and Renesas shared their remarkable successes with Cadence Cerebrus at our CadenceLIVE user conferences.”

Optimality: In-Design Optimization

The optimal electro-mechanical system needs to run many cycles of simulations until the system reaches its performance goals. This platform provides the parameters to reduce the number of simulations required. In a case study the company provided, Optimality reduces the number of simulations from 3125 to 79 simulations. This reduces the number of required engineering hours from 66 hours to 1.6 hours. In a second case study, it reduces the number of simulations from 625 to 58 simulations, with a reduction of hours from 110 hours to 11.3 hours.

Verisium: AI-Driven Verification and Debugging – 26% of Revenue

Combines the AI-enabled tools for simulation, emulation and prototyping and uses AI techniques to find the failures. It can be very time consuming to figure out the cause of a failure. By using AI, the engineer can go quickly to the root cause of the failure and to the bug fix. 

Per management, the verification business grew 28% year-over-year, and is used for mobile, hyperscale, high performance computing and electric vehicles. It was also stated that Verisium delivered up to 30X improvement in efficient root cause analysis.

Allegro X AI: AI-Driven PCB – 12% of Revenue

Allegro X helps to optimize circuit boards and systems using generative AI. It particularly helps with automating the placement and routing of components on a board.

Virtuoso: AI-Driven Custom Layout – 22% of Revenue

Virtuoso is a platform that helps move existing chips design and intellectual property over to a new generation through AI trained algorithms. One reason that Cadence is defensible against large language models is that these platforms require large data sets, whereas Cadence’s platforms can be trained on a much smaller yet highly specialized data set. This is ideal for chip designs, which are proprietary and are not shared. Cadence is ideal as the platforms can train using the smaller data sets that a company owns (and does not share).

Regarding the two generative AI platforms, Allegro and Virtuoso, the following was stated on the earnings call:

“Generative AI design tools are revolutionizing chip and system development by delivering unprecedented optimization and productivity benefits. Customers have already been benefiting from our ground-breaking generative AI solutions in the digital, verification and systems areas, and with the recent introductions of Virtuoso Studio and Allegro X AI, we now have an unmatched chip to package to board to systems generative AI portfolio.” Several customers including MediaTek, Renesas, Analog Devices and TSMC provided testimonials for the launch.

IP – 12% of Revenue

IP offerings consist of pre-verified, customizable functional blocks, which customers integrate into their ICs to accelerate the development process and to reduce the risk of errors in the design process.

JedAI: Joint Enterprise Data and AI Platform:

In September, the company released a platform to fuel the AI platforms called JedAI. This horizontal platform provides a knowledge repository between projects and serves as the big data analytics layer. There are many tools and projects required for hardware designs (listed above), and Jed AI provides the fuel (or a knowledge base) to improve efficiency for future designs from past projects. This is done by leveraging data from previous design projects, workload data (runtime, memory usage) and workflow data.

Below is an engineer’s view using Cadence’s chip design software.

Helping to improve Nvidia’s GPU Performance

For example, by integrating Computation Fluid Dynamics (CFD) with System Design Automation, Nvidia was able to improve the speed and power of efficiency of its GPU chips. Computation Fluid Dynamics (CFD) is an aspect of multi-physics system analysis that stimulates the behavior of fluid and their thermodynamic properties using numerical models.

Per the management team:

“Recently with our collaboration with NVIDIA, Jensen talked about that Cadence CFD on GPU for the same cost is giving a 9x improvement in speed up and 17x improvement in power efficiency. And GPUs are slightly more expensive than CPUs. I mean, typically, I would guess, at least 3x to 5x. So, you're getting 30x to 50x speed up on GPUs that normalized for cost is still getting 10x or 9x improvement in speed. So that's a huge improvement based on our special algorithms, because we have a long history of massive parallelism in CPUs and now we are applying it to GPUs, especially in SDA, both for electromagnetic and CFD. So, I think that can also provide a lot of growth. I talked about AI and all for chip and system, but this acceleration on GPUs, accelerated compute for system analysis is another big vector.” 

Evolving from EDA to SDA

Currently, there is a shift in electronic design systems from EDA (Electronic Design Automation) to SDA (System Design Automation). No longer can components be designed in isolation and integrated by systems engineers. As a result, electronic and mechanical design are increasingly becoming intermingled which requires the co-design and co-optimization of every component in an electronics system and every aspect of the physical nature of the systems.

Traditional EDA can already solve system simulations measured in billions of transistors. In the future, SDA will be able to process simulations involving 1 trillion transistors. Per the management team: “[…] some of these chips have 100 billion transistors, right, on 1 inch by 1 inch. And if you look at by 2030, they will have 1 trillion transistors, okay? So just in terms of size, it will be 10x more. And then the chips are more complicated and then you add software on top of it. So the design complexity that our customers need to do will go up by at least 20, 30x in the next 5 to 7 years. So the only way to meet that is by more (SDA) automation. That’s the history of our industry, And the best way to do more automation right now is using AI.”

Business model + Historical Growth (2016-2022) 

Between 2016 and 2022, on the back of these positive secular tailwinds Cadence delivered a revenue CAGR of 11.9% and non-GAAP EPS of 23.4%.  Despite selling products into an industry that can be cyclical, Cadence has been insulated from the profitability ups and downs of its semiconductor customers.

Because of its subscription model, 85% of Cadence’s revenue is recurring. Typically, Cadence enters into time-based license arrangements which grants customers the right to access and use all of the licensed products at the outset of an arrangement and updates are generally made available throughout the entire term of the arrangement, which is generally two to three years. Cadence’s updates provide continued access to evolving technology as customers’ designs migrate to more advanced nodes and as its customers’ technological requirements evolve. Payments are generally received in equal or near equal installments over the term of the agreement. Clients have the option to renew the license at the end of the agreement.

The 2022 revenue breakdown and 22/21 YoY growth rates for the 5 software segments:

The remaining 15% of revenue is upfront revenue mainly from the sale of Emulation and FPGA Prototyping hardware equipment. Typically, it’s the same clients who use the software and then use the hardware for testing and verification purposes.

China contributes 17% of revenue.

Profitability:

Similar to its Revenue and Non-GAAP eps, Cadence’s non-GAAP operating margins have steadily increased from about 26% in 2016 to ending at 36% in Q422.

Additionally, FCF generation increased coupled with share buybacks and healthy balance sheet.

Q123 Financials:

For q1fy23, Cadence reported revenue of $1.02b (+13.3% y/y) which matched the upper end of their guidance of between $1b-$1.02.  Non-GAAP eps was $1.29 which beat their guidance of $1.27 and consensus of $1.25.

For q223, Cadence guided revenue $960 million to $980 million, non-GAAP EPS $1.15 to $1.19 and GAAP EPS $0.73 to $0.77.

For q1fy23, GAAP operating margin was 31.6%, right in the middle of company guidance, vs 35.4% last year.  While non-GAAP operating margin 42.1%, lower than 44% in the prior year, but exceeded the upper end of management’s 42% guidance.

For q223, Cadence guided non-GAAP operating margin 40% to 41% and GAAP operating margin 29% to 30%.  

Looking at the balance sheet, Cadence finished q1 with $917 million in cash and debt of $678m. Operating cash flow was $267 million. And repurchased $125 million worth of Cadence shares.

The Q123 backlog stood at $5.4b vs $5.8b Q422

2023 guidance

Cadence updated their 2023 full guidance. The revenue range was increased from $4.03b to $4.07b vs $4.0b to $4.06b. GAAP eps in the range of $3.26 to $3.34 versus $3.24 to $3.34 and non-GAAP eps in the range of $4.96 to $5.04 versus $4.90 to $5.00

GAAP operating margin in the range of 30% to 31% vs 30.5% to 32% and non-GAAP operating margin in the range of 41% to 42%  vs 40.5% to 42%.

Operating cash flow in the range of $1.3b to $1.4b. Expects to use approximately 50% of free cash flow to repurchase Cadence shares.

Cadence’s full year 2023 guidance represents of +14% sales growth and 17%, non-GAAP EPS YoY. Full year guidance was very modestly raised by $20, spread evenly between hardware and software. Despite the better-than-expected hardware sales in Q1, Cadence is taking a wait and see approach and didn’t want to further raise the FY guidance at this time.    

Initially, the stock reacted negatively to the Q1 earnings report likely on 1) disappointment that 2023 guidance was not raised higher, 2) sequential q4/q1 backlog decline and 3) q1/q2 decline in sales guidance. It has since recovered with the Nvidia’s blowout earnings likely driving it higher. See below for questions from analysts on these points.

Earnings Call:

Analysts were concerned about the 5% sequential decline in revenue provided in the guidance:

Question

Oh, sorry, yes. And then, my second question on the guide, it looks like second quarter is going to decline sequentially by about 5%, consistent with what we saw last year too. So maybe just a quick refresher on what's driving the seasonality here?

John Wall

Yes, when you look at it, it will be — it'll show up in the functional verification number next quarter. I think the — when I look at — like Q1 was great. I mean, functional verification was up 30% year-over-year. The quarter was up low teens. When I look at Q2, Q2 also looks great. It's going to be up low teens again compared to Q1 '22, but functional verification will be up probably closer to 20% rather than 30%.

But — so, it's our expectation that in our guide, we're assuming that the recurring revenue mix for the year stays at 85-15, 85% recurring, 15% upfront, same as what we experienced last year. Now, in Q1, it was 80%, 20%, so there was a lot of open revenue for the hardware deliveries that went out in Q1. In Q2 — we expect Q2, Q3, Q4 to be less than the 80-20, and it will average 85-15 for the year. So, you're seeing that in the Q2 guide”

Regarding Q4/Q1 decline in backlog from $5.8 to $5.4b. Bookings and renewal environment continue to be solid. H1 tend to be weaker. Q123 was also impacted by timing and big renewals in H1 2022.

“The second half of this year is very heavily weighted for bookings for the total year. We're very light in the first half of the year for software renewals. The second half of the year, Q3 and Q4, are very strong for software renewals this year. Unlike last year, last year, I think the first half was we had a number of big software renewals in the first half, we don't have that this year. And when you look at the second half, of course, I mean any big renewal you have in Q3 — at the end of last year, we had like nine months in RPO for that and now it's only six months at the end of this quarter. So, it's really just a function of renewal timing and the fact that the first half of the year is light for renewal timing [..] What I was trying to convey was that we had very few software renewals that came up for renewal in Q1 and therefore bookings were expected to be light. The beauty of the recurring revenue model that we have is that the timing of those renewals is not especially important, but it's the annual value of those renewals. And that we continue to see growth in the annual value of those bookings, and we see growth across all of the businesses.” 

Key Risks

Currently, the biggest risk is Cadence’s 17% exposure to China where they sell software and hardware such as Emulation and FGPA Prototyping hardware equipment. Hardware sales to China were strong in Q123. Total hardware sales have ranged from 15-20% of sales and are recognized upfront.

Similar to other tech sectors, if the US gov’t restricts hardware citing competitive reasons, this will adversely Cadence.

However, at the moment there is nothing to indicate that this will happen. But any headline suggesting that will impact the stock price. 

Conclusion:

Taking into consideration the recent AI rally that lifted Cadence stock price, coupled with the sequential decline in Q2 and premium valuation, we are sensitive to entry price levels.

We expect it to be a medium and long-term winner. Cadence occupies an important piece of the AI stack and is at the intersection of secular megatrends such as 5G, hyperscale computing and AI/ML that are driving sustained investments by its semiconductor and systems customers. Despite the macroeconomic uncertainty, Cadence’s clients continue making significant investment in their next-generation products, resulting in robust design activity.

Ultimately, we will want to see revenue accelerate beyond the mid-teens. It’s a matter of deciding if the story is strong enough to buy in advance of an acceleration or wait for higher revenue to be reported and forego an earnings pop.

Recommended Readings:

Microsoft – AI Will Help Drive $100 Billion In Revenue By 2027

This article was originally published on Forbes on Jun 15, 2023,11:18pm EDTForbes Forbes on Jun 15, 2023,11:18pm EDT

Given the runup in AI-related valuations, separating the real deal from companies that are merely AI wannabes is critical. The first few things to consider are, will this company see revenue from AI and, if so, how soon.

AI-related cloud stock chart

Source: YCHARTS

Although many AI stocks will not report enough AI revenue to survive the fierce, competitive battle the tech industry faces due to AI/ML, Wall Street investors can reasonably assume that Microsoft will be a leader in this space. Microsoft’s AI platform is rather insulated from widespread competition outside of Google Cloud and AWS, and the company’s software assets are particularly well suited for AI advancements, such as Office 365.

In April of 2022, our firm re-entered Microsoft with a note to our premium research members about the company’s dominance in AI before Chat-GPT3 was released. We repeated this in October of 2022 when we called Microsoft a “sleeping AI giant”:

“Microsoft is a sleeping AI/ML giant. Google gets a lot of attention here yet I think they are equally prepared to serve this market […] To help Microsoft rival Google, the company has been investing in OpenAI, which is a large R&D operation that is breaking ground with AI algorithms that help computers to create images from text, reduce the amount of code that developers need to write, and to also help robotics think and act like humans, among other things […] DALL-E is a “12-billion parameter” version of GPT-3 that creates images from text. The partnership with Microsoft will bring DALL-E to apps and services, including the Designer app and Image Creator tool in Bing and Microsoft Edge – this was announced earlier this month at Ignite.”

Analysts have been raising their price targets to the high $300s with an Evercore analyst raising his price target to $400 stating: “the infusion of AI across Microsoft’s product portfolio represents a potential $100 billion incremental revenue uplift in 2027.”

To provide some context, Azure and Office 365 helped Microsoft add almost $100 billion in revenue over the past four years. It increased from $110 billion to $198 billion in revenue. The stock appreciated 180% over that time frame. At the time, the market did not comprehend the revenue potential in these two businesses. We believe that history will repeat itself and the market is underestimating the impact AI will have on MSFT’s future sales growth across its business lines.

However, valuation poses a risk to Microsoft’s current stock price, and as outlined below, our firm prefers to wait before we add again to our position.

Sign up for I/O Fund's free newsletter with gains of up to 221% – Click hereClick hereClick here

6 Ways Microsoft Can Drive Another $100 Billion with AI:

Open AI APIs:

The OpenAI opportunity extends beyond Microsoft’s installed base, which is an important change to Microsoft’s market position. This is because OpenAI APIs run on Azure even if the customer isn’t directly an Azure customer. Management commented on this in the earnings call:

“Second, even Azure OpenAI API customers are all new, and the workload conversations, whether it's B2C conversations in financial services or drug discovery on another side, these are all new workloads that we really were not in the game in the past, whereas we now are.”

Generative AI for Government:

One market that gets overlooked in terms of its AI impact is the Federal Government. It is currently undergoing a major shift into the cloud. In a blog post, the company CTO Bill Chappell wrote: "Microsoft continues to develop and advance cloud services to meet the full spectrum of government needs while complying with United States regulatory standards for classification and security. The latest of these tools, generative AI capabilities through Microsoft Azure OpenAI Service, can help government agencies improve efficiency, enhance productivity, and unlock new insights from their data. Many agencies require a higher level of security given the sensitivity of government data. Microsoft Azure Government provides the stringent security and compliance standards they need to meet government requirements for sensitive data."

Many years ago, I wrote about the Pentagon contract and why Microsoft would be a front runner when it was widely reported AWS was the sole Big 3 contender for the contract. This analysis pointed toward the long-standing history Microsoft has in being favored by government entities.

Microsoft CoPilot:

The company introduced Microsoft 365 Copilot last month. It is the productivity tool that combines large language models (LLMs) with the data in Microsoft Graph and Microsoft 365 apps. The use cases of Copilot in Word include giving the users the first draft while saving the time on sourcing, writing, and editing the content. Similarly, Copilot in PowerPoint will help to create presentations based on previous content. Copilot in Excel can analyze trends from the data, create charts, and helps to make informative decisions.

To have a suite of productivity products that can see an immediate impact from AI-related R&D is a large part of the $100 billion that Microsoft can potentially add to the top line by 2027.

Edge/Telecom Partnerships:

Another important driver is Microsoft’s close partnerships with many of the telecom and data centers around world which will further cement its strong position in edge computing.

In February, Microsoft announced it had previewed two AI-powered services that are designed to manage telecom networks. Jason Zander, executive vice president of strategic missions and technologies at Microsoft said, “What we’re doing is taking our native cloud work and making it specific to this telecom operator network space. I think a really great example of that is all the AI ops work that we are introducing into the system."

Microsoft Bing:

In the most recent quarter, Microsoft announced that the new AI-powered Bing and Edge has seen a positive response. The company crossed 100 million daily active users of Bing. This is how Microsoft described the early impact of ChatGPT.

“Of the millions of active users of the new Bing preview, it’s great to see that roughly one third are new to Bing. We see this appeal of the new Bing as a validation of our view that search is due for a reinvention and of the unique value proposition of combining Search + Answers + Chat + Creation in one experience.”

Notably, Microsoft Bing has 3% market share and for every additional 1%, Microsoft will make an additional $2 billion.

Every Thursday at 4:30 pm Eastern, the I/O Fund team holds a webinar for premium members to discuss how to navigate the broad market, as well as various stock entries and exits. We offer trade alerts plus an automated hedging signal. The I/O Fund team is one of the only audited portfolios available to individual investors. Learn more here.Learn more here.

Microsoft is one of the largest cybersecurity companies

Microsoft’s cybersecurity segment reports more than $15 billion in revenue. The company was also the only Big 3 cloud vendor to not only build a multi-cloud product but also multi-cloud security. Today Microsoft’s cybersecurity sales dwarf the revenue of many cybersecurity best-of-breed products combined.

Cybersecurity sales chart

Source: I/O FUND

Installed customer base provides cross selling opportunities for new AI/ML based products and functionality

In the spring of 2022, I wrote about how reducing cloud costs was going to be a key trend in 2022 and beyond. We believed that Microsoft was uniquely positioned to benefit from this trend as it aggregates cloud services to help drive down costs. This is especially attractive for the Fortune 500 whereas startups, SMBs and mid-sized enterprises are likely to seek out and manage a larger portfolio of cloud services from various vendors.

Among the Big 3, Microsoft dominates the Fortune 500 with 95% running on Azure. Retaining the Fortune 500 in the migration to the cloud was accomplished through hybrid computing where Microsoft was first-to-market on serving a mix of on-premise, private and public clouds for their large enterprise customers. As the leader in on-premise systems, Microsoft was perfectly positioned to win with hybrid architectures. The company took this a step further and undercut other services on prices across its suite of software and platforms to win aggregate, long-term contracts.

Microsoft’s Risk is Valuation

Microsoft business model is low risk compared to many other AI stocks. However, there is certainly risk in the company’s valuation. The risk is compounded when market exuberance front runs a trend and overshoots the mark of what a company can realistically report in the coming years. Microsoft’s valuation is high relative to its 5-year median. If you look at the 5-year median prior to the current runup, the stock has a historic valuation of 9 PS Ratio and is currently trading at a 12 PS Ratio. Similarly, the 5-year median PE Ratio at the start of the year was 25 and the stock is currently trading at 36.

Microsoft PS Ratio

Source: YCHARTS

Conclusion:

AI will be a constantly evolving space and while many investors are rushing in at overstretched valuations, we prefer to be patient. Over time, we agree with the analyst that Microsoft’s competitive moat has positioned it to monetize the AI opportunity, much like with Azure and Microsoft 360, across its business lines so that its revenue will increase by $100B in the medium-term.

Microsoft is a real-deal AI stock and the increase in valuation has clearly factored in some of this. However, our updated sum-of-the parts analysis indicates there is still upside. Our current bull case price target is $440. As the story unfolds over the next few quarters, we see additional upside. However, in light of the strong rally from the Jan 2023 lows, we believe incorporating technical analysis to attempt to get the stock lower is important in determining optimal entry levels. In other words, the risk the stock sells off is much higher than usual right now. Sure, the stock price could continue to climb higher, but the world’s best investors favor being patient and buying when the market is in a state of fear rather than a state of greed. When we do add to our key positions, we issue real-time trade alerts. Learn more here.

Please note: The I/O Fund conducts research and draws conclusions for the Fund’s positions. We then share that information with our readers. This is not a guarantee of a stock’s performance. Please consult your personal financial advisor before buying any stock in the companies mentioned in this analysis.

Recommended Reading: