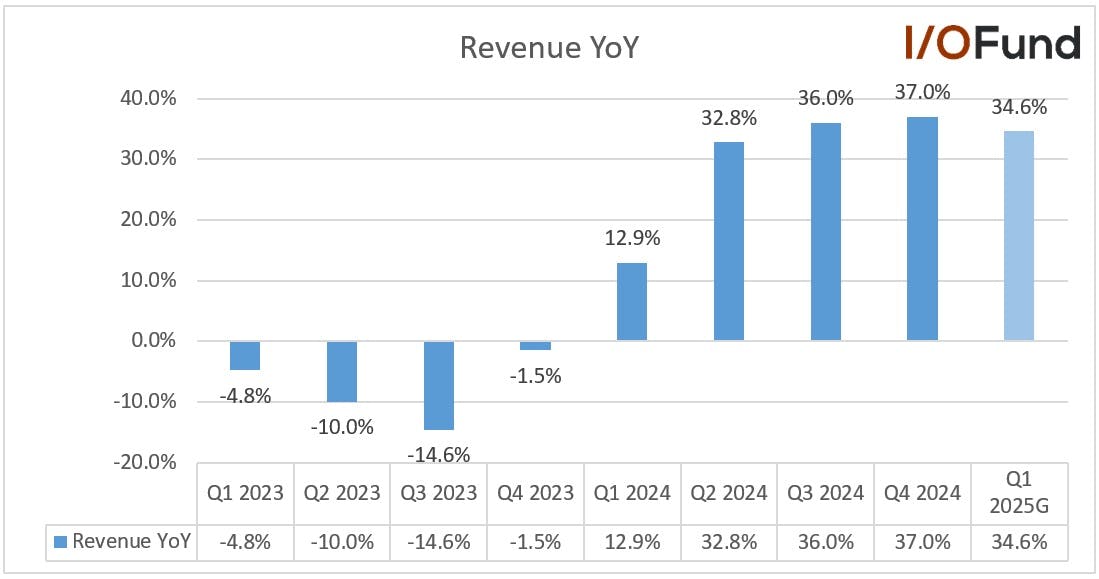
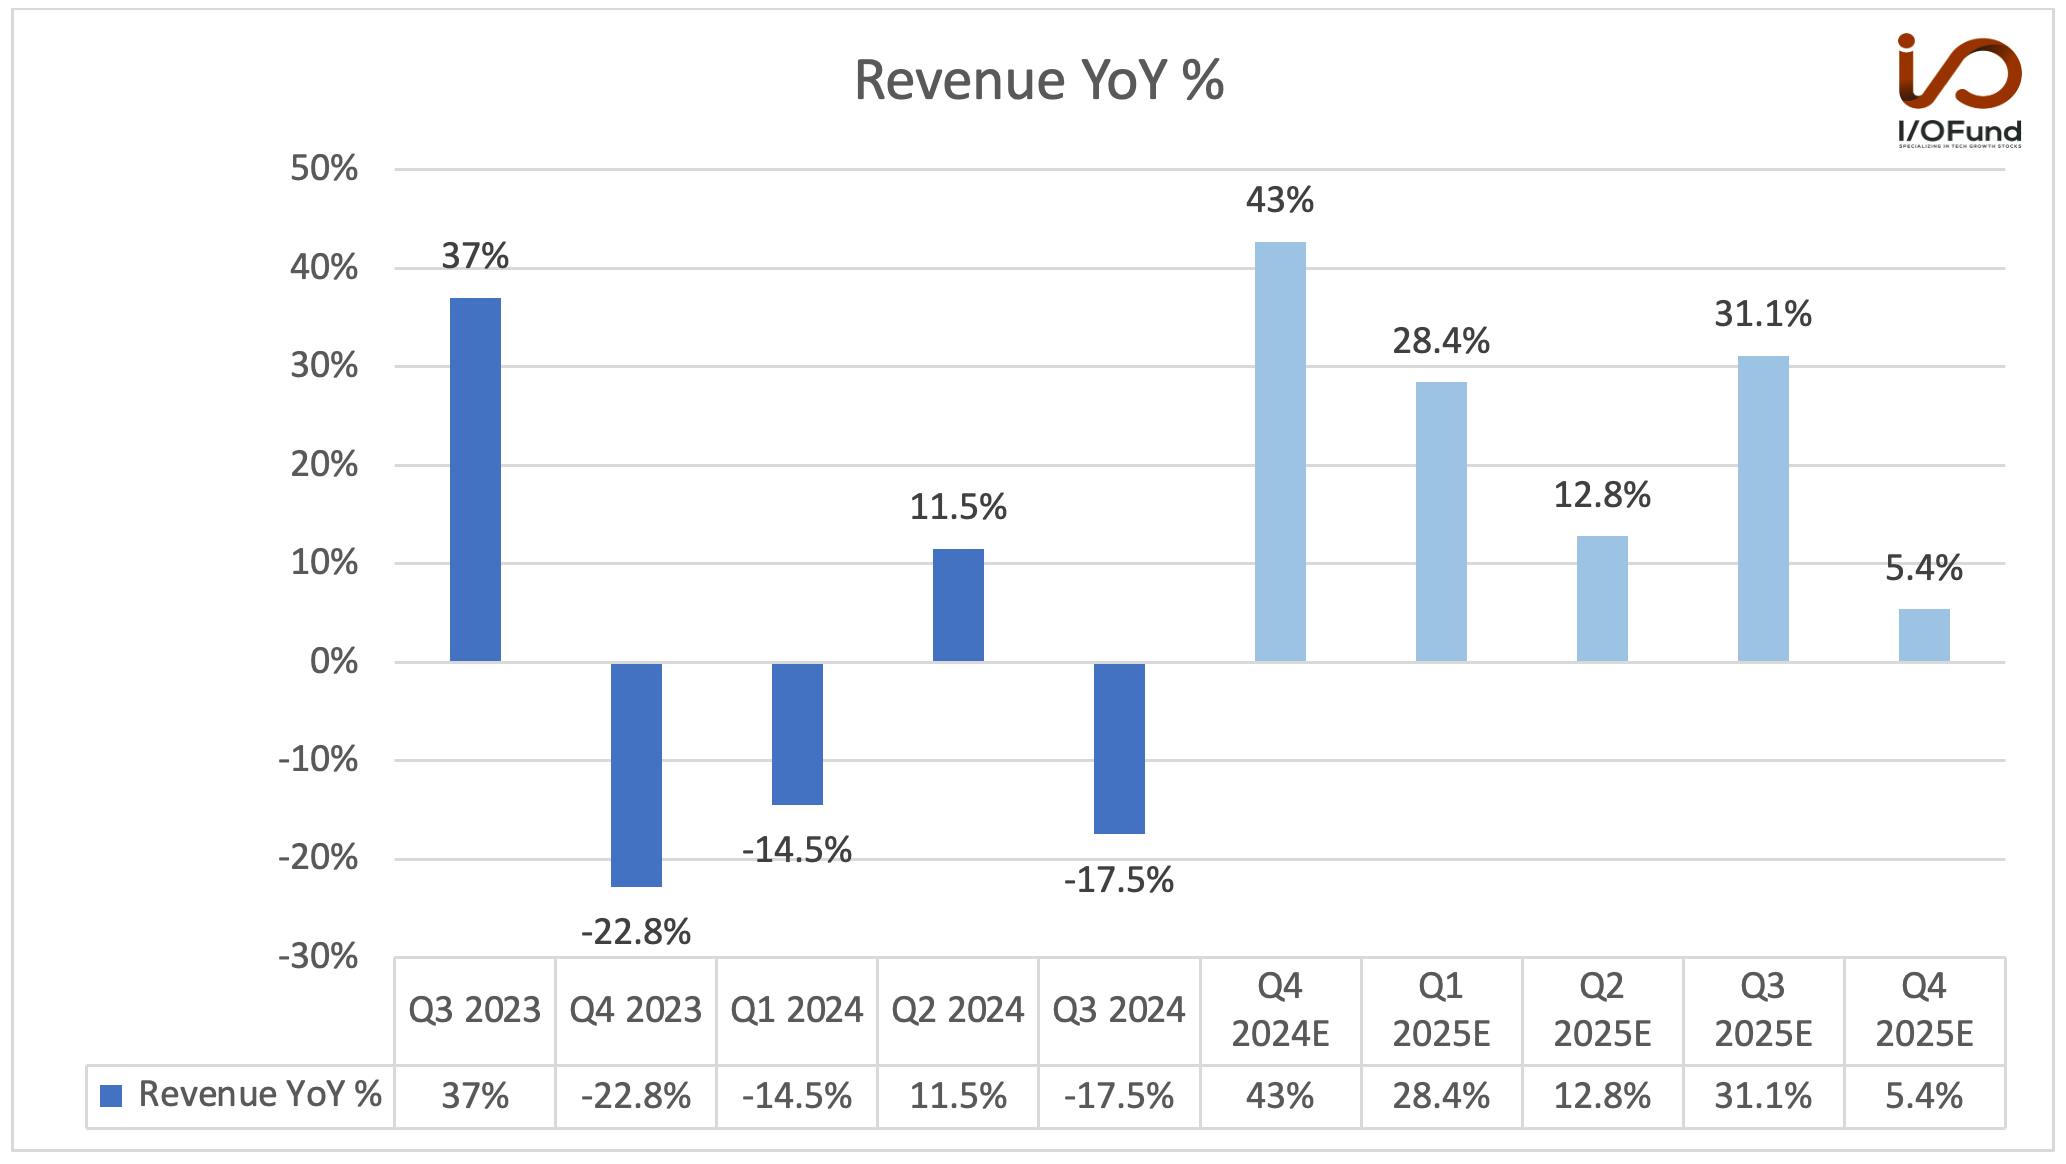
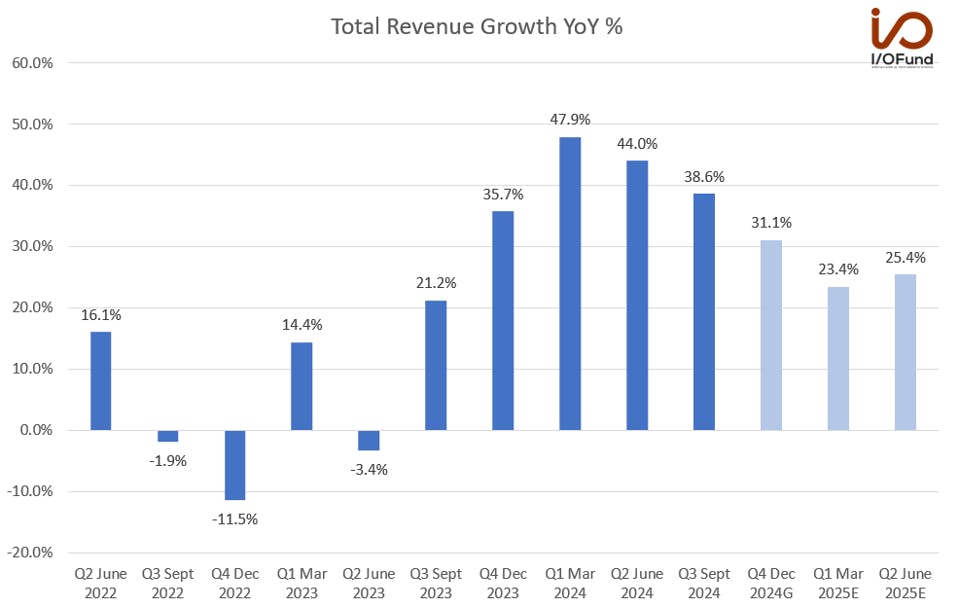
TSMC once again reported strong results led by robust AI chip demand. Q4 revenue grew by 37% YoY and 14.4% QoQ to $26.88 billion, beating the midpoint guide of $26.5 billion. The bottom line was even stronger, as EPS grew by 55.6% YoY to $2.24, beating analysts’ estimates by $0.01. Management also expects 2025 to be a strong year and expects revenue to grow close to mid-20s percent, led by strong AI demand.
Revenue
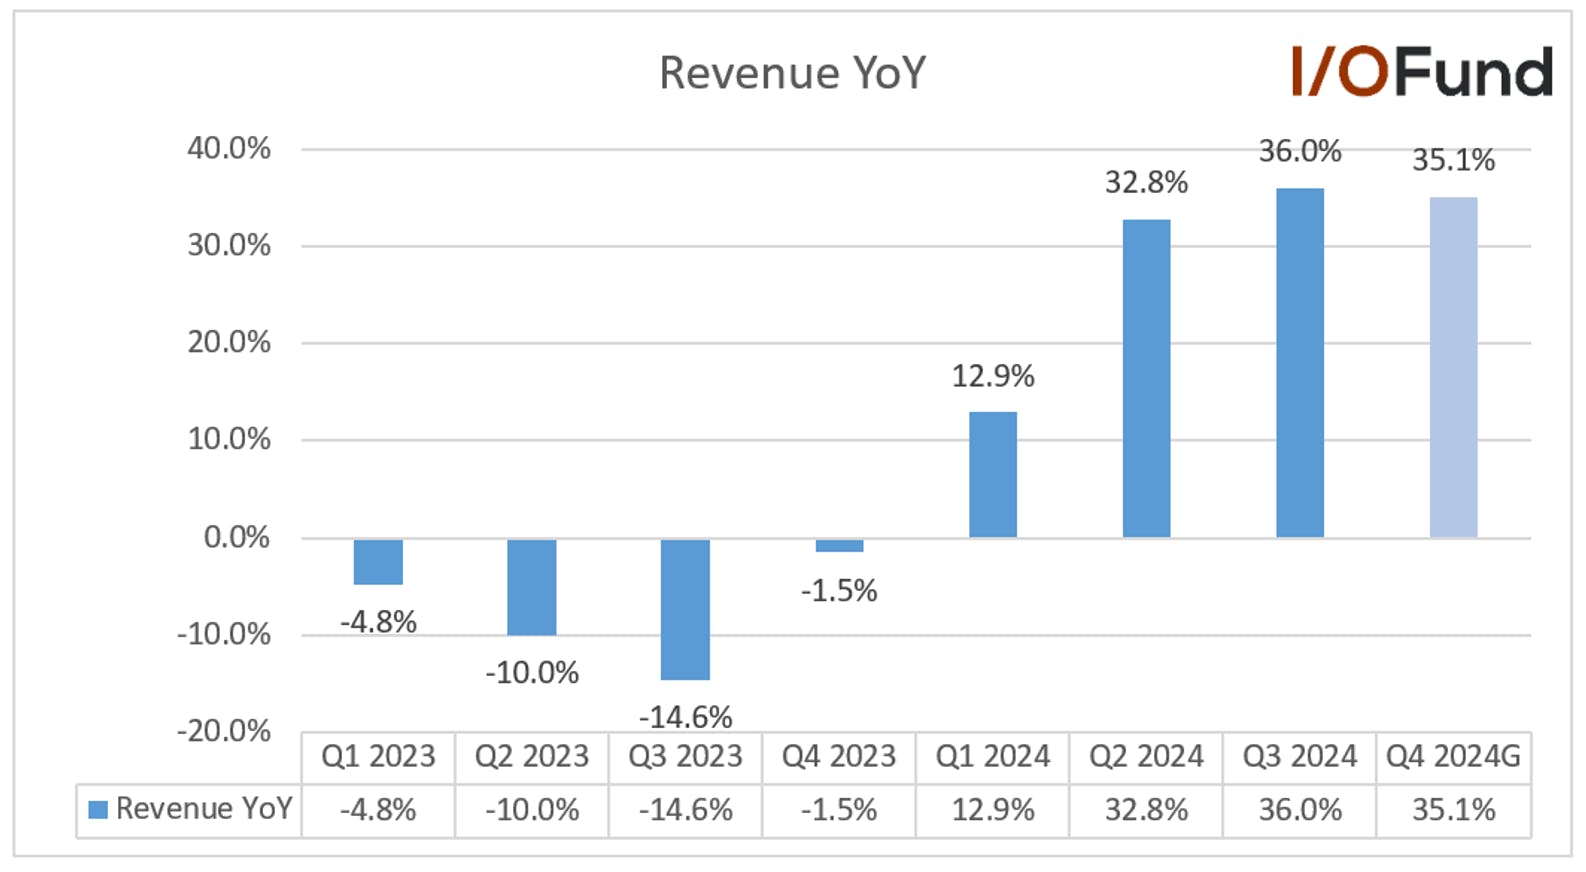
Q4 revenue grew by 37% YoY and 14.4% QoQ to $26.88 billion, driven by strong AI demand. Revenue came at the higher end of the guidance of $26.1 billion to $26.9 billion, beating the midpoint guide of $26.5 billion.
Management guide for the next quarter is $25 billion to $25.8 billion, representing YoY growth of 34.6% and down (-5.5%) QoQ at the midpoint. The sequential decline in the first quarter is due to smartphone seasonality.
“Our business in the fourth quarter was supported by strong demand for our industry-leading 3nm and 5nm technologies,” said Wendell Huang, CFO of TSMC. “Moving into first quarter 2025, we expect our business to be impacted by smartphone seasonality, partially offset by continued growth in AI-related demand.”
2024 revenue grew by 30% YoY to $90 billion, driven by robust AI-related demand. Revenue from AI accelerators, which they define as AI GPU, AI ASICs and HBM controllers for AI training and inference in the data center, accounted for close to mid-teens percent in 2024.
AI revenue tripled in 2024 and management expects it to double in 2025, as strong AI-related demand will continue in 2025. For the full year 2025, management expects total revenue to grow close to mid-20s percent in US dollar terms.
Management expects AI accelerators to grow mid-40% CAGR for the next five years and expects AI accelerators to be the strongest driver of the HPC platform growth and the largest contributor in terms of the overall incremental revenue growth in the next several years.
For the long term, management expects total revenue growth to grow 20% CAGR, driven by growth in all four platforms: smartphone, HPC, IoT, and automotive.
Margins
Margins continue to expand due to cost controls, higher capacity utilization rates, economies of scale, and better price negotiation with customers.
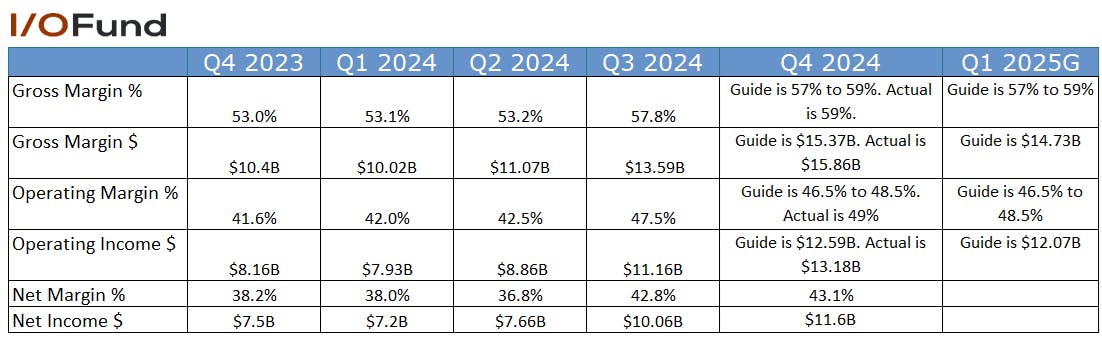
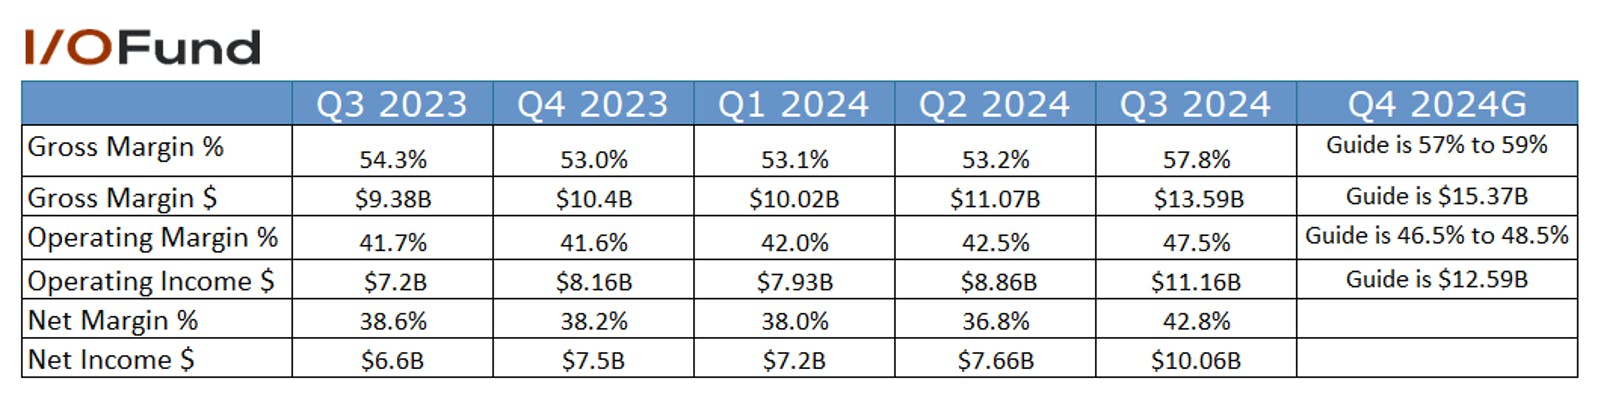
Q4 gross margin was 59%, up from 53% in the same period last year and 57.8% in Q3. The strong gross margin was driven by a higher capacity utilization rate and productivity gains, partially offset by the dilution of 3-nanometer ramp-up.
Management has guided gross margin to decrease 100 bps sequentially to 58% at the mid-point, primarily due to ramp-up costs associated with N2 and CoWoS expansion, and the start of dilution from the overseas fabs. However, gross margin is expected to be up from 53.1% in the same period last year.
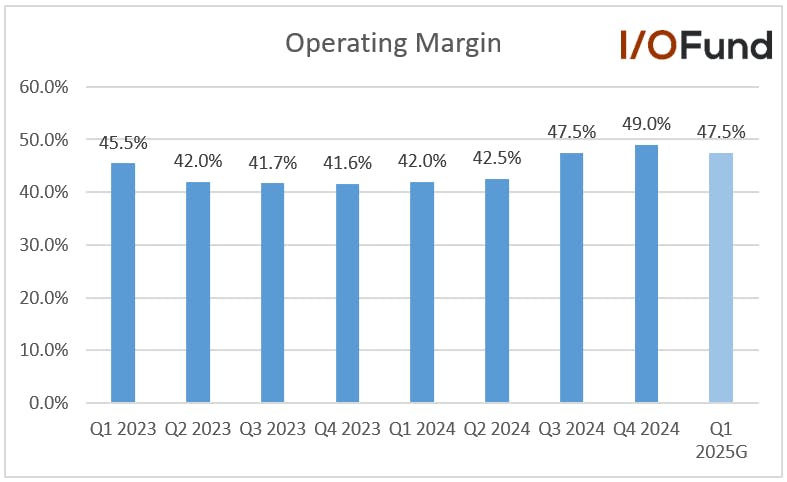
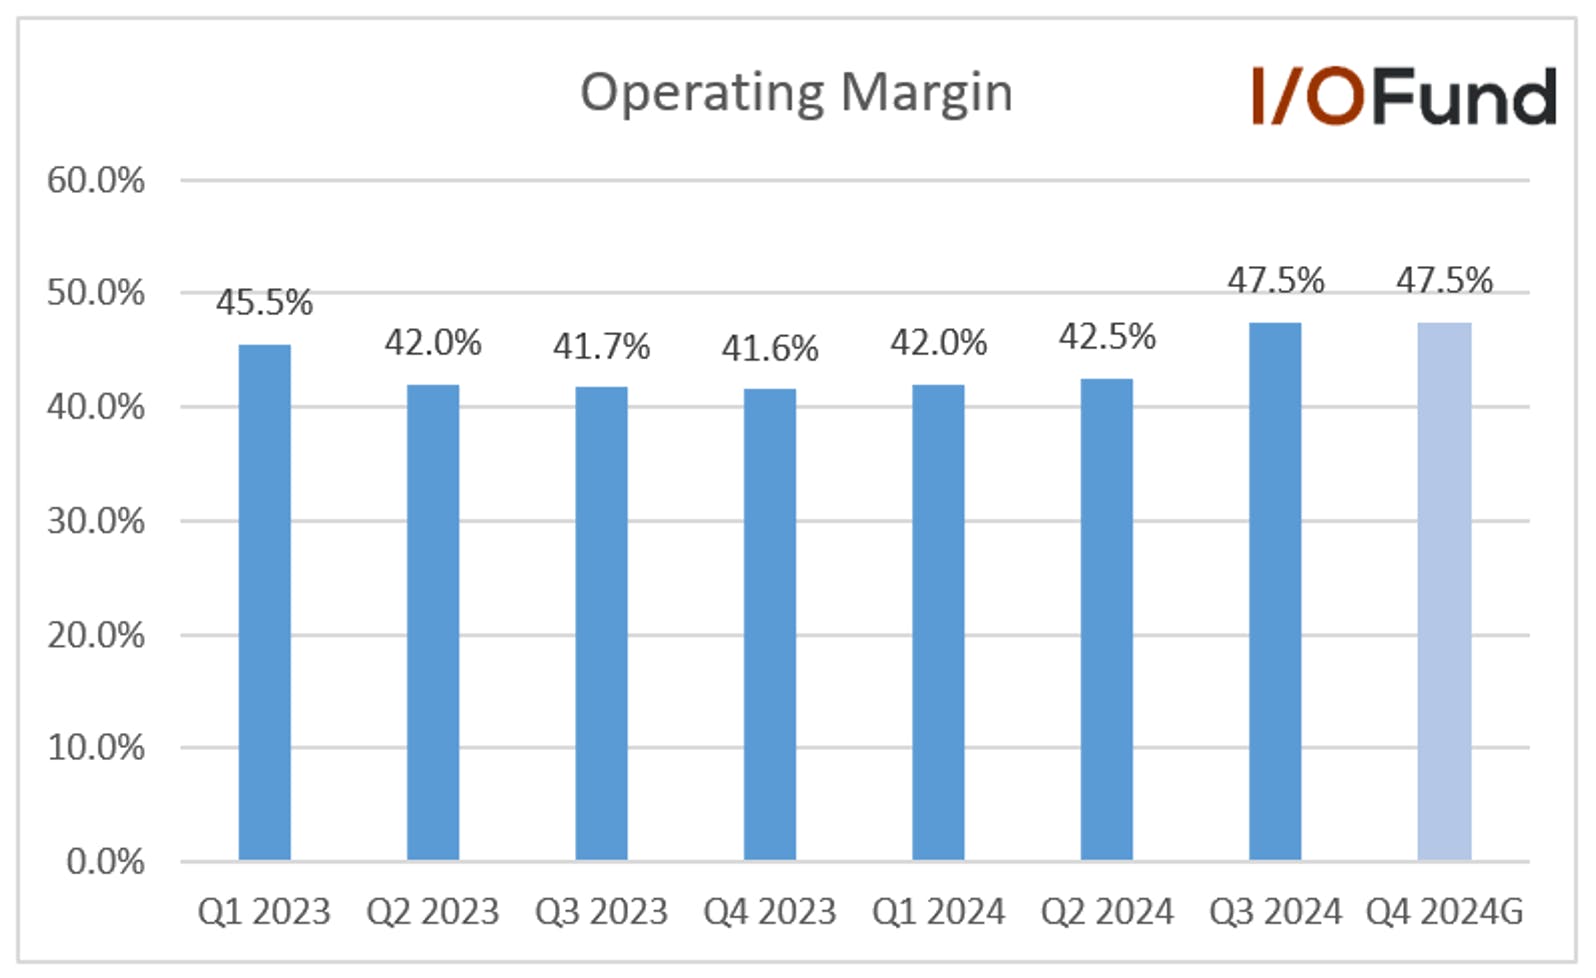
Operating margin improved to 49% from 41.6% in the same period last year and 47.5% in Q3. It beat the midpoint guide of 47.5% driven by operating leverage. Management guide for next quarter is 47.5%, up from 42% in the same period last year.
Net income grew by 54.7% YoY to a record $11.6 billion or 43.1% of revenue compared to 38.2% in the same period last year.
Return on equity improved to 36.2% from 28.1% in the same period last year.
2024 gross margin improved to 56.1% from 54.4% in 2023, driven by cost controls, improvements in overall capacity utilization, and partially offset by 3-nanometer dilution and higher electricity costs.
2024 operating margin improved to 45.7% from 42.6% in 2023, which was helped by operating leverage.
Management expects inflationary cost pressures and higher electricity prices in Taiwan will negatively impact the gross margin by at least 1% in 2025. In addition, the ramp-up costs associated with N2 and further conversion of N5 to N3 capacity will negatively impact the gross margin by about 1%. Also, the overseas fabs are expected to have 2% to 3% margin dilution every year. Management is working with its customers to negotiate better prices to improve the margins; along with it the dilution from the N3 ramp is expected to gradually reduce in 2025 and the overall utilization rate to moderately increase in 2025.
Over the long term, management has reiterated that a 53% or higher gross margin is achievable.
EPS
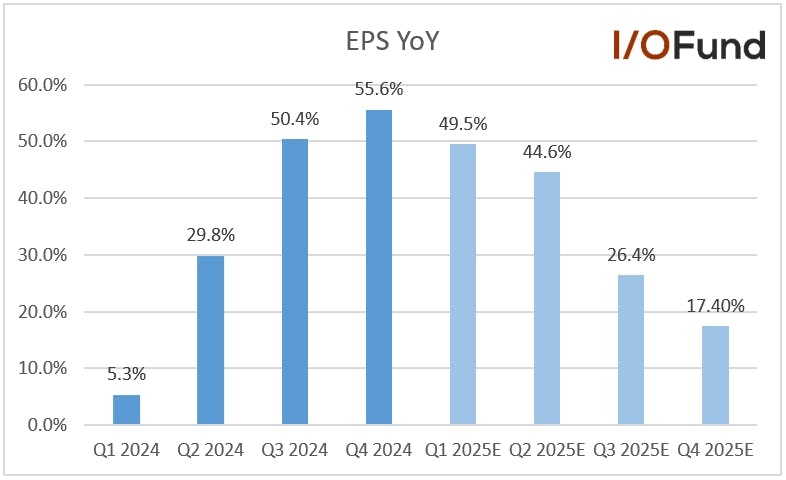
EPS grew by 55.6% YoY to $2.24, beating estimates by $0.01, driven by cost controls, higher capacity utilization rate, and economies of scale.
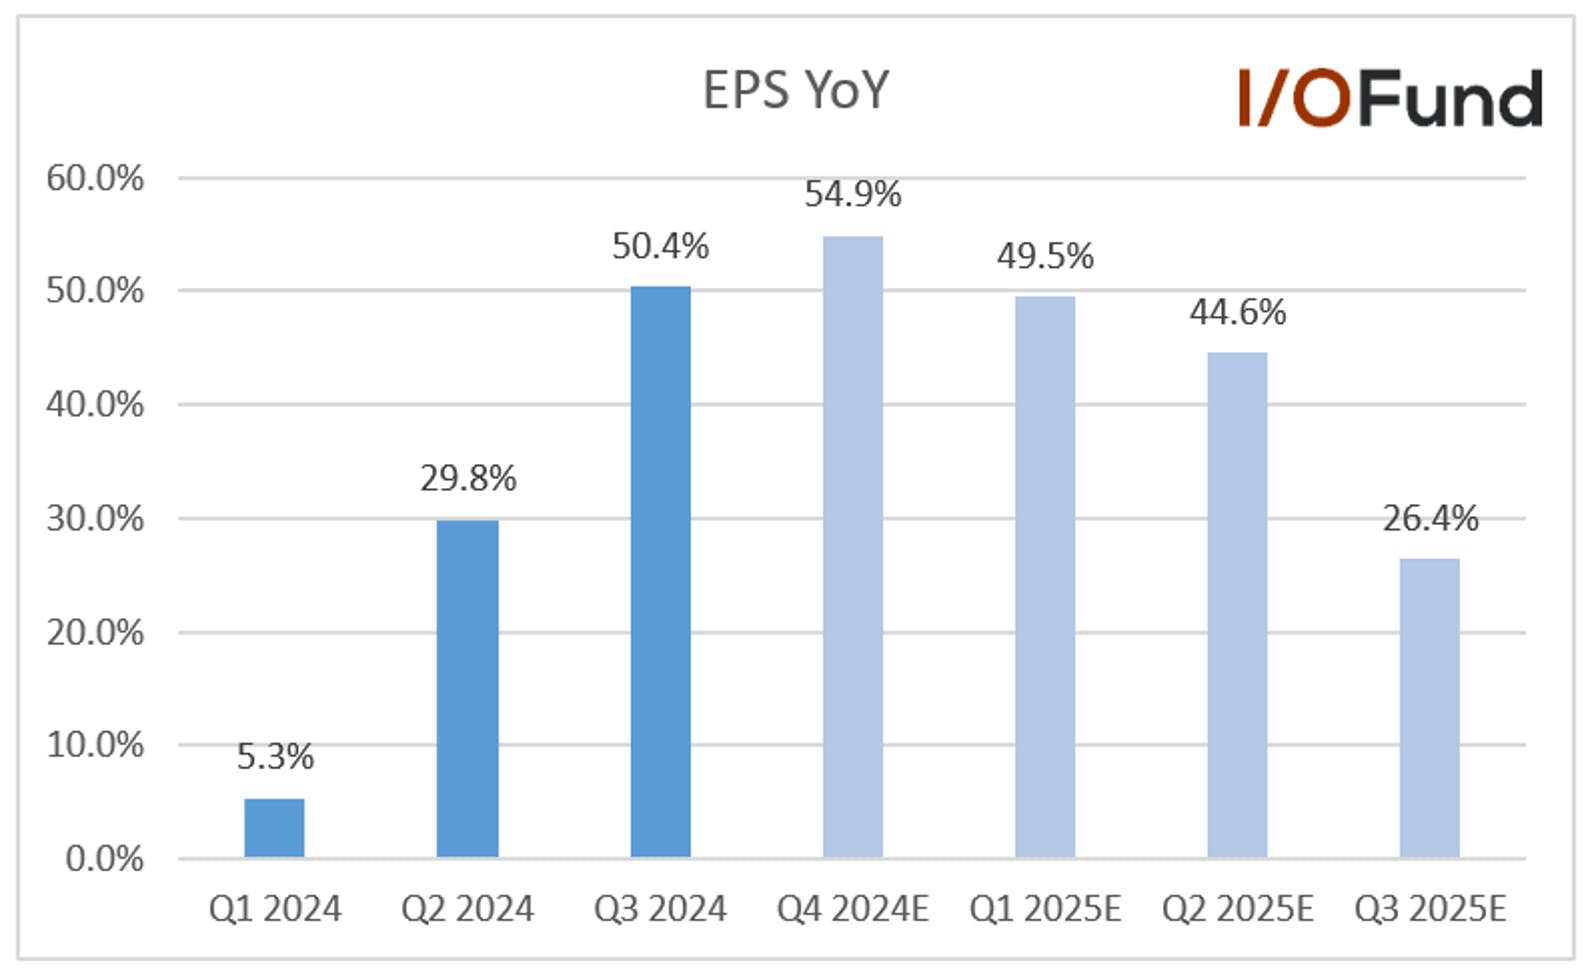
Analysts expect Q1 EPS to grow 49.5% YoY to $2.06 and Q2 EPS to grow 44.6% YoY to $2.14.
Looking further out, analysts expect 2025 EPS to grow 32.1% YoY to $9.27 and 16.1% YoY to $10.76 in 2026.
Cash Flows and Balance Sheet
The company’s financial stability is evident in its stable cash flow generation.
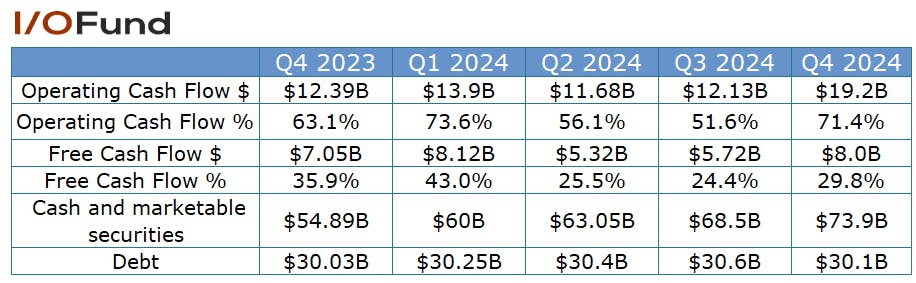
Q4 operating cash flow was $19.2 billion or 71.4% of revenue compared to 63.1% in the same period last year.
Q4 free cash flow was $8.0 billion or 29.8% of revenue compared to $7.05 billion or 35.9% in the same period last year. Capex increased 114.3% YoY to $11.23 billion.
The company spent $29.8 billion in capex in 2024, down (-2.3%) YoY. However, due to strong AI demand, capex is expected to increase in 2025 to $38 billion to $42 billion, up 34.4% at the midpoint.
Cash and marketable securities were $73.9 billion and debt of $30.1 billion compared to $68.5 billion and $30.6 billion at the end of Q3.
Revenue by Platform
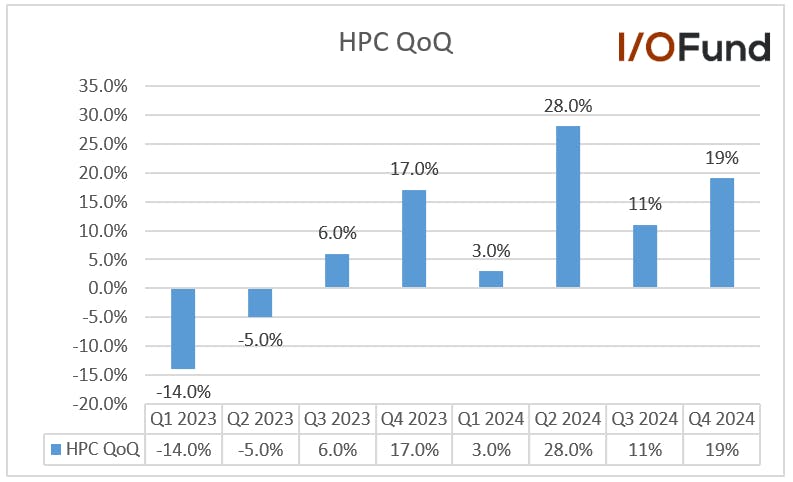
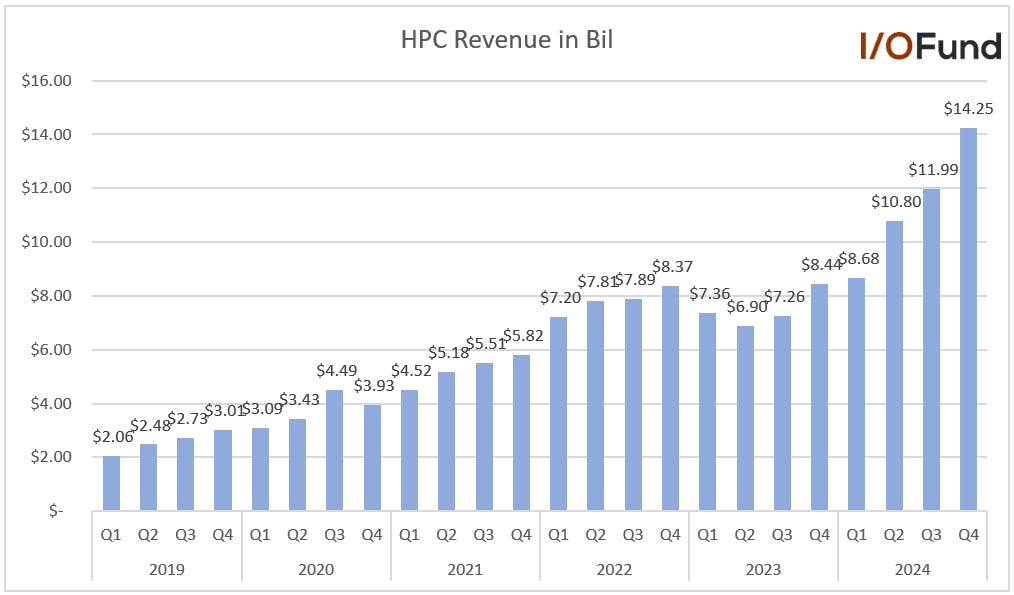
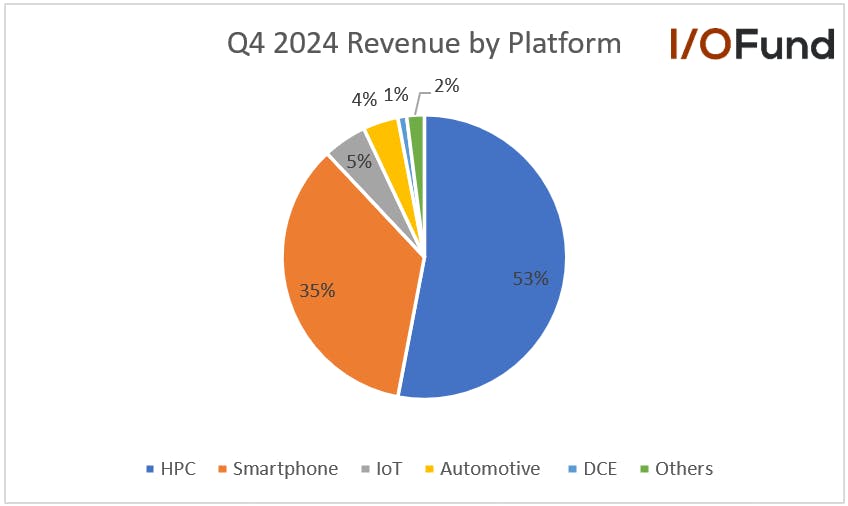
As the leading foundry for AI accelerators, TSMC is riding the enormous wave of demand from Big Tech. The chipmaker’s high-performance computing (HPC) revenues rose 19% QoQ to a record $14.25 billion and accounted for 53% of revenue, surpassing the 50% mark for the third time. Management expects AI accelerators to be the strongest driver of the HPC platform growth in the next several years.
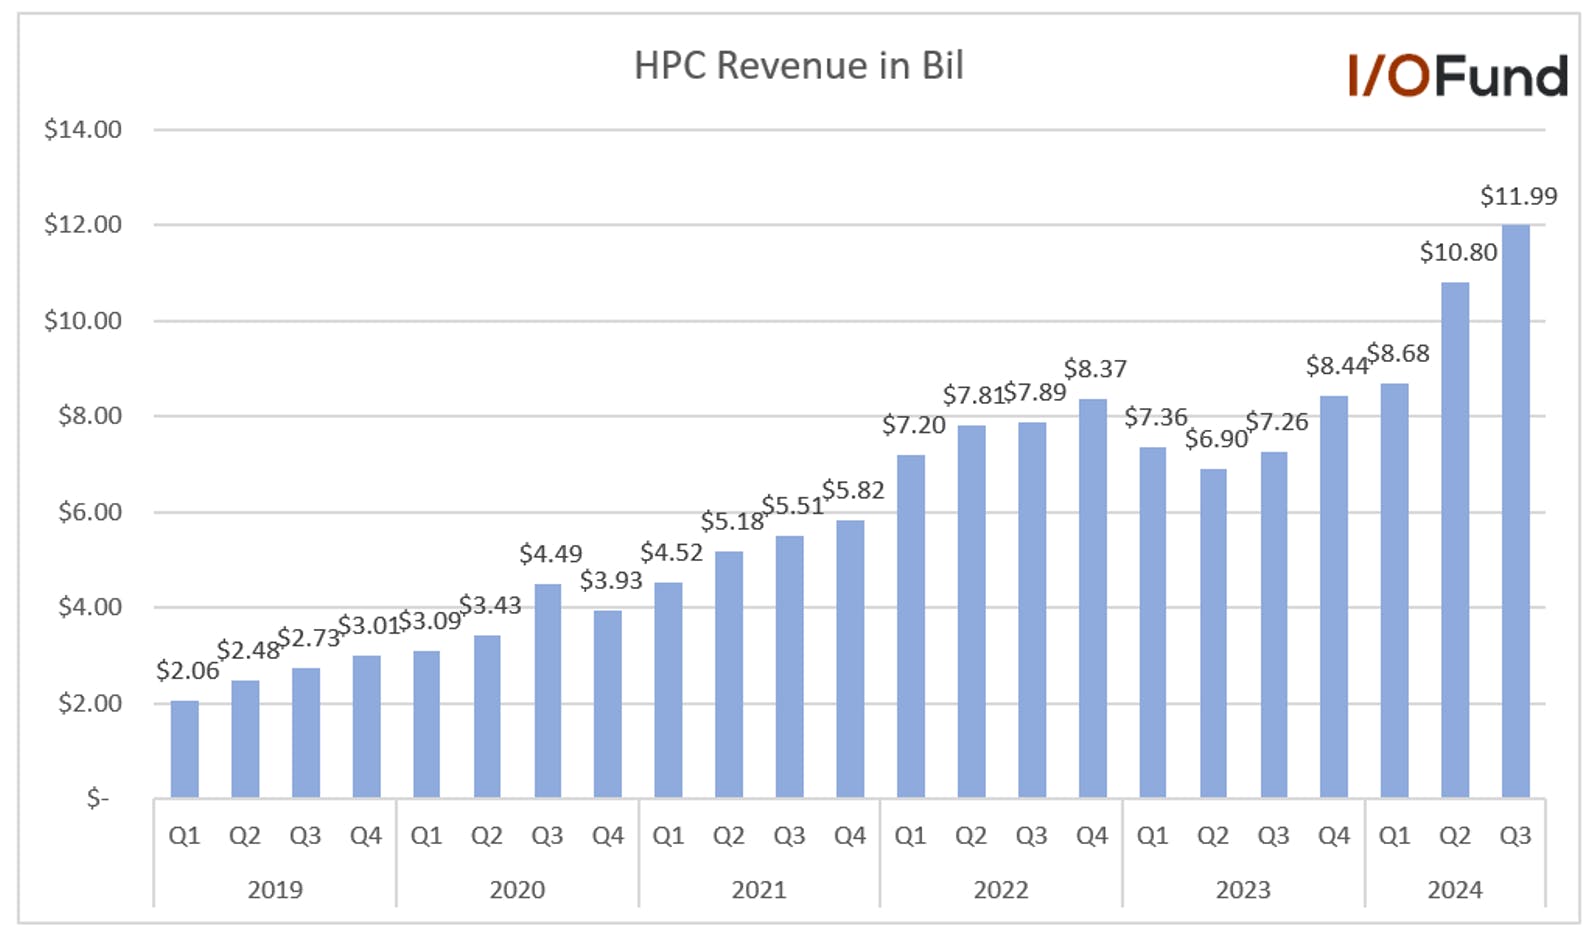
The chart below also shows that HPC revenue reached a record $14.25 billion – its largest sequential increase to date at ~$2.26 billion.
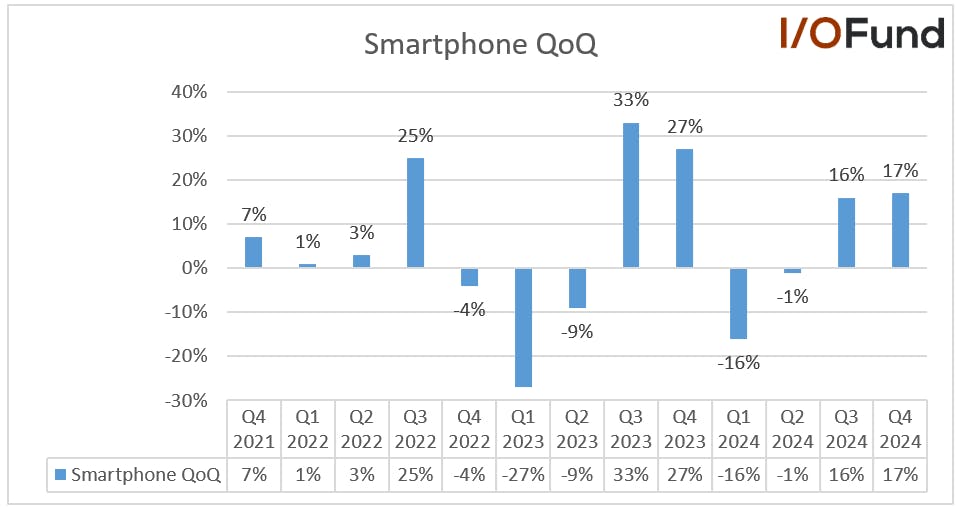
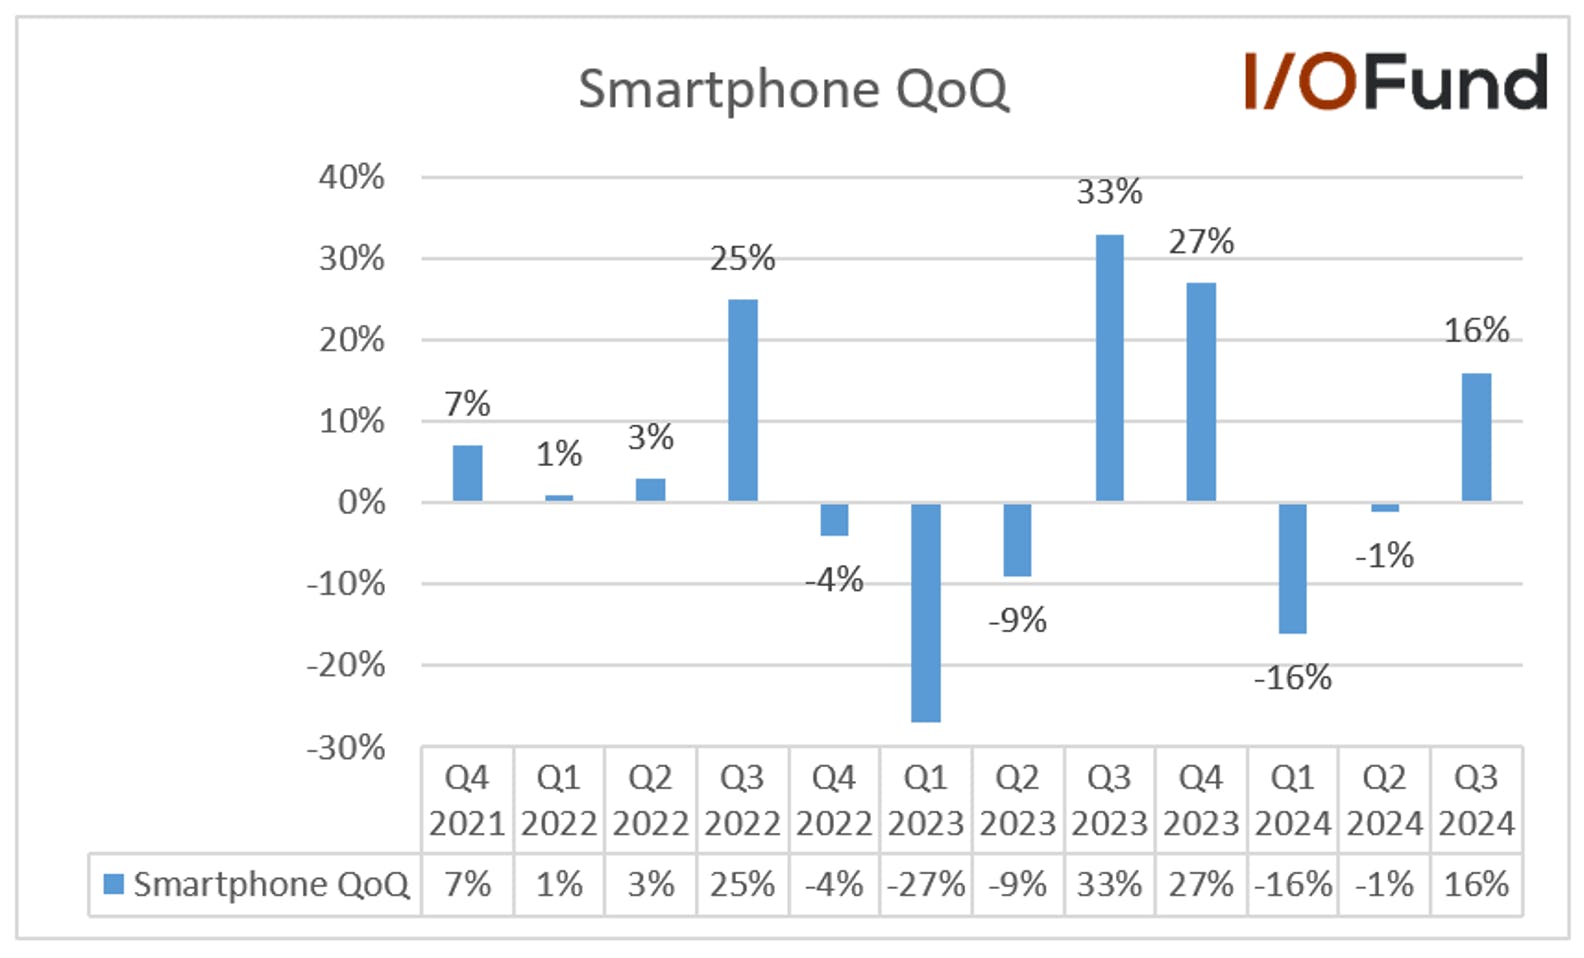
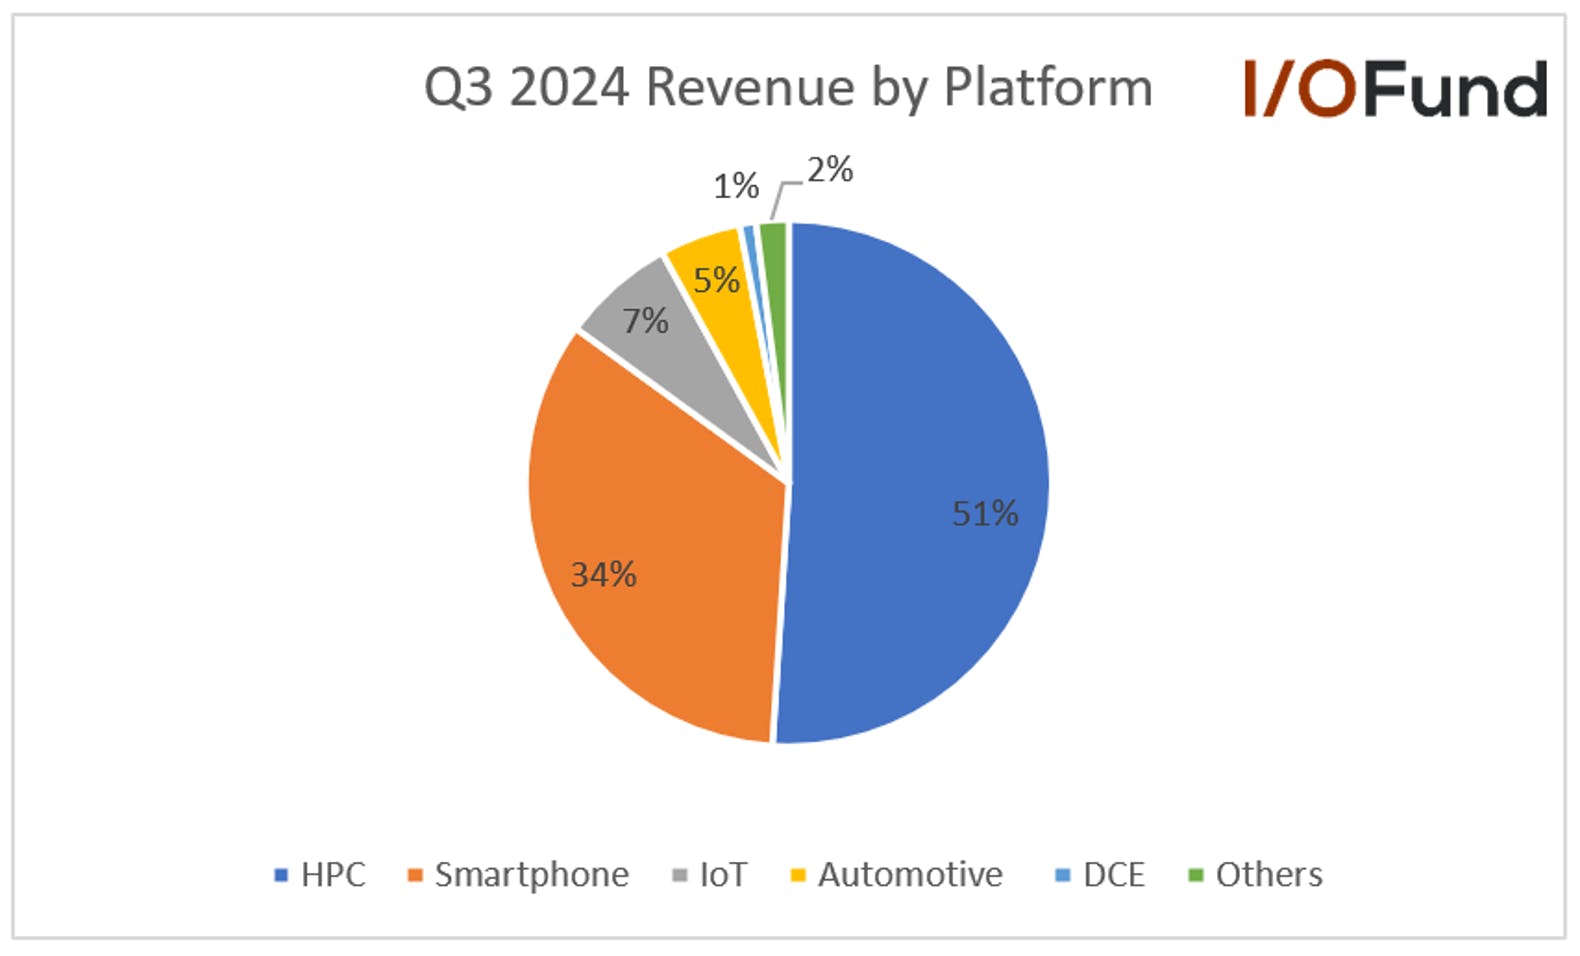
Smartphone grew by 17% sequentially to account for 35% of revenue from 34% of revenue in Q3.
The IoT decreased (-15%) sequentially to account for 5% of revenue. Automotive increased 6% to account for 4% of revenue. Digital Consumer Electronics decreased (-6%) to account for 1% of revenue. Others increased 2% and accounted for 2%.
Revenue by Technology
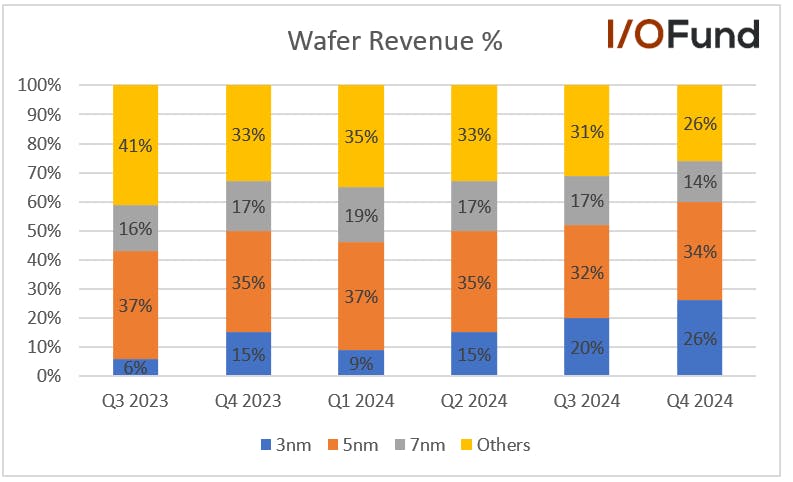
TSMC’s Advanced nodes are defined as 7-nanometer and below. These nodes accounted for 74% of wafer revenue compared to 69% in Q3.
In Q4 2024, 3-nanometer process technology contributed to 26% of wafer revenue, while 5-nanometer and 7-nanometer accounted for 34% and 14%, respectively.
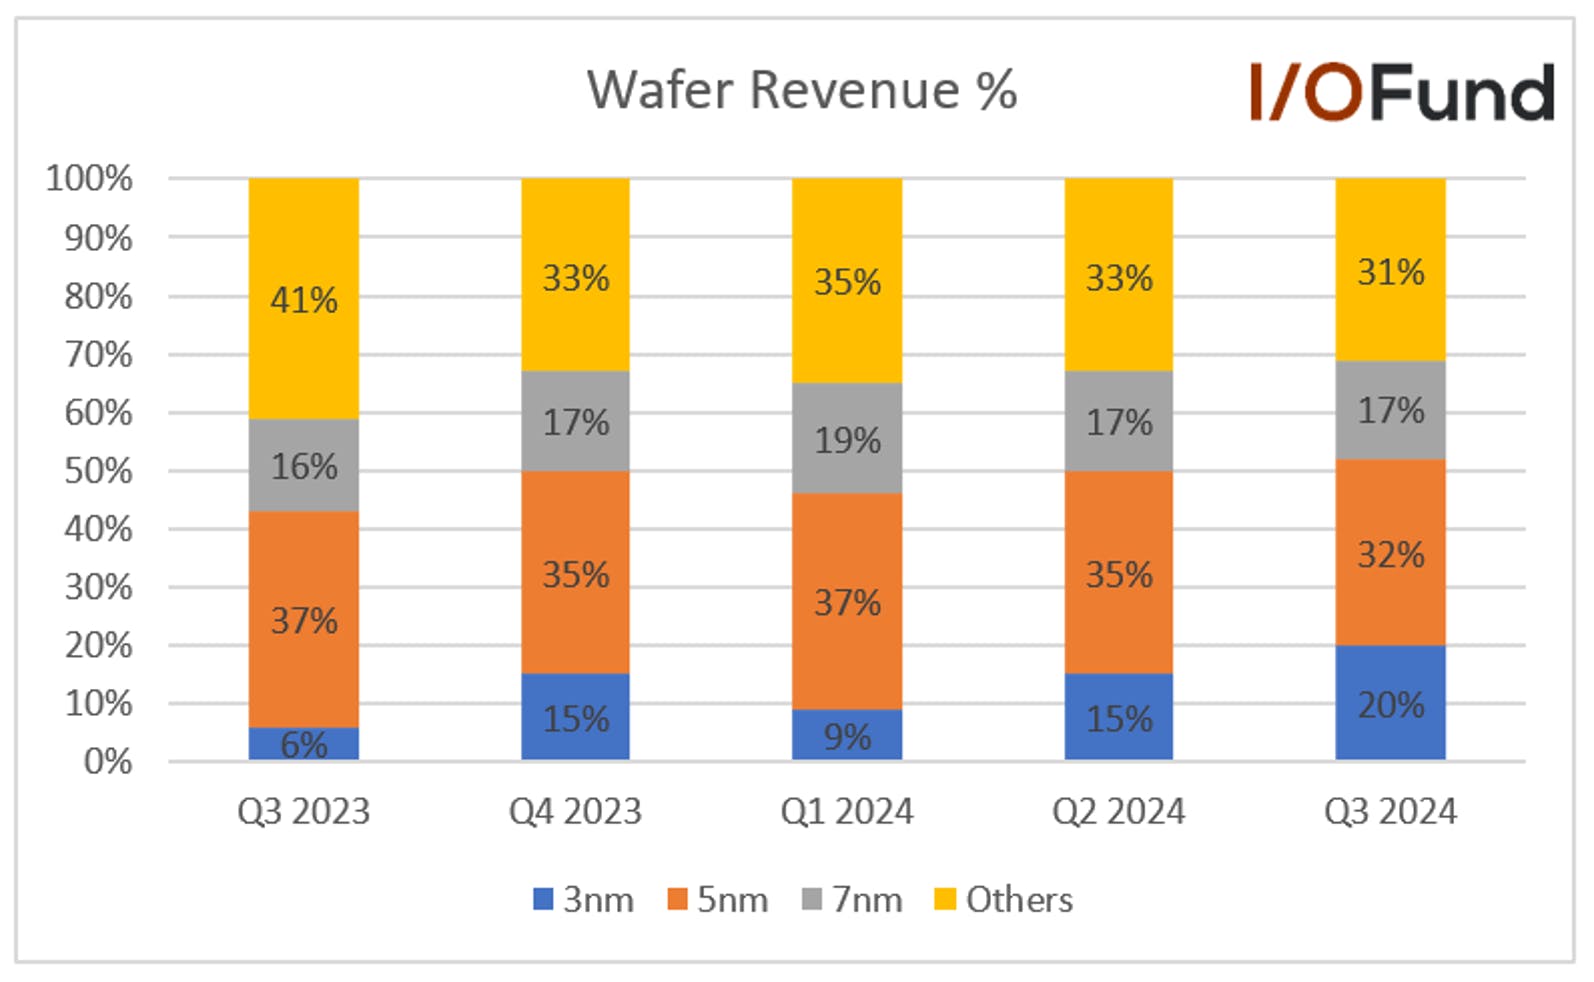
In Q3 2024, 3-nanometer process technology contributed 20% of wafer revenue, while 5-nanometer and 7-nanometer accounted for 32% and 17%, respectively.
Earnings Call: AI Accelerator Contribution, Margin Headwinds Discussed
TSMC’s management provided optimistic long-term growth and AI revenue forecasts on the earnings call, while also updating on international expansion efforts, some margin headwinds and capex.
Commenting on the broader industry, CEO C.C. Wei said that he expects the foundry industry to “grow 10% year-over-year in 2025, supported by robust AI-related demand and a mild recovery in other end market segments.” He believes TSMC can once again outperform the industry’s growth due to its broad customer base and technological leadership, forecasting revenue growth in USD close to the mid-20% range. This came in line with some analyst forecasts for 20% to 25% growth in 2025. Management provided some thin details on the segment breakdown for the year, saying that 2025 is “still a mild growth 2026 for PC and smartphone, but everything is AI-related.”
AI accelerators are playing an increasingly large role in TSMC’s long-term growth – TSMC forecast AI accelerator revenue growth at a 40% CAGR from 2024 to 2029, expecting it to be the strongest driver of HPC growth as well as the “largest contributor in terms of our overall incremental revenue growth in the next several years.”
Though margins were arguably very strong in Q4 – gross margin at the high end of the guided range and operating margin above the guided range – management discussed margin headwinds as Q1 is set to see some slight sequential contraction.
Management explained that they have guided Q1 gross margin to decrease 100 bp to 58% at midpoint due to “ramp costs associated with N2 and CoWoS expansion, and the start of dilution from our overseas fabs.” They clarified that these are a few of six significant factors that determine margins: tech development and ramp-up, cost reduction efforts, platform mix, pricing, capacity utilization, and forex.
For the full year, management said there were a few “puts and takes.” One of the primary headwinds includes 2% to 3% dilution impacts from ramping up production at the Arizona and Kumamoto fabs throughout the year, while other headwinds include at least a 1% impact from electricity price hikes in Taiwan, and a 1% impact from retooling from 5nm to 3nm capacity and some additional 2nm ramp. However, offsetting these headwinds are gradual reduction in dilution from the 3nm ramp this year (3nm now accounts for 18% of revenue), and utilization rate moderately increasing in 2025.
Capex was also discussed, with TSMC seeing 2025’s capex slightly ahead of estimates to support demand and capacity expansion plans. For 2024, capex totaled $29.8 billion, with management guiding for capex of $38 billion to $42 billion, or ~34% growth at midpoint; this compares to the $38 to $40 billion estimated by analysts. Of this budget, “about 70% of the capital budget will be allocated for advanced process technologies, about 10% to 20% will be spent for specialty technologies, and about 10% to 20% will be spent for advanced packaging, testing, mask making and others.”
TSMC was rather tight lipped about capacity expansion plans for CoWoS despite multiple analysts asking for more details about its capacity, ramp and revenue contribution. Management simply said that they have “very tight capacity and cannot even meet customers' needs” and they are working “very hard” to increase CoWoS capacity.
On the advanced node front, the 2 nanometer node is “well on track” for volume production in the second half of this year as previously scheduled, with TSMC expecting it to ramp similarly to the 3nm node. However, management added that the tape out in the first two years is expected to be higher than both 3nm and 5nm in their respective ramps due to the strong customer interest and demand for the new node.
Additionally, management shared some updates on international fab expansion, noting that its first fab in Arizona entered high volume production in Q4 with yields comparable to Taiwan. They expect the 4nm node there to ramp smoothly, with construction on the second and third fab in Arizona (set to produce 3nm, 2nm and A16), on track. Japan’s Kumamoto fab began volume production with “record yield”, while the second specialty fab in Japan is expected to break ground this year. TSMC also shared that they are smoothly progressing with plans to build a specialty automotive and industrial-focused fab in Dresden, Germany.
Conclusion
The company’s strong results showed its resilience in capturing the demand for advanced chips due to its technological leadership. Management was optimistic on the long-term forecast for AI revenue growth over the next few years supported by high demand from customers. Strong top-line growth, along with the bottom-line strength, distinguishes TSMC from other companies that are struggling in the current tough macro environment.
I/O Fund Equity Analysts Royston Roche and Damien Robbins contributed to this article.
Please note: The I/O Fund conducts research and draws conclusions for the Fund’s positions. We then share that information with our readers. This is not a guarantee of a stock’s performance. Please consult your personal financial advisor before buying any stock in the companies mentioned in this analysis.
TSMC once again reported strong results led by robust AI chip demand. Q4 revenue grew by 37% YoY and 14.4% QoQ to $26.88 billion, beating the midpoint guide of $26.5 billion. The bottom line was even stronger, as EPS grew by 55.6% YoY to $2.24, beating analysts’ estimates by $0.01. Management also expects 2025 to be a strong year and expects revenue to grow close to mid-20s percent, led by strong AI demand.
Revenue
Q4 revenue grew by 37% YoY and 14.4% QoQ to $26.88 billion, driven by strong AI demand. Revenue came at the higher end of the guidance of $26.1 billion to $26.9 billion, beating the midpoint guide of $26.5 billion.
Management guide for the next quarter is $25 billion to $25.8 billion, representing YoY growth of 34.6% and down (-5.5%) QoQ at the midpoint. The sequential decline in the first quarter is due to smartphone seasonality.
“Our business in the fourth quarter was supported by strong demand for our industry-leading 3nm and 5nm technologies,” said Wendell Huang, CFO of TSMC. “Moving into first quarter 2025, we expect our business to be impacted by smartphone seasonality, partially offset by continued growth in AI-related demand.”
2024 revenue grew by 30% YoY to $90 billion, driven by robust AI-related demand. Revenue from AI accelerators, which they define as AI GPU, AI ASICs and HBM controllers for AI training and inference in the data center, accounted for close to mid-teens percent in 2024.
AI revenue tripled in 2024 and management expects it to double in 2025, as strong AI-related demand will continue in 2025. For the full year 2025, management expects total revenue to grow close to mid-20s percent in US dollar terms.
Management expects AI accelerators to grow mid-40% CAGR for the next five years and expects AI accelerators to be the strongest driver of the HPC platform growth and the largest contributor in terms of the overall incremental revenue growth in the next several years.
For the long term, management expects total revenue growth to grow 20% CAGR, driven by growth in all four platforms: smartphone, HPC, IoT, and automotive.
Margins
Margins continue to expand due to cost controls, higher capacity utilization rates, economies of scale, and better price negotiation with customers.
Q4 gross margin was 59%, up from 53% in the same period last year and 57.8% in Q3. The strong gross margin was driven by a higher capacity utilization rate and productivity gains, partially offset by the dilution of 3-nanometer ramp-up.
Management has guided gross margin to decrease 100 bps sequentially to 58% at the mid-point, primarily due to ramp-up costs associated with N2 and CoWoS expansion, and the start of dilution from the overseas fabs. However, gross margin is expected to be up from 53.1% in the same period last year.
Operating margin improved to 49% from 41.6% in the same period last year and 47.5% in Q3. It beat the midpoint guide of 47.5% driven by operating leverage. Management guide for next quarter is 47.5%, up from 42% in the same period last year.
Net income grew by 54.7% YoY to a record $11.6 billion or 43.1% of revenue compared to 38.2% in the same period last year.
Return on equity improved to 36.2% from 28.1% in the same period last year.
2024 gross margin improved to 56.1% from 54.4% in 2023, driven by cost controls, improvements in overall capacity utilization, and partially offset by 3-nanometer dilution and higher electricity costs.
2024 operating margin improved to 45.7% from 42.6% in 2023, which was helped by operating leverage.
Management expects inflationary cost pressures and higher electricity prices in Taiwan will negatively impact the gross margin by at least 1% in 2025. In addition, the ramp-up costs associated with N2 and further conversion of N5 to N3 capacity will negatively impact the gross margin by about 1%. Also, the overseas fabs are expected to have 2% to 3% margin dilution every year. Management is working with its customers to negotiate better prices to improve the margins; along with it the dilution from the N3 ramp is expected to gradually reduce in 2025 and the overall utilization rate to moderately increase in 2025.
Over the long term, management has reiterated that a 53% or higher gross margin is achievable.
EPS
EPS grew by 55.6% YoY to $2.24, beating estimates by $0.01, driven by cost controls, higher capacity utilization rate, and economies of scale.
Analysts expect Q1 EPS to grow 49.5% YoY to $2.06 and Q2 EPS to grow 44.6% YoY to $2.14.
Looking further out, analysts expect 2025 EPS to grow 32.1% YoY to $9.27 and 16.1% YoY to $10.76 in 2026.
Cash Flows and Balance Sheet
The company’s financial stability is evident in its stable cash flow generation.
Q4 operating cash flow was $19.2 billion or 71.4% of revenue compared to 63.1% in the same period last year.
Q4 free cash flow was $8.0 billion or 29.8% of revenue compared to $7.05 billion or 35.9% in the same period last year. Capex increased 114.3% YoY to $11.23 billion.
The company spent $29.8 billion in capex in 2024, down (-2.3%) YoY. However, due to strong AI demand, capex is expected to increase in 2025 to $38 billion to $42 billion, up 34.4% at the midpoint.
Cash and marketable securities were $73.9 billion and debt of $30.1 billion compared to $68.5 billion and $30.6 billion at the end of Q3.
Revenue by Platform
As the leading foundry for AI accelerators, TSMC is riding the enormous wave of demand from Big Tech. The chipmaker’s high-performance computing (HPC) revenues rose 19% QoQ to a record $14.25 billion and accounted for 53% of revenue, surpassing the 50% mark for the third time. Management expects AI accelerators to be the strongest driver of the HPC platform growth in the next several years.
The chart below also shows that HPC revenue reached a record $14.25 billion – its largest sequential increase to date at ~$2.26 billion.
Smartphone grew by 17% sequentially to account for 35% of revenue from 34% of revenue in Q3.
The IoT decreased (-15%) sequentially to account for 5% of revenue. Automotive increased 6% to account for 4% of revenue. Digital Consumer Electronics decreased (-6%) to account for 1% of revenue. Others increased 2% and accounted for 2%.
Revenue by Technology
TSMC’s Advanced nodes are defined as 7-nanometer and below. These nodes accounted for 74% of wafer revenue compared to 69% in Q3.
In Q4 2024, 3-nanometer process technology contributed to 26% of wafer revenue, while 5-nanometer and 7-nanometer accounted for 34% and 14%, respectively.
In Q3 2024, 3-nanometer process technology contributed 20% of wafer revenue, while 5-nanometer and 7-nanometer accounted for 32% and 17%, respectively.
Earnings Call: AI Accelerator Contribution, Margin Headwinds Discussed
TSMC’s management provided optimistic long-term growth and AI revenue forecasts on the earnings call, while also updating on international expansion efforts, some margin headwinds and capex.
Commenting on the broader industry, CEO C.C. Wei said that he expects the foundry industry to “grow 10% year-over-year in 2025, supported by robust AI-related demand and a mild recovery in other end market segments.” He believes TSMC can once again outperform the industry’s growth due to its broad customer base and technological leadership, forecasting revenue growth in USD close to the mid-20% range. This came in line with some analyst forecasts for 20% to 25% growth in 2025. Management provided some thin details on the segment breakdown for the year, saying that 2025 is “still a mild growth 2026 for PC and smartphone, but everything is AI-related.”
AI accelerators are playing an increasingly large role in TSMC’s long-term growth – TSMC forecast AI accelerator revenue growth at a 40% CAGR from 2024 to 2029, expecting it to be the strongest driver of HPC growth as well as the “largest contributor in terms of our overall incremental revenue growth in the next several years.”
Though margins were arguably very strong in Q4 – gross margin at the high end of the guided range and operating margin above the guided range – management discussed margin headwinds as Q1 is set to see some slight sequential contraction.
Management explained that they have guided Q1 gross margin to decrease 100 bp to 58% at midpoint due to “ramp costs associated with N2 and CoWoS expansion, and the start of dilution from our overseas fabs.” They clarified that these are a few of six significant factors that determine margins: tech development and ramp-up, cost reduction efforts, platform mix, pricing, capacity utilization, and forex.
For the full year, management said there were a few “puts and takes.” One of the primary headwinds includes 2% to 3% dilution impacts from ramping up production at the Arizona and Kumamoto fabs throughout the year, while other headwinds include at least a 1% impact from electricity price hikes in Taiwan, and a 1% impact from retooling from 5nm to 3nm capacity and some additional 2nm ramp. However, offsetting these headwinds are gradual reduction in dilution from the 3nm ramp this year (3nm now accounts for 18% of revenue), and utilization rate moderately increasing in 2025.
Capex was also discussed, with TSMC seeing 2025’s capex slightly ahead of estimates to support demand and capacity expansion plans. For 2024, capex totaled $29.8 billion, with management guiding for capex of $38 billion to $42 billion, or ~34% growth at midpoint; this compares to the $38 to $40 billion estimated by analysts. Of this budget, “about 70% of the capital budget will be allocated for advanced process technologies, about 10% to 20% will be spent for specialty technologies, and about 10% to 20% will be spent for advanced packaging, testing, mask making and others.”
TSMC was rather tight lipped about capacity expansion plans for CoWoS despite multiple analysts asking for more details about its capacity, ramp and revenue contribution. Management simply said that they have “very tight capacity and cannot even meet customers' needs” and they are working “very hard” to increase CoWoS capacity.
On the advanced node front, the 2 nanometer node is “well on track” for volume production in the second half of this year as previously scheduled, with TSMC expecting it to ramp similarly to the 3nm node. However, management added that the tape out in the first two years is expected to be higher than both 3nm and 5nm in their respective ramps due to the strong customer interest and demand for the new node.
Additionally, management shared some updates on international fab expansion, noting that its first fab in Arizona entered high volume production in Q4 with yields comparable to Taiwan. They expect the 4nm node there to ramp smoothly, with construction on the second and third fab in Arizona (set to produce 3nm, 2nm and A16), on track. Japan’s Kumamoto fab began volume production with “record yield”, while the second specialty fab in Japan is expected to break ground this year. TSMC also shared that they are smoothly progressing with plans to build a specialty automotive and industrial-focused fab in Dresden, Germany.
Conclusion
The company’s strong results showed its resilience in capturing the demand for advanced chips due to its technological leadership. Management was optimistic on the long-term forecast for AI revenue growth over the next few years supported by high demand from customers. Strong top-line growth, along with the bottom-line strength, distinguishes TSMC from other companies that are struggling in the current tough macro environment.
I/O Fund Equity Analysts Royston Roche and Damien Robbins contributed to this article.
Please note: The I/O Fund conducts research and draws conclusions for the Fund’s positions. We then share that information with our readers. This is not a guarantee of a stock’s performance. Please consult your personal financial advisor before buying any stock in the companies mentioned in this analysis.
TSMC recently released its December monthly revenue, which grew by a robust 57.8% YoY and 0.8% MoM to NT$278.16 billion. The fourth quarter revenue grew 38.8% YoY to NT$868.5 billion, beating the LSEG estimates of NT$854.7 billion.
In US dollar terms, Q4 revenue grew 36.9% YoY to $26.85 billion using the average exchange rate of $1=NT$32.34. We will get the official USD figures when the company releases its full results on January 16th. This suggests that the company’s revenue will come at the high-end guidance of $26.1 billion to $26.9 billion and beat the mid-point guide of $26.5 billion.
The strong December quarter revenue suggests that AI demand will continue in 2025. Recently, Foxconn also beat estimates with record fourth-quarter revenue driven by AI demand. Revenue grew by 15.2% YoY to NT$2.13 trillion, beating estimates of NT$2.1 trillion. Foxconn management said, “Robust AI server demand led to strong revenue growth for its cloud and networking products division.”
The revenue beat of TSMC and Foxconn provides further hope to investors that AI demand is not slowing down in 2025. TSMC is a major beneficiary of surging demand for AI chips, holding over 90% market share in manufacturing advanced AI processors. Increased investments from Big Tech is further expected to drive AI growth; for example, Microsoft recently announced plans to invest approximately $80 billion in AI-enabled data centers in FY2025, a significant increase from the $55.7 billion capex in FY2024.
Investors will be closely watching the comments from the management on the broader semiconductor market for 2025 since TSMC has better insights than any other company as the world’s leading foundry.
Revenue
Strong revenue growth is expected in the coming quarters due to robust demand for AI and smartphone chips. Over the past few quarters, revenue estimates have risen — 4.9 percentage points for Q4 2024 and 6.1 percentage points for Q1 2025 — indicating analysts’ confidence in the company’s ability to maintain growth.
Management’s guide for the fourth quarter is between $26.1 billion to $26.9 billion, representing YoY growth of 35.1% and 12.8% QoQ at the midpoint. Based on the monthly TWD figures, Q4 revenue grew 36.9% YoY to $26.85 billion using the average exchange rate of $1=NT32.34. We will get the official USD figures when the company releases its full results on January 16th.
Q3 revenue grew 36% YoY and 12.9% QoQ to $23.5 billion, driven by strong demand for AI and smartphone chips.
C.C. Wei, Vice Chairman and CEO, said in the earnings call, “Moving into fourth quarter, we expect our business to continue to be supported by strong demand for our leading-edge process technologies. We continue to observe extremely robust AI-related demand from our customers throughout the second half of 2024, leading to increasing overall capacity utilization rate for our leading-edge 3-nanometer and 5-nanometer process technologies.”
Due to its technological leadership, TSMC can capture robust demand for the most advanced AI chips. The revenue contribution from server AI processors is expected to triple this year and will account for a mid-teens percentage of 2024 revenue. Management guided for full year 2024 revenue to grow close to 30% in U.S. dollar terms and calculating using the recent monthly figures suggest revenue to grow 29.9% YoY to $90 billion, rebounding significantly from a decline of (-8.7%) for 2023.
Morgan Stanley expects TSMC to provide a conservative annual sales growth guide of low 20% in dollar terms for 2025 at the beginning of the year, with a potential to raise throughout the year as the company did in 2024.
Margins
While many companies face the issue of rising costs, TSMC has demonstrated resilience by effectively managing expenses. Through a combination of cost control measures, negotiating better prices with its customers, and leveraging economies of scale, TSMC has maintained strong profitability. The company's leadership position in the foundry industry further solidifies its competitive advantage.
According to an Economic Daily News report, TSMC plans to increase prices for advanced nodes by 5% to 10% in 2025. The price increase to customers will help to allay investor fears on rising costs from shifting of manufacturing processes outside of Taiwan due to geopolitical risks, increasing electricity prices in Taiwan, inflationary cost pressures, and initial higher costs involved in the ramp-up phase of advanced node manufacturing.
Management guided Q4 gross margin to increase 20 basis points sequentially to 58% at the midpoint, up significantly from 53% in the same period last year, driven by higher capacity utilization and cost controls, partially offset by dilution from N3 ramp, higher electricity prices in Taiwan, and N5 to N3 tool conversion cost.
Operating margins are expanding, helped by operating leverage. Management’s guide for Q4 is 47.5% at the midpoint compared to 41.6% in the same period last year.
Q3 net income grew by 52.4% YoY to $10.06 billion or 42.8% of revenue compared to 38.6% in the same period last year.
EPS
Q3 EPS grew by 50.4% YoY to $1.94, driven by better capacity utilization, cost improvement, and operating leverage. EPS is projected to rise significantly in the coming quarters and analysts have raised estimates indicating greater confidence in the company’s ability to grow its bottom line.
Analysts expect Q4 EPS to grow 54.9% YoY to $2.23, up from 35.4% expected growth in mid-October, and Q1 EPS to grow 49.5% YoY to $2.06, up from 26.1% expected growth in mid-October.
Looking further out, analysts expect 2025 EPS to grow 32.1% YoY to $9.27 and 16.1% YoY to $10.76 in 2026.
Cash Flows and Balance Sheet
The company’s financial stability is evident due to its strong cash flows, with operating cash flows increasing 30.3% and free cash flows by 166% in Q3. The foundry industry is capital-intensive, and this is why you will notice a wide difference between operating cash flows and free cash flows for the company.
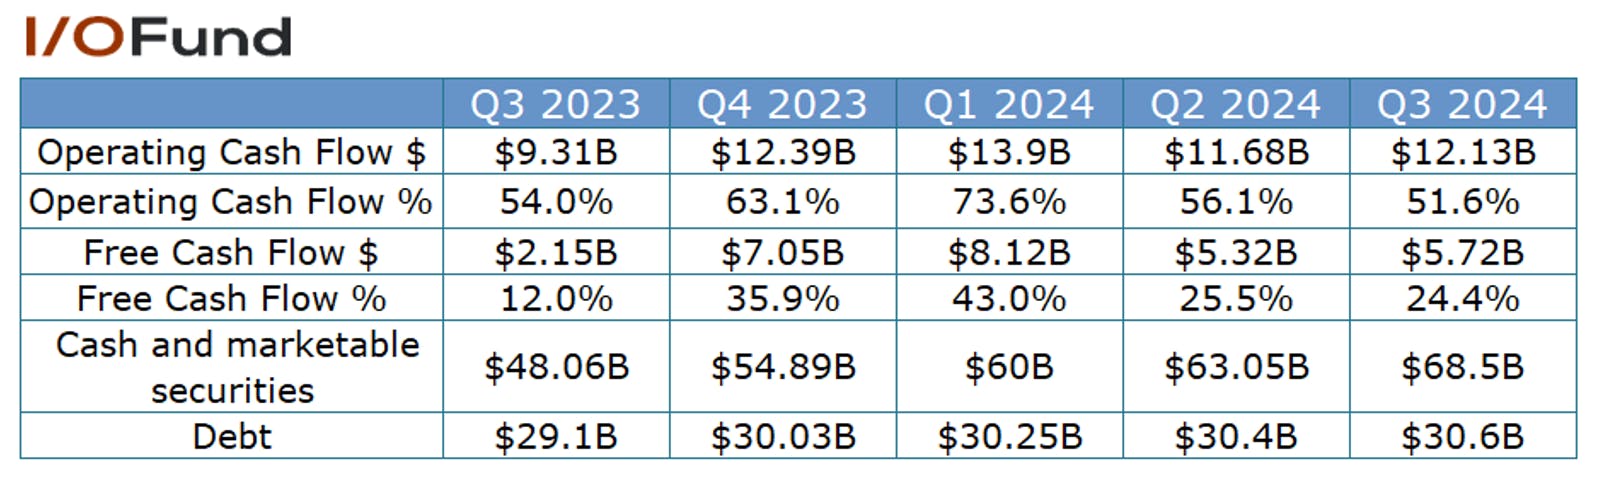
Q3 operating cash flow was $12.13 billion or 51.6% of revenue compared to $9.31 billion or 54% of revenue in the same period last year.
Free cash flow grew by 166% YoY to $5.72 billion or 24.4% of revenue compared to 12% of revenue in the same period last year. Capex was down (-9.9%) YoY to $6.4 billion.
Management expects capex to be slightly higher than $30 billion for 2024, revised down slightly from the previous guide of $30 billion to $32 billion. About 70% to 80% will be allocated for advanced process technologies, 10% to 20% for specialty technologies, and 10% for advanced packaging, testing, mask making, and others.
As the company continues to invest due to the strong expected AI growth, capex is likely to increase in 2025, and management mentioned that they will provide more details during the January earnings call.
Cash and marketable securities were $68.5 billion and debt of $30.6 billion, compared to $63.05 billion and $30.4 billion in Q2.
Revenue by Platform
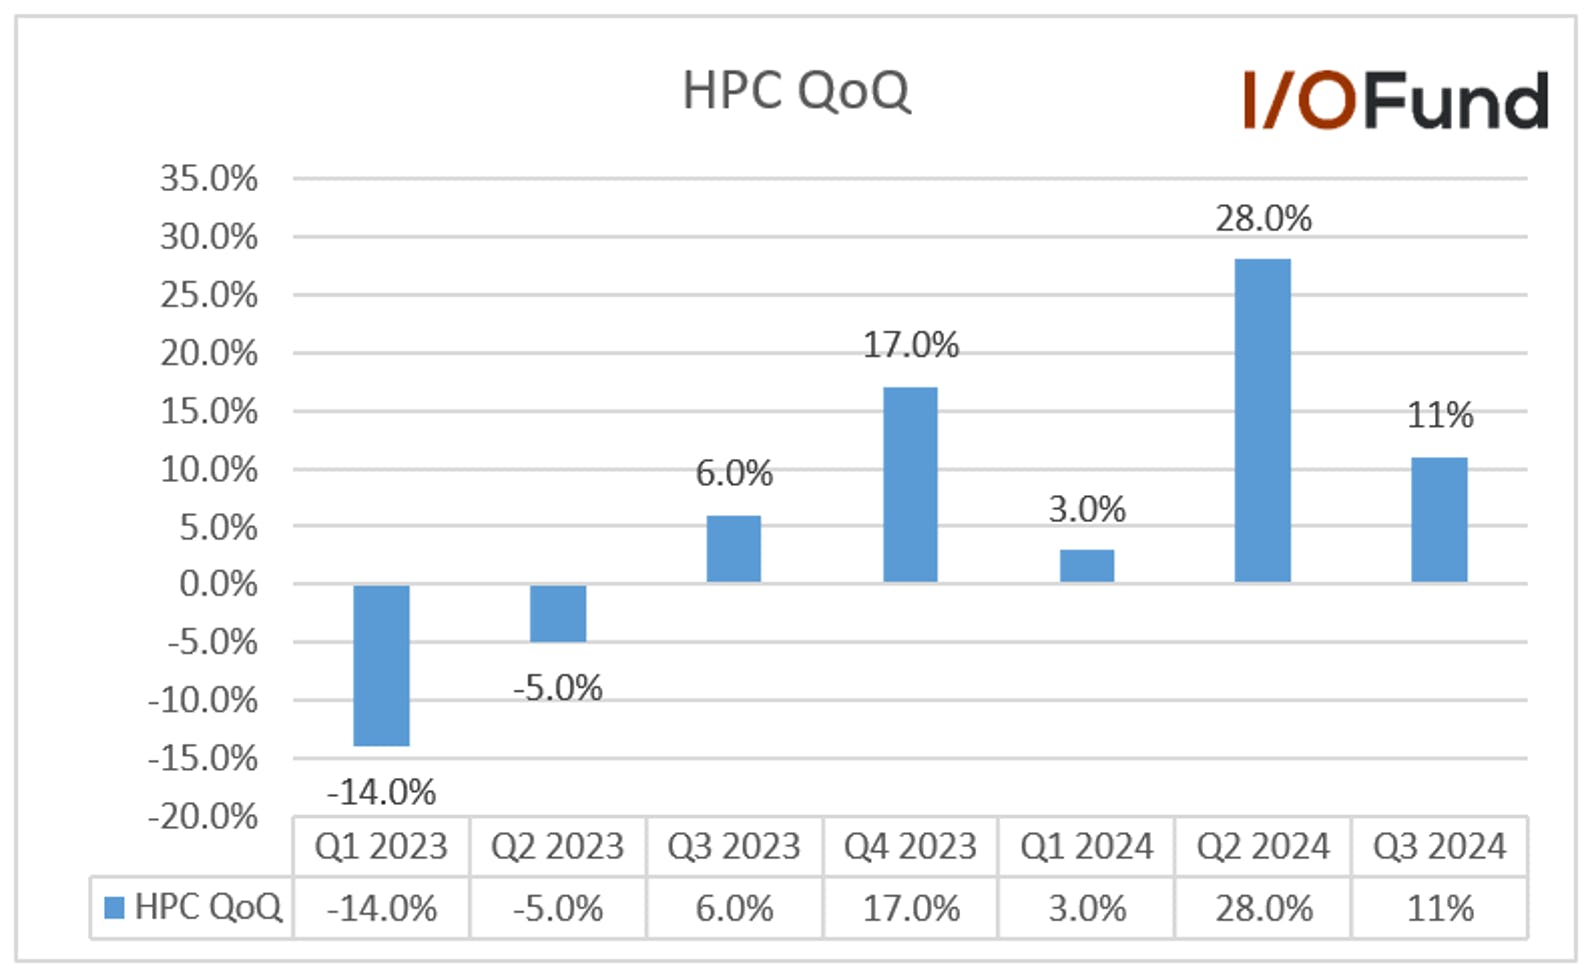
As the leading foundry for AI accelerators, TSMC is riding the enormous wave of demand from Big Tech. The chipmaker’s high-performance computing (HPC) revenues rose 11% QoQ to $11.99 billion in Q3 and accounted for 51% of revenue, surpassing the 50% mark for the second time.
TSMC is immensely benefiting from the AI spending of Big Tech companies. The company has more than 90% market share in manufacturing advanced AI chips. Microsoft also recently outlined its plan to invest about $80 billion primarily in AI-enabled data centers in FY2025, up from $55.7 billion capex in FY2024. This substantial investment underscores the growing importance of AI and bodes well for TSMC's continued dominance in the advanced semiconductor manufacturing sector.
As seen in the chart below, HPC revenue has grown sequentially each quarter in 2024 to reach a record $11.99 billion in Q3.
Smartphone grew by 16% sequentially and accounted for 34% of revenue from 33% of revenue in Q2.
Internet of Things revenue grew by 35% sequentially and accounted for 7% of revenue.
Automotive revenue grew by 6% sequentially and accounted for 5% of revenue. Digital Consumer Electronics decreased by 19% and accounted for 1% of revenue; others grew by 8% to account for 2% of revenue.
Revenue by Technology
The most advanced node in production today is the 3-nanometer process technology. Volume production for 2-nanometer is expected in 2025 and should have a meaningful revenue contribution in the first half of 2026.
According to the MoneyDJ report, TSMC has initiated the setup of a pilot production line for its 2-nanometer process at its Hsinchu Baoshan fab in Taiwan, with an initial monthly capacity of 3,000 to 3,500 wafers. By the end of 2025, TSMC expects to significantly expand its 2nm production capacity to over 50,000 wafers per month, including the contributions from its Kaohsiung fab in Taiwan. By the end of 2026, TSMC is expected to further increase its 2nm monthly capacity to 120,000 to 130,000 wafers, suggesting strong demand for the 2nm chips. TSMC's 2nm node is expected to provide 15% better performance and 35% better energy efficiency than its 3nm node. Apple is expected to be the first customer to use 2-nanometer process technology.
Advanced nodes are defined as 7-nanometer and below. These nodes accounted for 69% of wafer revenue in Q3 compared to 67% in Q2.
In Q3 2024, 3-nanometer process technology contributed 20% of wafer revenue, while 5-nanometer and 7-nanometer accounted for 32% and 17%, respectively.
Other Points to Watch
Advanced Packaging
Advanced packaging demand is strong and will account for high single-digit revenue this year. According to Economic Daily News, TSMC’s monthly CoWoS capacity could reach 75,000 wafers in 2025, nearly doubling 2024 levels. Due to the strong demand, primarily from Nvidia, the construction of CoWoS facilities time has been shortened to 1.5 years from the previous three to five years.
Overseas Fabs
The company is expanding its fabs overseas to reduce geopolitical risks. TSMC began producing 4-nanometer chips in Arizona fab, United States Secretary of Commerce Gina Raimondo told Reuters. Earlier in November the US government had also finalized the Chips Act incentive with the company and it is expected to get up to $6.6 billion in grants and $5 billion in loans. TSMC’s second Arizona fab is expected to feature the N3 and N2 processes and is expected to be operational in 2028.
According to TrendForce, the first fab in Arizona will have an initial capacity of 20K wafers per month by year-end. TSMC is also in talks with Nvidia about producing its Blackwell chips at the Arizona plant; these chips are currently manufactured in Taiwan. However, these Blackwell chips will still need to be shipped back to Taiwan since the Arizona facility does not have CoWoS packaging capability. If the contract is finalized, Nvidia will be the third customer for the Arizona plant after Apple and AMD
According to Nikkie report, TSMC’s first plant in Japan will start mass-producing chips by the end of the year. The first fab is expected to produce less advanced chips. The company is also planning a second fab that could produce 6-nanometer and 12-nanometer chips, and is also discussing to build a third fab in Japan that could make advanced 3-nanometer chips.
Trade Wars
Due to its limited China exposure (about 12% of revenue) and the strong global demand for AI chips, TSMC is better positioned to mitigate any potential disruptions from the US-China trade war.
Valuation
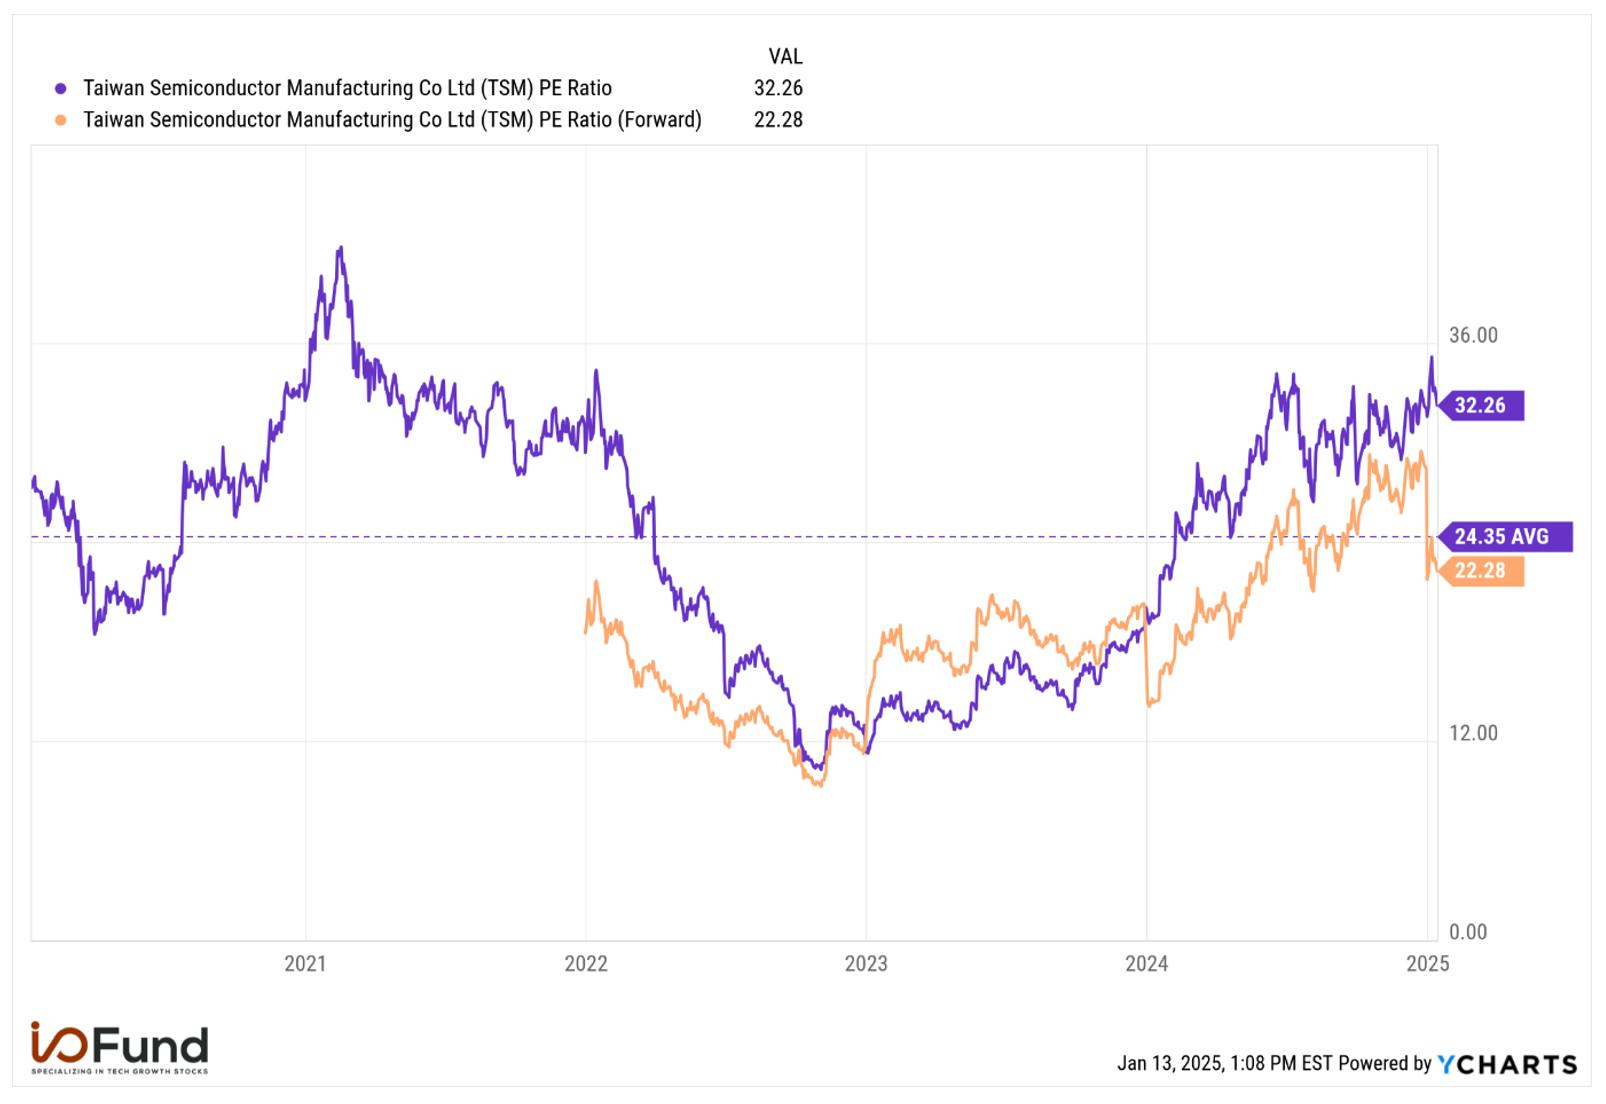
The company trades at a P/E ratio of 32.3 and a forward P/E ratio of 22.3. The P/S ratio is 12.6 and a forward P/S ratio of 9.5. In the last five years, the P/E ratio peaked at 41.8 in February 2021 and hit a low of 10.3 in November 2022. The stock is now trading above its five-year average P/E ratio of 24.4.
Conclusion
TSMC plays a crucial role in the success of many leading AI companies, including Nvidia, Apple, AMD, Marvell, and Qualcomm, as it is their primary supplier of advanced semiconductor chips and has more than 90% market share manufacturing advanced AI processors. Given the continued growth of the AI economy, TSMC's importance in the semiconductor industry is expected to further increase.
Royston Roche, Equity Analyst at the I/O Fund, contributed to this article.
Please note: The I/O Fund conducts research and draws conclusions for the Fund’s positions. We then share that information with our readers. This is not a guarantee of a stock’s performance. Please consult your personal financial advisor before buying any stock in the companies mentioned in this analysis.
TSMC recently released its December monthly revenue, which grew by a robust 57.8% YoY and 0.8% MoM to NT$278.16 billion. The fourth quarter revenue grew 38.8% YoY to NT$868.5 billion, beating the LSEG estimates of NT$854.7 billion.
In US dollar terms, Q4 revenue grew 36.9% YoY to $26.85 billion using the average exchange rate of $1=NT$32.34. We will get the official USD figures when the company releases its full results on January 16th. This suggests that the company’s revenue will come at the high-end guidance of $26.1 billion to $26.9 billion and beat the mid-point guide of $26.5 billion.
The strong December quarter revenue suggests that AI demand will continue in 2025. Recently, Foxconn also beat estimates with record fourth-quarter revenue driven by AI demand. Revenue grew by 15.2% YoY to NT$2.13 trillion, beating estimates of NT$2.1 trillion. Foxconn management said, “Robust AI server demand led to strong revenue growth for its cloud and networking products division.”
The revenue beat of TSMC and Foxconn provides further hope to investors that AI demand is not slowing down in 2025. TSMC is a major beneficiary of surging demand for AI chips, holding over 90% market share in manufacturing advanced AI processors. Increased investments from Big Tech is further expected to drive AI growth; for example, Microsoft recently announced plans to invest approximately $80 billion in AI-enabled data centers in FY2025, a significant increase from the $55.7 billion capex in FY2024.
Investors will be closely watching the comments from the management on the broader semiconductor market for 2025 since TSMC has better insights than any other company as the world’s leading foundry.
Revenue
Strong revenue growth is expected in the coming quarters due to robust demand for AI and smartphone chips. Over the past few quarters, revenue estimates have risen — 4.9 percentage points for Q4 2024 and 6.1 percentage points for Q1 2025 — indicating analysts’ confidence in the company’s ability to maintain growth.
Management’s guide for the fourth quarter is between $26.1 billion to $26.9 billion, representing YoY growth of 35.1% and 12.8% QoQ at the midpoint. Based on the monthly TWD figures, Q4 revenue grew 36.9% YoY to $26.85 billion using the average exchange rate of $1=NT32.34. We will get the official USD figures when the company releases its full results on January 16th.
Q3 revenue grew 36% YoY and 12.9% QoQ to $23.5 billion, driven by strong demand for AI and smartphone chips.
C.C. Wei, Vice Chairman and CEO, said in the earnings call, “Moving into fourth quarter, we expect our business to continue to be supported by strong demand for our leading-edge process technologies. We continue to observe extremely robust AI-related demand from our customers throughout the second half of 2024, leading to increasing overall capacity utilization rate for our leading-edge 3-nanometer and 5-nanometer process technologies.”
Due to its technological leadership, TSMC can capture robust demand for the most advanced AI chips. The revenue contribution from server AI processors is expected to triple this year and will account for a mid-teens percentage of 2024 revenue. Management guided for full year 2024 revenue to grow close to 30% in U.S. dollar terms and calculating using the recent monthly figures suggest revenue to grow 29.9% YoY to $90 billion, rebounding significantly from a decline of (-8.7%) for 2023.
Morgan Stanley expects TSMC to provide a conservative annual sales growth guide of low 20% in dollar terms for 2025 at the beginning of the year, with a potential to raise throughout the year as the company did in 2024.
Margins
While many companies face the issue of rising costs, TSMC has demonstrated resilience by effectively managing expenses. Through a combination of cost control measures, negotiating better prices with its customers, and leveraging economies of scale, TSMC has maintained strong profitability. The company's leadership position in the foundry industry further solidifies its competitive advantage.
According to an Economic Daily News report, TSMC plans to increase prices for advanced nodes by 5% to 10% in 2025. The price increase to customers will help to allay investor fears on rising costs from shifting of manufacturing processes outside of Taiwan due to geopolitical risks, increasing electricity prices in Taiwan, inflationary cost pressures, and initial higher costs involved in the ramp-up phase of advanced node manufacturing.
Management guided Q4 gross margin to increase 20 basis points sequentially to 58% at the midpoint, up significantly from 53% in the same period last year, driven by higher capacity utilization and cost controls, partially offset by dilution from N3 ramp, higher electricity prices in Taiwan, and N5 to N3 tool conversion cost.
Operating margins are expanding, helped by operating leverage. Management’s guide for Q4 is 47.5% at the midpoint compared to 41.6% in the same period last year.
Q3 net income grew by 52.4% YoY to $10.06 billion or 42.8% of revenue compared to 38.6% in the same period last year.
EPS
Q3 EPS grew by 50.4% YoY to $1.94, driven by better capacity utilization, cost improvement, and operating leverage. EPS is projected to rise significantly in the coming quarters and analysts have raised estimates indicating greater confidence in the company’s ability to grow its bottom line.
Analysts expect Q4 EPS to grow 54.9% YoY to $2.23, up from 35.4% expected growth in mid-October, and Q1 EPS to grow 49.5% YoY to $2.06, up from 26.1% expected growth in mid-October.
Looking further out, analysts expect 2025 EPS to grow 32.1% YoY to $9.27 and 16.1% YoY to $10.76 in 2026.
Cash Flows and Balance Sheet
The company’s financial stability is evident due to its strong cash flows, with operating cash flows increasing 30.3% and free cash flows by 166% in Q3. The foundry industry is capital-intensive, and this is why you will notice a wide difference between operating cash flows and free cash flows for the company.
Q3 operating cash flow was $12.13 billion or 51.6% of revenue compared to $9.31 billion or 54% of revenue in the same period last year.
Free cash flow grew by 166% YoY to $5.72 billion or 24.4% of revenue compared to 12% of revenue in the same period last year. Capex was down (-9.9%) YoY to $6.4 billion.
Management expects capex to be slightly higher than $30 billion for 2024, revised down slightly from the previous guide of $30 billion to $32 billion. About 70% to 80% will be allocated for advanced process technologies, 10% to 20% for specialty technologies, and 10% for advanced packaging, testing, mask making, and others.
As the company continues to invest due to the strong expected AI growth, capex is likely to increase in 2025, and management mentioned that they will provide more details during the January earnings call.
Cash and marketable securities were $68.5 billion and debt of $30.6 billion, compared to $63.05 billion and $30.4 billion in Q2.
Revenue by Platform
As the leading foundry for AI accelerators, TSMC is riding the enormous wave of demand from Big Tech. The chipmaker’s high-performance computing (HPC) revenues rose 11% QoQ to $11.99 billion in Q3 and accounted for 51% of revenue, surpassing the 50% mark for the second time.
TSMC is immensely benefiting from the AI spending of Big Tech companies. The company has more than 90% market share in manufacturing advanced AI chips. Microsoft also recently outlined its plan to invest about $80 billion primarily in AI-enabled data centers in FY2025, up from $55.7 billion capex in FY2024. This substantial investment underscores the growing importance of AI and bodes well for TSMC's continued dominance in the advanced semiconductor manufacturing sector.
As seen in the chart below, HPC revenue has grown sequentially each quarter in 2024 to reach a record $11.99 billion in Q3.
Smartphone grew by 16% sequentially and accounted for 34% of revenue from 33% of revenue in Q2.
Internet of Things revenue grew by 35% sequentially and accounted for 7% of revenue.
Automotive revenue grew by 6% sequentially and accounted for 5% of revenue. Digital Consumer Electronics decreased by 19% and accounted for 1% of revenue; others grew by 8% to account for 2% of revenue.
Revenue by Technology
The most advanced node in production today is the 3-nanometer process technology. Volume production for 2-nanometer is expected in 2025 and should have a meaningful revenue contribution in the first half of 2026.
According to the MoneyDJ report, TSMC has initiated the setup of a pilot production line for its 2-nanometer process at its Hsinchu Baoshan fab in Taiwan, with an initial monthly capacity of 3,000 to 3,500 wafers. By the end of 2025, TSMC expects to significantly expand its 2nm production capacity to over 50,000 wafers per month, including the contributions from its Kaohsiung fab in Taiwan. By the end of 2026, TSMC is expected to further increase its 2nm monthly capacity to 120,000 to 130,000 wafers, suggesting strong demand for the 2nm chips. TSMC's 2nm node is expected to provide 15% better performance and 35% better energy efficiency than its 3nm node. Apple is expected to be the first customer to use 2-nanometer process technology.
Advanced nodes are defined as 7-nanometer and below. These nodes accounted for 69% of wafer revenue in Q3 compared to 67% in Q2.
In Q3 2024, 3-nanometer process technology contributed 20% of wafer revenue, while 5-nanometer and 7-nanometer accounted for 32% and 17%, respectively.
Other Points to Watch
Advanced Packaging
Advanced packaging demand is strong and will account for high single-digit revenue this year. According to Economic Daily News, TSMC’s monthly CoWoS capacity could reach 75,000 wafers in 2025, nearly doubling 2024 levels. Due to the strong demand, primarily from Nvidia, the construction of CoWoS facilities time has been shortened to 1.5 years from the previous three to five years.
Overseas Fabs
The company is expanding its fabs overseas to reduce geopolitical risks. TSMC began producing 4-nanometer chips in Arizona fab, United States Secretary of Commerce Gina Raimondo told Reuters. Earlier in November the US government had also finalized the Chips Act incentive with the company and it is expected to get up to $6.6 billion in grants and $5 billion in loans. TSMC’s second Arizona fab is expected to feature the N3 and N2 processes and is expected to be operational in 2028.
According to TrendForce, the first fab in Arizona will have an initial capacity of 20K wafers per month by year-end. TSMC is also in talks with Nvidia about producing its Blackwell chips at the Arizona plant; these chips are currently manufactured in Taiwan. However, these Blackwell chips will still need to be shipped back to Taiwan since the Arizona facility does not have CoWoS packaging capability. If the contract is finalized, Nvidia will be the third customer for the Arizona plant after Apple and AMD
According to Nikkie report, TSMC’s first plant in Japan will start mass-producing chips by the end of the year. The first fab is expected to produce less advanced chips. The company is also planning a second fab that could produce 6-nanometer and 12-nanometer chips, and is also discussing to build a third fab in Japan that could make advanced 3-nanometer chips.
Trade Wars
Due to its limited China exposure (about 12% of revenue) and the strong global demand for AI chips, TSMC is better positioned to mitigate any potential disruptions from the US-China trade war.
Valuation
The company trades at a P/E ratio of 32.3 and a forward P/E ratio of 22.3. The P/S ratio is 12.6 and a forward P/S ratio of 9.5. In the last five years, the P/E ratio peaked at 41.8 in February 2021 and hit a low of 10.3 in November 2022. The stock is now trading above its five-year average P/E ratio of 24.4.
Conclusion
TSMC plays a crucial role in the success of many leading AI companies, including Nvidia, Apple, AMD, Marvell, and Qualcomm, as it is their primary supplier of advanced semiconductor chips and has more than 90% market share manufacturing advanced AI processors. Given the continued growth of the AI economy, TSMC's importance in the semiconductor industry is expected to further increase.
Royston Roche, Equity Analyst at the I/O Fund, contributed to this article.
Please note: The I/O Fund conducts research and draws conclusions for the Fund’s positions. We then share that information with our readers. This is not a guarantee of a stock’s performance. Please consult your personal financial advisor before buying any stock in the companies mentioned in this analysis.
As a utility-based stock, Bloom Energy has lumpy revenue – which is common in this sector. The stock requires strong risk management due to weak cash and not being profitable, however, the upside is immense should more large data center deals be announced.
The company has deployed 1.3 GW since 2001, yet announced in November a deal for 1 GW with the utility company AEP to power data centers. The deal announced in November will nearly double the company’s fuel cell deployment from one deal; evidence of the booming energy demand from AI data centers. AEP’s customers include Google, Amazon, Microsoft and Meta Platforms.
Bloom Energy has set the bar high for Q4 2024 earnings for growth of 67.7% versus analyst estimates for growth of 42.7%. Results are expected after the market close on February 14, 2025. The CEO and CFO reaffirmed guidance implying Q3 2024 had revenues pushed out to Q4 due to delays.
Bloom Energy is not profitable and is cash flow negative – hence, the first bullet point that this stock requires strict risk management (i.e., we will closely adhere to our stops). However, the company is nearing GAAP profitability with a margin of (-3%) last quarter and management has guided for adjusted operating profits of $75 million to $100 million for FY2024. The adjusted EBITDA margin last quarter was 6.5%.
Nearly 77% of accounts receivable come from just two customers, who are also related parties.
Bloom Energy Shows Initial Promise of Becoming Data Center-Fueled Stock
The Chinese bamboo tree remains dormant on the surface for five years after planting the seeds. While many farmers chalk it up as a waste of time, those who are believers eventually get rewarded as it can break ground and grow up to 90 feet tall in the following five weeks. What appears to be dormant on the surface overlooks the years spent developing its root system underground.
This metaphor applies to many companies that eventually transform into outliers. In Bloom Energy’s case, it would be more than two decades of dormancy that may be leading up to breaking ground in 2025.
Bloom Energy Inc. provides on-site 24/7 power generation using their proprietary solid oxide fuel cells (SOFCs). The SOFCs are stacked up by the hundreds to thousands in Bloom Energy Servers (BES), which enable the conversion of fuels like natural gas, biogas and hydrogen to electricity through a chemical reaction, not combustion, arguably resulting in less emissions.
Hydrogen and biogas fuel sources enable BES produce zero carbon or carbon neutral power. When BES are fueled with natural gas to generate electricity, they do emit carbon dioxide, but significantly less than through the combustion process. Natural gas is currently the primary fuel source for most BES due to the readily available supply of natural gas, established infrastructure and lower costs.
Bloom Electrolyzers are solid oxide fuel cell electrolyzers (SOECs) that can convert electricity into hydrogen, an important decarbonization tool in the energy transition. With that said, most of Bloom Energy Servers use natural gas as their primary fuel source.
Bloom Energy’s management emphasizes the following key points as to why hydrogen fuel cells are well suited as a power solution for AI data centers:
The time response of fuel cells is in the milliseconds. This is a primary point as to why Bloom Energy could secure future data center deals. Here is what management described as to the competitive advantages regarding time to power for fuel cells: “A big shift in our business today is time to power. We are providing solutions to meet the urgent needs of our customers who cannot fulfill their power needs from the grid. In these cases, we rapidly book, build, ship, install and power sites for our customers in a matter of months, a much faster timeline than a grid connection. Such rapid drill activities will necessarily come with timeline variances, both pull-ins and delays, and will affect our quarterly revenue line. You are seeing this in our Q3 numbers.”
Using high-temperature heat to provide cooling could become a key way to use hydrogen fuel cells in data centers. As pointed out by the Fuel Cell and Hydrogen Energy Association, excess heat from fuel cells can be used to cool servers.
Management also stated fuel cells are “pay-as-you-grow” are offer “high-power density” which makes them an economic choice. However, nuclear offers far more power density than fuel cells and thus this is not a primary point for choosing fuel cells over nuclear (in fact, it’s a primary reason to choose nuclear)
Rapid Deployment for Backup or Primary Power, or Utility Transmission:
BES uses core 325 kW base blocks customized to work in parallel with the local electric grid in standby or backup mode to kick in when the local power becomes unavailable. The 325 kW base blocks can be duplicated and scaled up to multiple MWs for any project. They can also be used as the primary power source. They can be used off-grid or parallel as a microgrid. BES has a high density compared to solar or wind of 100 MW per acre with features such as stackable servers and combined heat and power solutions. However, nuclear is in the kilowatts per acre, and therefore, is by far the highest density power solution.
BES can be purchased, customized and installed with ongoing maintenance and support contracts procured with a maintenance agreement or contracted as an energy service for five to 20 years under a Power Purchase Agreement (PPA) with a tolling rate. BES is compatible with utility companies as backup power or behind-the-meter as a more primary power solution.
Bloom Microgrids offer security and flexibility by running alongside the utility in grid-following mode, taking primary control over critical loads and customizing power delivery. During power outages, the BES briefly disconnects from the utility coming online in grid-forming mode, carrying the predetermined load set by the customer. The BES will maintain this load and resume grid parallel operation after restoring utility power.
Rapid Solution for Utility Transmission:
A few months back, our free analysis pointed toward a critical bottleneck in power consumption as GPUs are increasing in power consumption from 75% from the previous generation of Hopper GPUs to now a 300% increase in the next generation of Blackwell GPUs arriving in 2025. The analysis cited Morgan Stanley’s estimates of 5X increase in power demand over the next three years and Wells Fargo estimating growth of 8,050% from 2024 to 2030.
Bloom Energy pointed out an important aspect of fuel cells in clearing this bottleneck which is time to power, including for utility transmission.
Here is what was stated:
“Transmission in the U.S. is going to be a bottleneck for a very long time to come. So, our asset becomes both a transmission asset and an end-user asset. So, to help a utility mitigate the long cycles it's going to take them to get transmission to where they need to supply the power to their customer, a short circuit to that would be to use our box in front of the meter, not have to do transmission upgrades and supply large blocks of power to a customer.”
Heat Capture Helps to Cool GPUs
BES are designed to work with existing carbon capture utilization and storage (CCUS) and combined heat and power (CHP) technologies. CCUS mitigates emissions from natural gas as BESs generate a pure stream of CO2 that can be used or sequestered. CHP allows the exhaust heat generated by BES (operating at a core temperature of 1,500 degrees Fahrenheit or 800 degrees Celsius) to be channeled and made available for use, further increasing the efficiency of the system.
Bloom Energy announced their SOFCs have reached 60% electrical efficiency while using 100% hydrogen. The high-temperature exhaust stream can produce steam in addition to electricity, resulting in 90% lifetime total system efficiency by adding Heat Capture. For example, the BES with heat capture includes applications that use a rear-door heat exchanger, which is one way to cool servers. Rear-door heat exchangers offer near-instantaneous cooling. Per Bloom’s website: “With the Heat Capture option, the exhaust heat exits the equipment at the back of the power module instead of the top and is easily transferred to a heat exchanger system.”
Bloom Energy Customers: AI Drives Up Energy Demand
The Gamechanger Deal: AEP Procures up to 1GW of SOFCs for Data Centers
November 15, 2024, Bloom Energy stock gapped 59% higher to $21.14 from $13.28 on news of a deal with American Electric Power (NYSE: AEP), a major utility company serving 5.6 million customers in 11 states with 29,000 MW of diverse generating capacity, to secure up to 1 GW of Bloom Energy SOFC for their data center customers and other larger energy users. The deal coined itself as the largest commercial procurement of fuel cells in the world. AEP placed an order for 100 MW of fuel cells, with further expansion orders expected in 2025.
While Bloom Energy provided no financial information regarding the deal, S&P Global Intelligence estimates the deal could be worth up to $7 billion in revenues if the full 1 GW is deployed. The initial 100 MW order from AEP is valued at around $1 billion (revealed in the Q3 2023 conference call). The AEP deal would accomplish 77% of the 1.3 GW total deployed by Bloom Energy in the past 24 years. The hype and hope have fueled Bloom Energy's stock into the $20s.
AEP is Finalizing the First Customer Project with More to Come
AEP expects commercial load to grow 20% annually over the next three years, driven by data center development. The company is in the process of finalizing the first customer project agreements, and discussions are ongoing with several other customers. AEP’s hyperscaler customers include Google, Amazon, Microsoft and Meta Platformshyperscaler customers include Google, Amazon, Microsoft and Meta Platforms.
AEP will purchase SOFCs from Bloom Energy with an initial order of 100 MW, with more expected in 2025, and integrate them into their customer energy systems, prioritizing AI data centers. Large customers will cover all costs for the fuel cell projects under a special contract. AEP will oversee deployment and installation at customer sites.
Bloom will supply the SOFCs to AEP, providing the core technology for on-site power generation. Bloom will likely offer ongoing support and maintenance services.
Bloom CEO and founder KR Sridhar commented, “I am delighted that there is strong market recognition that the Bloom Energy platform is the ideal choice for powering AI data centers. We are thrilled to be working with AEP as they lead the charge to bring innovative solutions to the transforming electricity market. With our proven track record of more than 1.3 GW deployed and a fully functional factory that can deliver GWs of products per year, we are ready and able to meet this rapid electricity demand growth."
Customer Concentration is a Concern: Two Customers Account for 77% of AR
As of September 30, 2024, two customers accounted for 77% of total accounts receivables (59% and 18%). The first is the related parties SK ecoplant and a Korean JV. Related parties account for $349.5M in accounts receivables for Q3 2024.
As of September 23, 2023, SK ecoplant held 23.5 million shares of Bloom Energy Class A stock representing 10.5% of outstanding shares, which makes them a related party, valued at around $566 million on December 22, 2023.
Three customers account for 68% of total revenue for Q3 2024, which includes 38% from its "related party" and 20% and 10% from two other customers. Related parties generated $126.6M in revenue in Q3 2024.
SK ecoplant and SK Eternix are subsidiaries of SK Group. SK Eternix was launched in March 2024. On November 7, 2024, SK Eternix and Bloom Energy announced the World’s Largest Fuel Cell Installation in HistoryWorld’s Largest Fuel Cell Installation in History in collaboration with SK Eternix for an 80MW installation looking to commence operations in 2025. The single-site installation will power two ecoparks in the North Chungcheong Province, South Korea.
SK ecoplant: A White Knight with Too Much Leverage
Bloom Energy states that it has incurred losses and negative cash flows since its inception. SK ecoplant (formerly known as SK Engineering and Construction Co.) was a large funder for the company. From 2021 to 2023, Bloom executed new debt offerings, debt extinguishments and conversions to equity (dilution) to grow liquidity to $842 million and $4.6 million in recourse and non-recourse debt at the end of December 31, 2023, classified as long-term debt.
December 22, 2023, SK ecoplant extended its preferred distributor agreement to commit to purchasing 500 MW of Energy Servers from Bloom Energy through 2027, expected to generate $1.5 billion in product and $3 billion in service revenues over 20 years for Bloom Energy. SK ecoplant has made $566 million in equity investment, owning 10% of the company.**
Bloom Energy’s Roster of Customers Are Well Known
Some of Bloom Energy’s well-known customers include Google (400 kW Mountainview, CA, in July 2008), FedEx, Yahoo (1 MW, Sunnyvale, CA, in July 2014), Adobe (1.5 MW San Francisco, CA, 2012), IBM, AT&T (21 MW at 34 sites starting with 10 MW in 2013 in CA, CT, NJ and NY), Honda (1 MW of 5 BES in Torrance, CA), Target, Home Depot, Medtronic (400 kW, Santa Clara, CA), Equinox, Walmart (40+ projects in CA since 2009), Kaiser Permanente (4.3 MW in 7 projects in CA), Comcast and Lockheed Martin. However, the majority of their revenue is derived from three customers. Most of these installs occurred many years ago without follow-on orders.
While Bloom Energy generally has had high renewal rates, some customers opt not to renew their contracts due to various situations ranging from earlier contracts with less favorable terms, shifting energy solutions, changing local regulation and incentives or financial difficulties.
Establishing A Template Moving Forward with Major Utility Companies
Beyond AEP, this deal marks a significant template for future deals with major utility companies. The AEP deal also bolsters Bloom Energy's credibility and sets a standard footprint moving forward. Hyperscalers are in a race for procuring clean energy sources, as evidenced by nuclear energy deals that power their data centers like Constellation Energy's (NYSE: CEG) 20-year PPA with Microsoft Co., Talen Energy’s deal with Amazon.com and Google’s inroads into small modular reactors (SMRs), which AEP is also exploring.
Inflation Reduction Act (IRA) and the Clean Energy Investment Tax Credit (ITC) Impacts
One of the motivating factors for companies to use Bloom Energy Servers is the investment tax credit (ITC) for fuel cells. The ITC provided a 30% tax credit for the installation of renewable energy systems with an efficiency of at least 30%. The credit helped cut down the upfront costs of Bloom’s Energy Servers. Bloom Energy also received a $75.3 million tax credit from the IRS for its manufacturing facility in Freemont, CA, on March 29, 2024. The ITC expired at the end of 2024.
However, the Inflation Reduction Act of 2022 replaces the traditional ITC with the Clean Electricity Investment Tax Credit (CEITC), which is essentially the same but not technology-specific. The focus is on the production of clean energy and not just investment in equipment like the ITC. Clean hydrogen produced through its SOEC qualifies for incentives in the form of production tax credits (PTC). Clean electricity produced by BES when fueled by renewable natural gas and biogas qualifies. Renewable natural gas is produced from natural waste sources, including manure and landfills. While natural gas is a non-renewable fossil fuel, the credit can still apply by meeting emission requirement thresholds.
Additionally, implementing carbon capture technology, blending biofuel additives to natural gas and efficiency improvements can all be applied to reduce emissions. These incentives help to enhance Bloom Energy's value proposition, making its BES more affordable based on the projects and fuel sources.
The new Trump Administration has stated its intention to cut waste from the IRA of 2022, which may impact the clean energy tax credits, PTCs and manufacturing credits to offset the extension of the 2017 Tax Cuts and Jobs Act.
Financials: Improving Trends in 2024 But Still Underperforming 2023 Comparables
Bloom Energy has shown improvement in its financials since Q1 2024. The Company reported a Q3 2024 EPS loss of a penny, missing consensus analyst estimates by 9 cents. Revenues fell 17.5% YoY to $330.4 million, falling short of the $384.24 million consensus estimates. Incidentally, the stock reacted by rising 23% the following day. The market was more focused on the underlying QoQ improvements in the financial metrics, marking a third consecutive quarter of improvements.
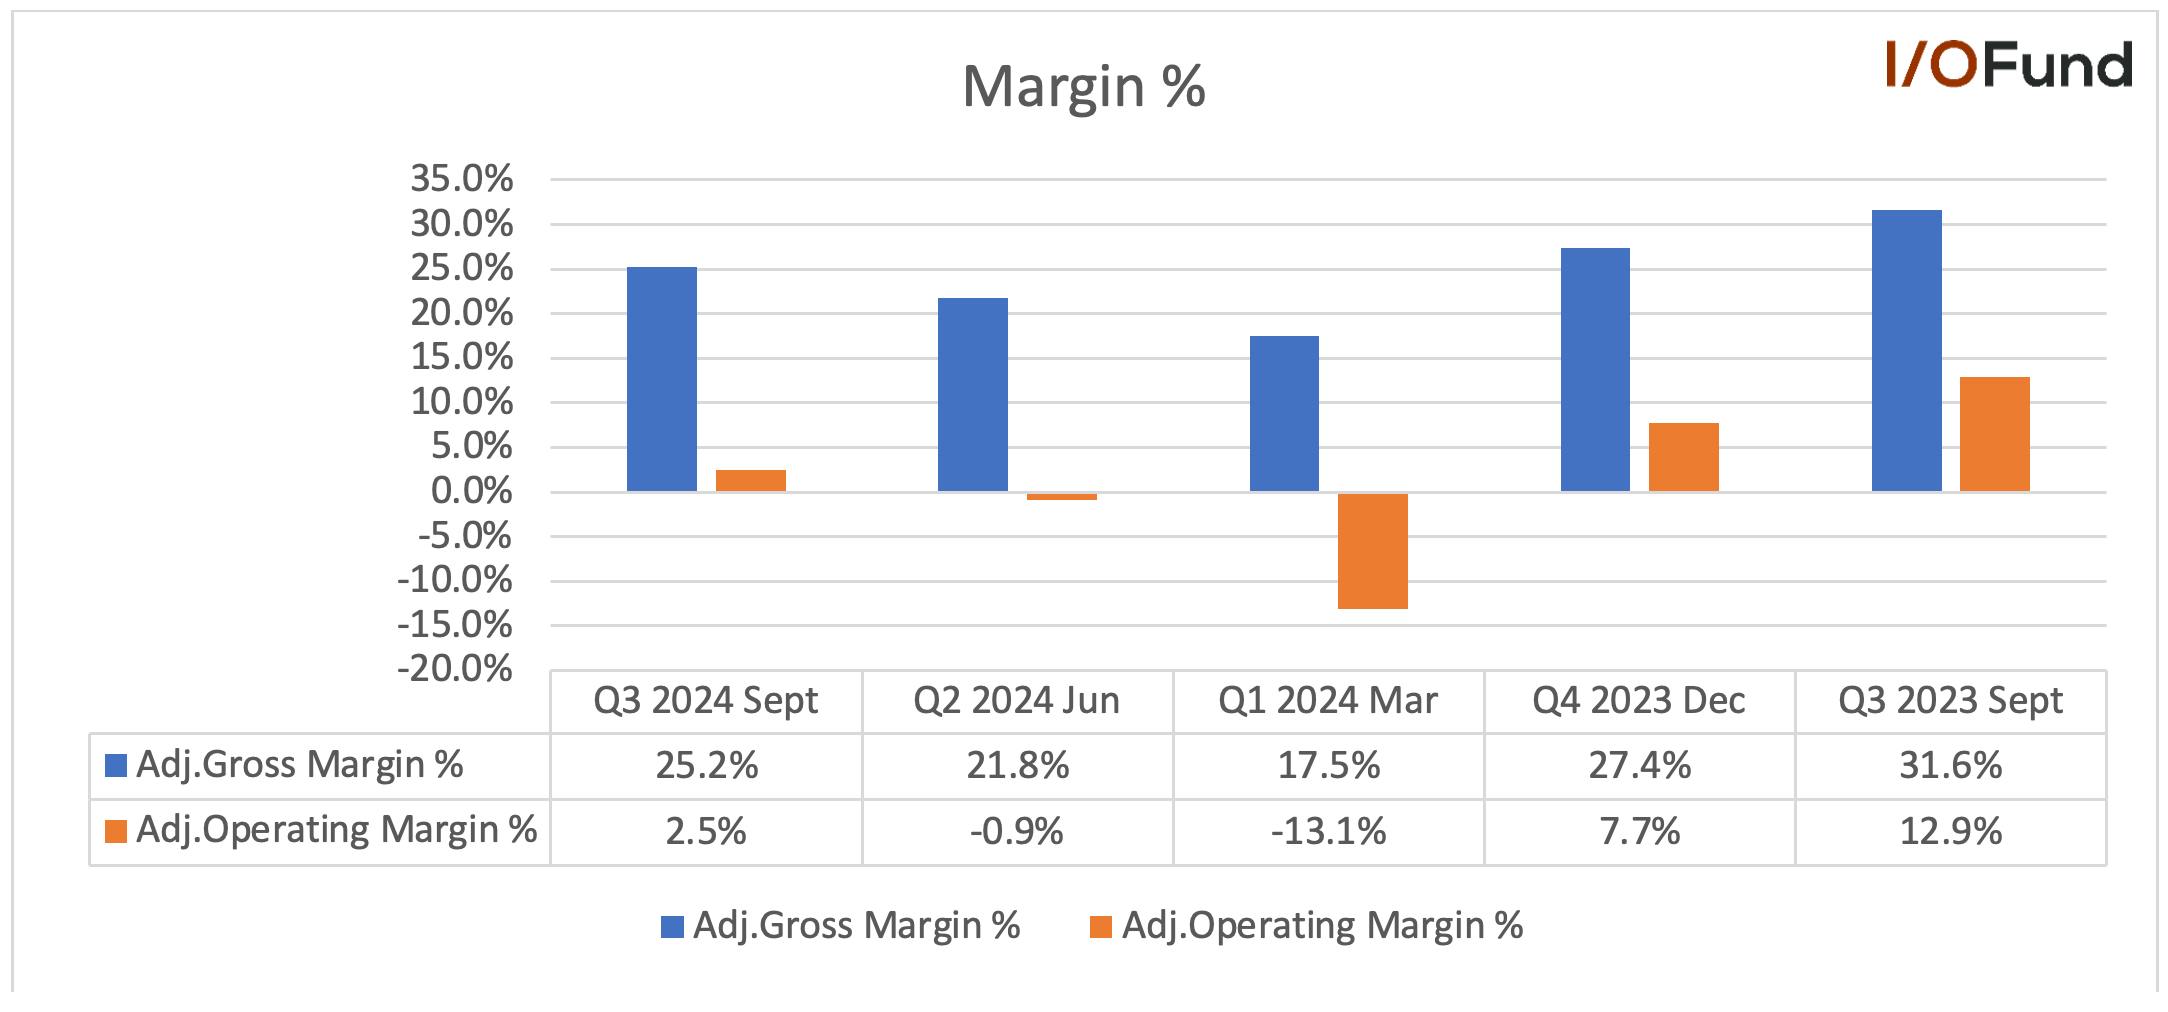
Gross margin improved from 16.2% in Q1, 20.4% in Q2 to 23.8% in Q3 2024.
Operating margin also improved from -20.8% in Q1, -6.9% in Q2 and -2.9% in Q3 2024.
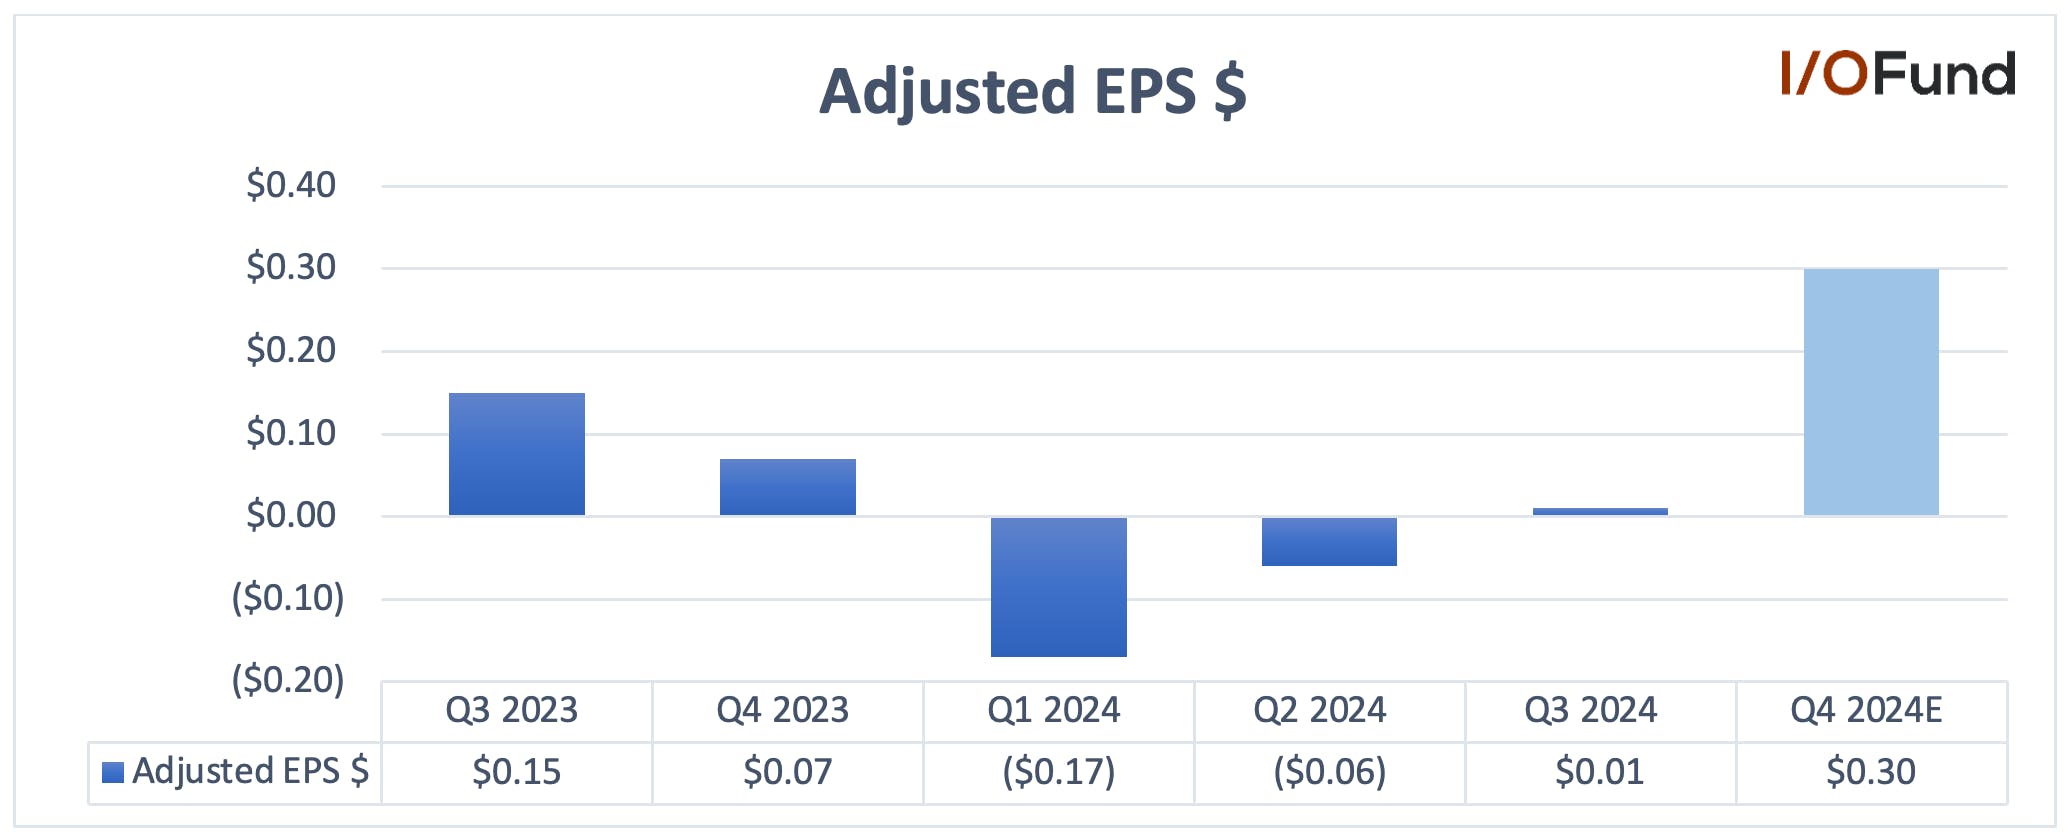
Adjusted EPS has improved from -$0.17 in Q1, -$0.06 in Q2 and -$0.01 in Q3 2024.
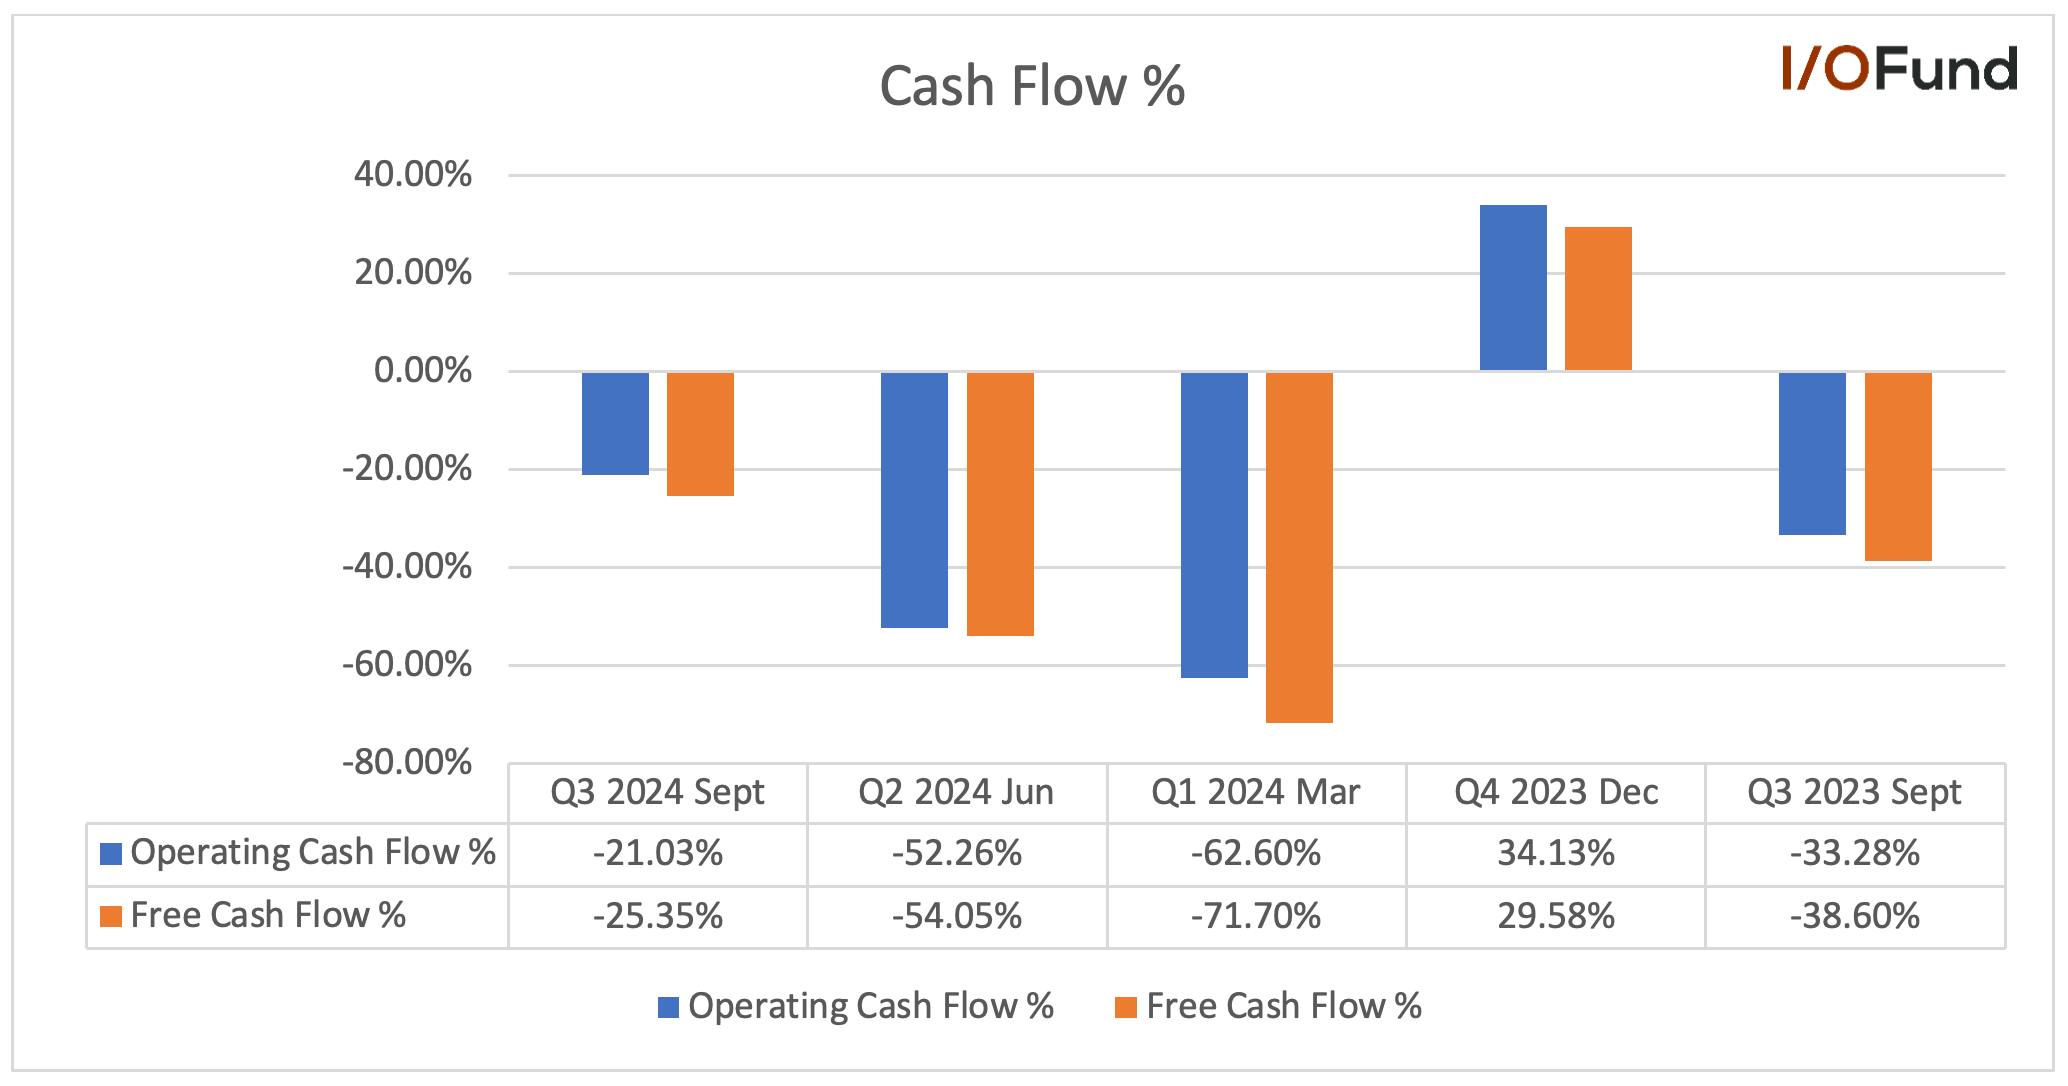
Free cash flow % has improved from -71.7% in Q1, -54.04% in Q2 and -25.35% in Q3 2024.
Operating cash flow % has improved from -62.6% in Q1, 52.26% in Q2 and -21.03% in Q3 2024.
Operating cash flow improved by $102.1 million in the first nine months of 2024 compared to the prior year from $123.1M in inventory reduction, $166.5M from faster customer payments, $85.8M in reduced deferred revenue, $31.5M in reduced accrued expenses and delayed payments to suppliers.
During the conference call, CEO Sridhar noted the big shift in its business is the time to power. Bloom Energy is able to book, build, ship, install and power sites for customers in a matter of months, which is exponentially faster than a grid connection. However, such rapid drill activities come with timeline variances, pull-ins and delays, as evidenced in Q3. Order diversity was good in Q3, with orders from utilities, data centers and international.
Sridhar remained confident, reaffirming their full-year 2024 guidance ($1.4 to $1.6 billion revenues or $1.5 billion mid-point). BES are purpose-built for data centers. He also noted the ability to provide high-temperature heat to provide cooling is an added benefit for data centers.
Sridhar disclosed the commercial value of the initial AEP order, “A 100-megawatt data center deal has a commercial value of over $1 billion, and so it takes a minute, maybe a long Texas minute, to get a deal done. We are making good progress.”
The SK Eternix deal is also a model the company hopes to replicate in international markets, as the large power block project (80 MW) is a proof point showing Bloom can power large data centers.
Bloom Energy closed a front-of-the-meter deal with FPM Development for 20 MW of Bloom SOFC across two locations in Los Angeles, providing additional capacity to Southern California Utilities.
CFO Dan Berenbaum noted that they generally recognize product revenue as they ship their energy servers for customer projects. Customer projects naturally have schedule variability, positive and negative pulling in or pushing out revenue by a quarter. This was the case in Q3 2024, and Berenbaum stands by the $1.4 billion to $1.6 billion full-year 2024 guidance too.
Analysts Are Mixed on Whether Bloom Energy Can Achieve Full Year 2024 Targets
The Company reaffirmed full year 2024 revenue of $1.4 billion to $1.6 billion or $1.5 billion midpoint, up 12.5% YoY. In order to achieve the mid-point, Q4 revenue would need to grow 67.8% YoY to $598.5 million. This is a tall order, but due to schedule variability, a large chunk of product revenue may have been pushed into Q4.
Bloom Energy could achieve this based upon strong key metrics, such as the high number of products accepted and MW accepted. Products accepted pertain to BES that have been installed, tested and accepted by the customer. MW accepted means the MW capacity of fuel cells is fully installed, operational and accepted by the customer. The revenue can finally be recognized upon acceptance of both metrics when they turn the power on or upon delivery of the product and is subject to the terms of each contract.
The SK Eternix 80MW ecoplant project in South Korea is expected to go online in 2025. If they were able to get a surge in the two acceptance metrics from October through December, then they may recognize the revenue in Q4. In the Q3 conference call Q&A, CFO Dan Berenbaum hinted at SK's receivables, “So, I mean, we're not being specific about what's included in factoring, but I will say that that specific receivable that we've spoken to, the SK receivable, we do expect to collect that before the end of the year.”
Keep in mind that Bloom Energy has $142.1 million in deferred revenues as of Q3 2024. Accounts receivables are $590.79 million of which 59% are from the Korean JV and SK ecoplant (related parties) or $348.67 million.
The trend has been rising consecutively, as evidenced by:
Products accepted rose from 477 in Q1, 673 in Q2 and 737 in Q3 2024.
MW accepted rose from 48 in Q1, 67 in Q2 and 74 in Q3 2024.
In order to achieve the $598.5 million revenue mid-point guidance, with all things being equal, Bloom Energy would need to generate more than Q1 and Q2 2024 combined, meaning at least 1,150 products accepted and 115 MW accepted, theoretically generating $571.1M in Q4 2024. Both the CEO and CFO of Bloom reaffirmed the FY 2024 revenue guidance. This could be a case of revenue pushed-out by a quarter due to schedule variability due to unexpected delays, as Q3 2024 had many installation and maintenance delays.
Here is what was stated on the call regarding the high level of confidence in meeting the total year guidance.
“Based on our current projects and the visibility we have to year-end, I'm extremely confident that Bloom Energy will meet our total year guidance.”
Conference Call Q&A Session Noteworthy Moments
UBS Analyst Manav Gupta noted how the press release underscored the diversity of orders as they came from three different markets including utilities, international power projects and data centers, inquiring if that trend will continue. CEO Shridar expounded on the importance of diversity to make their business less vulnerable to market cycles. Diversity positions them for long-term growth addressing the growing global need for clean and reliable energy solutions. It’s more than power generation but also transmission.
RBC Capital Markets analyst Chris Dendrinos inquired about the rationale for expanding manufacturing capacity in the Fremont, California facility. CEO Sridhar answered that they will have a GW worth of capacity next year for their fuel cells. It’s a preemptive move in light of the rapidly growing market. They also have enough space to add an additional GW as needed. Bloom Energy not only has time to power play but also time to expansion play to meet the “voracious demand” brewing in the marketplace adding, “So we built, we not only selected the factory and the size, but also how we scale to be able to scale extremely quickly as we see the demand go up.”
CEO Sridhar noted that, outside of data centers, Korean volumes are up and stable, but U.S. commercial and industrial are experiencing significant uptake across sectors. Bloom Energy is in active negotiations with multiple partners for the opportunity in large AI data centers. He stated, "Data centers and the entire AI supply chain are going to create a demand unlike any other that we have ever seen since Edison put a grid together. And we are hand in glove for that market.”
Wolfe Research Analyst Chris Senyek wanted clarity on what drives management’s conviction they will meet end of year forecasts. He mentioned the 20 MW FPM order being expected to be delivered by year’s end and SK Eternix deliveries. Berenbaum cited that SK Eternix is 2025 revenue upon commissioning and commented, “But very specifically, when we look at Q4, we're looking at very specific projects that are in various stages of contracting, for example, that lead us to be confident in our ability to hit that full-year guidance. So these are very specific conversations that we have looking at our relationships with our customers on the projects that they are moving forward with.”
Conclusion:
Bloom Energy still loses money on every BES. Demand slowed down in Q3 2024, as evidenced by a 23.3% YoY drop in product revenue, but the CEO and CFO ensured it was due to schedule variability. Underlying metrics have been improving in 2024, with large expectations in Q4 2024 to set the tone in 2025. The SK Eternix 80MW single-site installation is expected to commence operations and generate revenues in 2025. Bloom Energy will also get revenue from the initial 100MW of SOFCs ordered from the AEP deal, but revenue won't be recognized until the product and MW are accepted. The potential upside of $7 billion in revenue looms on additional MWs up to the 1 GW procurement. Bloom Energy has a loan interest payment of $115 million due in August 2025.
The AEP deal has given Bloom Energy stock a 52% premium halo that may erode unless new deals are announced. AEP has already indicated that it’s in the process of finalizing the first customer project agreements, and discussions are ongoing with several other customers. Material revenue growth is likely several quarters away from the AEP deal.
I/O Fund Equity Analyst, Jea Yu, contributed to this analysis
** On October 23, 2021, Bloom entered into a securities purchasing agreement (SPA) in connection to a strategic partnership. SK ecoplant purchased 10 million shares of Bloom Energy Series A preferred stock at $25.50 per shares for $255 million, with an option to purchase additional Class A common stock.
August 10, 2022, SK ecoplant notified its intention to exercise its option to purchase additional Class A common stock, pursuant to a Second Tranche Exercise Notice. SK ecoplant elected to purchase 13,491.701 shares at $23.05 per share for a total of $311 million.
March 20, 2023, Bloom amended the SPA, as they issued and sold 13,491,701 Series B redeemable convertible preferred stock (RCPS) for $311 million in cash. Bloom also entered into a Shareholders Loan Agreement for up to $311 million if needed.
September 23, 2023, SK ecoplant converted all 13,491,701 of the RCPS into Class A common stock. Shares opened the following morning at $13.71.
According to its 2023 10-K pg. 88, Bloom Energy recognizes revenue when they "satisfy a performance obligation ."Revenue is recognized at the time the related performance obligation is satisfied by transferring control of the promised products or services to a customer. However, they don't report remaining performance obligations (RPOs) or backlog information.
Please note: The I/O Fund conducts research and draws conclusions for the Fund’s positions. We then share that information with our readers. This is not a guarantee of a stock’s performance. Please consult your personal financial advisor before buying any stock in the companies mentioned in this analysis.
As a utility-based stock, Bloom Energy has lumpy revenue – which is common in this sector. The stock requires strong risk management due to weak cash and not being profitable, however, the upside is immense should more large data center deals be announced.
The company has deployed 1.3 GW since 2001, yet announced in November a deal for 1 GW with the utility company AEP to power data centers. The deal announced in November will nearly double the company’s fuel cell deployment from one deal; evidence of the booming energy demand from AI data centers. AEP’s customers include Google, Amazon, Microsoft and Meta Platforms.
Bloom Energy has set the bar high for Q4 2024 earnings for growth of 67.7% versus analyst estimates for growth of 42.7%. Results are expected after the market close on February 14, 2025. The CEO and CFO reaffirmed guidance implying Q3 2024 had revenues pushed out to Q4 due to delays.
Bloom Energy is not profitable and is cash flow negative – hence, the first bullet point that this stock requires strict risk management (i.e., we will closely adhere to our stops). However, the company is nearing GAAP profitability with a margin of (-3%) last quarter and management has guided for adjusted operating profits of $75 million to $100 million for FY2024. The adjusted EBITDA margin last quarter was 6.5%.
Nearly 77% of accounts receivable come from just two customers, who are also related parties.
Bloom Energy Shows Initial Promise of Becoming Data Center-Fueled Stock
The Chinese bamboo tree remains dormant on the surface for five years after planting the seeds. While many farmers chalk it up as a waste of time, those who are believers eventually get rewarded as it can break ground and grow up to 90 feet tall in the following five weeks. What appears to be dormant on the surface overlooks the years spent developing its root system underground.
This metaphor applies to many companies that eventually transform into outliers. In Bloom Energy’s case, it would be more than two decades of dormancy that may be leading up to breaking ground in 2025.
Bloom Energy Inc. provides on-site 24/7 power generation using their proprietary solid oxide fuel cells (SOFCs). The SOFCs are stacked up by the hundreds to thousands in Bloom Energy Servers (BES), which enable the conversion of fuels like natural gas, biogas and hydrogen to electricity through a chemical reaction, not combustion, arguably resulting in less emissions.
Hydrogen and biogas fuel sources enable BES produce zero carbon or carbon neutral power. When BES are fueled with natural gas to generate electricity, they do emit carbon dioxide, but significantly less than through the combustion process. Natural gas is currently the primary fuel source for most BES due to the readily available supply of natural gas, established infrastructure and lower costs.
Bloom Electrolyzers are solid oxide fuel cell electrolyzers (SOECs) that can convert electricity into hydrogen, an important decarbonization tool in the energy transition. With that said, most of Bloom Energy Servers use natural gas as their primary fuel source.
Bloom Energy’s management emphasizes the following key points as to why hydrogen fuel cells are well suited as a power solution for AI data centers:
The time response of fuel cells is in the milliseconds. This is a primary point as to why Bloom Energy could secure future data center deals. Here is what management described as to the competitive advantages regarding time to power for fuel cells: “A big shift in our business today is time to power. We are providing solutions to meet the urgent needs of our customers who cannot fulfill their power needs from the grid. In these cases, we rapidly book, build, ship, install and power sites for our customers in a matter of months, a much faster timeline than a grid connection. Such rapid drill activities will necessarily come with timeline variances, both pull-ins and delays, and will affect our quarterly revenue line. You are seeing this in our Q3 numbers.”
Using high-temperature heat to provide cooling could become a key way to use hydrogen fuel cells in data centers. As pointed out by the Fuel Cell and Hydrogen Energy Association, excess heat from fuel cells can be used to cool servers.
Management also stated fuel cells are “pay-as-you-grow” are offer “high-power density” which makes them an economic choice. However, nuclear offers far more power density than fuel cells and thus this is not a primary point for choosing fuel cells over nuclear (in fact, it’s a primary reason to choose nuclear)
Rapid Deployment for Backup or Primary Power, or Utility Transmission:
BES uses core 325 kW base blocks customized to work in parallel with the local electric grid in standby or backup mode to kick in when the local power becomes unavailable. The 325 kW base blocks can be duplicated and scaled up to multiple MWs for any project. They can also be used as the primary power source. They can be used off-grid or parallel as a microgrid. BES has a high density compared to solar or wind of 100 MW per acre with features such as stackable servers and combined heat and power solutions. However, nuclear is in the kilowatts per acre, and therefore, is by far the highest density power solution.
BES can be purchased, customized and installed with ongoing maintenance and support contracts procured with a maintenance agreement or contracted as an energy service for five to 20 years under a Power Purchase Agreement (PPA) with a tolling rate. BES is compatible with utility companies as backup power or behind-the-meter as a more primary power solution.
Bloom Microgrids offer security and flexibility by running alongside the utility in grid-following mode, taking primary control over critical loads and customizing power delivery. During power outages, the BES briefly disconnects from the utility coming online in grid-forming mode, carrying the predetermined load set by the customer. The BES will maintain this load and resume grid parallel operation after restoring utility power.
Rapid Solution for Utility Transmission:
A few months back, our free analysis pointed toward a critical bottleneck in power consumption as GPUs are increasing in power consumption from 75% from the previous generation of Hopper GPUs to now a 300% increase in the next generation of Blackwell GPUs arriving in 2025. The analysis cited Morgan Stanley’s estimates of 5X increase in power demand over the next three years and Wells Fargo estimating growth of 8,050% from 2024 to 2030.
Bloom Energy pointed out an important aspect of fuel cells in clearing this bottleneck which is time to power, including for utility transmission.
Here is what was stated:
“Transmission in the U.S. is going to be a bottleneck for a very long time to come. So, our asset becomes both a transmission asset and an end-user asset. So, to help a utility mitigate the long cycles it's going to take them to get transmission to where they need to supply the power to their customer, a short circuit to that would be to use our box in front of the meter, not have to do transmission upgrades and supply large blocks of power to a customer.”
Heat Capture Helps to Cool GPUs
BES are designed to work with existing carbon capture utilization and storage (CCUS) and combined heat and power (CHP) technologies. CCUS mitigates emissions from natural gas as BESs generate a pure stream of CO2 that can be used or sequestered. CHP allows the exhaust heat generated by BES (operating at a core temperature of 1,500 degrees Fahrenheit or 800 degrees Celsius) to be channeled and made available for use, further increasing the efficiency of the system.
Bloom Energy announced their SOFCs have reached 60% electrical efficiency while using 100% hydrogen. The high-temperature exhaust stream can produce steam in addition to electricity, resulting in 90% lifetime total system efficiency by adding Heat Capture. For example, the BES with heat capture includes applications that use a rear-door heat exchanger, which is one way to cool servers. Rear-door heat exchangers offer near-instantaneous cooling. Per Bloom’s website: “With the Heat Capture option, the exhaust heat exits the equipment at the back of the power module instead of the top and is easily transferred to a heat exchanger system.”
Bloom Energy Customers: AI Drives Up Energy Demand
The Gamechanger Deal: AEP Procures up to 1GW of SOFCs for Data Centers
November 15, 2024, Bloom Energy stock gapped 59% higher to $21.14 from $13.28 on news of a deal with American Electric Power (NYSE: AEP), a major utility company serving 5.6 million customers in 11 states with 29,000 MW of diverse generating capacity, to secure up to 1 GW of Bloom Energy SOFC for their data center customers and other larger energy users. The deal coined itself as the largest commercial procurement of fuel cells in the world. AEP placed an order for 100 MW of fuel cells, with further expansion orders expected in 2025.
While Bloom Energy provided no financial information regarding the deal, S&P Global Intelligence estimates the deal could be worth up to $7 billion in revenues if the full 1 GW is deployed. The initial 100 MW order from AEP is valued at around $1 billion (revealed in the Q3 2023 conference call). The AEP deal would accomplish 77% of the 1.3 GW total deployed by Bloom Energy in the past 24 years. The hype and hope have fueled Bloom Energy's stock into the $20s.
AEP is Finalizing the First Customer Project with More to Come
AEP expects commercial load to grow 20% annually over the next three years, driven by data center development. The company is in the process of finalizing the first customer project agreements, and discussions are ongoing with several other customers. AEP’s hyperscaler customers include Google, Amazon, Microsoft and Meta Platformshyperscaler customers include Google, Amazon, Microsoft and Meta Platforms.
AEP will purchase SOFCs from Bloom Energy with an initial order of 100 MW, with more expected in 2025, and integrate them into their customer energy systems, prioritizing AI data centers. Large customers will cover all costs for the fuel cell projects under a special contract. AEP will oversee deployment and installation at customer sites.
Bloom will supply the SOFCs to AEP, providing the core technology for on-site power generation. Bloom will likely offer ongoing support and maintenance services.
Bloom CEO and founder KR Sridhar commented, “I am delighted that there is strong market recognition that the Bloom Energy platform is the ideal choice for powering AI data centers. We are thrilled to be working with AEP as they lead the charge to bring innovative solutions to the transforming electricity market. With our proven track record of more than 1.3 GW deployed and a fully functional factory that can deliver GWs of products per year, we are ready and able to meet this rapid electricity demand growth."
Customer Concentration is a Concern: Two Customers Account for 77% of AR
As of September 30, 2024, two customers accounted for 77% of total accounts receivables (59% and 18%). The first is the related parties SK ecoplant and a Korean JV. Related parties account for $349.5M in accounts receivables for Q3 2024.
As of September 23, 2023, SK ecoplant held 23.5 million shares of Bloom Energy Class A stock representing 10.5% of outstanding shares, which makes them a related party, valued at around $566 million on December 22, 2023.
Three customers account for 68% of total revenue for Q3 2024, which includes 38% from its "related party" and 20% and 10% from two other customers. Related parties generated $126.6M in revenue in Q3 2024.
SK ecoplant and SK Eternix are subsidiaries of SK Group. SK Eternix was launched in March 2024. On November 7, 2024, SK Eternix and Bloom Energy announced the World’s Largest Fuel Cell Installation in HistoryWorld’s Largest Fuel Cell Installation in History in collaboration with SK Eternix for an 80MW installation looking to commence operations in 2025. The single-site installation will power two ecoparks in the North Chungcheong Province, South Korea.
SK ecoplant: A White Knight with Too Much Leverage
Bloom Energy states that it has incurred losses and negative cash flows since its inception. SK ecoplant (formerly known as SK Engineering and Construction Co.) was a large funder for the company. From 2021 to 2023, Bloom executed new debt offerings, debt extinguishments and conversions to equity (dilution) to grow liquidity to $842 million and $4.6 million in recourse and non-recourse debt at the end of December 31, 2023, classified as long-term debt.
December 22, 2023, SK ecoplant extended its preferred distributor agreement to commit to purchasing 500 MW of Energy Servers from Bloom Energy through 2027, expected to generate $1.5 billion in product and $3 billion in service revenues over 20 years for Bloom Energy. SK ecoplant has made $566 million in equity investment, owning 10% of the company.**
Bloom Energy’s Roster of Customers Are Well Known
Some of Bloom Energy’s well-known customers include Google (400 kW Mountainview, CA, in July 2008), FedEx, Yahoo (1 MW, Sunnyvale, CA, in July 2014), Adobe (1.5 MW San Francisco, CA, 2012), IBM, AT&T (21 MW at 34 sites starting with 10 MW in 2013 in CA, CT, NJ and NY), Honda (1 MW of 5 BES in Torrance, CA), Target, Home Depot, Medtronic (400 kW, Santa Clara, CA), Equinox, Walmart (40+ projects in CA since 2009), Kaiser Permanente (4.3 MW in 7 projects in CA), Comcast and Lockheed Martin. However, the majority of their revenue is derived from three customers. Most of these installs occurred many years ago without follow-on orders.
While Bloom Energy generally has had high renewal rates, some customers opt not to renew their contracts due to various situations ranging from earlier contracts with less favorable terms, shifting energy solutions, changing local regulation and incentives or financial difficulties.
Establishing A Template Moving Forward with Major Utility Companies
Beyond AEP, this deal marks a significant template for future deals with major utility companies. The AEP deal also bolsters Bloom Energy's credibility and sets a standard footprint moving forward. Hyperscalers are in a race for procuring clean energy sources, as evidenced by nuclear energy deals that power their data centers like Constellation Energy's (NYSE: CEG) 20-year PPA with Microsoft Co., Talen Energy’s deal with Amazon.com and Google’s inroads into small modular reactors (SMRs), which AEP is also exploring.
Inflation Reduction Act (IRA) and the Clean Energy Investment Tax Credit (ITC) Impacts
One of the motivating factors for companies to use Bloom Energy Servers is the investment tax credit (ITC) for fuel cells. The ITC provided a 30% tax credit for the installation of renewable energy systems with an efficiency of at least 30%. The credit helped cut down the upfront costs of Bloom’s Energy Servers. Bloom Energy also received a $75.3 million tax credit from the IRS for its manufacturing facility in Freemont, CA, on March 29, 2024. The ITC expired at the end of 2024.
However, the Inflation Reduction Act of 2022 replaces the traditional ITC with the Clean Electricity Investment Tax Credit (CEITC), which is essentially the same but not technology-specific. The focus is on the production of clean energy and not just investment in equipment like the ITC. Clean hydrogen produced through its SOEC qualifies for incentives in the form of production tax credits (PTC). Clean electricity produced by BES when fueled by renewable natural gas and biogas qualifies. Renewable natural gas is produced from natural waste sources, including manure and landfills. While natural gas is a non-renewable fossil fuel, the credit can still apply by meeting emission requirement thresholds.
Additionally, implementing carbon capture technology, blending biofuel additives to natural gas and efficiency improvements can all be applied to reduce emissions. These incentives help to enhance Bloom Energy's value proposition, making its BES more affordable based on the projects and fuel sources.
The new Trump Administration has stated its intention to cut waste from the IRA of 2022, which may impact the clean energy tax credits, PTCs and manufacturing credits to offset the extension of the 2017 Tax Cuts and Jobs Act.
Financials: Improving Trends in 2024 But Still Underperforming 2023 Comparables
Bloom Energy has shown improvement in its financials since Q1 2024. The Company reported a Q3 2024 EPS loss of a penny, missing consensus analyst estimates by 9 cents. Revenues fell 17.5% YoY to $330.4 million, falling short of the $384.24 million consensus estimates. Incidentally, the stock reacted by rising 23% the following day. The market was more focused on the underlying QoQ improvements in the financial metrics, marking a third consecutive quarter of improvements.
Gross margin improved from 16.2% in Q1, 20.4% in Q2 to 23.8% in Q3 2024.
Operating margin also improved from -20.8% in Q1, -6.9% in Q2 and -2.9% in Q3 2024.
Adjusted EPS has improved from -$0.17 in Q1, -$0.06 in Q2 and -$0.01 in Q3 2024.
Free cash flow % has improved from -71.7% in Q1, -54.04% in Q2 and -25.35% in Q3 2024.
Operating cash flow % has improved from -62.6% in Q1, 52.26% in Q2 and -21.03% in Q3 2024.
Operating cash flow improved by $102.1 million in the first nine months of 2024 compared to the prior year from $123.1M in inventory reduction, $166.5M from faster customer payments, $85.8M in reduced deferred revenue, $31.5M in reduced accrued expenses and delayed payments to suppliers.
During the conference call, CEO Sridhar noted the big shift in its business is the time to power. Bloom Energy is able to book, build, ship, install and power sites for customers in a matter of months, which is exponentially faster than a grid connection. However, such rapid drill activities come with timeline variances, pull-ins and delays, as evidenced in Q3. Order diversity was good in Q3, with orders from utilities, data centers and international.
Sridhar remained confident, reaffirming their full-year 2024 guidance ($1.4 to $1.6 billion revenues or $1.5 billion mid-point). BES are purpose-built for data centers. He also noted the ability to provide high-temperature heat to provide cooling is an added benefit for data centers.
Sridhar disclosed the commercial value of the initial AEP order, “A 100-megawatt data center deal has a commercial value of over $1 billion, and so it takes a minute, maybe a long Texas minute, to get a deal done. We are making good progress.”
The SK Eternix deal is also a model the company hopes to replicate in international markets, as the large power block project (80 MW) is a proof point showing Bloom can power large data centers.
Bloom Energy closed a front-of-the-meter deal with FPM Development for 20 MW of Bloom SOFC across two locations in Los Angeles, providing additional capacity to Southern California Utilities.
CFO Dan Berenbaum noted that they generally recognize product revenue as they ship their energy servers for customer projects. Customer projects naturally have schedule variability, positive and negative pulling in or pushing out revenue by a quarter. This was the case in Q3 2024, and Berenbaum stands by the $1.4 billion to $1.6 billion full-year 2024 guidance too.
Analysts Are Mixed on Whether Bloom Energy Can Achieve Full Year 2024 Targets
The Company reaffirmed full year 2024 revenue of $1.4 billion to $1.6 billion or $1.5 billion midpoint, up 12.5% YoY. In order to achieve the mid-point, Q4 revenue would need to grow 67.8% YoY to $598.5 million. This is a tall order, but due to schedule variability, a large chunk of product revenue may have been pushed into Q4.
Bloom Energy could achieve this based upon strong key metrics, such as the high number of products accepted and MW accepted. Products accepted pertain to BES that have been installed, tested and accepted by the customer. MW accepted means the MW capacity of fuel cells is fully installed, operational and accepted by the customer. The revenue can finally be recognized upon acceptance of both metrics when they turn the power on or upon delivery of the product and is subject to the terms of each contract.
The SK Eternix 80MW ecoplant project in South Korea is expected to go online in 2025. If they were able to get a surge in the two acceptance metrics from October through December, then they may recognize the revenue in Q4. In the Q3 conference call Q&A, CFO Dan Berenbaum hinted at SK's receivables, “So, I mean, we're not being specific about what's included in factoring, but I will say that that specific receivable that we've spoken to, the SK receivable, we do expect to collect that before the end of the year.”
Keep in mind that Bloom Energy has $142.1 million in deferred revenues as of Q3 2024. Accounts receivables are $590.79 million of which 59% are from the Korean JV and SK ecoplant (related parties) or $348.67 million.
The trend has been rising consecutively, as evidenced by:
Products accepted rose from 477 in Q1, 673 in Q2 and 737 in Q3 2024.
MW accepted rose from 48 in Q1, 67 in Q2 and 74 in Q3 2024.
In order to achieve the $598.5 million revenue mid-point guidance, with all things being equal, Bloom Energy would need to generate more than Q1 and Q2 2024 combined, meaning at least 1,150 products accepted and 115 MW accepted, theoretically generating $571.1M in Q4 2024. Both the CEO and CFO of Bloom reaffirmed the FY 2024 revenue guidance. This could be a case of revenue pushed-out by a quarter due to schedule variability due to unexpected delays, as Q3 2024 had many installation and maintenance delays.
Here is what was stated on the call regarding the high level of confidence in meeting the total year guidance.
“Based on our current projects and the visibility we have to year-end, I'm extremely confident that Bloom Energy will meet our total year guidance.”
Conference Call Q&A Session Noteworthy Moments
UBS Analyst Manav Gupta noted how the press release underscored the diversity of orders as they came from three different markets including utilities, international power projects and data centers, inquiring if that trend will continue. CEO Shridar expounded on the importance of diversity to make their business less vulnerable to market cycles. Diversity positions them for long-term growth addressing the growing global need for clean and reliable energy solutions. It’s more than power generation but also transmission.
RBC Capital Markets analyst Chris Dendrinos inquired about the rationale for expanding manufacturing capacity in the Fremont, California facility. CEO Sridhar answered that they will have a GW worth of capacity next year for their fuel cells. It’s a preemptive move in light of the rapidly growing market. They also have enough space to add an additional GW as needed. Bloom Energy not only has time to power play but also time to expansion play to meet the “voracious demand” brewing in the marketplace adding, “So we built, we not only selected the factory and the size, but also how we scale to be able to scale extremely quickly as we see the demand go up.”
CEO Sridhar noted that, outside of data centers, Korean volumes are up and stable, but U.S. commercial and industrial are experiencing significant uptake across sectors. Bloom Energy is in active negotiations with multiple partners for the opportunity in large AI data centers. He stated, "Data centers and the entire AI supply chain are going to create a demand unlike any other that we have ever seen since Edison put a grid together. And we are hand in glove for that market.”
Wolfe Research Analyst Chris Senyek wanted clarity on what drives management’s conviction they will meet end of year forecasts. He mentioned the 20 MW FPM order being expected to be delivered by year’s end and SK Eternix deliveries. Berenbaum cited that SK Eternix is 2025 revenue upon commissioning and commented, “But very specifically, when we look at Q4, we're looking at very specific projects that are in various stages of contracting, for example, that lead us to be confident in our ability to hit that full-year guidance. So these are very specific conversations that we have looking at our relationships with our customers on the projects that they are moving forward with.”
Conclusion:
Bloom Energy still loses money on every BES. Demand slowed down in Q3 2024, as evidenced by a 23.3% YoY drop in product revenue, but the CEO and CFO ensured it was due to schedule variability. Underlying metrics have been improving in 2024, with large expectations in Q4 2024 to set the tone in 2025. The SK Eternix 80MW single-site installation is expected to commence operations and generate revenues in 2025. Bloom Energy will also get revenue from the initial 100MW of SOFCs ordered from the AEP deal, but revenue won't be recognized until the product and MW are accepted. The potential upside of $7 billion in revenue looms on additional MWs up to the 1 GW procurement. Bloom Energy has a loan interest payment of $115 million due in August 2025.
The AEP deal has given Bloom Energy stock a 52% premium halo that may erode unless new deals are announced. AEP has already indicated that it’s in the process of finalizing the first customer project agreements, and discussions are ongoing with several other customers. Material revenue growth is likely several quarters away from the AEP deal.
I/O Fund Equity Analyst, Jea Yu, contributed to this analysis
** On October 23, 2021, Bloom entered into a securities purchasing agreement (SPA) in connection to a strategic partnership. SK ecoplant purchased 10 million shares of Bloom Energy Series A preferred stock at $25.50 per shares for $255 million, with an option to purchase additional Class A common stock.
August 10, 2022, SK ecoplant notified its intention to exercise its option to purchase additional Class A common stock, pursuant to a Second Tranche Exercise Notice. SK ecoplant elected to purchase 13,491.701 shares at $23.05 per share for a total of $311 million.
March 20, 2023, Bloom amended the SPA, as they issued and sold 13,491,701 Series B redeemable convertible preferred stock (RCPS) for $311 million in cash. Bloom also entered into a Shareholders Loan Agreement for up to $311 million if needed.
September 23, 2023, SK ecoplant converted all 13,491,701 of the RCPS into Class A common stock. Shares opened the following morning at $13.71.
According to its 2023 10-K pg. 88, Bloom Energy recognizes revenue when they "satisfy a performance obligation ."Revenue is recognized at the time the related performance obligation is satisfied by transferring control of the promised products or services to a customer. However, they don't report remaining performance obligations (RPOs) or backlog information.
Please note: The I/O Fund conducts research and draws conclusions for the Fund’s positions. We then share that information with our readers. This is not a guarantee of a stock’s performance. Please consult your personal financial advisor before buying any stock in the companies mentioned in this analysis.
2024 was quite the year for Bitcoin, with the popular cryptocurrency topping the $100,000 mark for the first time in history. Spot ETFs were approved at the beginning of the year, quickly seeing billions in inflows, while investors look ahead to more favorable crypto policy come 2025.
While it was a banner year for BTC, miners have not fared as well, with some of the leading miners such as Marathon Digital and Riot Platforms recording (20%) to (30%) declines for the year. Revenue growth has faced some headwinds this year while losses have widened so far post-halving. Marathon has been significantly boosting its BTC holdings with open-market purchases of more than 22,000 BTC in 2024, while Riot began purchases in December. Though 2025 looks set for growth, profitability remains challenged.
As stated under the Technicals section below, Riot and Marathon Digital would be strictly momentum plays. These are not quality positions based on fundamentals, rather they lean into the extremely high risk/high reward category due to being leveraged Bitcoin bets. You can think of these stocks along the lines of MicroStrategy, a stock that is reaping outsized rewards from Bitcoin’s price movements due to accumulating large amounts of Bitcoin on the company’s balance sheet. To illustrate why leveraged Bitcoin bets can often be highly rewarded, Marathon noted in the Q3 earnings call that “a $10,000 change in BTC price will result in over a $200 million impact in our earnings purely due to our large HODL position.”
The profile from last quarter on both stocks is deep in the red at (-51%) gross margin and (-101.6%) operating margin for Marathon, while Riot has a +14% gross margin yet (-121%) operating margin. Losses into the triple digits helps to illustrate just how risky these stocks are.
It’s also important to consider that Marathon and Riot are accumulating Bitcoin instead of mining Bitcoin due to increased network difficulty from mining Bitcoin following the last halving in April of 2024, and also headwinds to profitability from depreciation and amortization (D&A).
Global Hash Rate Surges Alongside BTC
Global hash rate has surged alongside Bitcoin this year, ending the year 60% higher, at approximately 800 exahash per second (EH/s). While global hash rate increased fairly steadily throughout the year, it accelerated in Q4, from 640 EH/s to 800 EH/s, as BTC rose from $60,000 to over $100,000. Global hash rate is now ~5x higher than at Bitcoin’s prior peak in 2021.
This increase in global hash rate, or higher network difficulty, means more computational power and thus electricity is required to mine the same amount of blocks. Riot said that Bitcoin’s rise led to “unprecedent expansion in mining operations and resulting in a doubling in the size of provisioned hash calculation services on the network.” More recently, the mining industry “recently experienced an increase in transaction fees on the Bitcoin network, as well as an increase in overall demand for Bitcoin.”
What this means is that Bitcoin mining efforts have actually led to decreased BTC production despite both Marathon and Riot significantly expanding operations and increasing hash rates. Riot said that despite increasing its hash rate ~159% YoY to 28.2 EH/s, April’s halving event and increased network difficulty from higher global hash rate resulted in BTC mining production declining -34% YoY in Q3. Similarly, Marathon’s BTC production declined -41% YoY to 2,070 BTC despite a YoY increase in blocks won.
These trends are expected to persist as BTC pricing increases, with Riot pointing out that rising market prices draw more miners and hash rate onto the network, increasing difficulty and forcing existing operators to continually increase hash rates to maintain chances of earning mining rewards.
Strong Q4 Hash Rates
It’s important to note that Riot and Marathon do not operate at 100% energization (or full utilization) of their BTC mining fleets on a 24/7 basis.
However, average operational hash rates are lower, due to some mining systems being offline, downtime, or other fluctuations in performance.
Marathon’s average operational hash rate in Q3 was 28.8 EH/s, or ~78% of its energized hash rate of 36.6 EH/s at quarter end.
Riot’s average operating hash rate was 16.7 EH/s in Q3, or ~59% of its 28.2 EH/s deployed hash rate.
Marathon kept a larger percentage of its fleet online during the quarter. As a percentage of global hash rate, Marathon contributed ~4.6% and Riot ~2.7% in Q3.
Both miners have set targets for energized/deployed hash rates for 2024 — 50 EH/s for Marathon and 35 EH/s for Riot. Marathon Digital surpassed its energized hash rate target, with energized hash rate up 15% MoM to 46.1 EH/s in November and another 15% MoM to 53.2 EH/s in December. Riot’s deployed hash rate in November rose 5% MoM to 30.8 EH/s, also putting it on track to reach its year-end target.
Accumulating BTC with MARA’s Holdings at 67% of Market Cap
Marathon shifted its treasury policy stance in Q2 2024 to adopt a “full HODL approach”, and said that it will make open-market purchases to take advantage of dips in BTC. Marathon had sold off portions of its mined BTC to cover operational expenses beginning in 2022, but now will be focused on retaining mined coins and building out its BTC assets due to management’s confidence in the long-term value of BTC moving forward.
Marathon has quickly put this strategy in play, with its BTC holdings surging 68% QoQ and 143% since Q2 to 44,893 BTC. Marathon’s BTC holdings are worth $4.4 billion at the current price of $98,000 – another way to see this is that 67% of Marathon’s current $6.6 billion market cap is solely BTC.
The increase in BTC holdings has been driven by large scale purchases over the past two months – Marathon mined 907 BTC in November but purchased an addition 6,474 BTC on the open market. December mining rewards were 890 BTC, with purchases of 9,044 BTC.
Marathon is augmenting its lower production post-halving: Marathon mined 4,584 BTC in Q3 and Q4 (down -41% YoY), but purchased nearly 22,000 BTC in the two quarters. The purchases are coming at a higher cost than mining, with Marathon paying more than $87,000 on average for its 22,065 BTC purchased in 2024 while average mining costs were $42,805 in Q3.
Similar to MicroStrategy, Marathon tapped into the low/zero-coupon convertible market to finance these major BTC purchases:
Purchased 4,144 BTC for $249 million from the August 2024 issuance of $300 million in 2.125% convertible notes due 2031
Completed Nov 2024 issuance of $1 billion in 0% convertible notes due 2030 (oversubscribed and upsized from $700M), to be primarily used for BTC purchases and repayment of 2026 notes (~$331M principal remaining)
Completed Dec 2024 issuance of $850 million in 0% convertible notes due 2031 (oversubscribed and upsized from $700M), to be primarily used for BTC purchases and 2026 note repayment
Additionally, Riot began large-scale purchases of BTC in December. Riot’s BTC holdings totaled 11,425 at the end of November, up ~5% MoM from 10,928 in October. Riot purchased 5,784 BTC in December (utilizing the proceeds from its $594.4 million convertible note issuance), taking its total holdings to 17,722 BTC at the end of 2024, a 141% YoY increase.
Marathon: Revenue Expected to Rebound in Q4
Though its average operational hash rate was much higher than Riot’s, Marathon was also adversely impacted by rising network difficulty, with mined BTC declining significantly YoY and revenues declining from a peak in Q1.
Q3 revenue was $131.6 million, rising nearly 35% YoY but declining -10% QoQ. This was also more than 20% lower than the $165.2 million in revenue generated in Q1, despite BTC rising more than 40%, as mined BTC slumped post-halving and network difficulty rose.
Mined BTC did rise more than 21% sequentially in Q4 to 2,514, but this still represented a -41% YoY decline. Quarterly revenue is expected to rebound significantly in Q4. Analysts currently expect Marathon to report $175 million in revenue, up 11% YoY and 33% QoQ.
Management is expecting to see some tailwinds to the bottom line from BTC as well as cost improvements, noting in Q3 that “a $10,000 change in BTC price will result in over a $200 million impact in our earnings purely due to our large HODL position.” BTC’s average closing price in Q4 was ~$83,400, up more than $21,000 QoQ, potentially proving up to a $400 million impact to earnings; yet the scale of this is likely to be lower given that a majority of the BTC purchases were made later in the quarter.
Marathon’s cost of revenue per petahash per day improved 18% YoY in Q3, from $45.2 to $37.1. However, this was more than offset by depreciation and amortization costs, which were up substantially, leading to widening losses from expanding the mining fleet at +89% YoY in Q3 to $101.1 million; and up +146% YTD to $266.9 million.
Net loss was ($124.8 million) in Q3, following on a ($199 million) loss in Q2. Current plans to significantly expand owned capacity from ~4% of 619 MW capacity at the end of 2023 to ~65% of 1,500 MW capacity should help reduce cost of revenues due to a higher share of near-zero cost of energy in these operations – this can further aid improvements in cost per petahash, helping mitigate growth in mining costs. With that said, headwinds from D&A and increased network difficulty remain with Marathon expected to report only one quarter of profitability in 2025.
Riot: Revenue Projected to Surge in Q4
Riot’s quarterly BTC production has fluctuated, falling from a peak of 2,115 in Q1 2023 to a low of 844 in Q2. Production ticked higher in Q3 to 1,104 BTC, flat YoY. Contrary to Marathon, Riot’s revenue reached a new high in Q3 at $84.7 million, rising over 21% QoQ as BTC revenue rose nearly 21% QoQ and engineering revenue increased more than 31% QoQ.
Riding BTC’s tailwinds, revenue is estimated to surge in Q4, rising almost 57% QoQ and 69% YoY to $132.8 million. Riot has rather significantly increased its average operational hash rates this quarter, from 16.7 EH/s in Q3 to 27.4 EH/s by the end of December; Q4’s average operational hash rate is likely to be ~25 EH/s, or a nearly 50% QoQ increase.
Mined BTC rebounded 40% QoQ to 1,516 BTC in Q4, even as Riot fell short of its deployed hash rate targets for the quarter (and year). Riot had initially targeted 36.3 EH/s for 2024, but then decreased that deployed hash rate target to 34.9 EH/s. December’s release showed that Riot ended 2024 with just 31.5 EH/s deployed, 10% short of its targets, with the company saying it took a more measured approach to expanding its fleet to “ensure power quality.” Fleet efficiency is also short of targets, at 21.9 J/TH, short of its target for 21.4 J/TH.
As a result of this delayed hash rate expansion, Riot decreased its deployed hash rate targets through 2025. For Q1, Riot now sees deployed hash rate at 34.5 EH/s, one quarter behind schedule, before ramping to 46.3 EH/s by the end of the year, down from 46.7 EH/s. Riot is aiming to get largely back on track with its prior targets despite the Q4 shortfall by the second half of 2025.
Similar to Marathon, Riot’s net losses widened post-halving, falling from $212 million income in Q1 to ($154.4 million) in Q3. Aiding this two-quarter acceleration in net loss for Riot was increased depreciation (rising more than 62% QoQ to $60 million), increasing SBC (up from 26% of revenue in Q3 2023 to 36% in Q3 2024), less power curtailment credits, and shrinking BTC gross margin (down -50% YoY). Riot is unlikely to reach profitability in 2025 due to headwinds to BTC gross margin from increased network difficulty, less power credits, and a heightened cost profile in part due to heightened SBC.
Long-Term Expansion Sets Stage for Growth in 2025
Both Marathon and Riot are working to significantly expand capacity and mining fleets, as they both need to continually expand fleets as hash rate rises in order to maintain BTC production at current levels.
Marathon is expecting to bring its recently added 372 MW of owned and operating capacity in Ohio fully online and energized in 2025, while Riot’s expansion efforts are more weighted in 2026 and beyond; Riot is expecting to bring some additional capacity in Kentucky online in late 2025, though much of the expansion in Corsicana is expected to begin in Q4 2025 and the majority in 2026.
Marathon also outlined potentialities from “symbiotic relationships” with data center developers for AI and bitcoin mining, saying that it is working to become a key player in both BTC mining and AI/HPC. To that extent, Marathon welcomed two new board members with expertise in AI and data centers this year. Riot said in Q3 that there is “notable sense of urgency for power access in 2025 with AI HPC companies willing to pay a premium for timely access at attractive sites.” Riot’s management said they are in some preliminary discussions with AI HPC firms over some capacity, and will see if there are deals to monetize capacity at a better rate than mining.
Other miners have struck deals to offer capacity to AI HPC firms, most notably Core Scientific’s expanded relationship with Nvidia-backed GPU renter CoreWeave. Core Scientific will be providing 500 MW capacity to CoreWeave in an agreement worth $8.7 billion in cumulative revenue to Core Scientific over the next 12 years. Analysts note that Core Scientific is expected to generate $1 million in incremental cash flow per 1 MW contracted at a 75-80% margin, far higher than BTC mining, demonstrating that providing capacity to AI HPC can provide higher margin, cash flow positive deals.
While these opportunities have yet to bear fruit for Marathon and Riot as they have for other miners, the two are both expected to see significant revenue growth in 2025. Marathon is projected to see nearly 61% YoY revenue growth to $1 billion, whereas Riot is expected to see revenue surge nearly 113% YoY to $782 million. This trajectory ultimately will be determined by BTC’s price movement, as a prolonged correction could negatively impact revenues, while a surge far above $100,000 could aid revenue growth but impact mining rewards from higher network difficulty.
Q4 is expected to kick off growth for 2025, with both companies expected to see revenue accelerate to the triple digit range by Q3.
Marathon’s quarterly revenue growth is expected to accelerate from 12% in Q4 to 107% in Q3 2025. Riot’s revenue growth is expected to accelerate from 69% in Q4 to 151% in Q2 2025 before decelerating to 113% in Q3 2025. However, profitability is expected to be a rare sight in 2025 – consensus estimates point to net losses each quarter for Riot, and only one quarter (Q1) of profitability at a thin margin for Marathon.
Technical Analysis
By Knox Ridley
We have been talking about both RIOT and MARA on several recent webinars, so hopefully our entry into these two stocks is not a surprise to our members. We view these positions as leveraged Bitcoin plays, and not as buy and hold positions. When Bitcoin is in a bull market, they tend to do quite well; however, the risk to their unique business models is elevated when Bitcoin enters a bear market.
Regarding MARA, it is in line with our outlook on Bitcoin, which is that we should see one more large swing higher. If we zoom into the current pattern, we have a messy 5 wave pattern off the September 2024 low. This is being followed by a 3 wave retrace that has either ended or should have only one more slight low. If accurate, this is waves 1 and 2 in a larger 5 wave pattern that is targeting the $53 – $72 region.
The volume activity is also encouraging. Note how volume is expanding in the uptrend (wave 1) and decelerating in the downtrend (wave 2). Furthermore, the 1st daily volume bars that were above the 10-day average happened on further buying.
MARA has room for further weakness, but it has to hold $13.70 for the above setup to remain valid. If we can hold that level and then first breakout above the downtrend line, and then breakout above $30.40, we will have full confirmation that this scenario is in play.
RIOT is in a similar posture; however, it is further from invalidating its setup. For this reason, technically, it is a sounder setup. Like MARA, RIOT appears to be in a 2nd wave with a similar bullish volume pattern.
As long as any further weakness holds over $7, we will be looking for a breakout over $16 for full confirmation of the below scenario.
Conclusion:
Being crypto-related, these stocks have very little fundamental value to offer. These are high risk/high reward momentum stocks that the I/O Fund will attempt to ride up; but be aware, we will be closing them quickly on any weakness by following our stops, or when we hit predefined price targets with trade alerts sent to our Advanced Members.
Damien Robbins and Knox Ridley, I/O Fund Analysts, contributed to this analysis
Please note: The I/O Fund conducts research and draws conclusions for the Fund’s positions. We then share that information with our readers. This is not a guarantee of a stock’s performance. Please consult your personal financial advisor before buying any stock in the companies mentioned in this analysis.
The long-term count has Bitcoin in a final 5th wave push, which will complete the bull market that started at the late 2022 low. To be more exact, I believe that we are in wave 4 of this final 5th wave. The 4th wave is targeting the $87,000 – $78,000 region. This drop can go as low as $75,000 and still support the above count. If we hold $75,000, I expect one final swing into the $114,000 – $150,000 region. If this happens, this is where we plan to reduce the remainder of our Bitcoin position. If we instead break below the $75,000 region in the continuation of this volatility, we will look to reduce our exposure on the bounces.
Nvidia
Nvidia is in a long-term secular bull market. However, like all secular bull markets, there are periods of volatility that can see a stock drop 30% – 60%. Apple, for example, launched the iPhone in June of 2007, and then dropped +60% In 2008 – 2009. It also saw several 40% and 30% drawdowns while remaining the primary beneficiary of the mobile phone tech trend. These were buying opportunities. Nvidia will not go higher in a straight line, and for those that are patient, we believe a better price for a long-term buy-and-hold strategy will likely manifest.
Until then, the current pattern we are in appears to be an ending diagonal for wave 5 off the 2022 low. If accurate, we should get another drop into the $126 – $116 region, which would then lead to a move into the $170 – $205 region. Our plan is to add on the coming drop, and trim if we get the expected 5th wave swing that will complete this ending diagonal pattern.
Taiwan Semiconductor
TSM also appears to be in an ending diagonal. The final 5th wave is targeting the $235 – $250 region. What we must be on the lookout for is an extended diagonal pattern. So, instead of being in wave 5, we might be in the early stages of wave 3. This would line up better with what we are seeing in the AI sector this year. This will depend on how explosive the next swing higher is.
We are also closely analyzing the supply chain to identify overlooked beneficiaries of the AI infrastructure buildout, sharing this information as well as potential buy and sell plans and real time trade alerts with advanced signals members. Learn more here.here.
Please note: The I/O Fund conducts research and draws conclusions for the Fund’s positions. We then share that information with our readers. This is not a guarantee of a stock’s performance. Please consult your personal financial advisor before buying any stock in the companies mentioned in this analysis.
The world today was engineered to be ephemeral and noisy. This is a terrible combination for an investor.
On Twitter alone, there are 456,000 messages sent every minute. On Facebook, there are 510,000 comments posted every minute and 293,000 status updates. Outside of social media, there are 16 million text messages sent every minute and 156 million emails.
For an investor, the antidote to noise is quality stock analysis. Due diligence requires dozens of hours per equity, and it takes hundreds of hours every year to produce a free newsletter with quality analysis. I/O Fund strives to offer some of the team’s best analysis for free, and we believe the consistency and depth of what we provide for free is hard to replicate.
We offer this in the most challenging sector for investors, which is hands-down the tech sector. The tech sector is unusually challenging because it involves many different verticals – artificial intelligence, crypto, consumer, media, cloud, and more. It’s also the highest risk and highest reward sector in the market. Due to sudden price movements in both directions, the stakes are high. Perhaps we are biased, but quality analysis particularly in the tech sector can be hard to come by.
Below are highlights from our free newsletter during a strong year for AI and crypto. Although numerous investor favorites rose more than 100% during the year, many other popular tech stocks declined significantly. We offered our readers clues and insights for the leading stocks in AI semiconductors and software, providing unparalleled depth and quality to our free readers.
Nvidia to Surpass Apple’s Valuation
Right out the gate in 2024, the I/O Fund’s free newsletter expanded on Lead Tech Analyst Beth Kindig’s highly regarded 2021 prediction that Nvidia would surpass Apple’s valuation within 5 five years; which at the time, this prediction was inconceivable as it would require not only Nvidia to go up more than 300%, but also for the tech leader Apple to plateau.
Kindig explained why she would deliver on this prediction a whole 2 years early in the February 2024 analysis, Nvidia Stock Gained $1.5 Trillion To Surpass The FAANGs – Apple Is Next. In the analysis, she pointed out that it was not just the consistency and magnitude of Nvidia’s multi-billion dollar revenue beats, but the expansion of its margins and earnings as revenue grew >200% for multiple quarters as it approached a $90 billion annualized scale.
From Kindig’s August 2021 prediction to the February 2024 update, Nvidia posted some staggering growth numbers:
Data center revenue grew 676% to $18.4 billion. Data center revenue scaled from a $10 billion run rate to a $75 billion run rate in 2.5 years, a feat that took AWS 6 years to accomplish.
Nvidia’s total revenue increased 240% during the period driven by blazing data center growth, versus a 43% increase for Apple, with iPhone revenue rising just 4.5% from fiscal 2021 to fiscal 2023.
Nvidia’s quarterly EPS grew nearly 400% during the period, versus just 14% for Apple.
Nvidia’s operating margin increased from 47% to nearly 67%, while Apple’s expanded from 28% to 34%.
The I/O Fund provided a handful of reasons that would propel Nvidia to quickly become the world’s most valuable company. This included the long runway for AI accelerators – AMD’s executives forecast the market to reach $400 billion by 2027 – with Nvidia taking the lion’s share. Nvidia’s accelerated product roadmap to a one-year release cadence lets it continue to pry away Big Tech capex, while the software opportunity beckons, already reaching a $1B+ run rate. These tailwinds combined with a valuation that was “eerily low” at the time considering the rapid ascent shares had made through 2023.
Supply chain and demand signals point to 2025 being another strong year for Nvidia as Blackwell comes to market, with the I/O Fund tracking these data points to assess Nvidia’s growth potential in the year to come. The I/O Fund has published numerous free analyses on Nvidia’s Blackwell; some of this explaining back in May why there was still room in the stock price as Kindig called out institutional analyst estimates being too low (which later materialized). Kindig also boldly wrote that delays on Blackwell were overblown, and we have gotten yet another confirmation from Nvidia’s management team at CES that Blackwell is shipping on time. The I/O Fund’s ongoing consistency and accuracy on this stock dating back to 2018 for up to 4,000% returns has been unparalleled –premium members received nine real-time buy alerts below $20 in 2021 and 2022; learn more here.
Portfolio Manager Knox Ridley provided two crucial updates on the I/O Fund’s game plan for Bitcoin, with his first update from April 2024 increasing the Fund’s target zones. At the time, Bitcoin was an overlooked asset compared to the over-hyped Mag 7, yet the asset has delivered superior returns compared to all of the great large-cap tech stocks in this bull cycle, minus Nvidia, while having a low inverse correlation to tech.
Utilizing technical analysis and on-chain data In the analysis We Are Raising Our Bitcoin Targets To $106K – $190K, Ridley explained that the I/O Fund was now raising its target zones for Bitcoin to $106,000 to $190,000, up from the previous zone of $75,000 to $130,000. Bitcoin was trading in the mid-$60,000 range at the time, with Ridley saying that “the $42,750 support region holds on any ongoing volatility, then we have no reason to doubt the uptrend in place.”
Ridley provided another update to the Bitcoin thesis at the end of July 2024 in the analysis, Bitcoin Update: Next Stop $100,000; Bitcoin finally surpassed that historic level as 2024 came to a close. He explained that Bitcoin had “a full corrective pattern in place that ended around $54,000 in early July,” which “suggests we are in the early stages of the next rally.”
The I/O Fund had systematically been accumulating since the start of this cycle while raising our critical supports along the way — below is the history of Bitcoin buy alerts that the I/O Fund issued to our subscribers in real-time since early 2023.
Source: I/O Fund
Notably, our firm assisted our readers in capturing immense upside from the two top-performing large-cap tech positions in 2023 and 2024 with Nvidia and Bitcoin; the fact we also provided ongoing entries and risk management for these mega-winners should not be understated in terms of the value we have delivered. To refer our newsletter to your friends and family, please click here.
Meta to Outperform Snapchat
In the January 2024 analysis, Social Media Stocks: One Metric Shows Meta’s Clear Leadership, the I/O Fund pointed out what separated Meta as a clear social media leader and why Snapchat would struggle with monetization. Since then, Meta shares have risen nearly 65%, while Snapchat has declined -28%.
Meta was demonstrating improvements in ad pricing with strong ad impressions growth of >30% in Q2 and Q3 2023, while average revenue per user (ARPU) accelerated in those quarters; whereas Snapchat was struggling to effectively monetize its user base. Additionally, we explained that Meta was much more efficient with spending, maintaining R&D spending below 40% of gross profit while improving ARPU, significantly improving operating margin, and investing in AR/VR and AI technologies. Snapchat was “spending around 80% of its gross profit dollars on R&D,” a disproportionately high amount on R&D relative to peers while failing to increase ARPU and monetization within its user base.”
We pointed out that what makes Meta a clear leader is that “it can maintain a high level of R&D spend … while remaining a cash cow with strong operating cash flow and free cash flow growth,” with OCF margin nearing 60% in Q3 2023 and OCF tracking for 50% YoY growth to $75 billion in 2023.
In a follow-up analysis in March 2024, Top 3 Ad-Tech Stocks For 2024, we said that Meta’s “key metrics [were] supporting a return to >40% operating margin for the full year and a possible >33% net margin, driven by increasing ad pricing, strong engagement trends and impressions growth, aided by the release of numerous AI features.” Q3 2024’s results put this prediction very close to coming true, with 9M operating margin at 39.6% and net margin at 35.8%.
The I/O Fund is also closely analyzing the supply chain to identify overlooked beneficiaries of the AI infrastructure buildout, sharing this information as well as potential buy and sell plans and real time trade alerts with premium members. The I/O Fund recently entered two separate beneficiaries for gains of 23% and 17% since November. Learn more here.here.
Amazon’s Cloud Acceleration
In the February 2024 analysis AI Driving Acceleration For Big 3 Cloud Stocks, the I/O Fund discussed how AI was impacting cloud growth at Microsoft, Amazon and Alphabet. For Amazon, the I/O Fund explained that in Q4 2023, “AWS finally accelerated in Q4 for the first time in 2 years, with Amazon reporting 13.2% growth in Q4, up just over 1 point from Q3’s 12%.” However, the more important metric was AWS’ operating leverage improving in the second half of 2023, with operating income growth at 3x the rate of revenue in Q4.
At the time, AWS was generating the majority of Amazon’s company-wide operating income (67% of 2023) due to its higher operating margin (27% in Q4 2023), which we had said was “a trend that can strengthen with AI driving accelerated customer and revenue growth and decreased costs.” This has played out, with AWS reporting a 37.8% operating margin in Q3 2024.
What the I/O Fund had seen in February 2024 was a combination of increased customer migrations, larger and longer duration contracts, increased incremental revenue QoQ, and opportunities to better monetize the suite via AI. These factors were the necessary ingredients for AWS to show “a sustained AI-driven acceleration,” even though its quarterly growth rates lagged Azure and Google Cloud. AWS growth has now re-accelerated to 19%.
In a follow-up article in May, Amazon Stock: Nearing $2 Trillion Club From AWS Growth & Ads Catalyst, we provided evidence that AWS was a primary contributor to Amazon’s push to the $2 trillion milestone. We noted that AWS was contributing more than 60% of Amazon’s total operating income despite contributing less than 20% of total revenue, one reason that gross profit margin has quickly approached 20% and operating margin reached double-digits for the first time ever, at 10.7%. Growth from AI quickly reached a multi-billion dollar run rate, while improvements in operating leverage at AWS aided Amazon’s bottom line and stock price — shares have risen nearly 30% since the February 2024 analysis.
Honorable Mentions
The I/O Fund was also quick to call out a fundamental acceleration for one of 2024’s best performing AI stocks, alongside another AI-exposed ad-tech winner and an AI theme that quickly came to the forefront thanks to Nvidia.
1) Palantir’s Revenue Acceleration
In December 2023, the I/O Fund outlined four cloud stocks set to see revenue accelerate in 2024, with Palantir one of the four. We had said that Palantir was “exhibiting multiple signs of acceleration heading into 2024 with an improved fundamental backdrop driven by increasing AI demand. Palantir’s Artificial Intelligence Platform (AIP) is driving a significant acceleration in its US commercial business, while underlying metrics and the bottom line are rapidly improving: Palantir posted its first GAAP profitable quarter in February and has since reported four consecutive GAAP profitable quarters.”
We explained that “revenue growth is poised to accelerate in Q4 and through 2024, boosted by AI demand, a reacceleration in Palantir’s US government segment, and continued strength in the US commercial segment stemming from [AIP].”
Palantir’s shares ended 2024 as the S&P 500’s best performer with a 341% return.
We discussed how TSMC was “riding the enormous wave of demand from Big Tech,” with HPC revenue rising 3% QoQ to $8.68 billion in Q1 2024, “a fresh record despite the first quarter typically being seasonally weaker.” Additionally, we said reports of “Nvidia and AMD fully booking out TSMC’s advanced packaging capacity through the end of 2025” lent “to a strong AI-driven outlook.”
April’s sales numbers gave us confidence that TSMC was “on track to land in the upper half of or above the guided range” for Q2 revenue — it ultimately beat estimates by $500 million, the largest in more than two years.
3) AI Power Consumption
In June 2024, the I/O Fund published a thematic analysis on AI power consumption, and the rising power draw from next-generation GPUs. This analysis was underpinned by the “rise of generative AI and surging GPU shipments [which] is causing data centers to scale from tens of thousands to 100,000-plus accelerators, shifting the emphasis to power as a mission-critical problem to solve.”
We explained how Nvidia’s Hopper and AMD’s MI300X accelerators consume 50% to 75% more power than the prior generation, while Blackwell represented “up to a 300% increase in power consumption across one generation of GPUs with AI systems increasing power consumption at a higher rate.”
With power draw now quickly becoming mission-critical for data centers to address due to each generation of GPUs becoming increasingly more powerful than the last, we pointed out that this was driving a shift to liquid cooling.
For 2025, the I/O Fund has worked to identify key Nvidia suppliers with Blackwell on deck to ramp significantly, sharing our in-depth research on the AI networking stack. Sign up to join our upcoming webinar, held every Thursday at 4:30 pm EST, where we discuss buy zones for the stocks we cover plus a special, one-hour 2025 webinar held on January 14th. Learn more here.
Please note: The I/O Fund conducts research and draws conclusions for the company’s portfolio. We then share that information with our readers and offer real-time trade notifications. This is not a guarantee of a stock’s performance and it is not financial advice. Please consult your personal financial advisor before buying any stock in the companies mentioned in this analysis. Beth Kindig and the I/O Fund own shares in NVDA, TSM and BTC at the time of writing and may own stocks pictured in the charts
This article was originally published on Forbes on Jan 1, 2025,06:21pm ESTForbes Forbes on Jan 1, 2025,06:21pm EST
The Nasdaq 100 is capping off 2024 with a return of 27.0%, building upon 2023’s 53.8% return (its best year since 1999). Since the start of 2023, the Nasdaq 100 has nearly doubled with stellar returns of 95.3%, its second highest two year performance since 1998 and 1999’s 274.2% rise.
This year, the Nasdaq had countless winners and strong repeat performances from AI leaders like Nvidia, but 5 stocks took the market by surprise with significant outperformance relative to the broader indices. I think it’s important to pause and draw some parallels around the stocks that performed well in 2024 to form an opinion on what might perform well in 2025, as many of the year’s top performers shared similar fundamental improvements or had similar thematic tailwinds such as AI, nuclear and quantum computing.
Below, I review five of the top stocks of 2024, selected based on their price action, fundamentals and presence withing leading tech themes. Choosing a top 5 means many great stocks were left off this list, yet this sample helps to form conclusions around how 2024 shaped up versus years past, centered around leading, core thematic opportunities.
Read about our Top 5 Stocks from 2023 here and our Top 5 Stocks from 2022 here – many of which went on to lead the following years.here and our Top 5 Stocks from 2022 here – many of which went on to lead the following years.
AppLovin (APP)
AppLovin was one of the Nasdaq’s best performers, up 735%and joining the Nasdaq 100 on a special rebalance in November. From the start of 2024, AppLovin rose from a mere $13 billion valuation to $111 billion, peaking above $135 billion in early December – the stock has done the unthinkable this year, awakening a low-growth mobile gaming ads industry with an AI engine that is showing demonstrable results.
This meteoric rise stems from APP’s AXON 2.0 AI advertising engine, which has driven significant revenue acceleration and massive fundamental improvements to margins and cash flow. AppLovin has reported four consecutive quarters with revenue growth above 30% YoY, a major acceleration from late 2022 and late 2023 where three of four quarters saw declining revenues. Management expressed confidence in maintaining 20% to 30% YoY growth for the foreseeable future due to the efficiencies of AXON’s self-learning and catalysts from web-based e-commerce expansion.
AppLovin has reported four consecutive quarters with revenue growth above 30% YoY, a major acceleration from late 2022 and late 2023. Source: I/O Fund
Not only has revenue accelerated substantially, but AppLovin’s margins have more than doubled further down the income statement. GAAP gross margin expanded more than 8 points to 77.5% in Q3, while operating margin rose more than 13 points to 44.6%. Taking a look annually, AppLovin is on track to potentially double its operating margin to ~38% from 19.7% in FY23. Additionally, net margin nearly tripled to 36% in Q3 on a GAAP basis, up from 13% a year ago. EPS rose 317% YoY to $1.25, with YTD EPS reaching $2.81, up 462% YoY.
AppLovin is on track to potentially double its operating margin to ~38% from 19.7% in FY23. Source: I/O Fund
AppLovin’s near-flawless execution has also translated to strong cash flow generation, with operating cash flow margin doubling, rising from 23% a year ago to 46% in Q3. Free cash flow margin followed, reaching 45.5%, up from 22% a year ago.
This kind of operating leverage while maintaining revenue growth rates in the 30% range is quite rare indeed, separating AppLovin from a majority of its ad-tech and software peers. Analysts are excited to see what the company’s expansion to e-commerce can contribute to growth and a path to $6+ in EPS next year from AppLovin’s very strong margin profile.
Sign up for I/O Fund's free newsletter with gains of up to 2600% because of Nvidia's epic run – Click hereClick hereClick here
Palantir (PLTR)
Palantir joins this Top 5 list for a second-year running, with shares rising 356%. My firm’s free stock newsletter previously pointed out that Palantir was “one of the rare few that sees AI drive both real returns for its business and real value for its customers,” as it continues to crush its software competitors in AI-related growth. Palantir’s Artificial Intelligence Platform (AIP) has driven a significant revenue re-acceleration following its launch, with profitability also expanding – a rare combination for growth software stocks.
Palantir has capitalized on the AI software opportunity at hand via AIP’s unique value proposition, its scalability and versatility. November and December’s partnership announcements alone help demonstrate the versatility of Palantir’s platform, spanning numerous different industries from autonomous drone navigation to AI models for defense tech to more government program wins. Palantir benefits from the best of both worlds in both government contracts and AI exposure, as enterprise adoption of AI builds.
Palantir’s 2024 was characterized by strong underlying AI momentum, with Q3 seeing revenue growth reach 30%, more than 10 points faster than when it entered the year and nearly 5 points above guidance for 25.2% growth. AIP has aided this revenue acceleration story by driving significant growth in Palantir’s US commercial segment, with the past two quarters seeing growth there above 50% YoY.
Palantir’s 2024 was characterized by strong underlying AI momentum, with Q3 seeing revenue growth reach 30%, more than 10 points faster than when it entered the year. Source: I/O Fund
Similar to AppLovin, these AI growth tailwinds are not just driving revenue, but also aiding operating margin expansion and EPS growth. GAAP operating margin was 16% for the second quarter in a row, up 9 points from last year, while adjusted operating margin is approaching 40% and has been >30% for four quarters in a row. Cash flow margins have been strong — operating cash flow was nearly $420 million, or a 58% margin, while adjusted free cash flow was $435 million, a 60% margin in Q3, up from the low-20% range in the first half of 2024. Palantir is targeting adjusted FCF of $1 billion-plus this year, or ~36% of revenue.
Fundamentally, to have revenue growth around 30%, free cash flow margin of 30%, and adjusted operating margin nearing 40% is impressive, to say the least. Palantir’s returns this year reflect that fundamental strength from AI-driven growth as well as optimism about its AI growth prospects for next year.
IonQ (IONQ)
Quantum computing stocks have been on a tear to end the year, with a handful of names seeing returns of more than 2,000% over the past three months. IonQ has risen 244% on surging enthusiasm for the quantum computing sector and revenue reaccelerating 40 percentage points over the past three quarters.
IonQ reported $12.4 million in revenue in Q3, with revenue growth of 102% YoY, following on 106% YoY growth in Q2. This has accelerated 42 points from 60% YoY growth in Q4, as IonQ is starting to quickly scale revenues as it has been consistently delivering on its technical roadmap ahead of schedule. IonQ also slightly raised its full year revenue guidance to $40.5 million at midpoint, for growth of 84% YoY.
As it is still in its scaling phase, IonQ is by no means profitable or close to profitability, with analysts not expecting the quantum computing firm to break into profitability until well after 2027. However, revenue is currently expected to grow at a ~95% CAGR through 2027, from $22 million last year to an estimated $315 million.
IonQ's revenue is currently expected to grow at a ~95% CAGR through 2027, from $22 million last year to an estimated $315 million. Source: I/O Fund
This positioning in a leading theme among investors in the second half of 2024, as well as consistent execution ahead of schedule with revenue growth forecast to rise at a nearly triple digit CAGR through 2027 has landed IonQ a spot on this list.
Reddit (RDDT)
Despite not even trading for the entire year with its IPO in March, Reddit has returned a remarkable 224% from its first day close of $50.44. The social media and online community platform reported a blowout beat and raise in Q3, with investors eyeing some AI training data opportunities ($60M/year deal with Google) on top of strong advertising growth.
Q3 revenue rose 68% YoY to $348 million, a 14 point acceleration from 54% YoY growth in Q2 and up 20 points from 48% YoY growth in Q1. Advertising revenue growth accelerated 15 points sequentially, rising 56% YoY to $315 million. Q4’s guide for $385 million to $400 million in revenue came in well above the $361 million consensus estimate, pointing to growth of 57% YoY. The market is expecting another blowout in Q4, with analysts already projecting $403 million in revenue, above the high end of management’s guided range.
Reddit's Q3 revenue rose 68% YoY to $348 million, a 14 point acceleration from 54% YoY growth in Q2 and up 20 points from 48% YoY growth in Q1. Source: I/O Fund
Reddit is demonstrating significant operating leverage, as it surprised the Street by reporting GAAP net income in the high single-digit percents in the quarter. GAAP operating expenses rose 53% YoY, less than that 68% YoY revenue growth, pushing GAAP operating margin to 8.6%, up from (3.4%) a year ago and (3.7%) in Q2.
Cash flow generation has improved, with Reddit generating $71.6 million in operating cash flow and $70.3 million in free cash flow in Q3, or margins of ~20%. This doubled from ~10% cash flow margins in Q2. Adjusted EBITDA has increased more than 9x from the start of the year, at $94.4 million in Q3, a 27% margin, up from just $10.0 million in Q1.
Reddit excites the market due to its fundamentals — a 90% gross margin business quickly shifting to GAAP profitability on rapid quarterly revenue growth. This combination hints at potentially strong EPS growth, should it scale from the single-digit net margin range of 8.6% in Q3, to the double-digit range in short time.
Every Thursday at 4:30 pm Eastern, the I/O Fund team holds a webinar for premium members to discuss how to navigate the broad market, as well as various stock entries and exits. We offer trade alerts plus an automated hedging signal. The I/O Fund team is one of the only audited portfolios available to individual investors. Learn more here.Learn more hereLearn more here.
Astera Labs (ALAB)
Though Nvidia arguably deserves a spot on this Top 5 list with a 114% gain following Hopper’s breakout 2023, with data center revenue continuing to beat estimates by $1 billion each quarter, I think it’s time to highlight an Nvidia supplier and ASICs beneficiary – Astera Labs. Astera returned 179% in Q4 for a total YTD gain of 128%, with the company showing multiple growth opportunities and a push for profitability despite still solidly being in its hypergrowth phase.
Astera is a major supplier to Nvidia’s PCIe-enabled GPUs with PCIe5 retimers and components, and its upcoming Scorpio fabric switches built on its lead in PCIe5. Management expects the new product to “exceed 10% of revenues in 2025” with “good momentum going into 2026” as it unlocks a $12 billion TAM by 2028.
Astera reported record revenue of $113.1 million in Q3, up 47% QoQ and 206% YoY, beating estimates by 16.1%. Management guided for $126 million to $130 million in revenue in Q4, well ahead of the $108 million consensus estimate and representing YoY growth of 153%, its fifth consecutive triple-digit growth rate.
Astera Labs reported 206% YoY revenue growth in Q3 and guided for 153% YoY growth in Q4, its fifth consecutive quarter of triple-digit growth. Source: I/O Fund
Even with revenue growth expected to be triple-digits for at least the next two quarters, management forecast for GAAP net income in Q4, though at a razor thin margin. GAAP operating margin is moving towards positive territory, from (7.9%) in Q3 to (4.3%) at midpoint of Q4’s guide. Adjusted operating margin expanded significantly to above 32% in Q3, up from 2% a year ago, while adjusted net margin improved 35.6% compared to (-1.1%) last year.
Astera was one of a handful of AI-exposed semiconductors to see dazzling returns this year, as AI semiconductors remained investor favorites throughout the year. Astera also shared key similarities to the rest of this list: adjusted margins showing strong expansion, high cash flow margins (56% operating cash flow margin in Q3), and AI-related rapid revenue growth.
For a more detailed look at Astera’s product lines, Blackwell and ASICs opportunities and its AI-driven TAM growth, read more here.here.
Conclusion
If there’s one major takeaway from this selection of 2024’s top tech stocks, it’s that being at the top comes with quite the price tag and premium. All five of these stocks trade at quite high multiples, headlined by IonQ at 230x forward revenue and Palantir at a 2021-esque 63x forward revenue and 32x 2027 revenue. Astera Labs trades at 53x forward revenue, while AppLovin and Reddit are not quite as high, at 24x and 22x respectively. However, these revenue multiples are all 130% to 500% higher than they were six months ago, highlighting just how quickly these five have gotten more expensive as they’ve rallied.
All five of these stocks trade at quite high multiples, headlined by IonQ at 230x forward revenue and Palantir at a 2021-esque 63x forward revenue and 32x 2027 revenue. Source: YChartsYCharts
Looking back at 2024 can be important as it often provides clues for tech investors as the new year begins. Winners have kept winning, from Nvidia to the five discussed here, and that is one reason I like to reflect on the clear winners from the previous year. These five stocks above highlighted similarities among winning tech stocks in 2024 – presence and prevalence in leading themes such as AI and quantum computing, strong revenue acceleration (and rapid growth), and operating leverage driving margin expansion.
For 2025, the I/O Fund has worked to identify key Nvidia suppliers with Blackwell on deck to ramp significantly, sharing this research and buy zones with premium members. Stay tuned for our upcoming 2025 and Q1 webinars to hear more about what the I/O Fund expects for the new year. Learn more here.
I/O Fund Equity Analyst Damien Robbins contributed to this report.
Please note: The I/O Fund conducts research and draws conclusions for the Fund’s positions. We then share that information with our readers. This is not a guarantee of a stock’s performance. Please consult your personal financial advisor before buying any stock in the companies mentioned in this analysis.