AMD Q4 Earnings Preview: The Bottom May Be Near

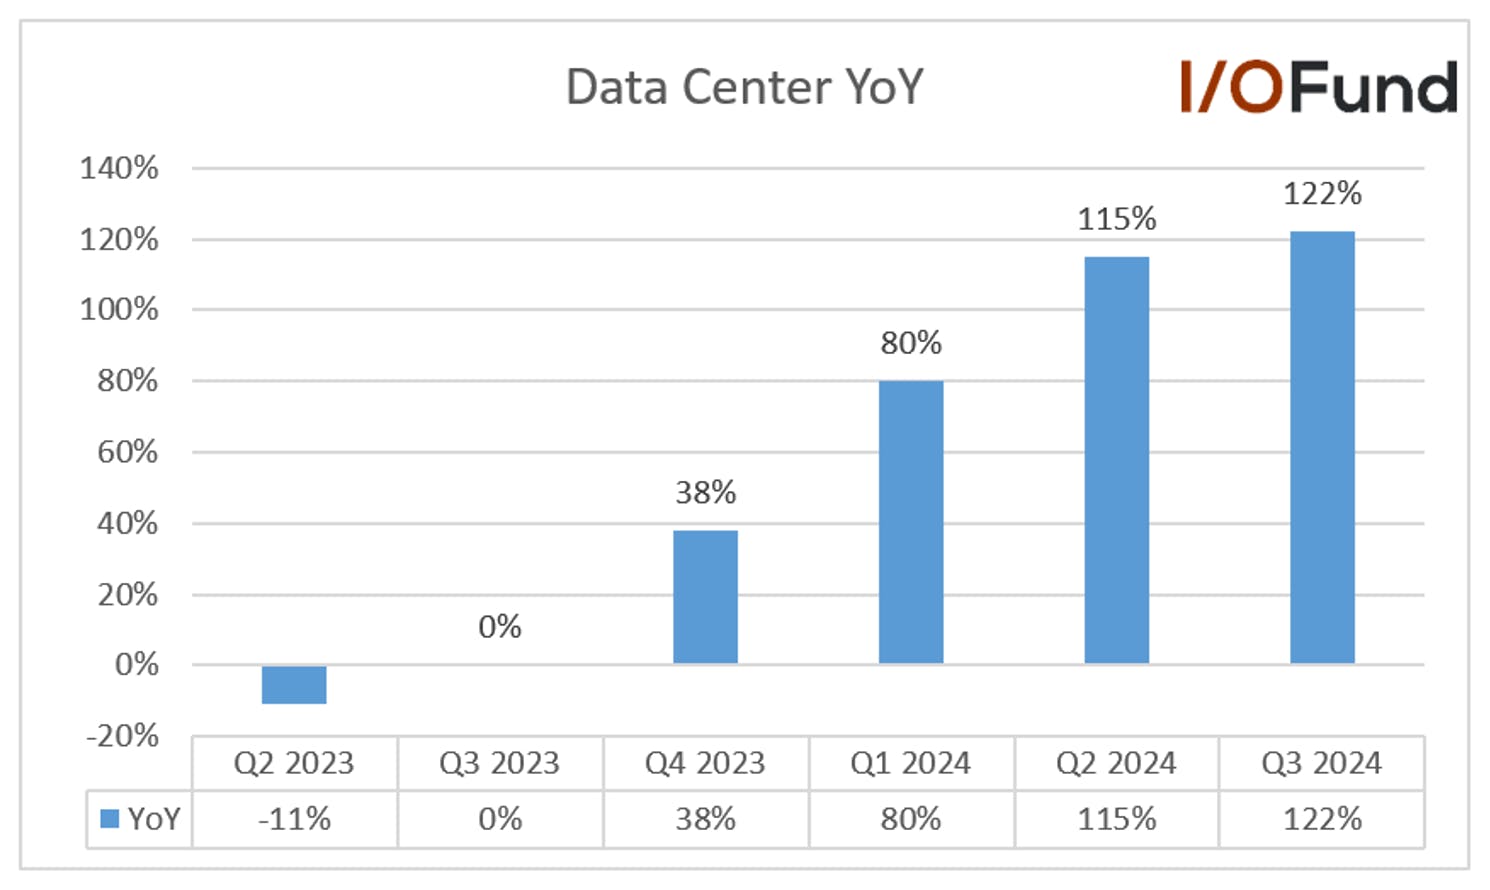
AMD reports after the bell tomorrow. Analysts expect revenue to grow 22% YoY to $7.53 billion and adjusted EPS to grow 41.1% YoY to $1.09. The company’s data center and client segments have performed well in Q3, with the Data Center segment growing 122% and the Client segment growing by YoY. The gaming segment and embedded segments have been headwinds, yet in the recent Barclays Conference, management said that “they (headwinds) are behind us when we look ahead of 2025.”

Management’s AI revenue guide for 2024 is to exceed $5 billion, a $500 million increase announced during Q3 results. Investors will be looking for the 2025 AI revenue guide and commentary in the earnings call. The current consensus estimates for 2025 is about $9.5 billion in AI revenue.

AMD stock underperformed YTD till the news of DeepSeek came in, as analysts had reduced estimates due to the expected lukewarm response for the new MI325 chips. However, AMD fared better during the last Monday’s sell-off than other semiconductors. We’ve discussed key price levels in the Advanced webinars as of late, and right now, AMD is holding the support laid out months ago.

AMD is at the forefront of integrating the DeepSeek-V3 model on Instinct MI300X GPUs and is optimized for AI inferencing, which is positive for the stock. It also supports our thesis that Nvidia owns training, while AMD will compete on inference by lowering costs for inference, specifically. Although DeepSeek is not a death knell for Nvidia, it foreshadows that eventually cost will be at the forefront of AI development and Nvidia’s pricing power will not sustain forever.

AMD’s management has been especially clear that the MI350 chips based on new CDNA-4 architecture is the release they are most excited about with a 35X increase in performance compared to CDNA-3. Again, AMD’s thesis is not about training models, it’s about running them at the edge where cost combined with speed will take the reins as opposed to Nvidia’s big compute muscles in the data center. Nvidia will compete on inference too, but it’ll be this market that matters most for AMD’s AI story.

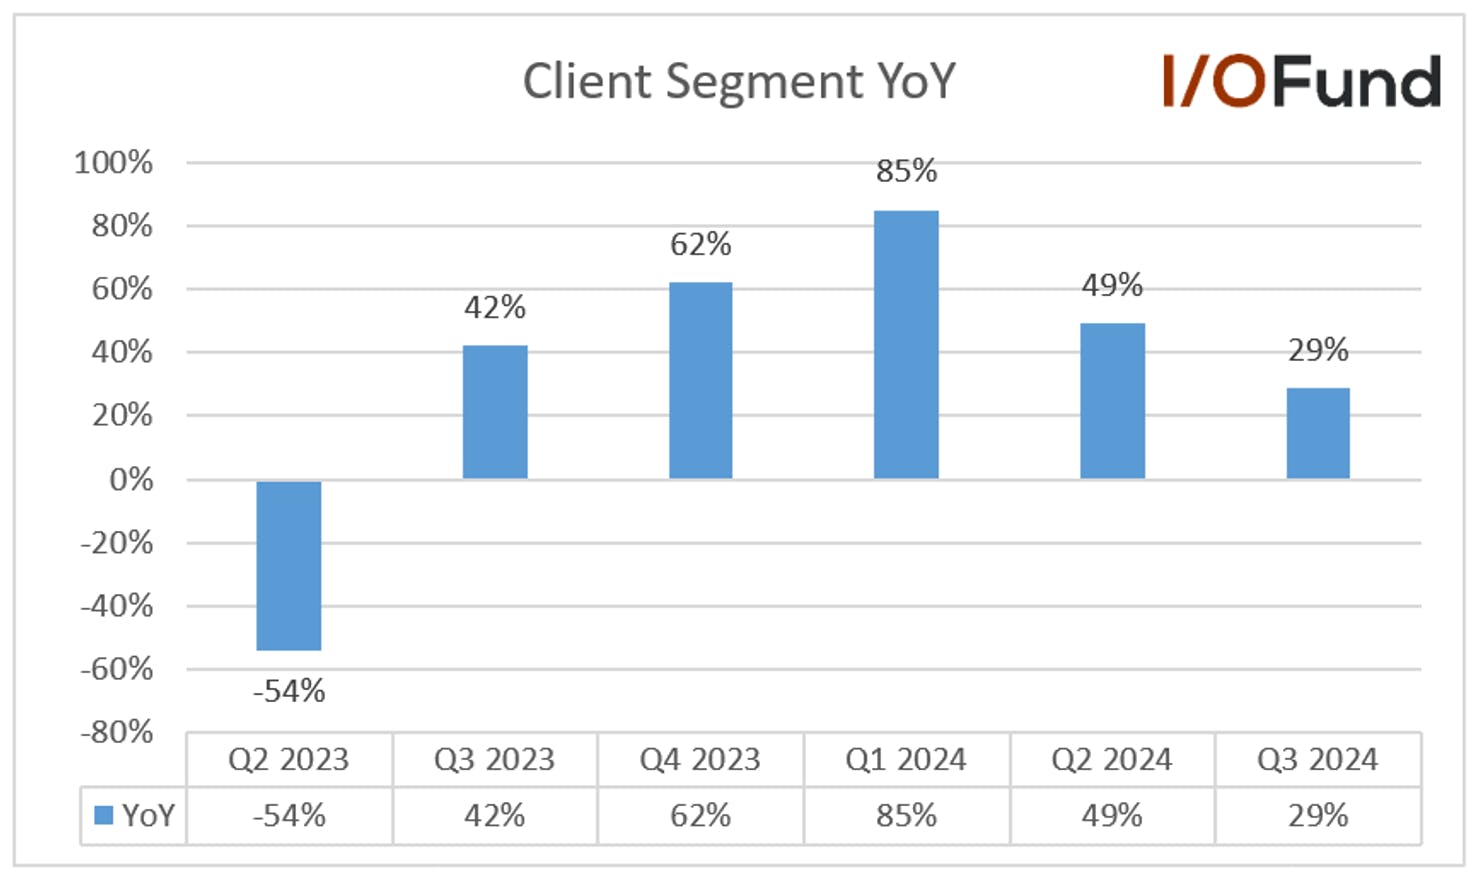
The PC market is mired in concerns over tariffs, as the idea is PCs that source parts in China will need to pass the cost of tariffs onto consumers. AMD’s stock price has clearly been affected by these concerns. With that said, AMD is currently the leading AI PC company. Consider that last quarter, the Zen 5 Ryzen processors drove Client revenue up 29% YoY and up 26% QoQ to $1.88 billion while competitor Intel was flat. However, Nvidia’s Project Digits and RTX 5090 GPU laptops are set to defy all odds with an order of magnitude higher TOPS. Therefore, it comes down to costs and how much performance is needed (as will be the ongoing theme between these two competitors).

Similar to last quarter (and last half of the year), industry analysts are showing a decline in the mid to high single digits QoQ for PC data, yet MoM for December was stronger than expected due to seasonality in both the United States and Chinese New Year.

Our conclusion to the post-earnings last quarter called out tariffs as a primary reason for the weak price action. It’s not clear if the tariff story is already priced into AMD’s stock price, but it could already be priced in, so keep an eye out for that outcome. Notably, the question of when a stock bottoms is not an easy one to answer. However, we’ve been tracking this company quite closely and it’s our hope the stock has already bottomed or will bottom very soon. The price has acted accordingly by holding support in the $110 to $114 range. Therefore, how low is too low for AMD’s stock price, given 22% of its revenue is already from AI? This is a separate question than when will AMD effectively compete with Nvidia, on a path to 10% or more of the GPU market? The answer is that often price will bottom first.

Revenue

Management provided a soft Q4 revenue guide of $7.5 billion, representing a YoY growth of 21.6% at the midpoint due to headwinds in gaming and embedded segments. However, management had hinted during the recent Barclays Conference that these headwinds are now behind when we look into 2025.
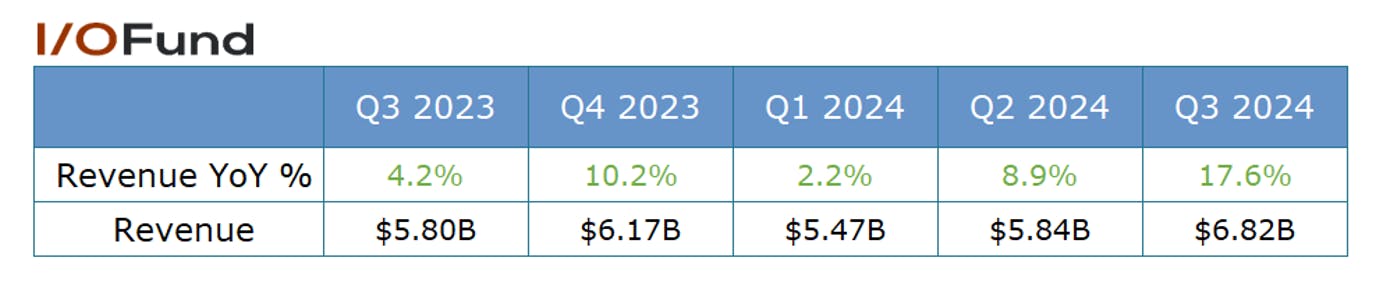
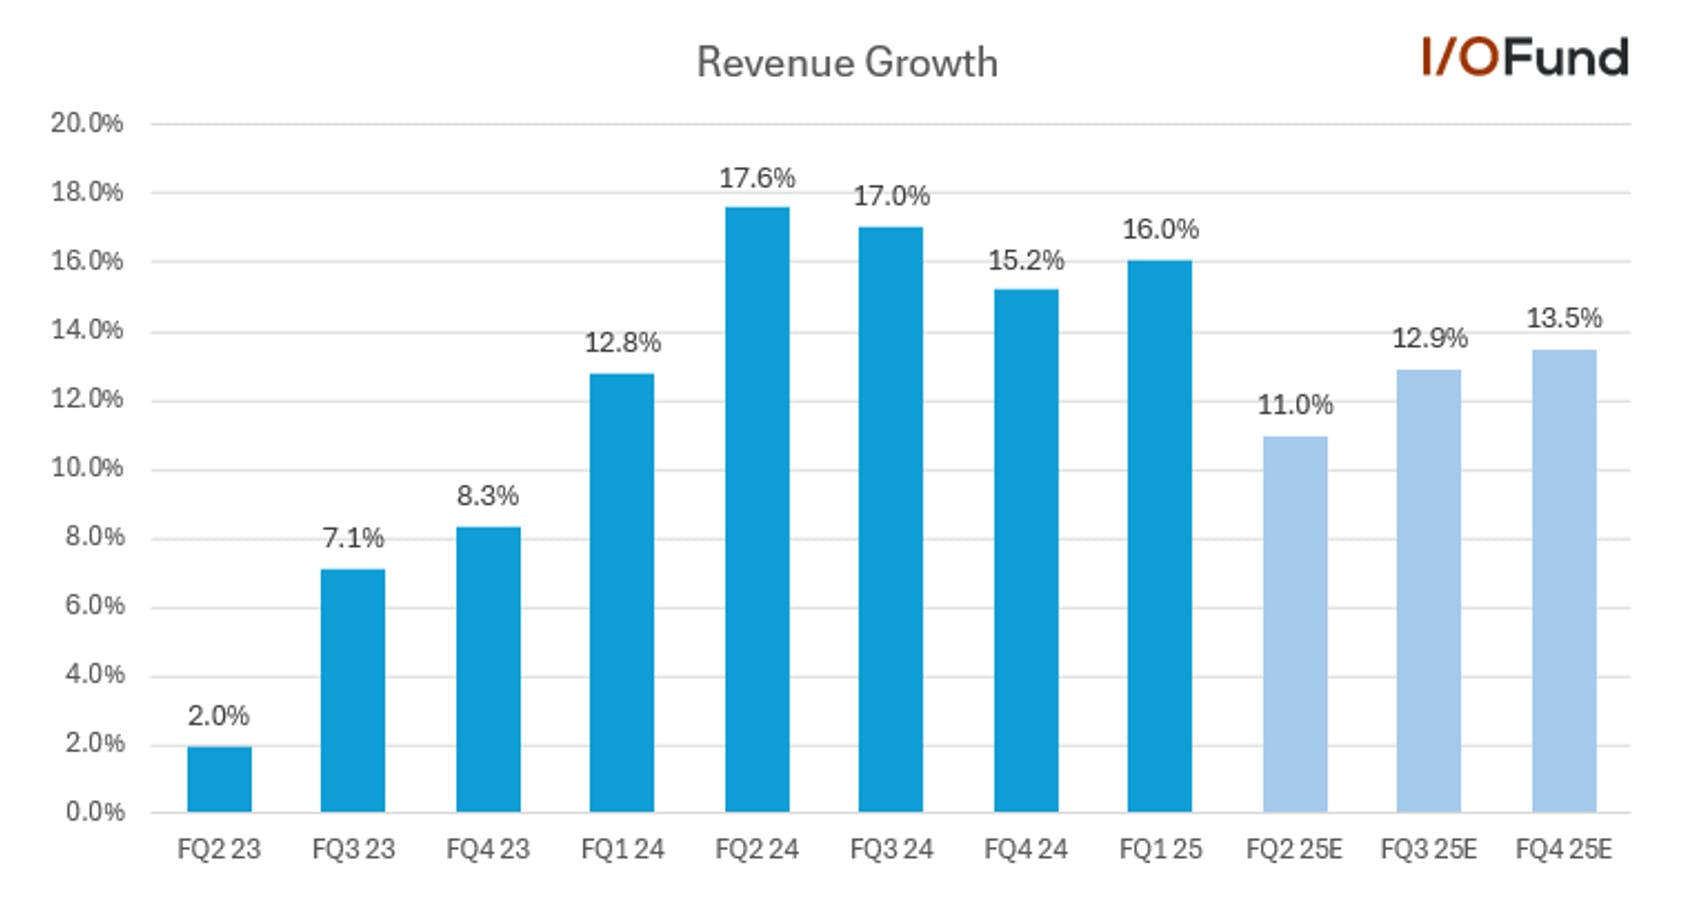
  • Q3 revenue grew by 17.6% YoY to $6.82 billion. Data center drove Q3’s growth, while Client revenue rebounded significantly, offsetting continued weakness in gaming and embedded.
  • Analysts expect Q4 revenue to grow 22% YoY to $7.53 billion and accelerate to 28.2% and 28.6% in the subsequent two quarters. Analyst estimates have come down after the company’s soft guidance and also due to the expected lukewarm response for the MI325 chips.
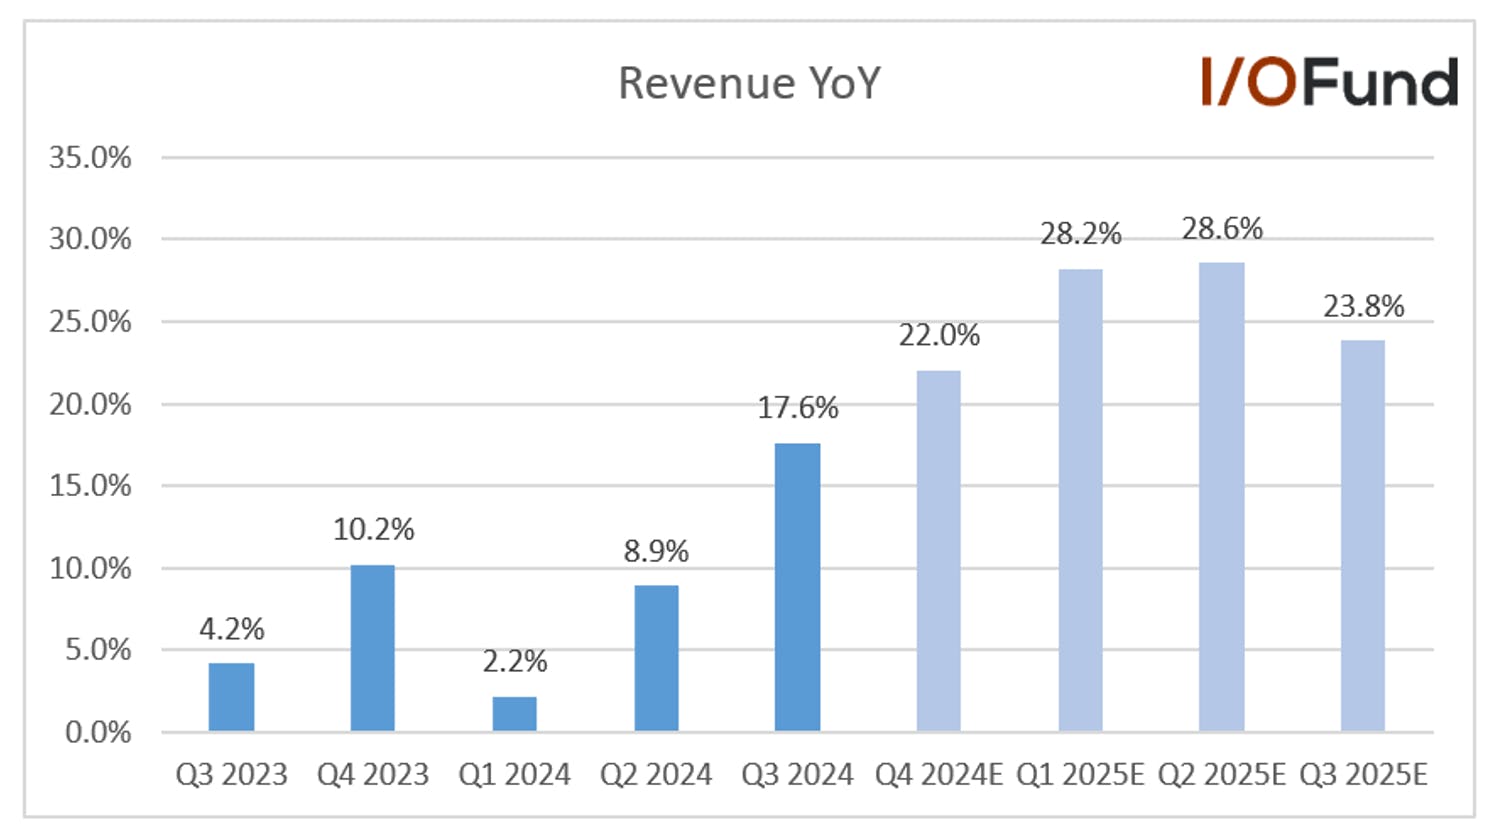
  • Looking further out, revenue growth will accelerate from the expected 13.1% growth in 2024 to 25.6% growth to $32.2 billion in 2025 and 23.4% growth in 2026.

Segments

The company’s Data Center and Client segments showed strong growth in Q3. While Gaming and Embedded segments presented headwinds, management indicated at the recent Barclays Conference that these challenges are expected to be resolved as the company looks toward 2025.

Data Center

Q3 Data Center revenue grew by 122% YoY and 25% QoQ to $3.55 billion, driven by strong demand for AMD Instinct GPUs and EPYC server CPUs. Zen 5 Turin was launched in October 2024 and will help support data center sales in 2025. The MI325X chips were launched in October with increased memory capacity and bandwidth, with AMD stating it offers 20% higher inferencing than the H200.

Regarding the MI300 AI accelerators, Meta and Microsoft are large customers due to TCO advantages (total cost of ownership). Management also offered statements about RocM’s progress, stating that foundational support is growing and performance gains are improving by 2.4X.

The company’s launch of MI350 chips in the second half of 2025 should be a significant catalyst as the management believes that the chips have the largest generational increase in AI performance, they have ever produced. Management expects sequential growth in Data Center revenue in Q4 driven by the expected strong demand for Instinct, EPYC, and Ryzen processors.

Data Center operating margin improved to 29% compared to 19% in the same period last year.
Client Segment

Client segment revenue grew by 29% YoY and 26% QoQ to $1.88 billion in Q3, driven by strong demand for the Zen 5 Ryzen processors. Management expects client segment revenue to grow sequentially in Q4.

The PC market has been sluggish. AMD could fare better in the coming quarters due to its strong line of AI PCs. AMD said its chips will be used by Dell for the first time in PCs sold to businesses. AMD also unveiled its new Ryzen AI Max chips, offering up to 90% faster performance vs predecessors, delivering the highest level of performance available in premium thin and light notebooks. Further, it announced a new 9000 series of desktop computer processors that should also help to propel the revenue in 2025.

The client segment operating margin improved to 15% in Q3 from 10% in the same period last year.
The PC market has been sluggish. AMD could fare better in the coming quarters due to its strong line of AI PCs. Citi analyst said that the December notebook shipments increased 8% MoM due to a pull in demand ahead of Chinese New Year and potential tariffs. Notebook shipments were down (-7%) QoQ and were better than the company’s estimates of (-8%) decline, though below the normal season gain of 2%. Citi expects notebook shipments to decrease (-10%) sequentially in Q1, above the normal (-14%) decline.

Gaming

Gaming revenue declined by (-69%) YoY and (-29%) QoQ to $462 million in Q3 as semi-custom sales declined due to reduced inventory by Microsoft and Sony. Management expects modest sequential growth in Q4.

Operating margin declined to 2% compared to 14% in the same period last year.

Embedded

Embedded revenue declined by (-25%) YoY and up 8% QoQ to $927 million. Management expects modest sequential growth in Q4. Operating margin declined to 40% compared to 49% in the same period last year.

AI Revenue

Management provided an AI revenue guide for 2024 that is to exceed $5 billion, a $500 million increase announced during Q3 results. Investors will be looking for the 2025 AI revenue guide and commentary in the earnings call. The current consensus estimate for 2025 is about $9.5 billion. Analysts have reduced estimates due to the expected lukewarm response for the new MI325 chips.

Wolfe Research estimates data center GPU revenue in the range of $1.5 billion to $2.0 billion for 4Q and $7 billion for CY2025, lower than the prior estimate of $10.8 billion. For Q1 2025 they estimate $1.75 billion and flat quarterly growth for the rest of the year. KeyBanc analyst also trims estimates and expects $10 billion revenue in 2025. Loop Capital has reduced estimates from $10 billion to $8 billion. HSBC has reduced to $8.1 billion from $12.3 billion. Management AI commentary is very crucial to soothe the markets, given that MI350 chips are expected to be released in the second half of 2025.

In December, AMD invested in Vultr, an enterprise Cloud infrastructure company and a competitor of DigitalOcean. Vultr uses AMD’s graphic processing units in its data centers.

Margins

As stated in the pre-earnings writeup, margins are an area where AMD and Nvidia offer quite a contrast. AMD’s data center margin is 29% with a company operating margin of 11% compared to Nvidia’s 60%.  The guide is for flat margins next quarter. The CFO was encouraging in terms of what to expect for 2025: “When we scale the company next year, you can see we're going to benefit from economies of scale to continue to drive our operational efficiency to improve gross margin.”
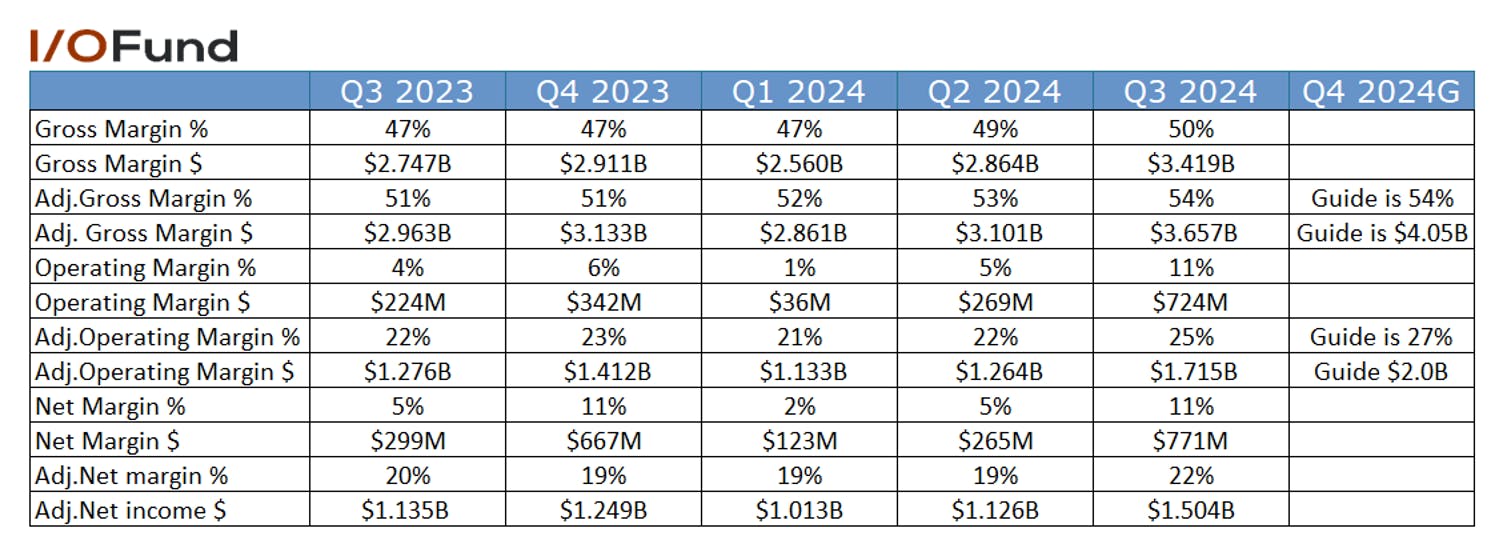
The company’s margins are improving with a higher mix of data center revenue and operational efficiencies. The company also announced in November that they are planning to reduce about 4% of its workforce to focus on better growth opportunities.

Margins are expected to improve in 2025. The growth in data center revenue is the largest driver for margin improvement, including both CPU and GPU business and the expansion of the enterprise server business also has a tailwind on the gross margins. The gradual improvement of the Embedded business will also improve margins. On the other hand, the client business expansion will be a headwind due to the higher concentration of consumer business, which has margins below the corporate average.

  • Q3 gross margin was 50% compared to 47% in the same period last year, driven by strong growth in Data Center revenue.
  • Adjusted gross margin was 54% compared to 51% in the same period last year. Management guide for Q4 is 54% compared to 51% in the same period last year.
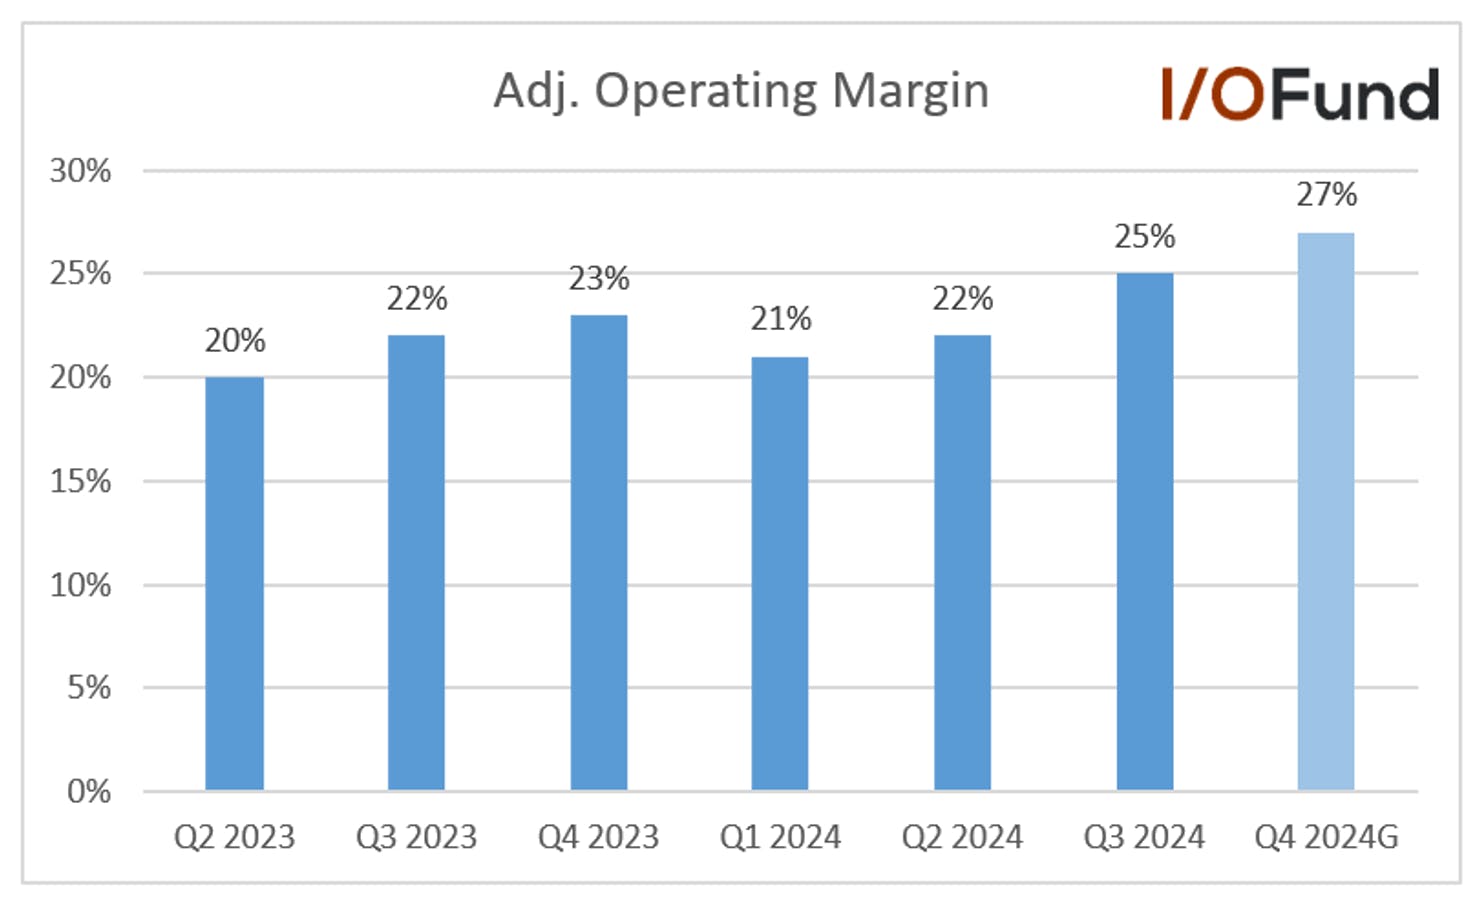
  • The adjusted operating margin also improved to 25% compared to 22% in the same period last year, driven by operating leverage. Management guide for Q4 is 27% compared to 23% in the same period last year.
  • Q3 net income was $771 million or 11% of revenue compared to $299 million or 5% of revenue in the same period last year. Adjusted net income was $1.50 billion or 22% of revenue compared to $1.14 billion or 20% of revenue in the same period last year.
EPS

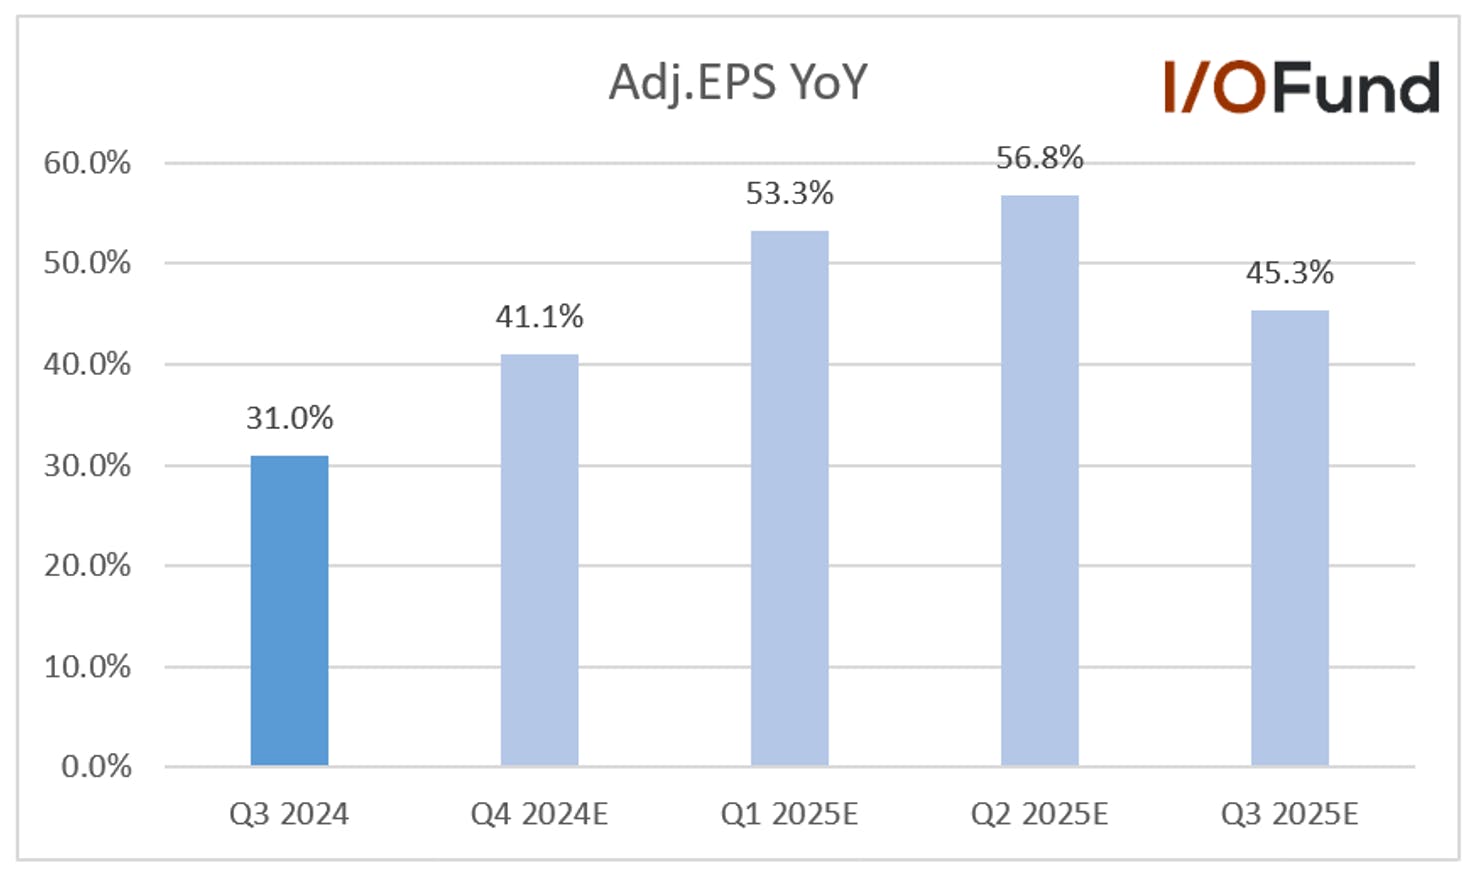
The company’s Q3 adjusted EPS grew by 31% YoY and 33% QoQ to $0.92, which was helped by higher data center revenue. Analysts expect strong growth in the coming quarters. However, estimates have been coming down as analysts are cautious due to the expected lukewarm response for MI325 chips.

  • Analysts expect adjusted EPS to grow 41.1% YoY to $1.09 in Q4 and accelerate to 53.3% growth to $0.95 for Q1.
  • Looking further out, analysts expect adjusted EPS to grow 49.8% YoY to $4.98 in 2025, accelerating from the expected 25.4% growth in 2024. For 2026, analysts expect adjusted EPS to grow 39.1% YoY to $6.92.
Cash Flows and Balance Sheet

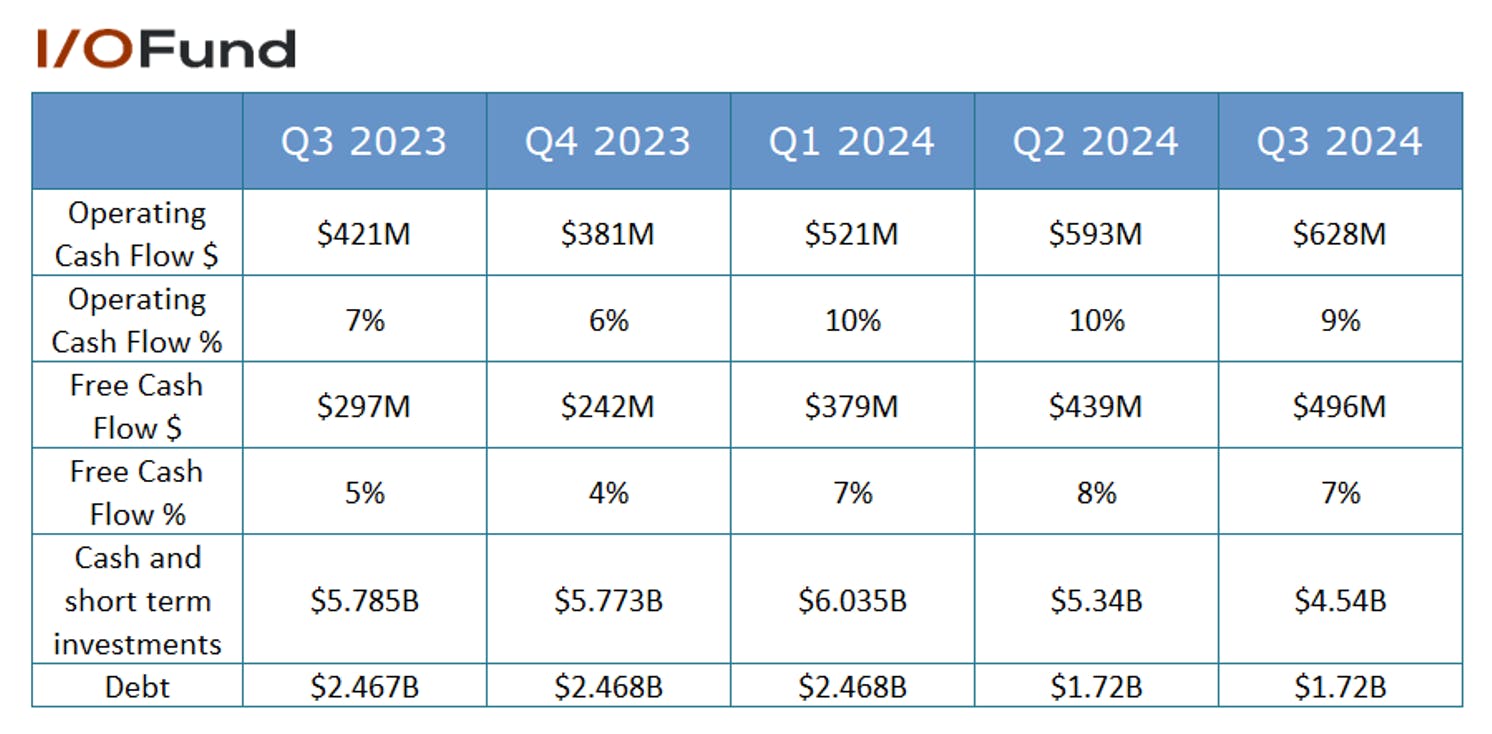
Cash flows are improving and have room for further improvement due to the expected better bottom line in 2025.

  • Q3 operating cash flow was $628 million or 9% of revenue compared to 7% of revenue in the same period last year.
  • Q3 free cash flow was $496 million or 7% of revenue and 9% excluding certain nonrecurring payments compared to 5% in the same period last year.
  • The company had cash and short-term investments of $4.54 billion and debt of $1.72 billion compared to $5.34 billion and $1.72 billion in the same period last year. The company paid $548 million for the previously announced acquisition of Silo AI and repurchased shares worth $250 million in Q3.
Valuation

The company is trading at a P/E ratio of 105 and a forward P/E ratio of 23.5.

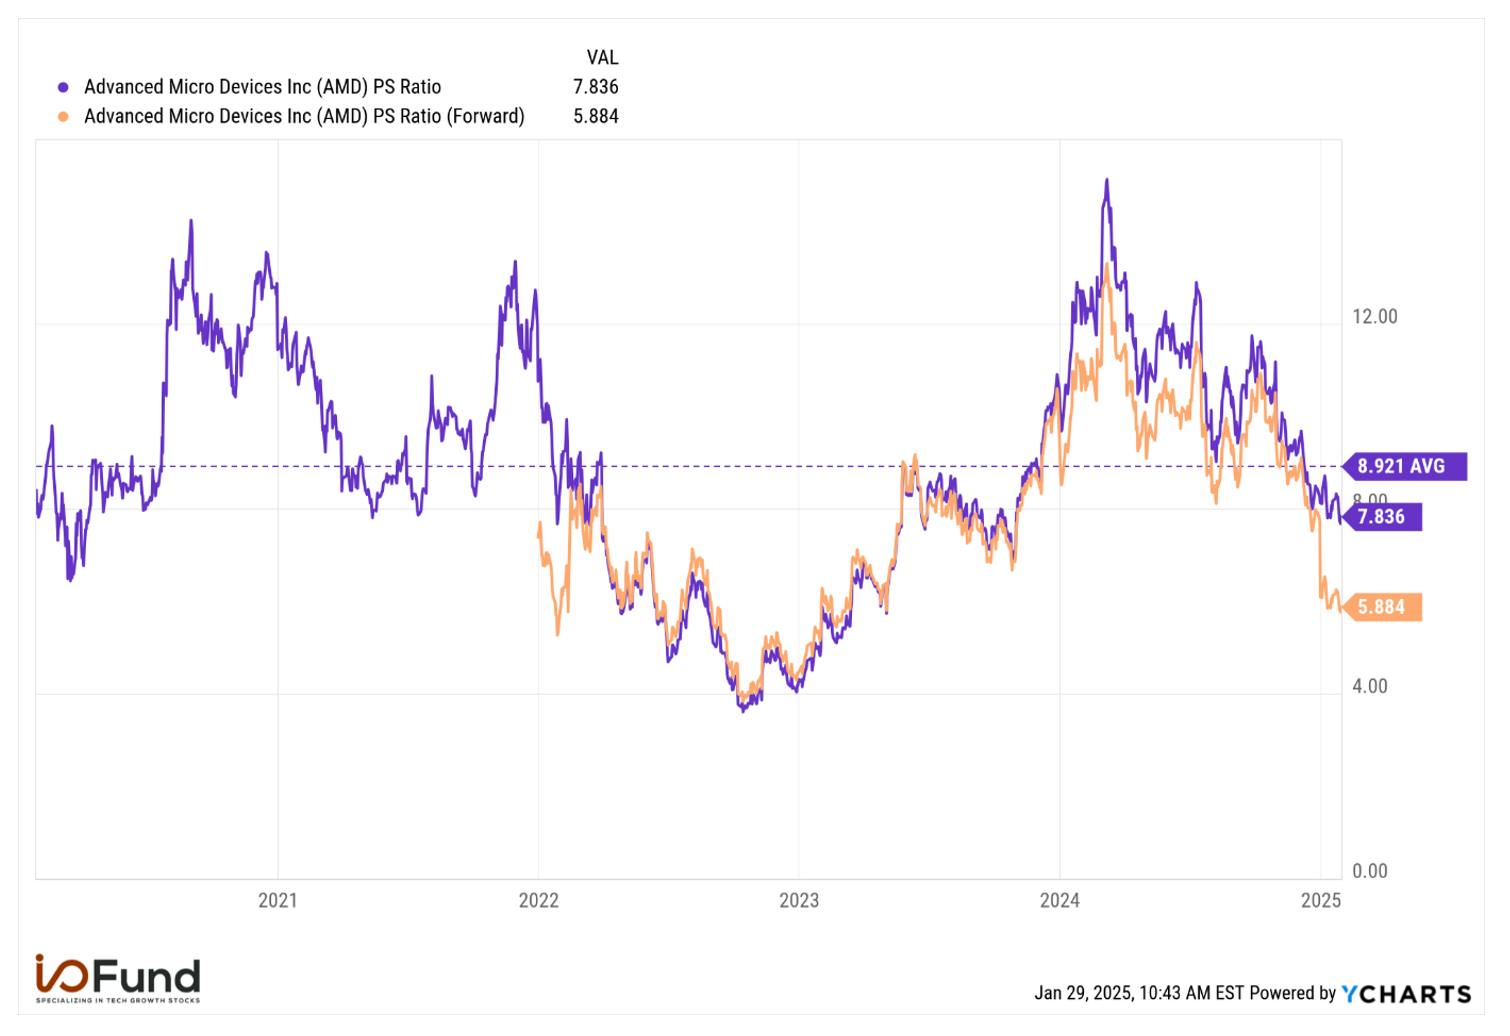
P/S ratio is 7.8 and a forward P/S ratio of 5.9 compared to the five-year average of 8.9.
Conclusion

If I were to use my crystal ball, I think AMD’s stock price will bottom well before the cloudy (murky) narrative from the Street clears. The company has 22% in GPU revenue today, and if analyst estimates are correct, then the company will end the year with 30% in GPU revenue. This does not include AI revenue from AI PC sales, which are growing steadily QoQ, and the $9.5 billion analyst estimates on AI don’t include any upward surprise impact from AMD’s upcoming new architecture for H2 2025. The new architecture will undoubtedly be aimed at speeding up real-time throughput as cheaply as possible as AMD gathers its strength against a far more capable competitor than Intel ever was. Yet, cheap is the keyword here, as AMD’s margins would likely expand based off its pricing, where Nvidia’s could contract when the inference market truly takes off (this is further off once inference overtakes the training market). This stuff is nuanced for AI investors, so be prepared to hear a lot more details from the I/O Fund as we go along.

Royston Roche, Equity Analyst at the I/O Fund, contributed to this article.

Please note: The I/O Fund conducts research and draws conclusions for the Fund’s positions. We then share that information with our readers. This is not a guarantee of a stock’s performance. Please consult your personal financial advisor before buying any stock in the companies mentioned in this analysis.

Recommended Reading:
Meta Blows Past Estimates in Q4, Guides for a Soft Q1

Meta reported some mind-boggling growth numbers for 2024 – 22% revenue growth, 48% operating income growth driving a 7 point margin expansion, and 60% EPS growth. As we had recently discussed in Big Tech AI Stocks to Showcase AI Gains, Capex in Q4 Reports, Meta’s decision to be “aggressively investing in compute and data center capacity as it continues developing its Llama family of models, fine-tuning its feed to boost engagement and increase time spent on apps, and optimizing ad delivery” is paying off.

Meta doubled down on its $60-65 billion capex for 2025, despite fears that DeepSeek’s breakthroughs would substantially alter the AI spending narrative. In fact, Meta CEO Mark Zuckerberg explained that Meta would be investing “hundreds of billions of dollars” towards AI infrastructure in the long run, while making multiple predictions for the path of AI and AI at Meta in 2025. Core AI is paying off as ad pricing growth is accelerating, aiding high revenue growth, while margins and cash flows remain very strong.

Despite the blowout Q4 report, Meta guided for a rather soft Q1, with the midpoint of its revenue guide below consensus, forcing Q1 growth to be revised nearly 1 point lower. EPS growth is also expected to become much more challenging in the back half of 2025, with consensus estimates pointing to growth of just 4.6% in Q3 and an unusual (2%) decline in Q4.

Financials

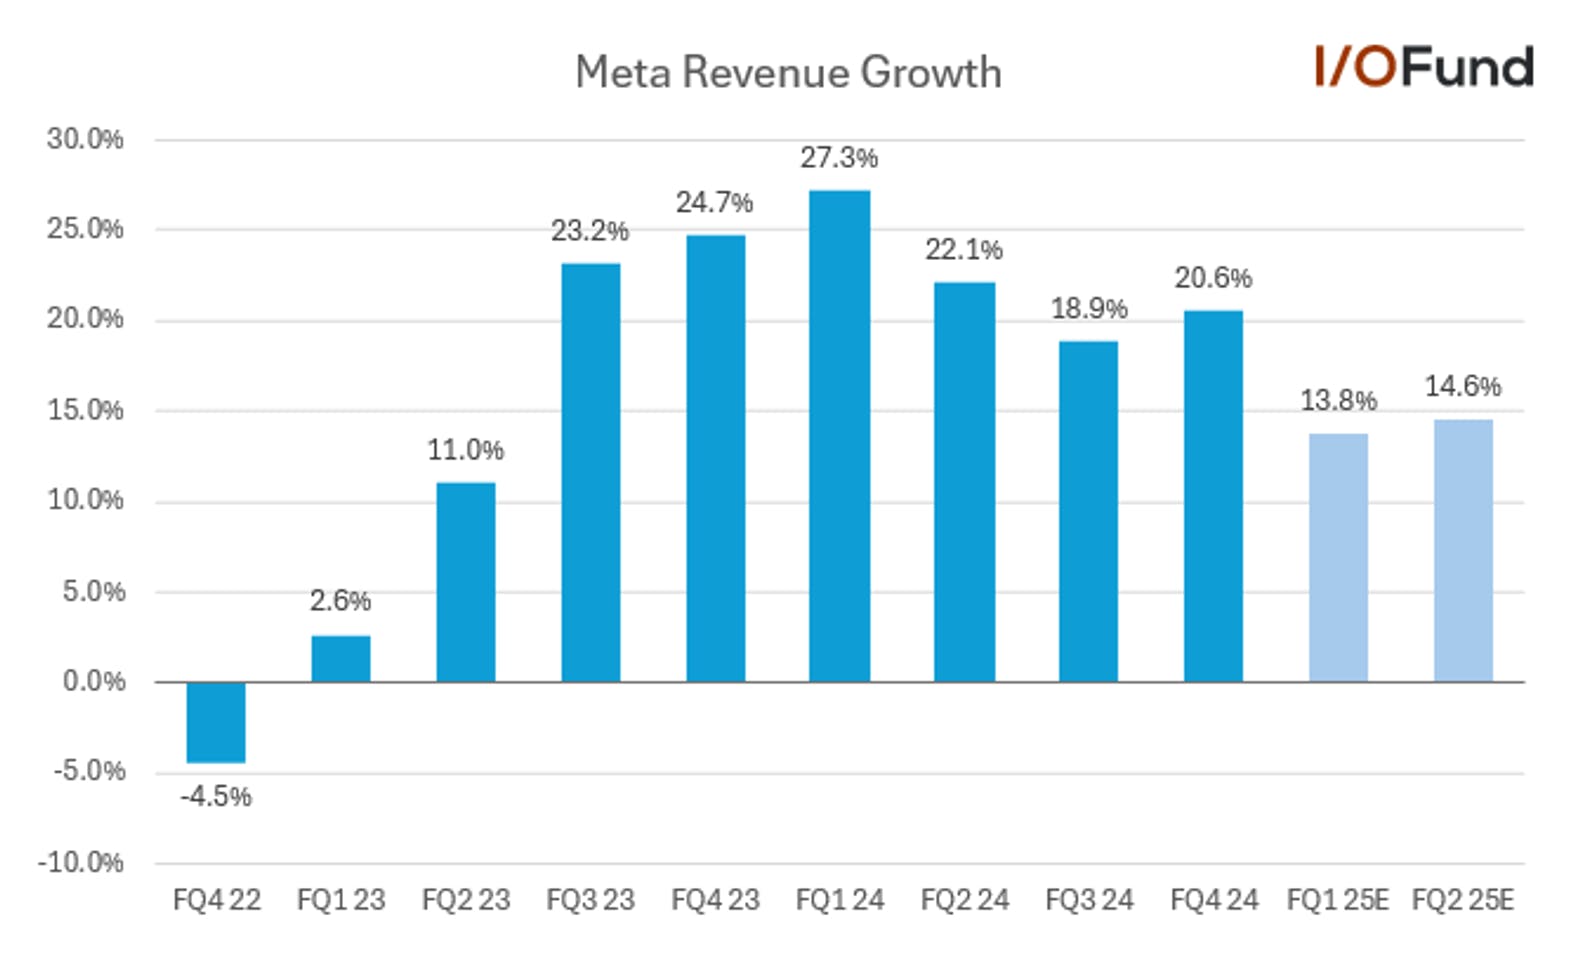
Meta reported quite a significant beat on EPS of 19%, while revenue also beat estimates, driven by increasing monetization. However, management guided for Q1 below consensus at midpoint, pointing to a sharp 7 point growth deceleration sequentially and the slowest growth since Q2 2023.

  • Revenue of $48.4 billion beat estimates by $1.4 billion, representing YoY growth of 20.6%.
  • For FY24, revenue rose 22% YoY to $164.5 billion.
  • For Q1, management guided for revenue of $39.5 billion to $41.8 billion, which at the $40.65 billion midpoint, was approximately $1 billion below estimates for $41.6 billion. The guide was impacted by a 3% FX headwind.

Management shared interesting commentary on how they are increasing monetization to drive improved revenue performance, via improving marketing performance for advertisers. Management explained that in the second half of the year, they introduced Andromeda, an ML system in partnership with Nvidia, which “enabled a 10,000 times increase in the complexity of models we use for ads retrieval.” This allowed Meta to “run far more sophisticated prediction models to better personalize which ads we show someone,” leading to “an 8% increase in the quality of ads that people see on objectives we’ve tested,” aiding ROI for advertisers. Automation tools made an appearance as well, with Meta noting that adoption of Advantage+ Shopping campaigns (tailored for e-commerce) surpassed a $20 billion annual run-rate while growing 70% YoY in Q4.

Margins and EPS

Meta’s focus on efficiency and margins in 2023 has translated into significant gains in 2024. Not only is operating margin now approaching 50%, but what was more impressive is the 50% EPS growth this quarter on top of a 201% growth comp.

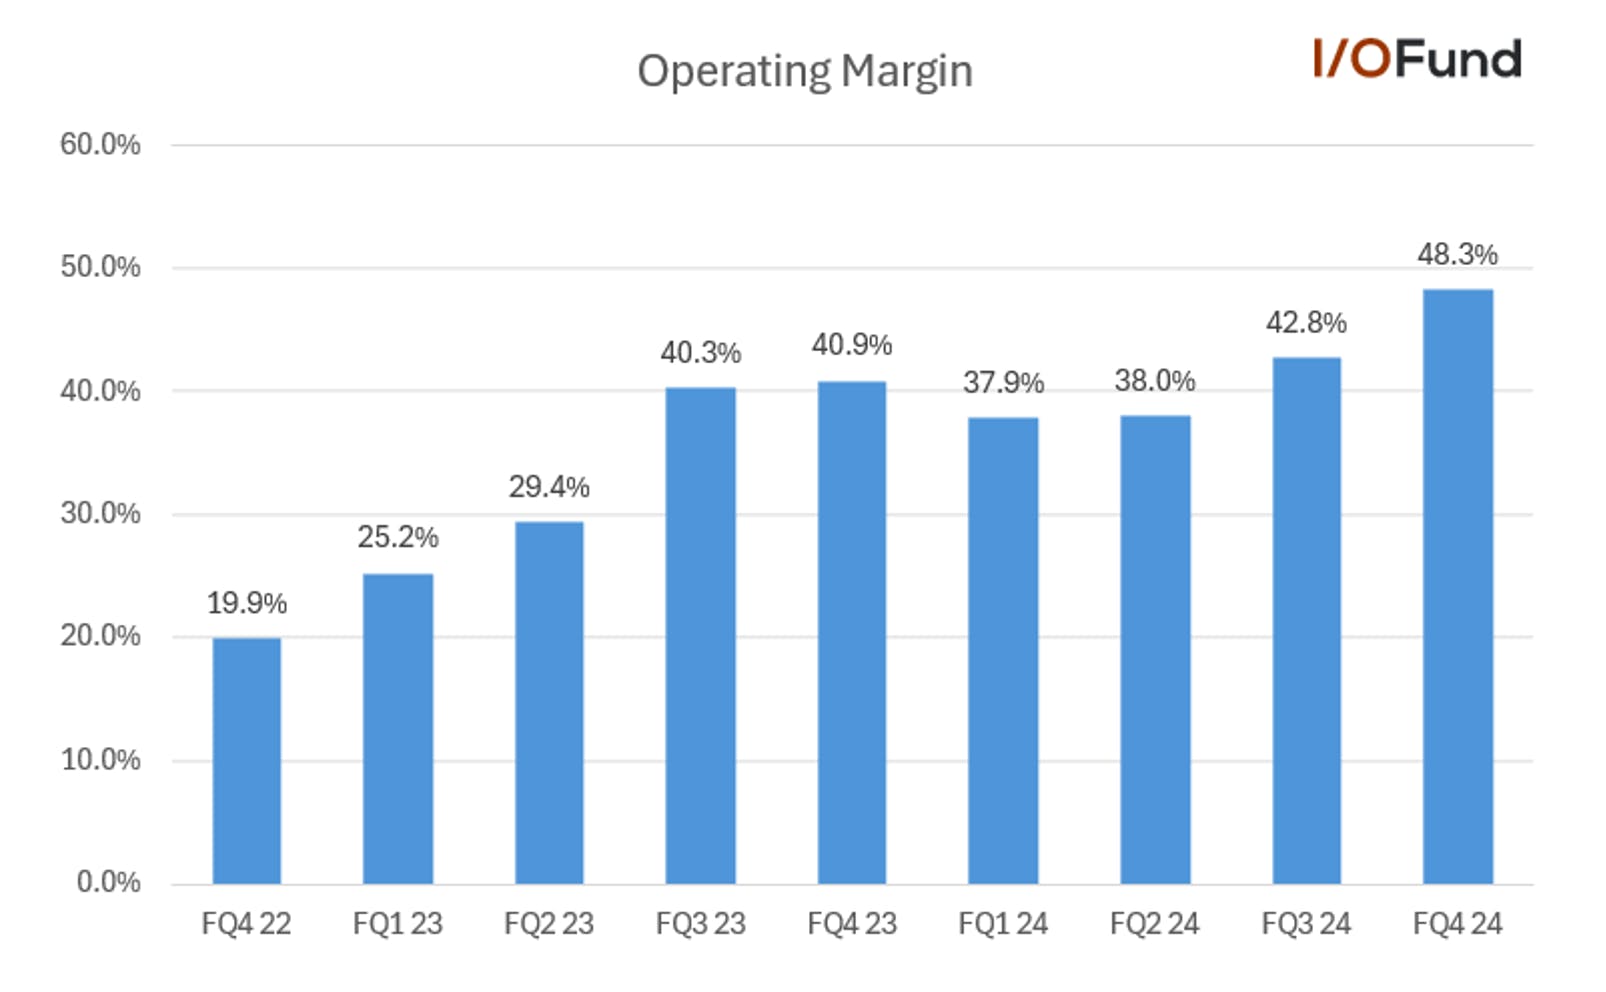
Here’s how Meta’s operating margin expansion has looked since Q4 2022:

  • Operating margin rose 5.5 points sequentially and 7.4 points YoY to 48.3%. This is also more than double the 19.9% margin reported in Q4 2022.
  • For FY24, operating margin was 42.2%, up 7.7 points from 34.5% in 2023 as operating income rose 48% YoY.
  • Net margin was 43.1% in Q4, improving from 38.7% in Q3 and 35% a year ago. Two years ago, net margin was just 14.5%.

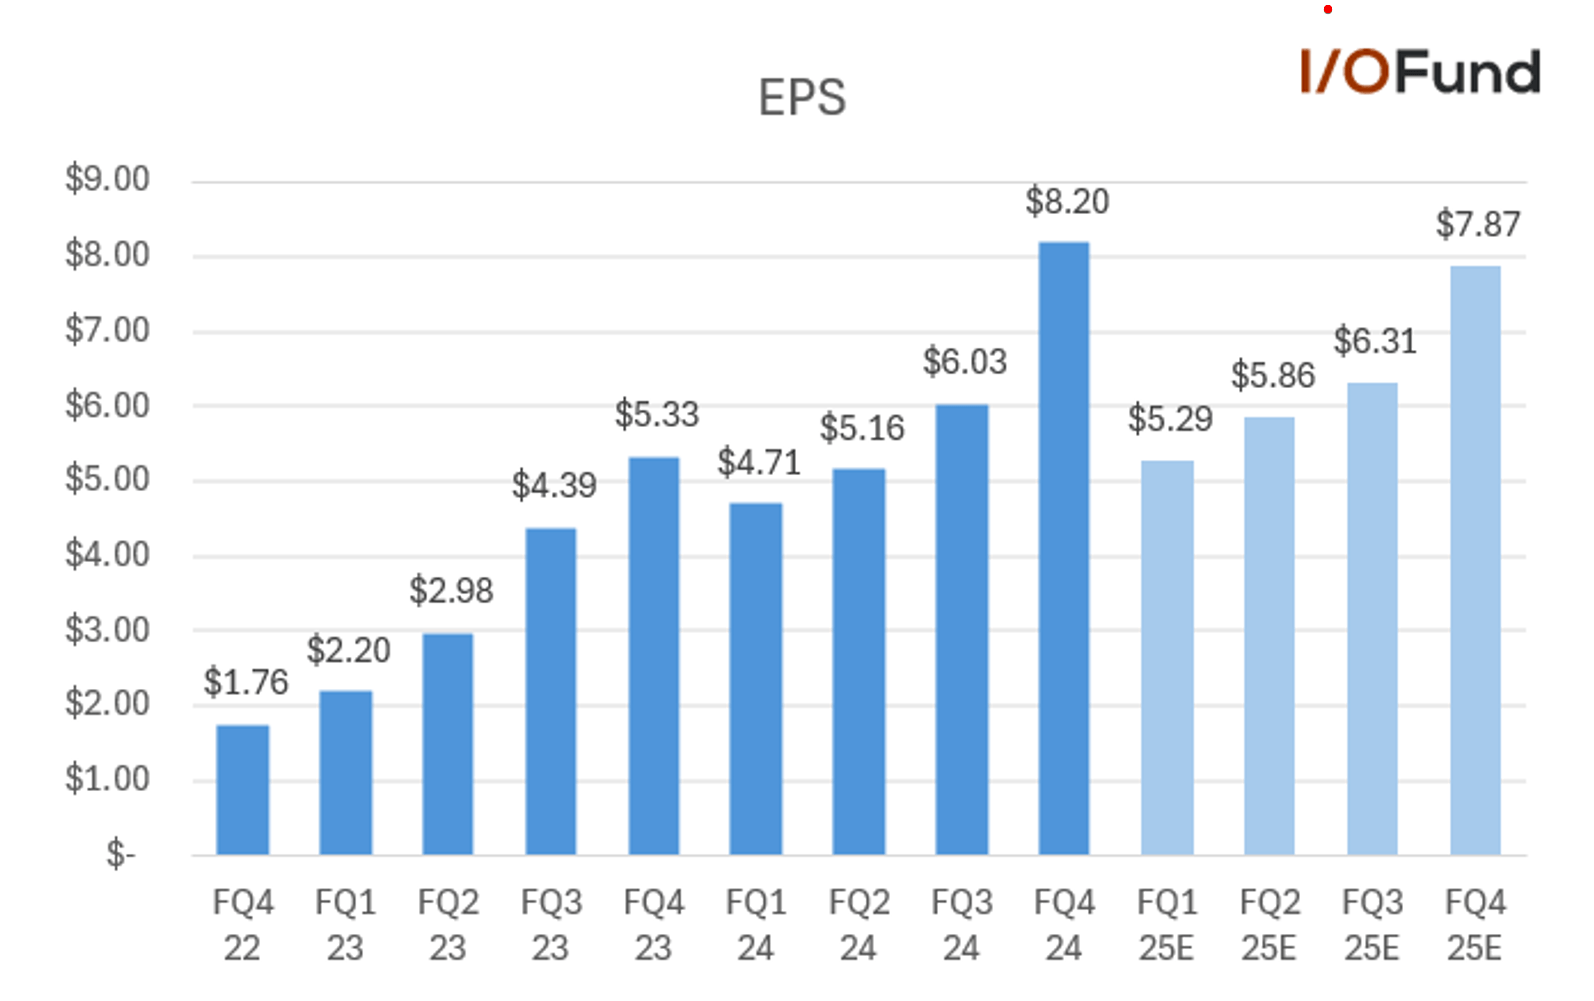
This substantial margin expansion has led to significant earnings growth. Meta’s EPS for 2024 rose 60% after increasing 73% in 2023.

  • Q4 EPS of $8.02 beat estimates by $1.28, and increased 50% YoY.
  • FY24 EPS of $23.86 increased 60% YoY.
  • For Q1, EPS is estimated to be $5.29, for growth of 12.3% YoY. 2025’s EPS growth is expected to become more challenged, with consensus pointing to growth of just 5.5% to $25.18, with single-digit to declining growth in the second half of the year.

Cash flows have been extremely strong as well – it’s quite absurd to see operating cash flow growing at 30% at nearly a >50% margin at this nearly $100 billion scale.

  • Operating cash flow was $28.0 billion in Q4, rising more than 44% YoY and representing a margin of 58%.
  • FY24 operating cash flow was $91.3 billion, up 28% YoY. OCF margin was 56%, improving from 53% in FY23.
  • Free cash flow was $13.2 billion, up 14% YoY as capex rose 90% YoY to $14.4 billion. FCF margin was 27%.
  • FY24 free cash flow was $52.1 billion, up 21% YoY for a 32% margin.
  • Cash, equivalents and marketable securities totaled $77.8 billion, while debt totaled $28.8 billion.

Key Metrics

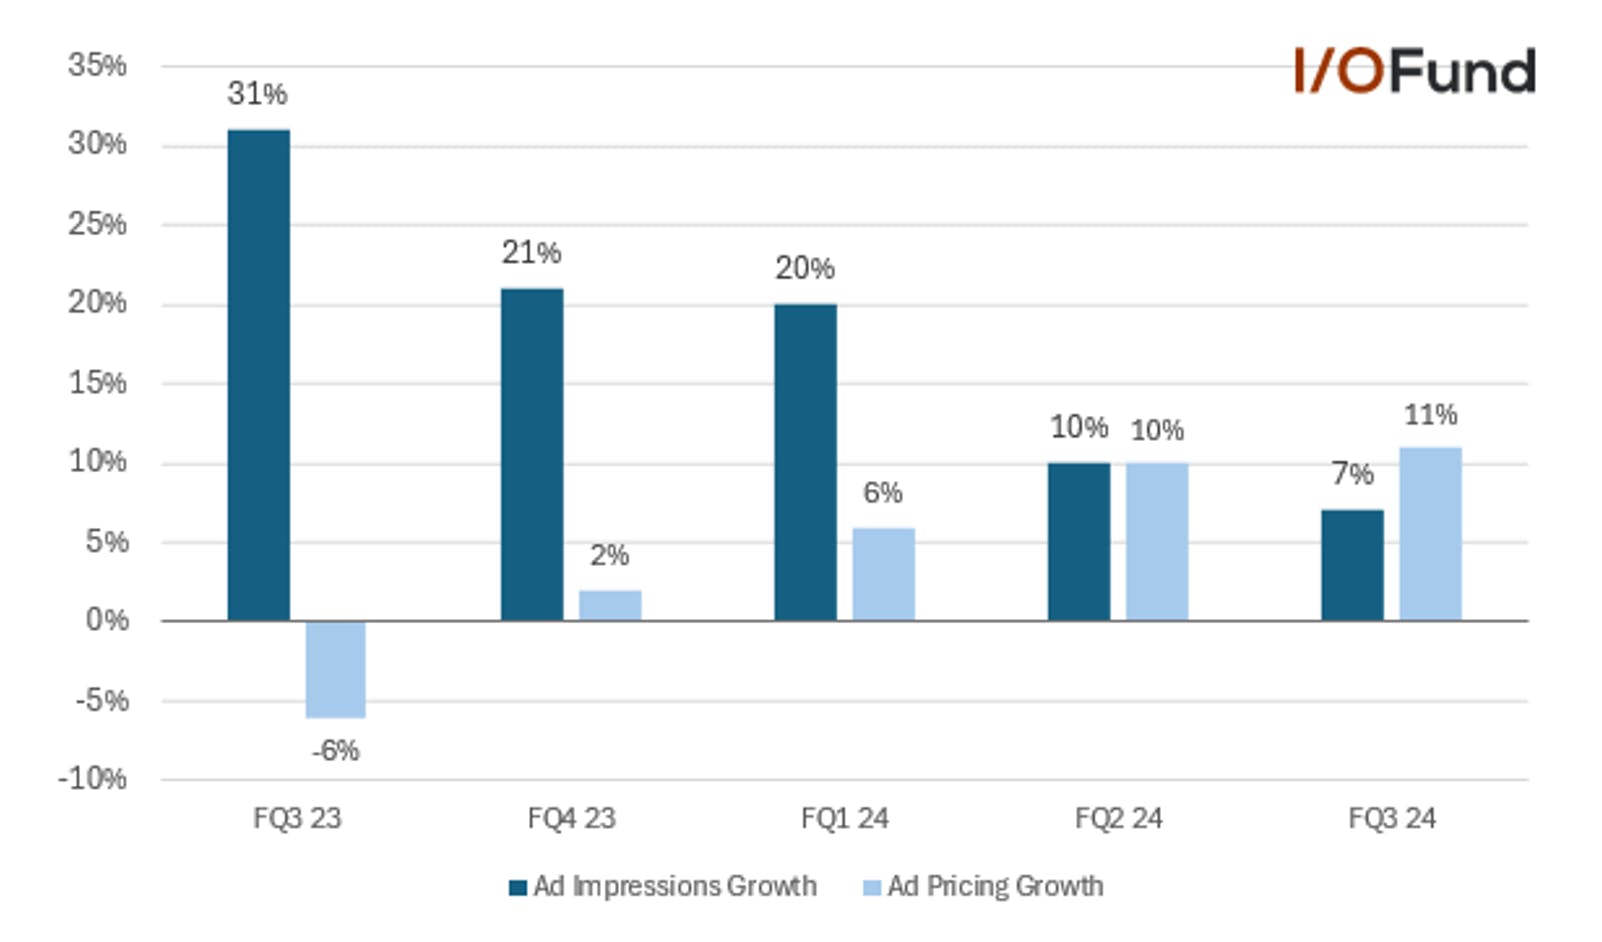
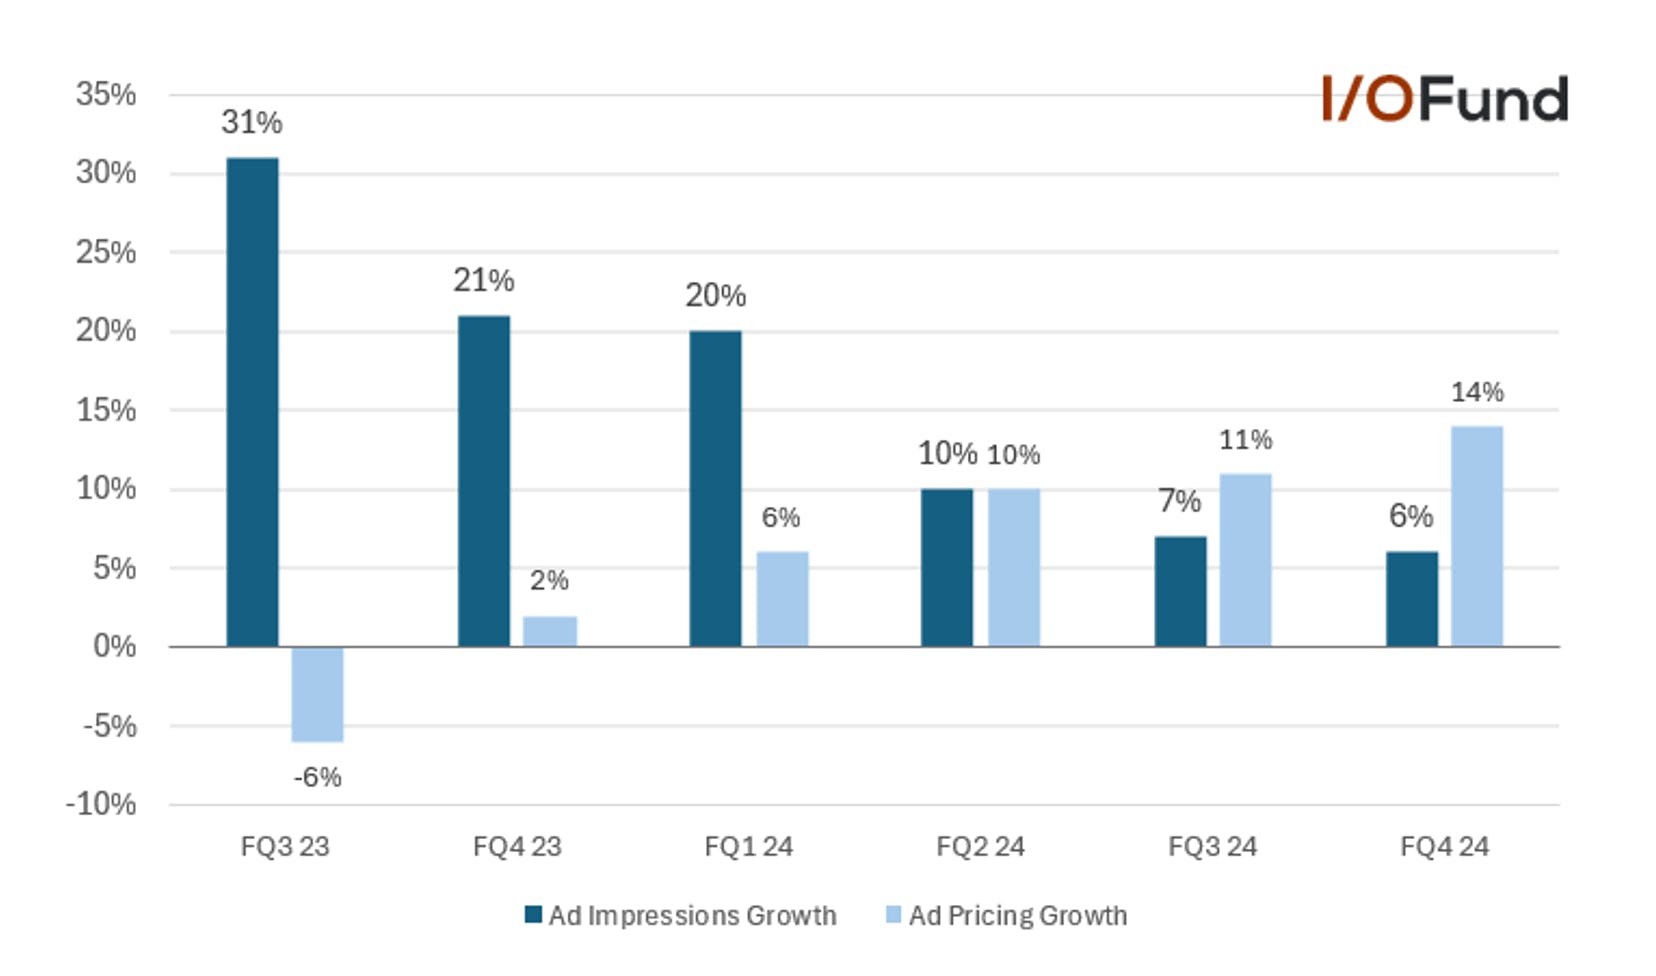
  • Ad impressions grew 6% YoY, slowing from the 7% growth last quarter. Europe and Rest of World dragged on growth, with impressions rising 5% and 3% YoY respectively.
  • Ad pricing increased 14% YoY, accelerating from 11% growth last quarter. Europe and Rest of World drove this growth, at 16% and 23% YoY respectively.
  • Average revenue per person (ARPP) was $14.25, up 16% QoQ and 16% YoY, highlighting Meta’s improvements in monetization.

Valuation and Risks

Despite shares rising 72% over the past year, Meta is trading as one of the cheapest stocks among the Mag 7, at 27x forward EPS. Alphabet is the only of the 7 to be cheaper on a bottom-line basis at 22x forward EPS, with Nvidia at 28x following this week’s selloff.

2025’s earnings growth forecast raises some red flags, as EPS is expected to grow just 5% for the full year, with growth decelerating significantly. Meta’s rally had gained steam as it reported consecutive triple-digit growth quarters, and this 38 point growth deceleration and risk of slipping into declining growth presents a headwind to shares, as it suggests AI monetization efforts are not translating into consistent EPS growth quarter after quarter.

On a top-line basis, Meta is trading for 11.5x revenue, and 9.4x forward revenue. This is the highest level it has traded at since 2018, and more than 50% higher than its five-year average of 7.5x revenue. Cash-flow based valuations offer a bit more room to the upside, with Meta trading at 21.8x operating cash flow, below its peaks of 24-26x in 2020 and 2021; for FCF, Meta is trading at 34x, below peaks of 43x.

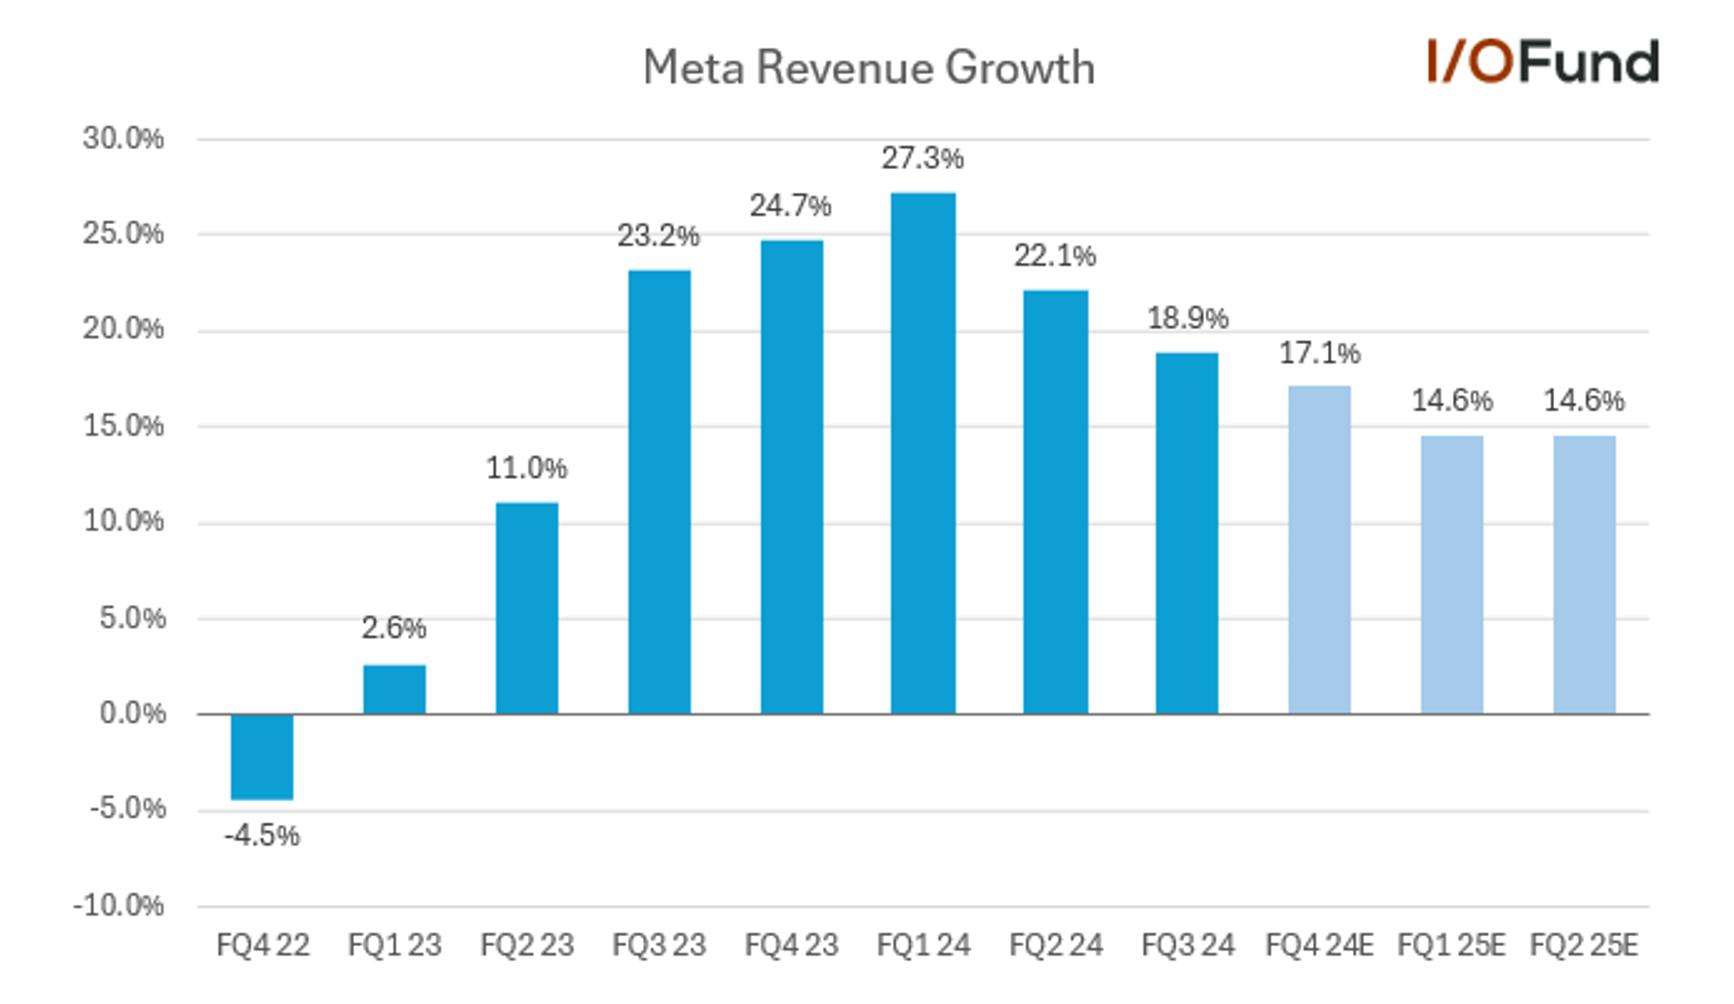
One other risk presents itself from Q1’s below consensus guide, as revenue growth estimates have already come down. Prior to earnings, Meta was expected to see growth of ~14.5% to 14.6% in each quarter of 2025, though Q1 is now expected to see growth of 13.8%.

Capex Commentary – Implications for Nvidia and Broadcom

Though there were fears that DeepSeek would impact the trajectory of AI spending this year, Meta doubled down on its planned capex of $60 to $65 billion in 2025. Management explained that the increase would be driven by investments supporting genAI and core businesses, though the majority would be directed towards core, where Meta is seeing the most AI growth arise. CEO Mark Zuckerberg also discussed the “hundreds of billions of dollars that we will invest in AI infrastructure over the long-term,” as it brings 1 GW of capacity online this year while working on a 2 GW data center.

For 2025, CFO Susan Li provided a breakdown of where capex will go, saying data center spend will rise to support build outs of large-scale training clusters and higher power density facilities entering primary construction phases. Networking spend is expected to rise as higher-capacity networks get established to support both core AI and gen AI traffic.

However, perhaps the most important part of the call was Li’s discussion on AI accelerators, as it has implications for both Broadcom and Nvidia. Li explained that Meta would be “pursuing cost efficiencies by deploying our custom MTIA silicon in areas where we can achieve a lower cost of compute by optimizing the chip to our unique workloads. In 2024 we started deploying MTIA to our ranking and recommendation inference workloads for ads and organic content. We expect to further ramp adoption of MTIA for these use cases throughout 2025 before extending our custom silicon efforts to training workloads for ranking and recommendations next year.”

Management still emphasized that they are “planning to significantly ramp up deployment of GPUs in 2025, and we'll continue to engage with our vendors and invest in our own silicon to meet those needs,” though they did not comment on whether they are supply constrained like Microsoft.

Analyst Q&A

Analysts questioned Meta about the MTIA accelerator ramp, growth drivers moving forward, and most importantly, the impact of DeepSeek.

Q, Brian Nowak (Morgan Stanley): “How should we think about the main gating factors as to how quickly you'd be able to move a higher percentage of your engagement to your custom silicon?”

A, Susan Li (Meta): “We're also very invested in developing our own custom silicon for unique workloads, where off-the-shelf silicon isn't necessarily optimal and specifically, because we're able to optimize the full stack to achieve greater compute efficiency and performance per cost and power because our workloads might require a different mix of memory versus network, bandwidth versus compute and so we can optimize that really to the specific needs of our different types of workloads.

Right now, the in-house MTIA program is focused on supporting our core ranking and recommendation inference workloads. … We'll continue ramping adoption for those workloads over the course of 2025 as we use it for both incremental capacity and to replace some GPU-based servers when they reach the end of their useful lives. Next year, we're hoping to expand MTIA to support some of our core AI training workloads and over time, some of our Gen AI use cases.”

Reading between the lines here suggests that ramping MTIA is not necessarily coming at the expense of lost share to Nvidia; rather, Meta is working to replace old GPUs with custom chips to increase capacity and power workloads with more efficient chips, supplementing GPU purchases from Nvidia.

JP Morgan’s Douglas Anmuth asked about the impact of DeepSeek and other models that “potentially leverage Llama or others to train faster and cheaper,” and what impact this has.

Zuckerberg said that it is “probably too early to really have a strong opinion on what this means for the trajectory around infrastructure and CapEx,” though the mix shift between compute and inference as reasoning models arise was already something that Meta had been experimenting with.

He went on to explain, “Of all the compute that we're using, that the largest pieces aren't necessarily going to go towards pre-training. But that doesn't mean that you need less compute, because one of the new properties that's emerged is the ability to apply more compute at inference time in order to generate a higher level of intelligence and a higher quality of service, which means that as a company that has a strong business model to support this, I think that's generally an advantage that we're now going to be able to provide a higher quality of service than others.”

Conclusion

Meta’s Q4 was indeed a strong report, though Q1’s weak guide was a bit questionable given the strength of the recent report. Execution has been pristine since 2023, with operating margin more than doubling with significant cash flow and EPS growth. ROI from investments in core AI is becoming more evident as ad pricing growth is accelerating, offsetting decelerating growth in ad impressions.

Damien Robbins, Equity Analyst for the I/O Fund, contributed to this analysis.

Please note: The I/O Fund conducts research and draws conclusions for the Fund’s positions. We then share that information with our readers. This is not a guarantee of a stock’s performance. Please consult your personal financial advisor before buying any stock in the companies mentioned in this analysis.

Recommended Reading:
Microsoft FQ2 Earnings: Soft revenue guidance

Microsoft beat the top-line and bottom-line consensus estimates. However, the revenue guidance fell short of estimates. The company’s December quarter revenue grew by 12.3% YoY to $69.6 billion, beating estimates by 1.2%. The EPS grew by 10.2% YoY to $3.23, beating estimates by 3.9%, driven by strong operating efficiencies.

The company guided the March quarter revenue in the range of $67.7 billion to $68.7 billion, representing YoY growth of 10.3% at the midpoint. However, they were short of analyst estimates of $68.8 billion. The strong US dollar is expected to negatively impact the revenue growth by two percentage points.

Azure grew by 31% and came in at the lower-end guidance range of 31% to 32%. The company’s AI revenue met the management’s expectations. However, the non-AI revenue was slightly lower than expected due to the company’s challenges in the go-to-market execution.

Management provided a soft guide for the next quarter between 31% and 32% in constant currency. Demand for AI products exceeds Microsoft's current capacity, as the company faces challenges building enough data centers to support the high demand. Management expects supply constraints to be resolved by the end of the first half 2025.

Financials

Revenue

The company’s FQ2 (December quarter) revenue grew by 12.3% YoY to $69.6 billion, beating estimates by 1.2%, driven by strong AI and cloud demand.

Microsoft's revenue guidance for the March quarter is $67.7 billion to $68.7 billion, representing 10.3% year-over-year growth at the midpoint. This fell short of analyst estimates of $68.8 billion. A strong US dollar is projected to impact revenue growth by 2 percentage points negatively.

Segments

The company’s Productivity and Business Processes segment, which includes Microsoft 365 subscriptions and LinkedIn, grew by 14% YoY and 13% in constant currency to $29.4 billion, driven by strong Microsoft 365 Commercial offerings. Management expects revenue to grow between 11% and 12% in constant currency or $29.4 billion to $29.7 billion in the next quarter.

The Intelligent Cloud segment, which includes Azure AI revenue, grew by 19% YoY to $25.5 billion. The revenue was below management expectations due to lower non-AI revenue due to the company’s challenges in the go-to-market execution, specifically with customers reached through partner and indirect sales channels as the company balances its resources driving strong AI revenue. The lower non-AI revenue was offset by better-than-expected Azure AI revenue.

Azure revenue grew by 31% and included 13 percentage points contribution from AI services. Management provided a soft guide for the next quarter between 31% and 32% in constant currency. The company is facing challenges in building enough data centers to support the high demand. Management expects supply constraints to be resolved by the end of the first half of 2025, helped by the investments it has made in long-lived assets.

Management expects Intelligent Cloud revenue to grow between 19% and 20% in constant currency or $25.9 billion to $26.2 billion in the next quarter.

More Personal Computing revenue was flat at $14.7 billion. Management expects revenue in the next quarter in the range of $12.4 billion to $12.8 billion as it continues to prioritize higher margin opportunities in this segment.

Margins

The company’s margins have improved this quarter despite AI investments, which are driven by operational efficiencies.

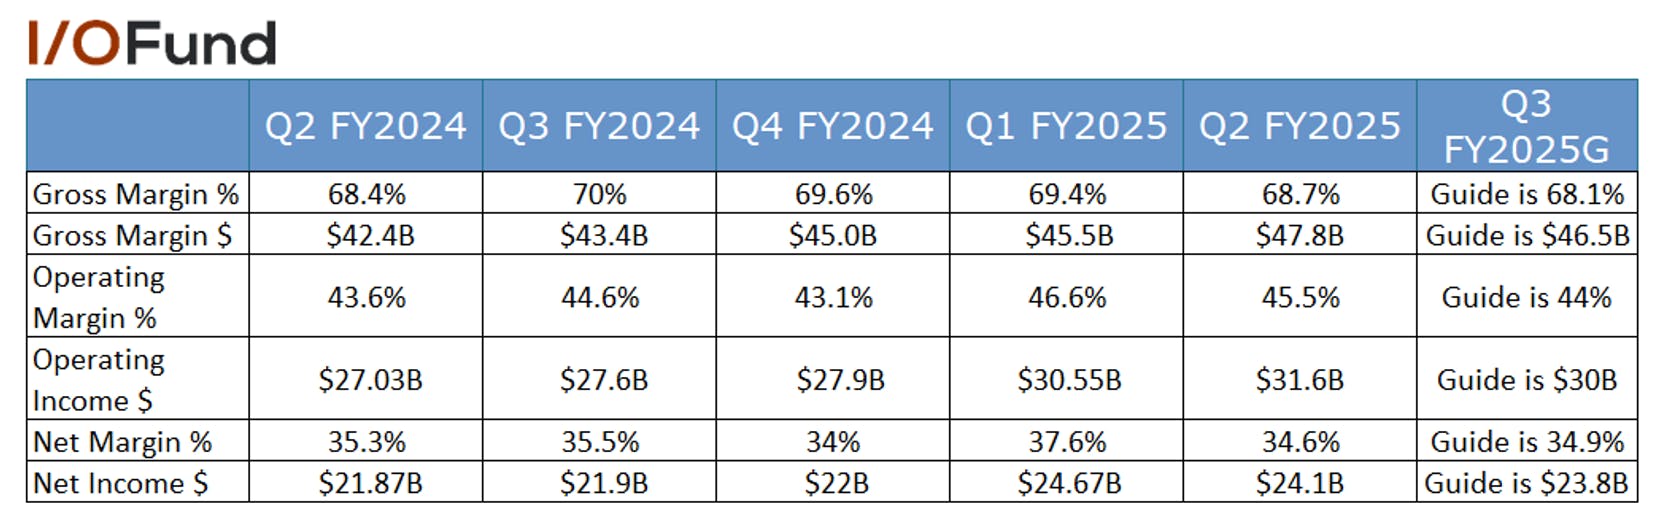
  • FQ2 gross margin was 68.7% compared to 68.4% in the same period last year. It was better than the guide of 67.9% due the to focus on higher margin business and partially offset by increased AI investments. Management guide for the next quarter is 68.1%.
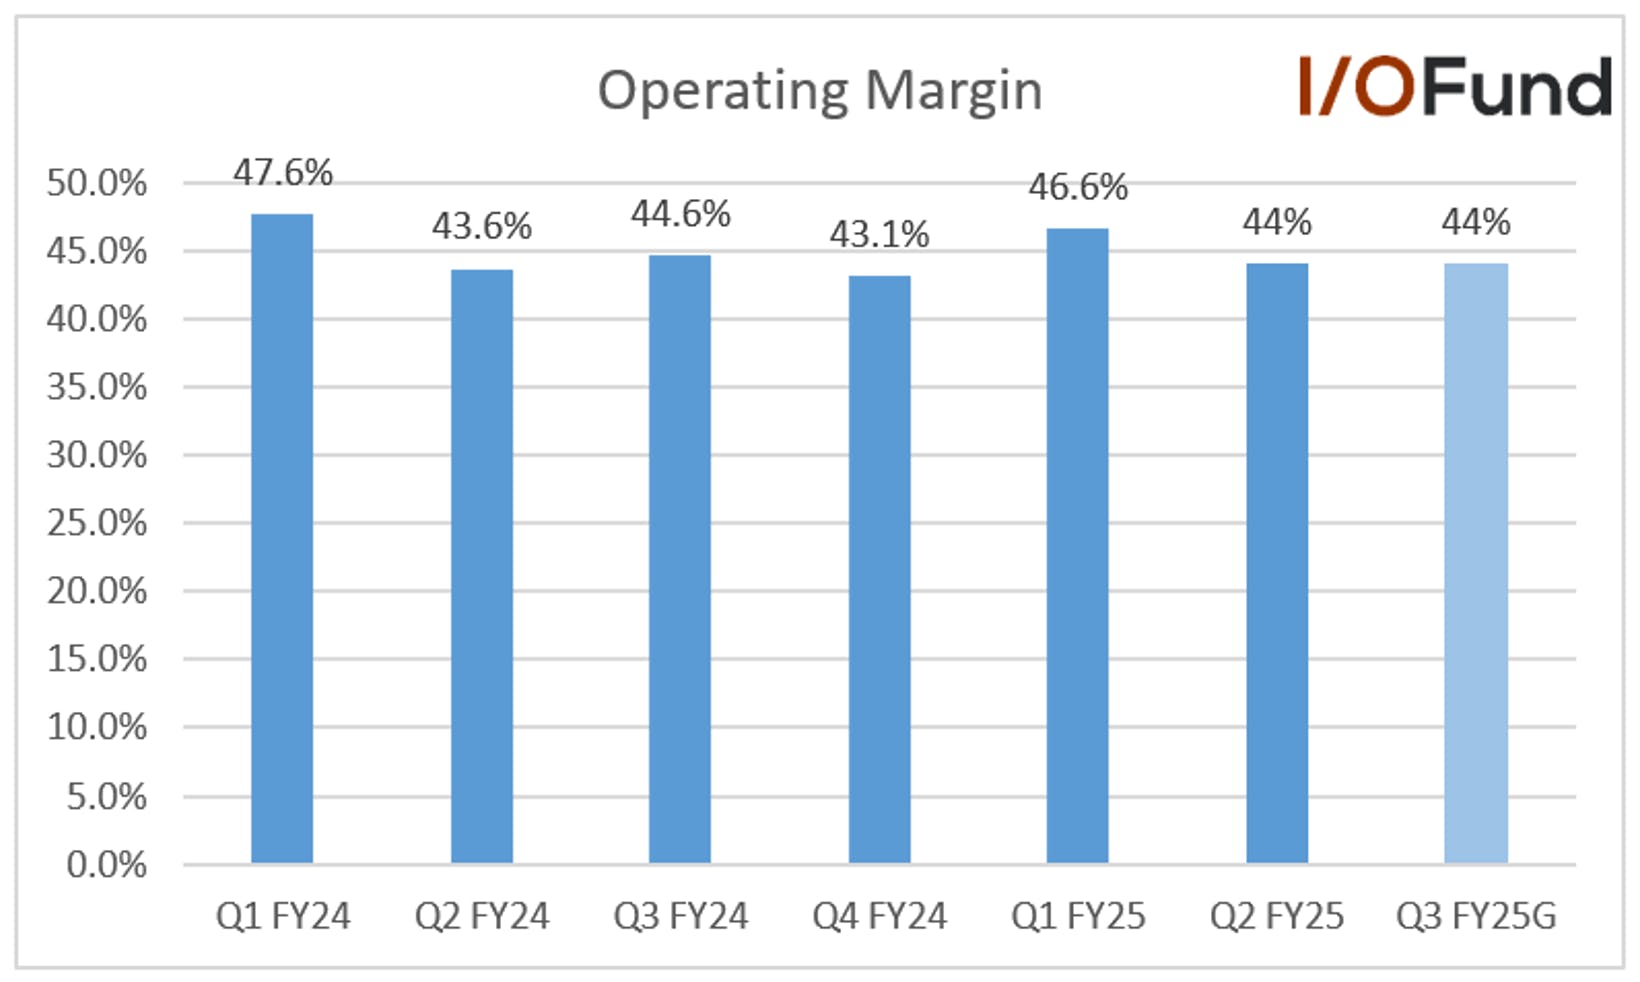
  • FQ2 operating margin was 45.5% compared to 43.6% in the same period last year. It was better than the guide of 44%, driven by operational efficiencies. Management guide for the next quarter is 44%.
  • Net margin of 34.6% was better than the guide of 33.8% compared to 35.3% in the same period last year. Management guide for the next quarter is 34.9%.

EPS

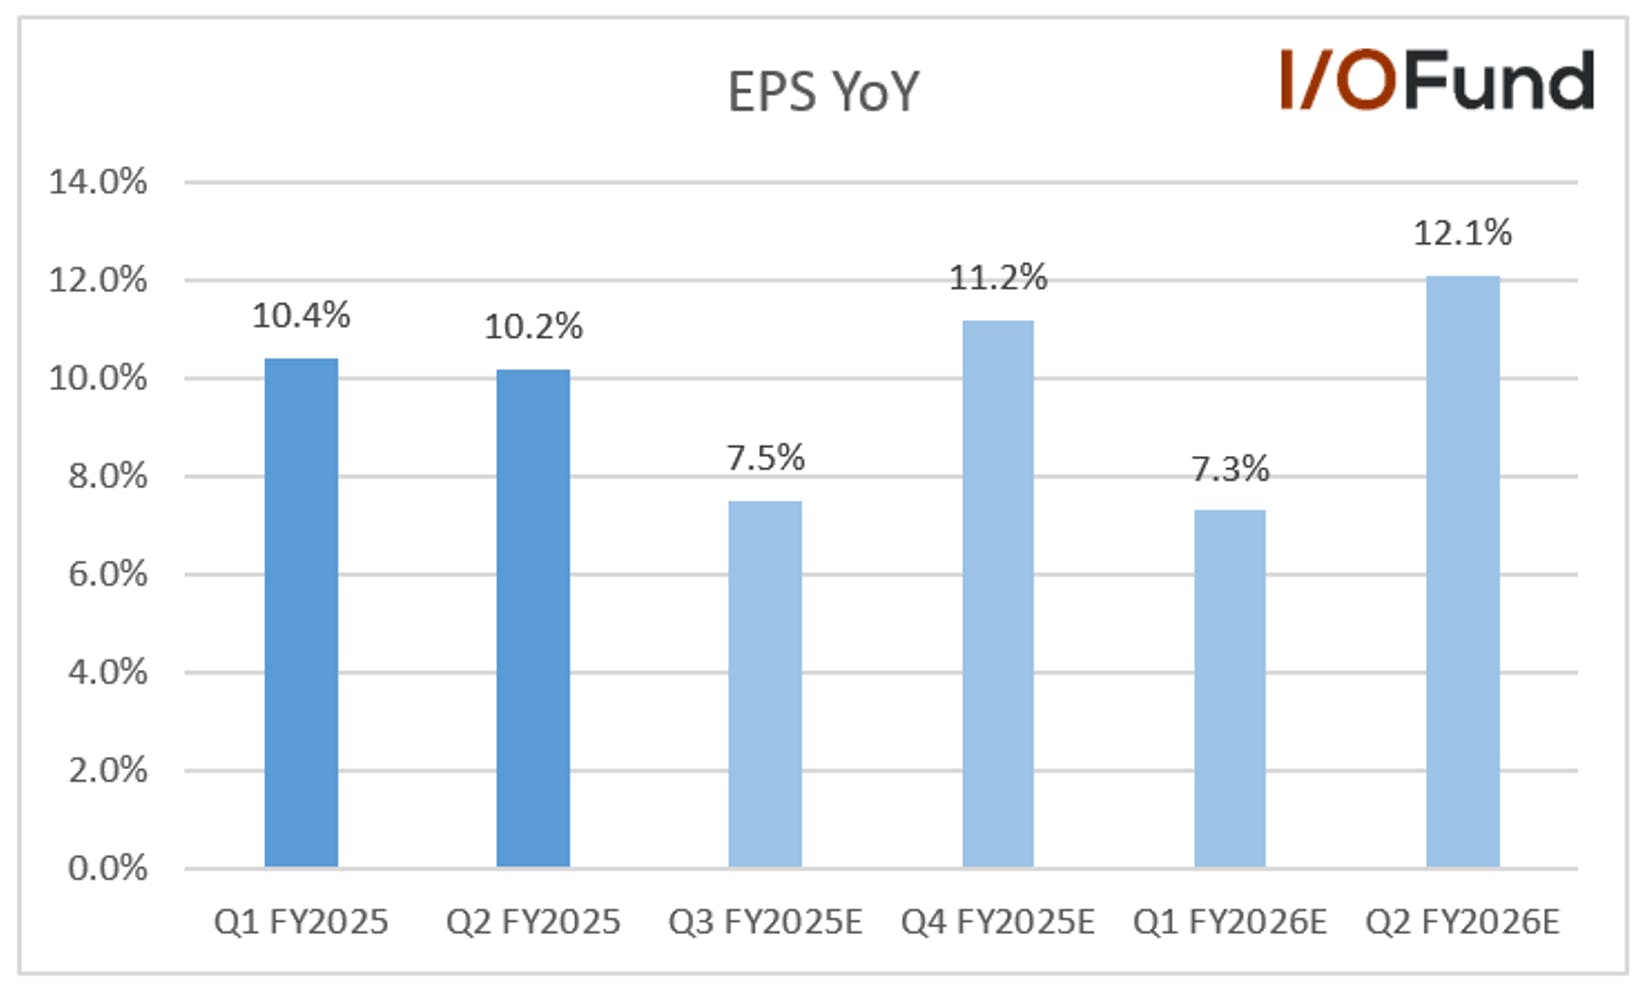
The EPS grew by 10.2% YoY to $3.23, beating estimates by 3.9%, driven by strong operating efficiencies.

Cash Flow and Balance Sheet

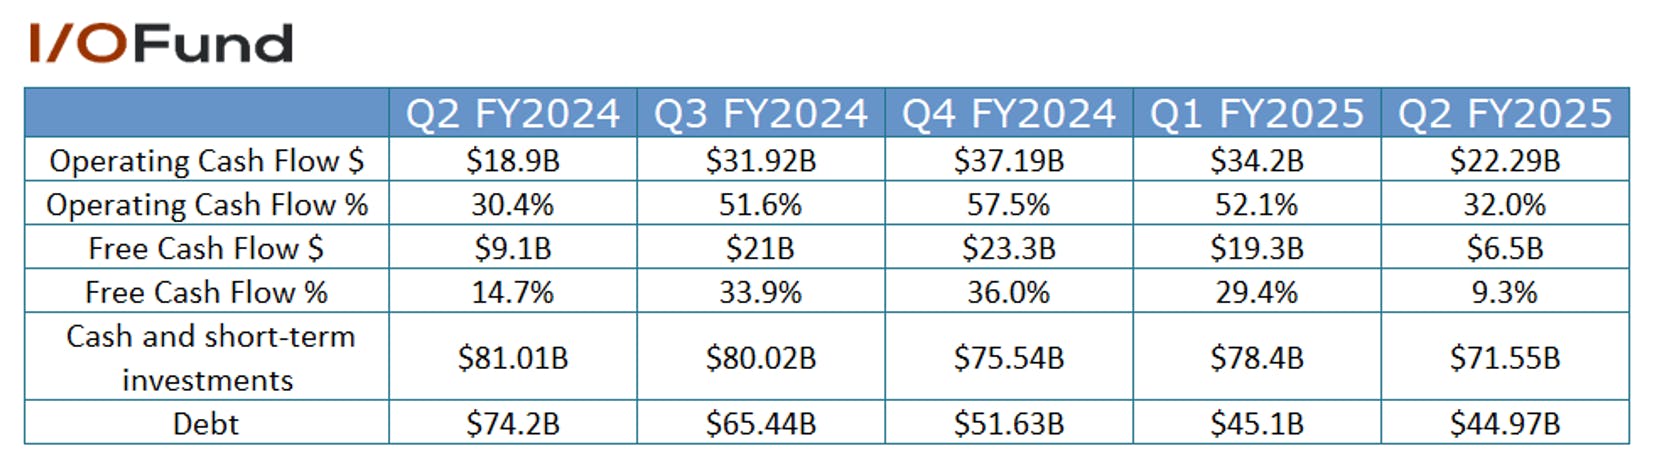
  • FQ2 operating cash flow grew by 18% YoY to $22.3 billion, driven by strong cloud billings and collections, partially offset by higher supplier, employee, and tax payments.
  • Free cash flow was down (-29%) YoY to $6.5 billion due to higher capital investments to support the strong AI demand.
  • Cash and short-term investments were $71.55 billion and debt of $44.97 billion compared to $78.4 billion and $45.1 billion at the end of FQ1.
  • The company paid $6.2 billion in dividends and repurchased shares worth $3.5 billion in FQ2.

Key Metrics

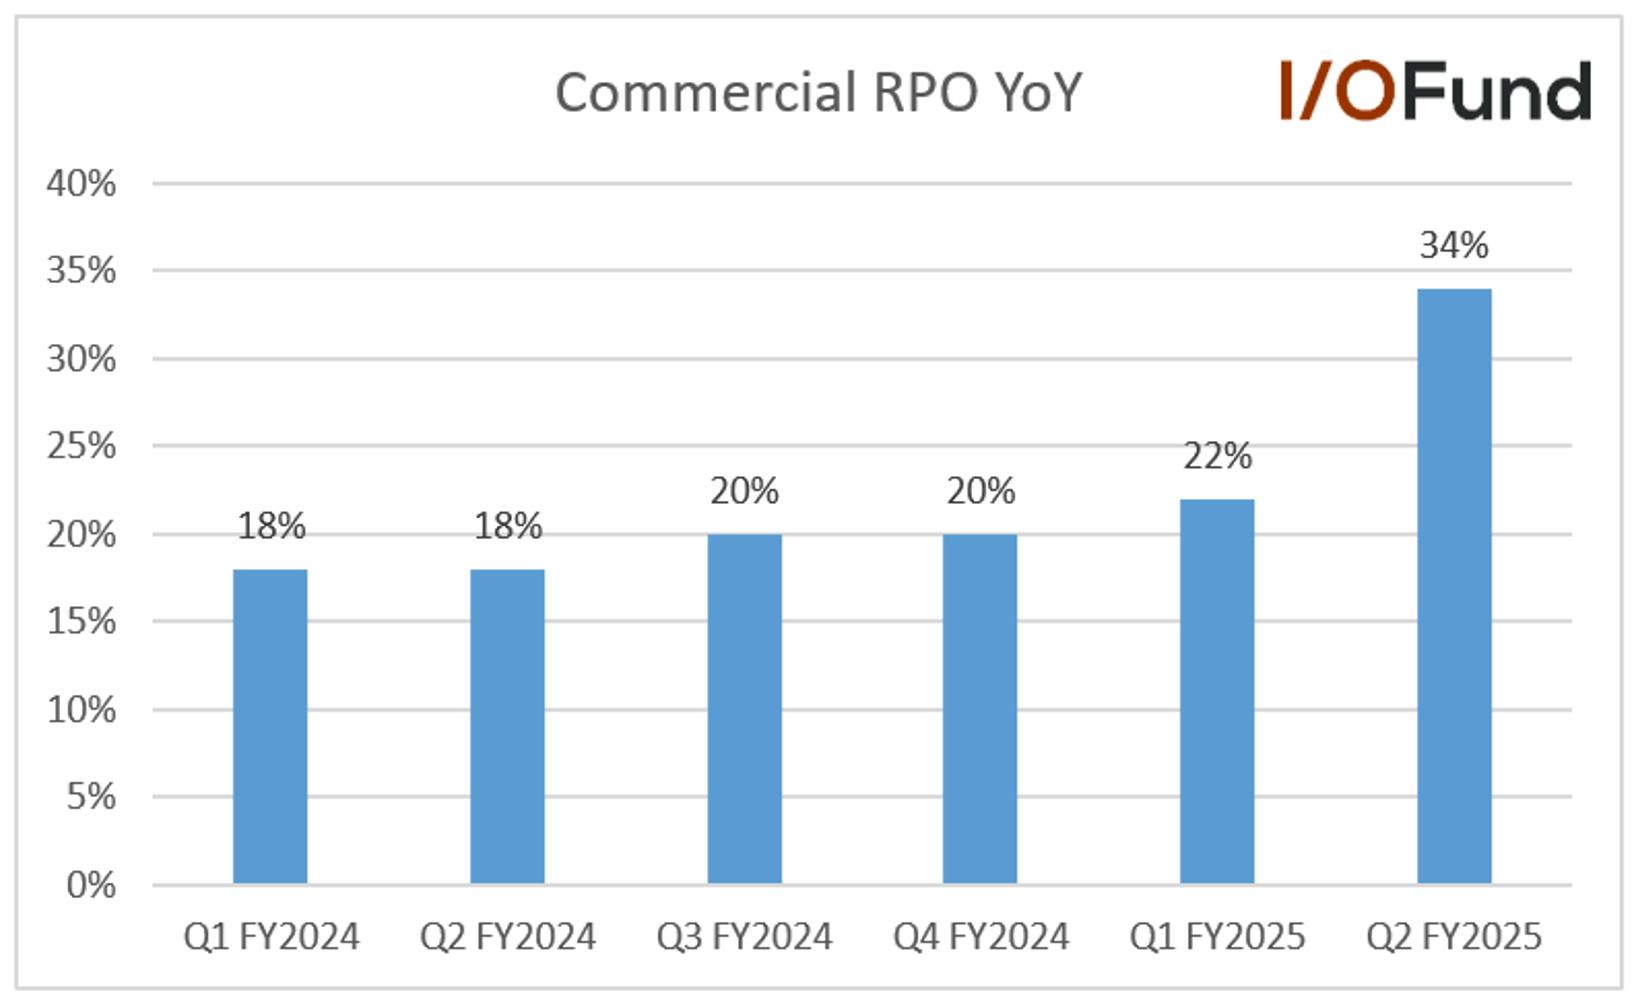
The company’s commercial RPO grew by 34% YoY and 36% in constant currency to $298 billion. Commitments from OpenAI drove the strong acceleration from 22% growth in FQ1 and also from existing and new Azure customers.

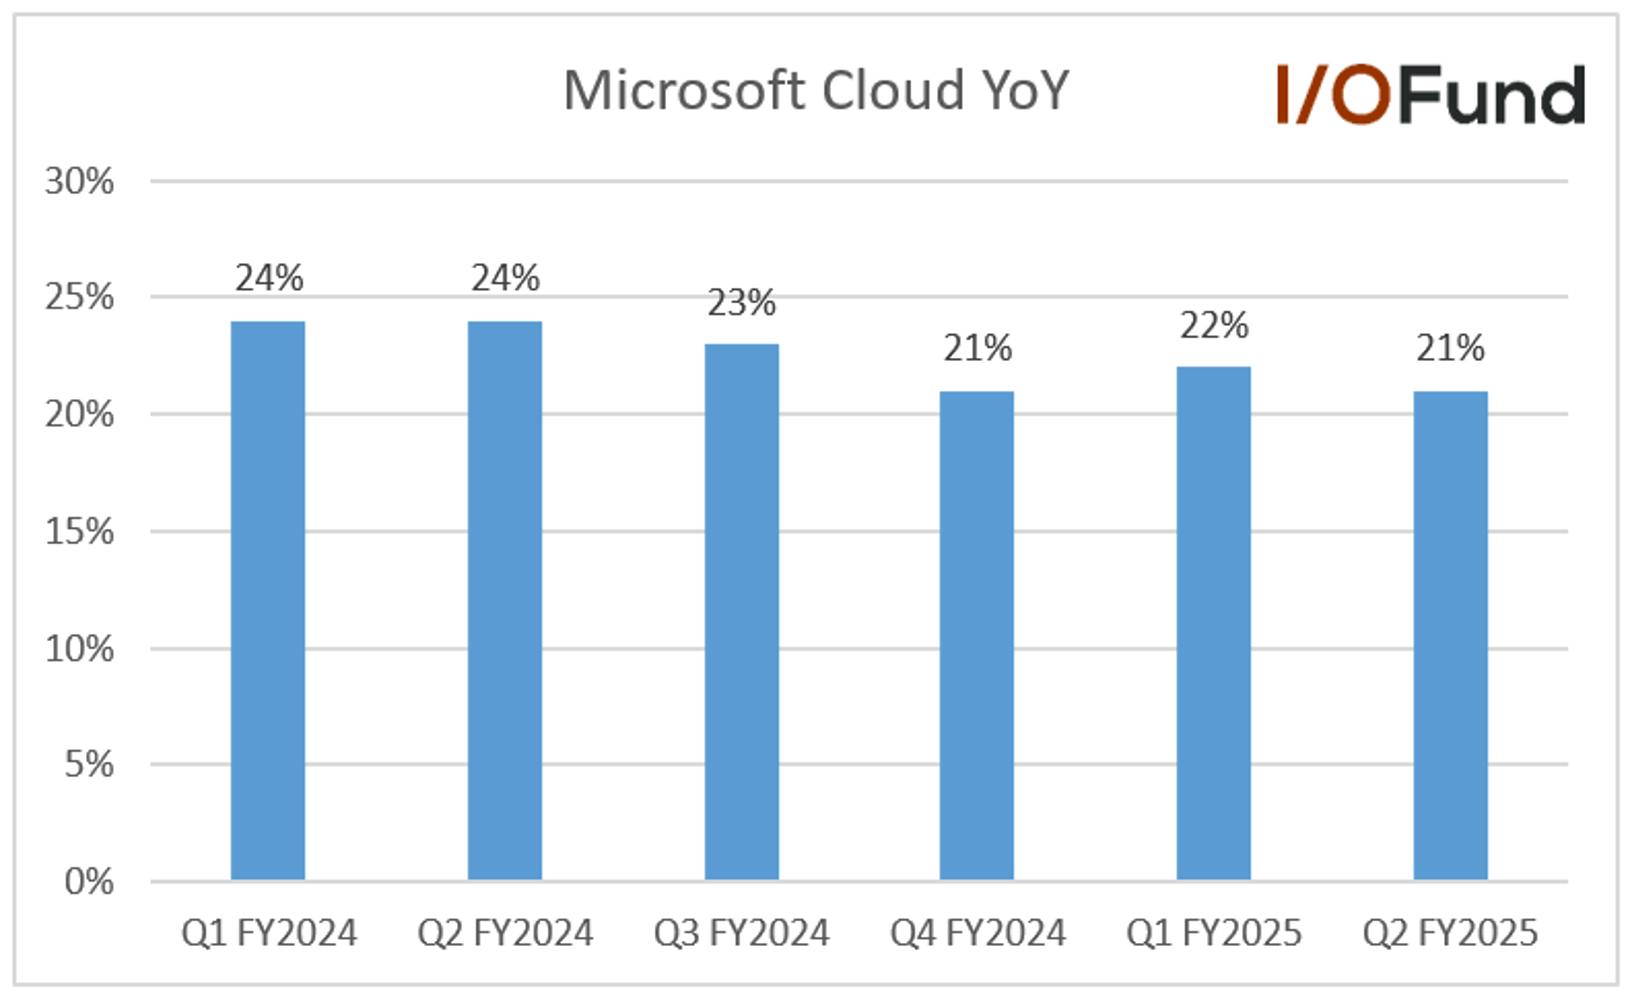
Microsoft Cloud revenue grew by 21% YoY to a record $40.9 billion. The AI business surpassed the annual revenue run rate of $13 billion, up 175% YoY. Cloud gross margin was 70% and in line with the guidance. Management guide for FQ3 is 69%, down from 72% in the same period last year due to higher AI investments.

Risks to consider

The company’s Azure growth in the coming quarters is to be watched. Management provided a soft guide for the next quarter between 31% and 32% in constant currency. Demand for AI products exceeds Microsoft's current capacity, as the company faces challenges building enough data centers to support the high demand. Management expects supply constraints to be resolved by the end of the first half 2025.

Morgan Stanley analyst Keith Weiss asked about the lower Azure growth during the earnings call. The CFO, Amy Hood, provided more context and clarified that the slowdown was due to the challenges in the non-AI Azure revenue. Microsoft's Azure AI revenue in FQ2 exceeded expectations due to operational teams pulling in delivery dates. However, non-AI Azure Compute Revenue (ACR) faced challenges in sales through partners and indirect methods.  The company shifted its sales and marketing budgets and resources over the summer to balance AI workloads with ongoing migrations and other customer needs. However, adjustments are still being made to optimize resource allocation. Some impact on non-AI ACR is expected through the first half of 2025 as these adjustments take effect. However, management has not provided a definite timeline for when the non-AI revenue will recover.

The company’s capex is another area to watch in the coming quarters. The rising capex will put pressure on the margins and the cash flows. Capex, including assets acquired under finance leases, was $22.6 billion, up 97% YoY. Cash paid for property and equipment was $15.8 billion. Management expects the spending to be similar to FQ2 spending in the next two quarters. For FY2026, which ends in June, management expects to continue to invest. However, the growth rate will be lower than the FY2025, which is positive news, and the mix will shift back to short-lived assets that are more correlated to revenue growth. The company recently announced plans to invest approximately $80 billion in AI-enabled data centers in FY2025, up 44% YoY.

Valuation

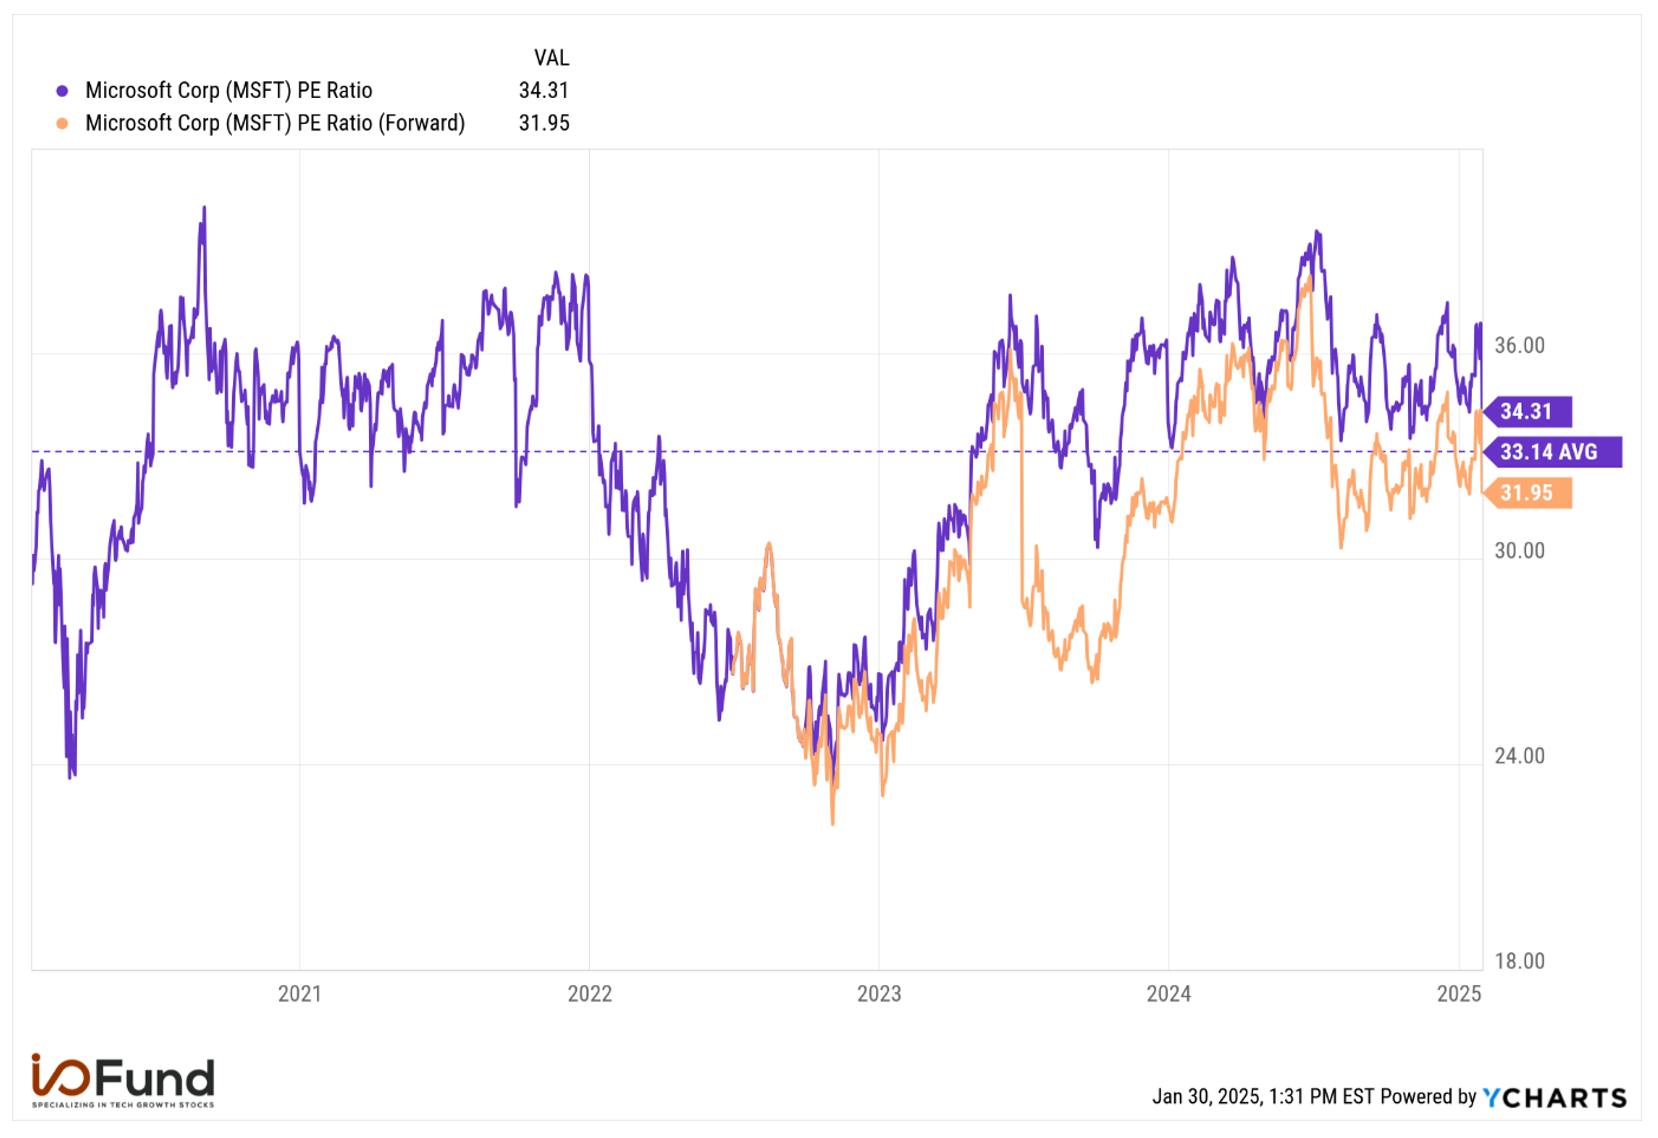
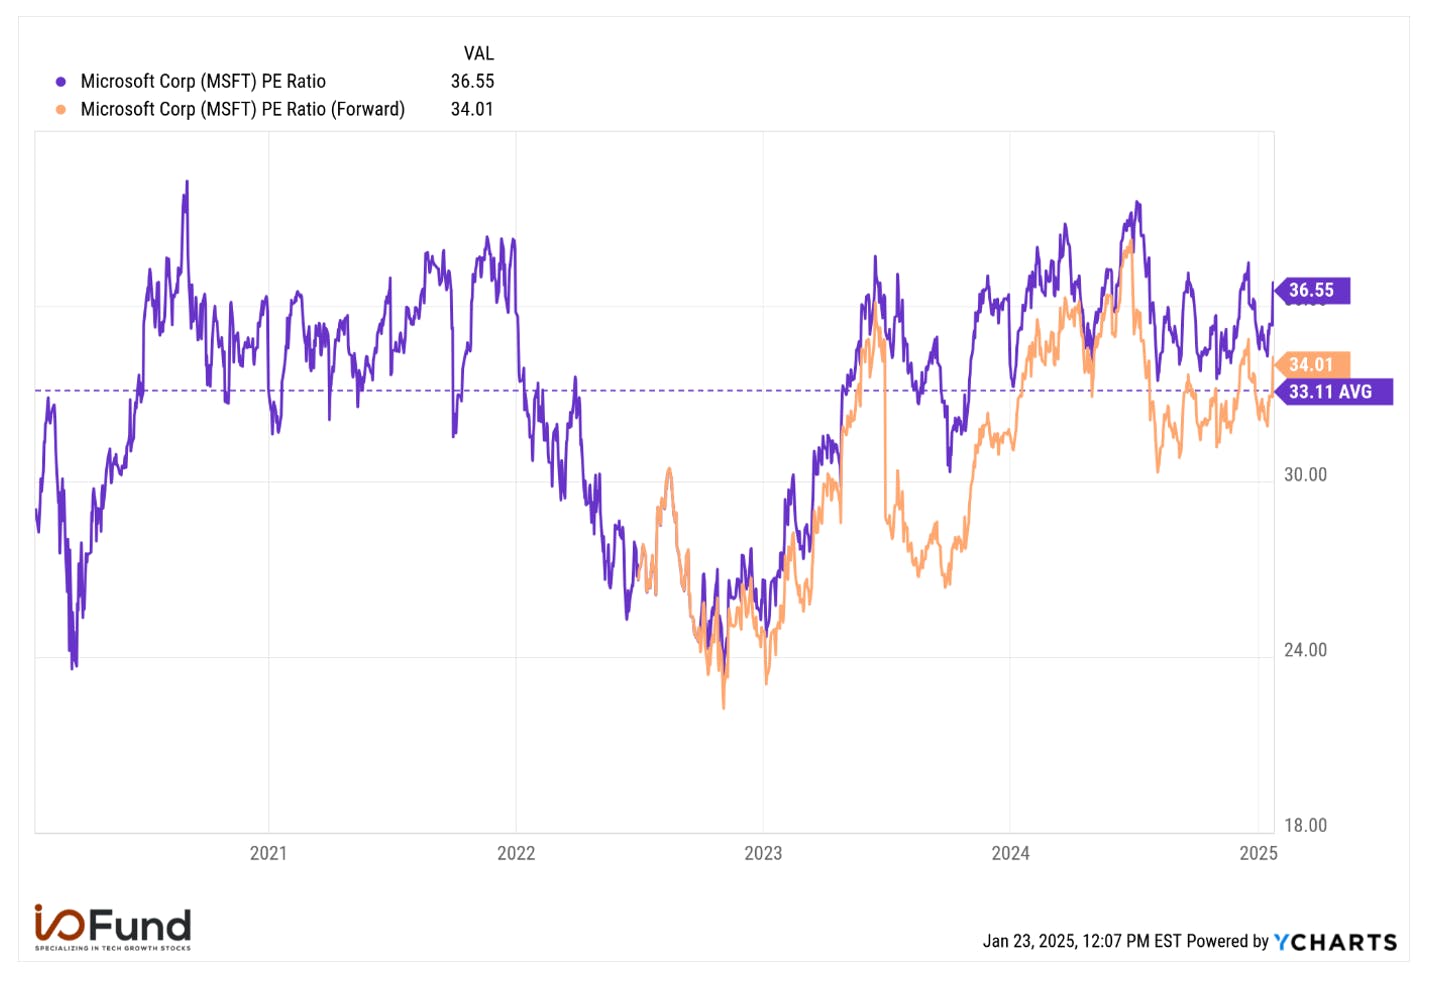
The company is trading at a P/E ratio of 34.3 and a forward P/E ratio of 32, higher than the 5-year average P/E ratio of 33.1. It is trading at a P/S ratio of 12.2 and a forward P/S ratio of 11.1.

Analysts Notes

Morgan Stanley analyst Keith Weiss lowered the firm's price target on Microsoft to $530 from $540 and keeps an Overweight rating on the shares. Commercial bookings growth of 75% year-over-year in constant currency accelerated well beyond expectations, though Azure growth of 31% in constant currency in Q2 came in 1% point below expectations, the analyst tells investors. While Azure was disappointing, strength in the GenAI ramp and moderating capex growth should support accelerating FY26 free cash flow growth, the analyst added.

UBS lowered the firm's price target on the company to $510 from $525 and keeps a Buy rating on the shares. Microsoft's quarter was weaker than expected, with the company pulling its guidance for a second half Azure acceleration, citing sales execution, the analyst tells investors in a research note. While the improvement in the fiscal 2025 margin guidance as well as the guide for capex growth to moderate in fiscal 2026 will help, three straight quarters of an Azure disappointment with a different explanation each time undermines confidence in the growth outlook, the firm argues.

Mizuho lowered the firm's price target on Microsoft to $500 from $510 and keeps an Outperform rating on the shares. The company reported a decent fiscal Q2 but Azure revenue growth of 31% year-over-year was at the low end of management' guided range as Microsoft' non-artificial intelligence go-to-market execution was subpar, the analyst tells investors in a research note. Meanwhile, the company's Q3 revenue guidance was below Street expectations due to a $1B currency headwind, adds Mizuho. Despite the disappointment, the firm remains confident that Microsoft's revenue growth opportunities over the medium-term and beyond are greater than many realize.

Conclusion

Microsoft beat the top-line and bottom-line consensus estimates. However, the revenue guidance fell short of estimates. The margins have improved this quarter and the company has controlled costs well despite increasing AI investments. The key hurdle for the company in the coming quarters is to resolve the supply constraints and the challenges in the go-to-market execution.

Over the coming months to year, we are looking for an entry into Microsoft as we ultimately foresee Azure accelerating from AI. For now, the market is discounting the stock on the high capex spend and relatively low ROI from AI, perhaps affording a lower entry for this cloud and AI juggernaut

Royston Roche, Equity Analyst at the I/O Fund, contributed to this article.

Please note: The I/O Fund conducts research and draws conclusions for the Fund’s positions. We then share that information with our readers. This is not a guarantee of a stock’s performance. Please consult your personal financial advisor before buying any stock in the companies mentioned in this analysis.

Recommended Reading:
DeepSeek Creates Buying Opportunity for Nvidia Stock

DeepSeek caused a deep rout in AI stocks earlier this week with Nvidia erasing more than $600 billion in value; the biggest one-day loss of any company in history. The R&D company out of China stated the model cost $6 million to train, which sent the market into a panic as this is pennies to the dollar compared to what Big Tech is spending. The jerk-reaction readthrough was that, in the blink of an eye, DeepSeek had fundamentally rewritten the AI capex story. 

The battle between the United States and China on large language models (LLMs) following DeepSeek’s challenge to OpenAI has been called AI’s Sputnik moment. The most important takeaway for investors about this analogy is that Sputnik spurred massive investments. It was not the final destination, rather, it was the beginning of a multi-decade space race. The Sputnik satellite cost $15 to $20 million or $33 million with cost-adjusted inflation, yet the United States would spend an estimated $1 trillion over a sixty year period in response.

The United States takes it quite seriously to stay in the lead, and AI will spur an arms race unlike anything the world has seen before. Consider that it took sixty years for the government to spend $1 trillion (inflation adjusted) on the space race, yet in one sweeping piece of legislation, the United States will spend $500 billion in 5 years on AI infrastructure, up from $70 billion being spent in 2024 alone.

Remember, it was the market’s so-called “efficiency” that caused Nvidia’s stock to drop 60% from a gaming-related miss following rumors that Ethereum’s merge to Proof-of-Stake (PoS) would be the death knell for the stock. This was the very moment the powerful AI GPUs called Hopper were shipping, equipped with a Transformer Engine that would enable self-learning models, and change the world as we know it.

Tech is defined by disruption, by thousands of product announcements, and by leagues of competitors. It can be a noisy and costly sector when investors get whiplashed by the news of the day. My firm has an enviable track record on Nvidia – including speaking out during staggering selloffs or supply chain rumors. This includes also telling you when we are not buying, or when a stock is frothy, such as when Nvidia was trading in the $140s. We also go to great lengths to tell you when we plan to buy again. You will find dozens (perhaps hundreds) of articles on DeepSeek at this point; yet you will be hard pressed to find one other person helping investors navigate Nvidia’s stock at this granular level.

Below, I provide evidence that DeepSeek is notnot the black swan that killed Nvidia overnight – in fact, driving down the costs of AI development has always been the plan — and will ultimately boost Nvidia’s sales in the long run as AI will leave the data center, and move on-premise for enterprises and on-device for consumers.

I also touch base on what investors should keep an eye on price-wiseprice-wise moving forward for the GPU juggernaut.

DeepSeek’s DualPipe Algorithm

DeepSeek’s DualPipe Algorithm optimized pipeline parallelism, which essentially reduces inefficiencies in how GPU nodes communicate and how mixture of experts (MoE) is leveraged. MoE refers to distributing a computational load across “multiple experts” (or neural networks) to train across thousands of GPUs using what is called model and pipeline parallelism. This enables more compute-efficient training yet the parameters still need to be loaded in VRAM, so the memory requirements remain high.

Tom’s Hardware wrote an article about this a month ago, with an usually prescient title: “Chinese AI company says breakthroughs enabled creating a leading-edge AI model with 11X less compute — DeepSeek's optimizations could highlight limits of US sanctions.” The article stated: “The DualPipe algorithm minimized training bottlenecks, particularly for the cross-node expert parallelism required by the MoE architecture, and this optimization allowed the cluster to process 14.8 trillion tokens during pre-training with near-zero communication overhead.”

By allowing the routing of tokens to experts and the aggregation of results to be handled in parallel through code called PTX (Parallel Thread Execution), DualPipe helped to drive down costs. The software essentially optimized the hardware. The company also created a 4-node maximum to limit nodes and reduce traffic, allowing for a more efficient communication framework.

MoE models like DeepSeek’s can provide numerous benefits, and this is what DeepSeek is showing – an ability to train larger models at a lower cost with much faster pre-training, faster inference, and an ability to deliver decreased first-token latency. However, MoE also can require higher VRAM to store all experts simultaneously and can face challenges in fine-tuning.

Mixed Point Precision and Multi-Head Latent Attention Lowers Memory Usage

DeepSeek’s success is also found in lowering memory usage with multi-head latent attention that lowered memory usage to 5% to 13%. MLA ultimately reduces memory requirements during inference by processing long sequences of text. As pointed out by ML Engineer Zain ul Abideen, “MLA achieves superior performance than MHA, as well as significantly reduces KV-cache boosting inference efficiency.”

It has been estimated that HBM3e’s component costs in Hopper GPUs could be as much as 25% higher than HBM3-equipped GPUs, and it’s expected HBM4 will add more costs due to the complexities of delivering faster data rates. 

Memory is an expensive component and Hopper is known for its limited memory capacity at 80GB of HBM3e memory versus Blackwell’s 192GB of HBM3e (nearly 2.5X the memory in the upcoming release). Therefore, reducing memory usage is one path to optimizing Hopper GPUs.

DeepSeek’s success also stemmed from its pioneering approach to model architecture. The company introduced a novel MLA (multi-head latent attention) method that lowers memory usage to just 5%–13% of what the more common MHA architecture consumes. 

Nvidia’s hardware excellence stands out in the Hopper generation of GPUs with the Transformer Engine. Two years ago, Hopper’s transformer engine brought about Chat-GPT’s big moment as the OpenAI model eliminated the need to find patterns between elements mathematically, and this opens up which datasets can be used and how quickly.

The H100s also leverage the transformer engine for mixed precision, such as FP8, FP16 or FP32, depending on the workload. Nvidia architected the ability to switch between floating precision points in order to require less memory usage. Here is what Nvidia states:

“There are numerous benefits to using numerical formats with lower precision than 32-bit floating point. First, they require less memory, enabling the training and deployment of larger neural networks. Second, they require less memory bandwidth which speeds up data transfer operations. Third, math operations run much faster in reduced precision, especially on GPUs with Tensor Core support for that precision. Mixed precision training achieves all these benefits while ensuring that no task-specific accuracy is lost compared to full precision training. It does so by identifying the steps that require full precision and using 32-bit floating point for only those steps while using 16-bit floating point everywhere else.”

DeepSeek says that FP8 allowed it to “achieve both accelerated training and reduced GPU memory usage,” as it validated FP8’s usage for training large scale models for a fraction of the cost.  A majority of the “most compute-density operations are conducted in FP8, while a few key operations are strategically maintained in their original data formats,” such as those that require higher precision due to sensitivity reasons.

Though lower-precision training has often been “limited by the presence of outliers in activations, weights, and gradients,” and tests have shown that FP8 training was prone to higher instability and more frequent loss spikes, it is now emerging as a solution for efficient training due to hardware advancements (i.e., Hopper bringing powerful FP8 support, Blackwell bringing FP4).

DeepSeek also provided recommendations for future chips to accommodate low-precision training and replicate this at scale, suggesting chip designs should “increase accumulation precision in Tensor Cores to support full-precision accumulation, or select an appropriate accumulation bit-width according to the accuracy requirements of training and inference algorithms.”

This is what Blackwell was designed to address, with new precisions in Tensor Cores, FP4 precision, increased SM count, and more CUDA cores versus the Hopper. Blackwell also packs 208 billion transistors to provide up to 20 petaflops of FP4, compared to the H100’s 4 petaflops of FP8. The B200 features a second-generation transformer engine supporting 4-bit floating point (FP4), with the goal of doubling the performance and size of models the memory can support while maintaining accuracy.

To simply recreate DeepSeek’s training efficiencies and develop large-scale models, Hopper GPUs are a requirement due to support for FP8, with Blackwell bringing FP4 to power real-time inference and supercharged training for trillion parameter models.

Understanding the nuances of Nvidia’s hardware is the reason that I first called out Nvidia’s AI GPU thesis and CUDA moat in late 2018, and in 2019, Volta’s AI capabilities prompted me to say on my premium stock research site: “I believe Nvidia will be one of the world’s most valuable companies by 2030.” This has led to potential gains of over 4,000% for our free readers.AI GPU thesis and CUDA moat in late 2018, and in 2019, Volta’s AI capabilities prompted me to say on my premium stock research site: “I believe Nvidia will be one of the world’s most valuable companies by 2030.” This has led to potential gains of over 4,000% for our free readers.

Blackwell is Not Hopper

This may seem like a moment where AI software is triumphant, yet we are at the end of the Hopper generation with the H100s (and the more restricted H800) GPUs being available for two years now. Two years is eternity in the AI arms race, and the fact Hopper is reaching a point of peak optimization at the very moment that Blackwell is shipping is not a shocking new revelation — rather, it’s the point of keeping a fast-paced product road map. Per Nvidia’s Computex keynote, from Pascal to Blackwell, their AI systems will deliver “1,000 times increase in AI compute,” while simultaneously decreasing the “energy per token by 45,000X.

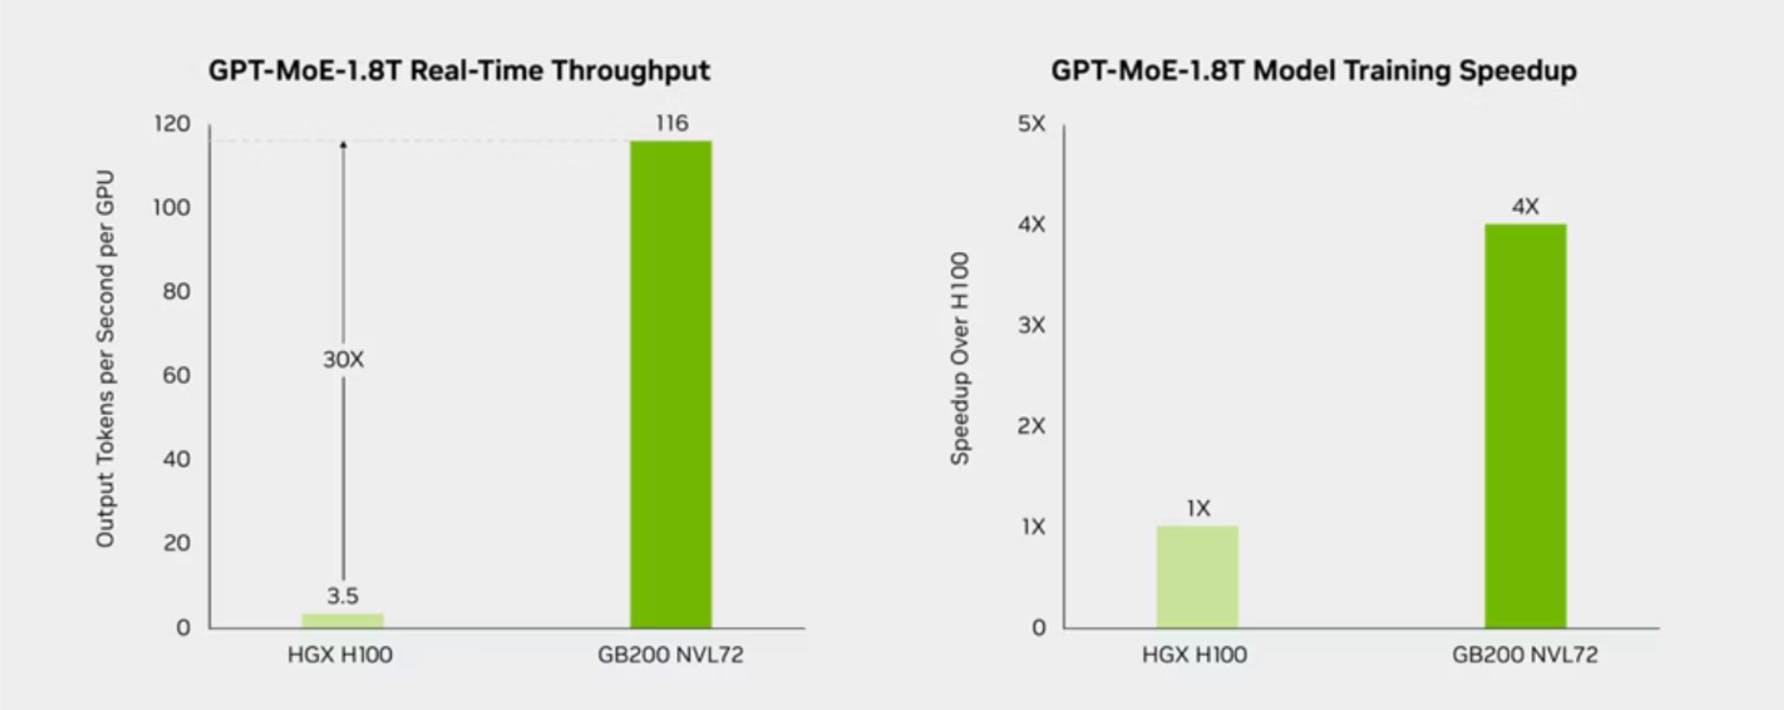
Therefore, the market is a bit confused to think the 11X increase in compute from software optimizations is going to catch Nvidia off guard. Below are the stated differences between the H100 and GB200 NVL72 systems on Mixture of Experts (MoE) real-time throughput and training speeds.

Nvidia H100 vs. GB200 NVL72 comparison on MoE inference throughput and training speeds, based on Nvidia’s 1,000X AI compute increase claim

DeepSeek acquiesced the limitations they faced in deploying the model is “expected to be naturally addressed with the development of more advanced hardware.” Note, they are not saying with the development of more advanced software.

I made the point nearly a year ago that Nvidia is competing with Nvidia with its one-year product release road map stating: “The product road map is the single most important thing investors should be focused on. A good chunk of the AI accelerator story is understood at this point. What is not understood is how aggressive Nvidia is becoming by speeding up to a one-year release cycle for its next generation of GPUs instead of a two-year release cycleThe product road map is the single most important thing investors should be focused on. A good chunk of the AI accelerator story is understood at this point. What is not understood is how aggressive Nvidia is becoming by speeding up to a one-year release cycle for its next generation of GPUs instead of a two-year release cycle."

In addition, by open sourcing the model, there will be more developers who can build new AI capabilities. As stated in a Predibase analysis, there were 500 derivative models of DeepSeek created in a few days’ time.

Nvidia has been early to this eventual outcome with the launch of Project Digits, a $3,000 supercomputer that can run 200B-parameter models. By releasing powerful personal computers, Nvidia seeks the proliferation of its GPUs – much like Apple’s iPhone — whereas companies like OpenAI are the ones most challenged by an open source LLM that drives down input token and output token costs that are 27X less expensive than OpenAI’s o1 model.

Blackwell Inches United States Toward General Artificial Intelligence (AGI)

The reason that software has not officially begun to commoditize hardware, and we could be as far as 5-10 years away from this moment, is because AI development is incredibly nascent. Blackwell and future generations of GPUs are a necessity for AI development to inch closer to the start of general artificial intelligence (AGI).

There have been discussions questioning if it is possible to reach AGI with reinforcement learning: “artificial general intelligence can be achieved if an agent tries to maximize a reward in a complex environment because the complexity of the environment will force the agent to learn complex abilities like; social intelligence, language, etc.”

Reinforcement learning is an ML method where an agent or model learns to make decisions through interactions in its environment, via rewards or punishments. Agents will interact with the environment, receive a positive or negative reward, and adjust its decisions/actions based on the feedback it has received.

AGI refers to the creation of a machine that is capable of performing intellectual tasks on par with humans, and have the ability to understand, learn and apply knowledge to a wide range of domains. Both RL and AGI involve learning from interactions with the environment, though RL is typically more focused on specific tasks or environments where AGI aims to be ‘all-encompassing.’

If software efficiencies from China are relatable to Sputnik, then the arrival of AGI will be the moment we land on the moon. AGI requires an order of magnitude larger models – minimum 1 trillion, up to 10 trillion or more. Reinforcement learning is certainly a step in the right direction, yet trillion+ parameter models are inevitable – and it’ll require Nvidia and other AI accelerator design companies to get there.

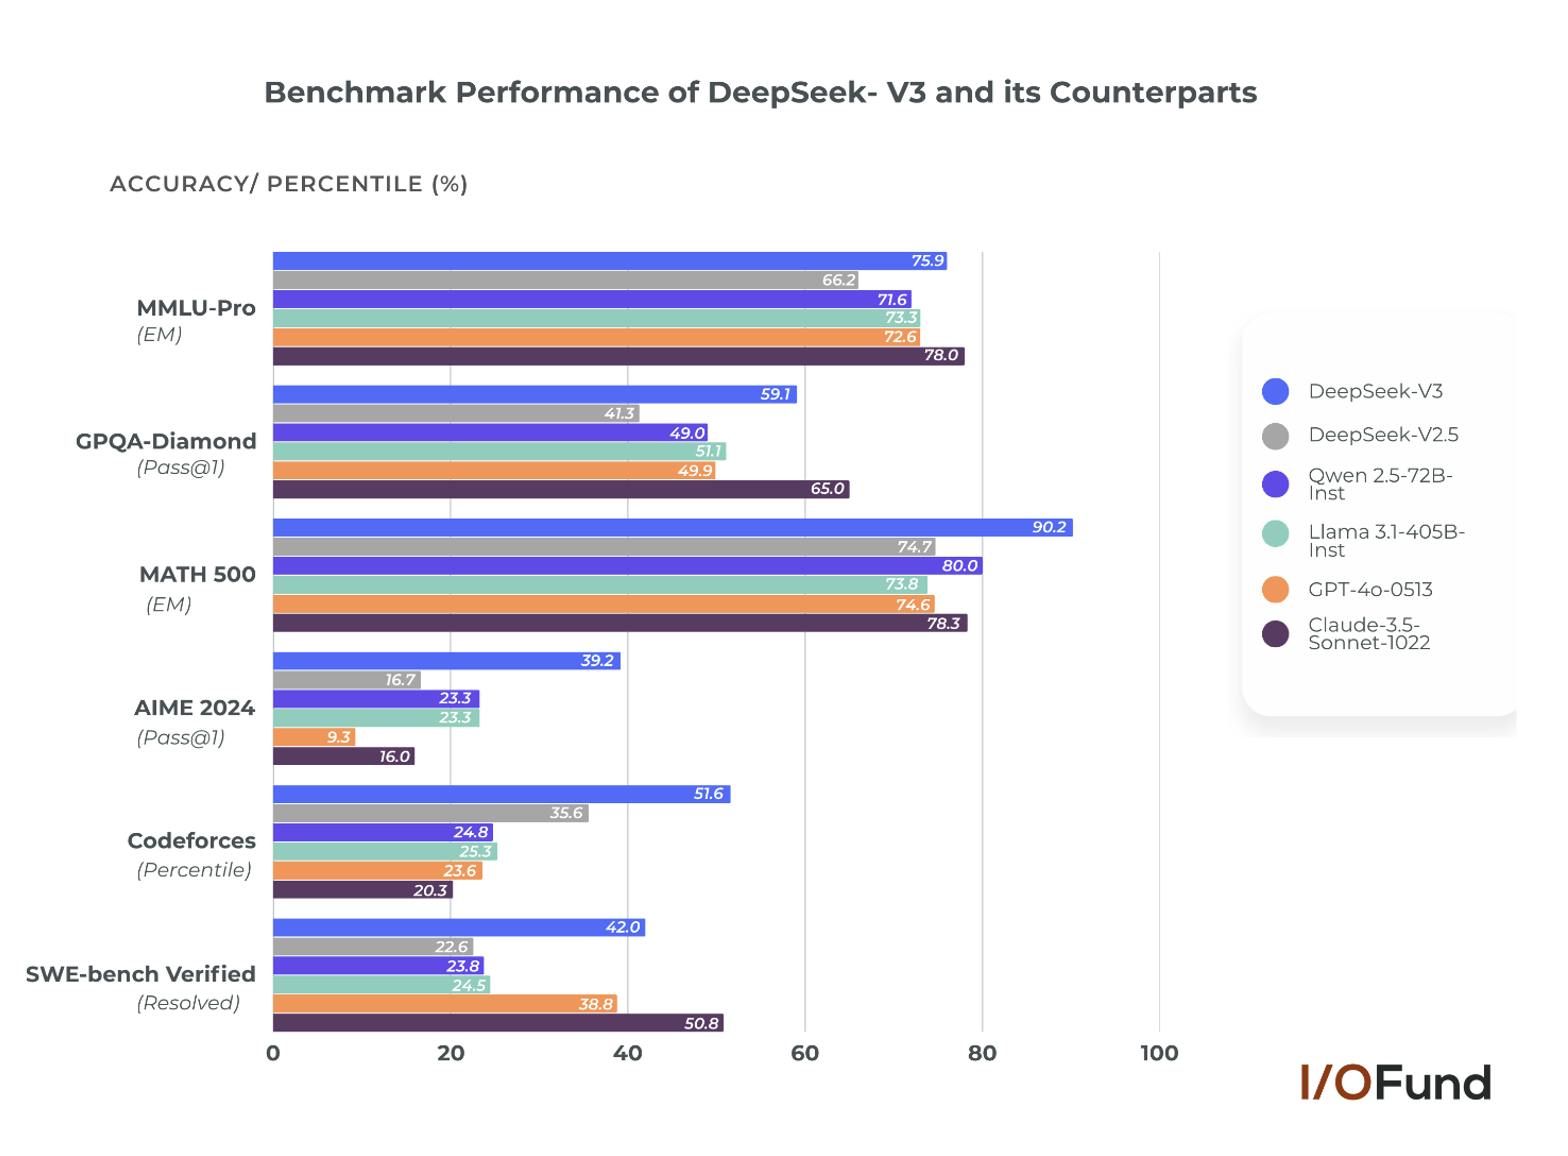
A benchmark performance comparison of DeepSeek V3 and its counterparts, including GPT-4o, Claude 3.5, and LLaMA 3, across reasoning, mathematics, and coding tasks.

Source: DeepSeek R-1 Pictured Above: Nvidia Stock saw its market cap shed $600 billion in one day  following DeepSeek’s release with benchmarks surpassing OpenAI on its performance and reasoning abilities. DeepSeek R-1 Pictured Above: Nvidia Stock saw its market cap shed $600 billion in one day  following DeepSeek’s release with benchmarks surpassing OpenAI on its performance and reasoning abilities. 

DeepSeek is Cheap … Or is it?

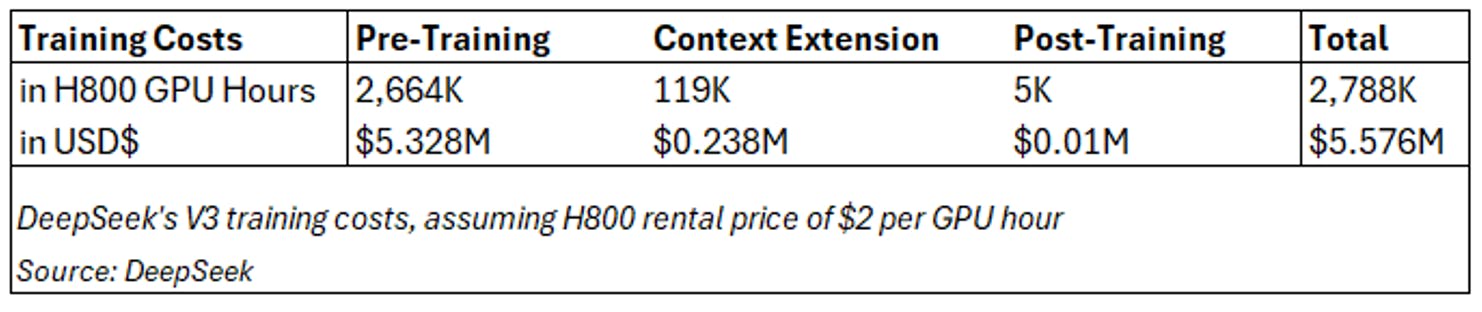
DeepSeek has stated V3 was trained on 14.8 trillion tokens in pre-training, with each 1 trillion tokens taking 180K H800 GPU hours (3.7 days) on its 2,048 H800 cluster. Compare this to Meta’s 405 billion parameter Llama 3.1 model, which was trained in 54 days (30.8M GPU hours) on a 16,384 H100 GPU cluster, estimated to cost ~$80 million at a $2.6/hour rental price.

This accounted for a majority of the costs at $5.328 million, assuming a $2/hour rental price for the H800s (this is about in-line with long-term contract rates at Lambda for the H100, but ~20% lower than short-term costs from other startup cloud providers).

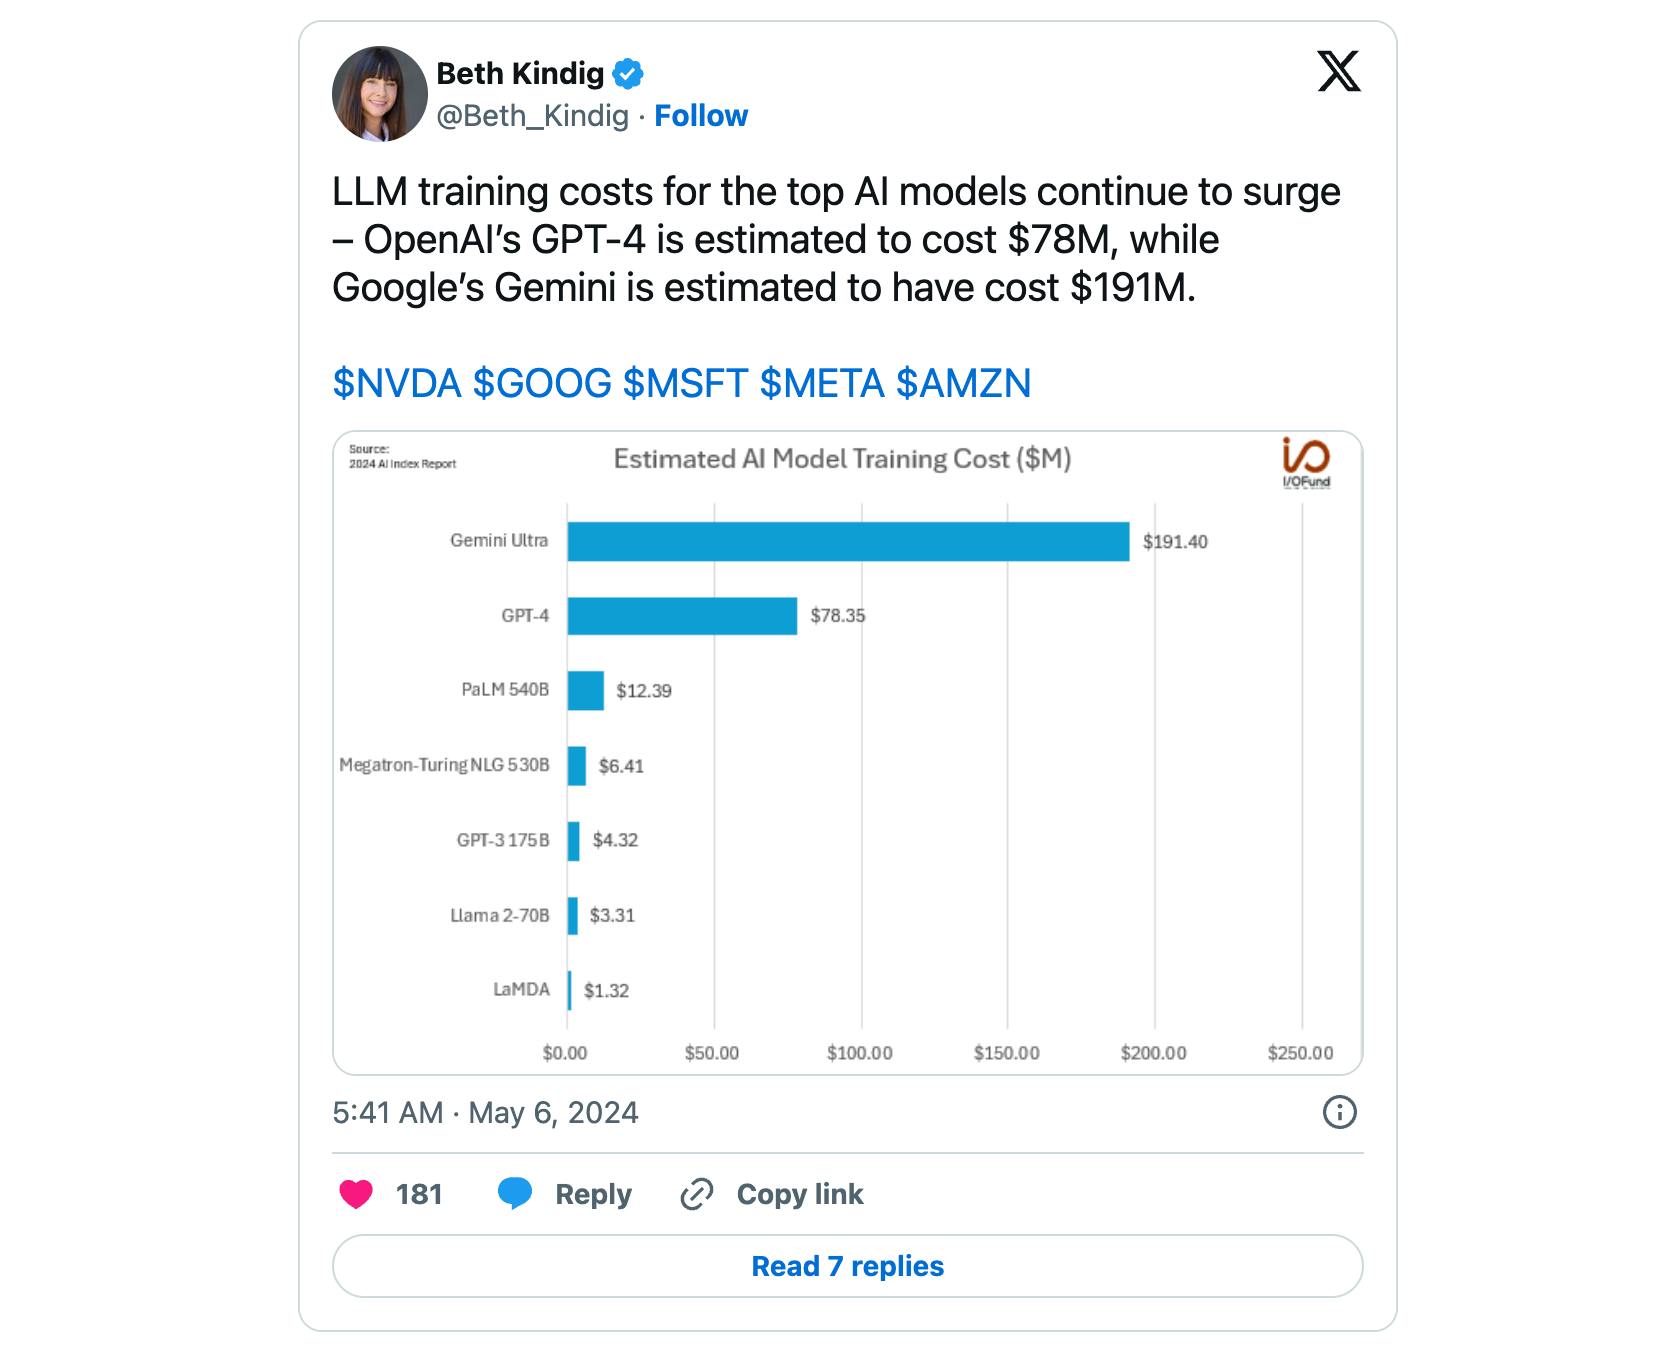
The estimated $6 million cost for DeepSeek would also be pennies on the dollar compared to estimated training costs for OpenAI’s GPT-4 and Alphabet’s Gemini Ultra.

Beth Kindig’s tweet on rising LLM training costs, estimating OpenAI’s GPT-4 at $78M and Google’s Gemini at $191M.
A cost comparison of DeepSeek V3 training vs. LLaMA 3.1, GPT-4, and Gemini Ultra, highlighting efficiency in GPU hours, token training, and total expenses.

Source: DeepSeek

While the training costs were estimated utilizing rental prices (and up for debate), what’s important to note is that the $5.6 million cost only excluded “costs associated with prior research and ablation experiments on architectures, algorithms, or data.”

Democratization of AI Helps Nvidia

Nvidia’s goal is to not only sell GPUs to the fortresses of Big Tech. Rather, all tech companies seek large addressable markets and the democratization of AI will assist Nvidia in reaching worldwide AI device ubiquity.

In the meantime, Blackwell is sold out. Microsoft stated this week that they are still supply constrained in the cloud, and Azure needs more supply to grow. Meta doubled down on its planned capex for 2025, and signaled a willingness to spend “hundreds of billions” towards AI infrastructure in the long run.

In the medium term, Nvidia will allocate supply to enterprises and edge AI, as lower costs will facilitate enterprise AI and edge computing. The market grew concerned that there would not be ROI on these large AI investments, and on the other hand, the market now is panicking when costs are lowered to the point where ROI can be achieved.

This has always been Nvidia’s goal, with CEO Jensen Huang and other executives declaring at high profile stages such as CES and GTC that the cost of computing will go down with each generation of GPUs. At GTC 2024, Huang explained that Nvidia “accelerated algorithms so quickly that the marginal cost of computing has declined so tremendously over the last decade that it enabled generative AI to emerge. He further explained that reducing the cost of computing and accelerating computing is what Nvidia “does for a living at its core,” and that the “pricing that we create always starts from TCO.”

Nvidia VP Ian Buck corroborated this at BofA GTC Conference in June 2024: “The opportunity here is to help [customers] get the maximum performance through a fixed megawatt data center and at the best possible cost and optimized for cost.”

Sign up for I/O Fund's free newsletter with gains of up to 2600% because of Nvidia's epic run – Click hereSign up for I/O Fund's free newsletter with gains of up to 2600% because of Nvidia's epic run – Click hereClick here

What to Monitor for Nvidia’s Earnings Report

There seems to be no end to the amount of Blackwell supply rumors with yet another one circulated in January 2025. According to Taiwan Semiconductor’s management team, “cut the order, that won’t happen. Actually [it will] continue to increase.”

Here are the additional points that cause us to believe Blackwell revenue will show up soon enough:

1) Nvidia CEO Jensen Huang at CES reconfirmed that Blackwell is in full production, adding that “every single cloud service provider now has systems up and running."

2) CFO Colette Kress in Q3’s earnings: “Blackwell demand is staggering and we are racing to scale supply to meet the incredible demand customers are placing on us. Customers are gearing up to deploy Blackwell at scale.”

3) CFO Colette Kress in Q3: “While demand is greatly exceeding supply, we are on track to exceed our previous Blackwell revenue estimate of several billion dollars as our visibility into supply continues to increase.”

4) CFO Colette Kress at UBS’ Global Technology Conference: “What we see in terms of our Blackwell, which will be here this quarter is also probably a supply constraint that is going to take us well into our next fiscal year for several quarters from now. So, no, we don't see a slowdown. We continue to see tremendous demand and interest, particularly for our new architecture that's coming out.” UBS Analyst Tim Arcuri added, “you are actually shipping more Blackwell than you thought you would three months ago.”

5) CFO Colette Kress at CES: “We are able to increase our demand and increase our revenue each quarter as well. … When we think about the demand that is in front of us, it is absolutely a growth year.”

Big Tech’s Capex

Two weeks ago, my firm covered how Big Tech capex (AI spending) came in significantly above expectations in 2024, and is on track to repeat that in 2025. To recap, analysts had initially estimated capex of ~$200 billion for Big Tech in 2024, an increase of ~30% YoY. However, our latest checks suggest that Big Tech is on track to spend at least $236 billion in capex in 2024, 18% higher than analyst estimates and representing YoY growth of more than 52%.

For 2025, Big Tech is on track to spend $300 billion or more on capex, based on initial commitments from Microsoft and Meta totaling at least $140 billion combined. This is already tracking ~7% higher than ~$280 billion estimated by analysts, with Microsoft’s $80 billion commitment 40% higher than estimated and Meta’s $60-65 billion more than 18% higher than estimated.

DeepSeek has highlighted one major tailwind that has been overlooked – if AI models can now be trained quicker and cheaper, it’s likely to catalyze demand for GPU instances in the cloud from leading providers, as GPUs can be rented much faster than setting up new infrastructure. In order to meet elevated demand, hyperscalers will need to continue purchasing, or even accelerate purchasing, Nvidia’s GPUs in order to prevent chip constraints from impeding revenue growth.

Analyst Revisions for Nvidia’s Stock Remain Unchanged

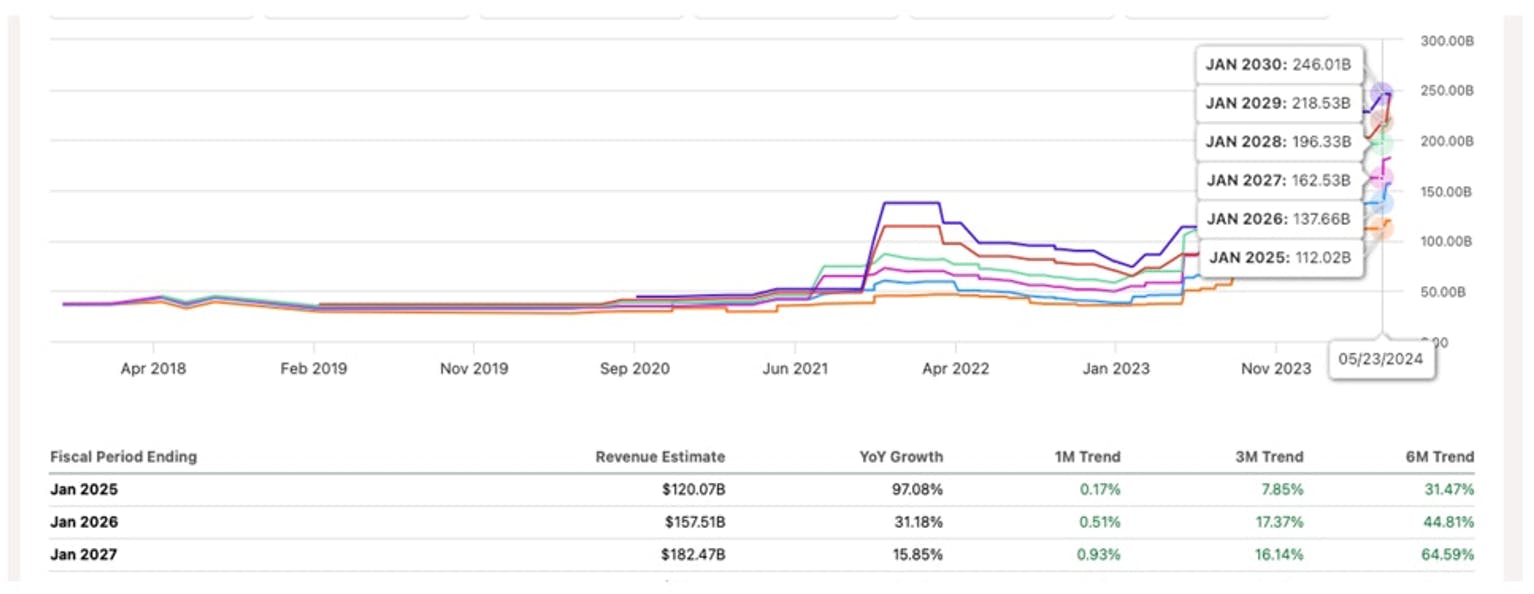
In June 2024, in the analysis Here's Why Nvidia Stock Will Reach $10 Trillion Market Cap By 2030, I discussed the importance of intra-quarter analyst revisions supporting Nvidia’s massive run, as data center revenue continued to blow past expectations.

Seen below, Nvidia’s revenue for FY25 was estimated at $120 billion in June, being revised 31.5% higher over the six months prior. In dollar terms, that represented a nearly $29 billion increase from $91.3 billion. For FY26, revenue was estimated at $157.5 billion in June, a 44.8% increase from $108.8 billion, a nearly $50 billion increase in six months.

Analyst revisions for Nvidia stock remain unchanged, with FY25 revenue estimates rising 31.5% and FY26 increasing 44.8%, reflecting strong data center growth.

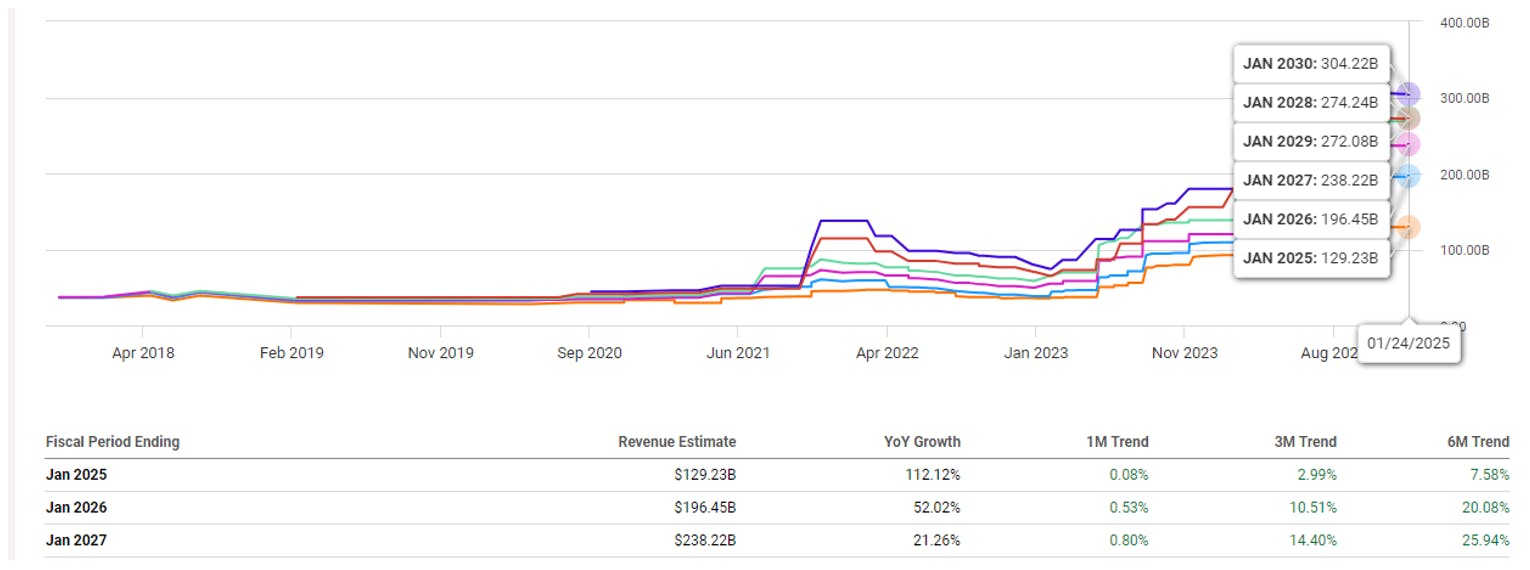
Compare that to today:

Nvidia’s FY25 revenue revised up by 7.6% to $129.2 billion, with FY26 showing a 20% increase to $196.5 billion, reflecting strong growth with no intra-quarter revenue hiccups.

FY25 revisions are up just 7.6% (or $9 billion) since July to $129.2 billion as the fiscal year comes to a close, but FY26 revenue is 20% higher to $196.5 billion. That’s another $39.5 billion (or over a full quarter at the current run rate) that has been added in the past seven months.

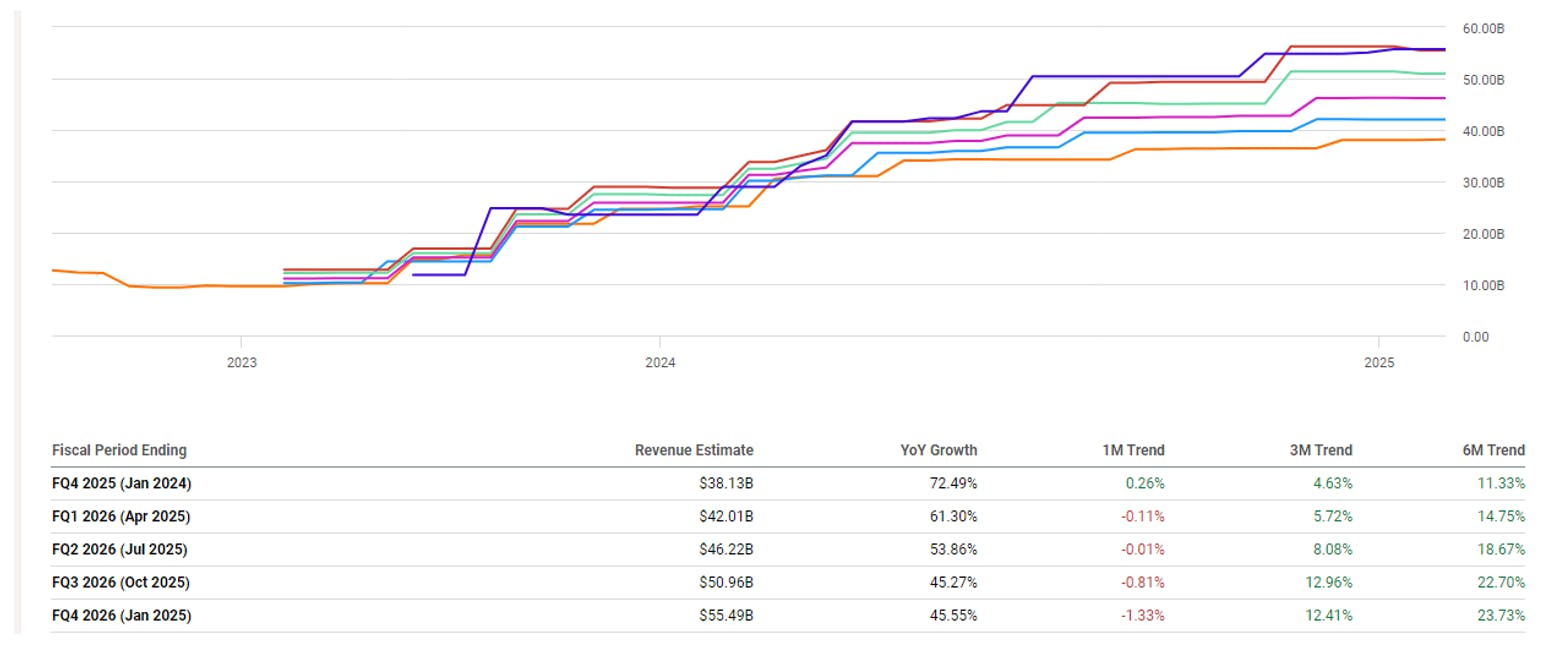
Nvidia FY26 Q4 revenue revised down slightly by 1.3% amidst Blackwell rumors, with a marginal increase in Q4 FY26 estimates due to DeepSeek V3 release, still showing significant growth.

Opinions aside, intra-quarter revisions will be where you will first see any material hiccups or impacts on revenue. FY26 quarterly revisions have come down slightly over the past month, at -1.3% lower for Q4. So far, there has been no impact from DeepSeek’s V3 release – in fact, estimates inched marginally higher on January 28, with Q4 FY26 revenue rising from $55.49 billion to $55.51 billion.

The bigger picture – revenue is still 14% to 24% higher than it was six months ago. At this scale, that’s $6 to $10-billion-plus higher.

Where Nvidia’s Stock Price Goes Next

Let’s talk price targets.

In the write-up “Where I Plan to Buy Nvidia Stock Next” we stated that Nvidia still needs, at least, one more push higher to complete the current uptrend. This would make the volatility that started in June of 2024 a correction within a larger uptrend.

We still believe that NVDA’s uptrend is not over. We stand by the two scenarios outlined in the last report; both are still in play.

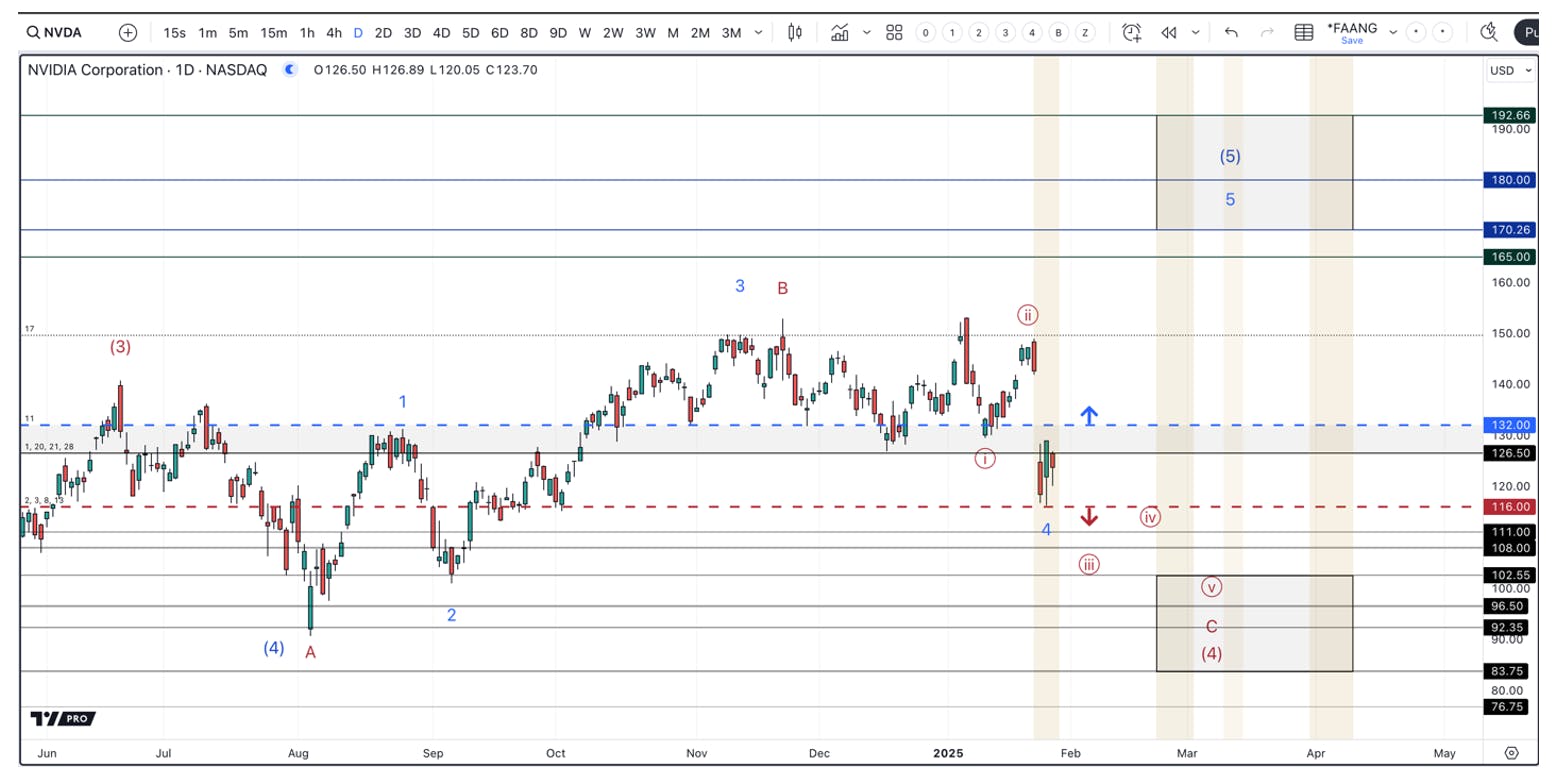
Blue – The final 5th wave is playing out as an ending diagonal pattern, which is common for 5th waves. This type of pattern is a 5 wave pattern in itself that is characterized with large swings in both directions. Our target zone for the bottom on this 4th wave is $126 – $116. If Nvidia can push over $140.75, then then odds favor this scenario.

Red – Nvidia is in a much more complex 4th wave. If this is playing out, NVDA would see the $116 level break, which opens the door to a potential low at $101, $90, or $78.”

Nvidia stock analysis with key target levels ($116, $132) and two potential scenarios for future price movement, outlining buying strategies and risk factors.

While the $116 support level still holds from our last analysis, the resistance worth monitoring is now $132. If Nvidia can breakout over the $132 resistance, it will shift the odds to the more immediately bullish count in blue. This would see a push into the $170 – $190 region over the coming months.

On the other hand, if Nvidia breaks below the $116 support level, it will signal that the more immediately bearish count in red is playing out. This would see us make a meaningful low in the $102 – $83 range over the coming months.

We began executing on our current buy plan, which is to layer into Nvidia at key levels. The $126 – $116 region was our first target. If the $116 region breaks, we will then target the $102 – $83 region to complete our buying. Considering the blue count is looking for a final 5th wave higher, we will likely not chase a breakout over $132.

Conclusion

If DeepSeek’s breakthroughs are truly the key to ushering in a new paradigm of AI training and ultimately AI democratization from cost reductions, it will not be a death sentence for Nvidia; in fact, quite the opposite.

This is Jevons paradox — where the technological advancements of Hopper and Blackwell will translate into significant efficiency gains and cost reductions for AI training, that then will drive near-ubiquity for AI services — and thus increase demand for GPUs in the data center, on-premise for enterprises and also on edge devices.

The market’s readthrough is that Big Tech has now been overspending on AI. However, The I/O Fund believes this readthrough is wrong; it’s not that the United States is overspending, it’s that we will accelerate spending to stay ahead. The I/O Fund recently entered five new small and mid-cap positions that we believe will be beneficiaries of this AI spending war. We discuss entries, exits and what to expect from the broad market every Thursday at 4:30 p.m. in our 1-hour webinar. Learn more here.

Please note: The I/O Fund conducts research and draws conclusions for the company’s portfolio. We then share that information with our readers and offer real-time trade notifications. This is not a guarantee of a stock’s performance and it is not financial advice. Please consult your personal financial advisor before buying any stock in the companies mentioned in this analysis. Beth Kindig and the I/O Fund own shares in NVDA at the time of writing and may own stocks pictured in the charts.

Recommended Reading:

Microsoft FQ2 Earnings Preview: Growth acceleration from AI expected in the 2H 2025

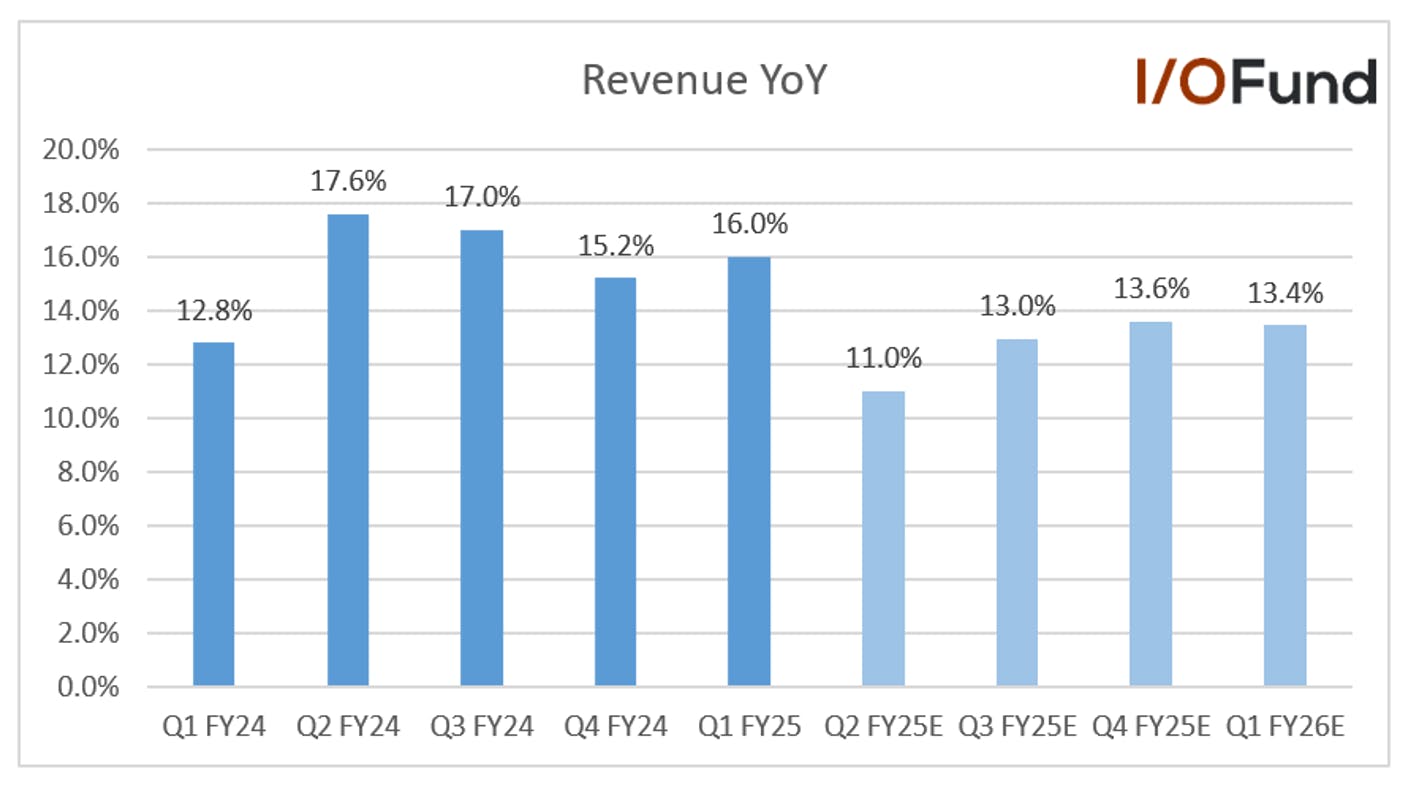
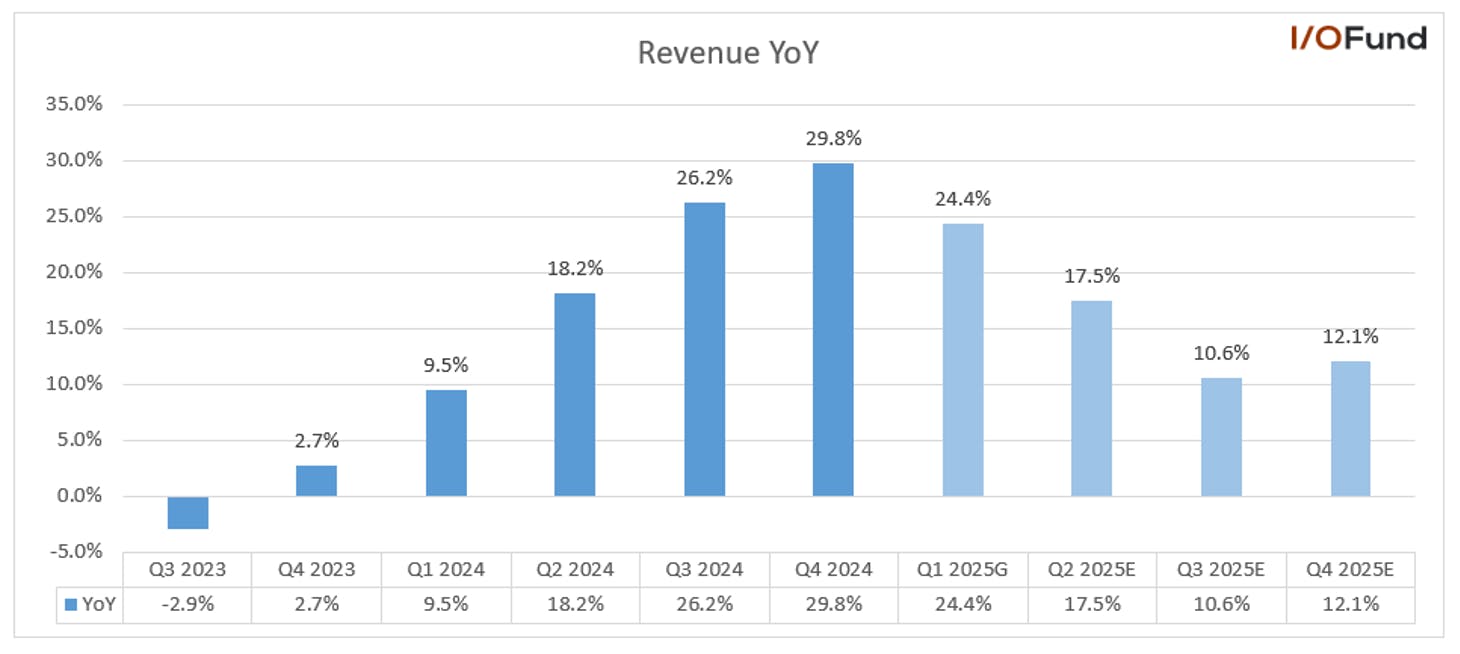
Microsoft will release its Q2 FY2025 (Dec Q) results on Jan 29th. Analysts expect FQ2 revenue to grow 11% YoY to $68.8 billion and EPS to grow 6.3% YoY to $3.12. Revenue is expected to accelerate to 13% growth in FQ3 and 13.6% in FQ4.

The December quarter (fiscal Q2) is expected to be a challenging quarter for Microsoft, as it battles weaker momentum in gaming, device sales, 365 Commercial products and a slight hiccup for Azure’s growth. Wells Fargo analyst Michael Turrin expects balanced December quarter results with continued growth in Microsoft Cloud revenue and bookings due to continued consolidation across software, the company’s leading position in AI (especially Azure AI), and a year-end budget flush.

Morgan Stanley analyst Keith Weiss said that the recent CIO survey suggests that Microsoft will maintain its lead as the number one share gainer of IT wallet due to a shift to the cloud on both a one-year and three-year view. Microsoft Azure was the preferred vendor for CIOs in the AlphaWise survey, handling about 54% of overall workloads and about 41% expected to keep Azure Open AI for the next twelve months.

The company also recently announced plans to invest approximately $80 billion in AI-enabled data centers in FY2025, a significant increase from the $55.7 billion capex in FY2024. Investors will look for clarity during the earnings call on the timeline for the returns on these long-term investments.

Revenue

Management provided a soft FQ2 guide of $68.1 billion to $69.1 billion, representing YoY growth of 10.6% at the midpoint. While acknowledging temporary supply chain constraints, particularly delays in data center infrastructure deliveries, management expects these issues to be resolved in the second half of the fiscal year. This resolution and increased AI capacity resulting from prior investments are anticipated to drive Azure and overall revenue acceleration in the second half of the fiscal year.

  • FQ1 revenue grew by 16% YoY to $65.6 billion, driven by continued strong business gains.
  • Analysts expect FQ2 revenue to grow 11% YoY to $68.8 billion. Revenue is expected to accelerate to 13% YoY growth to $69.9 billion in FQ3 and 13.6% to $73.5 billion in FQ4.
  • Looking further out, analysts expect revenue to grow 13.7% YoY to $278.6 billion for the FY2025 ending June. Revenue is expected to accelerate to 14.4% growth in FY2026 and 15.3% YoY growth in FY2027.

Segment Revenue

The company's Productivity and Business Processes segment delivered stronger-than-expected results in the FQ1. However, the Personal Computing segment encountered challenges due to weaker consumer demand. Revenue within the Intelligent Cloud segment was in line with management expectations. The company is experiencing temporary supply chain constraints impacting Azure AI revenue in FQ2, which are anticipated to be resolved in the second half of the fiscal year.

  • FQ1 productivity and business processes revenue grew by 12% YoY and 13% in constant currency to $28.3 billion, driven by better-than-expected revenue across all the businesses. Management expects FQ2 revenue in productivity and business processes to grow between 10% and 11% in constant currency or $28.7 billion to $29 billion.

    M365 commercial cloud revenue is expected to grow 14% in constant currency, with moderating seat growth across customer segments and ARPU growth through E5 and M365 Copilot. LinkedIn revenue is expected to grow by about 10% and Dynamics 365 (A suite of business applications like CRM and ERP for improving operational efficiencies) is expected to grow mid to high teens in the December quarter.

  • More Personal Computing FQ1 revenue grew by 17% YoY to $13.2 billion, which included the net impact of 15 percentage points from the Activision acquisition. Management expects More Personal Computing revenue to be $13.85 billion to $14.25 billion in FQ2. Windows OEM and devices revenue is expected to decline in the low to mid-single digits. Search and news advertising ex-TAC revenue is expected to grow in the high teens, and gaming is expected to decline in the high single digits due to hardware.
  • FQ1 intelligent cloud revenue grew by 20% YoY and 21% in constant currency to $24.1 billion. Azure revenue grew by 33% and 34% in constant currency, with healthy consumption trends that were in line with management’s expectations. Azure growth included roughly 12 percentage points from AI services.

Analyst see Azure accelerating to +35% growth

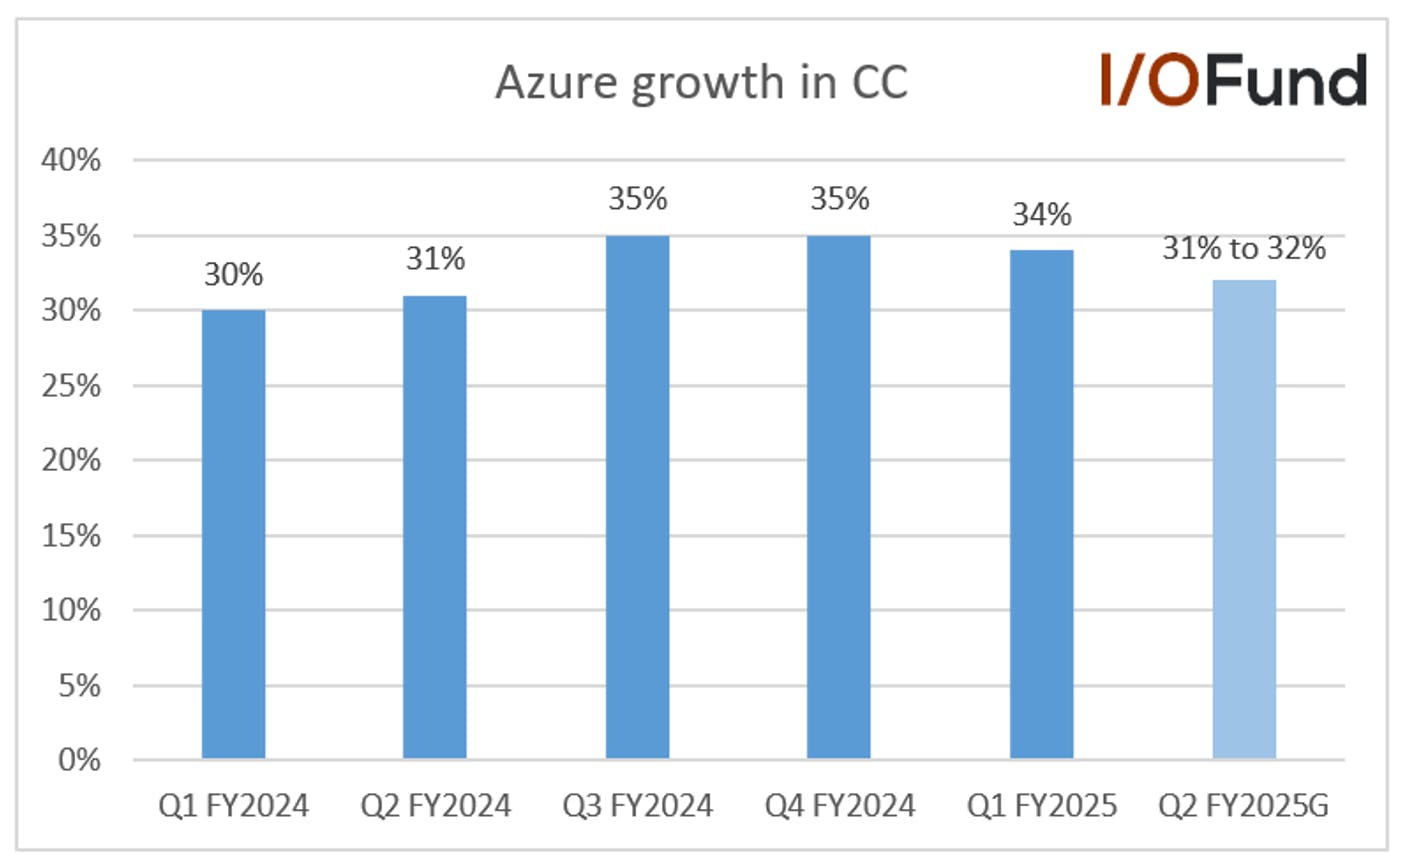
  • Management expects FQ2 Azure growth to be between 31% to 32% in constant currency and expects roughly 12 percentage points contribution from AI services. The soft FQ2 guidance is due to supply constraints, which is expected to improve in the second half of the fiscal year, and Azure growth is expected to accelerate in H2 FY2025. Berstein analyst Mark Moerdler expects Azure growth to accelerate to 35% to 40% YoY growth in the first half of CY2025.
  • KeyBanc analyst Jackson Ader said, “Over the December quarter (fiscal 2Q) Azure instances were up 17.3% sequentially and 28.0% year-on-year, each of which are multi-year highs." The analyst believes that non-AI growth from increased CPUs could positively surprise investors, given the supply constraints in FQ2 that will impact Azure revenue.

Margins

Microsoft has maintained strong margins driven by operating efficiencies. However, in the recent quarter’s investor sentiment has come down due to rising capex. Investors will be looking for more clarity during the earnings call on the timeframe of the returns on these long-term investments.

The company is continuing with its cost-cutting initiatives. Microsoft announced recently that they had frozen new hires in U.S. consulting and that minor layoffs were possible. In the second week of January, it revealed it was cutting less than 1% of its employees across multiple departments based on performance.

Microsoft increased the prices of the Consumer version of Microsoft 365 by $3 per month and now bundles with Copilot features, marking a 43% hike. The price increase reflects Microsoft’s plan to capitalize on the growing demand for AI services and enhance its revenue and profitability.

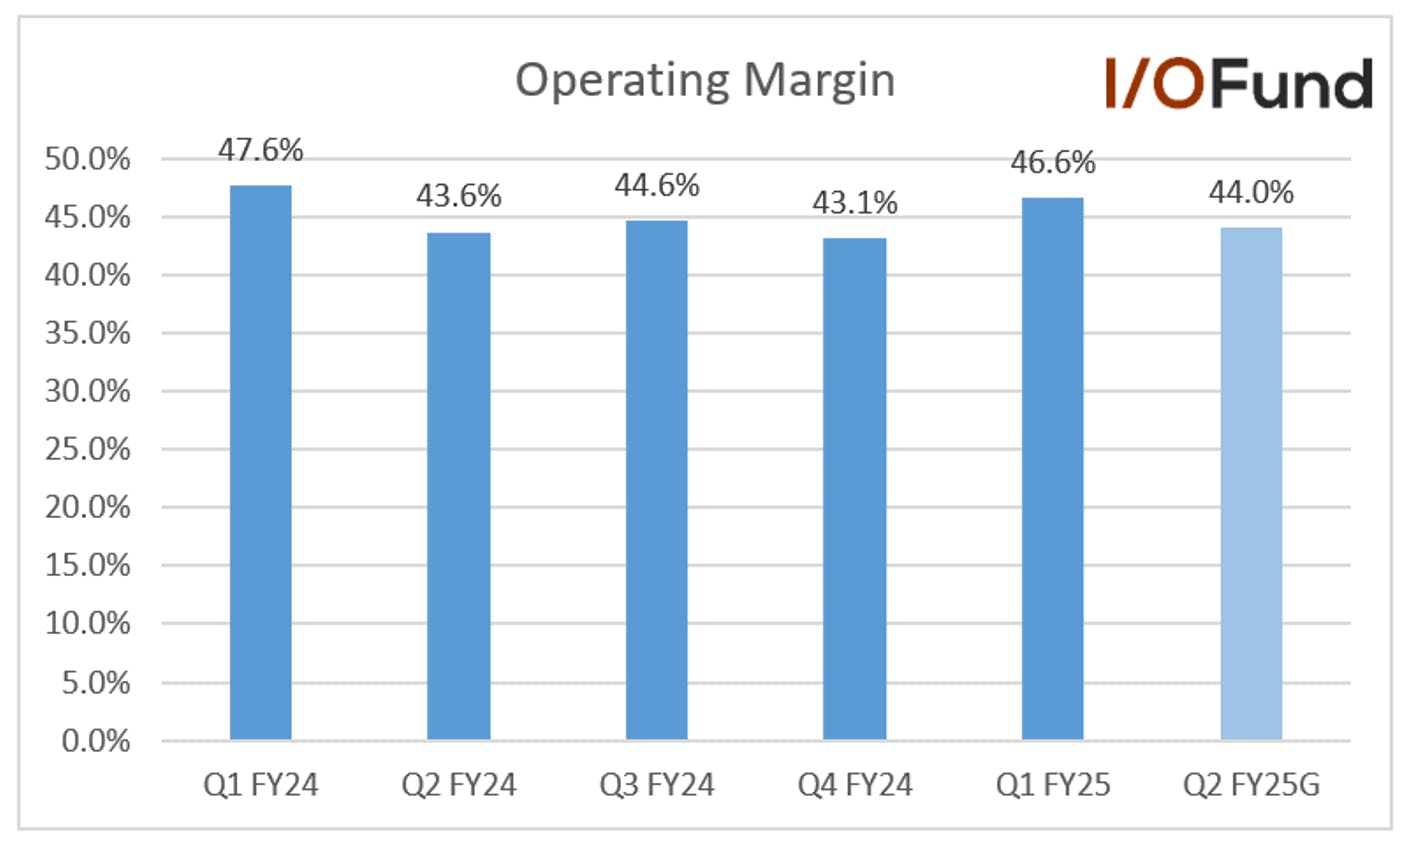
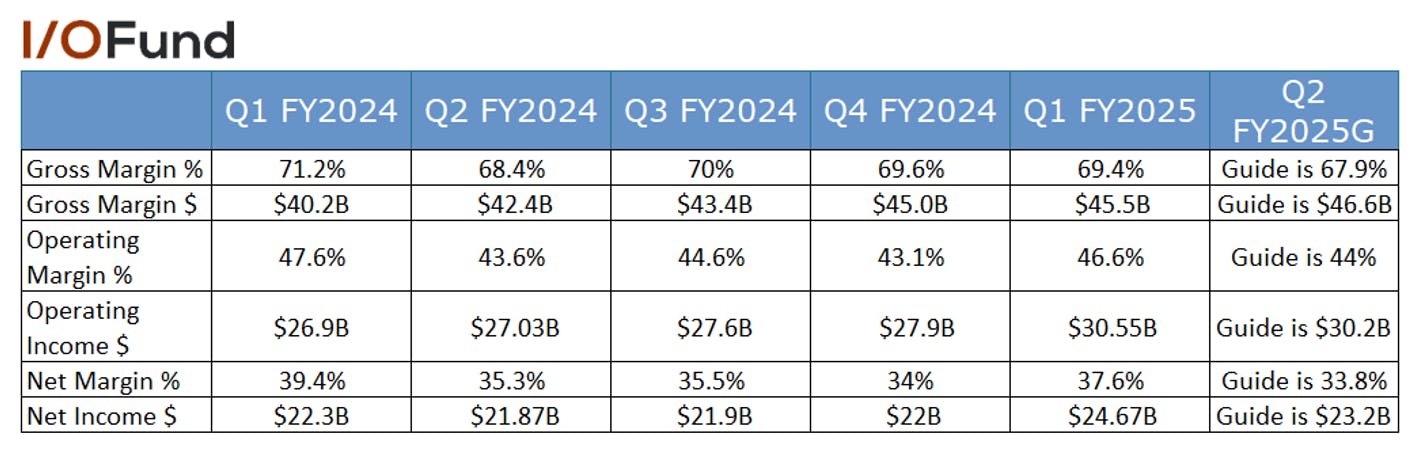
  • Management has guided a gross margin of 67.9% for FQ2 compared to 68.4% in the same period last year.
  • FQ1 operating margin was 46.6% compared to 47.6% in the same period last year. Excluding the impact of the Activision acquisition, the operating margin would have been up 1 percentage point compared to last year, driven by operational efficiencies.
  • Management operating margin guide for FQ2 is 44% compared to 43.6% in the same period last year.
  • Net margin FQ2 guide is 33.8% compared to 35.3% in the same period last year.
  • The company also expects a $800 million impairment charge in FQ2 over its investment in robotaxi startup Cruise after General Motors announced that they would halt the development of Cruise autonomous vehicles. This charge was not included when the company provided the guidance for FQ2. It is expected to have a negative impact of $0.09 on the FQ2 EPS.

EPS

FQ1 EPS grew by 10.4% YoY to $3.30, beating analysts estimates by 6.3% driven by operational efficiencies.

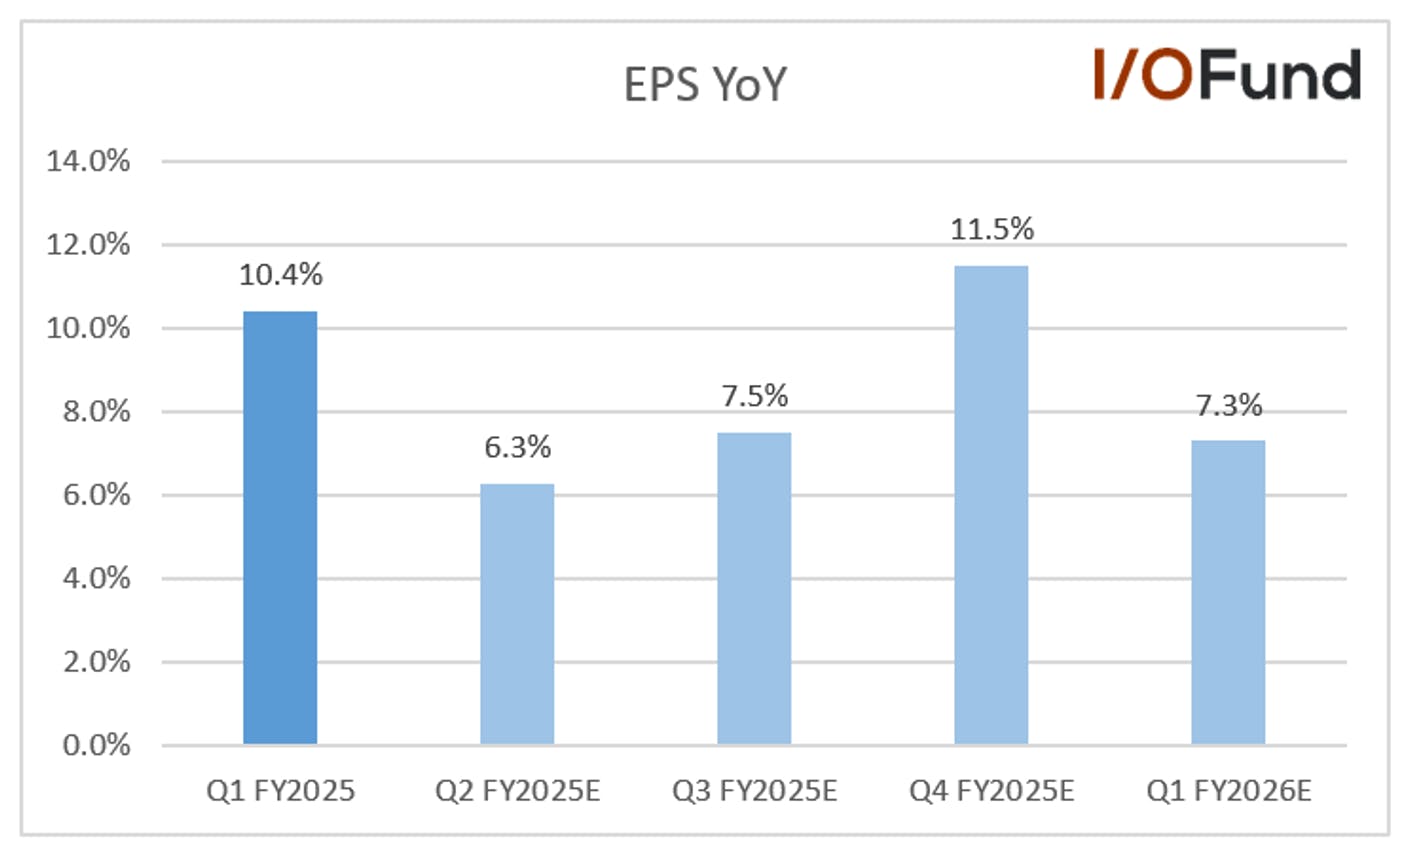
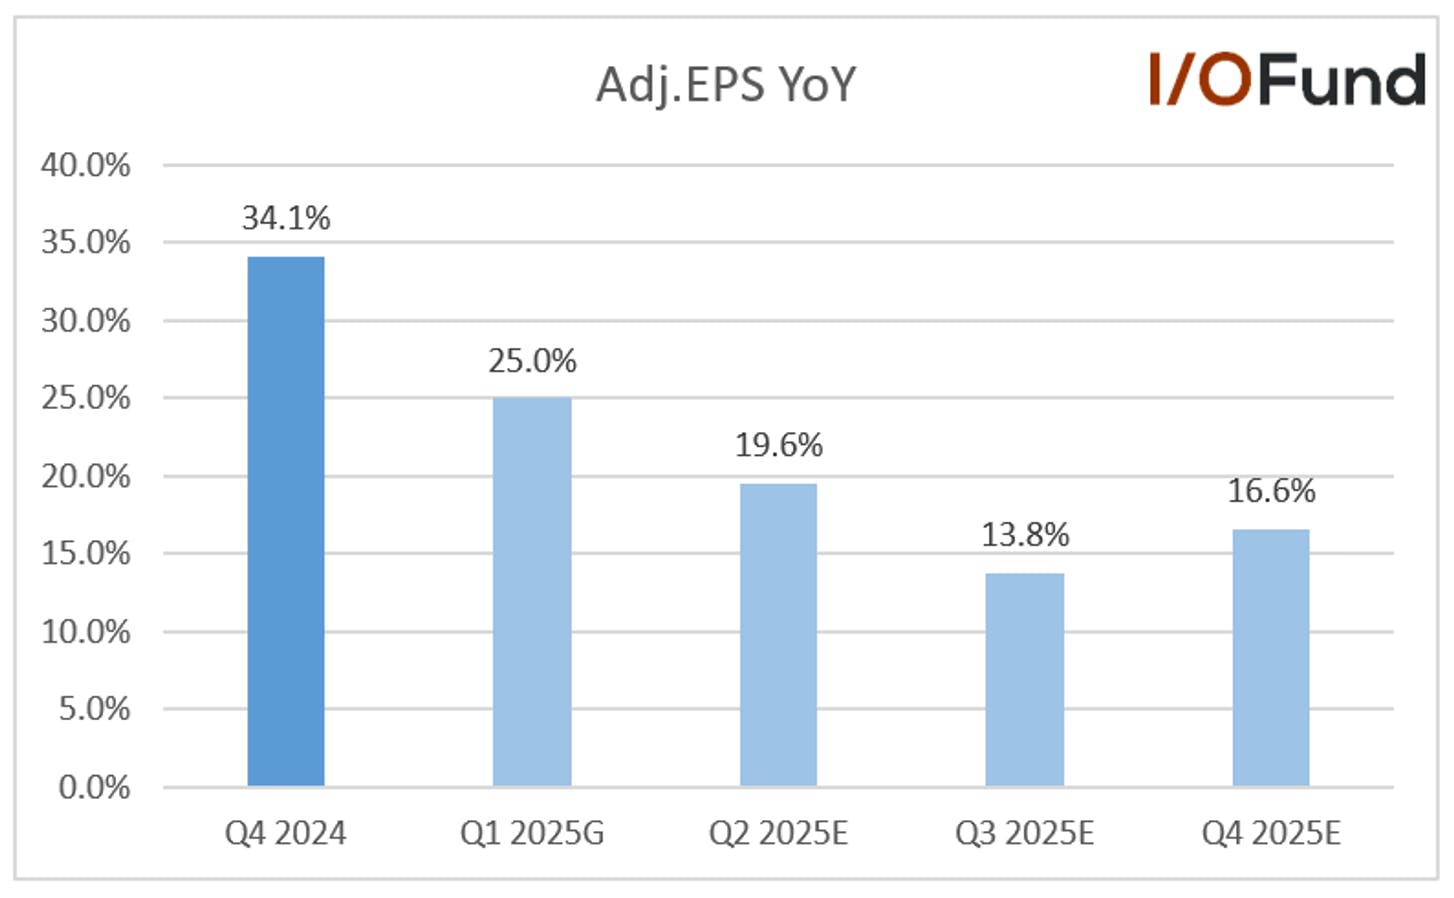
  • Analysts expect FQ2 EPS to grow 6.3% YoY to $3.12 and accelerate to 7.5% growth in FQ3 and 11.5% in FQ4.
  • Looking further out, analysts expect better EPS growth in the coming years. Analysts expect FY2025 ending June EPS to grow 10.5% to $13.04, followed by 15.6% and 18.5% growth for the next two years.

 Cash Flows and Balance Sheet

The company has strong cash flows. However, due to the strong growth in AI, the company has a higher capital investment plan. The company recently announced plans to invest approximately $80 billion in AI-enabled data centers in FY2025, a significant increase from the $55.7 billion capex in FY2024.

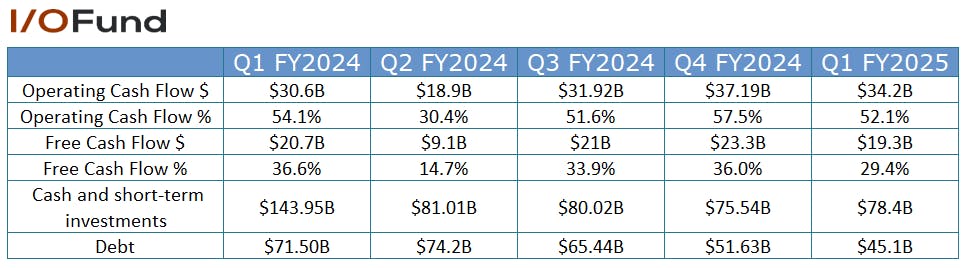
  • FQ1 operating cash flow grew by 12% YoY to $34.2 billion or 52.1% of revenue compared to 54.1% in the same period last year. The cash flow growth was driven by strong cloud billings and collections, partially offset by higher supplier payments, and employee and tax payments.
  • FQ1 free cash flow was down (-7%) YoY to $19.3 billion, reflecting higher capital expenditures to support the cloud and AI offerings. The free cash flow margin was 29.4% compared to 36.6% in the same period last year. Capex was $20 billion and included roughly 50% towards long-lived assets and the remaining towards servers, including CPUs and GPUs. Management expects capex to increase sequentially in FQ2.
  • The company had cash and short-term investments of $78.4 billion and debt of $45.1 billion compared to $75.5 billion and $51.6 billion at the end of the FQ4.

Key Metrics

Key metrics like Commercial RPO are demonstrating positive trends. Wells Fargo analyst Michael Turrin expects continued growth in Microsoft Cloud revenue and bookings in the December quarter driven by consolidation across software, the company’s leading position in AI (especially Azure AI), and a year-end budget flush.

Commercial RPO

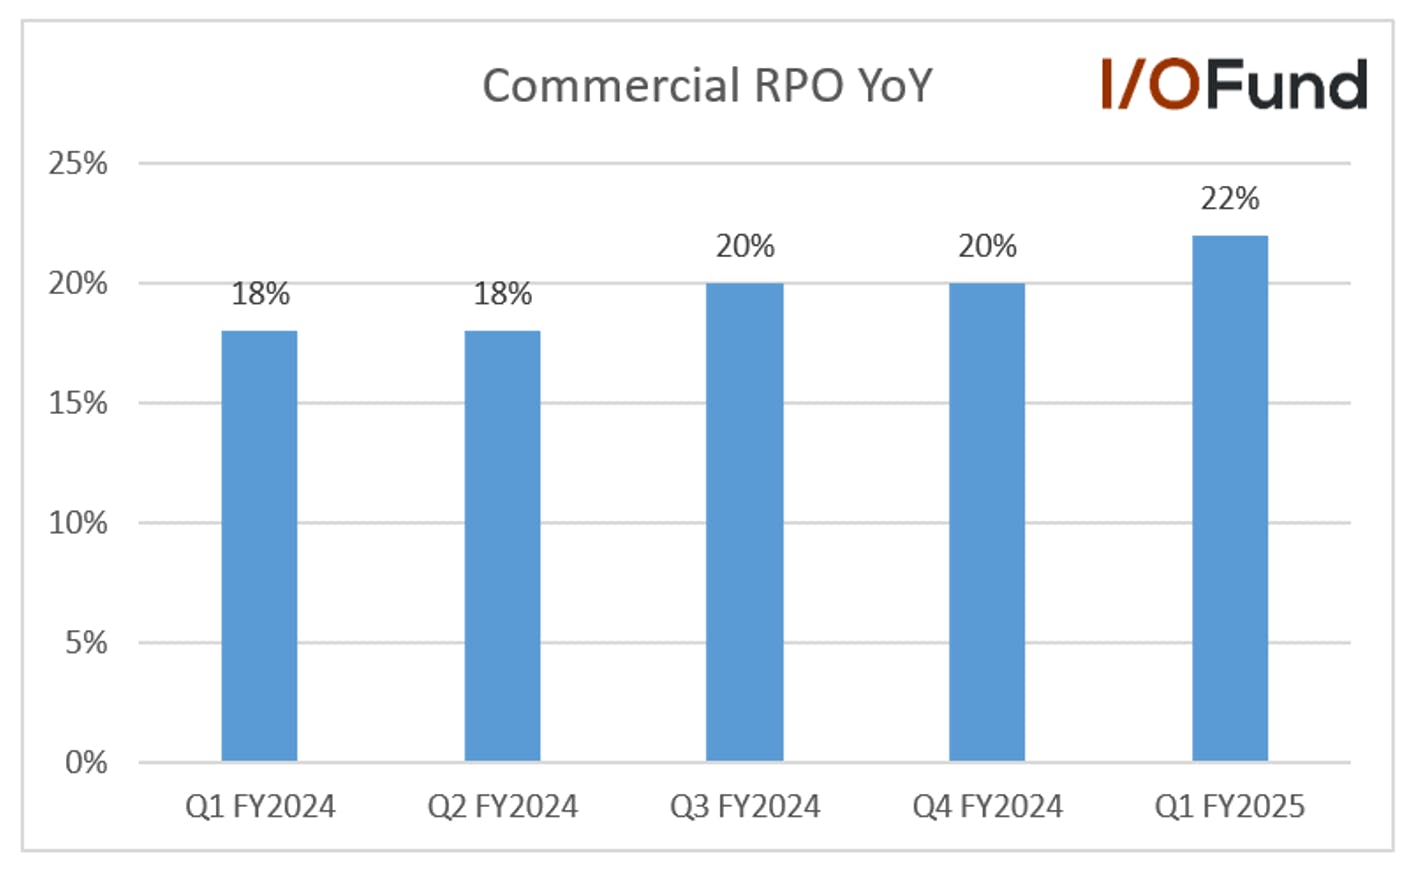
Commercial remaining performance obligation grew by 22% and 21% in constant currency to $259 billion in FQ1. Roughly 40% is expected to be recognized in revenue in the next 12 months, up 17% YoY. The remaining portion, recognized beyond 12 months, grew by 27%.

Commercial Bookings

The company witnessed increased demand and long-term commitments to the Microsoft Cloud platform in FQ1. Commercial bookings increased 30% and 23% in constant currency, driven by growth in contracts worth more than $10 million for Azure and Microsoft 365. In addition, the company witnessed a strong increase of over $100 million in contracts for Azure.

Microsoft Cloud

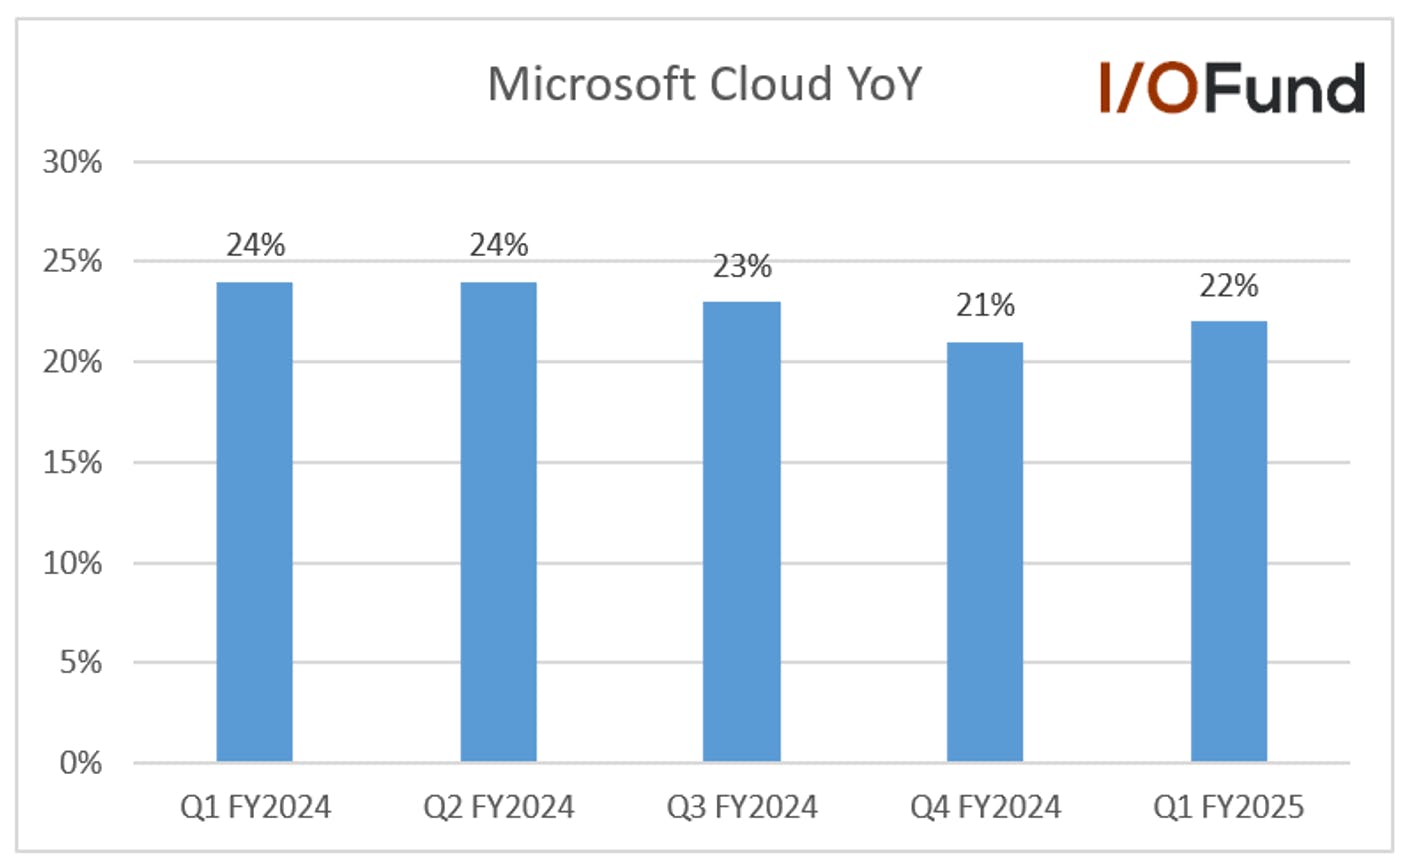
Microsoft Cloud revenue grew by 22% YoY to $38.9 billion in FQ1. Microsoft Cloud’s gross margin was 71% in FQ1 compared to 73% in the same period last year. Management expects gross margin to be around 70% in FQ2, down from 72% in the same period last year due to the increased AI spending.

  • Azure Arc, a tool that allows organizations to manage resources not hosted on Azure, had over 39,000 customers in FQ1, which is up 80% YoY and 8% QoQ.
  • The next-gen analytics platform, Microsoft Fabric, had over 16,000 customers in FQ1, up 14% QoQ.
  • Power Platform, a collection of low-code development tools, has been used by nearly 600,000 organizations, up 4x YoY.
  • Monthly active users in Copilot across CRM and ERP portfolio increased by 60% QoQ.

AI Revenue

During the FQ1 earnings call, management announced that its AI business is on track to surpass an annual revenue run rate of $10 billion in the FQ2. This remarkable achievement marks the fastest growth for any business in the company's history, reached within just 2.5 years. Management emphasized that this AI revenue primarily stems from inferencing services, which are known for their greater stability. This milestone also underscores Microsoft's strong relationships with Fortune 500 companies. Analyst Mark Moerdler of Bernstein estimates that Azure AI contributes significantly to this revenue, with approximately $9.7 billion. Moerdler also anticipates that the AI revenue mix will likely deliver healthy profit margins.

Valuation

The company is trading at a P/E ratio of 36.6 and a forward P/E ratio of 34, higher than the 5-year average P/E ratio of 33.1. It is trading at a P/S ratio of 13 and a forward P/S ratio of 11.8.

Conclusion

Microsoft's diverse product portfolio and strong leadership under Satya Nadella position the company for continued success. The company is expected to surpass the $10 billion annual AI revenue run rate in FQ2, showcasing the company's dominance in AI. Investors will be keen to understand the anticipated timeline for returns on AI-related investments. Also, the confirmation of Azure's growth trajectory in the second half of FY2025 are the key catalysts to watch in the upcoming earnings.

Royston Roche, Equity Analyst at the I/O Fund, contributed to this article.

Please note: The I/O Fund conducts research and draws conclusions for the Fund’s positions. We then share that information with our readers. This is not a guarantee of a stock’s performance. Please consult your personal financial advisor before buying any stock in the companies mentioned in this analysis.

Recommended Reading:
Amphenol: High-Performance Interconnects for the AI Ecosystem

  • Amphenol’s interconnects and networking solutions power AI/ML applications with Nvidia as a lead partner. The company’s 12VHPWR PCIe 5.0 power connector was able to eliminate the need for three power connectors with a single power connector.
  • Although Amphenol has benefited from its partnership with Nvidia, this partnership is in flux as Nvidia seeks to lower power requirements and sidestep thermal management issues with the GB200s and B200s.
  • This past quarter, information technology and data center (IT datacom) revenues surged 76% YoY in Q4 2024, accounting for 27% of total revenue.
  • Amphenol stands out from AI-related hardware peers for its strong GAAP margin of 22.1% and adjusted operating margin of 22.4%. The company generated free cash flow of $2.2 billion in FY24 yet has net debt of $3.6 billion.
  • Amphenol has completed nearly 50 acquisitions in the past 11 years, accounting for a third of growth, with most being accretive to EPS and dilutive to conversion margins initially.  
  • Amphenol generates 20% of its revenues from China yet management stated they can mitigate tariffs around the world by manufacturing products in the same region in over 300 facilities in 40 countries and buoyed by decentralized management. Given the high China exposure as it stands, this point needs to be monitored.

Amphenol (NYSE: APH) offers high-performance interconnect systems and networking solutions for data centers, EVs, telco, military, electronics and industrial customers. Their various power connectors are used in every smartphone, tablet and laptop. They have diversified end market exposure with no single customer generating over 10% of their revenues.

AI Interconnect solutions are a key growth driver bolstering its IT datacom segment growth of 76% YoY and comprising 27% of total revenues in Q4 2024. Their high-speed and power interconnect products are critical components for AI networking, available for both copper and fiber-optics. By offering interconnects and cables with the highest speed, and lowest latency, expensive GPU clusters can perform optimally.

Here is how management describes their early success in being a chosen networking partner: “I mean, look, when our customers choose Amphenol, they're doing this for a variety of reasons. They're doing it because we have the proverbial better mousetrap that our product has the capabilities and the abilities to satisfy the needs that they have and whether that's high-speed low-latency or more efficient power or the like. But they're also doing it because they have a — that they have a kind of a confidence in the execution machine that our entrepreneurial organization has created.”

Amphenol’s has a strong track record in supplying mobile devices and many other high-volume industries, and they maintain this puts them in a better position globally to supply the next large trend of AI. The global reach is visible in Amphenol’s large revenue base of an estimated $18 billion this year whereas most Nvidia suppliers have a fraction of this revenue.

However, there have been reports that Nvidia is testing out other suppliers. Barron’s reported that a BofA analyst stated: “Our checks suggest that certain issues with [Nvidia’s] GB200-based systems could result in a design change that could lower the addressable market for Amphenol.”

We look at this and more below.

The Rail Joints of the AI Gold Rush

Amphenol makes board level connectors like the 16-pin 12VHPWR used for connecting GPUs to computer power supplies for up to 600W of power delivery. Amphenol’s connectors enable chips to communicate, perform complex calculations and enable high-speed power and fiber optics to flow seamlessly, making them vital components for the AI ecosystem, especially in the data center market.

Amphenol’s IT datacom revenues surged 76% YoY in Q4 2024, accounting for 27% of total sales in Q4. It now accounts for 24% of total revenue. Full year 2024 IT datacom sales surged 57% YoY and 56% organically. IT datacom accounted for 27% of total sales in Q4 and 24% for the full year.

Amphenol's mission-critical power connectors are durable and designed for extra protection from the environment, including rain, snow, humidity, extreme temperatures and electromagnetic interference (EMI). Their zinc die-cast shell ruggedized connectors are IP67 and IP68 sealed to be waterproof and can stand up to shock and vibration, making them very resilient and resistant to mechanical damage.

Protecting Signal Integrity and Power Integrity

As data speeds increase, electromagnetic interference (EMI) can affect signal integrity. As a supplier of mobile devices, Amphenol has experience solving signal integrity related to EMI. Due to AI being particularly data hungry, printed circuit boards (PCBs) are experiencing high levels of data loss. Direct attach cables (DACs) is one way to transmit data by circumventing the need for printed circuit boards.

Note: we’ve covered active electrical cables recently in a deep dive here.deep dive here.

The other issue that data centers face that Amphenol alleviates is to minimize voltage fluctuations while offering higher speeds. The PCIe 5.0 connectors offer high-speed data transfer of 32GT/s per PCIe lane and 24GBs for SAS lanes. Amphenol’s I/O Connectors are customizable for signaling speed and heat management, which is attractive for custom silicon or in-house networking needs, like Nvidia’s. The mezzanine connectors help to increase density in data centers and increases the speeds of real-time processing and system performance. Finally, edge connectors help to integrate AI components with PCIe4 and PCIe5 that is backward compatible.

Note: we’ve discussed how data speeds are increasing, causing data centers to update their networking components here. We’ve discussed the importance of backward compatible here.networking components here. We’ve discussed the importance of backward compatible here.

Growth Enhanced by Acquisitions and Buoyed by Organic Revenues

Amphenol has executed a growth-by-acquisition strategy, but these companies have been accretive to their earnings, complementary to their offerings and offer enhanced diversification of end markets. Amphenol has completed over 50 acquisitions in the last decade, ranging from tens of millions of dollars up to $2.025 billion for Carlisle. A key advantage of acquisitions is that Amphenol effectively acquires new products, talent, technology and territories without bearing the time and costs of development.

In 2024, Amphenol completed two acquisitions and signed to complete a third one, the Andrew businesses from CommScope, by 1Q 2025:

  • Amphenol completed its $2.025 billion all-cash acquisition of Carlisle Interconnect Technologies (CIT) from the Carlisle Companies (NYSE: CSL). This acquisition adds 6,000 employees and brings with it high-performance wire and cable offerings, especially in harsh environments, complementing its existing connector offerings and enabling more comprehensive interconnect solutions. It also brings expertise in optical fiber technology to enhance capabilities in high-speed data transmission further, which is crucial for data centers and telcos. This business is reported in the Harsh Environment Solutions segment.
  • Amphenol completed the acquisition of the Lutze Group (US and Europe) by Q3 2024. It strengthens its position in the harsh environment and industrial interconnect market, including cable assemblies for automation, robotics and power cables for industrial machinery. It also increases its footprint in Europe. The Lutz US had annual sales of $75 million, and Lutz Europe had annual sales of $100 million. These businesses are reported in the Harsh Environment Solutions segment.
  • Amphenol looks to complete its acquisition of CommScope’s Outdoor Wireless Networks (OWN) and Distributed Antennae Systems for $2.1 billion in cash during the first half of 2025. This adds advanced antenna and interconnect products for wireless networks.

Amphenol has been strategic and purposeful with its acquisitions focused on high-quality management teams with complementary technology. Target acquisitions are to account for a third of growth. Integration lends itself to decentralized management comprised of nearly 140 general managers, who have full authority and accountability to tailor their businesses to meet customer demands, spread across 300 facilities in over 40 countries. They embrace the “Think Globally, act locally” mantra. Amphenol is not relying solely on acquisitions to fuel growth, as evidenced by the 20% YoY organic growth in Q4 2024, up from 15% YoY organic growth in Q3 2024.  

Diversified and Balanced End Market Exposure

While IT datacom is a leading growth driver, Amphenol has balanced end-market exposure that shields it from drastic volatility. Its longer cycle end markets, including automotive (23%), industrial (25%), commercial aerospace (4%) and defense (11%), provide stable revenues. Its shorter cycle end markets include mobile devices (10%), broadband (4%), mobile networks 4% and IT datacom (19%), at the end of 2023, are the growth drivers. The datacom end market grew to 24% in 2024.

Potential Issues with NVIDIA Blackwell GPUs Could Impact GB200 GB300 Launch

On Jan 25, 2025, Loop Capital analysts Ananda Baruah and John Donovan commented on potential problems with Amphenol still having connector yield issues for Nvidia’s GB200 and GB300 offerings, which could impact the launch. They commented, “We’ve heard that Nvidia has asked other controller suppliers to increase supply, although the interplay is that they don’t want to put on material capacity only to see share shift back to APH once yields improve.”

In September 2024, Bank of America analyst Wamsi Mohan warned of the possibility of design issues for Amphenol, “Our checks suggest that certain issues with [Nvidia’s] GB200-based systems could result in a design change that could lower the addressable market for Amphenol.” Mohan’s model estimates Amphenol could lose out on nearly $1 billion in 2025 revenues and 21 cents in earnings per share (EPS). Consensus analyst estimates call for 2025 full year revenues to grow 18.11% YoY to $17.98 billion and EPS of $2.28, up 20.64% YoY. This prompted Mohan to downgrade APH from Buy to a Hold, lowering his target price from $80 to $71 per share.

Amphenol’s Three Key Revenue Segments

The Company’s three key revenue segments:

  • Harsh Environment Solutions are interconnect products that are designed to be durable and able to withstand exposure to all weather conditions, extreme heat, cold (-319 degrees Fahrenheit), vibration, and wet and dry conditions. These products are built to withstand harsh weather and rugged environments. End markets include automotive, aerospace, defense, industrial, information technology and data communications (IT datacom) and mobile networks. Products include harsh environment data, power, fiber optic, coaxial cable, flexible and rigid circuit boards, backplane interconnect systems, and radio frequency (RF) interconnect products.
  • Communications Solutions end markets include automotive, broadband communications, aerospace, defense, industrial, IT datacom, network infrastructure and consumer antennas, coaxial, power and specialty cables, mobile devices and mobile networks. Key products include fiber optics, antennas, cables, and high-speed and RF interconnect products.
  • Interconnect and Sensor Systems end markets include automotive, aerospace, defense, industrial, IT datacom and mobile networks. Key products include busbars, power interconnect and power distribution systems, and sensor and sensor-based products.

Financials: A Record-Breaking Fourth Quarter of 2024

Amphenol reported a record-breaking Q4 2024, beating top and bottom consensus analyst estimates. The Company delivered strong results with organic sales accelerating to 20%, up from 15% sequentially. Orders rose for the sixth consecutive quarter, up 58% YoY to $5.14 billion. Its book-to-bill ratio grew to 1.16:1. Its operating cash flow rose for the fourth consecutive quarter to a record $847.1 million or 114% of net income, while free cash flow rose to $687 million or 87% of net income. Adjusted operating margin grew 120 bps YoY to a record 22.4%.

Q4 Revenue Growth Reports Beat and Raise

Amphenol reported 29.8% YoY revenue growth to a record $4.32 billion, beating consensus estimates by $240.13 million or 5.89%. Citi estimates AI sales represented $450 million to $500 million in Q4 as order momentum accelerated.

Amphenol issued upside Q1 2025 revenue guidance of $4.0 billion to $4.1 billion vs $3.93 billion consensus estimates. The mid-point revenue guidance of $4.05 billion equates to 24.4% YoY growth.

Full-year 2024 revenue grew by 21.3% YoY to $15.2 billion, beating $14.99 billion consensus estimates. Organic sales rose 13% YoY, driven by strength in IT datacom, commercial air, mobile device and defense markets.

EPS Beat and Raise, GAAP Profitable but EPS Growth Normalizing

Amphenol reported Q4 2023 adjusted diluted EPS of $0.55 per share, beating consensus EPS estimates by $0.05. Q4 Adjusted EPS grew by 34.1% YoY to $0.55 and beat estimates by $0.05. GAAP EPS grew by 40.5% to $0.59.

Full-year 2024 adjusted EPS was $1.89, up 25% YoY and GAAP EPS was $1.92, up 24% YoY.

Amphenol issued upside-adjusted EPS guidance of $0.49 to $0.51 vs. $0.48 consensus estimates. Adjusted EPS mid-point of $0.50 equated to 25% YoY growth.

Revenue Growth and Operating Margin by Segment:

A closer look at the three segments for Q4 2024 reveals the sequential improvements.

Harsh Environment Solutions’ revenues rose 40.2% YoY and 5.7% QoQ to $1.262 billion, compared to 34.5% YoY and 14.1% QoQ growth of $1.194 billion in the previous quarter. This segment generated $305.4 million in operating income, which was 24.2% of revenue, compared to $283.7 million in operating income or 23.8% of revenue in the previous quarter. Organic sales rose 8% YoY.

Communications Solutions’ revenues rose 43.3% YoY and 14.4% QoQ to $1.928 billion, compared to 31.8% YoY and 16.7% QoQ growth of $1.686 billion in the previous quarter. Organic sales rose 42% YoY. Operating income was $501.9 million or 26% of revenue, compared to $431 million and $25.6% of revenue in the previous quarter. Organic sales rose 42% YoY.

Interconnect and Sensor Systems’ revenue rose 4.3% YoY and fell 2.7% QoQ to $1.128 billion, compared to 31.8% YoY and 16.7% QoQ growth to $1.16 billion in the previous quarter. Operating income was $209.6 million or 18.6% of revenue, compared to $217.6 million and 18.8% of revenue in the previous quarter. Organic sales rose 3% YoY.

Orders and Book-to-Bill Growth Rising for Four Consecutive Quarters

Orders rose for five consecutive quarters to a record $5.14 billion in Q4 as Book-to-Bill reached its highest level in six quarters at 1.16:1.

Cash Flow Rises for the Fourth Straight Quarter, But So Does Debt

Q4 cash flow continued to grow, marking the fourth consecutive quarter of operating cash flow growth. In October, the Company priced $1.5 billion in senior notes and plans to use the cash for the pending acquisition of Mobile Business Networks (MBN) from CommScope for $2.1 billion. This explains the doubling of cash and marketable securities and the 58.76% YoY and 25.73% QoQ rise of debt to $6.89 billion. Net debt was $3.6 billion, and a net leverage ratio of 0.9X.  

CFO Craig Lamp noted that operating cash flow hit a record $847 million in the quarter despite elevated levels of capex to support the growth in IT datacom and defense markets. Capital spending in Q1 2025 will remain at elevated levels. Full-year operating cash flow was a record $2.815 billion and 116% of net income, while full-year free cash flow was $2.157 billion and 89% of net income.

Q4 2024 Earnings Conference Call Highlights

Nvidia Partnership

Evercore analyst Amit Daryanani noted that a “shoutout” from Nvidia implies they are working together with Amphenol.

In its Q3 2024 earnings conference call, Nvidia CEO Jensen Huang commented, “And in terms of how much Blackwell total systems will ship this quarter, which is measured in billions, the ramp is incredible. And so almost every company in the world seems to be involved in our supply chain. And we've got great partners, everybody from, of course, TSMC and Amphenol, the connector company, incredible company…”

CEO Norwitt pretty much confirmed this without getting too specific, “Yeah. Well, thanks very much, Amit and look, we are very pleased with the company's position on these next-generation systems and I've talked about the fact that we're working with really players up and down the stack from folks who are actually making the investments themselves in these data centers, all the way down to folks who are designing the chips and the systems around those chips and everything in between and we're really proud of our position and the breadth of our position.”

Dilutive Impact of Acquisitions

CEO Norwitt stated that despite the dilutive impact of acquisitions, notably for Carlisle Interconnect Technologies (CIT), Amphenol still saw strong conversion margins of mid-20% on a YoY basis and 30% sequential conversion. While margins for CIT are still below the company’s average, they are still happy with the progress as it’s accretive to EPS, with margins improving over time. With time, CIT margins should reach the Company's average.

  • Industrial automation is a more Europe-centric demand. While it was down YoY, there was a “smidgen” of growth in factory automation. Outside of defense and commercial aviation, Europe is somewhat concerning for CEO Norwitt.
  • Defense growth is being driven by increased investments in spending toward next-gen electronics, particularly in Europe. Amphenol is well positions in this space, participating more heavily in advanced electronics than in tradition military spending.
  • Automotive markets have been strong performers driven by the long-term trend of expanding electronics in vehicles, which creates significant content opportunities. They’ve consistently outperformed benchmarks, capturing a larger share of content in areas like next-gen drive trains, electronics, safety and communications.
  • Mobile device market success has been due to their extensive product range, including antennae, interconnects and mechanical components. Strong customer relationships and the ability to execute when needed have allowed them to take more than their fair share out of the business.

AI-Related Growth Prospects for 2025

Amphenol is well-positioned for AI buildouts, with a comprehensive product portfolio that encompasses high-speed interconnects, power solutions and thermal management. The Company already has significant investment already underway, but capex can be lumpy due to timing factors. The strong book-to-bill ratio in IT datacom as it relates to AI and the wide range of design wins gives them confidence for the long-term.

Q1 2025 is expected to be unusually strong as CEO Norwitt detailed, I think we've already given guidance about the first quarter that is unseasonably strong. I mean, typically, our first quarter in IT datacom would be down, I don't know, kind of low- to mid-single-digit decline from the fourth quarter, which is typical seasonality in IT datacom. And here we are guiding that up mid-single-digits, which is quite a differential for a market of that scale.”

Tariff concerns with China and the World:

Amphenol is no stranger to tariffs as they experienced China import tariffs during Trump’s first Presidency in 2017, which enabled them to create a template to help mitigate them through a number of measures.

  • Amphenol generates nearly 20% of its revenues from China. Amphenol tends to manufacture products closer to its customers, reducing transportation costs and lead times and improving supply chain resilience. Another major benefit of manufacturing products in the same region they are sold is the potential mitigation of import tariffs. Amphenol has new factories in Southeast Asia and new capabilities in North America, the U.S., Mexico, Eastern Europe and North Africa.
  • Norwitt stated, “… And we have around the world today nearly 300 facilities across more than 40 countries and we continue to expand so that we preserve that flexibility in the event that there are policies that come out that do impact us and our customers. And when those policies come out, we're first going to get together with our customers, we're going to see what's going on with them, what they want us to do, and then we're going to react accordingly in real-time and faster than any other organization can do because of that unique entrepreneurial structure that we have.”

Conclusion: Amphenol is a balanced AI infrastructure play with short-cycle end markets like IT datacom driving growth (76% YoY Q4 2024 revenue growth) while its long-cycle industrial, commercial aviation and automotive end markets provide stability. The company has successfully executed 50 acquisitions over the past 11 years and maintains a favorable net leverage ratio of 0.9X, along with sustained goodwill. Although its debt stands at $6.89 billion, the company’s strong and record-breaking adjusted operating cash flow makes this debt level manageable.

The Company has proven its seasoned pedigree with acquisitions, which are accretive to EPS but dilutive to conversion margins, which are expected to improve over time, as evidenced by the CIT acquisition.

Amphenol is will need to mitigate additional tariffs on Chinese imports and geopolitical tensions. Its "Thing globally, act locally" philosophy underscores its decentralized management, empowering its agility and flexibility in taking actions and making decisions to adapt to changing conditions, including tariffs. The Company raised its top and bottom-line guidance, noting how unusually robust IT datacom is expected to grow mid-single digits instead of the typical seasonal decline.

This is a sample of what you can expect in our upcoming Discovery tier, where we will cover a new stock idea every week. We are excited to bring you more coverage from the I/O Fund team that is geared toward new idea generation only. Our ETA for launching this new tier is February 2025.

I/O Fund Equity Analyst, Jea Yu, contributed to this analysis

Please note: The I/O Fund conducts research and draws conclusions for the Fund’s positions. We then share that information with our readers. This is not a guarantee of a stock’s performance. Please consult your personal financial advisor before buying any stock in the companies mentioned in this analysis.

Recommended Reading:
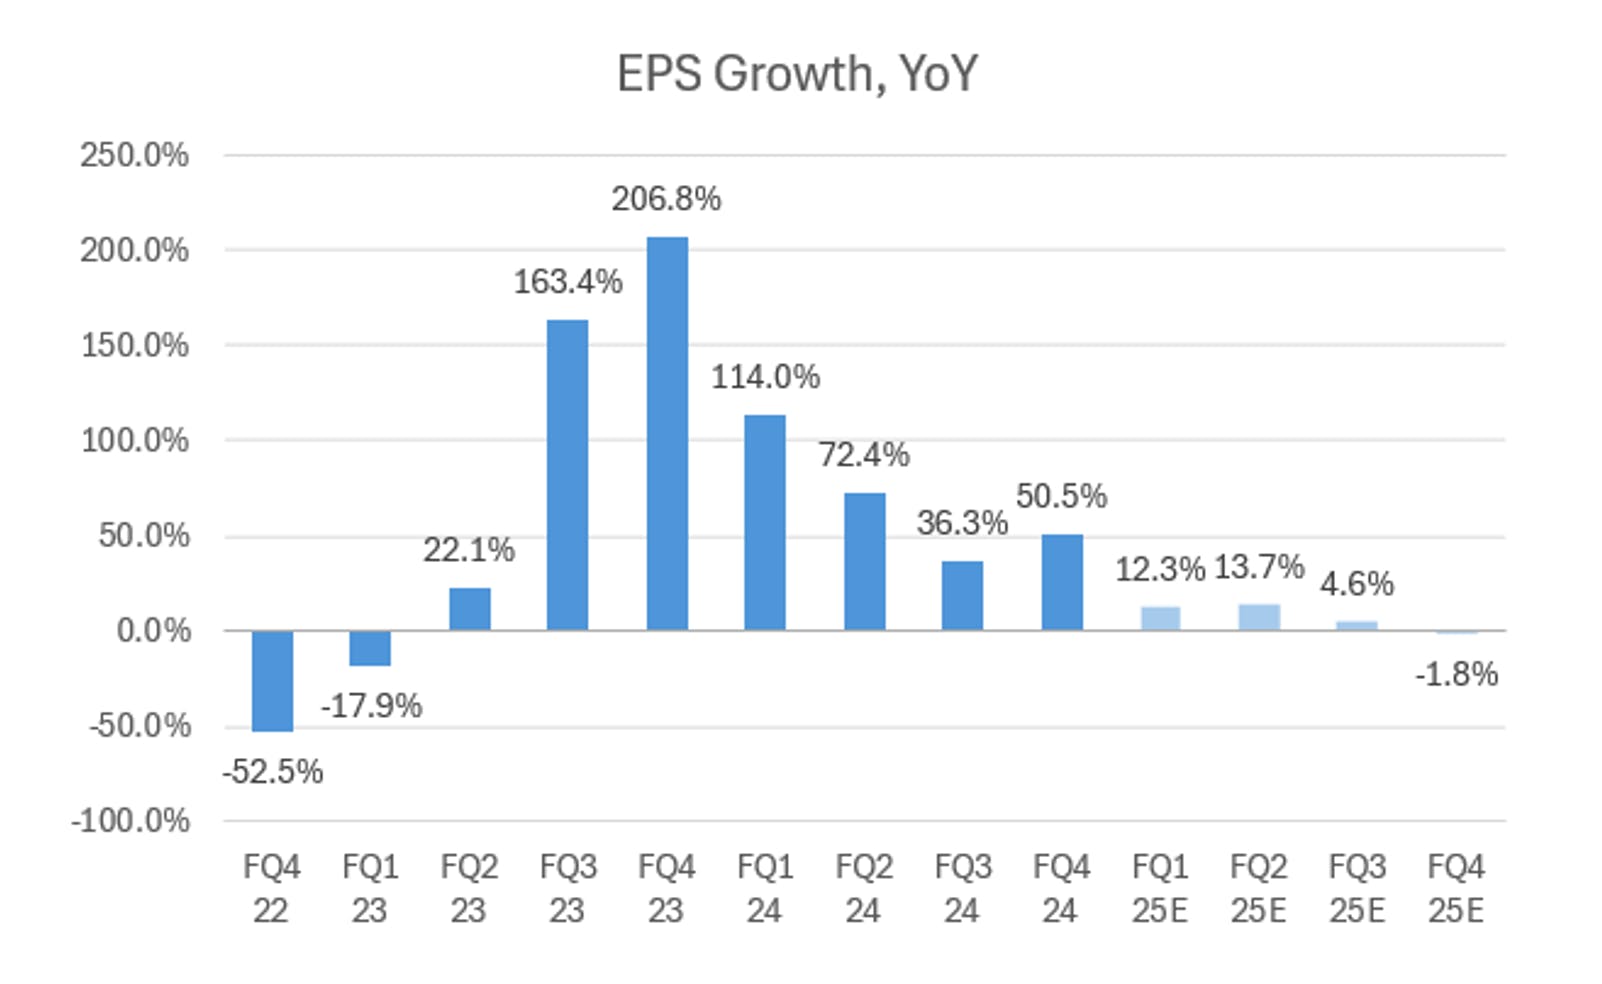
Big Tech AI Stocks to Showcase AI Gains, Capex in Q4 Reports

The first earnings season of 2025 is kicking off in full swing, with Big Tech in the spotlight starting next week. Microsoft and Meta’s quarterly reports are due on January 29th, followed by Alphabet on February 4th.

Two questions are likely to be a focal point during Big Tech’s results – how have AI investments been paying off in terms of revenue and contribution to growth, and what will AI investments look like for 2025? Microsoft has been more forward as to where AI spending will land in 2025, noting that it would be investing $80 billion towards AI data center capacity this year. The recent rounds of earnings, more specifically in August 2024, saw heightened scrutiny from analysts over the ROI from AI capex, and it’s likely that this theme persists this quarter.

2024 Capex Blew Estimates Out of the Water; 2025 Likely to Follow

Big Tech’s capex in 2024 blew estimates out of the water, coming in much higher than expected, with 2025 likely to follow as Microsoft has already signaled AI-data center capex 42% higher than estimated.

Analysts had initially estimated capex of ~$200 billion for Big Tech in 2024, an increase of ~30% YoY. In the first half of 2024, Big Tech spent nearly $104 billion, a 47% YoY increase. Through Q3, that sum had surged to $170 billion, up 56% YoY. Our latest checks suggest that Big Tech is on track to spend at least $236 billion in capex in 2024, 18% higher than analyst estimates and representing YoY growth of more than 52%.

For 2025, capex is likely to follow a similar strong growth trajectory, as companies have already signaled a willingness to invest substantially more this year predominantly for AI. Analysts are currently forecasting growth in the $280 billion range, up ~20% to 25% YoY, though we believe capex could surpass $300 billion in 2025.

The primary takeaway here is that there is alpha in AI hardware and data center suppliers when capex comes in much higher than expected, as more money is flowing beyond Nvidia to the outer reaches of the ecosystem.

AI Stocks Rise as US Nods Towards $500 Billion in AI Infrastructure

Earlier this week, the US government unveiled plans to spend up to $500 billion on AI infrastructure under a project codenamed Stargate. Consisitng of Oracle, OpenAI, SoftBank, and MGX, working alongside tech partners Arm, Nvidia, and Microsoft, the project is said to start with an initial $100 billion commitment before potentially scaling to up to $500 billion in investment through 2029. Arm, Microsoft and Oracle all surged on the news.

Stargate will focus on building out AI infrastructure for AI model development and deployment, breaking ground in Texas on the first data center. This is not necessarily new, as Stargate was first discussed in April 2024 by Microsoft and OpenAI as the fifth and final stage of a supercomputer buildout focusing on a 5GW data center operational by 2028.

Meta Stock’s Capex to Surge in Q4

Capex will continue to be in focus for Meta, as higher than expected spending forecasts have impacted shares in the past, especially as ROI for AI investments is not as crystal clear as the hyperscalers. Meta is aggressively investing in compute and data center capacity as it continues developing its Llama family of models, fine-tuning its feed to boost engagement and increase time spent on apps, and optimizing ad delivery.

Management explained that they “expect servers will be the largest driver of growth in 2025 and remain the largest portion of our overall CapEx budget, though we also expect higher spend in data centers and network equipment as we continue to just scale our overall infra footprint.” To note, Meta was among the largest deployers of custom silicon in 2024, with an estimated 1.5 million of its MTIA accelerators deployed alongside ~224,000 Hopper GPUs purchased. Management added that they “expect growth in non-AI capacity as we invest in the core business, including to support a higher base of engagement as well as refreshing existing servers, as well as AI capacity as we scale Gen AI training and continue to invest meaningfully in core AI.”

Through Q3, Meta’s capex totaled $24.4 billion, implying capex spend is rising from $9.2 billion in Q3 to $14.6 billion in Q4 to reach the midpoint of Meta’s $38-40 billion guide. Management was clear on expecting “significant growth” in 2025, with servers the largest driver (and largest portion of spending) followed by data centers and networking. Meta will likely provide an initial capex guide for FY25 in the upcoming report, with the level of growth in focus following ~40% implied growth in FY24.

For a deeper understanding of Big Tech’s capex and trajectory past one-quarter trillion in spending this year, read AI Spending To Exceed A Quarter Trillion Next Year.AI Spending To Exceed A Quarter Trillion Next Year.

Meta Says Generative AI Growth is Early

Q4 is expected to wrap up a strong growth year for Meta, with revenue projected to increase 17.1% YoY to $47 billion, at the higher end of management’s $45 billion to $48 billion range, with EPS increasing 26.5% YoY to $6.74. For the full year, revenue is expected to rise 20.8% with EPS increasing 52.5%.

Meta stock's revenue growth is expected to slow to 14.6% for Q1 and Q2.

Meta is expected to report 17.1% revenue growth in Q4 and 14.6% for the first half of 2025.

GenAI is not expected to be a meaningful contributor to revenue in FY24, per Meta’s management, but core AI, used for improvements in ad engagement and performance, has been driving revenue gains. Meta is capitalizing on improved ad pricing, driven by increased ad demand fueled by improved ad performance – a result stemming both from AI integrations for advertisers and optimizations to its AI-driven feed.

This is offsetting slowing growth in ad impressions as Meta laps strong double-digit growth. For example, Meta acknowledged that improvements to its AI-driven feed “led to an 8% increase in time spent on Facebook and a 6% increase on Instagram” in 2024, which boost ARPU (no longer reported geographically) with more ads (and higher priced ads) served.

Meta stock's ad pricing growth is offsetting weakness in ad impressions growth

Meta's ad pricing growth is offsetting slower growth in ad impressions.

Alphabet Lag AI Stock Peers in Capex

As expected, capex will be a focal point for the Q4 call, as Alphabet will provide more color on FY25’s planned spending. For FY24, capex is expected to increase nearly 60% YoY to just over $51 billion, with Alphabet signaling that 2025 will increase YoY, but “likely not the same percent step-up that we saw between ’23 and ’24.” This opens the door for a wide range of possibilities – Alphabet could scale towards $20 billion per quarter by year-end and boost capex ~40% YoY, or hover around the $15 billion/quarter market, for an increase of less than 20%.

Alphabet has been significantly investing in its custom chips as well as Nvidia GPUs as it believes that it can offer top-notch performance at a fraction of the cost. Alphabet’s investments in its TPU portfolio, augmented by Nvidia GPUs, is helping reduce operating costs for enterprise clients on model training and inference by up to 70%. Gemini has also been a strong growth driver, with Gemini API calls up 14x YoY in Q3, while token volume, consumer usage, and business adoption all saw “dramatic growth.”

Alphabet Stock Seeing Encouraging AI-Driven Growth

Alphabet has benefited from AI tailwinds in both Cloud and Search, with AI helping Cloud growth accelerate to 35% YoY, a nearly 7 point acceleration since the beginning of 2024. Search momentum has been solid with five consecutive quarters of low double-digit growth, as AI Overview now reaches 1 billion people each month.

For Q4, Alphabet is expected to report 11.9% YoY growth to $96.6 billion in revenue, before maintaining growth in the mid to high-11% range through FY25. EPS growth is expected to be choppy; Q4 is projected to see 29.5% growth to $2.12, while Q1 is expected to see just 7.2% growth to $2.03.

Alphabet stock's quarterly revenue growth is expected to hover in the 11% range through Q2 2025

Alphabet’s revenue is expected to hover in the mid to high-11% range from Q4 to Q2.

AI is driving new growth for Search, not just via AI Overviews, with ads now being implemented, but also by increasing engagement and Search usage. Management explained in Q3 that AI Overview is increasing overall Search usage and exploring more websites, creating a growth flywheel that “actually increases over time as people learn to adapt to that new behavior.” Management also mentioned that they “see monetization at approximately the same rate” for AI Overview, with  additional monetization opportunities in ads via new formats and improved ad targeting. 

However, Cloud has been a brighter spot for Alphabet, with revenue growth of 9.7% QoQ and 35% YoY in Q3, its sharpest acceleration in two years. AI has aided Cloud growth, with CEO Sundar Pichai saying AI helped “attract new customers, win larger deals, and drive 30% deeper product adoption with existing customers.” Cloud is also seeing its operating margin improve significantly – the segment reported a 19% operating margin in Q3, up from 11% in Q2, as operating income rose 66% QoQ to $1.95 billion.

Google Cloud revenue growth has reaccelerated to 35%, the highest among these AI stock peers

Google Cloud’s revenue growth reaccelerated to 35% in Q3.

The I/O Fund is also closely analyzing the supply chain to identify overlooked beneficiaries of the AI infrastructure buildout, sharing this information as well as potential buy and sell plans and real time trade alerts with premium members. The I/O Fund recently entered two separate beneficiaries for gains of 23% and 17% since November. Learn more here.herehere.

Amazon Ramps Spending With Significant AI Accelerator Purchases

Amazon CEO Andy Jassy has been straightforward with investors regarding AI demand and capacity – he told investors in Q3 that AWS has “more demand that we could fulfill if we had even more capacity,” and that the “rate of growth there has a chance to improve over time as we have bigger and bigger capacity.”  Amazon quickly scaling capex to $22.6 billion in Q3 (up nearly 30% QoQ)), Jassy’s comments about demand, and Amazon’s GPU purchases and ASICs deployments suggest that AWS’ acceleration can continue with significant AI chip capacity coming online to meet demand.

Data from Omdia shows Amazon was a significant deployer of both Nvidia’s GPUs and custom silicon in 2024, purchasing ~196K Hopper GPUs and deploying a combined 1.3 million Trainium and Inferentia chips (comparable to ~430K Hoppers). Amazon also signaled that it was working on deploying its next-gen Trainium 3 in an Ultracluster featuring hundreds of thousands of chips.

Amazon is expecting to spend $75 billion in capex in 2024, suggesting Q4’s capex comes in around $20 billion, or just over a -10% decline QoQ. However, given that Azure is growing 10 points faster and encroaching on AWS’ leading market share, Amazon may respond to Microsoft’s substantial increase in AI investments in 2025, given that it has the cash and cash flows to support said spending.

Amazon’s AWS Is Now the Core Fundamental Driver

AWS will be in focus not only for its significant AI-driven growth, but also for its status as a primary contributor to topline and bottom line growth. As we discussed in Amazon Stock: Nearing $2 Trillion Club From AWS Growth & Ads Catalyst in May 2024, AWS is one of the core contributors to Amazon’s improved fundamental strength, aiding its push towards a 20% gross margin for the first time in history and boosting the bottom line; e-commerce is no longer the main story fundamentally as AWS is contributing the bulk of operating income and aiding margin expansion.

AWS has recorded five consecutive quarters with accelerating revenue growth, from 12% YoY to 19% YoY, with operating income growth >30% in each quarter (and >50% in the last three). This contribution is the main reason that Amazon is expected to see 77% YoY growth in EPS for FY24, well ahead of the 43% estimated growth from October 2023.

Amazon's AWS revenue growth reaccelerating with strong operating income growth for five quarters

AWS revenue growth has reaccelerated while operating income growth has been >30% for five consecutive quarters.

Amazon Capitalizing On High AI Demand, Holiday Sales

Amazon is expected to continue capitalizing on high demand for AI services on AWS, noting that AI revenue has already reached a multi-billion dollar run rate. Outside of AI, an acceleration in online holiday sales growth (from 5.2% YoY in 2023 to 8.6% YoY in 2024), supports solid e-commerce growth for Amazon.  

For Q4, Amazon had guided for revenue of $181.5 billion to $188.5 billion, yet analysts are expecting a much stronger report – of 45 analysts covering the stock, the lowest estimate for Q4 is $185 billion, with consensus at $187.3 billion, on the upper end of the range.

EPS is expected to rise ~48% YoY to $1.48 in Q4, boosted by strong operating leverage for AWS. Given the significant growth in the first half of 2024, Amazon will face tougher comps come Q2 2025 – EPS growth is forecast to decelerate from 41% in Q1 to 12% in Q2.

Amazon stock's revenue to grow in high 10% range for 2025, lagging other AI stocks

Amazon’s revenue growth is expected to hover in the 10% range for the next few quarters.

Microsoft Leads AI Stocks With Capex 26.6% Higher Than Estimated

Commentary on AI capex will be in full focus, given that Microsoft announced earlier this year that it expects to spend $80 billion on AI data center construction in fiscal 2025, well ahead of estimates for $63.2 billion in capex. CEO Satya Nadella recently said in an interview with Business Insider that Microsoft is now power constrained, not chip constrained, after buying nearly double the amount of Nvidia’s Hopper GPUs as peers in 2024:

"We were definitely constrained in '24. What we have told the Street is that's why we are optimistic about the first half of '25 which is the rest of our fiscal year. And then after that I think we'll be in better shape going into 2026 and so we have good line of sight.”

Another important factor will be the trajectory of AI revenue. Nadella said last quarter that Microsoft is expecting its AI business “to surpass $10 billion of annual revenue run rate in Q2.” Capacity comments suggest that Microsoft has enough GPUs to continue adding billions in sequential growth for AI, while capex comments suggest it is willing to spend much more than anticipated to keep its lead against peers.

Microsoft’s Stock Sees Downward Revisions Despite AI Revenue Growth

The December quarter (fiscal Q2) is expected to be a challenging quarter for Microsoft, as it battles weaker momentum in gaming, device sales, 365 Commercial products and a slight hiccup for Azure’s growth. The quarter is expected to bring the end of Microsoft’s recent acceleration to high-teens revenue growth, with 11% growth forecasted for Q2; however, it’s important to note that this quarter is typically the lowest due to seasonality. Over the long-term, we believe Microsoft’s lead in monetizing AI in the cloud and with both consumers and enterprises may be insurmountable, as we think it has multiple tailwinds to drive $200 billion in Azure revenue by 2028. Read more here.

Despite being a leader in genAI monetization with numerous monetization outlets, Microsoft guided for a soft fiscal Q2, seeing revenue between $68.1 billion and $69.1 billion, below the consensus estimate for $69.8 billion. As a result of the subpar guide and aforementioned challenges, analyst estimates for both revenue and EPS have declined — over the past quarter, EPS estimates have been revised down from $3.23 to $3.13, while revenue estimates were lowered from $69.1 billion to $68.8 billion.

Microsoft stock's revenue growth to slow to 11% in Q2 and reaccelerate to 13.5% by Q4

Microsoft’s revenue growth is expected to accelerate after a soft December quarter.

AI revenue has been a strong point for Microsoft, as it expects to surpass the $10 billion annual run rate mark this quarter, an incredible growth trajectory from zero to $10 billion in ten quarters. AI contributed 12 points to Azure’s growth last quarter, with its estimated run rate exceeding $6 billion. Growth in AI-driven products has also been strong: Azure Arc customers grew 2x YoY to 33,000, >$100M Azure deals rose 80% YoY, GitHub Copilot subscriber growth accelerated to 35% YoY to 1.8 million paying subscribers, and Copilot on Windows became available on 225M PCs, up 2x QoQ.

AI Stocks Benefit as Capex Comes in Higher than Estimated

2024 showed that capex estimates were ultimately too low, with Big Tech on track to spend 15% to 20% more this year for AI infrastructure than initially estimated. This comes despite fears that these giants are spending more than they can generate to make these investments worthwhile.

However, if you look closely enough at the numbers and the commentary from Big Tech’s executives, there is ROI to be seen from the recent surge in AI spending. AI revenue is already reaching the billions, while growing at the fastest pace of any product in these companies’ histories, which is no small feat. We believe that ROI is likely to become more evident this year as products and cloud revenue streams only get larger.

Due to outsized capex spending and minimal AI revenue, Big Tech isn’t the best way to play AI. Our firm was first to Nvidia’s AI thesis in 2018 for gains of over 4,000% for our Members, and we are now entering small-cap and mid-cap AI beneficiaries that we think will dominate AI growth in 2025. Join us in our next webinar on Thursday at 4:30 p.m. Eastern to hear more on how we are positioned to capitalize on the $300 billion that Big Tech is spending on AI.

Every Thursday at 4:30 pm Eastern, the I/O Fund team holds a webinar for premium members to discuss how to navigate the broad market, as well as various stock entries and exits. We offer trade alerts plus an automated hedging signal. The I/O Fund team is one of the only audited portfolios available to individual investors. Learn more here.here.

Please note: The I/O Fund conducts research and draws conclusions for the Fund’s positions. We then share that information with our readers. This is not a guarantee of a stock’s performance. Please consult your personal financial advisor before buying any stock in the companies mentioned in this analysis.

Recommended Reading:
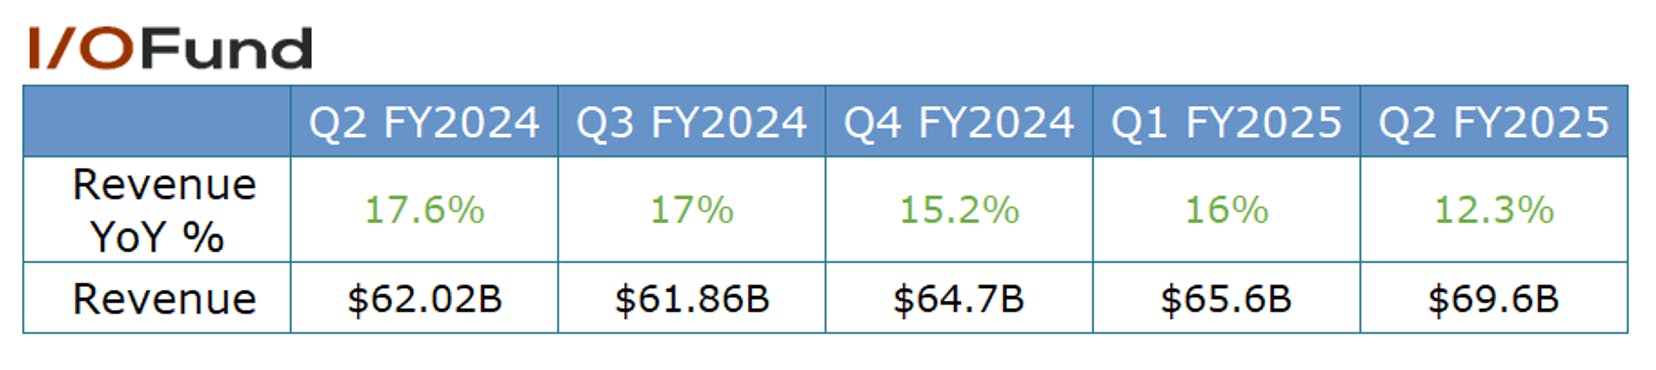
Credo: AI Networking Company Surging in Revenue from Active Electric Cables (AEC)

Credo offers active electric cables (AECs), which drove the bulk of the company’s phenomenal beat and raise last quarter. Power consumption will be at the forefront of infrastructure builds as we move into 2025 and beyond. Blackwell alone represents a 300% increase in power consumption across one generation of GPUs. We’ve covered in the past that as GPUs become more powerful in order to support trillion-plus large language models, the result is that AI requires more power consumption with each future generation of AI acceleration.

Although it’s easy to be laser focused on the AI chips driving this revolution, it’s my stance that 2025 will push networking, switches, optical modules and other networking components into the limelight. Networking performance is vital to the investments Big Tech is making, and Blackwell is the first generation of GPUs that truly test (or perhaps break) the upper limit of networking capabilities in terms of necessitating lower power consumption.

Fiber optic networking is superior to copper networking in nearly every way, as it’s 70% market share in networking in the data center clearly demonstrates. Fiber will continue to dominate in the above 7-meter distances as it’s bandwidth, durability, low electromagnetic interference, and transmission distance of up to hundreds of kilometers is unmatched.

In distances below seven meters, fiber optics are being challenged by active copper cables (ACC) and active electric cables (AECs) due to copper offering lower power, reduced costs, and in some cases, are more reliable. For distances between two meters and seven meters (or about six to 24 feet), active electric cables (AECs) are seeing heightened demand as servers scale up to eight GPUs to now 36 GPU to 72 GPU per rack-scale AI system, and also as GPU clusters grow from 10,000-GPU clusters to 100,000-GPU clusters to soon million-GPU clusters.

As AI applications grow increasingly more complex, requiring more advancements in AI cluster architecture, reliable networking solutions is at the forefront as a key facilitator. Credo operates in the outsized-demand environment that is the data infrastructure market. Credo’s relationship with hyperscale and enterprise data center customers as well as service provider networks and original design manufacturers (ODMs) helps to establish the company’s importance.

Demand for new networking architectures is further evidenced by Credo’s knockout earnings report, where the company reported a top line beat of 8% and a neck-breaking beat of 35% on the bottom line. Due to management’s strong forward-looking guidance, analysts have posted 1-month revisions of 70% on the bottom line and 38% on the top line for the upcoming quarter.

Below, we look at whether Credo can sustain this momentum and other key elements to the company’s hypergrowth.

The company’s ability to provide reliable yet cost-effective connectivity solutions make it a market leader candidate in the AI networking facilitators space. Additionally, Credo’s proprietary serializer/deserialzer (Ser/Des) technology, which is the cornerstone of its IP portfolio, gives it a significant competitive advantage as it enables the power-efficient connectivity and reasonable pricing that the company is known for. More so, Credo licenses this IP to the broader market, though this is not as significant a contributor to overall sales as product sales are. Credo’s product offerings are discussed below.

Active Electric Cables (AECs)

Active electric cables solve a critical issue of data loss that occurs with passive cables at longer lengths, especially in 800 Gbps/port environments with lengths longer than two to three meters. By using two re-timers per cable, AECs prevent data loss by creating a cleaner signal.

Active copper cables (ACCs) do not use retimers, rather they use redrivers. However, as data center network architectures look toward replacing fiber optic in some cases for short haul networking, both AEC and ACC are being evaluated.

Here is what was said in the ACC analysis, which solves a similar issue as AEC:

“Originally, the Blackwell B200s were designed to be 120 kilowatts of power. In order to achieve a lower power wattage of 100 kilowatts of power, Nvidia changed the interconnects from optic to copper. According to the Next Platform, these systems will use up to 5,184 copper cables with up to 200GB per SerDes lane with NVLink switches. The article has a link to a picture of the copper cables, which helps to visualize what thousands of cables going into a NVL72 server looks like.

The new Blackwell systems are being designed with copper cables for the short haul of connecting up to 72 GPUs. Copper networking previously had a reach of 1.5 meters, yet this has evolved to where there is now a reach of 3 meters to assist in connecting these large systems.”

AECs with retimers are a more expensive option compared to ACCs due to offering a cleaner signal, yet they have the additional benefit of being vendor agnostic, which is key for data center operators who are looking to upgrade as they add more racks. AECs also use clock data recovery to reduce jitter for higher signal integrity and can effectively reach distances of up to 5-7 meters, making it a solid choice for networking distances beyond 2-3 meters.

Being copper-based, AECs are cheaper than fiber optic even with the cost of the retimer, and AECs consume less power due to having a small diameter. By allowing more air flow, there are fewer issues with thermal management. This is the primary catalyst for AEC growth within the data center. Per management on the earnings call: “AI-driven demand for high-speed, power efficient and reliable connectivity is accelerating. AECs outperform laser-based optics, offering lower power, reduced cost and maybe most importantly, greater reliability.”

Until recently, fiber optic cables and transceivers have represented the bulk of data center and high-performance computing networking as fiber optics reduce packet loss and increase data transmission. However, with more emphasis being placed on power consumption, hyperscalers are looking for alternatives to the increased power consumption from optical signal transmission and conversion.

Due to liquid cooling, data centers are becoming increasingly dense to where servers are stacked closer than before with only air cooling. This allows for new back-end network solutions that were previously not possible due to distance.

Another factor is the Active Electric Cables (AECs) that Credo offers reduce complexity as data centers scale out and add more racks. In active optic cabling (AOCs), if a module fails, there is significant downtime to contend with. This was pointed out recently on the earnings call: “With increasing rack power densities and the shift to liquid cooling, shorter physical lengths for back-end connections are now possible. This enables AECs to displace optics in certain GPU to switch applications. Optical Link Flaps and AI clusters have become increasingly costly, causing significant downtime and loss of productivity for training clusters.”

800-Gig ZeroFlaps AECs:

About three months ago, Credo announced the 800G HiWire ZeroFlap AECs for AI backend networks with the goal of enabling large AI clusters sized into the hundreds of thousands of GPUs. The new AECs are designed to reach 7 meters with full host-to-switch connectivity, and especially designed for liquid cooled servers. According to an independent source, the 800G OSFPs AOCs are particularly troublesome due to physical constraints that cause the connectors to break. There is also link lapse with AOCs, which are “momentary disruptions in network links.” This is what Credo’s new AECs aim to solve.

Retimers:

The company also offers line card retimers, which means the company participates at a higher attach rate per deal by offering both the network cables and retimers. The company stated: “In Q2, our line card retimer business also added to our positive overall momentum. During the quarter, we generated record quarterly revenue driven by 400-gig and 800-gig applications.”

Optical DSPs and PAM4 SerDes Solutions:

Credo offers data transmission hardware, known as serializer/deserializers (SerDes) solutions that convert multiple streams of data into a single stream of data at rates starting at 100gig and up to 1.6 TBps. The cost- and power-effective SerDes solutions based on mature process nodes, are available in chiplets for integrations with systems-on-chips, multi-chip modules.

The founders of Credo come from Marvell, and currently serve as CTO and COO, so it is not surprising that Credo competes with Marvell directly on DSPs. Optical Digital Signal Processors are key component in optical transceivers used in AI clusters, service provider networks and data centers infrastructures.  You can read more about DSP products in our Marvell coverage here and also here. Also similar to Marvell, Credo works with both Ethernet and PCIe networking, which is important as Gartner sees Ethernet adoption rising rapidly for AI networks due to being an open standard, whereas the PCIe-based Infiniband is forecast to stagnant despite being the dominant leader today.

On the optical side, Credo offers 50G, 100G and will soon offer 200G per lane active optic cables (AOCs) and transceivers. The company is focused on lowering power requirements for modules and management expects the 3nm 200-gig per lane designs to make an impact later this year. In the discussions, management highlights the upcoming DSPs at 10 watts and LROs “at half that power.” This keeps Credo competitive with Marvell’s DSPs also currently at 10 watts.

Regarding LROs, we’ve covered linear pluggable optics here, which help to reduce power consumption and costs, while half-retimed linear optics (LRO) help to stabilize signal transmission. Credo was first to release a 800G PAM4 DSP for half-retimed modules with the idea these modules can reduce power by 40% compared to full-DSP modules. These are both in the discovery phase as to what extent they will be used in data centers, but it’s looking likely LPO and LRO-related suppliers will report revenue from LPOs/LROs come H2 2025/H1 2026.

Hyperscaler Customers:

Credo’s major customers are Microsoft and Amazon, with the third being perhaps Oracle or xAI. Here is what was shared on the call: “Yes. So we've talked about really being focused on the U.S. hyperscalers. And we kind of classify companies within that category, including Oracle. And we've also talked about emerging hyperscalers, companies like xAI, companies like Omniva. And so, we've – what we've talked about is we've talked pretty openly about our relationship with Microsoft, our relationship with Amazon.

We haven't been too clear about exactly which is the hyperscaler that represents customer number three, out of the five U.S. hyperscalers. We did mention during our press release during the OCP conference that we've been doing a lot of good work with xAI specifically in the ZeroFlap category. And so, I can say that we're doing well really, with several customers that will be ramping production.”

Management referred to Microsoft being just above 10% which most closely matches Customer B, which would leave Amazon as Customer A below. Management has emphasized the ramps are not linear.

Financials

Revenue

The company reported record revenue across the three main product lines i.e. active electric cables (AECs), Optical DSPs and line card retimers. Credo witnessed an uptick in shipments, which marked the beginning of the revenue inflection point due to strong AI demand.

  • Q2 was a record-breaking quarter for Credo as revenue grew by 63.6% YoY and 20.6% QoQ to $72.03 million.
  • Management expects Q3 revenue to be in the range of $115 million to $125 million, growing 126.2% YoY and 67% QoQ at the midpoint.
  • Analysts expect Q4 revenue to grow 125.2% YoY to $136.89 million and 133.5% YoY to $139.44 million in FQ1.
  • Looking further out, management guided FY25 (Apr) topline growth of 100%+ and double-digit sequential growth from Q3 to Q4.

Credo Segments:

Products

The product segment is comprised of various Credo’s high-speed and power-efficient connectivity hardware solutions tailored to the data infrastructure market, offerings that are growing in prevalence as the rapid deployment of AI applications require more bandwidth.  In Q2, Product sales grew 88% YoY and 21% QoQ to $64.4 million or 89.4% of total sales, driven by record sales from its AEC and optical DSP product lines. Management highlighted it saw strong demand from its top two customers and an emerging hyperscale customer for AEC products, and that it remains highly optimistic about the future of this business as Credo is well-positioned as a market leader when the adoption of this product line becomes more widespread.

Management highlighted in the earnings call that the second half revenue growth will be driven by AEC products and revenue growth will continue beyond FY2025 as the adoption expands the broader data center market.

The company sees long-term growth opportunities for the 50-gig and 100-gig per lane DSP solutions, driven by strong demand and close relationships with its customers. Looking ahead, management is optimistic on the 200-gig per lane solutions and have recently completed the tape-out of the 3-nanometer 200-gig per lane designs, showcasing power efficiency.

The company witnessed record revenue in the line card retimers revenue driven by 400-gig and 800-gig applications.

Products Engineering Services

Accompanying its robust products business is Credo’s engineering services business, which provides services related to its IP licensing agreements and product engineering services as part of its agreement with certain customers to integrate Credo’s technology solutions into customers’ products. In Q2, engineering services sales grew 90% YoY to $4.6 million as Credo saw a 156% increase in time spent on product engineering service arrangements due to increased shipments.

IP Licensing

Credo’s IP business consists mostly of its propriety SerDes and DSPs technologies licensing, which allows for comparable performance as its peers in data transmission but at a much lower cost. The business posted a revenue decline of (-60% YoY) to $3.0 million in Q2 due to fewer contract wins. Notably, management said during its earnings call that “that IP licensing will become a smaller percentage over time. We will continue to treat the business strategically.”

Margins: Management Guides for Strong QoQ Improvement in Operating Margin

Margins have been improving steadily, yet most importantly, the operating margin is expected to swing to GAAP positive and expand from (-20.2%) two quarters ago, and (-11.7%) one quarter ago, with guidance for an operating margin of 11.9% in the upcoming quarter. Due to commentary that adjusted operating expenses will grow “at less than half the rate of revenue from FY2024 to FY2025,” we expect that Credo will continue to see strong operating leverage. Adjusted operating margin is also expanding nicely from (-1.7%) a year ago to 11.5% in the most recent quarter.

The product adjusted gross margin improved by 70 bps sequentially and 940 bps YoY to 62.2% in Q2, driven primarily by increasing scale.

  • Q2 adjusted gross margin was 63.6% compared to 59.9% in the same period last year. Management is targeting a long-term adjusted gross margin in the range of 63% to 65%.
  • Q2 operating margin was (-11.7%) compared to (-20.2%) in the same period last year.
  • Management has guided a strong improvement in the operating margin for the next quarter to 11.9%, primarily driven by operating leverage.
  • Adjusted operating margin was 11.5% in Q2 compared to (-1.7%) in the same period last year.
  • Management is targeting long-term adjusted operating margin of 30% to 35%.
  • Management expects adjusted operating expenses to grow at less than half the rate of revenue from FY 2024 to FY 2025, suggesting strong operating leverage for this fiscal year.
  • Net loss in Q2 was (-$4.2 million) or (-5.9%) of revenue compared to (-$6.6 million) or (-15%) of revenue in the same period last year. Adjusted net income was $12.3 million or 17.0% of revenue compared to $1.2 million or 2.6% in the same period last year.
  • The difference between the GAAP and non-GAAP net income is due to high stock-based compensation. Stock-based compensation was $16.7 million or 23.1% of revenue.

EPS Grows 600% YoY with more Triple Digit Growth Expected

Q2 adjusted EPS grew by 600% YoY to $0.07, driven by substantial operating leverage. Analysts expect EPS to continue to improve, primarily driven by operating leverage as sales growth stands to outpace expense.

  • Analysts expect Q3 adjusted EPS to grow 358.6% YoY to $0.18 and 219% YoY to $0.22 for Q4.
  • Looking ahead, analysts expect the adjusted EPS to grow 467.6% YoY to $0.51 for FY2025 and 96.6% YoY to $1.00 for FY2026.

Cash Flow and Balance Sheet

Credo’s cash flows have been lumpy in the last few quarters, with the company investing in growth due to strong AI demand. The cash flows should improve in the coming quarters as profits increase.

  • Q2 operating cash flow was $10.3 million, or 14.3% of revenue, compared 11.4% in the same period last fiscal year. This is considerably higher than FY 2023’s (-13.4%) margins but lower than FY 2024’s 17.0% margin.
  • Q2 free cash flow was (-$11.7 million), or (-16.2%) of revenue, compared to 6.7% of revenue in the same period last year. This was also considerably higher than FY 2023’s (-25.2%) margin but still lower than FY 2024’s 8.9% margin. CapEx was higher at $21.9 million in Q2 that led to lower free cash flows, was driven largely by production of 5-nanometer tape-outs.
  • The company has a cash and short-term investments of $383 million and no debt as of the end of Q2 FY 2025. During the Q2 earnings call, management highlighted its belief the company remains well-capitalized to continue investing in growth opportunities while maintaining a “substantial” cash buffer.

Valuation:

Credo’s stock continues to build momentum, climbing over 130% in six months (over 300% uptick in one year) benefitting from the global acceleration of AI adoption. On a sales valuation, Credo is trading at 35x Forward P/S compared to Nvidia at 28x Forward P/S and Astera Lab at 32 Forward P/S. These are the highest priced AI-related stocks on the hardware side.

The PE Ratio is high at 158X forward but this is irrelevant as the company will become newly GAAP profitable next quarter and is only recently profitable on an adjusted basis.

Conclusion:

The over-arching investment thesis for a portfolio concentration in AI networking component companies is that AI models are driving an exponential increase in compute requirements, while the scaling of workloads is limited by the existing network. Although GPUs and AI accelerators capture the headlines, as we move into 2025, hyperscalers will become equally as focused (if not more so) on networking capabilities as GPUs and ASICs are reaching the upper limit of what current networking architectures are capable of.

Ushering in the golden age of AI applications requires a cost-effective and technologically advanced connectivity solutions, and Credo is well-positioned to benefit from as a market leader. Though the company’s stock has already experienced exponential growth and current valuation might give some investors pause, there is room for more upside as management believes Q3 marks the beginning of the topline inflection point that Credo has long anticipated to come. As AI clusters advancements necessitate innovations in computing power and cooling technology, network reliability and the need to reduce costs/power has become ever more important.

We are looking at a handful of companies in the area of AI networking, advanced packaging metrology, and direct liquid cooling plus others that collectively fall into the category of AI hardware. Due to being a firm that specializes in Nvidia and AI, you can look forward to a more strategic approach to how we plan to build our portfolio come 2025. Learn more in our Q1 webinar.in our Q1 webinar.

This is a sample of what you can expect in our upcoming Discovery tier, where we will cover a new stock idea every week. We are excited to bring you more coverage from the I/O Fund team that is geared toward new idea generation only. Our ETA for launching this new tier is February 2025.

Please note: The I/O Fund conducts research and draws conclusions for the Fund’s positions. We then share that information with our readers. This is not a guarantee of a stock’s performance. Please consult your personal financial advisor before buying any stock in the companies mentioned in this analysis.

Recommended Reading:
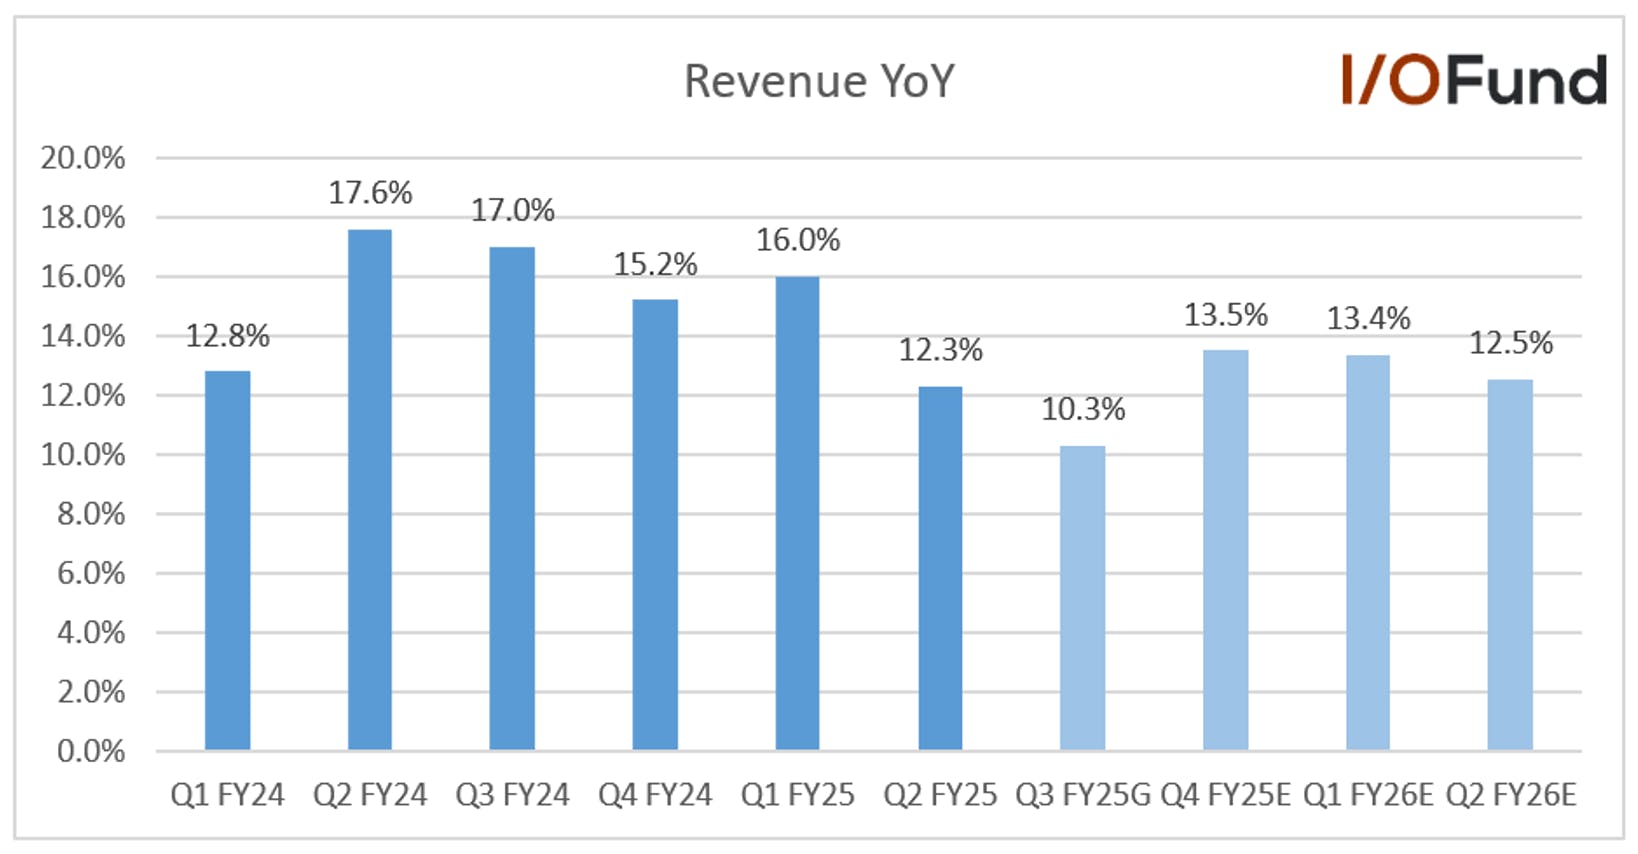
Credo: AI Networking Company Surging in Revenue from Active Electric Cables (AEC)

Credo offers active electric cables (AECs), which drove the bulk of the company’s phenomenal beat and raise last quarter. Power consumption will be at the forefront of infrastructure builds as we move into 2025 and beyond. Blackwell alone represents a 300% increase in power consumption across one generation of GPUs. We’ve covered in the past that as GPUs become more powerful in order to support trillion-plus large language models, the result is that AI requires more power consumption with each future generation of AI acceleration.

Although it’s easy to be laser focused on the AI chips driving this revolution, it’s my stance that 2025 will push networking, switches, optical modules and other networking components into the limelight. Networking performance is vital to the investments Big Tech is making, and Blackwell is the first generation of GPUs that truly test (or perhaps break) the upper limit of networking capabilities in terms of necessitating lower power consumption.

Fiber optic networking is superior to copper networking in nearly every way, as it’s 70% market share in networking in the data center clearly demonstrates. Fiber will continue to dominate in the above 7-meter distances as it’s bandwidth, durability, low electromagnetic interference, and transmission distance of up to hundreds of kilometers is unmatched.

In distances below seven meters, fiber optics are being challenged by active copper cables (ACC) and active electric cables (AECs) due to copper offering lower power, reduced costs, and in some cases, are more reliable. For distances between two meters and seven meters (or about six to 24 feet), active electric cables (AECs) are seeing heightened demand as servers scale up to eight GPUs to now 36 GPU to 72 GPU per rack-scale AI system, and also as GPU clusters grow from 10,000-GPU clusters to 100,000-GPU clusters to soon million-GPU clusters.

As AI applications grow increasingly more complex, requiring more advancements in AI cluster architecture, reliable networking solutions is at the forefront as a key facilitator. Credo operates in the outsized-demand environment that is the data infrastructure market. Credo’s relationship with hyperscale and enterprise data center customers as well as service provider networks and original design manufacturers (ODMs) helps to establish the company’s importance.

Demand for new networking architectures is further evidenced by Credo’s knockout earnings report, where the company reported a top line beat of 8% and a neck-breaking beat of 35% on the bottom line. Due to management’s strong forward-looking guidance, analysts have posted 1-month revisions of 70% on the bottom line and 38% on the top line for the upcoming quarter.

Below, we look at whether Credo can sustain this momentum and other key elements to the company’s hypergrowth.

The company’s ability to provide reliable yet cost-effective connectivity solutions make it a market leader candidate in the AI networking facilitators space. Additionally, Credo’s proprietary serializer/deserialzer (Ser/Des) technology, which is the cornerstone of its IP portfolio, gives it a significant competitive advantage as it enables the power-efficient connectivity and reasonable pricing that the company is known for. More so, Credo licenses this IP to the broader market, though this is not as significant a contributor to overall sales as product sales are. Credo’s product offerings are discussed below.

Active Electric Cables (AECs)

Active electric cables solve a critical issue of data loss that occurs with passive cables at longer lengths, especially in 800 Gbps/port environments with lengths longer than two to three meters. By using two re-timers per cable, AECs prevent data loss by creating a cleaner signal.

Active copper cables (ACCs) do not use retimers, rather they use redrivers. However, as data center network architectures look toward replacing fiber optic in some cases for short haul networking, both AEC and ACC are being evaluated.

Here is what was said in the ACC analysis, which solves a similar issue as AEC:

“Originally, the Blackwell B200s were designed to be 120 kilowatts of power. In order to achieve a lower power wattage of 100 kilowatts of power, Nvidia changed the interconnects from optic to copper. According to the Next Platform, these systems will use up to 5,184 copper cables with up to 200GB per SerDes lane with NVLink switches. The article has a link to a picture of the copper cables, which helps to visualize what thousands of cables going into a NVL72 server looks like.

The new Blackwell systems are being designed with copper cables for the short haul of connecting up to 72 GPUs. Copper networking previously had a reach of 1.5 meters, yet this has evolved to where there is now a reach of 3 meters to assist in connecting these large systems.”

AECs with retimers are a more expensive option compared to ACCs due to offering a cleaner signal, yet they have the additional benefit of being vendor agnostic, which is key for data center operators who are looking to upgrade as they add more racks. AECs also use clock data recovery to reduce jitter for higher signal integrity and can effectively reach distances of up to 5-7 meters, making it a solid choice for networking distances beyond 2-3 meters.

Being copper-based, AECs are cheaper than fiber optic even with the cost of the retimer, and AECs consume less power due to having a small diameter. By allowing more air flow, there are fewer issues with thermal management. This is the primary catalyst for AEC growth within the data center. Per management on the earnings call: “AI-driven demand for high-speed, power efficient and reliable connectivity is accelerating. AECs outperform laser-based optics, offering lower power, reduced cost and maybe most importantly, greater reliability.”

Until recently, fiber optic cables and transceivers have represented the bulk of data center and high-performance computing networking as fiber optics reduce packet loss and increase data transmission. However, with more emphasis being placed on power consumption, hyperscalers are looking for alternatives to the increased power consumption from optical signal transmission and conversion.

Due to liquid cooling, data centers are becoming increasingly dense to where servers are stacked closer than before with only air cooling. This allows for new back-end network solutions that were previously not possible due to distance.

Another factor is the Active Electric Cables (AECs) that Credo offers reduce complexity as data centers scale out and add more racks. In active optic cabling (AOCs), if a module fails, there is significant downtime to contend with. This was pointed out recently on the earnings call: “With increasing rack power densities and the shift to liquid cooling, shorter physical lengths for back-end connections are now possible. This enables AECs to displace optics in certain GPU to switch applications. Optical Link Flaps and AI clusters have become increasingly costly, causing significant downtime and loss of productivity for training clusters.”

800-Gig ZeroFlaps AECs:

About three months ago, Credo announced the 800G HiWire ZeroFlap AECs for AI backend networks with the goal of enabling large AI clusters sized into the hundreds of thousands of GPUs. The new AECs are designed to reach 7 meters with full host-to-switch connectivity, and especially designed for liquid cooled servers. According to an independent source, the 800G OSFPs AOCs are particularly troublesome due to physical constraints that cause the connectors to break. There is also link lapse with AOCs, which are “momentary disruptions in network links.” This is what Credo’s new AECs aim to solve.

Retimers:

The company also offers line card retimers, which means the company participates at a higher attach rate per deal by offering both the network cables and retimers. The company stated: “In Q2, our line card retimer business also added to our positive overall momentum. During the quarter, we generated record quarterly revenue driven by 400-gig and 800-gig applications.”

Optical DSPs and PAM4 SerDes Solutions:

Credo offers data transmission hardware, known as serializer/deserializers (SerDes) solutions that convert multiple streams of data into a single stream of data at rates starting at 100gig and up to 1.6 TBps. The cost- and power-effective SerDes solutions based on mature process nodes, are available in chiplets for integrations with systems-on-chips, multi-chip modules.

The founders of Credo come from Marvell, and currently serve as CTO and COO, so it is not surprising that Credo competes with Marvell directly on DSPs. Optical Digital Signal Processors are key component in optical transceivers used in AI clusters, service provider networks and data centers infrastructures.  You can read more about DSP products in our Marvell coverage here and also here. Also similar to Marvell, Credo works with both Ethernet and PCIe networking, which is important as Gartner sees Ethernet adoption rising rapidly for AI networks due to being an open standard, whereas the PCIe-based Infiniband is forecast to stagnant despite being the dominant leader today.

On the optical side, Credo offers 50G, 100G and will soon offer 200G per lane active optic cables (AOCs) and transceivers. The company is focused on lowering power requirements for modules and management expects the 3nm 200-gig per lane designs to make an impact later this year. In the discussions, management highlights the upcoming DSPs at 10 watts and LROs “at half that power.” This keeps Credo competitive with Marvell’s DSPs also currently at 10 watts.

Regarding LROs, we’ve covered linear pluggable optics here, which help to reduce power consumption and costs, while half-retimed linear optics (LRO) help to stabilize signal transmission. Credo was first to release a 800G PAM4 DSP for half-retimed modules with the idea these modules can reduce power by 40% compared to full-DSP modules. These are both in the discovery phase as to what extent they will be used in data centers, but it’s looking likely LPO and LRO-related suppliers will report revenue from LPOs/LROs come H2 2025/H1 2026.

Hyperscaler Customers:

Credo’s major customers are Microsoft and Amazon, with the third being perhaps Oracle or xAI. Here is what was shared on the call: “Yes. So we've talked about really being focused on the U.S. hyperscalers. And we kind of classify companies within that category, including Oracle. And we've also talked about emerging hyperscalers, companies like xAI, companies like Omniva. And so, we've – what we've talked about is we've talked pretty openly about our relationship with Microsoft, our relationship with Amazon.

We haven't been too clear about exactly which is the hyperscaler that represents customer number three, out of the five U.S. hyperscalers. We did mention during our press release during the OCP conference that we've been doing a lot of good work with xAI specifically in the ZeroFlap category. And so, I can say that we're doing well really, with several customers that will be ramping production.”

Management referred to Microsoft being just above 10% which most closely matches Customer B, which would leave Amazon as Customer A below. Management has emphasized the ramps are not linear.

Financials

Revenue

The company reported record revenue across the three main product lines i.e. active electric cables (AECs), Optical DSPs and line card retimers. Credo witnessed an uptick in shipments, which marked the beginning of the revenue inflection point due to strong AI demand.

  • Q2 was a record-breaking quarter for Credo as revenue grew by 63.6% YoY and 20.6% QoQ to $72.03 million.
  • Management expects Q3 revenue to be in the range of $115 million to $125 million, growing 126.2% YoY and 67% QoQ at the midpoint.
  • Analysts expect Q4 revenue to grow 125.2% YoY to $136.89 million and 133.5% YoY to $139.44 million in FQ1.
  • Looking further out, management guided FY25 (Apr) topline growth of 100%+ and double-digit sequential growth from Q3 to Q4.

Credo Segments:

Products

The product segment is comprised of various Credo’s high-speed and power-efficient connectivity hardware solutions tailored to the data infrastructure market, offerings that are growing in prevalence as the rapid deployment of AI applications require more bandwidth.  In Q2, Product sales grew 88% YoY and 21% QoQ to $64.4 million or 89.4% of total sales, driven by record sales from its AEC and optical DSP product lines. Management highlighted it saw strong demand from its top two customers and an emerging hyperscale customer for AEC products, and that it remains highly optimistic about the future of this business as Credo is well-positioned as a market leader when the adoption of this product line becomes more widespread.

Management highlighted in the earnings call that the second half revenue growth will be driven by AEC products and revenue growth will continue beyond FY2025 as the adoption expands the broader data center market.

The company sees long-term growth opportunities for the 50-gig and 100-gig per lane DSP solutions, driven by strong demand and close relationships with its customers. Looking ahead, management is optimistic on the 200-gig per lane solutions and have recently completed the tape-out of the 3-nanometer 200-gig per lane designs, showcasing power efficiency.

The company witnessed record revenue in the line card retimers revenue driven by 400-gig and 800-gig applications.

Products Engineering Services

Accompanying its robust products business is Credo’s engineering services business, which provides services related to its IP licensing agreements and product engineering services as part of its agreement with certain customers to integrate Credo’s technology solutions into customers’ products. In Q2, engineering services sales grew 90% YoY to $4.6 million as Credo saw a 156% increase in time spent on product engineering service arrangements due to increased shipments.

IP Licensing

Credo’s IP business consists mostly of its propriety SerDes and DSPs technologies licensing, which allows for comparable performance as its peers in data transmission but at a much lower cost. The business posted a revenue decline of (-60% YoY) to $3.0 million in Q2 due to fewer contract wins. Notably, management said during its earnings call that “that IP licensing will become a smaller percentage over time. We will continue to treat the business strategically.”

Margins: Management Guides for Strong QoQ Improvement in Operating Margin

Margins have been improving steadily, yet most importantly, the operating margin is expected to swing to GAAP positive and expand from (-20.2%) two quarters ago, and (-11.7%) one quarter ago, with guidance for an operating margin of 11.9% in the upcoming quarter. Due to commentary that adjusted operating expenses will grow “at less than half the rate of revenue from FY2024 to FY2025,” we expect that Credo will continue to see strong operating leverage. Adjusted operating margin is also expanding nicely from (-1.7%) a year ago to 11.5% in the most recent quarter.

The product adjusted gross margin improved by 70 bps sequentially and 940 bps YoY to 62.2% in Q2, driven primarily by increasing scale.

  • Q2 adjusted gross margin was 63.6% compared to 59.9% in the same period last year. Management is targeting a long-term adjusted gross margin in the range of 63% to 65%.
  • Q2 operating margin was (-11.7%) compared to (-20.2%) in the same period last year.
  • Management has guided a strong improvement in the operating margin for the next quarter to 11.9%, primarily driven by operating leverage.
  • Adjusted operating margin was 11.5% in Q2 compared to (-1.7%) in the same period last year.
  • Management is targeting long-term adjusted operating margin of 30% to 35%.
  • Management expects adjusted operating expenses to grow at less than half the rate of revenue from FY 2024 to FY 2025, suggesting strong operating leverage for this fiscal year.
  • Net loss in Q2 was (-$4.2 million) or (-5.9%) of revenue compared to (-$6.6 million) or (-15%) of revenue in the same period last year. Adjusted net income was $12.3 million or 17.0% of revenue compared to $1.2 million or 2.6% in the same period last year.
  • The difference between the GAAP and non-GAAP net income is due to high stock-based compensation. Stock-based compensation was $16.7 million or 23.1% of revenue.

EPS Grows 600% YoY with more Triple Digit Growth Expected

Q2 adjusted EPS grew by 600% YoY to $0.07, driven by substantial operating leverage. Analysts expect EPS to continue to improve, primarily driven by operating leverage as sales growth stands to outpace expense.

  • Analysts expect Q3 adjusted EPS to grow 358.6% YoY to $0.18 and 219% YoY to $0.22 for Q4.
  • Looking ahead, analysts expect the adjusted EPS to grow 467.6% YoY to $0.51 for FY2025 and 96.6% YoY to $1.00 for FY2026.

Cash Flow and Balance Sheet

Credo’s cash flows have been lumpy in the last few quarters, with the company investing in growth due to strong AI demand. The cash flows should improve in the coming quarters as profits increase.

  • Q2 operating cash flow was $10.3 million, or 14.3% of revenue, compared 11.4% in the same period last fiscal year. This is considerably higher than FY 2023’s (-13.4%) margins but lower than FY 2024’s 17.0% margin.
  • Q2 free cash flow was (-$11.7 million), or (-16.2%) of revenue, compared to 6.7% of revenue in the same period last year. This was also considerably higher than FY 2023’s (-25.2%) margin but still lower than FY 2024’s 8.9% margin. CapEx was higher at $21.9 million in Q2 that led to lower free cash flows, was driven largely by production of 5-nanometer tape-outs.
  • The company has a cash and short-term investments of $383 million and no debt as of the end of Q2 FY 2025. During the Q2 earnings call, management highlighted its belief the company remains well-capitalized to continue investing in growth opportunities while maintaining a “substantial” cash buffer.

Valuation:

Credo’s stock continues to build momentum, climbing over 130% in six months (over 300% uptick in one year) benefitting from the global acceleration of AI adoption. On a sales valuation, Credo is trading at 35x Forward P/S compared to Nvidia at 28x Forward P/S and Astera Lab at 32 Forward P/S. These are the highest priced AI-related stocks on the hardware side.

The PE Ratio is high at 158X forward but this is irrelevant as the company will become newly GAAP profitable next quarter and is only recently profitable on an adjusted basis.

Conclusion:

The over-arching investment thesis for a portfolio concentration in AI networking component companies is that AI models are driving an exponential increase in compute requirements, while the scaling of workloads is limited by the existing network. Although GPUs and AI accelerators capture the headlines, as we move into 2025, hyperscalers will become equally as focused (if not more so) on networking capabilities as GPUs and ASICs are reaching the upper limit of what current networking architectures are capable of.

Ushering in the golden age of AI applications requires a cost-effective and technologically advanced connectivity solutions, and Credo is well-positioned to benefit from as a market leader. Though the company’s stock has already experienced exponential growth and current valuation might give some investors pause, there is room for more upside as management believes Q3 marks the beginning of the topline inflection point that Credo has long anticipated to come. As AI clusters advancements necessitate innovations in computing power and cooling technology, network reliability and the need to reduce costs/power has become ever more important.

We are looking at a handful of companies in the area of AI networking, advanced packaging metrology, and direct liquid cooling plus others that collectively fall into the category of AI hardware. Due to being a firm that specializes in Nvidia and AI, you can look forward to a more strategic approach to how we plan to build our portfolio come 2025. Learn more in our Q1 webinar.in our Q1 webinar.

This is a sample of what you can expect in our upcoming Discovery tier, where we will cover a new stock idea every week. We are excited to bring you more coverage from the I/O Fund team that is geared toward new idea generation only. Our ETA for launching this new tier is February 2025.

Please note: The I/O Fund conducts research and draws conclusions for the Fund’s positions. We then share that information with our readers. This is not a guarantee of a stock’s performance. Please consult your personal financial advisor before buying any stock in the companies mentioned in this analysis.

Recommended Reading:
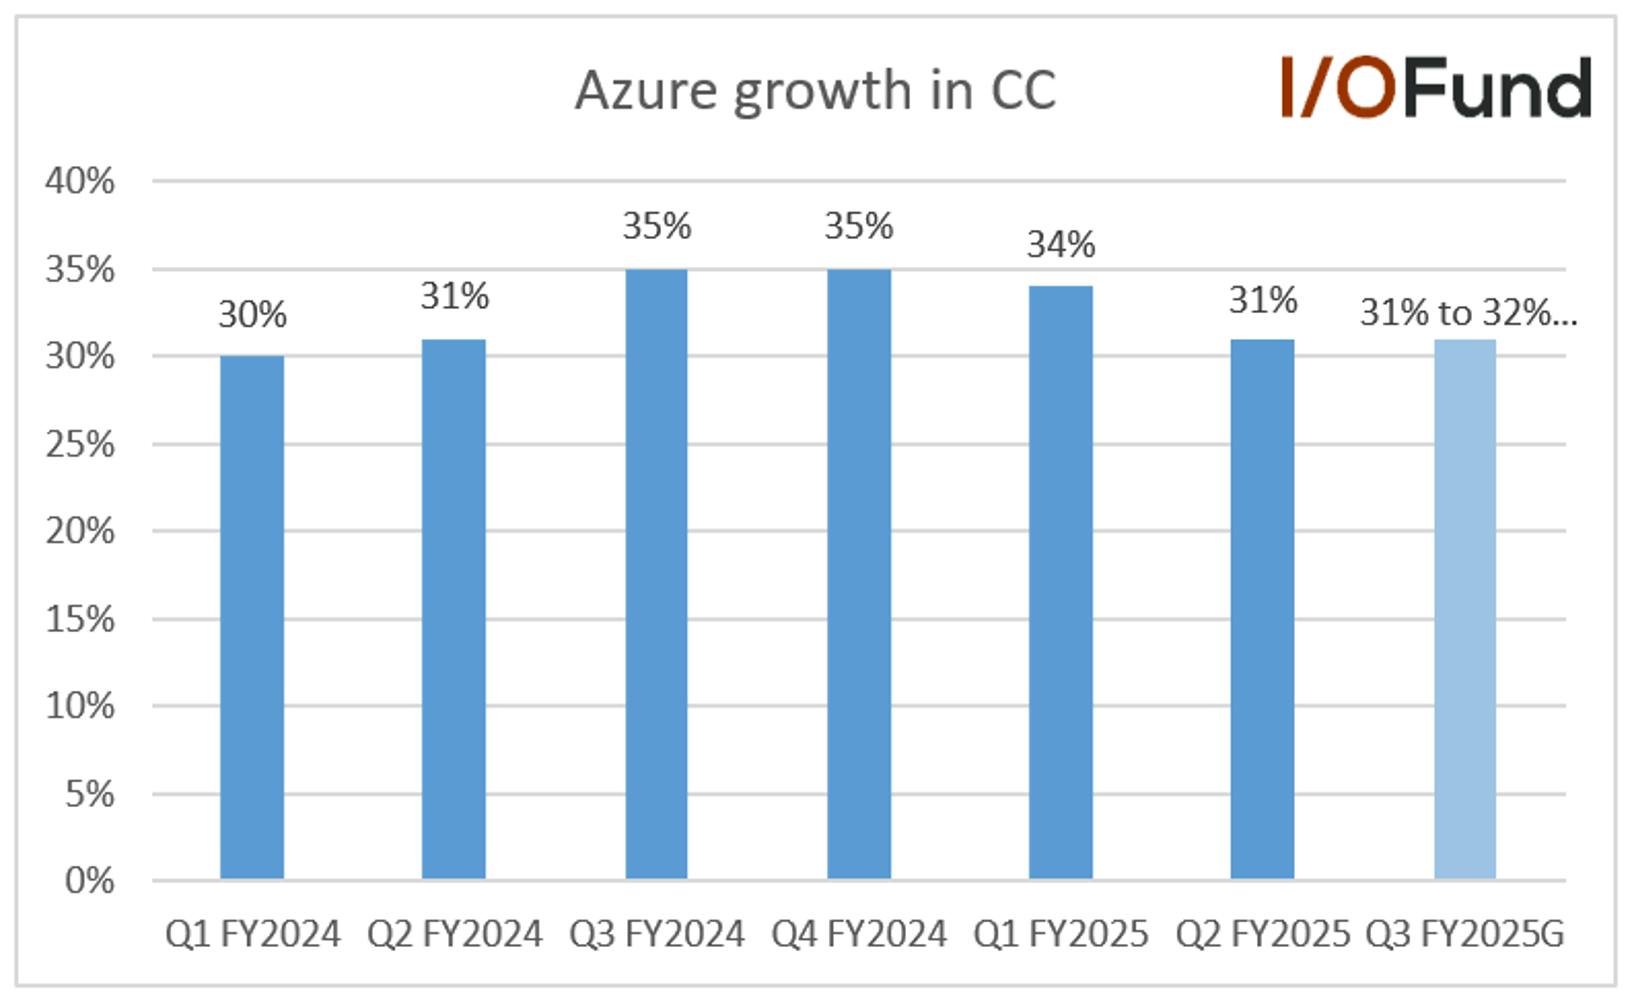
Why Solana is Outperforming Ethereum by 26,500% Since 2020

Ethereum is widely accepted as the 2nd most popular crypto in the market behind Bitcoin. It was first to market with smart contracts and has remained the reigning leader of decentralized apps. However, Ethereum experienced heightened competition when Solana hit the market in March 2020 as an alternative layer 1 network.

Since Solana began trading in 2020, it is up about +28,000% compared to Ethereum’s +1500% during the same time, proving to potentially be a so-called “Ethereum Killer.”  

Solana’s 28000 Percent Rise - The Ultimate Ethereum Killer Cryptocurrency

In this report, we will explore the competitive landscape between Ethereum and Solana for layer 1 dominance. While Ethereum’s idea was exceptional and original, execution has been clumsy, opening the door for a better and more efficient option, which is what Solana aims to provide.

While the background and fundamentals are always important to understand, the world of crypto is mostly pre-revenue technologies that are still nascent in their adoption, with little news or earnings reports to review. For this reason, the I/O Fund leans heavily into technical analysis to manage these positions. We expect this drop in Solana to end soon, which should lead to one more swing higher.

Crypto is a staple for the I/O Fund’s portfolio, with two crypto positions seeing gains of 1,000% up to 4,000%, and quick-trade momentum positions gaining 80% to 120%, or more. To access more in-depth analysis on I/O Fund’s crypto holdings, and weekly webinars where we discuss the price levels we’re watching, click here.

Layer 1 Competitive Landscape

One of the fundamental axioms within the world of crypto is what’s known as the blockchain trilemma. Crypto technologies aspire to achieve three critical features: decentralization, security and scalability.
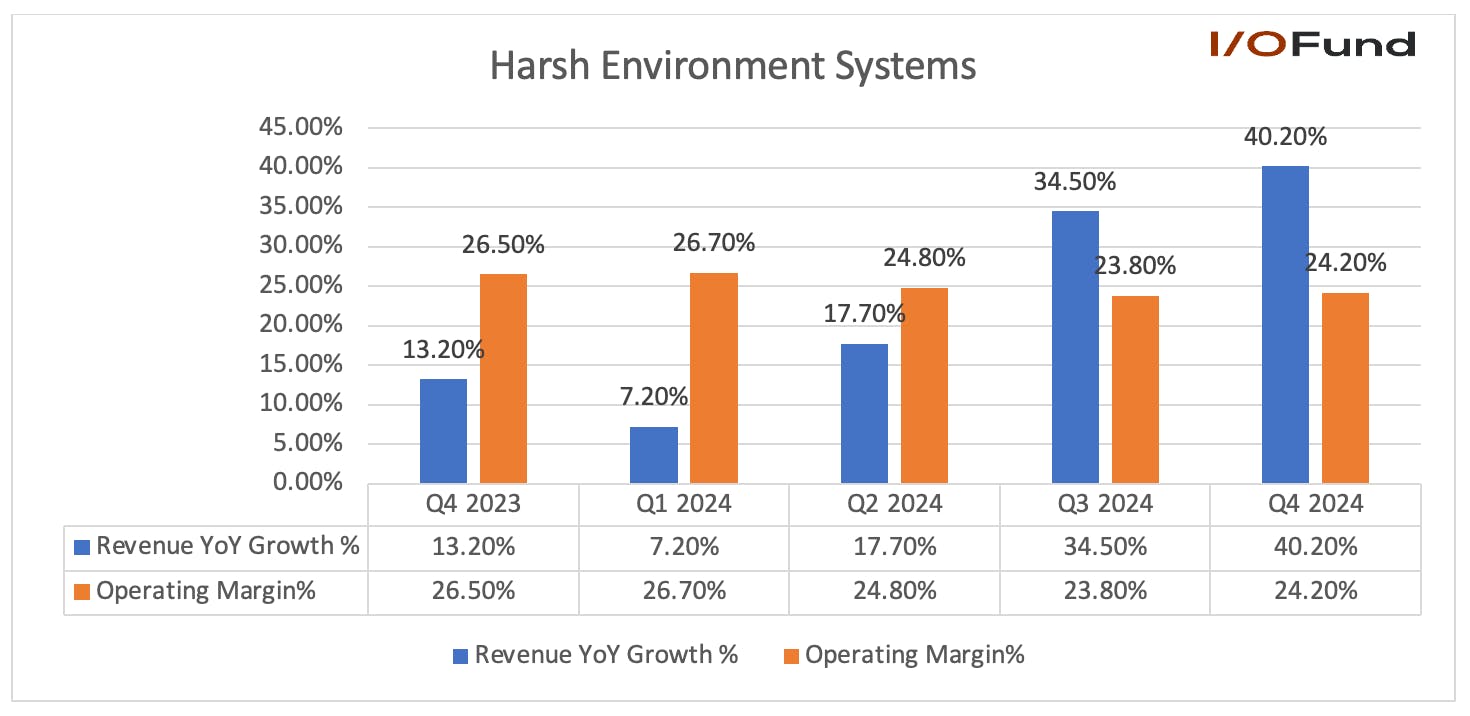
This trifecta is often called the “trilemma” as blockchain technologies can typically solve for two of these problems, yet struggle to solve all three. Instead, current blockchain technologies excel at two of the three, and then must experiment to solve the third with sidechains, sharding and other nascent attempts at solving the third requirement.

For example, Bitcoin’s network has prioritized security and decentralization, while sacrificing scalability. The network sends 7 transactions per second and can take up to 10 minutes to confirm a transaction. The upside is the network’s security is bullet-proof with a hash rate of 460 Exahash per second. It’s impossible today for a supercomputer to crack the Proof-of-Work (PoW) encryption.

Ethereum initially utilized a PoW protocol like Bitcoin. Therefore, in the blockchain trilemma, it sought to be decentralized and secure. However, it accomplished these two features at the cost of scalability. The limitations of a truly secure and decentralized network required multiple nodes confirming each transaction. So, in periods like early 2021, when the demand for the Ethereum network far exceeded its ability to handle high activity, the cost of each transaction rose to astronomical prices, making the network unusable for simple transactions. For example, Time Magazine’s TIMEPieces resulted in exorbitant gas fees where 10 NFTs were priced at 1 ETH for $2500 or $2800 yet due to gas fees, one buyer paid as much as $70,000.

Chart showing Ethereum's average gas prices over time, illustrating transaction costs and scalability from 2021-2025.

Source: YCharts

Considering that Ethereum is a business that is attempting to disrupt current technologies, not being able to scale is a serious problem. They have attempted to resolve this critical limitation by shifting their confirmation protocol from Proof-of-Work to Proof-of-Stake (PoS). This protocol works by selecting validators in proportion to the quantity of Ethereum holdings being staked. This is done to avoid the computational cost found in the PoW protocol. This has certainly improved the scalability of Ethereum, but at the cost of being decentralized and secure.

To understand these concerns, consider that Ethereum had seen up to 70% of its supply held by whales in 2021, although the latest report is that 43% of ETH supply is held by whales. The concentration is staggering as six of the top crypto wallets have 98% of their wallets allocated to the Ethereum blockchain, according to TechCrunch.

When looking more closely at Proof of Stake (PoS) validators for Ethereum, Lido is the largest Ethereum validator at 33% stake and Coinbase is at 15%. To help illustrate how unusual this concentration is, consider that the Nakamoto Coefficient for Ethereum is 2, which means it takes only two nodes to control the blockchain. Truly, it’s beyond belief the coefficient is this low for the world’s top blockchain Layer 1. Bitcoin’s is estimated to be as high as 9601. The highest Coefficient beyond Bitcoin is 236 for a network called Humanode, and its goal is to increase the coefficient over time. The last time Solana’s was reported in 2023, it stood at a coefficient of 31.

Also consider that PoS requires 32 ETH, or about $96,000 per node, whereas Proof of Work requires a mining setup of less than $10,000. This means Ethereum is far less democratized, leading to some centralization by the very fact Lido has such a large pool of validators at 33%. There was also a report in May of 2024 that one whale staked about $500 million to the network.

When you add the fact there are thousands of nodes globally, a Proof of Work system is truly decentralized whereas a Proof of Stake (PoS) system could still concentrate itself through “whales;” those who own a disproportionate amount of a single token. This results in the wealthiest crypto holders having a higher concentration in what is essentially a lottery system of validators. If a person has a thousand lottery tickets compared to a person with only ten, the person with 1,000 tickets (or nodes in this case) is more likely to be chosen to validate the ledger. This could lead to corruption, and it ultimately does not fit crypto’s ethos that those with a higher concentration of wealth are allowed to be more trusted and have more authority.

The ongoing complaints and limitations of Ethereum, coupled with long, drawn-out attempts to solve these issues, have allowed the opportunity for better layer 1 options, like Solana.

The I/O Fund is also closely analyzing the supply chain to identify overlooked beneficiaries of the AI infrastructure buildout, sharing this information as well as potential buy and sell plans and real time trade alerts with premium members. The I/O Fund recently entered two separate beneficiaries for gains of 23% and 17% since November. Learn more here.herehere.

Solana’s Proof of History Protocol, Upcoming Firedancer Upgrade

Started in 2017 by an ex-Qualcomm engineer, the primary improvement the Solana network offered was that it was based on a new Proof of History (PoH) protocol.  This revolutionary protocol offers a high throughput of 65,000 transactions per second on GPUs, although other blockchain networks have a higher time to finality. Solana accomplishes this without second layers or side chains by using the Proof of History (PoH) consensus mechanism. PoH creates a historical record that proves an event occurred at a specific moment in time. Rather than validators agreeing on a time, Solana validators maintain their own clock by encoding the time with a cryptographic hash function (SHA-256). This circumvents the need to wait for confirmation, thereby resulting in a higher throughput.

In short, Solana is a much more efficient layer 1 — it is significantly faster than Ethereum’s updated PoS protocol, and more secure. This is one reason why Solana is meaningfully outperforming Ethereum since it started trading in 2020. While this technology is still very nascent and not adopted on the level that would make it comparable to your standard hyperscalers, it is providing significant alpha when managed properly.

This year, Solana is expecting to undergo a massive network upgrade, expanding to its fourth validator, Firedancer. Developed by Jump Trading, the new validator client has been built to significantly improve Solana’s transaction processing capabilities. Jump says that Firedancer can allow the Solana network to process more than 1,000,000 transactions per second, boosting speeds and substantially boosting network security.

Such a boost in performance will further enhance Solana’s competitive standing in the layer 1 ecosystem, letting it keep pace with Bitcoin and Ethereum, which is also planning an upgrade this year (Prague/Electra), focusing on scalability and security.

Technical Analysis and Crypto

As stated, crypto tends to have little news moving the price swings. They have no earnings reports, and most are pre-revenue. So, one is left to believe that the large price swings are truly random or governed by a different set of rules.

For those that study crypto price charts, it is apparent that the swings are not random and lend themselves to technical analysis. Technical analysis is simply the study of herd sentiment, which manifests in repeatable patterns, time and time again.

This is the technique the I/O Fund has used to manage a large Bitcoin position since 2019. For example, in early 2021, we reduced our Bitcoin position in half around the $50K region.

Bitcoin ($BTC) chart: 3rd wave uptrend to $65K-$75K, then 4th wave drawdown for buying opportunity.

Source: Knox Ridley’s X

We then boldly stated that Bitcoin was going to rally from the $16,000 region in December of 2022. We backed this analysis up with 12 buy alerts within our premium service between $27,000 and $62,000.

I/O Fund alerts: strategic buy alerts & market insights, Bitcoin's rally from $27K to $62K.

Source: I/O Fund’s Real-Time Notifications

We have since started taking well deserved gains, as Bitcoin has reached our long-term targets. However, based on the same techniques used to call a top in 2021, and a bottom in 2022, we see a low developing, which should be followed with one more swing higher into the $114,000 – $150,000. This is where we would reduce our Bitcoin holdings significantly. Until then, we see this dip as a buying opportunity for the more nimble investors.

Bitcoin analysis by I/O Fund: projects $114K-$150K range, take gains, dips are buying opp for nimble investors.

What’s important to understand about herd sentiment is that it moves in 5 waves. The 3rd wave is the moment where everyone realizes at once the true direction of the trend. We see shorts covering at the same time and early adopters want to buy more. This is met with a vertical movement in price that is accompanied with max volume and max momentum. This was clearly the period between September 2023 and March of 2024.

The final 5th wave is where the herd pushes for one more swing high. The early adopter tends to take gains in the 3rd wave, while those who missed out are looking to finally get in, under the belief that the uptrend is just starting. The 5th wave is a move to new highs in price, but on lower volume and lower momentum.

From our estimation, we are in wave 4 of this final 5th wave. As long as this drop holds over $75,000, we expect a final swing into the $114K – $150K region.

Regarding Solana, the I/O Fund started buying in the $99 – $112 region, and closed our position between $210 and $241. This led to a ~117% gain from our initial buys to our closing prices. We used the same techniques to manage this move and see a similar setup going forward.

Like Bitcoin, Solana is clearly in a 5th wave uptrend that is incomplete. Note the vertical price movement from late 2023 – early 2024. This was met with max volume and max momentum. We are now pushing higher with less volume and less momentum in the 5th wave.

Solana (SOL) 5th wave analysis: vertical uptrend (late 2023-early 2024) with max volume/momentum; current wave reduced.

If we zoom in, we can see that this next swing higher is worth playing. Like Bitcoin, I see Solana in a 4th wave correction that is targeting between $170 – $135. As long as any further weakness holds over $120, we expect to see the next swing approach the $325 – $390 region.

Solana (SOL) price analysis: 4th wave correction to $170-$135, then swing to $325-$390 if support holds above $120.

In conclusion, being first to market with an idea does not guarantee dominance, especially when adoption of the new technology is early. Until Decentralized Apps and Web3 have an app go viral for more mass consumer adoption, it remains quite risky for investors. The adoption rate for blockchain has not hit the hockey stick vertical move that we like to see in developing tech trends, rather has stagnated in the low hundreds of millions (similar to Pinterest size audience; about half of Snap’s audience) rather than the billions that investors like to see.

This fact, coupled with Solana offering a better layer 1 option, means the landscape has not been decided. Until it is, we believe these cryptos warrant investment attention, and must be governed under strict risk management protocols that can be found in technical analysis.

We do believe crypto is sniffing out a bottom over the coming weeks. As long as critical supports hold, we see this as a buying opportunity for our portfolio.

If you own Bitcoin or Solana, are sitting on sizable gains and do not want to lose them, or if you are interested in owning crypto and not sure where to start, we invite you to join our weekly market webinars. Next Thursday, 1/23/25, at 4:30 EST (1:30 PST), we will hold a special webinar with a focus in crypto where we discuss our risk management game plan with several cryptos. Learn more here.here.

Please note: The I/O Fund conducts research and draws conclusions for the Fund’s positions. We then share that information with our readers. This is not a guarantee of a stock’s performance. Please consult your personal financial advisor before buying any stock in the companies mentioned in this analysis.

Recommended Reading: