Dell Q4: Projects $15 billion in AI shipments this year 

Dell had the unfortunate timing of reporting earnings at the moment tariffs threats increased, with China to see 20% tariffs starting as soon as next week. Dell is exposed to tariffs as a report from 2023 stated China revenue falls between 8% and 14% of sales.

In addition, Dell is the clearest supplier yet to illustrate the impact of the NVL systems being delayed. This quarter, the company stated they project $15B in AI shipments this year, yet in Q4, AI orders were $1.7 billion, down (53%) QoQ and shipments of $2.1 billion, down (28%) QoQ with $4.1 billion in backlog as customers work through technology changes. If Wall Street didn’t get the point from Nvidia’s fairly vague commentary, then Dell made it abundantly clear by offering shipments and backlog, which Supermicro and others do not offer.

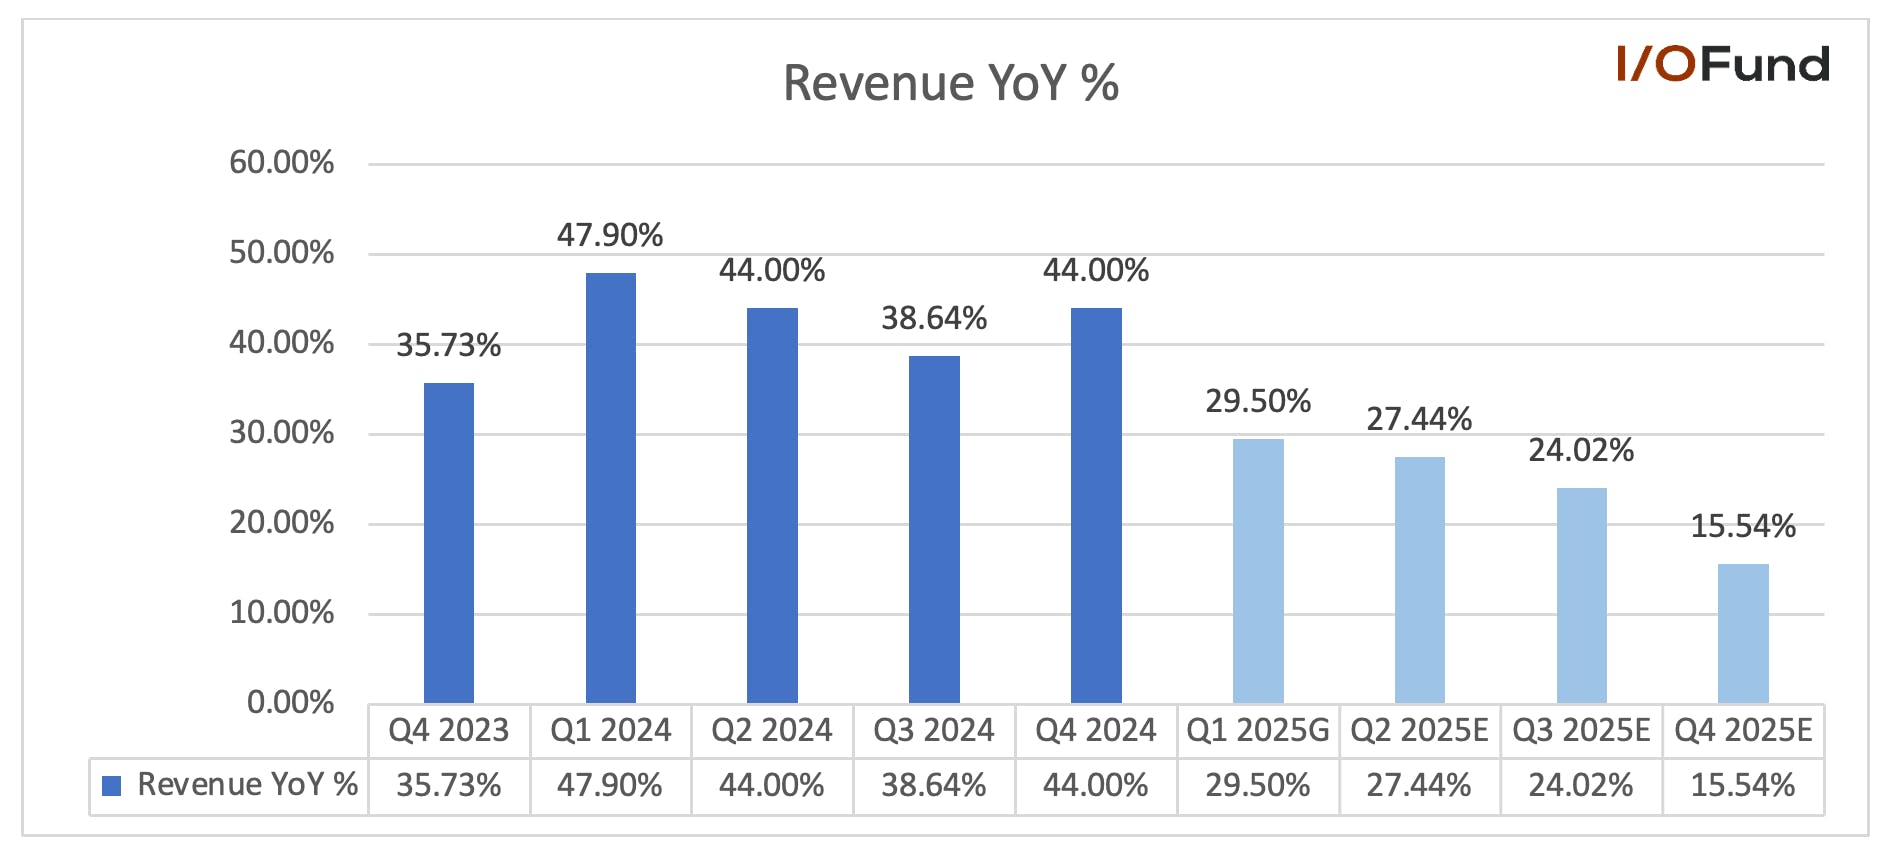
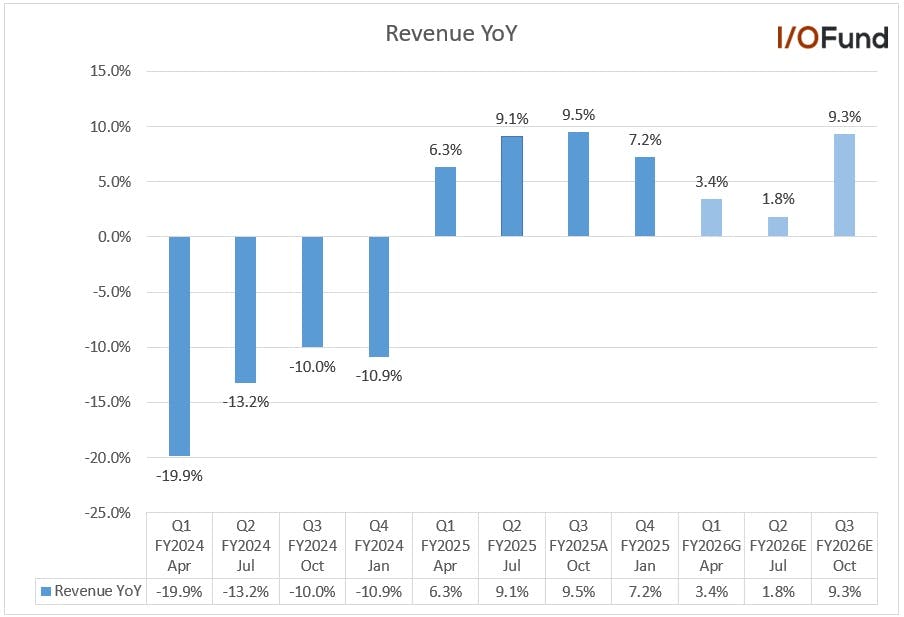
Down the income statement, the company reported mixed results. Revenue grew by 7.2% YoY to $23.93 billion, missing estimates by 2.6%. While adjusted EPS grew by 18.1% YoY to $2.68, beating estimates by 6.4%.

Management guided Q1 revenue in the range of $22.5B to $23.5B, representing a YoY growth of 3.4% at the midpoint, missing estimates by 3% and expects adjusted EPS to grow 25% YoY to $1.65.

Management has guided $15 billion in AI shipments for FY2026. The company’s AI server backlog increased from $4.5 billion in Q3 to $9.0 billion in Q4, primarily driven by the recent deals, including xAI.

Where Dell and Super Micro may both be seeing lower growth than expected likely goes back to the delivery of key Nvidia systems, where the larger systems lead to higher revenue (and you’re aware by now these were delayed by “couple months”). It’s also perhaps due to Nvidia’s partnership with Foxconn, who has seen more news lately than peers Dell and Supermicro in terms of shipping Blackwell systems. According to a news report from Economic Daily the GB200 was shipped by Foxconn in small quantities at the end of Dec and is expected to be shipped in large quantities at the end of January. Nvidia is expected to unveil the GB300 AI server product line at the GTC conference in March.

Ultimately, this is one more supplier that is offering a muted outlook. Per Knox’s webinars, IOF has been preparing for a rout of sorts. Our goal has been to add to AI positions during the rout. With that said, we have must-hold levels and will let you know if Dell breaks our must-hold.

Revenue

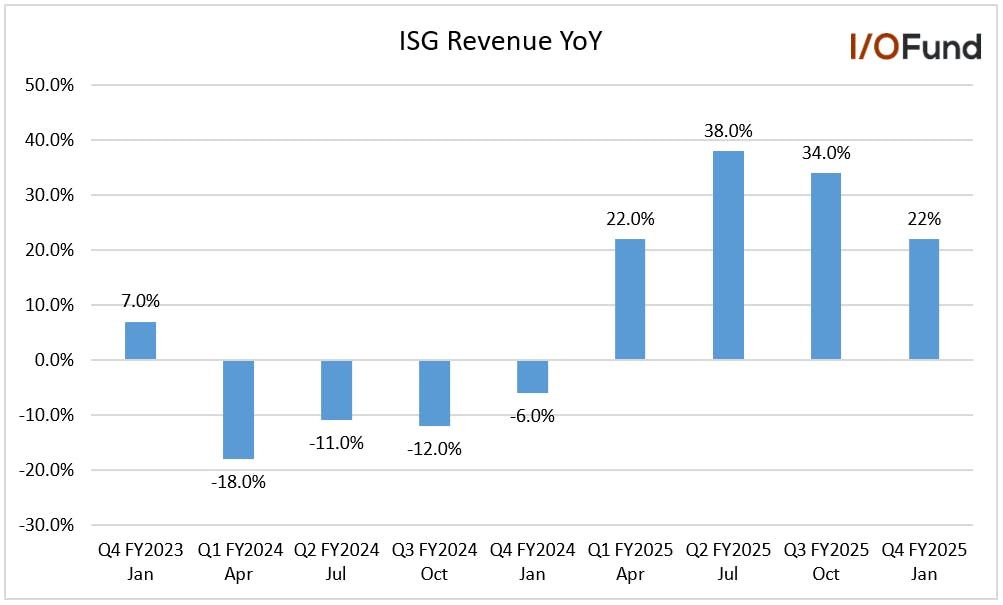
Q4 revenue grew by 7.2% YoY to $23.93 billion driven by the 22% YoY growth in the ISG segment. However, the revenue fell short of estimates by 2.6%.

  • Management guided Q1 revenue in the range of $22.5B to $23.5B, representing YoY growth of 3.4% at the midpoint, missing estimates by 3%.
  • Analysts expect revenue to grow 1.8% YoY to $25.5 billion in Q2 and 9.3% YoY to $26.6 billion in Q3.
  • FY2025 revenue grew by 8.1% YoY to $95.57 billion. The management guide for the FY2026 is $101B to $105B, representing YoY growth of 7.8% at the midpoint of $103 billion, slightly missing the consensus estimate of $103.62 billion.
  • Analysts expect FY2027 revenue to grow 6.8% YoY to $110.71 billion.

Key Operating Segments

Infrastructure Solutions Group

ISG revenue grew by 22% YoY and flat QoQ to $11.4 billion. Revenue growth decelerated from 34% in Q3.

In Q4, AI orders were $1.7 billion, down (53%) QoQ and shipments of $2.1 billion, down (28%) QoQ while management mentioned that $4.1 billion is in backlog as customers work through technology changes. The company’s AI server backlog increased from $4.5 billion in Q3 to $9.0 billion in Q4, primarily driven by the recent deals, including the $5 billion from XAI. Management has guided $15 billion in AI shipments for FY2026.

The company reported a record ISG operating income of $2.1 billion, up 44%. This was driven primarily by higher revenue. The ISG operating margin was 18.1% compared to 15.3% in the same period last year.
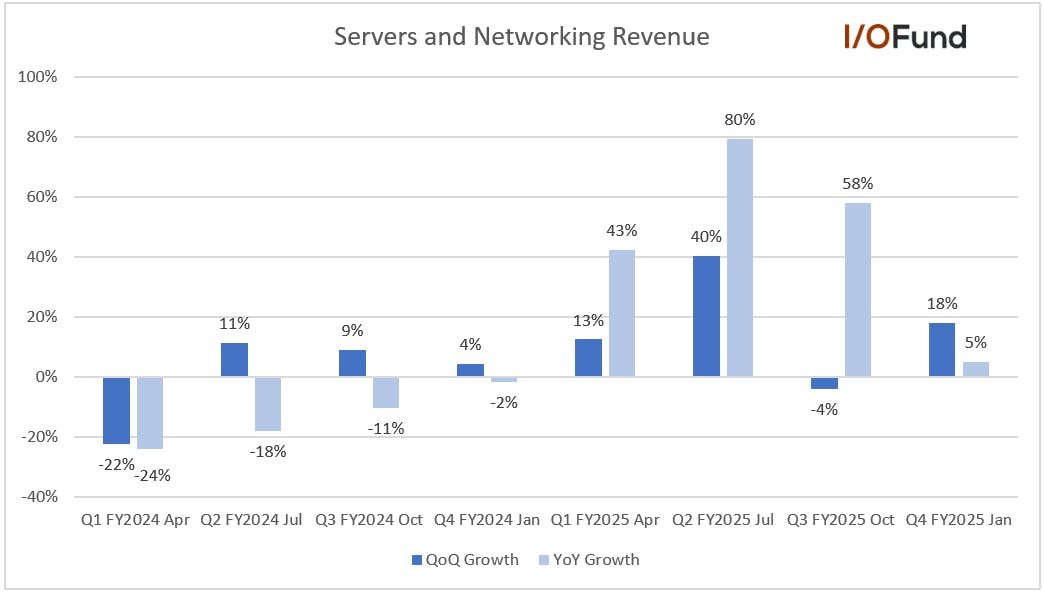
  • Servers and Networking revenue grew by 37% YoY and down (10%) QoQ to $6.6 billion.
  • Storage revenue grew by 5% YoY and 18% QoQ to $4.7 billion.
Regarding Dell’s AI server solutions, the company highlighted the Power Edge servers and the ability to scale up and scale in the opening remarks:

“We added five platforms to our AI-optimized portfolio, including support of Blackwell architectures, the highlight being the PowerEdge XE9712 supporting NVIDIA's NVL72 GB200, which we were the first to ship in the world. We launched the Dell Infrastructure Rack Scalable System, our IR7000 and 5000 in both 21-inch and 19-inch versions, providing up to 96 GPUs in a rack and 786 GPUs in a scalable unit. We have made significant advancements with CDUs, cold plates, manifolds and power distribution with our IR7000 supporting up to 480 kilowatts per rack.”

The company also benefits from the increase needs of storage due to data-hungry AI models: “We made significant advancements to PowerStore with PowerStore Prime, our mid-range storage solution addressing the fastest-growing portion of the market. And we introduced the PowerScale F910 and F710 in our unstructured portfolio that is primed to support unstructured and AI workloads.”

Client Solutions Group

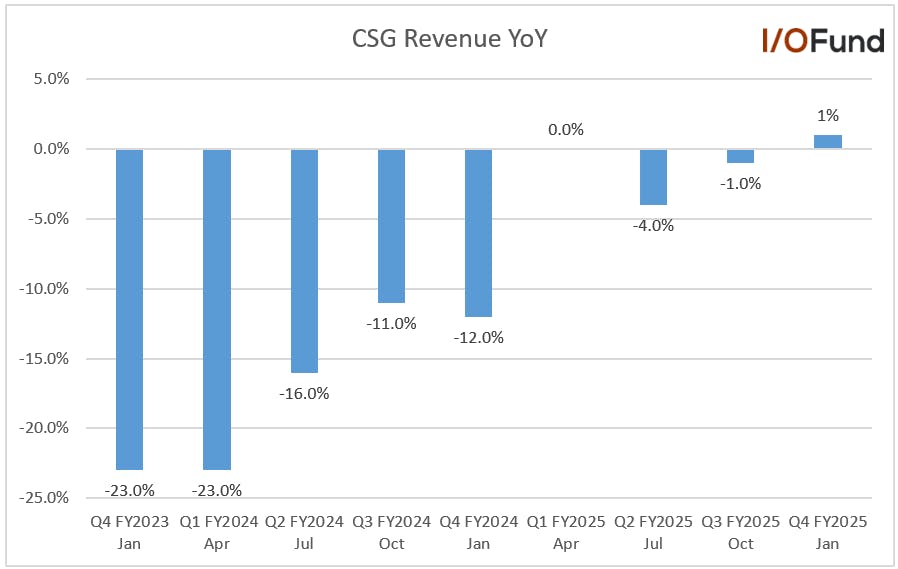
Client Solutions Group revenue grew by 1% YoY and down (2%) QoQ to $11.9 billion. The CFO said in the earnings call, “We saw some promising signs as we went through November and December with pockets of strength in large deals, but overall saw a slowdown in January. As Jeff mentioned, we saw strength in small and medium business, which is historically a leading indicator.”

The CSG operating margin was 5.3% of revenue compared to 6.2% of revenue in the same period last year and was also down 90 basis points sequentially due to a more competitive pricing environment.

  • Commercial revenue was up 5% YoY and down (1%) QoQ to $10 billion.
  • Consumer revenue declined by (12%) YoY and (5%) QoQ to $1.9 billion.
When AI PCs take off, Dell will be a beneficiary with the following stated on the call regarding their participating in both Arm-based and x86-based PCs: “We introduced the most Copilot+ PCs powered by ARM-based Qualcomm Snapdragon processors and also launched the broadest portfolio of Intel Lunar Lake commercial PCs, furthering our number one leadership position in commercial AI PCs worldwide.”

Operating Margins Stronger than Expected
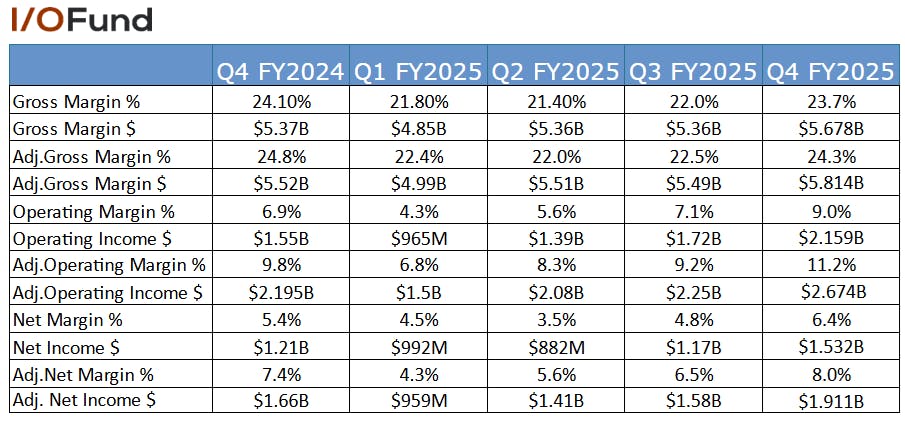
The company’s margins improved due to the operating leverage and higher profits in the ISG segment driven by the Dell IP storage portfolio. The company also discovered previously unrecognized accumulated credits from suppliers and have revised the margins slightly higher than the previous figures. However, the company’s gross margins are feeling pressure due to increasing competition faced in the CSG segment and also the increase in AI revenue.  

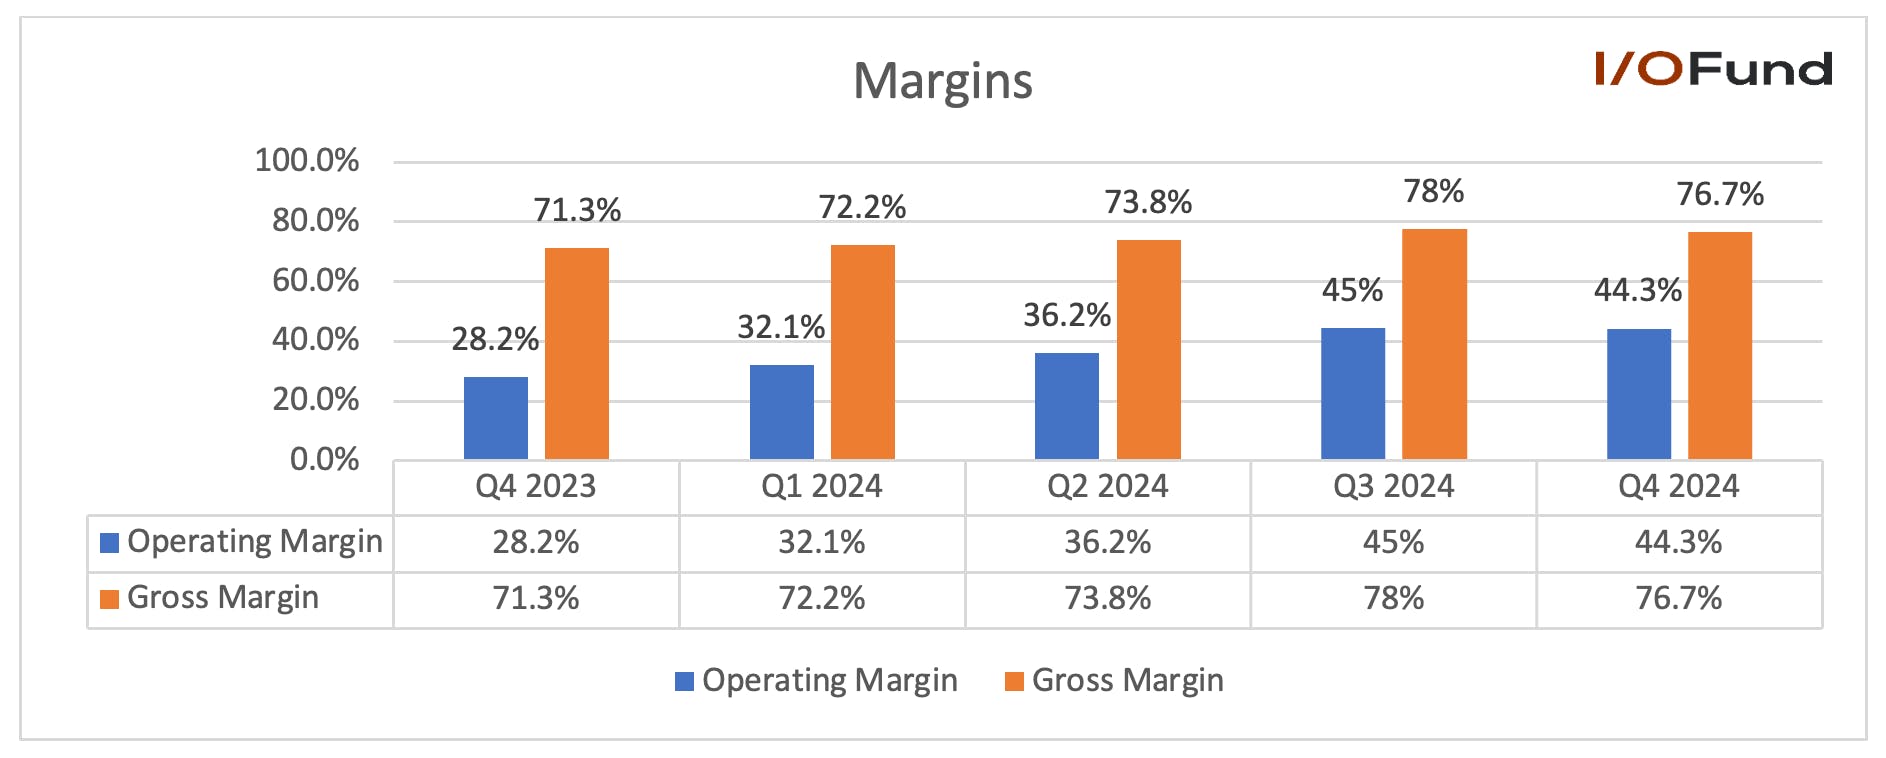
  • The gross margin was 23.7% compared to 24.1% in the same period last year. Adjusted gross margin was 24.3% compared to 24.8% in the same period last year. The lower gross margin was due to a higher AI-optimized server revenue mix and lower profits in the CSG segment due to increased competition. The gross margin rate will be lower sequentially given seasonally lower storage mix and a higher AI-optimized server mix.
  • The operating margin was 9% compared to 6.9% in the same period last year. Adjusted operating margin was 11.2% compared to 9.8% in the same period last year. The improvement in the operating margin was due to higher revenue and lower operating expenses.
  • Net margin was 6.4% compared to 5.4% in the same period last year. The adjusted net margin also showed improvement as it reported 8% compared to 7.4% in the same period last year.
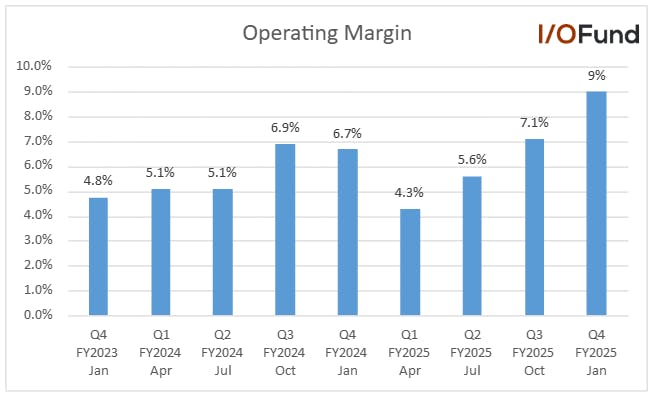
  • FY2025 adjusted gross margin was 22.8% compared to 24.5% in FY2024. Management expects adjusted gross margin to be down 100 basis points in FY2026 due to a higher mix of AI-optimized servers and the current competitive environment.
  • FY2025 operating margin improved 40 basis points to 6.5%. Adjusted operating margin remained the same at 8.9%.
  • FY2025 net margin improved 100 basis points to 4.8% and adjusted net margin remained the same at 6.1%.

Adj.EPS grew by 18.1%

  • Q4 adjusted EPS grew by 18.1% YoY to $2.68, beating estimates by 6.4% driven by operating leverage and improvement in the ISG segment operating margin and partly helped by revisions from the previously unrecognized accumulated credits from suppliers.
  • Management expects Q1 GAAP EPS to be $1.29, down (6%) YoY and adjusted EPS to grow 25% YoY to $1.65.
  • Full-year FY26 GAAP EPS expected to be $7.85, up 23% year over year, and adjusted EPS to be $9.30, up 14%.

When the time comes for AI servers to ship in volume, one thing to keep in mind is Dell’s operating leverage compared to other hardware peers – here is how the CFO described it with double digit growth that exceeds revenue growth: “Now let's look at operating income. We delivered a 22% increase to $2.7 billion or 11.2% of revenue. This was driven by higher revenue and lower operating expenses, partially offset by a decline in our gross margin rate. Q4 net income was up 15% to $1.9 billion primarily driven by stronger operating income. And our diluted EPS was up 18% to $2.68.”

Cash Flow and Balance Sheet

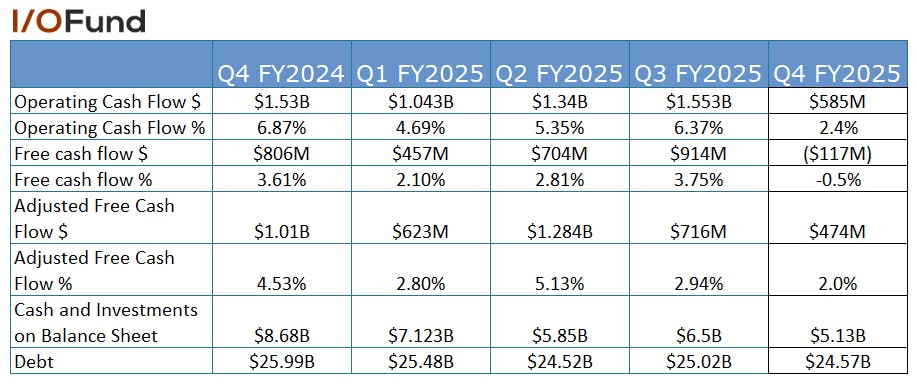
The company’s cash flows were lower due to lower CSG revenue and also higher inventory to support the AI demand. This was clarified by the management in the earnings call Q&A as they expect cash flows to improve this year with higher CSG revenue.

Q: Amit Daryanani (Analyst)

Thanks a lot. I guess I have a question on free cash flow. In fiscal '25, it looks like your free cash flow is down a couple of billion dollars versus '24. Can you just talk about what's driving this contraction in free cash flow? And maybe, Yvonne, you can help us kind of understand how do we think about free cash flow expectations as we head into fiscal '26? What are sort of puts and takes around it? It would be really helpful to kind of get the context, at least for fiscal '26, what's going on?

A: Tyler Johnson (Vice President and Treasurer)

“Amit, look, I think — as I was sitting here last year, I definitely thought cash flow was going to be a little bit stronger. If you look at what played out, one, we didn't see the growth in CSG that we were expecting. And as you know that throw off really good cash. And then two, we invested a lot in our AI business through inventory. And so you can see that our inventory has gone up, and that had a big impact to CCC. Now if I look where I am today and I think about FY '26, I would say I've got a few things working in my favor. So one, we're at a CCC level where historically, we've always shown improvement from here. And that will throw off good cash. We expect good CSG this year, and that will throw off good cash. And if I think about the growth in the P&L, that will throw off good cash. So look, I think we feel pretty good about cash. I do expect it to be greater than 1x and so yes.”

— End of Quote

  • Q4 operating cash flow margin was 2.4% compared to 6.9% in the same period last year.
  • Q4 free cash flow margin was (-0.5%) compared to 3.6% in the same period last year and adjusted free cash flow margin was 2.0% compared to 4.5% in the same period last year.
  • Cash and investments were $5.13 billion and debt of $24.57 billion compared to $6.5 billion and $25.02 billion in Q3.
  • Inventories were $6.7 billion in Q4 compared to $6.65 billion in Q3. However, it was significantly higher than the $3.62 billion in the same period last year to support the AI demand.  
  • The company repurchased shares worth $734 million and paid dividends of $311 million.
  • It also announced an 18% increase in the annual dividend to $2.10 per share. Additionally, the Board of Directors has approved a $10 billion increase in the share repurchase authorization.
Earnings Call:

Blackwell Margins to be Lower than Hopper Margins; Yet Dell Likely Will Win the Margin Battle

Margins are a key issue with hardware suppliers, and Dell stated Blackwell margins will be lower than Hopper margins, which is something to watch as the next architecture ramps: “I mentioned in the last call that the Blackwell margins were lower than the Hopper margins and remains so today. We're still early. The deals are very large upfront. There's more competitors, so it's a more competitive landscape.”

An analyst pointed out that despite growing their mix of AI server revenue, Dell guided for ISG margins to be flat – which is a win since AI servers are supposed to weigh on margins. Dell’s response is they will leverage storage to offset any margin weakness from AI servers.

In terms of Dell’s thesis, I would place margins equal to its AI server backlog, which is why I’m starting with this piece rather that AI in the call summary.

“Michael Ng

Hi good afternoon. Thank you for the question. I just have one on the ISG margin outlook of flat year-over-year for the upcoming year. It's a great outlook, particularly considering AI server revenues growing 50%. So can you talk a little bit about the expectations for margins for some of the components, traditional servers, storage AI servers? I'm just trying to understand the ability to keep ISG margins flat despite presumably the dilutive effect from the AI server margins. Thank you.

Jeff Clarke

I think, Mike, maybe the way to look at this is the, first and foremost, as we think about holding ISG margins flat, I love the way that you asked the question, we're going to do that by growing at least $15 billion in AI servers. I know your question is how we're going to do that. But for us, that's a very important mark that we're going to be able to meet that operating range that we've committed in our long-term framework and we're going to grow at a minimum of $15 billion in AI servers. And we're going to do that by what we've done in traditional servers and what we've done in storage. The storage leverage that Yvonne talked about earlier is front and center. When we grow the storage business and we control our expenses, scale matters, the operating margins improve. When we pivot to Dell IP storage, which we have done, our margins improve. The margins of our own IP are vastly superior than third-party IP. We've been doing that for some time.”

— End Quote

Dell Calms Supply Fears About Blackwell

Dell is the perfect company to corner on the GB200s shipping and if there is a “supply” issue. This is also the perfect question to ask as DeepSeek has greatly obfuscated the issue to where the media is focused on demand (which is def not the problem for 2025!!). Supply is the issue, to where rather than there being supply constraints (like during Covid), there are supply hiccups.

I find there are two kinds of management teams – those that are transparent and take it on the chin for being so, and those who are more vague and hope the market skates over their commentary. Dell is the former.

Samik Chatterjee

Hi, hopefully you can hear me now. Jeff, I just wanted to go back to some of your prepared remarks and — about the $15 billion of AI server revenue that you were highlighting that you at least expect to grow to that level. Just wondering, how much of that is gated by supply, particularly versus the visibility into supply that you're getting? And how much of that commentary around sort of at least growing there is a supply dynamic versus a demand dynamic? And should we be expecting more sort of linear growth for the quarter as we think about the — with visibility on supply? Thank you.

Jeff Clarke

Well, I think clearly, Hopper supply is available today. I believe there is references yesterday that Blackwell is in production and ramping. We're open for business and taking orders. The message that I really wanted to drive in our remarks is on day 27 of the fiscal year, we're trying to communicate that we are at least $15 billion in AI shipments. Our 5-quarter pipeline continues to grow. It's several multiples of our backlog. We are going to pursue every opportunity with the CSPs and in enterprise. These large-scale systems are accelerating and getting bigger. Models are quickly moving to reasoning models, which consume and require more computational capability, i.e., more computers. And the use cases continue to get clearer for enterprise to drive the return on investments they want to see to actually use AI more broadly. Algorithm innovation continues to accelerate. Again, these reasoning models are — will consume more computational capability. They're moving to be multimodal, which even consumes more kind of like where this is going. We're optimistic. I don't see supply as an issue. Clearly, these are about building the right architecture. There's a customer preparation or customer readiness component of this, new data centers getting powered, getting water, getting cooling. There's other materials beyond the GPU, getting the rack, getting the cold plates, getting the CDUs, the PDUs, all of that is what we orchestrate. We have line of sight that is at least $15 billion. We'll continue to update as that might change. And we're all in. I don't know what else I can tell you. I hope that helped.

Conclusion:

Dell’s server shipments QoQ makes it abundantly clear they were impacted by the delay in Blackwell NVL server shipments. How any issues are sorted will be fluid, as any supplier that can alleviate the issues around standing up the systems will be exponentially rewarded while those who falter will be eliminated. Dell’s $15B is lower compared to Supermicro with annual FY estimates of $24B. However, Dell is quickly catching up. What separates the two is the operating leverage, the more trustworthy management team (given SMCI has been in the crosshairs of the SEC lately), and the AI PC story that will materialize eventually.

Given the weak price action AH, we have a must hold level for Dell as the market is panicked right now over tariffs and weak AI supplier commentary (officially across the board now that we have Dell’s more transparent report on server shipments). Our goal is to not get shook out the position, while adhering to risk management. We will keep you in the loop if the must hold breaks.

I/O Fund Equity Analyst Royston Roche contributed to this article.

Please note: The I/O Fund conducts research and draws conclusions for the Fund’s positions. We then share that information with our readers. This is not a guarantee of a stock’s performance. Please consult your personal financial advisor before buying any stock in the companies mentioned in this analysis.

Recommended Readings:

AI Stocks Signal a Correction Before a Buying Opportunity Emerges 

In our last broad market report in mid-October of 2024, we stated that “If the S&P 500 can breakout above 5825, then it can likely push into the 6000 – 6185 region.” This was assuming that we hold support at 5675, which we did. Since then, the market topped at 6147 and is currently trading below where we were in October.  

We expressed caution in our October report based on several markets and stocks not participating in the uptrend. We also expressed concerns with the reaction in the bond market regarding the FED’s pivot attempt to aggressively cut rates. These warnings remain today and have only become more concerning.

AI Stocks and Intermarket Analysis: Predicting Market Trends Beyond Economics  
In an interview with Barrons in 1988, Stanley Druckenmiller stated, “the only good economist I have found is the stock market. People say it has predicted seven out of the last four recessions. That’s still better than any economist I know.” He further backed this claim up by stating that “One of my strengths over the years was having deep respect for the markets and using the markets to predict the economy and particularly using internal groups within the market to make predictions.” 

This same sentiment was also expressed by famed fund manager, Peter Lynch, when he claimed that no one was able to predict the 1982 recession, which, at the time, was the worst recession since the great depression. He then stated, “…if you spend 13 minutes a year on economics, you've wasted 10 minutes.” 

Both investors are considered market wizards, and both investors analyzed the markets, not the economy, when trying to get ahead of broad market moves. This type of analysis is known as intermarket analysis and, unlike economics, looks at what is going on right now instead of looking back at what already happened or trying to predict too far into the future what will happen. 

This type of analysis is what we used on our October 20th 2022 report, to position for the end of the bear market. In this report, we stated… 

“We are seeing multiple key sectors within the U.S. not follow the S&P 500 down to a new low last week. Transportation stocks, High Beta and Small Caps have been leading the markets since 2021, and last week, when the S&P 500 made a new low, these risk-on markets made a new high. These types of patterns tend to signal a trend change is brewing.” 

We are now seeing the same patterns; however, instead of marking a bottom, they appear to be marking some sort of top.  

When all markets, especially the ones sensitive to the economy are trending higher together, you are in a powerful uptrend that should last for a while. On the other hand, when these same sensitive sectors are not moving higher with the broad market, it tends to signal a warning.

AI Stocks and Semiconductors: Key Signals for Market Trends and Volatility  
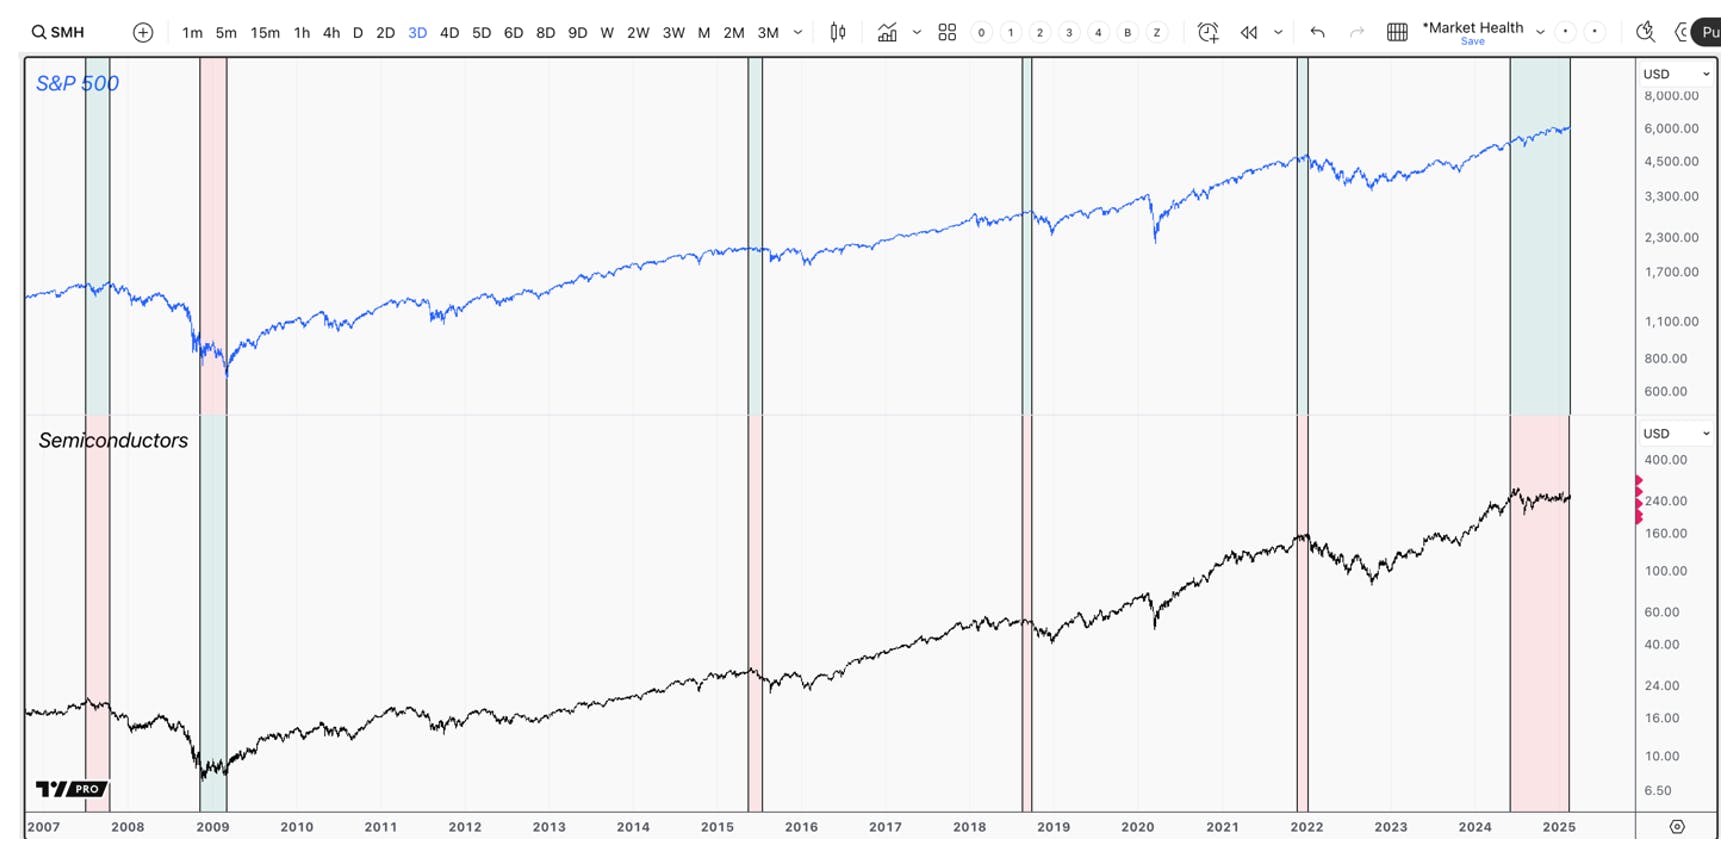
Semiconductor stocks have a long and reliable history of leading market volatility. Historically, this sector tends to be more economically sensitive, showing strong uptrends during economic expansions, as they make the key building blocks of enterprise and consumer technology. They tend to be more economically sensitive and can provide a long lead time between warning investors, and the broad market finally getting the message. Since the 2007 top, semis have provided advanced warnings of notable market turns, including the 2009 bottom, 2015 top, 2018 top, and 2022 top.  

In this cycle, we are a handful of semiconductor stocks are the primary recipients of the AI Capex cycle, which has reach nearly $250 Billion from 2023 – 2024, and expected to be $331.5 Billion by the end of this year. This is being fueled predominantly by the capex budgets of four companies – AMZN, MSFT, GOOGL, META.  

Considering the importance of AI within this bull market, this sector holds an outsized level of importance. SMH peaked in July of 2024, which we pointed out in prior reports. Interestingly, it is still -14% below it 2024 top, marking one of the longest divergences on record. Like with the above markets, for a meaningful uptrend to resume, we need to see a push to all-time highs. Until this happens, like other periods of volatility, semis could be warning us of market weakness ahead. 

Periods when the S&P 500 made a higher high without the semiconductor sector historically signals market weakness that leads to volatility.

Periods when the S&P 500 made a higher high without the semiconductor sector historically signals market weakness that leads to volatility.

The Mag 7’s AI Stocks Diverging 

The Mag 7 have been leading this market higher since 2023. Fueled by large Capex spend from Microsoft, Google, Meta and Amazon; their goal, which has been stated on numerous earnings calls, is to be first to market with AI infrastructure and large language models. These companies have repeatedly stated that the risk of underinvesting in AI outweighs the risks of overinvesting in AI.  

The roughly $300 billion in capex this year is pointed at a handful of stocks that design AI accelerators, and also those that supply necessary components for large AI systems to scale out and scale up. Nvidia is clearly the primary beneficiary.  

The seven stocks that have benefited from the AI trend are NVDA, MSFT, AAPL, AMZN, GOOGL, META, TSLA, and are the undoubted leaders of the current bull market, retuning an average of 128% vs. the S&P 500’s 62% since the October 2022 low. 

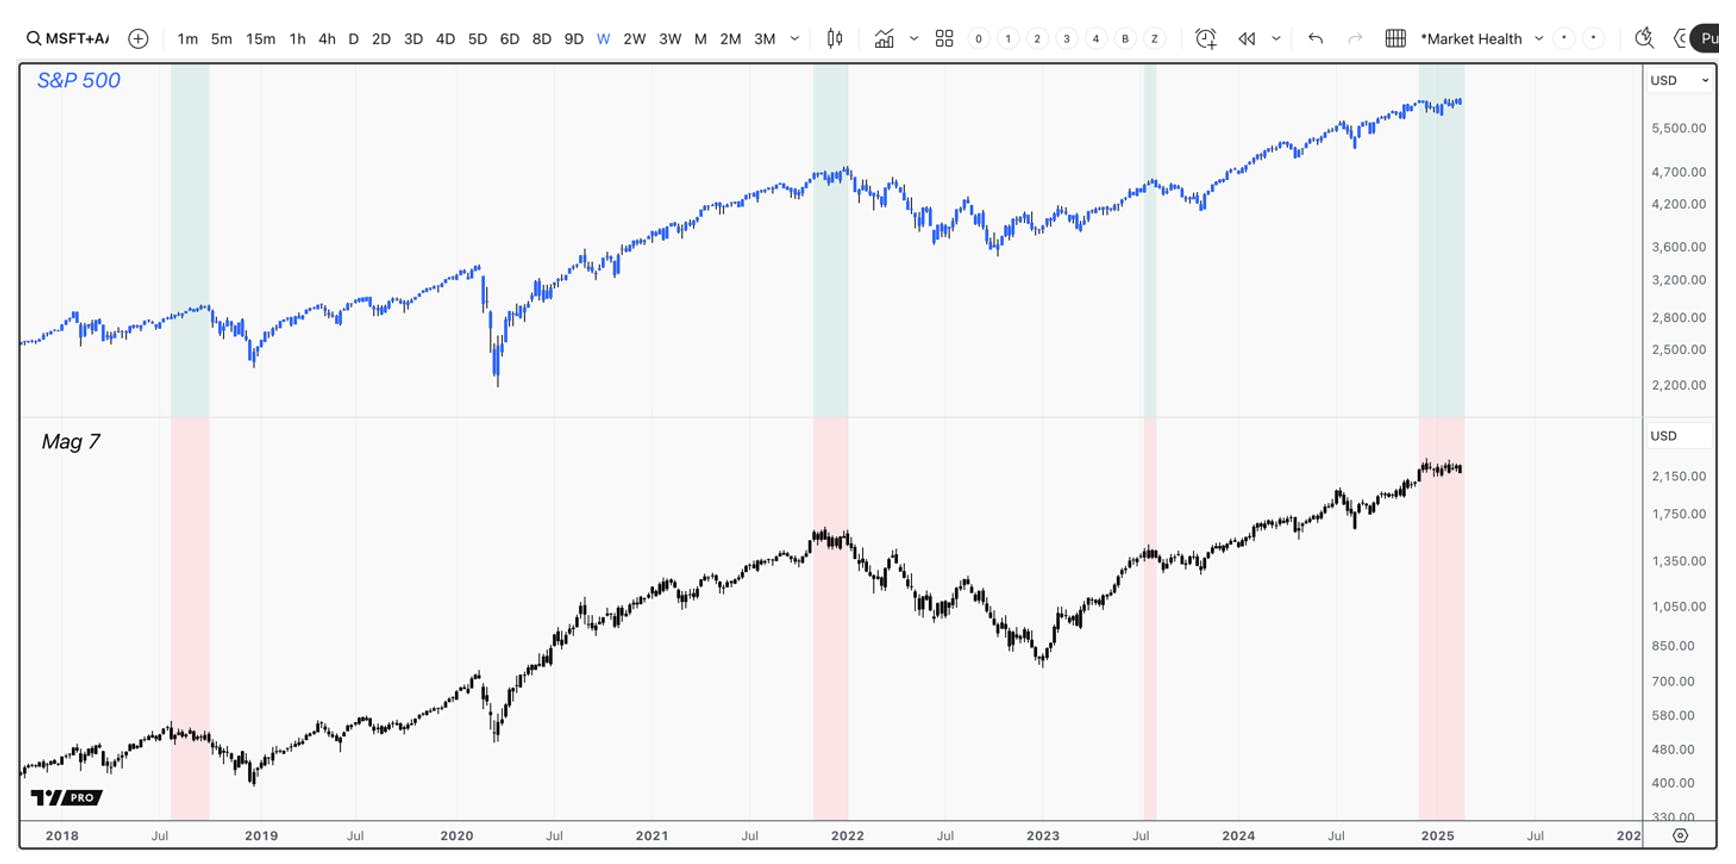
However, these market leaders are giving off a rare divergence that we have only seen three other times since 2018. While the S&P 500 made a new high on February 19th, the MAG 7 did not. In fact, the collective Mag 7 topped on December 17th, and have since made a series of lower highs. Every time we have since these stocks collectively diverge from the broad market, since 2018, it has led to a greater than 10% drop in equities.  

The S&P 500 made a higher high without the Mag 7 Index. This is a rare signal that historically signals market weakness that leads to volatility. 

The S&P 500 made a higher high without the Mag 7 Index. This is a rare signal that historically signals market weakness that leads to volatility. 

For the AI driven bull market to continue, it follows that the companies responsible for funding the build out of expensive AI infrastructure should also look strong. This is simply not the case, as many of them are already confirming breakdowns that are underway.

Microsoft (MSFT) 

Microsoft is one of the Mag 7 stocks that has spent the most in this AI Capex cycle, spending more than $116 billion in 2023 and 2024 combined. For 2025, Microsoft is estimated to spend at least $90 billion, though this may be higher considering it has outlined plans to spend at least $80 billion towards AI data center capacity in fiscal 2025 ending in June. 

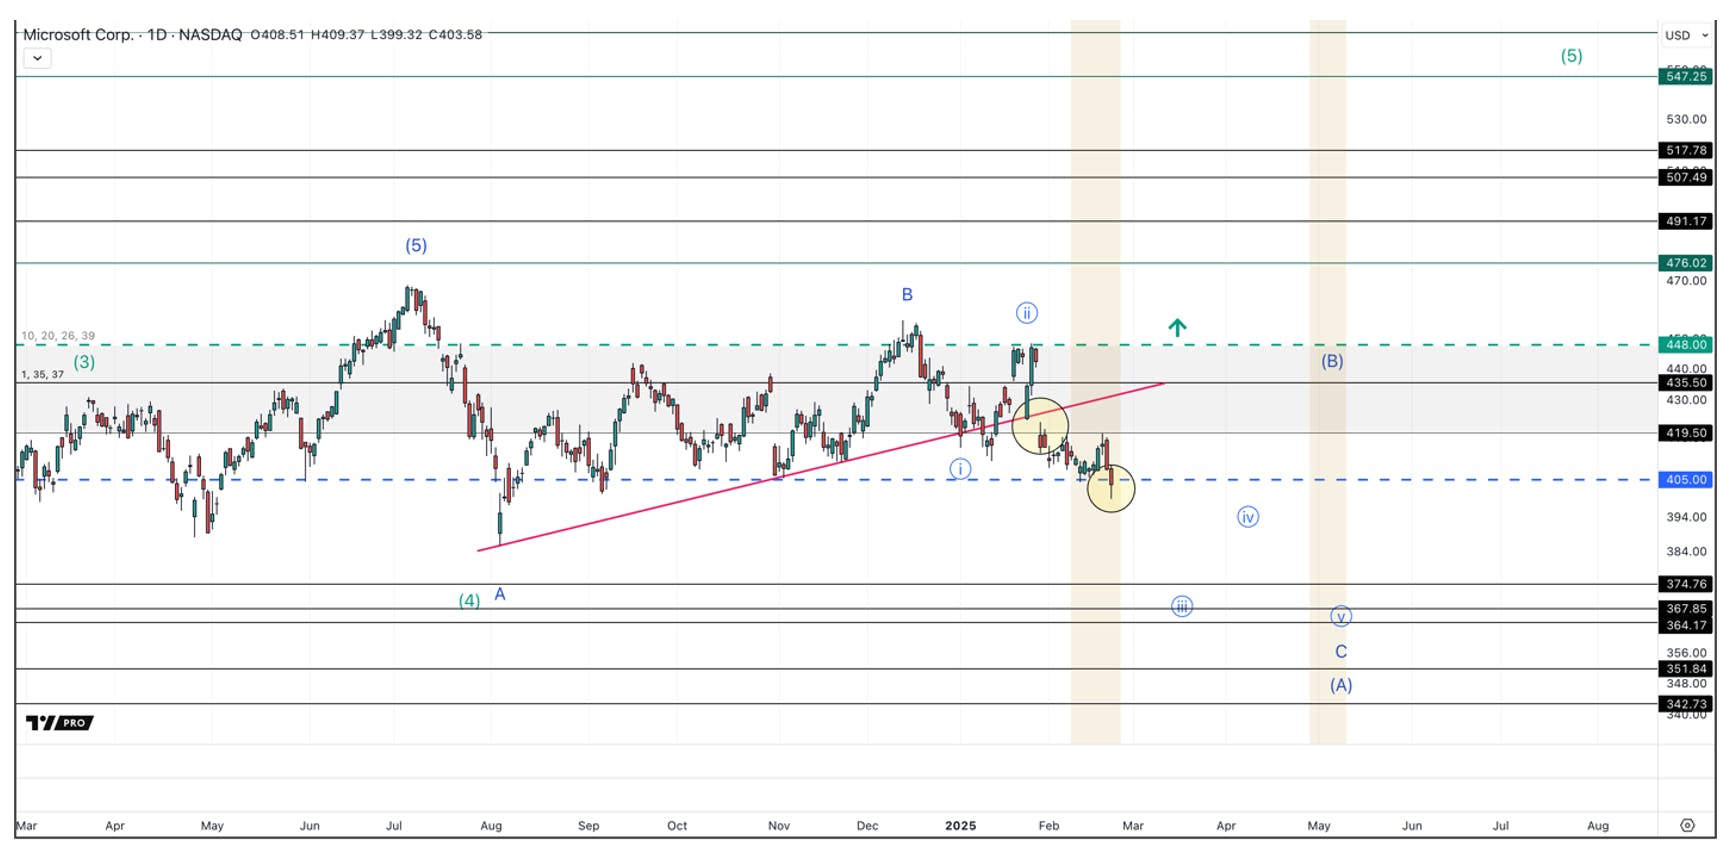
Interestingly, it has also not made a new high since July of 2024. We have since seen what looks like a large distribution between the $448 – $419 region. Note the two breakdowns circled in yellow. The first was a break i the uptrend, while the 2nd is a breakdown below the $405 support. Unless MSFT can reclaim the $419 – $448 region, the pressure will remain down. Microsoft is likely one of the Mag 7 leading this decline, and it is targeting the $375 – $350 region, if buyers don’t step in soon. 

Microsoft stock has been breaking down for weeks, long before the S&P 500. 

Microsoft stock has been breaking down for weeks, long before the S&P 500.

Google (GOOGL) 

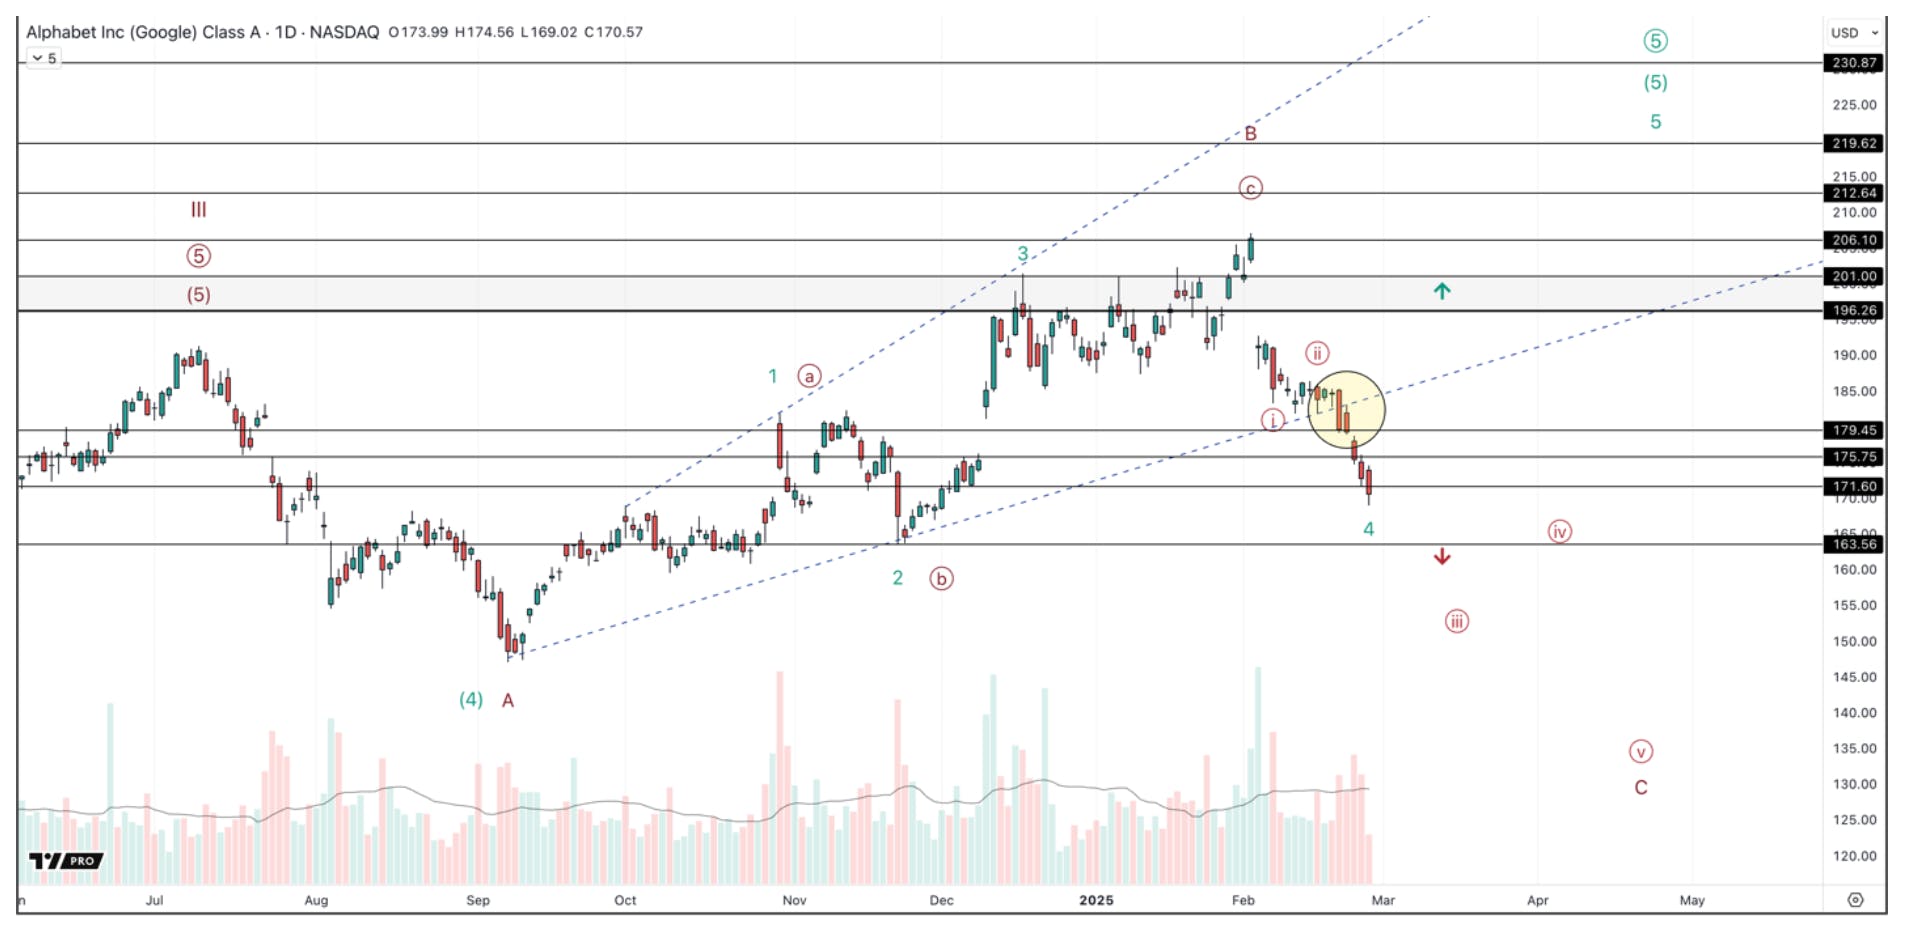
Google has contributed approximately $85 billion in capex expenditures over the past two years, with 2025 forecast to see spending rise 43% YoY to $75 billion. Google is one of the more concerning charts of the Mag 7. It topped on February 4th, just before its last earnings report. Since then, it has seen a sharp drop that is flashing warning signs. Google just broke below the uptrend line that has supported the uptrend since the September 2024 low. This is a notable development in technical analysis that suggests more volatility is ahead. GOOGL will need to reclaim this trendline soon to invalidate the signal. If it does reclaim the trend line, it will also need to also reclaim the $196 resistance level to suggest that it could see another push to all-time highs.  

GOOGL stock is showing technical weakness, recently breaking a key trend line.

GOOGL stock is showing technical weakness, recently breaking a key trend line.

Meta (META) 

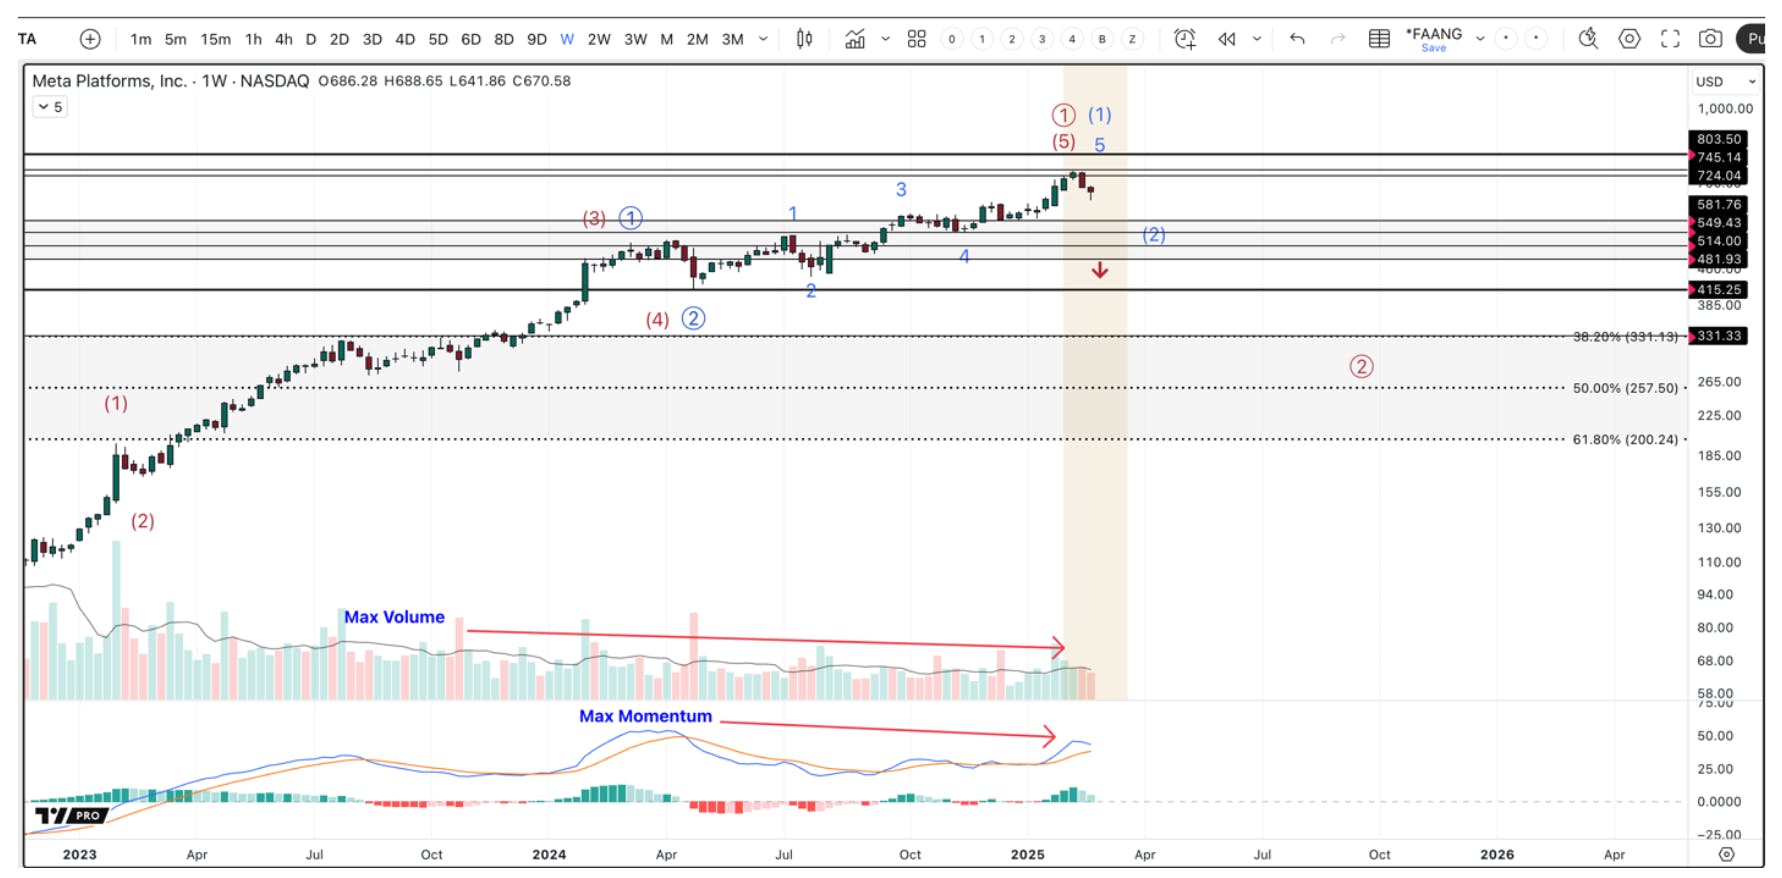
Meta is projected to spend around $62.5 Billion in capex by the end of 2025, nearly equal to the $66.8 billion it spent in 2023 and 2024 combined. It has also been the strongest MAG 7 in the recent uptrend and has been a heavy spender on its AI build out and a key player in the current bull market. After making a fresh all-time high two weeks ago, what’s worth pointing out is that it did so with lower momentum and lower volume. This is typical of 5th waves, which lines up with the larger pattern that started on the 2022 low.  

Considering that price is not below the last two weeks’ lows, it supports a period of volatility into the $590 – $481 region. META must hold $419, or a much deeper correction will unfold. 

Meta (META) is projected to spend $62.5 billion in capex by the end of 2025, nearly matching its 2023-2024 total. Despite hitting new all-time highs, declining momentum and volume suggest potential volatility ahead. Key support levels to watch: $590–$481, with $419 as a critical threshold.

Meta stock is currently below the prior 2-week lows, signaling a turning point in the trend.

Amazon (AMZN) 

Amazon has spent the most, so far, to build out their AI infrastructure. Spending totaled nearly $136 billion in 2023 and 2024 combined, with $104 billion more expected in 2025. 

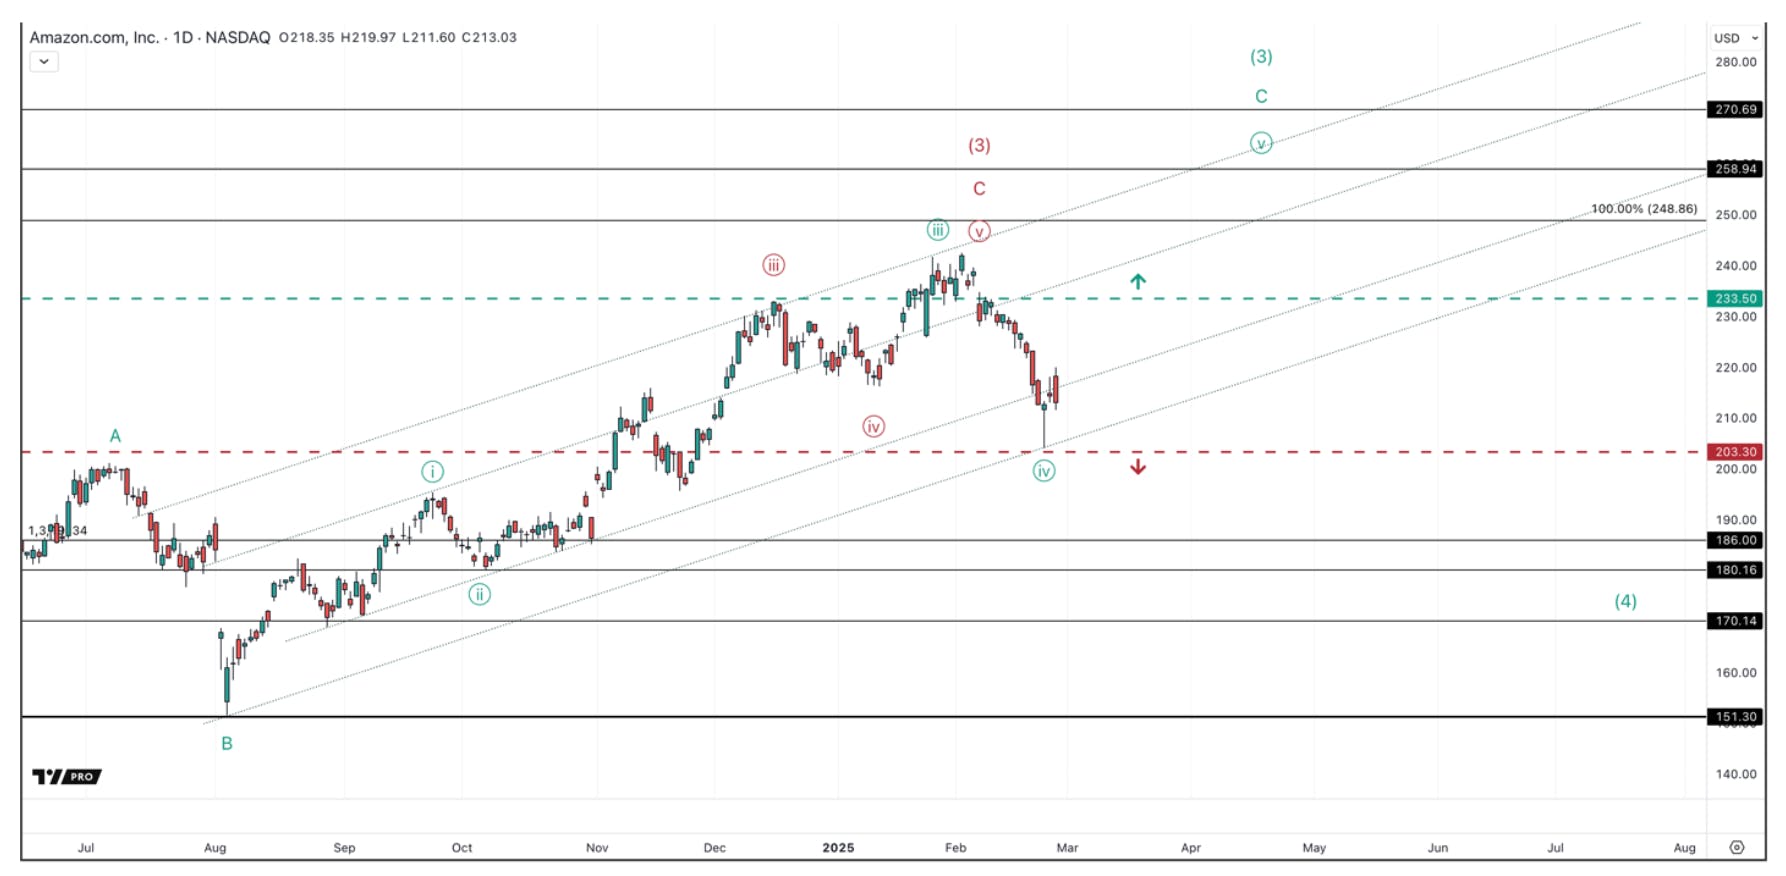
Like GOOGL, the market did not like what it reported in its earnings, showing a sharp drop. Amazon had a strong reaction off the $203.30 support. If AMZN is going to make a new high, it will need to clear $233.50. Even if we see a push to new highs, it does not look like a breakout worth chasing, as it will be the 5th wave, and final swing, in a very large 3rd wave. The 4th wave should take us sub-$200 and last for several months. If instead we break below $203.30, then we have already topped and will look for a low between $186 – $151. 

Amazon stocks shows the final support Below the recent low will signal a notable correction is unfolding.

Amazon stocks shows the final support Below the recent low will signal a notable correction is unfolding.

Nvidia (NVDA) 

Nvidia has been the primary recipient of the above Big Tech companies’ CapEx spend. For this reason, it has been the darling of the current bull market, and one of the most important stocks regarding the AI focused bull market.  

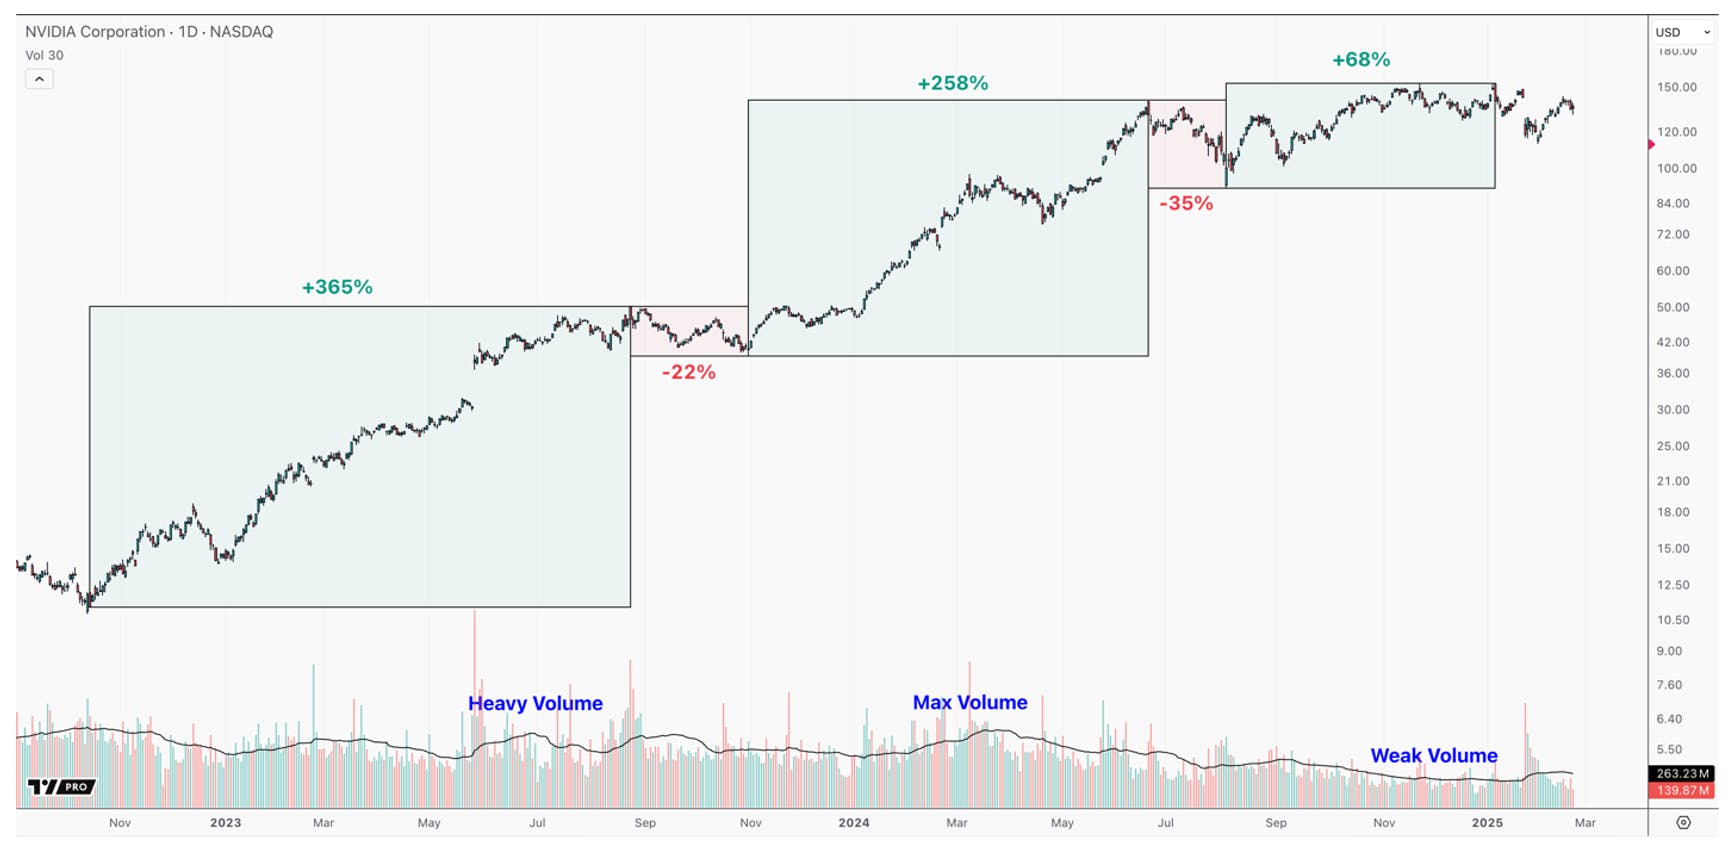
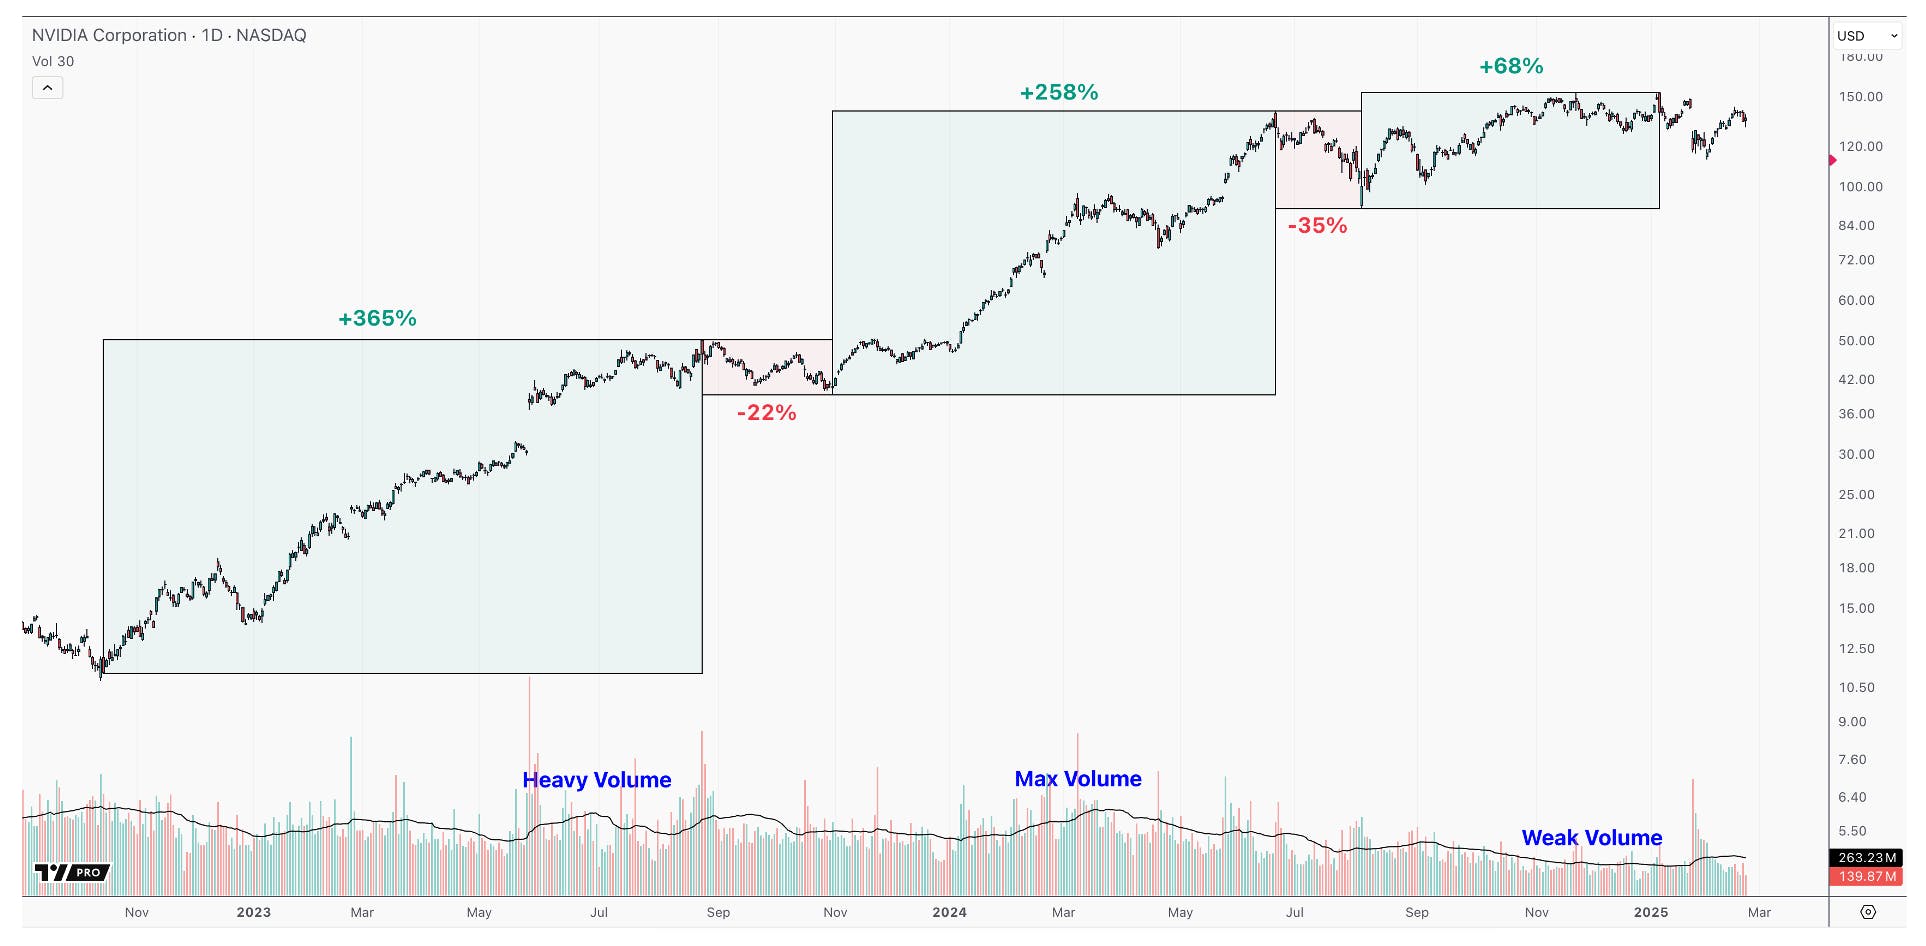
Since the 2022 low, there have been three clear uptrends. We are in the 3rd of these, and it is markedly different than the prior two. For one, unlike the 1st two, the uptrend that started in August of 2024 is relatively weak with a messy and overlapping structure. The prior two were nearly vertical. The second notable difference is that volume is weakening as price goes higher into the current uptrend. This is not like the prior two uptrends that saw volume expand with price.

Chart of NVDA showing three uptrends since the 2022 low, with the current uptrend from August 2024 appearing weaker, featuring a choppy structure and declining volume compared to the previous two strong rallies.

NVDA has seen 3 uptrends since the 2022 low, the most recent is notably weaker.

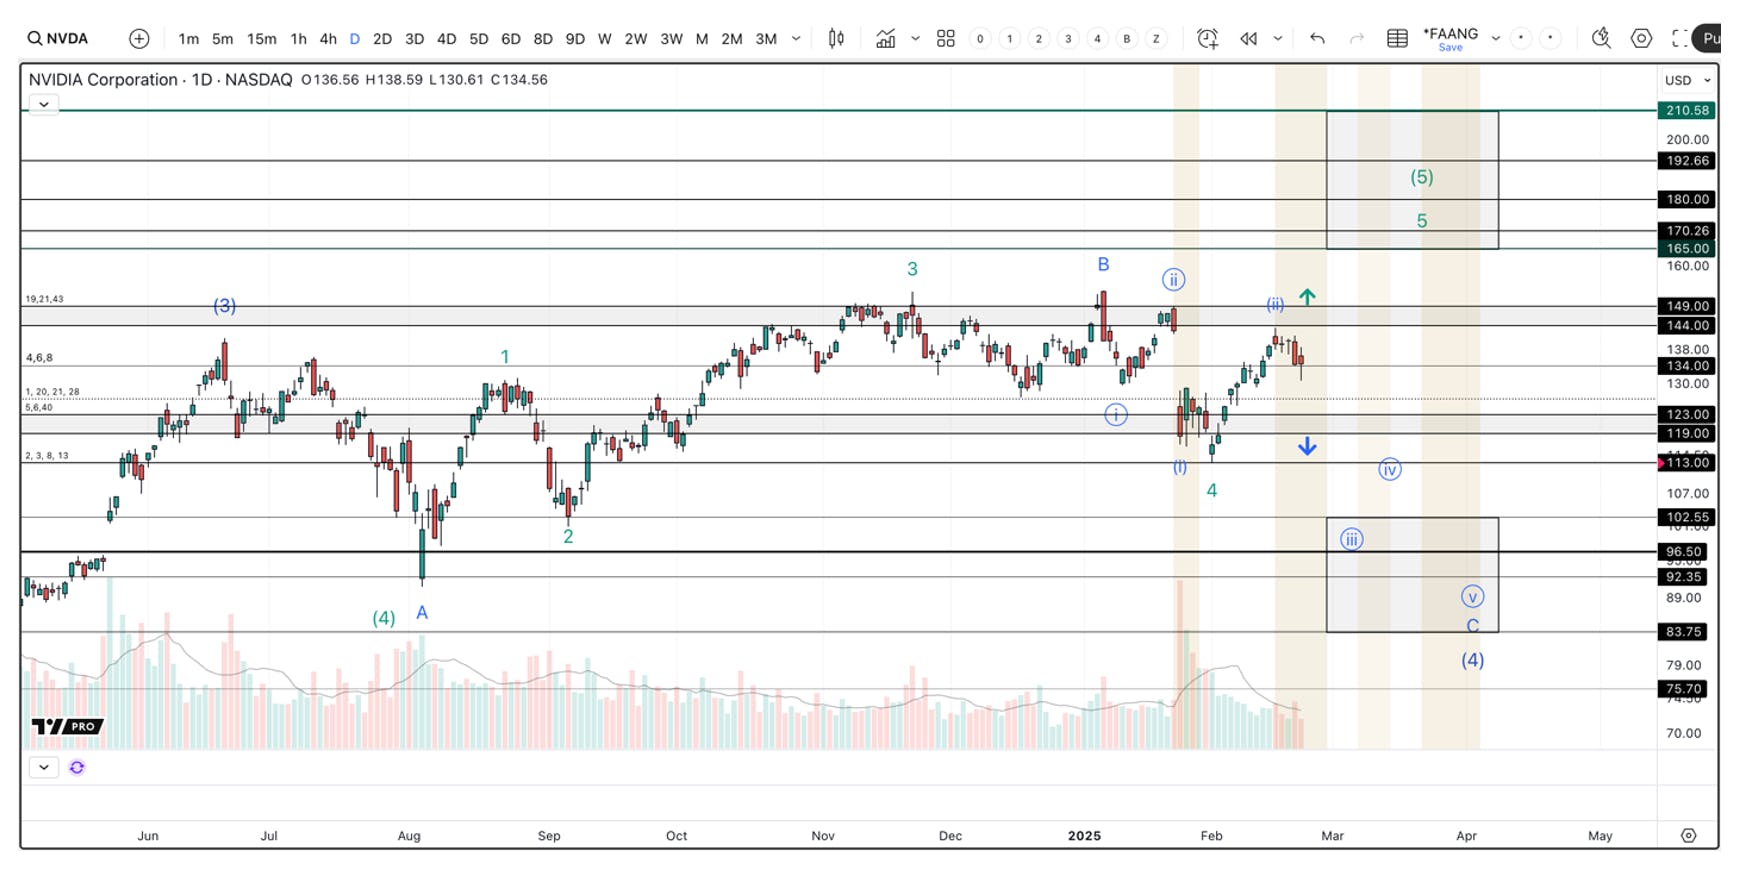
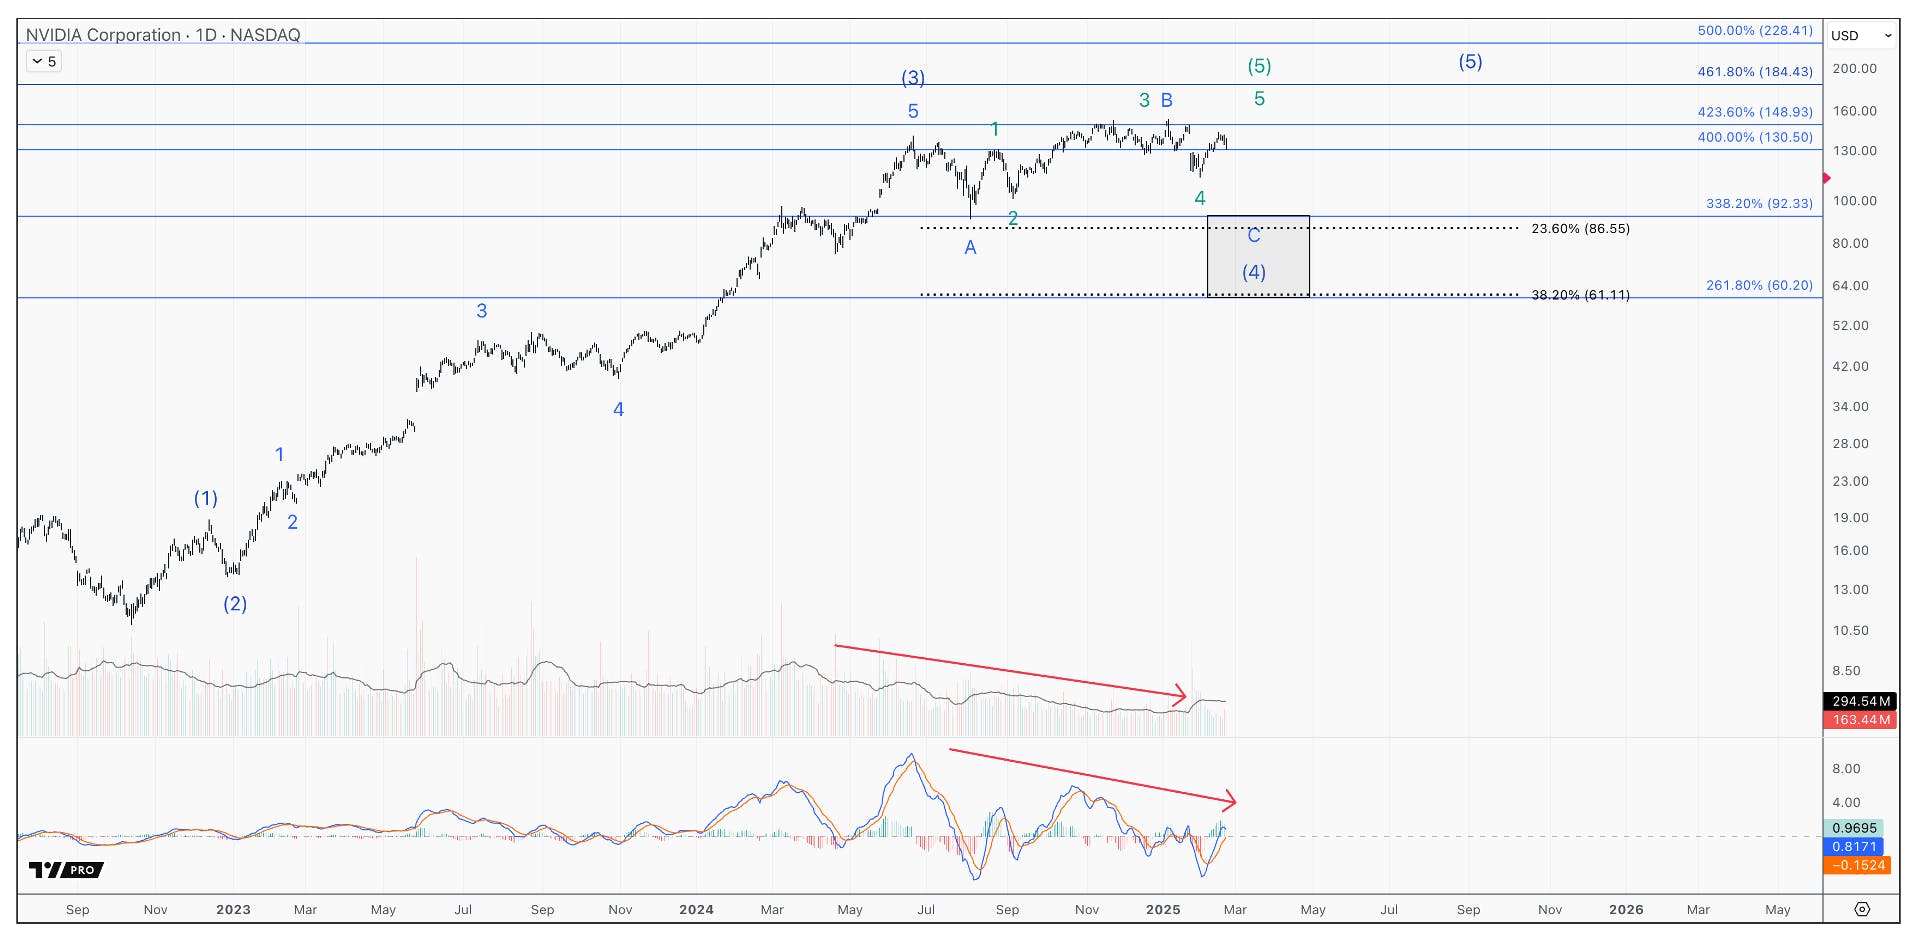
If we examine the potential pattern the current uptrend is taking, there are only two that make sense, given the price action.

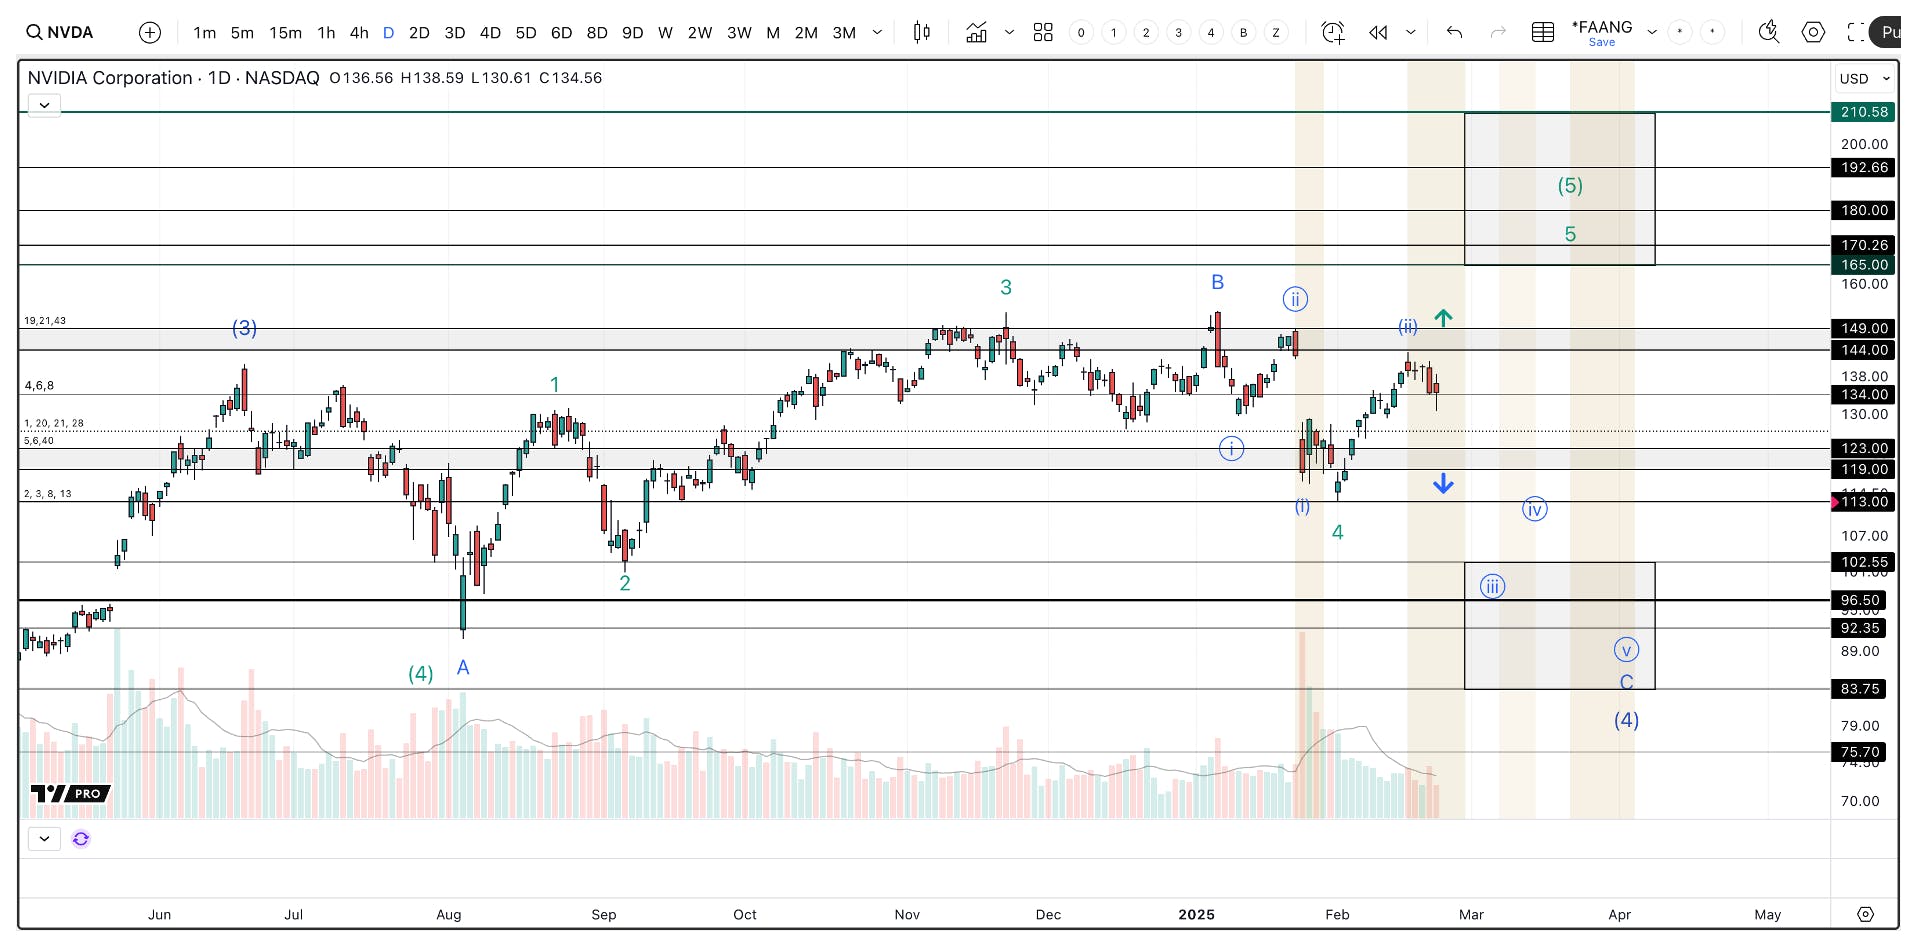
Chart of NVDA outlining two potential uptrend scenarios: the Green Count (ending diagonal pattern targeting $165-$211) and the Blue Count (corrective wave with potential support at $102-$83), highlighting Nvidia’s key role in the AI-driven bull market.

Nvidia’s stock is range bound, with a probable target of sub-$100

  1. The Green Count – If this is a continuation of the larger uptrend, it is taking the form of an ending diagonal pattern. These patterns are the final 5th wave in a larger 5 wave uptrend, and they tend to follow a powerful 3rd wave uptrend, which is what we saw with NVDA in 2024.

    Ending diagonals are also a 5 wave patterns that have significant overlaps and are relatively weak. If this is the pattern in play, we will need to hold over the $119 – $123 support zone and then break above the $144 – $149 resistance zone. If this does happen, we will be in the 5th wave of this ending diagonal, which will target between $165 – $211. This will end the 5th wave and should lead to a notable retrace. 

  2. The Blue Count – Considering the messy and overlapping nature of this uptrend, there is a chance that this was a corrective bounce in an on-going correction that started in June of 2024. This would suggest that the B wave of this downtrend ended on January 7th with a double top. The final C wave drop should break below $123 – $119 and find support between $102 – $83. 

Considering that Nvidia has been the market leader since 2023, and the most important name in the AI infrastructure spending cycle, how this stock trades will be very important to the bull market.  More importantly, what will be the catalyst to push it to new highs? 

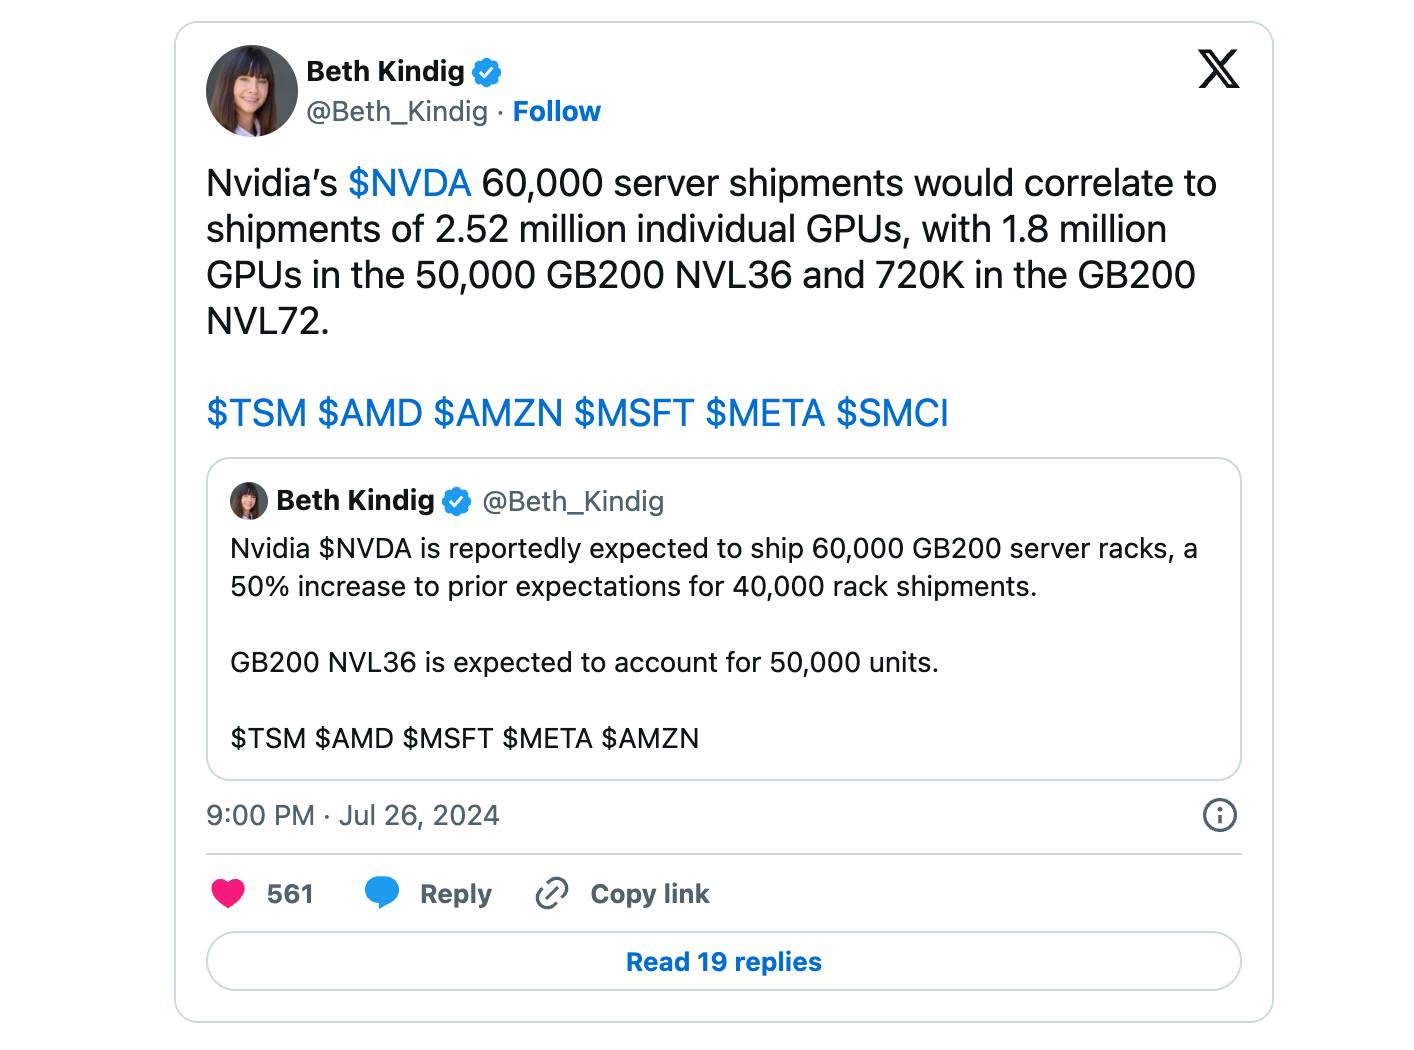
We have been saying for a while that the NVL systems should be that catalyst, expecting fireworks by now. There is $100 billion pointed at one SKU, which is unheard of (the NVL72 systems alone are expected to reach 30,000 racks at the midpoint at $3 million per rack). It took the iPhone fifteen years to get to that revenue (2023). Needless to say, this is an important SKU in terms of a catalyst.

Sign up for I/O Fund's free newsletter with gains of up to 2600% because of Nvidia's epic run – Click hereSign up for I/O Fund's free newsletter with gains of up to 2600% because of Nvidia's epic run – Click hereClick here

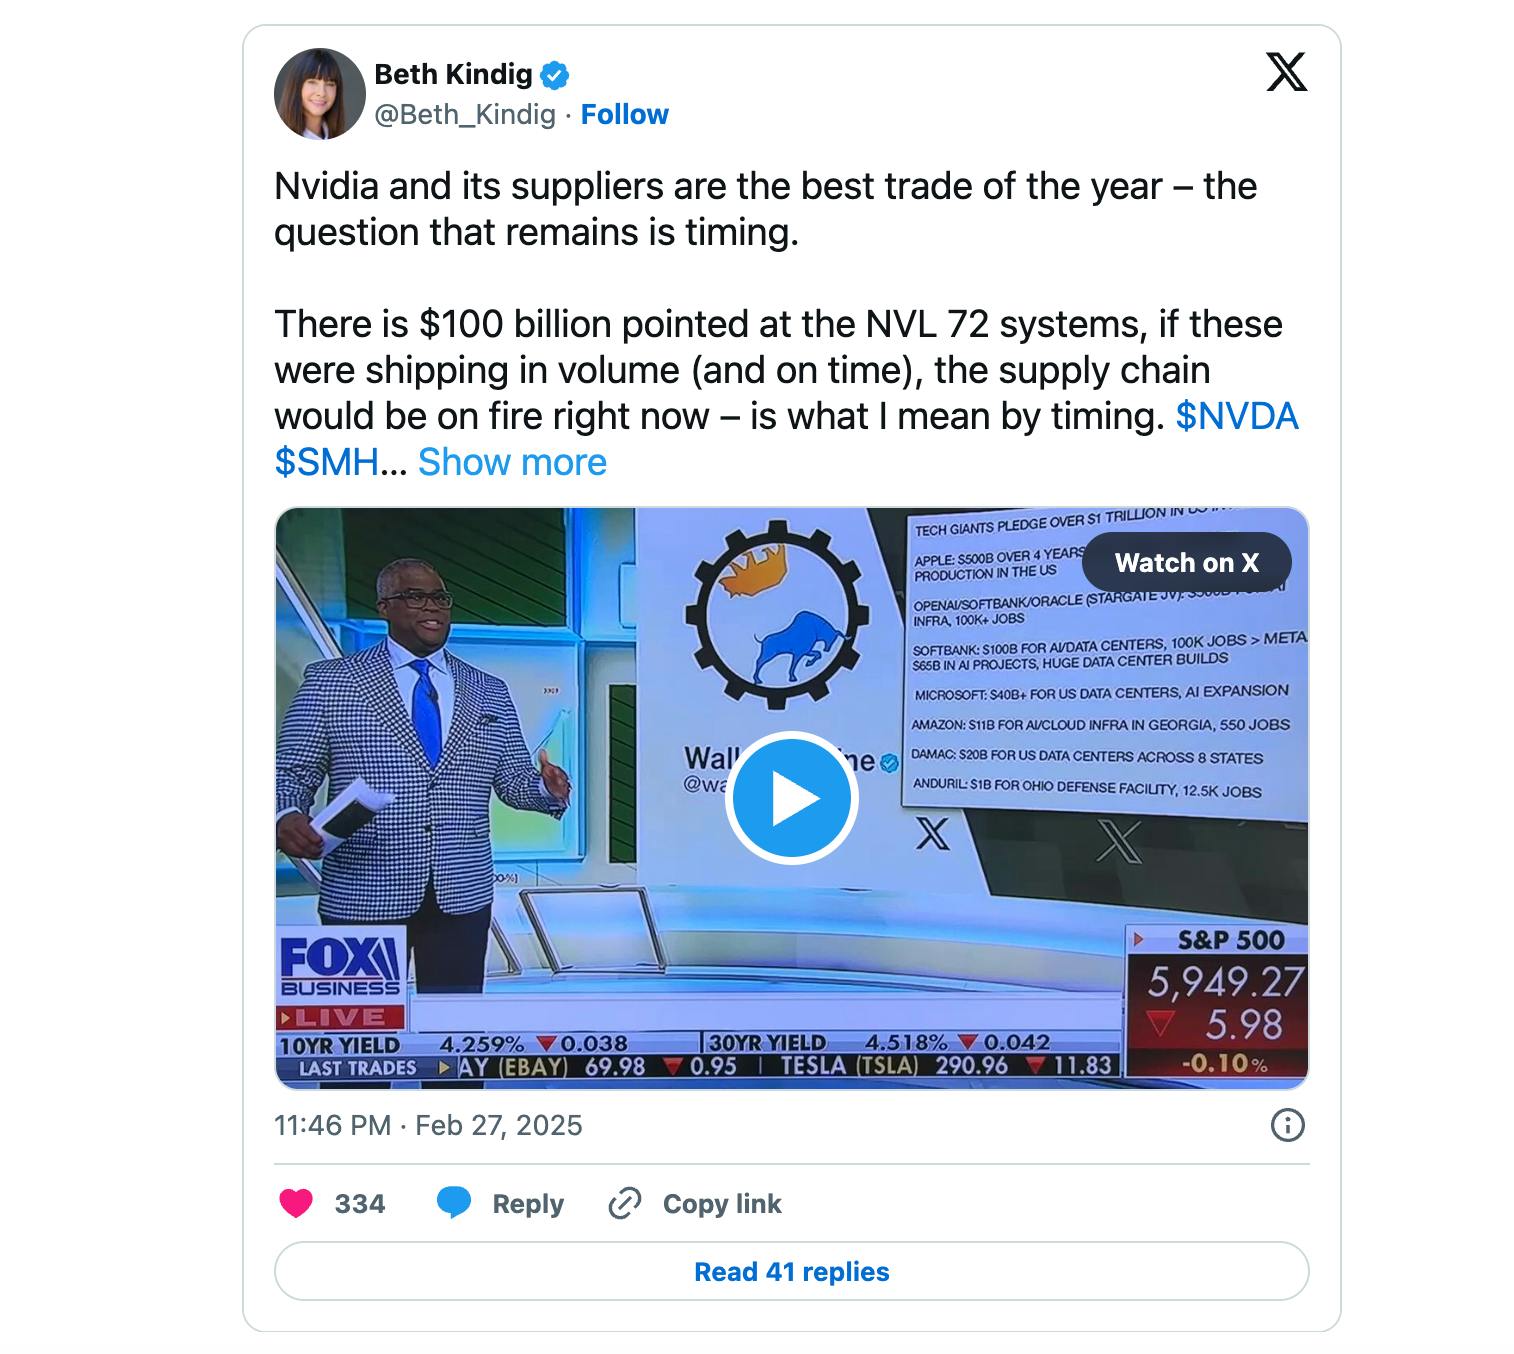
Nvidia (NVDA) and its suppliers are poised for a major trade, but timing is key. With $100 billion aimed at NVL 72 systems, the AI supply chain has yet to show signs of large-scale production. Meanwhile, NVDA remains range-bound for nine months, awaiting a catalyst likely to arrive in H2.

However, underneath the bullish language and standard beat/raise we’ve become accustomed to with NVDA reports, this week’s report confirmed Nvidia “had a hiccup that probably cost us a couple of months.” Nvidia stated the NVL systems have “successfully ramped in production” but did not say they were shipping in volume, which was the original expectation. This is also present with the price action in the NVL suppliers. You simply can’t put $100 billion into production for one SKU and ship in volume without a splash in the large supply chain that builds these AI systems. There was no splash (yet). We covered this more here

Some might be thinking that what we are seeing is a rotation from the overextended Mag 7 into other, beaten down names in the market. In other words, this would be a positive sign, as the FED has engineered a no-landing scenario, and the bull market is about to continue to grind higher with more involvement.  

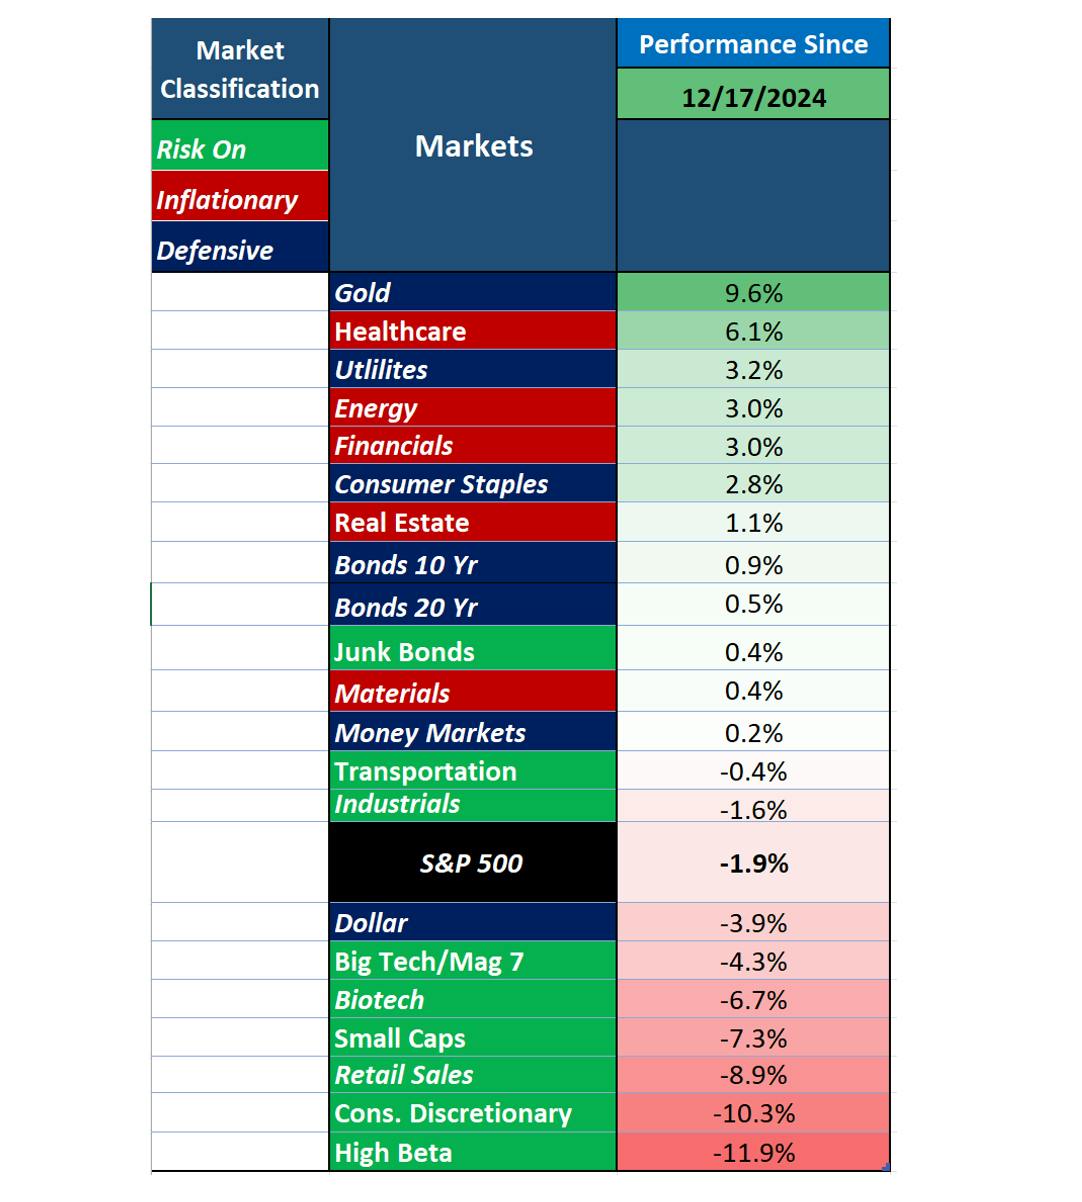
If this were the case, we would see a rotation from the Mag 7’s December 17th top into beaten down sectors like transportation, small caps, high beta, retail sales, biotech, etc. These are sectors that not reclaimed their 2021 highs and would benefit from a further economic expansion with lower rates and expanding credit.  

However, since the December 17th high in the Mag 7, we have seen money flow into predominantly risk-off sectors that represent inflationary and defensive positioning. Gold, Healthcare, Utilities, Energy, Financials, Consumer Staples, even Long-Dated bonds and Money Markets are outperforming most risk-on sectors. This is where money should be flowing, if this narrative were true, all of which are getting sold since money started rotating out of the Mag7. 

Chart showing market rotation since the December 17th Mag 7 high, with money flowing into defensive and inflationary sectors like Gold, Healthcare, Utilities, Energy, Financials, Consumer Staples, and Bonds.

Since the Mag 7 topped in December, money is flowing into risk-off sectors.

Sentiment

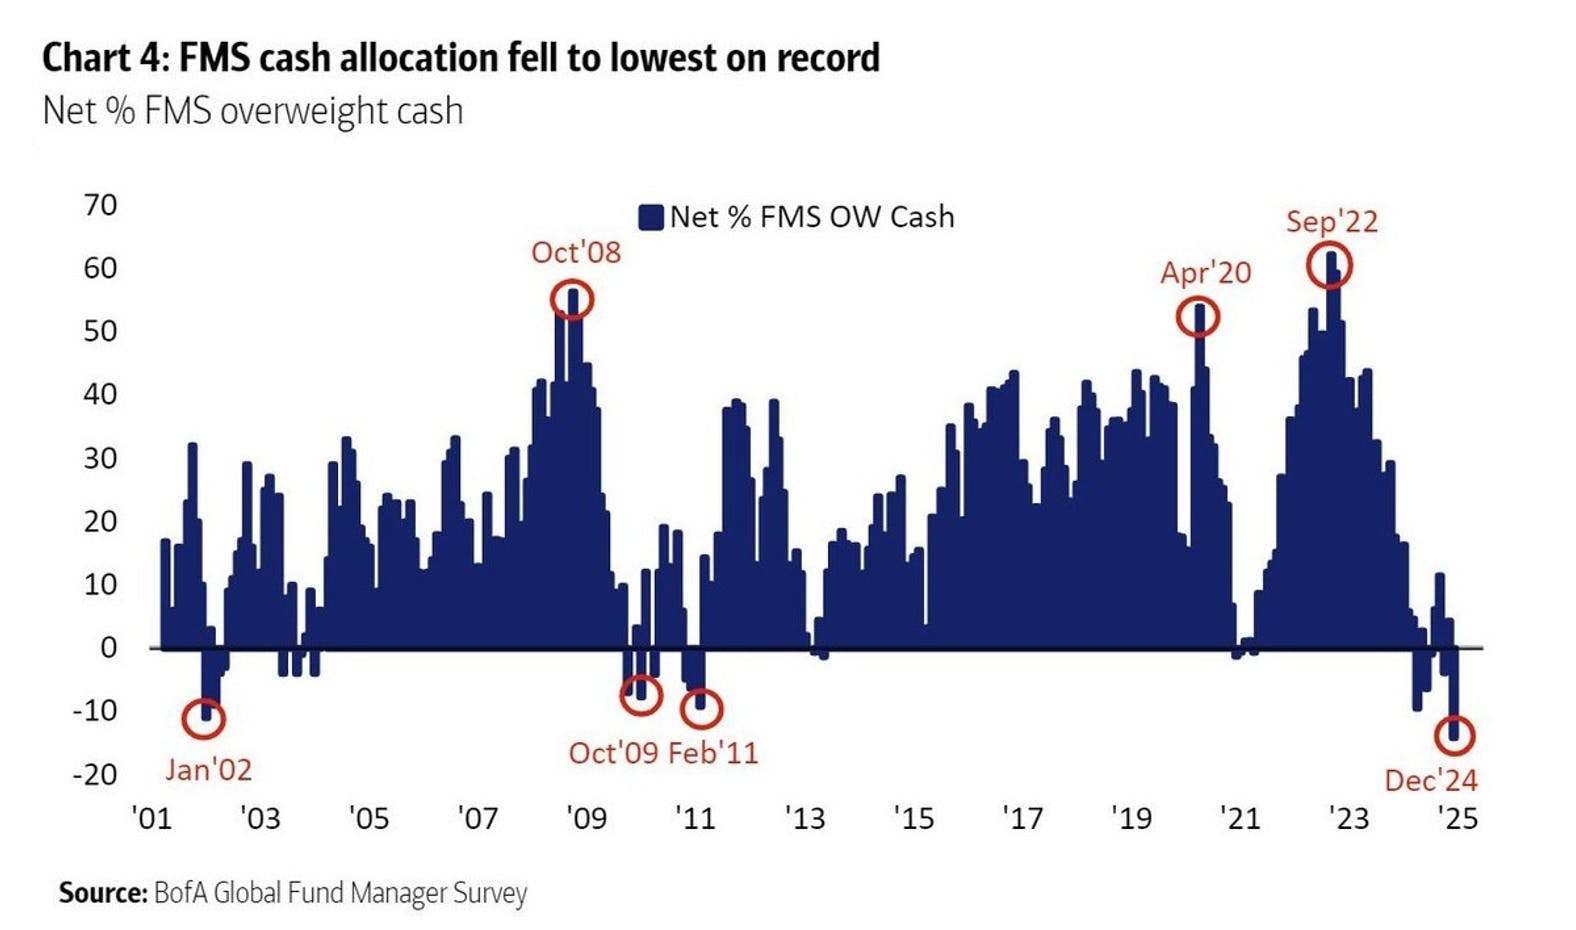
After seeing two back-to-back years of +20% returns in the markets, we are seeing historically high valuations coupled with historically high sentiment. The Bank of America Global Fund Manager Survey for December, which monitors how money managers are positioned, shows the lowest allocation to cash on record.

Chart highlighting historically high market valuations and sentiment following two consecutive years of 20%+ returns, with the Bank of America Global Fund Manager Survey showing record-low cash allocations.

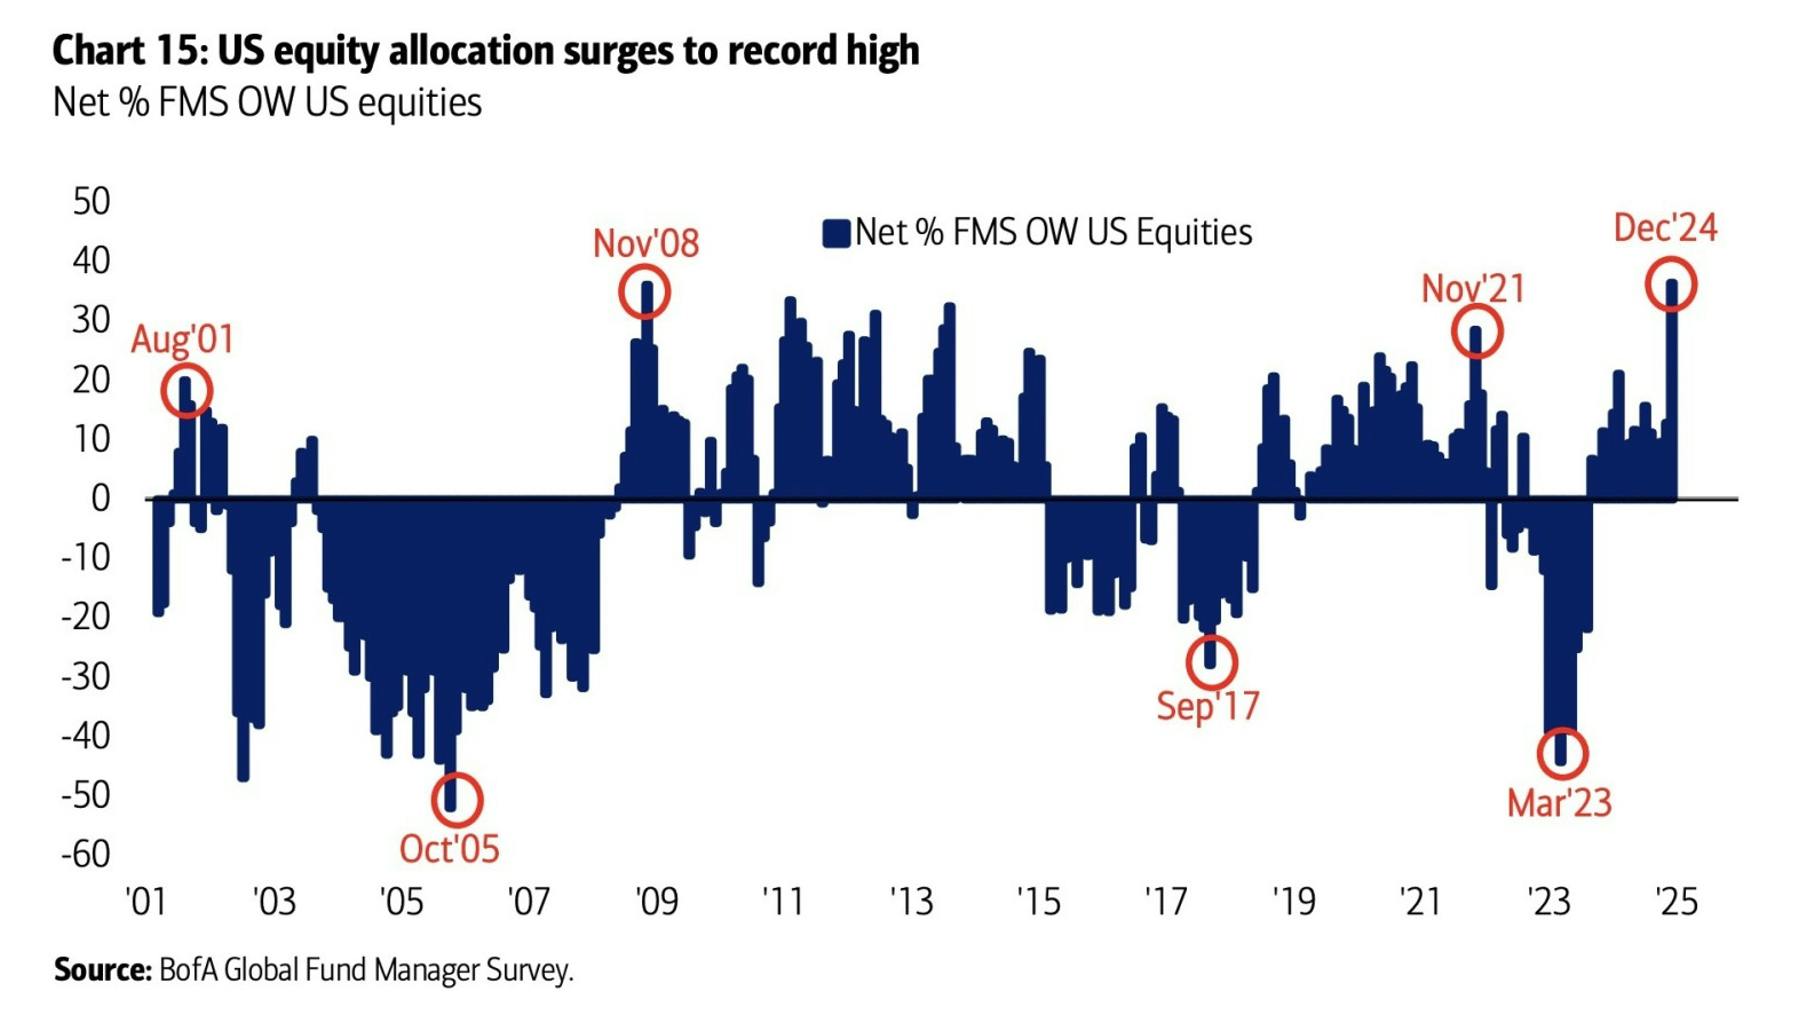
This is followed up with the highest allocation to equities on record.

Chart showing the highest equity allocation on record, following historically high market valuations and sentiment, as reported in the Bank of America Global Fund Manager Survey.

Fund managers are all in on stocks, unlike any period we have ever seen.  

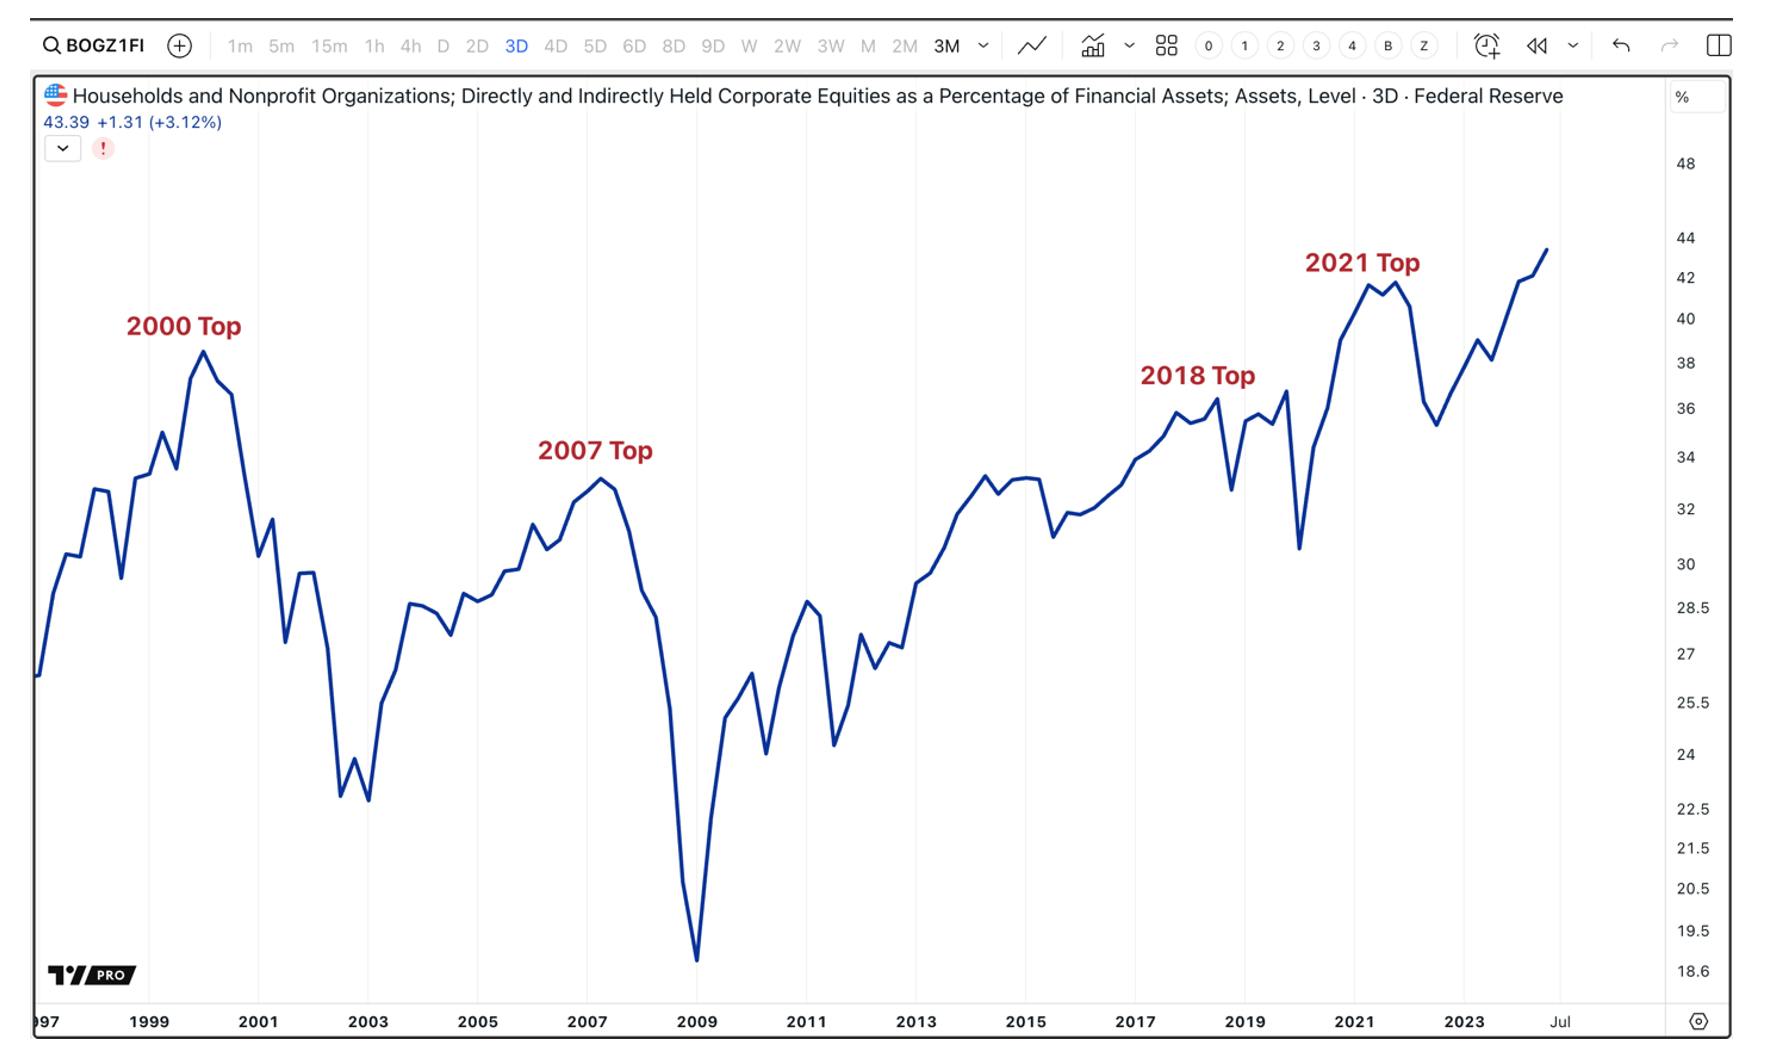
The same can be said about retail investors. When we look at the most recent data of the equities held as a percentage of financial assets for US households, it has just reached all-time highs, surpassing the 2000 top and 2021 top.

Chart showing record-high equity allocations among fund managers and US households, surpassing the 2000 and 2021 peaks, signaling extreme market positioning.

Retail is all in on stocks in 2025

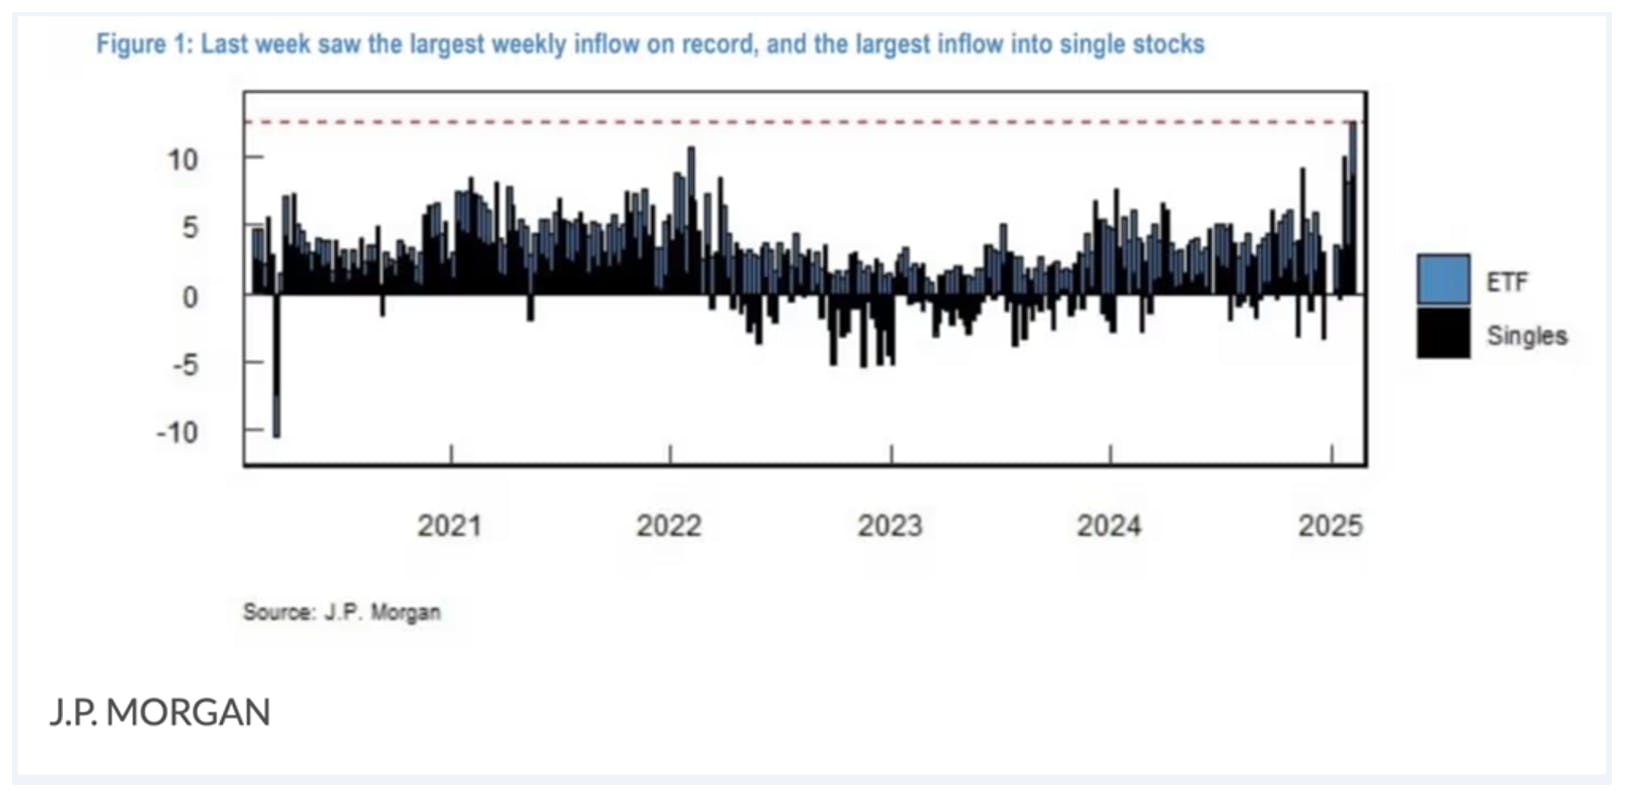
This trend reached a climax into the recent February top. JP Morgan saw the biggest weekly inflow of retail funds into equities starting February. Of this money, over 70% went into the Magnificent 7 stocks.

Chart showing record retail fund inflows into equities at the February market top, with JP Morgan reporting over 70% of this money flowing into the Magnificent 7 stocks.

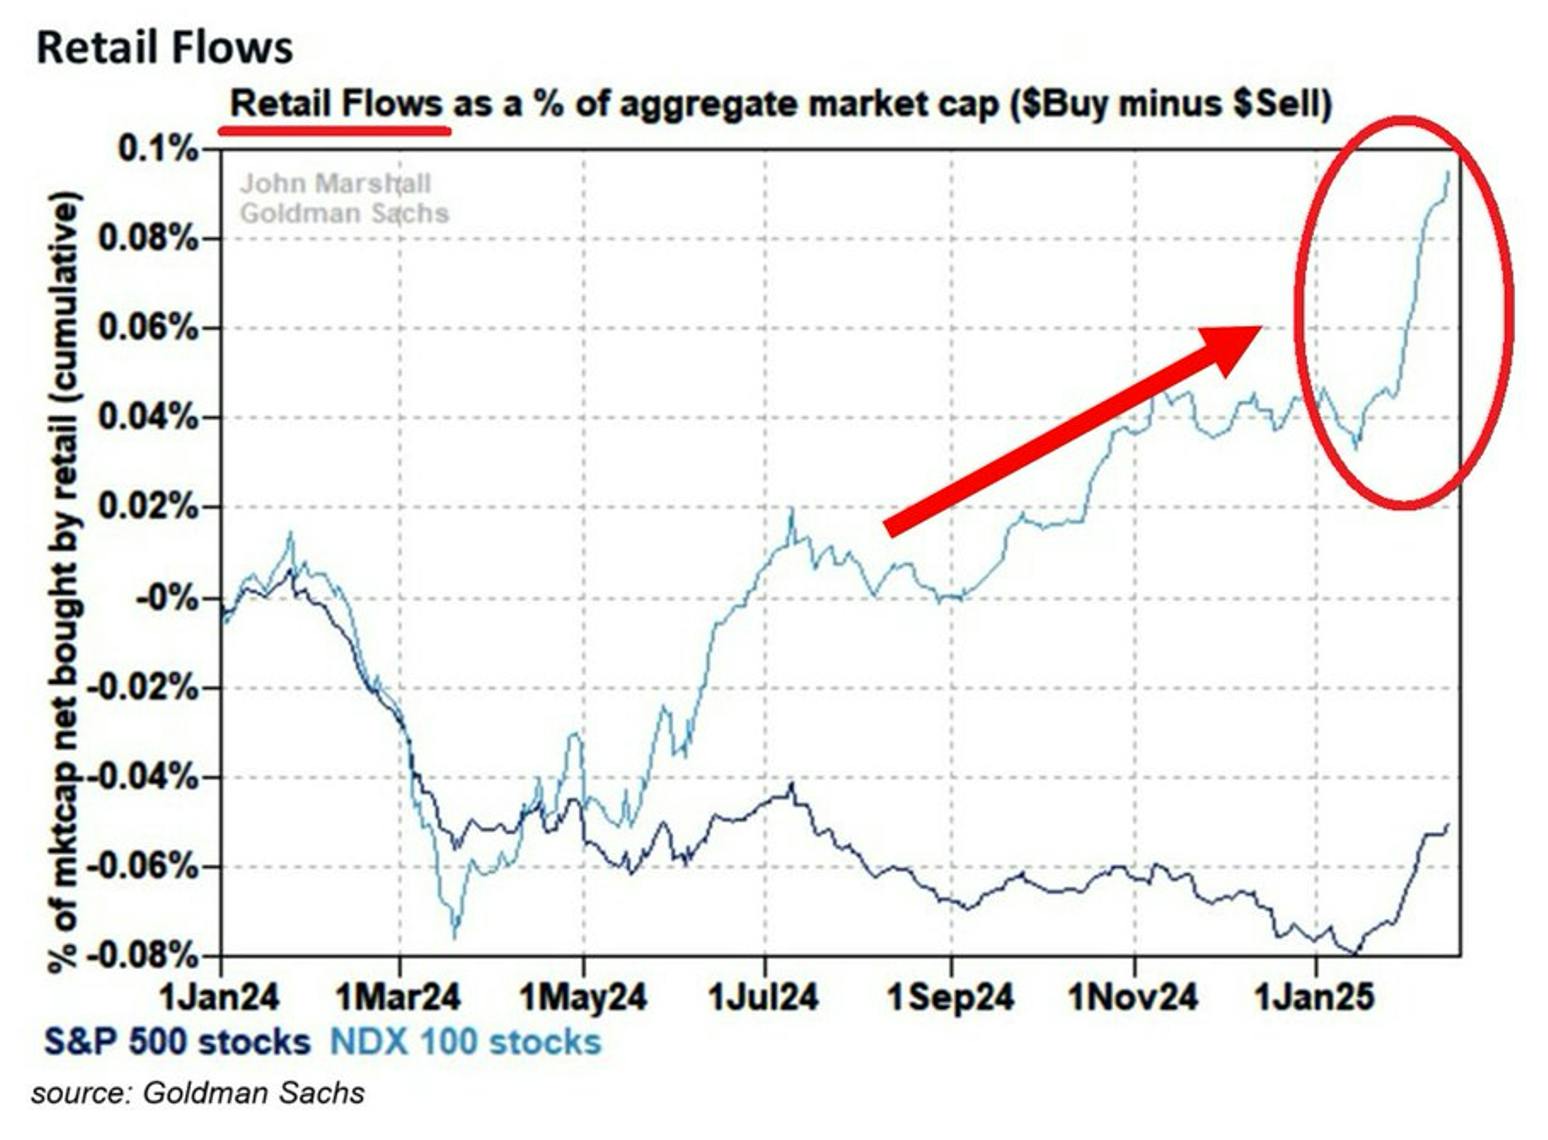
On aggregate, retail exposure to equities has more than doubled since the start of 2025

Chart showing retail equity exposure doubling in 2025, with retail flows as a percentage of aggregate market cap ($buy minus $sell), highlighting extreme market exuberance.

It appears that everyone is all-in on this bull market, with a level of exuberance that historically does not last. However, an important point to consider considering that retail is pushing more money into the Mag 7 on record – with this level of fund flows into these names, why are they not pushing to all-time highs? The only explanation is that bigger institutions are selling into the retail buying frenzy.  

Broad Market Analysis 

We have reached the upper target zone outlined in our last October report.  Now that we are here, the potential target zone has been adjusted to account for multiple scenarios that could play out.  

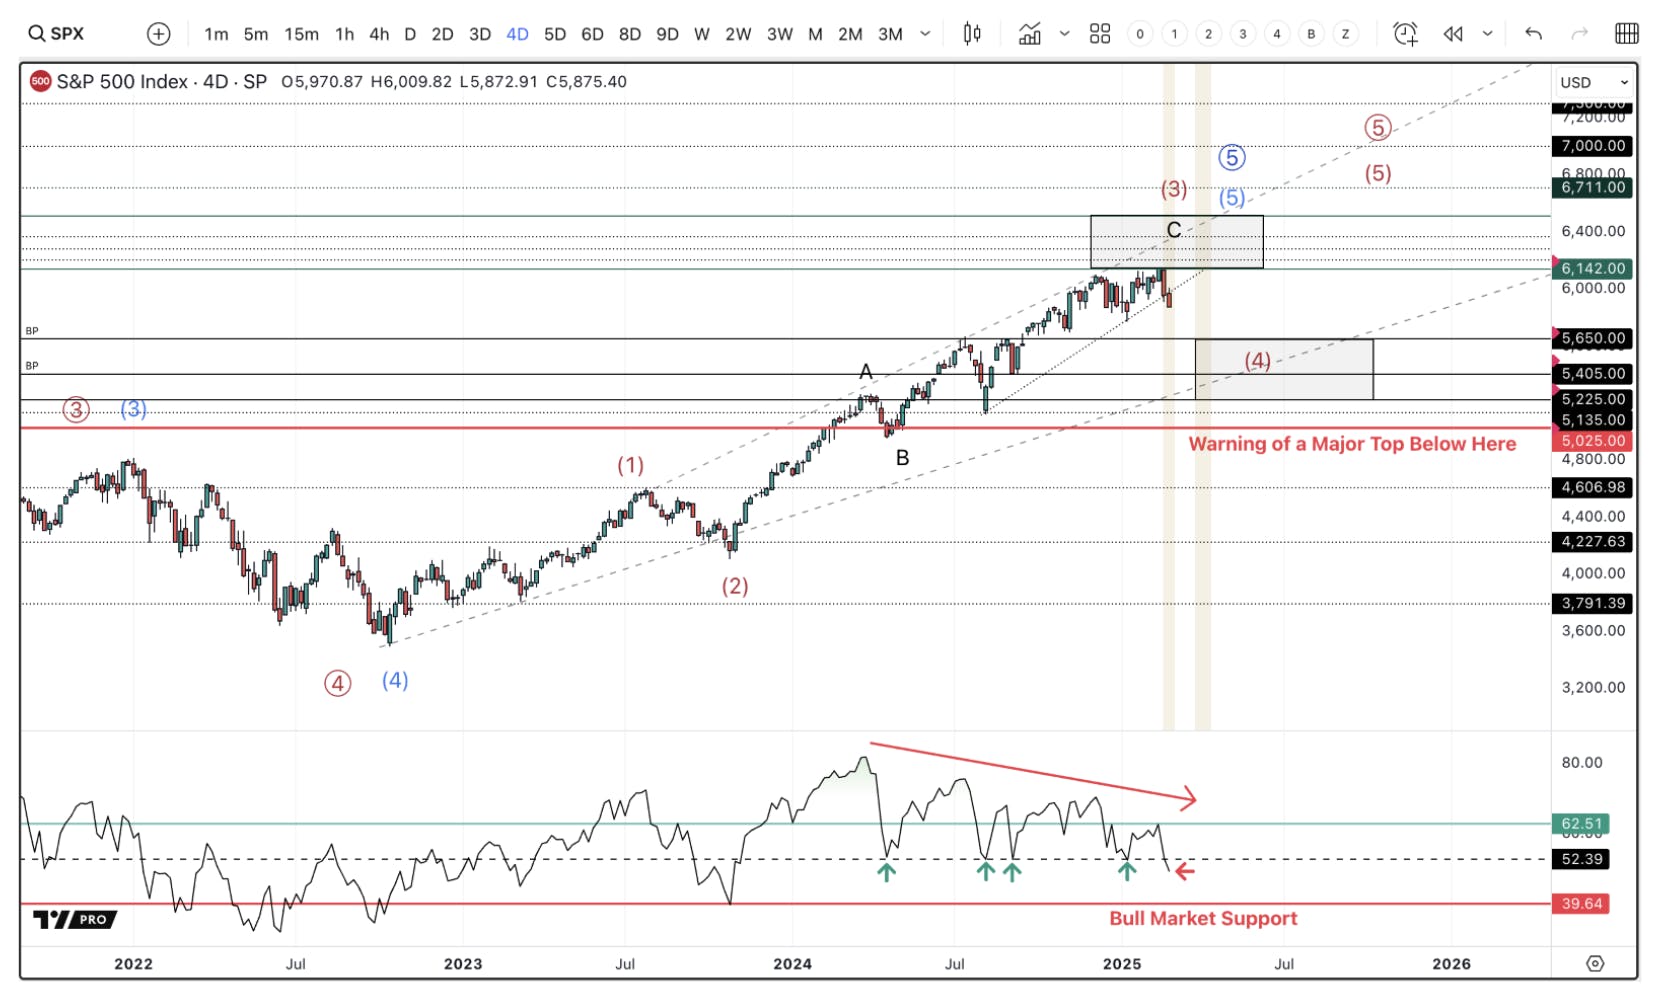
Even the most bullish interpretation of the bull market off the 2022, suggests that, at some point within the 6140 – 6500 target zone, we should start a relatively large correction back to the 5600 – 5200 region this year.  

However, note the Relative Strength Index (RSI) below. It has made a series of lower highs, suggesting momentum is fading the higher price pushes. This is the type of divergence we see at market turning points, especially when the RSI starts closing below the 60 region, as we just did at the recent February high.

The S&P 500 has reached the 6140–6500 target zone, with RSI making lower highs, signaling weakening momentum. A correction to 5600–5200 is likely if RSI continues to decline.

The S&P 500 is setting up for a sizable correction

Since 2024, each dip has found a low on the 53 region on the RSI. This level just broke, which suggests a drop to the bull market support region at 39 of the RSI. The market is currently on its last leg before fully confirming this drop. 

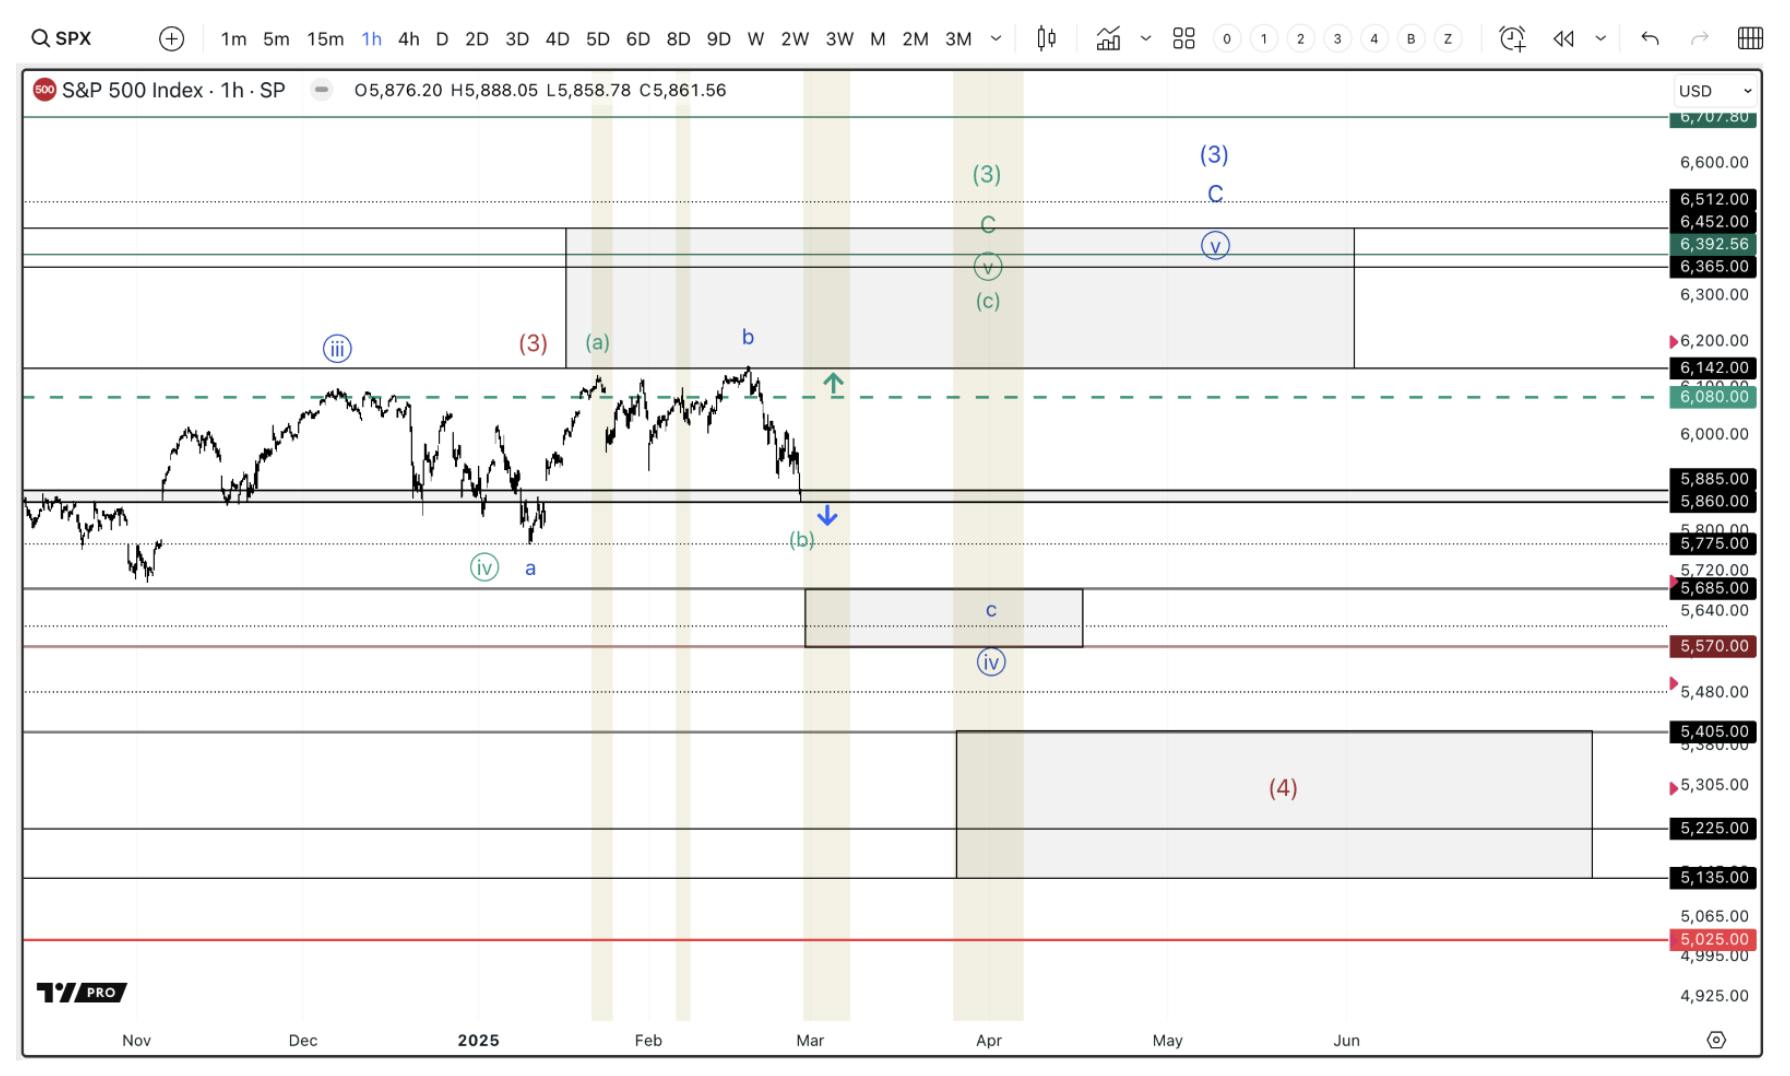
The RSI can give advanced warnings of bigger moves, and as of today, it is breaking below the minor dip level that has caught each dip in 2024. Now, we need confirmation with price. If we see a sustained break below 5885 – 5860, I am expecting a drop into our lower SPX target around 5600. If this level does not hold, the level below that is 5200. This scenario is shown in blue and appears to be the most probable outcome.  

However, while we are seeing ample signs of a market starting to break down, until SPX gives us a sustained break below 5860, this market has the potential to make one more swing into the 6300 – 6500 before starting this larger correction that we believe is on the horizon. This scenario is shown in green in the chart below.

The S&P 500 RSI has broken key support at 53, suggesting a drop to the bull market support region at 39. A sustained break below 5860 could lead to a decline toward 5600 or even 5200, while a final swing to 6300–6500 remains possible before a larger correction.

The S&P 500 is on its last leg before confirming a drop into the 5600 region, minimum. 

For this to happen, we need to hold over 5885 – 5860 and break above 6080 to suggest this is likely to play out. What this would mean is that this is a minor correction, which will lead to one more high before the larger correction unfolds. If this happens, based on the warning signs discussed, we will not chase this push higher, and likely sell more into it.  

The I/O Fund has been 100% hedged since December 27th.  The portion of the correction that we are in could potentially see us hit our targets below in a short amount of time. If this happens, we plan to remove our hedges and add the cash that we raised into beaten down AI names.  

Conclusion: 

In conclusion, while the market continues to push higher, it has been doing so without the support of key stocks and important sectors. As we’ve seen in times past, while this divergence can go on for a while, unless it invalidates with all sectors and stocks breaking to new highs, it tends to act as a warning. With money managers and retail investors all-in on stocks, it appears that the stage is being set for a potential rug pull this year. While this bout of volatility may have already started, we still could see one more swing into the 6300 first.  

We do not believe this is the end of the bull market, especially considering the on-going Capex spend and products coming to market to meet that flow of money. We have set up aggressive buy targets for some of the Mag 7, as well as suppliers that we believe should benefit from the continuation of the AI bull market. 

If you are overexposed to equities, sitting on outsized gains, or looking for a safe entry into richly valued tech stocks, we encourage you to join our weekly webinar for Premium Subscribers. Every week at 4:30 EST, we discuss broad market risk, our personal risk management strategies, as well as long-term buy targets for important AI stocks.  

Disclosure: The I/O Fund owns Nvidia and a handful of Nvidia suppliers including some of the suppliers listed in this analysis. To view the full portfolio, subscribe heresubscribe here.

Please note: The I/O Fund conducts research and draws conclusions for the company’s portfolio. We then share that information with our readers and offer real-time trade notifications. This is not a guarantee of a stock’s performance and it is not financial advice. Please consult your personal financial advisor before buying any stock in the companies mentioned in this analysis. Beth Kindig and the I/O Fund own shares in NVDA at the time of writing and may own stocks pictured in the charts.

Recommended Reading:

Nvidia Q4: Range Bound and Looking for a Catalyst 

Compared to any other stock on Wall Street, Nvidia reported an exceptional quarter. Yet, Nvidia’s stock is competing with itself at this point, and when compared to previous Nvidia earnings reports, Q4 and Q1 represent a pause in the fireworks. 

Nvidia reported $11 billion in Blackwell revenue, however, Huang finally admitted the NVL systems are in production (i.e., not shipping in volume). Rather, other SKUs are making up Blackwell revenue for now. According to a discussion with an analyst, Nvidia foresees NVL systems and the next generation Blackwell Ultra ramping “simultaneously” — which increases the pressure to deliver this fiscal year given there was a “couple months” delay with the NVL systems.  

Fortunately, for the I/O Fund, we use technicals to reduce risk. When there is a change in story, even if it’s transitory by a quarter or two, we rely on technicals to protect our position while maximizing the upside. As you know, we are exposed to Nvidia — yet heavily exposed when you consider its ecosystem. 

We also hold our management teams accountable, and not even Jensen Huang should get a free pass. Investors should have been provided more transparency on when the premier SKU will be shipping in volume, since it was originally slated for Q1. Below, I outline the reasons that H2 is likely to be the catalyst for the next leg higher, whereas Q1 may not have been enough to cause the stock to break out. With that said, semiconductors see intra-quarter news more frequently than software peers, and thus, this could change anytime.  

Nvidia’s valuation remains very attractive. I stated on Fox yesterday that Nvidia and its suppliers are the best trade of the year – the question that remains is timing. If the NVL systems were shipping in volume, the supply chain would be on fire right now – is what I mean by timing. I also pointed out that investors do better when proxies participate – whether that’s suppliers providing a clear, green light or an ETF like SMH, which is 14% off ATHs. 

I look at this and more below! 

Revenue Beat/Raise (Again) 

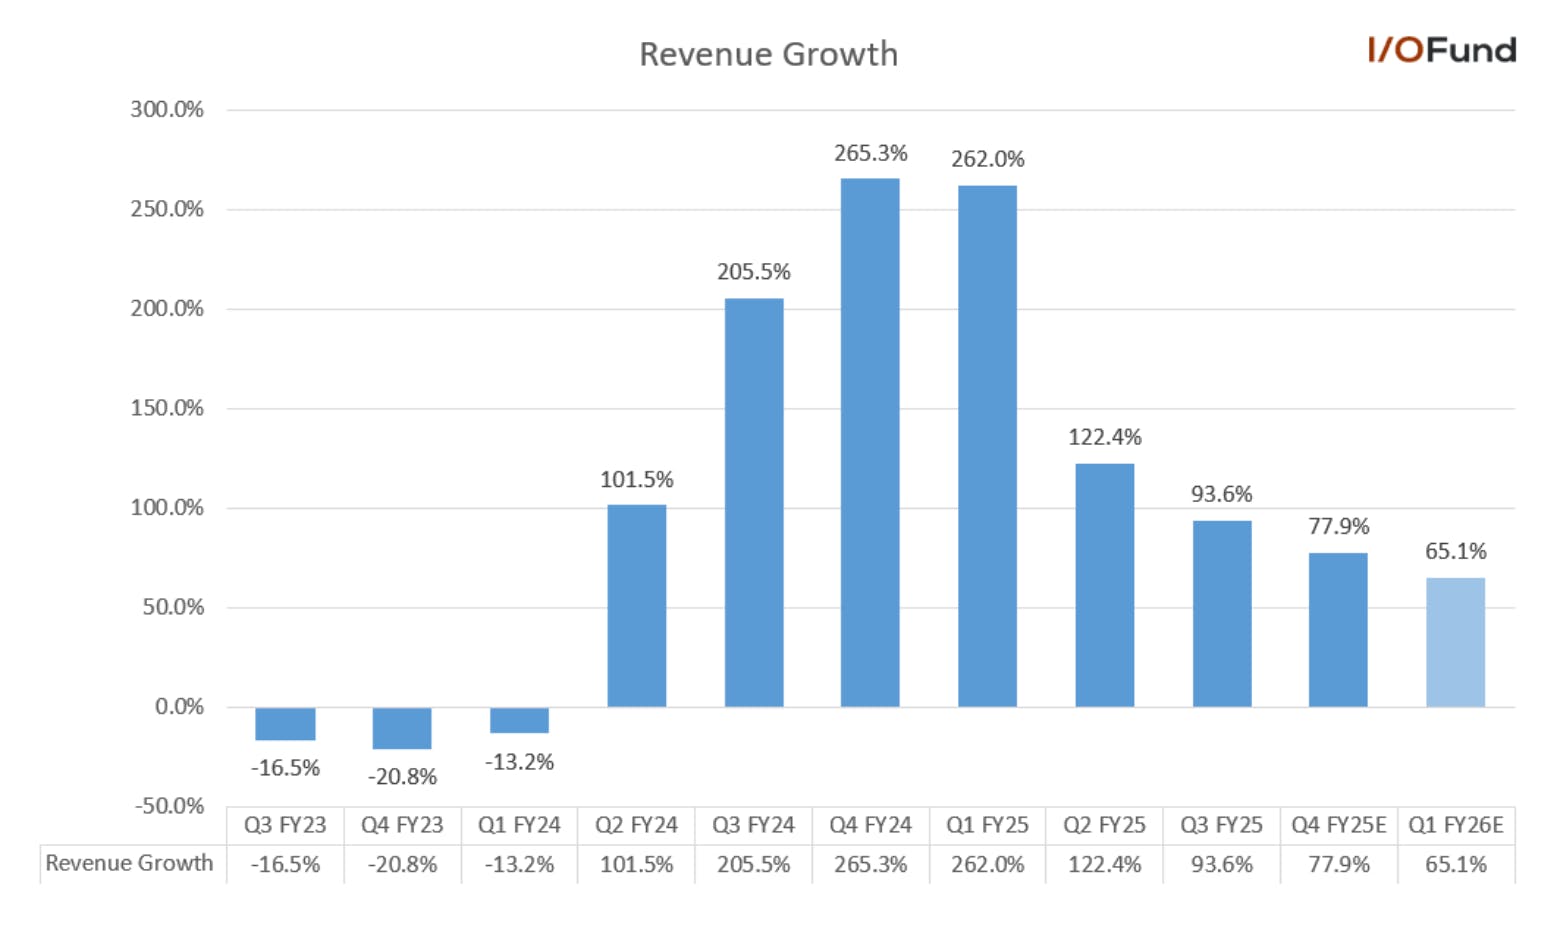
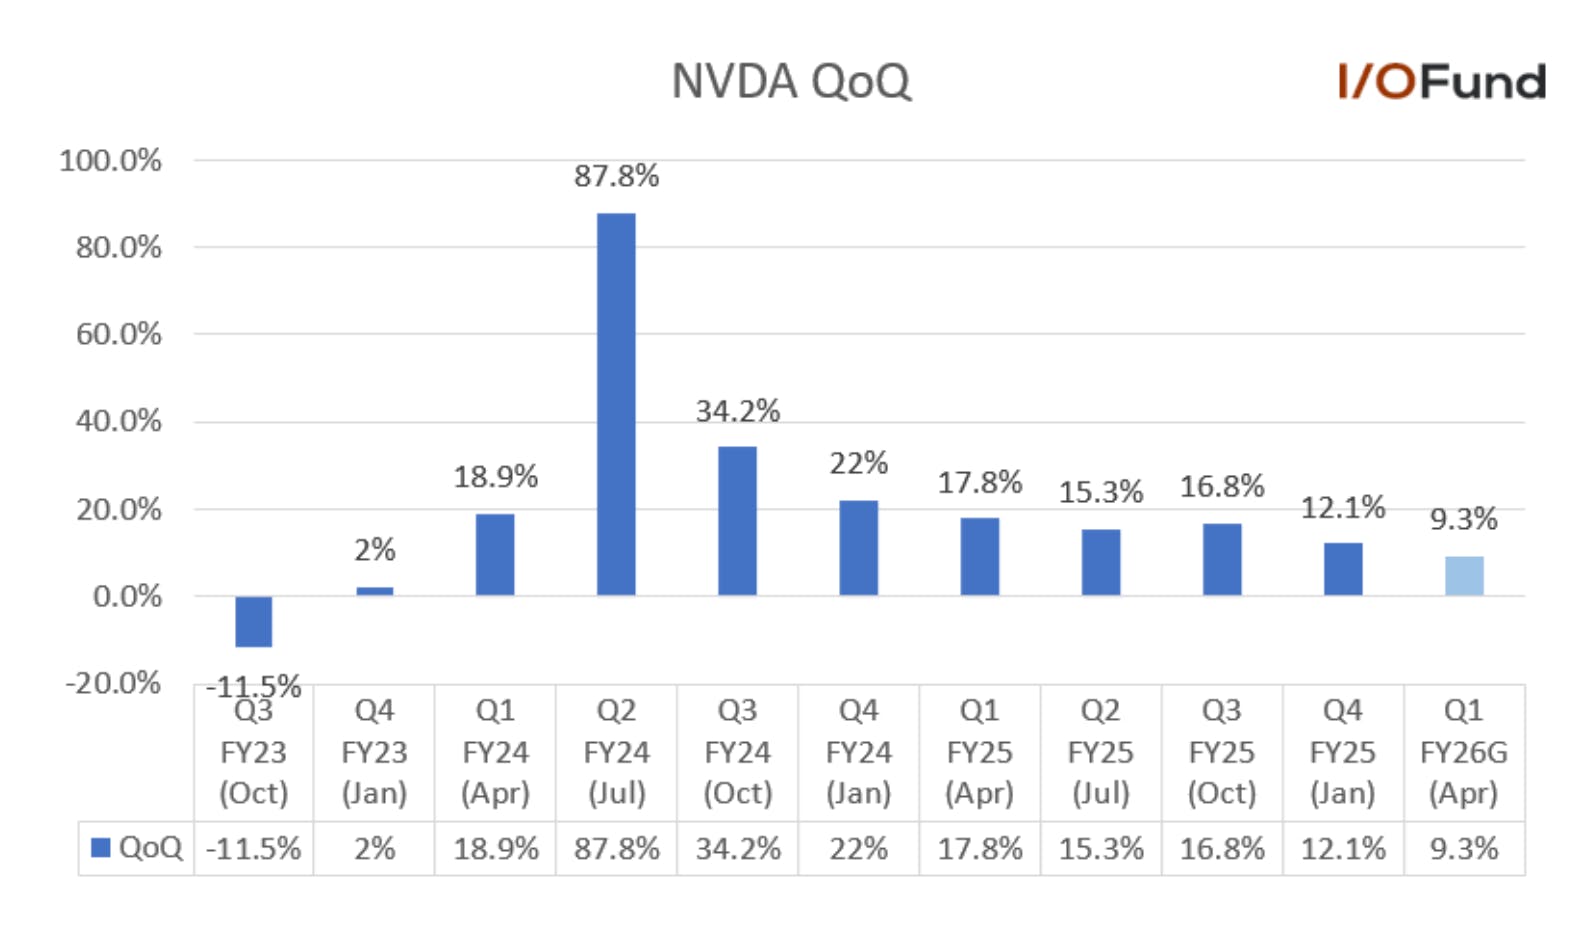
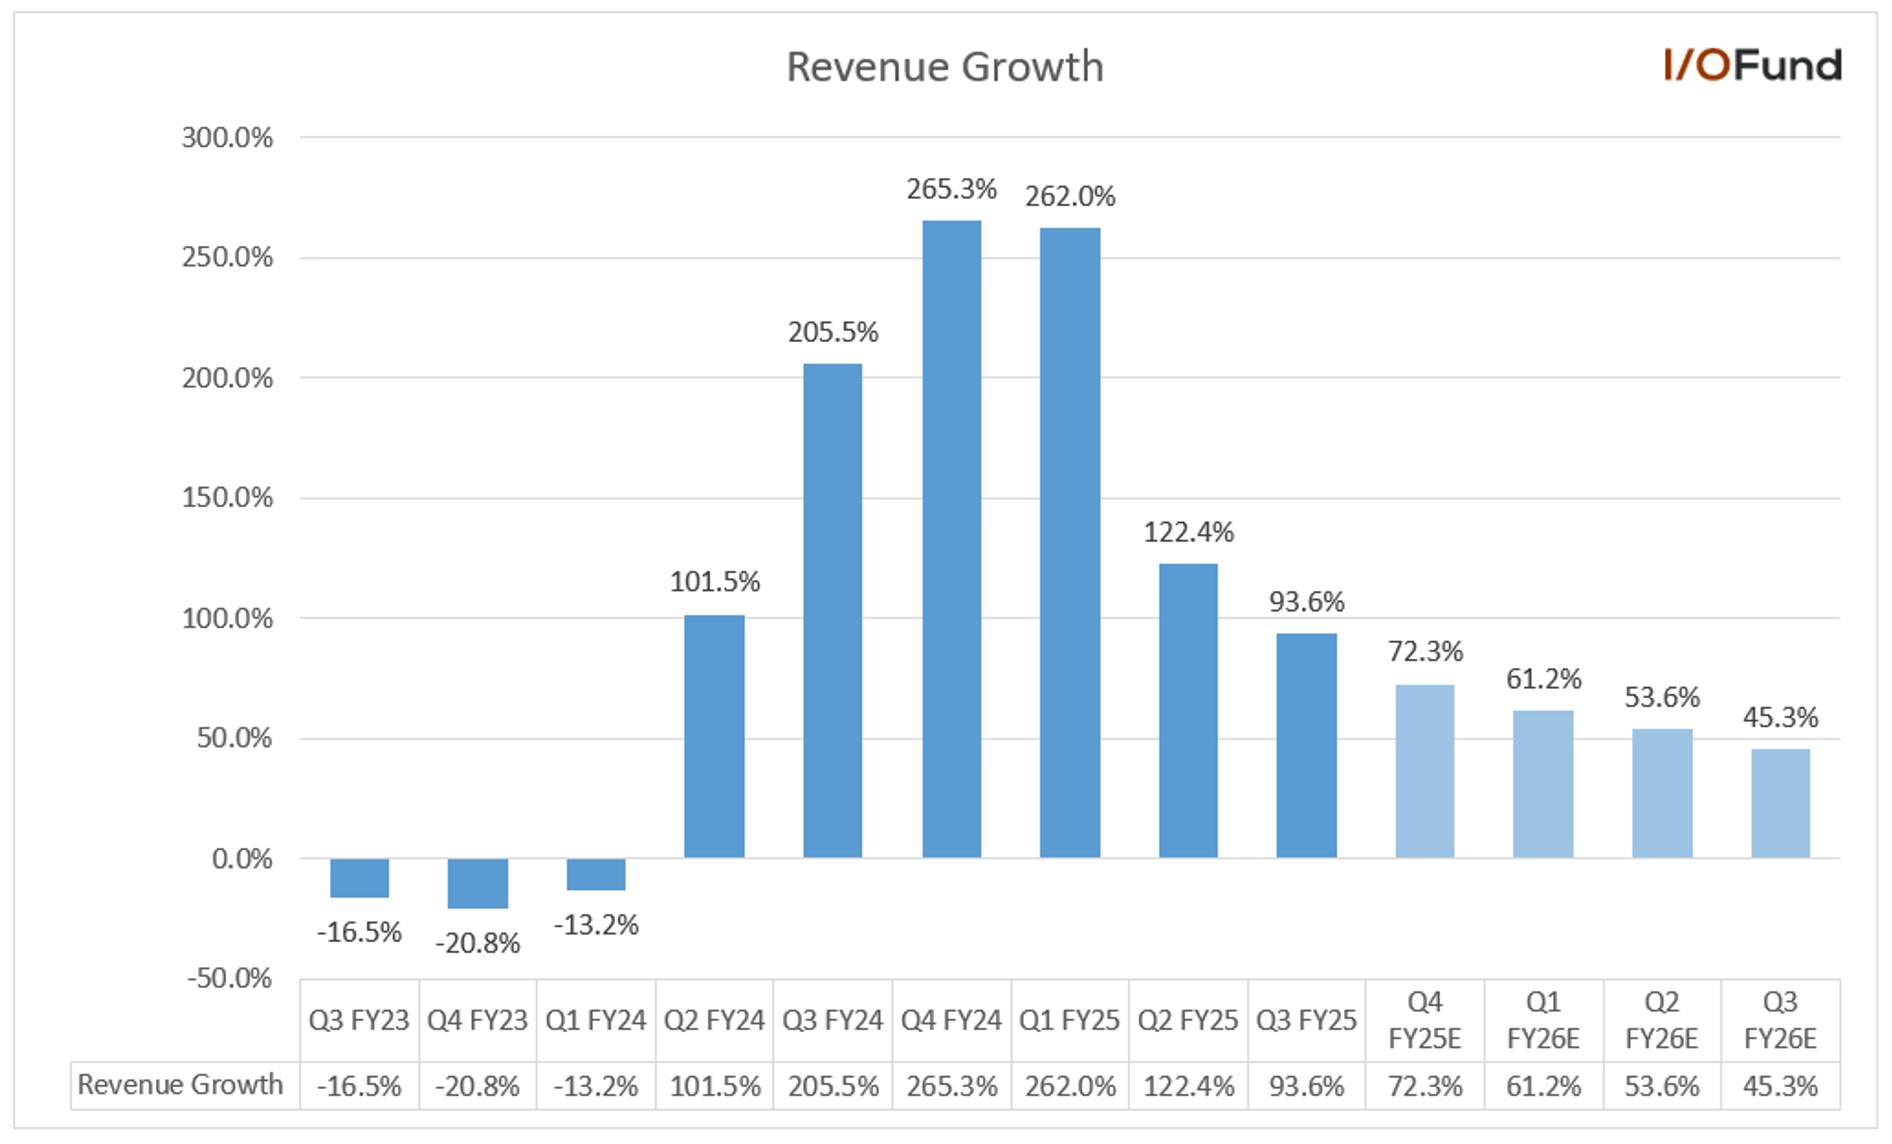
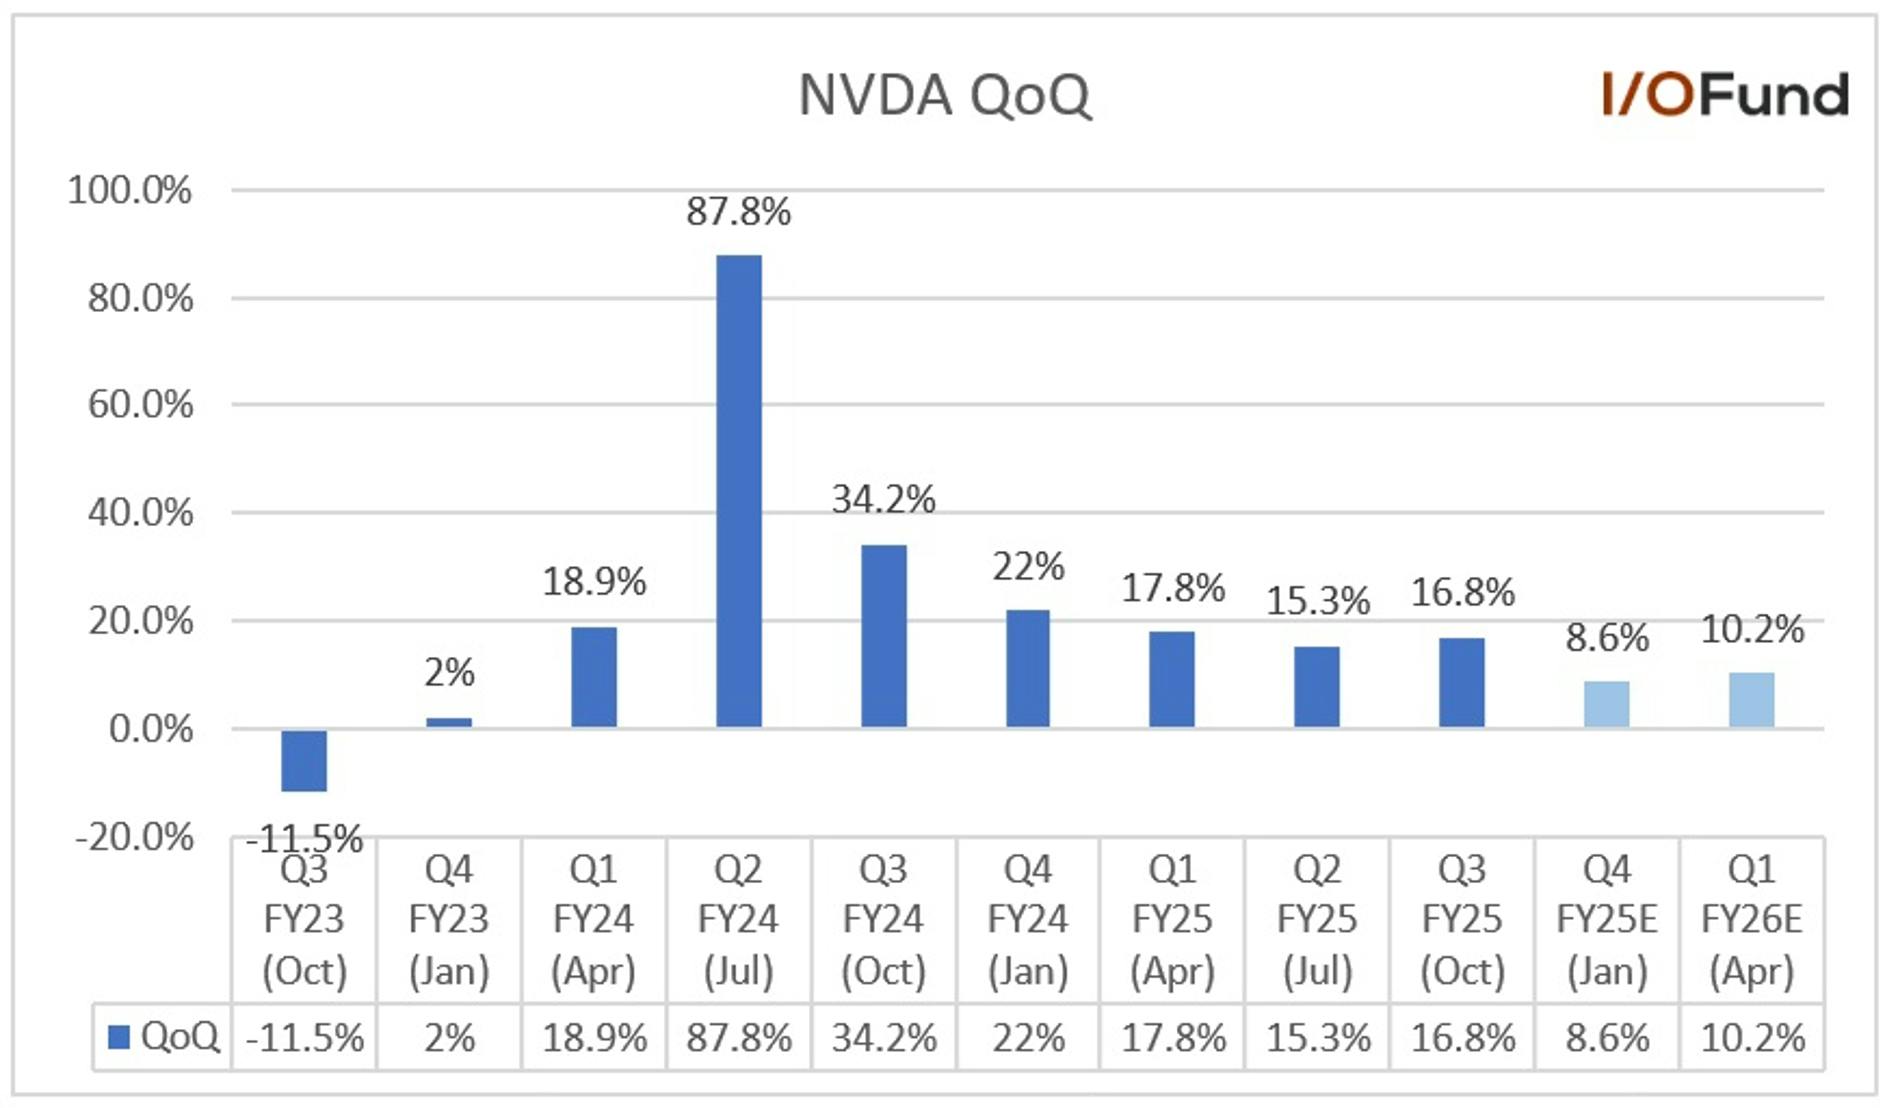
Nvidia beat consensus estimates by just $1.15 billion this quarter, its smallest beat of the last seven quarters, as it reported revenue of $39.33 billion, up 77.9% YoY and 12.1% QoQ. Management reported that Blackwell was witnessing the fastest product ramp in company history, delivering $11 billion in Blackwell revenue in Q4. 

For FY25, Nvidia reported revenue growth of 114% YoY to $130.5 billion, marking a consecutive year of triple digit growth after revenue rose 126% YoY in FY24. 

For Q1, Nvidia guided for revenue of $43 billion, +/- 2%, representing growth of 65.1% YoY and 9.3% QoQ at midpoint, slightly ahead of estimates for 61.2% YoY growth to $42 billion. As we had noted in our pre-earnings analysis, some analysts were looking for as much as $47 billion in revenue in Q1. On a sequential basis, Q1 is also estimated to see QoQ growth dip to the single-digit range at the midpoint of guidance, slowing nearly 3 points from Q4.  

Margins to Improve H2 

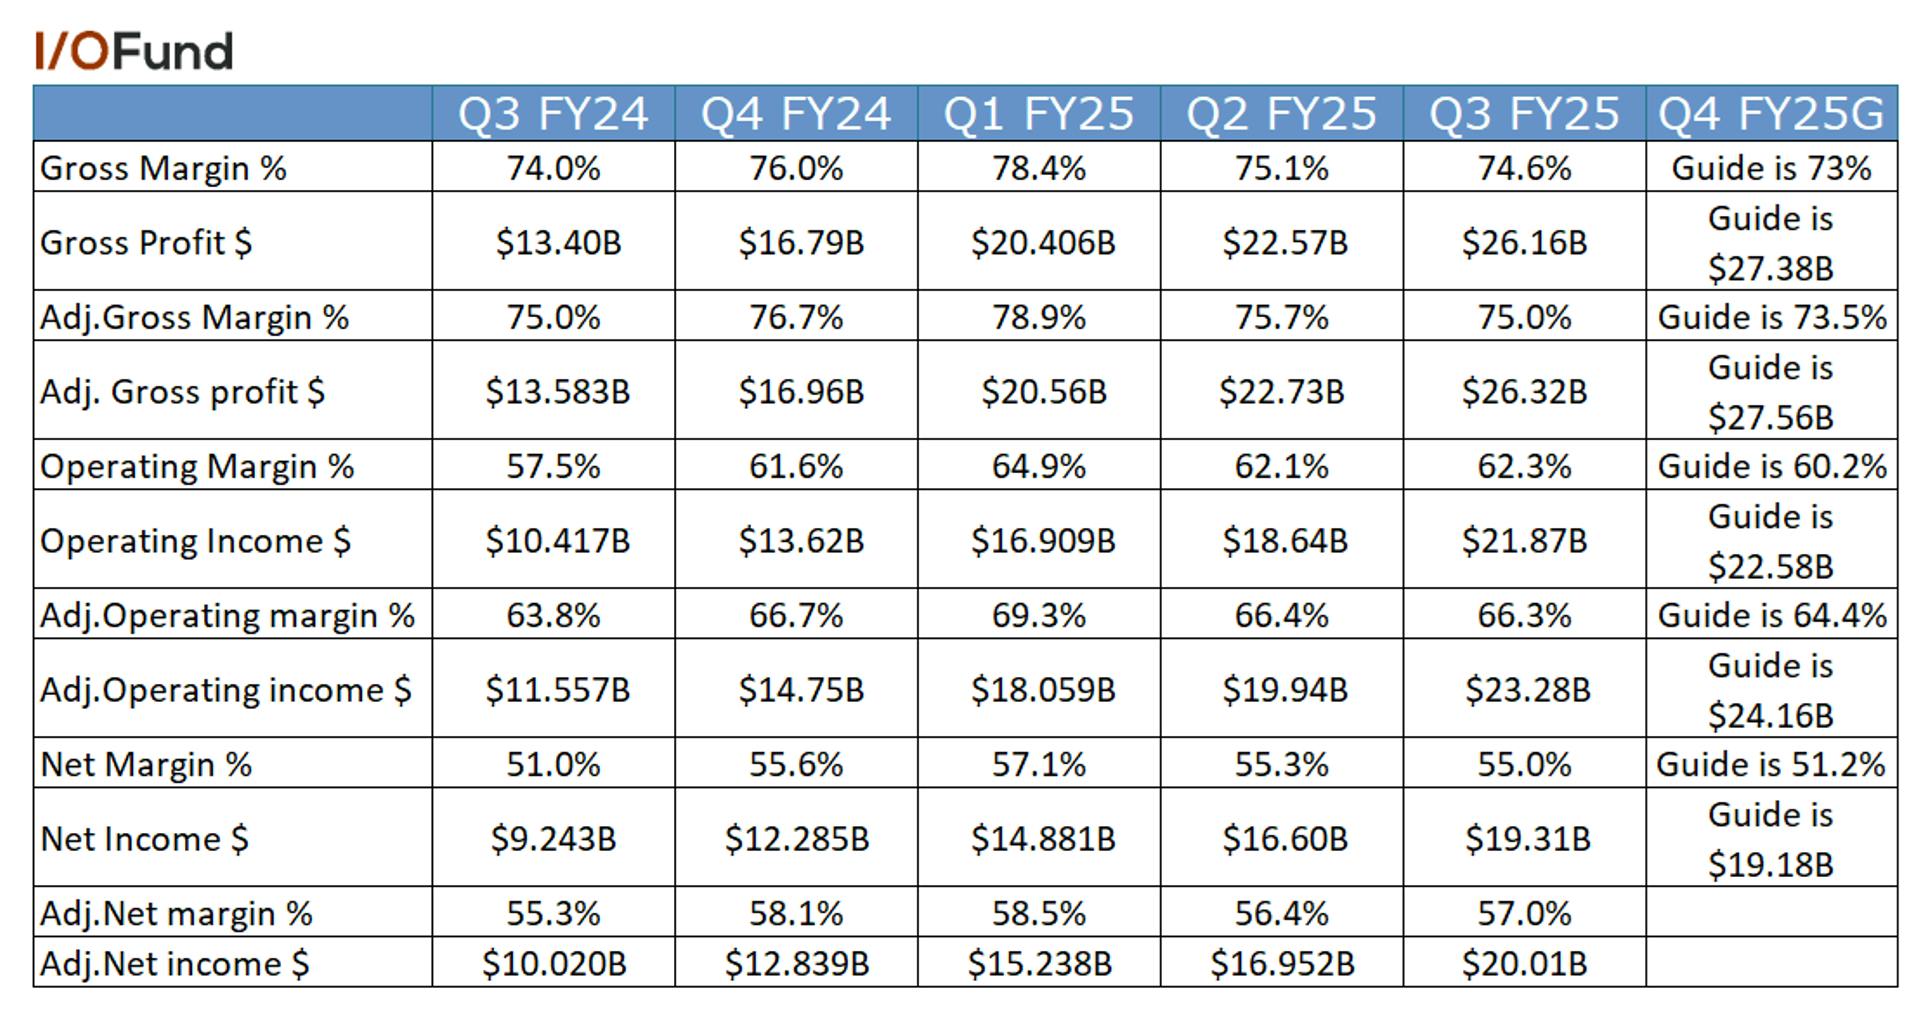
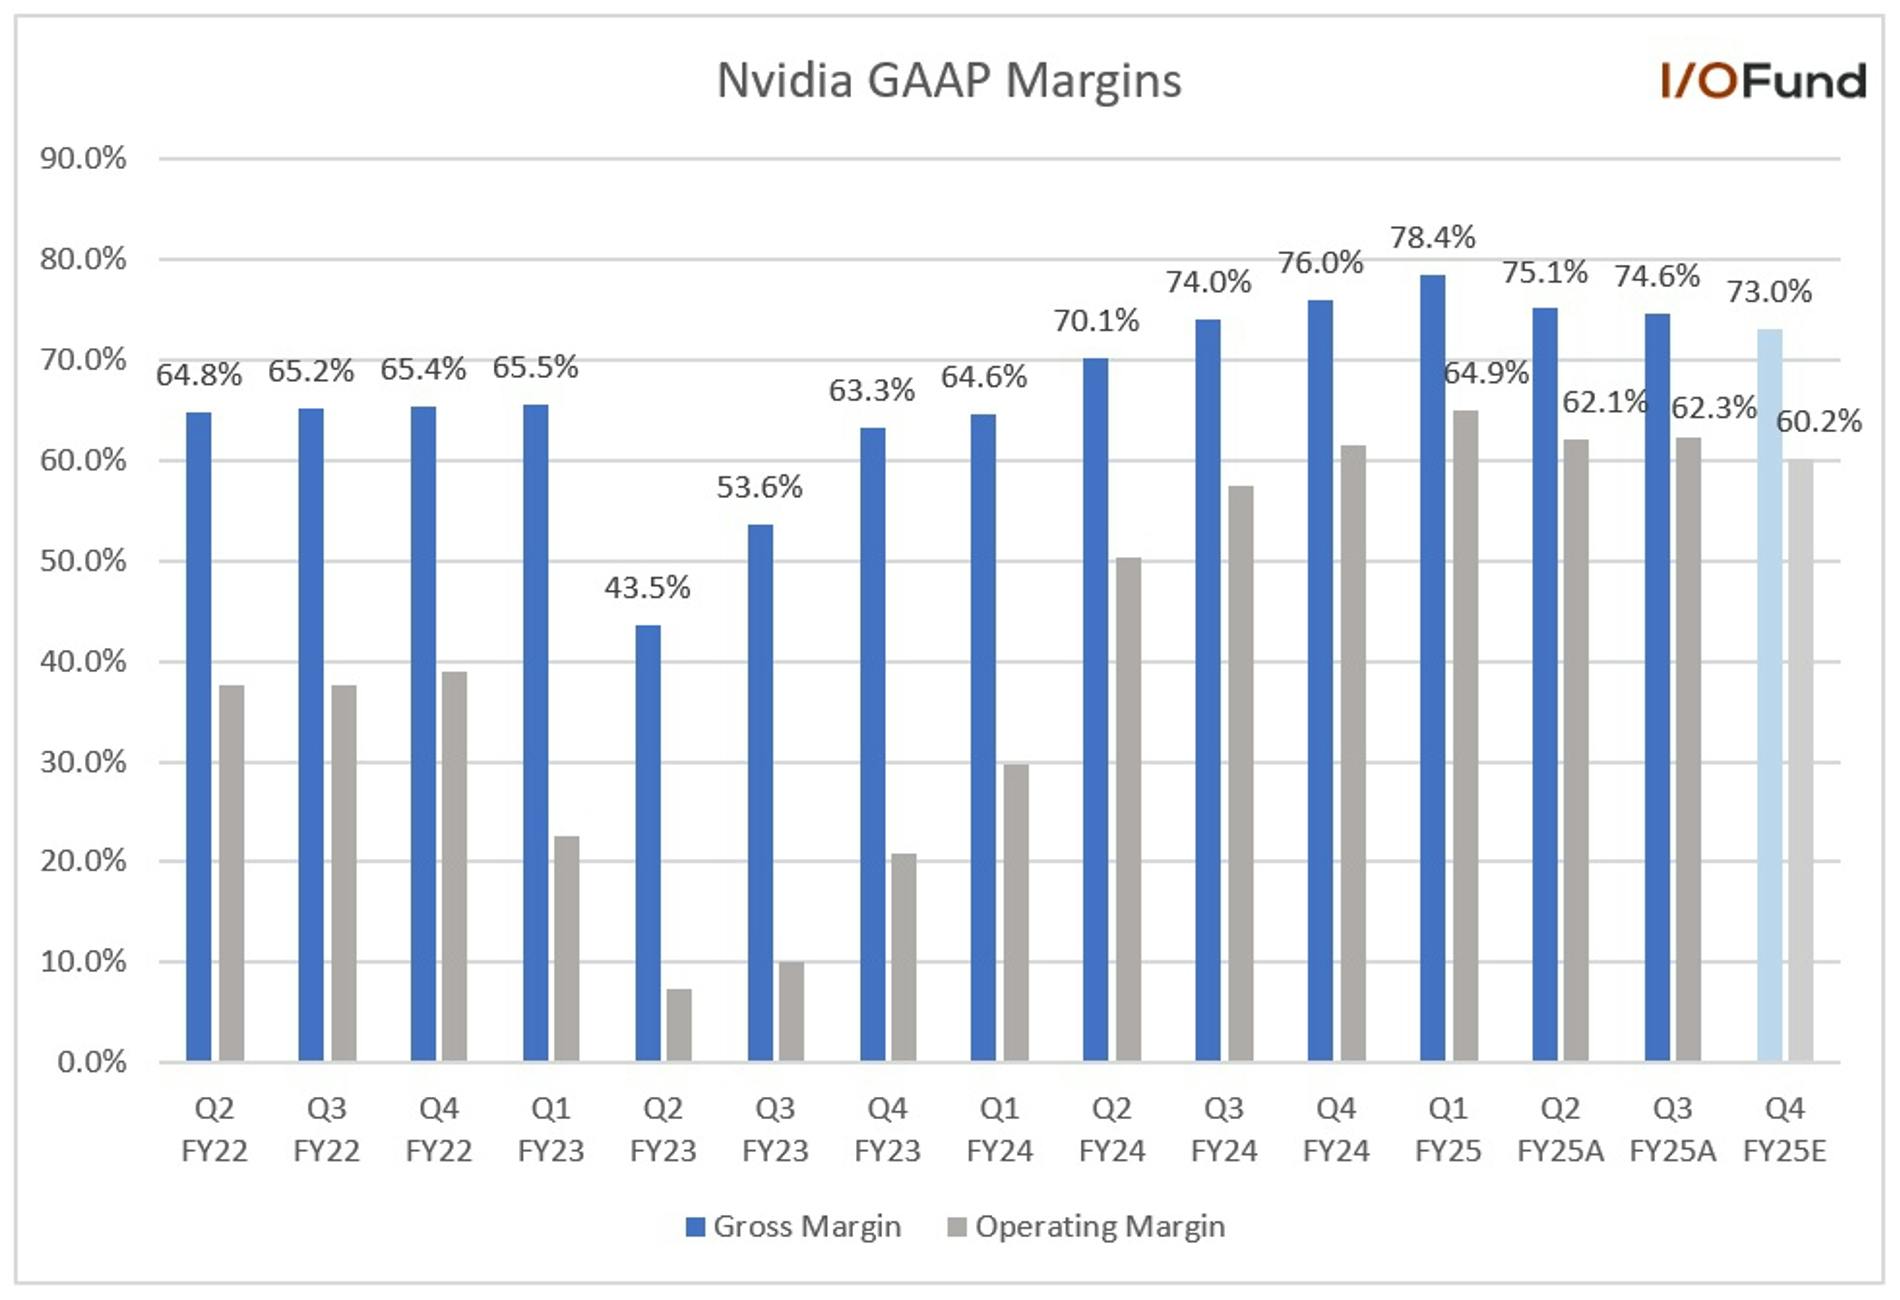
Margins are expected to contract sequentially in Q1 as Blackwell ramps, with management having stated in Q3 that gross margins were expected to dip to the low-70% level as Blackwell begins to ramp before returning to the mid-70% range. 

Gross margins in Q4 were in-line with prior guidance, though operating margins came in ahead of guidance as Nvidia continued to benefit from strong operating leverage. 

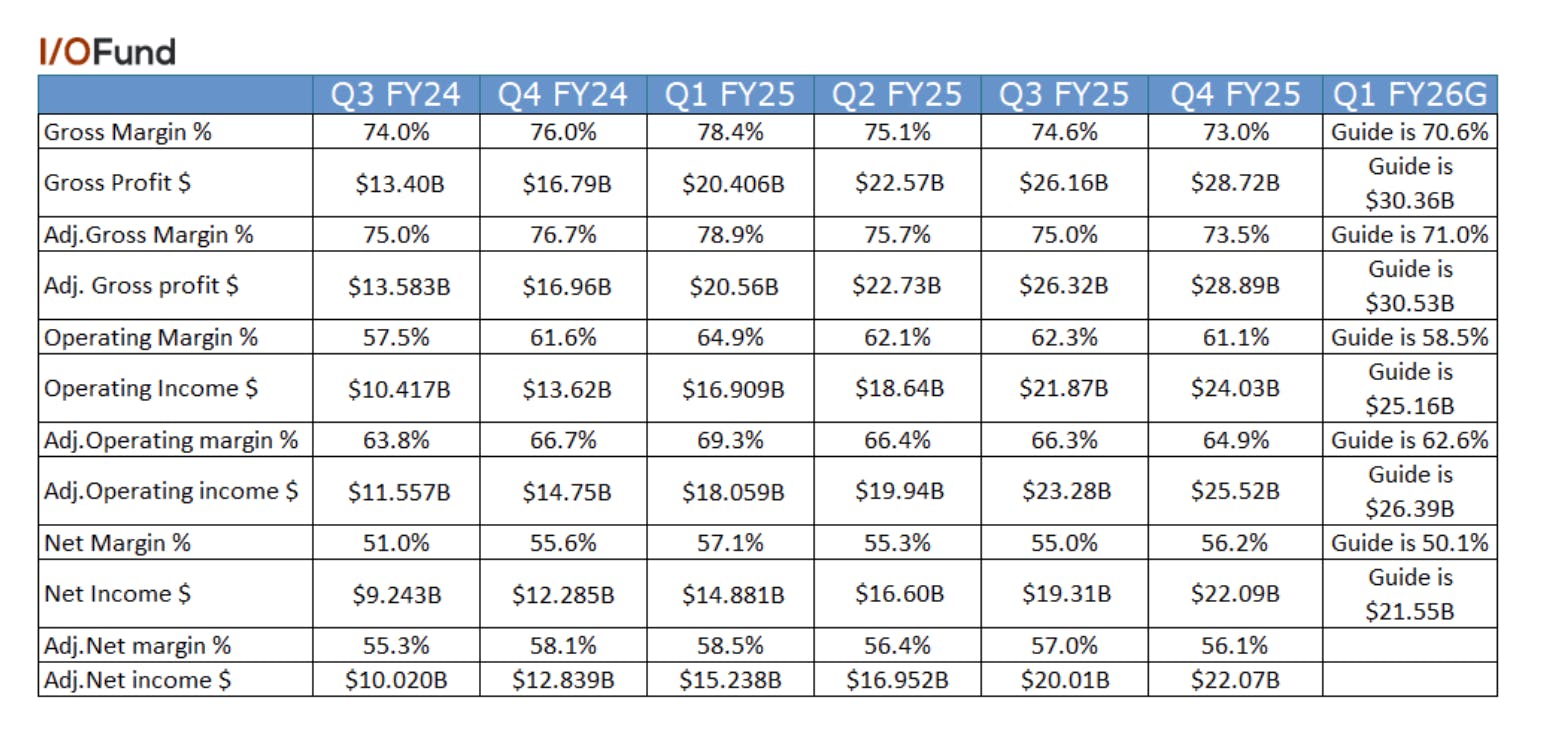
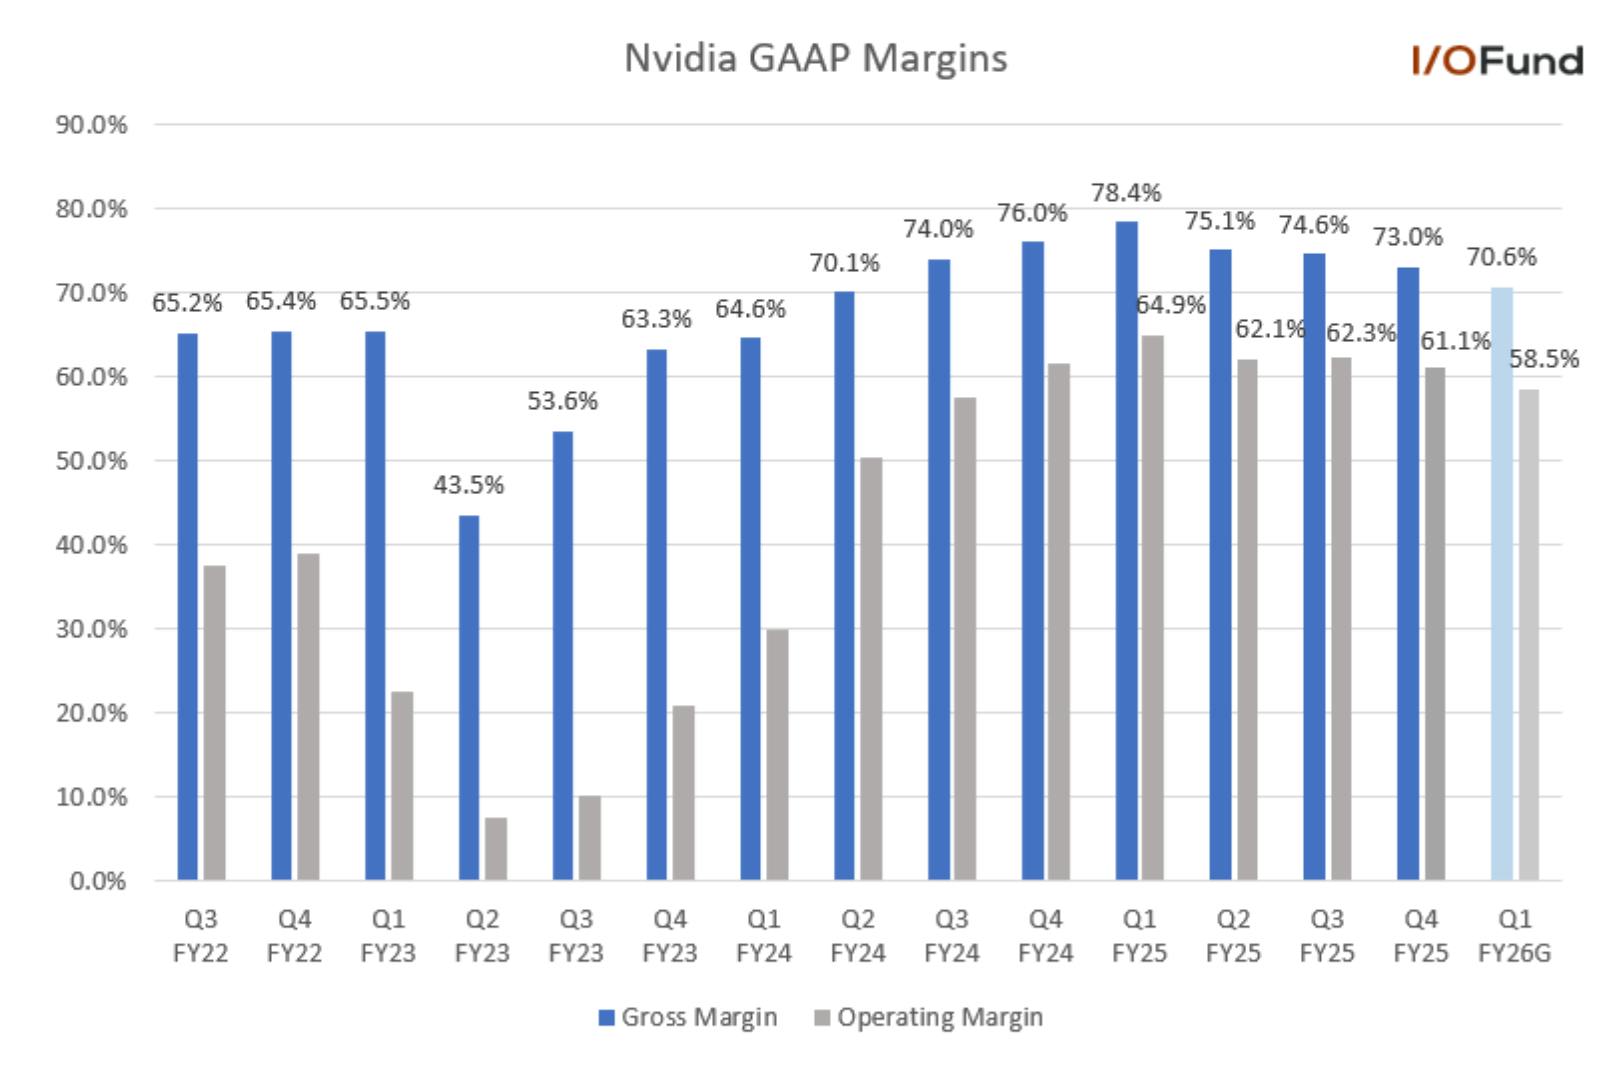
  • Q4 GAAP gross margin was 73%, contracting from 74.6% in Q3. For Q1, GAAP gross margin is expected to contract further to 70.6%.  
  • Adjusted gross margin was 73.5% in Q4, down from 75% in Q3, with management guiding for another contraction to 71% in Q1. 
  • Q4 GAAP operating margin was 61.1%, contracting from 62.3% in Q3. For Q1, GAAP operating margin is expected to drop below 60%, with management’s expense guidance implying a 58.5% margin.  
  • Adjusted operating margin was 64.9% in Q4, down from 66.3% in Q3, with Q1 forecast to contract further to 62.6%. 
  • Q4 GAAP net margin expanded slightly sequentially to 56.2%, though Q1’s net margin is implied to be 50.1% due to the QoQ gross and operating margin contractions. 

For FY25, margins expanded on a YoY basis despite contracting in the back half of the year. FY25’s GAAP gross margin was 75%, up from 72.7% in FY24. GAAP operating margin expanded 8.3 points YoY to 62.4%, as GAAP operating income increased 147% YoY to $81.5 billion. GAAP net margin increased 7 points YoY to 55.9% with a similar 134% YoY rise in net income to $86.8 billion. 

EPS 

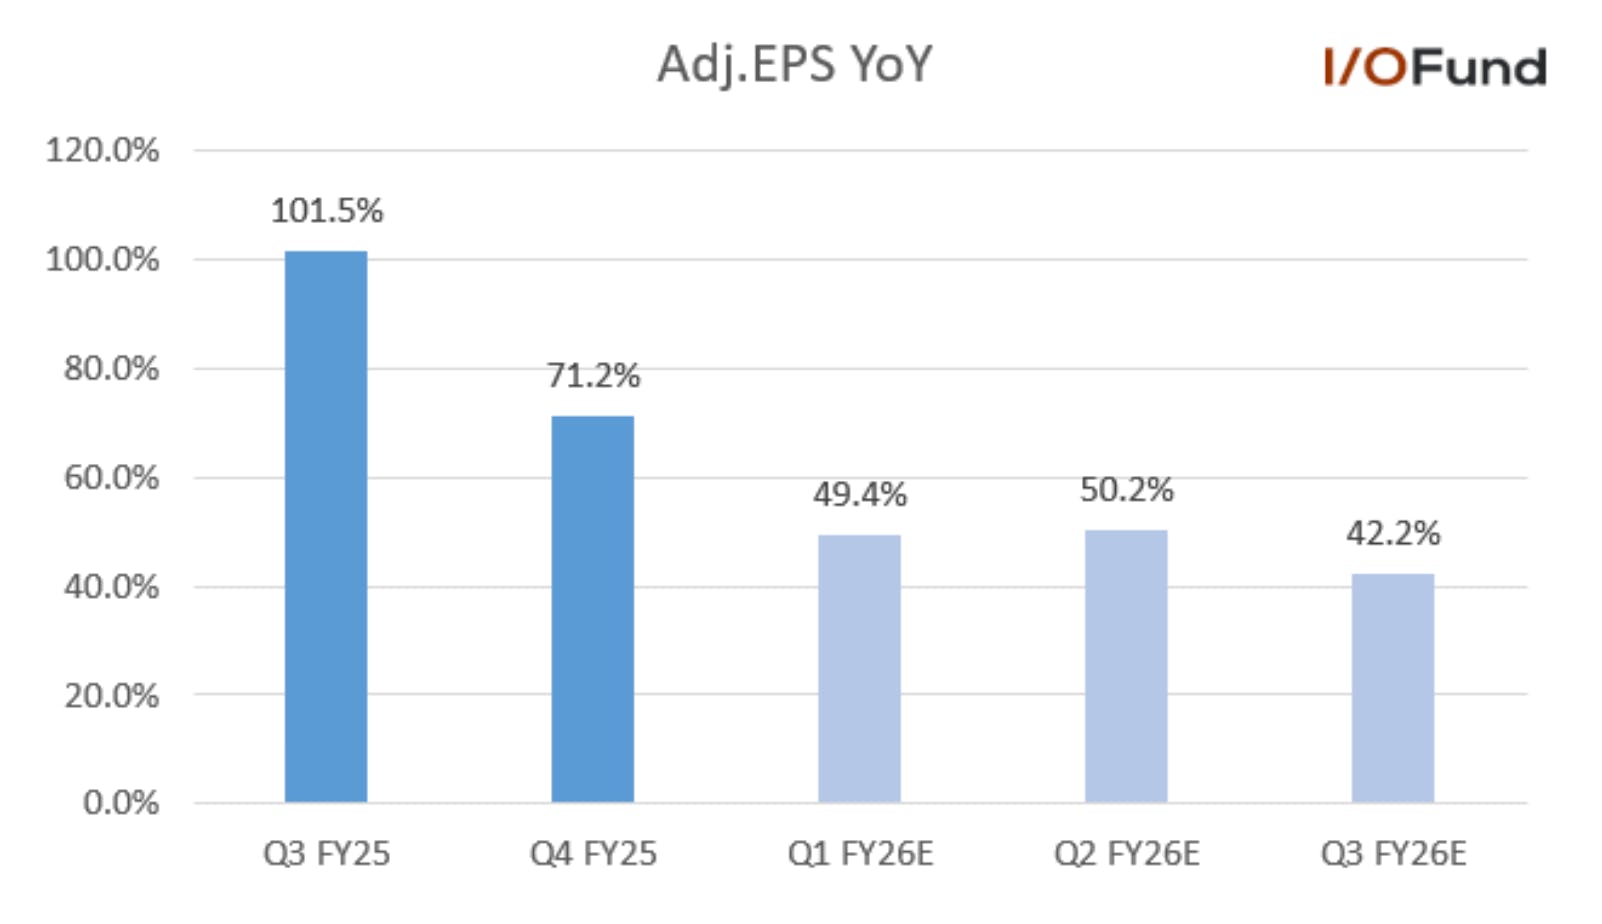
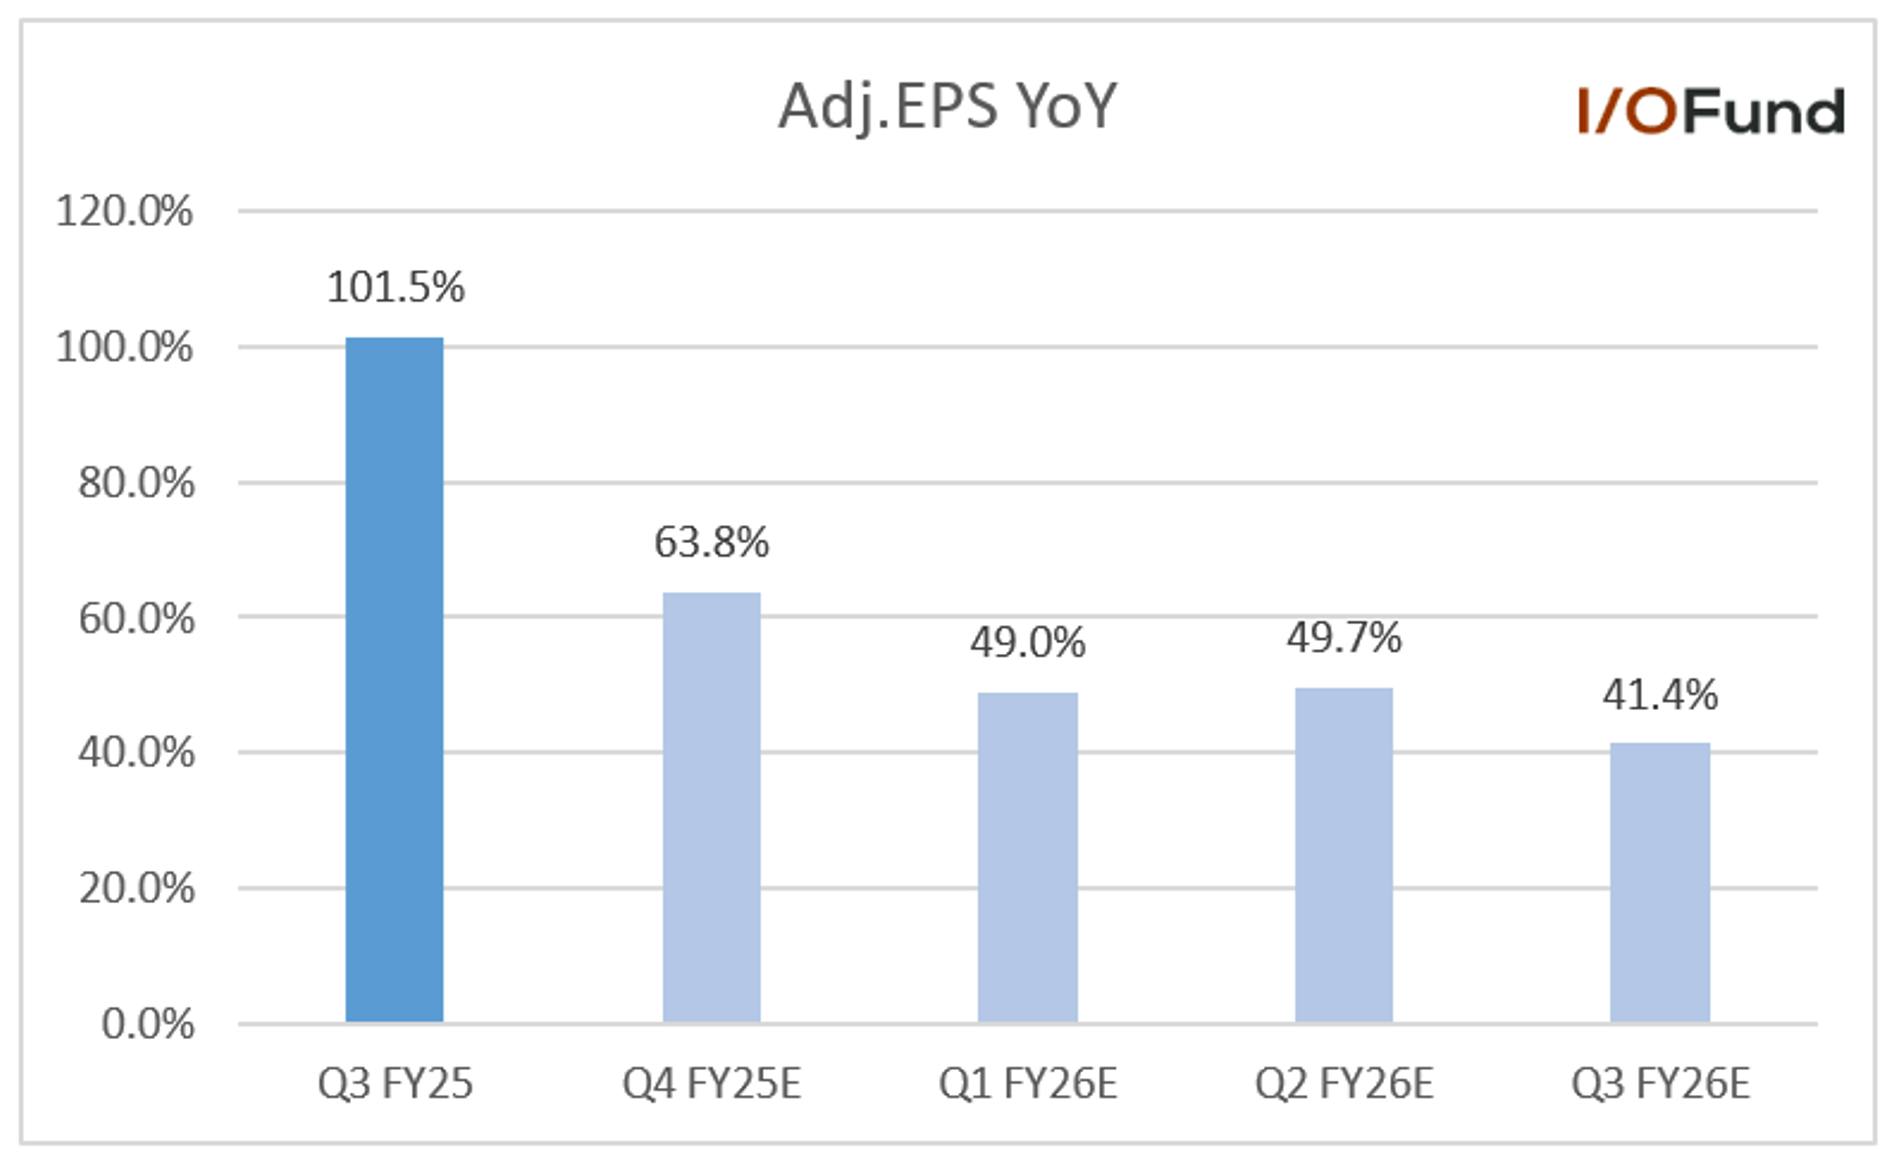
Q4 GAAP EPS increased 82% YoY to $0.89, beating estimates for $0.80. Adjusted EPS of $0.89 beat estimates for $0.85. Growth is expected to moderate to the ~50% range in the coming quarters, likely pressured by falling margins due to Blackwell’s ramp. 

  • Q1 adjusted EPS is expected to rise 49.4% YoY to $0.91. 
  • Q2 adjusted EPS is expected to rise 50.2% YoY to $1.02. 

Cash Flows and Balance Sheet 

Operating and free cash flows both decreased slightly sequentially, with management explaining that this was due to a “a higher accounts receivable balance due to shipment linearity and increased inventory to support our Blackwell product ramp.” Both inventories and accounts receivables showed strong QoQ growth. 

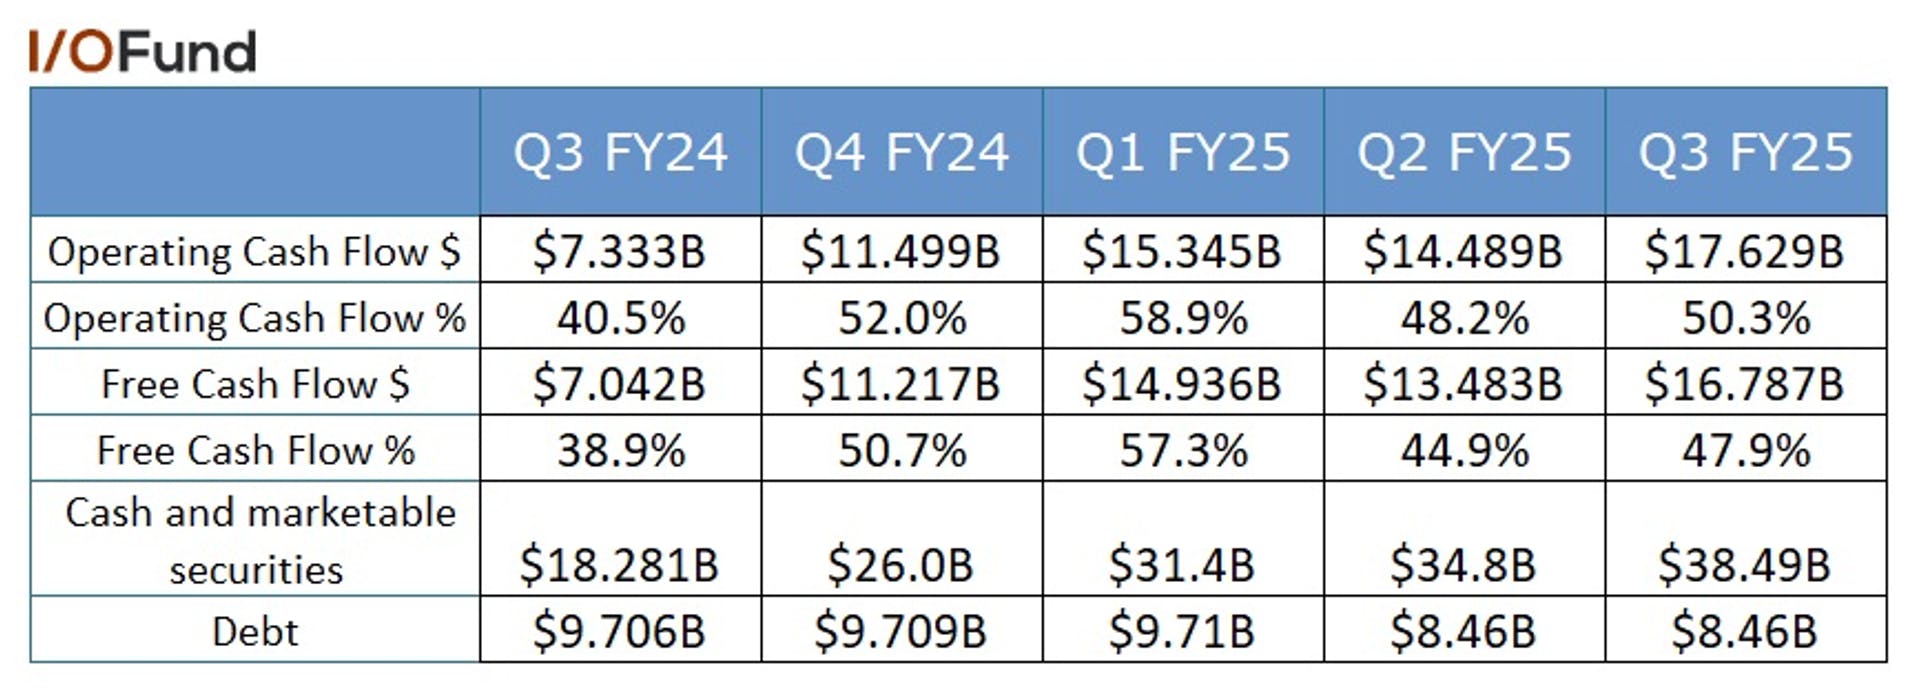
  • Operating cash flow in Q4 was $16.63 billion, down from $17.63 billion in Q3. OCF margin was 42.2%, more than 8 points lower than Q3’s 50.3% margin. FY25’s operating cash flow was $64.09 billion, rising 128% YoY and representing a margin of 49.1%, up 3 points YoY. 
  • Free cash flow was $15.52 billion in Q4, down from $16.79 billion in Q3. FCF margin was 39.5% in Q4, down from 47.9% in Q3. For FY25, free cash flow rose 125% YoY to $60.72 billion, for a margin of 46.5%, up 2.3 points YoY. 
  • Cash and marketable securities totaled $43.21 billion, while debt totaled $8.46 billion. 

Inventories, accounts receivable and purchase commitments all rose quite substantially on a sequential basis as Nvidia prepares to ramp Blackwell throughout the year. 

  • Inventories rose nearly 32% QoQ to $10.08 billion, representing a sequential rise of $2.43 billion.  
  • Accounts receivable rose $5.4 billion QoQ to $23.1 billion. 
  • Purchase commitments and obligations for inventory and manufacturing capacity rose $1.9 billion QoQ to $30.8 billion. 

Key Segments 

Data Center 

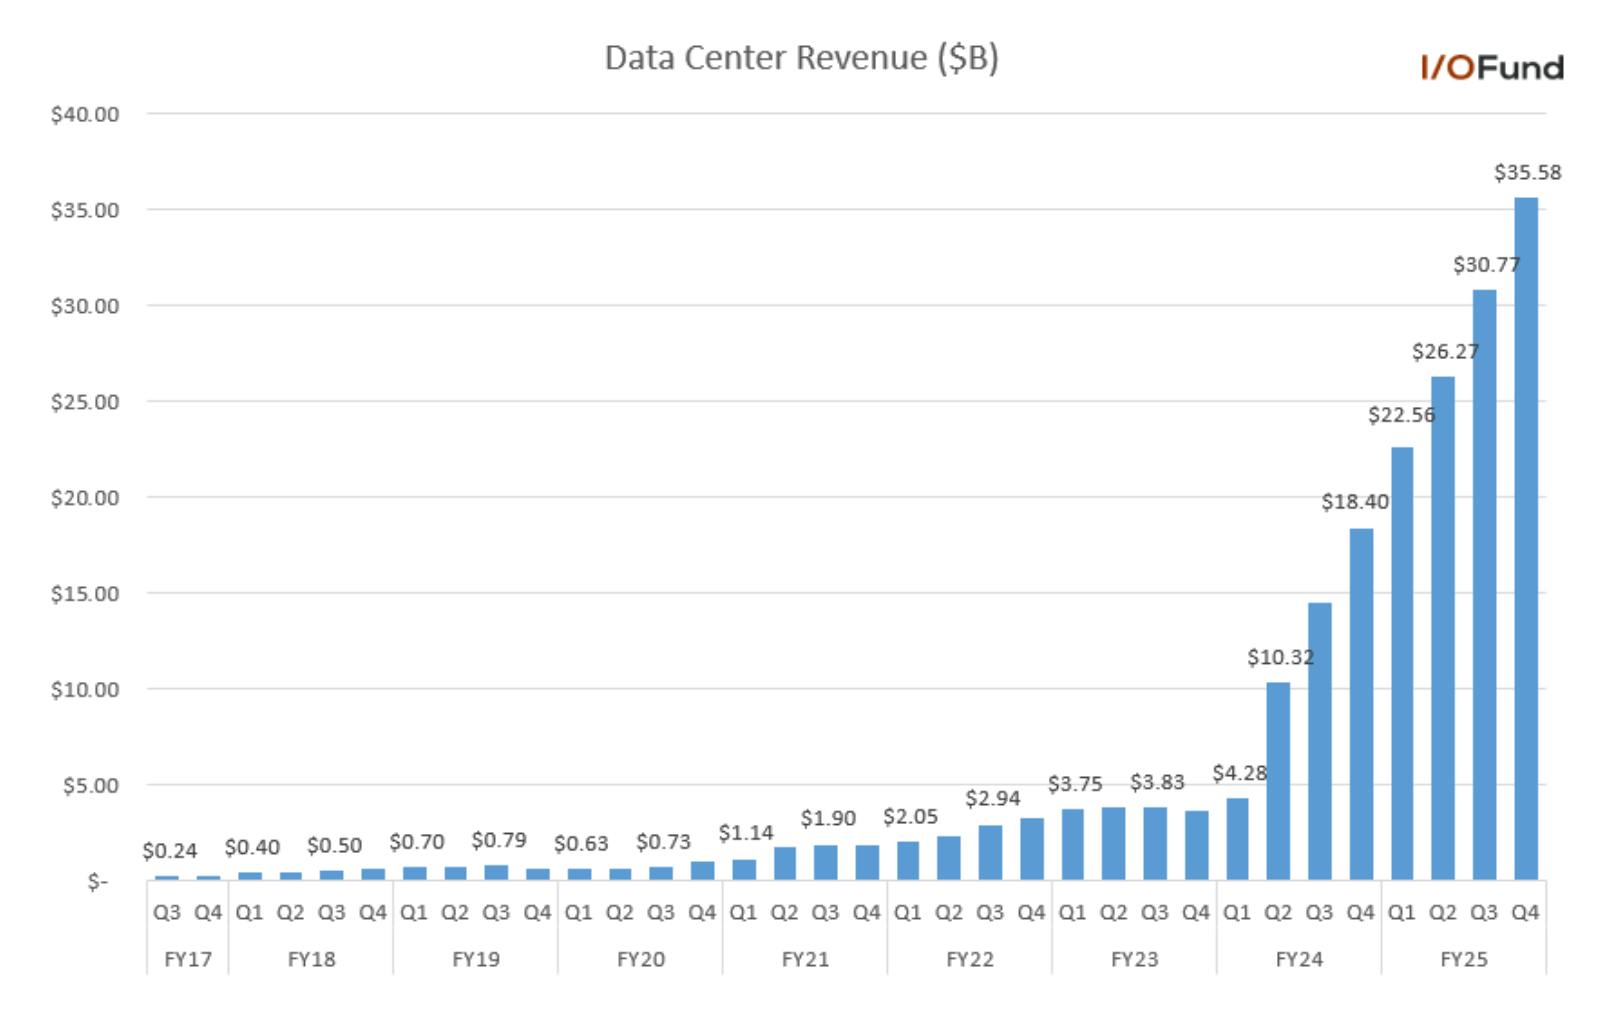
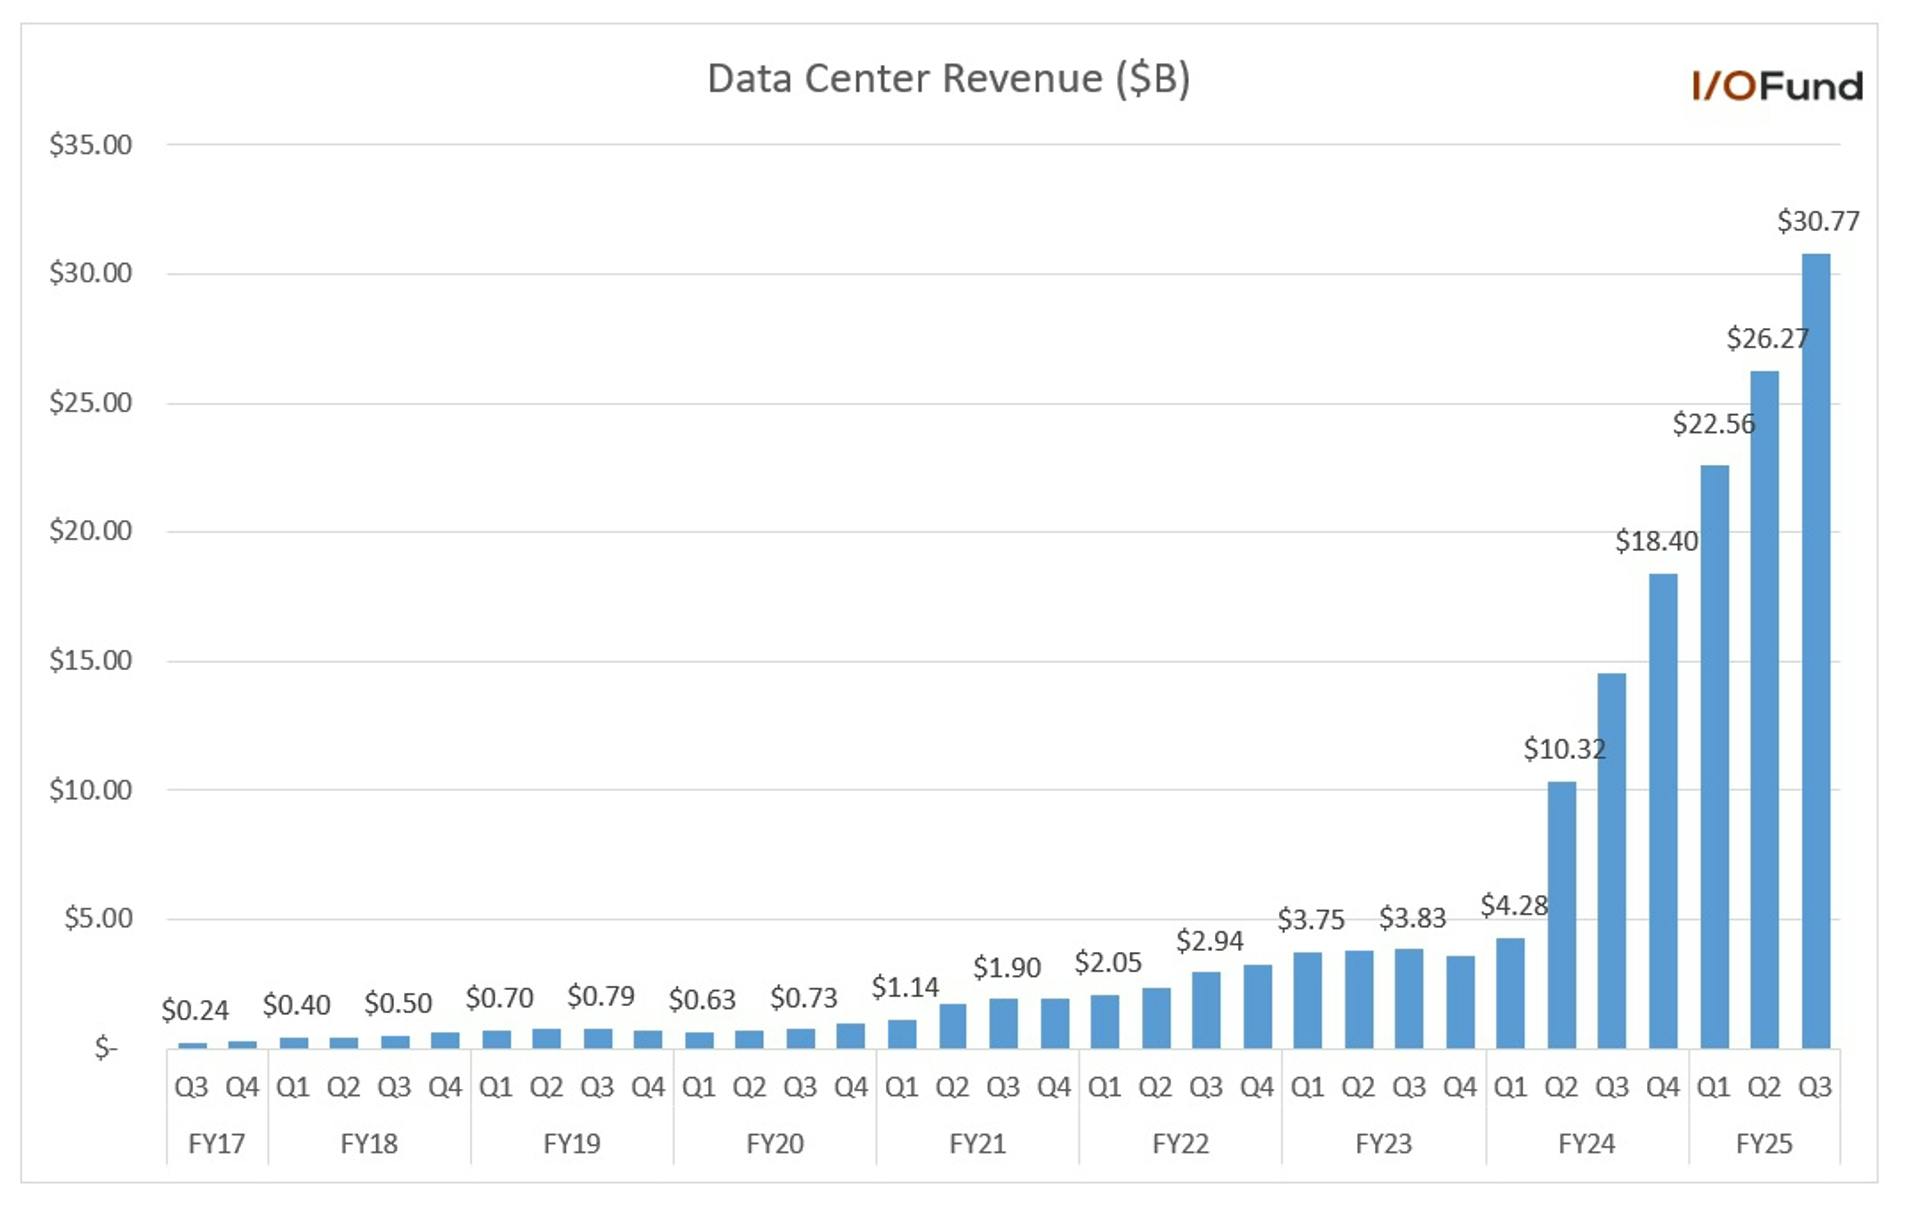
Data center revenue rose 93% YoY and 16% QoQ to $35.58 billion in Q4, driven primarily by GPUs as networking revenue was soft. Compute revenue rose 116% YoY and 18% QoQ to $32.56 billion in Q4, though Networking revenue declined (9%) YoY and (3%) QoQ to $3.02 billion. 

Management noted that they “delivered $11.0 billion of Blackwell architecture revenue in the fourth quarter of fiscal 2025, the fastest product ramp in our company’s history,” driven by major CSPs which accounted for 50% of data center revenue. Q4 growth was also aided by sequential growth for the H200. 

For Networking, Nvidia said that it is “transitioning from small NVLink 8 with Infiniband to large NVLink 72 with Spectrum X,” with growth in Ethernet and NVLink products related to the Grace Blackwell ramp. 

For FY25, data center revenue rose 142% YoY to $115.2 billion, driven by a 162% YoY increase in Compute revenue to $102.2 billion, with Networking revenue rose just 51% YoY to $12.99 billion. 

Other Segments 

  • Gaming revenue declined (11%) YoY and (22%) QoQ to $2.54 billion, due to “limited supply for both Blackwell and Ada GPUs.” For FY25, gaming revenue rose 9% YoY to $11.35 billion. 
  • Automotive revenue rose 103% YoY and 27% QoQ to $570 million, driven by self-driving platform sales. For FY25, automotive revenue rose 55% YoY to $1.69 billion. 
  • Pro Viz revenue rose 10% YoY and 5% QoQ to $511 million, driven by a “continued ramp of Ada RTX GPU workstations for use cases such as generative AI-powered design, simulation, and engineering.” For FY25, Pro Viz revenue rose 21% YoY to $1.88 billion. 
  • OEM and other revenue rose 40% YoY and 30% QoQ to $126 million. For FY25, OEM and other revenue rose 27% to $389 million.

Earnings Call:

NVL 72 Systems and Blackwell Ultra 

Of the $200 billion in revenue expected this year, roughly $100 billion is expected to come from NVL systems which comes out to 30,000 to 35,000 racks at $3 million per rack. Given there is evidence of a delay, there was bound to be a question about this on the call. Overall, the answer helps to alleviate if the systems are ready yet (they have “ramped production” but not stated they were shipping in volume).  

The remaining issue is if both Blackwell’s NVL systems and Blackwell Ultra (the next generation of GPUs) can ramp "simultaneously” (which was not the original road map). Perhaps these two can successfully ramp simultaneously, but it’s also important to acknowledge this was not the original plan. Personally, I think the hiccup discussed below should be explained more as to when the systems will ship in volume, since it was originally expected to be Q1. Judging by analyst estimates, the October quarter will see higher QoQ growth in terms of revenue at $5 billion compared to analyst estimates of $4 billion for the previous quarter.  

Harlan Sur  

Good afternoon. Thanks for taking my question. Your next-generation Blackwell Ultra is set to launch in the second half of this year, in line with the team's annual product cadence. Jensen, can you help us understand the demand dynamics for Ultra given that you'll still be ramping the current generation Blackwell solutions? How do your customers and the supply chain also manage the simultaneous ramps of these two products? And — is the team still on track to execute Blackwell Ultra in the second half of this year? 

Jensen Huang  

Yes. Blackwell Ultra is second half. As you know, the first Blackwell was we had a hiccup that probably cost us a couple of months. We're fully recovered, of course. The team did an amazing job recovering and all of our supply chain partners and just so many people helped us recover at the speed of light. And so now we've successfully ramped production of Blackwell. 

But that doesn't stop the next train. The next train is on an annual rhythm and Blackwell Ultra with new networking, new memories and of course, new processors, and all of that is coming online. We've have been working with all of our partners and customers, laying this out. They have all of the necessary information, and we'll work with everybody to do the proper transition. This time between Blackwell and Blackwell Ultra, the system architecture is exactly the same. It's a lot harder going from Hopper to Blackwell because we went from an NVLink 8 system to a NVLink 72-based system. So the chassis, the architecture of the system, the hardware, the power delivery, all of that had to change. This was quite a challenging transition. 

But the next transition will slot right in Blackwell Ultra will slot right in. We've also already revealed and been working very closely with all of our partners on the click after that. And the click after that is called Vera Rubin and all of our partners are getting up to speed on the transition of that and so preparing for that transition. And again, we're going to provide a big, huge step-up. And so come to GTC, and I'll talk to you about Blackwell Ultra, Vera Rubin and then show you what we place after that. Really exciting new products, so to come to GTC piece. 

–End Quote 

The $11 billion is likely coming from other SKUs as we pointed out in our pre-earnings analysis “There is certainly a scenario where Nvidia’s GPUs are in such high demand that other SKUs can help make up for a delay on the much-larger GB200 NVL systems.” The additional evidence of this is the QoQ decline in networking as these systems would certainly drive QoQ growth in networking, making the clear readthrough that other SKUs are driving the $11 billion. 

When asked if there were bottle necks to consider with NVL 72 systems specifically, the CEO avoided discussing NVL72 systems and redirected to a more general discussion on the Grace Blackwell architecture. He also pointed toward single use cases that have “come online” rather than a “shipping in volume” discussion: “You've probably seen on the web, a fair number of celebrations about Grace Blackwell systems coming online and we have them, of course. We have a fairly large installation of Grace Blackwell goes for our own engineering and our own design teams and software teams. CoreWeave has now been quite public about the successful bring up of theirs. Microsoft has, of course, OpenAI has, and you're starting to see many come online. And so I think the answer to your question is nothing is easy about what we're doing, but we're doing great, and all of our partners are doing great.” 

TAKEAWAY: The NVL 72 systems are probably not shipping in volume right now, but should be soon (if they’re in production). This will run close to Blackwell Ultra’s launch. Demand will not be an issue rather it’s unusual to see two generations ship this close to one another, and it will require a smooth supply chain  

Custom Silicon Not a Threat for 4 Reasons 

Concerns around timing of shipping for Blackwell SKUs will be transitory yet concerns with custom silicon are here to stay. Since the very first day of covering the AI story in 2018, I have been fielding concerns around custom silicon as Google’s TPUs were all the rage in 2018. It was actually expected at the time that Google’s TPUs would transition to merchant sales and directly compete with Nvidia. Nearly seven years later, that has not materialized. 

Below, is how Jensen Huang describes the challenges around custom silicon. He points toward custom silicon being application specific whereas GPUs are more flexible (this part is key), the software layer, as well as the fact that a lot of custom silicon does not make it to full production. Because investors will be fielding this concern into the foreseeable future, I’ve noted the response and four reasons below: 

  1. General versus application specific: “NVIDIA's architecture is general whether you're — you've optimized for unaggressive models or diffusion-based models or vision-based models or multimodal models or text models. We're great in all of it […] And so by definition, we're much, much more general than narrow” 
  2. Nvidia is Everywhere: “So we're general, we're end-to-end, and we're everywhere. And because we're not in just one cloud, we're in every cloud, we could be on-prem. We could be in a robot. Our architecture is much more accessible and a great target initial target for anybody who's starting up a new company. And so we're everywhere.” 
  3. Performance: “And if our performance per watt is anywhere from 2x to 4x to 8x, which is not unusual, it translates directly to revenues. And so if you have a 100-megawatt data center, if the performance or the throughput in that 100-megawatt or the gigawatt data center is 4 times or 8 times higher, your revenues for that gigawatt data center is 8 times higher.” 
  4. What Nvidia Does is Hard – the Hardware and the Software is hard to replicate: “And the ecosystem that sits on top of our architecture is 10x more complex today than it was 2 years ago. And that's fairly obvious because the amount of software that the world is building on top of architecture is growing exponentially and AI is advancing very quickly. So bringing that whole ecosystem on top of multiple chips is hard.”

China Increases in Geo Mix for Q1 

An analyst pointed out that China will be increasing in geographic mix for Q1.  

Here is the concern from the analyst: “And I think there is a concern about whether U.S. can pick up the slack if there's regulations towards other geographies. And I was just wondering, as we go throughout the year, if this kind of surge in the U.S. continues and it's going to be — whether that's okay. And if that underlies your growth rate, how can you keep growing so fast with this mix shift towards the U.S.? Your guidance looks like China is probably up sequentially. So just wondering if you could go through that dynamic and maybe collect can weigh in.” 

This may be a moot issue, as management stated: “China is approximately the same percentage as Q4 and as previous quarters. It's about half of what it was before the export control. But it's approximately the same in percentage” but noting the concern here that this analyst thinks USA may not be able to fully make up for a China loss if the trade war heats up. I think if the NVL systems are shipping in volume, it will not matter as China is primarily helping to make up for the lag in these systems right now for the next 1-2 quarters.  

Conclusion: 

You might be asking yourself — why is the I/O Fund so focused on something the rest of the market does not seem to care about? There are two reasons … $100 billion pointed at one SKU is unheard of. Consider the iPhone took a decade to get to that revenue. We will not lazily assume it’s coming until I get “all systems are a go” signs across the board. You can’t put $100 billion into production and ship in volume without a splash in the large supply chain that builds these AI systems. There was no splash (yet). 

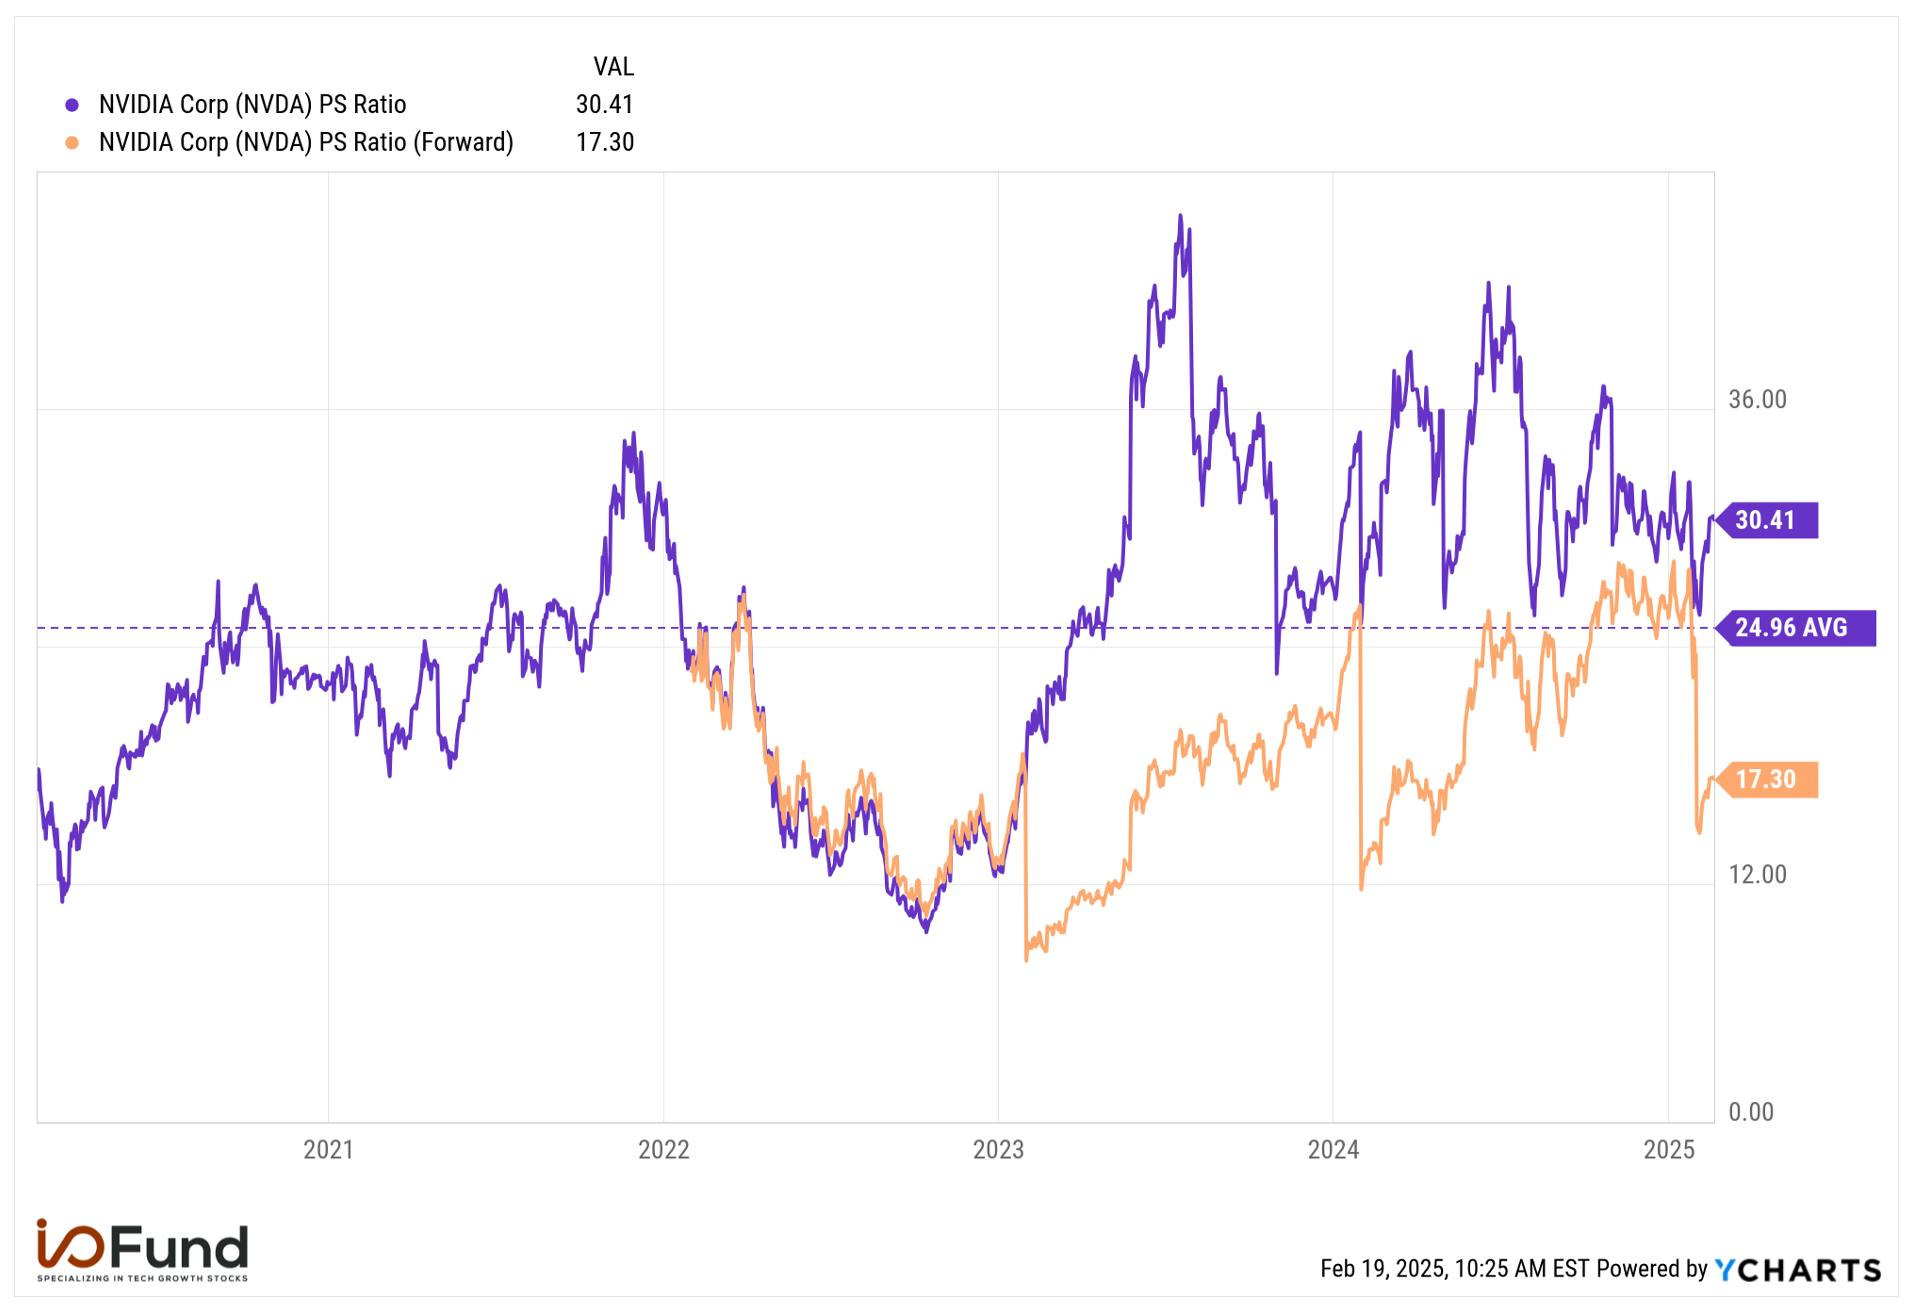
Secondly, we need Nvidia to break out of the range bound price it’s been in for 9 months (between $110 and $150). While many might be saying “whew, Nvidia beat/raised,” my stance is “where’s the catalyst that’s going to take this thing higher?” I had an answer for you a few months back – it was the NVL systems, which I stated would cause “fireworks.” To be range bound trading between $110 and $150 since May of 2024 is not exactly fireworks, and thus we need to look closely at whether Nvidia’s next move is to break out or break down. As stated, by being range bound, the valuation has become more attractive, and we are watching this piece closely. This is my number one reason for seeing a breakout above $150 right now (valuation). 

While many investors will rightly hold Nvidia through ups/downs (you’ll see IOF hold for years to come), our firm is competing with the world’s best tech portfolios – which means complacency is not something you’ll see here. Our Members greatly benefit from our need to compete as we question everything – especially if we are overweight any specific outcome.  

Please reference the most up to date trading plan here.

Please note: The I/O Fund conducts research and draws conclusions for the company’s portfolio. We then share that information with our readers and offer real-time trade notifications. This is not a guarantee of a stock’s performance and it is not financial advice. Please consult your personal financial advisor before buying any stock in the companies mentioned in this analysis. Beth Kindig and the I/O Fund own shares in NVDA at the time of writing and may own stocks pictured in the charts.

Recommended Reading:

Nvidia Q4: Range Bound and Looking for a Catalyst 

Compared to any other stock on Wall Street, Nvidia reported an exceptional quarter. Yet, Nvidia’s stock is competing with itself at this point, and when compared to previous Nvidia earnings reports, Q4 and Q1 represent a pause in the fireworks. 

Nvidia reported $11 billion in Blackwell revenue, however, Huang finally admitted the NVL systems are in production (i.e., not shipping in volume). Rather, other SKUs are making up Blackwell revenue for now. According to a discussion with an analyst, Nvidia foresees NVL systems and the next generation Blackwell Ultra ramping “simultaneously” — which increases the pressure to deliver this fiscal year given there was a “couple months” delay with the NVL systems.  

Fortunately, for the I/O Fund, we use technicals to reduce risk. When there is a change in story, even if it’s transitory by a quarter or two, we rely on technicals to protect our position while maximizing the upside. As you know, we are exposed to Nvidia — yet heavily exposed when you consider its ecosystem. 

We also hold our management teams accountable, and not even Jensen Huang should get a free pass. Investors should have been provided more transparency on when the premier SKU will be shipping in volume, since it was originally slated for Q1. Below, I outline the reasons that H2 is likely to be the catalyst for the next leg higher, whereas Q1 may not have been enough to cause the stock to break out. With that said, semiconductors see intra-quarter news more frequently than software peers, and thus, this could change anytime.  

Nvidia’s valuation remains very attractive. I stated on Fox yesterday that Nvidia and its suppliers are the best trade of the year – the question that remains is timing. If the NVL systems were shipping in volume, the supply chain would be on fire right now – is what I mean by timing. I also pointed out that investors do better when proxies participate – whether that’s suppliers providing a clear, green light or an ETF like SMH, which is 14% off ATHs. 

I look at this and more below! 

Revenue Beat/Raise (Again) 

Nvidia beat consensus estimates by just $1.15 billion this quarter, its smallest beat of the last seven quarters, as it reported revenue of $39.33 billion, up 77.9% YoY and 12.1% QoQ. Management reported that Blackwell was witnessing the fastest product ramp in company history, delivering $11 billion in Blackwell revenue in Q4. 

For FY25, Nvidia reported revenue growth of 114% YoY to $130.5 billion, marking a consecutive year of triple digit growth after revenue rose 126% YoY in FY24. 

For Q1, Nvidia guided for revenue of $43 billion, +/- 2%, representing growth of 65.1% YoY and 9.3% QoQ at midpoint, slightly ahead of estimates for 61.2% YoY growth to $42 billion. As we had noted in our pre-earnings analysis, some analysts were looking for as much as $47 billion in revenue in Q1. On a sequential basis, Q1 is also estimated to see QoQ growth dip to the single-digit range at the midpoint of guidance, slowing nearly 3 points from Q4.  

Margins to Improve H2 

Margins are expected to contract sequentially in Q1 as Blackwell ramps, with management having stated in Q3 that gross margins were expected to dip to the low-70% level as Blackwell begins to ramp before returning to the mid-70% range. 

Gross margins in Q4 were in-line with prior guidance, though operating margins came in ahead of guidance as Nvidia continued to benefit from strong operating leverage. 

  • Q4 GAAP gross margin was 73%, contracting from 74.6% in Q3. For Q1, GAAP gross margin is expected to contract further to 70.6%.  
  • Adjusted gross margin was 73.5% in Q4, down from 75% in Q3, with management guiding for another contraction to 71% in Q1. 
  • Q4 GAAP operating margin was 61.1%, contracting from 62.3% in Q3. For Q1, GAAP operating margin is expected to drop below 60%, with management’s expense guidance implying a 58.5% margin.  
  • Adjusted operating margin was 64.9% in Q4, down from 66.3% in Q3, with Q1 forecast to contract further to 62.6%. 
  • Q4 GAAP net margin expanded slightly sequentially to 56.2%, though Q1’s net margin is implied to be 50.1% due to the QoQ gross and operating margin contractions. 

For FY25, margins expanded on a YoY basis despite contracting in the back half of the year. FY25’s GAAP gross margin was 75%, up from 72.7% in FY24. GAAP operating margin expanded 8.3 points YoY to 62.4%, as GAAP operating income increased 147% YoY to $81.5 billion. GAAP net margin increased 7 points YoY to 55.9% with a similar 134% YoY rise in net income to $86.8 billion. 

EPS 

Q4 GAAP EPS increased 82% YoY to $0.89, beating estimates for $0.80. Adjusted EPS of $0.89 beat estimates for $0.85. Growth is expected to moderate to the ~50% range in the coming quarters, likely pressured by falling margins due to Blackwell’s ramp. 

  • Q1 adjusted EPS is expected to rise 49.4% YoY to $0.91. 
  • Q2 adjusted EPS is expected to rise 50.2% YoY to $1.02. 

Cash Flows and Balance Sheet 

Operating and free cash flows both decreased slightly sequentially, with management explaining that this was due to a “a higher accounts receivable balance due to shipment linearity and increased inventory to support our Blackwell product ramp.” Both inventories and accounts receivables showed strong QoQ growth. 

  • Operating cash flow in Q4 was $16.63 billion, down from $17.63 billion in Q3. OCF margin was 42.2%, more than 8 points lower than Q3’s 50.3% margin. FY25’s operating cash flow was $64.09 billion, rising 128% YoY and representing a margin of 49.1%, up 3 points YoY. 
  • Free cash flow was $15.52 billion in Q4, down from $16.79 billion in Q3. FCF margin was 39.5% in Q4, down from 47.9% in Q3. For FY25, free cash flow rose 125% YoY to $60.72 billion, for a margin of 46.5%, up 2.3 points YoY. 
  • Cash and marketable securities totaled $43.21 billion, while debt totaled $8.46 billion. 

Inventories, accounts receivable and purchase commitments all rose quite substantially on a sequential basis as Nvidia prepares to ramp Blackwell throughout the year. 

  • Inventories rose nearly 32% QoQ to $10.08 billion, representing a sequential rise of $2.43 billion.  
  • Accounts receivable rose $5.4 billion QoQ to $23.1 billion. 
  • Purchase commitments and obligations for inventory and manufacturing capacity rose $1.9 billion QoQ to $30.8 billion. 

Key Segments 

Data Center 

Data center revenue rose 93% YoY and 16% QoQ to $35.58 billion in Q4, driven primarily by GPUs as networking revenue was soft. Compute revenue rose 116% YoY and 18% QoQ to $32.56 billion in Q4, though Networking revenue declined (9%) YoY and (3%) QoQ to $3.02 billion. 

Management noted that they “delivered $11.0 billion of Blackwell architecture revenue in the fourth quarter of fiscal 2025, the fastest product ramp in our company’s history,” driven by major CSPs which accounted for 50% of data center revenue. Q4 growth was also aided by sequential growth for the H200. 

For Networking, Nvidia said that it is “transitioning from small NVLink 8 with Infiniband to large NVLink 72 with Spectrum X,” with growth in Ethernet and NVLink products related to the Grace Blackwell ramp. 

For FY25, data center revenue rose 142% YoY to $115.2 billion, driven by a 162% YoY increase in Compute revenue to $102.2 billion, with Networking revenue rose just 51% YoY to $12.99 billion. 

Other Segments 

  • Gaming revenue declined (11%) YoY and (22%) QoQ to $2.54 billion, due to “limited supply for both Blackwell and Ada GPUs.” For FY25, gaming revenue rose 9% YoY to $11.35 billion. 
  • Automotive revenue rose 103% YoY and 27% QoQ to $570 million, driven by self-driving platform sales. For FY25, automotive revenue rose 55% YoY to $1.69 billion. 
  • Pro Viz revenue rose 10% YoY and 5% QoQ to $511 million, driven by a “continued ramp of Ada RTX GPU workstations for use cases such as generative AI-powered design, simulation, and engineering.” For FY25, Pro Viz revenue rose 21% YoY to $1.88 billion. 
  • OEM and other revenue rose 40% YoY and 30% QoQ to $126 million. For FY25, OEM and other revenue rose 27% to $389 million.

Earnings Call:

NVL 72 Systems and Blackwell Ultra 

Of the $200 billion in revenue expected this year, roughly $100 billion is expected to come from NVL systems which comes out to 30,000 to 35,000 racks at $3 million per rack. Given there is evidence of a delay, there was bound to be a question about this on the call. Overall, the answer helps to alleviate if the systems are ready yet (they have “ramped production” but not stated they were shipping in volume).  

The remaining issue is if both Blackwell’s NVL systems and Blackwell Ultra (the next generation of GPUs) can ramp "simultaneously” (which was not the original road map). Perhaps these two can successfully ramp simultaneously, but it’s also important to acknowledge this was not the original plan. Personally, I think the hiccup discussed below should be explained more as to when the systems will ship in volume, since it was originally expected to be Q1. Judging by analyst estimates, the October quarter will see higher QoQ growth in terms of revenue at $5 billion compared to analyst estimates of $4 billion for the previous quarter.  

Harlan Sur  

Good afternoon. Thanks for taking my question. Your next-generation Blackwell Ultra is set to launch in the second half of this year, in line with the team's annual product cadence. Jensen, can you help us understand the demand dynamics for Ultra given that you'll still be ramping the current generation Blackwell solutions? How do your customers and the supply chain also manage the simultaneous ramps of these two products? And — is the team still on track to execute Blackwell Ultra in the second half of this year? 

Jensen Huang  

Yes. Blackwell Ultra is second half. As you know, the first Blackwell was we had a hiccup that probably cost us a couple of months. We're fully recovered, of course. The team did an amazing job recovering and all of our supply chain partners and just so many people helped us recover at the speed of light. And so now we've successfully ramped production of Blackwell. 

But that doesn't stop the next train. The next train is on an annual rhythm and Blackwell Ultra with new networking, new memories and of course, new processors, and all of that is coming online. We've have been working with all of our partners and customers, laying this out. They have all of the necessary information, and we'll work with everybody to do the proper transition. This time between Blackwell and Blackwell Ultra, the system architecture is exactly the same. It's a lot harder going from Hopper to Blackwell because we went from an NVLink 8 system to a NVLink 72-based system. So the chassis, the architecture of the system, the hardware, the power delivery, all of that had to change. This was quite a challenging transition. 

But the next transition will slot right in Blackwell Ultra will slot right in. We've also already revealed and been working very closely with all of our partners on the click after that. And the click after that is called Vera Rubin and all of our partners are getting up to speed on the transition of that and so preparing for that transition. And again, we're going to provide a big, huge step-up. And so come to GTC, and I'll talk to you about Blackwell Ultra, Vera Rubin and then show you what we place after that. Really exciting new products, so to come to GTC piece. 

–End Quote 

The $11 billion is likely coming from other SKUs as we pointed out in our pre-earnings analysis “There is certainly a scenario where Nvidia’s GPUs are in such high demand that other SKUs can help make up for a delay on the much-larger GB200 NVL systems.” The additional evidence of this is the QoQ decline in networking as these systems would certainly drive QoQ growth in networking, making the clear readthrough that other SKUs are driving the $11 billion. 

When asked if there were bottle necks to consider with NVL 72 systems specifically, the CEO avoided discussing NVL72 systems and redirected to a more general discussion on the Grace Blackwell architecture. He also pointed toward single use cases that have “come online” rather than a “shipping in volume” discussion: “You've probably seen on the web, a fair number of celebrations about Grace Blackwell systems coming online and we have them, of course. We have a fairly large installation of Grace Blackwell goes for our own engineering and our own design teams and software teams. CoreWeave has now been quite public about the successful bring up of theirs. Microsoft has, of course, OpenAI has, and you're starting to see many come online. And so I think the answer to your question is nothing is easy about what we're doing, but we're doing great, and all of our partners are doing great.” 

TAKEAWAY: The NVL 72 systems are probably not shipping in volume right now, but should be soon (if they’re in production). This will run close to Blackwell Ultra’s launch. Demand will not be an issue rather it’s unusual to see two generations ship this close to one another, and it will require a smooth supply chain  

Custom Silicon Not a Threat for 4 Reasons 

Concerns around timing of shipping for Blackwell SKUs will be transitory yet concerns with custom silicon are here to stay. Since the very first day of covering the AI story in 2018, I have been fielding concerns around custom silicon as Google’s TPUs were all the rage in 2018. It was actually expected at the time that Google’s TPUs would transition to merchant sales and directly compete with Nvidia. Nearly seven years later, that has not materialized. 

Below, is how Jensen Huang describes the challenges around custom silicon. He points toward custom silicon being application specific whereas GPUs are more flexible (this part is key), the software layer, as well as the fact that a lot of custom silicon does not make it to full production. Because investors will be fielding this concern into the foreseeable future, I’ve noted the response and four reasons below: 

  1. General versus application specific: “NVIDIA's architecture is general whether you're — you've optimized for unaggressive models or diffusion-based models or vision-based models or multimodal models or text models. We're great in all of it […] And so by definition, we're much, much more general than narrow” 
  2. Nvidia is Everywhere: “So we're general, we're end-to-end, and we're everywhere. And because we're not in just one cloud, we're in every cloud, we could be on-prem. We could be in a robot. Our architecture is much more accessible and a great target initial target for anybody who's starting up a new company. And so we're everywhere.” 
  3. Performance: “And if our performance per watt is anywhere from 2x to 4x to 8x, which is not unusual, it translates directly to revenues. And so if you have a 100-megawatt data center, if the performance or the throughput in that 100-megawatt or the gigawatt data center is 4 times or 8 times higher, your revenues for that gigawatt data center is 8 times higher.” 
  4. What Nvidia Does is Hard – the Hardware and the Software is hard to replicate: “And the ecosystem that sits on top of our architecture is 10x more complex today than it was 2 years ago. And that's fairly obvious because the amount of software that the world is building on top of architecture is growing exponentially and AI is advancing very quickly. So bringing that whole ecosystem on top of multiple chips is hard.”

China Increases in Geo Mix for Q1 

An analyst pointed out that China will be increasing in geographic mix for Q1.  

Here is the concern from the analyst: “And I think there is a concern about whether U.S. can pick up the slack if there's regulations towards other geographies. And I was just wondering, as we go throughout the year, if this kind of surge in the U.S. continues and it's going to be — whether that's okay. And if that underlies your growth rate, how can you keep growing so fast with this mix shift towards the U.S.? Your guidance looks like China is probably up sequentially. So just wondering if you could go through that dynamic and maybe collect can weigh in.” 

This may be a moot issue, as management stated: “China is approximately the same percentage as Q4 and as previous quarters. It's about half of what it was before the export control. But it's approximately the same in percentage” but noting the concern here that this analyst thinks USA may not be able to fully make up for a China loss if the trade war heats up. I think if the NVL systems are shipping in volume, it will not matter as China is primarily helping to make up for the lag in these systems right now for the next 1-2 quarters.  

Conclusion: 

You might be asking yourself — why is the I/O Fund so focused on something the rest of the market does not seem to care about? There are two reasons … $100 billion pointed at one SKU is unheard of. Consider the iPhone took a decade to get to that revenue. We will not lazily assume it’s coming until I get “all systems are a go” signs across the board. You can’t put $100 billion into production and ship in volume without a splash in the large supply chain that builds these AI systems. There was no splash (yet). 

Secondly, we need Nvidia to break out of the range bound price it’s been in for 9 months (between $110 and $150). While many might be saying “whew, Nvidia beat/raised,” my stance is “where’s the catalyst that’s going to take this thing higher?” I had an answer for you a few months back – it was the NVL systems, which I stated would cause “fireworks.” To be range bound trading between $110 and $150 since May of 2024 is not exactly fireworks, and thus we need to look closely at whether Nvidia’s next move is to break out or break down. As stated, by being range bound, the valuation has become more attractive, and we are watching this piece closely. This is my number one reason for seeing a breakout above $150 right now (valuation). 

While many investors will rightly hold Nvidia through ups/downs (you’ll see IOF hold for years to come), our firm is competing with the world’s best tech portfolios – which means complacency is not something you’ll see here. Our Members greatly benefit from our need to compete as we question everything – especially if we are overweight any specific outcome.  

Please reference the most up to date trading plan here.

Please note: The I/O Fund conducts research and draws conclusions for the company’s portfolio. We then share that information with our readers and offer real-time trade notifications. This is not a guarantee of a stock’s performance and it is not financial advice. Please consult your personal financial advisor before buying any stock in the companies mentioned in this analysis. Beth Kindig and the I/O Fund own shares in NVDA at the time of writing and may own stocks pictured in the charts.

Recommended Reading:

Nvidia Q4 Financials: Beat Likely for Q4; Questions Persist for Q1

Nvidia will release its Q4 FY2025 results on 26th February after market close. Analysts expect Q4 revenue to grow 72.3% YoY to $38.1 billion and adjusted EPS to grow 63.8% YoY to $0.84. The company has a history of beating consensus estimates, at a minimum of $1 billion for six quarters.  

Questions persist as from the supplier stocks listed below, Super Micro lowered guidancefrom a range of $26 billion to $30 billion, down to $23.5 billion to $25 billion on February 13th. Semtech pulled its $50 million floor guidance for AI revenue. AOSL’s Q1 missed. Regarding Astera’s raise for Q1, they called out custom silicon as driving Q1 revenue rather than merchant GPUs. Vertiv gave mixed results that were a hair lower than previous full year organic sales growth (at 16% instead of 17%). TSMC lowered guidance due to an earthquake.  

With that said, analysts expect Super Micro revenue to grow 27% sequentially in Q2, which suggests more meaningful Blackwell revenue could begin to ramp in the June quarter. We will look for more information from Nvidia on Wed evening. 

Revenue 

Management guided Q4 revenue of $37.5 billion, representing YoY growth of 69.7% and 6.9% QoQ at midpoint. The Q4 growth is expected to be driven by continued demand for Hopper architecture and the initial ramp of Blackwell products. Management provided guidance during Q2 results to “ship several billions in Blackwell revenue” and provided an update during Q3 earnings call that “we are on track to exceed our previous Blackwell revenue estimate of several billion dollars as our visibility into supply continues to increase.” 

UBS analyst Timothy Arcuri expects Blackwell’s revenue of $9 billion in Q4. He said, "We now see Blackwell revenue at ~$9B in Jan Q (vs. ~$5B previously and supply chain capacity able to support as much as $14B) but we believe Hopper is down in Jan," Arcuri added. "Net, we remain at ~$42B for FQ4 (Jan) (Data Center ~$38B) with FQ1 (April) still ~$47B." 

  • Q3 revenue grew by 93.6% YoY to $35.08 billion, driven by strong Hopper revenue. 
  • Analysts expect Q4 revenue to be $38.1 billion, representing YoY growth of 72.3% and QoQ growth of 8.6% 
  • Q1 revenue consensus is $41.98 billion, for YoY growth of 61.2% and QoQ growth of 10.2%.

Looking at sequential growth, Q4 would represent the slowest QoQ growth for two consecutive quarters since Hopper’s ramp, which is to be expected given the new generation of GPUs are scheduled to ramp in H1 2025. We expressed concerns about the timing of Blackwell ramping, primarily based on what suppliers were saying in their most recent earnings reports.

  • Looking further out, analysts expect revenue to grow 51.7% YoY to $195.9 billion in FY2026 ending January 2026 and 21.4% YoY to $237.8 billion in FY2027.

Margins 

Margins are also expected to be a focus during the upcoming earnings, as the Hopper ramp helped the company to improve its bottom line. However, the gross margins will drop for a couple of quarters during the initial ramp of Blackwell to the low-70s and increase to the mid-70s when Blackwell is fully ramped in the second half of the calendar year 2025. This was further clarified in the Q3 earnings call Q&A. 

Q: Timothy Arcuri (Analyst)  

“[…] And then Colette, you kind of talked about Blackwell bringing down gross margin to the low-70s as it ramps. So I guess if April is the crossover, is that the worst of the pressure on gross margin? So you're going to be kind of in the low-70s as soon as April. I'm just wondering if you can sort of shape that for us. Thanks.”  

A: Colette Kress (CFO)  

Sure. Let me first start with your question, Tim. Thank you regarding our gross margins, and we discussed our gross margins as we are ramping Blackwell in the very beginning and the many different configurations, the many different chips that we are bringing to market, we are going to focus on making sure we have the best experience for our customers as they stand that up. We will start growing into our gross margins, but we do believe those will be in the low 70s in that first part of the ramp. So you're correct, as you look at the quarters following after that, we will start increasing our gross margins and we hope to get to the mid-70s quite quickly as part of that ramp.” 

Q: Vivek Arya (Analyst)  

“Thanks for taking my question. Colette, just to clarify, do you think it's a fair assumption to think NVIDIA could recover to kind of mid-70s gross margin in the back half of calendar 2025? Just wanted to clarify that.” 

A: Colette Kress (CFO)  

“Okay. Vivek, thank you for the question. Let me clarify your question regarding gross margins. Could we reach the mid-70s in the second half of next year? And yes, I think it is reasonable assumption or a goal for us to do, but we'll just have to see how that mix of ramp goes. But yes, it is definitely possible.” 

Q: Stacy Rasgon (Analyst)  

Hi, guys. Thanks for taking my questions. Colette, I had a clarification and a question for you. The clarification, just when you say low-70s gross margins, is 73.5 count as low-70s, or do you have something else in mind? 

Colette Kress (CFO)  

“So first starting on your first question there, Stacy, regarding our gross margin and defined low. Low, of course, is below the mid, and let's say we might be at 71%, maybe about 72%, 72.5%, we're going to be in that range. We could be higher than that as well. We're just going to have to see how it comes through. We do want to make sure that we are ramping and continuing that improvement, the improvement in terms of our yields, the improvement in terms of the product as we go through the rest of the year. So we'll get up to the mid-70s by that point.” 

–End Quote 

  • Q3 gross margin was 74.6% compared to 74% in the same period last year. Management’s guide for Q4 is 73%. The adjusted gross margin was 75% in Q3 for both periods and the management guide for the next quarter is 73.5%. 
  • Q3’s operating margin was 62.3% compared to 57.5% in the same period last year with a guide of 60.2% for Q4.  Adjusted gross margin was 66.3% compared to 63.8% in the same period last year and guide of 64.4% for Q4. 
  • Q3's net margin was 55% compared to 51% in the same period last year and the guide for Q4 is 51.2%. Adjusted net margin was 57% in Q3 compared to 55.3% in the same period last year. 

EPS

Q3 GAAP EPS grew by 110% YoY to $0.78, and adjusted EPS grew by 101.5% YoY to $0.81, driven by strong operating leverage. Analysts expect strong growth in the coming quarters. However, growth is expected to moderate in line with the revenue growth. 

  • Analysts expect Q4 adjusted EPS to grow 63.8% YoY to $0.84 and 49% YoY to $0.91 in Q1. 
  • Looking further out, analysts expect adjusted EPS to grow 50.3% YoY to $4.44 in FY2026 and 26.1% YoY to $5.60 in FY2027.

Cash Flows and Balance Sheet 

Q3 cash flow remained strong, with operating and free cash flow margins both expanding sequentially and YoY. 

  • Q3's operating cash flow margin was 50.3% compared to 40.5% in the same period last year. 
  • Q3’s free cash flow margin was 47.9% compared to 38.9% in the same period last year.  
  • Cash and marketable securities were $38.49 billion and debt of $8.46 billion compared to $34.8 billion and $8.46 billion at the end of Q2.  
  • The company repurchased shares worth $11.0 billion and paid $245 million in dividends in Q3. 

Key Metrics 

Q3 data center revenue grew by 112% YoY and 17% QoQ to $30.77 billion, driven by strong Hopper revenue.  

According to estimates from FactSet, the data center is expected to increase $2.6 billion sequentially to $33.37 billion compared to the $4.5 billion increase in Q3, which would mark the lowest sequential increase since the AI boom at the beginning of 2023. UBS analyst Timothy Arcuri is more bullish and expects Data Center revenue to be $38 billion with Blackwell’s revenue of $9 billion in Q4.  

However, analysts are mixed with Mizuho’s Vijay Rakesh stating he is expecting a “more flattish” Q1 with data center revenue of $36.7 billion versus $37.4 billion consensus.  

On the other hand, KeyBanc analyst believes that despite the supply chain constraints for GB200 servers it will be backfilled with HGX-based B200 servers with x86 head nodes. The same note points toward H2 being more likely GB200s: “Baird believes previously discussed delays for GB200 have not been related to demand but to data enter availability while architecture novelties have taken time to implement and optimize. Investors should not assume that these initial delays will lead customers to skip to the next-generation products, the firm contends. It expects GB200 to represent the majority of Nvidia's GB mix in the second half of 2025 and into 2026.” The analyst believes GB200s will be offset by B200 servers including the HGX-based servers and H20 GPUs from China.

  • Q3 gaming revenue increased 15% YoY and 14% QoQ to $3.28 billion, driven by GeForce RTX 40 Series and game console SoCs. Management expects gaming revenue to decline sequentially due to supply chain constraints.  
  • Pro Viz revenue increased 17% YoY and 7% QoQ to $486 million, driven by the ramp up of RTX GPU workstations. 
  • Automotive revenue increased 72% YoY and 30% QoQ to $449 million, driven by the ramp of Nvidia’s self-driving platform revenue. 
  • OEM and other revenue increased 33% YoY and 10% QoQ to $97 million.  

Valuation 

The company is trading at a P/E ratio of 54.5 and a forward P/E ratio of 31.2. 

The P/S ratio is 30.4 compared to the average P/S ratio of 25, the forward P/S ratio is 17.3. These valuations are very reasonable and typically present a buying opportunity as the company has been rapidly growing its top and bottom line.

Technical Analysis 

By Knox Ridley 

Since Nvidia bottomed on October 13th 2022, we have seen three distinct uptrends emerge. We are in the 3rd of these uptrends, and it is markedly different than the prior two. For one, unlike the first two, the uptrend that started in August of 2024 is relatively weak with a messy and overlapping structure. The prior two were nearly vertical. The second notable difference is that volume is weakening the higher price goes into the current uptrend. This is not like the prior two uptrends that saw volume expand with price. This signals that there is less excitement about the current move higher, as less buyers are supporting it.

If we examine the potential pattern the current uptrend is taking, there are only two that make sense, given the price action.  Within the larger context of the uptrend, we are either setting up for the final 5th wave or a drop to complete the larger 4th wave.

If we zoom in, we can get a better idea of the levels to monitor that will signal what is likely playing out.

The Green Count – If this is a continuation of the larger uptrend, it is taking the form of an ending diagonal pattern. These patterns are the final swings in a larger 5 wave uptrend. They also tend to follow a powerful 3rd waves, which is what we saw with NVDA in 2024.  

Ending diagonals are also a 5 wave patterns that have significant overlaps and are relatively weak. If this is the pattern in play, we will need to hold over the $119 – $123 support zone and then break above the $144 – $149 resistance zone. If this does happen, we will be in the 5th wave of this ending diagonal, which will target between $165 – $211. This will end the 5th wave and should lead to a notable retrace. 

The Blue Count – Considering the messy and overlapping nature of this uptrend, there is a chance that this was a corrective bounce in an on-going correction that started in June of 2024. This would suggest that the B wave of this downtrend ended on January 7th with a double top. The final C wave drop should break below $123 – $119, and find support between $102 – $83.

Considering that Nvidia has been the market leader since 2023, and the most important name in the AI infrastructure cycle, how this stocks breaks will be very important to the bull market.

Conclusion: 

Nvidia has an attractive valuation and is one of the few tech stocks in the market that does. Typically, we would buy here. However, the I/O Fund prefers to wait to see how the supplier commentary around Blackwell resolves before deciding next steps since we are particularly exposed to AI semis.  

Our team has no doubt we will capture the next, powerful move higher in AI as we closely track key companies. However, given we our portfolio carries a higher beta profile, we tend to be more cautious on timing. With tech, you should not have to accept increased risk to buy – as the buys take care of themselves when a trend is in play and “all systems are a go.”  

If Nvidia does well on Wednesday – great, we are clearly participating with a heavy allocation to AI semis. If Nvidia stumbles with a Q1 outlook, then we are prepared for that too and will hedge our AI semis. That’s all you can ask for as an investor – is to have a plan! 

Lead Tech Analyst Beth Kindig and Equity Analyst Royston Roche contributed to this analysis.

Please note: The I/O Fund conducts research and draws conclusions for the company’s portfolio. We then share that information with our readers and offer real-time trade notifications. This is not a guarantee of a stock’s performance and it is not financial advice. Please consult your personal financial advisor before buying any stock in the companies mentioned in this analysis. Beth Kindig and the I/O Fund own shares in NVDA at the time of writing and may own stocks pictured in the charts.

Recommended Reading:

Nvidia Q4 Financials: Beat Likely for Q4; Questions Persist for Q1

Nvidia will release its Q4 FY2025 results on 26th February after market close. Analysts expect Q4 revenue to grow 72.3% YoY to $38.1 billion and adjusted EPS to grow 63.8% YoY to $0.84. The company has a history of beating consensus estimates, at a minimum of $1 billion for six quarters.  

Questions persist as from the supplier stocks listed below, Super Micro lowered guidancefrom a range of $26 billion to $30 billion, down to $23.5 billion to $25 billion on February 13th. Semtech pulled its $50 million floor guidance for AI revenue. AOSL’s Q1 missed. Regarding Astera’s raise for Q1, they called out custom silicon as driving Q1 revenue rather than merchant GPUs. Vertiv gave mixed results that were a hair lower than previous full year organic sales growth (at 16% instead of 17%). TSMC lowered guidance due to an earthquake.  

With that said, analysts expect Super Micro revenue to grow 27% sequentially in Q2, which suggests more meaningful Blackwell revenue could begin to ramp in the June quarter. We will look for more information from Nvidia on Wed evening. 

Revenue 

Management guided Q4 revenue of $37.5 billion, representing YoY growth of 69.7% and 6.9% QoQ at midpoint. The Q4 growth is expected to be driven by continued demand for Hopper architecture and the initial ramp of Blackwell products. Management provided guidance during Q2 results to “ship several billions in Blackwell revenue” and provided an update during Q3 earnings call that “we are on track to exceed our previous Blackwell revenue estimate of several billion dollars as our visibility into supply continues to increase.” 

UBS analyst Timothy Arcuri expects Blackwell’s revenue of $9 billion in Q4. He said, "We now see Blackwell revenue at ~$9B in Jan Q (vs. ~$5B previously and supply chain capacity able to support as much as $14B) but we believe Hopper is down in Jan," Arcuri added. "Net, we remain at ~$42B for FQ4 (Jan) (Data Center ~$38B) with FQ1 (April) still ~$47B." 

  • Q3 revenue grew by 93.6% YoY to $35.08 billion, driven by strong Hopper revenue. 
  • Analysts expect Q4 revenue to be $38.1 billion, representing YoY growth of 72.3% and QoQ growth of 8.6% 
  • Q1 revenue consensus is $41.98 billion, for YoY growth of 61.2% and QoQ growth of 10.2%.

Looking at sequential growth, Q4 would represent the slowest QoQ growth for two consecutive quarters since Hopper’s ramp, which is to be expected given the new generation of GPUs are scheduled to ramp in H1 2025. We expressed concerns about the timing of Blackwell ramping, primarily based on what suppliers were saying in their most recent earnings reports.

  • Looking further out, analysts expect revenue to grow 51.7% YoY to $195.9 billion in FY2026 ending January 2026 and 21.4% YoY to $237.8 billion in FY2027.

Margins 

Margins are also expected to be a focus during the upcoming earnings, as the Hopper ramp helped the company to improve its bottom line. However, the gross margins will drop for a couple of quarters during the initial ramp of Blackwell to the low-70s and increase to the mid-70s when Blackwell is fully ramped in the second half of the calendar year 2025. This was further clarified in the Q3 earnings call Q&A. 

Q: Timothy Arcuri (Analyst)  

“[…] And then Colette, you kind of talked about Blackwell bringing down gross margin to the low-70s as it ramps. So I guess if April is the crossover, is that the worst of the pressure on gross margin? So you're going to be kind of in the low-70s as soon as April. I'm just wondering if you can sort of shape that for us. Thanks.”  

A: Colette Kress (CFO)  

Sure. Let me first start with your question, Tim. Thank you regarding our gross margins, and we discussed our gross margins as we are ramping Blackwell in the very beginning and the many different configurations, the many different chips that we are bringing to market, we are going to focus on making sure we have the best experience for our customers as they stand that up. We will start growing into our gross margins, but we do believe those will be in the low 70s in that first part of the ramp. So you're correct, as you look at the quarters following after that, we will start increasing our gross margins and we hope to get to the mid-70s quite quickly as part of that ramp.” 

Q: Vivek Arya (Analyst)  

“Thanks for taking my question. Colette, just to clarify, do you think it's a fair assumption to think NVIDIA could recover to kind of mid-70s gross margin in the back half of calendar 2025? Just wanted to clarify that.” 

A: Colette Kress (CFO)  

“Okay. Vivek, thank you for the question. Let me clarify your question regarding gross margins. Could we reach the mid-70s in the second half of next year? And yes, I think it is reasonable assumption or a goal for us to do, but we'll just have to see how that mix of ramp goes. But yes, it is definitely possible.” 

Q: Stacy Rasgon (Analyst)  

Hi, guys. Thanks for taking my questions. Colette, I had a clarification and a question for you. The clarification, just when you say low-70s gross margins, is 73.5 count as low-70s, or do you have something else in mind? 

Colette Kress (CFO)  

“So first starting on your first question there, Stacy, regarding our gross margin and defined low. Low, of course, is below the mid, and let's say we might be at 71%, maybe about 72%, 72.5%, we're going to be in that range. We could be higher than that as well. We're just going to have to see how it comes through. We do want to make sure that we are ramping and continuing that improvement, the improvement in terms of our yields, the improvement in terms of the product as we go through the rest of the year. So we'll get up to the mid-70s by that point.” 

–End Quote 

  • Q3 gross margin was 74.6% compared to 74% in the same period last year. Management’s guide for Q4 is 73%. The adjusted gross margin was 75% in Q3 for both periods and the management guide for the next quarter is 73.5%. 
  • Q3’s operating margin was 62.3% compared to 57.5% in the same period last year with a guide of 60.2% for Q4.  Adjusted gross margin was 66.3% compared to 63.8% in the same period last year and guide of 64.4% for Q4. 
  • Q3's net margin was 55% compared to 51% in the same period last year and the guide for Q4 is 51.2%. Adjusted net margin was 57% in Q3 compared to 55.3% in the same period last year. 

EPS

Q3 GAAP EPS grew by 110% YoY to $0.78, and adjusted EPS grew by 101.5% YoY to $0.81, driven by strong operating leverage. Analysts expect strong growth in the coming quarters. However, growth is expected to moderate in line with the revenue growth. 

  • Analysts expect Q4 adjusted EPS to grow 63.8% YoY to $0.84 and 49% YoY to $0.91 in Q1. 
  • Looking further out, analysts expect adjusted EPS to grow 50.3% YoY to $4.44 in FY2026 and 26.1% YoY to $5.60 in FY2027.

Cash Flows and Balance Sheet 

Q3 cash flow remained strong, with operating and free cash flow margins both expanding sequentially and YoY. 

  • Q3's operating cash flow margin was 50.3% compared to 40.5% in the same period last year. 
  • Q3’s free cash flow margin was 47.9% compared to 38.9% in the same period last year.  
  • Cash and marketable securities were $38.49 billion and debt of $8.46 billion compared to $34.8 billion and $8.46 billion at the end of Q2.  
  • The company repurchased shares worth $11.0 billion and paid $245 million in dividends in Q3. 

Key Metrics 

Q3 data center revenue grew by 112% YoY and 17% QoQ to $30.77 billion, driven by strong Hopper revenue.  

According to estimates from FactSet, the data center is expected to increase $2.6 billion sequentially to $33.37 billion compared to the $4.5 billion increase in Q3, which would mark the lowest sequential increase since the AI boom at the beginning of 2023. UBS analyst Timothy Arcuri is more bullish and expects Data Center revenue to be $38 billion with Blackwell’s revenue of $9 billion in Q4.  

However, analysts are mixed with Mizuho’s Vijay Rakesh stating he is expecting a “more flattish” Q1 with data center revenue of $36.7 billion versus $37.4 billion consensus.  

On the other hand, KeyBanc analyst believes that despite the supply chain constraints for GB200 servers it will be backfilled with HGX-based B200 servers with x86 head nodes. The same note points toward H2 being more likely GB200s: “Baird believes previously discussed delays for GB200 have not been related to demand but to data enter availability while architecture novelties have taken time to implement and optimize. Investors should not assume that these initial delays will lead customers to skip to the next-generation products, the firm contends. It expects GB200 to represent the majority of Nvidia's GB mix in the second half of 2025 and into 2026.” The analyst believes GB200s will be offset by B200 servers including the HGX-based servers and H20 GPUs from China.

  • Q3 gaming revenue increased 15% YoY and 14% QoQ to $3.28 billion, driven by GeForce RTX 40 Series and game console SoCs. Management expects gaming revenue to decline sequentially due to supply chain constraints.  
  • Pro Viz revenue increased 17% YoY and 7% QoQ to $486 million, driven by the ramp up of RTX GPU workstations. 
  • Automotive revenue increased 72% YoY and 30% QoQ to $449 million, driven by the ramp of Nvidia’s self-driving platform revenue. 
  • OEM and other revenue increased 33% YoY and 10% QoQ to $97 million.  

Valuation 

The company is trading at a P/E ratio of 54.5 and a forward P/E ratio of 31.2. 

The P/S ratio is 30.4 compared to the average P/S ratio of 25, the forward P/S ratio is 17.3. These valuations are very reasonable and typically present a buying opportunity as the company has been rapidly growing its top and bottom line.

Technical Analysis 

By Knox Ridley 

Since Nvidia bottomed on October 13th 2022, we have seen three distinct uptrends emerge. We are in the 3rd of these uptrends, and it is markedly different than the prior two. For one, unlike the first two, the uptrend that started in August of 2024 is relatively weak with a messy and overlapping structure. The prior two were nearly vertical. The second notable difference is that volume is weakening the higher price goes into the current uptrend. This is not like the prior two uptrends that saw volume expand with price. This signals that there is less excitement about the current move higher, as less buyers are supporting it.

If we examine the potential pattern the current uptrend is taking, there are only two that make sense, given the price action.  Within the larger context of the uptrend, we are either setting up for the final 5th wave or a drop to complete the larger 4th wave.

If we zoom in, we can get a better idea of the levels to monitor that will signal what is likely playing out.

The Green Count – If this is a continuation of the larger uptrend, it is taking the form of an ending diagonal pattern. These patterns are the final swings in a larger 5 wave uptrend. They also tend to follow a powerful 3rd waves, which is what we saw with NVDA in 2024.  

Ending diagonals are also a 5 wave patterns that have significant overlaps and are relatively weak. If this is the pattern in play, we will need to hold over the $119 – $123 support zone and then break above the $144 – $149 resistance zone. If this does happen, we will be in the 5th wave of this ending diagonal, which will target between $165 – $211. This will end the 5th wave and should lead to a notable retrace. 

The Blue Count – Considering the messy and overlapping nature of this uptrend, there is a chance that this was a corrective bounce in an on-going correction that started in June of 2024. This would suggest that the B wave of this downtrend ended on January 7th with a double top. The final C wave drop should break below $123 – $119, and find support between $102 – $83.

Considering that Nvidia has been the market leader since 2023, and the most important name in the AI infrastructure cycle, how this stocks breaks will be very important to the bull market.

Conclusion: 

Nvidia has an attractive valuation and is one of the few tech stocks in the market that does. Typically, we would buy here. However, the I/O Fund prefers to wait to see how the supplier commentary around Blackwell resolves before deciding next steps since we are particularly exposed to AI semis.  

Our team has no doubt we will capture the next, powerful move higher in AI as we closely track key companies. However, given we our portfolio carries a higher beta profile, we tend to be more cautious on timing. With tech, you should not have to accept increased risk to buy – as the buys take care of themselves when a trend is in play and “all systems are a go.”  

If Nvidia does well on Wednesday – great, we are clearly participating with a heavy allocation to AI semis. If Nvidia stumbles with a Q1 outlook, then we are prepared for that too and will hedge our AI semis. That’s all you can ask for as an investor – is to have a plan! 

Lead Tech Analyst Beth Kindig and Equity Analyst Royston Roche contributed to this analysis.

Please note: The I/O Fund conducts research and draws conclusions for the company’s portfolio. We then share that information with our readers and offer real-time trade notifications. This is not a guarantee of a stock’s performance and it is not financial advice. Please consult your personal financial advisor before buying any stock in the companies mentioned in this analysis. Beth Kindig and the I/O Fund own shares in NVDA at the time of writing and may own stocks pictured in the charts.

Recommended Reading:

Nvidia Suppliers Send Mixed Signals for Delays on GB200 Systems – What It Means for NVDA Stock

Nvidia has led the Mag 7 for two years with a return of 853% since Jan of 2023. The second closest Mag 7 return in this time frame is Meta at 495% with all other Mag 7 stocks returning less than 200%, and popular tech ETF QQQ returning 105% in that time frame. All the above is outstanding performance, yet one stock has clearly set itself apart.

Given the spectacular outperformance of more than 7X the QQQs, it goes without saying there is outsized pressure on Nvidia’s stock, whether it’s from short sellers who are still in disbelief, or from investors who are simply wanting to book gains.

Recently, a low-cost large language model (LLM) from China sent the stock down 25% in two days. In the heart of the aftermath, I spoke with Charles Payne on Fox Business News, discussing key reasons investors should stay the course, given cheaper AI development will drive more demand (not less). The stock has nearly recouped its losses, trading 6% below its high before the Deep Seek news broke. Ultimately, Deep Seek is immaterial to AI demand, or perhaps even a net add given AI is too expensive to develop for most developers, resulting in fewer consumer and enterprise applications.

When it comes to Nvidia, there’s no denying the Street gets plenty wrong. Perhaps most egregious was when the Street dropped the stock 60% based on a gaming miss, as Ethereum’s merge to proof of stake in September of 2022 was expected to be the death knell for the AI juggernaut. A month later, the AI GPUs that drove the 7X outperformance shipped. The disconnect was staggering.

The I/O Fund has a strong track record on this stock, discussing every twist and turn publicly for our free stock newsletter readers with documented gains of up to 4,100% as far back as 2018 based on a very-early AI thesis. That gaming miss that resulted in a drop of 60%? We bought that too.

However, it’s important that I pause the exuberance and discuss something stirring beneath the surface. Recently, in this quarterly only, key suppliers are providing mixed guidance on the timing of Nvidia’s Blackwell GB200 systems. The commentary is subtle, and it would require knowing this stock thoroughly to identify the change in tone.

To put it simply, if Blackwell GB200s were ramping, we would see strong sequential growth for Q1. At the very least, there would be some indication Q2 is setting up for strong growth, and yet the commentary is shifting toward a second half discussion. When you add that suppliers do not want to get into the crosshairs with Nvidia, yet are under SEC regulations on how they offer guidance, the language used is incredibly easy to miss.

Ultimately, my spidey senses are up as commentary for Q1 and Q2 should be stronger on the products and solutions that supply Nvidia’s GB200 NVL systems. Meanwhile, Nvidia’s management team is under immense pressure as the company has beat revenue estimates by $1 billion or more for six quarters. This means even a minor delay or minor adjustment in expectations could come under close scrutiny.

As a reminder, we don’t make earnings calls, as many factors can affect stock price. For example, even though I’m getting mixed signals on the timing for GB200 NVL systems, Nvidia’s B200s are ramping, and theoretically can absorb some of this demand.

Instead of making an earnings call, we present quality research so that investors are fully informed to make their own decisions. From there, we take this a step further and publish every single trade we make on our research site. In finance, full transparency is rare, yet through never-ending tenacity, my firm has offered up to 4100% gains on Nvidia alone. We continue this long-standing dedication to our readers in the analysis below.

Nvidia’s Future Hinges on Blackwell – GB200s are the Standout SKUs

Due to the cyclical nature of GPU shipments, the differences in each generation are critical for investors to track. The Hopper generation has driven immense revenue growth over the past two years, while the Blackwell generation is expected to drive revenue that exceeds 2023 and 2024 combined. Hopper brought Nvidia to a $100 billion data center segment – at $26.3 billion in fiscal Q2 2024 – yet I pointed out how Blackwell could drive the data center segment to $200 billion-plus ten months ago.

You can read more about the nuances of each generation of Nvidia’s AI accelerators here, and why Nvidia’s future generations of GPUs can help Nvidia Stock reach $10 Trillion in Market Cap.Nvidia Stock reach $10 Trillion in Market Cap.

The rack-scale GB200 NVL72 features 36 GB200s, or 72 B200 GPUs and 36 Grace CPUs, offering up to 30X inference improvement and up to 5X training improvement versus the HGX H100, with significant improvements in energy efficiency and data processing speeds. The GB200 NVL72 was designed to address and unlock real-time inference for trillion-plus parameter models.

Despite being on an accelerated timeline, Blackwell will deliver the largest leap generationally to date for Nvidia’s AI GPUs.

  • The B200 GPU will deliver a 2.5X training improvement and 5X inference improvement over the H100.
  • Blackwell will see a massive upgrade in chip size, at 208 billion transistors compared to the H100’s 80 billion transistors.
  • The B200 will also have 20 petaflops of FP4 compared to the H100’s 4 petaflops of FP8. I’ve covered the importance of this awhile back, and more recently following DeepSeek.

Blackwell’s pricing power is one of the key factors behind its growth potential, with the GB200 expected to be priced between $60,000 to $70,000, around double the H200’s estimated $32,000 price tag. For rack-scale solutions, the price tags are much heftier – the GB200 NVL36 (featuring 18 GB200s and 18 Grace CPUs) is estimated to carry a $1.8 million price tag, while the GB200 NVL72 is estimated to command an eye-watering $3 million price tag.

Roughly 35,000 NVL72 racks are estimated to be shipped this year, that’s already up to $105 billion in revenue for Nvidia. This volume correlates to shipments of ~2.52 million GB200s, versus Hopper shipments of 2 million-plus in 2024. To note, the revenue and volume do not include the NVL36 racks, B200s, B200As, B300s, and Hopper GPUs still on deck this year.

Nvidia B200s Will Be in High Demand and Likely Ship in Volume in H1

There is certainly a scenario where Nvidia’s GPUs are in such high demand that other SKUs can help make up for a delay on the much-larger GB200 NVL systems. The B200s are expected to be in high demand and companies such as Super Micro are shipping B200 HGX systems in volume. This is one reason Super Micro has seen favorable price action despite lowering their fiscal year guidance; it’s assumed the company can make up for any delays on the GB200s with B200 and B200 HGX systems.

However, the market does not like surprises. As of now, the market is expecting the GB200s to ramp in Q1 and further ramp in volume in Q2. It will be a tall order to meet these expectations (on the dot) with lower priced GPUs and HGX systems.

SECTION TAKEAWAY: Blackwell is a significant undertaking to have 36 GPUs and up to 72 GPUs communicate as one GPU (number depends on the SKU, with complexity increasing if it’s a single rack versus multi-rack configuration). Previously, Nvidia’s AI systems combined 8 GPUs. This significant leap not only increases pricing from roughly $32,000 per GPU to up to $3 million per system, but it also greatly increases the need for new networking architecture and comes with increased power requirements.

Nvidia GB200 Delay Rumors Grow – The I/O Fund’s Take for Q1 & Q2

Dating back six months, there have been rumors that the GB200s are delayed. The first rumor came from The Information, stating machines were sitting idle at Taiwan Semiconductor, where Nvidia’s chips are made. I informed my readers at the time this was unlikely to be the case as TSMC was reporting record high-performance computing revenue. In fact, TSMC continues to report strong HPC revenue.

NVDA stock outlook chart: TSMC reports strong QoQ HPC growth (Q2-Q4), indicating active production.

NVDA stock outlook: TSMC shows no signs of idle machines with strong QoQ growth for the HPC segment during Q2 to Q4.

In January, analyst Ming-Chi Kuo reported there were “Short-term Potential Risks in Nvidia and Related Supply Chain,” stating that GB200 NVL72 shipments in 2025 could reach roughly 25,000 to 35,000 racks compared to 50,000 to 80,000 racks from last year. The same analyst reported earlier in the year that “The biggest challenges in NVL72 development mainly stem from the 132kW thermal design point (TDP) requirement, which makes it the highest-power-consuming server in history. Nvidia and its supply chain need more time to solve unprecedented technology issues.”

This post piqued my interest as the emphasis would be outside the foundry. Instead, this would suggest an entirely new delay with thermal management issues (direct liquid cooling), or perhaps with power management solutions, or even networking related — rather than a material delay related to TSMC and yield issues.

To cross-examine this possibility, below is a brief summary from some of the more well-known direct-liquid cooling suppliers, PMIC suppliers (power management integrated circuits), and a few networking companies outlining commentary that leads to a higher probability there is a delay for the GB200s. If my read-through from these management teams is correct, the delay falls somewhere on the thermal/power solutions or networking components part of the supply chain rather than on TSMC.

Explaining the Lower Rack Shipments of NVL72 Systems

Regarding the statement that the GB200 NVL72 shipments in 2025 could reach roughly 25,000 to 35,000 racks compared to 50,000 to 80,000 racks from last year, I want to take a step back and clarify here that while that would represent a substantial drop, it’s more representative of a significant shift in NVL72 share from last year, and more reflective of what key partner TSMC can handle in terms of CoWoS capacity.

In July of 2024, estimates for GB200 racks were revised 50% higher from 40,000 to 60,000 racks, with the NVL36 at more than 80% share at 50,000 racks with the remaining 10,000 racks to be NVL72.

This would correlate to 2.52 million GPUs shipped – coincidentally, the same amount of GPUs expected to be shipped with 35,000 NVL72 racks, with more on deck from NVL36 configurations.

So, while it may look to be a large decline, GPU shipments at 35,000 NVL72 racks plus additional NVL36 racks would actually be higher than last year’s 60,000 NVL72 and NVL36 estimate due to a large shift towards the NVL72 configuration.

screen shot of Beth Kindig’s tweet

Additionally, the industry’s more recent, most optimistic forecasts for 50,000 to 80,000 NVL72 racks would be unrealistic and practically impossible for TSMC to meet – at the midpoint, this would require ~4.68 million B200 GPUs, or more than 292,000 in CoWoS wafer allocation simply for the NVL72 (not including NVL36).

Current estimates from Morgan Stanley place the B200’s CoWoS allocation at ~220,000 wafers for 2025, or more than 30% of TSMC’s total capacity for the year. This coincides with estimated B200 GPU shipments of 3.52 million, more than enough to handle 35,000 NVL72 racks and similar volumes of NVL36 racks.

SECTION TAKEAWAY:

With what the I/O Fund knows today, the product mix of NVL72 being higher, thus resulting in a lower number of racks being delivered, is not the issue. Rather, it’s the timing that could pose an issue due to Wall Street potentially having to face uncertainty on what quarter NVL systems would ship in volume.

Blackwell Necessitates Direct Liquid Cooling – Super Micro and Vertiv’s Comments

In June, we wrote an analysis on AI Power Consumption: Rapidly Becoming Mission Critical which stated that as the industry progresses towards a million-GPU scale, more emphasis is placed on future AI GPU generations to focus on power efficiency while delivering increasing levels of compute. Data centers are expected to adopt liquid cooling technologies to meet the cooling requirements to house these increasingly large GPU clusters, and the percentage of air-cooled systems shipped versus liquid cooled systems will change (dramatically) with Blackwell’s NVL systems.

Therefore, any changes to Blackwell’s NVL systems timing would appear in commentary from companies that provide direct-liquid cooling solutions and servers, as the previous generations are air cooled.

Super Micro Lowers FY25 Revenue Guide, Pushes Back 30% Liquid Cooling Target

Super Micro recently reported preliminary fiscal Q2 results, in which it cut its fiscal 2025 revenue guide while hinting that Blackwell GPUs could take longer to ramp in the first part of the calendar year.

At Computex in June 2024, CEO Charles Liang stated that he “expects 15 percent of racks [SMCI] sells this year to use DLC, and 30 percent to employ it [in 2025].” In August 2024,  Liang slightly changed his tune, noting that they now expect “25% to 30% of the new global datacenter deployments to use DLC solutions in the next 12 months.”

I remember this comment well, as it was part of the evidence used to debunk the August rumors considering SMCI had moved up their timeline for DLC delivery (from end of year 2025 to mid-year 2025).

Two weeks ago in the February 2025 report, this timeline was shifted back with Liang stating that Super Micro now believes that “DLC or overall liquid cooling market share will grow all the way to 30% or even more in the next 12 months” — it’s not a dramatic shift in tone but rather pushes the 30% target back from mid-year 2025 noted in August, to beyond the original year-end timeline — to now technically being early 2026.

The August earnings call also housed one critical piece of information regarding Blackwell and Super Micro’s 2025 revenue. Wells Fargo’s Aaron Rakers questioned management about Blackwell and guidance for December 2024 and onwards. Liang explained that for the December quarter, Blackwell “will be very small. Engineering sample small volume. So the real volume, I believe, had to be March quarter next year. And that's why we foresee only $26 billion to $30 billion.”

But now, SMCI implied they are not able to ship Blackwell in the March quarter:

“Do you guys have a forecast from NVIDIA? You know when you think you're going to start to see you know supply the GPU, so that you can ship the NVL72 where visibility is still pretty low on availability of the GPUs?

Sign up for I/O Fund's free newsletter with gains of up to 2600% because of Nvidia's epic run – Click hereSign up for I/O Fund's free newsletter with gains of up to 2600% because of Nvidia's epic run – Click hereClick here

Charles Liang
We already proved pretty much everything. And now, just waiting for – and we are in some allocation, some volume, but the volume demand is way much bigger. So we are waiting for more allocation. So hopefully very soon we can ship in much higher volume."

Super Micro revised its FY25 guidance lower at the beginning of last week, now seeing revenue of $23.5 billion to $25.0 billion, or more than 13% lower than the initial guide at midpoint. Q3 revenue was guided between $5 billion and $6 billion, below the $5.95 billion estimate. A weaker-than-expected March and FY25 guide plays into management’s comments of a lack of Blackwell NVL72 availability, with Super Micro only just beginning volume shipments of Blackwell-based racks:

Q: Jon Tanwanteng, CJS Securities: “I was wondering if you could break down the factors …driving the reduction in the 2025 revenue guidance. How much is maybe pricing related? How much do you think is related to delays or availability of Blackwell?”

A: David Weigand, Super Micro CFO: “Yeah, I would say, Jon, that probably the biggest factor was just the delay in new technology because we were, when you think about it, we were all set to go. We were all set to ship with liquid cooling. We were ready. But the problem was that not everything else was.”

This was corroborated by Liang:

“Once Blackwell [is] in volume production, I believe we will have strong growth. And now we are just preparing, diligently preparing all the logistics, including the system enclosure, thermal solution, for sure GPU supply from our vendor Nvidia. So we are well prepared and once logistics ready, we are ready to ramp up our growth.”

Super Micro has walked back the revenue guide that hinged on Blackwell’s NVL systems shipping in volume in the March quarter. Management was also quite clear that the new product was facing a delay as they await more GPU supply.

Vertiv Signals Softer Q1

Vertiv is a provider of thermal and power management solutions and is a leader in direct liquid cooling. The company stated they benefited from a “particularly strong” Q4, with revenue rising nearly 26% YoY as they overdelivered by nearly $200 million as customers wanted products as soon as possible.

Vertiv’s strength in Q4 may be tied to key partner Dell, as its AI server backlog in fiscal Q3 (October quarter) rose more than 18% QoQ to $4.5 billion after being flat QoQ in Q2, and its AI pipeline rising more than 50% QoQ. Analysts placed Dell’s AI server pipeline at $16 to $17 billion, up from $11 to $13 billion previously, a rather large jump for one quarter. However, Dell noted that one factor for its softer Q4 and fiscal year guide was the “unpredictability of the AI shipments” as there are “some more timing differences than what we were anticipating when we gave the guide the last quarter.”

For Q1, Vertiv guided a deceleration to 19% YoY growth, with FY25 revenue growth guided at 16%. Management defended this deceleration into Q1 by saying: “Now of course, Q4 was particularly strong. So we should not look at Q1 as a quarter-to-quarter, really look at the first quarter sales as the acceleration that has taken place. With a 19% organic growth in the first quarter, I feel very, very good about what that tells us about our overall trajectory” and also that it is “higher than what we actually saw in 2024.”

Liquid cooling capacity is not a constraint for Vertiv, as they had said last summer that they were “on track to finish in 2024 with a 45x capacity increase compared to baseline at the end of 2023.”

I agree with the analyst sentiment (and weak price action) following the report that the commentary doesn’t check out exactly. Per I/O Fund numbers, management is contradicting itself by guiding for organic growth of 19% at the midpoint for Q1 but 16% growth for the fiscal year (i.e., slower growth later in the year) while stating shipments will increase QoQ.

Additionally, the QoQ/YoY has to be looked at which is lower than what typical seasonality would account for, as our numbers indicate Vertiv was down (12.1%) due to seasonal sequential growth from Q4-Q1. This year, Vertiv is down (16.9%) from Q4-Q1.

My conclusion (still to be confirmed) is that Vertiv may see a weak Q2 before there is an acceleration into the back half.

One Q&A exchange in Q4’s call voiced these concerns:

Q: Steve Tusa, JP Morgan: “Obviously, there's a lot of focus on orders, I think, for good reason. Everybody's trying to discern the trend relative to these CapEx numbers, the pipelines that are obviously pretty eye-popping. You're now two quarters step down relative to what we see at your customers and the way they're spending in these pipelines. What is that disconnect? Is there some sort of disconnect between you guys and everybody else talking about doubling their data center businesses?”

A: Giordano Albertazzi, Vertiv CEO: “I don't think there is a disconnect, quite honestly. If you look at our orders trajectory last year, if you think about a 60% year-on-year growth in the first half of the last year, that's a lot of growth. When our customers talk about their CapEx, of course, they also talk about a lot of the silicon part of their CapEx, not all the data centers. So, I feel pretty good about our visibility of the market and what we win in the market.”

Networking Companies Shift Tone on Timing for GB200s

Please note: the full research including company names, management statements and stock tickers are provided to our research members We offer a more generalized discussion below.to our research members We offer a more generalized discussion below.

PCIe 6.0 supplier:

PCIe 6.0 is a networking standard expected to initially ship with Nvidia’s Blackwell. A key supplier stated to expect this in the second half of the year, as these products “are driving higher dollar content opportunities […] on a full rack and full accelerator basis and we expect volume deployments to begin in the second half of this year.”

Revealed at GTC in March of 2024, PCIe 6.0 was initially expected to launch with the GB200s. The following quote from this supplier also hints that merchant GPUs (Nvidia) will not be driving H1 – which would be odd if Blackwell was shipping. “Now, if you look into 2025, we see both contributing growth. The first half of the year will be more predominantly the internal AI accelerator programs. But if you get into the back half of the year, the transition on the merchant GPUs will also be very strong for us. This is where you'll see the custom rack configurations start to deploy and that’s where we see a big dollar increase in our contemporary GPU with [our product] starting to ramp.”

PMIC Suppliers:

PMICs (power management integrated circuits) are a critical part of the picture for Blackwell, given that these components were linked to Blackwell’s rumored power management issues. Major PMIC suppliers were unable to confirm volume shipments in the first quarter in recent earnings calls.

One PMIC supplier that we covered on our Advanced site on Feb 5th, is stating that “We know that we're not the only one players going after this, so the share is still to be determined. The final design, everything is still to be finalized as well, too. So we're working closely with the customer. Again, at this point, we can say that we're targeting for a mid-year launch.”

This company is either discussing Blackwell Ultra with the B300s, or they are implying GB200s are delayed.

The competing PMIC supplier stated: “Just to add a little bit of color to how we see the year rolling out, we believe that we will be off to a slower start in the first half of the year. But as the year develops, the customer base is expected to broaden as hyperscalers launch their new products. We have multiple product ramps with both existing customers as well as with these new hyperscalers.”

The takeaway is that neither PMIC supplier can confirm they are shipping in volume in Q1 or Q2, yet meanwhile, both are saying they are still part of the supply chain.

Semtech Suddenly Pulls Guidance on Active Copper Cabling (ACCs)

Perhaps the most drastic commentary to come out of the last few weeks was when a key supplier pulled its Q1 guidance intra-quarter.

Semtech filed an 8-K stating that “net sales from its CopperEdge products used in active copper cables are expected to be lower than the Company’s previously disclosed floor case estimate of $50 million due to rack architecture changes, with no expected ramp-up over the course of fiscal year 2026.”

ACC content had been estimated to be substantially higher with 36×2 configurations – it had been rumored back in October 2024 that Nvidia was halting development of one of the NVL72 configurations, the NVL36x2, which linked two 36 GPU racks together in a side-by-side system. Semtech pulling guidance strengthens this view.

The shift in architecture to discontinue the 36×2 configuration was said to possibly “disrupt the supply chain for assembly and cooling solutions,” by removing dual-rack configurations and focusing solely on single-rack NVL72 and NVL36 configurations. DLC suppliers have been pushing back Blackwell’s ramp later in the year, suggesting that the market may have faced some impacts from this rumored design change late last year.

While shifting architectures is not a big deal in the medium-term (as stated above, NVL72 single rack configurations are expected to see a higher mix); it’s the suddenness that Semtech pulled it’s guidance that is cause for concern as the company had reaffirmed its optimistic revenue floor guidance  based on two factors – the timing of Blackwell’s launch and changes in rack design. This suggests both factors may be in play, as a late-stage design change was expected to have downstream impacts on timing for DLC ramping.

Potential Flat Q1 or Flat Q2

A week after we began covering the topic for our research members, Mizuho’s Vijay Rakesh stated he is expecting a “more flattish” Q1 with data center revenue of $36.7 billion versus $37.4 billion consensus.

To reiterate, if there is an issue, it will appear in Q1 or Q2 according to management commentary provided above. For Q4, the QoQ growth in the data center is expected to be $2.6 billion, compared to $4.5 billion QoQ from Q3-Q4.

What to Look for in Nvidia’s Q4 Report

We have yet to see a DLC supplier come in strong, so we believe the risk is elevated that Nvidia reports a weaker-than-expected Q1 or Q2 as the B200s absorbing a timing delay on the GB200s is a tall order.

In terms of the GB200s shipping on time, I’m open to this – and highly prefer it, given I continue to hold a large Nvidia position. However, I can't find clear evidence in the supply chain that these larger systems are ramping for a strong Q1 performance.

HP Enterprise stated that they’ve only now shipped their first Blackwell based system, while Super Micro walked back its FY25 guidance in part due to a soft fiscal Q3, which they had previously said would be when Blackwell increases in volume.

Combined with comments from Vertiv and Dell, as well as other suppliers noted in this analysis, there appears to be an air pocket, of sorts. A quarter that doesn't blow it out of the water would be unusual for Nvidia as it has consistently smashed expectations since Hopper’s breakout quarter in 2023.

On that note, Nvidia’s data center revenue has consistently exceeded expectations by at least $1 billion or more for six consecutive quarters, with fiscal Q2 ‘24 being the largest at a nearly $2.5 billion beat. Last quarter, fiscal Q3 ‘25, was the second largest at nearly $2 billion.

Nvidia data center revenue: Beat $2.5B (Q2'24), $2B (Q3'25). Q2'25 QoQ growth slowdown to 15.3% led to 6% stock decline.

Nvidia’s Q2 ‘24 saw the largest beat at $2.5 billion, while Q3 ‘25 followed with a nearly $2 billion surprise, driven by strong demand for Hopper

This has driven a string of impressive top-line beats each quarter, with the smallest revenue beat being $1.29 billion in fiscal Q2 ‘25. The shrinking size of revenue beats in that quarter correlated to a deceleration in QoQ revenue growth to 15.3%, one factor behind the more than 6% decline Nvidia felt the day following that report.

Nvidia stock: Q4 revenue forecast $38.1B (+8.6% QoQ), Q1 ‘26 projected $41.98B (+10.2%), driven by AI growth.

For the upcoming fiscal Q4 report, revenue is expected to be $38.1 billion, for QoQ growth of 8.6% while Q1 ‘26 is expected to see revenue of $41.98 billion, for QoQ growth of 10.2%.

Conclusion:

Given market jitters around DeepSeek, which turned out to be a non-issue, something more material related to the GB200s, such as growth slowing below expectations at the start of the new fiscal year, could send the stock below $100 — which we would see as a buying opportunity. We provided a more detailed buy plan before the earnings season began in the article “Where I Plan To Buy Nvidia Stock Next”

There is a scenario where Nvidia’s stock marches higher – perhaps based on the remaining strength from Hopper and the B200s, B200 HGX systems and B200As packaged with CoWoS-S and having a lower thermal design power (TDP). Or perhaps the string of suppliers discussed here are simply stating the GB200s are not ramping in volume in Q1 but will in Q2. Even still, I prefer to wait to see how this resolves as my firm has been tracking key suppliers and AI proxies for six years to confidently build our positions.  

Ultimately, my firm trimmed our Nvidia position (to a 10% allocation) and will happily buy lower should the assumptions in this analysis materialize. Nvidia remains the stock of the decade; however, stock returns – and product launches — are not perfectly linear.

The I/O Fund has recently added five new small and mid-cap positions poised to benefit from the ongoing AI spending war. Join us every Thursday at 4:30 p.m. for our exclusive 1-hour webinar, where we cover market entries, exits, and key insights on the broader market. Take advantage of $50 off our Advanced monthly service, now priced at $99/month. Use Code SAVE50ADV through Feb 28th MidnightJoin us every Thursday at 4:30 p.m. for our exclusive 1-hour webinar, where we cover market entries, exits, and key insights on the broader market. Take advantage of $50 off our Advanced monthly service, now priced at $99/month. Use Code SAVE50ADV through Feb 28th Midnight

Disclosure: The I/O Fund owns Nvidia and a handful of Nvidia suppliers including some of the suppliers listed in this analysis. To view the full portfolio, subscribe here.

Please note: The I/O Fund conducts research and draws conclusions for the company’s portfolio. We then share that information with our readers and offer real-time trade notifications. This is not a guarantee of a stock’s performance and it is not financial advice. Please consult your personal financial advisor before buying any stock in the companies mentioned in this analysis. Beth Kindig and the I/O Fund own shares in NVDA at the time of writing and may own stocks pictured in the charts.

Recommended Reading:

AppLovin: Expanding from Gaming to E-Commerce (and Beyond)

AppLovin delivered solid top and bottom line beat in its Q4 2024 earnings release. The company posted 44% YoY and 14.4% QoQ revenue growth to $1.37 billion, beating consensus estimates by 8.7%. GAAP EPS grew for the eighth consecutive quarter, coming in at $1.73, beating consensus estimates by 37.5%. Gross margins were at 76.7%. The Company also raised its forecasts for Q1 2025 and announced an agreement to sell its Apps segment for $900 million in Q1 2025.

The market rewarded its performance with a 24% stock rally. AppLovin has the unique advantage of having a vast dataset of 1.4 billion mobile users. The company has successfully leveraged this data to fuel its AI engine, enabling it to navigate and capitalize on the broader mobile gaming market effectively. AppLovin's data advantage provides a significant competitive edge over its competitors. Very few companies outside of Big Tech possess such a crucial dataset for advertising purposes. This strong moat solidifies the company's future position in the ad-tech industry.

The ad engine AXON 2.0 offers a monumental advantage to AppLovin as the company is ahead in the race for AI-driven advertising. AppLovin is also an arbitrage advertising platform, which means they can quantify the impact of their reach for advertisers by returning back to the advertiser what was spent or more within 30 days. If an advertiser spends $10,000 (or multiples of this), AppLovin is able to return that or more to the advertiser. The company is also unique in that it offers performance marketing for brands and direct-to-consumer. The Trade Desk primarily works with agencies, whereas AppLovin is attracting smaller and medium sized businesses that rely on performance. Most importantly, AXON 2.0 is an AI-powered advertising engine that is continuously improving. Every quarter and every year, AXON becomes more effective by ingesting more data that improves the model through self-learning.

Incidentally, The Trade Desk reported Q4 2024 EPS of 59 cents, beating consensus estimates by 2 cents; while revenues grew 22.32% YoY to $741.01 million, they still missed consensus estimates by $18.55 million. They issued Q1 revenue guidance of at least $575 million versus $574.16 million with an adjusted EBITDA of around $145 million. The stock gapped down 29%.

Revenue Reach Record Highs in Q4

Q4 revenue grew by 44% YoY and 14.4% QoQ to $1.37 billion, compared to Q3 revenue growth of 38.64% YoY and 10.93% QoQ to $1.198 billion. Q4 revenue of $1.37 billion beat consensus estimates for $1.26 billion by 8.7%, compared to Q3 revenue of $1.98 billion, beating consensus estimates for $1.13 billion by 5.9%.

The Advertising segment revenues grew 73% YoY to $999.49 million, up 73% YoY. The Apps segment revenues fell (1%) YoY to $373,29 million. Revenue strength was attributed to positive early results for its e-commerce advertisers during the holiday season, in addition to its mobile gaming partners. The Company signed an agreement to sell its Apps division to an undisclosed party for $900 million, comprised of $500 million in cash and a minority stake in the combined private entity.

Management Q1 2025 guide is $1.355 billion to $1.385 billion, representing a YoY growth of 29.5% and flat QoQ, beating estimates by 3.8% at the midpoint of $1.365 billion. The Advertising revenue Q1 guide is $1.03 to $1.05 billion, midpoint at $1.04 billion and the Apps revenue is $325 to $335 million, midpoint at $330 million.

Margins Consistently Expand Through 2024

Q4 gross margin was 76.7%, slightly down from Q3 at 77.5%, while operating margin was 44.3%, slightly down from Q3 at 44.6%.

Its Advertising segment generated a 78% adjusted EBITDA margin from the adjusted EBITDA of $776.7 million on $999.49 million in revenue. Its App segment generated a 19% adjusted EBITDA margin from the $71.3 million of adjusted EBITDA on $373.3 million in revenue. Even though the revenue will come down by divesting the Apps business, the adjusted EBITDA margin of the company is expected to increase to a high 70% from the current low 60% as the Apps business was a drag on the margins.

Management guided Q1 2025 adjusted EBITDA between 63% to 64%, midpoint of 63.5%, or adjusted EBITDA of $855 million to $885 million, midpoint of $870 million.

GAAP EPS Rises for the Eighth Consecutive Quarter

Q4 GAAP EPS was $1.73, beating consensus estimates for $1.26 by $0.47 or 37.5%. An improvement from Q3 EPS of $1.26, beating $0.93 consensus estimates of $0.93 by $0.32 or 34.8%. GAAP EPS has been improving consecutively from a loss of ($0.22) in Q4 2022 to $1.73 in Q4 2024.

Management didn’t provide specific guidance for Q1 2025 EPS. However, they did provide Q1 2025 adjusted EBITDA guidance of $855 to $885 million, midpoint at $870 million, which also include Advertising adjusted EBITDA of $805 to $825 million, midpoint at $815 million and Apps adjusted EBITDA of $50 to $60 million, midpoint at $55 million.

Steady Cash Flow Improvement, But Debt Remains Stagnant  

Operating cash flow has been improving for five consecutive quarters, reaching its highest level in Q4 at $701 million. The same can be said about free cash flow, as it has also improved for five consecutive quarters, reaching a high of $695.16 million in Q4. The accompanying OCF and FCF percentage have also continued to improve in parallel fashion closing Q4 at their highest levels of 51.10% and 50.60%, respectively. However, the debt has grown from $3.1 billion to $3.51 billion in Q4 and has remained stagnant for the past year. The sale of its Apps segment is expected to bring in $500 million in cash, which could be used to pay down some debt.

AppLovin’s debt levels have only grown in the past year to $3.51 billion, and it doesn't seem the company is very concerned about the debt-to-equity ratio of 3.74, whereas The Trade Desk has no debt.

The Apps Segment Will be Sold in Q1 2025

Applovin collects revenues from its Advertising segment, formerly known as the Software Platform revenue, and its Apps segment, which will be sold in Q1 2025. The Advertising segment revenue growth has been stabilizing with 73% YoY growth in Q4. The Apps segment revenue has been falling to (1%) YoY in Q4. Management guided Q1 2025 Advertising revenue growth to 53% and Apps revenue to fall (13%) YoY.

Valuation

Applovin trades at a price/earnings (P/E) ratio of 155.15.
Its forward price-earnings (P/E) of 69.55.
The price/sales (P/S) ratio is 41.49, forward P/S is 30.24.
The company is trading at an EV/EBITDA ratio of 69.6 and a forward EV/EBITDA ratio of 41.7.
However, if we assume a 78% adjusted EBITDA margin after divesting the Apps business, the forward EV/EBITDA will drop to about 35.9.
Debt-to-equity ratio 3.74.
APP stock is up 24% after earnings.

Since AppLovin plans to transform itself into a pure Advertising platform, it may be helpful to see how the leading pure play AdTech platform fares for comparison.

The Trade Desk trades at a price/earnings (P/E) ratio of 135.57.
Its forward price-earnings (P/E) of 42.26.
The price/sales (P/S) ratio is 17.91, forward P/S is 33.61.
Debt-to-equity ratio 0, no-debt.
TTD stock is down (33%) after earnings.

Earnings Call:

AppLovin Moves Beyond Gaming to E-commerce and Beyond

Q4 was the most foundational period since the Axon upgrade in 2023. For the first time, the Company captured “meaningful” holiday shopping advertising dollars beyond solely the gaming category, e-commerce. E-commerce is their new growth driver category. This is bullish as it increases the addressable market.

Applovin reaches over 1 billion people engaged with mobile games daily with engagement times comparable to social media. Applovin transcended beyond advertising for other games as they did historically, but this time included a broader set of advertisers. Applovin's data shows its platform works for all advertisers, not just direct-to-consumer (DTC) brands, which opens up its customer base to the 10 million businesses that advertise online.

The self-service platform is a top priority to meet the overwhelming demand.

“Self-serve and automated tools are going to be really, really helpful. And so, if you look at just the numbers, what gets us really excited is, in a limited pilot of a few customers on the platform, we're driving actually interesting revenue from this category. So, as we start opening up, we think it's going to be really impactful to the businesses of our clients. It's also very, very impactful for the publishers that we work with. All this inventory is mobile games, and it adds variety to the advertising that the customer is getting on a mobile game.”

Divesting the Gaming Apps Business

Applovin will be selling its Apps division for $900 million, comprised of $500 million in cash and a minority equity stake in the combined private company. They did not disclose the name of the acquirer but expect the transaction to close in Q1 2025.

The Apps segment owns over 200 free-to-play games operated by 10 in-house game studios. It will be instrumental in helping them sell their in-game advertising and collect user data. However, they’ve never been a game developer “at heart”. While their games are “free-to-play”, revenue is generated from in-app purchases including virtual items, upgrades and other enhancements. Advertisers bought ads in their gaming apps. Applovin generated $373.3 million from its Apps in Q4 and $1.485 billion in 2024. The Apps segment may be part of the aggregate system that helps the Advertising segment generate its double-digit revenue growth.

They will lose the Apps portion of revenue, which was not a growth engine. Apps revenue dropped (1%) YoY in Q4 and only grew 3% in 2024. While Apps revenue generated nearly 40% of total revenue in Q4 2023, its portion fell to 27% by Q4 2024, as its Advertising revenue soared 73% while Apps revenue lost (1%). Its Apps revenue generated 44% of total revenue in 2023, but due to the 75% YoY growth it ins Advertising revenue versus 3% growth in Apps revenue, that percentage fell to 31.5%.

The new metric moving forward will be adjusted EBITDA per employee (AEPE) as it transitions to a full advertising platform. Q4 generated a $3 million run-rate adjusted per employee, AEPE, in its Advertising segment.

More on the E-commerce Opportunity:

Foroughi stated that his focus has been on streamlining the team and processes. He stated that Applovin is “one of the most financially lucrative businesses to be constantly announcing layoffs.”

Foroughi notes many high-engagement gaming apps that earn most of their revenue through in-app purchases don’t typically run ads—since doing so could hurt their primary revenue stream—but companies like King have shown that introducing non-gaming ads can create extra revenue.

He notes that the traditional mobile gaming ad market has mostly focused on promoting competing games. By bringing in more non-gaming advertisers, the company expects to sell its MAX product and DSP platform to gaming publishers that primarily rely on in-app purchases, thereby opening a new growth opportunity.

“Traditionally, in the mobile gaming mediation market, vast, vast majority of the ads were for games that were competitive to the publisher game. As we execute on bringing on more and more advertisers in non-gaming categories, we think that it's going to be pretty reasonable to sell the MAX product and our DSP platform to these gaming publishers who are monetizing predominantly or exclusively with in-app purchasing, bring on that supply, and that will create another expansion vector.”

When asked about the growth of the e-commerce segment opportunity in 2025 and potential incremental growth to expect from its contribution, Stumpf felt very confident in the ability to contribute a material portion of the revenue from e-commerce activity in 2025.

Foroughi replied, “And the other piece is we've always been a closed-managed platform specifically for mobile games. We now have a lot of proof of life in ecommerce, you've seen it on Twitter, a lot of the noise from customers that are in, but we have not let a lot of customers onto the platform yet as we've been on pilot. As we go more and more open and start attracting thousands and tens of thousands, hundreds of thousands of customers to come on over the coming quarters and years, the business is going to continue to show compelling growth.” He summed it up, “We look at it as one single business and better monetizing the 1 billion-plus daily actives that we see. We don't think about it as revenue from each category matters.”

When asked about the e-commerce solution offering rollout, whether AppLovin is seeing and response from the incumbent competitors.

Foroughi replied, “Yeah. So, I mean, look, we don't look at competition all that much. What I will say is that we're not a platform that's taking the same dollars away from someone else. So, let's compare it to social. If you've got a mattress manufacturer advertising on social today and driving a certain amount of business, and they come on to our platform, what they're seeing are new transactions from customers that they wouldn't have otherwise gotten to respond to their ads. Whether those customers were on social or not might be an issue, but, certainly, there's a lot of overlap. But a lot of customers just won't notice ads in one environment. Now, in our environment, we have a full-screen video ad that captures attention, and they come on to our platform and they're driving incremental sales.”

As e-commerce grows to become a larger portion of revenues, it will be subject to typical seasonality, with holiday periods seeing slightly larger periods of revenue.

When asked about the Apps business sale and whether it would be tranched out rolling off a few studios throughout the year, CFO Stumpf was direct in his response.

“So, we're going to be selling the entirety of the Apps business, Arsenije. So that would all come off of the P&L and the balance sheet all at once. And then timing, as I mentioned, I think, in my talk track that we're targeting for that to close within Q2.”

When asked if the gaming companies are providing any feedback as they move into e-commerce ads, Foroughi responded that the gaming companies are seeing better performance on their platform every quarter since they are a catalyst to their growth. Also, shifting more impressions to e-commerce has its benefits.

“When they start seeing more and more of their impressions shifting to e-commerce, they absolutely love it. If you're a game publisher, your worst nightmare would have been that I'm going to monetize my game with all of my competition's ads. That just sucks as an end product, but that's all they had. And so, we allow all of our MAX publishers to see the advertising list run. Some of those publishers have commented about the number of impressions that are shifting to non-gaming categories. When you see that commentary, they're absolutely excited about it.”

Conclusion:

AppLovin has found a solid niche with in-game advertising due to its own ecosystem of over 200 gaming apps and solid AI engines. Its new e-commerce advertising segment is off to a strong start and looking to be a potentially lucrative source of more advertising revenues. Notably, the Company doesn’t report how much those revenues were in Q4 or will be moving forward. The rollout of its self-service platform will be a key catalyst once it's released. AppLovin also has high hopes of entering the lucrative CTV segment.

AppLovin’s success has been entirely based on gaming companies advertising to mobile gamers.

The company is planning to introduce new advertising segments to the 1.4 billion users they serve in 2025, which is likely to help the company grow into the foreseeable future. The catalyst for 2025 is expected to broaden to also include a self-service platform for all types of web-based advertising.

AXON 2.0 is an AI-powered advertising engine that is continuously improving. Every quarter and every year, AXON becomes more effective by ingesting more data that improves the model through self-learning. The management has been quite clear they believe these step-ups in model efficiency can help to maintain a 20% to 30% growth rate in gaming alone, and not accounting for the new web-based advertising catalysts expected in 2025.

The I/O Fund is actively looking for an entry into this stock with a final, multi-year price target that is multiples higher than where it’s trading today. It’s normal for an investor to feel like they’ve missed out; we think that thought will be a distant memory in a few years’ time. Keep an eye on your trade alerts and watch our Thursday webinar replay where Knox recently covered the plan for adding AppLovin to the portfolio.

Jea Yu, Equity Analyst at the I/O Fund, contributed to this article.

Please note: The I/O Fund conducts research and draws conclusions for the Fund’s positions. We then share that information with our readers. This is not a guarantee of a stock’s performance. Please consult your personal financial advisor before buying any stock in the companies mentioned in this analysis.

Recommended Reading:

Coinbase Posts Significant Growth Across the Board in Blowout Q4

Coinbase’s Q4 report was a blowout, with revenue beating estimates by more than 23% as transaction revenue and trading volumes both rose high triple-digits on a QoQ and YoY basis in the quarter. EPS of $4.68 came in more than 100% above estimates, with Coinbase benefiting partially from gains on crypto asset holdings and higher prices, while adjusted EBITDA and operating income generation were strong.

Management discussed share gains as a growth driver, as trading volume growth significantly outpaced spot market growth on a sequential basis, by as much as 50 points for consumer trading volumes. Transaction revenue growing at a higher rate than trading volumes for both consumer and institutional segments highlighted improvements in monetization, fueled by diversification in revenue streams to stablecoins, financing and subscriptions, and more.

Revenue

Coinbase reported a rather large revenue beat in Q4, following in Robinhood’s footsteps with strong growth in consumer transaction revenues in the quarter. Revenue increased 138.2% YoY and 88.5% QoQ to $2.27 billion, well ahead of estimates for $1.84 billion. The revenue outperformance was driven by significant triple-digit sequential growth in trading volumes, fueled by elevated crypto trading activity and a 27% sequential uptick in volatility as Bitcoin chopped around the $100K mark.

Management also said that they had “reached an all-time high for both U.S. spot and global derivatives market share in Q4,” with contributions from derivatives trading appearing in transaction revenue.

Coinbase revenue grew 138% YoY in Q4.

Q4’s strength was a stark contrast to Q3 for the spot market, which rebounded substantially in the quarter. In Q3, the US spot market had declined (18%) QoQ, but in Q4, the US spot market increased 126% QoQ.

For 2024, Coinbase reported $6.56 billion in revenue, up 111.2% YoY, driven by a strong Q1 and Q4. This was fueled by 148% YoY growth in trading volume to $1.2 trillion, with positive macro factors in the approval of Bitcoin ETFs in Q1 and the election of a pro-crypto administration in Q4.

Looking ahead, growth is expected to be in the mid-thirty percent rage for 1H, a substantial revenue from 1.5% and 16.3% estimated prior to the report. Trading volumes are already up significantly on a YoY basis YTD (discussed further below in Q1 Outlook). As a reminder to what we’ve stated in our deep dive from September, it’s nearly impossible to predict quarterly revenue this far in advance as asset volatility and trading volumes can be unpredictable. Recall from our post-Q3 write-up that Q4’s original grow estimate was 100 points lower at 38.9% YoY.

Key Metrics

Trading Volume

Trading volume grew significantly in the quarter, with both consumer and institutional trading volume outpacing spot market growth of 126% QoQ. Q4’s trading volume rose 137% QoQ and 185% YoY to $439 billion, the highest growth rate of the year and accelerating from 143% YoY in Q3. Interestingly, Bitcoin’s share of trading volume declined from 37% in Q3 to 27% in Q4, with other assets gaining 15 points share to 48%.

For 2024, trading volume rose 148% YoY to $1.16 trillion, still well below 2021’s peak of $1.67 trillion.

Coinbase's quarterly trading volume for consumer and institutional segments, Q4 2024

Consumer trading volume surged 224% YoY and 176% QoQ to $94 billion, outpacing spot market growth by 50 points. What’s notable is that consumer trading volumes are still well below 2021’s peaks despite Bitcoin surpassing $100,000 – consumer trading volume is under half of what it was in Q4 2021.

Institutional trading volume grew 176% YoY and 128% QoQ to $345 billion, rebounding from a string of sequential declines after Q1 this year. Institutional volumes nearly surpassed its prior record of $371 billion, coming in just 7% below that mark.

Transaction Revenue

This strong trading volume growth translated into strong transaction revenue growth; Q4’s transaction revenue 194% YoY and 172% QoQ to $1.56 billion. Despite accounting for a fraction of volume, consumer transaction revenue is the primary revenue driver, growing of 187% YoY and 179% QoQ to $1.35 billion. Institutional transaction revenue surged 285% YoY and 156% QoQ to $141.3 million – Coinbase provided a few factors that fueled this growth, discussed below.

For 2024, transaction revenue increased more than 162% YoY to $3.99 billion. Consumer transaction revenue rose 157% YoY to $3.43 billion, while institutional transaction revenue increased 283% YoY to $346 billion. Base and other transaction revenue rose 121% YoY to $210 million – Coinbase provided some strong stats for Base, with platform assets rising 89% YoY to $1.4 billion for 2024 and $25 billion in stablecoin transaction volume in Q4.

Coinbase quarterly transaction revenue for consumer and institutional segments, Q4 2024

Consumer transaction revenue was 38% below Q4 2021’s peak above $2 billion, faring better than volume at 47% below peak. Consumer revenue also benefitted from a notably strong uptick in monthly transacting users (MTUs), which rose 24% QoQ to 9.7 million (still below Q4 21’s peak at 11.2 million) as Coinbase worked to improve trading experiences on the platform and added 13 new assets including “popular memecoins like PEPE and WIF” in Q4.

Interestingly, Coinbase noted that “nearly half of trading customers in Q4 were either new to Coinbase or resurrected from prior cycles.” While not a true driver of revenue, it’s a positive sign to see re-engagement of old customers and substantial new customer additions that can be monetized.

Despite being below peak volume, institutional transaction revenue reached a new peak at $141.3 million. This was nearly 56% higher than in Q4 when trading volume peaked, as Coinbase is benefiting from Prime and new products like derivates.

Management noted that they are seeing “significant momentum” in the institutional business, including “strong adoption of our Prime suite across custody, prime trading, financing, and staking, with top clients engaging with most of these products in 2024,” adding that “Prime Financing saw all-time high loan balances in Q4 [with] elevated client trading activity among customers who use financing.”

A quick note on Base (which we covered in our deep dive here): Coinbase saw “higher revenue per transaction due to increased network demand and higher ETH prices in Q4,” along with sequential growth in transactions. Cost per transaction remained below the $0.01 target, and Coinbase noted a goal to optimize this further in 2025.

Subscription and Services Revenue

Subscription and Services revenue was $641.1 million in Q4, more than 10.5% higher than the upper end of the $505 to $580 million guide provided last quarter. This reflected growth of 15% QoQ and nearly 71% YoY.

For 2024, Subscription and Services revenue grew 64% YoY to $2.31 billion, and notably “was ~4.5x higher compared to levels during the 2021 bull market.” The majority of 2024’s growth was driven by blockchain rewards with revenue more than doubling, stablecoins, and Coinbase One subscriptions.

Coinbase subscription and services revenue grew 71% YoY in Q4

For Q1, Coinbase guided for Subscription and Services revenue to be between $685 million to $765 million, for approximately 42% YoY growth and 13% QoQ at midpoint. This would be a nearly 30 point deceleration, though for reference, Q4 was originally guided to see 45% YoY growth.

Coinbase said the sequential growth in Q1 would be driven primarily by stablecoin revenue as USDC assets and market cap reached all-time highs in February, “continued growth in our Coinbase One subscriber base, and the higher average crypto asset prices so far in Q1.”

Within subscription and services revenue:

  • Stablecoin revenue rose nearly 32% YoY but declined approximately (9%) QoQ to $225.9 million in Q4, driven by USDC growth, with international exchange customer balances more than doubling QoQ (settled in USDC).  For 2024, stablecoin revenue rose 31% YoY to $910 million. Coinbase noted that it facilitated more than $12 billion in on-chain payments in USDC, up 225% YoY. The segment has shown impressive growth, reaching nearly $1 billion in revenue in just two years.
  • Blockchain rewards revenue grew 126% YoY and 39% QoQ to $214.9 million in Q4, driven by “higher crypto asset prices, increases in average protocol reward rates (notably SOL), and continued native unit inflows.” For 2024, blockchain rewards revenue increased 113% YoY to $706 million.
  • Interest and finance fee income rose 34% YoY and 3% QoQ to $64.7 million in Q4, driven by Prime Financing, which saw all-time highs for loan balances after the election. For 2024, interest and finance fee income grew more than 42% YoY to $266 million.
  • Custodial fee revenue rose nearly 119% YoY and 36% QoQ to $43.1 million in Q4, fueled by higher crypto prices and growth in native units under custody. Coinbase noted that “BTC inflows were the largest driver of native unit growth, driven by our role as primary custodian for the vast majority of ETFs.” For 2024, custodial fee revenue rose 103% YoY to $142 million.
  • Other subscription and service revenue increased 46% YoY and 56% QoQ to $91.4 million, driven primarily by Coinbase One, with subscriber growth each quarter, accelerating in Q4. One subscribers surpassed 600,000 in Q4, marking 50% growth from Q1. For 2024, other subscription and service revenue rose nearly 125% YoY to $283 million.

Margins

Operating margin showed strong growth on both a sequential and YoY basis, up more than 31 points from last quarter and 33 points from last Q4 to 45.5%. Operating margin nearly matched Q1’s level at 46.4%.

Coinbase operating margin expanded to 45.5% in Q4 2024

Net margin was 56.8% in Q4 as Coinbase reported $1.29 billion in net income, impacted by “$476 million in pre-tax gains on our crypto asset investment portfolio, the vast majority of which were unrealized.” Pre-tax gains were $357 million when reflecting tax impacts. This was a significant QoQ increase from a 6.3% net margin in Q3, and nearly double Q4 2023’s net margin of 28.9%.

Stock-based compensation was $222 million, or 9.8% of revenue, declining (11%) QoQ. For Q1, Coinbase guided for SBC to be approximately $206 million.

EPS and Adjusted EBITDA

Coinbase places an emphasis on adjusted EBITDA due to crypto asset holdings, reporting its highest adjusted EBITDA quarter of the year in Q4 at $1.29 billion versus $1.01 billion in Q1. Adjusted EBITDA margin was 56.8% in Q4, up from 37.2% in Q3 but down from 61.9% in Q1 due to higher revenue.

For 2024, adjusted EBITDA was $3.35 billion in 2024, rising more than 242% YoY. Adjusted EBITDA margin expanded from 31.5% in 2023 to 51.0% in 2024.

Coinbase posted a rather huge EPS beat in Q4, with diluted GAAP EPS of $4.68 coming in at more than double the $2.04 estimate. This also surpassed the $4.40 in GAAP EPS that Coinbase generated in Q1. One primary takeaway here is that strong spot market conditions and elevated volatility are exponentially beneficial to Coinbase’s earnings generation and growth – Q1 and Q4 accounted for nearly 96% of 2024’s EPS generation.

Cash and Balance Sheet

Operating cash flow remained strong in Q4, rising more than 38% QoQ to $964.6 million. This also marked substantial growth from negative operating cash flow of ($5.2 million) in the year ago quarter. OCF margin was 42.5% in Q4. For 2024, operating cash flow rose 169% YoY to $2.56 billion, with OCF margin expanding from 29.7% to 39.0%.

Cash and equivalents totaled $8.54 billion, while debt remained steady at $4.23 billion. Coinbase is continuing to grow its cash reserves at a quick rate – cash is up almost 11% QoQ and 66% YoY, from $5.14 billion in Q4 2023.

This is quite different than Robinhood, where cash reserves have been flat at $5.1 billion since Q2 2024, and down from $5.3 billion a year ago. Cash and equivalents account for approximately 20% of Robinhood’s total assets, versus 38% for Coinbase.

Q1 Outlook

Coinbase provided a snapshot of transaction revenue for Q1 to date, noting that through February 11, transaction revenue was approximately $750 million. Coinbase cautions not to extrapolate this for the quarter as volatility and asset prices could change on a whim and quickly alter the path of revenue generation, but data from The Block supports a strong quarter of growth, with Coinbase gaining some share.

Monthly exchange volume was estimated to decline approximately (21%) MoM to $2.32 trillion in January, with Coinbase’s volume estimated to decline just (17%) MoM to $159 billion. Through February 14, Coinbase is estimated to have seen trading volume of $64.5 billion, with total exchange volume at $943 billion.

As a percentage of monthly exchange volume, Coinbase’s share rose from 6.5% in December to nearly 6.9% in January and 6.8% in February; both this and the relative outperformance on volume support management’s commentary that they are gaining share.

So far, halfway through Q1, Coinbase’s trading volume is at nearly $224 billion, versus Q1 2024’s $256 billion. Volumes so far are keeping pace with Q4, though this could change quickly.

Earnings Call Q&A

Management discussed the longer-term vision for crypto to fully evolve into an asset with significant daily usage across the world. CEO Brian Armstrong explained Coinbase thinks “crypto is much, much more than just an asset class that people want to trade. There's going to be daily use cases for everybody in the world as crypto updates the global financial system,” touching upon some opportunities in payments and tokenizing securities.

Stablecoin Growth, Revenue Diversification and USDC

Coinbase noted that it diversified its revenue streams during Q4, with growth in derivatives, stablecoins, USDC, staking and other products.

Management shared some interesting stats on stablecoins in the Q&A portion of the call, saying that “there was $30 trillion of crypto stablecoin volume last year. That was up 3x year over year.” CEO Brian Armstrong discussed that for stablecoins, Coinbase believes it can fuel more growth “just driving more partnerships with global and local players like Stripe and Yellow Card to do more global adoption. We've been adding a number of additional stable coin trading pairs on our platform. We've been offering rewards to our customers when they hold USDC,” and these efforts have helped drive stablecoin adoption and revenue in 2024.

Management sees stablecoin payments as a large opportunity in the future, saying that “we're moving with haste to integrate crypto payments across our entire suite of products. We think that'll be a big business over time.”

For USDC, management explained that they “have a stretch goal to make USDC the number one dollar stablecoin,” as it “has a network effect behind it” and could be “really defensible long term. So we'll be accelerating the market cap growth of USDC with more partnerships and leaning into new use cases like adding payment support across our product suite.”

International revenue is improving as well, with management explaining that “international revenue share reached 19% in Q4. And this is due to improved payment rails and localization. We've got a repeatable playbook now that we can launch in these new markets and get them to contribution margin positive. And so we're going to keep doing that in more markets.”

Derivatives Growth

Given that management pointed out that global derivatives reached an all-time high in Q4, they fielded questions about take rates long-term:

Q: Devin Ryan, Citizens JPM: A question on international derivatives. Obviously, just gaining kind of massive traction there and another great quarter of growth. Seems like the fees there are quite a bit lower, obviously. And so also appreciate that might make sense as you're taking share at this type of rate. But I'm curious as you think about take rates in derivatives kind of longer term, should we expect that they would kind of hold the line with where they are now? Or could there be an opportunity to actually increase the take rates as you get to kind of a more mature share?

A: Alesia Haas, Coinbase CFO

“So right now we're focused on building liquidity and building trading volume. And we are providing incentives to various market participants and focus on building that depth of liquidity in each of the order books as we put them on the platform. So, yes, I do believe that over time our fees will evolve and become more mature as we gain this to the scale and market position that we seek to have. And that right now we are not focused on monetizing at the top of the range.

That said, we're going to monetize this competitive with the market. And this is a lower priced product than spot trading. And so you can see us be in a competitive market position here, but not at the current levels that we are today.”

Coinbase is hinting at a path to higher fees, but remaining at a lower take rate than spot trading, requiring more volume to generate the same amount of revenue.

Tokenizing Securities

Management also discussed the tokenization of securities, where they see the potential for a wide range of real-world assets to be brought on-chain with real-time clearing, settlement, and ability to trade 24/7 across the globe.

Q: John Todaro, Needham:

“I have a broader question about the overall vision for Coinbase to maybe become something a lot bigger than a crypto brokerage. The two areas I see are stablecoins and the tokenized real-world assets, which you've discussed some, you could see a world where a lot of that transfer activity ultimately happens on Base. So one, just do you agree with that vision? And then two, is there anything more specifically you guys can do to push both of those segments?”

A: Brian Armstrong, Coinbase CEO:

“Well, that is definitely the plan. … And tokenizing real-world assets or traditional securities. I mean eventually, real estate, the debt markets like private credit, everything should come on chain. It's really just a more efficient way of transferring value and it can do real-time settlement and eliminate various risks that are out there in the ecosystem. So I mean, there's lots that we can do on this front.”

Crypto and Global GDP

Coinbase also shared a long-term vision for the crypto industry, predicting that “up to 10% of global GDP could be running on crypto rails by the end of this decade.” Management noted that “only about half of 1% of global GDP is [currently] running on crypto rails, but we think that, that could expand dramatically by the end of the decade.”

Based on global GDP of ~$105 trillion in 2023, that correlates with about $500 billion of GDP running on crypto. By 2030, global GDP is estimated to rise to $140 trillion, per the IMF, suggesting that crypto’s influence could rise to $10 trillion to $14 trillion should this prediction be realized – that’s more than 20x growth from today for the industry.

Conclusion

Coinbase posted a large beat in Q4 as elevated trading activity and higher volatility drove triple-digit transaction revenue and trading volume growth. Management highlighted revenue diversification with stablecoin and USDC contributions rising, with blockchain rewards and international markets two other growth outlets. Q1 is also off to a solid start with trading volumes keeping pace with Q4, with transaction revenue at $750 million halfway through the quarter, setting the stage for a strong entrance to 2025.

I/O Fund Equity Analyst Damien Robbins contributed to this report.

Please note: The I/O Fund conducts research and draws conclusions for the Fund’s positions. We then share that information with our readers. This is not a guarantee of a stock’s performance. Please consult your personal financial advisor before buying any stock in the companies mentioned in this analysis.

Recommended Reading:

Encouraging Growth in Key Metrics Drives 60% Gain YTD for Cloudflare Stock

Cloudflare’s stock rose 20% in the days following Q4 earnings with strong momentum for its Workers AI platform and accelerations in multiple key metrics, paving the way for the stock to potentially reaccelerate revenue growth while driving a shift to GAAP profitability. Management also expressed a high degree of optimism for AI inference and growth opportunities through 2025, especially for its Workers AI platform.

I break down the growth in the most important key metrics, Workers AI momentum, and commentary about AI opportunities below.

Workers Developers Grew from 2 Million to 3 Million in 2024

Cloudflare has quietly amassed a large developer base with tens of millions of developers, allowing for a rather frictionless ramp for its Workers AI platform, with 2024 seeing the platform record more than 50% growth. Workers AI positions Cloudflare to capitalize on the growing AI inference market via its unique approach that offers performance at or exceeding hyperscalers’ at a lower cost.

In Q4, management noted that active Workers developers crossed 3 million, marking a 50% growth from 2 million active developers in Q1 and 25% growth from 2.4 million developers in Q2. Since November 2023, active Workers developers have risen more than 200%.

The Workers platform essentially is Cloudflare’s moat, and what separates it from the rest of software in terms of what it can provide for AI. With Workers, Cloudflare eliminates cold starts, allowing code to be executed the moment it is received – we had explained to our premium members in 2023 that it is a “combination of competing with the hyperscalers, delivering app performance at faster speeds — while keeping prices low — that is unique to Cloudflare,” and what will help the platform drive growth down the road.

Management hammered home the significance of Workers in Q4’s earnings call, emphasizing that the “killer application for Cloudflare Workers is turning out to be AI. The model of programming is uniquely suited for building tools like AI agents, and our serverless architecture, which allows you to pay only for what you use based on CPU or GPU type, positions Workers to become the go-to platform for developers who want the best price performance for AI inference and agentic workflows.”

Cloudflare is now capitalizing on the developer moat that it has built with Workers over the past few years, as developers continue to choose the platform due to the unparalleled efficiencies and cost advantages it can offer when it comes to AI inference. Customers executing inference tasks could pay up to 250% more with hyperscalers than with Cloudflare’s pay-per-use model, per management.

Workers also saw significant deal momentum in the fourth quarter. Cloudflare reported its largest customer win in Q4, a $20 million contract with a Fortune 1000 tech firm, that includes Workers and application security, while a leading AI firm expanded with a $13.5 million deal for services including Workers, R2, and more.

What could easily be overlooked (and what arguably is very important) was management’s discussion on GPU utilization rates. Management explained that while a typical customer at a hyperscaler “is seeing sub-10% utilization across their GPUs, our peak utilization of GPUs is now around 70%,” though troughs are much lower with room to improve in 2025. What this means is that Cloudflare “can get effectively 7 times today the amount of work out of $1 of CapEx spent,” allowing them to capture the excess either in margins or pass it on to customers via lower costs. Improving troughs in utilization should theoretically lead to faster processing times and an ability to handle more requests for customers, all while doing so for cheaper and at a higher margin.

Multiple Key Metrics Support Confidence in Cloudflare’s Revenue Reacceleration

Though Workers growth and commentary on improving GPU utilization rates were quiet drivers of the report, multiple key metrics showed growth in Q4, supporting management’s confidence that the first half of 2025 would mark a turning point with the strength of its business accelerating in the second half.

Cloudflare guided for 23.7% growth in Q1 to $468-469 million in revenue, and that is currently forecast to be the bottom for the year, with revenue expected to reaccelerate to the 27% level exiting the year. All it would take is a few beat-and-raise quarters to put Cloudflare on track to surpass the 30% growth level by the end of 2025.

Cloudflare stock revenue is expected to reaccelerate through 2025 to 27%

Revenue growth is forecast to decelerate to 23.7% in Q1 before accelerating to 27% by year-end.

Multiple key metrics showed strong growth in Q4, with a handful of analysts praising the productivity strides and strong execution on these key metrics in the quarter:

  • Acceleration in growth in >$1M customers
  • High concentration of net new adds for >$1M customers in Q4
  • Acceleration in paying customers
  • Acceleration in billings and strong Pool of Funds activity
  • DBNRR expanding

The I/O Fund first covered Cloudflare’s AI inference story for premium members in October 2023, recently closing the position for a gain of 97% and making multiple purchases in small and mid-cap AI beneficiaries. Learn more here.here.

Cloudflare’s Paying Customer Growth Accelerates

Cloudflare reported 173 customers in the >$1M cohort at the end of 2024, for 47% YoY growth, up from 37% growth last year. Management noted that of the 55 of the net new adds in 2024, more than half came in Q4, implying at least 28 in the quarter, and 27 combined for the other three quarters; a significant uptick.

Paying customers increased 25% YoY to 237,714 at the end of Q4, an 8-point acceleration from the start of the year. From late 2022 through 2023, growth had remained in the mid-teens, with the recent uptick in paying customers coming alongside growth in AI applications and more mainstream AI usage with numerous consumer-facing and enterprise-focused models being released. What’s impressive is that Cloudflare is matching 2022 growth rates at a nearly 100,000 larger paying customer scale. Additionally, 2 of the past 3 quarters have seen paying customers grow at 7% QoQ, suggesting that a further acceleration could be still in store.

Cloudflare stock paying customer growth has accelerated to 25% YoY in Q4 2024

Paying customers growth accelerated to 25% in Q4 to 237,714 forecasting strong fundamentals for Cloudflare’s stock

Cloudflare’s Billings Growth Tops 30% Again

Billings meaningfully inflected in Q4, rising nearly 32% YoY and 22% QoQ to $548 million. Growth had previously been in the low-20% range for the first three quarters of 2024. Billings likely benefited from a “notable uptick in close rates” and “an improvement in sales cycles,” with management mentioning that the majority of large customers “whose deals had slipped from Q3, reengaged and signed significant contracts in Q4.”

Cloudflare stock billings growth has accelerated to 31% in Q4

Cloudflare’s billings growth accelerated nearly 8 points to 32% YoY in Q4.

Pool of Funds activity was quite strong as well, with activity comparable to Q3 at around 9 percentage points; management noted that a $20 million Pool of Funds contract with a Fortune 100 tech company was the largest new customer win in company history, along with a $13.5 million deal with a leading AI firm. Pool of Funds is expected to pick up strength in the second half of the year after leading to some near-term headwinds as customers transition to these contracts.

There were other encouraging signs within ramped account executives, with management saying that they “delivered a 10 percentage point increase in ramped AEs achieving over 80% of quota compared with 2023, with most gains coming in the 125% or higher attainment cohorts.” For 2025, management is expecting YoY growth in ramped account executives to “accelerate each quarter throughout 2025, further laying the foundation for Cloudflare's next phase of growth at scale.”

DBNRR Ticks Higher to 111%

Cloudflare reported that its dollar-based net retention rate (DBNRR) ticked 1 point higher to 111%, marking the first time the metric has grown since Q3 2023. Management commented that “there can be some variability in this metric quarter-to-quarter, but we believe the recent decelerating trend in DNR is stabilizing despite continued near-term headwinds from increased traction with pool of fund contracts.”

Graph of Cloudflare stock DBNRR each quarter in 2023 and 2024

Cloudflare’s DBNRR grew for the first time since Q3 2023 to 111%.

Cloudflare’s GPU Investments Rising

With the accelerations in billings, paying customers and strong net adds in its largest customer cohort, Cloudflare laid the foundation for increased investments to support growth through 2025. While this is likely to be slightly detrimental to margins, with management guided for an adjusted operating margin of 11.6% in Q1 versus 14.6% in Q2, it paves the way for Cloudflare to meet higher demand and reinvigorate revenue growth.

Sign up for I/O Fund's free newsletter with gains of up to 2600% because of Nvidia's epic run – Click hereSign up for I/O Fund's free newsletter with gains of up to 2600% because of Nvidia's epic run – Click hereClick here

Management said that the “accelerating shift from AI training to AI inference has given us confidence to continue to increase our investment in our GPU rollout as we provision greater capacity to support demand in 2025.” As a result, network capex is expected to be 12-13% of revenue in 2025, up from 10% in 2024.

As has been the case with hyperscalers, who had been quite vocal over the past few quarters that demand regularly outpaced GPU supply, Cloudflare signaled that its investments in GPU capacity would go towards supporting higher demand as workloads shift towards AI inference.

Cloudflare is Inching Closer to GAAP Profitability

Breaking into GAAP profitability on the bottom line is a ‘holy grail’ for cloud stocks, in part due to high SBC levels that push operating expenses above 100% of revenue. Cloudflare is inching closer to reaching GAAP profitability on the bottom, though GAAP operating income is a bit further away.

Cloudflare reported a GAAP operating loss of ($34.7 million), or a GAAP operating margin of -7.5% in Q4. Though this declined slightly from -7.2% in Q3 due to some headwinds to gross margin, it marked a 7 point improvement from the -14.4% operating margin in Q1.

Cloudflare is showing prudent cost management, bringing expenses down from 92% of revenue in Q1 to below 84% of revenue in Q4. R&D expenses ticked slightly higher sequentially in Q4, understandable given the investments Cloudflare is making in its network, while marketing expenses declined 1.4 points to 41.7% of revenue.

GAAP net margin is making strides towards positive territory, with Cloudflare benefitting from net interest income and improvements to operating margin. GAAP net margin improved from -9.4% in Q1 to -2.8% in Q4, or a loss of just ($12.8 million). This improvement comes despite SBC remaining elevated at just above 20% of revenue.

Cloudflare is currently not expected to break into GAAP profitability this year, with analysts expecting a loss each quarter of 2025. However, the improvements in operating margin from cost management efforts and a potential revenue reacceleration could shift that story. Other best of breed cloud names such as CrowdStrike and DataDog have seen strong returns after breaking into GAAP profitability on the bottom line.

Cloudflare’s Valuation Looks Elevated

Even though management is quite confident in the AI inference growth opportunities in 2025, there’s not yet tangible evidence of a reacceleration on the top-line, and Cloudflare is trading at its highest valuation in more than two years. Key metrics are showing underlying signs that support revenue reaccelerating, but the valuation amplifies risks to the downside until the acceleration story materializes.

On the top-line, Cloudflare is trading at its highest valuations since May 2022, at 28x forward revenue, above where it had previously found resistance at 22x to 23x forward revenue. This makes it one of the most expensive cloud stocks aside from Palantir, trading at a near 100% premium to DataDog and Snowflake despite all three reporting revenue growth in the high 26% to 28% range for the most recent quarter.

Graph of Cloudflare, Snowflake, Palantir and DataDog price to forward revenue valuation multiple

Source: YChartsYCharts

On a free cash flow basis, Cloudflare is the most expensive of the four here, trading at 350x free cash flow versus 250x for Palantir and 75x to 77x for Snowflake and DataDog. Free cash flow has hovered at ~10% of revenue for 2024, below Snowflake at 20% through fiscal Q3 and DataDog at 29% for 2024 due to Cloudflare’s much higher investments in its infrastructure – Cloudflare spent $185 million in 2024, versus $35 million for DataDog in 2024 and $34 million for Snowflake (through Q3).

Graph of Cloudflare, Snowflake, Palantir and DataDog price to free cash flow valuation multiple

Source: YChartsYCharts

For adjusted EPS, Cloudflare is valued at 217x forward earnings of $0.80, versus 210x for Palantir and 186x for Snowflake. This is a significant re-rating in a short period of time, with Cloudflare being valued at half of this multiple in October, at 105x forward earnings. Adjusted earnings growth is also expected to be minimal in 2025, with management guiding for barely 6% growth to $0.79 to $0.80 this year.

Graph of Cloudflare, Snowflake, Palantir and DataDog price to adjusted EPS valuation multiple

Source: YChartsYCharts

Conclusion

The Workers platform exhibited strong momentum through 2024 with active developers rising 50% to surpass 3 million, widening Cloudflare’s developer moat as it aims to harness growth in AI via its positioning at the edge and ability to offer high-performance, low-cost inference. A handful of key metrics inflected and accelerated in unison in Q4, a positive sign for growth heading into 2025.

Cloudflare’s management expressed confidence for 2025 on AI inference driven opportunities, with multiple key metrics suggesting that a revenue reacceleration could be in store. Given the soft Q1 and fiscal 2025 guide and elevated valuation, Cloudflare is in a spot where it has to prove that it can meaningfully inflect revenue growth based on the underlying strength in large customer deals, billings, and customer growth. We think the stock will prove this; yet we also book gains at specific price levels to reduce risk.

The I/O Fund recently entered five new small and mid-cap positions that we believe will be beneficiaries of increased AI spending after Big Tech projected capex of $320B+ for 2025. Advanced members received real-time trade alerts for each trade with entries and exits discussed Thursdays at 4:30 p.m. EST in our weekly webinars. Take advantage of our limited-time promotion for $50 off monthly Advanced plans – learn more herehere.

Damien Robbins, Equity Analyst for the I/O Fund, contributed to this analysis.

Please note: The I/O Fund conducts research and draws conclusions for the Fund’s positions. We then share that information with our readers. This is not a guarantee of a stock’s performance. Please consult your personal financial advisor before buying any stock in the companies mentioned in this analysis.

Recommended Reading: