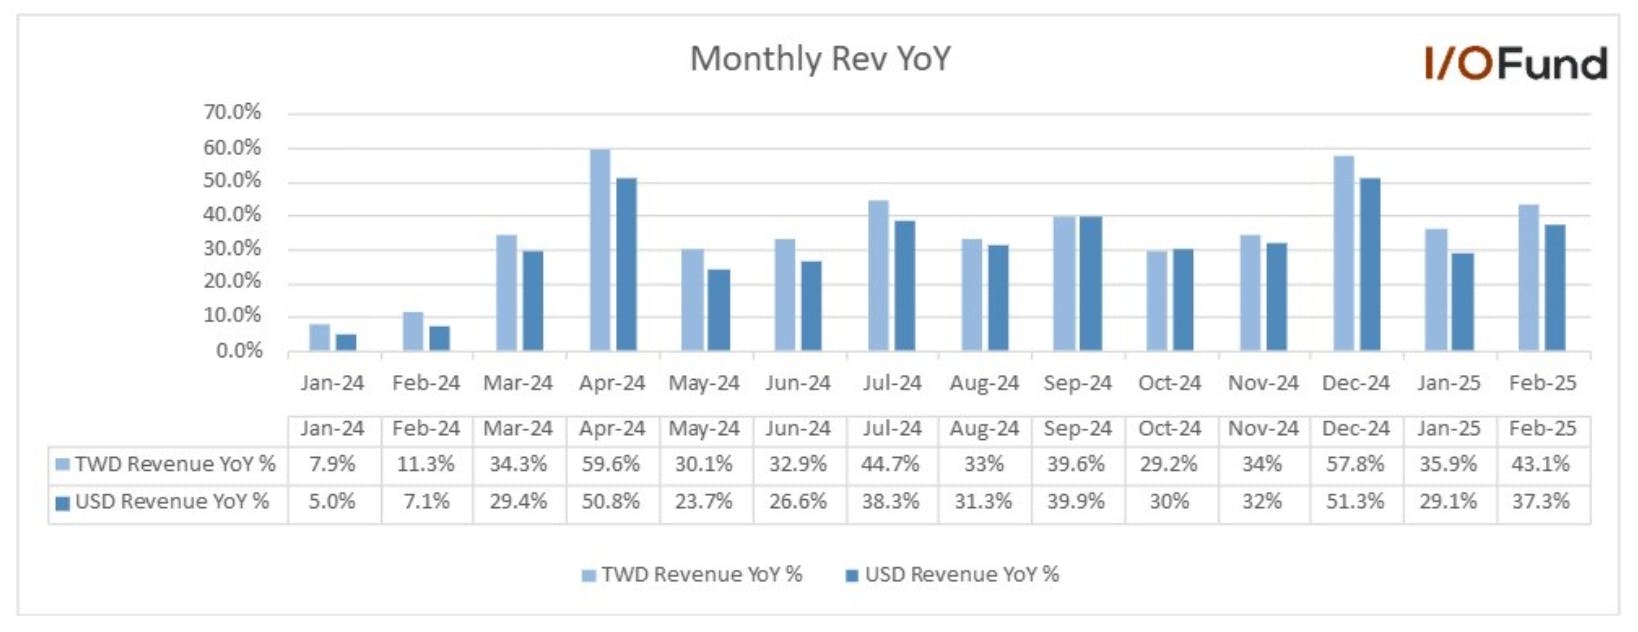
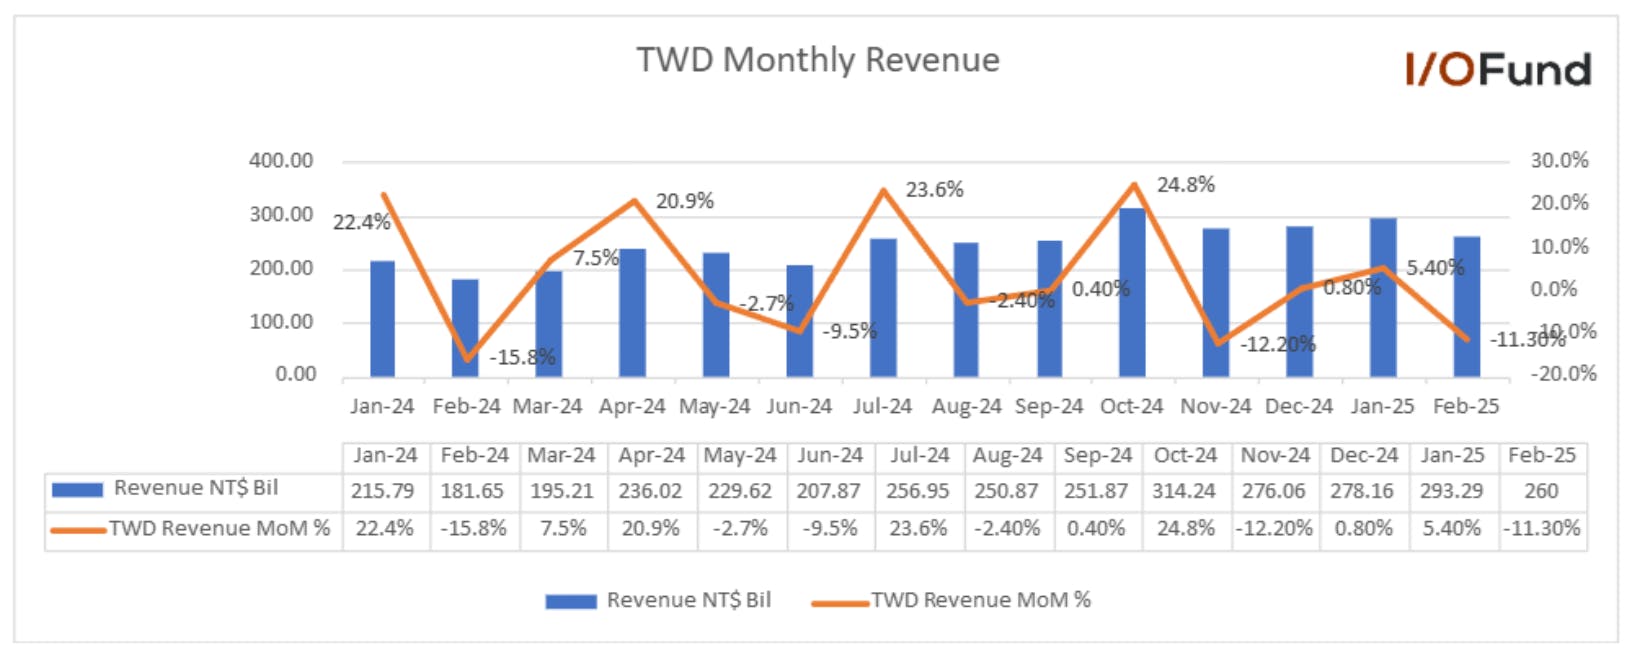
TSMC released its monthly revenue for February on March 10th. Revenue grew by 43.1% YoY and down (-11.3%) MoM to NT$260.01 billion. February 2025 revenue was the new high for the month. In U.S. dollar terms revenue grew by 37.3% YoY to $7.93 billion using the average exchange rate of 1 US dollar to 32.78 NT dollars. This strong performance, coupled with Foxconn's impressive 56.4% year-over-year monthly revenue growth in February, suggests robust and sustained demand for AI.
A closer look at TSMC's monthly revenue reveals that month-over-month figures can be volatile. The February decline is likely attributable to seasonal factors, such as the Lunar New Year holidays and fewer working days. For context, February 2024 also saw a MoM revenue decrease of (-15.8%). This suggests that the recent month-over-month decline is not unusual and should be considered within the context of seasonal trends.
The management had provided an update last month that they expect the Q1 revenue to be near the lower end of the guidance range of $25 billion and $25.8 billion due to the Taiwan earthquake in January. Importantly, TSMC maintains its strong outlook for the full year 2025, anticipating revenue growth in the mid-20% range in US dollar terms, driven by robust AI demand.
Sustained sequential HPC growth
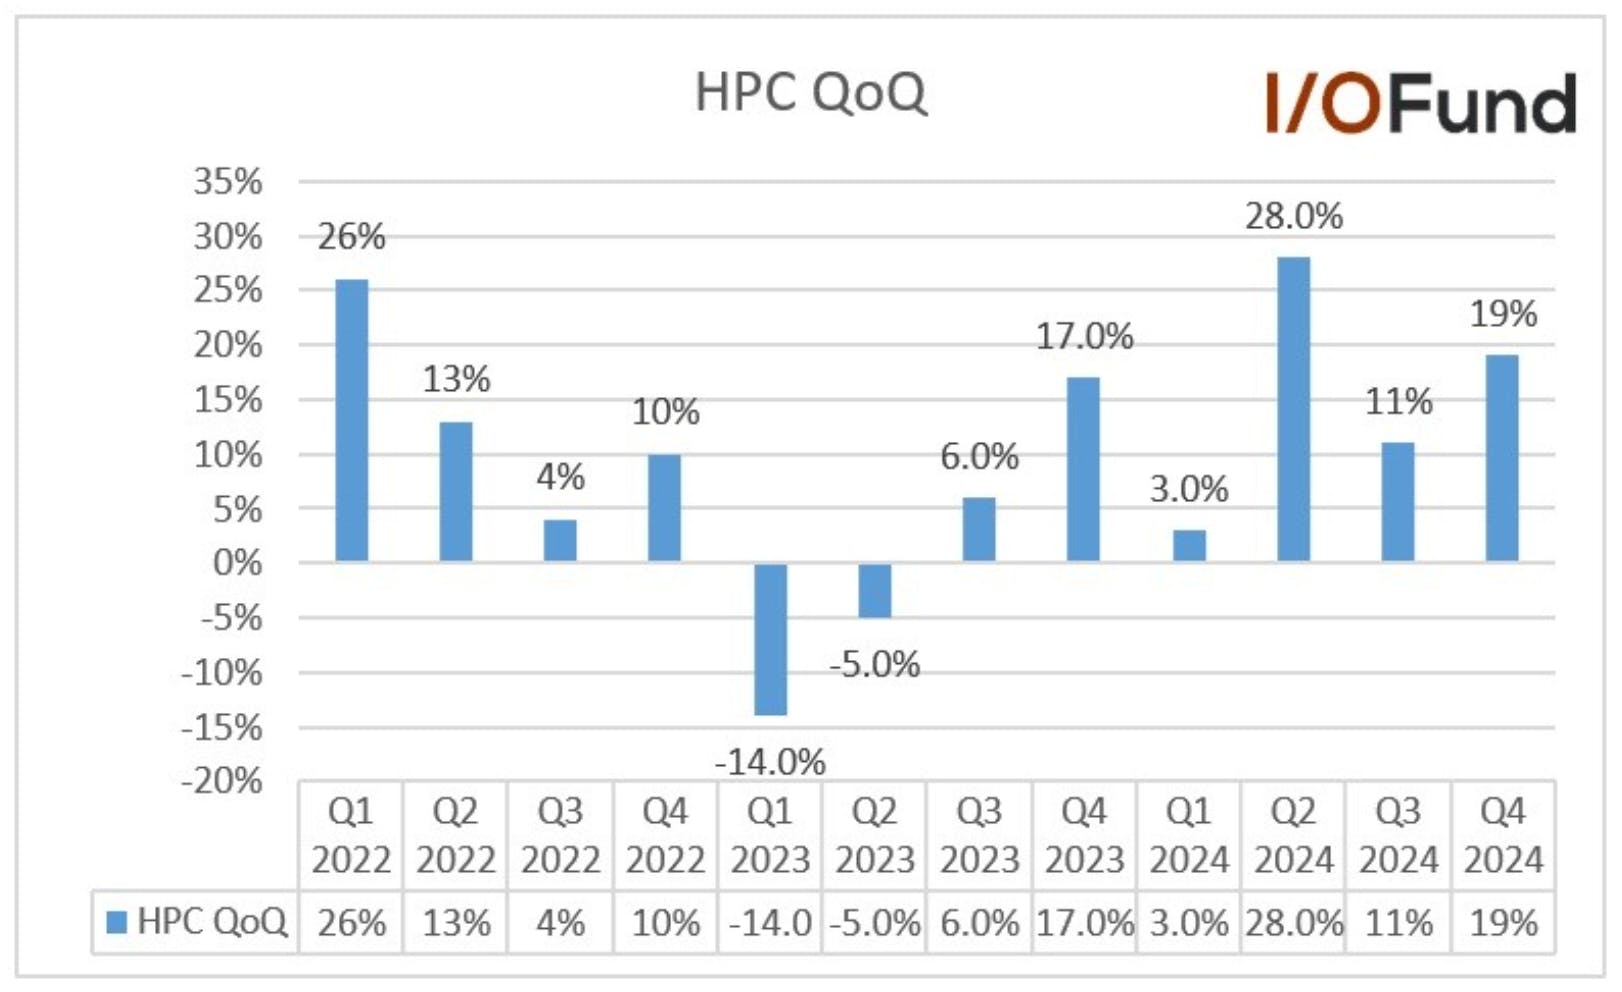
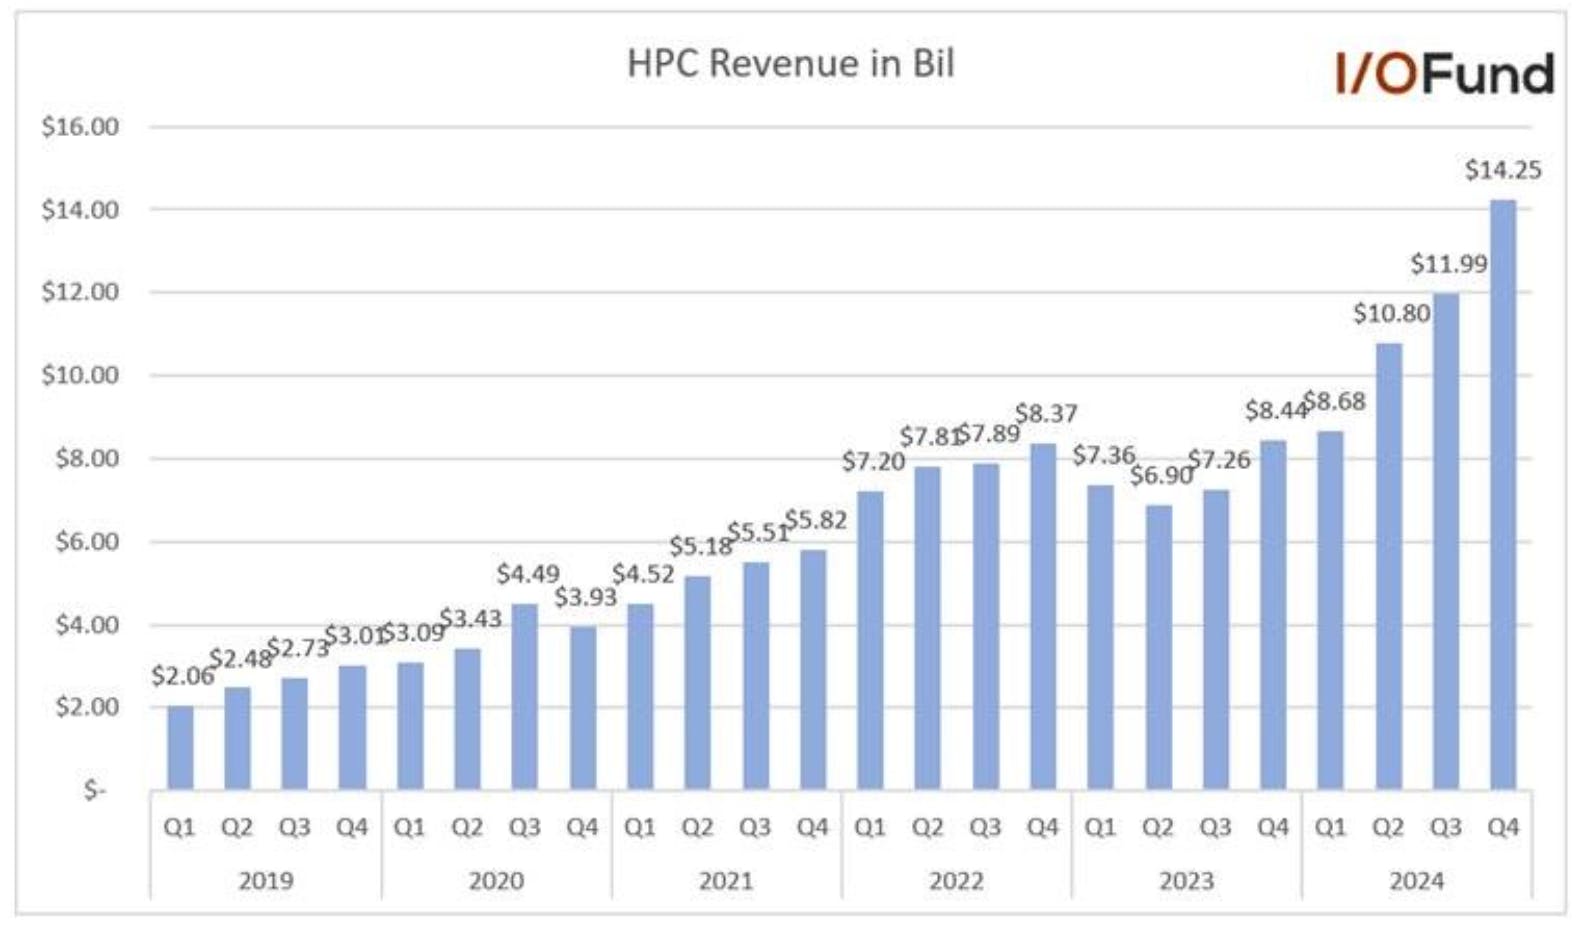
As the leading foundry for AI accelerators, TSMC is riding the enormous wave of demand from Big Tech. The chipmaker’s high-performance computing (HPC) revenues rose 19% QoQ to a record $14.25 billion and accounted for 53% of revenue in Q4, surpassing the 50% mark for the third time. The sequential HPC growth for the six consecutive quarters is a further testament that there is no AI demand slowdown and demonstrates sustained momentum in the AI sector. Management expects AI accelerators to be the strongest driver of the HPC platform growth in the next several years.
The above chart shows that TSMC’s HPC sequential revenue growth tells us that they're a few quarters ahead of Nvidia's bigger quarters like the 2022 sequential growth before the launch of Hopper Architecture.
TSMC is experiencing explosive growth in its AI segment, with revenue tripling in 2024. Management expects this remarkable growth to continue, projecting a further doubling of AI revenue in 2025.
Management expects AI accelerators to grow mid-40% CAGR for the next five years and expects AI accelerators to be the strongest driver of the HPC platform growth and the largest contributor in terms of the overall incremental revenue growth in the next several years.
The chart below further emphasizes the strength of TSMC's high-performance computing (HPC) segment, with revenue reaching a record $14.25 billion in the most recent quarter. This represents the largest sequential increase to date, surging by approximately $2.26 billion. This data underscores the significant growth trajectory of TSMC's HPC business, driven by robust demand for AI accelerators.
TSMC's Advanced Packaging in High Demand: NVIDIA Leads the Charge
TSMC also reported a surge in Advanced Packaging due to the strong demand for Nvidia’s Blackwell chips. NVIDIA has reportedly secured over 70% of TSMC's CoWoS-L capacity for 2025, with shipments expected to exceed 2 million units and grow by more than 20% each quarter, according to a report from Economic Daily News. The report also estimates that advanced packaging revenue accounted for approximately 8% of TSMC’s revenue in 2024 and is expected to exceed 10% in 2025.
TSMC, which is struggling to meet the strong demand for advanced packaging, plans to double production capacity this year to 75,000 wafers a month, according to a report from Taiwan Economic Daily. Furthermore, TSMC is projected to continue expanding CoWoS production in the coming year, reaching 90,000 wafers per month in 2026.
Please note: The I/O Fund conducts research and draws conclusions for the Fund’s positions. We then share that information with our readers. This is not a guarantee of a stock’s performance. Please consult your personal financial advisor before buying any stock in the companies mentioned in this analysis.
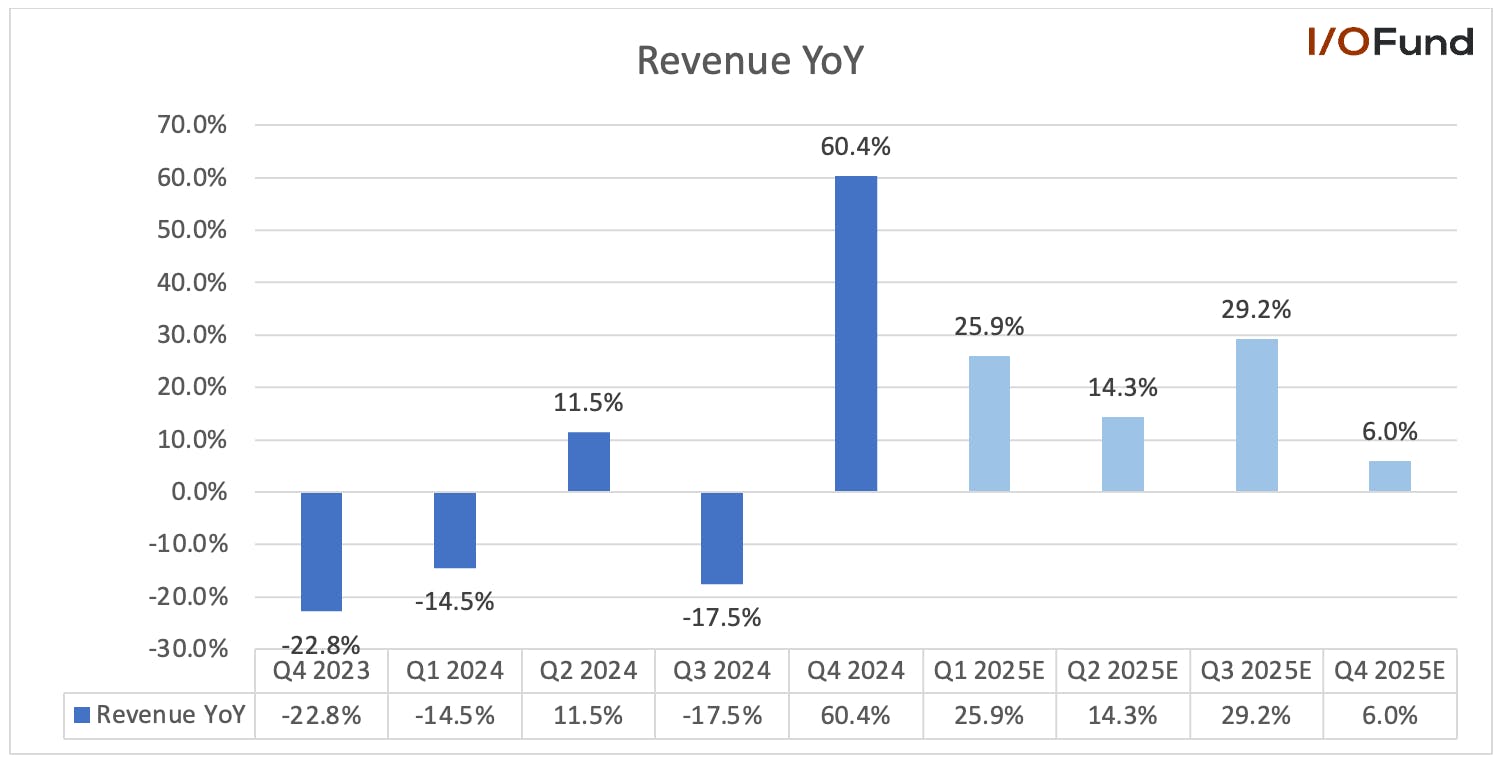
Bloom Energy delivered solid Q4 2024 results, culminating in a top-line beat of $64.85 million and a bottom-line beat of $0.12 per share. Revenue surged 60.4% YoY in Q4 to close out the year with positive free cash flow for the first time since 2019. Adjusted operating margin tripled from last year. 2024 laid out the foundation for deals and revenue to accelerate in 2025. Notably, the game-changer deal with AEP was a large driver for Q4.
With that said, energy-related stocks have lumpy revenue, lumpy margins and lumpy cash. Admittedly, fundamental analysis is challenging in this sector as there are often government subsidies to also consider, deal sizes can be enormous yet infrequent, and things change suddenly depending on macroeconomics. Like crypto, due to being absent of reliable fundamentals, technicals must be in the driver's seat for energy-related stocks, and investors should be prepared to have an active management stance.
The “Game Changer” AEP Deal up to 1 GW of Bloom Fuels Cells
According to Bloom, the company has key advantages by offering solid oxide fuel cells compared to other power solutions such as quick time to deployment, reliability, not needing backups, electrochemical (non-combustion) electricity generation, low to no carbon emissions and easy to obtain air permits.
The company also offers modular fault tolerant architecture, which we covered in the past stating: “BES uses core 325 kW base blocks customized to work in parallel with the local electric grid in standby or backup mode to kick in when the local power becomes unavailable. The 325 kW base blocks can be duplicated and scaled up to multiple MWs for any project. They can also be used as the primary power source. They can be used off-grid or parallel as a microgrid. BES has a high density compared to solar or wind of 100 MW per acre with features such as stackable servers and combined heat and power solutions. However, nuclear is in the kilowatts per acre, and therefore, is by far the highest density power solution.” Notably, Bloom Energy does not foresee nuclear being a true competitor until 2030: “I really don't think you're going to move the needle, between now and another eight years with nuclear.”
Due to these benefits, utility companies like AEP are contracting Bloom Energy to help serve the outsized power demands that AI data centers requires. We pointed out in our earlier coverage of Bloom Energy, the significant game-changer deal with American Electric Power (AEP) to “secure up to 1 GW of Bloom Energy SOFC for their data center customers and other larger energy users. AEP placed an order for the installation of 100 MW of fuel cells at customer sites, with further expansion orders expected in 2025.
AEP expects commercial load to grow 20% annually over the next three years, driven by data center development. The company is in the process of finalizing the first customer project agreements, and discussions are ongoing with several other customers. AEP’s hyperscaler customers include Google, Amazon, Microsoft and Meta Platforms.
AEP will purchase Solid Oxide Fuel Cells (SOFCs) from Bloom Energy with an initial order of 100 MW, with more expected in 2025, and integrate them into their customer energy systems, prioritizing AI data centers. Large customers will cover all costs for the fuel cell projects under a special contract. AEP will oversee deployment and installation at customer sites.
Bloom will supply the SOFCs to AEP, providing the core technology for on-site power generation. Bloom will likely offer ongoing support and maintenance services. “
AEP’s initial order of 100 MW at $3 per watt would equate to $300 million for the product hardware and $600 million of maintenance services over the following 20 years. The potential product sales for 1GW would equate to $3 billion with potential service revenues of $6 billion over 20 years. The potential total contract value of AEP’s 1 GW deal would be $9 billion over 20 years including products and services.
Bloom is in Talks with Other Utilities for Similar Deals to AEP
The company is using the AEP deal as a template for more deals with utility companies, who can provide Bloom’s solution for their customers. During the Q4 2024 conference call, Morgan Stanley analyst Andrew Percoco asked if they expect more deals like AEP’s with a large utility serving data center customers rather than directly to the data center.
CEO Shrider answered that Bloom Energy is not competing with the utilities but providing them with the ability to service their hyperscaler customers. He said this.
“This is KR and again on your first question, yes the answer is we are talking to several utilities who are interested in some kind of arrangements along the lines of what we announced with AEP. And it is A, they are realizing that no matter how fast they augment their transmission distribution system, no matter where generation happens or not, getting the power to the end customer, between now and 2030, is going to be a big issue unless you produce power where you need it.”
Revenue Rises to Record Levels in Q4 to Close Out a Record Full Year 2024
On Jan 12, 2025, the I/O Fund pointed out that Bloom Energy would need to have a big Q4 with revenue growing 67.8% YoY towards $598.5 million to achieve management’s mid-point guidance, which would imply a large chuck of product revenue being pushed out into Q4. Bloom Energy delivered close enough with 60.4% YoY revenue growth to $572.39 million, firmly beating the $507.54 million by $64.85M. The revenue spike was driven by collecting large receivables from their related party, SK ecoplant.
Q4 revenue grew by 60.4% YoY and 73.2% QoQ to $572.39 million, compared to the Q3 revenue drop of (17.5%) YoY and (1.6%) QoQ to $330.4 million. Nearly 40% of 2024 total revenue came in Q4. The Company received its large related party, SK ecoplant, receivable in the quarter. Bloom Energy also assisted them in selling a majority of the 73MW of energy servers they held as part of a delayed project.
Q4 revenue of $572.39507.54 million beat consensus estimates of $507.54 million by 12.78%, compared to Q3 revenue of $330.4 million, missing consensus estimates for $383.19 million by 13.78%.
Q4 Product and Service revenue surged 67.2% YoY to $525.5 million, compared to Q4 2023 Product and Service revenue of $314.4 million.
Full-year 2024 revenue rose 10.5% YoY to $1.474 billion. Product and Service revenues rose 12.1% YoY to $1.158 billion. Management provided full-year 2025 revenue guidance of $1.65 billion to $1.85 billion, midpoint is $1.75 billion for 19.1% YoY growth.
Key Metrics and Backlog
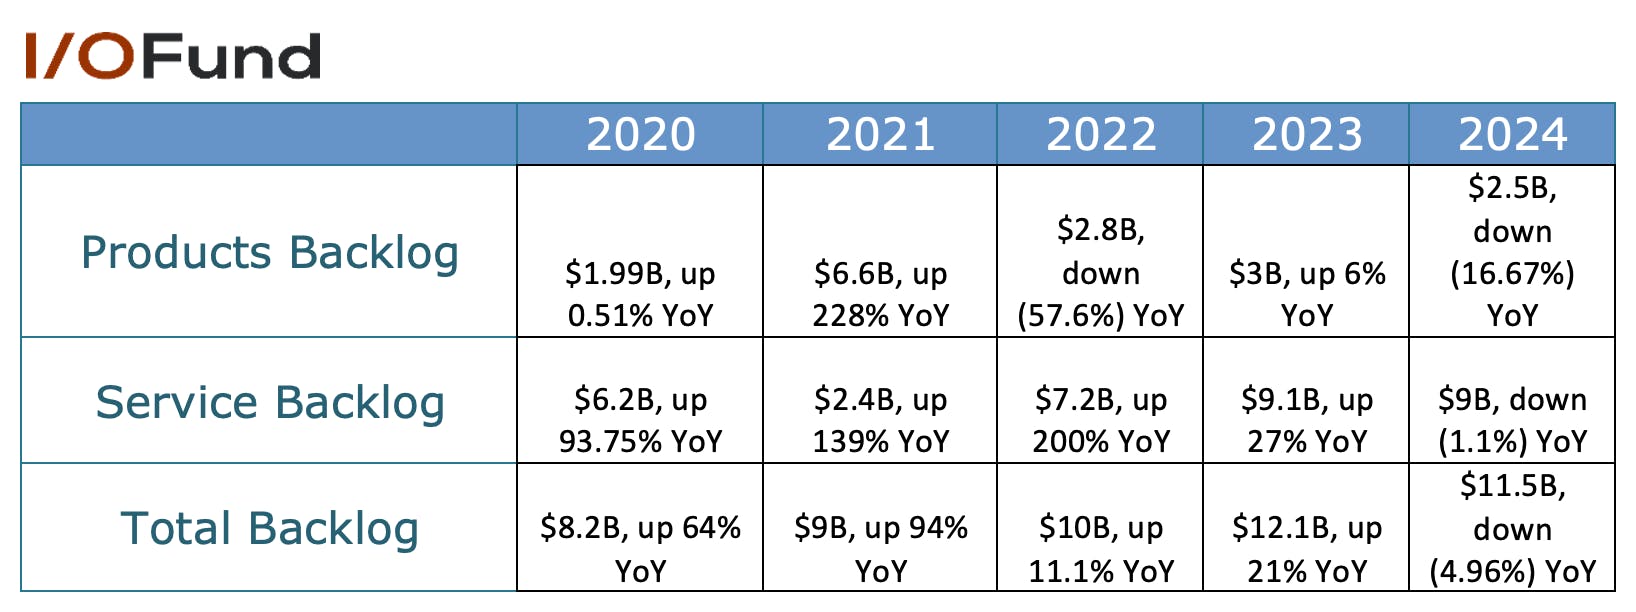
Bloom Energy closed out 2024 with a total backlog of $11.5B, down (4.96%) YoY, comprised of Product backlog of $2.5B, down (16.67%) YoY and Service backlog of $11.5B, down (4.96%) YoY. CFO Berenbaum pointed out that due to the supply agreement with SK ecoplant, the Product backlog would have been 30% higher, by $900 million, to $3.9 billion. This indicates the Company is seeing more demand for its products.
“We have $2.5 billion of product backlog. Excluding dynamics around our supply agreement with SK ecoplant, our product backlog would have been up roughly 30% year-over-year. As a reminder, at the end of 2023, we had extended the term of our SK ecoplant distribution agreement to the end of 2027, and increased their purchase commitment to 500 megawatts, all of which was included in our year ending 2023 backlog.”
Dropping Product and MW Accepted Metrics as of Q4
CFO Berenbaum noted on the Q4 2024 conference call that the Company is shifting focus away from earlier used metrics that measure kW shipped (IE: Products Accepted and MW Accepted).
Business has “evolved” as Product revenue is now recognized upon shipments, not acceptance as in the past based on grid-connected baseload power or timing of revenue recognition. The Company is now offering a broader range of solutions ranging from microgrids, carbon capture, AI data center solutions to combined heat and power systems, which provide more complex value to customers. Solutions go beyond just energy production and there the focus has shifted to traditional metrics like revenue growth, non-GAAP gross and operating margins, and cash flow from operations. Berenbaum said this.
“As we've discussed over the past few quarters, management is primarily focused on overall revenue, product revenue growth, non-GAAP gross and operating margin and cash flow from operations. In the past when we were primarily shipping grid connected, baseload power, and timing of product revenue recognition was somewhat divorced from timing of product shipments.”
Margins Consistently Expand in 2024
Q4 gross margin was 38.3%, up 47.8% YoY and 60.9% QoQ. This was an improvement over Q3 2024 gross margin of 23.8% versus gross margin of (1.3%) in Q3 2023. Gross margin improved on a sequential basis for Q3 gross margin improving 16.7% QoQ and Q2 gross margin improving 25.9% QoQ. Q1 gross margin fell by -37.4% QoQ from Q4 2023 gross margin of 25.9%. Management guided the full year 2025 non-GAAP gross margin around 29%.
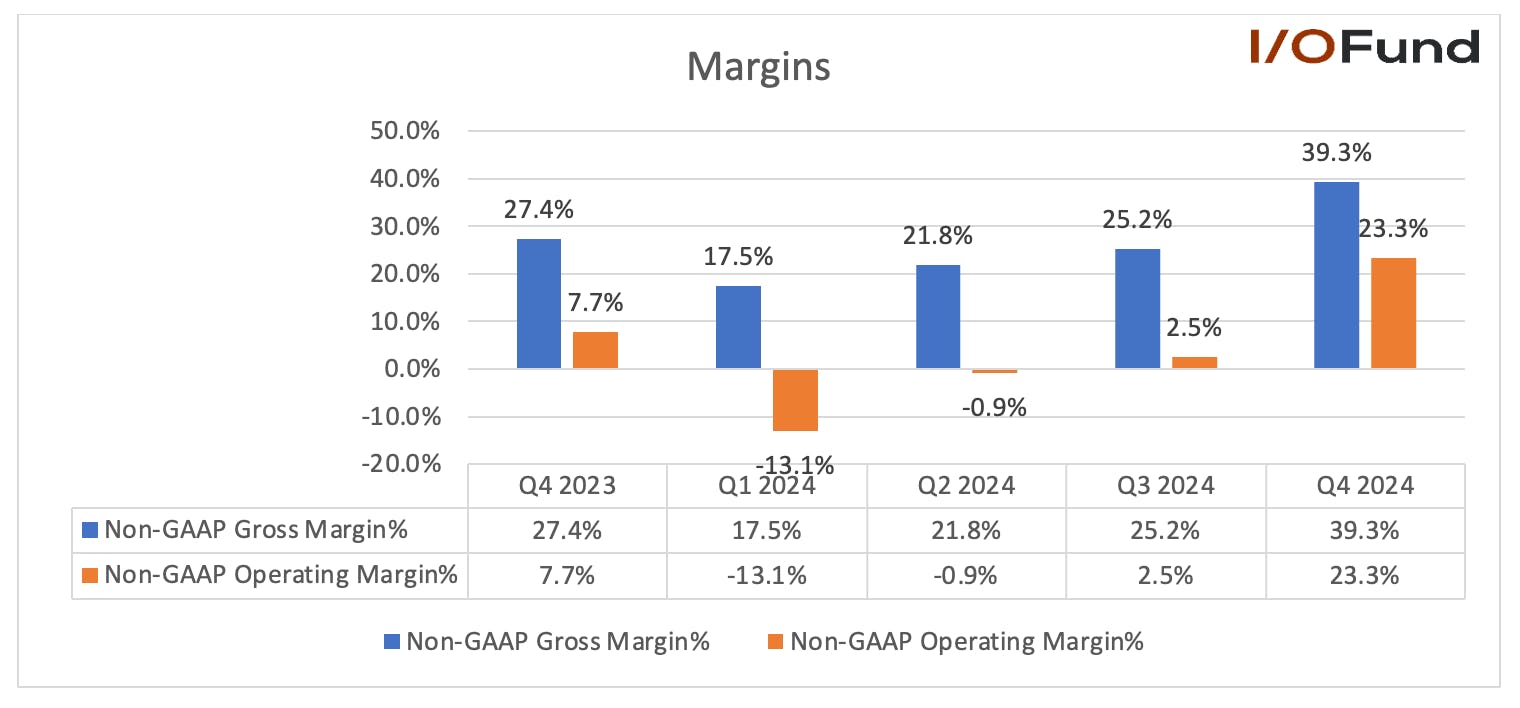
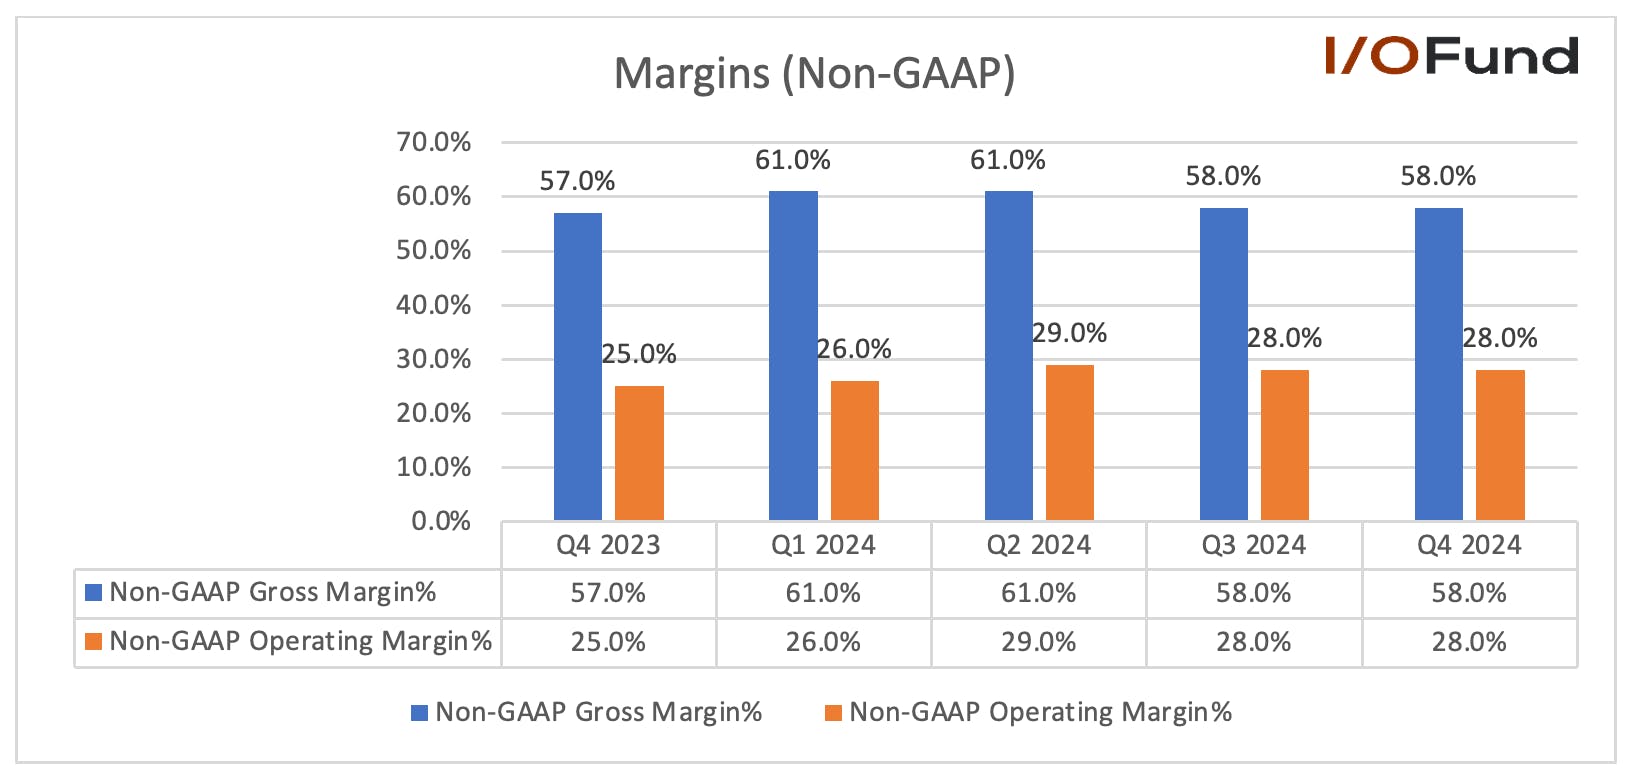
Non-GAAP gross margin rose to 39.3% in Q4, up 43.4% YoY and 14.1% QoQ. The operating margin turned positive to 18.3% in Q4, up from 3.6% YoY, and from (2.9%) in the previous quarter. Non-GAAP operating margin closed at a yearly high of 23.3%, compared to 7.7% in the year ago period and 2.5% in the previous period.
Bloom Energy drove another record year of double-digit core energy server product cost reduction, which benefits both Products and Services.
Non-GAAP EPS Rises Consecutively for the Fourth Quarter in 2024
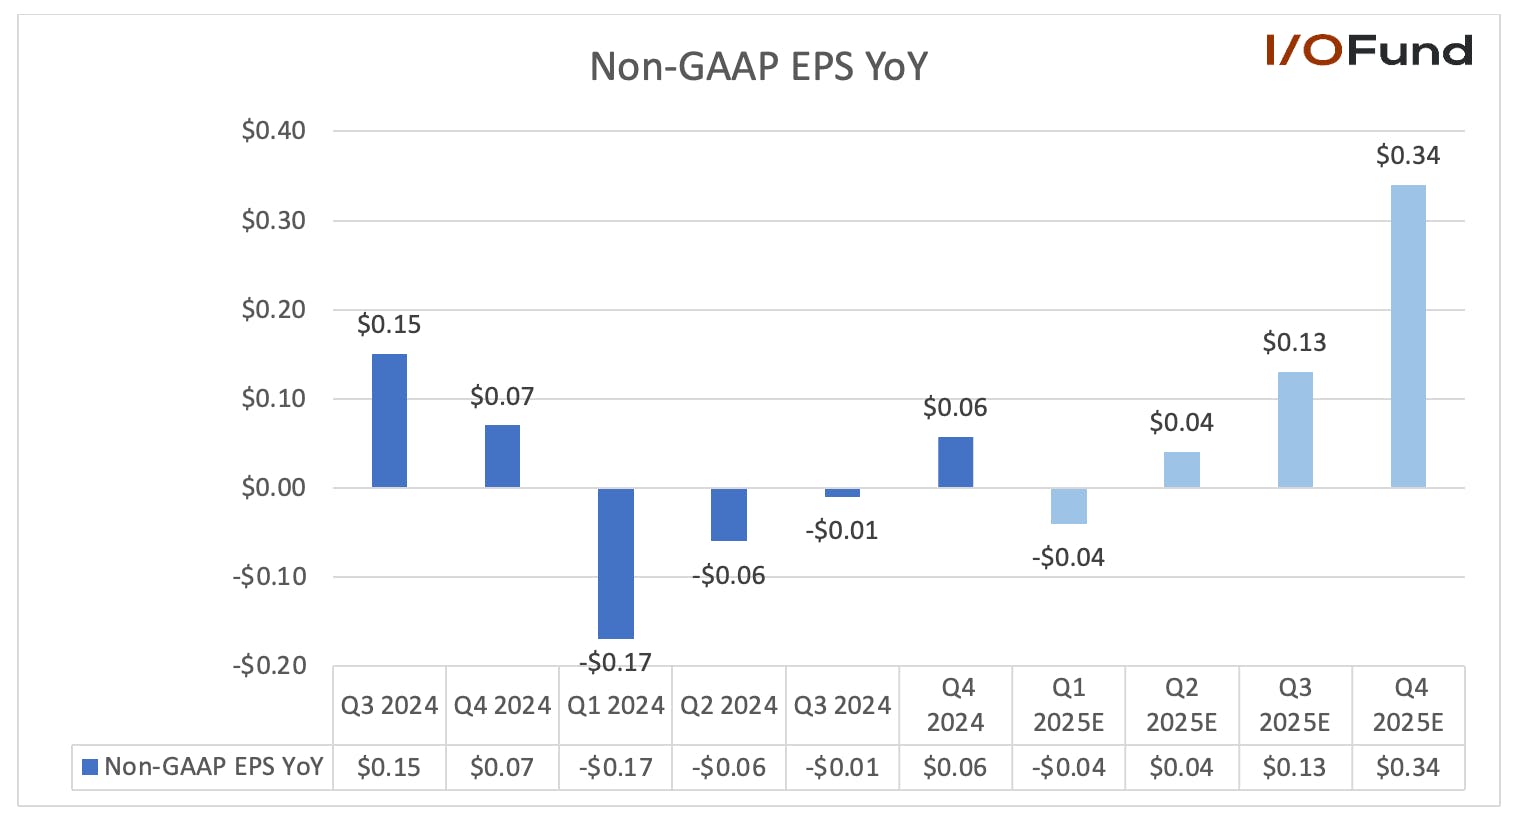
Q4 non-GAAP EPS was $0.43, beating consensus estimates for $0.31 by $0.12 or 38.7%, rising 514% YoY from $0.07. This was an improvement over Q3 GAAP EPS of a loss of ($0.01), which missed consensus estimates for a profit of $0.08 by ($0.09), and fell from $0.15 in the year ago period.
Management hinted that Q1 2025 EPS could be up approximately 20% to 30% YoY. For the full year 2024, EPS was calculated using the basic outstanding share count of 227 million, compared to the fully diluted share count of 294 million.
Cash Flows Surge in Q4 Driven by SK Ecoplant Receivables Collection
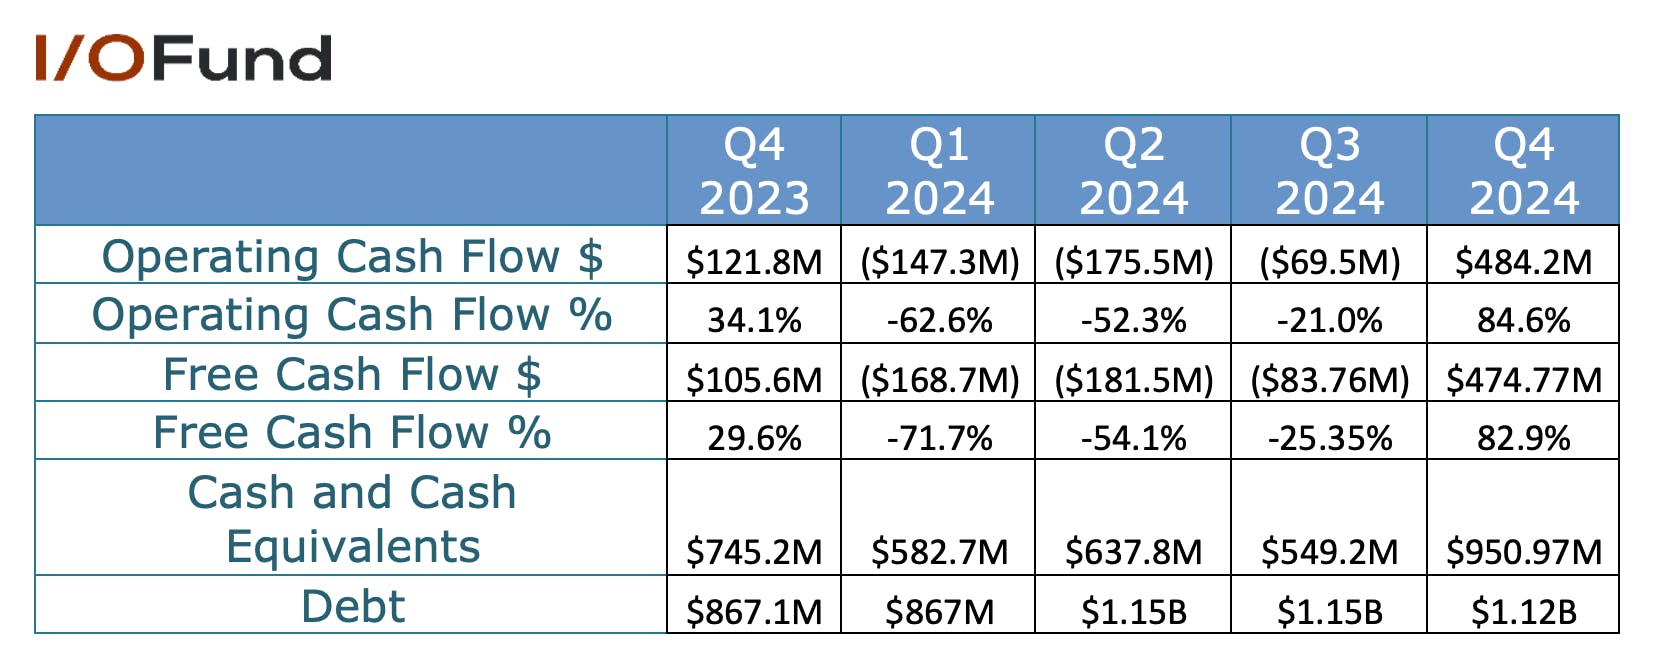
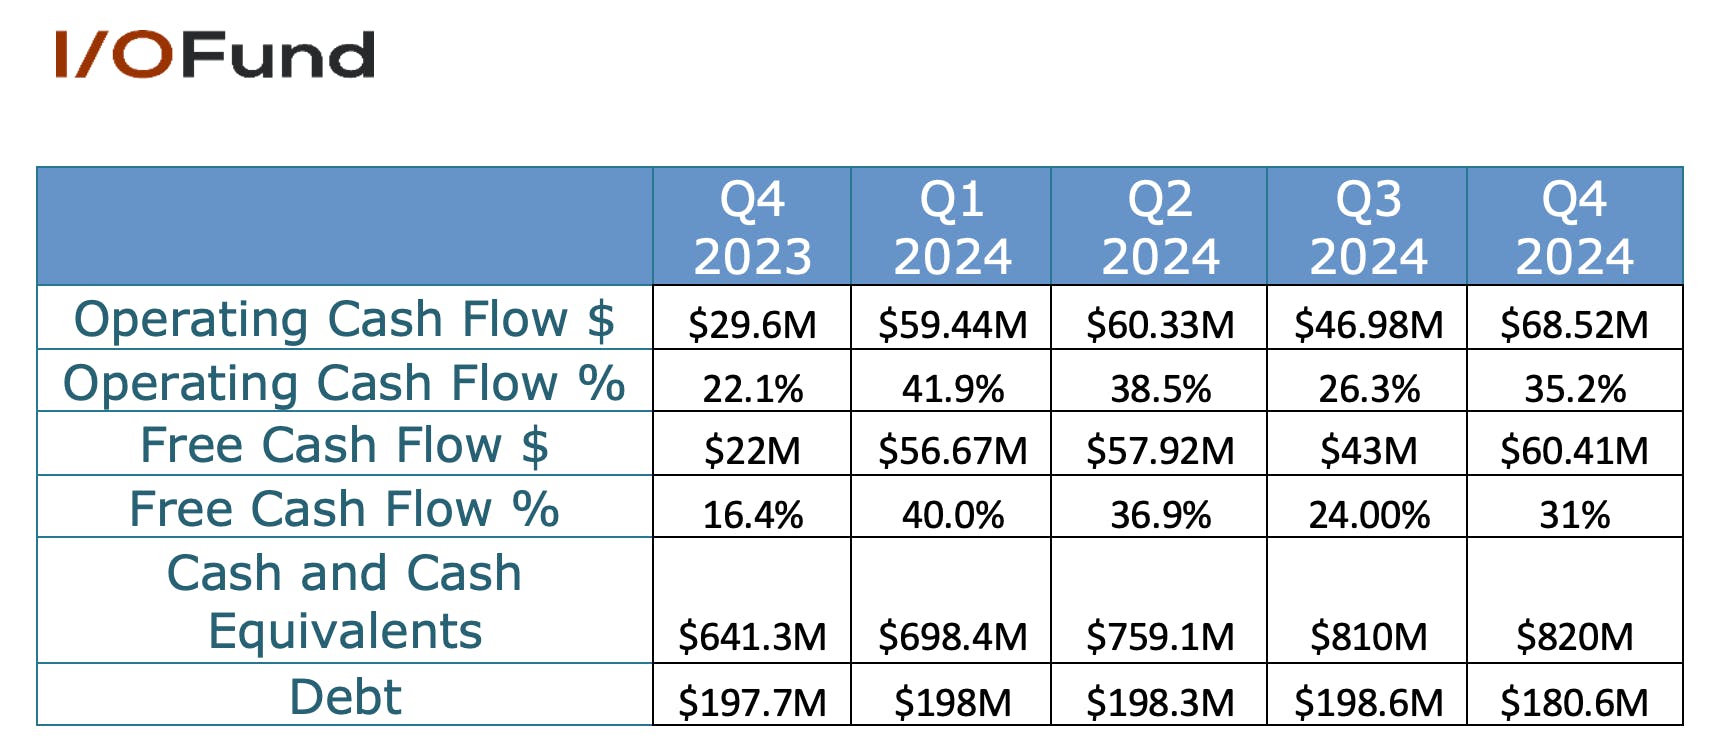
The collection of SK ecoplant receivables helped operating cash flow surge to $484.23 million, marking the first positive quarter of operating cash flow in 2024. However, a large portion of the cash flow surge came from collecting the SK receivable which was speculated at $325 million by BMO Capital Markets analyst Ameet Thakkar, which is a one off.
Operating cash flow was down ($69.5 million) in Q3. The operating cash flow margin in Q4 was 84.6%, a vast improvement from -21% in Q3.
Free cash flow improved to $473.3 million from down ($83.76 million) in Q3. The free cash flow margin was 82.7% in Q4, up from down (25.35%) in Q3. Bloom Energy closed out Q4 and 2024 was $960.97 million in cash and cash equivalents and debt of $1.12 billion.
Growth By Segment: Products and Services Climb Out of a Hole in Q4
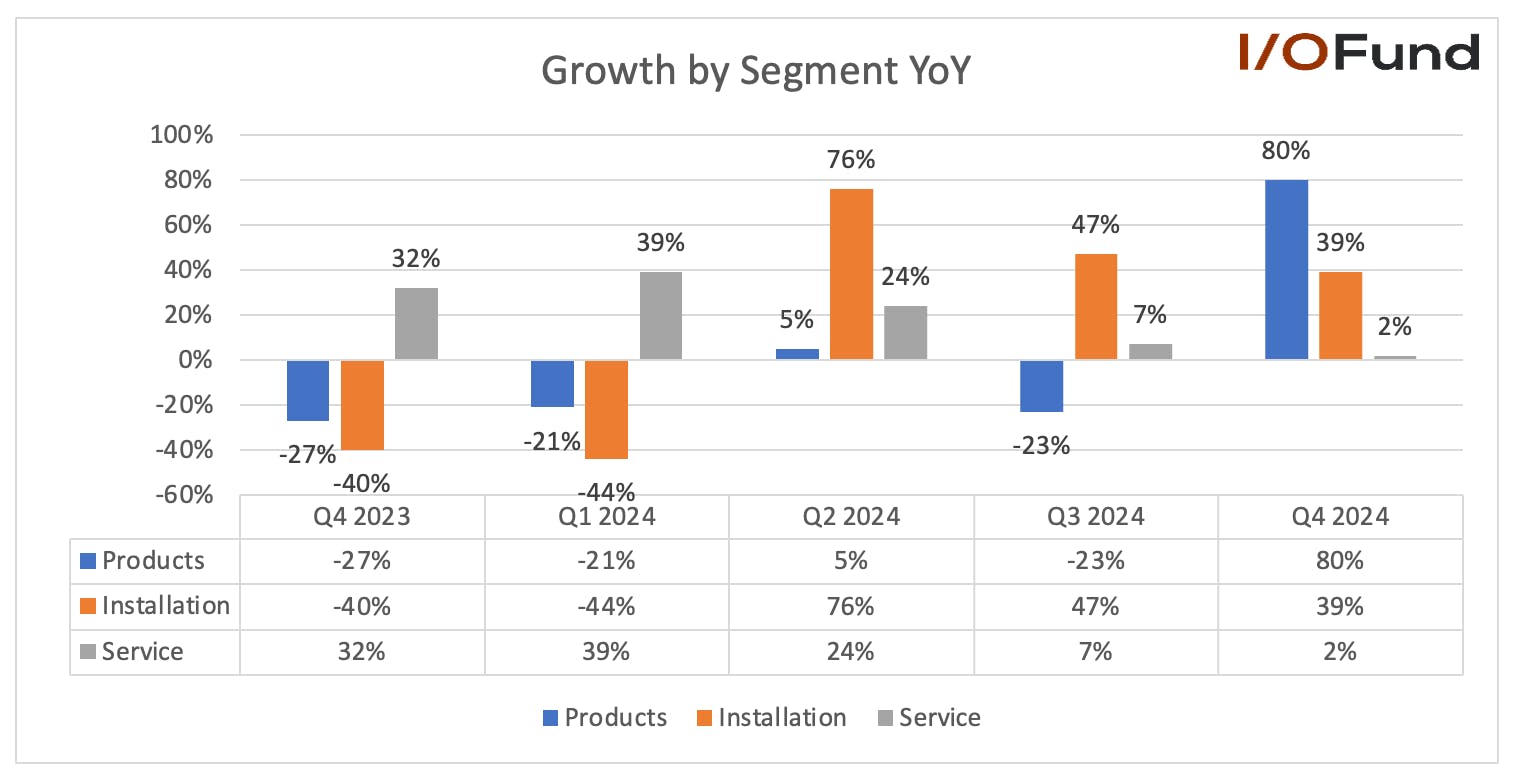
Bloom Energy revenues come in four segments. The largest segment is Product revenue generated from the sale of Bloom energy servers (BES) directly to customers through partnerships and preferred distributor agreements (PDAs). This segment can be lumpy but has been trending in the right direction, starting Q1 2024 with -27% YoY growth to 80% YoY growth by Q4 2024. Bloom Energy closed out 2024 with $2.5 billion in product backlog, excluding the supply agreement with SK ecoplant.
The Services revenue is less lumpy as these are comprised of maintenance contracts and performance guarantees. Extended maintenance contracts are received at the beginning of each service year. Payment comes in the form of a customer deposit that gets recognized over the service period. Q4 non-GAAP gross profit was $4 million in Q4, a vast improvement over a loss of $33 million in the year-ago period. Service was profitable on a non-GAAP basis in every quarter during 2024. Bloom Energy closed out 2024 with $9 billion of service backlog. The Company has a 100% attach rate of service with their product sales. Service contracts can range anywhere from five to 20 years, which is how the large long-term service backlog forms.
**Electricity is a $10 million segment and has been omitted due to being a small fraction of total revenue.
Valuation
Bloom Energy trades at a forward price/earnings (P/E) ratio of 51.72.
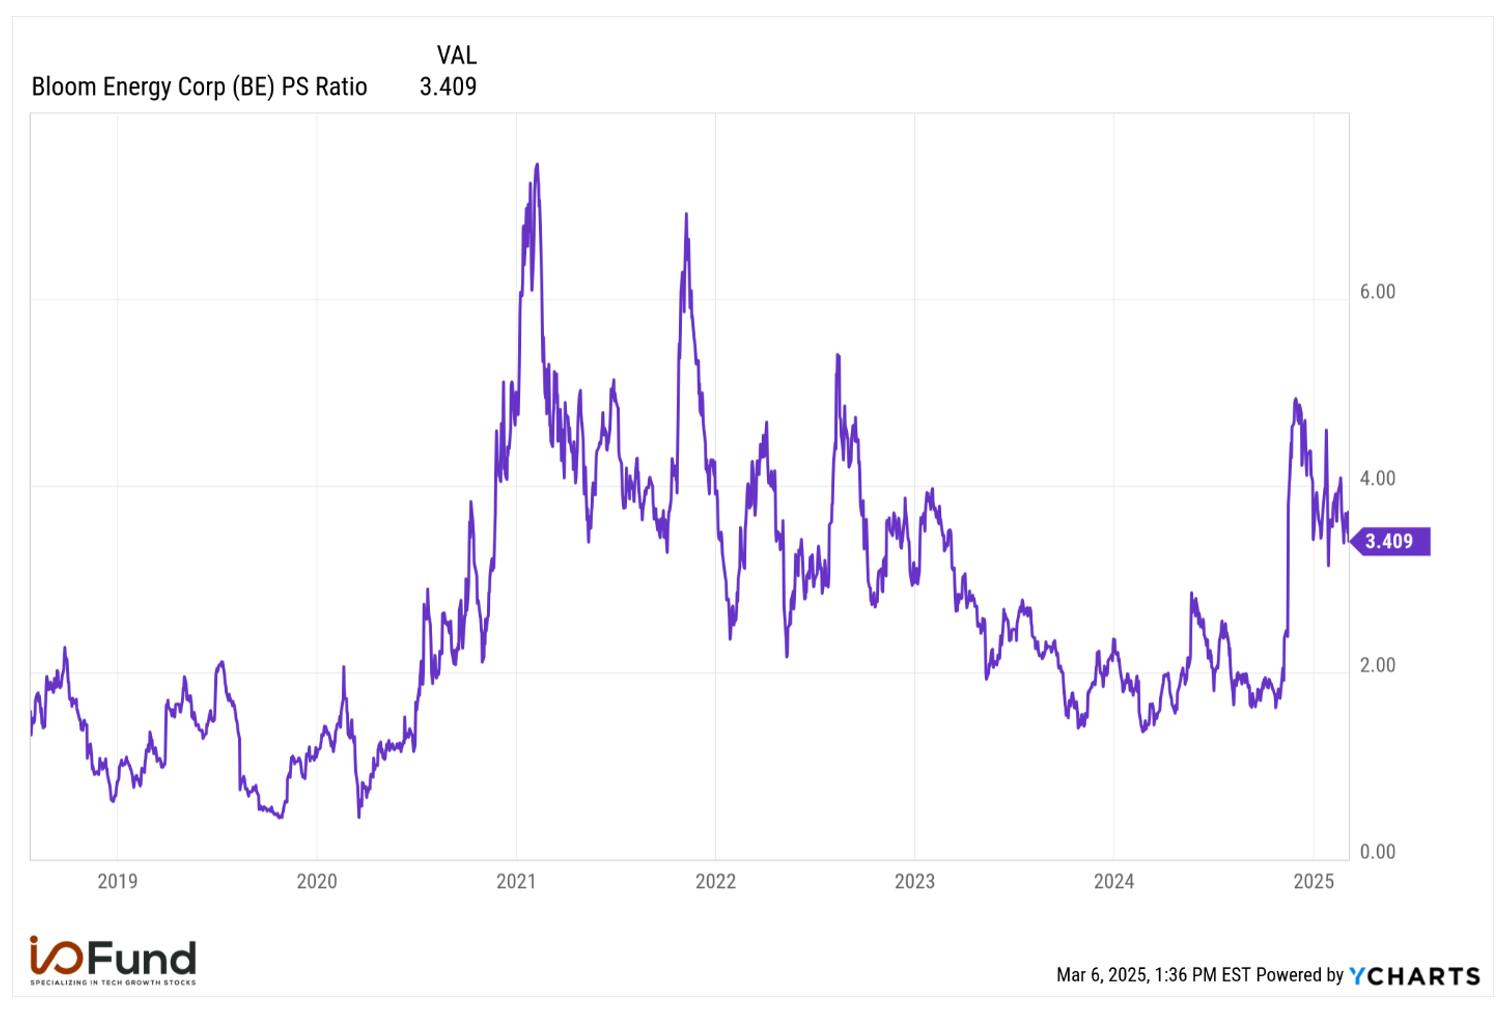
The price/sales (P/S) ratio is 3.41, forward P/S is 2.94.
The price-to-book value ratio is 9
The debt-to-equity ratio is 2.616.
Earnings Call:
AI’s $500 Billion Data Center Boom Is Stranded: Power Shortages Demand Urgent Action
The bottleneck with constructing AI data centers lies in the ability to secure the vast amount of power needed to operate them. Power availability is the chokepoint that dictates the entire ecosystem’s viability. Meanwhile, AI components like GPUs have a short shelf life that risks rapid depreciation if power isn’t secured quickly.
I/O Fund pointed out, “Nvidia’s upcoming Blackwell generation boosts power consumption even further, with the B200 consuming up to 1,200W, and the GB200 (which combines two B200 GPUs and one Grace CPU) expected to consume 2,700W. This represents up to a 300% increase in power consumption across one generation of GPUs with AI systems increasing power consumption at a higher rate.“
CEO Shrider gave an example with NVIDIA’s GPUS, “The earnings call from NVIDIA yesterday, okay. Whatever they shipped in that quarter, 90 days, if it were fully facilitized in a data center, will consume anywhere between 2 and 2.5 gigawatts of new power. That's the capacity that's needed. With the growth guidance that they gave you. You fast forward that for the next 12 months. That's just the chips coming from that one company. Fully facilitized will be somewhere in the range of 10 to 13 gigawatts. More than 50% of that is going to stay in the United States. That's more than 6 gigawatts. You're talking about $500 billion worth of infrastructure outside of power. That has to happen even at $5,000. Sorry, $5 billion in terms of facilitating that per gigawatt, that's less than 10%.”
Sridhar underscored the very real dilemma of rapid depreciation for the chips, while trying to secure power. Bloom’s customers are frantic about being able to secure power for this reason.
“Let me make this very clear. You're spending more than $500 billion building a data infrastructure that needs power. If power is not available, and the chips you're installing there have a very short shelf life, because they become old, every year the value of that chip drops like crazy. So, the time to power premium is so high, and the cost of bringing that power, even if you pay the premium is worth every penny of it.”
This is where Bloom Energy Servers come into play offering “AlwaysON” continuous 24/7 power that’s independent to the electrical grid or used as a backup power source. A Bloom Microgrid can be installed to take primary control over critical loads and customize power delivery. Energy Server blocks are repeatable and scalable with the 325 kW base block, which can be duplicated and scaled to multiple MW for any project.
Time to Power is a Competitive Advantage and Purchasing Criteria
CEO KR Shridar emphasized the competitive advantages that Bloom brings to the table, one of which is the ability to bring clients online quickly. He stated this.
“Four years ago, most of our bookings took two to three years to deploy and convert to revenue. The majority of 2024 revenue came from deals that were both signed and recognized in the same year. I expect us to continue to deploy orders quickly, just as we did in 2024. Because for many customers today, the most important purchasing criteria, is time to power. They need reliable power and they need it now. Our Bloom solution, is purpose built to meet that need.”
The fear of data centers getting priority over commercial and industrial (C&I) companies with the utilities is causing them to seek out off-the-grid solutions as Bloom Energy provides. This just adds to the demand for Bloom’s solutions.
The Need for Less Infrastructure May be Beneficial in this Administration
President Trump has declared a national energy emergency. However, he favors fossil fuels and has vowed to end delays for federal drilling permits for oil and gas production. Trump has and is repealing many of the Biden era environmental agenda including modifying and cutting back the Inflation Reduction Act. However, Trump is a big supporter of AI infrastructure as evidenced by his promotion of the $500 billion Stargate project which is a joint venture between OpenAI, SoftBank, Oracle and MGX. The project will build AI data centers across the country to create jobs and enable AI innovation. Both of these factors play into Bloom’s wheelhouse. By promoting more natural gas production and infrastructure, it enables Bloom Servers to more readily access its most used fuel source, natural gas, as management stated.
“Gas is available, the infrastructure is there. And our solution, without needing to add additional transmission, distribution, and making the average ratepayer incur that cost, is going to be politically very attractive. For all those reasons, we think that that's a great market for”
ITC Credits to End in 2028 for Section 48 Projects Before 2025
Shrider also noted that Bloom’s customers, financiers and other commercial ecosystem partners have collectively secured the option to receive full investment tax credit (ITC) for future purchases.
He said this.
“They are entitled to 40% credits nationwide in light of our U.S. manufacturing and 50% credits in predefined energy communities. They can enjoy the tax benefits for systems placed in operation in the United States between now and the year 2028. This Safe Harbor, if fully exercised, has the potential to yield between $12 billion and $15 billion of gross product revenue to Bloom.”
Under commercial ITC section 48 which was extended to Dec 31, 2024, it allows for a 30% ITC base. There is a 10% when using U.S. made components and an addition 10% bonus if installed in “energy communities” referring to fossil fuel towns with high unemployment (IE: coal mining towns). These result in a maximum 50% ITC credit for projects that started pre-2025, which get a 4 year continuity window which is the Dec 31, 2028, deadline.
This means any of Bloom’s installations started or contracted in 2024 can claim the 40% to 50% ITC is the project is completed by 2028. New projects shift to Section 48E. The $12 billion to $15 billion in potential projects refers to the 1.2 GW installed base and new orders like the AEP deal. The $2.5 billion product backlog is the floor and the $12 billion to $15 billion is the potential ceiling.
Could this have possibly triggered a pull-forward effect on orders and the backlog for Bloom Energy? Very possible. It doesn’t impact Q4 revenues because Bloom only recognizes the revenue when shipped, not on orders placed. However, projects starting after Dec 31, 2024, fall under section 48E, which is the Clean Electricity Investment Tax Credit (CEITC).
This is a technology-neutral ITC introduced by the IRA to replace section 48. However, section 48E requires electricity generation or storage with zero emissions, which favors solar, wind, nuclear and batteries. It excludes natural gas, biogas, CHOP and non-electrical technology. Hydrogen fuel would qualify since there is no carbon emissions from that, but its not very cost effective.
CFO Dan Berenbaum covered the $2.5 billion in products and $9 billion in service backlog. He spoke about the shifting priorities now with the business model.
“As we've discussed over the past few quarters, management is primarily focused on overall revenue, product revenue growth, non-GAAP gross and operating margin and cash flow from operations. In the past when we were primarily shipping grid connected, baseload power, and timing of product revenue recognition was somewhat divorced from timing of product shipments.”
Question and Answering Session: Reading Between the Lines
Bloom’s Business Relies on Third-Party Financing
Bloom Energy’s business is very cash intensive and its ability to deploy its backlog is directly tied to its ability to secure project financing. Its pointed out in the 10-K filing, “We arrange financing for our customers’ purchases of our products based on certain conditions, such as their credit quality and the expected minimum internal rate of return on the customer engagement. If these conditions are not met, we may not be able to find financing for their purchases of our products, which would have a negative impact on our revenue in a particular period. If we are unable to arrange financing for our products, our business could be harmed. Additionally, certain financing options, as with all leases, are also limited by the customer’s willingness to commit to making fixed payments, regardless of the products’ performance or our performance of our obligations under the customer agreement. If we are unable to arrange future financing for any of our current projects, it could negatively impact our business.”
CEO Shridar pointed out how capital efficiency and their ability to reduce costs has helped, “So for 2025, so we are being pretty tight about how we manage working capital. We're being very tight around how we manage expenses. We are investing prudently in the right things for the business. And to echo KR's comments, as we've said before, we're quickly approaching about 1 gigawatt worth of manufacturing. We've talked about being able to triple that capacity for roughly $150 million. So as KR said, we're able to grow our capacity in a very capital efficient manner. And to be clear, we will do that when we see the growth.”
Revenue is Now Recognized on Shipments
Wolfe Research analyst Chris Senyek tried to get an idea of the shipments in Q4 from the AEP deal, trying to get a clue if all 100 fuel cells for AEP were shipped in Q4. CFO Dan Berenbaum didn't take the bait and stated they don't talk about the specific timing of shipments for specific customers. However, an interesting point was that their revenue recognition policy has changed from being recognized upon transfer of control to the customer when products are delivered, installed and accepted by the buyer, but now Berenbaum said this.
“Let me just get that out upfront. As I said, in general, we recognize product revenue on shipments that, you know, way back the company used to be divorced a little bit; we used to recognize more of our product revenue on customer acceptance. That shifted a while ago. So now in general, our product revenue is recognized on shipments.“
He added, “And using Bloom to do that is very advantageous for them, from a time to deployment permitting ease, reliability, not needing backups, are being air pollution free, therefore being able to get air permits. For all those reasons, they like our technology. And more importantly, if that growth is being driven by data centers, the reliability of our modular fault-tolerant architecture is unbeatable.”
RBC analyst Chris Dendrinos asked about a breakdown of the backlog between AI and C&I. While CFO Berenbaum bluntly said they were "not going to breakdown the components of the backlog specifically", CEO Shrider did provide some clues.
“I think, we've already given you that kind of numbers, is that roughly one-third of our deployed backlog of greater than 1 gigawatt is towards data centers. And what is happening is that sector obviously is growing a lot faster, than everybody else.”
CEO Shrider also added that Bloom Energy is not dependent on China for the supply chain when asked about tariff implications.
Natural Gas Infrastructure Favors Bloom Energy Servers
Colin Rusch asked an important question about natural gas infrastructure since most Bloom servers use natural gas (not hydrogen) as the primary fuel source. Rusch inquired how much of the backlog was dependent on the incremental execution of gas infrastructure put in place in 2025.
Management didn’t really have much of an answer, “Again, it is a big mix. When we look at quarter-to-quarter, what we implement it is about it like depends on how quickly the projects are ready. That's why we gave it, we give a range of numbers. It's not just whether we can build and ship, it is whether those projects are ready. In many places, it's available. In some places it takes months, and in other places it may be more than a year. So not a single answer to your question. It is across the board.”
Since most Bloom servers operate on natural gas, the infrastructure is important. Schrider talked about regions in the United States and access to natural gas. Very large installations are difficult to do in the Northeast (New York and Massachusetts) due to the lack of gas pipeline infrastructure. West Virginia and Pennsylvania have plenty of gas. He expects Virginia to be attractive and the Great Lakes in Michigan is a “sleeping giant”.
“Gas is available, the infrastructure is there. And our solution, without needing to add additional transmission, distribution, and making the average ratepayer incur that cost, is going to be politically very attractive. For all those reasons, we think that that's a great market for us going forward.”
While Gas Turbines Are Competitors, Nuclear is Not a Concern Until At Least 2030
The demand for onsite power has caused many data centers to turn to gas turbines, like the GE Vernova H-class, to power data centers near term, which is an alternative to Bloom. Natural gas turbines mix compressed air with natural gas ignited at temperatures exceeding 2000 degree Fahrenheit. The hot gas expands through rotating blades that spin the turbine to produce electricity. However, gas turbines emit a lot of carbon dioxide due to their combustion process, whereas Bloom energy servers produce an electrochemical reaction to generate electricity, with no combustion resulting in significantly less carbon emissions.
Management feels secure that they have a six to eight year before small modular reactors come to market. By then, hydrogen could also be more readily available as a economically efficient fuel source.
“We can't afford to wait for nuclear to come before we do AI. So that's what creates this opportunity for the next four to six to eight years. And for us, look, when nuclear comes, the hydrogen play becomes really interesting. Other things become really interesting. So we have pathways – where we can play with those dynamics,” said Berenbaum.
Mitigating Tariffs Headwind Impacts in 2025
When asked about input prices, supply chain and tariff impacts in 2025, Shridar acknowledges that tariffs are potential challenges in their attempts to reduce costs. Tariffs are an unpredictable factor that can impact their operations, but cost reduction is deeply embedded into its business model. This is exemplified by the consistent double-digit cost reductions for the past 12 years, excluding a year of the COVID-19 pandemic, through various methods. The Company recognizes the potential headwinds, but they can be mitigated with cost-reduction efforts relying on their supply chain.
“They come from various different mechanisms, from diversity of supply base, the geographies of where we procure our materials from the efficiency with, which we manufacture, the yield that we get, the engineering advances that we make, all those lead to a cost reduction. So while definitely tariff related issues can be a potential headwind for us, it's one of many factors and we as a company are committed to finding ways around, and still getting to cost reduction.” Bloom is also not overly dependent on China for its components, which offers resilience against potential geopolitical conflicts.
Conclusion: A Strong Growth Pipeline Can Bloom in 2025
Bloom Energy has a compelling story and after two decades, it appears like the stars are aligning for them. Their energy server costs continue to decline, leading to margin expansion. The AI data center boom is power hungry and the game changer deal with AEP enables them to partner with the utilities that are selling the electricity to the data centers. Time to power is definitely a competitive advantage for Bloom. They have demonstrated how they’ve cut time to power down from years to months. Natural gas infrastructure is also a key for them since most of their energy servers run on natural gas, and the United States is the world's largest producer of natural gas and liquefied natural gas (LNG).
Heat capture also boosts the efficiency of Bloom energy servers. We previously wrote.
“BES (Bloom Energy Server) is designed to work with existing carbon capture utilization and storage (CCUS) and combined heat and power (CHP) technologies. CCUS mitigates emissions from natural gas as BES generates a pure stream of CO2 that can be used or sequestered. CHP allows the exhaust heat generated by BES (operating at a core temperature of 1,500 degrees Fahrenheit or 800 degrees Celsius) to be channeled and made available for use, further increasing the efficiency of the system. The high-temperature exhaust stream can produce steam in addition to electricity, resulting in 90% lifetime total system efficiency by adding Heat Capture.”
It's also important to note the slight improvement in customer concentration expanding from their related party, SK ecoplant and SK Eternix. Customer concentration has improved. At the end of 2024, three customers accounted for 53% of total revenues, of which the related party SK ecoplant was 28%. This is a vast improvement from the end of 2023, where two customers accounted for 63% of total revenue, of which SK ecoplant accounted for 37%.
At the end of 2024, three customers accounted for 76% of total accounts receivables, of which its related party was 23%. This was a vast improvement from the end of 2023, where a single customer, related party SK ecoplant, accounted for 74% of total accounts receivables.
The potential 50% ITC for projects that started before 2025 are also a value proposition that provides a $2.5 million Product backlog floor and a $12 billion to $15 billion ceiling if fully exercised. Bloom didn’t mention much about the AEP deal and what amount of the 100 fuel cells were shipped in Q4. The dramatic revenue and cash flow surge was driven by collecting on SK ecoplant's account receivables rather than AEP orders. If this is the case, then the AEP deal provides a lot of upside in 2025, and management’s guidance may actually be a lowball.
Like the Chinese bamboo tree, 2025 may be the year Bloom Energy breaks ground and growth surges. The story gets more compelling.
Welcome to the I/O Fund’s new Discovery Tier, where we cover a new stock idea on a weekly or bi-monthly basis. We are excited to bring you more coverage from the I/O Fund team geared toward new idea generation only.
Jea Yu, Equity Analyst at the I/O Fund, contributed to this article.
Please note: The I/O Fund conducts research and draws conclusions for the Fund’s positions. We then share that information with our readers. This is not a guarantee of a stock’s performance. Please consult your personal financial advisor before buying any stock in the companies mentioned in this analysis.
Broadcom reported a strong Q1, with revenue topping estimates by $330 million as management noted that AI revenue rose 77% YoY in the quarter. AI revenue reached $4.1 billion this quarter, beating previous guidance of $3.8 billion. The beat was driven by strength in networking with management mentioning last quarter that custom silicon would see stronger growth in H2. It was also stated networking was 40% of AI revenue while it’s typically 30% of AI revenue (confirming the higher product mix this quarter).
The stock was up double-digits after hours specifically when Broadcom stated next quarter AI revenue would be $4.4 billion and when management reiterated their serviceable addressable market forecast of $60 billion to $90 billion, stating “these R&D investments are very aligned with the roadmap of our three hyperscale customers as they each race towards 1 million XPU clusters by the end of 2027. And accordingly, we do reaffirm what we said last quarter, that we expect these three hyperscale customers will generate a Serviceable Addressable Market or SAM in the range of $60 billion to $90 billion in fiscal 2027.”
Managment also mentioned there are two more hyperscalers that plan “to tape out their XPUs” this year, referencing future expansion of the quoted SAM.
We’ve seen many AI stocks with similarly strong reports sell off this quarter, whereas the market loves Broadcom’s strong margins, its cash and the clarity management provides in terms of exact AI revenue per quarter.
Revenue
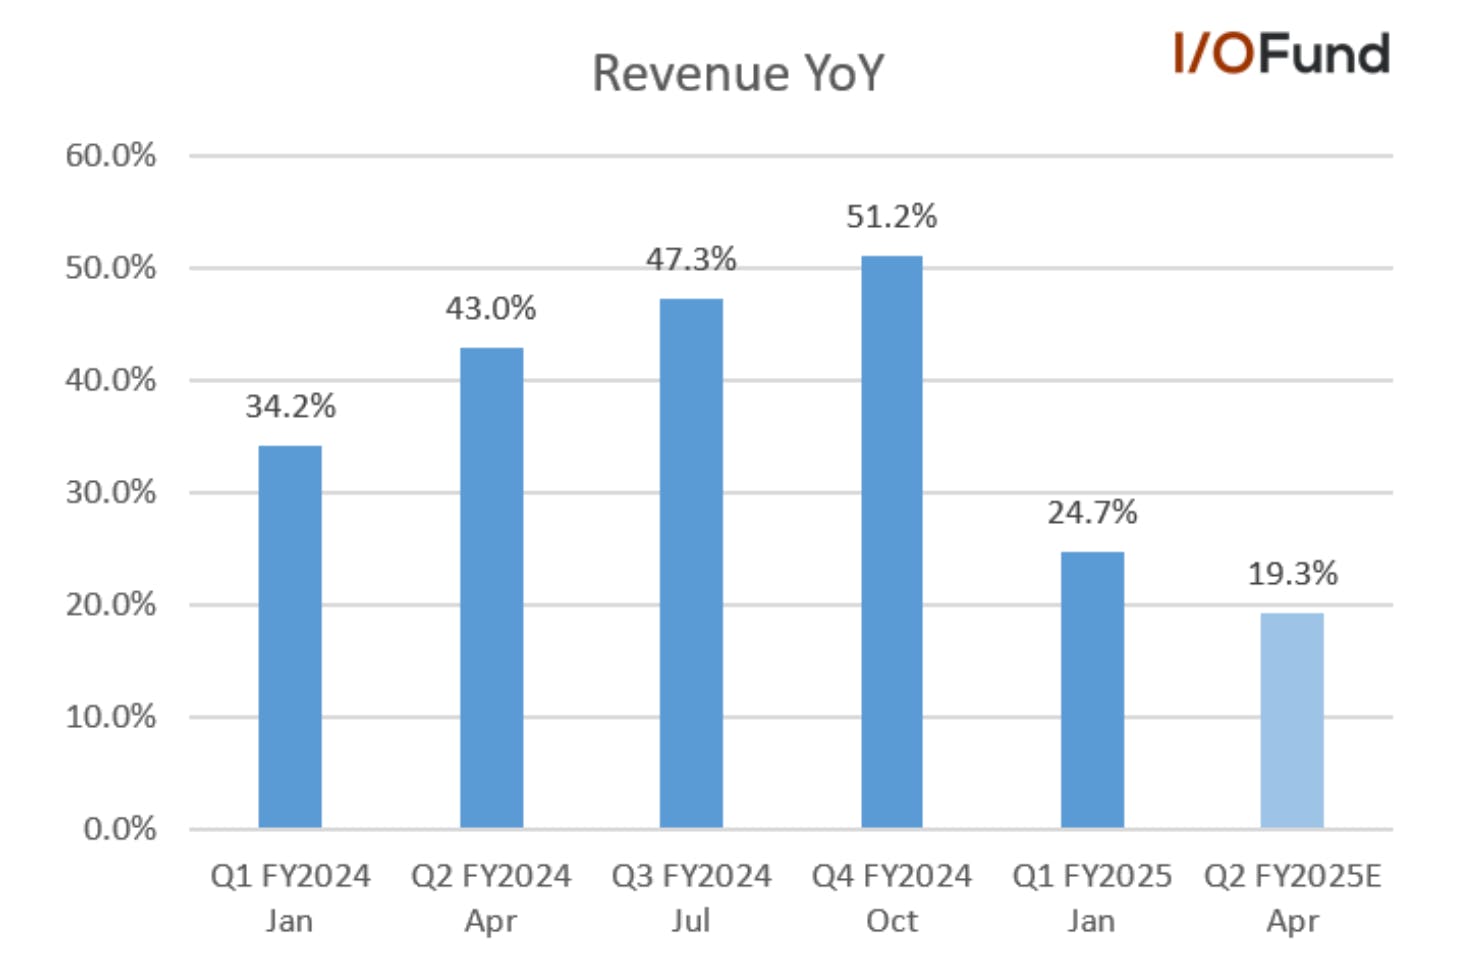
Broadcom’s revenue increased 24.7% YoY to $14.92 billion in its fiscal Q1, ahead of estimates for $14.59 billion due to strong AI momentum. Management guided for Q2 revenue to be flat sequentially at $14.9 billion, ahead of estimates for $14.73 billion.
Looking ahead, growth is expected to decelerate to 19.3% in Q2, a more than 5 point deceleration from 24.7% growth in Q1. Broadcom is lapping comps that include VMWare’s acquisition, hence why there is a large QoQ deceleration in Q1.
Most importantly, AI revenue rose 77% YoY and ~11% QoQ to $4.1 billion. For Q2, Broadcom said that it expects AI momentum to continue in Q2 “as hyperscale partners continue to invest in AI XPUs and connectivity solutions for AI data centers,” forecasting AI revenue to be $4.4 billion, up just over 7% QoQ and 44% YoY. This would put AI revenue at $8.5 billion for the first half of the fiscal year, up more than 57% from $5.3 billion in the same period last year.
Key Segments
Semiconductor Solutions revenue rose 11% YoY and was approximately flat QoQ at $8.22 billion, decelerating 1 point from 12% YoY growth in Q4.
AI revenue was $4.1 billion, ahead of management’s guidance for $3.8 billion on “stronger shipments of networking solutions to hyperscalers on AI.” Management added that they “see a steady ramp in deployment of our XPUs and networking products,” supporting its AI revenue guide of $4.4 billion in Q2.
Non-AI semiconductor revenue was $4.1 billion, down 9% QoQ due to a seasonal decline in wireless revenue.
Broadband “showed a double-digit sequential recovery in Q1 and is expected to be up similarly in Q2 as service providers and telcos step up spending.”
Server storage “was down single-digits sequentially in Q1, but is expected to be up high-single digits sequentially in Q2.”
Enterprise networking is expected to remain flattish in Q1 and Q2 as customers work through inventory.
Wireless was flat in Q1 and expected to be flat YoY in Q2, and resales in industrial were “down double-digits in Q1 and are expected to be down in Q2.”
Infrastructure Solutions revenue rose 47% YoY and 15% QoQ to $6.70 billion. Management said the QoQ performance was “exaggerated though by deals which slipped” from Q4 to Q1, though the strong YoY performance was driven by two factors – converting largely perpetual licenses to one full subscription, and “upselling customers to a full stack VCF, which enables the entire data center to be virtualized.” At the end of Q1, approximately 70% of Broadcom’s 10,000 largest customers have adopted VCF.
For Q2, Infrastructure Software revenue is expected to be $6.5 billion, up 23% YoY.
Margins
Margins expanded significantly across the board in Q1, with GAAP operating margin seeing the strongest expansion on a QoQ basis of 9.1 points.
Gross margin was 68.0% in Q1, up from 64.1% in the prior quarter as gross profit topped $10 billion for the first time. Adjusted gross margin was 79.1%, expanding from 76.9% in the prior quarter.
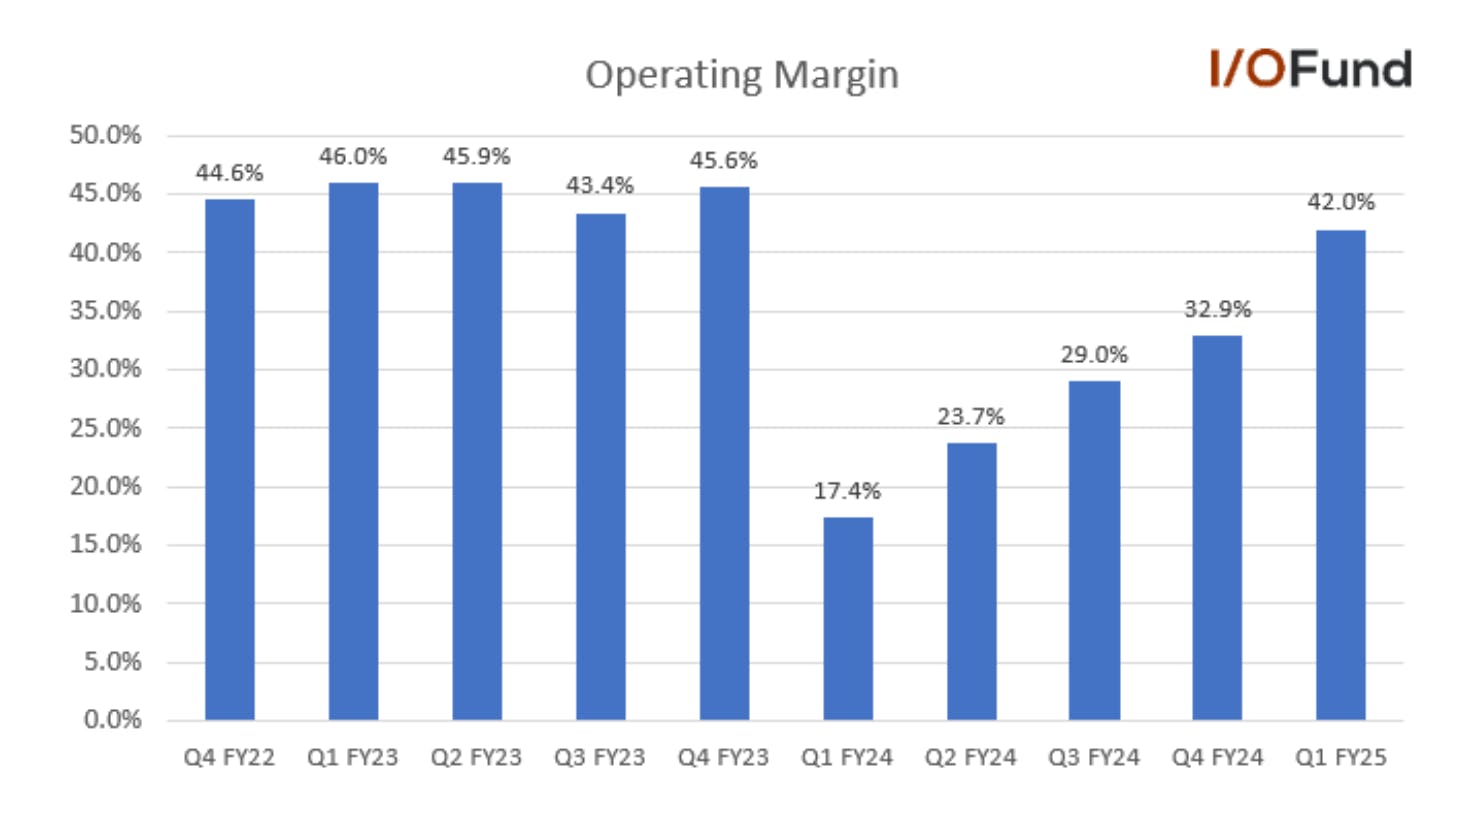
Operating margin witnessed the strongest QoQ expansion, with Broadcom reporting a 42.0% margin in Q1, up from 32.9% in Q4; this is marking a return to pre-VMWare acquisition levels. Adjusted operating margin was 65.9%, up from 62.7% in the prior quarter.
Net margin was 36.9% in Q1, a strong 6.1 point expansion from 30.8% in the prior quarter. Adjusted net margin was 52.4%, up from 49.6% in the prior quarter.
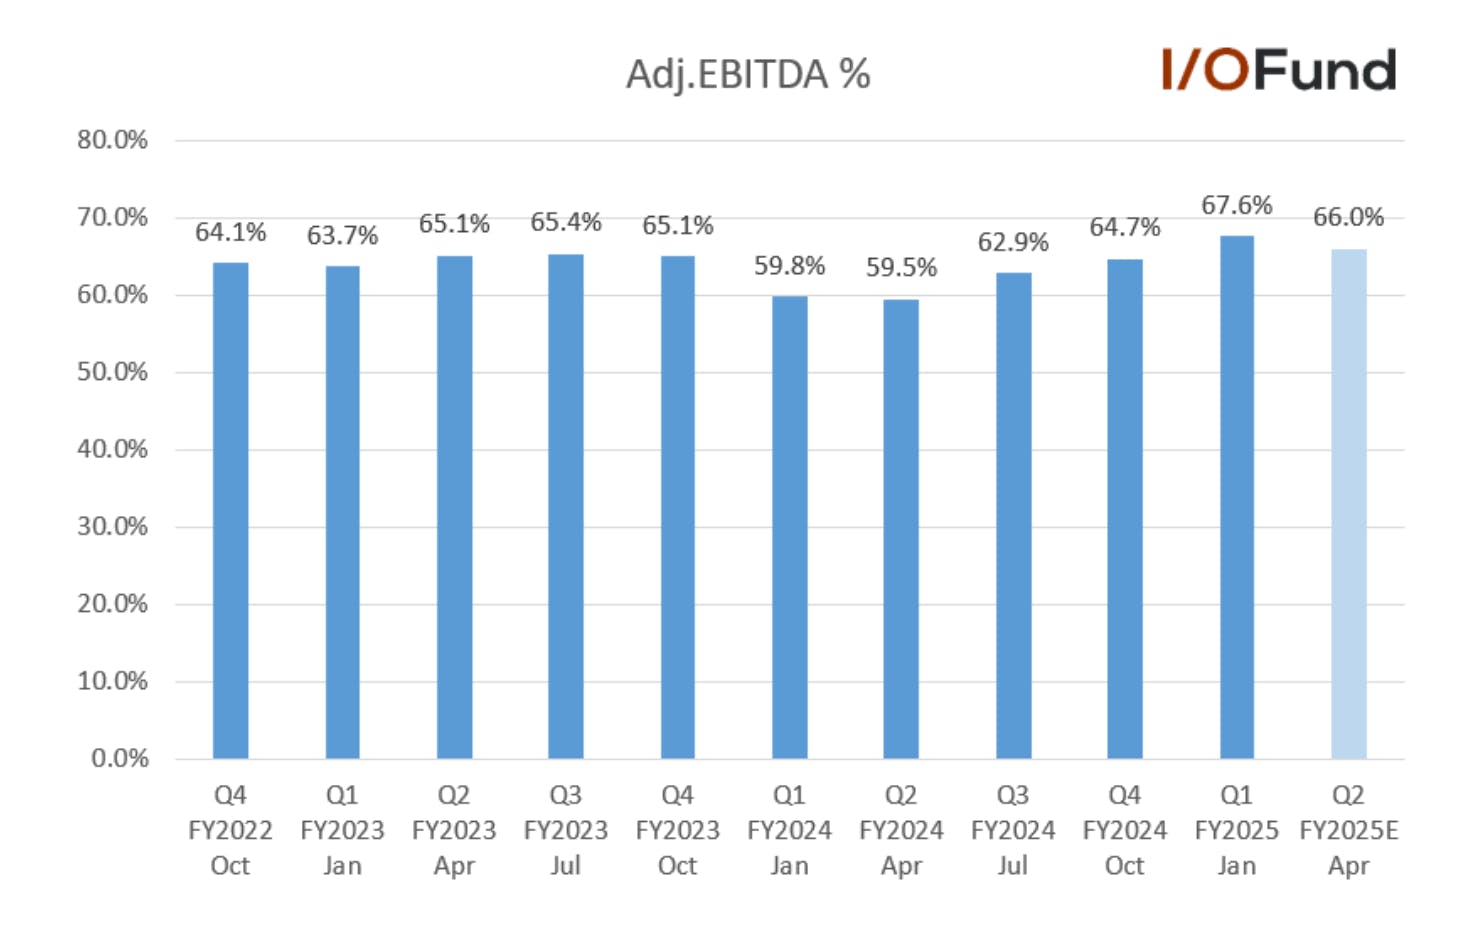
Adjusted EBITDA margin also expanded nearly 3 points sequentially to 67.6%, with adjusted EBITDA surpassing $10 billion for the first time in Q1 at $10.08 billion. This also marked a strong, consistent expansion from the high-59% range at the start of FY24 when VMWare’s integration was impacting margins. Q2’s adjusted EBITDA margin was guided at 66%, a slight sequential contraction.
EPS
Given the strong margin expansion in Q1, Broadcom delivered a strong GAAP EPS beat of 35.7%, while its adjusted EPS beat was smaller in nature at ~6%.
GAAP EPS of $1.14 beat estimates for $0.84.
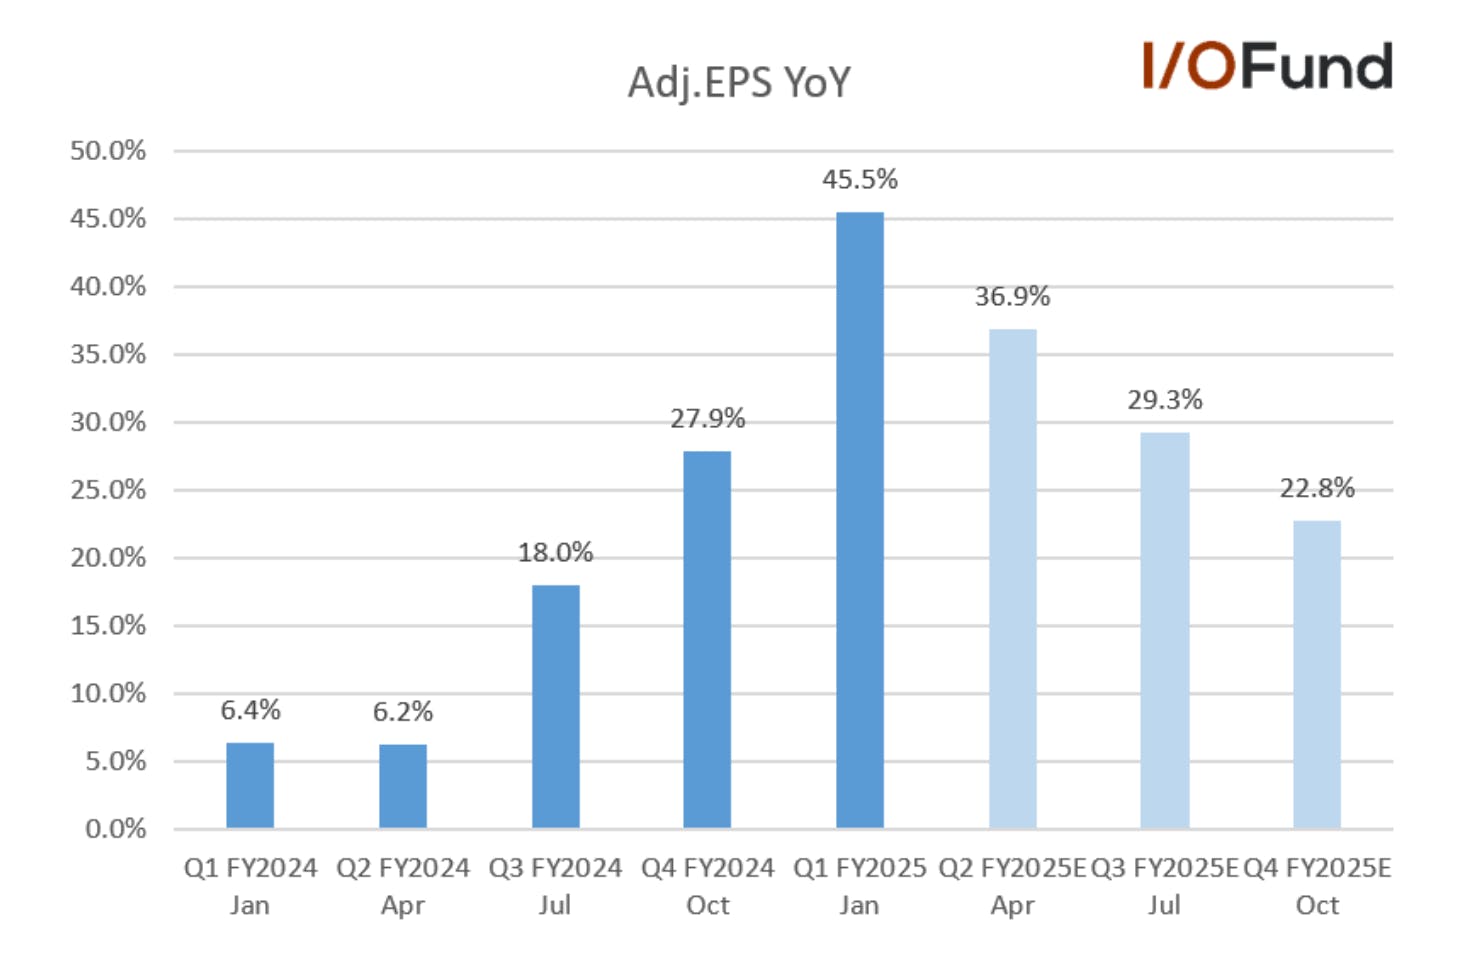
Adjusted EPS of $1.60 beat estimates for $1.51, for growth of 45.5% YoY. This is expected to be peak growth for adjusted EPS in fiscal 2025, with estimates pointing to 37% growth in Q2 below ending the fiscal year at almost 23% growth.
Cash and Balance Sheet
Operating and free cash flow were both strong in Q1 due to the margin strength and revenue outperformance, with both recording a margin of >40%.
Operating cash flow was $6.11 billion, up 9% QoQ. OCF margin was 41%, improving from 39.9% last quarter.
Free cash flow was $6.01 billion, up almost 10% QoQ. FCF margin was 40.3%, improving from 39.0% last quarter.
Inventories were $1.91 billion, increasing more than 8% QoQ.
Cash and equivalents totaled $9.31 billion, while debt decreased $1 billion QoQ to $66.58 billion.
Earnings Call:
Market Opportunity:
The market opportunity for Broadcom is quite large – represented by SAM of $75B at the midpoint by 2028, up from a $16B run rate right now. An analyst asked a similar question in terms of chips and management reiterated their current forecast is with only three customers right now whereas two more are likely to go into volume production in the coming years.
Timothy Arcuri:
Thanks a lot. Hock, in the past, you have mentioned XPU units growing from about 2 million last year to about 7 million you said in the 2027, 2028 timeframe. My question is, do these four new customers, do they add to that 7 million unit number? I know in the past, you've sort of talked about an ASP of 20 grand by then. So those — the first three customers are clearly a subset of that 7 million units. So do these new four engagements drive that 7 higher, or do they just fill in to get to that 7 million? Thanks.
Hock Tan:
And thanks, Tim for asking that. To clarify, as I made — I thought I made it clear in my comments. No, the market we are talking about, including — when you translate the unit is only among the three customers we have today. The other four, we talk about engagement partners. We don't consider that as customers yet and, therefore, are not in a served available market.
China Exposure:
Management was asked how many of the hyperscalers were from China, but they declined to comment. This is a notable question given any hyperscaler from that region has a low chance of being unscathed over the next four years. There were reports earlier this week that Broadcom may be losing major customer ByteDance, for example.
Management stated “no comment” yet it’s important to note the concern.
Conclusion:
Broadcom is quality and will help us hedge any anti-Nvidia narratives – which are bound to come up from time to time. As far as quality goes, you cannot find a better pair in AI (NVDA-AVGO). These are the juggernauts and we want exposure to AVGO as its empire slowly expands. Don’t forget AVGO’s AI software opportunity, which we’ve expanded on in the past.
That’s officially a wrap for the I/O Fund earnings season!
Regarding the AI trade falling out of favor this quarter, don’t let the market fool you for one minute – investors have never had it so good as to be able to track and verify there are hundreds of billionshundreds of billions pouring into one trend. It’ll be volatile, and it’ll be scary – and then ultimately thrilling, but this trend is bursting at the seams with demand. Supply is not merely bottlenecked; it’s dammed at the flood gates. The supply issues will work themselves out, and the I/O Fund and our Members will be well-positioned when those flood gates open.
Please note: The I/O Fund conducts research and draws conclusions for the Fund’s positions. We then share that information with our readers. This is not a guarantee of a stock’s performance. Please consult your personal financial advisor before buying any stock in the companies mentioned in this analysis.
After posting its first annual decline in deliveries in 2024, Tesla continues to face major hurdles to growth in 2025. There are shockingly large declines in Europe and China so far this year, coupled with automotive margins that hit a low in Q4 with more margin pressure likely in Q1. Management has also quietly shifted its tone on 20% to 30% delivery growth, with other segments offering no reprieve as Tesla continues to eat into its gross profit to push deliveries higher.
While optimism has risen for robotaxi services and Optimus robots, neither of the two look to be major drivers of growth in 2025, with initial use cases likely to be internal or small-scale in nature. Tesla continues to hype up a more affordable model, though questions remain about its ability to do so profitably as Tesla has made more progress cutting selling prices than it has cutting production costs.
Stay on the leading edge of AI with I/O Fund’s high-performing tech portfolio, which had 10 positions outperform the Nasdaq-100 in 2024, many held at high allocations, and we are prepping for a strong 2025. Take advantage of our limited-time monthly promotion for up to 20% off our Pro service here to access the I/O Fund’s portfolio, library of research, webinars, and more. here to access the I/O Fund’s portfolio, library of research, webinars, and more.
Tesla’s Automotive Growth Stagnates in 2024
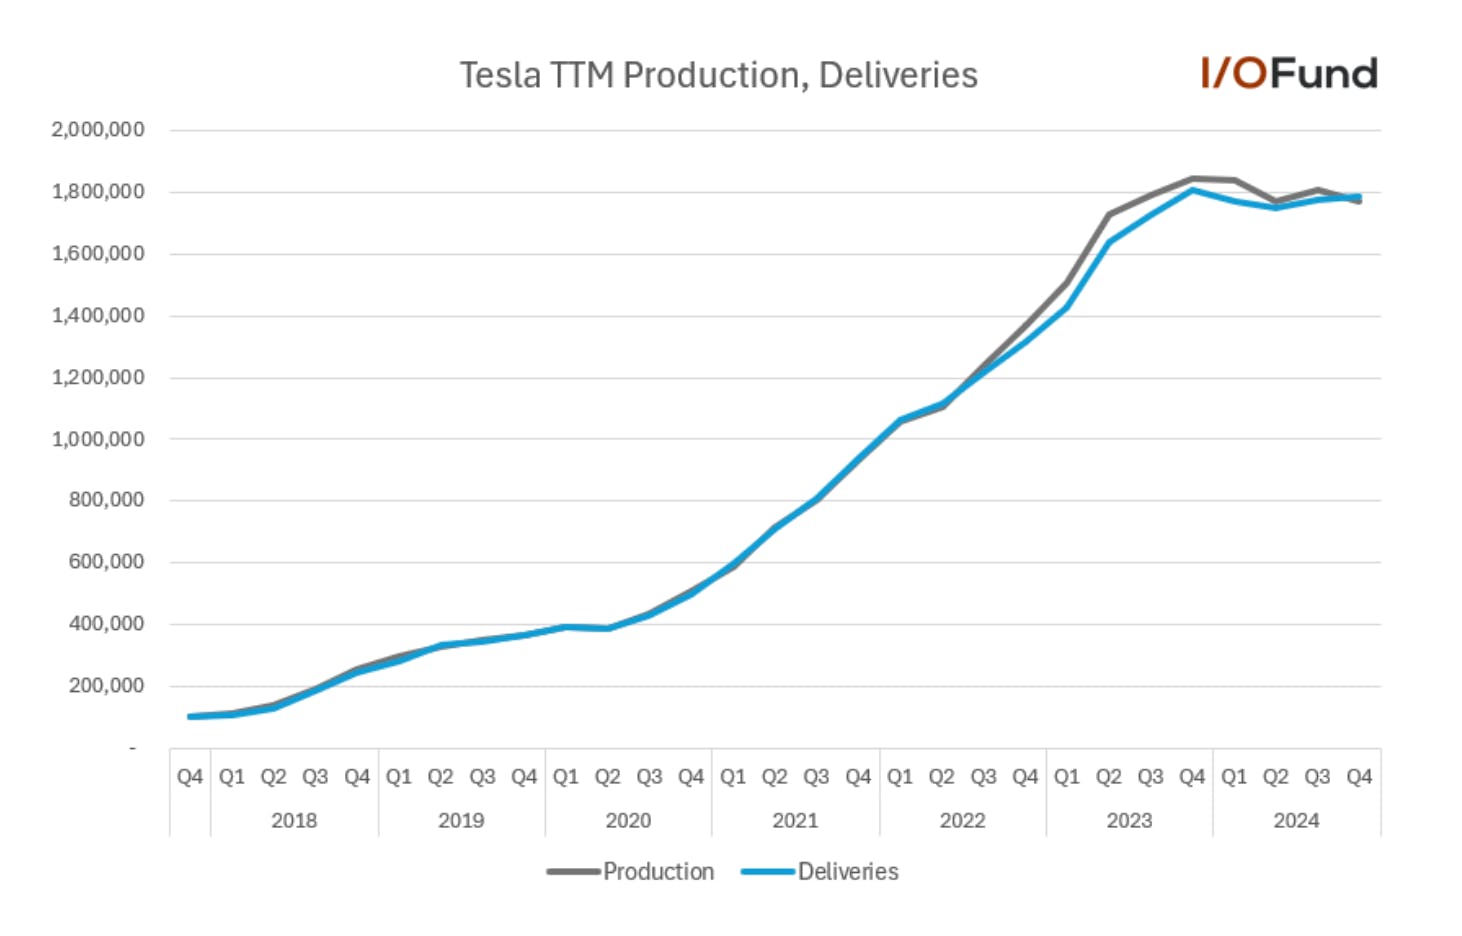
Automotive growth stalled in 2024, with Tesla recording a (1%) YoY decline in deliveries for the year to 1.79 million vehicles. Q4 capped off the end to a rather tumultuous year for Tesla, as Tesla sold down a significant amount of inventory after Q1 2024 saw its first YoY decline in quarterly deliveries in four years.
Tesla stock sees its first annual decline in deliveries as growth stagnated in 2024.
China was a strong area of growth for Tesla in 2024 and in Q4, with Tesla’s deliveries in China reaching a record high of 82,927 vehicles in December and 196,902 vehicles in Q4, up nearly 16% YoY and also marking a fresh record. For 2024, China deliveries exceeded 657,000, rising 8.8% YoY. As a result, China accounted for 39.7% of global deliveries in Q4 and 36.7% in 2024, up more than 3 points from 33.4% in 2023.
For 2025, Musk had estimated vehicle deliveries could grow 20% to 30% YoY in Q3, which would correlate to deliveries between approximately 2.15 million and 2.33 million, or an average of at least 550,000 deliveries per quarter. Interestingly, this target was not repeated in Q4, with Tesla saying now that it only expects to “return to growth” in 2025. This subtle shift in tone is easy to miss, but it suggests that Tesla may be on track for 1.85 to 2.0 million vehicles this year, technically returning to growth but at a much lower rate than prior commentary.
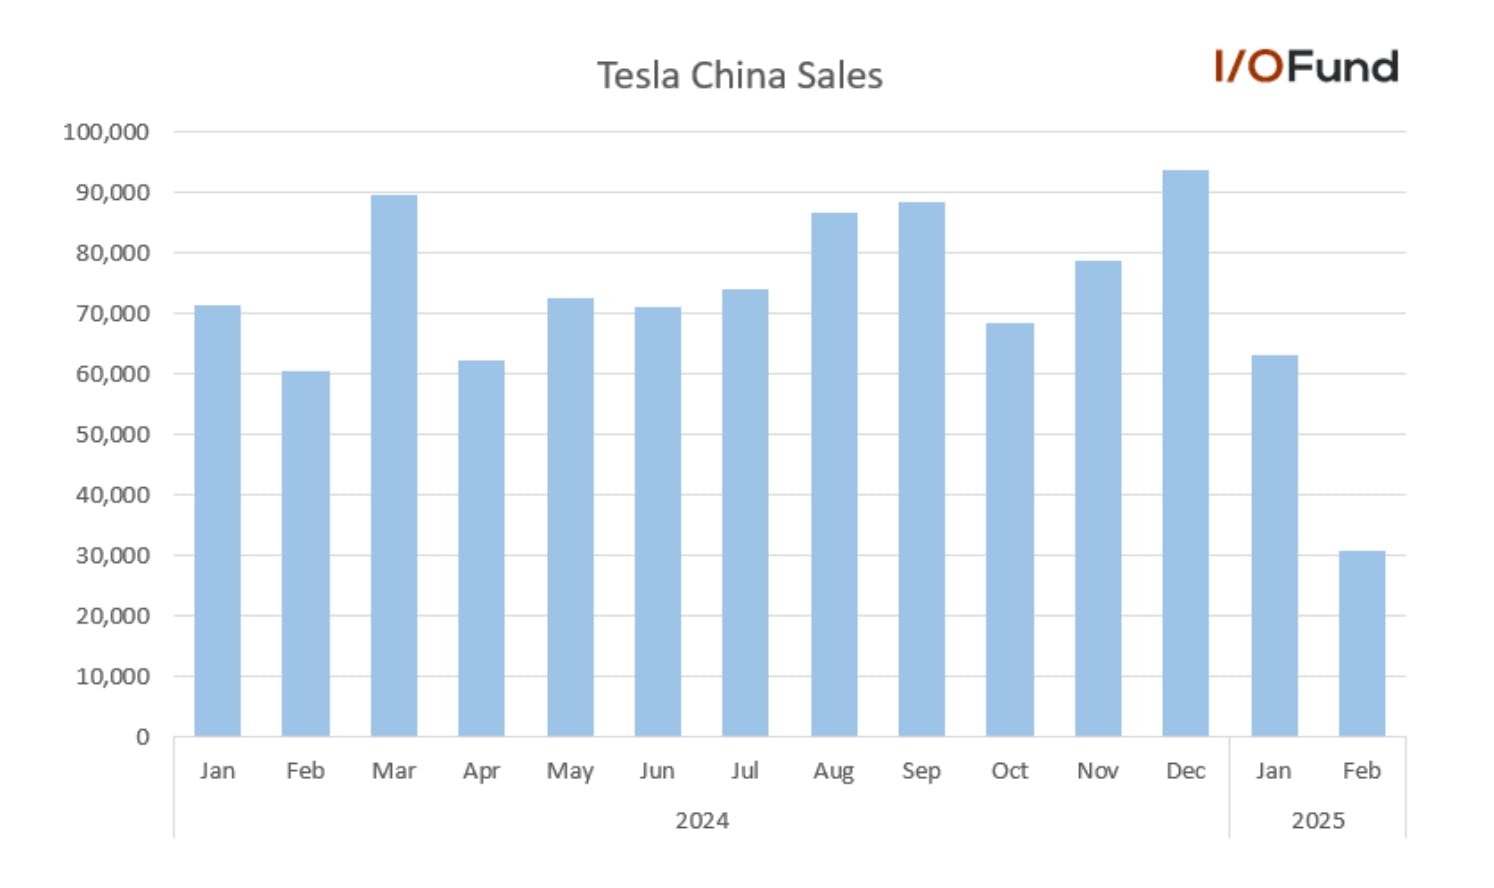
This year looks to be off to a challenging start, with early data from across Europe showing plunging sales, while China sales accelerated their decline in February to notch a (29%) YoY drop for the first two months of the year.
ACEA data showed that Tesla registrations fell 45% YoY in January 2025 in the EU, Iceland, Liechtenstein, Norway, Switzerland and the UK, reaching a two-year low, despite broader EV sales rising 37%. In February 2025, registration data showed declines of (42%) to (48%) YoY in Scandinavia and France, while Germany saw sales decline a whopping (76%) YoY after falling (60%) in January.
Tesla stock is facing a tough road ahead in China as sales have slumped to start 2025, with February plunging -49% YoY.
China sales dropped (12%) YoY in January, but accelerated this decline in February, with preliminary data from the CPCA showing sales down (49%) YoY to 30,688 vehicles, the lowest monthly volumes in the country since August 2022. This also marks a (51%) MoM plunge from January’s 63,238 vehicles, and a more than (67%) plunge from December 2024. For comparison, rival BYD’s February sales surged 161% YoY for BEV and PHEVs, with global sales up 56% YoY in the first two months. CPCA data also showed the NEV market rose 82% YoY in February, with Tesla lagging the market by a 131 point difference. Tesla is now offering an 8,000 yuan (~$1,100) insurance subsidy on Model 3 vehicles in China in an effort to revive demand.
Given this weakness already in Q1 in core regions, there are whispers that deliveries could fall to significantly below 400,000. There are mounting indications that Tesla is facing a demand problem, not only within plunging sales across multiple markets worldwide, but also in more aggressive financing perks. Tesla recently launched new financing and free lifetime supercharging perks this week to boost demand, offering 0% APR or zero due at signing for Model 3s and discounts on older Model Ys.
If Q1 does come in weak due to global sales weakness and transitionary impacts to production from the refreshed Model Y, Tesla will have to make up substantial ground in the back half of the year to reach its optimistic targets, as Musk’s prior 20% to 30% volume growth target would already be pushing the upper limits of Tesla’s installed manufacturing capacity.
Tesla’s Margins Have Faced Significant Pressure
Tesla has prioritized affordability to drive growth in delivery volumes and prevent inventory build-ups through 2024, with this coming at the expense of margins. In Q4, CFO Vaibhav Taneja reaffirmed these priorities, saying Tesla is still committed to reducing inventory and vehicle production costs – as expected, this came at quite a cost to margins. Management has also discussed for multiple quarters the plan to launch more affordable models in the first half of 2025, but there’s limited evidence that Tesla can do so in a margin-accretive way that quickly.
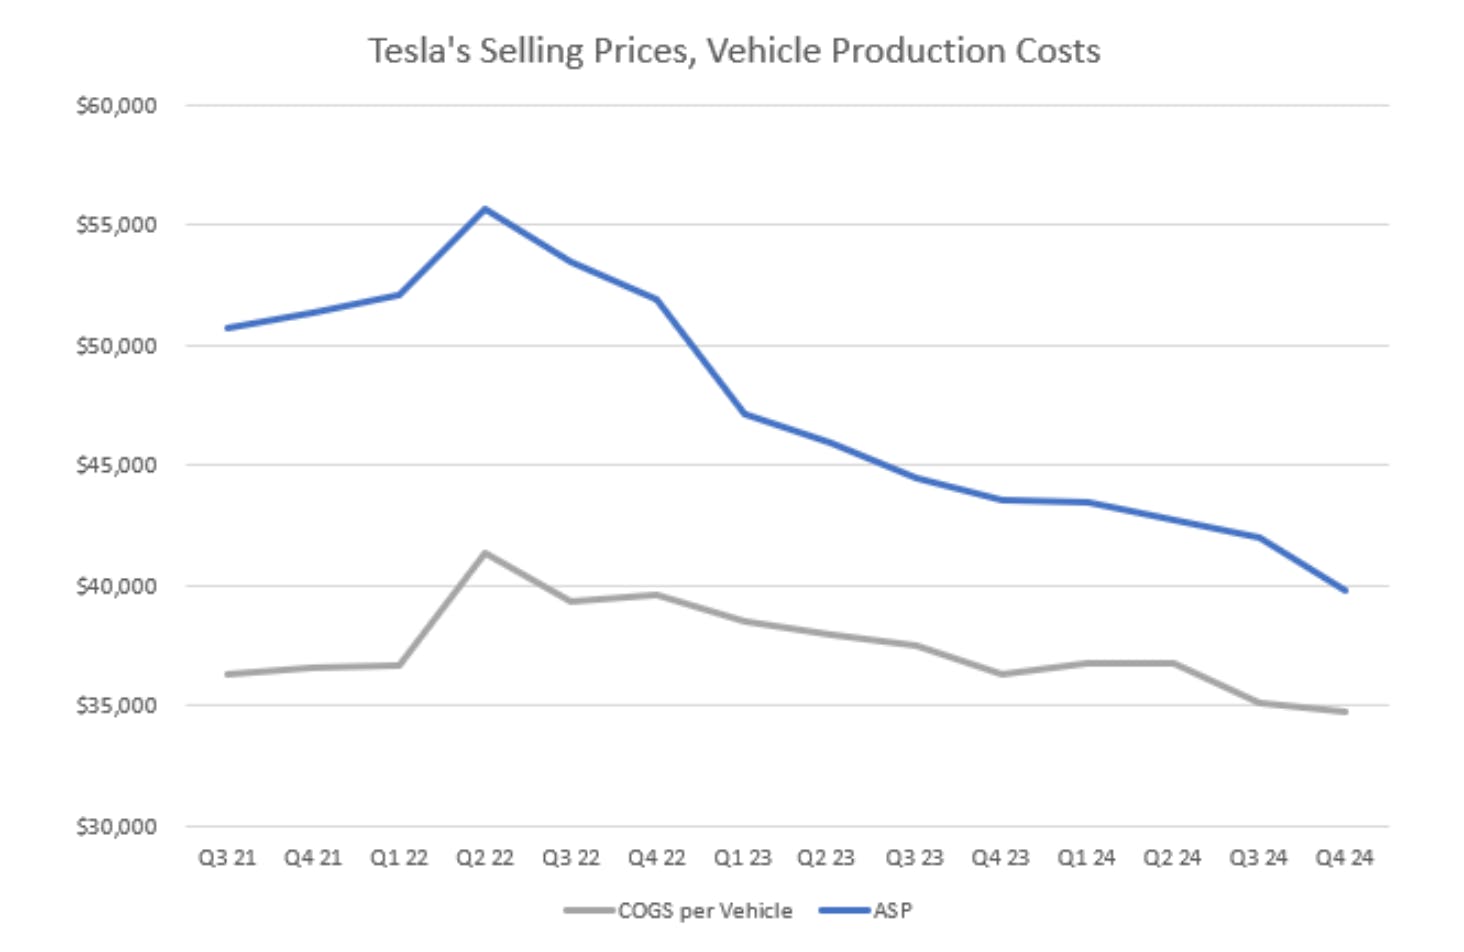
Taneja explained in Q4’s earnings call that Tesla was “able to get our overall cost per car down below $35,000, primarily by material costs,” despite increased depreciation as Tesla transitions to its refreshed Model Y. Calculations show that COGS per vehicle declined just (1.1%) sequentially in Q4 to ~$34,716, or a reduction of $390 from Q3.
Tesla’s actions to aggressively sell down inventories, which declined nearly $2.5 billion sequentially in Q4 to $12 billion, were possibly due to “attractive financing options but also other discounts and programs which impacted ASPs.” As a result, ASPs fell (5.2%) sequentially to $39,818 in Q4, a decline of approximately ($2,174) from Q3. This was the largest QoQ decline in ASPs since Q1 2023. Essentially, Tesla reduced production costs at less than 1/5th the rate of ASPs in the quarter.
Tesla’s average selling prices declined more than 5% QoQ in Q4 2024, while production costs declined just 1.1% QoQ.
Over the last three years, ASPs have been declining at a faster rate than COGS, pressuring margins quite substantially in the process. Tesla said that it saw a new record for deliveries in the highly competitive Chinese market, which (as we have discussed in our analyses Tesla Sells 33% Of Vehicles Below Average Cost, BYD Pulls Ahead in November 2023 and Tesla’s China Market Share Continues To Slide in December 2023) are detrimental to ASPs and likely a factor in the larger QoQ decline.
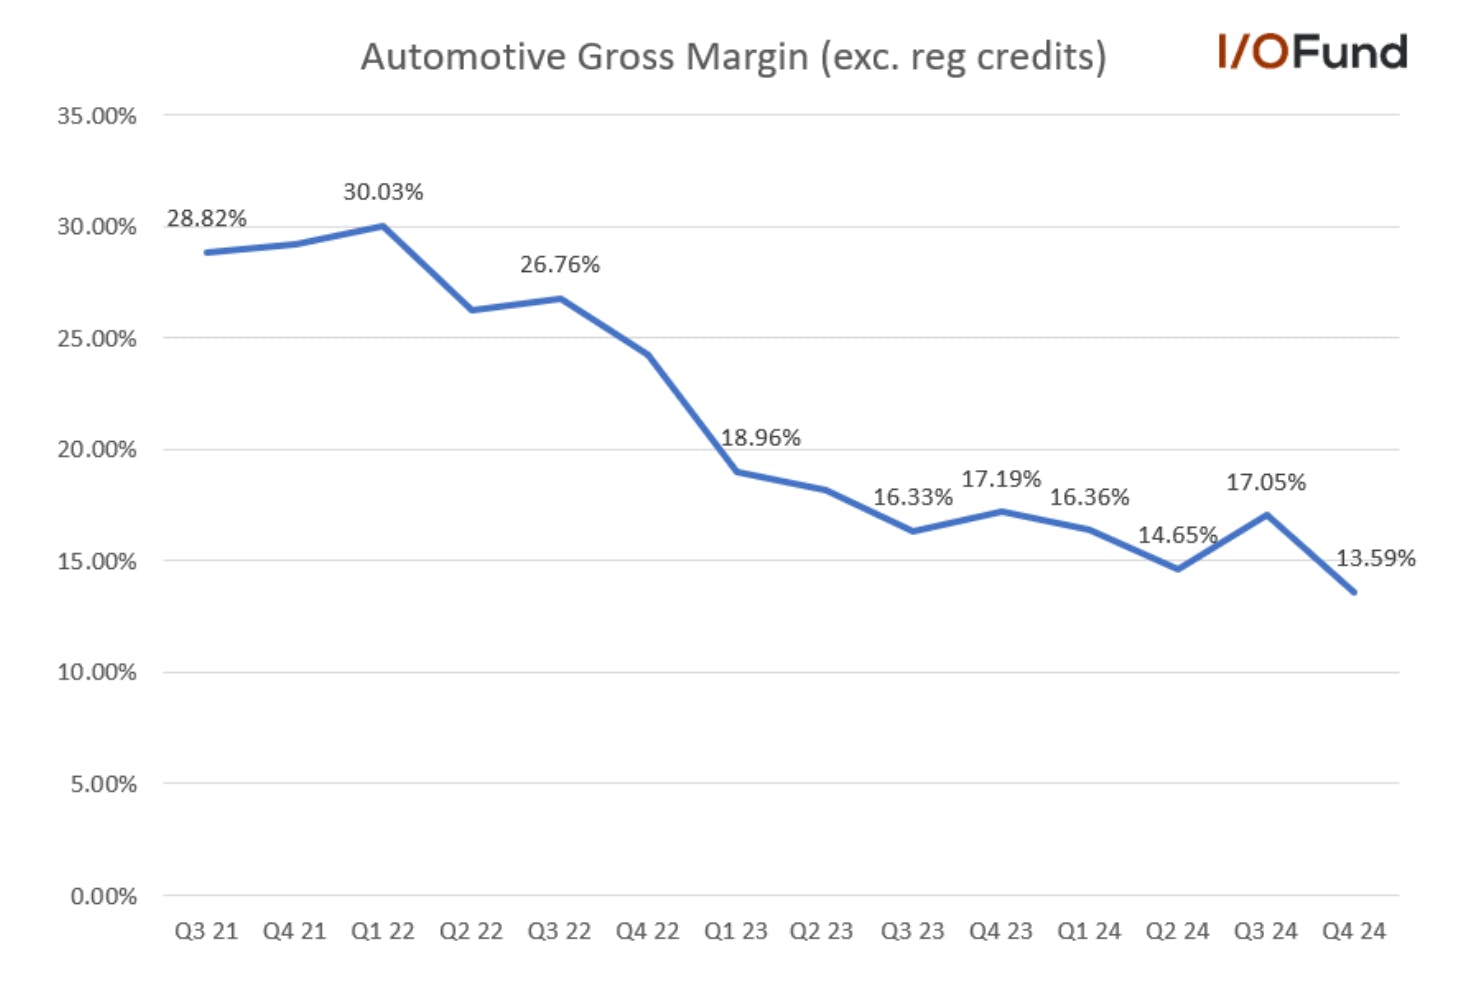
Putting this all together, automotive gross margin dropped more than 3.5 points sequentially to 13.59% in Q4, more than a full point below Q2’s 14.65% margin. This was visible within Tesla’s growth rates – automotive revenues declined (8%) YoY and (1%) QoQ despite a 2% YoY and 7% QoQ increase in deliveries. This was also mostly expected given management had stated that sustaining margins in Q4 would be challenging.
Tesla stock witnessed automotive gross margin (excl. regulatory credits) fall to a fresh low at 13.59% in Q4 2024.
On a per-vehicle basis, Tesla’s average gross profit was ~$5,102 in Q4, down more than (29%) YoY and (26%) QoQ due to the sharper decline in ASP. This is a far cry from the $14,000+ gross profit per vehicle Tesla was recording in late 2021 and early 2022.
As it stands, Tesla risks its per-vehicle gross profit falling below $5,000 in 2025 unless it can quickly drive production costs below $34,000 per vehicle or reverse its decline in ASPs. The aforementioned 0% APR financing perks and other promotional discounts are likely to weigh on ASPs, as was the case in Q4.
Margin Issues to Persist in Q1
Tesla has outlined more headwinds in the first half of 2025, and energy storage has been unable to offset automotive weakness recently, facing similar growth headwinds in Q4 – revenue and gross profit increased just 1.5% and 0.7% from Q2 despite deployments being more than 17% higher.
For Q1, there’s not likely to be much relief on the margin front, as management said that production of the refreshed Model Y kicking off in February will “result in several weeks of lost production” in Q1, and that “margins will be impacted due to idle capacity and other ramp related costs” that will ease once production is ramped. Energy storage is also likely to see margin pressure in Q1, with Shanghai production set to ramp with both Powerwall and Megapack remaining supply constrained.
Sign up for I/O Fund's free newsletter with gains of up to 2,250% because of Nvidia's epic run – Click hereSign up for I/O Fund's free newsletter with gains of up to 2,250% because of Nvidia's epic run – Click hereClick here
Questions also remain about Tesla’s ability to launch and ramp a more affordable model as promised this year. Tesla has stated for multiple quarters now that it remains on track to launch this vehicle in the first half of 2025, with it being a cornerstone to the previous 20-30% delivery growth forecast given management’s intense focus on improving affordability for customers to drive delivery growth in 2024. Tesla can tout Q4’s production costs as the lowest on record, but the bigger picture shows that Tesla has made very little progress in actually reducing production costs over the past three years. In fact, production costs have declined just (5%), or ~$1,830, since the end of 2021, or a little more than a $150 reduction per quarter on average.
If Tesla’s goal is to make an affordable model at a $25,000 price point and make it profitable at scale, production costs would need to be more than 30% lower than current levels. A 30% reduction in production costs from Q4’s level would equal ~$24,300, or a gross margin of under 3%. To produce a $25,000 vehicle at a ~15% margin, production costs would need to come down to ~$21,750, or nearly 40% below its average cost. Simply reshuffling logistics scheduling to reduce quarter-end weighting of deliveries or relying on materials costs coming down in the face of tariffs is not enough.
And if this is truly something that is feasible to do within the year, it begs the question, why hasn’t Tesla done this yet? There is little evidence that Tesla can flip a switch and bring to market a sub-$30,000 or $25,000 vehicle in the first half of the year without significant damage to margins.
The Bigger Picture at Play for Tesla Stock is Eroding Earnings
While I have heard numerous times that discussions on margins are short-sighted and that the bigger picture for Tesla is the long-awaited autonomous driving and robotics growth curve, I want to make clear that margins have led to a significant erosion in Tesla’s earnings power over the past few years.
At the beginning of 2023, Tesla was expected to earn $8.50 in earnings per share in 2025. At that time, automotive gross margin had actually contracted 5 points YoY, down from 29.2% in Q4 2021 to 24.3% in Q4 2023. To put it another way, Tesla was generating more in automotive gross profit at half the scale.
In Q3 2021, Tesla generated $3.67 billion in automotive gross profit, or $3.24 billion excluding leasing and regulatory credits, with deliveries of 241,391. In Q4 2024, Tesla generated $3.29 billion in automotive gross profit, or $2.39 billion excluding leasing and regulatory credits. This gross profit and margin erosion is why adjusted EPS peaked at $4.07 in 2022 and has since dropped to $2.42 in 2024.
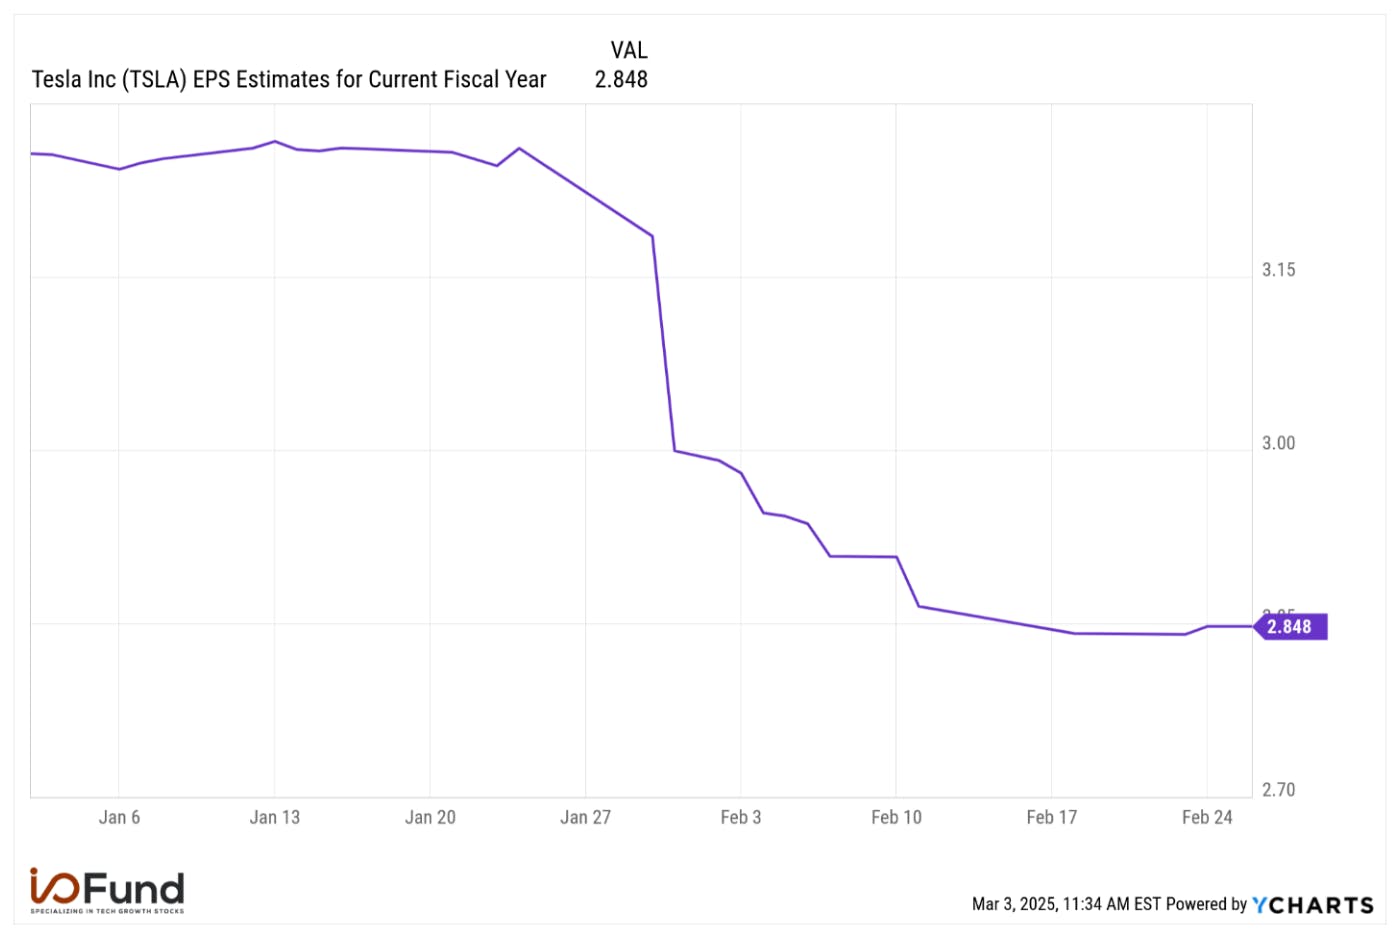
Now, 2025’s EPS forecast stands at just $2.85 at the beginning of March, more than (66%) lower than the estimate from two years ago. It’s also a rather sharp decline this year, down more than (12%) from $3.25 in mid-January.
Tesla stock’s EPS estimates have fallen -12% so far in 2025. Source: YCharts
This has been primarily caused by margin contraction and lower automotive gross profit, which have dragged operating margin much lower. Operating margin peaked at 16.8% in 2022, before contracting to 9.2% in 2023 and now to 7.2% in 2024, with Q4’s operating margin at 6.2%.
Robotaxis, Optimus Inconsequential to Tesla’s Growth in 2025
Robotaxis and Tesla’s Optimus humanoid robots are two core anchors for a majority of the multi-trillion-dollar valuation thesis, with Musk throwing out in Q4’s call that Optimus has “the potential to be north of $10 trillion in revenue.” However, for 2025, even if both are achieved, they’re likely to be only for internal use and not ready for commercialization in a way that will contribute to growth.
Tesla says that it is planning to launch unsupervised FSD as a paid service in Austin, Texas in June, with Tesla’s fleet testing the service out at its factory, from the end of the production line to the destination pick-up parking spot. Musk explained that Tesla is aiming to have unsupervised services with its internal fleet in multiple cities by the end of 2025. Tesla is also seeking the first permit to pave the way for an approval for robotaxi services in California.
However, given that FSD is still Supervised for consumers, analysts had questions about the progress Tesla is making on reaching full autonomy (ie. hands-off, eyes-off), with management explaining that it is close but not there yet:
“We need to be very confident that the probability of injury is low before we allow people to check with their email and text messages. … We're in this perverse situation where people will turn the car off autopilot so the computer doesn't yell at them, check the text messages while steering the car with their knee and not looking out the window. … If you have any problems with the system and when people are not looking, that is a dangerous thing. And that's what we're trying to avoid. The capability is getting there, but it's not fully there.”
Though Tesla laid forth that goal to have a robotaxi service running as soon as this summer, and discussed its ramp profile in Q3, the company provided no major update in Q4 on the Cybercab, its purpose-built robotaxi. Tesla said that it would be aiming for volume production in 2026 with a ramp to at least 2 million vehicles per year, potentially as high as 4 million in the future.
For Optimus, Musk threw out a rather sensational $10 trillion revenue figure, though he shared more details about the robot and Tesla’s production projections. Musk explained that the current production line Tesla is “designing is for roughly 1,000 units a month of Optimus robots. The next line would be for 10,000 units a month. The line after that would be for 100,000 units a month.” He added that Tesla will “probably not” succeed in manufacturing 10,000 in 2025, which is what its internal plan targets, but will aim to ramp production significantly faster than its automotive side.
Musk also predicted that it would not “take very many years before we're making 100 million of these things a year,” though initial use cases for Optimus will be inside Tesla factories, with commercial sales not expected until at least the second half of 2026. If anything, scaling production of either robotaxis or Optimus this year will likely add to costs and impact the bottom line.
Note on Tesla’s Capex
What’s interesting is that even with the $10 trillion revenue potential (and 100 million production numbers) for Optimus and 2 million for Cybercab, Tesla’s capex is not expected to meaningfully increase from 2024’s levels over the next three years. For 2025, 2026 and 2027, Tesla said that it expects capex to be at least $11 billion, compared with $11.34 billion in 2024. Musk had said in Q4 that Optimus’ AI training needs are “probably at least ultimately 10x of what's needed for the car,” suggesting significant amounts of compute would be needed.
In 2024, Tesla’s AI infrastructure assets rose $3.6 billion YoY to $5.15 billion, and it is still working on developing FSD. If you have to scale the compute factor by 10x, while ensuring plants can handle manufacturing millions of Optimus robots, millions of Cybercabs, existing models and a new affordable model, maintaining capex at or above $11 billion annually does not seem sufficient given that Tesla is just now approaching a 2 million vehicle scale annually after having spent close to $50 billion over the past decade.
Conclusion
Musk has been quite vocal about 2025 being Tesla’s “most pivotal year” and possibly the “most important” in its history. Despite strumming up optimism for Optimus and autonomous driving advancements this year, the growth story looks challenged with data for January and February showing substantial YoY declines across Europe and China.
Management’s commentary saw a subtle change from 20% to 30% growth in Q3 for deliveries to now only a return to growth mentioned in Q4, suggesting Tesla is also tempering expectations for deliveries in 2025.
2025’s EPS estimates are already dropping, falling more than 12% since the beginning of the year to $2.85, while revenue estimates have already been revised $4.3 billion lower to $112 billion. New products such as robotaxis and Optimus are unlikely to be growth drivers in 2025, with initial use cases likely limited to small scale and internal operations.
Margins came under more intense pressure in Q4, and are facing even more headwinds from idle capacity in Q1 as Tesla paused production in order to ramp up the refreshed Model Y, while Energy storage provided no relief despite a jump to record deployments in Q4. As Tesla is aggressively pushing for better affordability, it’s putting automotive gross margin at risk of falling into the single-digit range.
Price often bottoms before fundamentals, which means Tesla may be in a buy zone soon. Find out what potential entries the I/O Fund is watching for Tesla and other AI stocks in our upcoming webinar with Portfolio Manager Knox Ridley on Thursday, March 13 at 4:30pm EST. Learn more here.
I/O Fund Equity Analyst Damien Robbins contributed to this report.
Please note: The I/O Fund conducts research and draws conclusions for the Fund’s positions. We then share that information with our readers. This is not a guarantee of a stock’s performance. Please consult your personal financial advisor before buying any stock in the companies mentioned in this analysis.
Marvell reported in line results with Q4 revenue that grew by 27.4% YoY and 19.9% QoQ to $1.82 billion, beating estimates by 1.2%. Adjusted EPS grew by 30.4% YoY to $0.60, beating estimates by 1.6%.
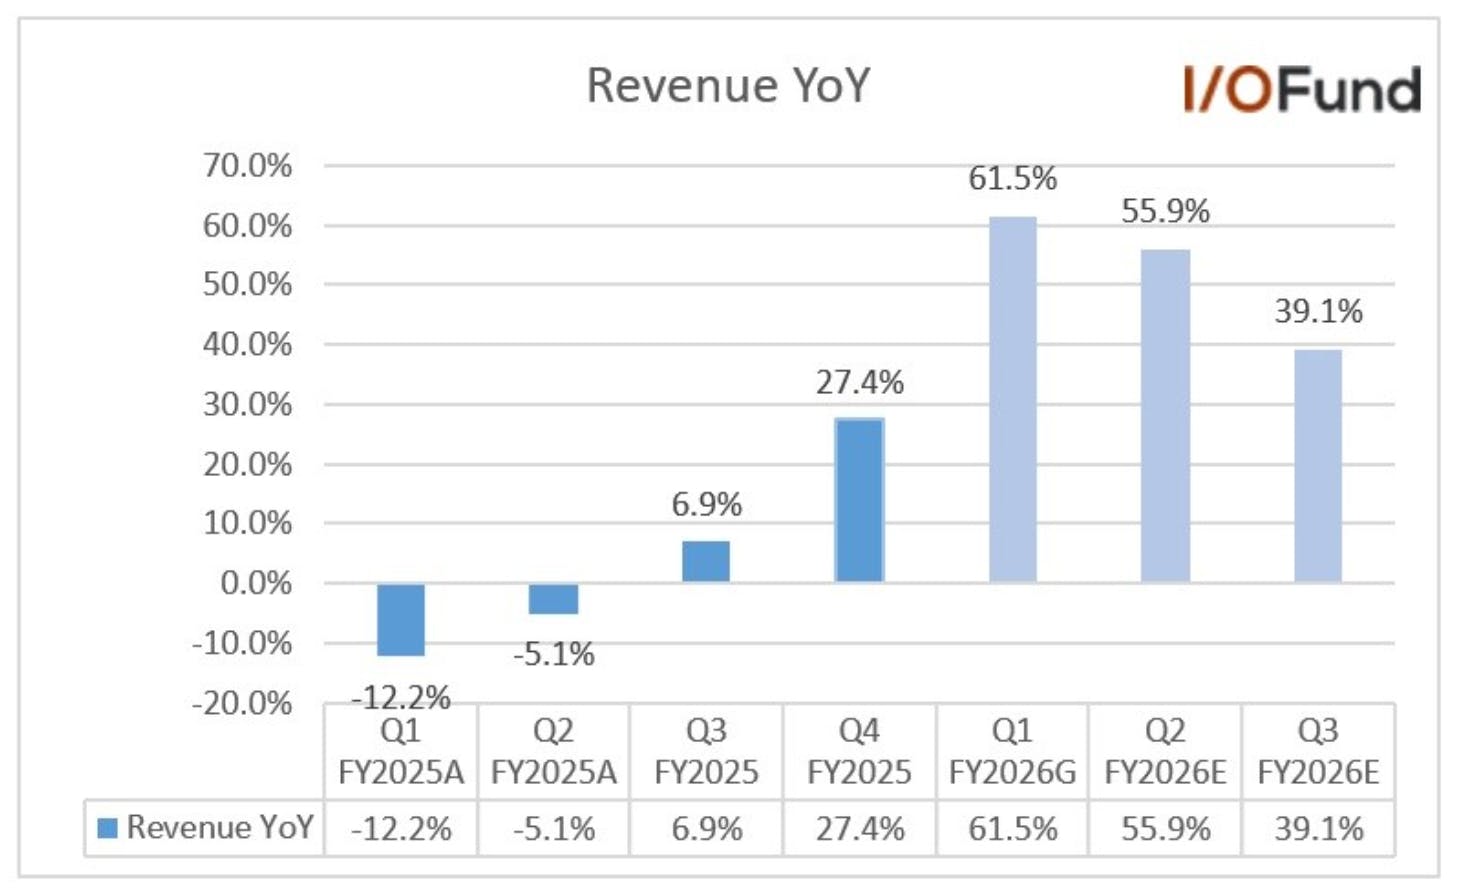
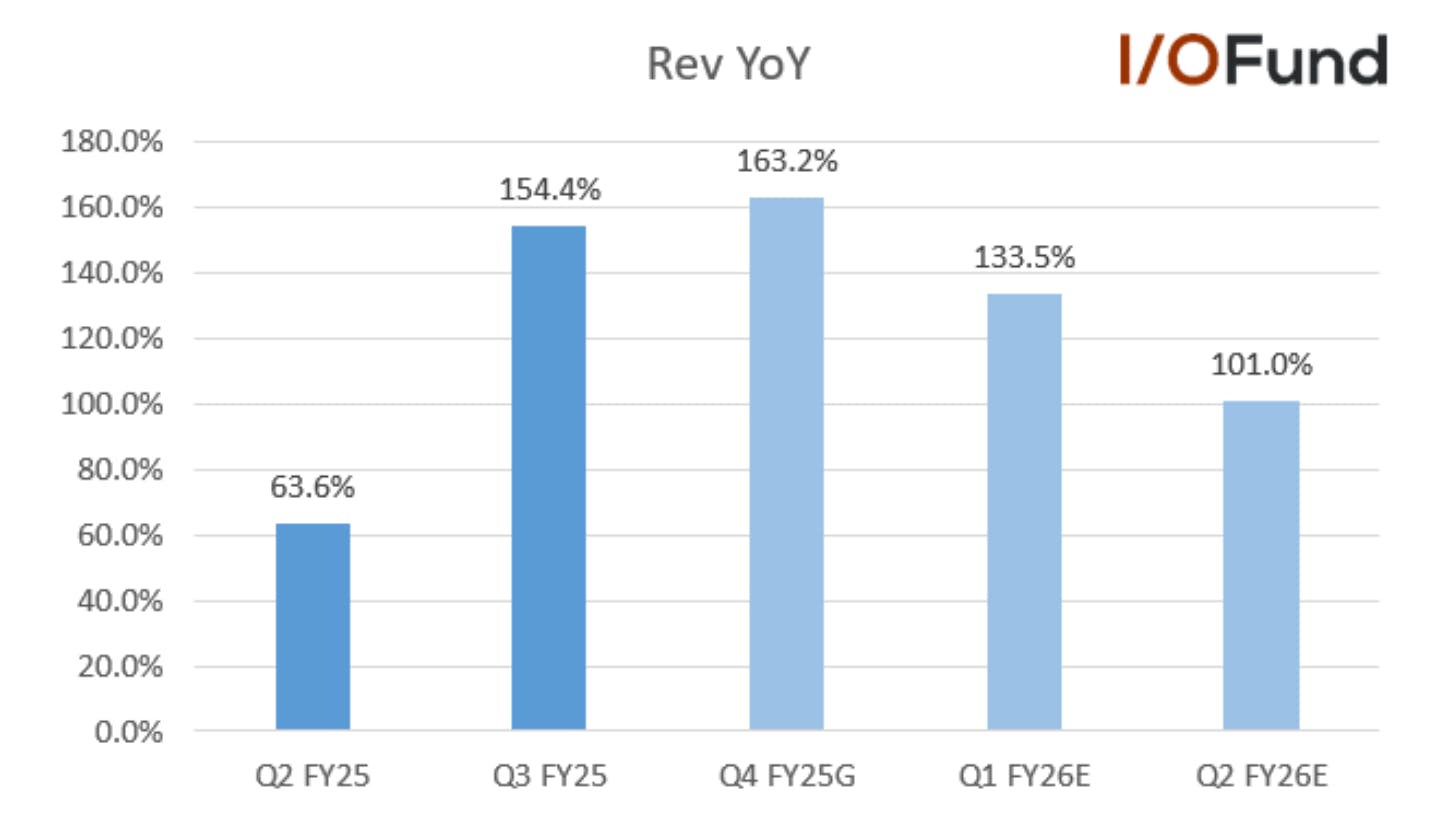
Management guided Q1 revenue of $1.875 billion, representing a YoY growth of 61.5% YoY and 3.2% QoQ at the midpoint, beating estimates modestly by 0.3% and expects adjusted EPS to grow 154.2% YoY to $0.61, beating estimates by 1.7%.
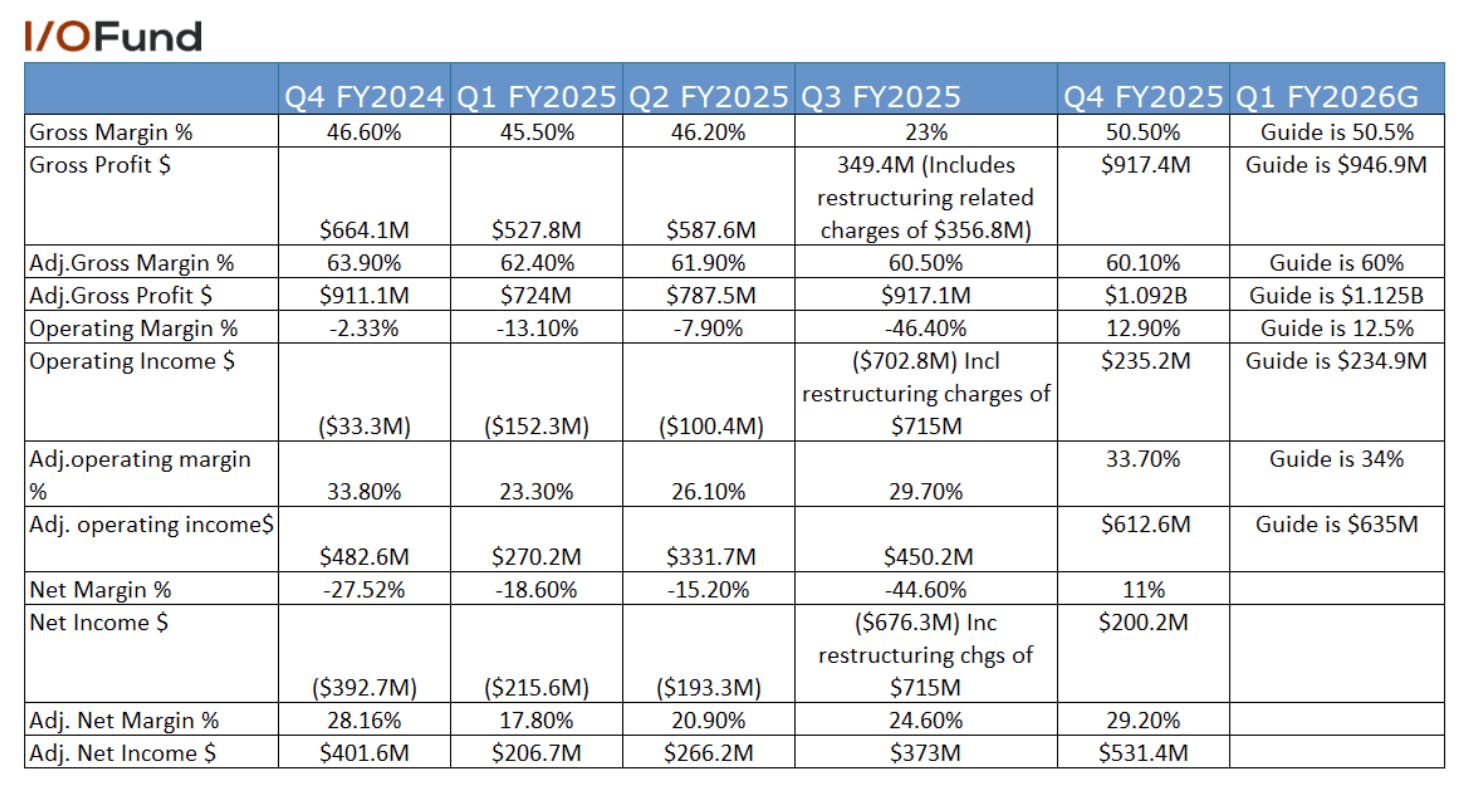
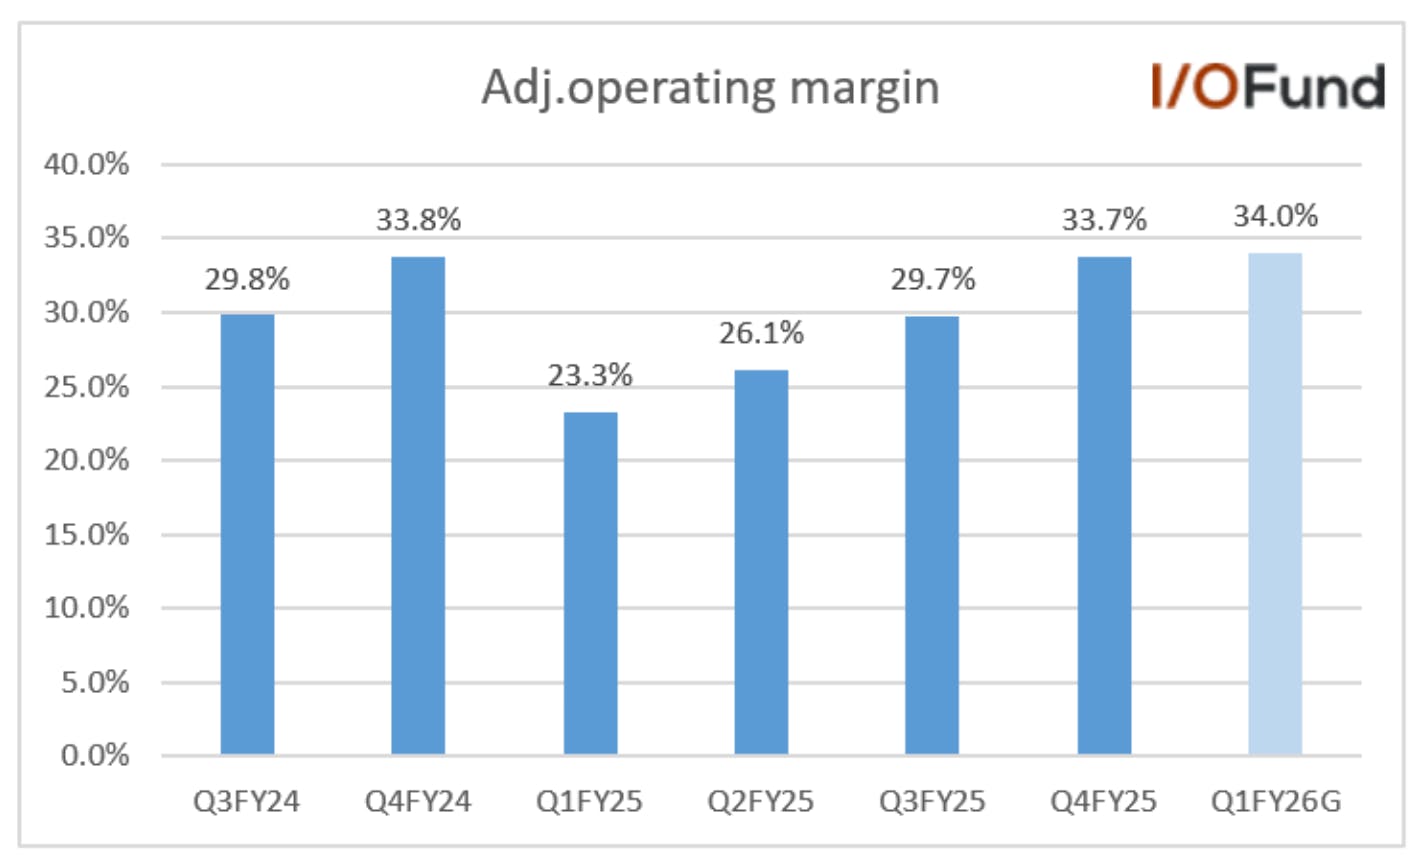
The company’s margins have improved from negative GAAP operating margin (often double-digit negative) to 12.9% in the most recent report. The adjusted operating margin of 33.7% was flat but on higher revenue, resulting in adjusted EPS that grew 40% sequentially.
The market is going through a phase of AI capitulation. Our site is particularly helpful here as Knox sets out price targets months in advance on his webinar for AI stocks, offering two scenarios – a pullback scenario and a breakout scenario. The AI selloff is behaving according to the scenarios he set forth months ago.
But for now, it’s retail against the Street. The Street is confusing narratives, lowering price targets despite blowout earnings (those lowered price targets are 100% above the price in some cases), and more specifically to Marvell, stating Amazon Trainium revenue should have been higher. Management stated AI revenue was substantially above the $1.5 billion target for FY2025, and they expect to exceed the $2.5 billion target in FY2026 significantly. The overall revenue growth accelerated in the second half of the year, driven by the custom silicon program ramps along with continued strong growth in Electro-Optics. However, these numbers have not changed for a few quarters now (the above $1.5B and $2.5B) and I’m sure the Street wanted more in terms of a new number given the 5-year deal with Amazon, implying Trainium2.
Although Marvell’s quarter was not a blowout, with some readthroughs being the Amazon deal is not as strong as expected, inventory is up 20% QoQ compared to 3% QoQ revenue guide, and management stated they are in “significant volume production ahead.” Overall, I’ve seen supply taking longer this quarter, thus within the framework of what I’ve seen, Q4 reports and Q1 guides are an air pocket of sorts across the board. Ultimately, there is $300B in capex saying the air pocket will resolve in the (patient) AI investor’s favor.
Hopefully, the multi-dimensional approach we offer by combining fundamentals and technicals – not only for lower entries that are discussed months in advance but also going so far as to hedge up to 100% of our portfolio — has proven its value over the past few months. Marvell is the most over-sold its been in its history – that is what is meant by capitulation. A bounce in price is on the horizon.
Revenue growth Headed to 61.5% Next Quarter
The company’s Q4 revenue grew by 27.4% YoY and 19.9% QoQ to $1.82 billion, driven by strong AI demand, beating estimates by 1.2%.
Management guided Q1 revenue of $1.875 billion, representing a YoY growth of 61.5% YoY and 3.2% QoQ at the midpoint, beating estimates modestly by 0.3%
Analysts expect revenue to grow 55.9% YoY to $1.98 billion in Q2 and 39.1% YoY to $2.11 billion in Q3.
FY2025 revenue grew by 4.7% YoY to $5.77 billion.
Analysts expect FY2026 revenue to grow 42.3% YoY to $8.21 billion and 20.5% YoY to $9.89 billion in FY2027.
Margins – GAAP Profitable
The company exceeded its margin guidance in Q4, driven by operating leverage, and achieved GAAP profitability. Management expects GAAP profitability to continue during FY2026.
Q4 gross margin was 50.5% compared to 46.6% in the same period last year. Gross margin was slightly above the guidance of 50%. Management guide for Q1 is 50.5%.
Adjusted gross margin was 60.1% compared to 63.9% in the same period last year. Management guide for Q1 is 60%.
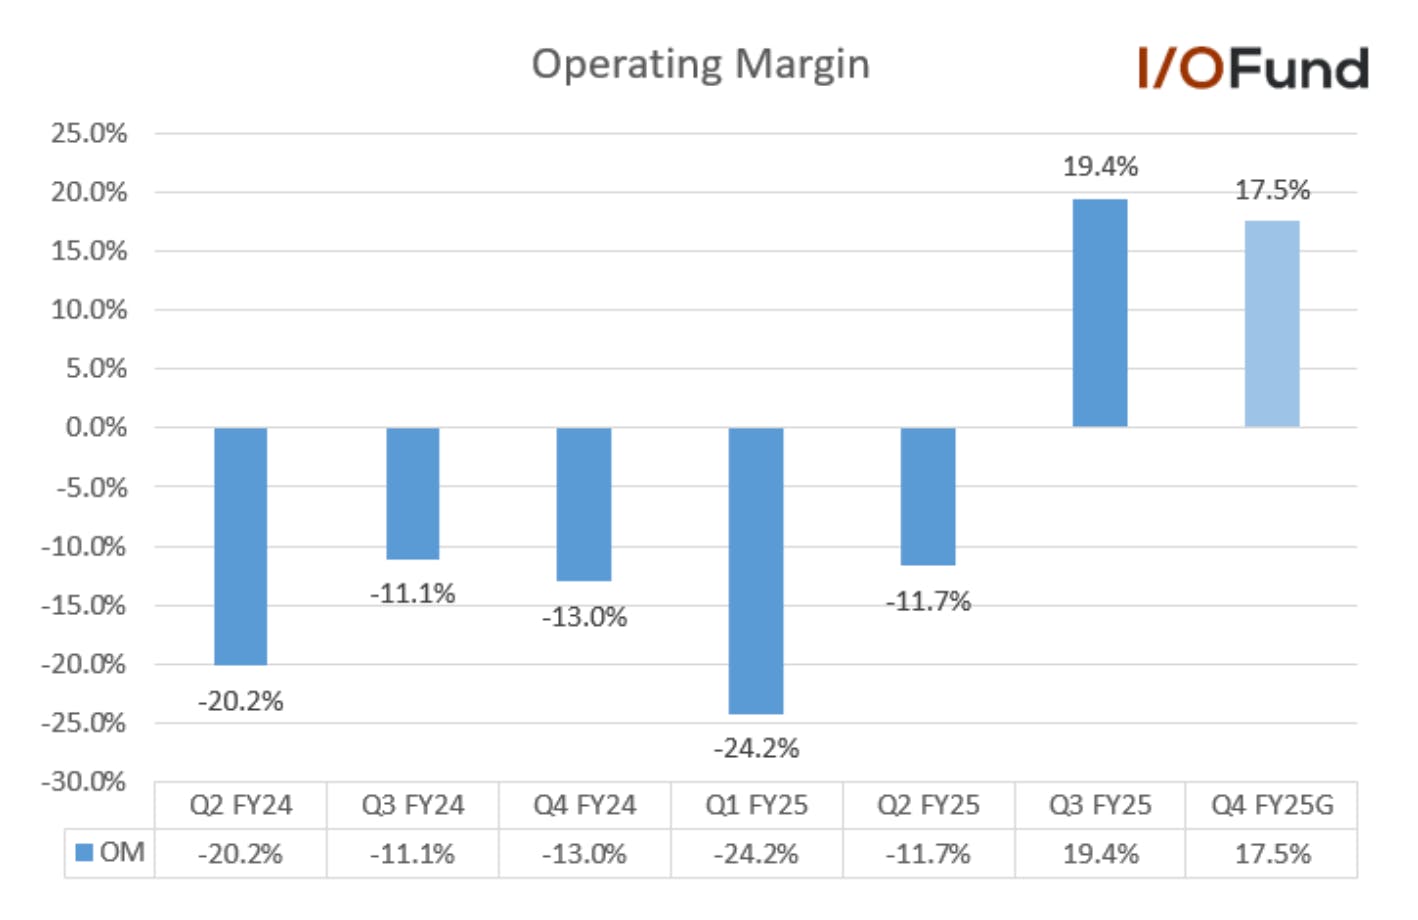
Q4 operating margin was 12.9% compared to (-2.3%) in the same period last year. It was above the guidance of 10.6%. Management guide for Q1 is 12.5%.
Adjusted operating margin was 33.7% compared to 33.8% in the same period last year. Managment guide for Q1 is 34%. Management expects strong operating leverage to continue in FY2026 and expects to make significant progress towards the long-term non-GAAP operating margin target of 38% to 40%.
Q4 net income was $200.2 million or 11% of revenue compared to a net loss of ($392.7 million) or (-27.5%) of revenue in the same period last year. Adjusted net income was $531.4 million or 29.2% of revenue compared to $401.6 million or 28.2% of revenue in the same period last year.
The difference in the GAAP net income and non-GAAP net income was due to stock-based compensation of $147.6 million or 8.1% of revenue and amortization of acquired intangible assets charge of $169.5 million or 9.3% of revenue.
Adj.EPS grew by 30.4% YoY and 39.5% QoQ
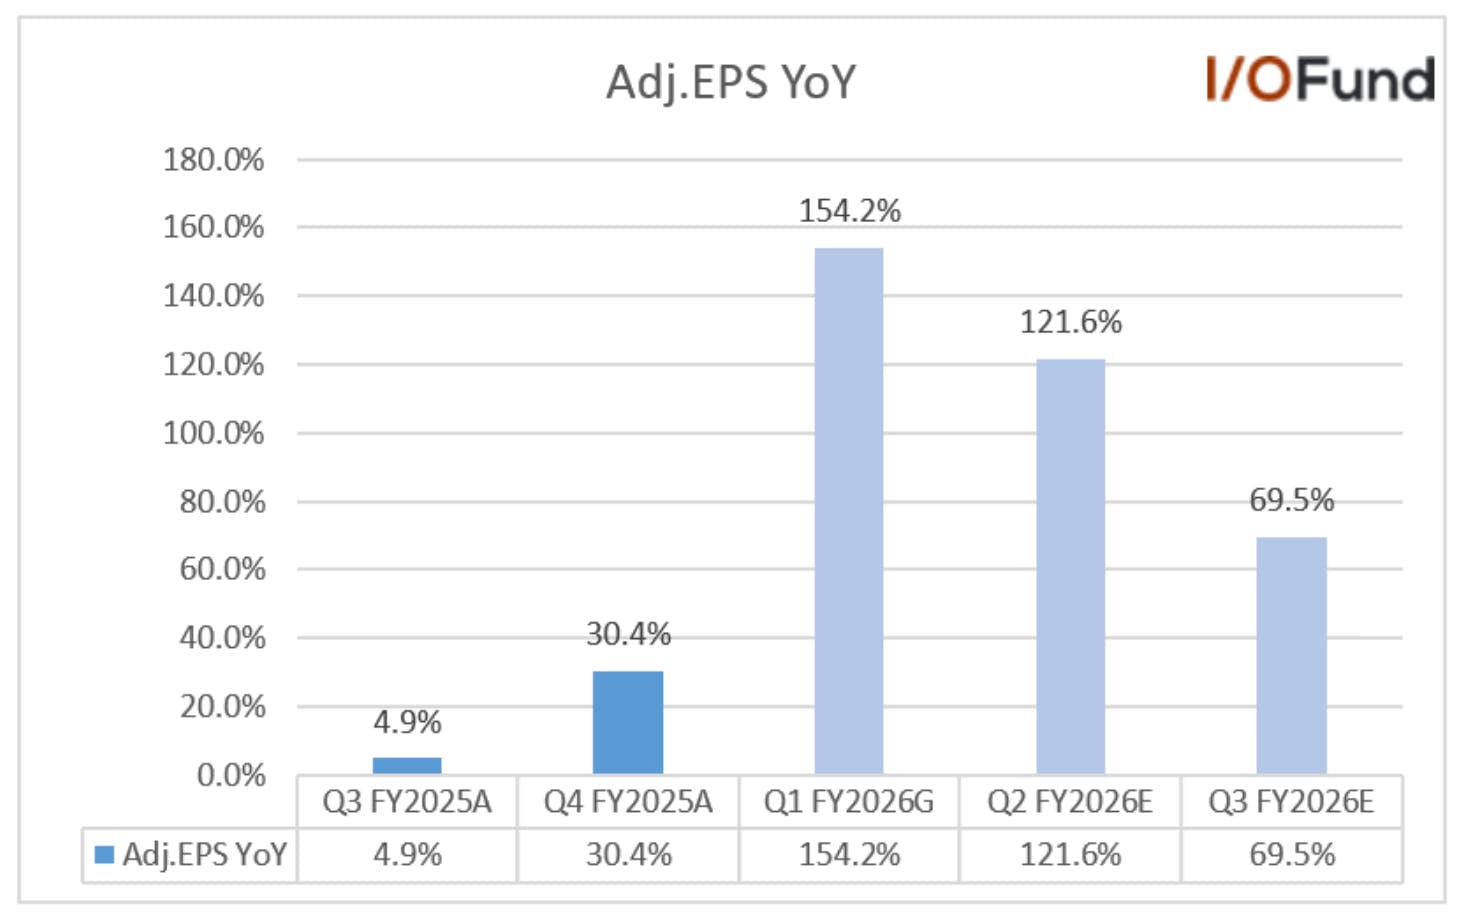
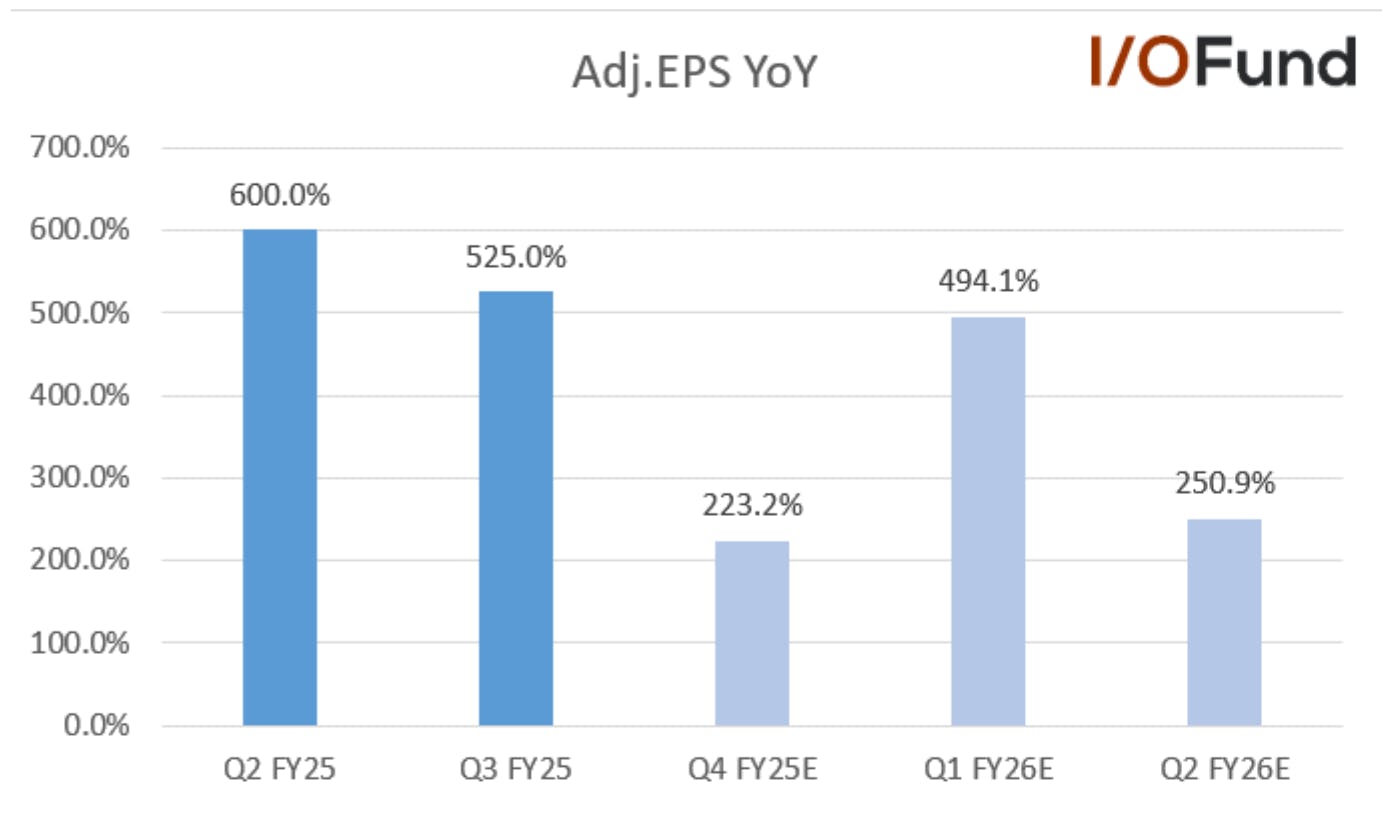
Q4 GAAP EPS was $0.23 compared to (-$0.45) in the same period last year. Q4 adjusted EPS grew by 30.4% YoY and 39.5% QoQ to $0.60 driven by operating leverage, beating estimates by 1.6%.
Management expects Q1 GAAP EPS of $0.19 and adjusted EPS to grow 154.2% YoY to $0.61, beating estimates by 1.7%.
Analysts expect Q2 adjusted EPS to grow 121.6% YoY to $0.66 and 69.5% YoY to $0.73 in Q3.
Analysts expect FY2026 adjusted EPS to grow 77.5% YoY to $2.79 and 31.8% YoY to $3.67 in FY2027.
Cash Flow and Balance Sheet
The company’s cash flow margin was lower due to the increase in inventories to support the strong expected growth.
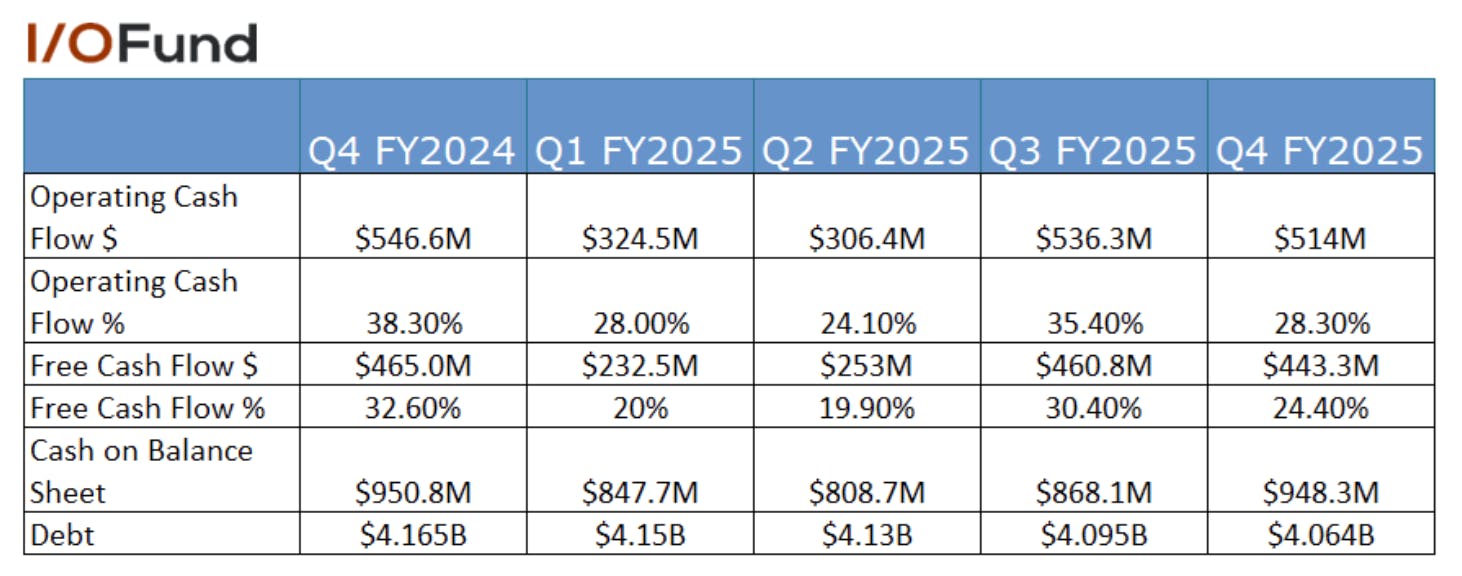
Q4 operating cash flow margin was 28.3% compared to 38.3% in the same period last year.
Q4 free cash flow margin was 24.4% compared to 32.6% in the same period last year.
Cash was $948.3 million and debt of $4.06 billion compared to $868.1 million and $4.1 billion at the end of Q3.
The company paid $52 million in dividends and repurchased shares worth $200 million in Q4.
Management mentioned that they received an upgrade to investment grade credit rating from Fitch which is positive as it helps the company to refinance its high debt with better terms in the future. The company’s CFO Willem Meintjes said in the earnings call, “We were pleased to receive an upgrade to our investment grade credit rating from Fitch in January, citing their positive outlook on Marvell's strong operating momentum from robust data center demand, structurally improved leverage metrics, strong market position and strengthened cash flow profile.”
Inventories increased to $1.03 billion from $859 million in Q3, up 19.9% sequentially to support the strong expected growth.
Key Segments
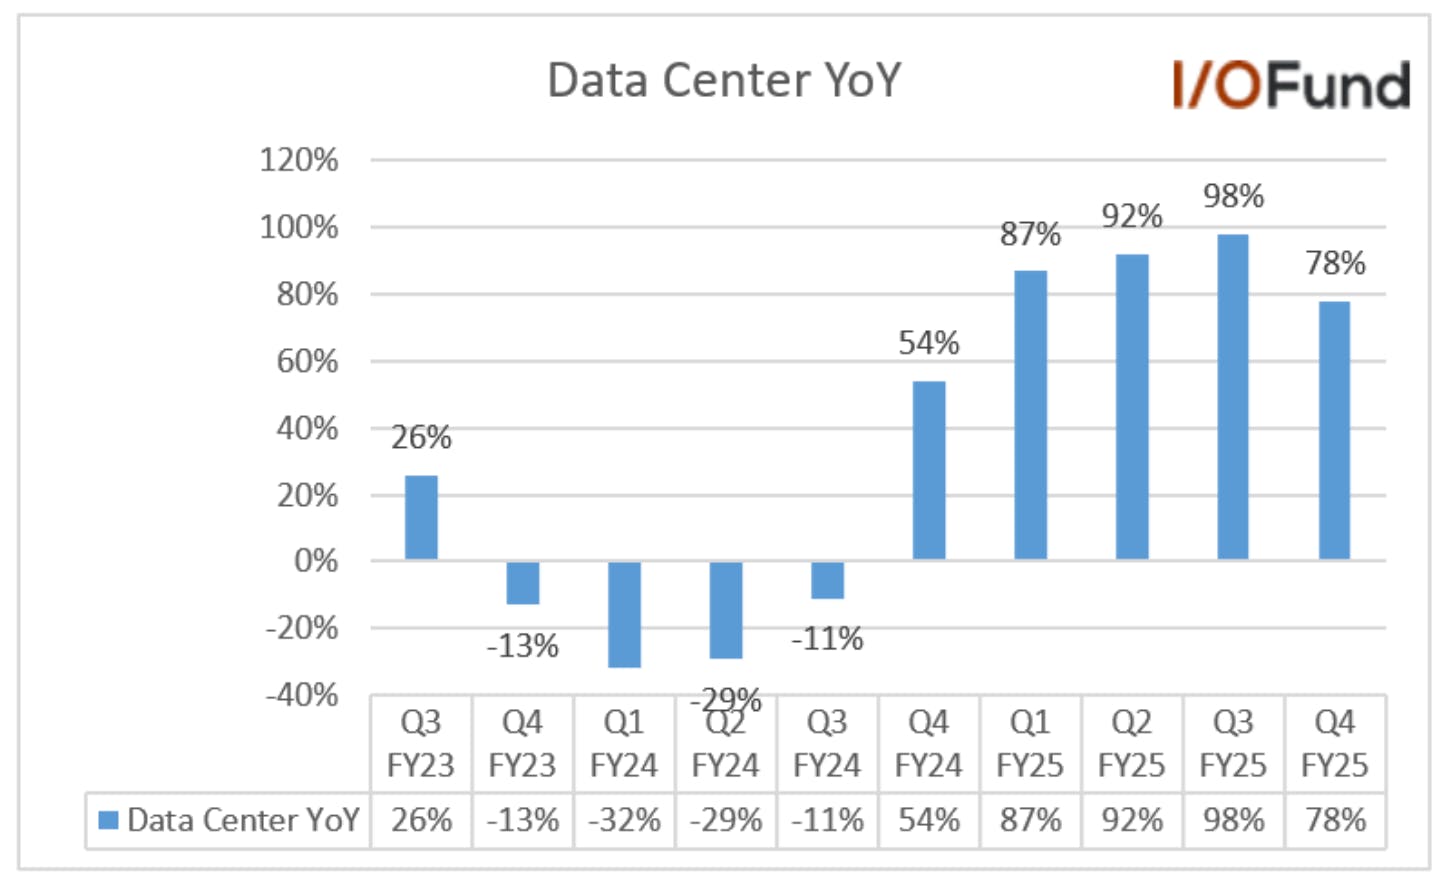
Data Center 78% YOY and 24% QOQ
The company achieved record Q4 revenue of $1.37 billion, growing 78% YoY and 24% QoQ. The strong results were driven by the custom AI silicon programs ramping to high volume production. Additionally, the company also benefited from strong shipments of Electro-Optics products and Teralynx Ethernet switches with revenue from both product lines growing double-digits sequentially on a percentage basis. Management pointed toward the 800G PAM4 products as being the workhorse in its electro-optics products. Marvell is also at the leading edge of 1.6T PAM DSPs and will be first to introduce the 3nm 1.6T DSP with 200G per lane.
AI Revenue Commentary
Management mentioned that AI revenue was substantially above the $1.5 billion target for FY2025, and they expect to exceed the $2.5 billion target in fiscal 2026 significantly. The overall revenue growth accelerated in the second half of the year, driven by the custom silicon program ramps along with continued strong growth in Electro-Optics.
Here is what was said in the opening remarks:
“We ended the year with our AI revenue substantially above our $1.5 billion target from April 2024's AI Day and we also expect to very significantly exceed our $2.5 billion target in fiscal 2026.” It was later stated: “Last year, we had talked about $1.5 billion. We blew through that — this year, again, we anticipate being substantially above that. I'm not putting a number on it just yet. I think that there's a lot to go here in terms of the momentum in the business and the opportunity set in front of us. And so we're, right now, we're kind of keying off the last update we did, which was in the AI Day from last year and then we'll find the right appropriate time in the future.”
Carrier Infrastructure
Carrier Infrastructure Q4 revenue was down (-38%) YoY and up 25% QoQ to $105.8 million. Revenue accelerated from the (-73%) YoY decline and 12% sequential growth in Q3.
Enterprise Networking
Enterprise Networking Q4 revenue declined by (-35%) YoY and up 14% QoQ to $171.4 million. Revenue accelerated from a decline of (-44%) YoY and flat QoQ in Q3. The company witnessed continued recovery in both Carrier Infrastructure and Enterprise Networking with revenue collectively growing 18% sequentially. Management expects aggregate revenue from enterprise networking and carrier infrastructure to grow sequentially by approximately 10% in Q1.
Consumer End Market
Q4 Consumer End Market revenue declined by (-38%) YoY and (-8%) QoQ to $88.7 million. For Q1, due to seasonality in gaming demand to expected to drive a sequential decline of (35%) in the consumer end market. Over the next several years, management expects the consumer end market revenue to be approximately $300 million on an annual basis.
Automotive/Industrial
The automotive/industrial revenue grew by 4% YoY and 3% QoQ to $85.7 million in Q4. The management expects continued sequential growth in the automotive end market. However, this growth will be more than offset by a decline in revenue from the industrial end market, where order patterns can be lumpy in any given quarter. As a result, they expect the overall revenue from the auto and industrial end market to decline sequentially in the high-single-digits on a percentage basis for Q1.
China Revenue
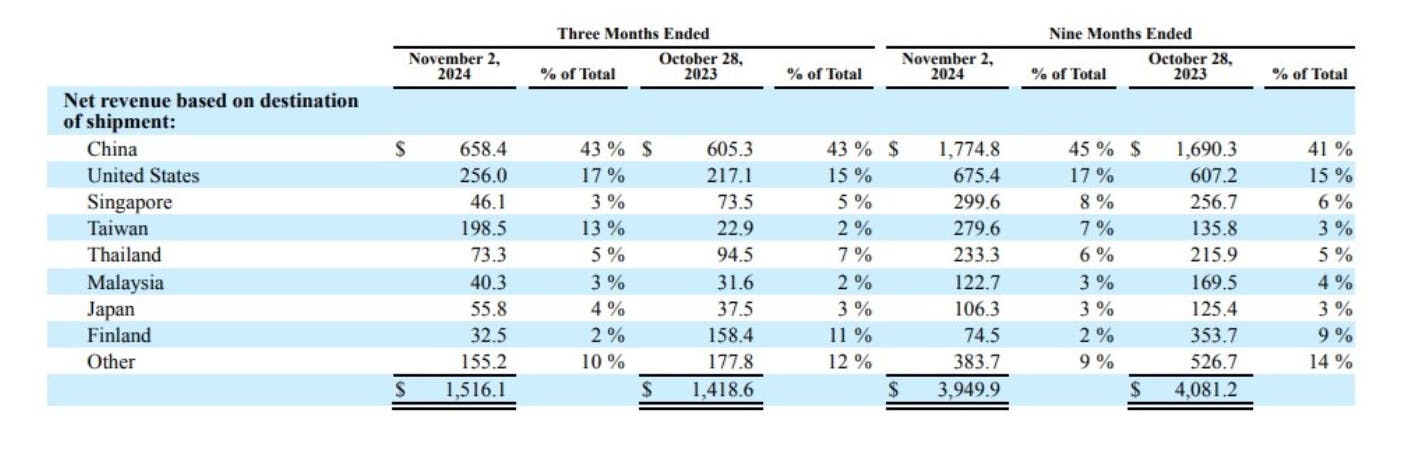
Marvell has a high China revenue concentration. It constituted 43% of revenue in Q3 and 45% for the nine months ending Q3. There was no mention of China during the recent earnings call, and we need to wait for the 10-K report to know the latest percentage of revenue from China. The high revenue concentration is a concern, notably since the recent tariffs increased from 10% to 20%.
Earnings Call:
XPU Design Discussions (Likely Amazon)
Regarding the custom design projects, Marvell stated the following in the opening remarks: “Let me now turn to our current custom silicon programs. Marvell has successfully ramped highly complex 100 billion plus transistor XPUs and CPUs from initial samples to high volume production on first pass silicon […] As I mentioned, our two leading AI custom programs are in high volume production, and we expect growth to continue. One of these is a custom ARM CPU, which we expect we'll see expanding adoption in our customers' data centers. The second program is for a custom AI XPU, which is also performing extremely well with significant volume production ahead. In parallel, we are fully engaged with this customer on the follow-on generation of this XPU and planning for a production ramp once it completes its sampling and qualification cycles.As a result, we expect our revenue from custom XPUs for this customer to not only grow this year, fiscal 2026, but continue to grow next year fiscal 2027 and beyond.”
There is a second hyperscaler, perhaps Meta, with potential “to start production in calendar 2026.”
In the call, analysts asked more about the lead customer. From the Q&A discussions below, I did not have a readthrough that Marvell lost Amazon’s Trainium2 business:
Harlan Sur
Hey, good afternoon guys. Thanks for taking my question. Great to see that you captured the follow-on AI XPU program after your current XPU program, which is ramping now with your major cloud and hyperscale customer. Matt, just to clarify. So is the new follow-on XPU program, a training XPU as well? Is that a calendar '26 ramp? And is that at 5-nanometer or 3-nanometer? Any more color there would be helpful. And then for Willem, your inventories were up 20% sequentially, which in a strong demand and product cycle environment like typically implies strong future growth, but you compare that to the 3% sequential total revenue guide for April. There seems to be some disconnect. So the way to interpret this is that the 20% sequential growth in inventories is more reflective of the AI strong growth profile ahead for the team?
Matt Murphy
Yes, I'll start off, Harlan. So, yes, so couple of things. So again given the confidentiality wrapper we've got, here we go. The first is you should assume this is a — it's a very high volume program and it's a continuation of what we're doing. It on the — and you should assume just in general, on every next generation type of device, you're going to see no transitions and technology advancements as you go forward. So you should assume that. And then also on a timing perspective, all I can say there is we'll be ready to ramp when it's time, and we'll manage that transition. We're very confident in our ability to manage that transition successfully with our customer, but that timing is something that we're just going to have to see when that's ready and we'll time it around that. And I can't really comment on what my customer plans are in this kind of detail, they just don't like it, and I don't blame them. And I'll give — I'll let Willem take the inventory question. Thanks.
Note: the answer above is about the next program which management is reluctant to discuss due to confidentiality
While the above quote was clear that another analyst was not expressing concerns about the loss of the lead customer (quite the opposite), it was perhaps even more clear on management’s side in this fairly long exchange:
Ben Reitzes:
Hey, guys. Thanks for the question and thanks for the intermission there in the middle. That was a nice break. The question that I have is with regard to sequential growth, Matt, and then a long-term question. Did you clarify that AI revenue could grow sequentially through the year? And did — when Tim asked his question earlier? And if so what's your confidence? And then if you could just kind of step back also, Matt, a lot of noise due to the speculation around that customer and content there. But when you step back, you have a goal of $15 billion for the data center long-term by calendar year '28 are you seeing the progress in your custom business still to hit that number because nobody on the street is even close to that. Thanks.
Matt Murphy:
Yes, Ben, thanks for the questions. So, yes, on the assumptions through the year, yes, I didn't, I think what I said was in Q1 our data center business ex the on-prem stuff was going to be up double-digits, coming off of overall data center like 25% a quarter sequentially. So I didn't comment throughout the whole year, but you should just you should just assume. It's not a bad assumption, right, or would be a fair assumption to think that it's obviously going to continue given the strength in the business and the momentum that we're seeing and just from what we're looking at from a year-over-year perspective. On the long-term, I think we're tracking extremely well to our 20% market share number. When we look back to kind of calendar '23 and then '24 and '25 and you start bouncing it up against what we said at the AI day. I think it looks very favorable. We're definitely gaining share from '23 to '24 and we'll definitely gain more share from '24 to '25. And so to get to that revenue target, you got to get there both ways. You got to grow the share, right, from kind of 10%, let's call it to 20%. And then the market's got to develop, right, obviously. You got to get to the sort of $75 billion TAM, but both of those are trending in a very positive direction. In fact, certainly in '24 and even in '25 is just kind of big round numbers, it looks like both the market and our growth, if you just bounce it up against sort of what's the compounded growth rate you needed from '23 to '28, it's actually growing above that right now. So now when we're in ramp phase, but that's going to continue. So I think we're in very good shape in terms of where we're tracking from a market share perspective. And certainly, if the market, by the way, is bigger. I mean remember, we gave that point of view in April of last year. And the world has changed then since then in terms of the absolute CapEx that's being deployed, certainly, even in recent months, all of the various programs from all the different key players and the potential of what's out there, sovereign programs, government programs, programs from new entrants. So we just see this — we just see the — quite frankly the TAM and the opportunity for Marvell, if anything, being way larger than it was when we looked at it almost a year ago. So all those make me feel very good about the market size developing and then certainly our progression on the market share. And you're right, that would be, it'd be an absolute home run to get there. And that's what me and my team are absolutely driving in this company day in and day out is drive the market share and help create the market, help make the TAM happen and execute like crazy and do it in a very focused manner, which is also why we reorganized the company with a dedicated data center engineering and business group to drive it. So I think the setup is really good. Thanks.
Networking Opportunity Expands TAM
We’ve covered Marvell’s networking products in great detail for six years now in previous analysis – this one is the most current. It’s a toss up as to whether Marvell’s custom silicon or networking opportunity will end up being the bigger market in a few years' time.
What was most interesting was that management discussed networking being incremental TAM to what was discussed above on custom silicon.
“The key thing I want to stress to you and to the investors on the call is this is incremental TAM the scale-up opportunity. We flagged it a few different times is right for sort of a TAM expansion. And it looks like that's what's going to play out at some point here. So that is all incremental. That's not, hey, if that happens and all of a sudden, Marvell's DSP revenue goes down or something like the scale up and this type of connectivity that is a revenue upside, market upside type of opportunity. So that one, I think, is — we're very excited about.”
Conclusion:
Despite design companies being in Nvidia’s shadow, Marvell put up a decent report. The company started the year at a run rate of $4 billion-ish and is now on a $7.5 billion run rate. They stated 75% of their revenue is from data center (this includes AI and on-prem, etc). Each investor will need to decide for themselves if the commentary or fundamentals reflects a weaker lead customer (Amazon). That’s not my readthrough from this report.
However, Marvell has higher debt and higher China revenue than our other semis, and that’s why we aren’t buying the report. We prefer to build other positions with less risk in these two areas, while acknowledging Marvell remains a strong AI contender – for both custom silicon and networking.
With that said, Marvell has never been more over-sold (technicals-wise) and is due for a bounce. Here is the note I got from Knox this morning, he will elaborate more in today’s webinar:
“Marvell has been trading for over 25 years. In this period, we have only seen the current level of oversold conditions 3 other times – 7/9/02, 10/9/08, 8/2/10. The first 2 were toward the tail end of bear markets: the period in 2022 period was followed by a +50% rally, before turning lower, while the period in 2008 was followed by a +20% rally in a short amount of time before eventually finding a bottom. The third period was not during a bear market and led to a +50% rally over the span of 6 months, before turning lower.”
Royston Roche, Equity Analyst at the I/O Fund, contributed to this article.
Please note: The I/O Fund conducts research and draws conclusions for the Fund’s positions. We then share that information with our readers. This is not a guarantee of a stock’s performance. Please consult your personal financial advisor before buying any stock in the companies mentioned in this analysis.
The world today was engineered to be ephemeral and noisy, with tens of millions of posts, comments, and messages sent across social media and messaging apps every minute of every day.
For an investor, this noise is a terrible combination, and we believe the antidote to noise is quality stock analysis. Due diligence requires dozens of hours per equity, and it takes hundreds to thousands of hours every year to produce free research and a paid platform with institutional quality analysis.
The I/O Fund strives to offer some of the industry’s best analysis for free alongside our premium content, and we believe the consistency and depth of what we provide for investors is hard to replicate in the most challenging sector for investors — tech.
Below are highlights from our free newsletter and premium research site during a strong year for AI and crypto. Although numerous investor favorites rose more than 100% during the year, many other popular tech stocks declined significantly. We offered our readers clues and insights for the leading stocks in AI semiconductors and software, providing unparalleled depth and quality with full transparency into our own trades in real-time.
While calling out Nvidia’s AI thesis at $3.15 in late 2018 for our free readers with gains of over 4,000%* is one of our most notable calls, the I/O Fund strives to offer unparalleled quality in its analysis each week sent straight to your inbox – sign up here.
1) Nvidia to Surpass Apple’s Valuation
Right out the gate in 2024, the I/O Fund’s free newsletter expanded on Lead Tech Analyst Beth Kindig’s highly regarded 2021 prediction that Nvidia would surpass Apple’s valuation within 5 five years; which at the time, this prediction was inconceivable as it would require not only Nvidia to go up more than 350%, but also for the tech leader Apple to plateau. Ultimately, Nvidia went up more than 500% since that call, and is up 900% between Jan 1st 2023 and Jan 1st 2025 while Apple is up 70% in that two-year time frame.
Kindig explained why she would deliver on this prediction a whole 2 years early in the February 2024 analysis, Nvidia Stock Gained $1.5 Trillion To Surpass The FAANGs – Apple Is Next. In the analysis, she pointed out that it was not just the consistency and magnitude of Nvidia’s multi-billion dollar revenue beats, but the expansion of its margins and earnings as revenue grew >200% for multiple quarters as it approached a $90 billion annualized scale.
From Kindig’s August 2021 prediction to the February 2024 update, Nvidia posted some staggering growth numbers, such as 676% growth in data center revenue, 240% growth in total revenue, 400% growth in quarterly EPS, and a 20% expansion in operating margin.
The I/O Fund provided a handful of reasons that would propel Nvidia to quickly become the world’s most valuable company. This included the long runway for AI accelerators, citing forecasts that the market will reach $400 billion by 2027 – with Nvidia taking the lion’s share. An additional reason Kindig provided was Nvidia’s accelerated product roadmap to a one-year release cadence, which let the stock continue to pry away Big Tech capex spending of $200 billion. She also pointed out the software opportunity beckons to extend Nvidia’s runway, already reaching a $1B+ run rate. These tailwinds combined with a valuation that was “eerily low” at the time given the stock’s rapid ascent through 2023.
The I/O Fund’s ongoing consistency and accuracy on this stock dating back to 2018 for up to 4,000% returns with the first entry at $3.15 has been unparalleled – more recently, premium members received nine real-time buy alerts below $20 in 2021 and 2022; learn more here.
2) Pinpoint Accuracy for Risk Managing Bitcoin to $100K+
In 2024, Portfolio Manager Knox Ridley provided two crucial updates on the I/O Fund’s game plan for Bitcoin. His updates are watched with anticipation from our free readers as he previously nailed Bitcoin’s top at $58,000 and then nailed Bitcoin’s subsequent bottom at $16,500.
His first update last year was in April 2024, where he increased his target zones. At the time, Bitcoin was an overlooked asset compared to the over-hyped Mag 7, yet the asset has delivered superior returns compared to all of the great large-cap tech stocks in this bull cycle, minus Nvidia, while having a low inverse correlation to tech.
Utilizing technical analysis and on-chain data in the analysis We Are Raising Our Bitcoin Targets To $106K – $190K, Ridley explained that the I/O Fund was now raising its target zones for Bitcoin to $106,000 to $190,000, up from the previous zone of $75,000 to $130,000. Bitcoin was trading in the mid-$60,000 range at the time, with Ridley saying that “the $42,750 support region holds on any ongoing volatility, then we have no reason to doubt the uptrend in place.”
Ridley provided another update to the Bitcoin thesis at the end of July 2024 in the analysis, Bitcoin Update: Next Stop $100,000; Bitcoin finally surpassed that historic level as 2024 came to a close. He explained that Bitcoin had “a full corrective pattern in place that ended around $54,000 in early July,” which “suggests we are in the early stages of the next rally.”
The I/O Fund had systematically been accumulating since the start of this cycle while raising our critical supports along the way — below is the history of Bitcoin buy alerts that the I/O Fund issued to our subscribers in real-time since early 2023.
Source: I/O Fund
Notably, our firm assisted our readers in capturing immense upside from the two top-performing large-cap tech positions in 2023 and 2024 with Nvidia and Bitcoin; the fact we also provided ongoing entries and risk management for these mega-winners cannot be understated in terms of the value we have delivered. To refer our newsletter to your friends and family, please click here.
3) Top Crypto Company Allocation Increased Ahead of Election to #1 Position
To find out the stock ticker of the “Top Crypto Company,” subscribe to our premium service.To find out the stock ticker of the “Top Crypto Company,” subscribe to our premium service.premium service.
Given the I/O Fund’s strong track record with technical analysis to predict Bitcoin’s moves, the team was able to identify a top crypto stock on the public markets to add to the I/O Fund’s portfolio in September. This was partly due to the stock having a high correlation with Bitcoin.
We first added this stock in September as Bitcoin showed signs of playing into the I/O Fund’s analysis where the leading crypto asset would see a move to $100,000, up from the high $50,000 range at the time.
Following the election, The Top Crypto Company stock became the second highest performer in the exuberant-led rally of early November. It was the I/O Fund’s largest allocation at the time with the team locking in gains of 82% and 111% in a brief few months.
The team highlighted the company’s diversification including a Layer 2 offering and opportunities in derivatives as potential catalysts. The company also has a large cash reserve, which is rare for tech stocks with its market cap.
4) Palantir’s Revenue Acceleration
In December 2023, the I/O Fund outlined four cloud stocks set to see revenue accelerate in 2024, with Palantir one of the four. We had said that Palantir was “exhibiting multiple signs of acceleration heading into 2024 with an improved fundamental backdrop driven by increasing AI demand. Palantir’s Artificial Intelligence Platform (AIP) is driving a significant acceleration in its US commercial business, while underlying metrics and the bottom line are rapidly improving: Palantir posted its first GAAP profitable quarter in February and has since reported four consecutive GAAP profitable quarters.”
We explained that “revenue growth is poised to accelerate in Q4 and through 2024, boosted by AI demand, a reacceleration in Palantir’s US government segment, and continued strength in the US commercial segment stemming from [AIP].”
Sign up for I/O Fund's free newsletter with gains of up to 2,250% because of Nvidia's epic run – Click hereSign up for I/O Fund's free newsletter with gains of up to 2,250% because of Nvidia's epic run – Click hereClick here
Palantir continued to blow past expectations through 2024 — Q4 revenue capped off a strong year as Palantir beat its own guidance by nearly $60 million, with revenue growth accelerating 6 points to 36%, coupled with strong margin expansion, cash flow generation, and large net new customer additions in its key US commercial segment.
Palantir’s shares ended 2024 as the S&P 500’s best performer with a 341% return.
5) Meta to Outperform
In the January 2024 analysis, Social Media Stocks: One Metric Shows Meta’s Clear Leadership, the I/O Fund pointed out what separated Meta as a clear social media leader and why other social media apps would struggle with monetization. Since then, Meta shares have risen 82%, while Snapchat has declined -37%.
We explained that Meta was much more efficient with spending, maintaining R&D spending below 40% of gross profit while significantly improving operating margin and driving ad pricing and impressions growth, whereas Snapchat was “spending around 80% of its gross profit dollars on R&D… while failing to increase ARPU and monetization within its user base.”
We pointed out that what makes Meta a clear leader is that “it can maintain a high level of R&D spend … while remaining a cash cow with strong operating cash flow and free cash flow growth,” with OCF margin nearing 60% in Q3 2023 and OCF tracking for 50% YoY growth to $75 billion in 2023.
In a follow-up analysis in March 2024, Top 3 Ad-Tech Stocks For 2024, we said that Meta’s “key metrics [were] supporting a return to >40% operating margin for the full year and a possible >33% net margin, driven by increasing ad pricing, strong engagement trends and impressions growth, aided by the release of numerous AI features.” Meta ended 2024 with a 42.2% operating margin, a 37.9% net margin, and a 55.5% operating cash flow margin.
Stay on the leading edge of AI with I/O Fund’s high-performing tech portfolio, which had 10 positions outperform the Nasdaq-100 in 2024, many held at high allocations, and we are prepping for a strong 2025. Learn more herehere
6) Key Metric Acceleration in AI Software Stock for 96% Gains
To find out the stock ticker of the “AI Software Stock,” subscribe to our premium service.To find out the stock ticker of the “AI Software Stock,” subscribe to our premium service.our premium service.
The I/O Fund recorded gains up to 96% on this AI-exposed software stock in 2024, with its February 2024 earnings report showing acceleration in a handful of key metrics, supporting our conviction that this stock would capitalize on the opportunities of bringing AI to the edge.
This company’s management team dropped hints that AI would gradually become a more meaningful driver of revenue as workloads shift from training toward inference, supported by strong growth in key metrics and key platforms.
Key metrics and margins continued to improve in the August 2024 earnings report, with some strong growth metrics for its AI platform. The I/O Fund fully closed the position in December 2024 to lock in gains for the year, as a soft guide and valuation concerns rose to the forefront after its November 2024 earnings report.
7) Amazon’s Cloud Acceleration
In the February 2024 analysis AI Driving Acceleration For Big 3 Cloud Stocks, the I/O Fund discussed how AI was impacting cloud growth at Microsoft, Amazon and Alphabet. For Amazon, the I/O Fund explained that in Q4 2023, “AWS finally accelerated in Q4 for the first time in 2 years, with Amazon reporting 13.2% growth in Q4, up just over 1 point from Q3’s 12%.” However, the more important metric was AWS’ operating leverage improving in the second half of 2023, with operating income growth at 3x the rate of revenue in Q4 2023.
At the time, AWS was generating the majority of Amazon’s company-wide operating income (67% of 2023) due to its higher operating margin (27% in Q4 2023), which we had said was “a trend that can strengthen with AI driving accelerated customer and revenue growth and decreased costs.” This has played out, with AWS reporting a 37.8% operating margin in Q3 2024 and 36.9% in Q4 2024.
What the I/O Fund had seen in February 2024 was a combination of increased customer migrations, larger and longer duration contracts, increased incremental revenue QoQ, and opportunities to better monetize the suite via AI. These factors were the necessary ingredients for AWS to show “a sustained AI-driven acceleration,” even though its quarterly growth rates lagged Azure and Google Cloud. AWS growth has now re-accelerated to 19%.
In a follow-up article in May, Amazon Stock: Nearing $2 Trillion Club From AWS Growth & Ads Catalyst, we provided evidence that AWS was a primary contributor to Amazon’s push to the $2 trillion milestone — growth from AI quickly reached a multi-billion dollar run rate, while improvements in operating leverage at AWS aided Amazon’s bottom line.
8) Best-of-Breed Cybersecurity Stock Closed for 93% Gain
The I/O Fund is no stranger to the cloud sector, having selected some of the sector’s top names in 2021 in Asana and DataDog. This best-of-breed cybersecurity stock greatly piqued our interest in late 2023 as the company became GAAP profitable; a rare feat for cloud.
We noticed a few encouraging signs of growth in key metrics in late 2023, and predicted that by late 2024, this stock would have a positive GAAP operating margin, which would be seen as a breakthrough moment. As a result, this stock entered 2024 as one of our larger allocations.
The March 2024 earnings report showed a continued sequential expansion in GAAP operating margin and a strong acceleration in a major key metric. Despite reporting another quarter with positive operating margin and strong growth metrics in June 2024, the I/O Fund saw trouble ahead with the stock’s high valuation, and closed this position in July 2024, recording approximately a 93% gain. The stock later plummeted over 40% in a month due to a high-profile security hack with the I/O Fund able to side-step these losses and lock-in gains before the sudden reversal.
9) Explosive Growth in “AI Server Maker” for Triple-Digit Gains
To find out the stock ticker of the “AI Server Maker,” subscribe to our premium service.To find out the stock ticker of the “AI Server Maker,” subscribe to our premium service.our premium service.
The I/O Fund identified one of the few darlings of the AI trend in 2023, introducing this stock to our premium readers in May 2023 and calling out its growth potential from AI servers. The I/O Fund analyst team was early to identify the tremendous upside in the stock due to a doubling of its AI revenue from about $12B to $25B — and beat the Street to this conclusion.
This stock reported strong sequential and YoY growth in its December 2023 quarter in late January, with the I/O Fund adding for a final time as guidance once again seemed to be conservative. However, some red flags began to appear, and we later closed the position after digging deeper when it became apparent the company would need to continue to raise cash to fund growth. The stock later became the subject of auditing issues, and the team was able to side-step this by risk managing the position.
Starting in February 2024, we issued 7 sell alerts, fully exiting the position by May 2024 to log an average gain of over 275% on this position alone, which we held at a high allocation within our portfolio.
10) I/O Fund Reports 131% Cumulative Returns Through 2023 Due to Leading AI Allocation
In April 2024, the I/O Fund announced returns of 57% in 2023 as seven positions beat the Nasdaq-100, bringing its cumulative returns to 131% since inception. This compares to popular tech ETFs that have cumulative returns of (-10%) in the same time period for an outperformance of 141% in less than four years.
If you had invested $10,000 with the I/O Fund’s picks versus other all-tech portfolios at inception, the difference would be a portfolio value of $23,052 with IOF versus $8,982 with institutional tech-focused portfolio. The difference in value is 157%.
Impeccable timing on Nvidia and other AI stocks led to the I/O Fund having one of the highest allocations to AI on record at 45%, and this high allocation was timely as it allowed us to beat Wall Street to the explosive trend of AI. Previously, our firm was early to cloud in 2019, then rotated into AI in 2022. For more on the I/O Fund’s official 2023 returns announcement, read more here: The I/O Fund Catapults to 131% Cumulative Returns.
For 2025, the I/O Fund has worked to identify key Nvidia suppliers with Blackwell on deck to ramp significantly, sharing our in-depth research on the AI networking stack. Sign up to join our upcoming webinar, held every Thursday at 4:30 pm EST, where we discuss buy zones for the stocks we cover. Learn more here.
*Stock returns are calculated through December 31st, 2024 and are updated annually.
Please note: The I/O Fund conducts research and draws conclusions for the company’s portfolio. We then share that information with our readers and offer real-time trade notifications. This is not a guarantee of a stock’s performance and it is not financial advice. Please consult your personal financial advisor before buying any stock in the companies mentioned in this analysis. Beth Kindig and the I/O Fund own shares in NVDA and Bitcoin at the time of writing and may own stocks pictured in the charts.
Credo reported a large beat and raise in Q3 ending in January, with revenue coming in more than 12% above estimates at $135 million for growth of 154.4% YoY and 87.4% QoQ. This is the most growth I can recall from any AI-related earnings report this quarter with an earnings season that wraps up this evening. Regardless of market volatility, Credo is communicating they are special. We’ve covered the product in the past here. Next quarter points to an acceleration in growth to 163.2% — which is especially impressive when you consider the company is seeing strong growth on the bottom line.
Gross margin exceeded management’s guidance at 63.6% while Credo’s strong operating leverage was visible as operating margin came in nearly 8 points ahead of guidance and improved more than 30 points sequentially.
Inventories and accounts receivable surged sequentially, supporting management’s comments that active electric cables (AECs) experienced the inflection point in growth management had expected in the third quarter. Interestingly, Credo’s margin profile is improving significantly despite it being in a strong ramp phase for its products, with GAAP operating and net margins both in the double-digit positives in Q3, a sharp contrast to double-digit negatives just one quarter prior.
Free cash flow was marginally negative this quarter at ($0.4) million due to the purchase of production equipment, plus the large inventory at $53.2 million. The company has $379 million in cash, and thus this isn’t too big of an issue.
Also, note that Credo had very high customer concentration this quarter with 86% of revenue from one customer (hinted to be Amazon) yet is ramping with other hyperscalers (likely Microsoft, xAI, Oracle). This means the company is agnostic, which is truly the best spot to be given they have both large custom silicon and merchant GPU customers.
Revenue
Credo reported revenue of $135.0 million in Q3, beating analyst estimates of $120.4 million. Revenue grew 154.4% YoY and 87.4% QoQ, driven by the inflection in active electric cables (AECs).
Here is what management stated about this outsized growth: “Regarding our AEC product line, as expected, our revenue surged in the third quarter, driven by our largest hyperscale customer. Compared to alternatives, the benefits of AECs have become clearer. More than ever, data centers are highly focused on back-end network reliability […] Our ZeroFlap AECs deliver more than 100 times better reliability than laser-based optical solutions. And as a result, we're seeing AECs replacing optics for rack-to-rack solutions for lengths up to seven meters. We continue to make significant progress with additional hyperscalers for our Ethernet AEC solutions. We've achieved volume production with three hyperscalers, and we're in qualification with two additional hyperscalers, expecting production in fiscal '26.”
For more information on Zero Flap AECs, read our previous analysis here.previous analysis here.
For Q4, Credo guided for revenue of $155 million to $165 million, or 163.2% YoY growth at midpoint, almost an 8 point sequential acceleration. This blew past estimates for $136.3 million for growth of 124.2% YoY. Analyst estimates for fiscal Q1 and Q2 2026 are likely to move higher following this result given that it came in nearly $25 million higher than estimates at midpoint.
For the full year, Credo is on track to generate $426.7 million, based on the midpoint of Q4, well ahead of estimates for $388.8 million and representing growth of 121.1% YoY.
To put how quickly Credo is ramping in perspective, Q3’s revenue was more than Q1 and Q2 combined. Additionally, at the midpoint of Q4’s guidance, Credo would be generating $295 million in Q3 and Q4 combined, or $50 million more than it generated in the four quarters prior.
Key Segments
Product Revenue rises 224% YoY
Credo’s product revenue accelerated significantly in Q3, rising nearly 224% YoY and more than 100% QoQ to $129.3 million. This is a sharp inflection from the 70% to 90% YoY growth seen in the prior three quarters.
For the nine months ending in January, product revenue was $247.7 million, up nearly 138% YoY. Based on Q4’s guidance and product revenue contribution, Credo is on track to potentially reach $400 million in product revenue for the full year.
As pointed out above, AECs and retimers are driving the revenue, yet there are other products that will contribute to the company’s ongoing growth. The founders come from Marvell, and there is overlap here with SerDes technology solutions, including PCIe5 (now) PCIe6 (next year) products incl retimers, which help to increase bandwidths from 50G per lane to 100G per lane to soon offer 200G per lane, including on active optic cables and transceivers. The goal is to corner both long-scale reach and very short-scale reach as architectures move toward scale up and scale out (this is discussed more below). Credo was also first to release a 800G PAM4 DSP for half-retimed modules with the idea these modules can reduce power by 40% compared to full-DSP modules.
Product Engineering Services: Product engineering services revenue declined nearly (78%) YoY and (42%) QoQ to $2.7 million.
IP Licensing: IP licensing revenue rose nearly 137% YoY and was flat QoQ at $3 million.
Margins Support a Blowout Report
Credo’s margin improvements are arguably more impressive than the large beat and raise on the top-line in Q3, as Credo reported double-digit positive GAAP margins down the line after reporting negative margins last quarter. When asked what was driving the margins, management stated it was due to scale: “Principally driven by scale. It's really as simple as that.”
Q3 GAAP gross margin was 63.6%, one full point above the high-end of guidance for 60.6% to 62.6%.
For Q4, management guided gross margin to be between 62.7% and 64.7%, or a marginal improvement sequentially at midpoint.
Q3 GAAP operating margin was 19.4%, a more than 30 point sequential improvement from (11.7%) in Q2 and well ahead of management’s guidance for an 11.9% margin. Adjusted operating margin was 31.4%, up nearly 20 points sequentially.
For Q4, management’s expense guidance implied GAAP operating margin would dip sequentially to 17.5%. Adjusted operating margin is implied to be 32.1%, a slight sequential improvement.
Q3 GAAP net margin was 21.7%, a more than 27 point sequential improvement from (5.9%) in Q2. Adjusted net margin was 33.6%, up more than 16 points sequentially.
This is a phenomenal improvement in operating and net margins in just one quarter, displaying Credo’s strong operating leverage as it enters its rapid ramp phase. Credo was able to deliver just north of $64 million QoQ growth in product revenue in Q3 while spending less than $6 million more in total operating expenses in the quarter. The strong performance in Q3 was also able to push GAAP operating margin into positive territory for the nine-month period, with GAAP operating income of $3.3 million for a margin of 1.3%.
EPS to See Triple Digit Growth
Credo reported GAAP EPS of $0.18 in Q3, ahead of estimates for $0.11. This was a notable improvement from a GAAP loss of ($0.03) per share last quarter, as net income rose substantially due to Credo’s operating leverage; Q3’s net income was $29.4 million versus a ($4.2 million) loss in Q2.
Adjusted EPS rose 525% YoY to $0.25, beating estimates for $0.18. Analysts are forecasting triple-digit growth in adjusted EPS to continue for the next three quarters.
Balance Sheet and Cash Flows
Credo’s inventories and accounts receivable both surged sequentially, while cash flows were negative as Credo is working to ramp production significantly.
Operating cash flow was $4.2 million, due to “working capital increases driven by the significant sequential product ramp.” Capex was $4.6 million, resulting in free cash flow of ($0.4) million due to purchasing equipment.
Inventories were $53.2 million in Q3, up more than 46% QoQ. Accounts receivable were $157.1 million, up more than 92% QoQ.
Cash and marketable securities totaled $379.2 million, while debt remained at zero.
Earnings Call:
High Customer Concentration (Likely Amazon)
Per our last write-up, Credo’s major customers are Microsoft and Amazon, with the third and fourth perhaps being Oracle or xAI as these two lesser-known names were mentioned in the previous earnings call. This quarter, customer concentration was quite high with one customer at 86%, and this drilled into during the Q&A. Management stated they will have 3-4 customers at 10% or greater revenue and the lead customer will be at 2/3 revenue as soon.
An analyst pointed out that due to the strength of this one customer, the other combined customers would be dropping from $48M in October to $19M in January.
Per the CFO's opening remarks: “As we shared last quarter, we had seven customers that contributed more than 5% of revenue. And going forward, we expect that three to four customers will be greater than 10% of revenue in the coming quarters and fiscal year, as additional hyperscalers ramp to more significant volumes, as Bill described.”
It seems management is implying the customer that surged was Amazon, and not Microsoft. This makes sense given what we know about the Trainium2 ramp. Notably, to be agnostic to both custom silicon and merchant GPUs is the cherry on the cake for a supplier.
Dan Fleming, CFO:
Yes. We've talked in the past about – actually Amazon is a great example. So our largest hyperscaler, if you look at their Q1 revenue, was $30 million. Then it went down a bit in Q2. Now it obviously surged in our Q3. Our internal expectation is probably be in the same ZIP code as to where they were in absolute dollar terms this – in Q3 or where they were in Q3. So if you look at that being what it is and knowing that we guided 19% sequentially up quarter-over-quarter into Q4 at the midpoint. That would imply that maybe they’re two-thirds of our revenue in Q4 would be what that math would apply.
Merchant GPUs (Likely) To be in Volume Production
By now, I hope my readers are well aware that the soft price action in Nvidia has nothing to do with China or DeepSeek. These are shallow narratives the media must quickly conjure up to fill a headline. We offered many before market open earnings reports on “what it could mean” that Nvidia suppliers were offering a muted Q1 starting on Feb 5th, followed by a more long-form analysis on the free side on Feb 25th.
Similar to myself, analysts would love nothing more than to get a green light from a supplier who is downwind from Nvidia. Amazon is a custom silicon project, and thus Credo’s report last night does not provide any evidence that Nvidia’s larger Blackwell systems (expected to drive more than 50% of revenue this year) are ramping in volume. If anything, it suggests the opposite if Amazon is at very high customer concentration while Microsoft, Oracle and/or xAI (the other three customers, presumably) are at a combined 14%.
On one hand, Credo stated the other three hyperscalers are in volume production – which is exactly what we want to hear as it not only verifies the larger Blackwell systems are moving along (since Credo is mainly a back-end networking growth opportunity) but also that Credo is qualified (as of now) to be in this stack in addition to the custom silicon from Amazon.
“Our ZeroFlap AECs deliver more than 100 times better reliability than laser-based optical solutions. And as a result, we're seeing AECs replacing optics for rack-to-rack solutions for lengths up to seven meters. We continue to make significant progress with additional hyperscalers for our Ethernet AEC solutions. We've achieved volume production with three hyperscalers, and we're in qualification with two additional hyperscalers, expecting production in fiscal '26.”
I put the word “likely” in parathesis because merchant GPUs were not specifically mentioned, yet the readthrough is that it’s Nvidia’s GPUs that Credo is providing the AECs to given these specific hyperscaler customers buildouts.
Scale Up, Scale Out Architectures (Total Addressable Market):
Scale up architectures refers to the increasing size of GPUs or AI accelerators per system. Prior to Blackwell, the maximum was eight, whereas the new architecture will be 36 or 72 GPU systems. Each new generation will likely attempt to increase size in which these systems scale up.
As we consider hypergrowth networking stocks like Credo, consider that its revenue today is mainly scale out (which refers to adding more systems, such as the 100,000 GPUs systems being built today). The total addressable market for Credo will expand considerably as we go into years (perhaps up to a decade) of the scale up trend driving forth major advancements in training first and foremost (with inference market too nascent to determine where it will end up in terms of its best and highest use across architectures.
The rack-level architectures that are scale up to 36 GPUs or 72GPUs this year will offer Credo a new opportunity to drive revenue. Per management: “Our Gen6 64 gig PAM4 AECs will deliver the same compelling benefits for AI scale-up networks as deployments move to rack scale architectures. Credo will demonstrate our PCIe AECs at Nvidia's GTC Show later this month.” It was also stated: “Existing customer wins and future opportunities here include 100 gig and 200 gig per lane applications for both traditional switching and increasingly for AI servers requiring retimers for scale-out networks. This year, Credo has entered the market for PCIe retimers used in scale-up networks.”
This was also stated: “We've talked about the volumes being larger than the scale-out network opportunities. So we really see this as a big new TAM. As the market moves from Gen-5 to Gen-6, we're talking about moving from 32 gig NRZ, which is really very old technology, and it is really not competitive if you compare it to the market leader from a bandwidth standpoint per lane.”
Conclusion:
Credo had an excellent earnings report and we are excited to build out this position further over the next few months. Suppliers who participate in both custom silicon and merchant GPUs are in an enviable position as it can remove lumpiness. Regarding lumpiness, Nvidia is not out of the weeds yet as the following analyst discussion foreshadows the delay we reported on is alive and well this quarter: “And the other combined customers would be dropping from $48M in October to $19M in January.” However, Credo’s comments the other hyperscalers are in volume production matches Nvidia’s commentary — and so hopefully we see a clearing of the selling pressure in the next 2-3 months. (And you know the IOF loves to buy low for the next leg up, so we are not stressing it – rather simply making sure our readers are well informed and not relying on the Street’s China tariffs and DeepSeek narratives, which are shallow narratives at best).
Credo's gross margin is one of the strongest I can recollect in the AI hardware space with an operating margin that exceeds many AI suppliers’ gross margin. The fact we are seeing revenue primarily from scale-out, while there is an equal opportunity (if not larger opportunity) for back-end networking with scale up for AI systems – and, the fact Credo plays in both arenas with custom silicon and GPUs — is the cherry on the cake.
Please note: The I/O Fund conducts research and draws conclusions for the Fund’s positions. We then share that information with our readers. This is not a guarantee of a stock’s performance. Please consult your personal financial advisor before buying any stock in the companies mentioned in this analysis.
The world today was engineered to be ephemeral and noisy. This is a terrible combination for an investor. On Twitter alone, 456,000 messages are sent every minute. On Facebook, 510,000 comments are posted every minute, and 293,000 status updates are made. Outside of social media, 16 million text messages are sent every minute, and 156 million emails are sent.
For an investor, the antidote to noise is quality stock analysis. Due diligence requires dozens of hours per company, and it takes hundreds of hours every year to produce a free newsletter with quality analysis. I/O Fund strives to offer some of the team’s best analysis for free, and we believe the consistency and depth of what we provide for free is hard to replicate.
We offer this in the most challenging sector for investors, which is, hands-down, the tech sector. The tech sector is unusually challenging because it involves many different verticals – artificial intelligence, crypto, consumer, media, fintech, ad-tech, semis, cloud, and more. It’s also the highest risk and highest reward sector in the market. Due to sudden price movements in both directions, the stakes are high. Perhaps we are biased, but quality analysis can be hard, particularly in the tech sector.
Below, we present you with 10 Timeless Articles You Won’t Want to Miss.
1) Nvidia’s Cuda Moat and Early-AI Thesis from 2018, for Gains of Over 4,160% on Premium Site
Our firm's AI coverage on Nvidia began with calling Nvidia an AI leader seven years ago! Yes, really.
In the article published in November 2018 when Nvidia was trading at $4.93; Holding Nvidia Stock Will Pay Off Due to Two Impenetrable Moats,Beth said that “Economic indicators and earnings from tech companies have not exactly warranted this reaction from the market… Nvidia’s outlook is quite the opposite in regards to public-company growth trajectory. The market may continue to have volatility, but Nvidia investors who are patient will be rewarded due to competitive advantages in GPU-powered cloud performance and developer adoption of Nvidia’s platform.” but Nvidia investors who are patient will be rewarded due to competitive advantages in GPU-powered cloud performance and developer adoption of Nvidia’s platform.”
Since the free article was published, the stock is up by over 2,600% and our first entry on our premium site is up by over 4,160%* with an entry at $3.15. The stock has now become the Street’s most-followed AI stock.
Nvidia has firmly established itself as the GPU leader in this AI boom, with CUDA (Compute Unified Device Architecture) serving as its primary moat. The A100 and H100 drove the revenue but CUDA’s software moat is why Nvidia has a near-monopoly in the GPU-driven data center with a 98% market share. Ultimately, CUDA is the primary reason that Nvidia is challenging to disrupt, and Beth pointed this would help the company dominate AI development 7 years ago. She then repeated this thesis 25 times before the Street finally caught on in May of 2023.
CUDA is a moat because developers are trained to program GPUs on this platform specifically. For a competitor to take market share, developers would have to be motivated to install new drivers, compilers, and to learn new libraries and tools to switch from CUDA to a new, competing programming platform.
Beth rightly pointed out that Nvidia has established itself as the dominant development platform for AI, a fact that later became increasingly apparent as AI technology matures. In 2018, the Street grew concerned that custom silicon would replace Nvidia’s GPUs, yet Beth pointed out that developers favor Nvidia's GPUs for their ease of use and flexibility compared to custom silicon.
Here is what she stated in this prescient analysis:
“Nvidia is already the universal platform for development, but this won’t become obvious until innovation in artificial intelligence matures. Developers are programming the future of artificial intelligence applications on Nvidia because GPUs are easier and more flexible than customized TPU chips from Google or FGPA chips used by Microsoft. Meanwhile, Intel’s CPU chips will struggle to compete as artificial intelligence applications and machine learning inferencing move to the cloud.”
*Note: Stock gains listed are through Dec 31, 2024 and are updated annually.
2) Nvidia to Surpass Apple’s Valuation from 2021, to Become World's Most Valuable Company
Beth is known as the Queen of Nvidia, not only for predicting Nvidia would become a dominant AI stock when it was priced below $5, but she clearly set herself apart again in 2021 with a prediction that Nvidia would surpass Apple to become the world’s most valuable company when it was priced at $152.51.
At the time, this prediction was inconceivable as it would require not only Nvidia to go up more than 350%, but also for the tech leader Apple to plateau. Ultimately, Nvidia went up more than 500% since that call, and is up 900% between Jan 1st 2023 and Jan 1st 2025 while Apple is up 70% in that two-year time frame.
The I/O Fund took it a step further and bought on the October 13th, 2022 low with a real-time trade alert sent to premium members to buy at $18.51 (corrected to account for stock split). This single buy alert is up an impressive +700%, if held into today’s price . Overall, premium members received nine real-time buy alerts below $20 in 2021 and 2022; learn more about premium here. Notably, this prediction required holding a high conviction through a 60% selloff in 2022.
The 2021 prediction that Nvidia would surpass Apple’s valuation within 5 five years highlighted Nvidia’s niche in the AI economy and also that Nvidia is not standing still with Ampere Architecture. Beth noted, “Nvidia has a market cap of roughly $550 billion compared to Apple’s nearly $2.5 trillion. We believe Nvidia can surpass Apple by capitalizing on the artificial intelligence economy, which will add an estimated $15 trillion to GDP. This is compared to the mobile economy that brought us the majority of the gains in Apple, Google and Facebook, and contributes $4.4 trillion to GDP. For comparison purposes, AI contributes $2 trillion to GDP as of 2018.”We believe Nvidia can surpass Apple by capitalizing on the artificial intelligence economy, which will add an estimated $15 trillion to GDP. This is compared to the mobile economy that brought us the majority of the gains in Apple, Google and Facebook, and contributes $4.4 trillion to GDP. For comparison purposes, AI contributes $2 trillion to GDP as of 2018.”
3) In 2024, Beth Followed Up on Why Nvidia Was Still a Buy
To date, Beth has updated her Nvidia thesis thirty times with original insights. In February of 2024, she explained why Nvidia was still a strong Buy, and how Nvidia would surpass Apple two years earlier than her original 5-year prediction in 2021.
In the analysis, Nvidia Stock Gained $1.5 Trillion To Surpass The FAANGs – Apple Is Next she pointed out that it was not just the consistency and magnitude of Nvidia’s multi-billion-dollar revenue beats, but the expansion of its margins and earnings as revenue grew >200% for multiple quarters as it approached a $90 billion annualized scale. She also highlighted the accelerated product roadmap, which is another reason for the company's stellar returns and futuristic software opportunities.
4) Prediction: Nvidia Bottomed in Late 2022
When the market dumped Nvidia stock, with the price cratering 60% in 2022, Beth aptly pointed to the big picture, i.e., the H100 chip opportunity for readers in her September 2022 analysis, Nvidia Stock Is Ready To Rumble With RTX 40 Series And H100 GPUs, during a time when the mainstream media was focusing on an irrelevant crypto mining miss.
Here is what she said at the height of the selloff:
“Nvidia had a big week with GTC 2022 and management is clearly ready to rumble against any excess inventory from crypto mining. The negative catalyst from crypto mining and Nvidia's price action is eerily similar to Q4 2018/Q1 2019 —- yet the company is not the same company it was four years ago. This is apparent by Nvidia flexing some major product muscle by timing it's best-ever gaming release and it's best-ever AI chip to hit the market in October.” This is apparent by Nvidia flexing some major product muscle by timing it's best-ever gaming release and it's best-ever AI chip to hit the market in October.”
Beth further highlighted that the Hopper architecture represents a significant performance leap over the Ampere architecture. Some of the improvements include Enhanced Algorithm Processing, increased bandwidth and scalability, memory, and performance boost, which all played a key role in capturing the AI demand. For example:
NVLink allows connecting eight H100s into a single, powerful GPU with immense processing power and memory bandwidth.
50% more memory and interface bandwidth than the A100, with support for 80GB of HBM3 memory.
Approximately 3x overall performance increase over the A100, and up to 6x faster in specific workloads.
“Where the H100 really stands apart is the leap in performance with about 3X more performance than the A100 and the H100 is up to 6X faster. The A100 lacked support for FP8 compute at default whereas the H100 will leverage a transformer engine to switch between FP8 and FP16, depending on the workload.”
5) Early Bitcoin Bulls when Bitcoin was trading at $11,156
I/O Fund published the Bitcoin bull thesis to its readers in July 2019; Will Bitcoin Make a Good Investment? Part 1: Institutional Adoption. Beth rightly said “There are key reasons as to why bitcoin will make a solid long-term asset over the next five years and may reach its peak as a new technology with mass adoption in seven to ten years. This 3-part series explores why strategically entering the bitcoin market at a good entry price will make a solid investment for the future.”
The first being institutional adoption, then economic uncertainty, and mobile payments. Since the article was published the shares have risen by over 730% and our first entry, Bitcoin is up by over 1,100%. Interesting enough, it was institutional adoption that became the major catalyst despite famed investor Warren Buffet stating Bitcoin was “probably rat poison squared” around the same time she wrote smart money would become the major, primary catalyst.
I/O Fund Called the 2021 Top in Bitcoin and the 2022 Bottom
I/O Fund Portfolio Manager, Knox Ridley, accurately called the top in June 2021. The uptrend in Bitcoin that continued through April and May topped at $64,895, which was the lower end of the listed range. Our firm took heavy gains by cutting the position in half, as outlined in the video and article: “Why the I/O Fund Cut Bitcoin in Half.”
Nearly 18 months later, in December 2022, Knox provided another prescient update that Bitcoin was bottoming and would rally again when the price was bottoming in the $17,000 range. In the article “Bitcoin is Going to Rally: What You Need to Know” he stated:
“Yet, there is key evidence that shows how Bitcoin is stronger today than it was during the previous three drawdowns. The reason you don’t want to ignore this is because – despite steep +80% selloffs — Bitcoin has reclaimed new highs within 3.5 years, every time. Therefore, it’s not only the size of gains Bitcoin has provided which places it as the #1 asset of all-time yet it’s the speed in which this is accomplished that is also remarkable.”
A year later when Bitcoin was trading at $43,600 Knox provided yet another update stating that Bitcoin price will reach $100,000 due to institutional adoption.
Every Thursday at 4:30 pm Eastern, the I/O Fund team holds a webinar for premium members to discuss how to navigate the broad market, as well as various stock entries and exits. The I/O Fund team is one of the only audited portfolios available to individual investors. Learn more here.here.
6) Bitcoin to $100K+
Portfolio Manager Knox Ridley provided two crucial updates on the I/O Fund’s game plan for Bitcoin, with his first update from April 2024 increasing the portfolio’s target zones. At the time, Bitcoin was an overlooked asset compared to the over-hyped Mag 7, yet the asset delivered superior returns compared to all of the great large-cap tech stocks in this bull cycle, minus Nvidia, while having a low inverse correlation to tech.
Utilizing technical analysis and on-chain data in the analysis We Are Raising Our Bitcoin Targets To $106K – $190K, Knox explained that the I/O Fund was now raising its target zones for Bitcoin to $106,000 to $190,000, up from the previous zone of $75,000 to $130,000. Bitcoin was trading in the mid-$60,000 range at the time, with Knox saying that “the $42,750 support region holds on any ongoing volatility, then we have no reason to doubt the uptrend in place.”
Knox explains why the I/O has been successful in navigating this volatile asset. “Timing is everything. When it comes to timing, our firm has a proven track record of navigating the life-changing bull case that crypto offers while minimizing the volatility associated with different coins – we achieve this via a unique approach combining technical and on-chain analysis to identify major lows and major tops in each cycle.”
Sign up for I/O Fund's free newsletter with gains of up to 2600% because of Nvidia's epic run – Click hereSign up for I/O Fund's free newsletter with gains of up to 2600% because of Nvidia's epic run – Click hereClick here
Knox provided another update to the Bitcoin thesis in August 2024 in the analysis, Bitcoin Update: Next Stop $100,000; Bitcoin finally surpassed that historic level as 2024 came to a close. He explained that Bitcoin had “a full corrective pattern in place that ended around $54,000 in early July,” which “suggests we are in the early stages of the next rally.”
7) Microsoft Stock Outperformance highlighted in 2018
Our bullish thesis on Microsoft was first developed in 2018. Beth highlighted that Azure would gain market share in Cloud Infrastructure in the article; Here’s Why Microsoft Stock Could Overtake Amazon on Cloud Infrastructure. Microsoft’s market share has increased from 13% to the current 21% and the stock has outperformed both Alphabet and Amazon as seen in the chart below.
Beth highlighted Microsoft’s Fortune 500 client base and also Microsoft’s acquisition of GitHub to attract developers who play a crucial role in the selection of cloud providers. She further highlighted Microsoft’s strength in the adoption of its products by most companies, which would make the transition easy for the IT department.
8) Microsoft Azure vs Google Cloud
We highlighted to our readers in December 2020 that Alphabet will lag Microsoft in the cloud market share in the article; Why It's Too Late for Google Cloud to Overtake Microsoft Azure. Currently, Microsoft has a 21% market share compared to Alphabet’s 12% and Amazon’s 30% at the end of December 2024.
Beth pointed out that “In our latest Forbes report, we discuss why Google (Alphabet) may have missed a critical window this year for the infrastructure piece. We also analyze how Microsoft directed all of its efforts to successfully close the wide lead by AWS. Lastly, we look at how all three companies will bring the battle to the edge in an effort to maintain market share in this secular and fiercely competitive category."
9) Netflix: A Hidden Gem
We published a series of articles in 2022 on Netflix during the market sell-off after the company lost subscribers for the first time since 2011 and said that investors need to be patient. During that time, Bill Ackman sold his stake in Netflix for a loss of $450 million within three months of his purchase. Beth highlighted that Netflix is entering the ad-supported market and in July 2022, in another article; Netflix Stock Stronger Than It Seems Following Q2 Earnings, she highlighted the cash flow transformation.
Beth said, “The most important line item for Netflix is the company’s cash flow. Looking back, this has been troublesome for Netflix as the company lost $3.3 billion in cash in 2019 as it built up its original content pipeline. However, the company is on an entirely new trajectory with $1 billion in free cash flow expected this year and “substantial” free cash flow in 2023, per Netflix management.”
We provided another update in May 2023; This Stock Price For Netflix Is A “Buy” For 2023 by highlighting the opportunities in password sharing, ad-tier, free cash flow, and by providing a buy plan to our readers. We closed Netflix in April 2024 for a total gain of 150%.
10) How the I/O Fund Sets a High Bar for Accountability
Don’t miss the article Verified Returns & Risk Management: A Retail Investor's Imperative.This article discusses the overarching thesis around ways retail investors can get ahead of Wall Street in the complex world of stock investing. For starters, having an actively managed portfolio is where you get the best of both world’s – performance that far exceeds the indexes and ETFs by paying close attention to allocation, (quickly) cutting stocks that do not meet specific criteria, and choosing stocks that have strong, fundamental strength. We strongly believe a more active stance is necessary for long-term tech investing, and this article explains why.
Logging trades in real-time also places immense pressure on the analysts at the I/O Fund, who are not allowed to simply choose a stock but must also determine the allocation for the stock. After recommending a stock, the analysts must help the portfolio manager actively manage the position, which can change at any time. There is a reason most services do not provide this level of transparency and activity — as more granularity is offered; more skill is required.
Another reason the I/O Fund is unique is because it is the only firm that provides audited results to its premium members. We use an auditor from a large firm in San Francisco to mathematically review and verify the performance of our I/O Fund portfolio trading account and crypto account.
That’s Not All ….
Our firm has assisted our readers in capturing immense upside from the two top-performing large-cap tech positions in 2023 and 2024 with Nvidia and Bitcoin; the fact we also provided ongoing entries and risk management for these mega-winners cannot be understated in terms of the value we have delivered.
That’s not all … on our premium side, we have garnered returns of 210% in five years, with analysis you must not miss on stocks not mentioned here. We reserve our best work for premium members.
These wins include*
The I/O Fund has cumulative returns of 210% and a lead over institutional technology portfolios of as much as 219% since inception.
In 2024, the I/O Fund returned 35%, outperforming the S&P 500 by 11% and both the Nasdaq-100 and Invesco QQQ ETF by 10%.
We had 10 positions outperforming the NASDAQ-100 in 2024.
We also closed an altcoin for a 99% quick gain and Netflix for a 164% realized gain in 2024.
Our combined realized returns on Super Micro were 243% while utilizing risk management to sidestep volatility.
We opened CrowdStrike in early 2023 and began taking gains in early 2024. We ended up closing the entire position for a realized gain of 87%, just before the vertical drop took CRWD down 41% from our final closing price.
We posted returns of 57% in 2023. If we were an ETF, mutual fund or hedge fund, our ranking would be #4 in the Wall Street Journal’s Winners’ Circle ranking of 1,191 funds.
In 2023, we had five positions with returns over 100% and seven positions beat the Nasdaq. Many were held at high allocations.
The I/O Fund had a 45% allocation to AI going into 2023, one of the highest on record. Today, the AI allocation is higher with many lesser-known names.
Issued 9 trade alerts for Nvidia under $20. Provided over 25 analyses on Nvidia’s AI thesis before the market caught on.
Nearly impeccable record on Bitcoin, buying between $7K to $10K, trimming at $58K, buying again $15K to $16K for the rally to $100K+. All entries and exits are sent as trade alerts.
We were early to the cloud in 2019, then rotated into AI in 2022 with a 45% allocation in 2023.
Released an automated hedge in 2022 to stave off losses during a historic selloff in the tech sector.
Picked the leading sectors in 2021: semiconductors and blockchain.
Picked the two top-performing cloud stocks in 2021 (DDOG and ASAN)
Picked the best-performing asset with a large market cap in 2021 (ETH)
Picked the best stock in the S&P 500 in 2019 (ROKU)
Has beaten other tech-focused funds in every audit since the portfolio’s inception.
*all percentages quoted of the current portfolio stocks are from first entry through 31 December 2024.
Please note: The I/O Fund conducts research and draws conclusions for the company’s portfolio. We then share that information with our readers and offer real-time trade notifications. This is not a guarantee of a stock’s performance and it is not financial advice. Please consult your personal financial advisor before buying any stock in the companies mentioned in this analysis. Beth Kindig and the I/O Fund own shares in NVDA and AMD at the time of writing and may own stocks pictured in the charts.
Our Essentials plan offers three stocks that are actively managed. For those who are new to tech investing, this plan offers an introductory level as mastering a few stocks before building a larger portfolio is a productive way to become acquainted with the world's most valuable and rewarding industry. As you know, tech can be volatile, and these stocks help to balance risk/reward in this volatile industry.
What is listed below is the most pertinent analysis for becoming acquainted with these three stocks.
This list will be updated and refreshed when positions are added or removed. Please check back often for updates!
Nova's metrology solutions are poised for long-term growth as AI/HPC drives the demand for advanced nodes and advanced packaging solutions.
Gate all around (GAA) presents a catalyst for NVMI as Taiwan Semiconductor moves toward a new advanced packaging architecture.
Over 100 new fabrication facilities will be built globally by 2030, according to Jeffries, buoyed by NVIDIA and AMD shifting to annual GPU releases.
Nova experienced a revenue and earnings growth spurt starting in Q3 2023, potentially hitting a peak in its Q1 2025 guide, as analyst estimates indicate a flattish plateauing year with rangebound revenue and EPS.
Nova collected 39% of its total revenue from China in 2024, but that will shrink due to the growth in its advanced nodes business, which China lags due to U.S. trade restrictions.
Nova’s headquarters are based in Rehovot, Israel, located 20 km from Tel Aviv, making it susceptible to geopolitical risks including the ongoing Israel-Hamas war and tensions with Hezbollah in Lebanon.
Nova Limited (NASDAQ: NVMI) is a leading provider of metrology tools for advanced process control in the semiconductor manufacturing industry. The company primarily focuses on dimensional and materials metrology and inspection solutions. Its tools are a necessity for chip manufacturers, and their business correlates to the supply and demand trends of the semiconductor industry.
The AI revolution is providing an extended runway as the need for metrology grows with the evolution of more advanced chips that are required for artificial intelligence (AI) and high-performance compute (HPC) applications. Nova’s metrology solutions are applied to advanced logic (AI-enabled), memory and advanced packaging.
Advanced Nodes Will Drive Growth
As AI drives the need for more powerful and efficient chips, manufacturers are scaling up their designs by making them more complex in terms of size, materials, and packaging. This complexity means that chips are becoming harder to produce, and even small deviations during manufacturing can affect the yield. Therefore, precise process control becomes critical, which in turn increases demand for metrology equipment.
“Advanced nodes require more process steps as node sizes shrink, so for a chipmaker or foundry like TSMC or Intel to move from primarily producing on 5nm nodes to 2nm or below over the next couple of years, there will be a greater need for metrology equipment. Currently, the 5nm and 4nm nodes are primarily being used for AI chip production, such as that for Nvidia’s Hopper and Blackwell chips, while 3nm production is ramping at TSMC, with volume production at the 2nm node expected in 2025, primarily for smartphone applications. This is because the manufacturing tolerances shrink as nodes shrink in size – the chipmaking process now becomes increasingly more sensitive to minute deviations in the process. Moving to more advanced nodes warrants much greater precision throughout the entire manufacturing process, as the smallest of deviations could greatly affect the process yield.“
Moreover, the frequency of accelerated chip development timelines is an added boon for the urgency and demand for Nova’s metrology tools — “Nvidia and AMD are both shifting to annual release cadences, aiming to bring next-generation GPUs to market once per year, compared to prior cadences of every two years. This is a major technological feat – as we had said previously for Nvidia, it’s a ‘move-fast-break-things’ problem, where Nvidia is pushing the boundaries of what had previously been seen as impossible in the chip industry. By moving to these quicker release cycles, there’s a much greater emphasis on metrology and process control to ensure that the manufacturing process remains sharp while also ensuring a faster ramp and high yields to meet mass production thresholds and demand.”
The increasing complexity of chips is driving higher metrology intensity. Gate all-around (GAA) field-effect transistors (FETs) require 30% more metrology steps. High bandwidth memory 3 extended (HBM3E) used for AI, ML, graphics processing, and scientific computing consumes 3X more wafer supply as double data rate 5 (DDR5) SDRAM used for mainstream computing applications on desktops and laptops. There are over 100 fab projects planned globally, supported by over $300 billion in funding and incentives by 2030. The U.S. alone has 28 fabs costing around $52 billion.
Advanced Packaging Revenues Doubled in 2024, Driven By AI/HPC Demand
AI and HPC workloads drive the need for advanced nodes, which deliver higher performance and energy efficiency. However, as chips become denser and generate more heat, advanced packaging techniques become essential to manage thermal challenges and improve overall chip performance. Nova’s 2024 advanced packaging revenues more than doubled YoY. It now contributes 15% of product revenue, and its integrated metrology solutions have been adopted by four of the top five advanced packaging manufacturers.
CEO Gabriel Waisman addressed the areas that boosted their advanced packaging segment in 2024 during the Q4 conference call. He stated this.
“So first, the advanced packaging had contribution from both our chemical metrology division as well as the dimensional metrology division. We have our integrated metrology in all of the top five advanced packaging manufacturers, and we have a significant adoption of our PRISM standalone OCD platform. So it's both divisions that contributed to this growth. And we do expect this year to expect to continue and grow by double-digit growth.”
Gate All Around (GAA) Presents Catalyst for Nova
In June, we covered how TSM is moving from FINFET transistors to gate all around (GAA), stating “with FinFET, the gate is wrapped on three sides, whereas with gate-all-around (GAA), as the name implies, the gate is wrapped around on all sides. FinFET is used in 14nm, 10nm and 7nm nodes. TSMC uses FinFETs in the 5nm, yet will phase out FinFET after the 3nm. As TSMC moves toward GAA for the 2nm, having the gate wrap “all-around” will create a greater surface area for better electrostatic control and to also reduce leakage.”
The write-up also pointed out: “The 2nm will be the first node to use gate-all-around field-effect transistors (GAAFETs), which will increase chip density. The GAA nanosheet transistors have channels surrounded by gates on all sides to reduce leakage, yet will also uniquely widen the channels to provide a performance boost. There will be another option to narrow the channels to optimize power cost. The goal is to increase the performance-per-watt to enable higher levels of output and efficiency. The N2 node is expected to be faster while requiring less power with an increase of performance by 10%-15% and lower power consumption of 25%-30%.
For TSMC, the 2nm will feature NanoFlex technology, which is similar to FinFlex to where designers can use cells from different libraries. However, due to the new gate-all-around (GAA) nanosheet transistors, there are additional benefits, such as customizing the width and height of cells.
Intel’s 20A will be the first to feature backside power delivery for faster switching and to alleviate routing congestion. With this release, Intel is introducing the “angstrom” era” which translates to future process generations where the process nodes are not smaller necessarily, rather the transistors they’re built with will be improved upon. For Intel, instead of the GAAFET, the company is introducing RibbonFET transistors where multiple flat nanosheets are stacked to enable better current flow.”
CEO Waisman committed to $500 million of GAA revenue from 2024 to 2026. If our math is correct, this can be achieved in one of two scenarios:
A two-year time frame which includes 2024 GAA revenue of $45 million and 2025 GAA revenue would have to be $455 million to arrive at the $500 million commitment from 2024 to 2026, implying a 10X surge in 2025 GAA revenue.
A three-year time frame which includes 2024 GAA revenue of $45 million, 2025 GAA revenue of $90 million and 2026 GAA revenue of $365 million to arrive at the $500 million commitment from 2024 through 2026, which would imply a 2X and then 4X ramp in GAA revenue in 2025 and 2026, respectively.
In the latter three-year scenario, GAA revenue would represent 8.3% in 2024, 13.4% in 2025 and 50.8% in 2026 of total product revenue based on consensus analyst estimates, as GAA adoption surges in 2026. Either scenario underscores the point that GAA is shaping up to be a major catalyst for Nova.
What is Semiconductor Metrology?
Semiconductor metrology uses precise measurement techniques to inspect wafers for defects and contamination, ensuring process control during manufacturing. Its main goal is to identify and locate issues so engineers can address them, thereby maximizing chip yield, which is the percentage of functioning chips produced from a wafer.
Higher Chip Yields are the Holy Grail of Efficient Semiconduction Manufacturing
Higher yields are essential for reducing costs by producing more functional chips from the same raw materials, which is a critical edge and key driver for Nova. Their metrology tools, including chemical and optical instruments help major customers like Taiwan Semi overcome yield challenges at advanced nodes. Advanced semiconductor packaging technology like chip-on-wafer-substrate (CoWoS), which was crucial to scaling NVIDA’s Hopper and Blackwell production, add further complexity. Taiwan Semi’s 3nm node only hit yields of 50% to 60% in 2023, but has reportedly achieved 3nm yield of over 90% and 2nm yield of 60%. Nova's role in optimizing CoWoS yields becomes a linchpin for success—more chips, lower costs, and higher margins.
As chip features shrink, tighter tolerances increase defect risks, making advanced metrology essential for quality and cost efficiency. While traditional applications face seasonal slumps, secular growth in AI is turbocharging demand for Nova’s metrology solutions across all semiconductor segments.
Nova offers many types of metrology solutions:
Dimensional Metrology measures the physical dimensions of semiconductor structures to ensure the accuracy of features on chips. Nova Fit Series utilizes optical techniques to measure critical dimensions (CD), including weight, height and side wall angle in 3D structures.
Materials Metrology provides insight into the material properties impacting device functionality. Technologies included X-ray photoelectron spectrometry (XPS), X-ray fluorescence (XRF), and secondary ion mass spectrometry (SIMS). Products include VeraFlex, Elipson and Metrion.
Chemical Metrology focuses on the chemical composition and purity of materials focusing on the presence, concentration, and distribution of chemical species, including dopants, impurities, and contaminants. Its technologies often overlap with materials technology through techniques like secondary ion mass spectrometry (SIMS) with platforms like Metrion. The Metrion platform offers SIMS capabilities for in-depth chemical analysis, which is vital for understanding dopant distribution and detecting impurities.
Spectral Interferometry uses light interference to measure depth, thickness and properties of thin films and complex 3D structures, especially for probing vertically stacked layers. Nova Prism uses this for optical CD metrology.
Optical Scatterometry analyzes how light scatters off the patterned structures to infer dimensions and shapes to measure critical dimensions of periodic structures and wafers. Nove MMSR+ uses this for high-precision measurement of CD and thin films.
Advanced Imaging involves capturing high-resolution images to analyze defects, patterns and material properties in combination with other metrology techniques for comprehensive analysis. Nova T600 integrated advanced imaging for better pattern recognition and precision alignment.
Hybrid Methodology combines different metrology techniques from various toolsets, including optical CD, atomic force microscopy (AFM), and scanning electron microscopy (SEM) to enhance accuracy. It’s used to measure parameters that are too difficult with just a single method. Nova's Hybrid Metrology Solutions uses a hybrid approach (IE, integrating spectral interferometry with scatterometry) to enhance measurement accuracy for parameters that single methods can't capture.
Taiwan Semiconductor Faces Yield Issues; Advanced Packaging Alleviates the Problem
Taiwan Semi’s CoWoS advanced packaging technology can improve chip yields, but it’s more of a double-edged sword. It boosts yields but introduces new yield challenges during the actual packaging process. CoWoS involves stacking multiple dies like (IE: GPU + HBM memory) on a silicon interposer and mounting that on a substrate. This is key for high-performance chips like NVIDIA’s Hopper and Blackwell GPUs.
CoWoS lets Taiwan Semi use smaller and higher-yielding dies instead of a single giant chip, two dies vs one monolithic chip. If one die fails, it can be swapped out (before stacking), rather than having to replace the whole chip. The challenge is that stacking dies on interposers is more complicated (IE: multi-die stacks heating unevenly causing warping, which can cut yields up to 10%). This is where Nova’s metrology tools, like PRISM II and ELIPSON, step in to enhance CoWoS yields, pushing them above 90% on mature production runs.
China Generates the Most Revenue, But That Will Be Shrinking with Advanced Nodes
In 2023, China generated 30% of total revenue. In full year 2024, that percentage climbed to 39%. However, growth will come from advanced nodes, so the China share is expected to decline. Nova CEO Gaby Waisman confirms this point.
“Sure. So, in 2024, the China share of our overall sales was 39%. Our strength there is in line with industry peers. And due to the fact that growth this year will come from advanced nodes, we see the share of China declining.”
Since China’s access to advanced nodes is limited due to trade restrictions, they lag behind leading-edge manufacturers like Taiwan Semi and Samsung. This is a positive as it enables more geographic and technological diversification. Advanced nodes are the future and generate strong margins. It reduces Nova’s dependence on any single market or technology, which captures opportunities in higher-growth and higher-value segments.
China's lag in advanced semiconductor nodes is largely due to U.S. trade restrictions that prevent ASML, the sole manufacturer of EUV lithography machines needed for chips at 7nm and below, from selling to China. These restrictions, influenced by U.S. policy, have left China using less advanced deep ultraviolet (DUV) systems, resulting in a technological gap where their most advanced chips are still at the 7nm node, about five years behind the global frontier. Incidentally, TSMC has also halted producing 7nm AI chips for Chinese customers, including Baidu, Alibaba and ByteDance, as of Nov 11, 2024. Any future AI chip production will need U.S. approval.
Financials: Growth Spurt Driven by AI/HPC Demand. Are Analysts Asleep at the Wheel?
Nova had a record 2024 driven by the AI boom. However, indications appear that a flattish 2025 is on the horizon. Nova experienced a growth spurt that started in Q3 2024, peaking out by Q1 2025, as it flattens out in 2025, according to analyst estimates. Nova only provided Q1 2025 guidance. They don't provide full-year guidance. The bump up in Q1 2025 is helped by the accretive nature of the Sentronics acquisition, which generates an estimated $20 million annually. Nova will start to add Sentronics revenue into the Company’s earnings starting in Q1. Nova reported a record Q4 and 2024 revenue powered by record sales of material metrology and dimensional metrology solutions. While analysts still forecast 25.26% YoY revenue and 23.09% YoY EPS growth rate in 2025, QoQ growth indicates a plateau.
Revenues Surge to All-Time Highs, But 2025 Analyst Estimates Indicate a Flattish Year
Q4 revenue grew 45.11% YoY and 9% QoQ to a record $194.77 million, beating consensus analyst estimates by $8.28 million or 4.44%. The revenue beat was attributed to record strength in its materials metrology portfolio driven by robust sales of the VeraFlex, Elipson and Metrion platforms augmented by record sales of their dimensional standalone OCD solutions that saw heightened demand from GAA and advanced packaging solutions.
Management guided Q1 2025 revenue of $205 million to $215 million, with a midpoint of $210 million, representing 48.09% YoY growth. Full year 2024 revenue rose 30% YoY to 672.4 million. Q1 2025 will include Sentronics revenues, which are estimated to be around $20 million annually or an additional $5 million per quarter. The geographic revenue split in 2024 was: China generated 39%, Taiwan had 20%, Korea had 18%, the U.S. had 14% and other territories contributed the remaining 9%.
Nova’s revenue will have grown for nine consecutive quarters, potentially peaking out in Q2 2025 at $213.8 million, according to consensus estimates. Analyst estimates for FY 2025 indicate flat revenues through Q1 2026 hovering between the $210 to $213.80 million level per quarter, despite 2025 YoY growth estimated to fall to 25.28%, which echoes the sentiment for many other component suppliers like Monolithic Power acknowledging a slow start and potential flattish 2025 as it pertains to AI and data center growth. Other suppliers like Vertiv have issued contradictory guidance indicating a slowdown as the year progresses (perhaps due to a softer Q2).
Revenues Split Between Product and Service Sales
Nova generates dual revenue streams through two segments: Products and Services. The Products segment includes sales of all the platforms, tools and systems. Service revenues include installation, training, maintenance, customization, support and upgrade services.
Products revenue rose 52.3% in Q4 to a record $158.55 million due to the adoption of Nova’s metrology solutions for logic for AI applications, advanced packaging and memory technologies like HBM. Product revenue distribution of 72% from logic and foundry and 28% from memory. Product revenues included three customers and four territories, which contributed each 10% or more. The principal customers come from Taiwan (Taiwan Semi), South Korea (Samsung), China (Semiconductor Manufacturing International Corporation) and the United States (Intel). Growth went from being down (15.7%) in Q4 2023 to consistent quarterly improvements to close the year with record revenues.
Services revenues rose 20.3% YoY to $36.2 million in Q4 driven by the increasing utilization of tools and expansion of Nova’s customer base on ongoing service contracts. Nova has over 6,400 active installed bases at over 400 customer sites. The Service division delivered record results, with 2024 revenues up 19% YoY due to increased capacity demand and yield improvements. The market remains robust, driven by mobile and AI demand and investments in advanced logic, DRAM, and packaging, with wafer front-end (WFE) expected to grow at mid-single digits this year. Management expects 10% to 15% growth in 2025.
Non-GAAP EPS: Solid YoY EPS Growth Peaks by Q1 2025 and Decelerates in 2025
Nova reported Q4 non-GAAP EPS of $1.94, beating consensus estimates of $1.82, by $0.12 or 6.5%. Non-GAAP EPS rose 42.65% YoY. Interest income for the quarter fell 48.4% YoY to $3.76 million, yet GAAP EPS rose 31.67% from $1.20 to $1.58.
Management guided Q1 2025 EPS to $2.00 to $2.16, with a midpoint of $2.08, which would beat analyst estimates by $0.01, indicating 49.6% YoY growth.
Nova experienced a growth spurt that started in Q3 2024, expected to peak by Q1 2025 driven by AI/HPC chip demand as it flattens out in 2025. Non-GAAP EPS peaks at $2.08 in Q1 2025 guide, as analyst estimates call for a sequential drop to $2.03 by Q1 2026, down -1.92% YoY.
Margins: Consistent Gross and Operating Margins
Nova has done a good job holding the line with margins, as they remained mostly flat in 2024. Non-GAAP gross margins for Q4 were 58%, down from 61% in 1H, but still high enough to indicate strong pricing power and operational efficiencies. The target gross margin is greater than 60%. Non-GAAP operating margins in Q4 were 28%, relatively flat throughout 2024.
Improving Cash While Chipping Away at Debt
Nova closed Q4 2024 with $820 million in cash and cash equivalents, up 27.9% YoY, while chipping away at debt close Q4 2024 at $180.6 million, down 8.65% YoY.
Conference Call: Growth Spurt in 2024, Managements Sees It Continuing in 2025
CEO Gary Waisman noted they are encouraged by the broad adoption of Nova’s portfolio across gate-all-around (GAA) and high-bandwidth memory (HBM) processes. Looking forward, Nova is poised to leverage the transition into advanced manufacturing processes and architectures. They expect growing exposure to new market segments and their differentiated portfolio to drive sustained growth into 2025, continuing the momentum from 2024.
Their standalone optical critical dimension (OCD) solutions had a record year, increasing market share as the Nova PRISM platform delivered high double-digit year-over-year growth. This success was driven by the platform's superior productivity and precision, appealing to both front-end and advanced packaging customers. To meet the rising demand for productivity and yield improvements, they launched Nova Velocity, a next-generation dual-chamber platform that offers the highest productivity in the market. Its speed and robustness have already secured a multi-tool purchase from a leading logic manufacturer, highlighting its ability to deliver innovative, high-yield solutions.
The surge in AI-related demand has been a significant driver as it necessitates energy-efficient computing power and accelerates the demand for advanced processing nodes and memory solutions.
Nova’s customers are leading the transition to 3D architectures, which translate into multiple catalysts for the business, including larger and more complex dies that require a growing number of wafers, a higher number of layers and a leap in the number of process steps, at a much smaller tolerance for error.
Leading foundries, logic, and memory manufacturers are increasingly adopting multiple Nova solutions from their optical dimensions, materials, and chemical metrology portfolio. This widespread adoption demonstrates their ability to meet the complex metrology challenges of advanced semiconductor nodes. Their solutions for 2.5D and 3D applications enable customers to achieve the precision and efficiency required for current and next-generation technologies.
Their materials metrology portfolio delivered record quarterly and annual results. The Metrion platform was adopted by a leading global memory customer for advanced DRAM R&D and high-volume DRAM and NAND production thanks to its high sensitivity and precision in full-wafer epitaxial layer measurements. Additional orders from this customer are expected, and two top memory and logic customers are evaluating the platform. Meanwhile, the fourth-generation VeraFlex platform has been widely adopted by several leading foundries and memory customers, and the Nova Elipson platform performed strongly with repeat orders and penetration into two new major customers.
Nova closed the Sentronics Metrology GmbH acquisition deal on Jan 30, 2025. Sentronics develops modular multi-sensor platforms with proprietary sensors and software that expand our solution capabilities. These platforms are critical for advanced packaging, measuring total thickness variation, surface roughness, and wafer bow and warpage.
Nova expects it to be accretive on a non-GAAP net earnings basis within 12 months of closing. Q1 2025 forecast includes the revenues from the relative period Sentronics will report on Nova. Sentronics had about 10% of a $200 million TAM in 2024, which leads to a total revenue of around $20 million annually or $5 million per quarter. This was gathered from CEO Gary Waisman’s comment here:
“So, as I mentioned, the first quarter forecast includes the revenues from the relative period Sentronics will report on the Nova. And you can deduct from the fact that Sentronics had about 10% of a $200 million TAM market last year as to the level of business that we expect in — especially at least in the first quarter.”
When asked about the demand in 2025 for memory versus logic, Waisman responded.
“So, we do expect advanced logic and advanced packaging to lead the pack in 2025with the growth. We definitely see the HBM segment as part of the advanced packaging growing with the metrology intensity as well. But the bottom line is it's definitely advanced logic and advanced packaging.”
A leading memory manufacturer selected Metrion.
Mark Millar of The Benchmark Company asked where Nova was seeing significant share gains and in which markets. CEO Waisman responded with this:
“So first of all, in terms of the PRISM, standalone OCD, we saw share gains in both advanced manufacturing as well as advanced packaging. We saw an increase in market share on the front-end side of the Chemical Metrology portfolio. We saw obviously high utilization and additional adoption of the XPS tools in Material Metrology. And we also gained some share on the integrated Metrology, especially as we entered into the advanced packaging space, both in the 2.5D architectures and logic as well as in high-bandwidth manufacturing.”
Waisman clarified that memory sales should be looked at by category—specifically DRAM versus NAND—rather than just comparing HBM to NAND. He explained that DRAM sales are significantly stronger than NAND sales, and within DRAM, high bandwidth memory (HBM) makes up the majority of their business. Moreover, HBM is growing at a faster rate compared to overall DRAM.
Charles Shi of Needham asked about the flatline number and 25% YoY growth estimates in 2025, with wafer front-end (WFR) growth in mid-single digits. Shi asked what the reasons are to believe they will continue 2024’s growth in 2025.
Waisman answered, “I think it has to do with two — three major issues. One is the position that we have, especially with the unique value driven by the technologies that we offer. The second one is expanding our position into advanced packaging and seeing higher adoption. And the third one, of course, which drives that as well, is the Sentronics acquisition that gives us an opportunity to expand to additional customers than the ones that we are exposed to-date. I would top it all, of course, by the fact that we have a strong position in advanced logic, and that gives us grounds to believe that we have the fundamentals, the infrastructure in order to drive the growth into 2025.”
CEO Waisman had confirmed committing that gate-all-around (GAA) revenues are expected to grow cumulatively to $500 million from 2024 through 2026. He stated this.
“I'm not sure I can add more to the fact that we are committed to the $500 million from gate-all-around until 2026. We haven't changed our position in that respect. We will try to give more color during the Investor Day on March 17. But I think that the tracking that number gives a lot in terms of our confidence in making it this year as well.”
This implies a solid growth driver as the adoption of GAA is clearly accelerating as it was 8-9% of total 2024 Product revenues equating to $45 million at midpoint. A doubling conservatively implies $90 million-ish in 2025 or 13.4% of Product revenue based on 25% YoY total revenue growth in 2025. Analyst Charles Shi commented on this.
“Based on your latest reporting, it sounds like, it's $40 million-ish. I think most of your peers are guiding gate-all-around revenue doubling, but your guidance seems to suggest that's a little bit more than doubling for you guys”
This leaves 2026 GAA revenues of $365 million (to complete the $500 million cumulative revenue “commitment” from 2024-2026) implying its growth to 50.8% of total Product revenues in year 2026, using the consensus analyst estimates for full year 2026 revenue of $896.75 million.
Valuation:
The flat/plateaued 2025 assumption is based on consensus analyst forecasts, which had dead-on accuracy for Q1 2025 as management’s midpoint revenue guidance of $210 million matched consensus analyst estimates for $210.1 million. The consensus analyst non-GAAP EPS estimates peak at $2.07 in Q1 2025 versus the $2.08 midpoint guide by the Company and progressively decline for the next four quarters to $2.03 in Q1 2026. Estimates reaccelerate in Q2 2026 at $2.18, then $2.25 for Q3 2026 and $2.34 for Q4 2026. While YoY growth analyst estimates forecast 25.26% revenue and 23.09% non-GAAP EPS growth, the growth during the year indicates a plateau with consensus analyst revenue estimates rangebound between $210 million to $213.8 million.
Either the analysts are asleep at the wheel with their growth estimates or are taking a wait and see approach or expect a flattish 2025 and reacceleration in Q2 2026. Metrology systems providers (semiconductor equipment makers) tend to be a leading indicator compared to power and cooling technology providers, although can be off cycle due to the lumpiness of capex spending from foundries.
It could also coincide with what other AI and data center suppliers are hinting at: a slowdown in 2025 and a reacceleration in 2026. Nova shares trade at a P/E of 47.56 compared to its five-year median P/E of 34.88 and a P/S of 13.06 compared its five year P/S of 6.96. Nova has doubled their revenues every five years since 2007. At the current elevated price levels, it may be prudent to wait and see what further guidance the Company provides in its Q1 2025 earnings release during market hours on May 9, 2025, and its Investor Day on May 16, 2025.
Conclusion:
Nova’s solutions are gaining traction, and the growth catalysts are evident. AI chips are power hungry beasts that advanced packaging technology like CoWoS helps to feed by enabling more performance in less space. Higher yields keep costs down, but the bottleneck occurs when packaging yields lag front-end wafer yields choking off supply. Nova’s metrology tools like its Prism 2 optical critical dimension (CD) platform and Elipson chemical profiling improve interposer alignment and film thickness control in CoWoS packaging. This contributes to higher yields potentially hitting up 90% or greater on mature runs at the foundry level. We can surmise their three principal customers and the four top regions coming from Taiwan (Taiwan Semi), South Korea (Samsung), China (Semiconductor Manufacturing International Corporation) and the United States (Intel).
Management was upbeat about the growth momentum continuing into 2025 but only provided Q1 guidance, as they don't provide full-year forecasts. The Q1 guidance indicates revenue growth of 48.09% YoY at the $210 million midpoint. Around $5 million of that is estimated to be from the addition of Sentech revenues. Customer concentration is less of a concern with a company that supplies foundries, as the total number of foundries globally is limited. However, there is an overallotment of clients in Asia, where most of the world’s foundries are located. Nova is highly exposed to Asia, which comprised 77% of total revenue in 2024, led by China at 39% of total revenues. Nova has a handful of large customers. Three customers comprise at least 30% of the Product revenues. Nova has maintained consistent margins, and its debt-to-equity ratio is 0.19. The company has a war chest of $820 million in cash and cash equivalents.
Welcome to the I/O Fund’s new Discovery Tier, where we cover a new stock idea on a weekly or bi-monthly basis. We are excited to bring you more coverage from the I/O Fund team geared toward new idea generation only.
I/O Fund Equity Analyst, Jea Yu, contributed to this analysis
Please note: The I/O Fund conducts research and draws conclusions for the Fund’s positions. We then share that information with our readers. This is not a guarantee of a stock’s performance. Please consult your personal financial advisor before buying any stock in the companies mentioned in this analysis.