Nvidia Q3: Largest QoQ Growth in 2 Years; Networking up 162% 

Nvidia’s Q3 showed the company’s GPU momentum return, delivering a substantial data center beat with 25% QoQ growth, surpassing an important $50 billion quarterly revenue milestone for the segment. More importantly, Nvidia’s guide pointed to this momentum continuing into the fourth quarter, implying that data center revenue could be on track to rise another $8 billion QoQ for 15% growth. 

Yesterday I published an article entitled Why Nvidia Stock Could Reach $20 Trillion Market Cap by 2030 – a prediction that requires a 36% CAGR over a five-year period or about 8% growth QoQ. These two quarters alone meet the criteria for next year’s CAGR plus some. 

Margins expanded sequentially, free cash flow sustained nicely, networking was up an impressive 162% and compute was up 56%. Management repeated they “currently have visibility to $0.5 trillion in Blackwell and Rubin revenue from the start of this year through the end of calendar year 2026.”

Below, we look at one other metric that hints that Blackwell Ultra can continue to deliver knockout earnings report while our sights are now set on Vera Rubin for H2 2026.  

Nvidia Surpasses $50 Billion Quarterly Data Center Revenue 

Nvidia surpassed the $50 billion quarterly data center revenue milestone in Q3, as it reported $51.2 billion in revenue for the segment, up 25% QoQ and 66% YoY. This is the highest QoQ growth rate for data center since fiscal Q4 2024. An impressive feat to deliver such strong growth at this scale considering the segment was just $18.4 billion at the time. On a dollar basis, data center revenue rose by $10.1 billion sequentially.  

This sequential growth was driven by a strong inflection in Compute revenue, which surged 27% QoQ to $43 billion, its highest sequential growth rate since fiscal Q1 2025; however, this does come after a (1%) QoQ decline in fiscal Q2. Nvidia noted that Blackwell Ultra was ramping across all customer categories and became its leading architecture.  
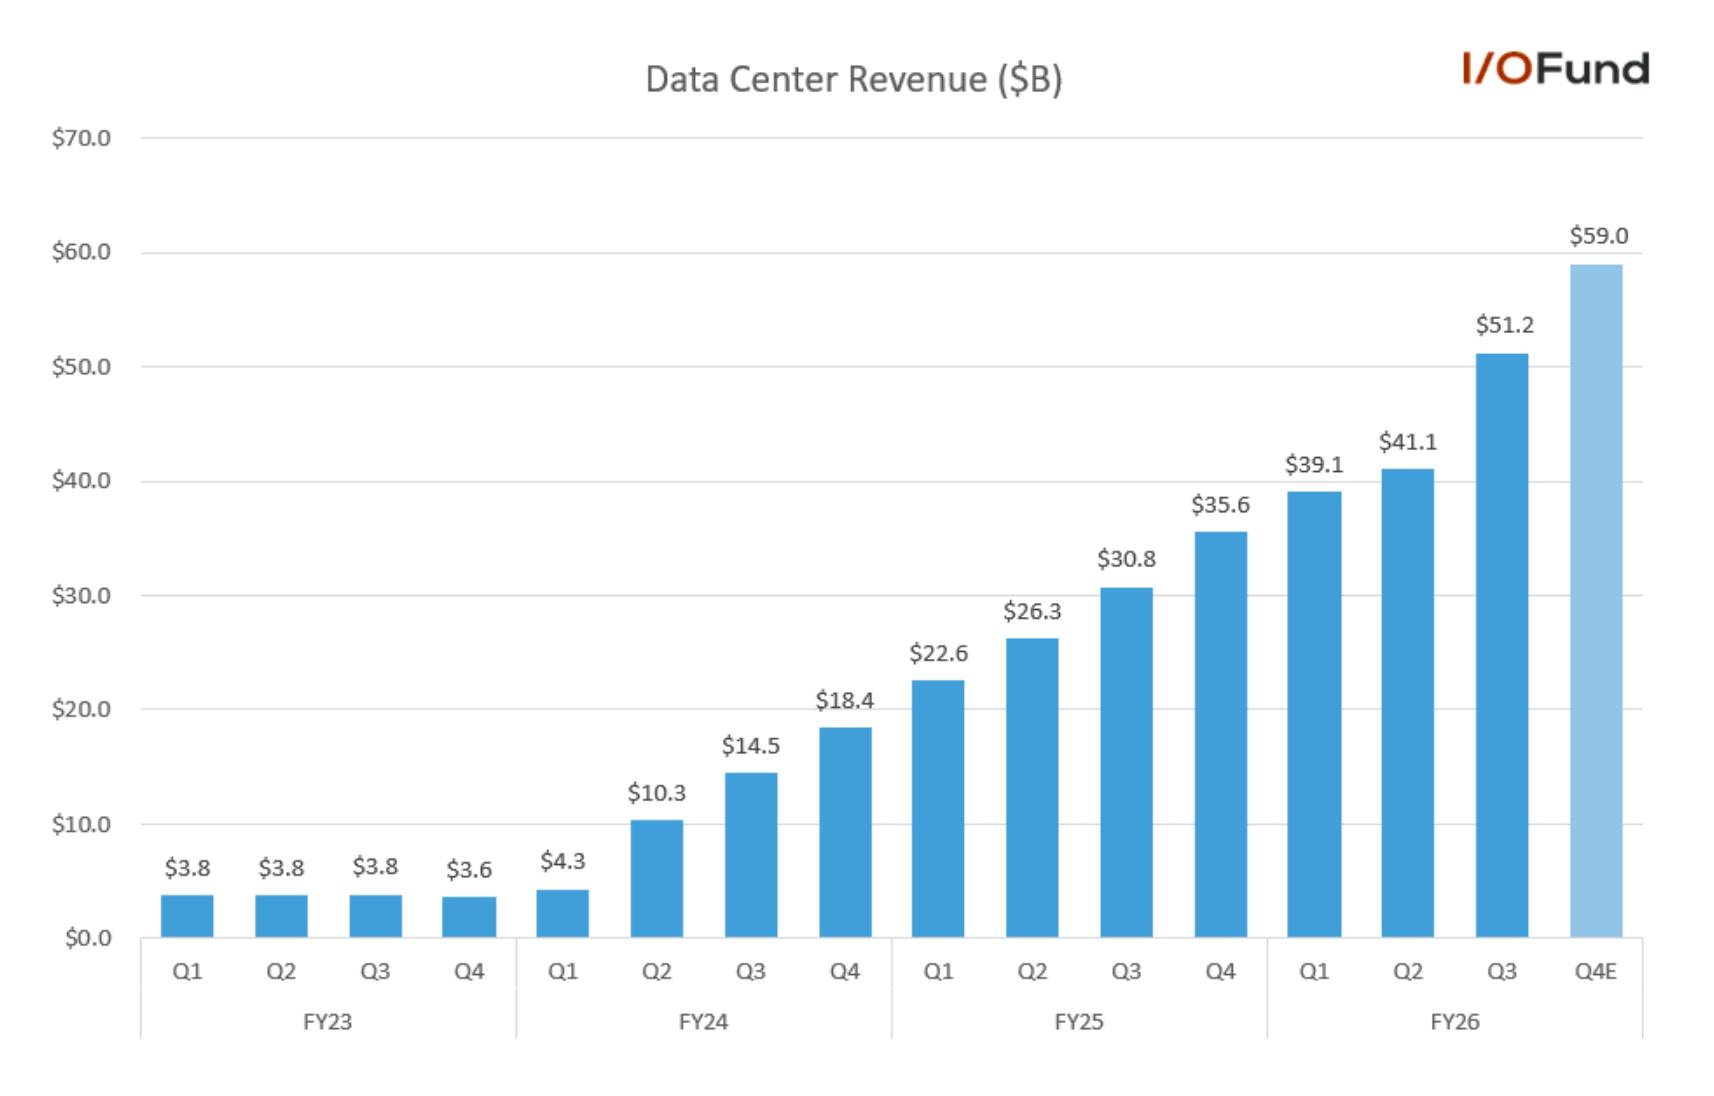
Q4’s guidance suggests that this $50 billion data center segment will quickly be in the rear view mirror, with the $65 billion guidance implying data center revenue of around $59 billion assuming similar mix shift as Q3. This represents another 15% QoQ growth on top of Q3’s 25%, or essentially the data center segment rising nearly 44% in just two quarters.  

This would also correspond to a nearly $8 billion QoQ increase, meaning that if Nvidia maintains this growth cadence through mid-CY26, then it would reach our prediction for a $75 billion data center segment two quarters early. If this materializes, this would represent data center growth of 66% YoY, up from 56% last quarter.  

It also could suggest Nvidia potentially reaching a $90 billion quarterly data center segment if this trajectory is maintained through the end of fiscal 2027. However, it is important to note that given the sheer scale of data center revenue, there is the potential for this inflection to be lumpy. Therefore, we are directionally bullish but not with too specific of a timeline; rather, these are milestones that tell us how quickly we could see $8 trillion market cap for example and then onward. 

Blackwell Revenue Tops $100 Billion 

As stated in our $20 Trillion pre-earnings writeup, after taking into account Blackwell revenue that will ship in FY2026, this should lead to a $320 billion data center segment next year. Here is what was stated in the $20 Trillion analysis: “Reading between the lines on Huang’s comments suggests strong upside to Nvidia’s data center revenue through 2026. Over the prior three quarters heading into fiscal Q3’s report, Blackwell revenue has totaled approximately $63 billion. Including Networking over that time frame, total revenue would rise to $78 billion, still a fraction of the total overall opportunity management is projecting. Thus, if we assume that Blackwell and Rubin ramp over the next five quarters, fiscal 2027 data center revenue could be nearly $320 billion, versus estimates for around $270 billion.”  

Since we wrote that earlier this week, analyst estimates have been rising and now stand at $292 billion for next year. With information from this report, we look to be on track for a $317 billion data center segment next year (close to our original estimate this morning). 

We calculated this from the prior three quarters heading into fiscal Q3’s report, Blackwell revenue has totaled approximately $63 billion. Now, Q3’s Compute revenue of $43 billion implies Blackwell has delivered around $104 billion in revenue in the past four quarters, assuming the only non-Blackwell revenue was the $2 billion disclosed from Hopper.  

Including Networking and Q4’s guidance, Nvidia looks to be on track to generate $186 billion of its $500 billion opportunity in fiscal 2026. This would leave approximately $314 billion for fiscal 2027’s data center revenue to meet the $500 billion visibility, but if Nvidia can exceed that by 2-4%, it could be on track for $330 billion next year. Management sounded confident to achieve the $500 billion target and they hinted that they could exceed it as the CFO stated, “So there's definitely an opportunity for us to have more on top of the $500 billion that we announced.”

One Figure Says This Growth Inflection Will Continue 

While we continue to hammer on the importance of Big Tech’s capex as the number one indicator for Nvidia’s data center growth continuing, there was potentially a more important, well overlooked figure in Nvidia’s report that signals this data center inflection will continue.  

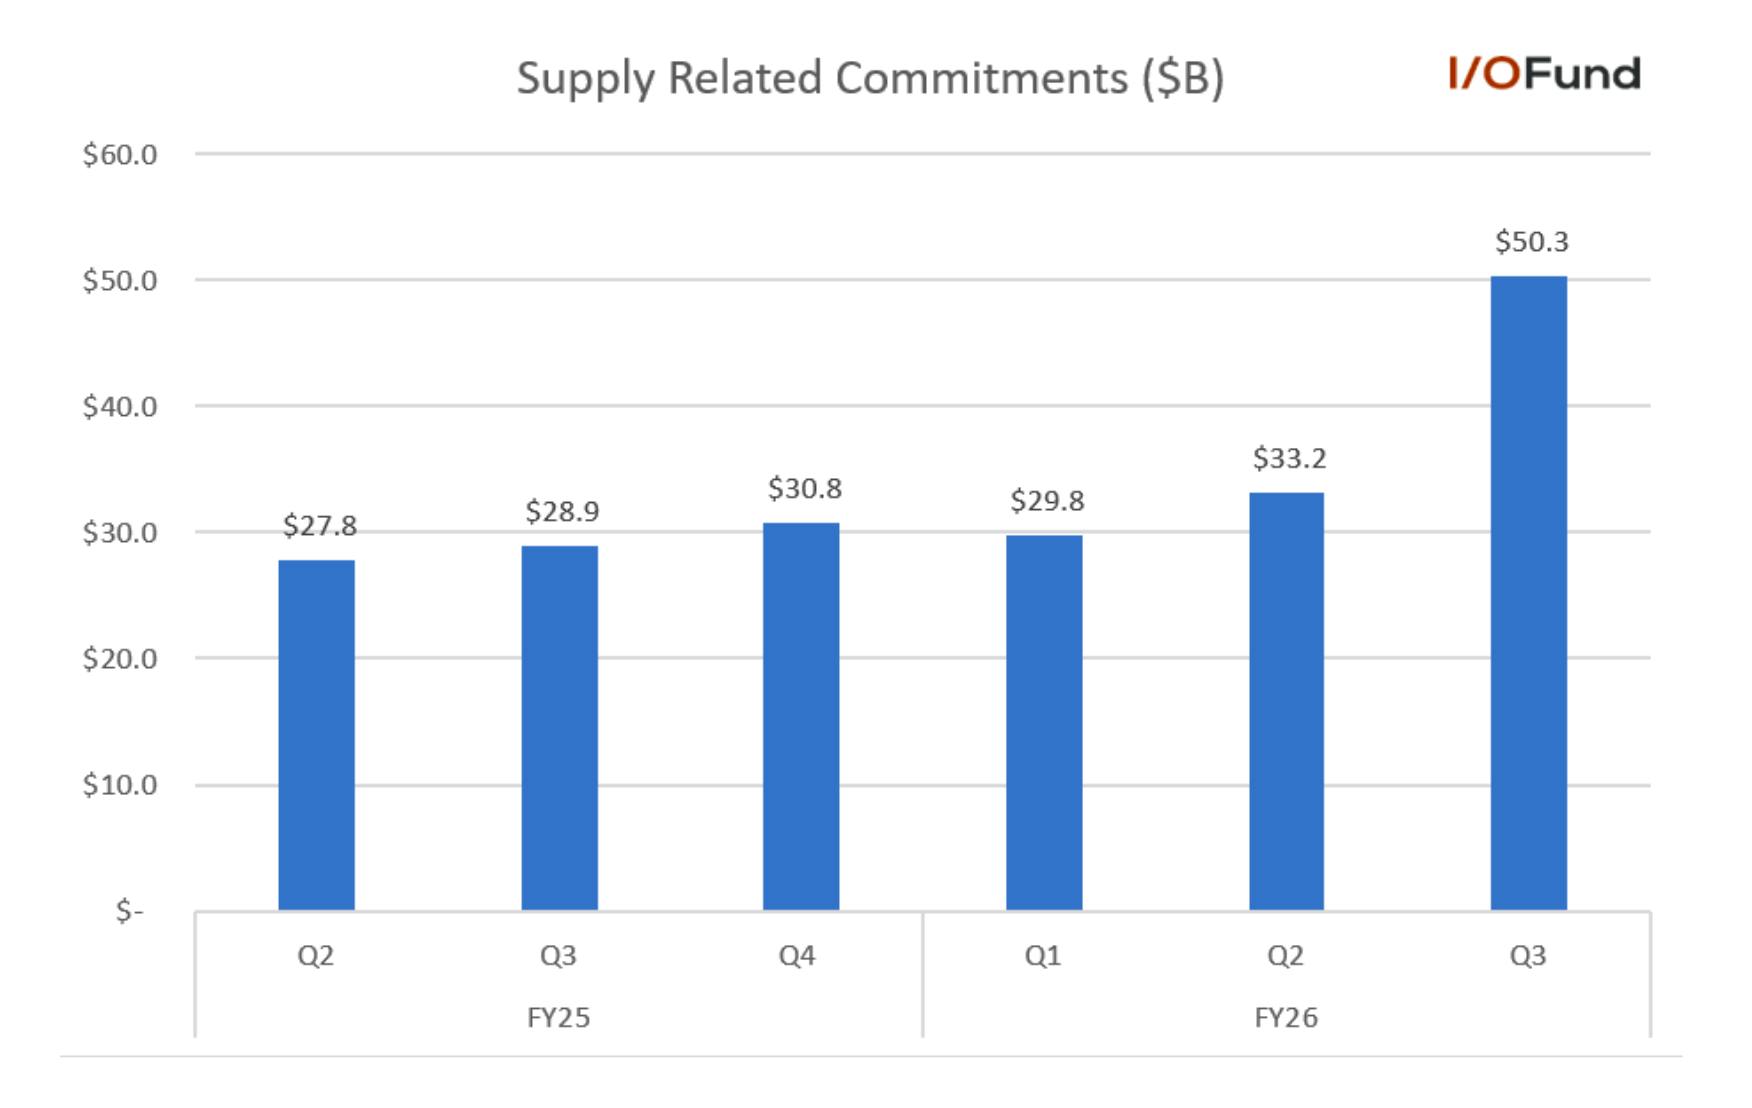
Nvidia’s total supply-related commitments, such as for CoWoS wafers, HBM memory, or other components, surged nearly 52% QoQ to $50.3 billion in Q3, with management noting that they are “ordering to secure long lead-time components, meet the demand for Blackwell, and support future architecture ramps.”  

This is a notable increase from the prior five-quarter average of ~$30 billion, which is likely supporting the current ramp in data center revenue. This uptick in supply commitments, which is likely to translate into inventories and revenue over the coming four to six quarters, hints that Nvidia will continue ramping Blackwell output while preparing for Rubin’s production in the second half of 2026.   
This also bolsters confidence in Nvidia’s order visibility to fill out and even exceed this cumulative $500 billion in Blackwell and Rubin revenue, as the company would not need to boost supply commitments by this degree if the demand signals were not there.  

There is Global Demand for Nvidia’s GPUs 

When hearing about an AI bubble, it’s important to remember there is global demand for Nvidia’s GPUs. The diversification across geographic regions, enterprises, startups – and of course, Big Tech, helps to insulate Nvidia should one customer or region slow their spending. Here is what was stated on the call: 

“And then lastly, remember, we were just talking about the American CSPs. Each country will fund their own infrastructure. And you have multiple countries, you have multiple industries. Most of the world's industries haven't really engaged agenetic AI yet, and they're about to. All the names of companies that you know we're working with, whether it's autonomous vehicle companies or digital twins for physical AI for factories and the number of factories and warehouses being built around the world, just a number of digital biology start-ups that are being funded so that we could accelerate drug discovery. All of those different industries are now getting engaged, and they're going to do their own fundraising. And so don't just look at the hyperscalers as a way to build out for the future. You got to look at the world, you got to look at all the different industries and enterprise computing is going to fund their own industry.” 

Commentary on Vera Rubin 

If only a Nvidia investor could kick back and call it a day! Instead, given Blackwell Ultra now comprises 2/3 of revenue confirming a successful launch, our sights are now set on Vera Rubin commentary. According to management, Rubin is set for a fast ramp: 

“The Rubin platform is on track to ramp in the second half of 2026. Powered by 7 chips, the Vera Rubin platform will once again deliver an X-factor improvement in performance relative to Blackwell. We have received silicon back from our supply chain partners and are happy to report that NVIDIA teams across the world are executing to bring up beautifully.  

Rubin is our third-generation rack-scale system substantially redefined the manufacturability while remaining compatible with Grace Blackwell. Our supply chain data center ecosystem and cloud partners have now mastered the build to installation process of NVIDIA's rack architecture. Our ecosystem will be ready for a fast Rubin ramp.” 

Financial Overview: 

Strong Revenue Growth of 63% 

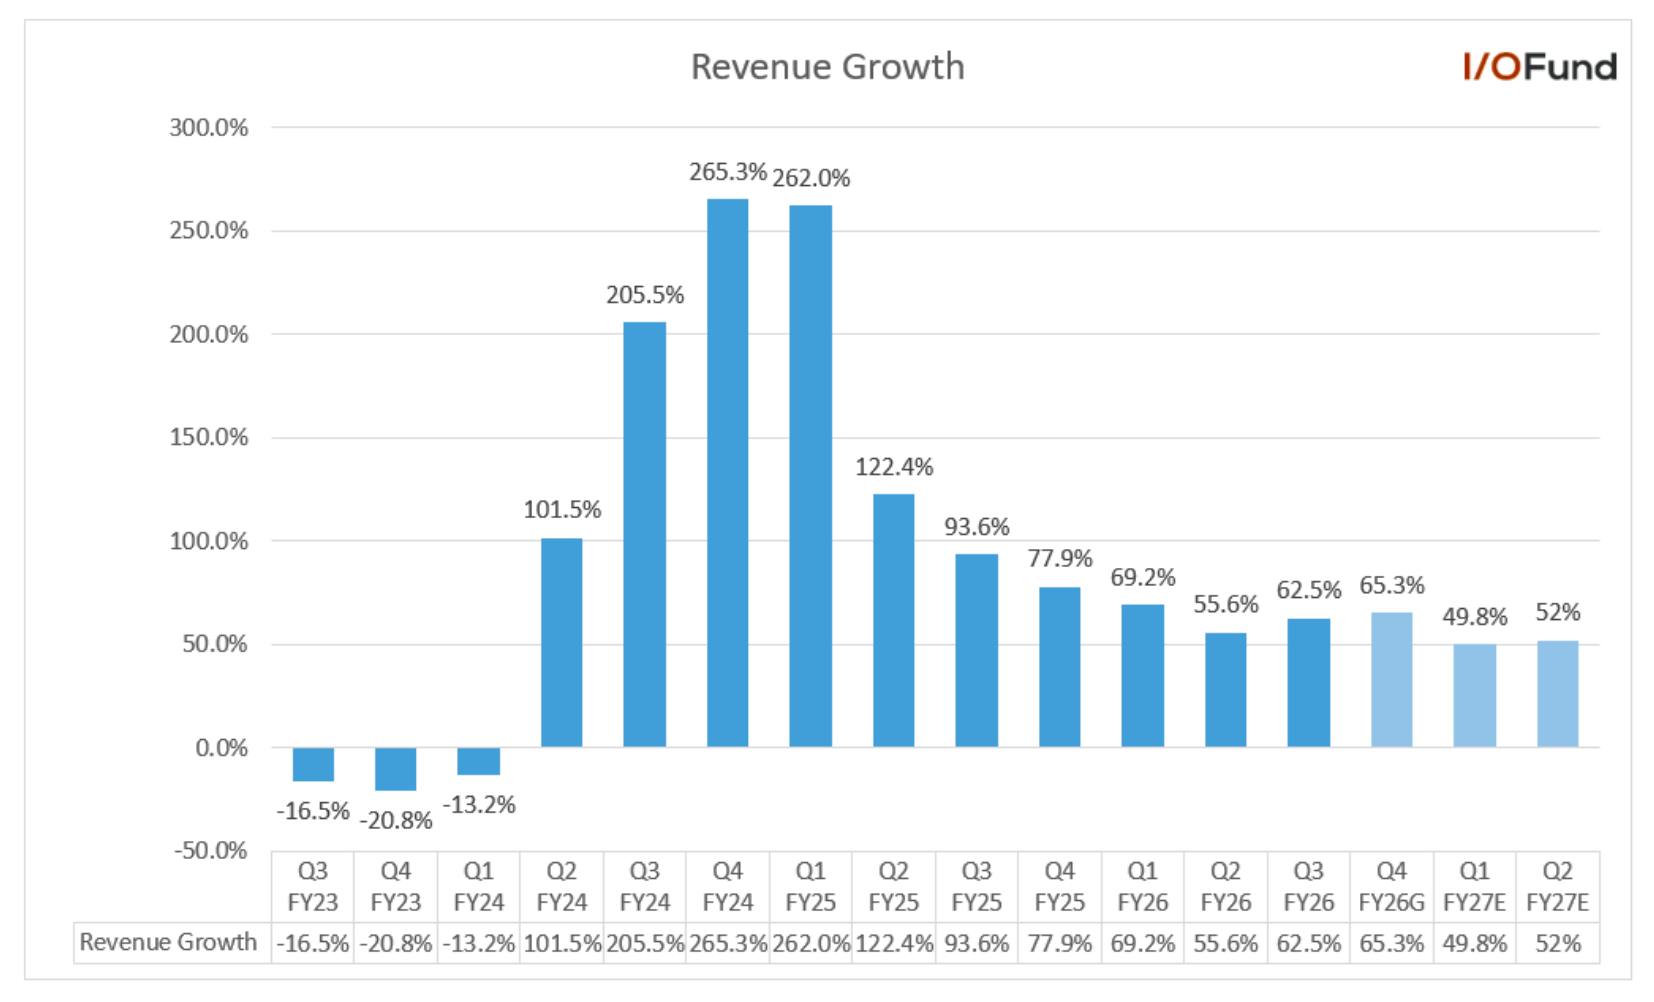
Nvidia’s Q3 revenue grew by a solid 62.5% YoY and 22% QoQ to $57.01 billion. Revenue growth accelerated by 6.9 percentage points from 55.6% YoY growth reported in Q2. Revenue beat estimates by 3.5% and is the strongest beat in the last four quarters. The company’s strong revenue growth dispelled fears of an AI Bubble. Nvidia’s CEO Jensen Huang said, “Blackwell sales are off the charts, and cloud GPUs are sold out.”  

The Blackwell revenue gained further momentum in the recent quarter. The GB300 sales were higher than the GB200 sales, notably accounting for 2/3 Blackwell’s revenue, driven by strong demand from cloud companies and hyperscalers. The Hopper platform contributed approximately $2.0 billion in revenue. While H20 sales were negligible at $50 million, management is working with the US and Chinese governments to ship products to China. Looking forward, Rubin is on track to ramp in the second half of 2026. 

Management also provided a strong Q4 revenue guide of $65 billion at midpoint, representing a YoY growth of 65.3% and up 14% QoQ. It beat the estimates by 5.1%. Looking forward, analysts expect revenue to grow 40.5% YoY to $292.1 billion for FY2027 and 24.8% YoY to $364.6 billion for FY2028.
Networking Revenue Growth of 162% 

The company’s networking revenue was an outlier, growing 162% YoY and 13% QoQ to $8.19 billion. Revenue growth accelerated by 84 percentage points from 78% YoY growth in Q2. Management stated in the earnings call that the company’s networking business is specifically built for AI and is now the largest in the world. The strong growth was primarily due to NVLink scale-up and robust double-digit growth across Spectrum-X Ethernet and Quantum-X InfiniBand. 

Management stated in the earnings call that Meta, Microsoft, Oracle, and xAI are building gigawatt AI factories with Spectrum-X Ethernet switches, further highlighting the flexibility and openness of the company’s platform. 

The company introduced Spectrum-XGS Ethernet in August, which will enable to connect distributed data centers into Giga-Scale AI Super-Factories. Nvidia is the only company with AI scale-up, scale-out and scale across platforms, reinforcing the unique position in the market as the AI infrastructure provider. 

  • Q3 gaming revenue grew by 30% YoY and was down (1%) sequentially to $4.27 billion. Management mentioned that channel inventories have reached more normalized levels heading into the holiday season. 
  • Pro visualization revenue grew by 56% YoY and 26% sequentially to $760 million. Colette Kress, CFO, said in the earnings call, “Growth was driven by DGX Spark, the world's smallest AI supercomputer, built on a small configuration of Grace Blackwell.” 
  • Automotive revenue grew by 32% YoY and up 1% QoQ to $592 million. The CFO highlighted, “We are partnering with Uber to scale the world's largest Level 4 ready autonomous fleet built on the new NVIDIA Hyperion L4 robotaxi reference architecture.” 
  • OEM and other revenue grew by 79% YoY and 1% QoQ to $174 million.  

Margins 

The company’s margins beat management guidance and are expected to expand in Q4. 

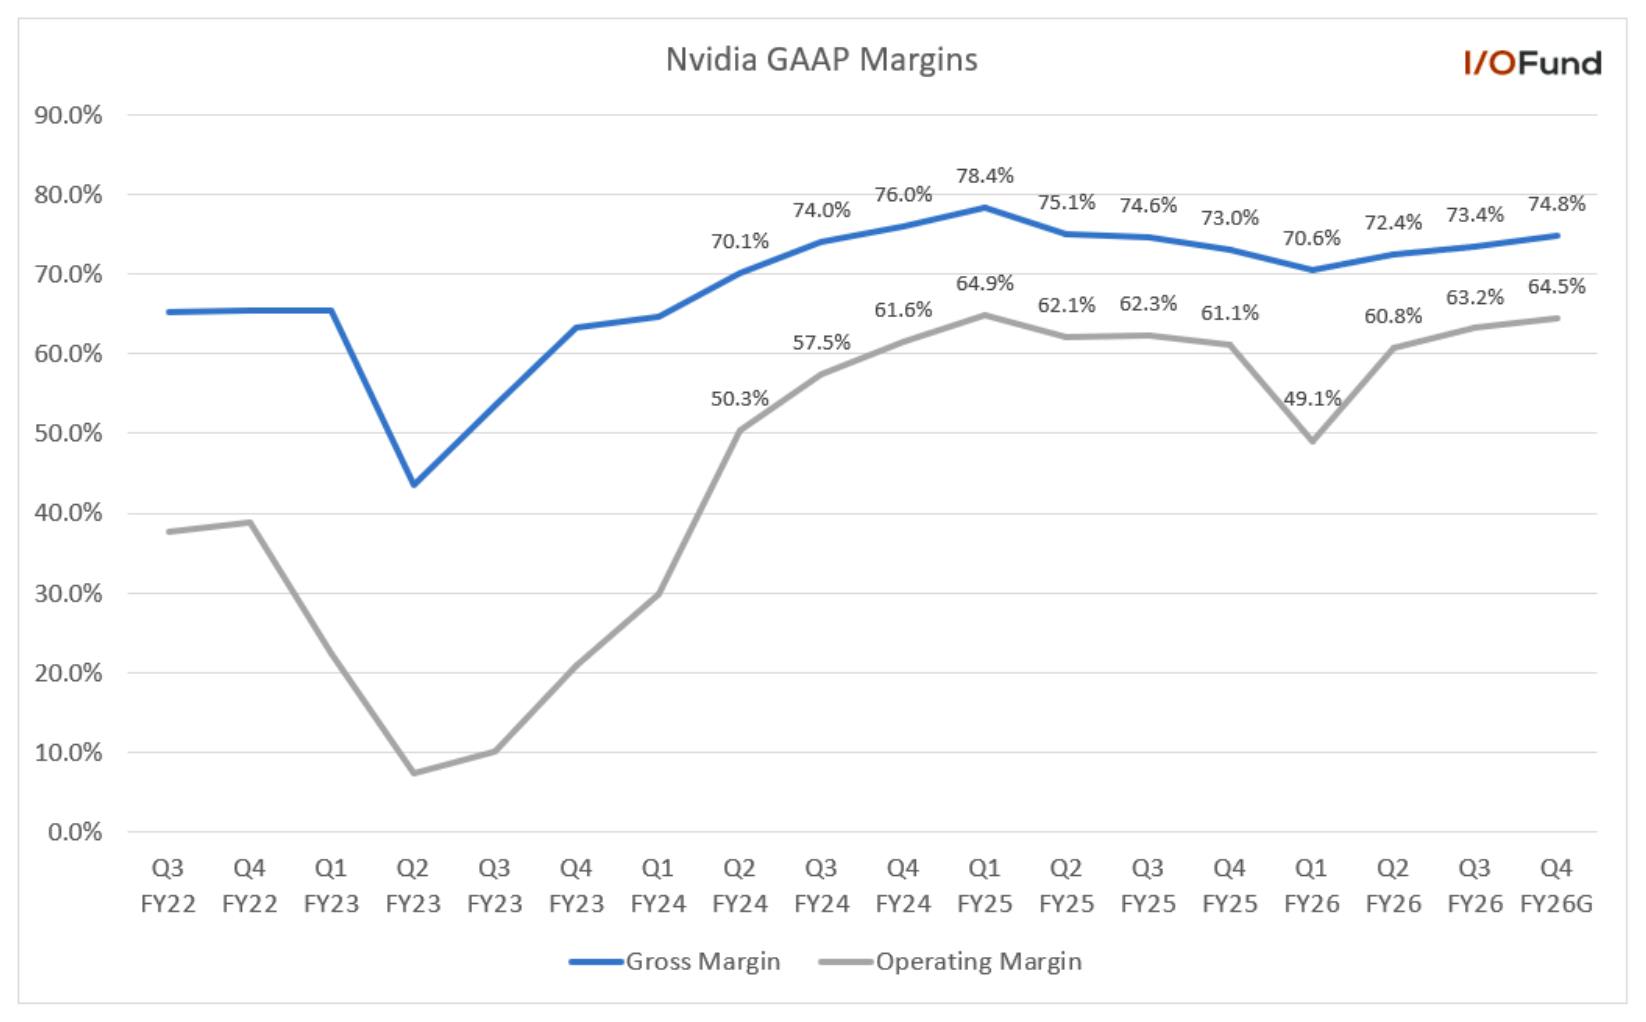
  • Q3 gross profits grew by 60% YoY to $41.85 billion. Q3 gross margin was 73.4%, beating management guidance of 73.3% by 10 basis points. Gross margin was up 100 basis points sequentially and down 120 basis points YoY. Q4 gross margin guide is 74.8%, up 140 basis points sequentially and up 180 basis points YoY.  Adjusted gross margin was 73.6%, beating the management guidance by 10 basis points. Management expects an adjusted gross margin of 75% in Q4, up 140 basis points sequentially and up 150 basis points YoY. 
  • Looking forward, management mentioned in the earnings call that the input costs are increasing and are looking to hold gross margins in the mid-70s range for FY2027. 
  • Q3 operating income grew by 65% YoY and 27% sequentially to $36.01 billion. The operating margin was 63.2%, beating the management guidance by 80 basis points. Adjusted operating margin was 66.2%, beating the management guidance by 50 basis points. Management has provided a strong operating margin guide of 64.5% and an adjusted operating margin guide of 67.3% for Q4. 
  • Q3 net profits grew by 65% YoY and 21% QoQ to $31.9 billion with a net profit margin of 56% compared to 55% in the same period last year and 56.6% in Q2. Adjusted net profits grew by 59% YoY and 23% QoQ to $31.77 billion with an adjusted net profit margin of 55.7%, compared to 57% in the same period last year and 55.2% in Q2.
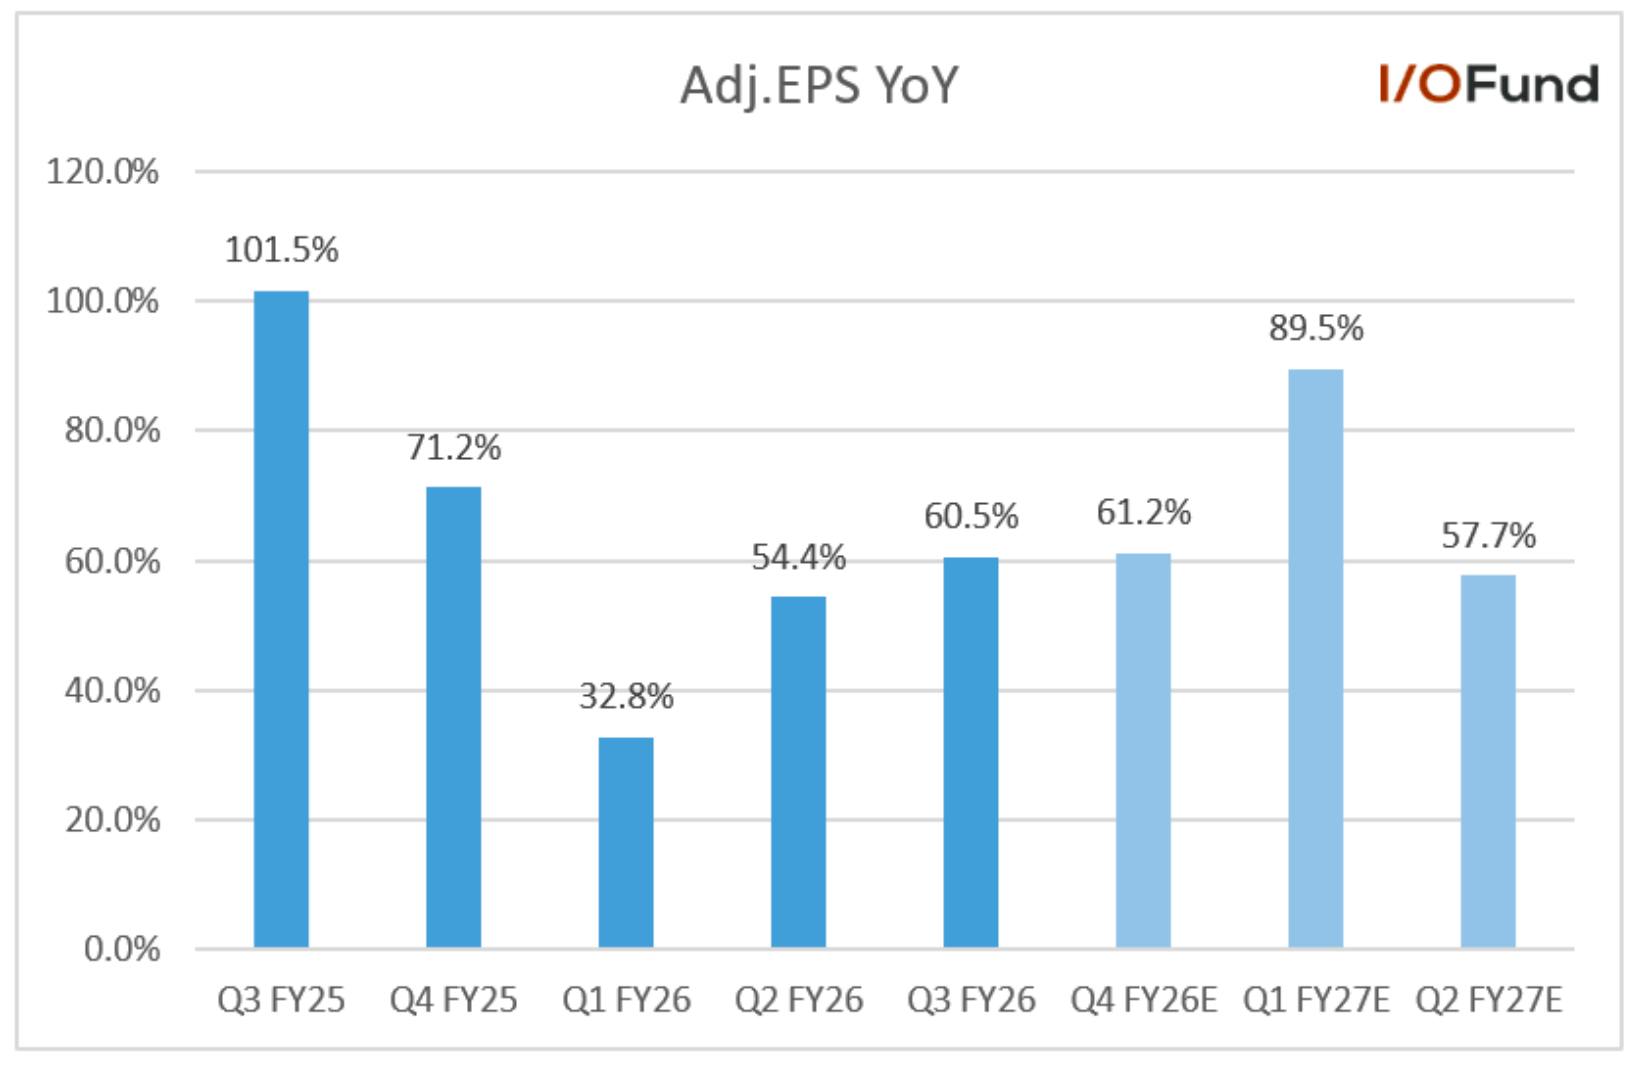
Adjusted EPS grew by 60.5% 

Q3 adjusted EPS grew by 60.5% YoY and 23.8% QoQ to $1.30, beating estimates by 3.5%. GAAP EPS grew by 66.7% YoY to $1.30, beating estimates by 8.5%. GAAP EPS included $0.06 in gains in non-marketable and publicly held equity securities. 

  • Analysts expect adjusted EPS to grow 61.2% YoY to $1.43 in Q4 and accelerate to 89.5% YoY growth to $1.53 in Q1. 
  • Looking forward, analysts expect FY2027 adjusted EPS to grow 49.5% YoY to $6.83 and 26.7% YoY to $8.65 in FY2028.
Cash and Balance Sheet 
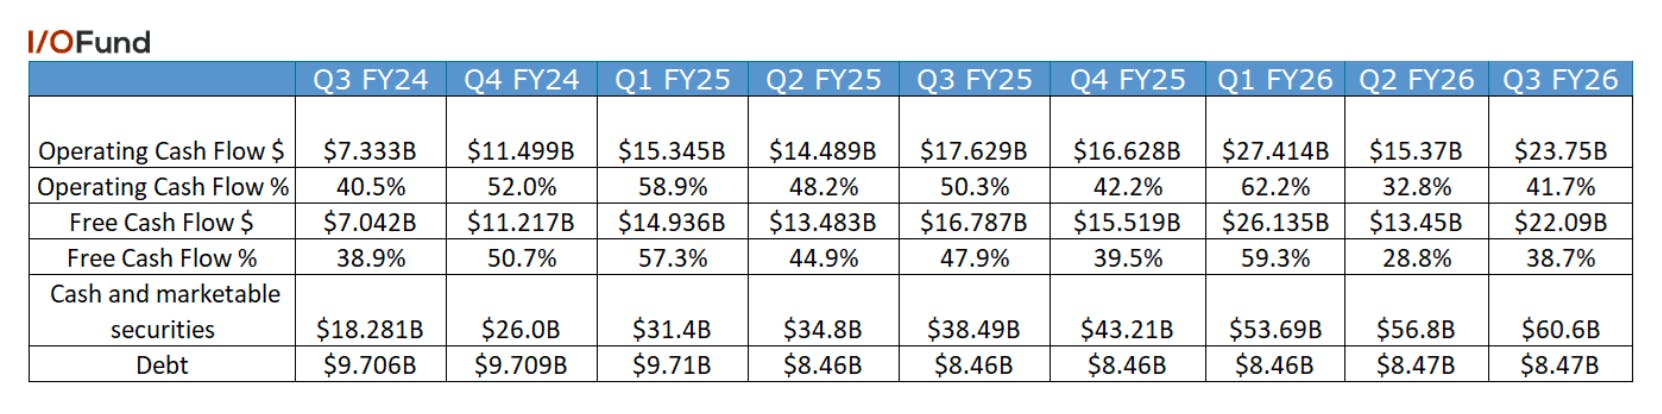
The company has a strong balance sheet with solid cash flows primarily driven by strong revenue and profits.  

  • Q3 operating cash flow grew by 34.7% YoY to $23.75 billion with an operating cash flow margin of 41.7%, compared to 50.3% in the same period last year and 32.8% in Q2. 
  • Q3 free cash flows grew by 31.6% YoY to $22.09 billion with a free cash flow margin of 38.7%, compared to 47.9% in the same period last year and 28.8% in Q2. 
  • The company’s cash and marketable securities have been steadily increasing and were $60.6 billion at the end of Q3, up from $56.8 billion in Q2 and $38.5 billion in the same period last year. Debt remained constant at $8.47 billion for Q3 and Q2. 
  • The company returned $12.7 billion to shareholders in the third quarter through $12.5 billion of share repurchases and $243 million of cash dividends. The company expects to continue to use its strong future cash flows to buy back shares and invest in AI growth opportunities.  
  • Inventories grew by 32% sequentially to $19.78 billion to support strong revenue growth. 

Conclusion: 

The $20 trillion prediction came from looking at the original $10 trillion prediction ahead of earnings and realizing I’d have to bump this up given the commentary around the $500 billion from the Blackwell-Rubin cycle. Although we had already slated next year for a $300 billion run rate and a $75 billion quarterly data center segment, it helped to hear last month that management agrees this is possible. Where the disconnect happens with analyst estimates is what will happen after next year as this is where analyst estimates show minimal growth through 2030 revenue with $437 billion whereas I am calling for double that by 2030. While Blackwell Ultra gets us to a new milestone of $50 billion to $75 billion quarterly revenue, quite a bit of my thesis depends on Vera Rubin, Rubin Ultra and the Feynman generations. 

Although the next five years will be a marathon, the Q3 report is a step in the right direction. I don’t expect consistent QoQ growth every quarter, yet as stated, we are already exceeding my CAGR for next year in two quarters’ time. Crunching these numbers matters quite a bit as we are talking about the world’s most valuable company and Nvidia will have to put up consistent growth for the stock to inch upward. The days of a sudden spike in the stock price are likely behind us, yet if Nvidia remains consistent, the incessant market narratives will eventually tire.  

Overall, this was an excellent report — and after two years of dissecting every angle of Blackwell, I’m excited to finally shift coverage to the Rubin generation of GPUs. Woohoo! This now marks the fourth GPU generation I’ve retired for I/O Fund Members — and we’re officially moving on to the fifth.

I/O Fund Equity Analysts Damien Robbins and Royston Roche contributed to this analysis.

Please note: The I/O Fund conducts research and draws conclusions for the company’s portfolio. We then share that information with our readers and offer real-time trade notifications. This is not a guarantee of a stock’s performance and it is not financial advice. Please consult your personal financial advisor before buying any stock in the companies mentioned in this analysis. Beth Kindig and the I/O Fund own shares in NVDA at the time of writing and may own stocks pictured in the charts.

Recommended Reading:
Why Nvidia Stock Could Reach a $20 Trillion Market Cap by 2030

The statement that Nvidia stock could reach a $20 trillion market cap by 2030 will trigger plenty of emotion — it sounds fantastical, full of hype, or like a prediction made far too early in the AI cycle. Yet what I offer you below is a data-driven, fundamentally grounded case for how Nvidia can realistically reach a $20 trillion valuation by 2030. 

When it comes to Nvidia’s AI story, I’ve offered the earliest and most consistent analysis, covering the company’s AI trajectory earlier than anyone on record. For instance, I told my premium stock research members in September of 2019 that Nvidia would become one of the world’s most valuable companies when it was only a $110 billion valuation (it’s now up 40X). I also publicly stated that Nvidia would surpass Apple when Nvidia had just one-fifth of Apple’s market cap — $550 billion versus $2.5 trillion — writing: “The conclusion to my analysis is the same as the introduction, which is that I believe Nvidia is capable of outperforming all five FAAMG stocks and will surpass even Apple’s valuation in the next five years.” Fast forward and Nvidia stock is up 8X since that analysis.

Last year, when Nvidia stock was valued at $3 trillion, I projected the stock would reach $10 trillion market cap by 2030 — a forecast that no longer looks aggressive now that the stock has briefly broken above $5 trillion. Today, with an even clearer view into the company’s product cadence, software moat, and AI systems dominance, my new, updated thesis is that Nvidia’s stock is on track to reach a $20 trillion market cap by 2030. 

This is supported by Nvidia’s aggressive 1-year product roadmap, an impenetrable software ecosystem through CUDA, and its evolution into a full-stack AI systems provider. When these elements are modeled together — alongside the rapid expansion in global AI infrastructure capex — the path to $20 trillion becomes less sensational and more a reflection of compounding fundamentals.

Nvidia’s Data Center Needs to Grow at 36% CAGR to Reach $20T Market Cap

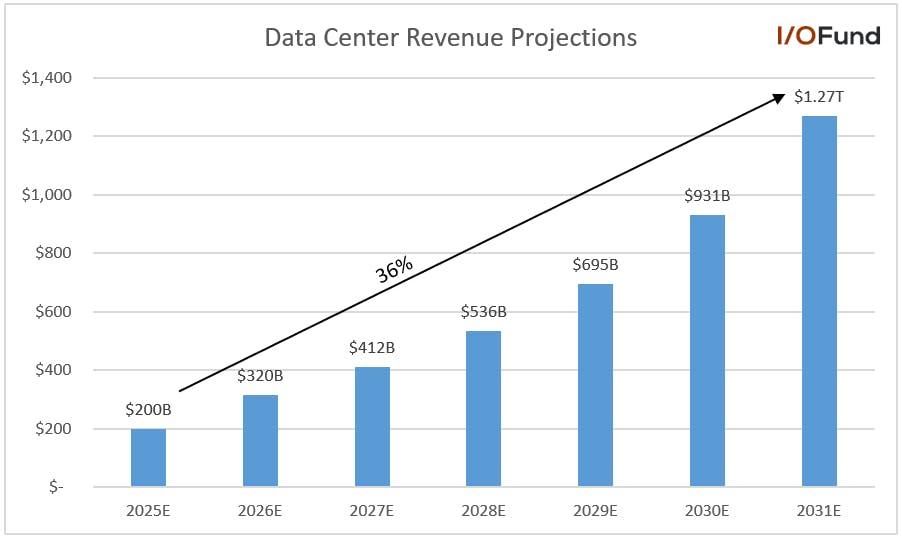
To get down to brass tacks, Nvidia will have to grow its data center segment at a 36% CAGR to reach a $20 trillion market cap if we assume its 5-year median sales valuation of 25 forward PS remains intact. This will put the company’s data center revenue at a run rate in the mid-$900 billion range.

Illustration showing Nvidia’s potential $20 trillion market cap by 2030 driven by 36% CAGR in its data center business

Pictured above: Nvidia stock could see a $20 trillion market cap by 2030 based on a 36% CAGR in its data center segment

About eighteen months ago, I highlighted the importance of Nvidia reaching a $50 billion data center segment by year-end in the article, Here's Why Nvidia Stock Will Reach $10 Trillion Market Cap By 2030, stating: 

In my analysis last month on the Blackwell architecture, I made the argument these estimates are too low and that my firm expects we will see a $200 billion data center segment by end of CY2025 propelled forward by the B100, B200 and GB200, including the following points: “Taiwan Semi’s CoWos capacity, which is essential for Blackwell’s architecture, is estimated to rise to 40,000 units/month by the end of 2024, which is more than a 150% YoY increase from ~15,000 units/month at the end of 2023. Applied Materials has boosted its forecast for HBM packaging revenue from a prior view for 4X growth to 6X growth this year.” 

The data center segment for Nvidia of $320 billion by 2027 would result in 260% growth for Nvidia’s DC from where it stands today and up 120% from DC revenue estimates for end of CY2025.” 

It’s highly probable that Nvidia will blow past the $50 billion data center segment mark this evening – one quarter earlier than my original prediction – which puts the company on the path for a $75 billion segment in Q4 of next year. Tracking these milestones is crucial as it helps support that Nvidia is well on its way to reaching my firm’s brand-new updated estimate for a $230 billion data center quarter by Q4 of 2030 or $930 billion for the full year. 

Industry analysts have AI accelerators growing at 31.5% CAGR through 2033 with McKinsey putting out a prediction for $7 trillion in AI infrastructure spend through 2030 with $5.2 trillion going toward building data centers for AI workloads. Dr. Lisa Su and Jean Hsu echoed McKinsey’s projections, stating the AI data center market could be worth $1 trillion by 2030, referring to the addressable market of AI accelerators where AMD competes.

mid

Regardless of which way you dice it, industry estimates point toward AI spend exceeding current expectations. For example, Dr. Su originally had predicted a $500 billion market by 2028. Her updated forecast assumes 35% growth over the next three to five years – the same growth rate required for Nvidia to reach the assumptions underpinning my thesis for a $20 trillion market-cap scenario. 

McKinsey’s $5.2 trillion AI infrastructure forecast implies roughly $1.5 trillion in annual AI spending by 2030. Under this framework, our assumptions are slightly on the aggressive side, as they imply Nvidia captures about 60% of total AI capex. Back-of-the-napkin math suggests Nvidia is currently capturing closer to 50% of AI spend, given today’s $405 billion capex run rate and Nvidia’s data center segment set to surpass a $200 billion run rate in this evening’s report.

Bar chart showing Big Tech Capex for AI infrastructure growing from $406 billion in 2025 to over $1.5 trillion by 2030, highlighting massive AI data center market expansion

Pictured above: Big Tech AI Capex expected to surge from $406B in 2025 to over $1.5 trillion by 2030, reflecting the massive growth in the AI data center market.

Offense is the Best Defense: Nvidia’s Rapid Product Road Map

The saying goes “the best offense is the best defense” and Nvidia is fully applying this philosophy by leading with its design prowess to ensure custom silicon cannot replace its lead in AI systems. There will certainly be a market for custom silicon as it excels at application specific workloads, which is attractive to Big Tech companies that can use custom silicon to optimize their recommendation engines, run inference at scale and optimize specific internal models. However, custom silicon cannot compete with GPUs and Nvidia’s CUDA software platform on general workloads, which excels at running every model, every framework and every new architecture.  

The key reason that Nvidia can reach a $20 trillion market cap by 2030 is because the company is moving its GPU generation cadence to a rapid 12-18 month cycle compared to custom silicon, which is typically on a 3-5 year cycle. Even for Nvidia, the goal of releasing a new GPU generation every year was once unthinkable. Yet this offensive measure will be transformative, turning what was once a cyclical revenue profile into a consistent and compounding growth trajectory.  

Diagram of Nvidia’s GTC March 2025 product roadmap illustrating rapid one-year AI factory cadence with Blackwell (2025), Rubin (2026–2027), and Feynman (2028) platforms across Compute, NVLink, Networking, and System components, supporting I/O Fund’s $20 trillion market cap thesis

Source: Nvidia GTC Conference, March 2025  Last March, Nvidia revealed their plans for a 1-year product cadence, a key element to the I/O Fund’s thesis that Nvidia can reach $20 trillion market cap by 2030.

At this point, Nvidia is competing with itself with Blackwell offering 208 billion transistors compared to Hoppers 80 billion transistors. By combining 72 GPUs, the Blackwell systems offer 30X to 40X faster inference and are up to 2.5X faster on training. The memory capacity has increased to 192GB of HBM3e for Blackwell and 288GB for Blackwell Ultra. Energy efficiency is also improved by 25X. The 30X improvement in running AI reasoning models is primarily from leveraging FP4 format and fifth-generation NVLink at rack scale level. Blackwell arrived in H1 of 2025 and Blackwell Ultra is shipping now in H2 2025. 

Vera Rubin increases the number of GPUs to 144, up from 72 GPUs, for 3.3X higher performance. Vera Rubin doubles the FP4 performance from 20 petaflops to 50 petaflops. The new architecture will offer HBM4 memory and sixth-generation NVLink. Rubin Ultra takes rack-scale to a new level with 576 GPUs compared to Rubin’s 144, with more details to be released in the coming months. Vera Rubin is expected to arrive in H2 2026 with Rubin Ultra in H2 2027. 

From there, Feynman is expected to bring to market Gigawatt AI factories, which would be up about 8X from today’s peak cluster size of 150 MW (the largest cluster right now is Colossus at 150MW with plans to expand to 300MW soon). Feynman is expected to arrive in 2028. 

5X Hopper: Jensen Huang Reveals $500 Billion Blackwell and Rubin Revenue Visibility

Nvidia laid out an eye-opening stat at the company’s GTC October conference, with CEO Jensen Huang revealing the company has visibility into an astonishing $500 billion in cumulative Blackwell and Rubin revenue through the end of 2026. This is ~5X the lifetime revenue of its Hopper GPUs from 2023 through 2025 which stood at $100 billion.  

Huang’s projection calls for 20 million GPU shipments, with 30% of that, or 6 million, having already been shipped; however, considering both generations have two GPUs per chip, in reality, this corresponds to 10 million chip shipments with 3 million already shipped. Huang’s forecast also excludes China but is expected to include attached networking equipment such as Nvidia’s InfiniBand and NVLink. 

Reading between the lines on Huang’s comments suggests strong upside to Nvidia’s data center revenue through 2026. Over the prior three quarters heading into fiscal Q3’s report, Blackwell revenue has totaled approximately $63 billion. Including Networking over that time frame, total revenue would rise to $78 billion, still a fraction of the total overall opportunity management is projecting. Thus, if we assume that Blackwell and Rubin ramp over the next five quarters, fiscal 2027 data center revenue could be nearly $320 billion, versus estimates for around $270 billion. 

This forecast is supported by the accelerated progression in GPU cluster sizes, scaling quickly from 10K clusters just two years ago to hundreds of thousands over the next few years. The first 10K Hopper GPU clusters came online in 2023 and 2024, before scaling 10X to 100K clusters by year-end 2024. Blackwell is picking up where Hopper left off, with clusters expanding from 100K to the hundreds of thousands through 2026 and 2027, such as for Microsoft’s new Fairwater data centers and xAI’s Colossus 2. This scale out of 8-10X growth to reach 1 million GPU clusters over the next few years underpins millions of GPU shipments over the coming quarters. 

Consensus Estimates Still Below Nvidia's $500B Target for FY26/27

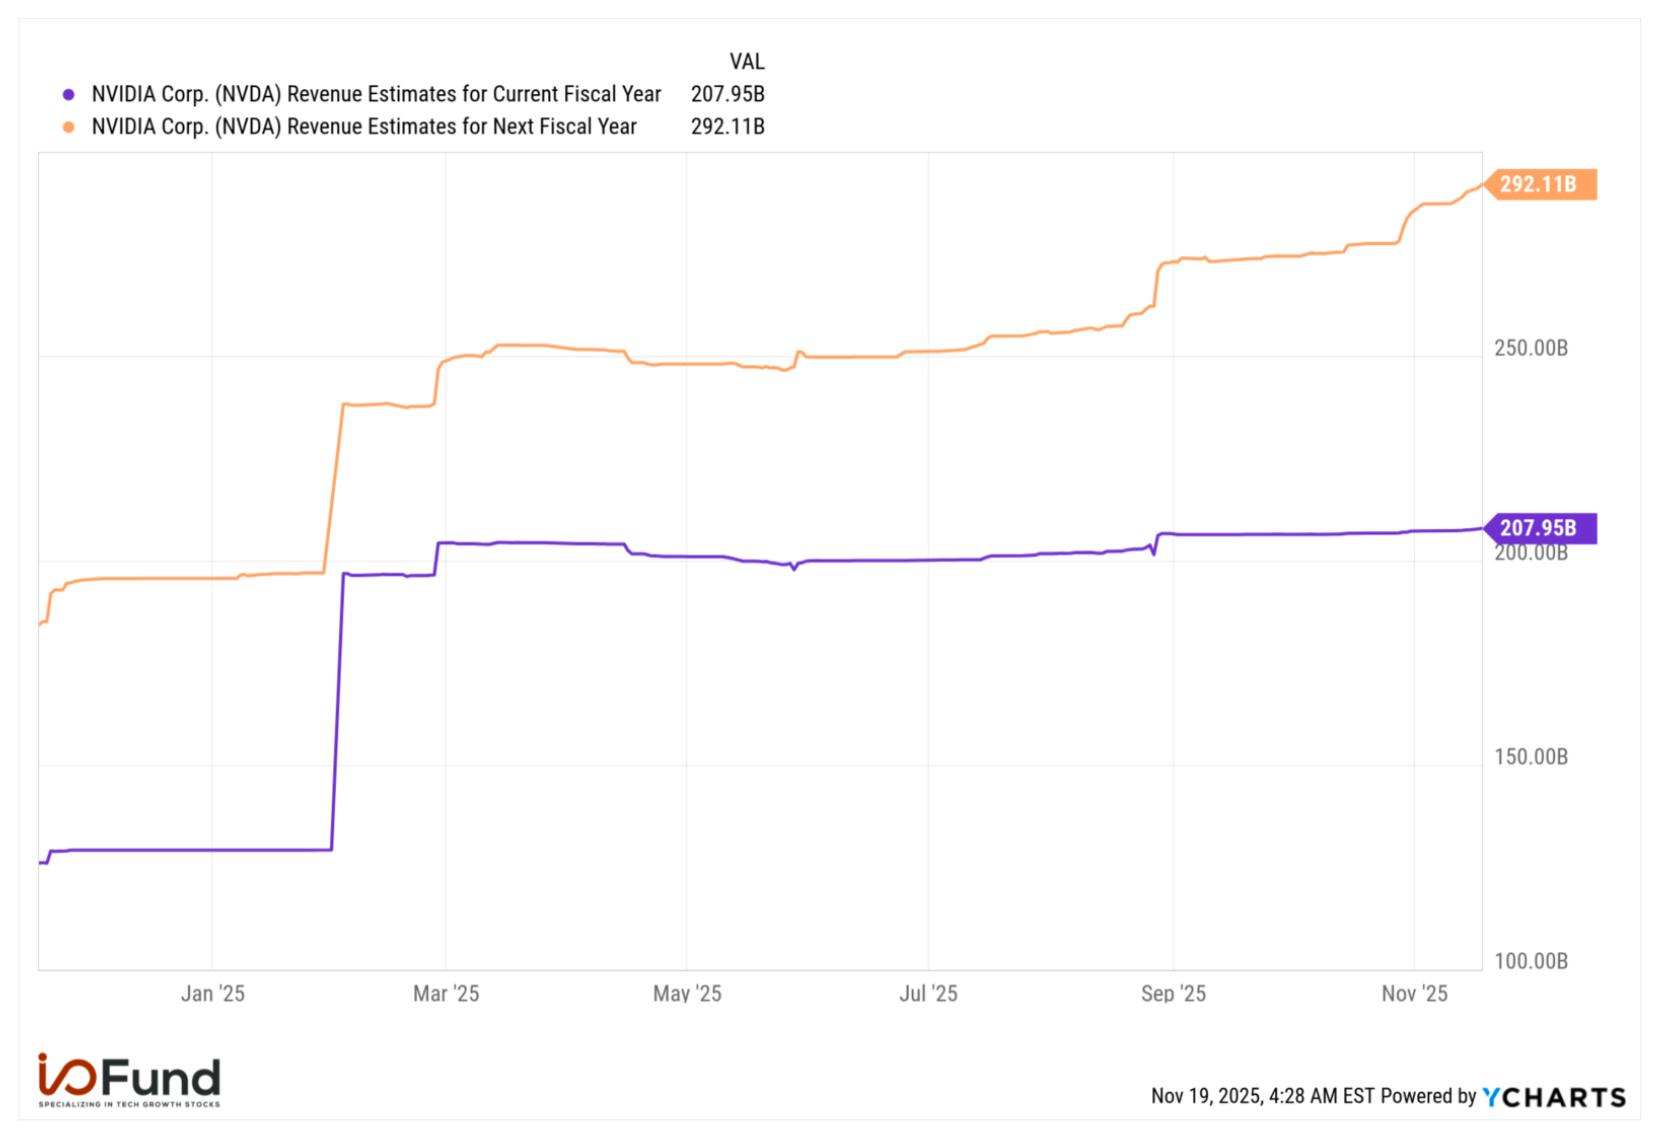
Even with the commentary for half a trillion in revenue potential for Blackwell and Rubin GPUs, consensus estimates for fiscal 2026 and 2027 still remain below $500 billion combined. This also comes despite numerous analysts pointing out that Street estimates are too low and citing substantial upside potential for data center revenue. 

Source: YCharts

Current consensus estimates point to $207.6 billion in revenue in fiscal 2026, before rising to $290.5 billion in fiscal 2027, with next year seeing only a $13 billion (5%) upward revision following the $500 billion forecast. It’s important to note that some of fiscal 2026’s revenue came from the Hopper generation, which contributed ~30% of Compute revenue in fiscal Q1, or more than $10 billion.  

However, analysts from Cantor, UBS, Melius and others believe estimates are too low moving through calendar 2026. New Street says the $500 billion forecast “implies a nearly doubling of Nvidia's data center revenue in 2026,” while Wolfe Research estimated that data center revenue "could be $60 billion over prior calendar 2026 estimates.”  

This suggests that the Street remains cautious about this order visibility materializing in full, as current consensus estimates would project data center revenue of ~$445 billion assuming ~90% share of total revenue. 

AI Buildout Accelerates: Big Tech Capex Headed for $405 Billion

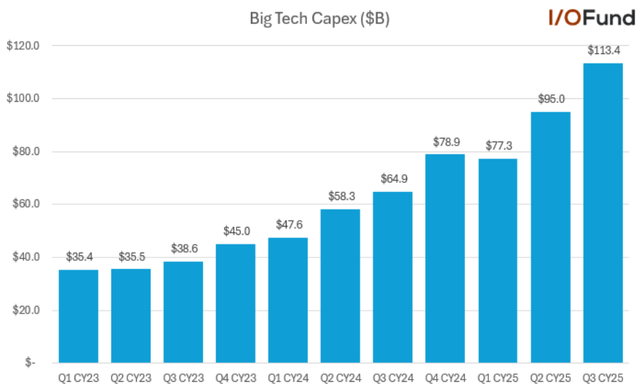
Big Tech Capex grew by 75% YoY and 19% sequentially to $113.4 billion in Q3. In fact, capital spending for the AI buildout has risen 44.6% from our initial estimates. A substantial jump considering the scale already measured in hundreds of billions. This time last year, the expectations were $280 billion in Big Tech capex.  

Morgan Stanley later forecast $300 billion in Big Tech capex for 2025. Capex estimates stood at $365 billion heading into Q3, and now we believe 2025 capex is on track to surpass $405 billion, representing YoY growth of 62%. This spells good things for the I/O Fund’s projected 36% CAGR for Nvidia’s data center to materialize. 

Overall, analysts have clearly underestimated the growth in capex and future AI opportunities. This is also evident when AMD’s CEO Lisa Su recently increased the company’s AI total addressable market to $1 trillion in 2030, up from the previous forecast of $500 billion by 2028.  

In terms of what the opportunity looks like moving forward, McKinsey is predicting 3.5X growth in gigawatts for AI data centers between 2025-2030. The costs associated with AI data centers range from $3 trillion to $8 trillion, or about $5.5 trillion at the midpoint. This correlates to about 3X growth if we assume the current run rate to 2030 is $1.8 trillion at the current capex of $405 billion. 

UBS recently upgraded the AI capex estimates from the previous $375 billion to $423 billion for 2025. For the next year, they have increased the estimates from $500 billion to $571 billion, a solid 14% increase. By the year 2030, UBS expects overall spending to hit $1.3 trillion, implying a 25% compound annual growth rate (CAGR) over the next five years – or about 11 points lower than our estimate for 36% CAGR – although I still have five years to go for analysts to raise their estimates, which judging by what we’ve seen in capex estimates, could very well be doable. 

Another point as to why AI spending estimates may be too low is they are still modest to global GDP. According to IMF estimates, the $1.3 trillion capex estimate would only account for 1% of GDP, whereas some of the previous investment booms like railroads, computers, telco, etc. – ranged from 1.5% to 4.5% of global GDP. 

Nvidia’s Deals with OpenAI and Microsoft Fuel Insatiable GPU Demand

If a $20 trillion market cap sounds outlandish, consider the deals worth hundreds of billions that are pouring in. Not only does Nvidia have the $500 billion Stargate project underway for OpenAI, but the ChatGPT parent also committed to an additional $250 billion of compute from Azure as part of its for-profit restructure.  

Additionally, Nvidia signed a partnership with OpenAI, which will see it deploy up to 10GW of Nvidia GPUs in data centers. Under the deal, Nvidia is investing up to $100 billion in OpenAI progressively as each GW is deployed. The first GW of GPUs under Nvidia and OpenAI’s agreement will be deployed in the second half of 2026 on Nvidia’s upcoming Vera Rubin platform. While there was no set timeline for the remaining nine GWs of chips, CEO Jensen Huang told CNBC that the entire deployment would represent around four to five million GPUs.  

In terms of the total opportunity for Nvidia, Bank of America estimates this partnership could generate $300 billion to $500 billion in revenue overtime at full deployment. This aligns with expectations from other analysts that Rubin and Rubin Ultra will cost $30 to $35 billion per GW, with 10-15% increases per GW per each generation. 

Microsoft also contracted approximately 200,000 GB300s from British startup Nscale in a deal said to be worth $14 billion, with the first smaller-scale deployment starting in Q1 followed by a 104,000 cluster in Q3 2026. This builds on Microsoft CEO Satya Nadella hinting last weekend that Microsoft is bringing online more than 100,000 GB300s this quarter, or approximately 1,389 NVL72 racks worth ~$4.17 billion at a $3 million estimated ASP.  

Deals like these that continue to pop up across the industry hint that demand for GPUs remains insatiable to meet high demand. It also suggests current capex estimates may be too low as hyperscalers continue to pour tens of billions each quarter to data center infrastructure via whatever avenue possible. 

Conclusion: 

When you step back from the noise and look at the data, the path to $20 trillion is built on compounding fundamentals that are already surpassing the most aggressive forecasts from a year ago. Analysts continue to revise capex expectations higher, AI infrastructure projections have doubled, and Big Tech is racing to deploy unprecedented levels of compute. 

The data center segment growing 36% CAGR is a tad ambitious, yet it does not factor in markets such as robotics, agentic systems and simulation. Also consider we are seeing 5X growth from the Hopper cycle to the Blackwell-Rubin cycle in the data center segment. At the end of 2026, we will need only 3X growth to deliver on my prediction of a $930 billion data center segment. 

Today, my updated thesis is clear: Nvidia has a credible path to reach a $20 trillion market cap by 2030 with an aggressive product road map for Blackwell, Rubin, Rubin Ultra and eventually Feynman’s gigawatt-scale AI factories. Just as with my earlier calls on Nvidia’s stock, the data increasingly supports an outcome that was once considered impossible.

As AI accelerates into the largest technology buildout of our lifetime, we believe Nvidia remains one of the strongest beneficiaries. Our portfolio is also positioned with many of Nvidia’s lesser-known AI networking suppliers and AI energy stocks. To view the I/O Fund portfolio plus my 43-page Top 15 AI Stocks list, sign up below.  

For Black Friday, we’re offering one of our biggest sales of the year — $250 off our Advanced Market Signals flagship tier. Sign up here.

Our cumulative return of 210% would place us as #2 if we were a hedge fund and #5 if we were an ETF. Our entries and exit are sent in real-time including one entry as low as $3.15 on Nvidia in 2018 and 9 alerts sent under $20 in 2021 – 2022. This year, we have an AI energy position up over 500% and others up over 100% in AI energy and AI networking. Learn more here.210% would place us as #2 if we were a hedge fund and #5 if we were an ETF. Our entries and exit are sent in real-time including one entry as low as $3.15 on Nvidia in 2018 and 9 alerts sent under $20 in 2021 – 2022. This year, we have an AI energy position up over 500% and others up over 100% in AI energy and AI networking. Learn more here.

Please note: The I/O Fund conducts research and draws conclusions for the company’s portfolio. We then share that information with our readers and offer real-time trade notifications. This is not a guarantee of a stock’s performance and it is not financial advice. Please consult your personal financial advisor before buying any stock in the companies mentioned in this analysis. Beth Kindig and the I/O Fund own shares in NVDA at the time of writing and may own stocks pictured in the charts.

Recommended Reading:
Big Tech’s $405B Bet: Why AI Stocks Are Set Up for a Strong 2026 

AI accelerators such as GPUs and custom silicon need no introduction. Compute has led the AI boom; a trend so powerful, it is displacing the FAANGs of the last decade with Nvidia firmly the world’s most valuable company and infrastructure suppliers like Broadcom has pushed past legacy peers such as Meta in market cap.  

As the market weighs the so-called AI bubble, there are many disparate facts thrown at investors: dot-com analogies, tariff headlines, short-term stock pullbacks, and circular investments from companies such as OpenAI. What matters far more for the AI trade than all of these combined is Big Tech capital expenditures.  

The cumulative amount that Big Tech is spending far outweighs the importance of earnings reports, fiscal year guidance, Nvidia’s networking growth or their product roadmap, if AMD has a new deal from OpenAI, Oracle’s insane RPO, Broadcom’s networking chips and custom silicon announcements – all of the above is being single-handedly driven by Big Tech’s large capital expenditure (capex) budgets.   

The latest quarter showed a 19% QoQ increase in Big Tech spending, confirming continued conviction in the build-out of AI infrastructure. Each tech giant is dedicating tens of billions toward AI systems, confident in the growth and customer value these services generate. As we look toward 2026, the direction of AI stocks will continue to follow the trajectory of Big Tech CapEx — and right now, that trajectory is pointed higher. 

AI Capex Forecasts Keep Accelerating: The $405 Billion Reality 

One of the most persistent patterns since the AI boom began is that analysts have been behind the curve on capital-spending forecasts. As you’ll see below, expectations have risen quarter after quarter as Big Tech’s actual investments repeatedly outstrip projections. What started as a $250 billion estimate for AI-related CapEx in 2025 now sits above $405 billion. The scale and urgency of hyperscaler build-outs suggest that even today’s elevated numbers could again be revised higher in 2026. 

In fact, capital spending for the AI buildout has risen 44.6% from initial estimates, a substantial jump considering the scale already measured in hundreds of billions. This time last year, the expectations were for $280 billion in Big Tech capex

Morgan Stanley later forecast $300 billion in Big Tech capex for 2025. Capex estimates stood at $365 billion heading into Q3, and now we believe 2025 capex is on track to surpass $405 billion, representing YoY growth of 62%.  

It’s easy to tune out the words “big tech capex” at this point but zoom out for a minute and consider that Big Tech’s TTM capex was $24B at the start of 2015, or up 15X over ten years.  Where we end up by the end of the decade on capex spending will likely represent the biggest “boom” in history. 

In terms of what the opportunity looks like moving forward, McKinsey is predicting 3.5X growth in gigawatts for AI data centers between 2025-2030. The costs associated with AI data centers range from $3 trillion to $8 trillion, or about $5.5 trillion at the midpoint. This correlates to about 3X growth if we assume the current run rate to 2030 is $1.8 trillion at the current capex of $405 billion. 

On a more near-term basis, Goldman Sachs sees hyperscaler capex increasing sharply through 2027 – capex is projected to be $1.15 trillion from 2025 through 2027, more than double the $477 billion spent from 2022 through 2024.  

Going back to the first point, analysts thus far have missed the mark in their estimates. Every quarter, sell side analysts rush to update their models. Therefore, the I/O Fund is penciling in that 3x is a baseline to work with over a 5-year time frame. 

Big Tech AI Capex Jumps 75% YoY in Q3 to a Record $113.4 Billion 

Big Tech Capex grew by 75% YoY and 19% sequentially to $113.4 billion in Q3. Most importantly, Q3’s 75% growth rate was the strongest growth so far this year, accelerating 12 points from 63% growth in Q2. This spells good things for key suppliers in the coming quarter.  

Big Tech Capex increased by 75% YoY to $113.4 billion in Q3 2025. 

Amazon’s Raises Annual Capex Guidance to $125 Billion 

When listening to commentary on earnings calls, in sharp contrast to concerns over an AI bubble, what we hear from Big Tech management teams is a sense of urgency. From Amazon’s Andy Jassy last quarter: “The faster we grow, the more CapEx we end up spending because we have to procure data center and hardware and chips and networking gear ahead of when we're able to monetize it. We don't procure it unless we see significant signals of demand.”    

This sense of urgency was echoed again in Q3: “You're going to see us continue to be very aggressive investing in capacity because we see the demand. As fast as we're adding capacity right now, we're monetizing it.”

mid

This boots-on-the-ground commentary implies that Amazon has direct visibility into how quickly capacity is selling out and the level of demand that can be met with accelerated capex investments. This is further supported by monetization trends in Amazon’s custom silicon business, Trainium, which reached a multi-billion dollar run rate, up 150% QoQ this quarter. 

Amazon’s capex in Q3 rose 55% YoY to $35.1 billion, with the company raising the 2025 capex guidance to $125 billion, up 51% YoY. This represents more than 88% of projected operating cash flow for the company and more than 17% of revenue.  

By spending more than its hyperscaler peers, Amazon was able to add 3.8 GW of capacity over the past 12 months, the most out of the group.  

Microsoft’s Q3 Capex Sees 75% Increase YoY 

Microsoft’s capex in Q3 was $34.9 billion, an increase of 75% YoY from $20 billion in the year-ago quarter. Sequentially, it grew by 44% YoY from $24.2 billion in the previous quarter.  The company’s strong capex growth was primarily driven by increasing demand for its Cloud and AI offerings. This quarter, approximately half of the capex spend was on short-lived assets, primarily GPUs and CPUs, to support the Azure platform, first-party apps at AI solutions, and accelerating R&D activities. The remaining spending was for long-lived assets that will support monetization in the long term.

With strong accelerating demand, Microsoft is increasing its spending on GPUs and CPUs. Therefore, total spending is expected to increase sequentially in the next quarter and now expects the FY 2026 growth rate to be higher than FY 2025.  To provide context, FY2025 ending June capex grew by 58% YoY to $88.2 billion.  

Big Tech is set to spend $405 billion building the AI infrastructure of the future — and we invest in the companies set to benefit most. Discover how the I/O Fund tracks, analyzes, and identifies beneficiaries of this unprecedented CapEx cycle. Learn more here.Learn more here. 

Alphabet Guides 2025 Capex Growth of 75% 

The company’s capex grew by 83% YoY to $23.95 billion. Sequentially, it grew by 7% from $22.4 billion in the previous quarter. Most of the capex was spent on technical infrastructure with approximately 60% of that investment in servers and 40% in data centers and networking equipment. Management stated in the recent earnings call that they are witnessing positive returns on AI investments. “I would say it's not just early signs because we're seeing returns, obviously, in the Cloud business. You've heard us talk about the fact that we already are generating billions of dollars from AI in the quarter.” 

Looking forward, the company expects to invest aggressively due to the strong demand from cloud customers as well as the growth opportunities across the company. Management now expects the 2025 capex to be in the range of $91 billion to $93 billion in 2025, up from the previous estimate of $85 billion. It represents a YoY growth of 75% at midpoint. The capex is further expected to increase in 2026, which further supports our view that AI stocks will benefit in 2026. 

Meta Increases Capex Guide to 81% Growth 

Meta’s Q3 capex was $19.4 billion, up 111% YoY from $9.2 billion in the same period last year. Sequentially, it grew by 14% from $17 billion in the previous quarter. The strong growth was primarily driven by investments in servers, data centers, and network infrastructure. 

Management also increased the 2025 capex to a range of $70 billion to $72 billion, up from the prior outlook of $66 billion to $72 billion. It represents a YoY growth of 81% from the prior year. Due to the continued investments in AI infrastructure, Meta expects next year’s capex to be significantly higher than in 2025, particularly as their compute needs are higher than their expectations. Management stated in the earnings call, “As we have begun to plan for next year, it's become clear that our compute needs have continued to expand meaningfully, including versus our own expectations last quarter. We are still working through our capacity plans for next year, but we expect to invest aggressively to meet these needs, both by building our own infrastructure and contracting with third-party cloud providers.” 

Big Tech Capex Increase Provides a Boost to AI Stocks in 2025 

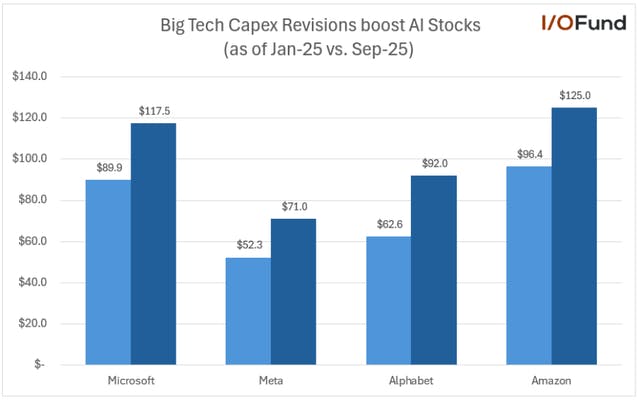
Since the beginning of the year, Big Tech Capex estimates have increased from $280 billion to $405 billion, an impressive 31% positive revision. Alphabet witnessed the highest positive revision of 47%. 

Big Tech Capex revisions boost AI stocks 

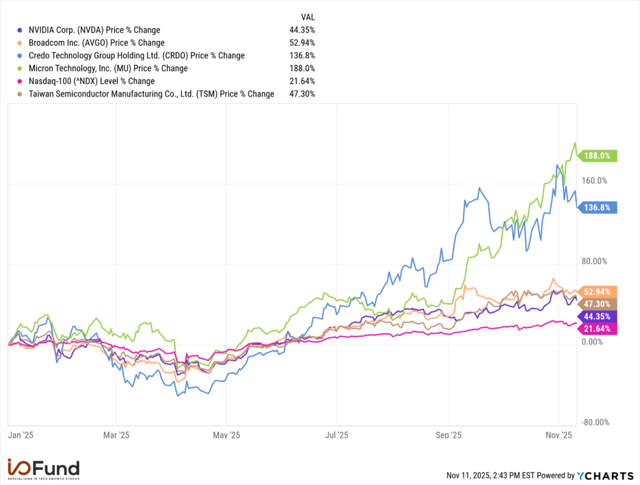
As seen in the chart below, AI stocks have outperformed the broader Nasdaq-100 index by a wide margin. We believe that this trend will continue in 2026 as Big Tech Capex continues to expand and the numerous earnings calls from companies indicate that demand far outweighs supply. 

AI Stock Micron returned 188% YTD in 2025. 

Source: YCharts 

Key Reasons Why Capex Spending Won’t Slow Down Anytime Soon 

To be objective, there are analysts calling for a stock market crash based on the risks around the consumer and a GDP that is propped up by capex spending.  

Stifel stated in August: “While the capex boom around AI temporarily supports GDP and asset prices, Stifel forecasts this bump will fade as corporate tech spending plateaus. Such a build-out, after all, occurs only once, while consumer spending power is entering a lull that could expose markets to abrupt correction.” 

There is weight to what Stifel is describing, which is why tariffs remained a risk on our last Top 15 AI stocks report and remain a risk for our latest report, as well. You can read more here about how the consumer is fairly weak under the hood, and how capex spending is creating a false impression that GDP is stronger than it is. 

Where I disagree with Stifel is the idea that “such a build-out, after all, occurs only once” AI infrastructure is not a fixed achievement — rather it is an evolving architecture with ambitions that expand each year. Each leap in model complexity and compute performance forces hyperscalers to re-architect their data centers roughly every one to two years. Power, cooling, memory bandwidth, and networking standards must all scale in tandem with new architectures such as Nvidia’s Blackwell and AMD’s upcoming MI400s. This constant cycle of upgrade and expansion makes AI CapEx structurally recurring, rather than a one-time boom, and illustrates why I view hyperscaler spending as a durable driver of AI semiconductor and infrastructure stocks. 

Although cloud was also architecture-driven, it reached its end goal rather quickly in terms of driving down costs and improving productivity, allowing companies to quickly scale while providing pay-as-you-go compute and services to disrupt the significant up-front costs from on-premise servers. The end goal for AI is far more ambitious, as it could take a decade or more before Big Tech accomplishes commercially viable AGI (general artificial intelligence). 

Early Signs of Heavy Debt Load from AI Buildout 

Over the last few years, capex was funded by cash flows and cash on the balance sheet of companies. However, this is now changing. There is a growing concern that the robust AI demand is fueled by significant levels of debt. 

Bank of America data shows that companies borrowed $75 billion in the last couple of months for spending on AI data centers. This is more than double the annual average issuance over the past decade. One of the reasons companies issue debt is that their capex exceeds their operating cash flows. The capex, excluding dividends and share repurchases, is reaching extreme levels of 94% of operating cash flows in 2025, up 18 percentage points from the 2024 levels. 

According to J.P. Morgan estimates, the build-out of data centers will require a staggering $1.5 trillion in investment-grade bonds over the next five years. They believe that every market, including both government and private credit markets, needs to be tapped to close the funding gap. What will happen if this original estimate is too low, as well? 

Analysts already project that $300 billion of high-grade bonds will be issued to fund AI data centers next year. Additionally, Barclays believes that AI-related tech debt issuance is a key determinant of potential credit market supply in 2026. Meanwhile, the Street is already concerned there is not enough revenue or profits to show for the capital already allocated, let alone the increase in capital we will see beyond 2026 plus the increasing costs of debt. 

Cash Leaders and Laggards 

Subscribe for Free Below  to find out:   

  • Which Big Tech stocks have stronger cash flows and balance sheets able to support high capex. 
  • Promising AI stocks that are weighed down by negative free cash flows owing to high capex. 
  • One major AI player and large cap stock with a rising debt problem. 

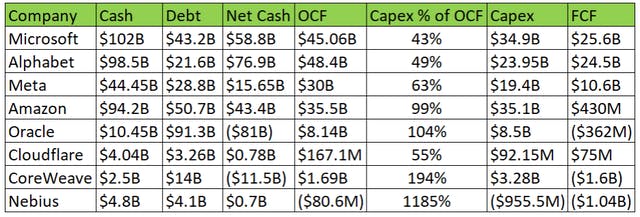
Companies like Microsoft and Alphabet have a broad-based revenue stream, a strong balance sheet, and stable cash flows to support long-term capex growth. Microsoft has cash and short-term investments of $102 billion and debt of $43.2 billion, with a net cash position of $58.8 billion. The company reported strong operating cash flows of $45.1 billion and free cash flows of $25.6 billion in the recent quarter. It has a low capex as a percentage of operating cash flow of 43%, as shown in the chart below.  

Similarly, Alphabet has a stable balance sheet of cash and marketable securities of $98.5 billion and debt of $21.6 billion. The company also reported strong operating cash flows of $48.4 billion and a free cash flow of $24.5 billion in the last quarter. The company also has a low capex as a percentage of operating cash flow of 49%, which suggests that the company can easily support capex with the operating cash flows.  

Meta has a stable cash flow and balance sheet. However, the company is on the threshold as it has a higher capex to operating cash flow percentages compared to Microsoft and Alphabet. It also entered a complex financing structure with Blue Owl Capital that would help to keep debt off its balance sheet but might not eliminate the concern of using debt to fund AI buildout.  

Meta had cash and marketable securities of $44.45 billion compared to debt of $28.8 billion at the end of Q3 2025. The company reported operating cash flow of $30 billion and free cash flow of $10.6 billion after deducting $19.4 billion of capex. Meta recently used hybrid debt by entering a $27 billion joint venture with Blue Owl Capital to fund its development of Hyperion Data Center. The complex financing structure will help the company keep debt off its own balance sheet. 

Note: To ensure an accurate comparison our 43% and 63% calculation for Microsoft and Meta excludes financial leases, which management includes while discussing capex. 

Source: Company IR 

On the other hand, a surge in the credit default swaps (a form of insurance against default for bondholders) of Oracle indicates that investors are worried about its debt levels. Oracle has $10.5 billion in cash and a high debt of $91.3 billion at the end of the August quarter. The company raised an additional $18 billion following its results. The company reported operating cash flows of $8.1 billion in the recent quarter. However, due to the high capex of $8.5 billion, the company reported a negative free cash flow of ($362 million). The company has a high capex to operating cash flow percentage of 104%. 

CoreWeave is a leading AI infrastructure stock. However, high capex is leading to negative free cash flows. The company has cash of $2.5 billion and a high debt of $14 billion at the end of Q3 2025, with a net debt position of $11.5 billion. The debt has increased from $8.7 billion in Q1 to $11.1 billion in Q2 and further increased $3.0 billion in the recent quarter. 

Similarly, Nebius has an extreme high capex to operating cash flow percentage of 1185%. The company reported an operating cash flow of ($80.6 million) and a free cash flow of ($1.04 billion) owing to high capex of ($0.96 billion) primarily driven by purchases of GPUs and GPU-related hardware, and the data center expansion activities.  

Conclusion 

For years, the I/O Fund has been a pioneer in identifying winners by recognizing the positive correlation between AI stocks and the increase in Big Tech Capex. While many are busy debating whether Big Tech’s AI spending will translate to revenue and profits, and more recently concerned about the useful life of servers. Meanwhile, during those years, the I/O Fund has been laser focused on where that AI capital is actually being allocated. Rather than thinking of our approach as the picks and shovels for those chasing a gold rush, we think of it as an “AI stack” strategy—investing in the lesser-known layers and components that are driving forward an ecosystem capable of massive GDP. 

Join us this Thursday for a one-hour webinar, where we’ll outline our buy and sell strategies on under-the-radar AI stocks and discuss how we’re positioning in a market where some valuations look stretched while others still have room to run. Learn more here 

Damien Robbins and Royston Roche, Equity Analysts at I/O Fund contributed to this analysis 

Please note: The I/O Fund conducts research and draws conclusions for the Fund’s positions. We then share that information with our readers. This is not a guarantee of a stock’s performance. Please consult your personal financial advisor before buying any stock in the companies mentioned in this analysis.

Recommended Reading:

TeraWulf Q3: Fluidstack/Google Deal Expands yet Debt Surges and Power Remains an Industry-Wide Bottleneck

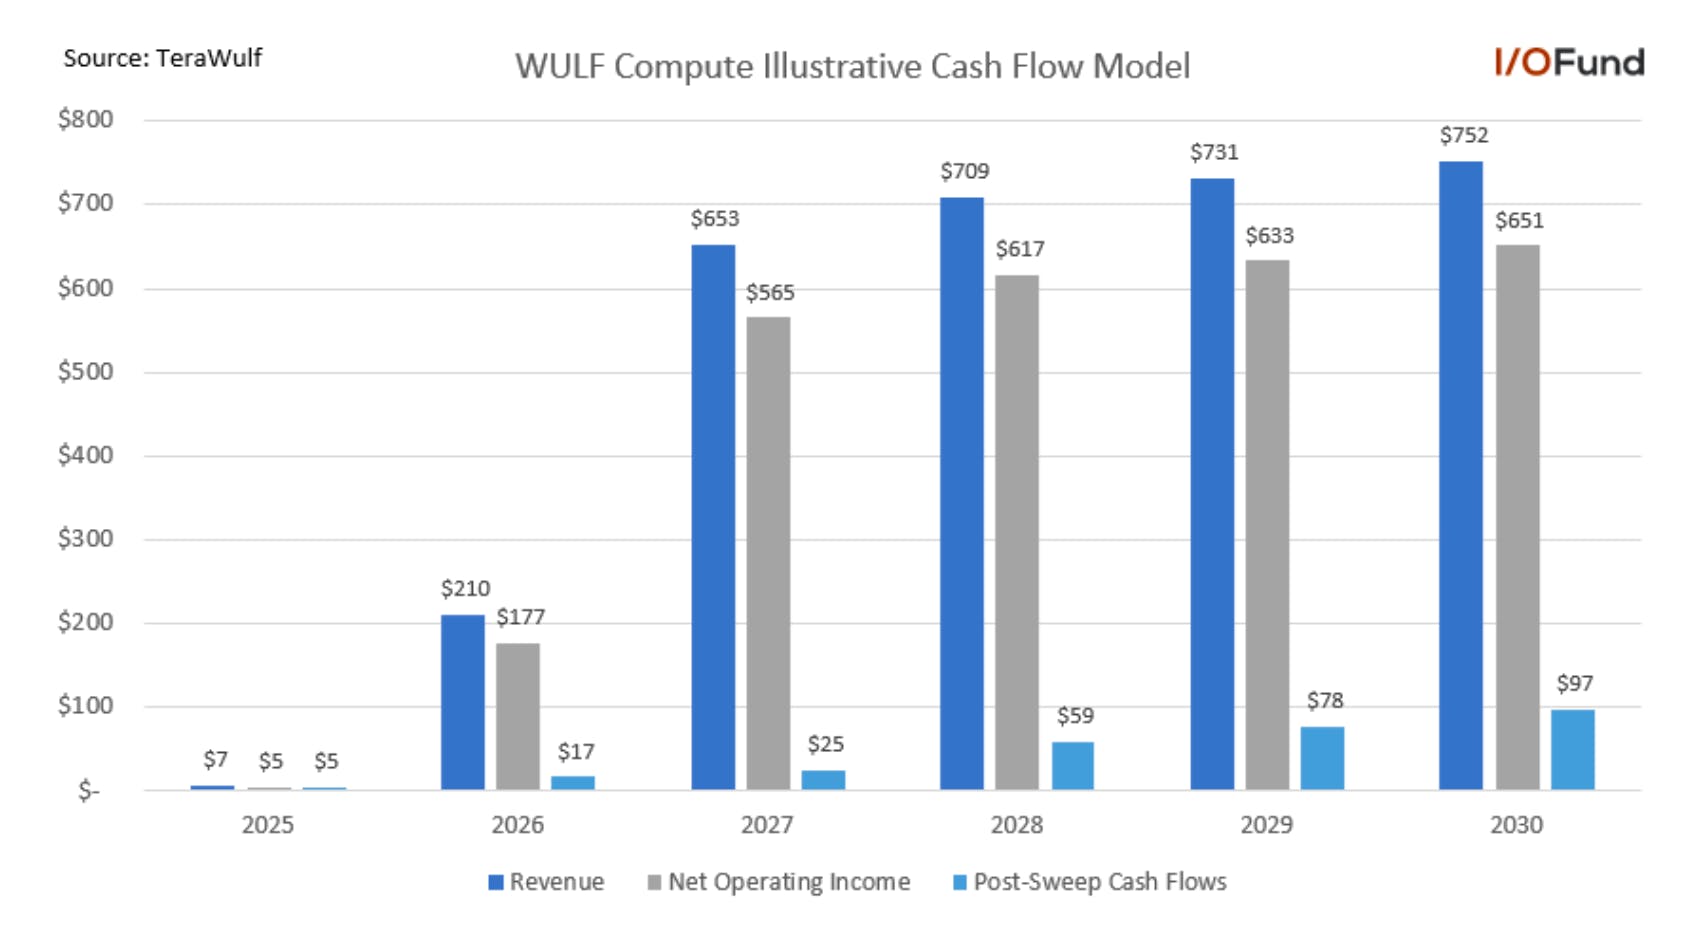
In our previous coverage on TeraWulf, we estimated the value of the Fluidstack deal to be $700 million in annual revenue. Management stated the lease was worth approximately $670 million with net operating income worth $565 million. The inflection point for this stock is fairly evident given the company recognized its first HPC leasing revenue in the third quarter of just $7.2 million, or more than 14% of revenue. This represents HPC capacity of 60MW by year-end that will expand roughly 6X to 366MW by end of 2026. 

In the most recent report, an additional 168+ MW was announced with Google backstopping $1.3 billion in lease obligations in similar fashion to Terawulf’s existing deals. The deal may complicate the income statement as TeraWulf owns 50.1% of the JV, therefore, it’s possible the company recognizes 100% of the revenue yet sees about half of the net operating income. It comes with the added benefit of seeing lower capex costs, which may be the motivating factor behind the deal terms. For investors, if the company does not announce the deals on the attributable basis, then it requires an additional step to recalculate at 50.1%.  

The debt for TeraWulf is rising quickly as the company had $712.8 million in cash and equivalents with debt of $1.5 billion by quarter end. However, debt has increased $4.2 billion in October alone to fund the upcoming data center buildouts. Here was the most recent update: “Turning our attention to the balance sheet. As of September 30, we held $712.8 million in cash and restricted cash with total assets amounting to $2.5 billion and total liabilities of $2.2 billion. In October, we closed over $4.2 billion in capital markets transactions, including $3.2 billion of 7.75% BB-rated senior secured notes due 2030 and $1.025 billion of 0% convertible notes due 2032.” 

TeraWulf Optimistically Outlines 2GW Pipeline by 2028 

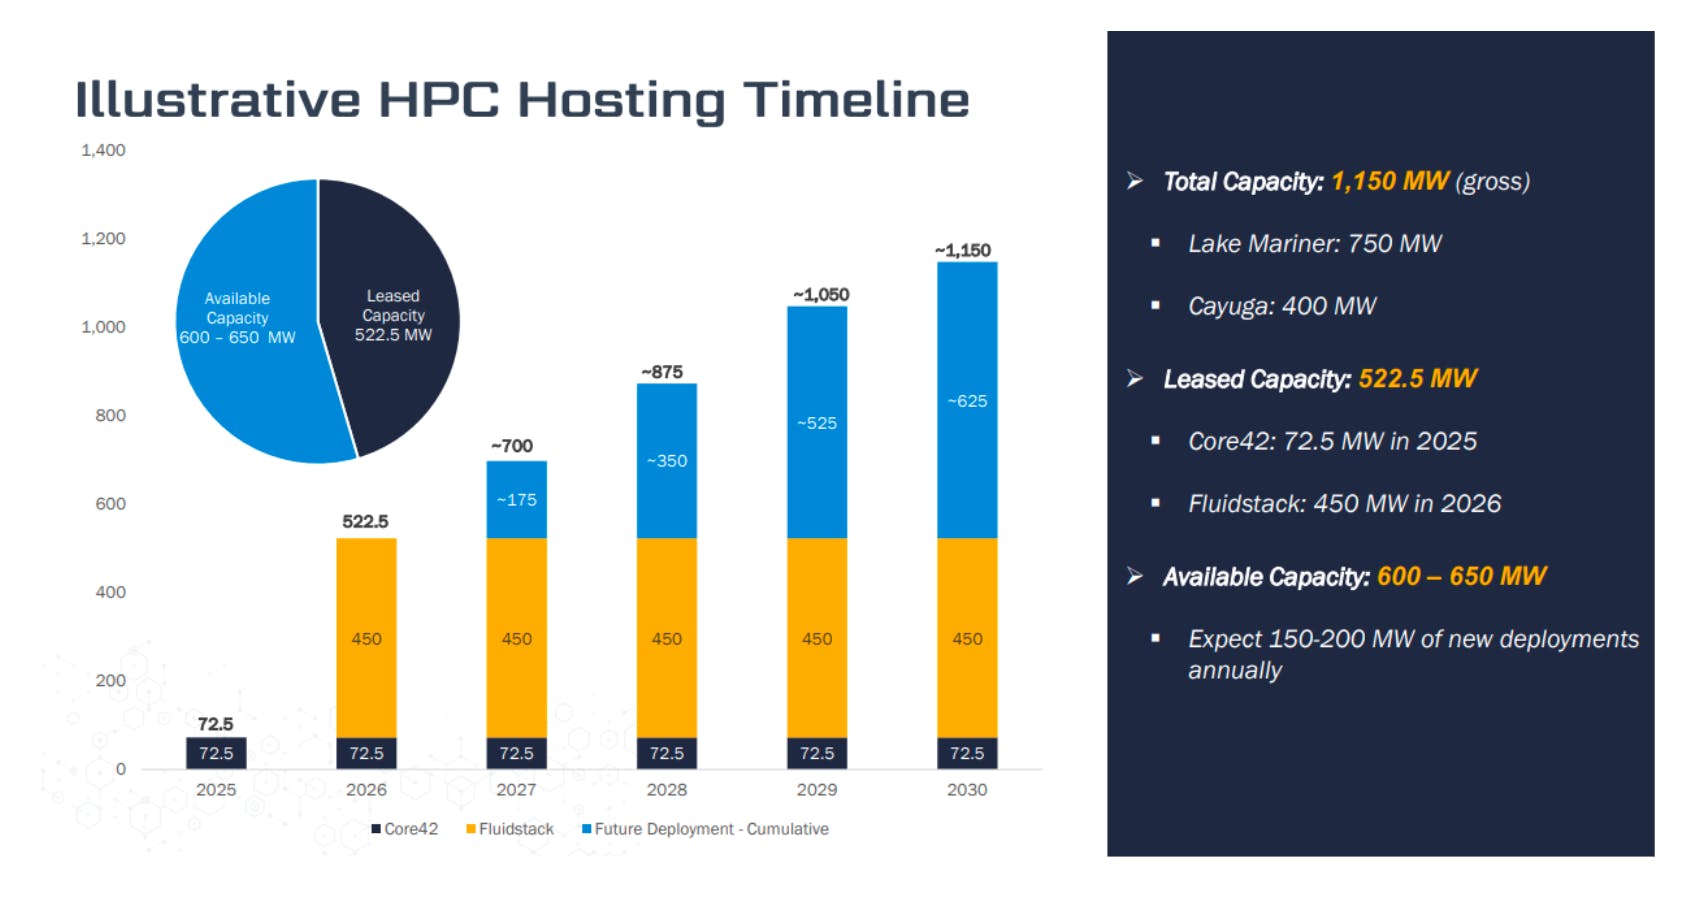
As of August, TeraWulf outlined a pipeline of just 1.15 GW of gross capacity through 2030, with 522.5 MW of that capacity contracted out to Core42 and Fluidstack (excluding the recent JV).  

Source: TeraWulf

This projection resulted in 600-650MW of available capacity through 2030, with TeraWulf laying out a framework to add ~175MW per year starting in 2027 to culminate in the full 600-650MW coming online by 2030, or 48+ months away. For the miner thesis that is built upon speed of power delivery, this projection does not appear as attractive to peers who could potentially deliver gigawatt scale sites over the same period.  

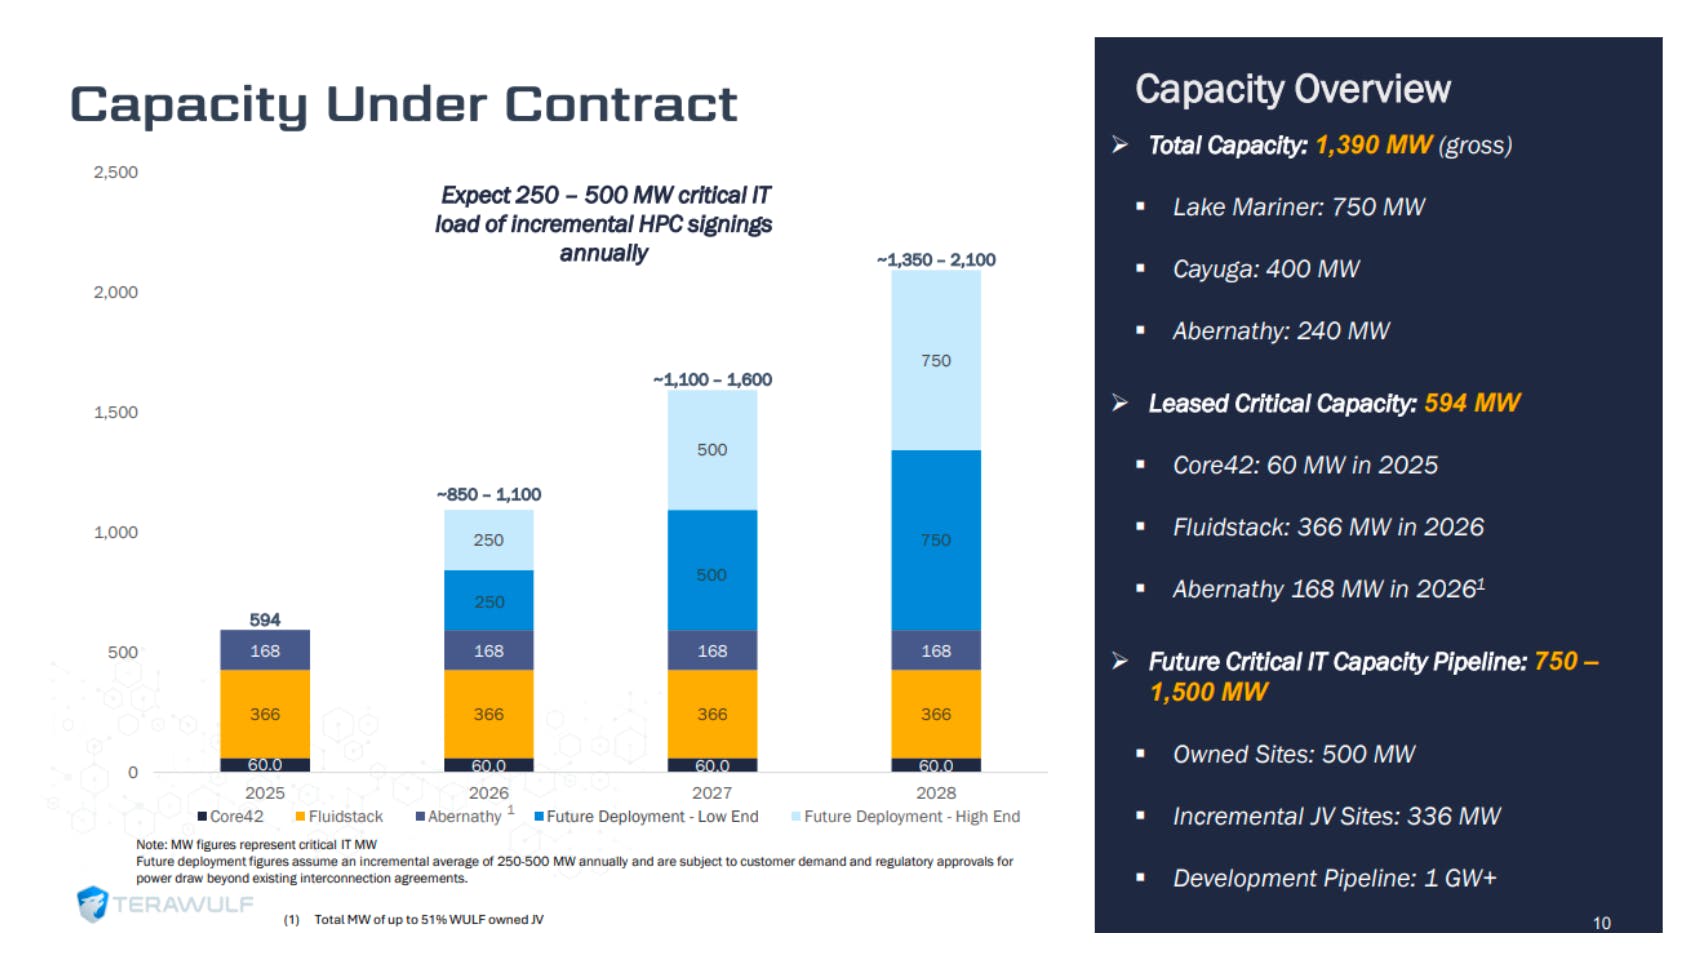
As such, TeraWulf provided an updated, more aggressive and accelerated pipeline projection in Q3’s update, now targeting as much as 2GW of capacity by 2028 in an optimistic scenario. The updated projection below assumes the 1.1GW could come as early as next year, before scaling to 1.1 to 1.6GW by 2027 and potentially as high as 2GW by 2028. TeraWulf added that future capacity includes other potential joint venture sites, another 500MW of owned capacity, and a 1GW+ pipeline. 

Source: TeraWulf

TeraWulf CEO Paul Prager said that he “would not be surprised if by year-end, we announced at least one, possibly two additional sites,” while CFO Patrick Fleury added that there were a handful of sites in consideration that could fulfill that 1GW pipeline.  

Building on this, Prager said that TeraWulf “recently increased our annual target for new HPC signings from 100 to 150 MW per year to 250 to 500 MW per year [which] reflects the tangible progress we've made in advancing our development pipeline and the strength of customer demand.” This suggests that TeraWulf is looking to accelerate the development of this pipeline and quickly add this GW to its portfolio, yet the main question is how the company will be able to do so given its current developments are burning quite a big hole in its pocket. 

Breaking Down TeraWulf’s Capacity and Timeline

In our previous coverage, TeraWulf stated CB-1 would generate revenue by end of October, CB-2 by the end of the December quarter and CB-3, CB-4 and CB-5 are on a tight timeline with the goal of being delivered within a year.  

Here is the update: 

  • As stated in the intro, the first HPC revenue was reported from CB-1 (on time) 
  • CB-2 is on track for near year-end “subject, of course, to tenant fit-out requests, which will complete our delivery of 60 megawatts of critical IT for Core42.” (slight tone change as previously it was by end of December quarter) 
  • Regarding CB-3, CB-4 and CB-5, the update was more vague stating “CB-3 is more than 50% directed and the structure will be fully enclosed before year-end" with “CB-4 and CB-5 are already well underway with underground work beginning next week, field deliveries arriving in early December and building erection expected to begin before Christmas” 

According to the investor’s presentation. CB-2 is expected to be operational and contribute to results in the December quarter for Core42, with Fluidstack’s 450MW at CB-3, CB-4 and CB-5 layering in through 2026. However, as you can see above, the commentary on the earnings call was less concrete. 

The Risk for Bitcoin Miners is Execution – But Especially in Procuring More Power  

The company increased the annual target for new HPC signings “from 100 to 150 megawatts per year to 250 to 500 megawatts per year” – which is stated as “HPC signings” and does not address the timeline around delivery. 

Investors must essentially take the Miners at face value they will deliver with very little prior experience executing (and arguably, the challenges around executing will only get harder given it will be energy related – outside of their control): 

“I'm not terribly worried about the HPC side. I feel pretty good about that and procurement capability and supply lines aren't what they were. I feel very good about that. I think that the key is going to be our ability to meet schedule and price. That's what the Street is looking for. That's what our customer wants. That's what we promised to our shareholders. So I'm very comfortable at 250 to 500. And as we grow, listen, we're building, as Patrick used to say, serial model # 6. As we get down to 10 or 11 and we find more efficacious ways to do this and needer ways to scale, then we could grow from there. But I think 250 to 500 is the right way to think about us for the coming year.” 

An interesting exchange occurred when an analyst asked TeraWulf how they plan to get power for the 250 to 500MW annual delivery schedule. Initially, management sidestepped the question, and when pressed, their answer underscored that energy availability lies largely outside of their control.  

This is a crucial point: even as TeraWulf scales its EPC and site-development capabilities, the real bottleneck remains interconnection and power procurement — both dictated by utilities, grid regulators, and the slow cadence of transmission upgrades. Management’s confidence in build execution (“the EPC side”) contrasts sharply with their limited influence over when and where new megawatts will actually be energized. 

“John Todaro 
Needham & Company, LLC, Research Division 

Great. That's super helpful. And then second question, if we do just take a step back, I guess, how are you guys able to add more of the power pipeline? Like some of the stuff was procured pretty quickly like Abernathy. I would just have to think major hyperscalers, Neo cloud, maybe private equity, everyone is competing now. Just, I guess, give us — frame it up a little bit more for how you guys are able to win that. 

Paul Prager 
Co-Founder, Chairman & CEO 

Yes. I'm not sure I understand the question. I mean — Abernathy didn't — I wouldn't look at that as came on real quickly. I would — again, we've had a long-term relationship now with Google and Fluidstack. And so we are aware of the strategy here, and they decided that bringing us alongside would be additive to the overall effort. But I'm not sure I understand the balance of your question. 

John Todaro 
Needham & Company, LLC, Research Division 

I guess just the main crux of it is if we take a step back and there's such a power constrained environment, one of the biggest questions we get from investors is just how these guys are able to continue to procure capacity like that 250 to 500 megawatts you talked about when we are in still a constrained environment, and there's just likely so many bidders for these assets. 

Paul Prager 
Co-Founder, Chairman & CEO 

Yes. I think the answer is — so some of them are looking at island generation where they bring their own power. Some of them are looking at high electrification sites that had former industrial uses and they're looking at repositioning them into data centers. And some of them are talking to utilities about figuring out if there's a way that they could work out a deal like the NextEra transaction.  

I think they're following multiple strategies to get to the answer of they have long-term demand, and it's near term in terms of its immediate urgency, but they're looking at the 25- and 30-year deals. If you take a look at the Abernathy deal, it's 25 years.  

So I'm — I can't tell you or opine to what the long-term answer is other than United States needs to build more generation. But I think everyone's figured that one out. The question is, are there sites that one can discover in the right regulatory frame set and from an environmental perspective, not too injurious to a customer that could enable a high-quality credit to come along and be a customer. And I think the answer is yes, but you got to know where to look.  

I guess I should emphasize TeraWulf where to look, which is why I think prior to year-end, we'll be bringing on at least one, maybe two other sites.” 

In perhaps the most interesting comment of the earnings call, TeraWulf’s management stated other Miners are providing “fictitious pipelines” – an important warning to investors that talk is cheap compared to what is required to stand up powered shells: “And again, I think unlike some of our peers, we're not telling you a fictitious pipeline of thousands of megawatts all in the same region. We're telling you about stuff when it's literally imminent and ready to go.” 

There was another interesting comment on the call from management stating it could take 3-4 years in some instances to get power to some of the sites being covered as announced deals: “Demand is real, and it's a constant. And I think that — listen, I think there was a site out in Ohio the other day. They got a letter from AEP saying they were in the queue and they were in the queue for '26. And now you should probably not think about that power in '26, but you should think about it for like '29 and '30. And that is a way of saying that you've got to pick your sites really carefully. You have to understand what the grid is capable of. Are you in an area where the whole grid is only X and the demand is 3x that.  

So it goes to the notion that you've got to have a very good handle where you site these things. But that then — when you go back to the customer and you say, hey, how do you want to think about it if you want to be in this region, you're okay moving from '26 to '27. The answer has been yes, universally. The answer from '27 to '28 is yes. I don't think you get the power problem solved by then. You've got hyperscalers now looking at island generation, which means they're going to bring their own power to the table, and that's at least four to five years away.” 

>$5 Billion in Debt, Convertibles Raised Recently 

Since August, TeraWulf has raised $5.2 billion in secured debt and convertible notes, including a major $3.2 billion raise, to help fund its data center expansion. In total, these three raises are equivalent to approximately 91% of TeraWulf’s current $5.7 billion valuation.  

The two convertible note raises in late August and the end of October were both for ~$1 billion, with one a 1% coupon due in 2031 and the other a no-coupon due in 2032, giving TeraWulf time to scale operations and expand its data center business accordingly with minimal interest expenses associated with the funding.  

However, the $3.2 billion in secured debt the company raised in mid-October came at a hefty 7.75% rate, meaning TeraWulf will face nearly $250 million in annual interest payments through 2030.  

Cash flows and debt are rapidly coming into focus for AI data center stocks, as names like Oracle have recently come under pressure for the enormous debt load the company is expected to inherit to fund the its ambitious data center plans. For example, there is rumored to be a $38 billion debt offering as soon as next week, with Morgan Stanley stating the figure could be as high as $55 billion to $75 billion. For TeraWulf, the company is quickly taking on a high debt load to expand its data center business, yet post-sweep cash flows through 2030 are projected to be minimal. 

Illustrative Revenue, Cash Flow Projections 

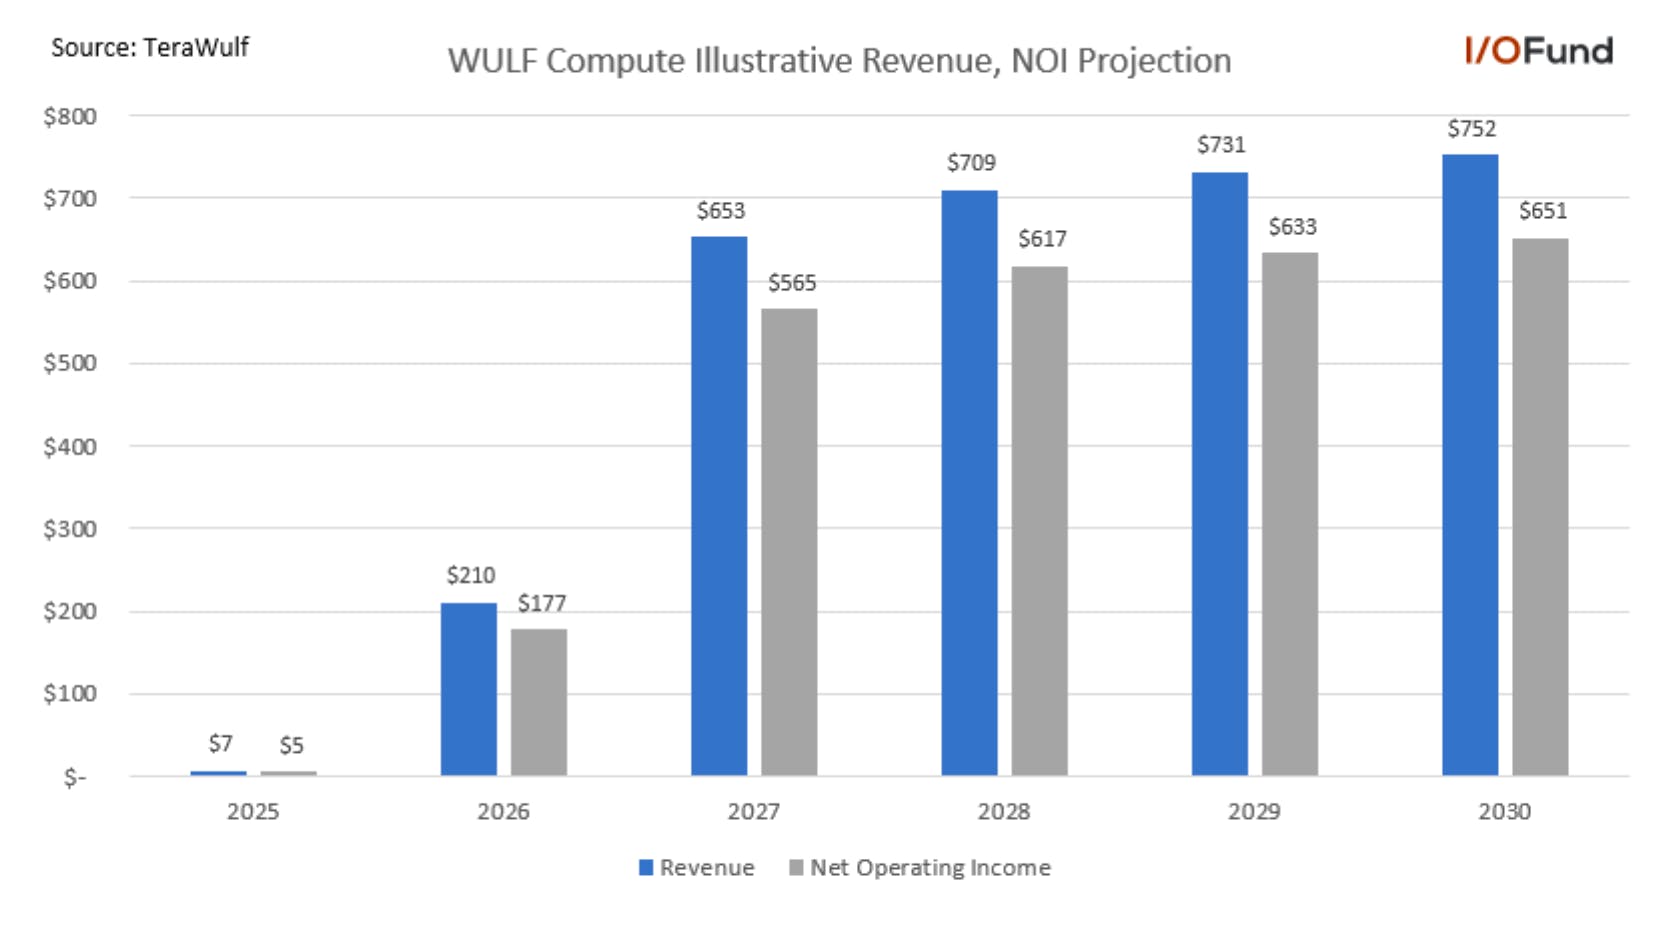
TeraWulf is expecting a rather sharp revenue ramp through 2026 into 2027 as its capacity for Fluidstack comes online, with the company currently projecting CB-3 to be operational in Q1 2026, followed by CB-4 in Q3 and CB-5 in Q4 2026. TeraWulf’s current internal estimates point to 3x growth from $210 million in 2026 to $653 million by 2027.  

Once the three buildings are operational, revenue is expected to flatline and increase per the annual escalators under the deal, with growth of just $23 to $25 million YoY (~3%) from 2028 through 2035. 

Cumulatively, TeraWulf is roughly projecting revenue of ~$3.06 billion from 2025 through 2030 from data center hosting, with net operating income of $2.65 billion, an ~86.5% margin. However, despite the strong NOI generation, cash flows post-sweep (minus mandatory amortization, debt interest expense and a 50% sweep) are minimal. 

TeraWulf is currently estimating cumulative post-sweep cash flows of $281 million through 2030, not even 10% of cumulative revenue. This is because TeraWulf is facing high mandatory amortization, from $281 million to $308 million from 2027 to 2030, and high interest payments on debt. This would leave TeraWulf with limited cash flow to fund additional data center projects or accelerate deployment timelines on its own. 

Financials Overview 

Revenue 

TeraWulf announced preliminary Q3 revenue of $48 million to $52 million, up approximately 84% YoY and coming in shy of the $56.3 million consensus estimate. Actual revenue for the quarter was $50.6 million, up 87% YoY and slightly ahead of the midpoint of the preliminary guide. 

The company’s first HPC data center, CB-1, was operational in August, making Q3 the first quarter blending both BTC mining and HPC revenues, which were just $7.2 million in Q3.  

AI Revenue 

TeraWulf recognized its first HPC lease revenue of $7.2 million in Q3, accounting for 14.2% of revenue. HPC lease revenue has a visible path to increase sequentially in Q4 as the 22.5MW CB-1 lease is now active and has a full quarter of contribution, and the 50MW CB-2 is nearing completion with operations expected before year-end. 

HPC’s adjusted net operating income margin was $5.2 million, or ~72%, which was below the ~85% guided due to partial lease revenue recognized in Q3 and development costs incurred at Cayuga. This is expected to normalize in Q4 to around the 85% level. 

Margins and EPS 

Margins show little improvement down the line from last year, though this is to be expected considering TeraWulf is still ramping capacity through 2026.  

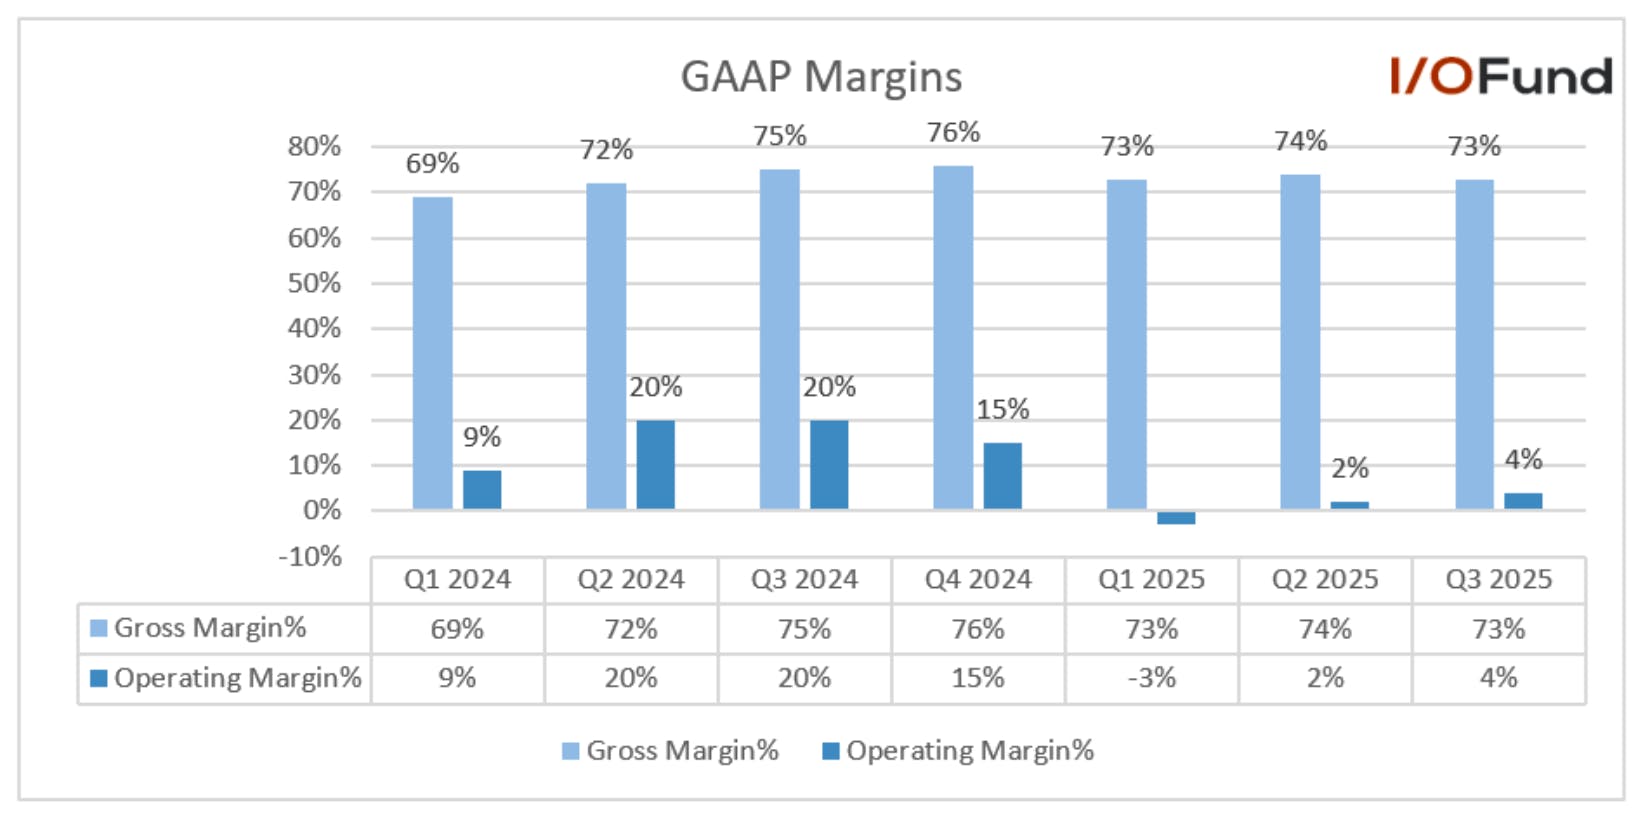
GAAP gross margin (excl depreciation) was 66.1%, up from 53.6% last quarter and 45.8% in the year ago quarter. Adjusted gross margin (incl depreciation) was 13.7%, down from 14.2% last quarter but up from (12%) in the year ago quarter. 

GAAP operating margin was (48.8%) in Q3, widening from (32.7%) last quarter but improving from (58.1%) in the year ago quarter. 

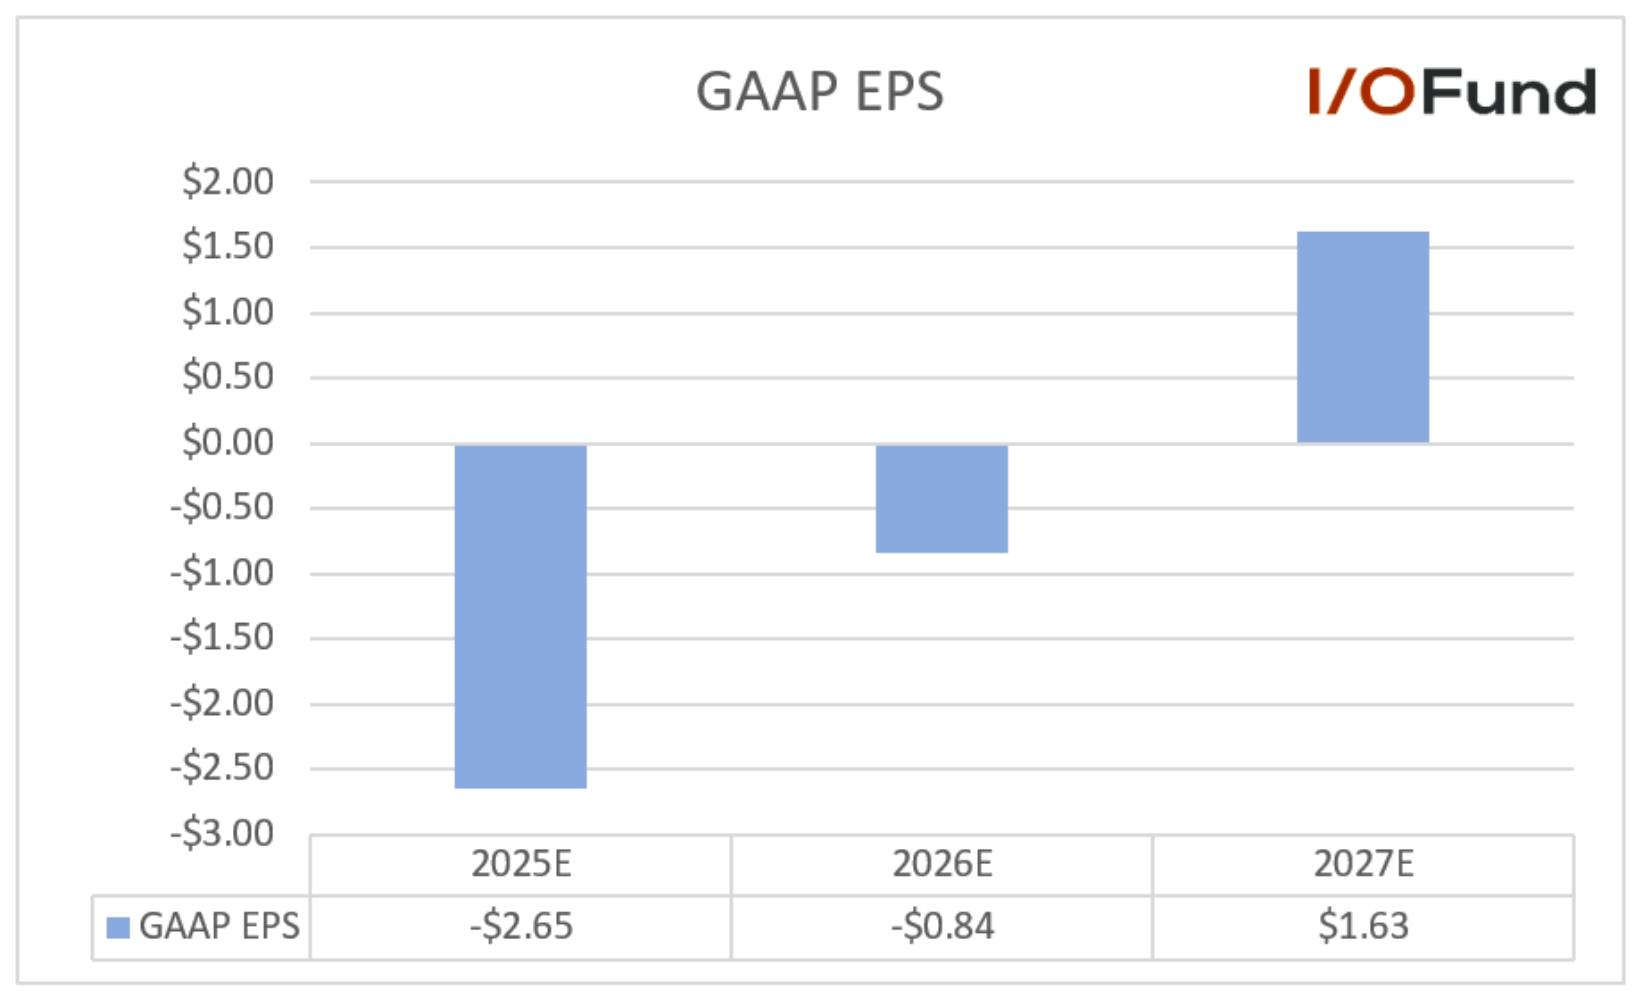
GAAP net margin was (899.7%) in Q3, impacted adversely by a ($424.6 million) change in warrant and derivative liabilities. Thus, GAAP net loss was ($1.13), not comparable to the ($0.05) estimate.  

Preliminary adjusted EBTIDA for Q3 was forecast at $15 to $19 million, or a 34% margin at midpoint. Actual adjusted EBITDA was $18.1 million for a 35.8% margin, at the higher end of the preliminary range. 

Cash Flows and Balance Sheet 

TeraWulf reported $713 million in cash and equivalents, with current convertibles outstanding of $1.06 billion, though this does not include the recent ~$4.2 billion raised in October. However, TeraWulf expects to use all of the recent funding for the Fluidstack and CB-2 buildouts through 2026.  

Pro-forma liquidity projected for 2026 is expected to be approximately $1 billion, including cash on the balance sheet; however, this is expected to go towards the joint venture and pipeline M&A, leaving little left over to build on more sites through 2026 without additional funding.  

Operating cash flow was ($36.7 million) in Q3 for a (48.8%) margin, while free cash flow was approximately ($268.3 million) for a (530.4%) margin. Put another way, TeraWulf spent more than 5X its revenue on PP&E in the quarter. 

Conclusion 

TeraWulf is progressing with its HPC pivot as the company is now recognizing HPC related revenue, while eyeing a strong ramp in HPC revenue through 2027 as substantial capacity for Fluidstack comes online. Notably, execution risks for all Bitcoin Miners remain front and center as the bottleneck around power will intensify.  

Despite the sharp revenue ramp over the coming eight to ten quarters, amortization and debt interest payments will keep post-sweep cash flows minimal, while future development of a 1GW pipeline or accelerated deployments will likely require more cash. 

As you’ll see, there is a common theme to where many of the AI infrastructure plays will require the market being in an optimistic mood as the opportunity is immense yet the path to execution is tricky. We will participate when the correct setup materializes, but we will also step aside if needed.

Damien Robbins, Equity Analyst at I/O Fund contributed to this analysis.

Please note: The I/O Fund conducts research and draws conclusions for the Fund’s positions. We then share that information with our readers. This is not a guarantee of a stock’s performance. Please consult your personal financial advisor before buying any stock in the companies mentioned in this analysis.

Recommended Reading:

CoreWeave Q3: Timing Miss yet Backlog up 2X QoQ and up 4X YTD

CoreWeave reported growth of 134% YoY for $1.4 billion in revenue yet missed fiscal 2025 revenue guidance due to a timing miss with a major hyperscaler. The revenue will now be recognized in Q1 due to a delay in the powered shell: “As mentioned, the delays in powered-shell delivery associated with the data center provider will have an impact on our fourth quarter results. These delays are temporary, and as Mike noted, the affected customer has agreed to adjust the delivery schedule to preserve their capacity for the full duration and the total value of the original agreement.” 

The new fiscal year guidance is for revenue of $5.05 to $5.15 billion compared to previous guidance for revenue of $5.15 to $5.35 billion. The timing miss also caused the company to reduce capex by 40% to $12-$14 billion compared to the previous guidance of $20-$23 billion. This will represent revenue growth of 165.6% compared to previous expectations for growth of 173.4%. 

AI investors may want to get comfortable with delays in recognizing revenue due to power constraints. We’ve been preparing for this with ample exposure to AI data center energy in our portfolio.  

CoreWeave’s fundamental profile has some puts and takes. The margins are strong yet the cash remains troublesome. For example, CoreWeave is a recent IPO that is already GAAP positive on operating margin at 4% and reported an adjusted EBITDA margin of 61%. However, the company reported negative free cash flow of ($1.6 billion) with $14 billion in debt and $2.5B in cash on the balance sheet. This leaves net debt of $11.5 billion – yet this is mild given what the company plans to spend in capex next year (expect the debt to go up rapidly).  

Overall, the buildout that AI requires will need the market to be in high spirits as there is a glass half-full and a glass half-empty exercise to many of these high growth names that are reporting high debt leverage ratios. The backlog of $55B represents nearly double Q2 and is approaching 4X YTD yet the debt is also up 2X YTD. There are no new major red flags in this report; rather CoreWeave is on a trajectory of high growth-high debt for the foreseeable future.  

For additional context, you can read our previous coverage on CoreWeave, where we outline the broader opportunity and what makes the AI infrastructure company unique despite having large competitors.our previous coverage on CoreWeave, where we outline the broader opportunity and what makes the AI infrastructure company unique despite having large competitors. 

Backlog Soars yet Powered Shells are the Bottleneck 

The company stated the backlog grew by $25 billion to $55.6 billion, up from $30.1 billion for growth of 85% QoQ. Although backlog helps to illustrate that we are years away from AI being a demand problem, one has to wonder if backlog and RPO key metrics are really all that useful given power-related bottlenecks are led to a miss in fiscal year guidance.  

Overall, key metrics that illustrate supply are preferred – such as CoreWeave stating their active power footprint grew by 120MW sequentially to approximately 590MW with contracted power capacity growing over 600MW to 2.9GW. That represents 25.5% QoQ growth. Management expects to end the year with over 850 megawatts of active power. 

According to management: “And as Nitin said, we expect the overwhelming majority of that 2.9 gigawatts of power to be brought into service over the next 12 to 24 months.” That would imply nearly 400% growth over a two-year period from 590MW to 2.9GW, if all else remains equal.  

Analysts asked what led to the timing delay with the CEO leaning into the issue by stating they expect to see powered shells leading to more delays in the near future: “So you're going to be hearing this theme repeated again and again as you talk to not just CoreWeave, but you talk across the space. And it is a real challenge at the powered-shell level. It's not a challenge for power, right? There's plenty of power right now, and we believe that there will be ample power for the next couple of years. But really where the challenge is, is the powered shell.” 

Note, we listen to many earnings calls and although CoreWeave is connecting dots that the bottleneck can persist beyond simply securing power, the widespread issue is certainly related to the availability of power.  However, the sentiment is the same as I believe CoreWeave is communicating that even after a customer secures power, there is still more work to do and potential delays before they can recognize revenue. For example, delays could be regulatory in nature to where states like Texas require extra steps, etc. 

There are no major red flags from this delay as management assured investors that the customer agreed to extend the expiration date with CoreWeave maintaining the total value of the original contract.

Financials 

Strong Revenue Growth of 134% 

CoreWeave’s Q3 revenue grew by 133.7% YoY and 12.5% QoQ to $1.37 billion. The company beat analyst consensus estimates by a solid 6.6%, driven by continued strong demand for the company’s AI cloud infrastructure services. 

While the underlying business momentum remains strong, the company reduced its full -year revenue guidance by $150 million at the midpoint due to a timing miss with a major hyperscaler. The revenue will now be recognized in Q1 due to a delay in the powered shell. The new fiscal year guidance is for revenue of $5.05 to $5.15 billion, compared to the previous guidance of $5.15 to $5.35 billion. It would imply that the Q4 revenue of $1.54 billion, representing a YoY growth of 106% and 12.8% QoQ. They were below the analysts' estimates of $1.79 billion. 

Management stated in the earnings call, “Now turning to guidance. As mentioned, the delays in powered-shell delivery associated with the data center provider will have an impact on our fourth quarter results. These delays are temporary, and as Mike noted, the affected customer has agreed to adjust the delivery schedule to preserve their capacity for the full duration and the total value of the original agreement.” 

Looking ahead, analysts expect 2026 revenue to grow 132% YoY to $12.23 billion, and these estimates will be increased due to the push-out caused by the delay in Q4 revenue recognition to Q1. For 2027, revenue is expected to grow 49.4% YoY to $18.27 billion. 

Product innovations included the launch of CoreWeave AI Object Storage. It is a fully managed storage service that eliminates the friction of moving data between regions, clouds, and tiers, with zero egress or transaction fees. Management also highlighted that CoreWeave's AI Object Storage delivers the highest throughput for AI workloads while cutting customers' costs by more than 75%. 

Robust Backlog of $55.6 billion 

The company’s Q3 backlog grew by 85% sequentially to $55.6 billion. Management stated: “Demand remains robust for not just the Blackwell platform but across our GPU portfolio. In the third quarter, we signed a number of deals for older generations of GPUs, adding new customers and recontracting existing capacity.” Management also highlighted that they reached $50 billion in RPO, faster than any cloud in history. 

Broad-based growth is positive as it will help the company reduce customer concentration. Currently, the largest customer accounts for 35% of the revenue backlog, down from 50% in the previous quarter and 85% at the beginning of the year.

In Q3, the company executed large-scale compute contracts with many of the largest customers, including Meta and OpenAI. We have discussed it in our analysis here. The company entered a $14.2 billion multi-year deal with Meta and expanded the OpenAI partnership with a $6.5 billion deal, bringing total commitments to up to $22.4 billion.  

In early September, CoreWeave announced that key partner and investor Nvidia had entered a new order worth up to $6.3 billion under the duo’s pre-existing 2023 master services agreement. It also represents a significant expansion of existing relationships and a diversification away from reliance on any single customer. No single data center provider represented more than 20% of the contracted power portfolio. 

The company also entered the US federal market, which should further help to diversify its customer base. CoreWeave will provide secure, compliant, high-performance AI cloud services to US government agencies and their key partners, including the Defense Industrial Base. NASA already uses its services to advance scientific exploration at its Jet Propulsion Lab. 

Margins 

The company is investing heavily in data center and server infrastructure to meet robust AI demand from its customers. The operating expenses are front-loaded, resulting in a short-term impact on margins. 

  • Q3 gross profits grew by 126% YoY to $995.85 million with a gross profit margin of 73%, down 200 basis points YoY and 100 basis points sequentially.  
  • Q3 operating margin was 4%, down from 20% in the same period last year and up 200 basis points sequentially. The operating expenses increased 181% YoY to support strong growth. The adjusted operating margin was 16%, compared to 21% in the same period last year. However, it was better than the management guide of 14% primarily due to higher revenue, lower costs due to timing of data center deliveries from third-party partners, and improved fleet efficiencies. 
  • The company’s adjusted operating margin guide for Q4 is expected to decline to 8%. Management stated: “In Q4, we will be bringing online some of the largest scale deployment in our company's history. This will have a near-term impact on adjusted operating margin due to the timing difference between when data center costs are first incurred and when we start recognizing revenue.” 
  • Adjusted EBITDA grew by 121% YoY to $838.1 million with an adjusted EBITDA margin of 61% compared to 65% in the same period last year. 

EPS 

Q3 GAAP EPS was ($0.22) compared to the analysts' estimates of ($0.51). However, the strong beat was due to a one-time noncash tax benefit of $0.25. Excluding the one-time benefit, the company would beat estimates by $0.04. 

Looking forward, analysts expect GAAP EPS of ($0.84) in 2026 and to be GAAP profitable in 2027 with an EPS of $1.63. 

Cash Flow and Balance Sheet 

CoreWeave’s business model is based on aggressive capacity expansion, currently fueled primarily by debt. As a result, cash is rather thin and gets spent quickly, and free cash flow is widely negative.   

  • Free cash flow was ($1.6 billion) compared to ($573.9 million) in the same period last year and ($2.7 billion) in the previous quarter. 
  • The revenue timing miss also caused the company to reduce its full-year capex by 40% to $12-$14 billion compared to the previous guidance of $20-$23 billion. Most of the remaining capex that was previously anticipated in Q4 will now be recognized in Q1. Management expects capex in 2026 to more than double from 2025. 
  • Cash was $2.49 billion, and debt was $14.03 billion compared to cash of $1.7 billion and debt of $11.05 billion in the previous quarter. 

Conclusion:

Increasingly, management conversations for AI buildouts are about credit terms – more so than compute, and perhaps equal to the discussions on energy. We do an extensive checklist after each earnings report to remove emotion from our portfolio decisions and the fact is that CoreWeave has a debt ratio that is 5-6X EBITDA – and this will only get steeper. 

Compare that to Nvidia at 0.1X (or negligible). There are lower risk ways to participate in AI, yet the positioning CoreWeave offers is second to none. The company is in the “build” phase but will eventually be in the “yield” phase.  

In the interim, we expect to approach this name tactically, as performance is likely to hinge more on market temperament than on a fundamental change in the AI hyperscaler’s long-term prospects. 

The yield phase is one we intend to participate in. To illustrate the yield CoreWeave could be capable of, consider the company reached $50 billion in RPO – faster than any cloud provider in history. This, along with other execution metrics, suggests the company could be laying the foundation for a long and meaningful runway in AI infrastructure.

I/O Fund Equity Analyst Royston Roche contributed to this analysis.

Please note: The I/O Fund conducts research and draws conclusions for the Fund’s positions. We then share that information with our readers. This is not a guarantee of a stock’s performance. Please consult your personal financial advisor before buying any stock in the companies mentioned in this analysis.

Recommended Reading:

Innodata on Pause until 2026 Story Develops Further 

Innodata’s AI segment slowed from 99% YoY growth last quarter to 22.6% YoY growth this quarter, although on a QoQ basis there was some improvement with 8.3% growth compared to essentially flat last quarter.  

However, the company is twiddling its thumbs (so to speak) until the next deal is announced. With nothing concrete to add this quarter, there was instead vague talk around their biggest customer expanding “based on verbal confirmation.” Management does believe 2026 will be stronger with $26 million in pre-training data wins expected to be signed “very soon” and “new partnerships emerging with key AI and sovereign AI players, which we expect to be announcing in 2026.” 

According to management, there are eight potential customers with five expected to contribute meaningfully in 2026. In terms of how much revenue they can contribute, the following was shared: “Three of these new five, we believe, are positioned to allocate up to hundreds of millions of dollars annually to generative AI data and evaluation, and we believe we’re well-positioned to capture a share of that spend. It is worth noting that two of these are global leaders in commerce, cloud, and AI.” 

Overall, it’s difficult to sit in the waiting room on any AI stock right now. With a name like Innodata, we prefer to remain balanced and to wait for more tangible evidence that new deals are materializing. Opportunity cost comes to mind when there are other AI names already showing clear acceleration in deal flow and revenue contribution today. 

Q3 Revenue Beat by 4.6% 

Revenue grew by 19.8% YoY to a record $62.6 million, beating estimates by 4.6%. Revenue growth decelerated from 79.4% in Q2, which was expected. It grew by 7.1% sequentially and was better than flat in the previous quarter. 

Management reiterated the annual guidance of 45% or more growth for the full year. They stated: “We reiterate guidance we provided last quarter of 45% or more year-over-year organic revenue growth in 2025, and we anticipate continued transformative growth in 2026 based on new wins and strong momentum.” 

Looking ahead, analysts expect revenue to grow 22.8% YoY to $303.8 million in 2026 and 3% growth to $313 million in 2027. These estimates could be revised higher based on the new deals in the pipeline.  

Innodata Federal Business Unit Launched 

The company also announced the launch of Innodata Federal, a dedicated government-focused business unit designed to deliver mission-critical AI solutions to U.S. defense, intelligence, and civilian agencies. Management expects this business unit to be a material revenue generator for the company in 2026 and beyond. The business unit has won an initial project with a new high-profile customer. They anticipate that the initial project will generate approximately $25 million in revenue, primarily in 2026. 

The company has additional projects under discussion with the customer, and they anticipate that these projects will be substantial. Management expects to issue a press release regarding the relationship prior to the end of the year. These projects are expected to be a potential game-changer for the next phase of growth. The new partnership is strategically significant, representing a material top-line opportunity. 

AI Segment grew by 23% 

Innodata’s Digital Data Solutions (DDS) segment grew by 22.6% YoY to $54.8 million. This AI segment slowed from 99% YoY growth last quarter, although on a QoQ basis, there was some improvement with 8.3% growth compared to essentially flat last quarter. Also, it had tough comps as the company reported a strong YoY growth of 179% in the same period last year. 

Management was also optimistic about the enterprise AI opportunity and mentioned that it was also gaining traction and holds promise for 2026. Innodata provides full-stack support to help enterprises integrate generative AI into products and operations. 

  • Synodex segment revenue was down (14.6%) YoY to $1.65 million compared to a 4% growth in the previous quarter. 
  • Agility segment revenue grew by 9.3% YoY to $6.1 million compared to an 11.5% growth in the previous quarter but was up 6.4% sequentially. 

Margins  

The company’s gross profits grew by 19.6% YoY to $25.5 million with a margin of 40.8%, which was flat YoY and up 80 basis points sequentially. The adjusted gross margin improved by 40 basis points YoY and 130 basis points sequentially to 44.2%. 

Operating income was up 3% YoY to $11.8 million. Operating margin was 18.8%, down 310 basis points YoY, but was up 350 basis points sequentially. The operating expenses increased by 38.7% YoY to $13.7 million, primarily due to new hires. Management expects operating expenses to increase to support strong expected growth. 

Net income was $8.3 million compared to $17.4 million a year ago. The decrease was primarily due to the tax benefit arising from the utilization of net operating loss carry forward in the same period last year.  

Adjusted EBITDA grew by 16.9% YoY to $16.2 million with an adjusted EBITDA margin of 25.9%, down 60 basis points YoY and up 320 basis points sequentially. 

  • The DDS segment adjusted EBITDA margin was 27.8%, up 70 basis points YoY. 
  • Synodex segment adjusted EBITDA margin was 8.2%, down 19.2 percentage points YoY. 
  • Agility segment adjusted EBITDA margin was 14%, down 8.1 percentage points YoY. 

EPS beat by 75% 

The company’s GAAP EPS came at $0.24, beating the analyst’s estimates by 75.2%. Analysts expect GAAP EPS of $0.21 and $0.24 in the next two quarters. 

Looking forward, analysts expect GAAP EPS to grow 40.8% YoY to $1.07 in 2026 and 21.5% YoY to $1.30 in 2027. 

Cash Flow and Balance Sheet 

The company has a healthy balance sheet. 

  • Q3 operating cash flow was $18.77 million or 30% of revenue compared to $11.37 million or 21.8% of revenue in the same period last year. The company also benefited from an $8.0 million cash payment received in the recent quarter, which would have otherwise been received by the end of Q2. 
  • Q3 free cash flow was $14.5 million or 23.2% of revenue compared to $9.92 million or 19% of revenue in the same period last year. 
  • The company’s cash was $73.86 million at the end of the quarter, up from $59.8 million at the end of the previous quarter. The company has no debt. 

Conclusion: 

As stated above, it’s difficult to sit in the waiting room on any AI stock right now. With a name like Innodata, we prefer to remain balanced and to wait for more tangible evidence that new deals are materializing. Opportunity cost comes to mind when there are other AI names already showing clear acceleration in deal flow and revenue contribution today. 

I/O Fund Equity Analyst Royston Roche contributed to this analysis. 

Please note: The I/O Fund conducts research and draws conclusions for the company’s portfolio. We then share that information with our readers and offer real-time trade notifications. This is not a guarantee of a stock’s performance and it is not financial advice. Please consult your personal financial advisor before buying any stock in the companies mentioned in this analysis. Beth Kindig and the I/O Fund own shares in INOD at the time of writing.

Recommended Readings:

Applied Optoelectronics Q3: Timing Miss yet Q4 Signals Inflection Point

Applied Optoelectronics missed revenue by $1.2M for revenue of $118.6M expected compared to $119.9M reported. The miss was due to a timing issue with management stating data center revenue was “a touch below our expectations, largely due to the timing of certain shipments at quarter-end. In particular, we had approximately $6.6 million in shipments of 400G transceivers to a large hyperscale customer, which was not able to be turned into revenue during the quarter due to various shipping and receiving delays and which we have booked in Q4.”

Although the headline numbers are causing an aftermarket selloff, the call was quite clear that the company AOI (Nasdaq: AAOI) is preparing to grow shipments significantly. Most importantly, there were discussions of an “imminent” 800G qualification coming in the next few weeks with additional hints of very strong QoQ data center growth next quarter. The earnings call signaled an important inflection point in Q4 that is not accurately depicted in Q3 numbers. We cover this and more below!

The Importance of the 800G Qualification

AOI is expected to become a large supplier for 800G and 1.6T optics, especially for its customer Amazon with a deal worth $4B over ten years. However, the 800G qualification is expected to expand beyond Amazon with management stating: “we believe we are near the final stages of qualification with several customers. We expect qualification in the near term based on conversations that we are having with our customers, and we continue to believe that we will produce meaningful shipments of 800G products in the fourth quarter.”

When asked how soon the qualifications could occur, management used the word “imminent.” This is noteworthy because AOI faced timing delays in Q3, which meant the quarter reflected very little contribution from AI data center revenue. In fact, roughly 83% of data center sales came from 100G products, while only 9% came from 200G and 400G transceivers. If we take management’s commentary at face value, this sets up a potential inflection point for AOI, as 400G — and especially 800G — products carry higher sales prices that can accelerate growth. With qualifications now described as “imminent,” AOI may be entering the part of the product cycle where higher-speed optics begin to materially impact the top line.

This understanding was echoed by management with the following statement: “Looking ahead to Q4, we expect a substantial sequential increase in our data center revenue driven by growth in 400G revenue, as well as layering in some increased 800G revenue.” Later, management quantified their expectations: “That means the data center growth should be a lot, okay, since the revenue increased by about 10% compared to Q3. That means data center revenue will increase by $25-$40 million in Q4.” Given that data center was $43.9 million this quarter, that would imply 74% data center growth at the midpoint – a sharp contrast to the (2%) decline QoQ in data center revenue this quarter.

This is supported by additional color in terms of where the company is now on shipping volumes compared to where they expect to be by year-end and mid-year 2026:

Right now, we’re only talking about maybe 10,000, 20,000. It’s a volume still far away from, quite away from. That’s why I say by end of December, we should have 100,000 per month. By end of June next year, we have 200,000 per month.”

AOI is Building USA’s Largest 800G and 1.6T Laser Production Capacity

As covered previously, in OFC in April, AOI outlined one of the most impressive capacity expansion stats that we have seen: an 8.5x increase for 800G and 1.6T products by the end of the year, with management reaffirming in both Q1 and Q2 that they remain on track to reach said target. Capacity for these high-speed products is split between two facilities, one in Taipei, Taiwan and the other in Sugar Land, Texas. Overlaying potential 3x growth industry this year with 8.5x capacity growth for AOI implies the company is eyeing market share gains into year end persisting through 2026.

If 8.5X growth was not enough, AOI is going further and aiming to double capacity again by mid-2026, stating in Q2’s call that they are expecting to be able to produce >200K 800G/1.6T products per month, with the majority produced in Texas. This corresponds to annual production of ~2.4 million 800G/1.6T products, up more than 16x from less than 150K annually prior to these expansion plans.

The fact AOI is on the verge of a sharp ramp was a central theme on the call with management stating:

As a reminder, we expect this will culminate later this year with what we believe will be the largest domestic production capacity for 800G or 1.6 terabit transceivers, approximately 35,000 transceivers per month, or roughly 35% of our overall capacity for these advanced optical transceivers. Notably, we will be able to accommodate this expansion in our current Texas facility footprint. Further, by mid-2026, we continue to expect to be able to produce over 200,000 pieces per month, with the majority produced in Texas.”

The only change in tone the I/O Fund team could pick up on is the Texas facility is expected to now produce 35% of overall capacity compared to commentary in the previous earnings call that Texas would contribute 40% of overall capacity. In Q2, it was stated:

We continue to expect to exit this year with a production capacity of over 100,000 units of 800G transceivers per month, with 40% of this production being done in the US”

Last week, the company announced its $150M investment for expansion in Texas to increase its USA production over a five-year period:

The expansion project, when complete, will have the largest production capacity for AI-focused datacenter transceivers in the U.S.”

Timing for 400G, 800G and 1.6T

I’m earmarking AOI to (hopefully) make a splash starting next quarter and into Q2 2026. It’ll be an interesting three quarters as 400G is expected to carry the revenue in Q4, then 800G in early 2026 with 1.6T taking effect by Q2.

Here is what was stated on the earnings call:

If you look at our guidance, again, just kind of go back to the segment guidance that we gave. It implies a dramatic ramp in data center revenue in the fourth quarter. We didn’t give annual guidance for next year, but we certainly believe that’s the beginning of a sustained ramp. I think we’re exactly in sync with what you described. We’re seeing that ramp first at 800G, but as we talked about, later next year, we expect 1.6 to be a strong contributor as well.”

Financials

Revenue

AOI reported $118.6 million in revenue in Q3, slightly below estimates for $119.8 million and at the lower end of management’s guidance for $115 to $127 million. This represented growth of 15.2% QoQ and 82.1% YoY, decelerating from 137.9% YoY in the second quarter, driven by strong cable TV demand and the ramp of 1.8 GHz amplifier products as data center revenue was soft.

For Q4, AOI guided for revenue between $125 and $140 million, up 11.7% QoQ and 32.1% YoY, another sharp deceleration though this comes against much tougher comps. Management expects to recognize 800G revenue in the fourth quarter: “we continue to believe that we will produce meaningful shipments of 800G products in the fourth quarter.”

Key Segments

CATV (Cable TV):

CATV revenue surged 237.1% YoY and 26.1% QoQ to a record $70.6 million, with management characterizing demand as “exceptionally strong.”

Data Center:

Data center revenue was $43.9 million, up 7.3% YoY but down (1.9%) QoQ, with management explaining that this “came in a touch below our expectations, largely due to the timing of certain shipments at quarter end due to various shipping and receiving delays.” AOI also added that it is seeing increased orders for 100G and 400G products from several large customers, and expects increased demand for both through the end of the year.

According to the opening remarks, the split across products was “In the third quarter, 83% of data center revenue was from 100G products, 9% was from 200G and 400G transceiver products, and 7% was from 10G and 40G transceiver products.”

Telecom/Other:

Telecom revenue rose 33.7% YoY and 92.8% QoQ to $3.74 million, while other revenue was $0.35 million.

Margins

AOI showed a marginal sequential improvement in GAAP operating margin despite GAAP gross margin contracting, though the company is not meaningfully closer to GAAP profitability.

  • GAAP gross margin was 28.0%, down 2.3 points QoQ but up 3.6 points YoY. Adjusted gross margin was 31%, at the high end of guidance and up 0.6 points QoQ and 6 points YoY.
  • GAAP operating margin was (15.3%), a slight improvement from (15.5%) in Q2 and up more than 10 points YoY. Adjusted operating margin was (8.7%), improving 1.8 points QoQ and 9.2 points YoY.
  • GAAP net margin was (15.1%), down from (8.8%) in Q2 but up from (27.3%) in the year ago quarter. Adjusted net margin was (4.6%), below guidance for (3.3%) but marking an improvement from (8.6%) in Q2 and (13.5%) in the year ago quarter.

For Q4, management guided for adjusted gross margin to be 29-31%, down 1 point QoQ but up 1.3 points YoY at midpoint. Adjusted net margin was guided at (4.5%), approximately flat QoQ.

EPS

AOI met adjusted EPS estimates this quarter at ($0.09), though Q4’s guidance missed as the company is still forecasting a small loss whereas estimates were expecting a shift to profitability, albeit at a thin $0.03.

  • Q3 GAAP EPS was ($0.28), improving from ($0.42) in the year ago quarter but widening from ($0.16) in Q2. This missed estimates for ($0.10).
  • Q3 adjusted EPS met at ($0.09).
  • Q4 adjusted EPS was guided to be ($0.13) to ($0.04), short of consensus for $0.03.

Cash and Balance Sheet

Cash flows significantly improved from Q2, and inventories rose sharply once again, likely in preparation for the ramp of 800G products.

  • Q3 operating cash flow was ($28.5 million) for a (24%) margin, improving from a (63.6%) margin in Q2 but down slightly from (22.2%) a year ago.
  • Q3 free cash flow was ($57.5 million) for a (48.5%) margin, improving from (101.3%) in Q2 but still lower from (32%) a year ago.
  • Cash and equivalents totaled $150.7 million and debt totaled $192.1 million.
  • Inventories were $170.2 million, up 22.5% or $31.3 million QoQ. Since Q1, inventories have risen by ~$68 million.

Conclusion:

If the market were always on our side, investing would be easy. What we’re seeing this quarter is a reminder that even when a company’s story remains intact, the market can still get the jitters. This stock, however, continues to get a green light from me across the board — the headline “miss” was a non-issue (on the contrary – it’s a boon for the strong QoQ commentary on Q4). Looking ahead, shipments are on track to increase 16X over the next year, kicking off soon with key 800G qualifications only weeks away. Management is feeling comfy enough to include 800G in the Q4 guide — a meaningful signal. Of course, nothing is ever certain in investing. But based on what I heard this evening, this is not a report I’m concerned about.

Please note: The I/O Fund conducts research and draws conclusions for the Fund’s positions. We then share that information with our readers. This is not a guarantee of a stock’s performance. Please consult your personal financial advisor before buying any stock in the companies mentioned in this analysis. Beth Kindig and the I/O Fund own shares in Applied Optoelectronics at the time of writing and may own stocks pictured in the charts.

Recommended Reading:
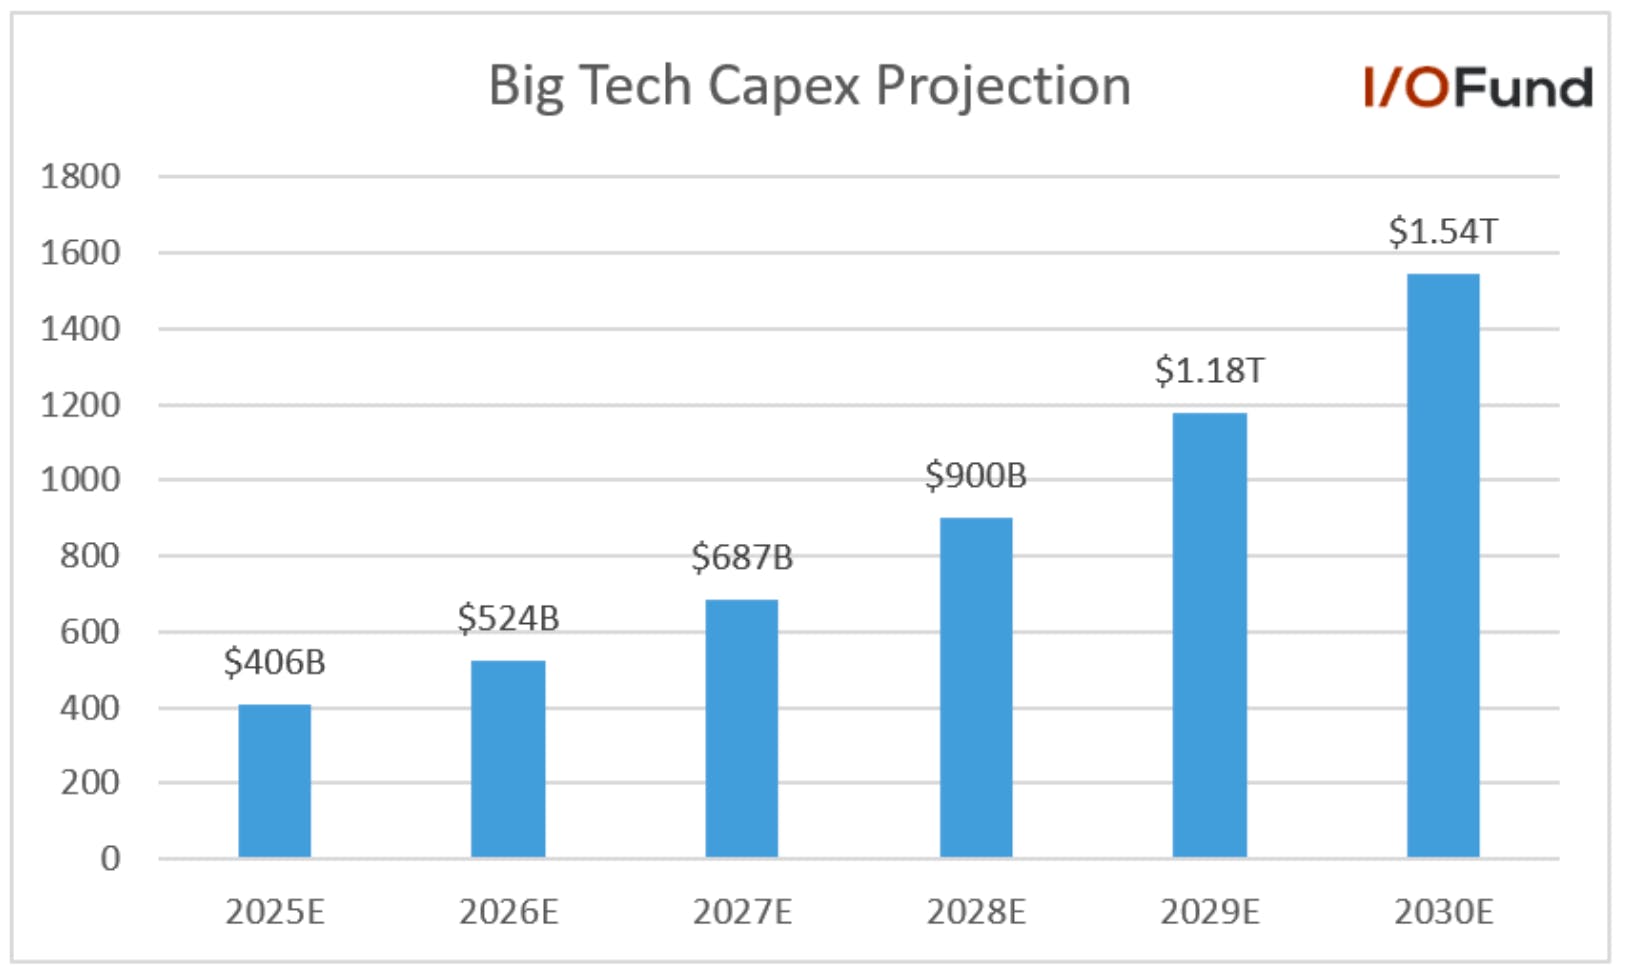
IREN Raises Cloud ARR to $3.4B for 2026, Yet Financing and Execution Remain

This evening, IREN reported record revenue of $240.3 million, up 355% YoY, and net income of $384.6 million, impacted by a $665 million gain on financial instruments. The company has experienced a significant rebound after retrofitting its Bitcoin mining operations for AI data centers, though its AI Cloud has not yet shown substantial growth, with just $7.3 million in revenue the quarter, up 4% QoQ with only 2,067 GPUs operational. However, cloud revenue growth is expected to accelerate rapidly to $500 million by Q1 and $3.4 billion by the end of 2026 – what remains is the financing and execution.

While the I/O Fund has participated in the AI-energy momentum with successful Bitcoin Miner entries, we want to be clear that these are currently momentum trades for us. In the most recent report, IREN provided a more detailed breakdown on how it will fund $5.8 billion in GPUs, using a $1.9 billion pre-payment, estimating $2.5 billion in financing secured against the GPUs and contract, and the remaining $1.4 billion from cash/cash flows, debt, equity or convertible notes. Payments for the GPUs will be phased in alignment with deliveries through 2026.

However, until financing for the full data center buildout is secured and ARR visibility materializes, we will continue to treat names like IREN as high-risk trades and adhere strictly to our stop levels.

IREN Signs $9.7 Billion Deal with Microsoft

Earlier this week, IREN announced a five-year, $9.7 billion data center with Microsoft, providing the cloud giant with 200MW of capacity of Nvidia’s GB300 GPUs. As is the case with miners, capacity will roll out in phases through 2026, with IREN aiming to deliver the full capacity by year-end. Delivery of the GPUs is not expected to commence until March 2026, hinting that the first tranche will likely not be deployed until calendar Q2.

IREN has provided a detailed breakdown of the deal value, capex costs and pre-payments:

  • $9.7 billion total deal value, translating to annualized run rate revenue of $1.94 billion per year, or $9.7 million per MW.
  • 85% estimated EBITDA margin, or ~$1.65 billion per year on average.
  • $1.94 billion pre-payment (20%) from Microsoft, credited to the third, fourth and fifth year of the deal, covering some of the upfront GPU costs.

Moving to capex and GPUs:

  • All-in GPU cost of $5.8 billion including InfiniBand, cabling, servers, etc; while IREN did not disclose the total contracted GPUs, prior GB300 purchases imply that this would represent approx. 72,500 GPUs.
  • Data center capex costs of $14-16 million per MW, including $9-11 million for infrastructure, $3 million for 100MW supercluster architecture and flexible rack densities, and $2 million to accelerate deployment of the full capacity by the end of next year.

As stated above, IREN provided a more detailed breakdown on how it will fund the $5.8 billion in GPUs, using the $1.9 billion pre-payment, estimating $2.5 billion in financing secured against the GPUs and contract, and the remaining $1.4 billion from cash/cash flows, debt, equity or convertible notes. Payments for the GPUs will be phased in alignment with deliveries through 2026.

IREN Raises ARR Projection to $3.4B by End of 2026 with ~140K GPUs

With the Microsoft deal now under its belt, IREN had updated its annualized run-rate revenue (ARR) projection to $2.5 billion, which reflects no change to its prior target of $500 million by Q1 2026 excluding the deal.

However, IREN now guided for $3.4 billion in ARR by the end of 2026, which includes its original $500 million target, plus an additional $1 billion ARR target for its remaining 110MW capacity at Mackenzie and Canal Flats. Again, IREN warns that this figure “is not fully contracted, there can be no assurance that it will be achieved, and actual revenue may differ materially.”

Source: IREN

IREN says this forecast assumes ~63K GPUs deployed at its British Columbia sites, which would require the company to procure, receive and install an additional ~40K GPUs before the end of next year. Considering that its ~23K GPU fleet cost upwards of $1.2 billion, IREN may need to find another >$2 billion to scale to 63K in British Columbia, or potentially even $3 billion if it goes primarily for GB300s. With the company already looking for several billions in funding for Microsoft will little to show for AI Cloud revenue, this could require more debt or creative financing methods such as GPU-collateralized loans.

IREN’s 2.9GW Places Third Among the Miners

In terms of overall power capacity, IREN would rank third in the miners with its 2.9GW, behind Applied Digital’s 4.3GW active development pipeline and Galaxy’s 3.5GW. IREN’s Sweetwater campus accounts for a majority of its capacity at 2GW, with substation energization for the first 1.4GW coming in the first half of 2026 and the second substation energization for the remaining 0.6GW in the second half of 2027. Considering the high costs of fully outfitting this entire 2.9GW of capacity with next-gen GPUs, it’s unlikely that IREN’s power pipeline will expand substantially in the near future.

The more important question for IREN is two-fold: how long after substation energization will Sweetwater be ready for service, and how can IREN fund a full 2GW build-out quickly? Big Tech and semis continue to harp on power being the primary constraint, and the differentiating factor for miners is who can deliver the most power the fastest.

Current timelines for Applied Digital, Galaxy and TeraWulf project each will have less than 1GW online by 2027 for key customers, but if IREN can bring the first 1.4GW of Sweetwater online by 2027 (or at least a portion of it), it could be in a better position to secure more lucrative cloud deals. However, self-funding the full buildout will be a challenge as current GPU prices suggest 2GW could cost nearly $60 billion.

Rental Pricing and Payback Periods

IREN’s October 7th announcement about securing multi-year AI cloud contracts included an important but potentially overlooked phrase: “New NVIDIA Blackwell GPUs continue to be contracted ahead of delivery on an average term of 2 years, at pricing that supports a ~2-year revenue payback.”

What this means is that customers are currently willing to contract Blackwell GPUs for two years, as Rubin GPUs will be released late next year and will likely be highly sought after, and IREN is expecting its Blackwell GPUs to be paid back in the same two year contracts.

However, considering how quickly Nvidia (and AMD) are upgrading GPUs and the performance gains each generation brings, these older generation GPUs quickly get priced out of the market. For example, Nvidia’s H100 GPUs were renting for approximately $3.00 per hour in January 2025, prior to Blackwell’s ramp, yet now are renting for <$2 per hour, a (33%) decline that is only likely to exacerbate as the Blackwell Ultras ramp up.

Source: Bloomberg via X

Thus, relying on a two-year payback period under a two-year contract suggests that residual revenue and cash flows from these Blackwell GPUs come 2027 could be significantly lower than current contractual terms. This is because rental rates are likely to follow a similar trajectory of the H100 and decline substantially for two primary reasons: Blackwell availability will be much larger as new systems ramp through the end of the year and 2026, and early Rubin availability will likely draw a significant amount of demand for the more-performant chip.

While it may seem to be a significant positive for IREN that it can realize a two-year payback for Blackwell GPUs, the dynamics of demand and the pace of GPU upgrades imply future revenue opportunities from Blackwell may be more limited in scope.

IREN has a Cash Flow Issue

Stocks like Oracle have recently come under pressure for the enormous debt load the company is expected to inherit to fund the company’s ambitious data center plans. For example, there is rumored to be a $38 billion debt offering as soon as next week, with Morgan Stanley stating the figure could be as high as $55 billion to $75 billion.

IREN is in a similar boat as its ambitions to scale into a competitive AI data center and cloud provider are not congruent with current cash resources, meaning capital intensity and how the company will expand the balance sheet will be a key focus for investors going forward.

Last quarter, we discussed that despite operating cash flow being positive for the fiscal year at $245.9 million, the overall picture of how GPUs and data center expansion would be funded was murky. Due to outsized capex, the free cash flow was ($1.13B) or a FCF margin of –226%. In other words, every dollar of operating cash flow generated was spent 5:1 on the buildout. This improved slightly in fiscal Q1, with every dollar of operating cash flow spent only 2:1.

Financing flows filled this gap with $1.30 billion raised via converts, equity, and leases. Net-net, IREN ended FY25 with $160 million more cash than it started with, despite billion-dollar capex outlays. After year-end, the Company raised another $253.5 million via ATM equity sales and finalized a lease program that funds GPUs entirely, with fixed monthly payments of ~$2.8M and a buyout option at 18% of cost after 36 months. This strategy shifts capital intensity away from cash up front, preserving liquidity while enabling AI Cloud scaling.

However, the issue lies with the more aggressive buildout that is in front of IREN. In the previous analysis, we pointed toward IREN needing $6 billion for a 112K GPU fleet:

At Horizon 1, IREN says that it can host ~19K GB300 GPUs at 50 MW IT load, which, based on prices calculated above, would cost the company upwards of $1.5 billion. Funding this and fully outfitting its British Columbia sites for 100% AI cloud capacity would likely cost $5 billion or more, or ~10x IREN’s most-recently reported cash holdings. This also does not account for its 2GW Sweetwater campus, which IREN says can support >600K GB300s.

Analysts are expecting IREN to quickly scale its fleet through 2026, with Roth Capital projecting IREN to reach a ~112K GPU fleet by year-end 2026. This ~90K increase in GPU fleet could require IREN to take on more than $6 billion in debt, per Roth’s calculations. This would represent nearly 60% its current valuation and likely cost ~$600 million quarterly, which would not be covered by revenue nor cash flows.”

$1 Billion Convertible Raise to Support Expansion

As we discussed in our prior analysis, IREN: GPU Fleet Doubled to 23K, AI Cloud ARR Guide Raised to $500M, outfitting its pipeline with tens of thousands of GPUs will not be cheap, with the company likely to pull out several billions in debt to scale its fleet towards 100K GPUs.

In mid-October, IREN closed a $1 billion convertible note raise, giving the company approximately $922 million in capital for general corporate purposes, which will likely go towards additional GPU purchases. Considering 200MW of GB300 GPUs will cost $5.8 billion, this raise will likely only fund another 20-30MW of capacity.

Microsoft’s Nebius Deal Highlights Miner Shortfalls

Microsoft had signed a similar five-year deal with Nebius in early September worth $17.4 billion for capacity at the neocloud’s upcoming data center in New Jersey, which is expected to have 300MW capacity.

Under such terms, the deal would be worth $3.48 billion on average per year, but on a per-MW basis, $11.6 million per year, or approximately a 20% premium to IREN’s deal. Considering timing is very similar with deployment occurring throughout 2026, Nebius’ ability to command a more valuable deal may stem from its full-stack, proprietary AI cloud purpose-built for AI workloads. Nebius can offer both the powered shell and its platform with MLops services, low downtime and high cost efficiency, offering up to 3x token savings with low latency, and up to 4.5x faster time to token versus other competitors.

This further reinforces that miners’ main value proposition is simply delivering the powered shell in a timely manner, leading to potentially lower deal economics versus neoclouds like Nebius who can combine power with AI-optimized software. It’s also likely why IREN is making a deeper push to bridge the gap with its own AI-optimized cloud offering, as it could drive more valuable deals with hyperscalers, versus a deal such as Cipher’s with AWS worth $1.22 million per MW per year on average.

Financials:

Revenue

IREN reported a record $240.3 million in revenue in Q1, up 355% YoY and more than 28% QoQ, driven primarily by Bitcoin mining revenue of $232.9 million. This beat estimates for $228.5 million the quarter.

AI Cloud Revenue

IREN’s AI Cloud revenue showed minimal growth in fiscal Q1 at just 4% QoQ to $7.3 million, though this was up more than 128% YoY. Operational GPUs rose just 9% from 1,896 to 2,067, less than 10% of the ~23K the company has purchased; considering the company has announced that 11K of its fleet has been contracted under multi-year deals and are expected to be operational by the end of the year, deliveries and revenue should ramp significantly in the December quarter.

Margins

Gross margin was 66.4% in fiscal Q1, down from 71.8% in Q4, as net power prices rose 31% sequentially. Bitcoin mining gross margin shrunk from 70.9% to 65.7%, while AI Cloud gross margin shrunk from 92.9% to 90.4%.

However, operating margin was (31.8%), a stark contrast to the 11% reported in Q4, driven by a 107% sequential increase in operating expenses to $236 million, or more than 98% of revenue. This was fueled by SG&A, which rose from $53.3 million in Q4 to $138.4 million in Q1, which IREN says was driven by a “materially higher share price” that resulted in an additional $23.9 million of stock-based amortization and $32.8 million in payroll taxes related to RSUs.

Net margin was 160%, as IREN reported $384.6 million in net income, impacted by a $665 million gain on financial instruments, primarily related to prepaid forwards and capped calls on convertible notes.

Adjusted EBITDA margin also contracted from 65.1% in Q4 to 38.2% in Q1.

Cash Flows, Cash and Debt

Operating cash flow was $142.4 million, though free cash flow was ($138.2 million) as IREN spent ($180.3) million on PP&E and another ($100.3) million in GPU prepayments.

IREN reported cash and equivalents of $1.03 billion at quarter end, though noted that at the end of October, cash and equivalents totaled ~$1.8 billion following its $1 billion convertible raise. This is a sharp increase from $564.5 million as of Q4.

Property, plant and equipment was $2.12 billion, up from $1.93 billion in Q4.

Debt (convertible notes) was reported at $962.4 million, though this does not include the recent $1 billion convertible raise. IREN also added that it secured an additional $200 million in GPU financing in the quarter, bringing its total there to $400 million. IREN expects future capex needs to be met by cash/cash flows, GPU financing, Microsoft’s prepayments and additional financing methods.

Equity rose from $1.82 billion to $2.88 billion, driven by an increase in cash, financial and derivative assets. Shares outstanding rose 4% from August to October, from 272 million to 283.5 million.

Conclusion:

IREN’s AI Cloud revenue is at $7.3 million with management forecasting $500 million by Q1 and $3.4 billion by the end of next year. Of this, $1.9B is to come from the Microsoft deal over a five-year period: “When combined with the $1.9 billion expected from the Microsoft contract and $500 million from our existing 23,000 GPU deployment, this expansion provides a clear pathway to approximately $3.4 billion in total annualized run rate revenue once fully ramped.”

Estimates call for $2.5 billion at the end of fiscal year 2027 ending in June, implying the Microsoft deal and the $500 million could already be priced in. At some point, the market will want to take a rest and watch how the financing and execution pieces comes together (not IREN specific).

Also keep in mind, IREN’s main source of revenue is Bitcoin and Bitcoin prices have been dropping. As stated in our original IREN coverage, this is more of a momentum trade setup: “We are watching IREN closely and would buy on a clear breakout only. If we were to buy, we’d closely adhere to all stops.”

Please note: The I/O Fund conducts research and draws conclusions for the Fund’s positions. We then share that information with our readers. This is not a guarantee of a stock’s performance. Please consult your personal financial advisor before buying any stock in the companies mentioned in this analysis. Beth Kindig and the I/O Fund own shares in IREN at the time of writing and may own stocks pictured in the charts.

Recommended Reading:
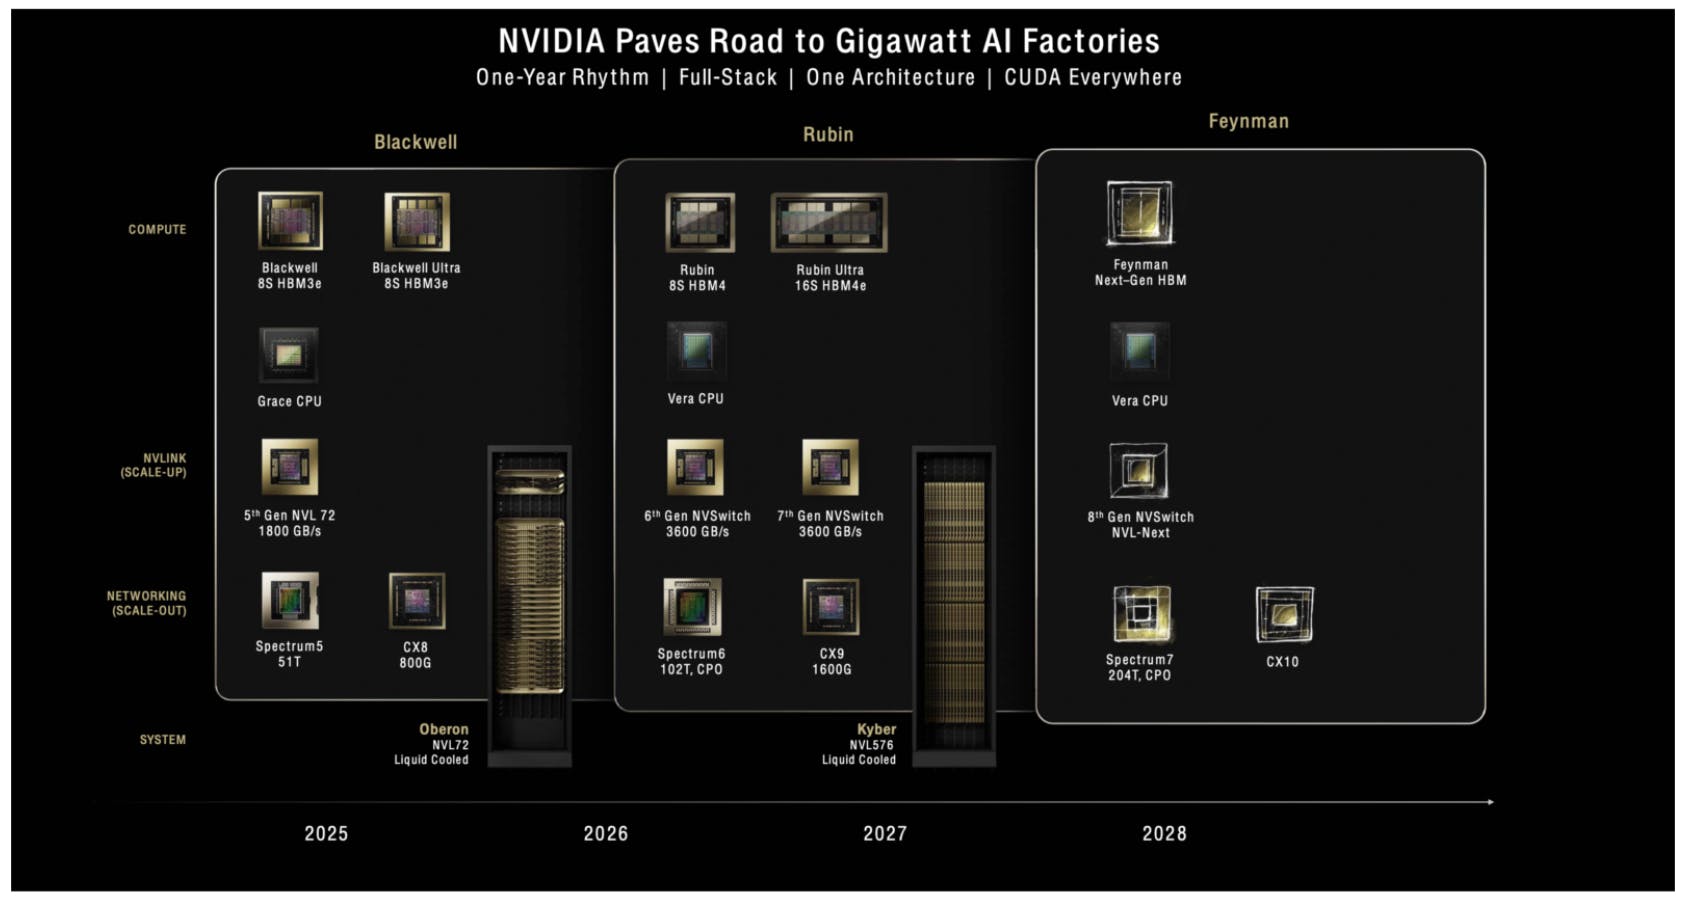
AppLovin Q3: Flexes Bottom Line Muscle; AXON Self-Service Platform is Ramping 

AppLovin beat on the top line with revenue growth of 68.2% YoY and 11.6% QoQ. Management guidance is for a slight acceleration for QoQ growth of 12.8% in Q4. Growth on the top line is disproportionately flowing to the bottom line with EPS growth of 91.2% this quarter and growth expected to be 65% next quarter. As a reminder, they divested their Apps business in Q2 2025. 

Just when you thought AppLovin’s Adjusted EBITDA could not get any better, it expands again 100 basis points QoQ to 82% and is expected to expand 50 basis points next quarter to 82.5% at the midpoint. As we’ve pointed out, this is the best EBITDA margin in the market (that I’m aware of). The cherry on top was free cash flow growing 92% YoY. 

The earnings call Q&A was focused on the AXON ads manager self-service platform that launched October 1st.  The goal is to quickly scale by offering a self-service interface for Applovin’s 1 billion reach and also help expand Applovin’ from gaming inventory only to also include e-commerce. Previously, Applovin was limited to the number of advertisers the company could manually on board.

Applovin operates in sharky waters as one of the only contenders over the past decade to challenge the walled fortresses of Meta and Google. There is a current SEC probe, which is detailed below. Although the fundamentals are exceptional, this stock is not for the faint of heart with wild swings in both directions.  

We look at this and more below!  

High Growth AXON Ad Engine Expands with Self-Service Feature 

Although very early and based on small numbers, management stated AXON’s self-serve feature is seeing strong traction with advertiser spend growing 50% week-over-week since the launch October 1st. This is invite-only, referral based demand in the e-commerce vertical with the platform expected to open up more broadly in early 2026. 

“While it takes a while for new customers to get going, to integrate, to learn how to use our system and to ramp spend, we're already seeing spend from these self-service advertisers grow around roughly 50% week-over-week. It's too soon to be significant, but this type of early growth gives us even more confidence that our platform will excel at being an open platform to any type of advertiser.” 

The company uses AI to increase conversion rates; this can be considered a catalyst for future growth if the company expands conversion rates for advertisers compared to competitors. According to management, the model continually learns for better behavior targeting and ad personalization. Generative-AI based creatives are also a feature being built out to generate more effective ads (also leading to higher conversion rates). An area where Applovin sets themselves apart is the 35 second ad creatives compared to 7 seconds on social, which could (presumably) also lead to higher conversions.  

According to management, improving conversion rates is a path to sustained growth: “We believe that giving our powerful recommendation engine, a more diverse set of advertisers to recommend will dramatically improve conversion rates, paving the way for elevated growth rates for years to come.” 

Overall, it’s important to remember that Applovin is demand constrained rather than supply constrained as they reach over 1 billion users. Therefore, opening up the AXON ad manager to more demand is the primary catalyst for the next few quarters.  

According to data from eMarketer shows encouraging signs from the e-commerce sector: clients including Wayfair, Ashley Furniture and Dr. Squatch are scaling six-figure daily budgets. eMarketer adds that early Axon adopters see “strong click-through and conversion rates,” with one brand increasing spend by >500% after testing Axon. 

Regarding the size of the AXON ad manager, APP has not disclosed customer count, yet management said they have hundreds of gaming and hundreds of e-commerce customers, or a “platform that might have 1,500 advertisers,” yet opening the platform up could help them scale to “hundreds of thousands of customers” in the long run.  

On the call, the following information was shared regarding AXON’s current size: “I think it was in Q1 was $11 billion plus of ad spend. And then the disclosures we've given you across web advertisers and gaming advertisers puts it in the low thousands. So you've got such a high amount of spend for such a low amount of advertisers across over 1 billion daily active users.” 

20% to 30% Annual Growth Baseline Hinges on Two Factors 

At Goldman Sachs’ Communacopia conference, APP executives dove deeper into the long-term growth framework provided in Q2, calling for a baseline 20% to 30% annual growth. Management explained that this hinges on two primary factors: reinforcement learning and continuous improvement on the ad engine, and opening the recommendation engine up to e-commerce and exposing it to a wealth of new demand.  

The update regarding 20% to 30% growth is the self-service platform could help exceed this baseline: “We're still believing very confidently in this 20% to 30% long-term growth rate in our core category. But even in the core, we're beating that. And then now you're layering on, on top of that, all this opportunity with the self-service platform” 

Management also hinted that the public launch of Axon and expanding to the e-comm vertical could help drive significant customer growth leading to a flywheel. This was expanded on during the earnings call: “And so you're building up a data set that doesn't just limit itself to the shopping category or the website advertising category. It helps enable better advertising for the gaming customers as well. So you put all those pieces together, and I'm really confident that we're not going to squeeze anyone in our platform. We're probably going to have expansion across the board as we add more demand density and get more data into the system.” 

AppLovin Facing SEC Probe 

AppLovin dropped ~14% last month on reports of an SEC probe into its data practices, following short-seller and whistleblower allegations that APP used “unauthorized” tracking—such as device fingerprinting—to support targeted ads in ways that may conflict with platform rules (e.g., Apple). These remain allegations; no findings have been announced. AppLovin declined to comment, stating it does not discuss potential regulatory issues. 

Financials: 

Revenue beat by 4.7% 

AppLovin reported strong revenue of $1.405 billion, beating analysts' estimates by a solid 4.7%. The company’s revenue grew by 68.2% YoY and 11.6% QoQ. The growth was primarily driven by the strong gaming advertising revenue, with management stating: 

“Our teams delivered multiple incremental lifts in our core models this quarter. And our MAX supply-side platform, one of the best indicators of our end market growth continues to grow at very healthy rates. We also opened up international traffic for advertisers promoting websites or shops in Q3 ahead of schedule.” 

Management has guided for a strong Q4 guide of $1.57 billion to $1.60 billion, representing a YoY growth of 58.6% and 12.8% QoQ. The Q4 guide beat the analysts' estimates by 2.3%. Looking forward, analysts expect revenue to grow 33.5% YoY to $7.45 billion in 2026 and 28.2% YoY to $9.56 billion in 2027. 

Management highlighted that the priorities include improving the models, onboarding flows, and continued AI integration, positioning the company to acquire a large volume of new advertisers in the future. “Our focus for Q4 and 2026 will be the following, with priority always given to improving our models for all advertisers. We'll continue tuning our onboarding flows and ramping more AI agents into the workflow to support a seamless experience for new advertisers. Once we're satisfied with the quality and experience, we'll open the platform broadly beyond referral basis. We'll be testing generative AI-based ad creatives.” 

Advertising Revenue Grew by 68% 

The company’s Q3 advertising revenue grew by 68.3% YoY to $1.405 billion. The ad revenue exceeded the management guidance by a solid 5.6%, primarily driven by strong gaming advertising revenue.  

Management guided advertising revenue of $1.57 billion to $1.60 billion, representing a YoY growth of 58.6% at the midpoint. Management stated that the guidance incorporates optimism around the e-commerce referral program, continued model enhancements, and the normal holiday seasonality.  

Operating Margin of 76.8% 

AppLovin’s margin expansion is truly outstanding, primarily driven by strong operating leverage. The company’s AI-powered advertising engine, AXON 2.0, launched in Q2 2023, serving as a game-changer that drove strong revenue and profits. The company’s operating margin has increased from 17.5% in Q2 2023 to a remarkable 76.8% in the recent quarter. 

During the Goldman Sachs Communacopia conference, management highlighted that additional costs can be expected with the e-commerce push. They stated: “So as we push into things like e-commerce, where we are going to see new costs that investors should be aware of are for things like API calls as we use LOMs for agentic customer support, campaign analytics and management.” 

  • Gross profits grew by a solid 72.2% YoY to $1.23 billion, with a gross profit margin of 87.6%. The gross profit margin was up 210 basis points YoY and down 10 basis points sequentially. 
  • Operating profits grew by 102% YoY to $1.08 billion, driven by solid operating leverage. The operating margin improved by 12.8 percentage points YoY to 76.8%. 
  • The net profits grew by 92.3% YoY to $835.55 million or a net profit margin of 59.5% compared to 52% in the same period last year and 65.1% in the previous quarter. 
  • Adjusted EBITDA grew by 79% YoY to $1.16 billion. The adjusted EBITDA margin was 82%, beating management guidance by 100 basis points. Management also guided a strong Q4 adjusted EBITDA margin of 82.5% at the midpoint. 

GAAP EPS grew by 91% 

The company’s Q3 GAAP EPS grew by 91.2% YoY to $2.45, primarily driven by strong operating leverage. The EPS beat the analysts' estimates by 2.6%. Analysts expect strong EPS growth to continue as they expect it to grow 65.3% YoY to $2.86 in Q4 and 85.2% YoY to $3.09 in Q1 2026. 

Looking forward, analysts expect EPS to grow 51.2% YoY to $13.80 in 2026 and 31.4% YoY to $18.12 in 2027. 

Free Cash Flow Grew by 92% 

The company has an exceptionally strong cash flow margin profile, primarily driven by strong profits.  

  • Q3 operating cash flows grew by 91.3% YoY to $1.05 billion with a margin of 75%, up 9.1 percentage points YoY. 
  • Q3 free cash flows grew by 92.4% YoY to $1.049 billion with a free cash flow margin of 74.7%, up 9.4 percentage points YoY. 
  • The company’s cash improved to $1.67 billion, up from $1.19 billion at the end of the previous quarter. While debt remained the same at $3.51 billion.  
  • The company repurchased and withheld approximately 1.3 million shares worth $571 million in Q3, which was funded by free cash flows. Over the last 3 quarters, the company has been able to reduce the outstanding shares from 346 million in Q4 2024 to 341 million this quarter. During the quarter, the Board of Directors increased the share repurchase authorization by an incremental $3.2 billion. The total outstanding authorization is $3.3 billion as of the end of October. 

Conclusion: 

The management team has accomplished an unimaginable feat over the past 1-2 years, yet their success has also attracted short seller scrutiny. What keeps us coming back on this stock is the exceptional fundamentals and the understanding that Applovin is disrupting a massive industry. Thus, the reward could outweigh the risk given management’s strong history of execution.   

Equity Analysts Damien Robbins and Royston Roche contributed to this analysis. 

Please note: The I/O Fund conducts research and draws conclusions for the company’s portfolio. We then share that information with our readers and offer real-time trade notifications. This is not a guarantee of a stock’s performance and it is not financial advice. Please consult your personal financial advisor before buying any stock in the companies mentioned in this analysis. Beth Kindig and the I/O Fund own shares in APP at the time of writing.

Recommended Readings:

Reddit Q3: Setting a High Bar with Top Line Strength and 10-point Sequential Margin Expansion

AMD Q3: The Catalyst is Expected in H2 2026, Could Ramp Sooner

Market Cycles, Not Headlines: What History Says About the 2025 Rally and What Comes Next 

Despite how it may seem, modern-day narratives rarely drive market swings. Tariffs, political headlines, niche trends like rare earth materials, or speculation about which company OpenAI partners with next — these stories dominate the news cycle, but they do not reliably move markets, as the consensus believes. If they did, investing would be much easier. 

Numerous well-known studies have come to this conclusion. One of the most famous is “What Moves Stock Prices?” by Harvard and MIT economists Cutler, Poterba, and Summers. Their goal was to model how news and macroeconomic events might predict stock market movements. To their surprise, they found that only about one-third of major price swings could be linked to identifiable news events.  

This finding was later reinforced by Yale economist Ray Fair in his groundbreaking paper, “Events That Shook the Market.” Fair examined major one-day movements in the S&P 500 from 1950 to 1999 in search of their causes. He concluded that neither news, earnings, nor data releases could explain most of these large jumps. As Fair put it, “It is difficult to find any news that corresponds to many of the largest daily changes in stock prices.” 

We’ve seen this phenomenon play out in real time. The COVID crash was perhaps the most striking example. Economic data went off the charts: 26 million Americans filed for unemployment within five weeks, as GDP fell 31.4% annualized — the steepest drop since World War II. Yet the stock market bottomed at the height of this deterioration and uncertainty, staging a V-shaped recovery that was impossible to justify by the data alone. 

There are many forces that shape markets — liquidity, growth, and monetary and fiscal policy among them. But there are also powerful, less tangible forces that economics struggle to explain. One of these is herd sentiment, which we explored in last week’s report, Decoding the S&P 500: When Human Sentiment Meets Artificial Intelligence

This week, we’ll turn to another underappreciated but potent influence on markets – cycles. Much like natural phenomena, financial markets move in rhythmic, repetitive patterns that can be observed, analyzed, and applied to better understand broader trends. 

Understanding market cycles is essential for anyone seeking to interpret market behavior beyond the noise of daily headlines. While news and data provide short-term context, the deeper rhythm of expansion, contraction, and renewal has repeated throughout centuries of market history. These cycles reflect the underlying forces of liquidity, sentiment, credit, and innovation that collectively drive long-term trends. By studying them, investors can gain perspective — identifying where we may be in the broader sequence of optimism and fear — and making decisions grounded in historical precedent rather than emotion. 

In this report, we will look at two dominant cycles that closely align with the price action in 2025. Both suggest a potential year-end rally, followed by the potential for volatility into Q1 of 2026. We’ll then line these cycles up with the broad market to outline what levels must hold, and what targets this uptrend is hitting, as we push higher. 

The Gann Cycle Framework: Predictable Rhythms Behind Market Movements 

The concept of market cycles gained mainstream attention through Neil Howe and William Strauss’s theory The Fourth Turning, which proposes that history unfolds in recurring 80–100-year cycles based on generational shifts. Each “turning” reflects a distinct societal mood—ranging from confidence and expansion to crisis and renewal—that repeatedly shapes political, economic, and market behavior. 

However, the study of cycles long predates Howe and Strauss. In 1862, economist Karl Juglar identified what became known as the Juglar Cycle—an 8 to 11-year rhythm of expansion and contraction that still appears in modern market data. Juglar’s work established the foundation for viewing markets not as random systems, but as recurring patterns driven by predictable phases of human and economic behavior. 

Decades later, W.D. Gann advanced this concept into one of the most comprehensive frameworks for understanding market structure. Gann demonstrated through decades of analysis that market movements often unfold in rhythmic, repeating patterns tied to both human psychology and natural law. His research suggested that the same behavioral and structural forces that shaped past bull and bear markets continue to influence markets today. 

Gann identified several “master cycles”—notably the 100-year, 90-year, 60-year, 52-year, 45-year, and 30-year cycles. At any given time, one or more of these cycles, as well as divisions of these cycles, tend to influence the prevailing market trend. He used these relationships to issue remarkably accurate forecasts, many of which have held up over time. 

While this may sound abstract, it holds historical merit. For example, 90 years back from the 1929 market top takes us to the end of the 1839 speculative boom, which ended in the Panic of 1839. Counting 90 years forward from 1929 brings us within months of the COVID top in 2020—an equally significant inflection point. 

Another example is Gann’s 60-year “Great Cycle.” When we overlay the S&P 500 from 1962 onto today’s market starting in January 2022, the patterns align with remarkable similarity. While cycles can invert or distort temporarily, they consistently identify key inflection points and general directional bias. 

Chart showing how the S&P 500 (SPX) from 2022 to 2025 aligns with the 60-Year historic market cycle

How the S&P 500 (2022–2025) Aligns with the 60-Year Historical Market Cycle 

Chart by I/O Fund

Because sentiment moves in waves, the emotional extremes of fear and greed remain timeless. While technology, policy, and liquidity conditions evolve, the human response to opportunity and risk does not. Even if equities rise in 2025 on optimism surrounding AI, investor psychology mirrors that of prior generations—driven by the same patterns of exuberance and denial.  

To see how these long-term cycles manifest in real markets, let’s look at two historical periods that mirror 2025 with uncanny precision. 

With this in mind, we examined historical precedents for 2025—a year defined by a rapid 20% decline in Q1 that erased nearly all of 2024’s gains, followed by a strong seven-month rally with limited pullbacks. These conditions—a liquidity shock followed by a sharp rebound—are rare. Over two centuries of data, only two market periods fit this mold: 1980 and 1998. Interestingly, both align with significant Gann cycles—the 45-year (half of the 90-year) and the 26-year (half of the 52-year) cycles. 

To summarize: History may not repeat — but it often rhymes. 

The 45-Year Market Cycle: How 1980’s Policy Shock Is Repeating in 2025 

The market in 1980 has a striking resemblance to what we’ve seen unfold in 2025. In both periods, a swift and unexpected policy shock triggered a sudden liquidity event that sent markets sharply lower, followed by a rapid V-shaped recovery that defied expectations. 

In early 1980, the Federal Reserve—newly under the leadership of Paul Volcker—launched an aggressive campaign to control inflation. The Fed pushed interest rates to nearly 17% in February, an unprecedented move that instantly drained liquidity from the system and sent equity markets into a sharp correction. 

prompt

Similarly, in early 2025, the executive branch imposed an unexpected increase in tariffs, creating a sudden liquidity squeeze that rippled across U.S. markets. The February decline that followed erased much of the prior year’s gains in a matter of weeks. 

In both years, the shock proved temporary. Political pressure and a seizing credit market forced Volcker to reverse course in 1980, cutting rates back to roughly 9 percent. The result was an eight-month recovery that lasted through late November. Likewise, in 2025, just days after Liberation Day, the bond market began a disorderly unwind that pushed yields higher than the government could sustain. The policy reversal that followed restored liquidity and fueled a seven-month rally that continues today. 

If this historical rhythm continues to guide market behavior, the current advance could extend through December, leading to a secondary high in mid-January followed by a period of elevated volatility into the second quarter of 2026. 

S&P 500 (SPX) long-term chart showing how the current stock market rally aligns with the 45-year market cycle from 1980

How the S&P 500 in 2025 aligns with the 45-year cycle

Chart by I/O Fund

The 26-Year Market Cycle: How 1998’s Global Crisis Echoes Through 2025’s Rally 

When we align the 26-year cycle with the 2025 decline, the parallels are difficult to ignore. The 1998 correction was sparked by a sudden global liquidity crisis that rippled through international markets. It began with the Asian Financial Crisis, as currencies in Thailand, Indonesia, and South Korea collapsed under the pressure of capital flight. The shock then spread to Russia, which defaulted on its domestic debt, setting off a global contagion. 

One of the largest casualties was Long-Term Capital Management, a highly leveraged hedge fund managed by Nobel laureates and veteran Wall Street traders. As LTCM’s positions unraveled, liquidity evaporated across credit markets. Within two months, U.S. equities had dropped roughly 20 percent, forcing the Federal Reserve to intervene and backstop the system. 

The Fed’s swift action reignited risk appetite, setting off one of the most powerful rallies in modern market history. Fueled by speculation about the transformative potential of the internet, investors poured into technology and growth stocks, propelling the market into the final and most euphoric phase of the dot-com boom. 

While today’s AI leaders—such as Nvidia—are built on far stronger fundamentals than the speculative favorites of 2000, like Cisco and Pets.com, the behavioral pattern is strikingly similar. Both eras were defined by optimism surrounding an emerging technology with vast, untested potential and by investors’ willingness to price in future revolutions before they materialized. 

If this 26-year cycle continues to guide the market, the current uptrend could extend through December and into the first quarter of 2026 before encountering the first meaningful correction. Unlike the 45-year cycle, however, this correction would likely be brief—more of a consolidation within a broader advance that carries into late 2026. 

S&P 500 (SPX) long-term chart overlaying the current market rally with the 26-year market cycle from 1998.

How the S&P 500 aligns with the 26-year cycles (1998) 

Chart by I/O Fund 

Interestingly, both cycles suggest continued strength into December, and both cycles suggest some period of volatility in Q1 of 2026. What separates the two is how far this uptrend pushes into Q1. While the 45-year cycle suggests a top in mid-December and lower high into mid-January, the 26-year cycle suggests a continuation of the aggressive uptrend into mid-Q1 of next year before seeing a small period of volatility.  

Broad Market Levels 

If we take the general direction of the above cycles and place it within the context of developing price patterns, there are two counts that best fit: 

Subscribe for Free Below to see our updated game plan, which includes:  

  • The two scenarios we are tracking that best fit the potential cycles discussed in this report.  
  • Critical support levels that must hold for a year-end rally to continue.  
  • What the overhead targets are if we do see a rally into year-end.  

One of these scenarios is starting to take shape — read this timely analysis below. 

  • Blue – We are in the final swings of the rally off the April 2025 low. As long as any weakness holds SPX 6,552.50 – 6345, then we should see this rally continue into year-end, before seeing any notable volatility unfold into Q1 of 2026.  
  • Green – This path follows the blue path above. The difference is that the Q1 period of volatility will likely only be a correction within a larger uptrend, which would then continue into 2026.  
S&P 500 (SPX) long-term chart showing the I/O Fund’s analysis of the current stock market rally and what levels to watch for Q1 2026.

S&P 500 Elliott Wave Outlook: Key Scenarios Into Year-End 2025 and 2026 

Chart by I/O Fund 

In conclusion, as with all cyclical analysis, no one can say with certainty why a particular cycle takes hold or how long it will remain dominant. Markets often follow one rhythm until it loses influence, at which point a new cycle emerges and becomes the primary driver. The task for us as analysts is to identify which cycle is in control and the conditions that will sustain it. 

At this stage, the 45-year and 26-year cycles appear to be the prevailing forces. As long as the SPX holds between 6,552.50 and 6,345 on any near-term weakness, the market is likely to continue tracking these patterns, both of which point toward the potential for continued strength into year-end. 

Last week, Beth Kindig spoiled I/O Fund Members with a 43+ page report on the Top 15 AI Stocks for Q4 2025Top 15 AI Stocks for Q4 2025.  This in-depth report ranks 15 key stocks that are leading the three most powerful trends in AI with many lesser-known names. Not one FAAMG made the list. Last quarter’s report highlighted Bloom Energy, a stock up over 800% from our April buys.  Learn more here

Please note: The I/O Fund conducts research and draws conclusions for the Fund’s positions. We then share that information with our readers. This is not a guarantee of a stock’s performance. Please consult your personal financial advisor before buying any stock in the companies mentioned in this analysis.

Recommended Reading: