Talen Energy: Acquisitions May Unlock Data Center Deals, Amazon Ramping Soon 

Talen is an independent power producer with more than 10GW of generation capacity with 2.2GW of that being nuclear. The company’s assets are primarily located in Pennsylvania, Maryland and now Ohio, yet data center regions and capacity are growing including a long-term power purchase agreement with Amazon to fuel data centers in Pennsylvania.

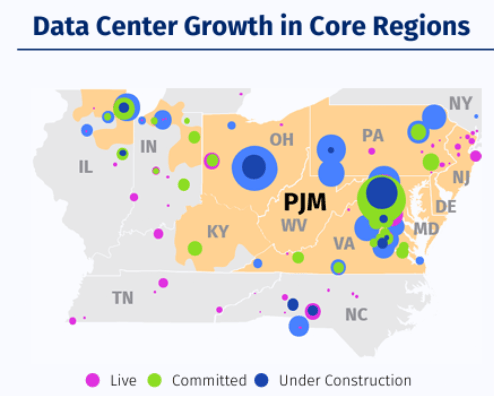
Talen is expanding its power production portfolio with recent acquisitions of two combined-cycle gas turbine (CCGT) plants, Freedom Energy Center and Guernsey Power Station, for ~$3.8 billion. The two plants will add 2.8 GW to Talen’s energy assets in the PJM region – both are suitable for hyperscale data center power supply. This comes at a time when data center construction is surging in PJM’s region as its grid faces increasing strain, meaning the plants could be more valuable for meeting near-term hyperscaler power needs.

While Talen is inherently higher-risk having emerged from Chapter 11 bankruptcy in 2023 with a significantly reduced balance sheet, its cash balance has returned to extremely thin levels. On the flip side, the company expects strong cash flow generation to support rapid deleveraging, with substantial upside possible from its Amazon PPA and potential future data center deals. To first set the stage of why Talen is positioned well to power future AI data centers, it’s crucial to cross-examine strong construction activity in the region and the health of PJM’s grid.

Strong Growth in Data Center Buildouts in Data Center Alley, Pennsylvania

The data center market in the US remains heavily constrained as high levels of demand are outstripping surging supply, even as data center construction reached $40 billion annualized in June, up 30% YoY and a new record. In Northern Virginia, the so-called ‘Data Center Alley’ accounting for ~35% of total hyperscale data centers worldwide, demand and construction activity signals remain robust.

Data from CBRE showed that in the first half of 2025, data center capacity under construction in the region rose 80% YoY to nearly 2.1GW, or 35% of new construction activity across primary and secondary markets.

Available capacity in Northern Virginia was just 25MW, with the vacancy rate shrinking to just 0.7%, down 0.8 points YoY, signaling a very strong demand environment. Rental rates were estimated at $190 to $235/kW/month, above the primary market average of $188.75/kW/month, also indicative of strong demand.

Pennsylvania, while a smaller market versus Data Center Alley, has seen rapid growth in data centers over the past few years. A report from data center intelligence firm DC Byte estimated that the state’s data center capacity has surged nearly 34X since 2021 from 0.23 GW to over 7.8 GW, with the majority of this growth coming in the last year alone.

There have also been a handful of large-scale investments in the state – Google this summer announced a $25 billion investment over the next two years for data center infrastructure, while Blackstone also announced a $25 billion investment to build out data center and energy infrastructure. Additionally, Pennsylvania Data Center Partners and PowerHouse Data Centers are constructing a 1.35 GW hyperscale data center facility, expandable up to 1.8 GW, adding significant capacity to the state.

This strong demand and construction environment is coming head-to-head with a PJM grid that is at increasing risk of shortfalls as early as next year.

PJM Grid Sees Sharp Capacity Crunch, Facing Large Data Center Load Growth

Come 2026, PJM’s grid is expected to be at elevated risk of shortfalls during extreme conditions, per NERC. This is something the grid operator is well aware of, having stated before that they have been “warning for over two years of the prospect that parts of our country could run short of power during high demand periods.” Board Chair Mark Takahashi repeated in December 2024 that a shortfall “could emerge as early as the 2026/2027 delivery year.”

To understand why this is important, consider the high concentration of data centers in Northern Virginia plus the strong construction activity in the region. Companies looking to build new data centers in PJM’s grid – either in Virginia, Pennsylvania, Ohio or surrounding states – may struggle to get power in a timely manner.

For example, a survey conducted by Bloom Energy found that hyperscalers and developers expect to have power delivered to data centers by 2027 in Northern Virginia, though utilities do not expect to be able to deliver power until 2028 on average. Even back in 2024, Bloomberg reported that utility Dominion Energy said >100MW data centers in Virginia were facing up to seven year wait times for new connection hookups.

The 2026/27 base residential auction (BRA) this summer reaffirmed that the grid remains in a tight spot, with a handful of more concerning trends seen this year. Generation capacity offered in this year’s auction declined for a fifth consecutive year, with just 135.2GW offered, down from a peak of 183.6GW in the 2021/22 auction. As such, uncleared capacity shrunk to just 800 MW, down from a peak of more than 22GW in 2022/23, indicating the supply/demand balance has rapidly tightened rapidly over the last two years.
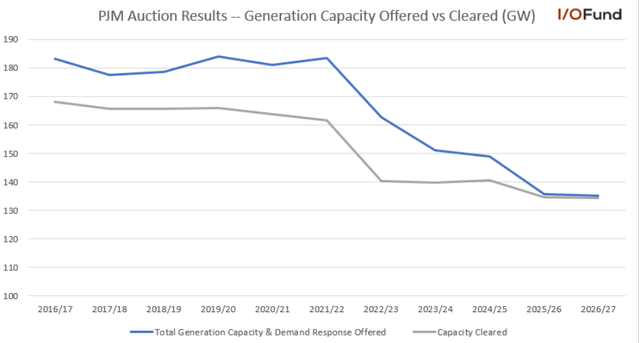
This built on similar trends from the 2025/26 auction, which saw supply/demand tighten, with POWER Mag saying that a “major driver behind the market imbalance is unforeseen demand growth from data centers and industrial electrification.” Talen provided a brief look ahead to the 2027/28 auction, noting there is potential for further tightening, as the auction parameters “‘include ~6 GW demand increase vs expectation of ~4 GW in incremental supply.”

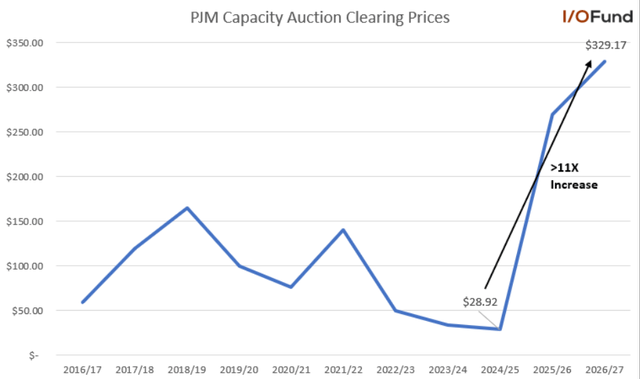
Because of the rapid tightening in power supply, clearing prices have surged, to the tune of 11X over the past two years. Much of this arose in the 2025/26 auction, where clearing prices jumped 833% from $28.92/MW-day to $269.17/MW-day, reaching the annual cap. The 2026/27 auction saw prices once again hit the FERC-approved cap at $329.17/MW-day, a 22% YoY increase.
Skyrocketing power prices and elevated risk of grid shortfalls from a fifth consecutive year of declining supply puts major emphasis on adding new capacity to the grid. This is especially important when considering the increasing load from data centers. PJM reported in August that it's long-term projected load growth from 2024 through 2030 would be 32GW, with 30GW of that coming from data centers, assuming many data center projects materialize on time.

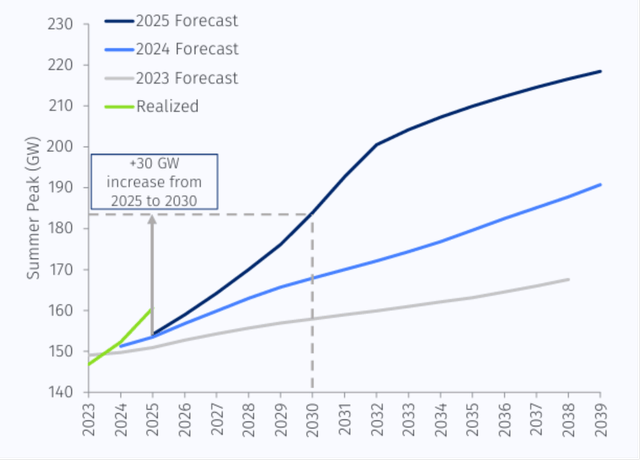
PJM’s 2025 forecast projects peak summer load at nearly 184 GW by 2030, up 30 GW from 2025’s peak forecast of 154 GW. Much of this growth is coming from PJM West, or Ohio, western Pennsylvania, western Virginia, with some additional growth in eastern Pennsylvania – primary regions where Talen’s assets are located.

However, the problem here is that PJM’s forecasting has recently underestimated peak demand growth, even with significant upward revisions over the last few years. For example, realized peak demand is already approaching 160 GW, nearly two years ahead of current forecasts, and if data center builds progress at current (or accelerated) paces, peak load may continue to outpace forecasts through 2030.
Source: Talen

This raises the risk that peak growth may continue to outpace PJM’s baseline projections, and could require additions well beyond 30 GW of new generation capacity, net of plant retirements, to meet load growth and reduce risk of shortfalls. Talen’s opportunity surfaces here as it is acquiring two new plants with 2.8 GW of capacity that could be prime targets for data center supply in two of PJM’s highest load growth regions.

Freedom and Guernsey Acquisitions May Expand Data Center Opportunities

While Talen has already made its first foray into colocating power and data center infrastructure at its Susquehanna nuclear plant in Pennsylvania (discussed more below), the company announced the acquisition of two combined-cycle gas turbine (CCGT) plants that may expand its presence in powering AI data centers. These assets could prove to be valuable to Talen as the two combined could help meet ~10% of estimated data center load growth in PJM’s grid through 2030, and Amazon’s deal economics suggest both combined could be worth easily more than $1 billion in annual revenue in a hyperscaler PPA.

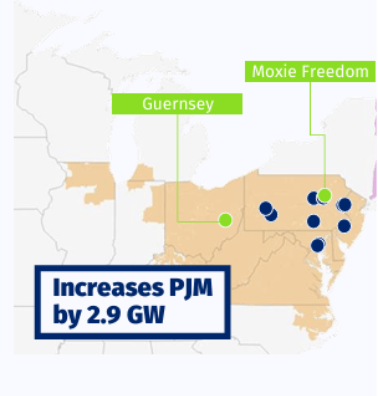
Talen signed definite agreements in July to acquire Caithness Energy’s Moxie Freedom Energy Center (Freedom) in Pennsylvania and Caithness Energy and BlackRock’s Guernsey Power Station (Guernsey) in Ohio. The two CCGT plants will boost Talen’s portfolio by nearly 2.9 GW, with 1.84GW at Guernsey and 1.05GW at Freedom.

The transaction is valued at $3.8 billion gross, or $3.5 billion net after estimated tax benefits, expected to close in Q4 pending regulatory approval. Talen says the purchase price is an “attractive” multiple of 6.7x 2025 EV/EBITDA for the plants, or $1,300/kW, which it believes is a “material discount to current new-build CCGT costs.” This is around 35% cheaper to recent new build costs of ~$2,000/kW, per GridLab.

Talen believes the two new plants will facilitate service to data center loads, being located in close proximity to major new buildouts in northeast Pennsylvania and Columbus, Ohio, as seen in the diagram below. The two sites are capable of supporting gigawatt-scale buildouts based on generation capacity, and both could be attractive to hyperscalers and developers as gas turbines are increasingly popular to meet near-term AI data center power needs.
Source: Talen

Talen has provided some color on the synergies the plants will provide and how it is funding the transaction. Once integrated, Talen expects both the plants to be immediately accretive to free cash flow, by over 40% in 2025 and >50% through 2029.

On the flip side, Talen has issued ~$3.8 billion in new debt across various methods to fund the purchase and refinance some existing debt, which would more than double its pro-forma net debt to $6.56 billion. The company drew $1.2 billion in a term loan, upsized its revolving credit facility and stand-alone credit facility by $200 million each to $900 million and $1.1 billion, and priced $1.4 billion in senior notes due 2034 and $1.29 billion in senior notes due 2036.

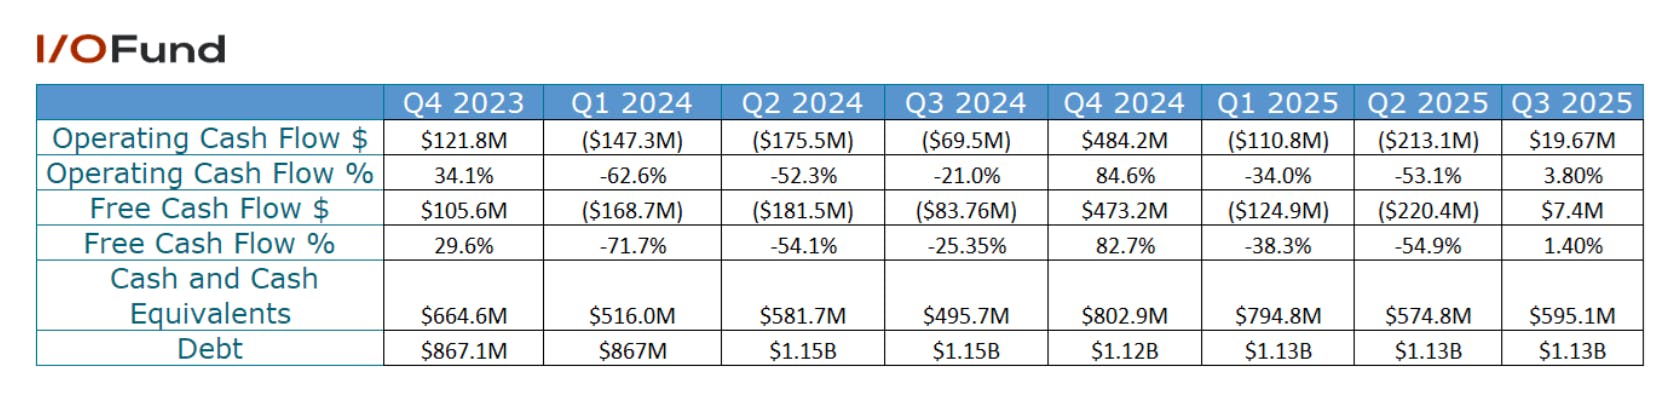
Although the company expects strong free cash flow generation to allow it to rapidly deleverage this debt and reach a <3.5X net leverage ratio by year-end 2026, the high indebtedness raises risks substantially as cash has declined nearly $1 billion over the past year to just $135 million.

$18 Billion, 17-Year Power Purchase Agreement with Amazon in Pennsylvania

Talen’s sole AI ties presently are to Amazon, having expanded and signed a 17-year power purchase agreement through 2042 to power the hyperscaler’s data center adjacent to the Susquehanna plant, and potentially other facilities in the Pennsylvania region.

Talen signed the 1.92 GW agreement worth $18 billion in June, and expects to deliver the first 240MW by mid-2026 and scaling up in 120MW phases through mid-2028 to reach 480MW at a minimum. Full volume is expected to be reached no later than 2032.

Economics of Amazon’s Deal

At face value, the Amazon deal is worth more than $1 billion in average annual notional revenue to Talen, though it will take up to seven years to reach full volume. Talen has provided a glimpse into how the deal will accrete to FCF in the ramp stage:

  • FY25 FCF estimated to be $0.70 per share with 120MW delivered.
  • FY26 FCF estimated to rise ~121% to $1.55 per share, before rising at a ~27% annually to $2.50 per share by FY28
  • FY29 FCF estimated to rise between 60% to 130% to $4.00 to $5.75 per share, with anywhere between 840MW to 1,200MW delivered. Reaching the upper end of this range would require Talen to accelerate the ramp significantly and likely reach 960MW by 2028.
  • By FY32, when the plant ramps to full volume, Talen expects FCF in the range of $7 to $8.25 per share.

35% Free Cash Flow CAGR Supports Debt Deleveraging

A key highlight for Talen’s financials is the strong free cash flow growth the company is targeting over the next few years, driven in part by the Amazon deal and the PJM auction pricing. The major downside is the recent CCGT acquisitions have substantially boosted debt, with Talen’s pro-forma debt-to-equity ratio sitting around 5.3X.

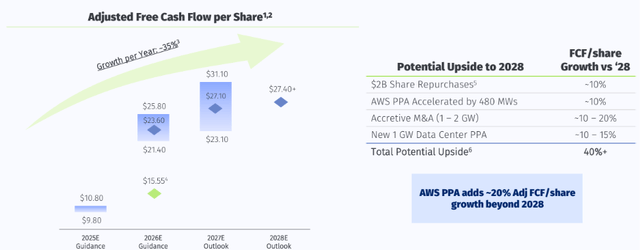
Talen is targeting adjusted free cash flow growth at a >35% CAGR through fiscal 2028, rising from $10.30 per share at midpoint in fiscal 2025 to more than $27.40 per share, with room for significant upside to that terminal target.

In FY26, Talen is guiding for $21.40 to $25.80 in adjusted free cash flow per share, up 129% YoY at midpoint, and a significant 52% increase from its February guidance for $15.55 per share. For FY27, Talen is projecting $23.10 to $31.10 in adjusted FCF per share, up 15% YoY at midpoint. FY28 adjusted FCF is seen increasing marginally to $27.40 at midpoint, though Talen identified multiple outlets for additional upside to the mid to high-$30 per share range.

For example, if Talen fully executes its $2 billion share repurchase plan by 2028, this is expected to add ~10% upside to adjusted FCF, or ~$2.74 per share. If Talen accelerates the delivery of its Amazon colocation to 960MW by 2028, this could provide another 10% potential upside, while its recent acquisitions could provide 20% to 35% upside, with the higher range stemming from a potential 1 GW data center PPA.
Source: Talen

To put in perspective why this free cash flow generation is important, Talen’s pro-forma net debt would be approximately ~$144 per share, with adjusted FCF generation through FY27 covering about 40% of that at the high end of this projected range. Considering debt does not begin to mature until 2030, Talen has a long runway and strong visibility into cash flows that will help it deleverage this debt load.

EOS Energy Partnership

Talen and battery energy storage startup EOS Energy partnered earlier this week to combine EOS’ Z3 battery tech with Talen’s assets in Pennsylvania, to promote grid reliability, increase capacity utilization from existing energy assets, and help meet growing demand from AI data centers.

The two are reportedly currently working to “identify and develop multiple storage projects” across Pennsylvania totaling multiple GWh of capacity. The two have not provided a timeline on when projects would begin deployments, but considering EOS is still ramping production up to an annualized rate of 2 GWh of capacity by year-end, this may be more of a medium-term story.

Battery storage systems are emerging as a suitable answer for reliability and backup power for AI data centers, especially as grid strain increases. Storage systems help reduce reliance on the grid and ensure reliable backup power is available is times of disruption, including outages or inclement weather.

Financials

Q2 Revenue grew by 29% YoY

Talen’s Q2 revenue rose 29% YoY and 62% QoQ to $630 million, positively impacted by a $176 million gain on derivatives (compared to a $76 million gain in the year ago quarter). Revenue from contracts with customers was $409 million, up 18% YoY but down (-37%) QoQ. This shows the quarterly fluctuations that can stem from commodity contract hedging. For the first half of the year, Talen’s revenue was $1.02 billion, up 2% YoY, though revenue from customer contracts was $1.06 billion, up 40% YoY.

  • Capacity revenue grew by 91% YoY to $88 million in Q2, primarily driven by a $60 million increase due to higher cleared capacity prices through the PJM BRA for the 2025/2026 capacity year, partially offset by a (-$18 million) decrease due to lower volumes cleared through the BRA.
  • Energy revenues were flat YoY at $366 million. However, with a net of Fuel and Energy Purchases it had a $12 million favorable increase. It was primarily due to the combined effects of $70 million increase in margin associated with electric generation and ancillary revenue, primarily due to higher realized prices received at Susquehanna and the PJM fossil fleet, partially offset by lower generation volumes at Susquehanna and lower ancillary revenues; and $10 million increase in realized hedge results. It was partially offset by a (-$68 million) decrease in digital revenue and Nuclear PTC revenue.

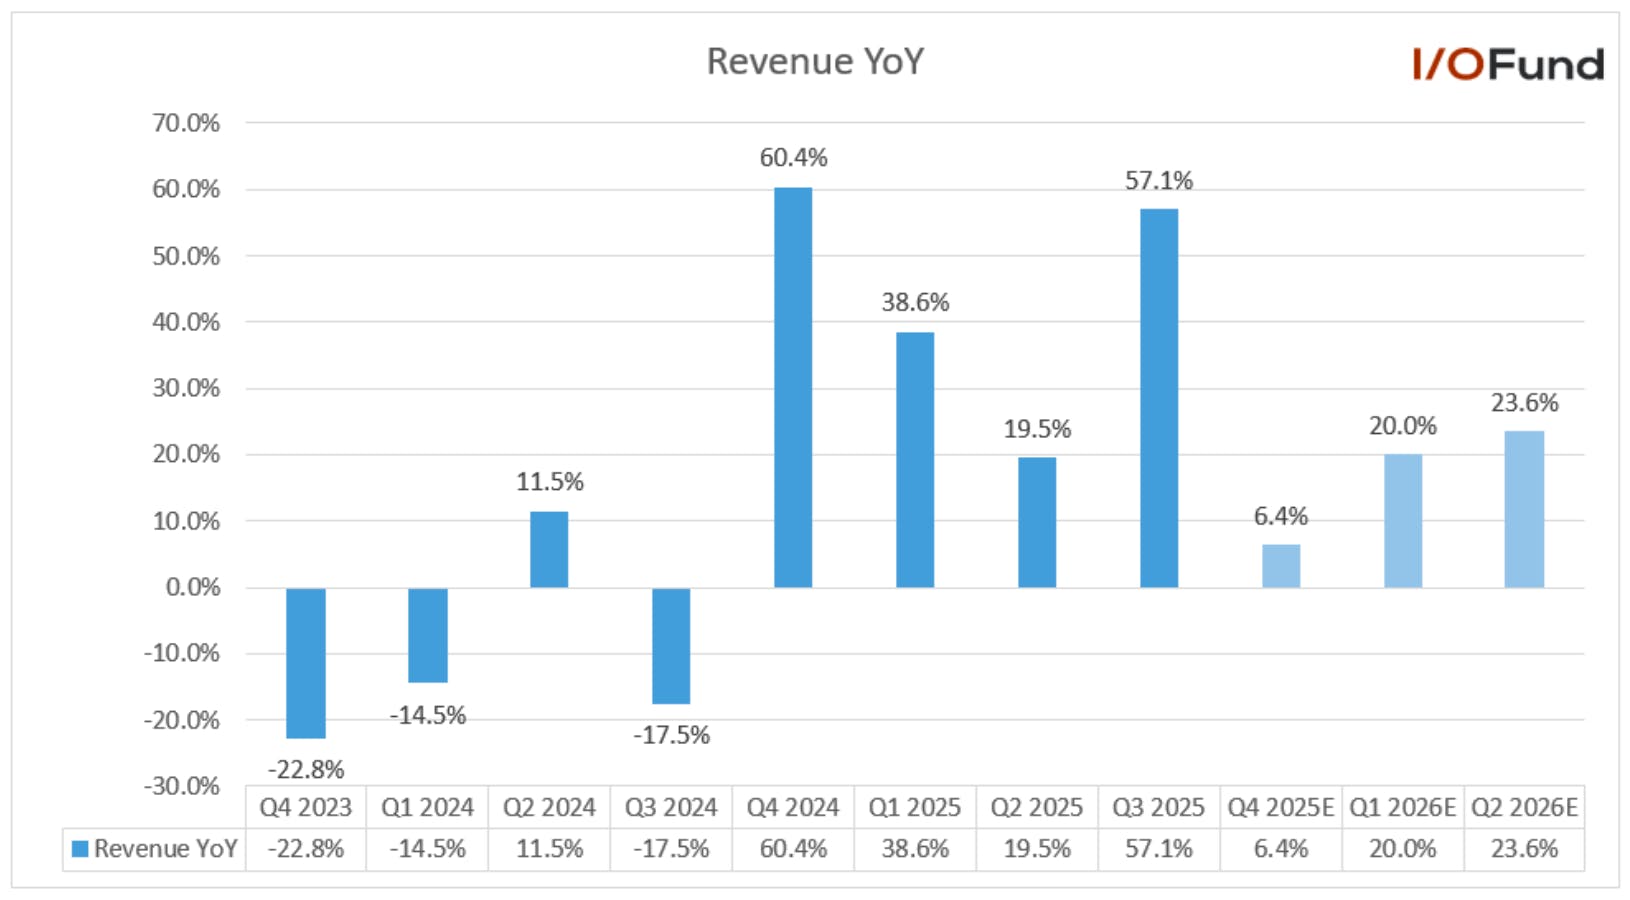
Analysts expect revenue to grow 8.9% YoY to $707.9 million in Q3 and then accelerate to 53.4% growth in Q4 and 184.5% growth in Q1 2026.
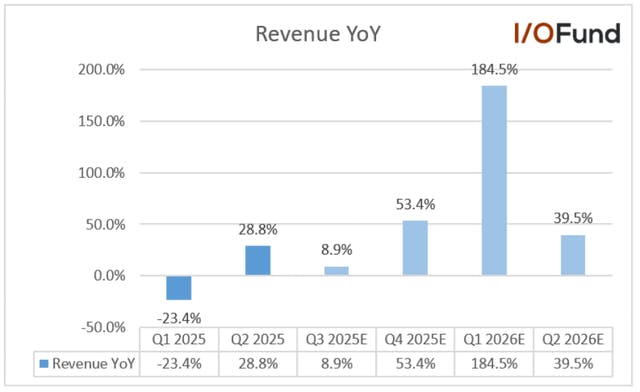
Analysts expect 2025 revenue to grow by 11.4% YoY to $2.36 billion and accelerate to 69% growth in 2026 to $3.98 billion. During the recent Investor Day, management provided guidance for Energy revenue to be $2.89 billion in 2026, with more visibility arising from the BRA auction where Talen cleared 6.7GW translating to $805 million in Capacity revenue for the planning year from June 2026 to May 2027. As a result, Talen expects 2026 Capacity revenue of ~$747 million, up ~124% from $333 million projected in 2025; combined with Energy revenue, this gives visibility to $3.63 billion in revenue.

Margins

Talen’s gross margin (operating revenues including derivatives minus energy expenses) was 60% in Q2, down from 64% in the year-ago quarter due to unrealized losses from derivative instruments compared to an unrealized gain in the same period last year.

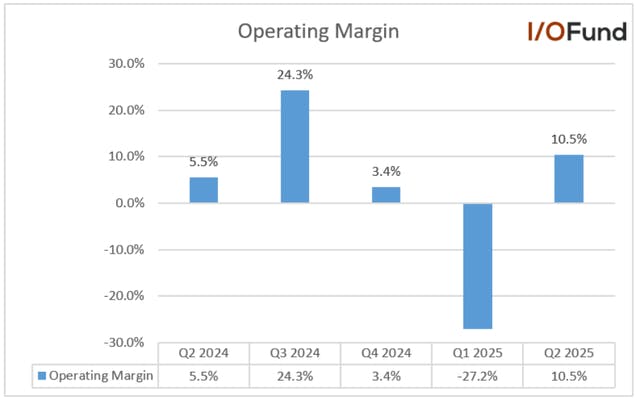
The Q2 operating margin was 10.5%, up from 5.5% in the same period last year, as the general and administrative expenses were flat. However, it was negatively impacted by higher maintenance expenses at the Susquehanna facility during its planned annual spring refueling outage.

Net margin was 11.4% in Q2, which does not compare with the asset-sale-impacted margin of 92.8% from the year-ago quarter. Q1’s net margin was (-34.6%), dragged down by derivatives.
Q2 adjusted EBITDA grew by 3.4% YoY to $90 million or an adjusted EBITDA margin of 14.3% compared to 17.8% in the same period last year. It was lower due to higher maintenance expenses at the Susquehanna facility during its planned annual spring refueling outage.

During the recent Investor Day held in September, management guided that 2025 adjusted EBITDA would be at the lower end of its previously guided range during the Q2 results of $975 million to $1,125 million, due to lower market opportunities in July and August than initially expected.

Management increased the adjusted EBITDA guidance for 2026 during the recent investor day, primarily due to the synergies from the Amazon deal. Management has guided the 2026 adjusted EBITDA to $1.9 billion at midpoint, an increase of approximately $600 million from the prior 2026 outlook given in July.

For 2027, management expects adjusted EBITDA in the range of $1.79 billion to $2.29 billion, representing a 7.4% YoY increase at the midpoint of $2.04 billion. For 2028, it expects to be above $2.06 billion, implying continued growth momentum.

EPS to surge in 2026

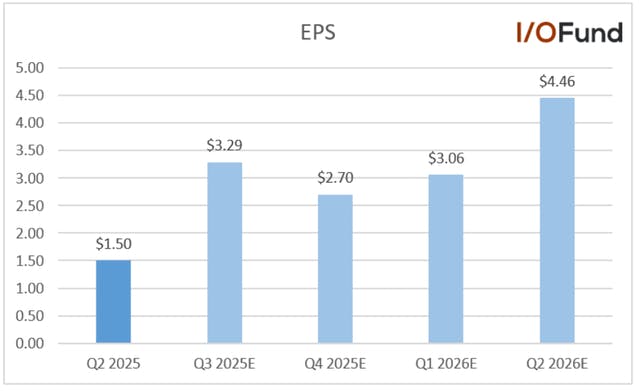
Talen reported GAAP EPS of $1.50 in Q2, rebounding from ($2.94) in Q1, which was down due to sharper losses on commodity contracts. This is also not comparable to the year-ago quarter, where Talen reported $7.60 in EPS, as this included an approximate $9.40/share benefit from the sale of its Cumulus data center to Amazon.

Analysts expect Q3 EPS to be down (-0.2%) YoY; however, it will be up by a solid 120% sequentially to $3.29, then accelerate to 49.3% YoY growth to $2.70 in Q4.

For fiscal 2025, Talen is expected to report $5.45 in GAAP EPS, signaling a strong second half of the year, with 2026 EPS projected to surge 269% YoY to $20.71.
Cash Flow Guidance Points to Strong 2H Despite Softer View

Talen’s operating cash flow was (-$184 million) in Q2 for a (-29.2%) margin, bringing 1H operating cash flow to (-$65 million) for a (-6.4%) margin, down from $150 million for a 15% margin in the year-ago period.

Adjusted FCF was (-$78 million) in Q2 for a (-12.4%) margin, with 1H adjusted free cash flow of just $9 million. Talen updated during the recent Investor Day that they expect its adjusted free cash flow to come at the lower end of the guidance range of $450 to $540 million for the year, primarily due to lower market opportunities in July and August compared to its initial expectations at the end of Q2. However, it still implies that it will be significantly stronger in the second half of the year.

For fiscal 2026, Talen is guiding adjusted free cash flow in the range of $980 million to $1.18 billion, more than doubling YoY, and for fiscal 2027, adjusted FCF of $1.055 billion to $1.425 billion. This would represent about 175% growth in two years or a compound annual growth rate (CAGR) of 66%.

Talen’s cash balance is extremely thin at $135 million versus its reported debt at $3.02 billion in Q2. However, pro-forma debt is much higher at $6.56 billion, including $3.8 billion for the acquisitions of the Freedom and Guernsey plants.

Management sounded optimistic on future cash flow generation during the Investor Day and increased the share repurchase authorization by $1.0 billion to $2.0 billion and also increased expiration by two years to December 31, 2028.

Valuation

Talen is trading just off peak multiples on the top-line at 7.4x forward revenue, more than 2x its average multiple of 3.6x but below its recent peak of 8.6x from early October. On the bottom-line, Talen trades at 70.5x estimated FY25 EPS, again just below peak levels, but for FY26 EPS, Talen trades at a more reasonable 19.1x multiple, far below its peak 1-year forward multiple of nearly 41x.
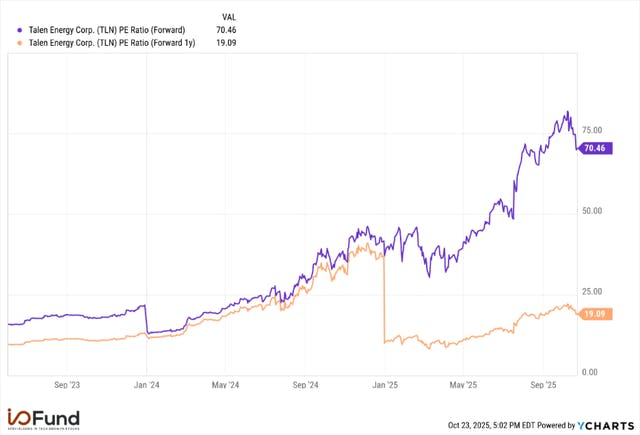
On an adjusted FCF basis, Talen trades at 18.8x FY26’s adjusted FCF per share guidance of $23.60 at midpoint, versus 43.1x FY25’s adjusted FCF of $10.30 at midpoint. Talen is quickly growing into this multiple with rapid FCF growth next year and additional growth opportunities arising in 2027 and 2028.

Notable Risks

Talen has a thin balance sheet with substantial debt, and has launched multiple financings via term loans, revolving credit facilities and senior notes to fund its recent acquisitions, though it still may need more cash over the next few quarters. The Amazon deal does de-risk the future growth story by locking in substantial revenue and free cash flow growth, but not for its immediate-term cash needs.

Talen had emerged from Chapter 11 bankruptcy in 2023 with a significantly reduced balance sheet, though its cash balance has returned to extremely thin levels; the Amazon deal beckons a strong ramp in FCF that may be able to pad the balance sheet in the future.

Conclusion

Talen is inherently higher-risk with thin cash and now elevated debt following its two plant acquisitions, though it expects strong, visible cash flow generation to allow it to quickly deleverage said debt. Talen is aiming to ramp to 480MW for Amazon’s data center by 2028 with the potential to accelerate that delivery to 960MW, providing more upside to cash flows and revenue if this materializes. The Freedom and Guernsey plants could command similarly valuable data center opportunities with key positioning near high-growth data center regions alongside with rising stress on PJM’s grid.

Please note: The I/O Fund conducts research and draws conclusions for the Fund’s positions. We then share that information with our readers. This is not a guarantee of a stock’s performance. Please consult your personal financial advisor before buying any stock in the companies mentioned in this analysis.

Recommended Reading:

RIOT Q3 EARNINGS: CONSTRUCTION BEGINS ON CORSICANA FOR 112MW

APPLIED DIGITAL Q1: ACTIVE PIPELINE TRIPLES IN TWO QUARTERS TO 4.3GW, SECOND HYPERSCALER DEAL SECURED

APPLIED DIGITAL: BITCOIN MINER HINTING AT RARE, HYPERSCALER DEAL

BLOOM ENERGY: FUEL CELLS FOR THE BOOMING AI DATA CENTER TREND

AMD Q3: The Catalyst is Expected in H2 2026, Could Ramp Sooner
AMD’s bigger moment was intra-quarter when the OpenAI deal was announced, as it’s a clear signal the company is able to grab the attention of AI’s leading development firm. According to Lisa Su, the 6GW deal is expected to amount to “generate well over $100 billion in revenue over the next few years.”  

However, as noted in July’s Top 15 Report, “the risk to AMD is primarily in Q2’s data center growth decline, and how quickly the company can ramp its MI355s and subsequent MI400s while in the midst of Nvidia’s large shadow – will we see a solid surprise arrive in Q3, Q4 or even into next year? My best guess is the most meaningful AMD moment is not likely to occur during Blackwell’s NVL72s release – I think 2025 belongs to Nvidia and somewhere between 2026-2027 we switch it up.” 

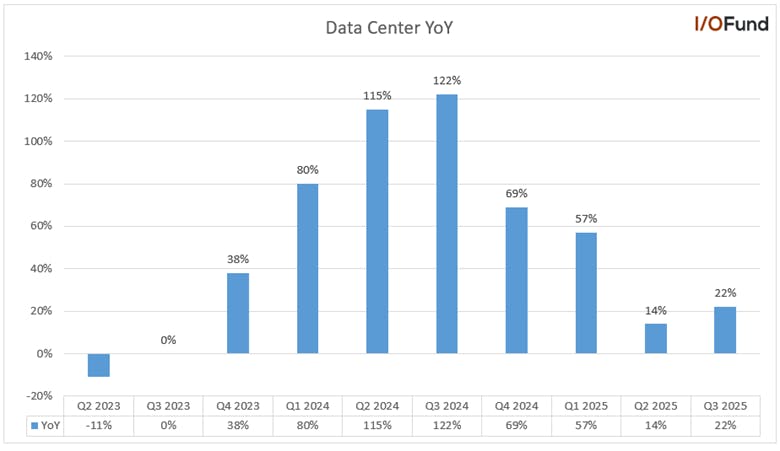
After putting the loss of China revenue in the rear-view mirror, the data center segment sharply rebounded this quarter, up 22% YoY and 34% QoQ for revenue of $4.34 billion. However, we aren’t quite there yet in terms of a strong inflection as it was stated data center would grow 4% QoQ with strong growth server (a nod toward CPUs instead of GPUs). 

AMD is a stock where I’ve been intentional about managing expectations. The upside is compelling — as the second place in data center GPUs is wide open. Yet for those who have followed our coverage, the timing has always been key: meaningful execution in AI accelerators is not expected to materialize until the second half of 2026. In other words, the long-term opportunity is substantial, but patience remains part of the thesis.

MI400s Arriving in H2 2026 

As stated in the most recent Top 15 AI Stocks report: “The MI400 series will be the start of rack-scale systems for AMD, starting with Helios, which will connect up to 72 GPUs similar to Nvidia’s NVL72 systems […] AMD stated in their last earnings report they have an ambitious goal of reaching tens of billions in MI400 sales. Investors should take note that management is specifically calling out the MI400 for this, arriving in H2 2026. The readthrough is that OpenAI is an early validator that the MI400s have serious chops, and where OpenAI goes, the rest of the AI market tends to follow.” 

I’m quoting all of my previous comments so the timing is crystal clear. Here was the update this evening in terms of timing – aligned with my current understanding: “But given what we see today, we see a very good demand environment into 2026, so we would expect that MI355 continue to ramp in the first half of '26. And then, as we mentioned, MI450 Series comes online in the second half of 2026, and we would expect a sharper ramp as we go into the second half of 2026 of our data center AI business.” 

Last month, more information was shared on AMD’s Helios systems, primarily that Meta’s Open Rack Wide specifications were met, which refers to improvements for power, cooling and serviceability. The end result is ecosystem validation that AMD can offer an open standard for AI infrastructure based on Meta’s data center rack designs.  

One key area where Helios stands out is memory — the platform offers roughly 50% more total memory capacity compared to Nvidia’s Vera Rubin rack architecture. That said, if you’ve followed AMD’s AI story as closely as I have (and I know many of you have), then the most important leap in this generation of GPUs is not found in Helios specs or even this quarter’s commentary. Rather, it’s in the demand signals. For the first time, some of the most influential AI customers — including OpenAI, Oracle, and Meta — are preparing to deploy the MI400 Series in meaningful volume. That level of hyperscaler commitment is something AMD hasn’t enjoyed in prior GPU generations (MI300s), and it represents an important shift in the company’s competitive positioning. 

AMD Signs 6GW Partnership with OpenAI 

In early October, AMD signed a landmark deal with OpenAI to supply the ChatGPT parent with 6GW worth of GPUs, starting with 1GW worth of AMD’s MI450 GPUs in the second half of 2026. AMD said the deal would be worth “tens of billions” but declined to provide exact specifics, yet analysts have chalked the deal as worth potentially upwards of $100 billion at the full 6GW scale. In conjunction with the deal, AMD is issuing a warrant to OpenAI to purchase up to 160 million shares. This enables OpenAI to take up to a 10% stake in the chipmaker, though vesting will not begin until the first 1GW deployment and is tied to certain share price targets. 

The deal is expected to provide significant upside potential for both revenue and earnings by 2030, per BofA’s estimates, even assuming a significant discount to Nvidia’s GPUs on a GW basis – AMD’s opportunity per GW is pegged at $17.5 billion, compared to $25 billion-plus for Nvidia’s Blackwell Ultra GPUs.  

BofA’s scenario analysis projects AMD’s total revenue as high as $63.1 billion by calendar 2027 assuming one full GW is deployed, a rather quick timeline considering first shipments are not expected to commence until the second half of next year.  

Under this assumption, BofA projects AMD’s earnings power as high as $10.15, a 35% uplift to consensus estimates at the time for $7.50. By calendar 2030, deployments are expected to culminate with 2GW, or ~$35 billion assuming the opportunity per GW remains flat at $17.5 billion; this could result in EPS as high as $15.80, per BofA, 47% above consensus prior to the deal.  

However, considering that next-gen GPUs continue to command higher prices (such as Nvidia’s Rubin and Rubin Ultra moving to $30-35 billion per GW), AMD may also be able to charge a higher premium for its GPUs and still maintain a significant price-performance advantage to Nvidia. Thus, assuming a mid-$20 billion per GW opportunity by 2030, AMD could see $45 billion-plus with 2GW delivered in the final tranches. Given consensus estimates were ~$65 billion prior to the deal, this would project revenue potentially at $110 billion by 2030. 

Our estimates are aligned with Lisa Su’s commentary, where she stated in the opening remarks that “We expect this partnership will significantly accelerate our data center AI business with the potential to generate well over $100 billion in revenue over the next few years.” 

One major question surrounding the deal is OpenAI’s spending spree, and how the company will not only fund this, but its other GPU and cloud computing deals it has signed over the last month. In September, OpenAI had already projected cash burn at $115 billion through 2029, yet has signed $1.4 trillion worth of deals with Nvidia, Oracle, Azure, AWS and others.  

Commentary for AI Growth in FY26-FY27 

The last guide that AMD provided on GPUs was $6.5 billion in revenue by the time we exit this year. Management is hinting they will see “tens of billions” in their AI business by 2027. If we assume this means a minimum of $20B (perhaps more) then it coincides with roughly minimum 200% growth in AMD’s AI business over a two-year time span.  

“In summary, our AI business is entering a new phase of growth and is on a clear trajectory towards tens of billions in annual revenue in 2027, driven by our leadership rack scale solutions, expanding customer adoption and an increasing number of large-scale global deployments. I look forward to providing more details on our data center AI growth plans at our Financial Analyst Day next week.” 

Current Consensus Estimates Show Mismatch In FY28-29 

Though it is still uncertain as to how the OpenAI deal will ramp with the subsequent 5GW and timing for those deployments, consensus estimates still show a mismatch in FY28-29, with YoY growth pegged at <2%.  

Some of this stems from the inherent difficulty from projecting 3+ years into the future (and a much smaller # of analysts projecting long-term, dropping from 32 in FY28 to 5 in FY29). However, running off the assumption that 6GW is worth >$110 billion with the opportunity per GW rising from $17.5 billion to mid-$20 billion over the course of the deal, there is a >$30 billion mismatch in forward estimates.  

For example, post-deal, estimates for FY27 have risen 22.5%, FY28 by 37% and FY29 by 22.5%. On a dollar basis, FY27 has risen by nearly $11 billion, FY28 by $14 billion, and FY29 by $11.5 billion. Adding in the $2 billion jump in FY26 and a ~$48 billion jump in FY30 (limited data but initial consensus at approx. $65 billion), the total increase in estimates amounts to ~$86.5 billion.  

Based on rough back-of-the-napkin math for ~$110 billion in the total opportunity, $23.5 billion is unaccounted for, likely landing in the FY27-29 time frame as deployments ramp. Thus, there could exist future upside to revenue estimates later in the decade as the pace and timing of the ramp becomes more clear.  

Oracle to Deploy 50K MI450 GPUs with Expansion Potential 

Oracle has emerged as another large, public backer for AMD’s upcoming MI450 GPUs, with the company announcing on October 14 that it would be deploying an initial 50,000 GPU cluster starting in the second half of 2026, with room to expand in 2027 and beyond. This builds on an existing planned deployment of a zetta-scale cluster of 131,072 MI355X GPUs announced earlier this summer. 

This deployment is expected to carry an all-in cost of $3.5 billion to $4 billion to Oracle for ~700 72-GPU racks, including storage and networking, or nearly $5.4 million per rack at the midpoint. For comparison, Nvidia’s GB300’s are estimated to carry an all-in cost of $80,000 per GPU, or ~$5.6 million per rack. 

Oracle Cloud Infrastructure executives said that they believe “customers are going to take up AMD very, very well — especially in the inferencing space.” This is where AMD is packing a punch with 31.1TB of HBM content in the MI450’s Helios rack, 1.5x more than the GB300 NVL72, to significantly increase bandwidth and throughput for inference tasks. The I/O Fund was early to discuss this angle in the analysis “AMD vs Nvidia” 

AMD expressed confidence in delivering for Oracle in future years, as well: “Oracle announced they will also be a lead launch partner for the MI450 Series, deploying tens of thousands of MI450 GPUs across Oracle Cloud Infrastructure beginning in 2026 and expanding through 2027 and beyond.” 

Q3 Revenue Grew by 36% 

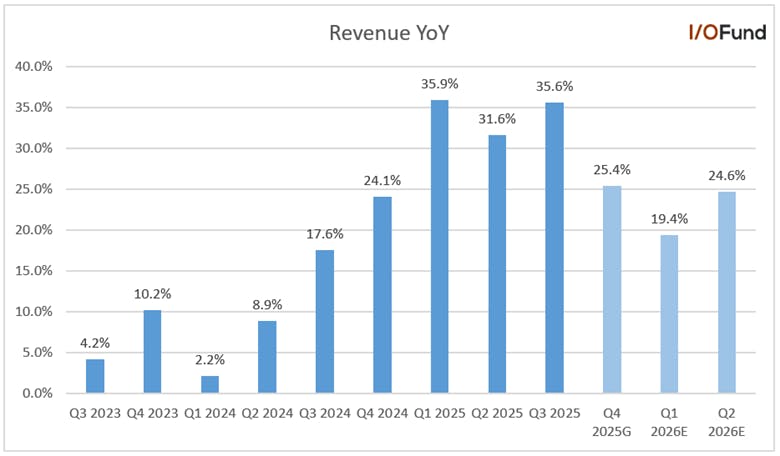
AMD’s Q3 revenue grew by 35.6% YoY and 20.3% QoQ to a record $9.25 billion, beating estimates by 5.7%. The revenue growth accelerated by 400 basis points from the 31.6% growth reported in Q2, reflecting strong momentum across the data center AI, server and PC businesses. The strong sequential revenue growth was primarily driven by growth in the data center, client & gaming segment, as well as modest growth in the embedded segment. 

The company also guided for a strong Q4 revenue of $9.6 billion at the midpoint, representing a YoY growth of 25.4% and 3.8% sequentially. It beat the analyst's estimates by 4.3%. The revenue growth will be primarily driven by strong double-digit growth in the data center and client & gaming segments. Similarly, to the last quarter, the revenue guidance does not include any MI308 chip sales to China. However, this time management indicated that MI308 chip sales could be coming soon.  

“So look, it's still a pretty dynamic situation with MI308. So that's the reason that we did not include any MI308 revenue in the Q4 guide. We have received some licenses for MI308, so we're appreciative of the administration supporting some licenses for MI308. We're still working with our customers on the demand environment and sort of what the overall opportunity is. And so we'll be able to update that more in the next couple of months.” 

Analysts expect revenue to grow 19.4% YoY to $8.88 billion in Q1 and then accelerate to 24.6% growth to $9.58 billion in Q2 2026. Looking forward, analysts expect revenue to grow 27.9% YoY to $42.33 billion in 2026 and accelerate 8.5 percentage points to 36.4% YoY growth to $57.72 billion in 2027. 

Data Center Segment Grew by 34% QoQ 

Data Center revenue rebounded strongly in Q3 as it grew by 22% YoY and 34% QoQ to a record $4.3 billion. The strong growth was primarily driven by the ramp of the Instinct MI350 Series GPUs and server share gains. Server CPU revenue reached an all-time high as adoption of 5th Gen EPYC Turin processors accelerated rapidly, accounting for nearly half of overall EPYC revenue in the quarter. The sales of prior generation EPYC processors also continued to be strong. 

The company also reported record sales as hyperscalers expanded EPYC CPU deployments to power both their own first-party services and public cloud offerings. Hyperscalers launched more than 160 EPYC-powered instances in the quarter. Currently, there are more than 1,350 public EPYC cloud instances available globally, up by about 50% YoY. 

Management expects cloud demand to remain very strong as hyperscalers are significantly increasing their general-purpose compute capacity as they scale their AI workloads. Many customers are now planning substantially larger CPU buildouts in the coming quarters to support the strong AI demand. Also, enterprise demand is very strong as the EPYC server sell-through increased sharply YoY and sequentially, reflecting accelerating enterprise adoption. 

AMD’s Instinct GPU business continues to accelerate. It is witnessing a sharp ramp of MI350 GPU sales and broader MI300 deployments. Multiple MI350 Series deployments are underway with large cloud and AI providers, with additional large-scale rollouts on track to ramp up over the coming quarters. 

Management was quite optimistic about future AI business growth. “Looking ahead, our data center AI business is entering its next phase of growth with customer momentum building rapidly ahead of the launch of our next-gen MI400 Series accelerators and Helios rack-scale solutions in 2026.” 

Client and Gaming Segment Grew by 73% YoY 

The client and gaming segment grew by 73% YoY and 12% QoQ to $4.05 billion. The strong growth was primarily driven by the acceleration in the Ryzen portfolio. It was stated

“Our PC processor business is performing exceptionally well with record quarterly sales as the strong demand environment and breadth of our leadership Ryzen portfolio accelerates growth. Desktop CPU sales reached an all-time high with record channel sell-in and sell-out led by robust demand for our Ryzen 9000 processors which deliver unmatched performance across gaming, productivity and content creation applications. OEM sell-through of Ryzen-powered notebooks also increased sharply in the quarter reflecting sustained end customer pull for premium gaming and commercial AMD PCs.” 

The gaming revenue grew by 181% YoY and 16% QoQ to $1.3 billion. The strong growth was driven by higher semi-custom revenue and strong demand for the Radeon GPUs. Management stated, “Semi-custom revenue increased as Sony and Microsoft prepare for the upcoming holiday sales period. In gaming graphics, revenue and channel sell-out grew significantly driven by the performance per dollar leadership of the Radeon 9000 family.” 

Embedded revenue was down (8%) YoY and up 4% sequentially to $857 million. Revenue increased sequentially as the demand environment strengthened across multiple markets. 

Margins 

The company’s profits are growing. However, margins are negatively impacted by higher operating expenses to support strong future AI opportunities.  

  • The company’s Q3 gross profits grew by 40% YoY and 56% QoQ to $4.78 billion. The gross margin was 52%, up 200 basis points YoY primarily driven by a higher profitable product mix. The adjusted gross margin was 54%, in-line with management guidance. Management has guided an adjusted gross margin of 54.5% for the fourth quarter. 
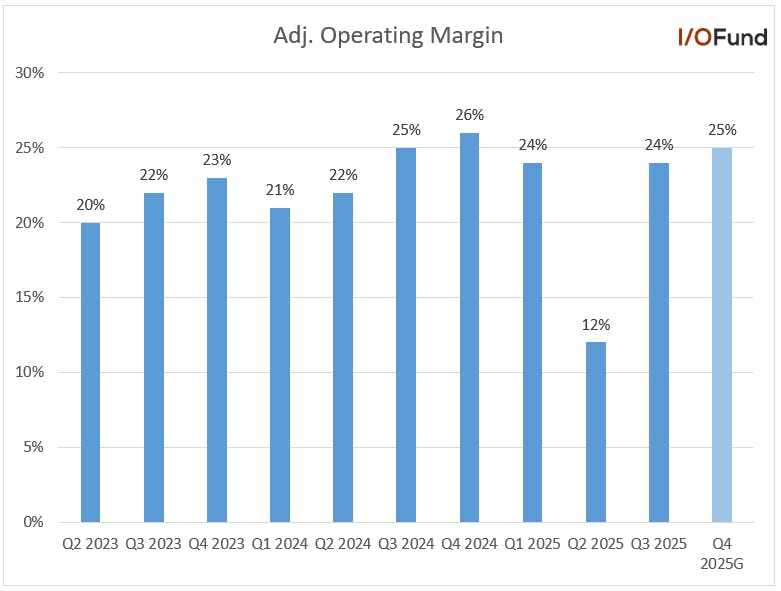
  • Operating income was up 75% YoY and up 1048% QoQ to $1.27 billion. The operating margin improved by 300 basis points YoY to 14%. Adjusted operating margin was down by 100 basis points YoY to 24% and missed the management guidance of 25% as the adjusted operating expenses increased by 42% YoY to support the significant AI opportunities and go-to-market activities for revenue growth. Management has guided an adjusted operating margin of 25% for the fourth quarter. 
  • Net income was up 61% YoY to $1.24 billion or 13% of revenue, up 200 basis points YoY. The adjusted net income was up 31% YoY to $1.97 billion or 21% of revenue, down 100 basis points YoY.

Adjusted EPS Grew by 30% YoY 

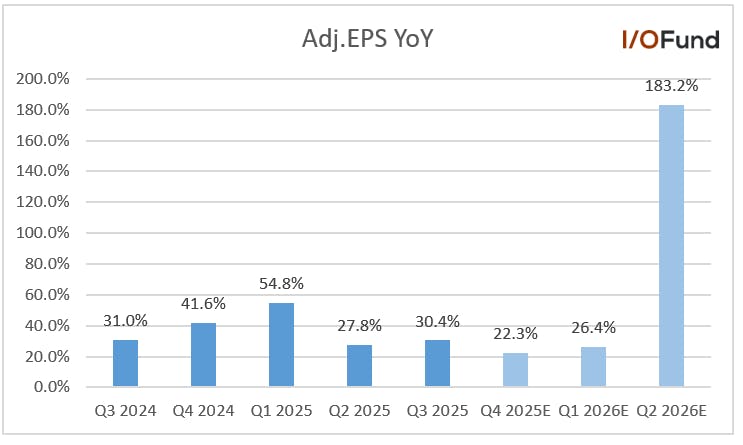
The company’s GAAP EPS grew by 59.6% YoY to $0.75, beating estimates by 10%. Adjusted EPS rose by 30.4% YoY to $1.20, beating estimates by 2.4%. 

Analysts expect adjusted EPS to grow by 22.3% YoY to $1.33 in Q4 and accelerate to 26.4% growth in Q1 and 183.2% YoY growth in Q2 to $1.36. Looking forward, they expect the adjusted EPS to grow by 61% YoY to $6.35 in 2026 and 45.7% YoY to $9.25 in 2027.

Cash Flow and Balance Sheet 

The company’s cash flows are growing primarily driven by higher revenue and profits.  

  • Q3 operating cash flows grew by 185% YoY to $1.79 billion or 19% of revenue, up 10 percentage points YoY. 
  • Q3 free cash flows grew by 208% YoY to $1.53 billion or 17% of revenue, up 10 percentage points YoY. 
  • The company had cash and short-term investments of $7.24 billion at the end of the quarter, up from $5.87 billion in the previous quarter. While debt remained the same at $3.22 billion. 
  • Inventories increased by 10% sequentially to $7.3 billion. 

Conclusion 

For the far majority of stocks, we would not have a placeholder in the I/O Fund portfolio this far ahead of execution. AMD is unique because the data center GPU market desperately needs a second-place contender. Investors may appreciate Nvidia’s pricing power, but hyperscalers and companies like OpenAI do not; they’d like to see more competition and optionality including lower prices. That is why we are seeing Meta work alongside AMD to bring Helios to market. There are many investment opportunities in AI across AI networking, AI energy, AI software, AI data layer and more – but none compare to the sheer size and strategic importance of GPUs, particularly when there are so few players competing for that share. That scarcity dynamic is precisely why AMD remains a special case in our portfolio. 

Equity Analyst Royston Roche contributed to this analysis. 

Please note: The I/O Fund conducts research and draws conclusions for the Fund’s positions. We then share that information with our readers. This is not a guarantee of a stock’s performance. Please consult your personal financial advisor before buying any stock in the companies mentioned in this analysis.

Recommended Reading:

Astera Labs Q3 Earnings: Blowout Report Meets UALink Uncertainty  

Astera Labs reported another impressive quarter in Q3 with revenue maintaining 20% QoQ growth, beating estimates by 11.7%, while GAAP operating and net margins showed solid QoQ expansion. Fiscal 2025 revenue is expected to be around $831 million at midpoint, $55 million above current estimates for $776 million and pointing to approximately 110% YoY growth. 

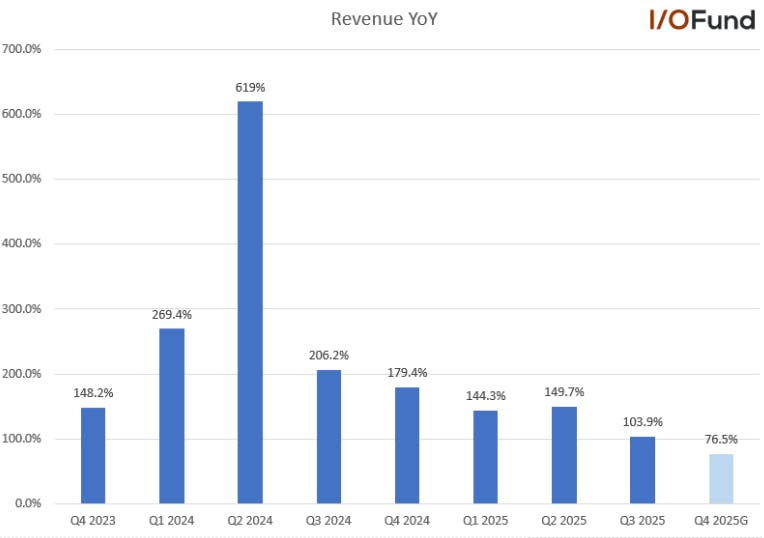
There are two items weighing on Astera’s report this evening. The first is the guide for Q4 of $249M at the midpoint, which implies 76.5% YoY growth yet 8% QoQ growth. This is a slowdown from the 20% QoQ growth this quarter.  

However, if we zoom out, we see this is actually a large beat as Q4 was slated to report $216.5M equaling a 15% beat. Also consider Astera has seen significant beats every quarter even after raising guidance, thus the conservatism we’ve seen thus far could continue. When looking at the bottom line, we see % surprise has been exceptional – don't believe I’ve seen this consistency and magnitude of bottom line beat before. 

Fundamentals aside, Astera’s stock has recently been haunted by Ethernet for Scale Up Networking (ESUN). ESUN was announced mid-October following the Open Compute Project conference with support from AI chip partners and strong Ethernet players, including Nvidia, AMD, Broadcom, Arista, Cisco, HPE, plus a few hyperscalers such as Meta, Microsoft and AI heavyweight OpenAI. The week of the announcement, Astera dropped as much as 33% from an October high of $225 to $154.  

Astera’s product line has greatly benefited from the boom in the PCIe networking protocol, and the readthrough is that PCIe will see competitive pressure from Ethernet.  

There is a lot to unpack from the earnings report, yet the PCIe versus ESUN debate takes precedence. As you can expect, the Financials section shows a trend very much in play, but we have to address the boogieman first before we can assess Astera’s ability to continue its remarkable growth trajectory.  

UALink versus Ethernet Scale-Up Networking (ESUN) 

UALink is an open-source alternative to proprietary interconnect protocols such as Nvidia’s NVLink. Astera offers a portfolio of UA linked connectivity solutions, including AI fabrics for signaling conditioning and other I/O components. The expectation is that PCIe’s low latency would carry UALink as a solid alternative to Nvidia’s NVLink with proliferation expected around 2027.  

In the past, Astera has counted ten customers as leveraging PCIe in the short term and a combination of PCIe and UALink in the midterm before “transitioning perhaps to a broader UA Link deployment in 2027 and later.” 

The market is concerned because ESUN is now a third viable option and one that comes with a sense of familiarity given its Ethernet based, has large backers and perhaps most importantly – can exceed UALink when it comes to time to market. As you’ve likely picked up on with our energy coverage, time to market is everything right now. The ESUN consortium is banking on Ethernet moving quickly for scale-up networking.  

As it stands now, PCIe is optimized for scale-up networks due to low latency and speed measured in nanoseconds whereas Ethernet is best for scale-out networks. However, ESUN is proposing an Ethernet solution for scale-up with the press release stating: “ESUN is a new workstream collaboration designed as an open technical forum to advance Ethernet in the rapidly growing scale-up domain for AI systems.” 

There are quite a few details to consider in terms of how this plays out, yet the most likely outcome (from where I stand today) is that both are needed. UALink has specific benefits that will be tough for Ethernet to displace. Here is the technical description: “The [UALink] specification enables load, store, and atomic operations between 100s of GPUs while optimizing the protocol stack to minimize end-to-end latency, reducing valuable die area on GPUs and switches, and reducing interconnect and switching power consumption. UALink will support state-of-the-art up to 200Gbps per lane (equivalent to Ethernet) to provide the high bandwidth required between GPUs while also keeping latency in the 100s of nanoseconds (vs. multiple microseconds for Ethernet)” 

It goes back to this last part, which is the 100s of nanoseconds for UALink versus microseconds for Ethernet (as it stands today) that will require a leap in product design and successful deployment in order to displace UALink and the PCIe protocol (where Astera’s solutions fit in). Market participants are doing what many time-strapped investors do – scanning and seeing the large backers for ESUN and assuming it means UALink will not be successful. There is a time to market issue for UALink, yet in the meantime, PCIe remains a strong choice for fast, scale-up systems. PCIe is deployable right now for scale-up pods and CXL is also a strong choice for memory pool connectivity (Astera participates in all of this). 

Quick Takeaway: ESUN is attempting to make Ethernet work for scale-up whereas UALink was built from scratch for scale-up. The primary benefit ESUN offers is to move quicker than UALink (as discussed above, ALAB is saying it’ll be 2027 for UALink to be fully deployed). However, in the meantime, Astera’s PCIe solutions are in high demand and deployable now. Even if ESUN moves faster commercially, there is a performance gap that helps to ensure that Astera’s positioning with PCIe/CXL remains intact. That performance gap is best described as the low latency required for what are the most in-demand AI workloads today – those that require memory pooling and GPU-to-GPU communication.  

Commentary on the Earnings Call regarding UALink and ESUN 

The first question on the call pertained to this concern with an analyst inquiring about any changes in management’s outlook given the recent developments around Ethernet. It’s important to note the analyst acquiesced that it could take 18-24 months for a new protocol to be spec’d out.   

Here is what was stated – providing a longer quote given this topic has caused the stock to selloff twice. 

“We continue to see our market opportunity grow for our scale-up products, particularly this Scorpio X product like you noted. Scale up, as you can imagine, it's a very large market. We estimate it to be in tens of billions of dollars like you correctly noted, some of these design wins take last over multiple generations, simply because of the investment that goes into developing the software and the hardware required for killer topologies.  

For us, if you think about our business today, we are getting ready to ramp into production with our PCIe-based scale-up solutions, it's been extremely popular. There are several customers that are using PCIe like protocols for scale. A new entrant was Qualcomm that publicly announced their new AI 200 inference rack that feature PCIe-based scale-up. For Astera, we have engaged with over 10 AI platform providers. And we expect that these design wins and engagements that we have will continue to ramp.  

In fact, we expect this to go 2029 just based on some of the multi-generation nature of these design wins. For us, UALink is also a very meaningfully additive opportunity as customers start adopting it, just based on the higher data rate support the spec has been around, like you noted, for over a year now in terms of the consortium being formed. The spec is stable, the ecosystem is forming, silicon development is in full gear. And many of these customers, we have currently engaged with RFPs and RFQ. So the momentum is really built up very nicely and continues to grow. So we do expect meaningful revenue from UALink to start coming in 2027.” 

Notably, there is already a hint that UALink could hurry along to become available in H2 2026: “We continue to expect a portfolio of UALink solutions to be available to customers in the second half of 2026 with early revenues generated in 2027.” 

Scorpio P-Series is Ramping Now, and X-Series will Ramp Early 2026 

The more immediate catalyst for Astera as we look toward Q4 and into early 2026 are the Scorpio products, which we’ve covered in the past.  

Scorpio P-Series represents 10% of revenue now, yet management stated it will quickly double to exit the year at 20% of revenue. From there, management has implied Scorpio X will exceed Scorpio P’s revenue percentage. Net-net, that means Scorpio will reach 50% of revenue sometime in H1 2026 up from effectively 0% of revenue in H1 2025. 

Here is a quick refresher on these two solutions: 

The Scorpio P-Series is a small chip that connects the CPU, GPU, NIC and NVMe storage. Rather than building a large switch, the company built a smaller device that is more efficient for high-speed signals to help feed GPUs with data. The fewer ports and smaller switch decrease complexity in a bid to compete against Broadcom with twice the lane count.  

The X-Series is for back-end networking in GPU-to-GPU configurations (and custom silicon configurations), and will offer a higher port count. Astera is essentially building something similar to Nvidia’s NVSwitch with the X-Series, but for PCIe-enabled GPUs and ASICs. Per an earnings call earlier this year: “And this one, like Mike noted, it's a greenfield use case, meaning if you keep Nvidia and NV Switch aside, everyone else is starting to build configurations that are obviously going to need some kind of a switching functionality, which is what we are addressing with our X Series device.”   

The X-Series improves efficiency for ever-increasing AI cluster sizes. The majority of AI clusters are in the tens of thousands GPUs, but are expected to go to the hundreds of thousands (already has with X and some other Big Tech companies), and will see AI clusters with millions of GPUs over the next couple of years.  

In an effort to identify a catalyst that can sustain Astera’s exceptional growth, it would be this product that does so. The X-series is used to interconnect GPUs for higher GPU utilization, resulting in higher ASPs. Per previous commentary: “So to that standpoint, X-Series does bring in a lot more value, and therefore, you can assume that the ASPs tend to be significantly higher. And that's — again, there are different — the X-Series is not one device, to be very clear, there are multiple part numbers. So there would be situations where maybe one part number is not at the same level as P-Series. But in general, you can just look at it from a per lane standpoint or per port standpoint, and look at the value delivered.  And on that basis, the X-Series will always be a much more valuable, much more higher ASP product than a P-Series.” 

Notably, Astera maintains their largest opportunity for the X-Series is on the custom silicon side although they foresee hyperscalers wanting to customize their racks in a way that prevents vendor lock-in from both Nvidia and Broadcom.   

“So these are fabric switches that are used to interconnect multiple accelerators together. So to that standpoint, a, it's not only a significant dollar opportunity because the ASP of this product tends to be high. But these are also products that are turning out to be anchor sockets for us. If you think of an AI rack being built, you have the accelerators and then you have the fabric that interconnects the accelerators.    

So what we are transitioning and what we're excited about is that the Scorpio X device is now translating to be an anchor socket. Think of it as like a mothership around which we are able to now add a lot more products that go along with it, whether it's the silicon level products or module or other form factors that we're considering.” 

The longer refresher on Scorpio P-Series and Scorpio X-Series is necessary because the primary catalyst we identified earlier this year has not even ramped yet. Scorpio P-Series only began shipping this quarter and Scorpio X-Series will begin to ship next year. Here’s the most recent update on when these are shipping: “Scorpio P-Series continued its initial volume ramp at our lead customer, and we are excited that our P-Series revenue will further broaden with recent new design wins across a variety of AI platforms at multiple hyperscaler customers. Scorpio X-Series is shipping in preproduction quantities with a volume ramp expected throughout 2026.” 

Management confirmed they continue to expect a strong ASP uplift for the upcoming Scorpio X-Series ramp in 2026: “Looking ahead, we are gearing up for Scorpio X-Series to shift to high-volume production over the course of 2026. With this ramp of Scorpio X-Series for scale-up connectivity topologies next year, we expect our overall dollar content opportunity per AI accelerator to significantly increase, representing another step-up from a baseline revenue standpoint.” 

To future proof Scorpio solutions, Astera Labs is acquiring xScale Photonics as the market is expected to rely more heavily on photonics (as opposed to copper) a few years from now with management stating: “However, as data rates increase and scale-up domains go beyond 1 rack, clearly, at some point, you will need optical interconnects for scale-up. And there is already a big market for optical interconnects at a data center scale.” The result will be photonic solutions with higher data rates for Astera’s Scorpio solutions. 

Financials 

Revenue Beats by Nearly 12% 

Astera delivered a strong beat on the top line in Q3, with revenue up 103.9% YoY and 20.1% QoQ to $230.6 million, beating the $206.4 million estimate by 11.7%. This maintained Q2’s sequential growth rate of 20%, though YoY decelerated by ~46 points as the company begins to lap tougher comps on a dollar basis. Management said the strong growth was driven by new AI platform ramps featuring multiple products and “robust demand” across its signal conditioning, smart cable module (SCM), and switch fabric portfolios. 

For Q4, Astera guided for $245 million to $253 million in revenue, coming in well ahead of estimates for $216.5 million and pointing to YoY growth of 77% and QoQ growth of 8%, driven by continued PCIe 6 momentum and robust growth from Taurus Ethernet SCMs. This would technically mark the company’s first <100% growth quarter since the end of 2024.  

While Astera did not provide a full-year guide, extrapolating from the midpoint of Q4’s guide projects FY25 revenue at ~$831 million, ahead of estimates for $776 million and corresponding to nearly 110% YoY growth. This will likely force FY26 revenue revisions to move at least $100 million higher from the current $1.04 billion assuming consensus continues to project 34-35% YoY growth. 

GAAP Operating Margin Expands ~32 Points YoY to 24% 

While the revenue beat and raise is certainly welcomed, the improvement in GAAP margins down the line was impressive, with GAAP operating margin expanding to 24%.  

  • GAAP gross margin was 76.2%, ahead of guidance for 75%. This marked a marginal 0.4 point sequential improvement but a 1.5 point YoY contraction. Adjusted gross margin was 76.4%. 
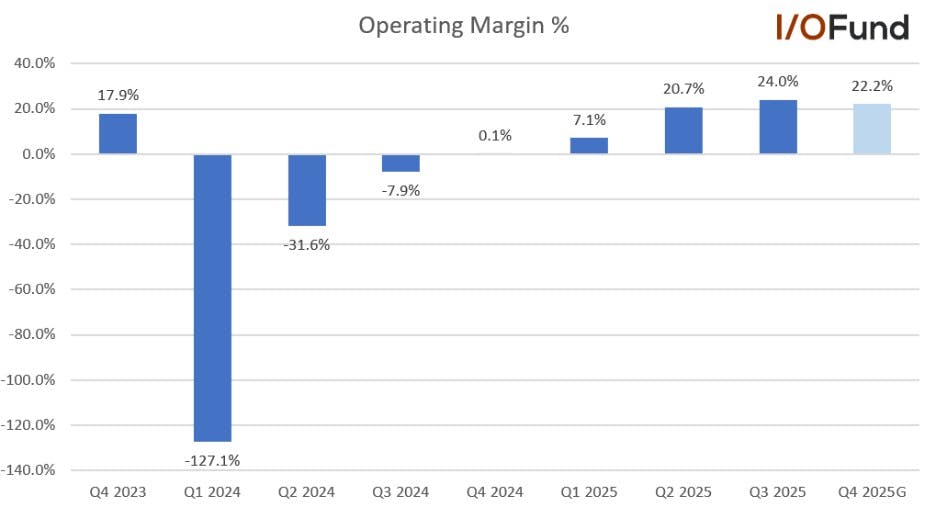
  • GAAP operating margin was 24.0%, well ahead of guidance for 17.9%, and expanding 3.3 points QoQ and nearly 32 points YoY. This YoY expansion from (7.9%) in Q3 ’24 is quite impressive considering the company was reporting triple-digit revenue growth in each quarter; this also reinforces that the company is comfortably GAAP profitable. Adjusted operating margin was 41.7%, up 2.5 points QoQ and 9.3 points YoY. 
  • GAAP net margin was 39.5%, up nearly 13 points QoQ and more than 46 points YoY. Adjusted net margin was 38.3%, down 2.4 points QoQ but up 2.7 points YoY. 

For Q4, Astera guided for slight sequential moderation in margins down the line, with gross margin guidance at 75%, in line with prior quarter guidance. GAAP operating margin was guided to be 22.2% at midpoint, down 1.8 points QoQ but still up more than 22 points YoY. Adjusted operating margin was guided at 39.9%, down 1.8 points QoQ but up 5.6 points YoY. 

GAAP EPS Beats by 92% 

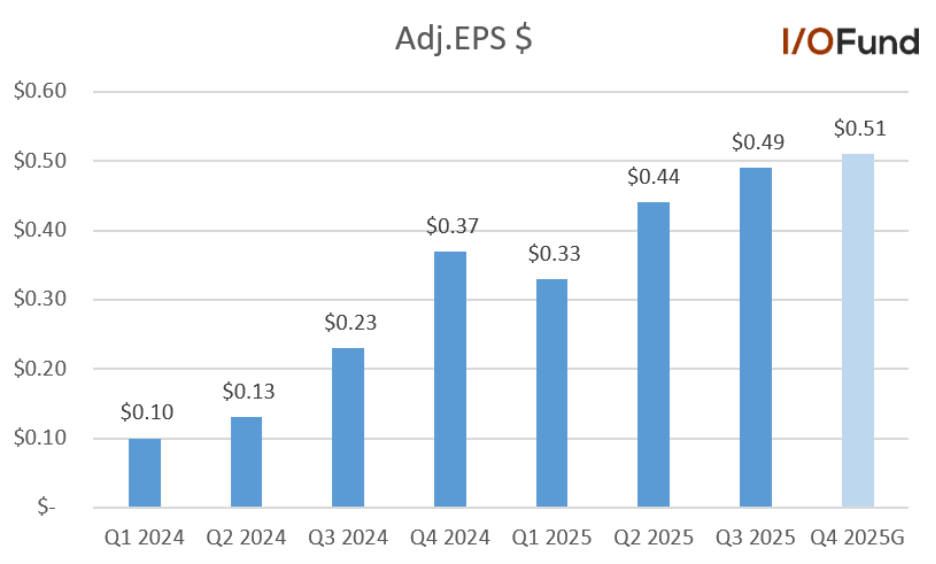
With the strong expansion in GAAP net margin, Astera delivered a 92.3% beat on GAAP EPS, reporting $0.50 in Q3 versus the $0.26 estimate. Adjusted EPS was $0.49, up 113% YoY and solidly ahead of the $0.39 estimate. 

For Q4, Astera guided for $0.20 in GAAP EPS, below the $0.26 estimate due to a 45% income tax rate. Adjusted EPS was guided at $0.51, up 38% YoY. This guidance would bring FY25 GAAP EPS to $1.17 (versus estimates for $0.96) and adjusted EPS to $1.77 (versus estimates for $1.58).  

Cash and Balance Sheet 

Cash flow margins moderated quite sharply on both a QoQ and YoY basis, though cash flow generation remained decently strong with an OCF margin of 33.9%.  

  • Q3 operating cash flow was approximately $78.1 million for a 33.9% margin, down from a 56.2% margin in the year ago quarter and a 70.5% margin in Q2.  
  • Q3 free cash flow was approximately $65.8 million for a 28.5% margin, down from a 41.4% margin in the year ago quarter and 69.5% in Q2. 
  • Cash and equivalents totaled $1.13 billion and debt remained zero. 
  • Accounts receivable were $42.9 million, rebounding from $24.3 million last quarter but remaining lower than the $69.8 million from Q1. Inventories moderated slightly to $51.7 million from $58.6 million in Q2.  

Conclusion: 

We do a lot of checks and balances at the I/O Fund to figure out if a stock is seeing unexpected headwinds. We look for catalysts (Scorpio solutions), we double check our product understanding (PCIe has unique benefits over Ethernet that will be hard to completely displace especially for memory pooling and GPU-to-GPU communication), we do a thorough checklist of the fundamentals with Astera crushing on the top line and even more so on the bottom line.  

To me, ESUN signals that Ethernet vendors are a little afraid of being left out of the scale-up party. The most probable outcome is that both ESUN and UALink coexist to address different layers of an AI cluster and as part of a broader shift away from proprietary networking. Even in a downside scenario where Ethernet moves faster than expected, we probably have an 18-month window before those dynamics materially affect deployments. It won’t be a boring 18 months either, rather it’ll be pretty exciting in terms of the importance of AI networking.  

With that said, Astera is a hypergrowth stock with an AI valuation. We are always prudent with these stocks by following risk management plans. We saw this with Palantir this week, reminding us that price action doesn’t always follow fundamentals in the near term. Our antennas are up, not because of concerns specific to Astera, but because prudent positioning is part of being an investor in high-growth AI names. 

Equity Analyst Damien Robbins contributed to this article.

Please note: The I/O Fund conducts research and draws conclusions for the Fund’s positions. We then share that information with our readers. This is not a guarantee of a stock’s performance. Please consult your personal financial advisor before buying any stock in the companies mentioned in this analysis.

Recommended Readings:Recommended Readings:

AMD Q3: The Catalyst is Expected in H2 2026, Could Ramp Sooner

Reddit Q3: Setting a High Bar with Top Line Strength and 10-point Sequential Margin Expansion

Vertiv Q3: Orders Surge 60% YoY, 20% QoQ, FY25 Guidance Raised

Thematic: 8/10
Fundamentals: 8/10
Valuation: 3/10

Brief Overview 

Vertiv will not win any hypergrowth stock awards, especially as management has previously offered CAGR guidance of 15% to 17% through 2029. Rather, it’s where Vertiv is positioned as an AI infrastructure partner especially as the trend turns toward modular infrastructure that makes this a stock to watch.  Essentially, all roads point toward Vertiv’s power and thermal solutions becoming increasingly important for future generations of rack scale solutions, with the company already preparing 800V DC solutions for Nvidia’s Rubin Ultra platform due in 2027. 

Revenue 

Vertiv reported revenue up 29% YoY and 1% QoQ to $2.676 billion, well ahead of its original guidance for 23% growth in the third quarter. This was driven by 43% YoY growth in the Americas on accelerated AI demand and 20% growth in APAC.  

For Q4, Vertiv guided for revenue to be $2.81 billion to $2.89 billion, up 6.5% QoQ and 18-22% YoY at the $2.85 billion midpoint. While this was ahead of previous guidance for $2.735 to $2.815 billion, this would still represent a nine point deceleration on the topline at midpoint. Management expects Americas revenue to be up high-30s, APAC up mid-single digits and EMEA down high single digits but up mid-teens QoQ. 

The strong outperformance in Q3 also led to Vertiv hiking its FY25 revenue guidance from $10 billion at midpoint to $10.2 billion at midpoint, pointing to organic growth of 26-28% YoY. Management did not provide any direct insight into FY26, though they did say that based on the “substantial backlog and clear visibility of pipeline, we anticipate continued significant organic sales growth in 2026,” with EMEA potentially reaccelerating in 2H 2026. 

AI Revenue Metrics 

Vertiv’s backlog rose ~30% YoY and 12% QoQ to $9.5 billion, reaccelerating from 21% YoY growth last quarter. More importantly, the $1 billion sequential increase in backlog was the largest in more than two years. However, one of the stronger metrics was order growth, with Vertiv reporting organic orders up 60% YoY and 20% QoQ in Q3. This drove a ten point rebound in TTM organic order growth to 21% YoY, from 11% in Q2. 

However, starting in Q4, Vertiv will no longer report on quarterly orders and backlog information, and instead will report a new metric “projected full year orders.”  

The following was stated in Q2: “Beginning on our Q4 and full year 2025 earnings call, we will provide projected full year orders rather than quarterly orders and backlog information. We believe this better aligns with how we run our business. We will provide updates on the full year projections quarterly as we progress through the year and as we deem necessary.”  This could create a boost to Vertiv’s stock to remove the lumpiness from quarterly reports and to also be more forward looking in terms of visibility offered to investors.  

Earnings 

Vertiv reported adjusted EPS up 63% YoY to $1.25 in the quarter, beating the $0.99 estimate by 25%. GAAP EPS of $1.02 beat estimates by 16.7%. For Q4, adjusted EPS was guided to decelerate to 27% growth to $1.26 at midpoint.  

For the full year, Vertiv raised its adjusted EPS forecast to $4.07 to $4.13, up from its prior view for $3.75 to $3.85. At midpoint, this represented a nearly 8% hike, now pointing to 44% YoY growth versus 33% previously.  

Margins 

Vertiv reported expanding margins across the board in Q3, though Q4 is expected to be approximately flat for adjusted operating margin.  

  • Gross margin was 37.8%, up 1.3 points YoY and 3.8 points QoQ. 
  • GAAP operating margin was 19.3%, up 1.4 points YoY and 2.5 points QoQ. Adjusted operating margin was 22.3%, up 2.2 points YoY and 3.8 points QoQ, driven by tariff mitigation efforts and strong execution addressing operational inefficiencies.  
  • Net margin was 14.9%, up 6.4 points YoY and 2.6 points QoQ. 

For Q4, adjusted operating margin was guided to be up 0.9 points YoY and approximately flat QoQ at 22.4%, as “progress addressing operational inefficiencies [is] offset by acceleration in growth investments and negative impact from new tariffs.” This is a rather steep decrease from Q2’s guidance for 23.6%, which would’ve been its best adjusted operating margin print since going public in 2020.  

For FY25, Vertiv slightly raised its adjusted operating margin forecast by 0.2 points at midpoint to 20.2%, representing YoY expansion of 0.8 points. This is strong as it comes in the face of “significant headwinds from tariffs and operational inefficiencies driven by supply chain actions to mitigate tariffs.” Tariff impacts are expected to be materially offset exiting Q1 ’26. 

Cash 

Vertiv reported strong cash flows in Q3, with operating cash flow of $508.7 million, up nearly 36% YoY. OCF margin was 19%, up 1.8 points YoY and 6.8 points QoQ. 

Q3 adjusted free cash flow was $462 million, up 32% YoY. Adjusted FCF margin was 17.3%, up 1.1 points YoY and 6.8 points QoQ. Q4 adjusted FCF was guided to be $496 million for a 17.4% margin, up marginally from Q3. Vertiv boosted its adjusted FCF guidance by $100 million, now forecasting $1.5 billion for the year, up from $1.4 billion previously. This corresponds to a 14.7% margin.  

Accounts receivable dipped (1%) QoQ to $2.81 billion, while inventories rose less than 2% YoY to $1.43 billion. 

Cash, equivalents and investments totaled $1.94 billion, while debt totaled $2.90 billion. 

Valuation 

Vertiv is trading at peak multiples on the top line, and slightly below peak on the bottom line. Vertiv’s forward PS is 7.2x, above its late 2024 peak of 6.8x, and substantially higher than its April low at 2.2x forward PS. 

On the bottom line, Vertiv is just below peak multiples, at 47.3x forward earnings versus its peak at 52.5x.  

Notable Risks 

Vertiv’s extended valuation is a primary risk as the company contends with a sharper deceleration on the top line heading into Q4, as well as a sharp deceleration in EPS growth from 63% in Q3 to 27% in Q4. Margins are also a line item to watch, considering management had guided for a Q4 adjusted operating margin of 23.6% back in Q2 but then subsequently cut that guide to 22.4% in Q3. 

Conclusion: 

The current quarter was not a showstopper as we prefer to be allocated more heavily to stocks that are showing signs of imminent Blackwell participation. However, Vertiv remains one to watch as the backlog increasing 12% QoQ and order growth increasing 20% QoQ could be signaling an inflection.

Damien Robbins, Equity Analyst at I/O Fund contributed to this analysis.

Please note: The I/O Fund conducts research and draws conclusions for the Fund’s positions. We then share that information with our readers. This is not a guarantee of a stock’s performance. Please consult your personal financial advisor before buying any stock in the companies mentioned in this analysis.

Recommended Reading:

Riot Q3 Earnings: Construction Begins on Corsicana for 112MW

Riot had a lackluster report with no new surprises to speak of. In terms of timing, the initial 112MW build-to-suit data centers will not be complete until early 2027 despite being energized much earlier. For Riot, the timing issue is centered around design and construction rather than available power.  

We’ve done some back-of-the-napkin math in our previous analysis to put a value around $792 million in average annual revenue for the 600MW for a total of $8 billion over ten years, with the understanding the beginning stages will begin at a much smaller size as capacity ramps and end much larger than the averaged figure of $792M. 

Analyst estimates are currently for $805M next year, and Bitcoin operations are producing $160.8 million this quarter (this is lumpy of course). There’s certainly a path to where Riot sees strong upward revenue revisions when the 600MW is energized and delivered. Analysts have estimates for Q1 FY27 at $181M, which would theoretically create upside  when the AI data center story materializes if we assume Bitcoin continues to offers the low end with a $200M run rate. 

The upside in analyst estimates is more apparent on the bottom line with our back-of-the-napkin math suggesting net operating income of $673 million annually. Last year, Riot reported net operating income of $92.3 and has reported $5 million in NOI year-to-date (currently this is largely dependent on Bitcoin). Analyst estimates call for a decline in EPS of (43%) for FY2026 and net losses in FY2027. Therefore, if/when management truly delivers the 600MW in the next 1-2 years, it should drive a significant rebound on the bottom line.  

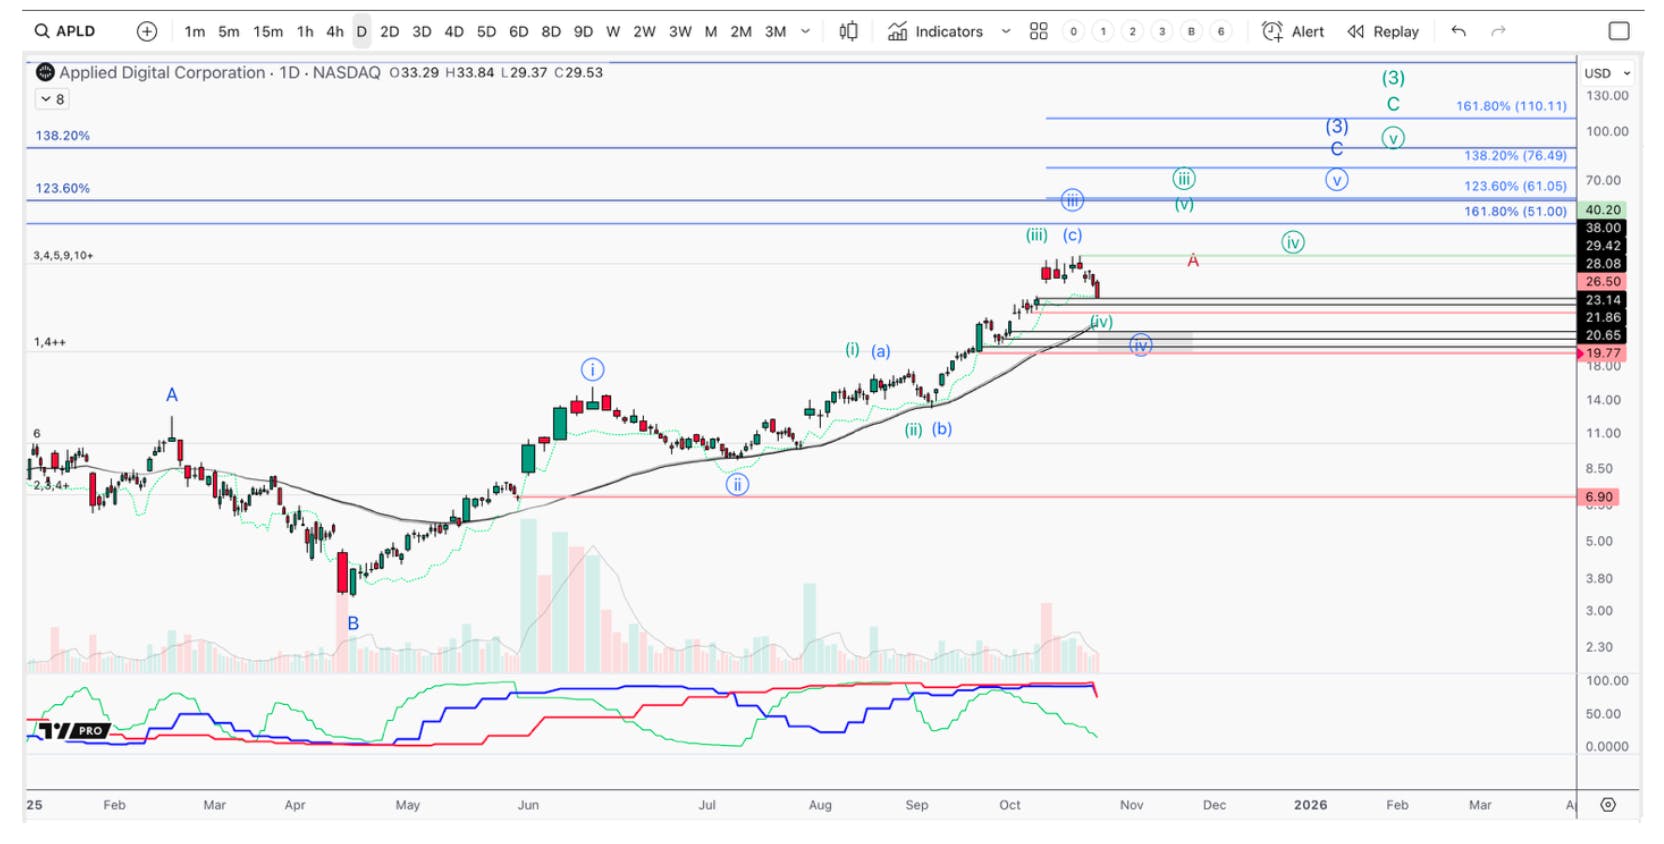
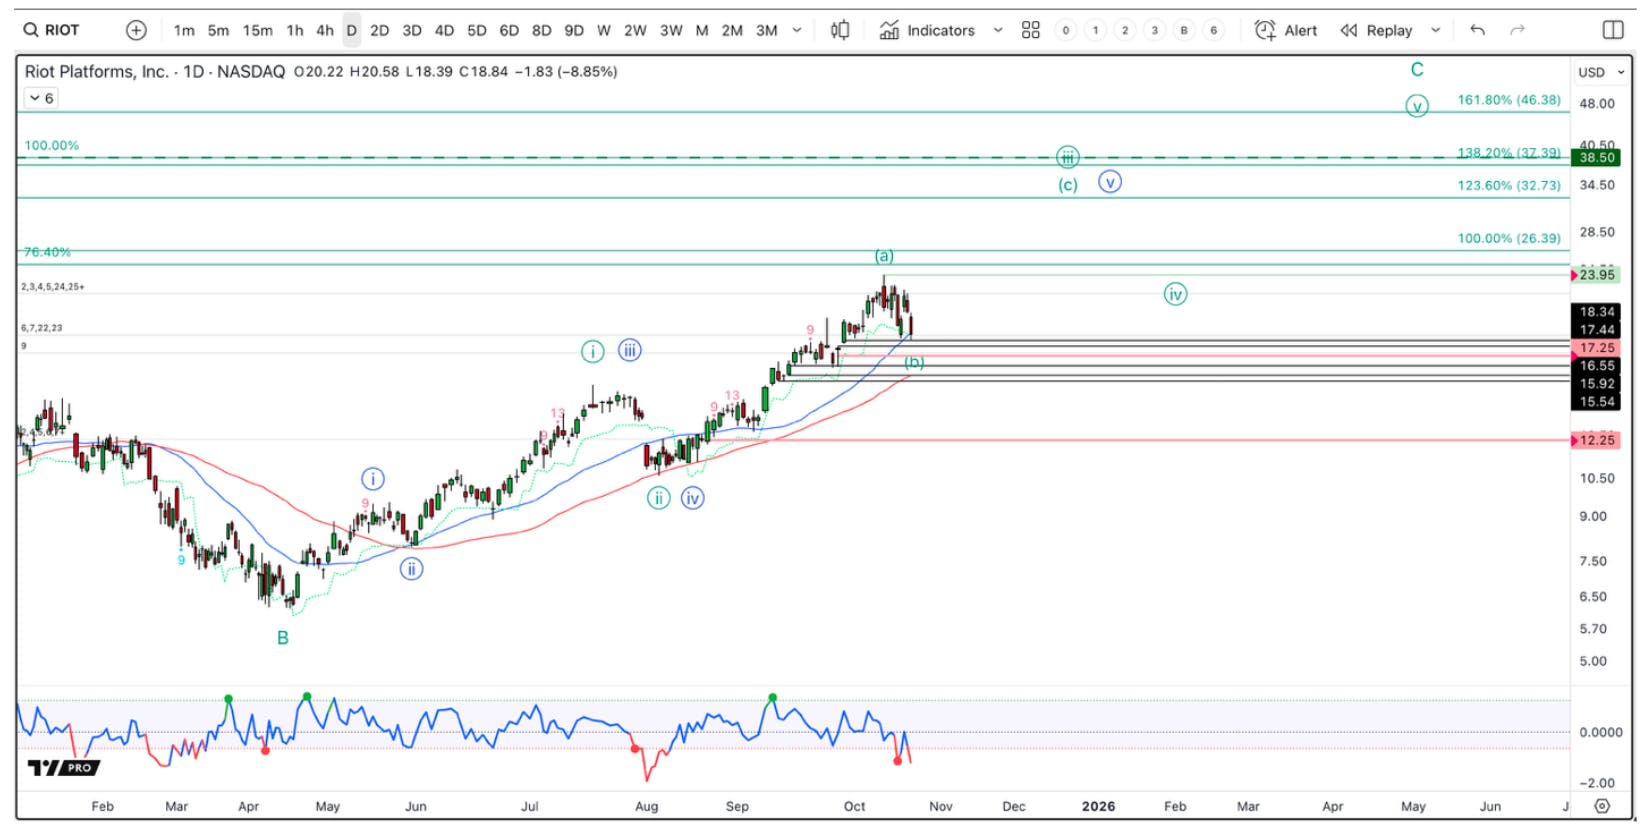
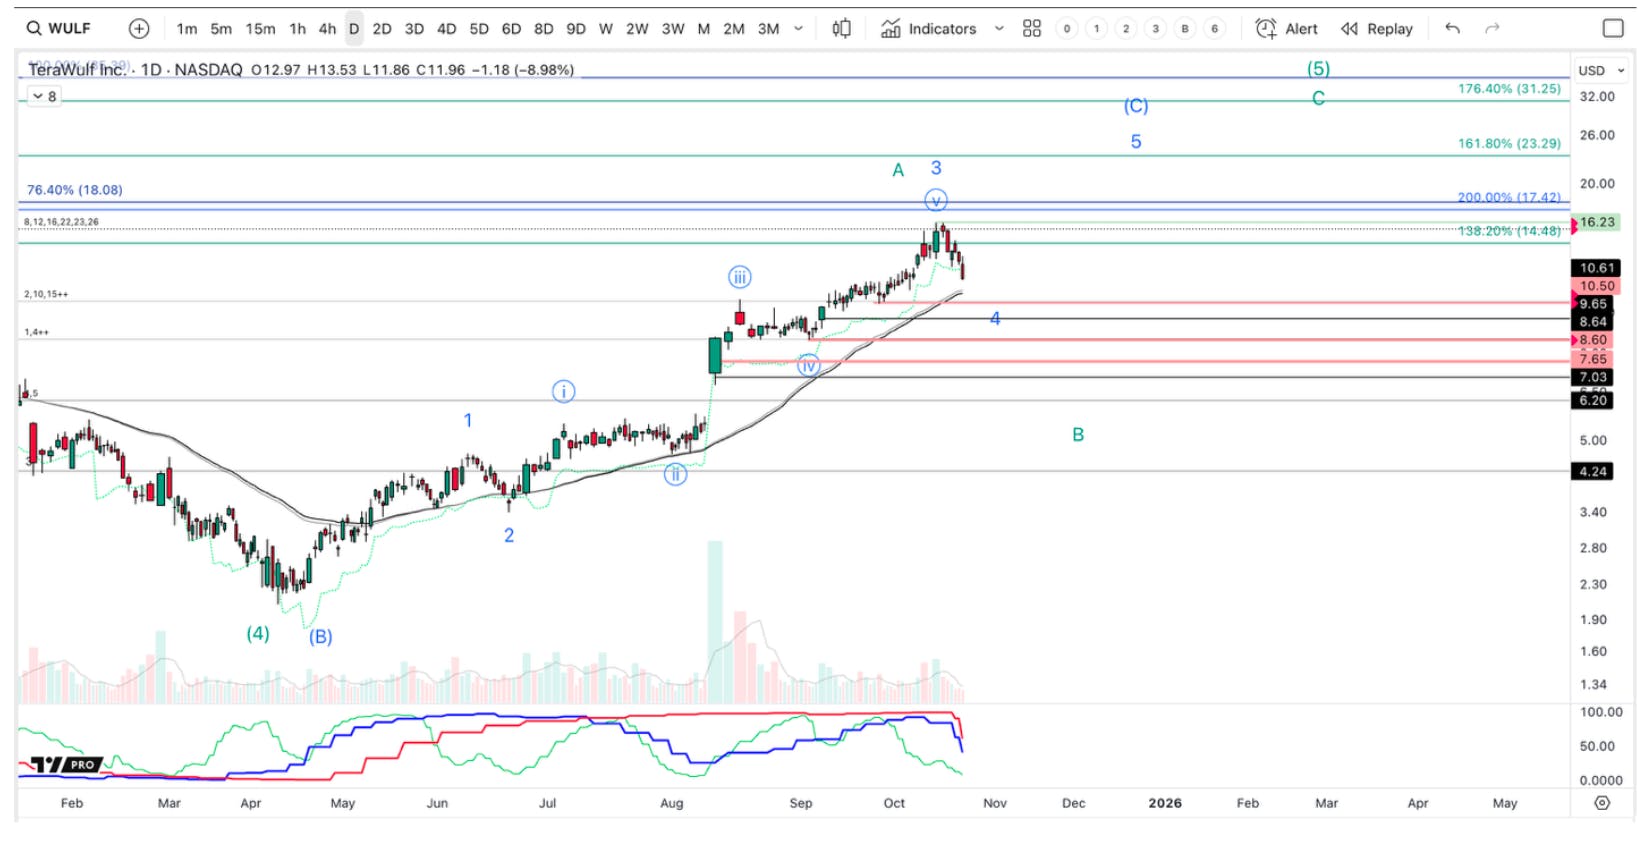
What we must grapple with is the timing for this rebound as other Miners are executing more quickly. The AI market is moving like a freight train, and Q1 FY2027 seems awfully far away. The opportunity cost with stocks is tricky, as Riot could announce a deal with a hyperscaler at any time, yet so could its many peers – in fact, they’ve been doing so at a fast clip such as Applied Digital, TeraWulf, and more. 

Below, we look at Riot and if the opportunity cost of remaining in the stock makes sense or not. 

First 112MW to Enter Construction in Q1 2026 

While Riot announced this quarter that it has initiated its data center strategy with development of the first 112MW of IT capacity at Corsicana, construction on these first two 56MW buildings is not expected to commence until Q1 2026.  

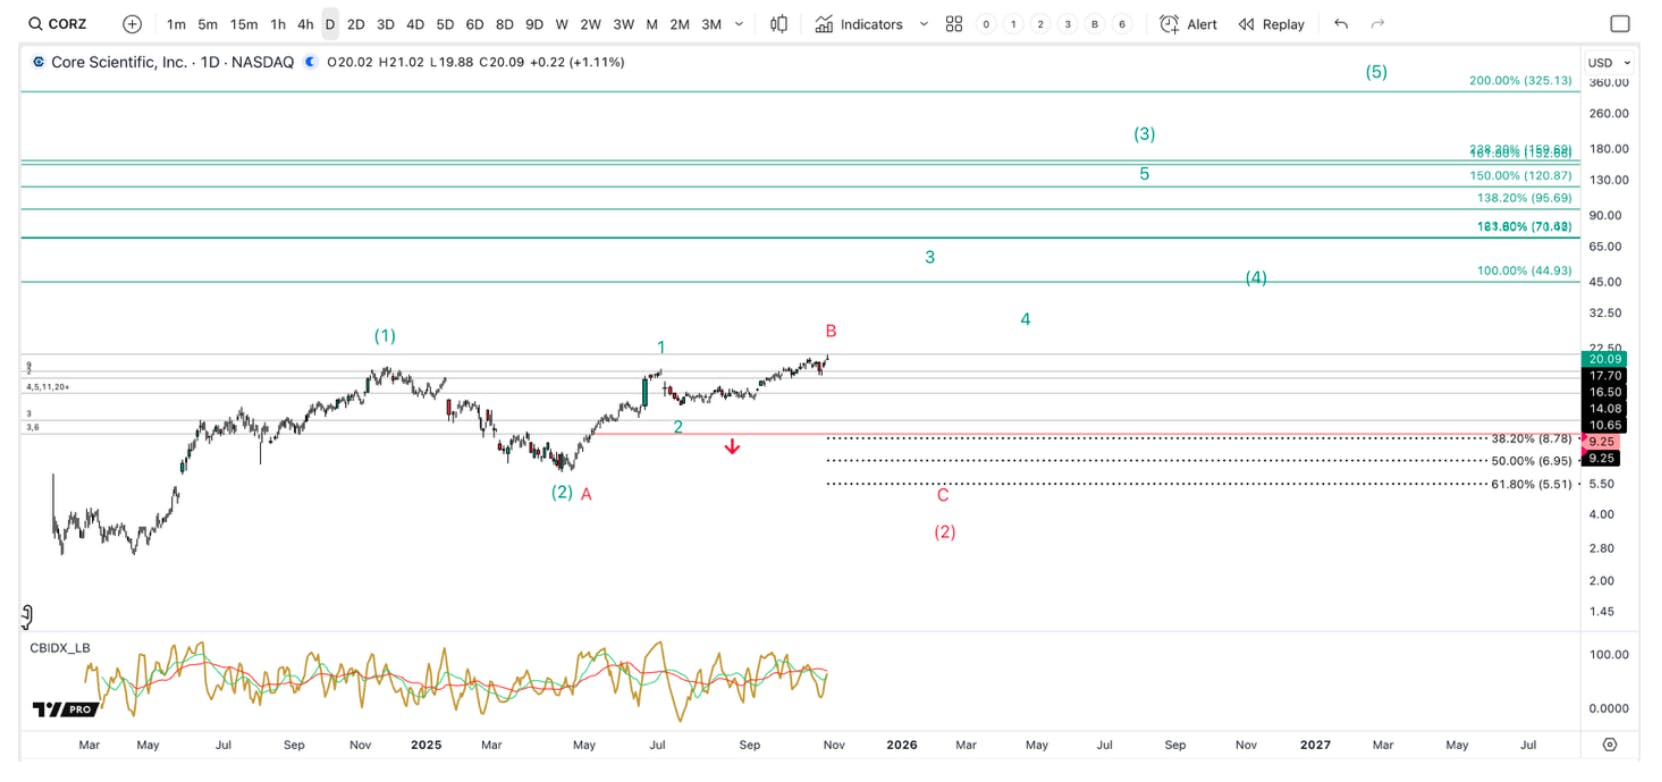
Riot says that completion of the core and shell will enable it “to deliver full build-to-suit data centers in 2027,” hinting that any deals secured with tenants may not contribute meaningful lease revenue until then. Compare this to other miners such as TeraWulf, Applied Digital or Core Scientific, who will already be delivering hundreds of MW of capacity by the end of 2026 and who have deals in place with visible revenue ramps.  

The reason this is important is because miners’ value lies within timing – this is a race for power and how quickly they can deliver data center power to customers. Currently, Riot is slower to execute on the construction side as the language here suggests that the power will be available without a need for further regulatory approvals, rather the build and design phase is the delay: “We have also further progressed on the ongoing infrastructure development at Corsicana, including the 600-megawatt substation expansion, where the first 400-megawatt auto transformer of this expansion development is now on site being installed and remains on track for energization in Q1 next year and the Core & Shell development of the first 2 buildings of our Phase 1 development plan, which will allow us to deliver full build-to-suit data centers in 2027.” 

Later it was stated the Core & Shell development was the more time intensive aspect: “The first phase of construction of the Core & Shell is the most time-intensive but capital-light portion of the build-out with total expected development cost of $214 million, representing approximately $1.9 million per IT megawatt for the first 2 buildings.” 

In total, Riot is aiming to develop 672MW of IT capacity at Corsicana across two separate phases, with this 112MW build part of its first 504MW phase across eight separate buildings. Riot did not provide an update on when it expects to complete this in full, rather stated the pace of development would be dictated by tenant demand.  

For the first 112MW, Riot expects to spend ~$214 million on capex across the next six quarters, translating to ~$1.9 million per MW for the core and shell. Note that this does not include substation capex or land acquisitions, which are expected to be $18 million in Q4, taking total spend on both to ~$138.6 million for the full year. 

Riot’s 1.86GW Offers Rebound on Bottom Line – But When? 

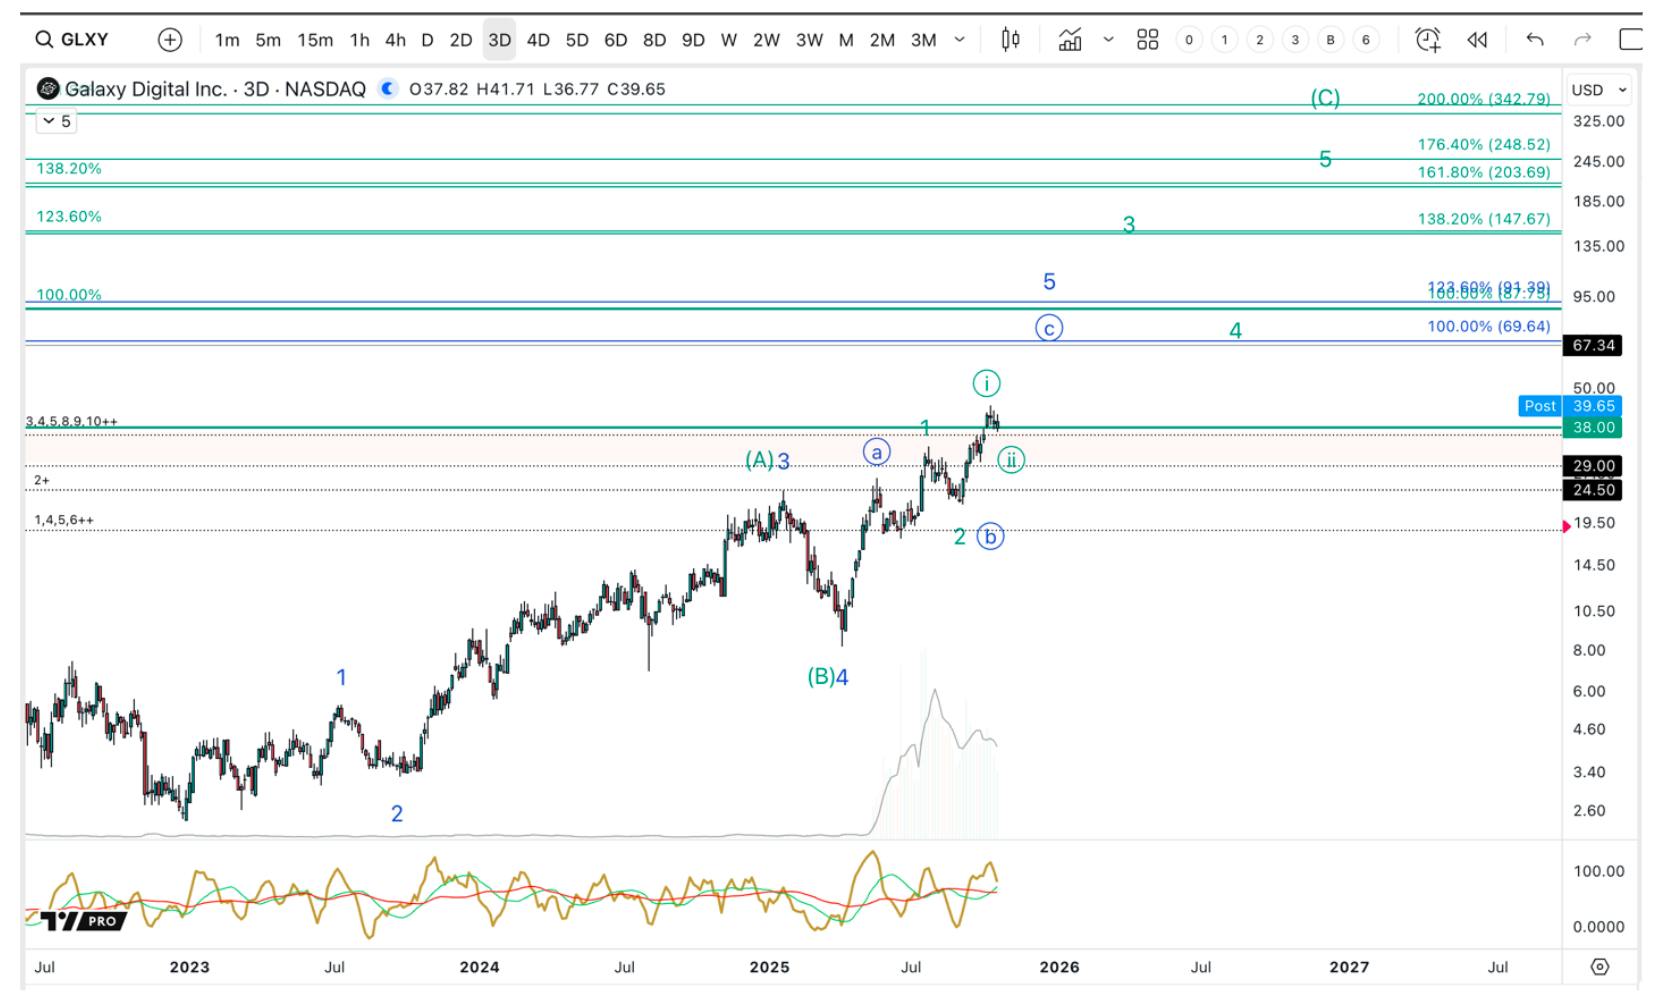
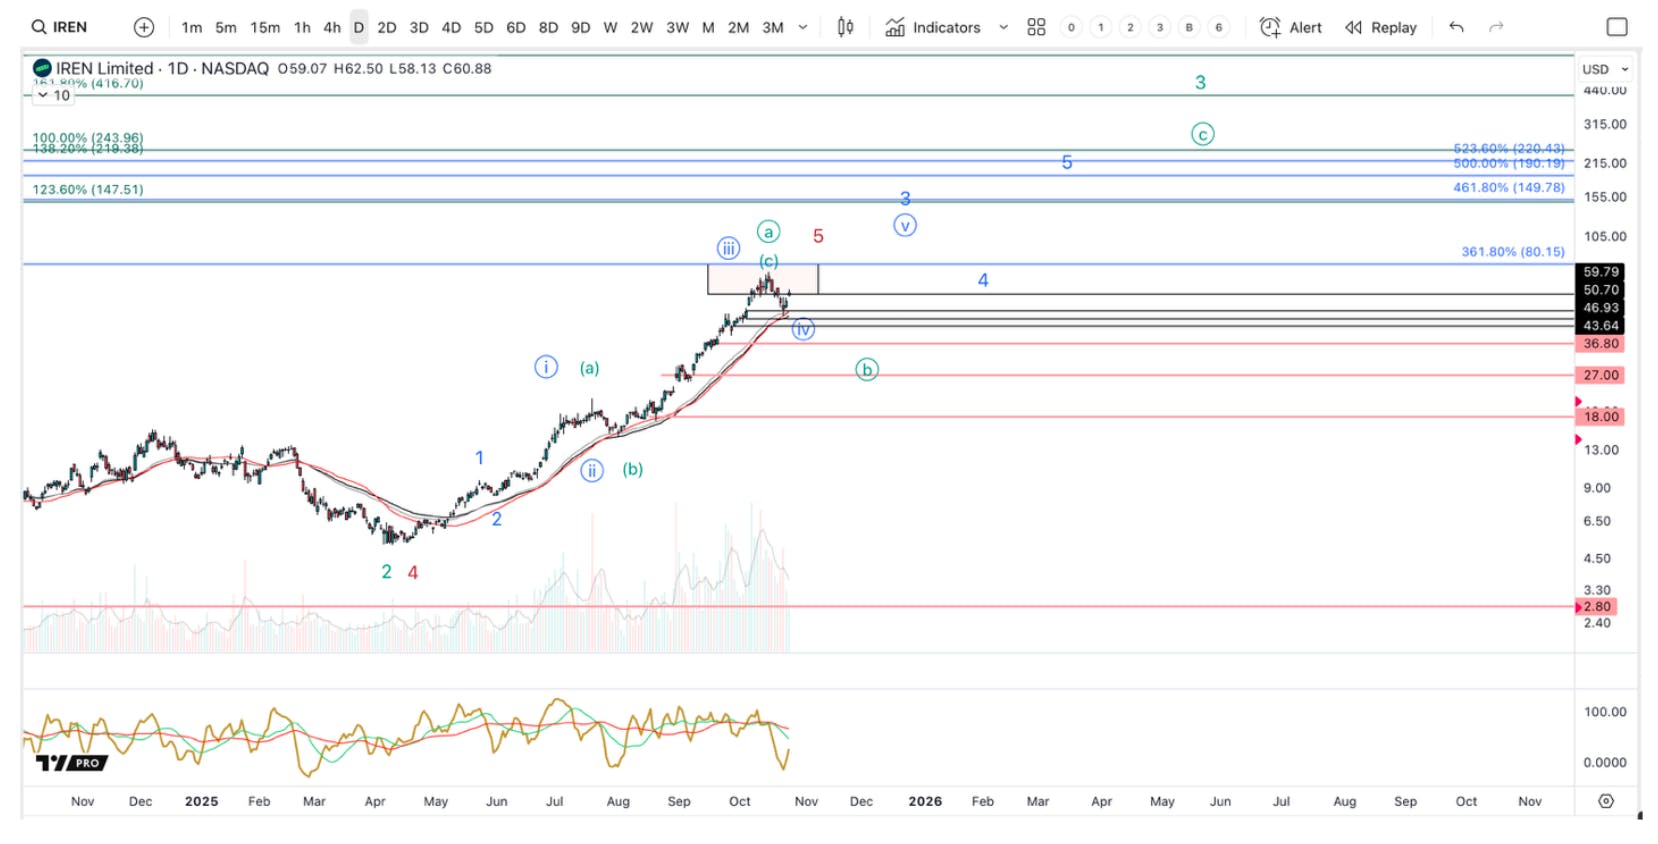
Riot has 1.86GW of power permitted and readily available for use, with the company aiming to transition this entirely over to data center capacity when economically feasible. Riot lags peers with a smaller power pipeline than peers in the Miner Universe, with Applied Digital recently disclosing its active power pipeline tripling in two quarters to 4.3GW. Additionally, Galaxy has up to 3.5GW available, IREN has 2.9GW and Cipher has 2.4GW in its pipeline. 

Similar to the numbers above, we had done some calculations on what the roughly 2GW is worth for Riot and came up with the following: “For Riot’s combined Corsicana and Rockdale facilities offering 1.7GW of available power, and assuming both are fully converted to AI with a 1.3 PUE for ~1.3GW of critical IT load, the two could be worth more than $23 billion for a 10-year deal structured at similar terms, or average annual revenue of $2.34 billion.” 

When we look at 2030 analyst estimates, it seems to be pricing in most of the 2GW with estimates for $2.5B, up from $660M today. Therefore, I’m asserting that most of this has been priced in and there are better deals on the market – with the information I have today.  

Brief Financial Update 

Riot beat on the top and bottom line in Q3 with revenue up 112.5% YoY to $180.2 million, driven by 138% growth in Bitcoin mining revenue to $160.8 million. Engineering revenue was $19.1 million, up 51.1% YoY, while Engineering backlog rose 135.4% YoY and 34.5% QoQ to $159.6 million, with 90% originating from the data center sector. GAAP EPS was $0.26, ahead of estimates for $0.13.  

For our perspective, the most important aspect for Riot boils down to cash and capex, as the company has not yet secured a data center tenant deal and for the moment will be fronting the capex for the powered shell itself.  

Riot reported $330.8 million in cash and equivalents in Q3, while holding 19,287 Bitcoin worth nearly $2.1 billion (including 3,300 BTC held as collateral). Debt was $839.7 million, with $253.2 million current. 

Capex is projected to be $153 million in Q4, with $131.6 million going to miner purchases and miner infrastructure, and the remaining going towards Corsicana’s substation, land and initial capex for the first 112MW. Riot says its key capex needs through year-end are fully-funded with cash on hand, yet current debt suggests the company will need to raise more cash sooner rather than later to progress with more phases at Corsicana.  

Conclusion: 

There is a disconnect between analyst estimates for Riot on the bottom line once Corsicana’s 600MW is delivered as the net operating income will provide a significant boost to the bottom line. We’ve seen this across the board where Miners rebound from being deep in the red from their Bitcoin mining operations to seeing healthy margin expansion.  

However, this one is hard to time – it is a complete guess if Riot can deliver sooner than Q1 2027. In the meantime, we’ve identified some strong trends in play right now that we prefer to re-allocate to.

The Discovery tier offers fast-paced research on new stock ideas the I/O Fund is interested in, with technical setups and comprehensive deep-dive analysis. Be the first to know what exciting new tech, AI and energy stocks the I/O Fund is tracking.

To subscribe to Discovery with 30% off, please click here to email us or email premium@io-fund.com and mention code DISCOVERY30.click here to email usclick here to email us or email premium@io-fund.com and mention code DISCOVERY30.

Please note: The I/O Fund conducts research and draws conclusions for the Fund’s positions. We then share that information with our readers. This is not a guarantee of a stock’s performance. Please consult your personal financial advisor before buying any stock in the companies mentioned in this analysis.

Recommended Reading:

Applied Digital Q1: Active Pipeline Triples in Two Quarters to 4.3GW, Second Hyperscaler Deal Secured

Applied Digital easily beat estimates in Q1 with revenue up 69% QoQ with fit-out revenue contributing significantly in the quarter as the company prepares to roll out its first phase for CoreWeave. Barely two weeks after the earnings report, Applied signed a $5 billion, 15-year lease at Polaris Forge 2 with an unnamed, investment-grade hyperscaler, which helps de-risk its story from being tied solely to CoreWeave. Combined with the neocloud’s lease at PF1, the two deals for will generate $1.07 billion in average annual revenue over the lifetime of the contracts, or ~5X fiscal 2025 revenue, highlighting the attractiveness of pivoting to AI data centers.  

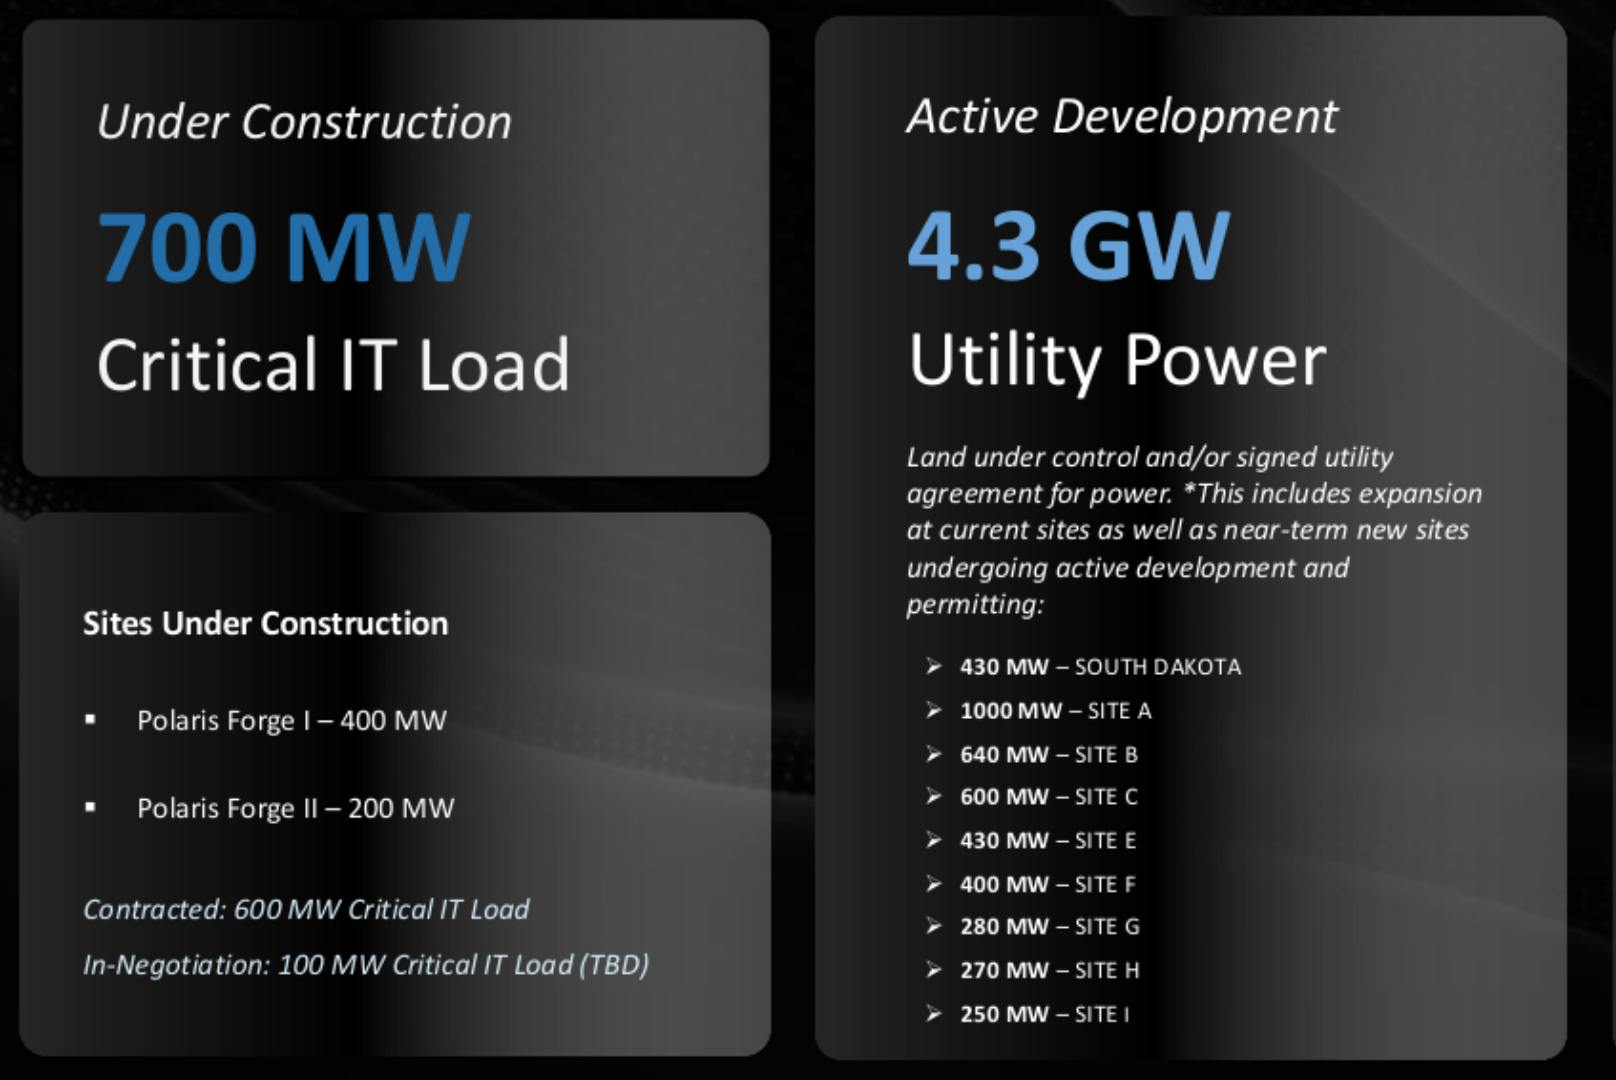
More importantly, Applied also quietly disclosed that they have 4GW in the pipeline with additional capacity under review, doubling from our prior update Applied Digital: Bitcoin Miner Hinting at Rare, Hyperscaler Deal, and nearly 3X more than the 1.4GW disclosed two quarters ago. With only 600MW currently contracted at PF1 and PF2, this hints at substantial upside to contracted revenue and net operating income at full scale.  

Applied Extends Active Pipeline to 4.3GW, the Highest Among Miners 

Perhaps the most important update coming from Q1’s earnings call was that Applied has quickly and quietly expanded its active development pipeline – just two quarters ago, the company disclosed 1.4GW in the pipeline, yet now it has tripled this to 4.3GW this quarter across nine sites. This would rank Applied atop the leading miners, outpacing Galaxy’s 3.5GW and IREN’s 2.9 GW of grid-connected power.  

Source: Applied DigitalApplied Digital 

For the 4.3 GW, CEO Wesley Cummins explained that these are projects “we feel could move into that construction box in the next 6 to 12 months, and some of those could be even sooner. So those are things we're actively working on with permitting, with power, with all of those pieces that we think in the next 6 to 12 months can move into the construction pipeline.”  He added that there is demand for sites ranging from hundreds of MW to a multi-GW scale, with emphasis on sites “built in a single location so that you get the cost advantages of building a scale in a single location,” which Applied’s pipeline covers with sizes from 250MW to 1GW+.  

This is especially important as Applied continues to reiterate its ability to shorten its construction timelines, from 24 months down to 12 to 14 months. Management is working to match the pace of building with power delivery, starting construction early to ensure buildings are prepped and ready once power is available. Essentially, Applied is hinting that with limited holdups from permitting, with smooth power delivery and necessary financing, it could bring its pipeline to power in as quickly as two and a half years.   

This could make the company increasingly more attractive from hyperscalers as other miners are not targeting having even 1GW online by the end of 2027 – management also disclosed that they have “entered negotiations with 2 additional hyperscalers for 2 new locations,” with 100MW under negotiation.  

Should this pipeline materialize to operational capacity, Applied’s revenue and NOI opportunities could be 6X its current contracted capacity of 600MW. Assuming deal terms similar to PF1 and PF2, the remaining 3.7 GW pipeline could be worth $6.1 billion to $6.7 billion in average annual revenue, compared to the $1.07 billion in average annual revenue it has currently contracted out.  

$5 Billion Lease Secured at Polaris Forge 2 

Applied broke ground on Polaris Forge 2 in September, with the facility having an initial 300MW capacity. Applied said in Q1’s call that it has secured financing for the project via Macquarie with an expected cost of $3 billion, or $10 million per MW.  

On October 22, Applied announced that it had signed a $5 billion, 15-year deal with an unnamed hyperscaler for 200MW capacity at PF2. On the headline, this is a slight discount to CoreWeave’s lease at $1.67 million per MW per year on average versus $1.83 million per MW per year, with a slightly lower NOI margin of ~86% +/- 3% versus 88% for CoreWeave’s deal. Management explained that having the hyperscaler provides a lower cost of capital, thus the spread between capital cost and revenue is approximately equal.  

Securing this second deal with a major hyperscaler is important as it helps de-risk the story from being linked to CoreWeave, whose financials are upside down and require creative ways to raise cash to finance lofty growth ambitions.  

“Firmly” On Track to Reach $1B NOI Target in 5 Years 

While the hyperscaler engagement at PF2 is certainly good news to hear, management provided a snapshot into long-term net operating income (NOI) targets, providing a clearer view of how the deals will translate into earnings.   

Management stated that they believe they can reach an “annualized NOI run rate of approximately $500 million once Polaris Forge 1 is fully operational,” while the “tenant signing at our second campus should put us firmly on the path toward our $1 billion NOI target within the next five years.” 

At full scale, the 600MW of contracted capacity would translate into approximately $932 million in NOI based on expected margins of 88% and 86% across its two deals. Looking further out to Applied’s current active pipeline, the remaining 3.7GW could generate around $5.5 billion in annual NOI on average at full scale at similar margins.  

While not a true comparison to NOI, analysts currently project Applied’s EBITDA to rise more than 10X by 2028, from $60.7 million expected this fiscal year to $640.2 million as these two deals begin to ramp towards full capacity. This would represent an expansion of EBITDA margin from 20.4% to 66%, still below targeted NOI margins. Additionally, there is the potential for EBITDA to rise by another factor of 7-8X in the long run if Applied can successfully commercialize its entire active development pipeline. 

Project Financing Deal with Macquarie Unlocks 5X More Capital  

As we discussed in our prior analysis, financing partnerships and capital raises are central to funding Applied and its HPC buildout. In Q1, the company drew $112.5 million from its $5 billion preferred equity financing with Macquarie, which management says helped fund the completion of PF1.   

Applied also secured $50 million from Macquarie Equipment Capital, to help fund the groundbreaking for PF2, while also adding that it intends to tap the $5 billion vehicle to help fund the subsequent buildout. Additionally, Applied noted that subsequent to the quarter, it raised an $200 million from an expanded offering of its Series G Preferred Stock, providing more capital to fund these buildouts.  

In the earnings calls, management noted that they may have the ability to finance both PF1 and PF2 by themselves, but they would prefer to tap the project financing from Macquarie as it lets them unlock significant capacity growth: 

“When you look from a capital perspective, what we're seeking to do there is we could finance the Ellendale campus Polaris Forge 1 by ourselves. We probably even finance Polaris Forge 2 by ourselves.  

But what we're trying to put in place and what we have put in place now is the ability for us to scale much larger. We're looking more into the future and putting a mechanism in place that eliminates or minimizes the dilution at the public company for a set amount at the subsidiary for Macquarie. And this allows us to go forward. The Macquarie Capital, $5 billion of capital really unlocks $20 billion to $25 billion of total capital for us when you include project finance and that allows us to build a significant amount of capacity.” 

Instead of being capital constrained with two builds, Applied believes the $5 billion line from Macquarie could allow them to build >2GW with the amount of capital it can unlock.  

Brief Update on Polaris Forge 1, South Dakota Development 

Applied Digital this week announced that the first 50MW phase for CoreWeave is now ready for service, with the remaining 350MW to be rolled out in phases through 2027.  

The fit-out of PF1 contributed $26.3 million in revenue in the quarter, with this expected to ramp significantly in the first part of fiscal Q2 leading up to the start of service in late October. Now that the first 50MW phase is online, lease revenues will begin ramping in the latter half of fiscal Q2 ending November and ramp further in Q3 as the next 50MW comes online by year-end. 

Applied also provided a brief update on progress in South Dakota, where it was reported back in May 2025 that the company was planning to construct a $16 billion, 430 MW data center. Management said that power would be available in South Dakota in 2026, though the one piece they say is the gating factor for development is a sales tax exemption for IT data center equipment.   

Financials 

Revenue Surges 69% QoQ, Driven by CoreWeave Fit-out 

Applied’s revenue rose 69% QoQ and 84% YoY to $64.2 million, driven primarily by the fit-out of Polaris Forge 1, which contributed $26.3 million in tenant-fit out revenue. This was more than 41% ahead of estimates for $45.5 million in revenue.  

For fiscal Q2, revenue is expected to be $82.2 million, up 28.7% YoY and 28% QoQ. Fiscal Q3 (ending Feb 2026) is currently projected to see $71.4 million in revenue, up 35% YoY but down (13.1%) QoQ as fit-out revenue shifts to lease revenue.  

Fiscal 2026 revenue is expected to be $297.3 million for YoY growth of 106.2%, with fiscal 2027 (ending May 2027) currently projected at $553.0 million for 86% YoY growth. 

Operating Margin Improves Despite Gross Margin Pinch 

Gross margins felt a pinch in Q1 due to the ramp in fit-out activity, though operating margins improved from Q4 yet remain a decent distance from GAAP profitability. 

  • GAAP gross margin was 13.4% in Q1, down from 20.5% in Q4 and 27.6% a year ago due to increase in low margin fit-out revenue. Applied said the $26.3 million in fit-out revenue carried a cost of $25 million, implying barely a 5% gross margin. The ramp of fit-out in Q2 may further pressure gross margin though this should ease by Q3 as lease revenue arises.   
  • GAAP operating margin was (34.7%) in Q1, up from (54.5%) in Q4; the 72.6% year-ago comp is not necessarily comparable due to a $24.8M gain on assets held for sale. Adjusted operating margin was (5.6%), improving from (8.1%) in Q4 but down from 6.2% in the year ago quarter. 
  • GAAP net margin was (28.8%) in Q1, improving from (70%) in Q4 and not comparable to the 45.5% from the year ago quarter. Adjusted net margin was (11.8%), improving from (19.9%) in Q4 but down from (2.3%) a year ago. 

EPS Beats, but Not Yet Profitable 

Applied beat on EPS in the quarter, with adjusted EPS of ($0.03) coming in well ahead of the ($0.16) estimate. GAAP EPS also beat at ($0.07) versus the ($0.13) estimate.  

Looking ahead to Q2, GAAP EPS is expected to dip slightly to ($0.11), likely driven by margin pressure related to the ramp in fit-out revenue, before rebounding slightly to ($0.09) in Q3. For fiscal 2026, GAAP EPS is projected at ($0.45), before improving to ($0.27) in fiscal 2027 and shifting to a profit of $0.86 in 2028. 

Cash Flows Heavily Negative on High Capex 

Cash flows were heavily negative, with FCF margin widening to (516%) in Q1 driven by a sharp increase in capex.  

  • Operating cash flow was ($82.0 million) for (127.7%) margin, down from 18.0% in Q4 but improving from (217.8%) in the year ago quarter. 
  • Free cash flow was ($331.4 million) for a (516.1%) margin, driven by $249 million PP&E purchases. This compared to a (503.5%) margin in Q4 and a (375%) margin in the year ago quarter. 
  • Cash and equivalents totaled $114.1 million, not including Applied’s $362.5 million raise subsequent to quarter-end. Debt totaled $687.3 million. 

Conclusion 

Applied’s second deal with a hyperscaler customer at PF2 boosts confidence in its AI data center hosting story and de-risks it from CoreWeave, putting it firmly on track to reach its $1 billion net operating income target by 2030, up from $60.7 million expected this fiscal year. Additionally, Applied disclosed that they have an active pipeline of 4.3 GW but with only 700 MW of capacity under construction, highlighting that revenue and NOI opportunities at full scale could be up to 6X larger at similar terms.

Damien Robbins, Equity Analyst at I/O Fund contributed to this analysis.

Please note: The I/O Fund conducts research and draws conclusions for the company’s portfolio. We then share that information with our readers and offer real-time trade notifications. This is not a guarantee of a stock’s performance and it is not financial advice. Please consult your personal financial advisor before buying any stock in the companies mentioned in this analysis. Beth Kindig and the I/O Fund own shares in APLD at the time of writing and may own stocks pictured in the charts.

Recommended Reading:

Reddit Q3: Setting a High Bar with Top Line Strength and 10-point Sequential Margin Expansion 

Reddit’s earnings report ticked a lot of boxes. The company beat on the top line with growth of 68% YoY and 17% QoQ. The bottom line was also strong with a 10-point sequential expansion in GAAP operating margin to 23.7%, an adjusted EBITDA margin above 40%, and EPS grew 400% YoY. It’s easy to see why this stock ranked very high on my Top 15 list – in fact, it was my top software choice due to the clean fundamentals.  

Reddit represents monetization momentum in the AI era as its data is highly valuable for training LLMs. There is something far more important that Reddit provides in the AI era than simply a forum; rather Reddit offers a continuous supply of human-generated conversations. What was once a forum is now a wealth of opinions and loads of sentiment that AI models desperately need to produce more natural and sentient-sounding responses. In fact, about a week ago, Reddit announced they are suing companies like Perplexity and Anthropic for scraping their site.  

In exchange for data, Reddit ranks high on Google Search and in AI search results from Open AI, as well. This has helped Reddit move from #85 ranked site to #2 when we last covered the stock. Management stated they are currently ranked #3 this month: “Today, Reddit is the #3 most visited site in the U.S. for Semrush October 2025. That puts us in a rare company. YouTube is #2 and Amazon is #4.” The increased search ranking helped Reddit grow both their daily active users (DAUq) and weekly active users (WAUq) at a rate of 20% YoY.  

With that said, Reddit’s report was not a Perfect 10 – it was more like a 9 out of 10. First, the logged-out user growth is outpacing the logged-in user growth, which will take some getting used to for Street analysts as they often imply in the Q&A that logged-out users don’t monetize as well.  

Second, Reddit has put up some strong post-IPO growth rates with five quarters above 60% growth, yet management guided for 54% revenue growth next quarter and analysts see Reddit dipping below 40% growth two quarters out. We will want to watch this closely as IPOs are known for coming strong out of the gate. As stated in the Top 15 report, every stock must prove it belongs in our portfolio. Therefore, Reddit will need to prove to us that it can maintain a healthy growth rate to hold its spot. There are some strong tailwinds, yet accelerating revenue in the near future will be key for this stock. 

Reddit’s Future Growth Opportunities – Search and More 

A study by Profound from August 2024 to June 2025 of 30 million citations across ChatGPT, Google AI Overviews, and Perplexity revealed that the latter two frequently cited Reddit, while ChatGPT primarily cited Wikipedia. Reddit was the top citation for Google’s AI Overviews at 21% and for Perplexity at 46.7%, while at ChatGPT, Reddit was the second most cited source at 11.3%, far behind Wikipedia at 47.9%.  

However, per Promptwatch, Reddit’s share of citations on ChatGPT fell from ~14% in early September down to 2-4%. As of mid-October, Reddit remained the most frequently cited social platform at 3.3%, slightly behind Profound’s data showing 3.8%.  

Source: Promptwatch 

Overall, the vast treasure trove of Reddit’s user-generated, opinionated content backed by structed engagement data is increasingly valuable to LLMs, as Reddit executives explained at the Zero Click Summit in October. This could lead to more lucrative licensing deals in the future. 

Management implied Q4 is looking strong so far on growth trends: “Looking into Q4, we exited Q3 higher than our average. So we have a head start. Beyond that, we're going to see how the quarter plays out.” 

There was also discussion on the call about reducing friction as Reddit’s onboarding is fairly clunky and invasive in terms of accessing content a user wants to see: “But today, it's behind a couple of screens of interrogation before you actually get to see it. And so really streamlining that or even removing it are the things that we're putting in the test shortly and making sure users are landing on speeds that are relevant to them.”  

Later, it was discussed that knowing personal information on a user may not necessarily lead to a higher path of monetization for Reddit, which leaves an important clue as to how Reddit could spark future growth – from what I gather, removing the need to be logged in could be Reddit’s next step to driving more growth: “And finally, I think your third question was capturing identity of logged out users. Look, all of Reddit is really built around this idea of connecting users with their interests. So not necessarily what or who they are, but what they're into on Reddit. And so that's how we're different than some other platforms. We don't need to know who you are or necessarily even how old you are or other demographics because we look at your explicit interest on Reddit, right? Are you part of the skiing community, you're probably in the outdoor stuff. Are you coming from a parenting blog, you're probably a parent. And so that's generally how we think about it. And I think it's a little bit of a different model, but I think it's better for user privacy, and we can target on, I think, a unique but really powerful dimension.” 

Reddit’s Web Rankings, Engagement Remain Solid Since Q2 

As a brief recap, Reddit was the 2nd most visible site August, behind Wikipedia, and ahead of popular sites such as Facebook in 7th, Amazon in 4th, and even YouTube in 3rd. In October, Reddit’s web rankings continue to remain strong, with Sistrix placing it as the third most visible site as of October 30, with YouTube taking the 2nd place spot.  

In terms of user engagement, Reddit notched 3.8 billion visits in September, down (5.4%) MoM after rising 1.5% MoM in August, per Similarweb, slightly underperforming Facebook, which saw monthly visits decline (4.7%) MoM to 11.4 billion. In the US, Reddit’s web traffic was estimated to be down (5.8%) MoM in September, versus (5.1%) for Facebook. Similarweb places Reddit as the fifth-most visited site in the US, behind Facebook in fourth place.  

However, it’s important to remember that this is a factor that’s entirely out of Reddit’s control as algorithms and rankings could change anytime. 

Reddit Sues Perplexity for ‘Illegal’ Data Scraping 

Despite being Perplexity’s preferred source for AI searches, Reddit sued the startup in early October, claiming it was scraping data from Reddit without permission to train its AI responses. Reddit claims that it created a “test post” that was only visible to Google’s crawler, but “within hours”, Perplexity’s queries contained contents of the post, suggesting Perplexity or its three data scraping partners scraped Google and then incorporated that data into its engine. 

Rumors of New Data Licensing Pricing with Google, OpenAI 

In mid-September, it was rumored that Reddit was exploring new data licensing deals with Google and OpenAI, with company executives believing current terms with fixed pay do not accurately reflect the value Reddit brings to AI answers, tying in to its high share in AI citations.  

Instead, the company is rumored to be seeking a dynamic pricing model “where pay would be determined by how useful or important content is to the answers generated by AI tools.” This could provide more upside to Reddit’s data licensing side, which currently accounts for 6% of revenue in Q3, considering how frequently it is cited in AI Overviews and on ChatGPT. 

Most importantly, the revenue contribution from Reddit’s partnership with Google is not reported in a linear fashion. During the call, an analyst noted that roughly half of Reddit’s traffic is direct, while half comes from Google. Management confirmed the 50/50 split is “approximate, but pretty close.” This means Reddit is receiving an additional benefit from Google that isn’t fully visible within the data licensing revenue line item – rather, it’s mainly visible in the strong advertising growth from the traffic Google is sending to Reddit. Overall, the true impact of Reddit’s partnership with Google is hard to quantify.  

Strong Q3 Revenue Growth of 68% 

Reddit once again reported stellar revenue growth of 67.9% YoY and 17.1% QoQ to $584.9 million. Revenue growth was more than 60% for the fifth consecutive quarter. The company’s Q3 revenue beat the analyst’s estimates by 6.4%. The strong growth was primarily driven by 74% YoY growth in the advertising revenue to $549 million. While its other revenues, which include licensing deals with Google and OpenAI, rose by a modest 7% YoY to $36 million. Regionally, revenue grew 67% and 74% YoY in the US and internationally, respectively. 

The company has also guided strong Q4 guidance in the range of $655 million to $665 million, representing a YoY growth of 54.3% YoY and 12.8% QoQ. The company’s Q4 guide beat the analysts’ estimates by 3.5%. Analysts expect revenue to grow 42% YoY in Q1 and 34.8% YoY in Q2 to $673.6 million. 

The co-founder and CEO, Steven Huffman, highlighted during the earnings call that Reddit is the #3 most visited site in the U.S. per Semrush, October 2025. The company is also making strong progress across the 3 focus areas they shared last quarter: core product, search, and internationalization. 

The company has redesigned the website with a more modern, search-forward interface and streamlined onboarding, making it easier for new users to find what they're looking for. This is achieved through a dynamic, personalized home feed, along with the incorporation of AI tools.  The company also continues to enhance search results to make Reddit a go-to search destination. Third, international growth continues to accelerate, and AI-powered machine translation is now available in 30 languages, serving as a major driver of top-of-funnel growth outside the U.S.   

Looking forward, analysts expect revenue to grow 35.8% YoY to $2.83 billion in 2026 and 29% YoY growth to $3.65 billion in 2027. 

Advertising Revenue Growth of 74% 

The Q3 advertising revenue grew by 74% YoY to $549 million, primarily driven by broad-based strength across the business as the company continues to expand existing relationships, acquire new customers and diversify its advertising base. The total active advertising customers grew by over a solid 75% YoY as the company added new accounts across businesses, including large mid-market and SMB businesses.  

The company’s AI-optimized ad platform continues to drive strong growth in the second half of the year. The strong advertising revenue growth is a direct result of Reddit’s ongoing investments in AI ad models and formats, which drive greater performance and efficiency, leading to better ROI for advertisers.  

The company continued to optimize the models for lower-funnel objectives, including app installs and conversions. The ML-driven optimizations in the lower-funnel conversion objective improved performance by over 20%. To strengthen the lower-funnel strategy, it continues to make it easier for businesses of all sizes to adopt the measurement tools, including Pixel and conversions API (CAPI). In Q3, CAPI-covered conversion revenue tripled year-over-year. 

For the upper funnel, the company launched the beta of auto bidding, which simplifies budget management and improves efficiency, leading to over 15% more impressions and lower pricing for advertisers. In the middle and lower funnel, auto targeting is delivering strong results, and adoption is growing over 50% year-over-year. 

ARPU grows by 41% 

The company’s Q3 Average revenue per user (ARPU) grew by 41% YoY to $5.04. Management believes that this is still low on an absolute basis and remains an opportunity for the company. Though growth has decelerated from 47% reported in Q2 due to tough comps, it was up 11% on a sequential basis. 

The US ARPU grew by 54% YoY to $9.04, a 5-point deceleration from a strong 59% YoY growth in Q2. However, it grew by 15% sequentially. 

The International ARPU grew by 39% YoY to $1.84, a slight deceleration from the 40% growth reported in Q2 and was up 6% sequentially.

The company’s Daily Active Uniques (DAUq) are witnessing strong international growth. The Daily Active Uniques (DAUq) global grew by 19% YoY to 116 million. While US growth is stabilizing as it grew by 7% YoY to 51.6 million, it showed a sequential growth of 3%, while it was flat in Q2. The international DAUq growth was solid as it was up 31% YoY to 64.4 million.   

The company’s Weekly Active Uniques (WAUq) grew by 21% YoY to 443.8 million. International growth outpaced US growth as it grew by 37% YoY to 256 million, while the US grew by 6% YoY to 187.8 million. 

Operating Margins Expand 21.7% YoY 

The company is experiencing strong profit growth, primarily driven by operating leverage.  

  • Q3 gross profits grew by 69.7% YoY to $532.4 million with a gross margin of 91%. The gross margin is up 90 basis points YoY and up 20 basis points sequentially. The company reported its fifth consecutive quarter of above 90% gross margins. 
  • Operating income was $138.5 million compared to a mere $6.9 million in the same period last year. Operating margin improved by 21.7 percentage points YoY and 10.1 percentage points sequentially to 23.7%, primarily driven by operating leverage. 
  • Net income grew by 444% YoY and up 82.1% QoQ to $162.6 million. Net profit margin improved by 19.2 percentage points YoY and 9.9 percentage points sequentially to 27.8%. 

EPS grew by 400% 

The company’s Q3 GAAP EPS grew by 400% YoY and 78% sequentially to $0.80, beating analyst estimates by a solid 53.8%. Analysts expect EPS to grow 119.6% YoY to $0.79 in Q4 and 226.7% YoY growth to $0.42 in Q1 2026. Looking forward, they expect EPS to grow 76.3% YoY to $3.35 in 2026 and 39.9% YoY to $4.69 in 2027. 

Q3 adjusted EBITDA grew by 151% YoY to $236 million. Adjusted EBITDA margin improved by 13.3 percentage points YoY and 6.9 percentage points sequentially to 40.3%, beating the management guidance by 5.1 percentage points. 

Management has guided Q4 adjusted EBITDA in the range of $275 million to $285 million, representing a YoY growth of 81.5% at the midpoint. Adjusted EBITDA margin guide for Q4 is 42.4%, which represents a YoY increase of 6.3 percentage points.

Cash Flow and Balance Sheet 

The company reported strong cash flows primarily driven by record profits.  

  • Q3 operating cash flows grew by 158.6% YoY to $185.16 million with an operating cash flow margin of 31.7%, up 11.1 percentage points YoY. 
  • Q3 free cash flows grew by 160.5% YoY to $183.1 million, with a free cash flow margin of 31.3%, up 11.1 percentage points YoY. The company generated $510 million in free cash flows in the last twelve months. 
  • The company has a strong balance sheet of $2.23 billion in cash and no debt. The cash increased by $170 million sequentially. 

Conclusion: 

The true impact of Reddit’s partnership with Google is hard to exactly quantify given it’s more about the traffic Reddit receives than the licensing revenue – however, web rankings help support that Reddit has officially arrived in the AI era. The primary reason that Reddit could remain in a leading position longer than one might imagine is the uniqueness of the data. As the COO stated: “I think Reddit's corpus of information is clearly incredibly valuable and helpful to LLMs because it's human conversation that's fresh, it's authentic. It's just distinctive. There's nothing like it.” 

Reddit delivered one of the strongest prints of the season so far: a top-line and bottom-line beat, nearly 10-point margin expansion sequentially, cash flow margins above 30%, ARPU up 41% YoY, and revenue increasing 17% QoQ. Although Reddit reported early in the earnings season, the company has set a remarkably high bar — one that very few tech companies will be able to keep up with as more earnings results continue to roll in.

I/O Fund Equity Analysts Damien Robbins and Royston Roche contributed to this analysis. 

Please note: The I/O Fund conducts research and draws conclusions for the Fund’s positions. We then share that information with our readers. This is not a guarantee of a stock’s performance. Please consult your personal financial advisor before buying any stock in the companies mentioned in this analysis.

Recommended Reading:

Decoding the S&P 500: When Human Sentiment Meets Artificial Intelligence

In a recent interview on Thoughtful Money, famed economist David Rosenberg stated that the percentage of the U.S. economy currently expanding—when weighted by population—is only 18%. In other words, 82% of the U.S. economy is flat or in contraction. To make this statistic even more startling, he noted that just six weeks ago, over 40% of the economy was expanding, signaling a rapid deterioration in growth. 

The last two times we saw less than one-fifth of the U.S. economy expanding was the summer of 2020 and the winter of 2009—two of the most difficult periods for the American economy in decades. Yet today, the S&P 500, NASDAQ, Dow Jones Industrial Average are at all-time highs, while credit spreads remain near historic lows. 

The reason lies in the remarkable fact that the small portion of the economy that is still expanding is tied to artificial intelligence, which continues to show no signs of slowing down. This is largely driven by a handful of hyperscalers, who are spending hundreds of billions of dollars annually on AI data center capital expenditures and that spending continues to accelerate. In fact, analyst estimates have consistently failed to keep pace with the actual rate of AI infrastructure investment. A year ago, expectations for Big Tech capex stood at roughly $250 billion. Morgan Stanley later projected $300 billion for 2025, yet that number has already risen to $365 billion with one quarter left to go. 

Though it may seem overly simplistic, the reality is that if hyperscale’s capex continues to grow, it is unlikely that the U.S. economy will fall into a recession—even with more than 82% of its sectors already contracting. 

To say that this is an unparalleled economic backdrop would be an understatement. Each week, a new thesis emerges, warning of an AI bubble, citing historic valuations and drawing parallels to the dotcom bust. Yet the market—and Big Tech capex—continues to march higher, leaving many investors unsure of what comes next. 

While the current environment is unprecedented, what never changes is human sentiment. Arguably the most underestimated force driving markets, sentiment remains something economics has no meaningful way to measure. Only through technical analysis can we quantify market psychology and define risk parameters that keep us out of trouble while allowing us to participate in the uptrend. 

In this report, we will analyze the sentiment pattern shaping the current bull cycle. We will then place that pattern within the context of the larger secular bull market to better understand when the music might stop—and how we plan to potentially navigate this environment when it does happen.

Defining the End Game: Decoding the S&P 500's Long-Term Elliott Wave Count 

On October 13th, 2022, the S&P 500 bottomed, after selling off approximately 25% in just under eight months. Since this low, the market is up around 95% in a new bull market, as investors continue to wonder how much further this new bull cycle can go. Using technical analysis, we can get a rough idea of how much longer this cycle can continue by analyzing the pattern of this bull cycle, and how it fits into the context of the larger pattern in play. 

What is clear about the current bull cycle is that the pattern is what’s called a diagonal. A diagonal is a 5-wave pattern where each of the sub-waves is a series of 3-wave patterns. The primary characteristic of this pattern is that the explosive 3rd wave fails to take off, and the 4th wave tends to be very deep, retracing close to, or into 1st wave territory.

Illustration of Elliott Wave Ending Diagonal, showing a 5-wave motive pattern where each sub-wave forms a 3-wave correction, indicating trend exhaustion.

Elliott Wave Ending Diagonal: A 5-wave motive pattern where each sub-wave is a 3-wave correction, signaling trend exhaustion. 

Image by I/O Fund 

This is a very distinct and common pattern that we see in capital markets. What is unique about the current diagonal pattern is its size. It is rare to see a multi-year diagonal pattern in play, which is exactly what the market is tracing in real-time.

S&P 500 (SPX) chart showing a large Elliott Wave Ending Diagonal pattern, with the market currently in its final 5th wave and potential continuation toward 2026 targets between 6820 and 7600.

S&P 500 Index (SPX) Chart: Large Elliott Wave Ending Diagonal formation, showing the market currently in its final 5th wave with potential continuation to 2026 targets (6820-7600). 

Image by I/O Fund 

As you can see above, the S&P 500 is likely in the final stages of a multi-year diagonal pattern. Note the overlapping swings in both directions, as well as the very deep 4th wave drop in March of 2025. This puts us squarely in the 5th wave of this pattern. Based on the current price action, the below counts best projects where this diagonal can go: 

  • Green Count –The move off the April low of this year is the A wave within the final 5th wave. We should see some type of B wave correction in the coming weeks to months, followed by a final, multi-month blow off swing into 2026. This will complete the diagonal pattern, setting the market up for a period of volatility.
  • Blue Count – We are in the final swings of the 5th wave. As long as 6345 and then 6205 holds on any further weakness, we should see a continued push higher into Q4 with target between 6820 – 7280. 

The green count is further supported by the NASDAQ-100. It too appears to be tracing a diagonal pattern.  

NASDAQ-100 (QQQ) chart illustrating a multi-year Elliott Wave Ending Diagonal pattern in its final stages, signaling a major bull cycle ending in 2026.

NASDAQ-100 (QQQ) Chart: Multi-Year Ending Diagonal pattern (Elliott Wave Theory) in its final stages, projecting a major bull cycle end in 2026. 

Image by I/O Fund 

While we do have a full 5 waves in place, which is enough to complete the pattern in full, note the symmetry of this final 5th wave compared to the 1st wave. To fill out the pattern completely, the NASDAQ-100 suggests a correction and continuation into 2026.

Secular Bear Warning: The Market Reality After an Ending Diagonal Completes 

Another key element of diagonal patterns is their placement within a trend. They can only show up in two places: (1) a leading diagonal is the 1st move higher within a larger trend that is starting. In other words, it is wave 1 in a newly developing 5-wave pattern; (2) an ending diagonal is the final move within a completing 5-wave pattern. In other words, it is wave 5 within a larger 5 wave pattern that is close to completion.

This begs the question: if the current bull cycle we are in is the start of a much larger 5 wave pattern, or the end move within a larger 5 wave pattern? If we zoom out on the larger pattern in play, it appears to be an ending diagonal within the secular bull market that started in 2009.

S&P 500 (SPX) long-term chart showing the I/O Fund’s analysis of the secular bull market that began in March 2009, currently in its final 5th Elliott Wave.

S&P 500 (SPX) Long-Term Chart: The I/O Fund's Analysis of the Secular Bull Market (March 2009) in its Final 5th Elliott Wave. 

Image by I/O Fund 

The above monthly chart of the S&P 500 shows a very clear and distinct secular bull market that took the shape of a 5-wave uptrend. Note how the bull market in 2017 was marked with peak momentum, followed by the vertical move after the COVID low. We have continued to see the market make new highs on weaker momentum, which is characteristic of 5th waves.  

Most importantly, though the bear market in 2022 was difficult, as you can see on the chart above, it was merely a bump in the road of the larger bull trend. In short, it was not deep enough, nor long enough to constitute a reasonable consolidation of the secular bull market that started in 2009. In other words, if one were to say the 5-wave pattern, and secular bull market, ended at the start of 2022, we would need to see a consolidation/retrace that matches the length of the uptrend in both price and time. This does not meet that criteria, which tells me 2022 was a correction within the on-going secular bull market.

mid prompt

This leads me to believe that the diagonal pattern we are in is an ending diagonal, which  once completes, will lead to a period of volatility and consolidation that most investors are not prepared for. 

What this suggests is that after the secular bull market completes, we will enter a very normal period of consolidation, known as a secular bear market. Though this may seem impossible, as we have been trained since 2010 to stay long and buy every dip, it is a very normal part of investing. In fact, since 1900, the market has spent 56% of the time in a consolidation period.

S&P 500 historical chart analyzing consolidation periods since 1900, showing that the market spends over half its time (56%) in sideways or bearish phases following extended secular bull markets.

S&P 500 Historical Chart: Analyzing Consolidation Periods Since 1900. Market spends over half its time (56%) in sideways/bearish phases following extended Secular Bull Markets. 

Image by I/O Fund 

Furthermore, the average secular bull market since 1900 has lasted for an average 11.3 years and returns 774%. The current secular bull market has lasted for 16.6 years and returned just over 918%, well over the average, and the 2nd most profitable secular bull market in the last 125 years.

Historical S&P 500 bull markets chart analyzing duration and gains, emphasizing the current secular bull market that began in 2009 as the second longest and most profitable in modern history.

Historical S&P 500 Bull Markets: Analysis of duration and gain, highlighting the current 2009-starting secular bull market as the second longest and most profitable in modern history. 

Image by I/O Fund 

The below analyzes the last secular bear market between 2000 – 2009 to gain a better understanding of how to best participate in stocks in extended periods of volatility. Like Apple at the turn of the century, there are similar correlations with Nvidia, which we reveal in our long-term chart below.  

Subscribe for Free Below to see how to best survive an extended period of volatility:  

  • Understand why Apple’s lesson, not Cisco, was the most important of the 2000 – 2003 bear market. 
  • Get a glimpse into how we plan to navigate challenging times if they manifest.  
  • Get access to the big picture of Nvidia’s potential path higher, and why it appears to be in a secular uptrend for many years to come, unlike the S&P 500. 

The I/O Fund plans to approach the current market with a well-defined exit strategy. Learn below the strategies we are eyeing should volatility increase. 

From Cisco to Apple to Nvidia: How Market Leaders Emerge Through Secular Bear Markets 

This becomes evident when we analyze the last secular bear market from 2000 – 2009. The S&P 500 topped in a dot.com bubble in March of 2000. It traded sideways until April of 2013, at which point it reclaimed the March 2000 high and never looked back. For 13 years, the market went nowhere and gave investors two greater than 50% drawdowns, in one of the most challenging periods in modern markets.

S&P 500 chart illustrating the post-Dotcom crash period, highlighting a 13-year secular bear market and consolidation phase from 2000 to 2013 following the 2000 market peak.

S&P 500 Post-Dotcom Crash: Chart illustrating the 13-year secular bear market and consolidation phase (2000–2013) following the 2000 market peak. 

Image by I/O Fund 

The poster child of the dot.com bust is Cisco (CSCO). This is a story everyone is familiar with, which is incessantly used as a dire warning about chasing bubbles. Cisco was the leader of the dot.com bull run, returning nearly 700% from the 1998 low to the 2000 top. It then fell 90% and took more than 22 years to reclaim its 2000 top.  

However, no one talks about Apple during the same time, another beneficiary to the dot.com run, returning nearly 1100% during the same period, and then dropping 83% from peak to trough. Interestingly, after putting in a low April of 2003, in less than 2 years, Apple reclaimed its March 2000 top in January of 2005.  

Even more interesting, from January of 2005 to April of 2013, the moment when the S&P 500 reclaimed its March 2000 top, Apple was up over 1000% from its 2000 peak.

Chart comparing Apple stock’s recovery within 5 years after the Dotcom crash to the S&P 500’s prolonged 13-year consolidation phase from 2000 to 2013.

Apple vs S&P 500 (2000-2013): Chart showing Apple Stock's recovery in 5 years while the S&P 500 consolidated for 13 years. 

Image by I/O Fund 

The vital lesson Apple teaches us about normal and extended periods of volatility that occur in the markets is that not all stocks participate. The difference between Apple and Cisco is simple. Apple was one of the primary beneficiaries of the personal computer microtrend and then became the primary beneficiary of the most powerful microtrend in our lifetime – the smartphone. We went from no one having a smart phone in 2007 to nearly everyone in the world having a smartphone today, propelling Apple to becoming the most valuable company in the world – a title it held until recently.  

Technology and innovation do not pause because the stock market is in a secular bear market. These microtrends are multi-decade periods that push forward regardless of the stocks market, minting new leaders along the way.  

If we do see a period of heightened volatility, if the broad market does enter a multi-year consolidation period, like Apple in 2000, the AI microtrend should push forward. This will likely create similar winners, as any deep drawdowns due to macro forces would be viewed as cyclical drawdowns within secular uptrends.  

This is not only anecdotal, but can be seen in various AI charts, like Nvidia, for example. While the most likely interpretation of the S&P 500, shown above, is that we do enter a secular bear market in the coming years, Nvidia, which has been the primary beneficiary of the AI microtrend, appears to be in a secular uptrend for many years to come.  Like Apple from 2007 through 2018, any major drop in price due to macro events will likely be a cyclical drawdown within a secular uptrend.

Nvidia (NVDA) AI stock forecast chart based on I/O Fund’s long-term Elliott Wave count, projecting continued secular uptrend toward Wave V targets, contrasting with the consolidating S&P 500.

Nvidia (NVDA) AI Stock Forecast: I/O Fund's long-term Elliott Wave count projects continued secular uptrend towards its Wave V targets, unlike the consolidating S&P 500. 

Image by I/O Fund 

In conclusion, less than one-fifth of the U.S. economy is expanding, yet this small segment is growing at such a blistering pace—driven by AI-related spending—that it continues to hold up the rest of the economy. We are living through unprecedented times, with no true historical corollary to today’s economic backdrop. 

Of course, this is not the first time such a statement has been made. Every cycle feels unique and unparalleled in the moment. What never changes, however, are human emotions and the way the herd responds to periods of greed and exuberance. 

This is precisely what technical analysis was designed to measure—the repeatable and consistent price patterns that develop in real time. These patterns appear across all time frames, in every market, and throughout market history. According to these patterns, it appears we are now in the final swings of a multi-year ending diagonal—also known as a termination pattern—the final phase of a major uptrend 

That said, this pattern still has the potential to extend into 2026, which remains our expectation as long as key support levels hold. Next week, we’ll dive into another powerful—yet often overlooked—force shaping capital markets: market cycles. We’ll uncover what these cycles are signaling for equities into year-end and 2026, reveal the hidden rhythm behind major turning points, and highlight the critical support levels that must hold to keep our intermediate-term bullish outlook intact. 

This week, Beth Kindig spoiled I/O Fund Members with a 43+ page report on the Top 15 AI Stocks for Q4 2025Top 15 AI Stocks for Q4 2025.  This in-depth report ranks 15 key stocks that are leading the three most powerful trends in AI with many lesser-known names. Not one FAAMG made the list. Last quarter’s report highlighted Bloom Energy, a stock up over 800% from our April buys.  Learn more here.

Please note: The I/O Fund conducts research and draws conclusions for the Fund’s positions. We then share that information with our readers. This is not a guarantee of a stock’s performance. Please consult your personal financial advisor before buying any stock in the companies mentioned in this analysis.

Recommended Reading:

Positions Report – October 2025

Broad Market Price Analysis 

On October 13th, 2022, the S&P 500 bottomed, after selling off approximately 25% in just under 8 months. Since this low, the market is up around 95% in a new bull market, as investors continue to wonder how much further this new bull cycle can go. Using technical analysis, we can analyze the pattern in play for the current uptrend. Furthermore, we can fit this pattern within the larger pattern in play so that we can get a favorable perspective on how to better manage risk.  

As discussed in my upcoming free analysis, the most likely pattern the bull cycle is taking off the 2022 low is what’s called a diagonal. A diagonal is a 5-wave pattern where each of the sub-waves is a series of 3-wave patterns. The primary characteristic of this pattern is that the explosive 3rd wave fails to take off, and the 4th wave tends to be very deep, retracing close to, or into 1st wave territory. 

This is a very distinct and common pattern that we see in capital markets. What is unique about the current diagonal pattern is its size. It is rare to see a multi-year diagonal pattern in play, which is exactly what the market is tracing in real-time.  

As you can see above, the S&P 500 is clearly in the final stages of a multi-year diagonal pattern. Note the overlapping swings in both directions, as well as the very deep 4th wave drop in March of 2025. This puts us squarely in the 5th wave of this pattern. Based on the current price action, the below counts best project where this diagonal can go: 

  • Green Count – This is the primary scenario I am tracking.  The move off the April low of this year is the A wave within the final 5th wave. We should see some type of B wave correction in the coming weeks to months, followed by a final, multi-month blow off swing into 2026. This will complete the diagonal pattern, setting the market up for a period of volatility.  
  • Blue Count – We are in the final swings of the 5th wave. As long as 6345 and then 6205 holds on any further weakness, we should see a continued push higher into Q4 with target between 6820 – 7280. 

The green count is further supported by the NASDAQ-100. It too appears to be tracing a diagonal pattern.  

While we do have a full 5 waves in place, which is enough to complete the pattern in full, note the symmetry of this final 5th wave compared to the 1st wave. In order to fill out the pattern completely, the NASDAQ-100 suggests a correction and continuation into 2026

What Happens When a Diagonal Ends? 

Another key element of diagonal patterns is their placement within a trend. They can only show up in two places: (1) a leading diagonal is the 1st move higher within a larger trend that is starting. In other words, it is wave 1 in a newly developing 5 wave-pattern; (2) an ending diagonal is the final move within a completing 5 wave pattern. In other words, it is wave 5 within a larger 5 wave pattern that is close to completion.  

This begs the question on if the current bull cycle we are in is the start of a much larger 5 wave pattern, or the end move within a larger 5 wave pattern? If we zoom out on the larger pattern in play, it appears to be an ending diagonal within the secular bull market that started in 2009.  

The above monthly chart of the S&P 500 shows a very clear and distinct secular bull market that took the shape of a 5-wave uptrend. Note how the bull market in 2017 was marked with peak momentum, followed by the vertical move after the COVID low. We have continued to see the market make new highs on weaker momentum, which is characteristic of 5th waves.  

Most importantly, though the bear market in 2022 was difficult, as you can see on the chart above, it was merely a bump in the road of the larger bull trend. In short, it was not deep enough, nor long enough to constitute a reasonable consolidation of the secular bull market that started in 2009.  

This leads me to believe that the diagonal pattern we are in is an ending diagonal, which once completes, will lead to a period of volatility and consolidation that most investors have not experienced.  

What this suggests is that after the secular bull market completes, we will enter a very normal period of consolidation, known as a secular bear market. Though this may seem impossible, as we have been trained since 2010 to stay long and buy every dip, it is very normal part of investing. Since 1900, the market has spent 56% of the time in a consolidation period.  

Furthermore, the average secular bull market since 1900 has lasted for 11.3 years and returns 774%. The current secular bull market has lasted for 16.6 years and returned just over 918%, well over the average, and the 2nd most profitable secular bull market in the last 125 years.  

If we do enter a period of extended volatility and choppy markets, this does not mean that investors should avoid the stock market. What it does mean is that the easy period of mindless buy and hold and buy ever dip will not be the winning strategy going forward. Instead, and active approaching that favors focused stock picking will likely be the strategy that profits.  

This becomes evident when we analyze the last secular bear market from 2000 – 2009. The S&P 500 topped in dot.com bubble in March of 2000. It traded sideways until April of 2013, at which point it reclaimed the March 2000 high and never looked back. For 13 years, the market went nowhere and gave investors 2 greater than 50% drawdowns.  

The poster child of the dot.com bust is Cisco (CSCO). This is a story everyone is familiar with, which is incessantly used as a dire warning about chasing bubbles – CSCO was the leader of the dot.com bull run, returning nearly 700% from the 1998 low to the 200 tops. It then fell 90% and took more than 22 years to reclaim its 2000 top.  

However, no one talks about Apple during the same time, another beneficiary to the dot.com run, returning nearly 1100% from during the same period, and then dropping 83%. Interestingly, after putting in a low April of 2003, in less than 2 years, Apple reclaimed its March 2000 top in January of 2005.  

Even more interesting, from January of 2005 to April of 2013, the moment when the S&P 500 reclaimed its March 2000 top, Apple was up over 1000%. 

The vital lesson Apple teaches us about normal and extended periods of volatility that occur in the markets is that not all stocks participate. The difference between Apple and Cisco is simple. Apple was one of the primary beneficiaries of the personal computer microtrend and then became the primary beneficiary of the most powerful microtrend in our lifetime – the smart phone. We went from no one having a smart phone in 2007 to nearly everyone in the world having a smart phone today.  

Technology and innovation do not pause because the stock market is in a secular bear market. These microtrends are multi-decade periods that push forward regardless of the stocks market, minting new leaders along the way.  

If we do see a period of heightened volatility, if the broad market does enter a multi-year consolidation period, like Apple in 2000, the AI microtrend will push forward. This will likely create similar winners, which we would view as cyclical drawdowns within secular uptrends. 

This is not only anecdotal, but can be seen in various AI charts, like Nvidia, for example. While the most likely interpretation of the S&P 500, shown above, is that we do enter a secular bear market in the coming years, Nvidia, which is the primary beneficiary of the AI microtrend, appears to be in a secular uptrend for many years to come.  Like Apple from 2007 through 2018, any major drop in price due to macro events will likely be a cyclical drawdown within a secular uptrend. 

I/O Fund Portfolio 

Starting in September, we began the process of raising cash while also rotating further into the AI energy theme – a theme that we first authored as far back as 2024. During this time we were able to log some meaningful gains:  

  • Closed TSM for a 41% gain. 
  • Closed DELL for a 35% gain.  
  • Closed CORZ for a 194% gain 
  • Trimmed AMD for a 34% gain. 
  • Trimmed INOD for a +80% gain. 
  • Trimmed APP for a +60% gain. 
  • Trimmed ALAB for a 335% gain.  
  • Trimmed BE for a +320% gain. 
  • Closed OKLO for a 54% gain. 
  • Trimmed APLD for a 89% gain. 
  • Trimmed WULF for a 23% gain. 

We were fortunate enough to take gains in APP at $626, just before selling off 27% from its high. We did the same in ALAB clocking gains as high as $232 before it saw a 43% drop from its highs. These moves put us back into a sizable cash position, which we have been deploying on nearly a daily basis since the volatility began just a few weeks ago.  

Furthermore, we decided to close the above positions because they no longer fit our investing criteria or hit a stop – e.g., DELL’s thin margins, TSM’s obvious 5th wave push, and OKLO breaking below our stop. Instead, we have shifted to positions that we believe should do better in the current environment. This should not be confused with the I/O Fund asserting if a stock will continue to go up or not, rather we are asserting that other stocks fit our criteria better at this time. This is about probabilities, not about finalities.  

For a more detailed look into the themes that we are investing in today, please read Beth’s most recent Top 15 AI Stocks Q4 2025 Report

The below pie chart is our current portfolio, We are still holding about 1/3 of the cash position we built up and will continue to target the names within the trends we identified in Beth’s Top 15 AI Stocks Q4 2025 Report. As long as critical supports hold within the broad market, expect more buys over the coming weeks.  

Hedge Update 

As many are aware, we are pivoting our current hedge strategy into more of a trend following system. Unlike many trend following systems, our goal is to actively manage how we layer into and out of our hedge based on critical levels breaking within a trend. As of now, the critical levels are 6345 SPX and 6205 SPX. These levels could move higher if we continue to trend higher; however, until these levels are broken, we will remain unhedged and long this market. 

Furthermore, we ran an updated correlation screen recently against our portfolio through 2025. Our goal is finding an ETF or combination of ETFs that will closely mimic the beta of our portfolio, which we can use to short against our portfolio so that we can approach being market neutral during times of volatility. As of this week, the closest match to our portfolio is no longer a mix between QLD+USD; it is the VanEck Semiconductor ETF (SMH).  

This is visible in the chart above. We are looking for an ETF that tracks as close to the 1 line as possible, which is SMH. So, moving forward, our new hedge will be for every $1 invested, we will short $0.9 of SMH.

Stock Setups 

 Astera Labs (ALAB)

  • Blue – We are tracing a very large diagonal pattern that started on the 2024 low. The first signal that this count is in play will be a sustained break below $161. The 2nd signal will be any bounce that follows testing this level will be a clear 3-wave pattern. We would make a lower high, and then push toward $132 – $103, which would complete the 4th wave in this on-going, and large diagonal pattern.
  • Green – We are in a standard 5 wave pattern, not a diagonal. The $161 level should hold, and the next bounce will be a more direct 5-wave pattern that makes a fresh all time high. We will then press toward the $460 region, which will complete the 3rd wave in this very large 5 wave pattern.  

Nvidia (NVDA) 

  • Blue – We are completing wave 3 and should see a in the 4th wave consolidation. We should see another leg lower that potentially tests the $155 region but holds. This will set the stage for the final 5th wave toward $214 – $262, and will complete the uptrend pattern off the April low.
  • Red – We are in an ending diagonal pattern. The current drop is the 4th wave in this pattern. We will hold $173, then turn higher toward $200 in the coming weeks. The key for this pattern will be making a new high directly on weakening momentum and volume. Whether this will be the end of the uptrend pattern off the April low, or a 4th wave correction is yet to be determined and will likely come down to their earnings report.
  • Green – I’m adding this count to the mix due to the unique situation NVDA currently is in. This has predominantly been a fundamental story, which has consistently provided us with shallow 2nd waves and extended 3rd waves. This count is a continuation of this theme and suggests that NVDA has a very shallow 2nd wave and is currently completing wave 2 of 3. This will lead to another vertical gap on heavy volume as the trend pushes well above the $243 blue target. From a technical perspective, what must hold for this count to be valid is: 1) We must hold $164; 2) There must be a large surprise that forces a buyer’s gap in price. If their earnings report fails to provide this gap, this count gets invalidated.

Credo (CRDO) 

  • Green – I am not very confident in CRDO’s chart. It is an overlapping mess from the 2023 low, which implies a diagonal. However, the diagonal could be interpreted in several ways.

    That being said, this count suggests that we are approaching the end of the 3rd wave, which could have already topped at the recent high or could push as high as $285. Once completed, the 4th wave should be rather deep, considering the pattern best fits a diagonal.

  • Blue – This count suggests the full diagonal has already completed. This would complete a very large 1st wave and set us up for a multi-month 2nd wave retrace. Though this count would be challenging over an intermediate time frame, it would be setting us up for a large 3rd wave.  

CoreWeave (CRWV) 

  • Green – There is not a lot of price data with CRWV. However, the price information we have is intriguing. For one, off the IPO low, we have an aggressive uptrend that resembles a 5-wave pattern. We then have a 3-wave retrace from the all-time-high. This implies that we have a very large 1st and now 2nd wave in place. If this is playing out, any further weakness needs to hold $99.75 and then break above $188.
  • Red – This count would become the most probable if CRWV breaks below $99.75. This would imply that we are in the C wave of an extended 2nd wave. The drop should be a 5-wave pattern and target between $78 – $64. For any of the long-term bullish counts to play out, we must hold $50.50 at all cost.

Bloom Energy (BE) 

  • Blue – Thirds waves are characterized with relentless price action and small dips as we progress. This perfectly characterizes BE since the April lows, as it has quickly become a 6 bagger from our March – April entries.  The trend has been so aggressive that it makes it difficult to decipher where this trend might meaningfully pause. What we do know is that volume and momentum are both fading the higher we go. This is typically a sign that buyers are drying up, which precedes some type of reversal.

    As long as BE holds below its recent high of $125.75, I’m expecting a 4th wave decline to take us back into the $92 – $75 range. If we do see a continuation of this drop, we need to hold $$68.50. We should then continue higher toward $165 – $200. IF we do drop below $68.50, we could be in a much larger B wave decline, which would set up another great buying opportunity.

  • Green – This count has us in a very large 3rd wave. This count should break over $125.75 directly, and push toward our $165 – $200 price range. We would then get a 4th wave consolidation into Q1, which would set up the final 5th wave into 2026.

Bitcoin (BTCUSD) 

  • Green – We are in the final 5th wave of the large bull cycle that started on the 2022 lows. Note how price keeps making new highs on decelerating volume and momentum. This fact, coupled with a very filled out 5-wave pattern, has us taking gains and tightly managing risk. The path to $200,000 in a final blow off move will require the $103,604 level to first hold. At most, I can give this count a move to $83,775. If these levels hold, and we then breakout over $133,000 with force, this count will be confirmed. 
  • Blue – We will see one final push to $133,000 into December. If this happens, the volume and momentum patterns will be the tell – if it remains weak the higher we go, the bigger the warning.  

Furthermore, the below Gann chart has been extremely accurate, keeping us on the right side of this uptrend. Note the 45-degree angle in red, which bottled up the last two pushes higher. Furthermore, note how accurate the time factors have been at identifying turning points. The next major cluster is in December, which coincides with the 45-degree angle intersecting the $133,000 level.  

Reddit (RDDT) 

  • Blue – We are completing wave 4 in a 5-wave pattern that started on the April low of this year. We need to hold $185 and then see a direct 5 wave bounce off the recent low to confirm this is in play. We should see a 5th wave push to $322 – $500 region. This will complete a very large 3 wave pattern off RDDT’s IPO low, which can allow for a multitude of outcomes once complete. So, from a technical perspective, if this scenario is in play, we will have to wait and see what unfolds when the uptrend pattern completes.
  • Green – We are in the middle of a 3rd wave within a larger diagonal pattern. This count should see a corrective bounce, followed by one more drop to the $173 – $140 region.  This final drop does not need to happen, but if it does, these will be the targets that we will use to add to our position. The 3rd wave should target $765 – $999. 

Applied Optoelectronics (AAOI) 

  • Blue – We are completing wave 1 of 3. Note the messy push higher on lower volume and momentum. This is likely an ending diagonal for wave 1 and should see a 2nd wave retrace back toward $26 – $16. As long as $13.25 holds, we should see a large breakout follow. 
  • Green – We already completed wave 2 of 3 and setting up for a large breakout. If we see a vertical move over $44.40, this will signal that we are in the early stages of a very large 3rd wave move.

Oracle (ORCL) 

  • Blue – ORCL gapped higher in 3rd wave. We are in a 4th wave which should hold over $250 – $241. We will then push higher on less volume and momentum in the 5th wave, which would target $383 – $488.
  • Green – The earnings gap was the final exhaustion move of the A wave. We are in a B wave retrace that will break below $241. I do not want to see this B wave break below $179, or something more bearish could be in play. Once the B wave ends, we should see a C wave well into the $600s into 2026.

Advanced Micro Devices (AMD) 

  • Blue – AMD is clearly in a termination wedge after its recent gap. Note the tight trading pattern that is trending higher on lower volume and momentum. We typically do not see 5th wave on max volume and momentum, which is why I am viewing this termination wedge as wave 5 of 3. The 4th wave should see a corrective drop back into the gap before staring at wave 5 toward the $288 – $391 region. Any drop must hold $158, or something more bearish could be playing out.
  • Green – When the termination wedge ends, we will only see a slight drop that holds $203. I have this as wave 2 of a larger 3rd wave. It implies that a larger gap is on the horizon, as we push toward the $500 – $600 region.

Applovin (APP) 

  • Blue – We are in a very large ending diagonal pattern. We completed wave 3 and are in the middle of wave 4. It is currently targeting $483 – $416. As long as this 4th wave holds over $331, we should find a low and start wave 5 toward $1000.
  • Green – We are still in the 3rd wave and completing the B wave. We already struck a low, will hold over $534, and then continue higher toward $1000 in a larger 3rd wave diagonal pattern.

Ethereum (ETHUSD) 

  • Blue – We just completed wave 4 of 3. The next move must be a 5-wave push over $4,762. We’ll then target around $6,700 for wave 3. The larger 5-wave pattern is targeting around $9,000 – $10,000. Any further weakness must hold $3,350 or this count gets invalidated. 
  • Green – We will break $3,350 in a large 3 wave move. This will be a B wave of a larger 5th wave. The targets will be around $3,033 – $2,243. We must hold $1,862 for any bullish resolution into 2026 to manifest.

Broadcom (AVGO) 

  • Green – AVGO is in a B wave that should fail to make new highs and then turn lower toward $314 – $292. This will set up a large C wave uptrend into 2026 with targets around $559, at minimum. Once we get the B wave low, and a new uptrend has started, we can get more accurate targets.  Below $221 will be a problem for continued upside.
  • Blue – AVGO is in a standard 5 wave uptrend. We will breakout to new highs on decelerating volume and momentum, which will confirm this is a 5th wave. We will target $402 – $425 in the coming weeks to months, which will complete 5-wave uptrend off the April 2025 low. 

Applied Digital (APLD) 

  • Blue – We are in a 4th wave within a larger diagonal. We should drop to the $24 – $19 region to complete this 4th wave. Any sustained break below $19.75 will be concerning and put this count at risk. If we can hold $19.75, we should turn higher toward the $30 region to complete the 5th wave within this diagonal pattern. 
  • Green – We are not in a diagonal. Instead, we are in a standard 5 wave pattern, and only in wave 4 of 3. We should bottom above $26.50 and then continue higher.

Innodata (INOD) 

  • Blue – We are in the middle of a 3rd wave. We can see weakness test $64, but this level must hold. We will then continue this 3rd wave toward the $122 – $137 region. The larger 5 wave pattern should target $163, as long as supports hold.
  • Red – The bounce off the April low is a clear 3 wave pattern, so far. We will see a large drop that takes the shape of a 5-wave pattern. This drop will break through $64, which will be the first warning that the blue count is failing. If this happens, the odds increase that we will retest the April low. 

Core Scientific (CORZ) 

  • Green – CORZ appears to be tracing a very large cup and handle pattern. This is typical before 3rd wave breakouts. If this is in play, we should see a vertical push higher toward $44 – $70 on expanding volume and momentum.  
  • Red – The next move is not a breakout, but instead a breakdown. It will be in the form of an aggressive 5-wave pattern, signaling that we are heading below the April low in an extended 2nd wave. 

Galaxy Digital (GLXY) 

  • Green – GLXY is setting up for a large 3rd wave breakout. We have a series of back-and-forth pushes higher that is holding over major support $37. As long as we hold over $28, the setup will remain valid. The pattern is signaling $134 as the 3rd wave target, if triggered.
  • Blue – We are in the final 5th wave in a very large diagonal pattern. The setup is pointing toward $67, if any further weakness holds over $24.

Riot Blockchain (RIOT) 

  • Green – We are in the 5th wave of a diagonal pattern. This drop should hold $17.25 and then turn higher toward $26 – $38. 
  • Blue – We are in wave 4 of 5. This drop will hold over $16.55 and then turn higher on lower volume and momentum towards the $26 region.  This will complete the 5-wave uptrend that started in April of 2025, which would be followed by a period of volatility.

Iren Limited (IREN) 

  • Blue – We are in a 4th wave within a larger 3rd wave. This drop is deep enough to satisfy this 4th wave. If we do see further weakness, it must hold over $36. We should then turn higher in an aggressive breakout over $74.15 as we move toward $149.
  • Green – We will break below $36 in a 3 wave move. This will be the B wave of a much larger swing higher. This drop can go as low as $18 and still maintain a long-term bullish posture but cannot break below. 

TeraWulf (WULF) 

  •  Blue – We are starting wave 4 of C. This 4th wave should target around $10.50 – $7.65, then turn higher for wave 5, which would be targeting $23 – $31. Below $7.65 will invalidate this count.
  • Green – We are starting a B wave that would take us to $7.65 – $4.25. Once completed, we should see a 5-wave uptrend take us toward the $30 region.

Chainlink (LINKUSD) 

  • Green – Chainlink’s price pattern has devolved into, at best, a diagonal pointing higher. This drop is too deep, which limits the path higher. If this count is in place, any further weakness must hold $12.80 and then turn higher in an aggressive 5-wave move. It will be a choppy move higher, which will have large swings in both directions.
  • Red – We are in a very large 2nd wave. Once we break below $12.80, the odds of this happening become elevated. The final target for this count will be around $3. 

Conclusion: 

The I/O Fund has been delivering top notch information with the Top 15 AI Stocks report for Q4 2025, the Top 10 New Ideas list for the Discovery tier and my Positions Report for the Advanced tier. Combined, we delivered 100 pages of research in the brief time frame of two weeks, all of actionable ideas within the AI space.  

Regarding market risks, in a recent interview on Thoughtful Money, famed economist David Rosenberg stated that the percentage of the U.S. economy currently expanding—when weighted by population—is only 18%. In other words, 82% of the U.S. economy is flat or in contraction. To make this statistic even more startling, he noted that just six weeks ago, over 40% of the economy was expanding, signaling a rapid deterioration in growth. 

The last two times we saw less than one-fifth of the U.S. economy expanding was the summer of 2020 and the winter of 2009—two of the most difficult periods for the American economy in decades. Yet today, the S&P 500, NASDAQ, Dow Jones Industrial Average are at all-time highs, while credit spreads remain near historic lows. 

The reason lies in the remarkable fact that the small portion of the economy that is still expanding is tied to artificial intelligence, which continues to show no signs of slowing down. Though it may seem overly simplistic, the reality is that as long as hyperscaler’s capex continues to grow, it is unlikely that the U.S. economy will fall into a recession—even with more than 82% of its sectors already contracting. 

As long as the AI economy continues to expand, and the broad market holds critical support levels, we will maintain a bullish posture.

The Discovery tier offers fast-paced research on new stock ideas the I/O Fund is interested in, with technical setups and comprehensive deep-dive analysis. Be the first to know what exciting new tech, AI and energy stocks the I/O Fund is tracking.

To subscribe to Discovery with 30% off, please click here to email usclick here to email us or email premium@io-fund.com and mention code DISCOVERY30.

Please note: The I/O Fund conducts research and draws conclusions for the Fund’s positions. We then share that information with our readers. This is not a guarantee of a stock’s performance. Please consult your personal financial advisor before buying any stock in the companies mentioned in this analysis.

Recommended Reading:

Bloom Energy Q3: Doubling Capacity in FY2026 for “4X 2025 Revenue”

Bloom reported a strong Q3 with revenue beating estimates by more than $90 million, strong margin expansion including GAAP operating margin shifting to positive territory. However, the reason the stock surged after hours was not found in the earnings report, rather the stock was up as much as 20% after hours from management commentary on FY2026 during the earnings call.  

Bloom Energy has seen incredibly strong price action this year of nearly 400% YTD and is nearly 600% off the April lows. Therefore, it would take something unexpected to get the stock to soar after an earnings report – yet management delivered exactly that by stating: “As we have previously announced, we are doubling our capacity to 2 gigawatts by December 2026, which will support about 4x our 2025 revenue. That expansion is all systems go. Bloom's capacity will not be a bottleneck for our customers.” 

Although management stated “about 4X our 2025 revenue,” a conservative approach would be to assume the revenue will be recognized across both 2026 and 2027. Analyst estimates are for $1.9B in 2025 and a mere uptick to 16.6% growth next year for revenue of $2.2B. However, helping the bull case further that last night’s comments offer alpha is that Bloom detailing further their primary benefit, which is quick time to power. Therefore, I imagine some of the “4X from 2025 revenue” from doubling the capacity will occur in 2026 and some will occur in 2027. I’m not choosy on which exact quarter given there is a wide disconnect in analyst estimates as 2027 estimates are for $3.5B, or less than 2X 2025 revenue.  

The 2GW represents 100% growth in capacity as AEP had contracted for 1GW going into this year. My interpretation is that Bloom Energy must be able to charge more for its power given how rapid their solid oxide fuel cells are deployed with expectations of 90 days, yet they actually delivered in an astonishing 55 days for Oracle. In the past, management had hinted they were doubling GWs but did not correlate it to a quadrupling of their revenue. From Q2 earnings call: “Now our robust product has robust demand. We will double our factory capacity from 1 gigawatt a year now to 2 gigawatts a year by the end of next year. Our mission has never felt more urgent, and we are ready.” 

Even with this blockbuster statement of “about 4x our 2025 revenue,” one has to wonder if 2GW is the baseline for 2026 capacity. The company counts one massive energy partner Brookfield, two hyperscalers and one neocloud as customers (ORCL, AWS via AEP and CRWV) plus they hinted of a fourth large customer on the call today via a gas company partnership. Secondly, management explained why their product is in high demand and will likely remain that way for some time. We cover this and more below! 

Please note, we are shifting our post-earnings formatting to have the contextual information including Q&A commentary first and financials second. 

“About 4X our FY2025” – The Comment that Caused the Stock to Surge  

I want to double click on the comment that 2GW will be “about 4X our FY2025 revenue.” Surprisingly, the first few analysts on the call breezed over the comment before an Evercore analyst asked for clarity. I’m quoting this in full given the importance of the comment in the opening remarks with the CEO confirming the analyst’s understanding and stating, “we will never be the constraint in our customers growing their data center“ and that “all systems are go.” My translation is that Bloom can increase its capacity faster than many other energy options and now that “lighthouse” customers such as Oracle have taken note, that we will see what Bloom is truly capable of in the coming quarters. As Bloom’s CEO stated, commercial demand is “accelerating.” 

Here is a further breakdown on the 4X comment: 

“Nicholas Amicucci 
Evercore ISI Institutional Equities, Research Division 

I just wanted to build upon on kind of the doubling of capacity by the end of 2026 and kind of the commentary that would support 4x the fiscal '25 revenue.  

How should we think about kind of the utilization on that capacity as we kind of enter into — again, as we enter into 2027 and we have that — the 2 gigawatts kind of up and running. I mean because if we're exploring opportunities to go beyond that 2 gigawatts, it seems like 4x full year '25 revenue, that seems like a big number that we could get there relatively quickly. So I just wanted to parse that out a little bit. 

K. Sridhar 
Co-Founder, CEO & Chairman 

Yes. So here is a simple way to think about it, right? We didn't get to where we are today to deliver what I just explained, this purpose-built factory based on just meeting a market demand as we see it right now, we just prepared ourselves. What is the beauty of Bloom being able to expand its capacity and offer what we do? Is the return on investment like invested capital? So we are fiscally very disciplined, and we only make decisions based on that added cost and its absorption, will it have a great rate of return. 

So we have a very disciplined process on this. And on top of that, we have a very clear understanding right now given time to power shortages and the importance of this as a nation-state issue for AI.  

We are committing to strive and work as hard as we need to and stay ahead such that we will never be the constraint to our customer on growing their data center. That's what we are positioned for. And we will increase capacity. We will increase it in whatever steps necessary as we see fit. But as you saw, this 2-gigawatt capacity, all systems go based on that.  

Would we use it for peak capacity? When we use it, will we use it for steady capacity? All that, you'll hear from us as we talk about our backlog and other things next year. But we are now using our OpEx wisely to invest in capability and talent to think about how do we expand beyond 2 gigawatts. That's all I can say right now. Thanks for that question.” 

Regarding how fast Bloom Energy can build the additional GW, management was confident they can do so faster than anyone else: “Today, we are able to provide our power faster than most of the others who have supply chain constraints. We can expand our capacities a lot faster than anybody else.” 

Why Bloom Energy Remains in High Demand Amidst a Crowded Energy Industry 

We’ve covered Bloom’s products extensively, yet it doesn’t hurt to refresh our understanding of what makes the company stand out given the market dynamics around how data centers are scrambling to secure power is shifting nearly daily.  

Our primary message has been “time to power” for Bloom, which management emphasized stating: “We are going to strive to make sure we are able to provide power for our customers before they are ready for it. We will not be the bottleneck. And we designed our factories; we built it with that in mind.” 

Looking beyond speed, management also focused on price-to-performance, especially when they were asked how Bloom plans to compete with small-scale gas turbines with management stating a clear benefit to their solid oxide fuel cells (SOFC) is that hyperscalers can put out a lot more tokens with their fuel cells, stating: “With the same amount of gas that's available, same amount of space that's available, we can produce a lot more tokens for the hyperscaler than any other technology can today, end-to-end. And so the value for a hyperscaler is not about the cost of power. It's about that cost of the entire value chain across the board. So price-performance ratio, we can compete with anybody.” This was reiterated in the opening comments with management stating their fuel cells produce “10x more power in the same footprint than they did 10 years ago.”  

It was also discussed that mechanical combustion solutions require a lot of batteries, whereas Bloom does not require batteries, implying that gas turbines are a band-aid solution compared to SOFCs, which can provide offer steady output without the grid or batteries.

Updates on Bloom’s Deals with Brookfield, Oracle, Hints of New Hyperscaler Customer 

Earlier this month, Bloom shares surged more than 26% to $110 on the backs of a partnership with Brookfield, which will see the asset management firm invest up to $5 billion in Bloom’s fuel cell tech to be deployed at data centers worldwide. While timelines are rather unclear for deployment of the fuel cells, the two state that the partnership does include an AI inference focused site in Europe that will be announced before year-end. To put in perspective the potential size of the partnership, this would represent nearly 3x of Bloom’s estimated revenue for fiscal 2025. 

Under the partnership, Bloom will become Brookfield’s “preferred on-site provider for Brookfield's trillion-dollar infrastructure portfolio of AI factories, data center operators, corporate facilities and factories.” What makes this partnership important is not only the fact that Brookfield has invested $50 billion towards AI and “is tripling the size of its AI strategy over the next 3 years,” but that Brookfield is willing to finance for Bloom. 

CEO KR Sridhar explained that “if there are Bloom-sourced deals that require financing, so we can offer a customer a PPA, they are willing to step in and be the financier for that. It’s an inaugural investment.” This would remove an important layer on the equation for growth for Bloom as it would help them accelerate deployments without them or customers bearing the capital or financing risks.  

Management also hinted of another hyperscaler customer in the works, but declined to provide any further details: “We signed our first deal with a major gas provider who will convert its gas to electricity with Bloom fuel cells and sell that on-site power to a third hyperscaler. The hyperscaler will announce details of this installation when it is ready.”  

Bloom also struck a deal with Oracle back in July to deploy its fuel cells for onsite power at select Oracle Cloud Infrastructure (OCI) data centers over the next 90 days. While terms of the deal such as size were not disclosed, Bloom completed shipments in just 55 days, highlighting its ability to deliver power to data centers rapidly.  

Bloom had signed a partnership with CoreWeave in July 2024, with the first fuel cells expected to be commissioned in Q3 2025 for a data center in Illinois. Bloom briefly updated on this, saying that its fuel cells are generating power at the facility. However, it is rumored that the data center is just 14MW, essentially making it a pilot/validation deployment rather than a full-scale commercial deployment.  

Nvidia’s Rubin is Coming; Bloom Energy is Ready 

There was discussion around how Bloom Energy’s solutions could become more attractive with the Rubin generation of GPUs with an analyst asserting DC/DC power would be more efficient than DC/AC power.  

Our team has covered quite closely the power requirements for Rubin Kyber racks, which could draw 600kw or 5X that of the NVL72 systems that are shipping now. You can read more here on this topic (an important read if you are invested in AI energy stocks). 

What was discussed on the earnings call is the power requirements will put immense pressure on voltage, stating: “the laws of physics dictate that you have to go to an 800-volt DC architecture if you want AI chips that have more power density, which is the only way you can improve upon AI in the next generation. This is not an if, this is not a nice-to-have. This is a must-have.” 

Bloom is asserting they are prepared for the 800-volt DC architecture (whereas most energy solutions are not such as 50MW turbines) as they are adaptable when moving beyond the 48-volt DC architectures of today. 

“That is the 48-volt DC because the small wire through which a small amount of water comes into the straw, that water was sufficient to satiate the thirst. That was when CPU racks were 13 kilowatts. We have put a lot of Band-Aids on it to make sure Blackwell chips that come somewhere near the 130 kilowatts can handle it through the straw […] We saw this coming one day. We didn't know what day in 2000 when we initially created architecture. We built an architecture where we can feed these straws appropriately right at that 800 volts, and we decided every unit we have shipped for the last 15 years has that.” 

Bloom Q3 Revenue Beat of 21% 

Bloom smashed analysts' revenue estimates by 21.3%. The company reported record revenue of $519.05 million, versus estimates of $428.07 million. Revenue grew by a solid 57.1% YoY and 29.4% sequential growth, accelerating 37.6 percentage points from the previous quarter’s YoY growth of 19.5%. 

The company’s fourth consecutive record revenue was driven by the strong demand for its fuel cell technology, driving AI data centers. We have discussed the fuel cells opportunity as a key catalyst in our article here. The company’s fuel cells are very efficient and are currently producing 10x power within the same footprint than produced previously a decade ago. 

The management highlighted three major tailwinds that are positioning the company to become a global standard for on-site power generation; a market expected to reach a trillion dollars. First, AI buildouts have increasingly made on-site power generation a core necessity. Secondly, since AI is a national priority, government policy on on-site power generation is now more liberal. Third, the company’s fuel cells are highly efficient and are witnessing double-digit YoY cost reductions.  

Revenue growth decelerates in Q4 due to tough comps, as last year’s Q4 revenue grew by 60.4%. Analysts expect Q4 revenue to grow 6.4% YoY to $608.7 million. Revenue growth will accelerate to 20% in Q1 2026 and to 23.6% growth in Q2 2026. 

Looking ahead, analysts expect 2026 revenue to grow 24% YoY and accelerate to 62% growth in 2027. Management sounded optimistic on the future growth as the company’s co-founder and CEO, K. Sridhar said in the Q3 earnings call, “This seminal year for Bloom positions us for an even stronger 2026 and beyond with higher growth and more profitability”.  

The analysts' estimates would trend higher after management's comments during the recent earnings call that doubling capacity to 2 gigawatts would support 4x the company’s 2025 revenue. Using a conservative approach, we believe revenue may be recognized over the next two years.   

Key Segments 

Products, installation, and service revenue growth showed acceleration from the previous quarter. While Electricity segment declined sequentially. 

  • Products revenue grew by 64% YoY to $384.3 million, accelerating from the 31% growth in Q2. 
  • Installation revenue growth spiked 105% YoY to $65.78 million, accelerating from a (13%) decline in Q2. 
  • Service revenue grew by 16% YoY to $58.6 million, accelerating from the 4% growth reported in the previous quarter. 
  • Electricity revenue was down (25%) YoY to $10.35 million, decelerating from a decline of (10%) in Q2. 

Margins Continue to Expand 

Bloom’s margins are improving, primarily driven by operational efficiency, product cost improvements, and operating leverage. Bloom is fundamentally transforming into a stronger company, as its GAAP operating margins were previously deep in the red, in double digits. 

  • Q3 gross profits grew by 92.7% YoY to $151.68 million or a gross margin of 29.2%, up 5.4 percentage points YoY and 2.5 percentage points sequentially. Similarly, adjusted gross margins showed strong YoY and sequential improvement, primarily driven by product cost improvements and manufacturing efficiencies. 
  • Operating margins improved 4.4 percentage points YoY and 2.4 percentage points sequentially to 1.5%, primarily driven by strong operational efficiencies. Adjusted operating profits grew by 470% YoY to $46.2 million or an adjusted operating margin of 8.9% compared to 2.5% in the same period last year and 7.1% in the previous quarter. 
  • Net margin was (4.4%) compared to (4.5%) in the same period last year and (10.6%) in the previous quarter. Adjusted net income was $35.45 million compared to ($1.5 million) in the same period last year. Adjusted net margin improved 7.2 percentage points YoY and 1.3 percentage points sequentially to 6.8%. 

Adjusted EPS beat of 47% 

GAAP EPS came at ($0.10) in Q3 compared to ($0.06) in the same period last year. GAAP EPS was negatively impacted by a one-time loss related to unconsolidated affiliates of ($19.6 million) or a ($0.08) per share. The company reported adjusted EPS of $0.15, beating estimates by 47%, and was up from ($0.01) in the same period last year and $0.10 in the previous quarter. Bloom reported strong profits growth driven by operational efficiency, product cost improvements, and operating leverage. 

Analysts expect adjusted EPS of $0.31 in Q4 and $0.04 in Q1. Looking forward, adjusted EPS is expected to grow strongly by 84.7% YoY to $0.93 in 2026 and 122.4% to $2.07 in 2027. 

Cash Flow and Balance Sheet 

The company reported positive operating cash flows and free cash flows in the recent quarter after negative cash flows in the first two quarters of the year. 

  • Q3 operating cash flows were $19.67 million or 3.8% of revenue compared to ($69.5M) or (21%) of revenue in the same period last year. Operating cash flow improvement was primarily driven by higher profits and working capital improvements. 
  • Strong operating cash flows also led to higher free cash flows. Q3 free cash flow was $7.4 million or 1.4% of revenue compared to ($83.8 million) or (25.4%) in the same period last year. 
  • While management has not provided concrete 2025 guidance, it noted on the earnings call that “we expect fiscal 2025 to be better than our previously stated annual guidance on our financial metrics”. It suggests that the company’s cash flows and free cash flows would be strong in Q4, based on management's guidance during Q2 results that cash flows would be at the same level as in 2024. To give a perspective, the company reported operating cash flow of $92 million in 2024 and free cash flow of $33.2 million. Year to date, the company reported operating cash flow of ($304 million) and free cash flow of ($338 million), which means operating cash flow will be about $396 million and free cash flow will be about $371 million, respectively, in Q4. 
  • Cash was $595.1 million and debt of $1.13 billion at the end of Q3 2025. While debt remained unchanged, cash improved by $20.3 million from the previous quarter. 

Conclusion:  

We are in the era of “what you see is what you get” – meaning, those offering strong earnings reports right now are setting up for a strong runway as future generations of GPUs will only be more power hungry. There is far less speculation than there was at the start of the year when we first covered Bloom in terms of which energy solutions can answer the demands of the AI data center buildout. The test for investors will be figuring out how to hold-on while this market unfolds in the coming years.  

We hope to help with all of the above from being early to the products and solutions driving forward this massive market, to carefully examining the financials for confirmation the company is delivering, and providing the technicals to help stay the course while also not getting too emotional during the highs and lows.  

Our earnings season is off to a strong start, we have dozens of reports to cover for you alongside real-time trade alerts that do what few can offer – analyze the complex AI market yet also execute.  

Regarding the flawless execution, I want to thank the team on this one: Knox, Damien and Royston. It’s been a pleasure to see the pieces come together, and we hope there are many more like it to come. 

I/O Fund Equity Analysts Damien Robbins and Royston Roche contributed to this article.

Please note: The I/O Fund conducts research and draws conclusions for the Fund’s positions. We then share that information with our readers. This is not a guarantee of a stock’s performance. Please consult your personal financial advisor before buying any stock in the companies mentioned in this analysis.

Recommended Reading: