Broadcom FQ4 Earnings: $73B AI Backlog with Visibility; $162B Consolidated Backlog

Broadcom’s total AI-related orders on hand exceed $73 billion, nearly half of the company’s consolidated $162 billion backlog. The $73B backlog is expected to ship over the next 18 months. This backlog includes not only XPUs but also networking components. Most of the earnings call was management explaining the $73 billion is a baseline for the next 18 months.  

Notably, there’s been a significant amount of hype around custom silicon challenging Nvidia, thus, the bar was set high going into this earnings report. For Broadcom, the words “steady as you go” come to mind. 

Next quarter, AI revenue is expected to double year-over-year to $8.2 billion. During fiscal year 2025, AI revenue grew 65% year-over-year to $20 billion, leading to semiconductor revenue seeing an all-time high of $37 billion. During the fiscal year, the Infrastructure Software segment posted 26% growth to $27 billion, led by strong adoption of VMware Cloud Foundation, which represents enterprise software monetization. 

Management emphasized that AI has now grown more than 10x over the past 11 quarters, illustrating how rapidly Broadcom has scaled this business. Custom accelerators, or XPUs, more than doubled year-over-year, primarily driven by Google’s TPUs as Big Tech now turns toward monetizing their platforms through inference APIs and AI-driven applications. 

The report was fairly neutral as Broadcom struggled to live up to the recent custom silicon hype; yet it’s also clear Broadcom is in pole position to be a large beneficiary of the incoming AI Monetization Supercycle. You can view my free coverage here, where I connect the dots on why the AI trade’s best years are still up ahead. 

Regarding this earnings report, the main topics can summed up by the expanding customer list, the margin compression expected from XPUs, and the strength of Tomahawk 6. 

$73 Billion Visible Backlog and Expanding Customer List 

In the opening remarks, Hock Tan provided an update on the backlog, stating “And all these components combined with XPUs, bring our total order on hand in excess of $73 billion today, which is almost half Broadcom's consolidated backlog of $162 billion. We expect this $73 billion in AI backlog to be delivered over the next 18 months. And in Q1 fiscal '26, we expect our AI revenue to double year-on-year to $8.2 billion.” 

The earnings call was essentially a series of questions dissecting this statement. Overall, Tan implied this is more of a baseline, stating: “And obviously, this is as of now, I mean, we fully expect more bookings to come in over that period of time.” 

Broadcom has an expanding customer list that is quite impressive, including Google, Meta, Bytedance, Anthropic and now a fifth customer (analysts asserted the 5th customer is OpenAI, management declined to comment). The fourth customer, Anthropic, placed a $10 billion order for the TPU Ironwood racks with an additional $11 billion placed in the latest quarter. In the earnings call, management made sure to state they are building server racks for Anthropic and not only chips – stating it was “a system sale.”  

The market is suddenly taking notice of custom silicon (despite it being debated as a risk to Nvidia for over a decade) because an R&D lab is turning to TPUs and also now that Ironwood v7 is the first generation of TPUs to be specifically designed for inference.  

Tomahawk 6 

Broadcom’s Tomahawk 6 is an Ethernet switch built to address the scaling limits of AI clusters as they move beyond single-rack deployments by allowing hyperscalers to interconnect tens of thousands of accelerators with predictable performance, high bisection bandwidth, and tighter cost and power control. 

Tomahawk 6 delivers up to 102.4 Tbps of switching capacity and effectively doubles bandwidth versus the prior generation, enabling large-scale GPU and custom XPU fabrics to scale out while preserving low latency and power efficiency. Broadcom is making a bet that AI systems will increasingly rely on Ethernet for cluster expansion rather than proprietary fabrics (such as Nvidia’s NVLink).  

According to management, the new Ethernet switch is ramping quickly over the past 3 months and the current order backlog for AI switches exceeds $10 billion:

“And frankly, we see that bookings not just in XPUs, but in switches, DSPs, all the other components that go into AI data center. We have never seen bookings of the nature that what we have seen over the past 3 months, particularly with respect to Tomahawk 6 switches. This is one of the fastest-growing products in terms of deployment that we've ever seen of any switch products that we put out there. It is pretty interesting and partly because it's the only one of its kind out there at this point at 102 terabits per second. And that's that exact product needed to expand the clusters of the latest GPU and XPUs out there.” 

XPUs will Lead to Margin Compression 

If I were to point to why there is weakness after hours, it’s likely a combination of the $73 billion not meeting the high bar the custom silicon hype set for the company, but also the discussions around XPUs leading to margin compression over time.  

The company will have to pass-through more third-party components such as memory, optics, and power infrastructure, which will lead to gross margins contracting. However, management was clear that gross profit dollars and operating income dollars will continue to rise due to scale and operating leverage.  

According to the CFO: “And so those gross margins will be lower. However, overall, the way Hock said it, gross margin dollars will go up, margins will go down, operating margins — because we have leverage operating margin dollars will go up, but the margin itself as a percentage of revenues will come down a bit.” 

Financials 

Revenue grew by 28% 

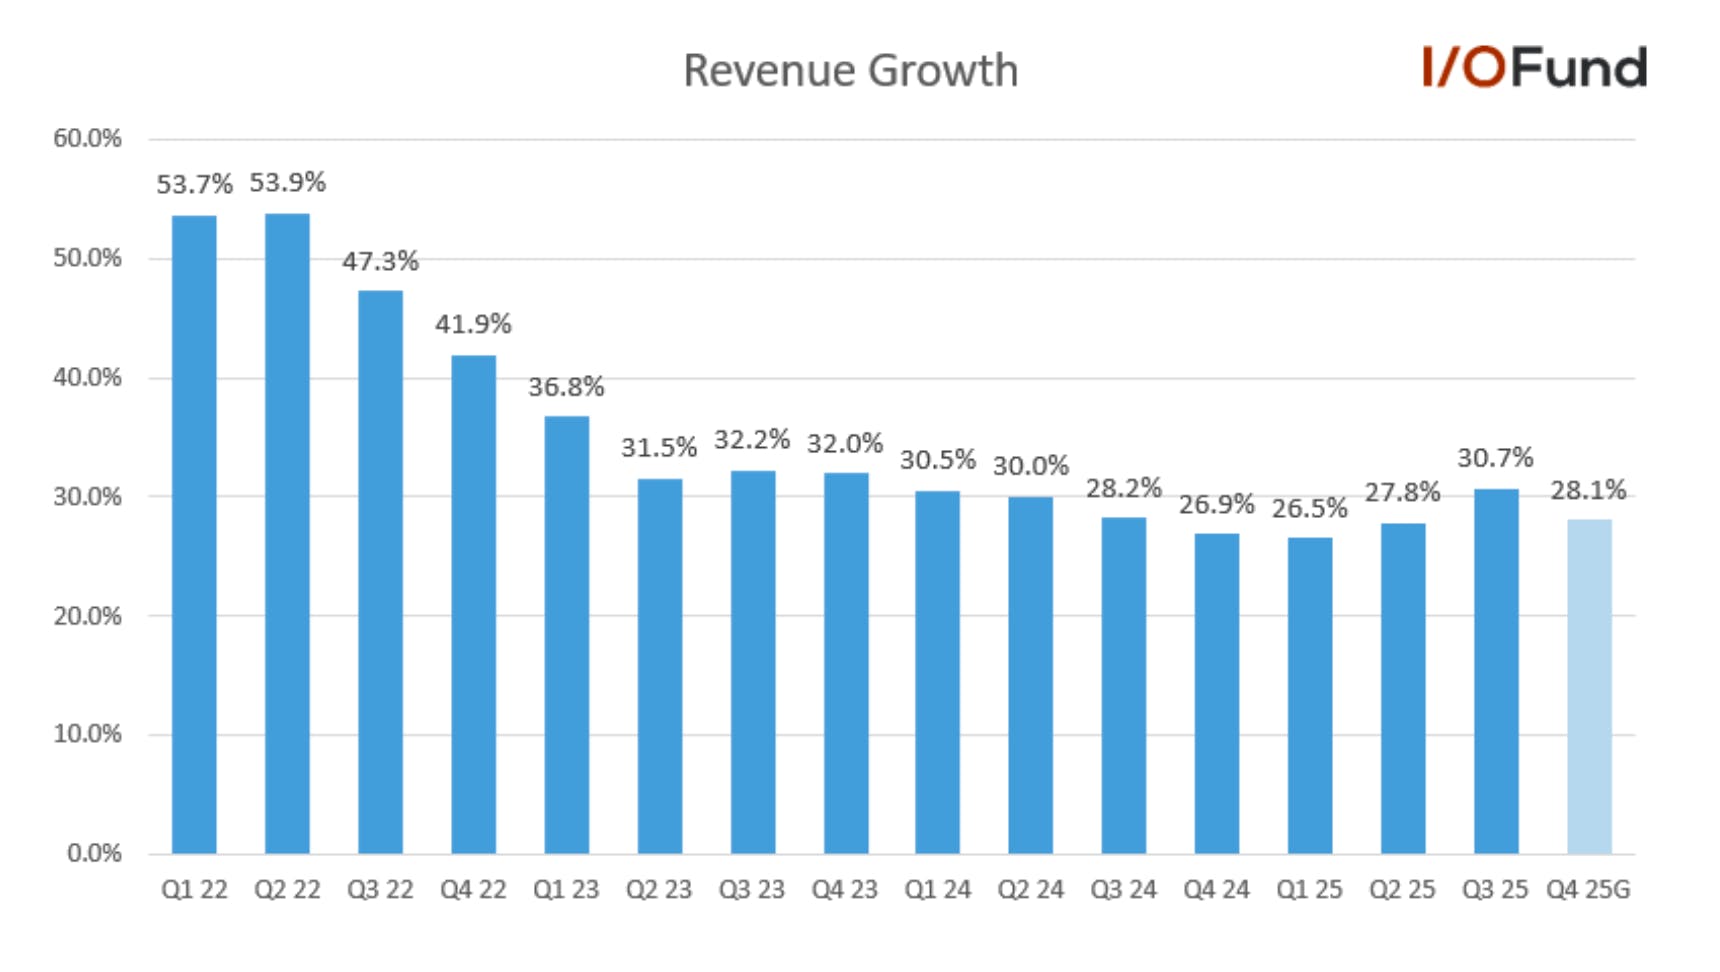
Broadcom’s FQ4 ending October 2025 revenue grew by 28.2% YoY and 12.9% QoQ to $18.02 billion, beating estimates by 3.2%. Revenue growth accelerated by 6.2 percentage points from 22% growth reported in FQ3. The strong growth was primarily driven by a surge in AI revenue and growth in Infrastructure software revenue.  
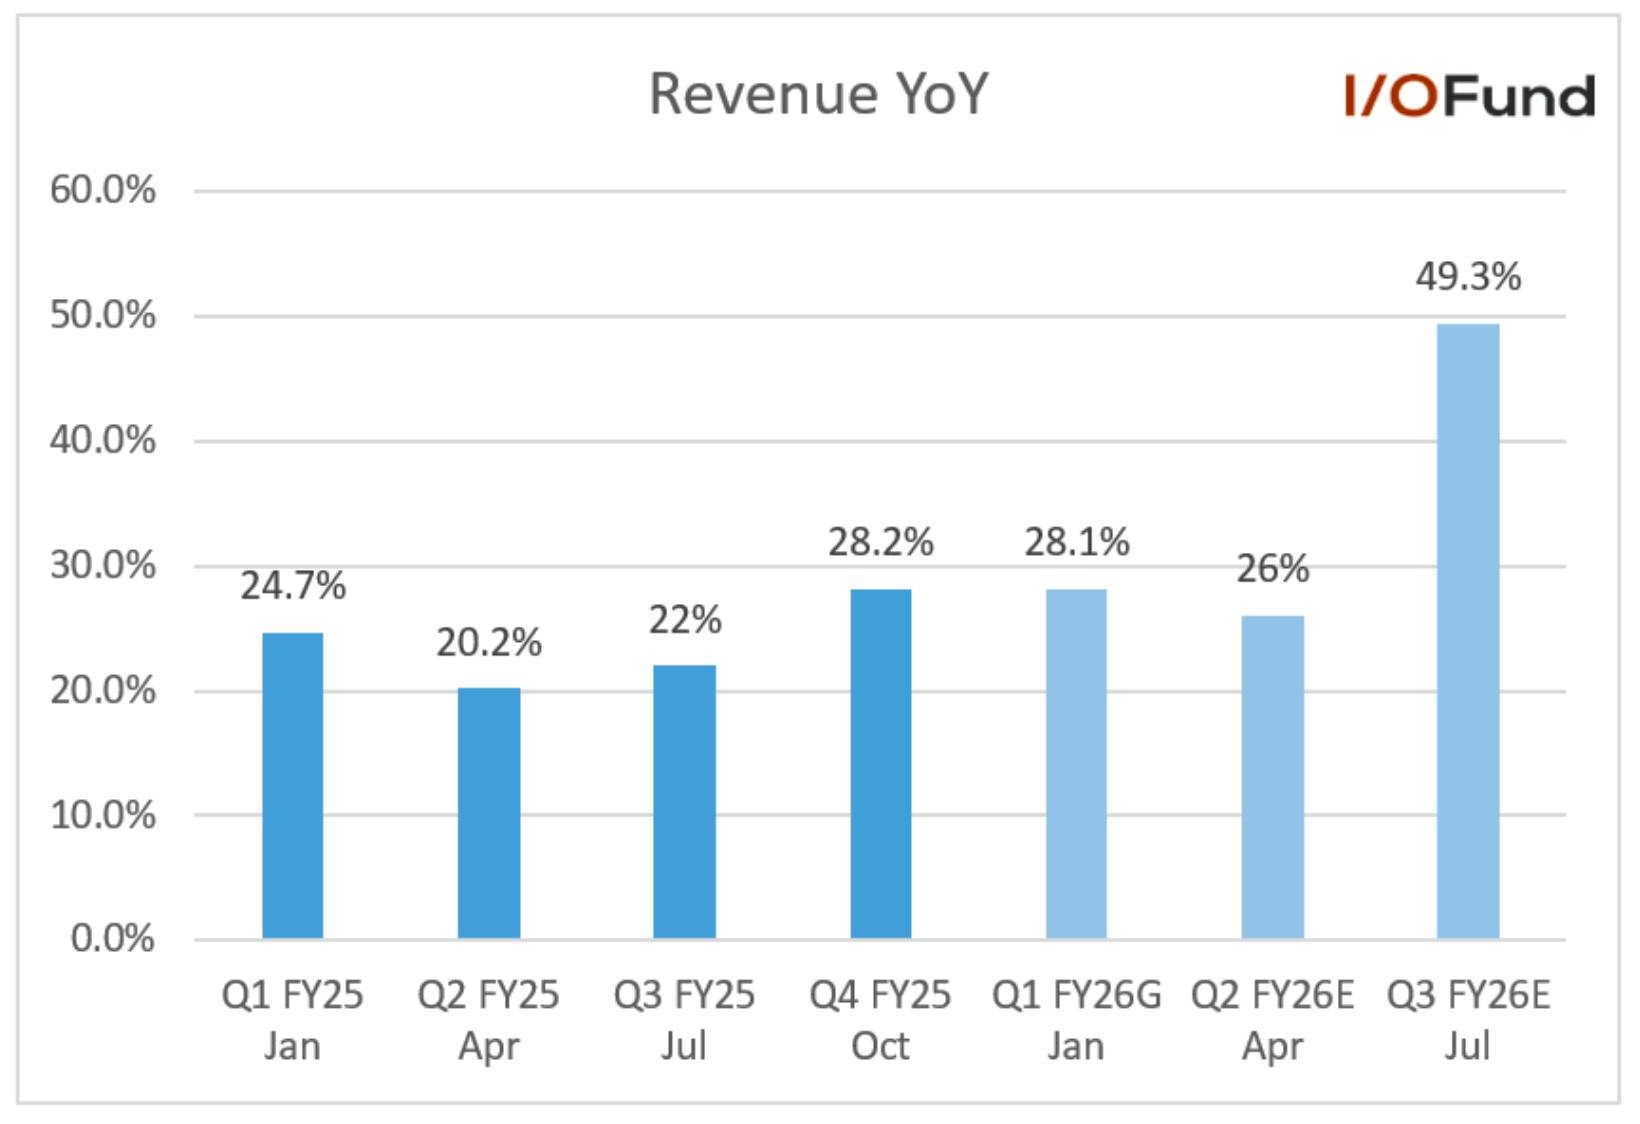
Management also provided a strong FQ1 revenue guide of $19.1 billion, implying a YoY growth of 28.1% and 6% QoQ, beating estimates by 4.3%. The expected strong growth is primarily driven by AI revenue, which is expected to double YoY to $8.2 billion. Analysts expect strong growth to continue, with revenue expected to grow 26% YoY to $18.91 billion in FQ2 and accelerating 49.3% YoY growth to $23.82 billion in FQ3. 

For FY2025, ending October, revenue grew by 23.9% YoY to a record $63.89 billion. The strong growth was primarily driven by AI revenue and VMware. Looking forward, analysts expect revenue to grow 35.7% YoY to $86.1 billion in FY2026 and 33.1% YoY to $114.59 billion in FY2027. 

Key Segments 

Semiconductor Solutions 

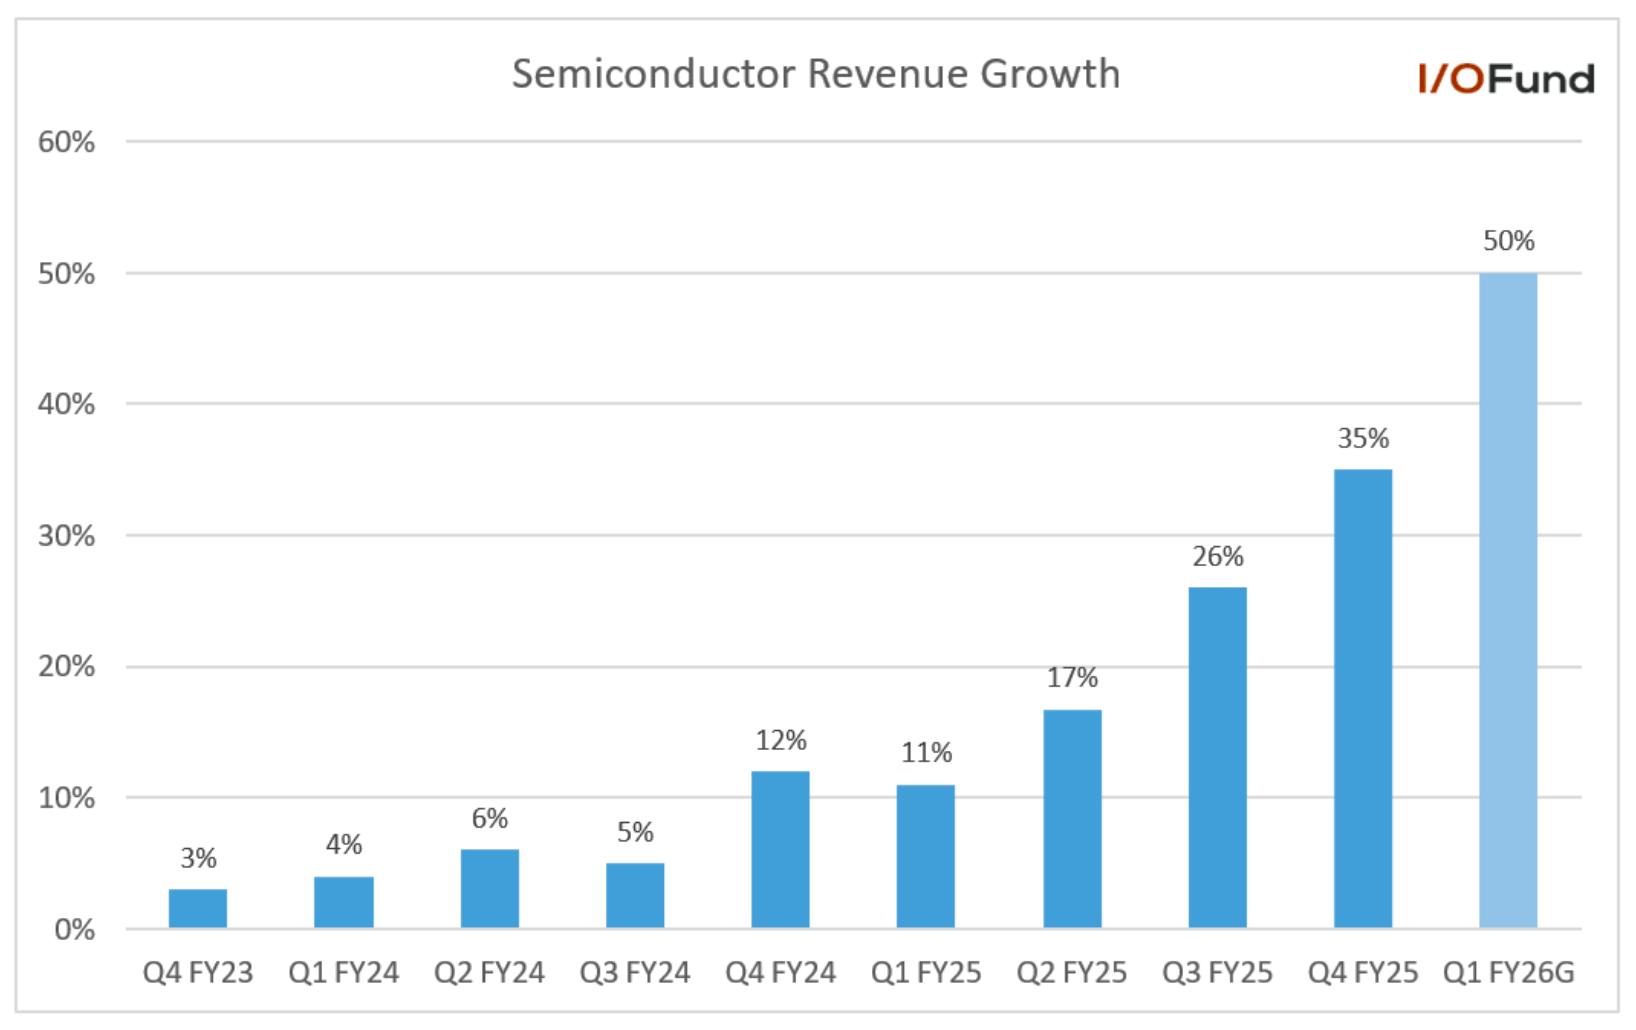
FQ4 semiconductor solutions revenue grew by 35% YoY to $11.07 billion, primarily driven by strong AI revenue. Revenue growth accelerated by 9 percentage points from 26% growth reported in FQ3. Management expects semiconductor revenue growth to further accelerate 15 percentage points to 50% YoY, reaching $12.3 billion in FQ1, driven by a surge in AI revenue. For FY2025, semiconductor revenue grew by 22% YoY to a record $36.9 billion.  
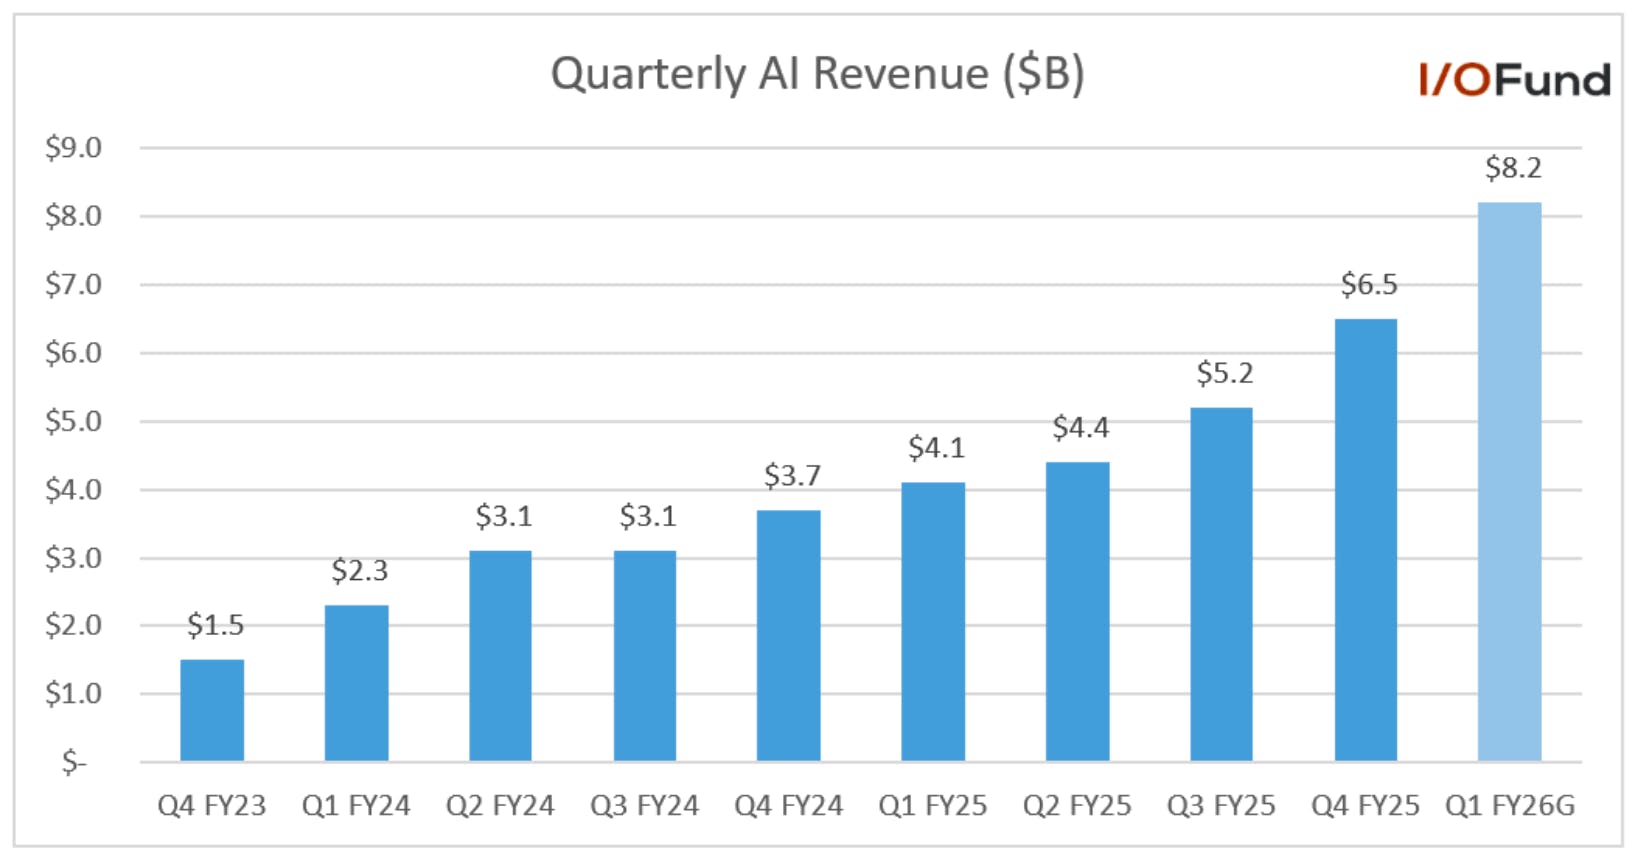
FQ4 AI revenue grew by 74% YoY and 25% QoQ to $6.5 billion and was higher than the management guide of $6.2 billion. CEO Hock Tan said in the earnings call, “And this represents a growth trajectory exceeding 10x over the 11 quarters we have reported this line of business. Our custom accelerated business more than doubled year-over-year, as we see our customers increase adoption of XPUs, as we call those custom accelerators in training their LLM and monetizing their platforms through inferencing APIs and applications.” It further highlights the point that we have discussed in our article here that Broadcom is a silent beneficiary of the AI Monetization trend.  

Management also highlighted that these XPUs have also been extended to other LLMs, “best exemplified at Google, where the TPUs use in creating Gemini, have also been used for AI cloud computing by Apple, Coherent and SSI as an example. And the scale at which we see this happening could be significant.” Management confirmed that the $10 billion order from the fourth customer they mentioned in the last earnings call was from Anthropic and that they received an additional $11 billion order this quarter for delivery in late 2026. Broadcom also announced a fifth XPU customer this quarter, who has placed a $1 billion order to be delivered in late 2026. 

Management also provided a strong AI revenue guide for FQ1 of $8.2 billion, implying a 100% YoY and 26% QoQ growth. The expected strong growth is primarily driven by custom AI accelerators and Ethernet AI switches. For the FY2025, AI revenue grew by 65% YoY to $20 billion. Management expects AI revenue to accelerate in FY2026 and drive most of Broadcom’s growth in FY2026.
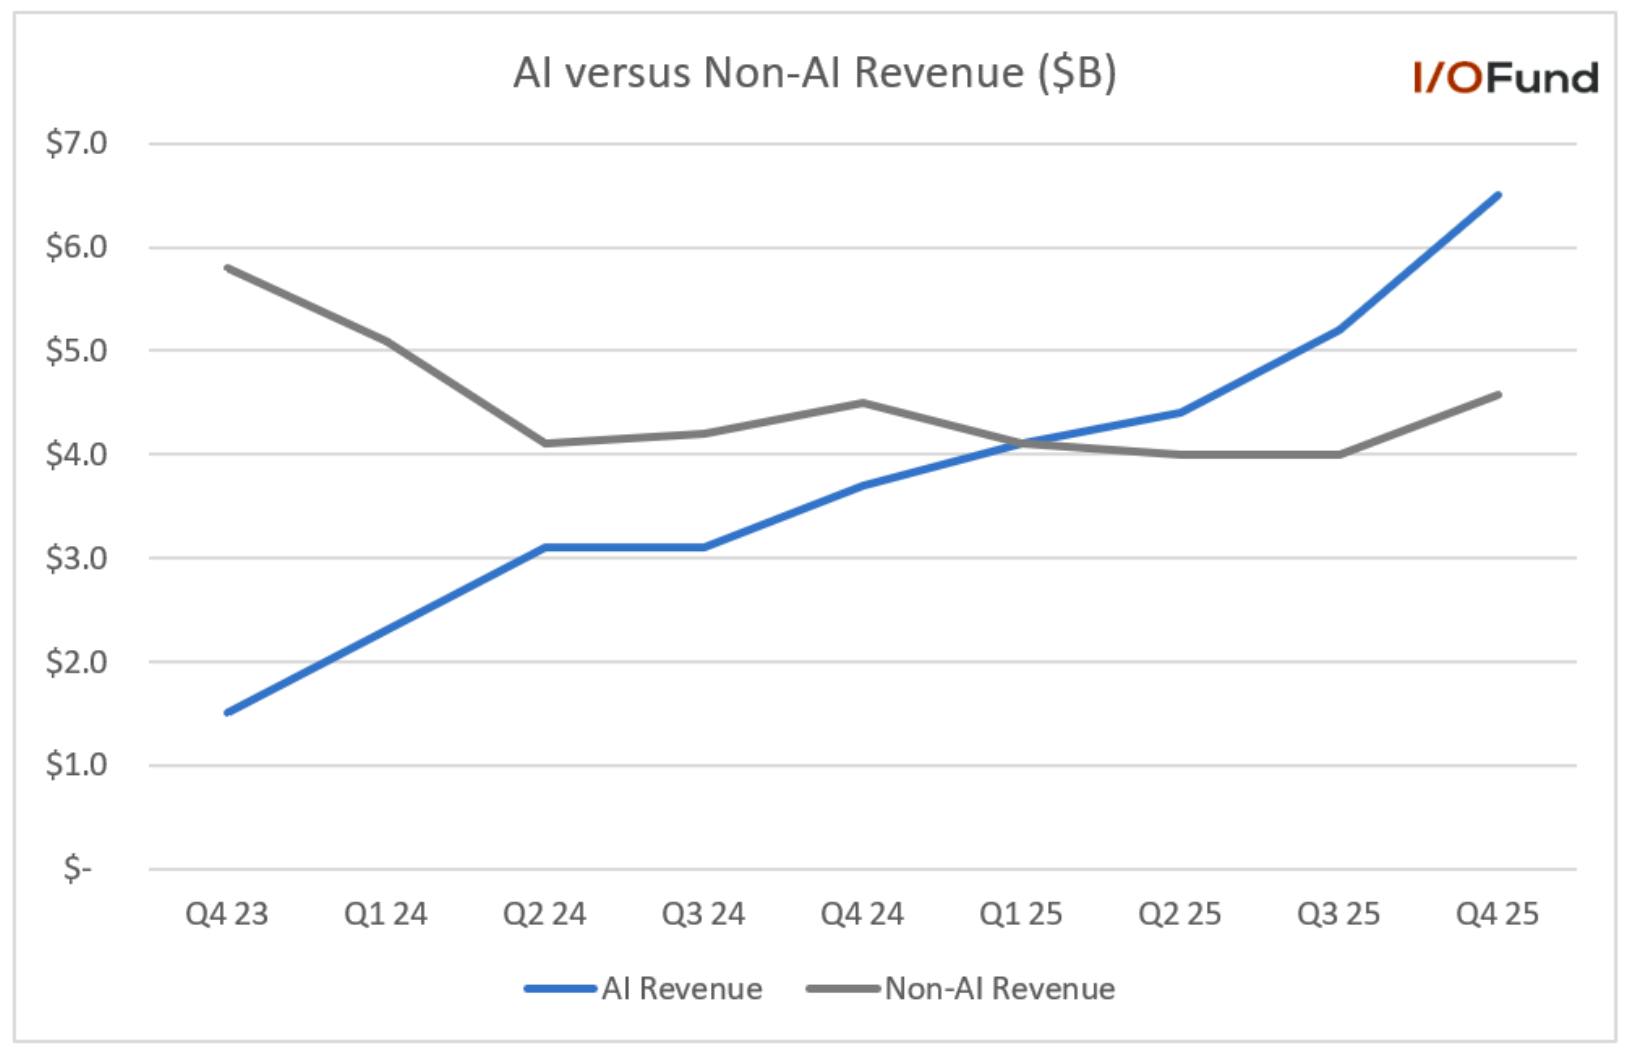
Non-AI semiconductor revenue in FQ4 grew by 2% YoY and 16% QoQ to $4.6 billion primarily driven by favorable wireless seasonality. As seen below, the gap between AI and non-AI revenue is widening as AI growth accelerates. Management expects non-AI-semiconductor revenue to be flat YoY to $4.1 billion and down sequentially in FQ1 due to wireless seasonality.  
Infrastructure Software 

FQ4 Infrastructure software revenue grew by 19% YoY to $6.9 billion, above the management guide of $6.7 billion. Bookings continue to be strong, with total contract value booked in FQ4 exceeding $10.4 billion compared to $8.2 billion in the same period last year. 

The Infrastructure Software backlog was $73 billion compared to $49 billion in the same period last year. Management expects renewals to be seasonal in Q1 and expects Infrastructure Software revenue to be $6.8 billion, down (2%) sequentially and up 1% YoY.  

For the FY2025, Infrastructure Software revenue grew by 26% YoY to $27 billion, primarily driven by strong VMware revenue. Management expects Infrastructure Software revenue to grow in the low double digits in FY2026. 

Margins 

Broadcom reported better margins than expected, primarily due to higher software revenue than expected, operating leverage, and better product mix within the semiconductor revenue. As discussed earlier in our article that AI revenue will lead to lower gross margin in the coming quarters. However, management was clear that gross profit dollars and operating income dollars will continue to rise due to scale and operating leverage.   

  • FQ4 gross profits grew by 36.1% YoY to $12.25 billion, with a gross margin of 68%, an improvement of 390 basis points YoY and 90 basis points sequentially. Adjusted gross margin was 77.9%, up 100 basis points YoY and down 50 basis points sequentially. It was better than the management guidance of 77.7% primarily due to higher software revenues than expected and better product mix within semiconductors. Management expects FQ1 adjusted gross margin to be down 100 basis points sequentially to 76.9% primarily due to higher mix of AI revenue. 
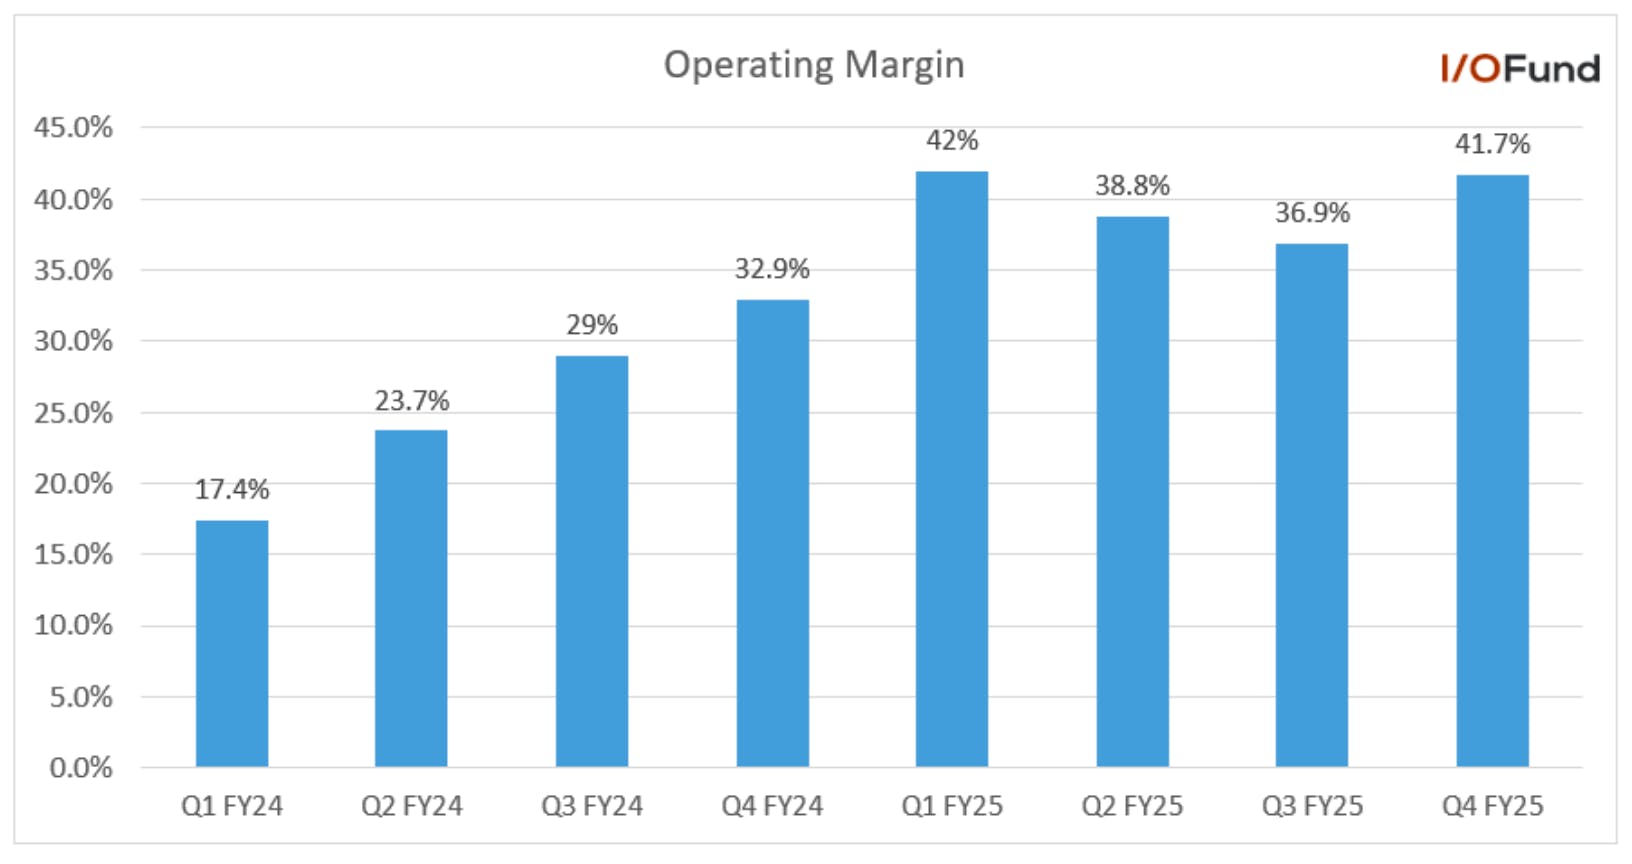
  • FQ4 operating income grew by 62.3% YoY to $7.5 billion. Operating margin improved 8.8 percentage points YoY and 4.8 percentage points sequentially to 41.7%, primarily driven by operating leverage. The adjusted operating margin was 66.2%, compared to 62.7% in the same period last year and 65.5% in the previous quarter. 
  • Net income grew by 102.6% YoY to $8.5 billion with net profit margin of 47.3% compared to 30.8% in the same period last year. Adjusted net income grew by 39.5% YoY to $9.7 billion, with an adjusted net profit margin of 53.9% compared to 49.6% in the same period last year. 
FQ4 adjusted EBITDA grew by 34.4% YoY to $12.2 billion with an adjusted EBITDA margin of 68% and was better than the management guide of 67%. For FQ1, management expects adjusted EBITDA margin to be down 100 basis points sequentially and YoY to 67%.
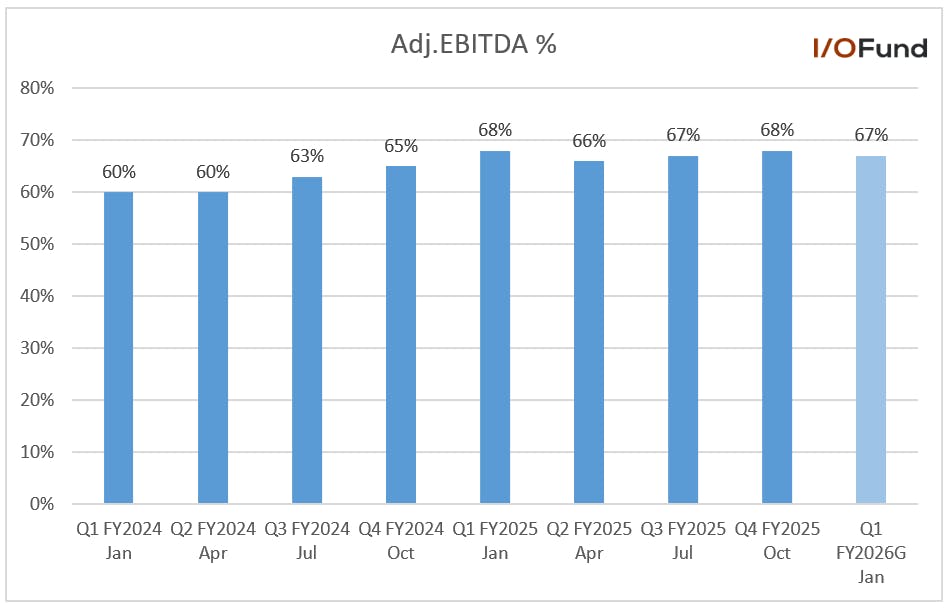
  • For FY2025 gross margins came at 67.8%, an improvement of 480 basis points YoY. Similarly, operating margin improved by 13.8 percentage points to 39.9%. The adjusted EBITDA margin was 67% compared to 62% last year.

Adjusted EPS grew by 37% 

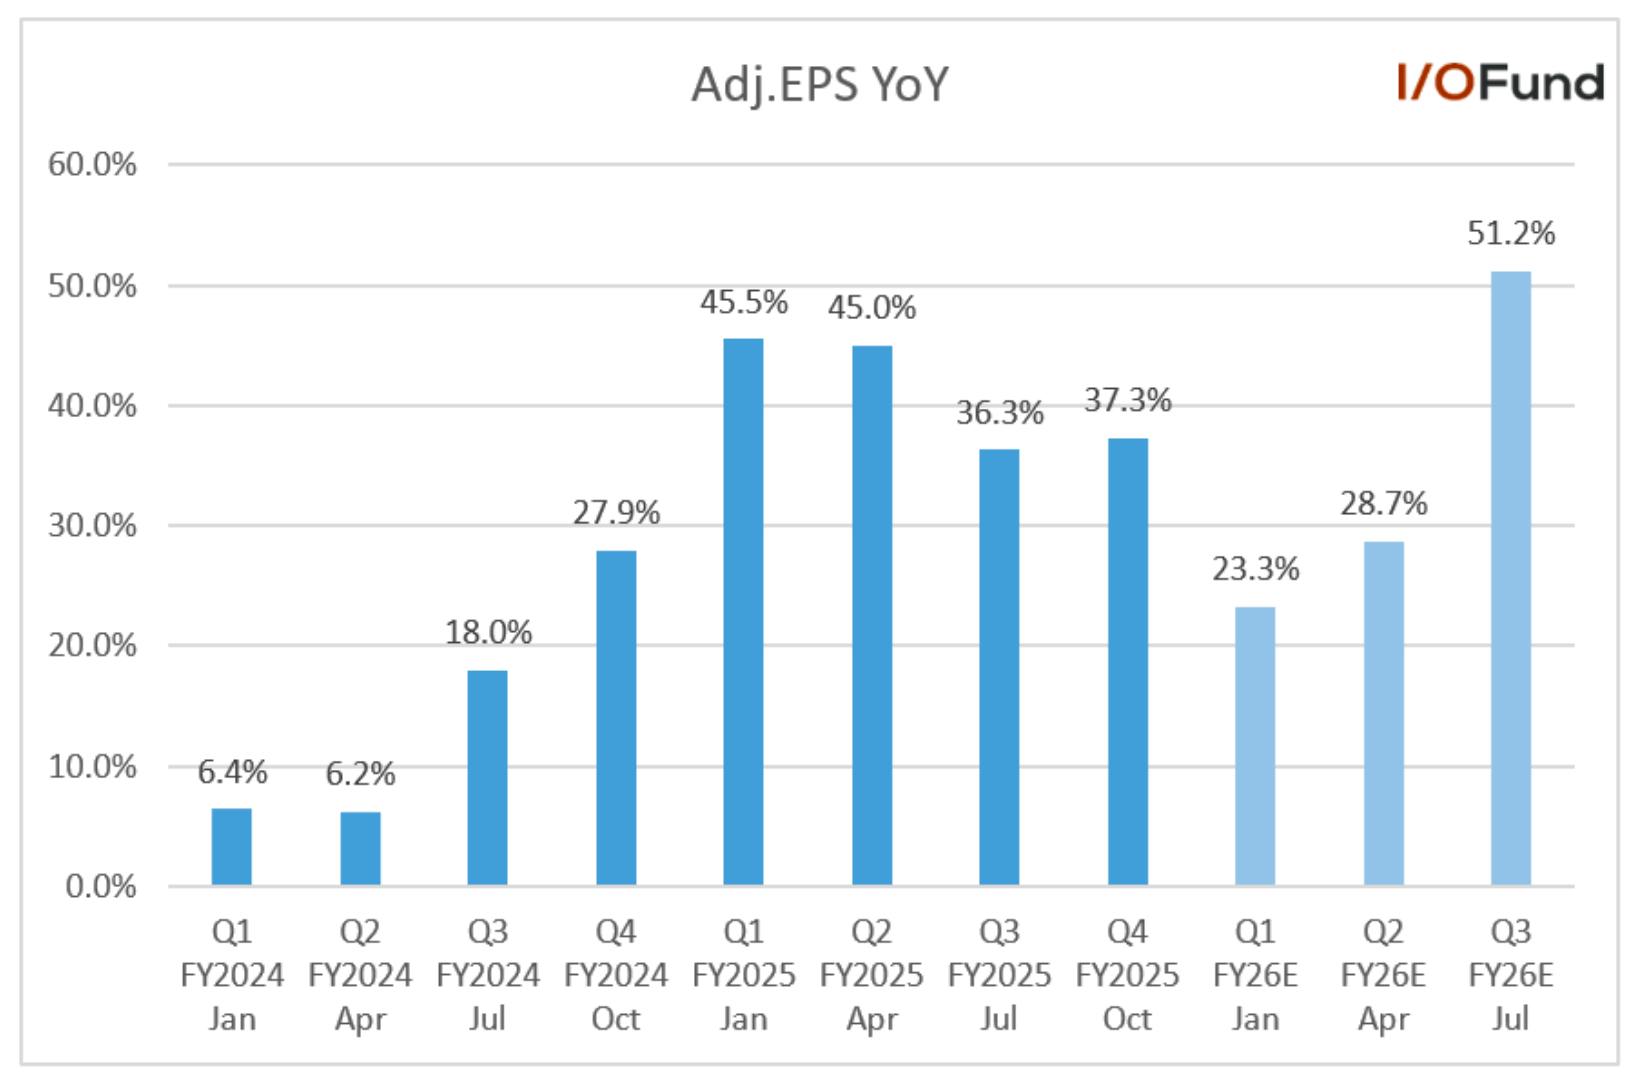
FQ4 GAAP EPS grew by 93.3% YoY to $1.74. While adjusted EPS grew by 37.3% YoY to $1.95, beating estimates by 4.3%. Analysts expect adjusted EPS to grow by 23.3% YoY to $1.97 in FQ1 and 28.7% YoY to $2.03 in FQ2.  

Strong adjusted EPS is expected to continue in the coming years and analysts expect FY2026 adjusted EPS to grow by 39.1% YoY to $9.39 and 35.6% YoY to $12.72 in FY2027. However, these estimates are conservative, as the ramp-up of recent deals is expected to provide a further boost to the bottom line in the long term. 
Cash Flow and Balance Sheet 

Broadcom’s cash flows are improving, driven by higher profits. 

  • FQ4 operating cash flows grew by 37.5% YoY to $7.70 billion with an operating cash flow margin of 42.8% compared to 39.9% in the same period last year. 
  • FQ4 free cash flows grew by 36.2% YoY to $7.47 billion with a free cash flow margin of 41.4% compared to 39% in the same period last year. 
  • Cash was $16.18 billion at the end of FQ4 with debt of $65.1 billion compared to $10.7 billion cash and debt of $64.2 billion at the end of FQ3; cash increased due to higher free cash flows in the recent quarter. 
  • Management also increased the quarterly dividend by 10% to $0.65 or $2.60 for FY2026. 
  • Inventory grew by 4% sequentially to $2.3 billion in FQ4.

Conclusion: 

Broadcom provided a solid report with no red flags to speak of. The AI cycle is approaching an inflection point, as a technology long debated will finally begin to move toward monetization, which will be a defining moment for the markets. If I had to guess, after listening closely to the management teams on the front lines, we will see major progress on inference in 2026 with more economic impact in 2027-2028.  

That makes 2025 the AI crux as many companies are spending an ungodly amount on building AI infrastructure with little immediate return on investment. When revenue and profits begin to catch up to these investments, the impact could be significant. I believe Broadcom will have a front row seat for that moment.  

You can read previous discussions around Broadcom’s custom silicon opportunity and networking opportunity in the deep dive on the Networking/ASICs Giant, the analysis covering the $110B backlog, and also This Stock is Set to Surge from AI Inference.Networking/ASICs Giant, the analysis covering the $110B backlog, and also This Stock is Set to Surge from AI Inference.

I/O Fund Equity Analyst Royston Roche contributed to this analysis.

Please note: The I/O Fund conducts research and draws conclusions for the company’s portfolio. We then share that information with our readers and offer real-time trade notifications. This is not a guarantee of a stock’s performance and it is not financial advice. Please consult your personal financial advisor before buying any stock in the companies mentioned in this analysis. Beth Kindig and the I/O Fund own shares in AVGO at the time of writing and may own stocks pictured in the charts.

Recommended Reading:
Broadcom Stock: The Silent Winner in the AI Monetization Supercycle

When discussing the AI Monetization Supercycle, I would be remiss not to highlight Broadcom. The AI accelerator market will inevitably widen beyond Nvidia’s GPUs – the keyword is widen. More players will sell more AI systems as the market expands, and that growth supports both the clear leader (Nvidia) and those already in pole position, such as Broadcom.  

Last week, amidst a flurry of noise in the AI market, my firm wrote an article on the AI Monetization Supercycle that is not being priced in. The analysis suggested the predominant risk is not an AI dot-com bubble or various headlines weighing on sentiment, but rather the risk investors face is missing out on what may be one of the strongest investing opportunities of our lifetime: what I’ve dubbed the AI Monetization Supercycle catalyzed by the inference phase. 

While many refer to this as the “AI Supercycle,” I believe Monetization is a critical word missing from that description. The hallmark of the next phase will not be the architectural leap toward AI superintelligence (although important) – but rather, it will be defined by the ability to monetize this very expensive technology. As an investor, I am obligated to care more about the latter.  

Which brings us back to Broadcom—a stock my firm highlighted in our free stock newsletter last June in an article entitled “This Stock is Set to Surge from Inference Demand.” 

At the time, I wrote: 

“Broadcom has already benefited from both increasing compute and networking needs – but the surge in inference demand will disproportionately (and positively) flow to Broadcom’s top line and bottom line. This is because custom silicon’s cost advantages and ability to drive lower inference serving costs at scale creates a strong value proposition for Big Tech. As more and larger clusters are deployed to serve exploding inference demand, there will be additional long-term tailwinds for the Ethernet networking giant.” 

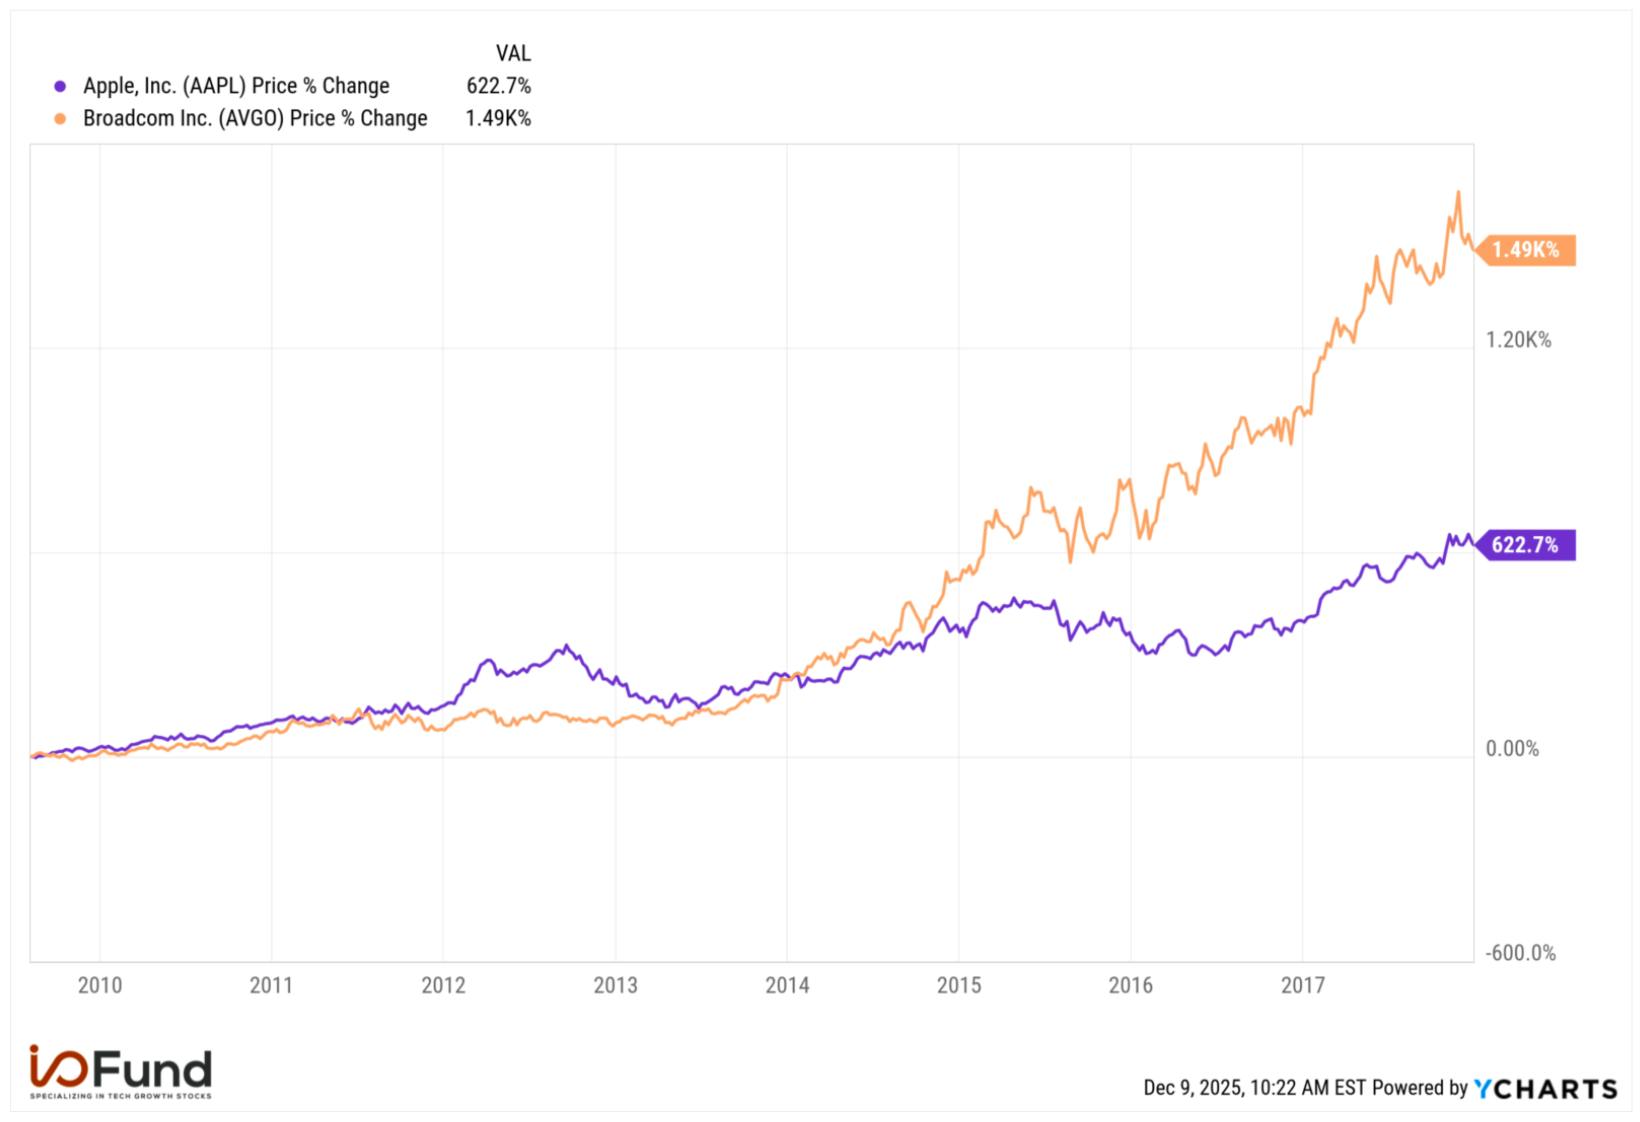
The inference phase – what I'm calling the Monetization Supercycle – is squarely in front of us. While many will understandably point toward companies like OpenAI as the biggest beneficiaries, it is one of the market’s greatest misconceptions that platform owners always outperform suppliers (hardware stocks). During the mobile era, Broadcom’s stock outperformed Apple precisely because it supplied RF and connectivity components to the iPhone giant. 

Below, we look more closely to see if the “silent winner” Broadcom stock can repeat that outperformance again.

Line chart comparing Broadcom (AVGO) and Apple (AAPL) stock performance over a 10-year mobile boom era. Broadcom delivered a 1,490% return, significantly outperforming Apple’s 623%.

Stock Price Comparison Chart: $AVGO vs $AAPL. Broadcom Stock significantly outperformed Apple stock in the 10-year cycle of the mobile boom era, delivering a return of 1,490% compared to Apple’s 623%. Source YChartsYCharts

Google TPU Ironwood v7: The Custom AI Chip Built for Inference 

Last April, Google announced that its upcoming seventh-gen TPU Ironwood is its “most performant and scalable custom AI accelerator to date, and the first designed specifically for inference.” Individual Ironwood TPUs are interconnected into larger units called pods, coming in two sizes, a 256-chip pod and a 9,216-chip Superpod, with the larger size offering up to 42.5 exaflops of performance. Notably, the Superpod would deliver 24x the compute of El Capitan, the largest supercomputer in the world.  The rack-scale architecture offers 64 TPUs compared to Nvidia’s racks with 72 GPUs, with a small cluster being four pods connected through an optical circuit switch network. While TPUs may excel at driving down costs on certain workloads, Nvidia’s GPUs still lead when it comes to processing performance.

mid

Google adds that Ironwood offers 2x the performance per watt as last-year’s generation Trillium, with 6x more HBM and 4.5x the HBM bandwidth; versus TPU v5p, released in 2023, Ironwood brings a more than 10x improvement in peak performance per chip and per pod. The substantial increases in memory and bandwidth are critical for maintaining high performance when processing larger data sets while the improvements in power efficiency allows inference workloads to be run in a cost-effective manner. 

It’s widely understood that Broadcom supplies Google with its custom TPUs. The incoming inference growth curve, that the I/O Fund detailed here, has led CEO Hock Tan to state Broadcom may witness an acceleration of XPU demand into the back half of 2026. He said, “In fact, what we've seen recently is that they are doubling down on inference in order to monetize their platforms. And reflecting this, we may actually see an acceleration of XPU demand into the back half of 2026 to meet urgent demand for inference on top of the demand we have indicated from training.”   

Something similar was echoed in the FQ3 call, with Tan stating: “But also as for these guys, they got to be accountable to being able to create cash flows that can sustain their path. They [are] starting to also invest in inference in a massive way to monetize their models.” On that note, Google’s TPU business received a significant vote of confidence recently with Anthropic signing a deal for up to one million TPUs, including Ironwood, coming online in 2026. The deal is said to be worth tens of billions.  

For Broadcom, the TPUs are expected to be the primary driver of AI revenue growth in fiscal 2026 – estimates from HSBC earlier this summer projected Google’s TPUs to represent ~58% of Broadcom’s ASICs shipments at 1.79 million, but account for ~78% of ASICs revenue at $22.1 billion. This is because Google’s TPUs were estimated to carry a significant price premium at $13,000 per chip versus Broadcom’s other projects at $5,000 per chip. However, this is still less than half the cost of Nvidia’s chips at $30,000 to $40,000 for a solo B200 ($60,000 to $70,000 for a GB200).  

Looking beyond fiscal 2026, projections for TPU shipments are surging. Morgan Stanley now expects 5 million TPUs to be shipped in 2027, a 67% rise from its prior estimate for 3 million; for 2028, the firm estimates shipments as high as 7 million, a 120% increase from its prior estimate. This would project YoY growth of 40% from 2027 to 2028, a substantial increase from 6% previously, and will represent more than 2X growth in two years. 

The I/O Fund first covered TPUs versus GPUs back in 2019 and revisited the topic in February 2024 in our analysis, Broadcom: Networking/ASICs Giant and the Second Largest by AI Revenue. Since then, we’ve provided quarterly coverage for two years. Broadcom: Networking/ASICs Giant and the Second Largest by AI Revenue. Since then, we’ve provided quarterly coverage for two years.  

If you want cutting-edge insights on AI stocks early in the cycle — including our take on Broadcom’s earnings this evening — sign up now.sign up now

Broadcom Stock’s AI Edge: Custom Silicon & Massive Hyperscaler Deals 

Broadcom’s stock has been strong this year, outperforming the Nasdaq by nearly 50-points and SMH by 20-points. This strong performance is partly due to custom accelerators that are often multiples cheaper than Nvidia’s GPUs for inference tasks and also due to custom silicon becoming increasingly performant with each generation. By optimizing algorithms (software), Big Tech can drive higher performance from large language models — which helps to drive down costs while also increasing output for specific workloads.  

For example, a rough idea as to how much it costs Nvidia to make merchant GPUs is estimated around $3,000 to $6,000 whereas the company charges $30,000 to $40,000 – hence the AI leader’s excellent margins. Reducing Nvidia’s high pricing power is what Big Tech is after and this can be accomplished both in the hardware costs but also through optimizing the workloads for specific use cases – for comparison, Ironwood is expected to cost around $13,000 per chip.  

Big Tech is prominent in Broadcom’s custom silicon customer list, which includes Google and Meta. ByteDance reportedly emerged as the third customer last summer. The company announced its fourth customer in FQ3 with a $10 billion XPU order. Hock Tan said in the FQ3 earnings call, “Last quarter, one of these prospects released production orders to Broadcom, and we have accordingly characterized them as a qualified customer for XPUs and, in fact, have secured over $10 billion of orders of AI racks based on our XPUs.” 

In late October, Anthropic signed a deal with Google worth tens of billions to access up to 1 million TPUs to bring online more than 1GW of capacity in 2026, although it has not explicitly confirmed if Anthropic is the mystery fourth customer.

Furthermore, OpenAI and Broadcom announced in October a strategic collaboration to deploy 10 gigawatts of OpenAI-designed AI accelerators. OpenAI and Broadcom will co-develop systems that include accelerators and Ethernet solutions from Broadcom for scale-up and scale-out. Broadcom plans to deploy racks of AI accelerators and network systems starting in the second half of 2026 and completed by the end of 2029.  

The OpenAI deal represents a substantial three-year revenue ramp for Broadcom stock and further solidifies its position in the AI silicon market. Citi estimates the deal with OpenAI could bring in $100 billion in sales and $8.00 in earnings per share over the next few years; however, Mizuho highlighted that the deal to deploy 10GW of OpenAI's custom ASIC, code named Titan, could be even larger at an estimated $150 billion to $200 billion deal over multiple years. 

The enviable customer list is showing up in Broadcom’s results. This quarter, management guided Q4 AI revenue to $6.2 billion, which would represent ~19% sequential growth and eleven consecutive quarters of YoY growth.  

Broadcom did not lay out a FY25 AI revenue target, yet FQ4 ending in October 2025 implies Broadcom is guiding for $19.9 billion in AI revenue for the year, up 63% YoY from $12.2 billion in FY24. Mizuho estimates that AI revenue will grow 103% YoY to $40.4 billion for the FY2026 and nearly double to $78 billion in FY2028. However, given the growing customer list, these estimates could prove to be too low. 

Additionally, Hock Tan will be duly rewarded should AI revenue targets exceed current expectations. In September, Tan received a performance award of 610,251 shares of common stock as part of a recent contract extension. The award will fully vest if Broadcom reaches $90 billion in revenue from its AI products over any consecutive four-quarter period from FY2028 through FY2030. That award will double if Broadcom earns $105 billion in AI revenue and triple if revenue totals more than $120 billion. If Broadcom fails to hit $60 billion in AI revenue during the period, Tan will forfeit the entire award. This provides investors with a framework for upper targets for the bull case. 

Chart showing Broadcom (AVGO) AI revenue forecast reaching $40.4 billion in FY2026, driven by Google TPU deployments and rising demand for custom silicon solutions.

Broadcom (AVGO) AI Revenue Forecast: Projected to hit $40.4 billion in FY2026, driven by Google TPUs and custom silicon demand.  

Source: Company IR/TheFly/Mizuho 

Broadcom’s Tomahawk 6: The Ethernet Switch to Power 1 Million-Plus AI Clusters 

Broadcom has been quite vocal about the industry’s path to 1-million-plus accelerator clusters, frequently reiterating how its three hyperscalers and now four “each race towards 1 million XPU clusters by the end of 2027.” This would be multiples larger than current deployments, with xAI’s Colossus supercluster expanding from 100K to 200K GPUs Today, these clusters are 10-20X larger than Ironwood’s 9,216 chip SuperPod, highlighting the depth of AI demand. 

Broadcom has continuously re-emphasized this forecast as it represents two major growth opportunities for the company: significant growth in accelerator deployments with inference tailwinds, and even more growth in networking deployments to support these clusters.  

The shift to Ethernet and away from Nvidia’s lock-in ecosystem of GPU + InfiniBand is benefiting Broadcom, with the industry pointing to rising Ethernet demand. Arista said that momentum for Ethernet “has really shifted in the last year” while Nvidia touted that its new Spectrum-X Ethernet is annualizing at $10 billion in revenue, or $2.5 billion quarterly.  

The company is committed to remaining on the leading edge of networking with its Tomahawk 6 switch, the industry’s first 102.4 Tbps Ethernet switch. The next-gen switch doubled the bandwidth of its predecessor, while offering flexible deployment ability with 1,024 100G or 512 200G SerDes options, reducing switch count.  

This raw performance upgrade paves the way for >100K to 1 million accelerator clusters by allowing larger leaf-spine fabrics to be constructed, while drawing less power and keeping latency low. Broadcom exec Ram Velaga said that the demand for the new switch is “unprecedented” with multiple >100K accelerator deployments “using Tomahawk 6 for both the scale-out and scale-up interconnect.” 

When discussing Tomahawk 6, management points toward the flattening of the AI cluster as an important catalyst for this product, stating: “[…] Tomahawk 6 enables clusters of more than 100,000 AI accelerators to be deployed in just two tiers instead of three … this flattening of the AI cluster is huge because it enables much better performance in training next-generation frontier models through a lower latency, higher bandwidth and lower power.” The two-tier topology also reduces complexity of cluster construction and reduces congestion choke points significantly, addressing another critical pain point of building larger and larger clusters.  

Additionally, in terms of the AI networking opportunity, scale up is 5-10X more than scale out – setting up a nice trajectory as AI clusters grow. Oppenheimer analyst Rick Schafer highlighted that they expect next-gen Tomahawk6 volumes to ramp up in the second half of next year, providing added growth and gross margin boost. 

Broadcom FQ4 Earnings Preview: AI Revenue Outlook & OpenAI Deals 

  • Revenue expected to grow by 24.2% YoY and adjusted EPS by 31.7%. 
  • AI Revenue outlook 
  • New customer announcements 
  • Update on AI Serviceable Market for 2027 

Broadcom is expected to report FQ4 revenue of $17.46 billion, up 24.2% YoY and a 220-basis points acceleration from the 22% growth reported in FQ3. Adjusted EPS is expected to grow 31.7% YoY to $1.87. 

Chart illustrating Broadcom (AVGO) expected FQ4 revenue growth of 24.2% year-over-year to $17.46 billion, driven by accelerating AI-related demand.

Broadcom (AVGO) FQ4 revenue is expected to grow 24.2% YoY to $17.46 billion, driven by AI Revenue Acceleration. 

Source: Company IR/Seeking Alpha 

The company’s margins will be a key metric to watch in the upcoming report. Management has done an excellent job in maintaining strong margins. Broadcom has been able to reduce operating expenses through cost controls and operational efficiency. Management expects adjusted gross margins to be down 70 basis points sequentially to 77.7% in FQ4, primarily due to a higher mix of XPUs and wireless. However, they are expected to be up 80 basis points compared to the same period last year. The company’s operating leverage should help to compensate for any sequential weakness in gross margins due to the FQ4 product mix. Management adjusted EBITDA guide for FQ4 is 67%, flat sequentially and up 200 basis points YoY.  

Analysts expect strong adjusted EPS growth in the coming years. Adjusted EPS is expected to grow 39.1% YoY to $9.39 in FY ending October 2026 and 35.6% YoY to $12.72 in FY2027. The strong expected EPS growth showcases operating leverage, successful VMware integration, the benefits of higher margin software revenue, and rising AI revenue.  

During the last earnings call after winning the $10 billion XPU order from the new customer, Hock Tan said, “And reflecting this, we now expect the outlook for our fiscal 2026 AI revenue to improve significantly from what we had indicated last quarter.” We expect management to provide more details on the AI revenue outlook for FY2026. The Q4 management guide of $6.2 billion implies that Broadcom is guiding for $19.9 billion in AI revenue for FY2025, up 63% YoY from $12.2 billion in FY24. Analysts are pointing to 100% YoY growth in AI revenue in FY2026, with Mizuho estimating that AI revenue will grow 103% YoY to $40.4 billion. 

According to a recent report by The Information, Broadcom is in discussion with Microsoft to co-develop custom silicon chips. Analysts will likely ask for more details on this and other customers such as the $10 billion XPU order mentioned during the FQ3 earnings call and the OpenAI deal announced in October. The OpenAI deal is also expected to provide a strong boost to the company’s bottom line as UBS expects “large-scale deployments are expected to ramp later, positioning EPS to reach about $13.50 in 2027 and potentially above $20 by 2028 as projects come fully online.” It highlights that the current consensus adjusted EPS estimates for FY2028 of $15.80 are very low, a 27% difference. 

Hock Tan often references the AI Serviceable Market. We could expect Tan to provide an update for 2027 at the next earnings call, as the company has been adding new customers over the past year. Hock Tan had said during the FQ4 earnings call in December last year, “In 2027, we believe each of them plans to deploy 1 million XPU clusters across a single fabric. We expect this to represent an AI revenue Serviceable Addressable Market, or SAM, for XPUs and network in the range of $60 billion to $90 billion in fiscal 2027 alone.” 

Conclusion: 

This year, Broadcom stock has outperformed Nvidia’s stock despite the two being about $200 billion apart in AI revenue with Broadcom at $20 billion in AI revenue for FY2025 ending in October and Nvidia at $250 billion run rate in the quarter ending in Jan. Nvidia clearly has the scale for R&D purposes to help defend its lead. However, I’ve also argued inference will provide an opening for Broadcom and AMD to meaningfully compete on AI accelerators.  

At the I/O Fund, when discussing Nvidia versus Broadcom, the answer is yes and yesyes and yes. We look for fundamental strength, product positioning, supply chain signals, and numerous other proprietary criteria to help us determine if a stock is participating in the AI trend.  

I won’t yank your chain by pretending investors must choose one or the other. In a widening market, leadership compounds at the top and radiates outward as exponential demand will lift the entire ecosystem – including a ripple effect for lesser-known AI networking and AI energy names. 

As we move deeper into the second half of this AI-driven decade, the investors who stay focused on the bigger picture — rather than react to every speculative headline or force themselves into a false binary — will be the ones best positioned to capture the full opportunity of the AI Monetization Supercycle. 

This year, my firm has 15 positions beating the Nasdaq YTD, up from ten positions last year – helping to cement the I/O Fund as one of the world’s leading AI portfolios. Our cumulative return of 210% over a five-year period would rank us #2 if we were a hedge fund and #5 if we were an ETF – notably, this strong cumulative return does not yet include our 2025 performance.

Get real-time trade alerts, weekly webinars and deep dives on lesser-known AI stocks in our Advanced tier. Learn more hereLearn more hereLearn more here

Please note: The I/O Fund conducts research and draws conclusions for the company’s portfolio. We then share that information with our readers and offer real-time trade notifications. This is not a guarantee of a stock’s performance and it is not financial advice. Please consult your personal financial advisor before buying any stock in the companies mentioned in this analysis. Beth Kindig and the I/O Fund own shares in AVGO at the time of writing and may own stocks pictured in the charts.

Recommended Reading:
Coherent: Indium Phosphide Capacity to Double, Data Center to Reaccelerate to 10% QoQ 

Coherent is not nearly as flashy as Lumentum when it comes to revenue growth or even data center growth, yet the company is sitting in a prime position moving through 2026 as the industry navigates extremely tight indium phosphide (InP) capacity coupled with elevated demand for InP-based EML lasers. This is because Coherent is preparing to double indium-phosphide capacity via a multi-faceted expansion plan with multiple facilities ramping output in unison, while shifting to a larger wafer size that can deliver 4X output per wafer at half the cost. 

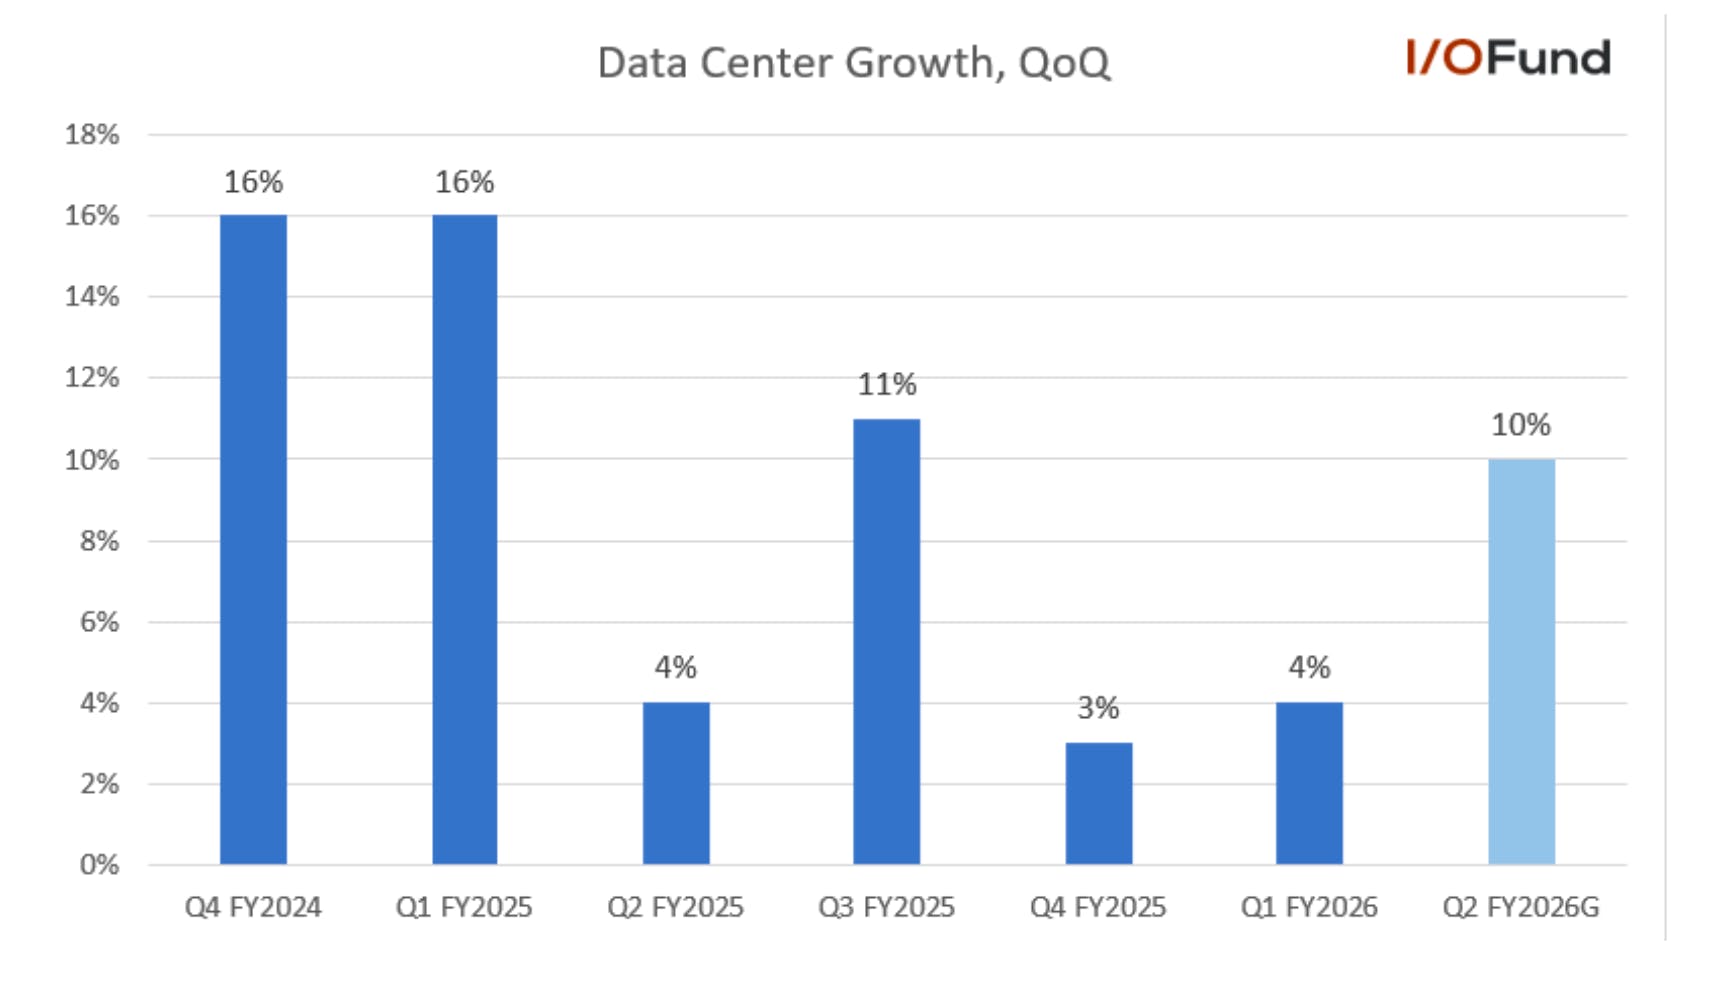
This dynamic is expected to help drive a reacceleration in Coherent’s data center segment to 10% QoQ growth next quarter, a notable uplift from 4% this quarter, along with margin expansion driving solid adjusted EPS leverage. Management also stated they expect “strong sequential growth through the balance of this fiscal year given very strong demand and improving supply.” 

On the product side, Coherent sees strong demand for both its 800G and 1.6T transceivers, with 1.6T expected to drive a significant portion of the guided sequential growth. This first wave of 1.6T growth is expected to be split between both EML-based and CW laser-based silicon photonics transceivers, with Coherent able to benefit from both as it can quickly shift capacity for whichever customers prefer. 

For Coherent’s AI-related revenue exposure, Datacenter and Communications account for ~69% of total revenue. This also includes some contribution from telecom so is not an exact figure yet provides a rough idea as to Coherent’s AI exposure. 

InP Capacity to Double, Data Center to Accelerate to 10% QoQ in Q2 

Coherent has many products that participate in the AI-driven datacom transceiver and optical interconnects market. Primarily, the growth story centers around supplying pluggable optical transceivers (400G, 800G, 1.6T) including EML lasers, VSCEL lasers and CW lasers, and emerging co-packaged optics technologies for next-generation switches and interconnects.  Right now, the primary focus centers on EML supply and indium phosphide capacity, given Coherent, Lumentum and others have pointed out how imbalanced supply is relative to exceptionally strong demand.  

Electro-absorption modulated lasers (EMLs) have quickly become attractive for AI servers as these components help enable 100G and 200G per lane transmissions, thus enabling 800G and 1.6T data rates for optical transceivers. EMLs also leverage indium phosphide (InP) over silicon as InP reduces power consumption, although it is more expensive at the component level as four EMLs are needed compared to two lower-cost CW lasers for silicon photonics modules.  

Coherent’s data center segment growth was “constrained by the supply of indium phosphide lasers” and specifically EMLs in Q1, with Coherent reporting just 4% QoQ and 23% YoY growth in the segment. This was a slight uptick from 3% QoQ in Q4, where management cautioned that “sequential growth rates can fluctuate quarter-to-quarter based on lumpiness of demand from our customers or supply or capacity related things.” 

Notably, Coherent is guiding for the data center segment to grow ~10% QoQ in fiscal Q2, “followed by strong sequential growth through the balance of this fiscal year given very strong demand and improving supply.” Q2’s sequential growth guide also includes some unmet backlog that rolled over from Q1 due to InP constraints.  

6-inch InP Wafers to Produce 4X more than 3-inch InP Wafers 

Expectations for significant sequential improvements in internal and external supply through 2026 are the primary factors driving this strong QoQ growth outlook over the next few quarters, helping Coherent potentially absorb higher levels of EML demand. Much of the improvement in internal supply is tied to the company’s InP capacity expansion plans and shift to 6-inch wafers (the world’s first 6-inch fabs), aiming to double InP capacity again after recently tripling it:  

“We are aggressively ramping 6-inch capacity because a 6-inch wafer compared to a 3-inch wafer will produce more than 4x as many chips at less than half the cost. This will provide increasing benefit to our gross margin as we continue to ramp production.”  

Q2 is also the first full quarter of production on the 6-inch wafer, after production initially started mid-quarter in Q1.  

While the ability to produce 4x more chips at less than half the cost is certainly impressive in itself, 6-inch wafer yields are more important: “Our initial 6-inch indium phosphide production yields are actually higher than our current 3-inch indium phosphide yields.”  

The major takeaway here is not only that 6-inch wafer yields are better than 3-inch, but that these are the initial yields versus the ‘very mature’ 3-inch lines, suggesting that there is room for further improvement as production continues to ramp over the next four quarters and as 6-inch matures. As such, Coherent will likely be exceeding linear capacity growth over the next few quarters as 6-inch ramps and then matures. The cost advantages from 6-inch are also expected to drive more meaningful gross margin benefits in calendar 2026 and in each sequential quarter, though current margin tailwinds are minimal.  

Management also offered a bit more of a long-term picture on capacity in response to a question about milestones to track this doubling of InP capacity over the next 12 months. CEO Jim Anderson explained that some of Coherent’s largest customers are now showing forecasts through 2028, and “given that demand signal that we're seeing, not just for next calendar year, but now for '27 and '28, our plan is to continue to ramp indium phosphide capacity beyond the next 12 months as well. And certainly, we'll share more thoughts on the rate and pace of that ramp over the next 12 months.”  

Coherent Expanding InP Capacity, Targeting 2X Growth in One Year 

As mentioned briefly above, Coherent is aiming to double its InP capacity in roughly one year in order to meet higher levels of demand. This capacity growth is coming from a simultaneous capacity ramp in both Texas and Sweden, supported by strong initial yields: 

“Given the healthy yields we are seeing with 6-inch production, we began production of 6-inch indium phosphide at a second site in Jarfalla, Sweden …  With the ramp of 6-inch production at 2 sites in parallel, we expect to roughly double our total internal production capacity of indium phosphide over the next year.” Importantly, this ramp covers the three key transceiver components, EMLs, CW lasers and photodiodes. Management said they will share progress updates on the ramp as they occur, but added that “beyond the next 12 months, we expect to continue to expand capacity,” hinting that capacity could more than double by calendar 2027. 

Not only is Coherent’s InP capacity doubling, but external capacity is expected increase sequentially as well: “We expect our external supply of EMLs to increase sequentially this quarter and next calendar year through continued partnership with our key external suppliers.” 

This quick capacity expansion is critical in helping close the supply-demand imbalance, which theoretically will translate into an ability to capture more revenue and drive faster growth the smaller the gap becomes. 

More on 1.6T Transceivers and the EML vs CW Ramp Question 

As we have discussed previously, Coherent’s growth story centers around supplying Nvidia with pluggable optical transceivers (400G, 800G, 1.6T) including EML lasers, VSCEL lasers and CW lasers, and emerging co-packaged optics technologies for next-generation switches and interconnects. Coherent’s transceivers work with both Ethernet or InfiniBand, as well as proprietary protocols such as Nvidia’s NVLink and Nvidia’s interconnect chips NVSwitch. 

Coherent’s ability to now get 4X more chips per wafer while supplementing this with external supply can directly drive 800G/1.6T transceiver output much higher over the course of the fiscal year, as InP capacity is fully consumed internally for transceivers. More importantly, Coherent is early compared to some of its competitors – management pointed out that at OFC earlier this year, they were the “only company to demonstrate 3 different types of 1.6T transceivers based on 3 different types of laser sources; silicon photonics, EML and VCSEL.” 

Additionally, Coherent is already ramping its first EML and silicon photonics-based 1.6T transceivers, noting that a “significant portion of the sequential growth we expect in the current quarter is driven by 1.6T adoption.” This compares to Lumentum, who stated that they “have expectation to be shipping 1.6T transceivers sometime middle-ish of next year, and those will be at the early part of the customer ramp as well.” This gives Coherent a few quarters to ramp output and secure market share before Lumentum brings its products to market.  

Management provided ample discussion around 800G and 1.6T demand, summarized below: 

  • 800G demand remains very strong with strong orders, and significant YoY growth is expected in calendar 2026. 
  • 1.6T adoption is accelerating, with Coherent engaged with multiple customers with multiple ramping in parallel, with strong orders. Management also expects significant 1.6T growth in calendar 2026.  

As mentioned above, the first wave of growth for 1.6T transceivers will be a mix of both silicon photonics (which uses CW lasers) and EML-based, with 200G VSCEL-based 1.6T transceivers ramping much later in 2026. Similar to Lumentum, Coherent expects to be well positioned for whichever way this mix shifts and expects to benefit regardless of whether customers prefer CW laser-based or EML-based transceivers:  

“From our perspective, there's no significant profitability trade-off between those two. Really, what drives our production mix of EML versus CW is purely the demand from our customers, right? So if it's more silicon photonics-based transceivers, then we'll allocate more capacity to CW lasers. If it's more EML, we'll allocate it to EML. And I think in general, we can make those choices certainly 6 months ahead of time. We can even make those choices even 4 months ahead of time. So I would say somewhere to the kind of 4 to 6 months ahead of time, we have to do the capacity planning between EML and CW.” 

Although management has not outright confirmed this, it’s likely that the strength of demand means there will be more than enough content for Coherent (and Lumentum) to participate. 

Bookings Support Strong Ramp 

The strong demand and ramp signals for 1.6T transceivers are further supported by Coherent’s bookings, and while an exact bookings figure was not disclosed, commentary suggests bookings have moved substantially higher.  

Management explained that they “received direct bookings that represent a step function increase in already strong customer demand,” with record bookings for transceivers (primarily driven by 800G and 1.6T), as well as for DCI and telecom products. InP capacity growth allows more of this backlog to be converted to revenue over the coming quarters, which could translate to Datacenter revenue growth remaining stronger for longer.  

Management also explained that this includes both typical bookings for near-term supply, as well as orders more than a year in advance, as customers are already looking to lock in supply for 2027 due to strong demand forecasts they are seeing.  Some of Coherent’s large customers are providing strong forecast visibility into 2028, giving management the confidence in ramping capacity to meet multi-year demand growth.  

Initial Co-packaged Deployments on Deck for 2026 

In Q1, Coherent began sampling its 400mW CW lasers for co-packaged optics (CPO) and silicon photonics applications, with the lasers expected to address “a broad range of CPO form factors for both scale-out and scale-up data center applications with this new product.”  

Co-packaged optics (CPO) are not contributing to revenue now yet could materialize into a strong opportunity for Coherent as Nvidia begins to roll out its Spectrum-X photonics networking switches in 2026.  

Coherent expects initial CPO deployments in calendar 2026, though volume production and availability of the 400mW CW lasers is expected to start in Q3, meaning the ramp may be more geared towards 2027. Additionally, surging InP capacity growth with improved yields at 6-inch wafers also suggests that Coherent could be rather quick to ramp CPO when the time comes, as supply allocation allows. Outside of this, discussion on CPO was rather limited.  

Other Product Opportunities 

Coherent also has a handful of other upcoming product opportunities outside of EMLs, 1.6T transceivers and CPO: 

  • Optical Circuit Switching (OCS) – Coherent maintains that they have a more advanced approach/advantage to OCS through liquid crystal technology versus the more mechanical MEMS technology that competitors offer, with OCS adding a >$2 billion addressable market over the next few years. Coherent said its revenue and backlog for OCS grew sequentially in Q1 and is expected to grow again in Q2, with the company shipping systems to seven customers. 
  • Linear Receive Optics (LRO) and Linear Pluggable Optics (LPO): Coherent says LPO has potential to offer lower power consumption, lower cost and lower latency versus traditional retimed optics, while LRO are optimized for low power consumption in distances up to 500 meters, such as for network switch interconnects. Coherent says it has shipped both LPO and LRO 800G and 1.6T transceivers to customers. 
  • Thermodyne – Coherent believes its experience in advanced materials for thermal management could help address thermal issues and cooling needs of future AI data centers as GPU racks get more powerful. Coherent said that its Thermodyne material “moves heat twice as effectively as copper which is a tremendous advantage in data center cooling applications,” and while it is engaged with hyperscalers on the tech, it’s too early in its emergence to project how this will pan out. 
  • Data Center Interconnect (DCI) – Although recognized as part of telecom (under Communications), demand is driven by AI, as the long-distance data transmissions can range up to hundreds of kilometers, crucial for current data center buildouts. Coherent has seen five sequential quarters of growth for DCI along with strong orders in Q1. 

Streamlining Portfolio, Paying Down Debt 

Coherent has made steps recently to streamline its portfolio, notably with the $400 million sale of its Aerospace and Defense unit in early September. The sale was immediately accretive to gross margin and EPS, per management, with proceeds going to pay down debt. 

In Q1, Coherent also announced the sale of its materials processing product division based in Germany, which has averaged revenue of ~$25 million (1.6% of revenue) in recent quarters with gross margins well below corporate average. Coherent also expects to use proceeds to pay down debt, and once again the transaction is expected to be immediately accretive to gross margins and EPS upon closing, slated for fiscal Q3. 

Relating to its physical manufacturing footprint, Coherent has sold or exited 23 different sites and plans to “continue to streamline our footprint and exit additional underutilized or unnecessary sites over the coming quarters.” This will consolidate operations to its key plants and likely also create small margin tailwinds.  

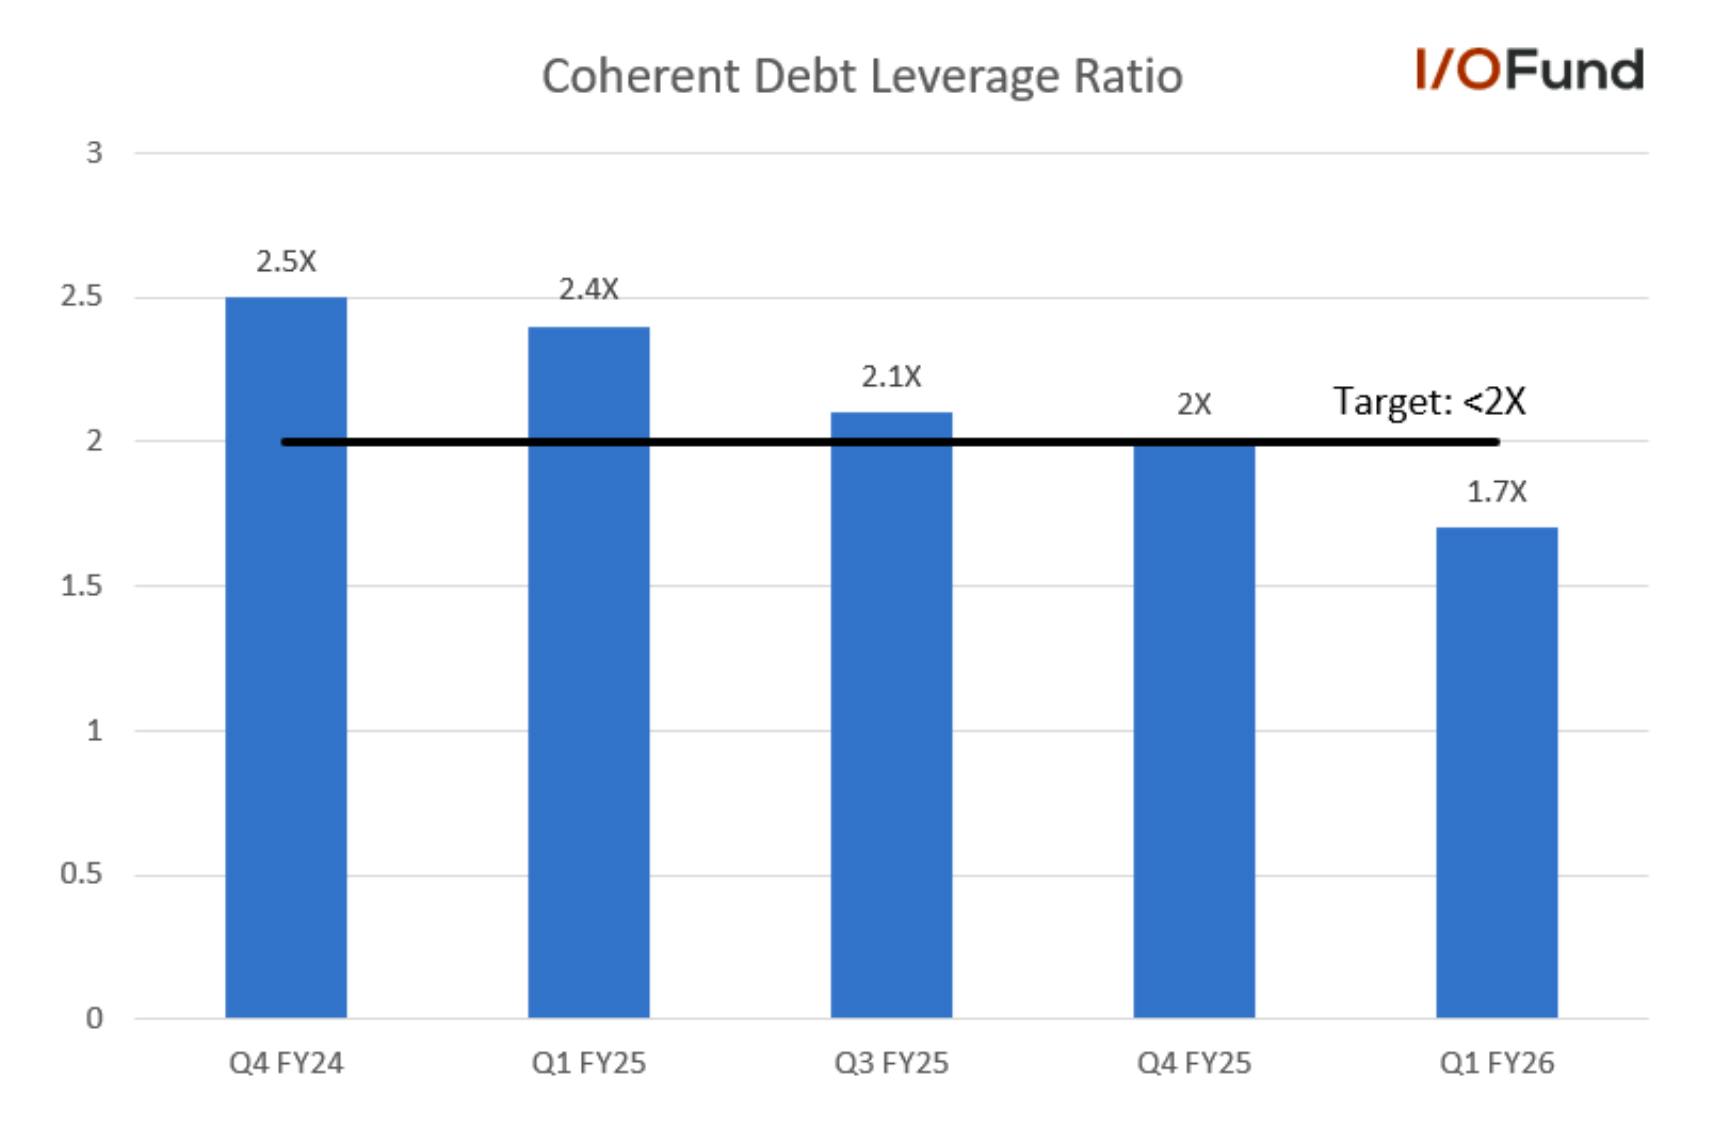
As a result, Coherent has made substantial progress on its debt leverage ratio, paying down $400 million in debt in Q1. On that note, Coherent’s debt has declined approximately $1 billion over the last two years, from $4.29 billion in Q1 FY24 to $3.31 billion this quarter – a nearly 23% reduction.  

Coherent’s debt leverage ratio has now improved to 1.7x, down from 2x in the prior quarter and 2.4x a year ago. This is notably now below the company’s <2x target, implying that as further sales are recorded and used to pay down debt (such as the materials processing unit), debt leverage ratio will continue to improve. This is key to Coherent’s turnaround story as the company can better withstand potential cyclical whipsaws with a less-stressed balance sheet.  

Financials 

Revenue Growth to Inflect in Late FY26 

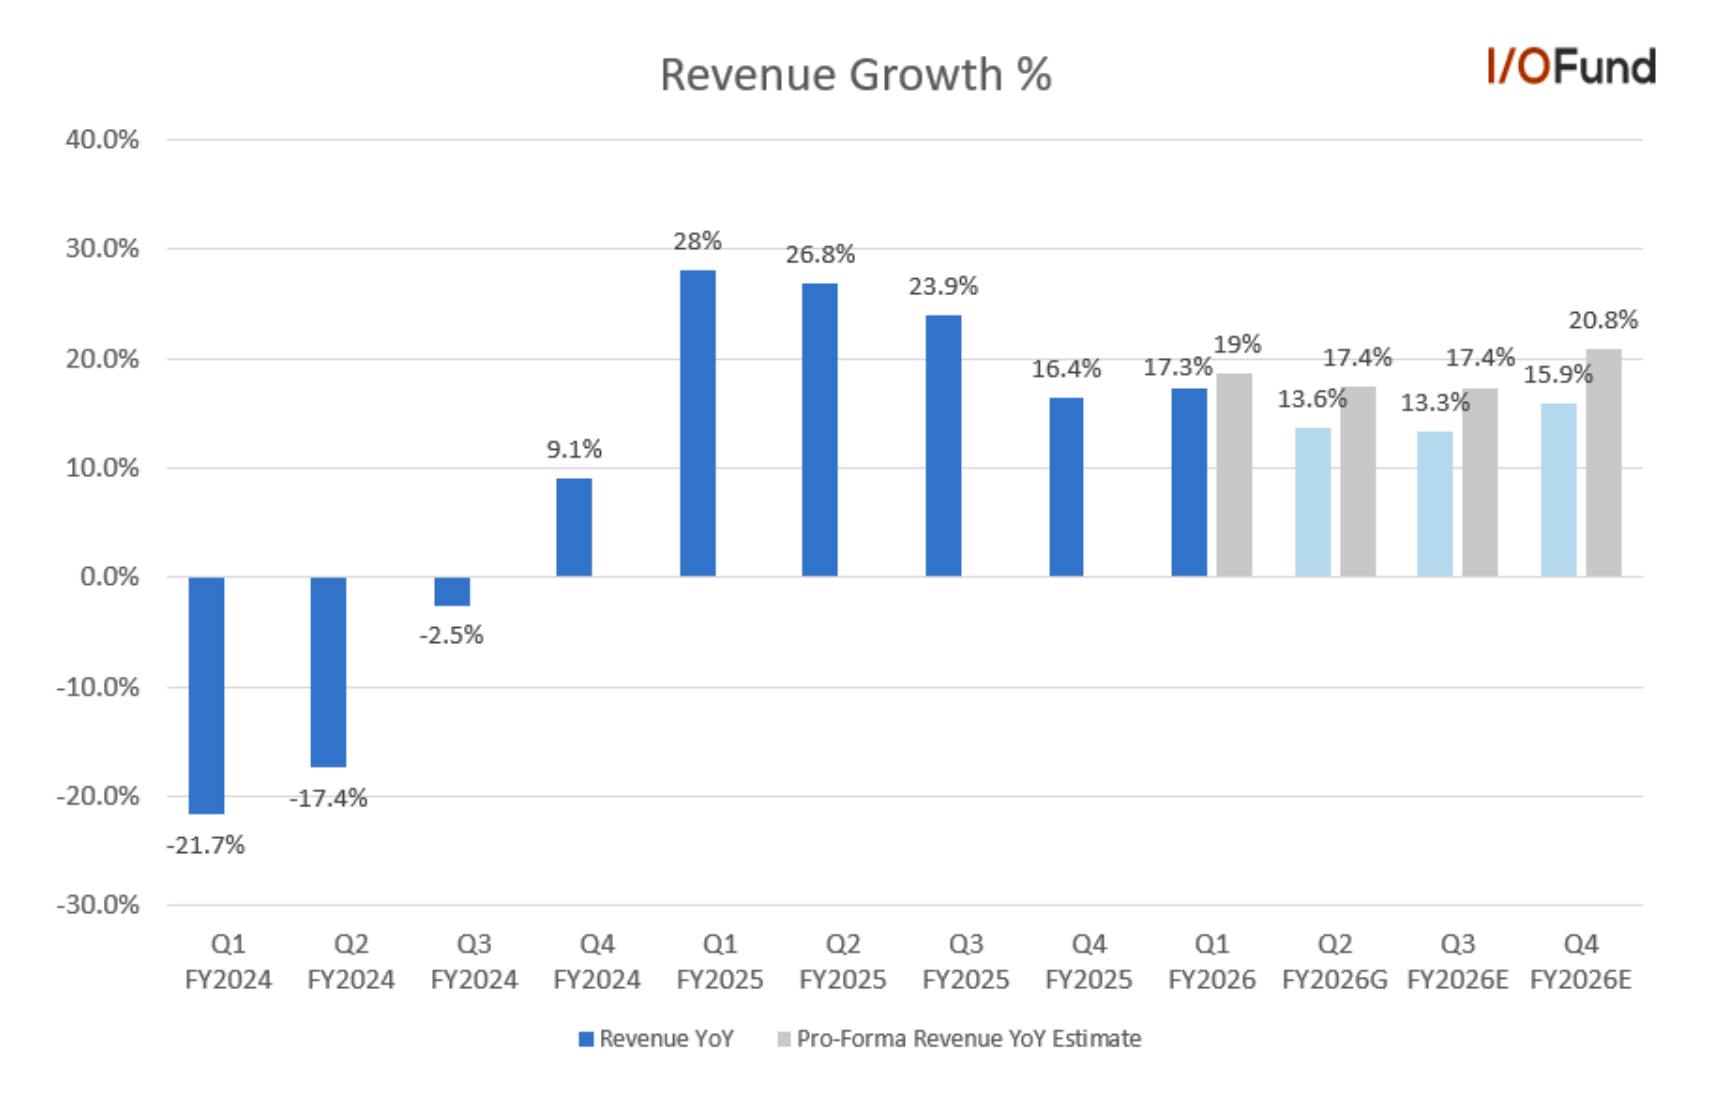
Coherent delivered 17.3% YoY and 3.4% QoQ revenue growth in fiscal Q1 to $1.58 billion, beating estimates by nearly 3%. On a pro-forma basis excluding the $33 million in Q1 revenue from the now-divested Aerospace & Defense unit, revenue growth was 19% YoY and 6% QoQ.  

For Q2, Coherent guided for revenue between $1.56 billion to $1.70 billion, which on the headline figure would be decelerating to 13.6% YoY and 3.2% QoQ at midpoint, before reaccelerating to 15.9% by Q4. 

However, our internal pro-forma estimate shows a better trajectory for revenue through fiscal 2026 – pro-forma growth may decelerate slightly to the 17.4% YoY and ~5.7% QoQ in Q2, before reaccelerating to nearly 21% by Q4, the highest growth rate in the past five quarters.  

For fiscal 2026 ending in June 2026, Coherent is expected to report 14.8% headline growth to $6.67 billion in revenue, though pro-forma growth would be higher at ~18.6% YoY based on our internal calculations. Fiscal 2027 is currently expected to see a slight deceleration to 14.1% growth to $7.61 billion. 

AI Revenue 

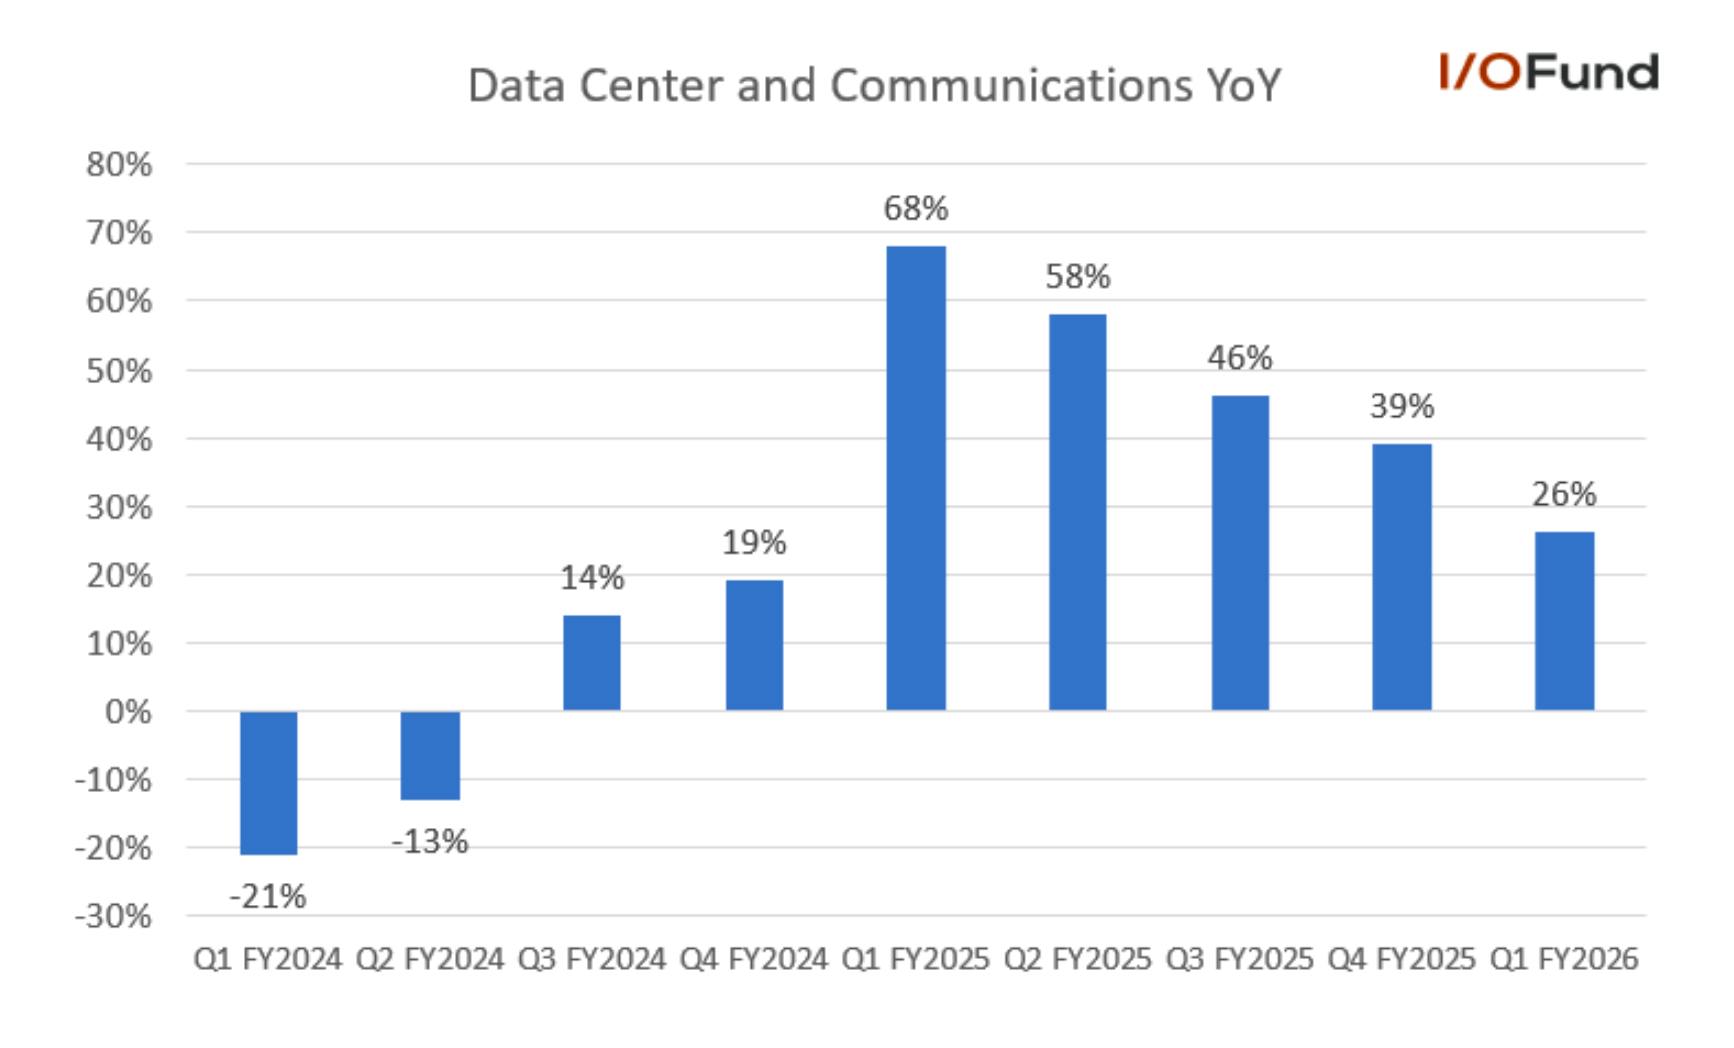
Coherent’s Datacenter and Communications revenue rose 26.2% YoY and 7% QoQ to $1.09 billion, accounting for ~69% of revenue. Growth has decelerated rather steadily since Q1 FY2025’s 68% YoY print. 

  • Datacenter revenue rose 4% QoQ and 23% YoY. As mentioned previously, Datacenter growth was constrained by InP laser supply, with management expecting QoQ growth to accelerate to 10% in Q2 and remain strong through the end of the fiscal year
  • Communications revenue, which includes telecom and data center interconnect (DCI) rose 11% QoQ and 55% YoY, driven primarily by DCI products. Management said they witnessed strong growth in demand for ZR/ZR+ DCI products, with 100G, 400G and 800G products expected to continue ramping through fiscal 2026. 

Adjusted Gross Margin Shows Improvement Towards 42% Goal 

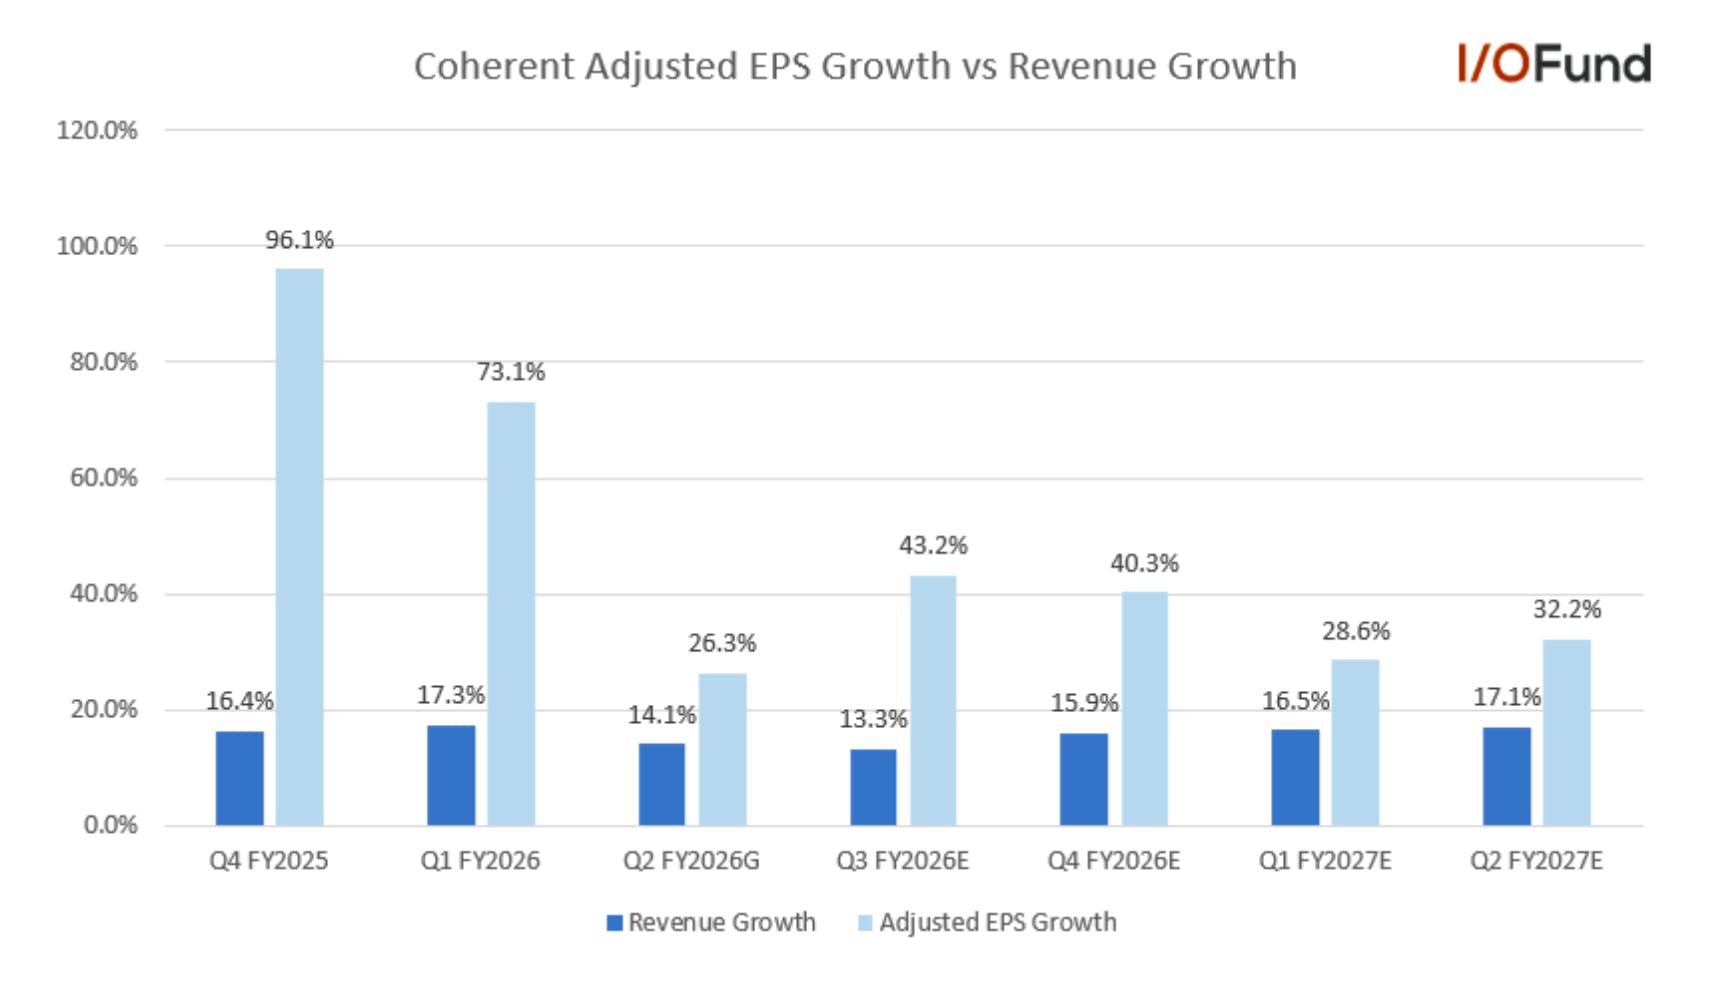
Coherent made solid progress on the margin front and expects gross margins to strengthen towards 42% with the ramp of its 6-inch InP wafers and higher margin 1.6T transceivers, and continued cost cutting measures. While it may take multiple quarters to progress solidly above 40% for gross margin, margin improvement down the line is expected to drive strong EPS leverage through 2026 with adjusted EPS growth expected to outpace revenue growth by 2X to 3X.  

GAAP gross margin was 36.6%, expanding 2.5 points YoY and 0.9 points sequentially. Adjusted gross margin came in at 38.7%, above the midpoint of guidance for 37.5-39.5%, expanding two points YoY and 0.6 points sequentially. Management said the gross margin expansion was driven by “cost reductions and product input costs as well as yield improvements,” while pricing optimization was also a meaningful contributor.  

GAAP operating margin was 16.4%, up nearly 11 points YoY and 16 points QoQ, though this was impacted by a $115 million gain from the Aerospace divestment. Adjusted operating margin was 19.5%, up 3.4 points YoY and 1.5 points QoQ.  

GAAP net margin was 14.3%, up 12.4 points YoY and more than 21 points QoQ; adjusted net margin was 14%, up 3.8 points YoY and 1.4 points QoQ. 

Adjusted EPS Up 73% YoY and 16% QoQ 

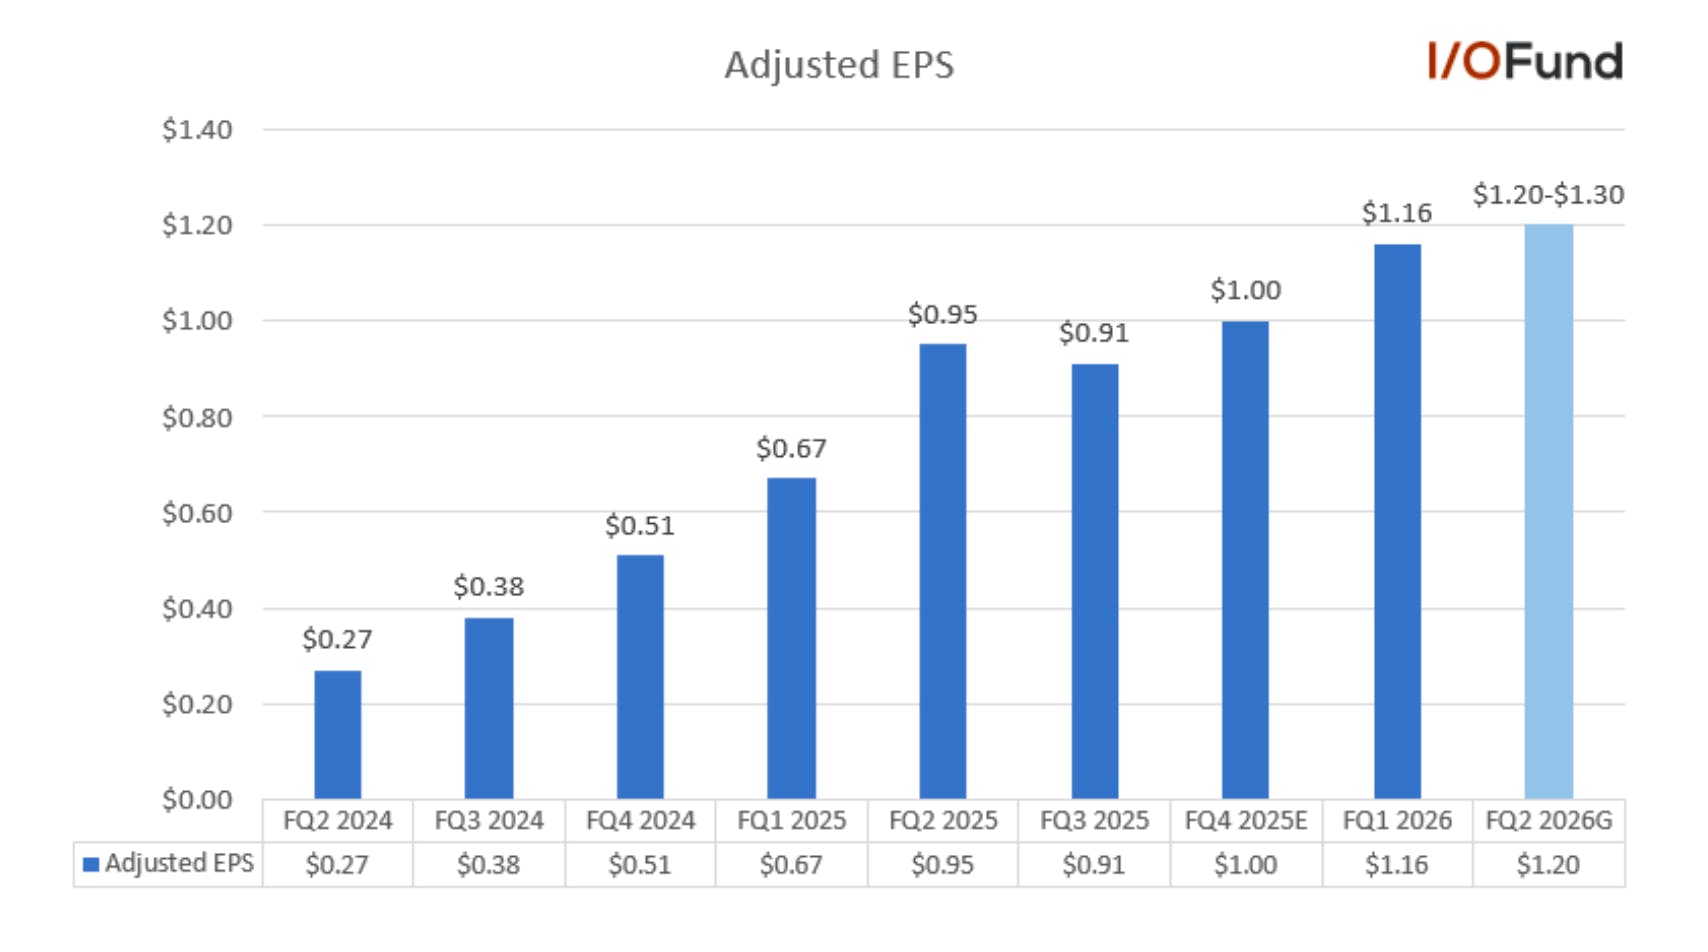
Fueled by margin improvements, Coherent reported a solid adjusted earnings beat in Q1, with adjusted EPS rising 73% YoY and 16% QoQ to $1.16, beating estimates by 11.3%. 

For Q2, Coherent guided for adjusted EPS between $1.10 to $1.30, decelerating sharply to 26.3% YoY at the $1.20 midpoint, and only showing a small sequential improvement. As noted above, while it may take a few quarters for gross margins to progress solidly above 40%, steady margin improvement down the line (3-4 points YoY and ~1.5 points QoQ for adjusted operating margin and net margin) is expected to drive solid EPS leverage through 2026.  

For example, adjusted EPS growth is expected to reaccelerate to the low-40% range in both Q3 and Q4, and moving through the first half of fiscal 2027 (Dec 2026 quarter) adjusted EPS growth is expected to range between 28% to 32%, or 2X to 3X estimated revenue growth of 13% to 17% over the next five quarters. 

Coherent has not provided a guide for the full year, but current consensus estimates point to fiscal 2026 adjusted EPS of $5.05, up 43% YoY. Fiscal 2027 is currently expected to see growth decelerate to 25.5% to $6.34.  

GAAP earnings have been lumpy as Coherent reorganizes its business and sells off assets – Q1 saw GAAP EPS of $1.18, impacted by the Aerospace sale, though Q4 recorded a GAAP loss of ($0.83) impacted by impairment charges on assets held for sale. GAAP EPS is expected to remain positive in fiscal 2026 at $0.69 in Q2, $0.81 in Q3 and $0.92 in Q4 for annual GAAP EPS of $3.62, up from $(0.52) last year.  

Operating Cash Flow Shrinks, Free Cash Flow Negative in Q1 

Coherent’s balance sheet is beginning to improve, with the company using proceeds from the divestment to pay down debt, though debt to cash remains upside down. Cash flows were also thin with OCF margin down nearly 10 points YoY, and FCF widened deeper into negative territory due to capex for the upcoming capacity expansion. 

  • Operating cash flow was $46 million in Q1, down from $130.3 million in Q4 and the first time falling below $100 million in the past seven quarters. OCF margin was 2.9%, down from 11.4% a year ago and 8.5% in the prior quarter. 
  • Free cash flow was ($57.9 million), widening from ($1 million) in Q4 and a stark contrast to $61 million in the year ago quarter, driven by capex of $103.9 million. FCF margin was (3.7%), widening from (0.1%) in the prior quarter and down from 4.5% a year ago. 
  • Cash and equivalent totaled $852.8 million, while debt was $3.31 billion, down from $3.69 billion in the prior quarter. Additionally, Coherent refinanced its debt at the end of Q1, reducing interest rate by 60bp, cutting down its quarterly interest expenses, which were ~$58.7 million in Q1.  

Valuation 

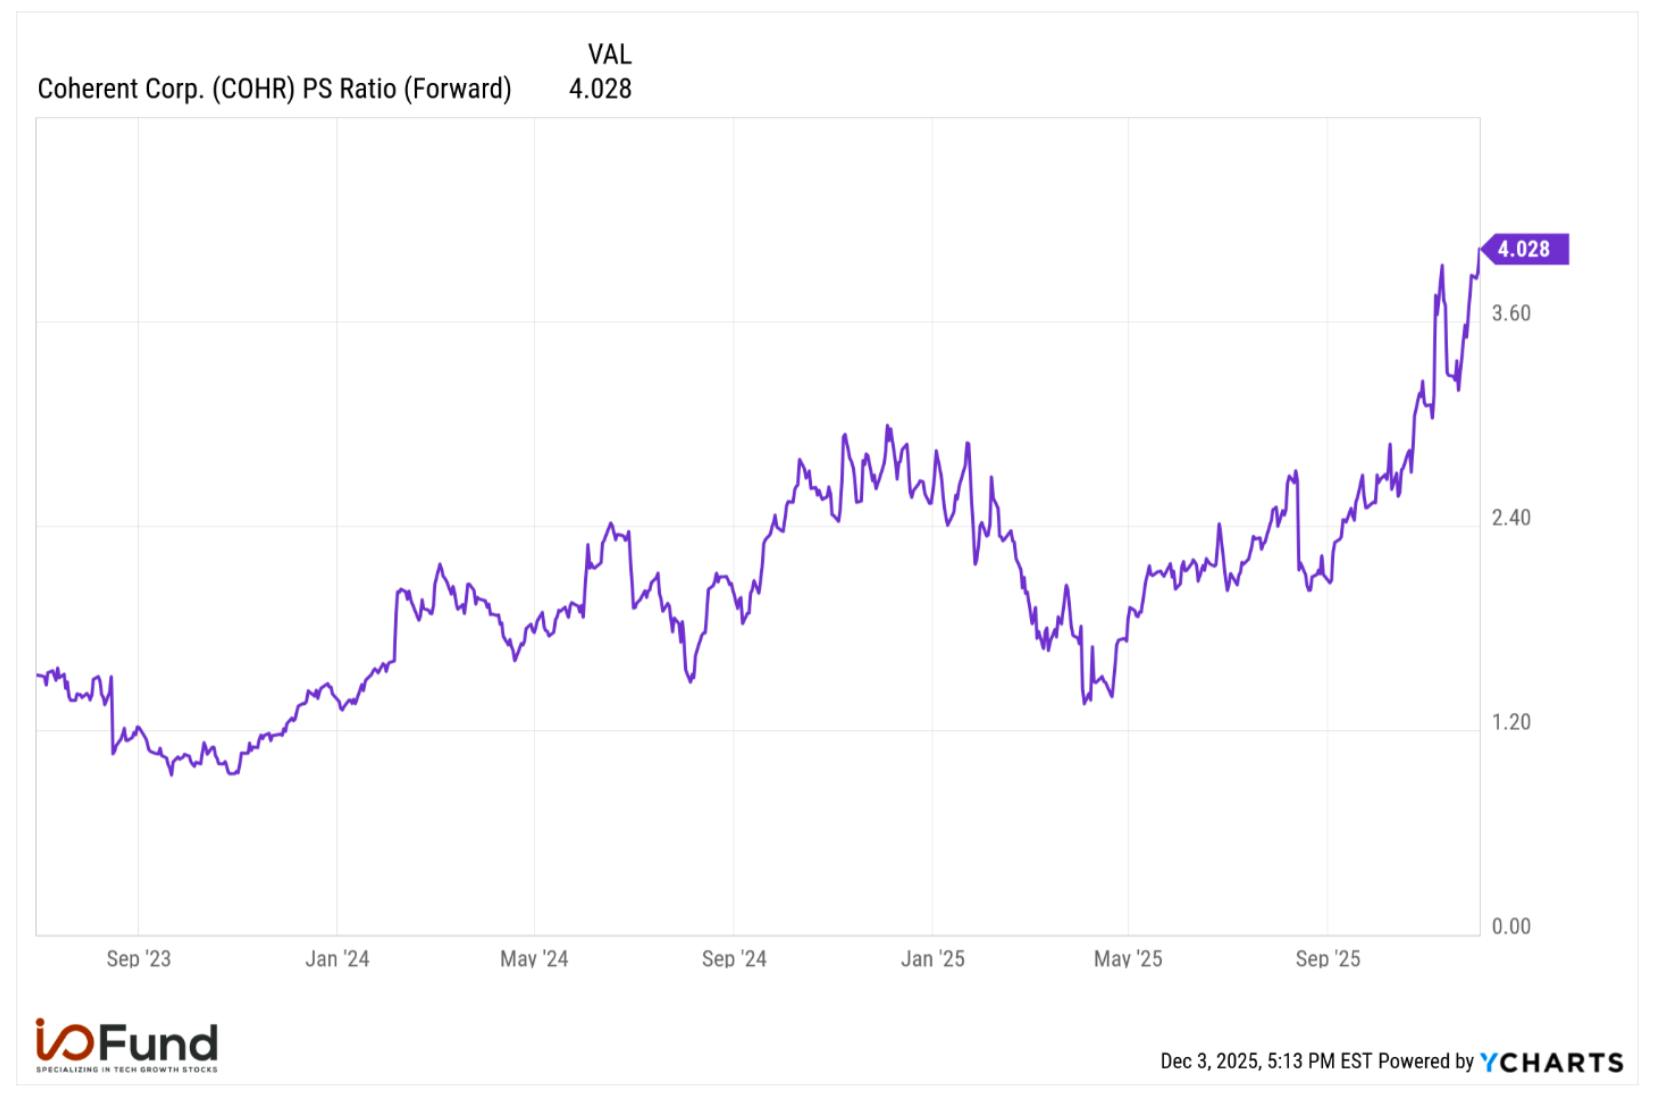
Coherent’s valuation is quite elevated on the topline, with the company trading at a peak 4X forward sales multiple, double its historical 5-year average of 2X. This is also a ~33% premium to the peak 3X multiple that Coherent found resistance at in late 2024 and early 2025.

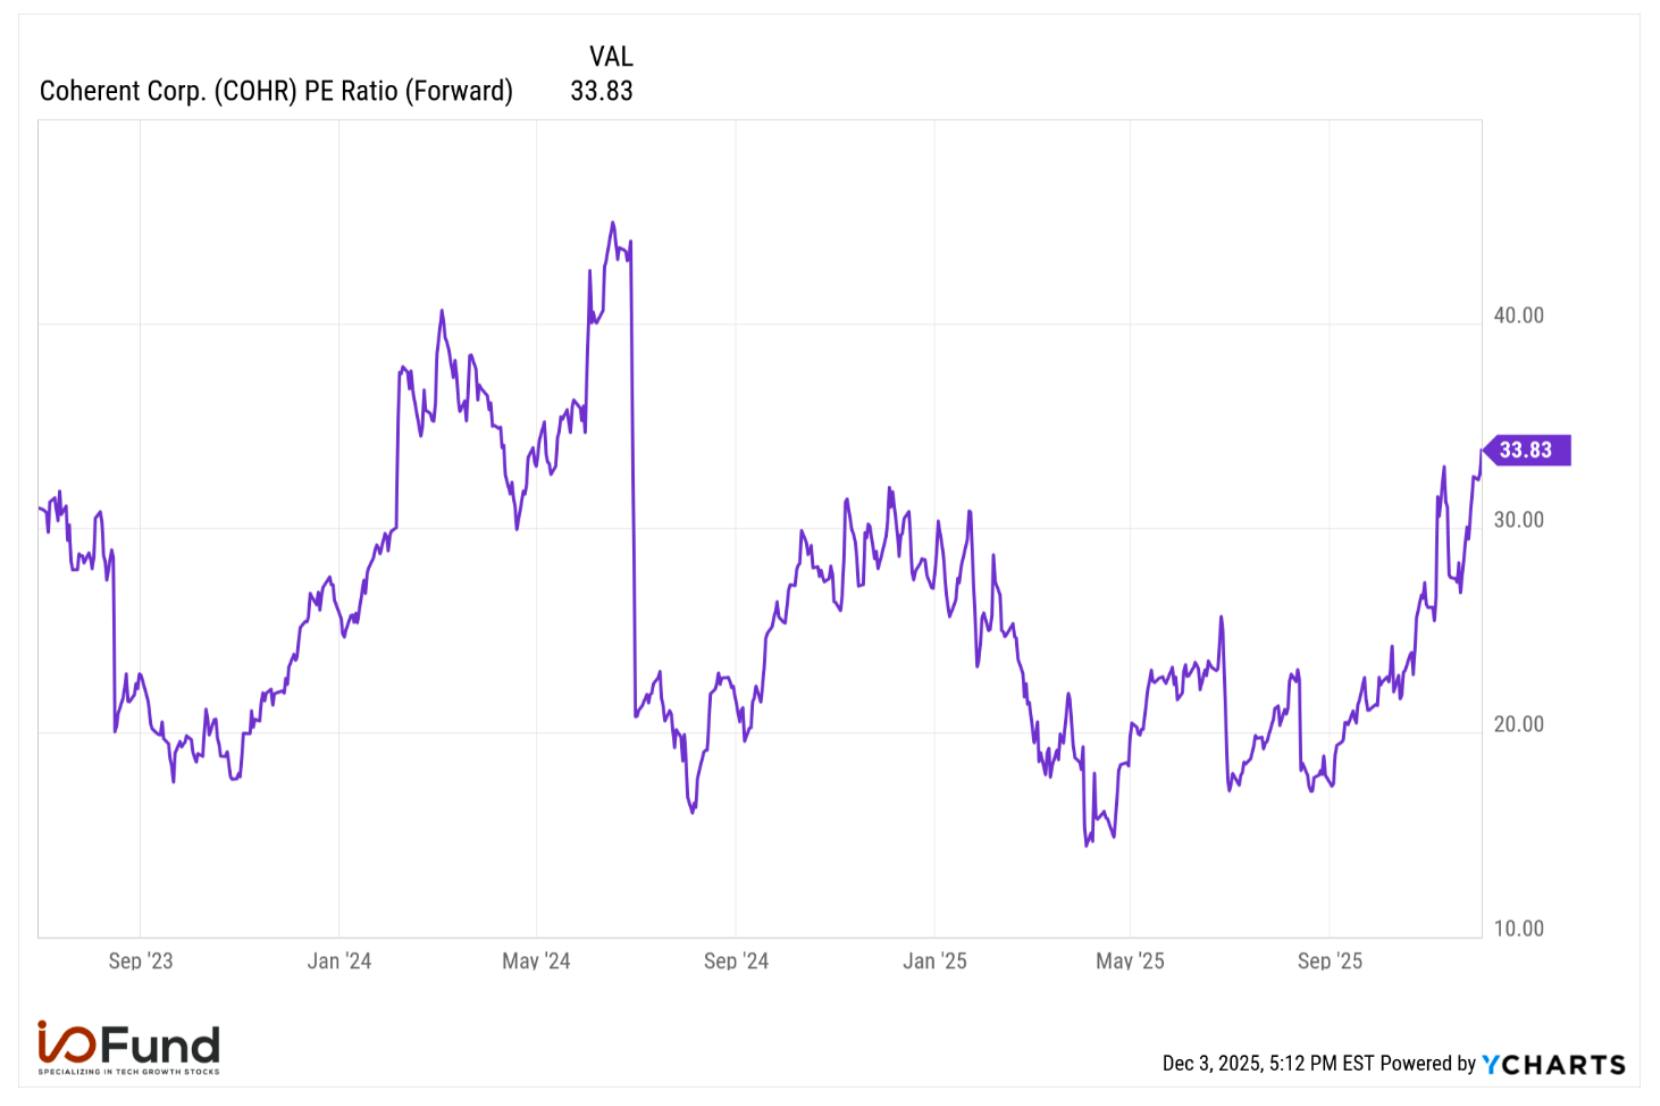
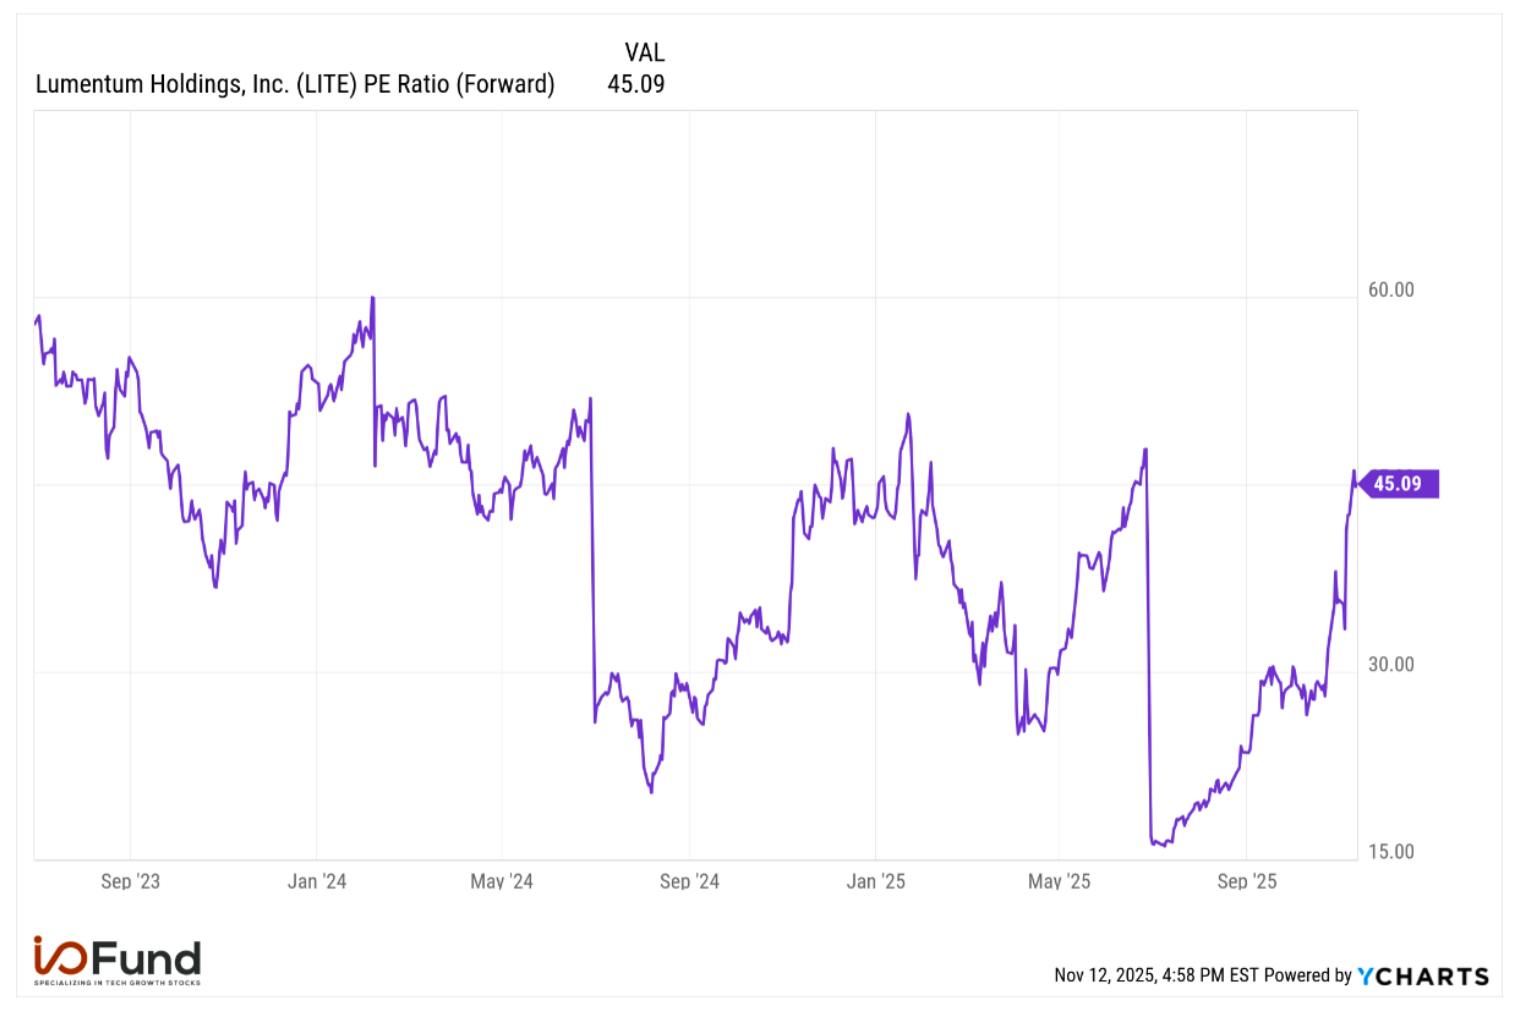
On the bottom line, however, Coherent trades at a more reasonable 33x forward PE based on its adjusted EPS estimate of $5.05. While this does represent a ~30% premium to its 5-year average of 25.7x, it is around the midpoint of its recent range of 24.5x to 45x.  

Conclusion 

Coherent is positioning itself to capitalize on the growing imbalance of EML supply and demand, with the company aiming to double its InP capacity over the next year with a shift to 6-inch wafers which can deliver 4X more output per wafer at half the cost. Coherent will likely be exceeding linear capacity growth over the next few quarters as 6-inch ramps and then matures, further supporting the QoQ reacceleration management projects. 

Although the company’s Datacenter segment growth was soft in fiscal Q1 with growth of just 4% QoQ, Coherent expects to drive a reacceleration to 10% QoQ in Q2, driven by this supply growth and strength in 1.6T transceiver, followed by strong sequential growth thereafter. The ultimate pace of this sequential growth over the next few quarters will be important to track given the converging supply growth tailwinds and increasing demand for 800G and 1.6T products ahead of CPO and other contributions later in 2026.

Damien Robbins, Equity Analyst at I/O Fund contributed to this analysis.

Please note: The I/O Fund conducts research and draws conclusions for the Fund’s positions. We then share that information with our readers. This is not a guarantee of a stock’s performance. Please consult your personal financial advisor before buying any stock in the companies mentioned in this analysis.

Recommended Reading:

Lumentum: EMLs Driving Results, CW Lasers Ramping with Q2 Guided for 22% QoQ Growth 

Lumentum’s Q1 provided more confirmation that EML laser shipments are ramping in full force, with another record quarter driven by 100G speeds and an increase in 200G shipments. EMLs have been the primary driver of growth so far for Lumentum, though the supply-demand imbalance is widening due to tight indium-phosphide (InP) capacity. Looking ahead to 2026, InP capacity will be a key factor to focus on as Lumentum is targeting 40% capacity growth over the next few quarters, with the potential for this to drive even stronger revenue growth.  

Outside of EMLs, Lumentum is beginning to work on CW lasers for silicon photonics and co-packaged optics. CW laser shipments for 800G have begun with 1.6T eventually layering in to growth next year, regardless if CW lasers or EMLs are the preferred component of choice for 1.6T rates. Management also remains confident in other growth opportunities in co-packaged optics (CPO) and optical circuit switches, though the latter is expected to be a late calendar 2026 story. 

On the financials side, the number one item was Q2’s impressive 22% QoQ revenue growth guide to $650 million at midpoint. This is significant as Lumentum is reaching its $600 million quarterly revenue target two quarters ahead of schedule, with this also marking its highest revenue in company history. The 22% QoQ guide would also reflect Lumentum’s fastest sequential growth since the September 2020 quarter. 

EML Lasers Driving Results, CW Lasers Ramping for Future Co-packaged Optics 

Electro-absorption modulated lasers (EMLs) have quickly become attractive for AI servers as these components help enable 100G and 200G per lane transmissions, thus enabling 800G and 1.6T data rates for optical transceivers. EMLs also leverage indium phosphide (InP) over silicon as InP reduces power consumption, although it is more expensive at the component level as four EMLs are needed compared to two lower-cost CW lasers for silicon photonics modules.  

EMLs are a critical component with Nvidia’s Blackwell generation, as the scale-up in GPU counts per rack from eight to 72 and subsequent increases in bandwidth and switch density will require low-power, efficient high-speed optics. The power advantages over SiPho also come to the forefront as power consumption becomes a central concern in scaling AI data centers, with Blackwell doubling power consumption versus Hopper at 140kW per rack.  

EMLs are the main driver for Lumentum’s growth as these are good for short-to-medium reach and a strong choice for 400G and 800G optical transceivers, with the company having begun its 100G EML ramp for these data rates in early 2024. EML laser shipments reached a fresh record in fiscal Q1 2026, driven once again by 100G speeds and an increase in 200G shipments.  

More importantly, Lumentum expects calendar 2026 to be another breakout year for laser chip shipments, anchored by a widening supply-demand imbalance, sharp capacity growth and mix shift to higher priced, higher margin 200G products. 

One important discussion on EMLs is that the supply-demand imbalance continues to widen, meaning that substantial growth in capacity through 2026 should quickly convert to revenue. CEO Michael Hurlston explained that “last quarter, I think we characterized it as roughly a 20% shortfall relative to total customer demand. Even with the add in supply, I would say that number has increased to 25% to 30%. We are quite a bit short right now relative to the customer demand.” 

Lumentum is not the only supplier commenting about this imbalance, with Applied Optoelectronics also echoing this in their Q3 earnings call; however, management hinted that despite industry-wide capacity increases, supply could still lag demand through 2027: “We've also said we see the supply and demand imbalance increasing we're falling further behind. And that accounts for all this other capacity that's being built out here or there and everywhere by our competition. So at least through 2027, we don't believe we catch up. We think we're still behind on supply.” 

On the positive side, Lumentum shared that while its indium phosphide fab is fully allocated due to high demand, it has made “better-than-expected progress on yields and throughput and now see a line of sight to add approximately 40% more unit capacity over the next few quarters.” CEO Michael Hurlston clarified at UBS’ tech conference that “we gave in the last earnings call a new benchmark saying, over the next 3 quarters, meaning our December, March and June quarters, we expected to add that 40%. So that's a forward-looking statement where we'd expect an increase in capacity of 40% on what already is a doubled number.” 

Breaking this down suggests that the yield and throughput improvements means Lumentum is exceeding linear capacity growth, which can translate to stronger than expected revenue from more capacity going to higher ASP products. It also has strong implications for Lumentum’s margins and EPS, driving strong expansion in operating margins that then flows through to EPS: 

“So that 40% increase in indium phosphide capacity is focused on laser chips, which has, as you know, higher gross margins than many more of our other product lines. So as that flows through in the coming quarters, that will have a positive effect on our earnings per share. What you're seeing this quarter is without that increased capacity and increase gross margin contribution from the indium phosphide capacity we talked about.” 

Lumentum is also now working on CW lasers for silicon photonics (SiPho) and co-packaged optics (CPO), which are expected to kick in with 1.6T transceivers and layer into topline growth even if CW takes share from EMLs at 1.6T.  

Management expects to be well positioned for both EML and CW lasers ramping for 1.6T transceivers, as its capacity is interchangeable between the two components, despite management noting a difficulty in forecasting how the two will ramp – the primary takeaway here is that even if faster data rates such as 1.6T are less dependent on EMLs, management believes there is more than enough content for them to do well: 

“On the battle between CW and EML, it appears to us that CW is going to ramp with 1.6T but so will EML. And so the slope of the 2 ramps was hard for us to call but it looks like no matter how you slice it, the numbers will increase. So even if the mix shifts away from EML-based transceivers at 1.6T, the absolute numbers seem to be stratospherically high. And at least in the near term, we see no end in sight. We watch it every day, Chris, just like you're sort of cautioning but I think for the next 6 quarters, we're completely sold out, and we have long-term agreements, as I said, that we've worked out with our customers to ensure that they're going to take any additional capacity we've got online.” 

For a bit more on CW lasers, its 70 mW lasers started meaningful shipments this quarter and will be a more reasonable part of the mix in the December quarter, while sampling for 100 mW CW lasers just began. 100 mW lasers are expected to be in full production by mid-year 2026, with Lumentum aiming to integrate these into its own internal transceivers, slated for the June 2026 quarter.  

Q2 Outlook of $650M, Two Quarters Ahead of $600M Target 

While Q1 produced a solid beat, the most impressive part of the report was Q2’s guidance, with the company forecasting revenue of $630 million to $670 million. This marks a sharp sequential acceleration of nearly 11 points to 21.8% QoQ growth at midpoint and 25.5% QoQ at the high-end of guidance.  

On a YoY basis, the midpoint of the guidance points to a more than 3 point acceleration to 61.6% YoY, while the high-end would reflect 66.6% YoY growth.  

Just last quarter, Lumentum had projected reaching $600 million in quarterly revenue by the June 2026 quarter (fiscal Q4) or earlier, with the company now two quarters ahead of that target. When looking at the company’s original guidance for the end of 2025, which was $500 million (and satisfied by Q1), Q2’s forecast is 30% ahead of that, reflecting the strength of the AI networking theme and the demand the company is seeing. 

For the strong QoQ guide, management said that “the thing that probably caught us flat-footed is the width of the customer demand. It's touching everything. We talked about pump lasers. We talked about narrow linewidth. We talked about the transceivers. We talked about even coherent components. So it is very, very broad-based. And every single one of our segments is up. Every single one of our segments is contributing to the growth that you see.” 

To put in perspective how strong Lumentum’s growth curve is, current estimates for the June 2026 quarter sit at $740.3 million, more than 23% ahead of the company’s target revenue. This is also up from $689.9 million on November 7, a 7.3% revision higher in less than one week. 

Out of Lumentum’s three outlined growth drivers through 2026 – cloud transceivers, optical circuit switches (OCS) and co-packaged optics (CPO) – only cloud transceivers are expected to meaningfully contribute to Q2’s growth. OCS and CPO are expected to see much stronger growth next year, with ultra-high power lasers for CPO more geared towards 2H 2026. More on this is discussed below.  

Lumentum Intentionally Keeping Customer Count Low 

Another important discussion circled back to supply allocation and possible customer consolidation. This is not something that is necessarily new to Lumentum, as we had covered in our previous analysis that the company is intentionally keeping customer count low and not taking on new customers in an effort to focus on the highest-margin opportunities.  

Analysts had asked if management would use EML supply constraints to drive new transceiver engagements and qualifications and expand the customer base. However, management countered this and said they are actually trying to “consolidate supply and consolidate our customer base around a couple of folks that we think are going to be long-term winners. Those customers in return have given us multiyear commitments that give us a lot of confidence that our business is going to be sustainable even as we continue to ramp capacity through the next probably 6 or 8 quarters.” 

Management made sure to emphasize again that they will aim to “allocate our laser capacity based on the profitability metric more than to trying to broaden our transceiver opportunities in 1.6T using our lasers.” 

This is a two-edged sword, as multi-year commitments give Lumentum security in the ramp phase with visible, long-term revenue growth, yet it also could increase customer concentration risk by tying Lumentum solely to handful of key customers and limit its opportunities to diversify its customer base. This concentration risk is already becoming a bit more evident, with two customers accounting for 45% of revenue, at 22% and 21% respectively in fiscal Q1. This is up from 31.4% of revenue in fiscal 2025, at 16% and 15.4% respectively for the two largest customers. 

Cloud Transceiver Ramp Expected to Begin Next Quarter 

Lumentum’s ramp for cloud transceivers is expected to begin next quarter, with management stating that they have a line of sight to transceivers eventually becoming a $250 million/quarter business, or a $1 billion annual run rate; this is double its $500 million annual run rate today. Lumentum does not plan to expand the business beyond that $1 billion run rate, stemming from its gross margin profile.  

Cloud transceiver revenue was roughly flat QoQ in Q1 with Lumentum focusing primarily on increasing manufacturing capacity in Thailand to meet rising demand. As a result, management expects to resume growth in Q2 with the upward trajectory accelerating for the next four to five quarters.  

Lumentum believes Q2 will serve as a ‘proof point’ that as its new 1.6T and 800G transceivers ramp, it will see “the revenue layering benefits that our larger transceiver competitors have experienced” around the middle of 2026. The ramp of 1.6T will be important to track, as Lumentum has been straightforward about 1.6T margins being “significantly better” than 800G. 

However, CEO Michael Hurlston made clear at UBS’ tech conference that Lumentum is “operating meaningfully below the mid-30s in terms of margin” for transceivers as manufacturing is “substandard” on throughput, scrap and yields. He added that there is a path to get to the mid-30s over the next few quarters as production ramps and Lumentum in-sources components (versus virtually zero in-sourced today), but this remains a headwind to the company’s target model of 42%.  

Because of the lower-than-target margins, Hurlston explained that while Lumentum has “aspirations to get it to $1 billion annually, to add another $500 million of incremental revenue. But we don't want it to run much higher than that, just given the margin headwinds we see. We think we can manage our business up from a margin perspective if we keep the business to about $1 billion top line. If it gets beyond that, it will be more challenging.” 

No Change to Co-packaged Optics Timing, But Demand is Stronger 

As we discussed in September for Discovery members, co-packaged optics (CPO) is not contributing to revenue now yet could materialize into one of the biggest opportunities among all of the components and subsystems that Lumentum supplies, as the company says it is enabling Nvidia’s Spectrum-X networking switches. As a reminder, CPO places optical transceivers directly on the chip package, rather than using separate optical modules, resulting in faster data transmission, reduced latency and higher bandwidth. This may be the best of both worlds: the performance of optical yet with reduced power consumption for increasingly power-hungry AI racks.  

Management provided a brief update on CPO, noting that the ramp is forecast to begin in the early stages of calendar Q3 2026 with a more meaningful contribution in calendar Q4. Hurlston explained in Q1’s call that the only change is that “demand is stronger than we initially forecast” and “getting better,” though the timing for the ramp is still the same. He clarified further that Lumentum expects “an inflection point on Ethernet-based switches. That's where we see the real step-up where our revenue would become more material” in the second half of 2026, continuing through 2027. Second-gen CPO products for 3.2T speeds are tentatively on deck for 2028.  

Ultra-high power lasers are still in the initial production ramp, though Lumentum expects significant growth in shipment volumes in 2H 2026 with accelerating adoption, with this providing further confirmation of the strength of the CPO opportunity. Lumentum had announced the production expansion in early August, giving the company multiple quarters to ramp.  

Optical Circuit Switching Also a Late 2026 Story 

Lumentum’s second upcoming growth driver, optical circuit switches, are not expected to meaningfully contribute in Q2, rather being a late 2026 story alongside CPO. Optical switches are a new kind of switch for AI clusters that handle the switching optically instead of using transceivers to convert photons to electrons, and back again. Optical switching and CPOs work together to allow for more flexibility for reconfigurations, to reduce energy and complexity while also increasing bandwidth.  

Management has outlined confidence in reaching a $100 million quarterly revenue target by the December 2026 quarter, with its two major customers expected to be qualified in the March 2026 quarter with a third customer potentially qualifying in the middle of the year. CEO Michael Hurlston provided more clarity about how Lumentum expects OCS to ramp beginning in this quarter through 2026:  

“We outlined sort of a revenue ramp of kind of mid-single-digit millions here in the December quarter, getting to double digit — very, very low double digits in the March quarter and then accelerating to kind of mid $50 million, $60 million in the middle of the year and then getting all the way to that $100 million mark in the December quarter.” 

This commentary implies that the largest ramp and impact from OCS will hit in fiscal Q2 2027, with management eyeing tens of millions of QoQ growth in the back half of next year. As seen in the revisions, current estimates only point to $59 million QoQ growth in that quarter, which may underestimate the tailwinds from simultaneous growth in OCS, transceivers and initial CPO growth in the second half of 2026.  

Financials 

Revenue Growth Maintaining >50% YoY 

Lumentum fulfilled its guidance for a >$500 million revenue quarter in calendar 2025, reporting a record $533.8 million in revenue in fiscal Q1, beating estimates by just 1.4%. Revenue growth accelerated 2.5 points to 58.4% YoY though QoQ growth slowed to 11%.  

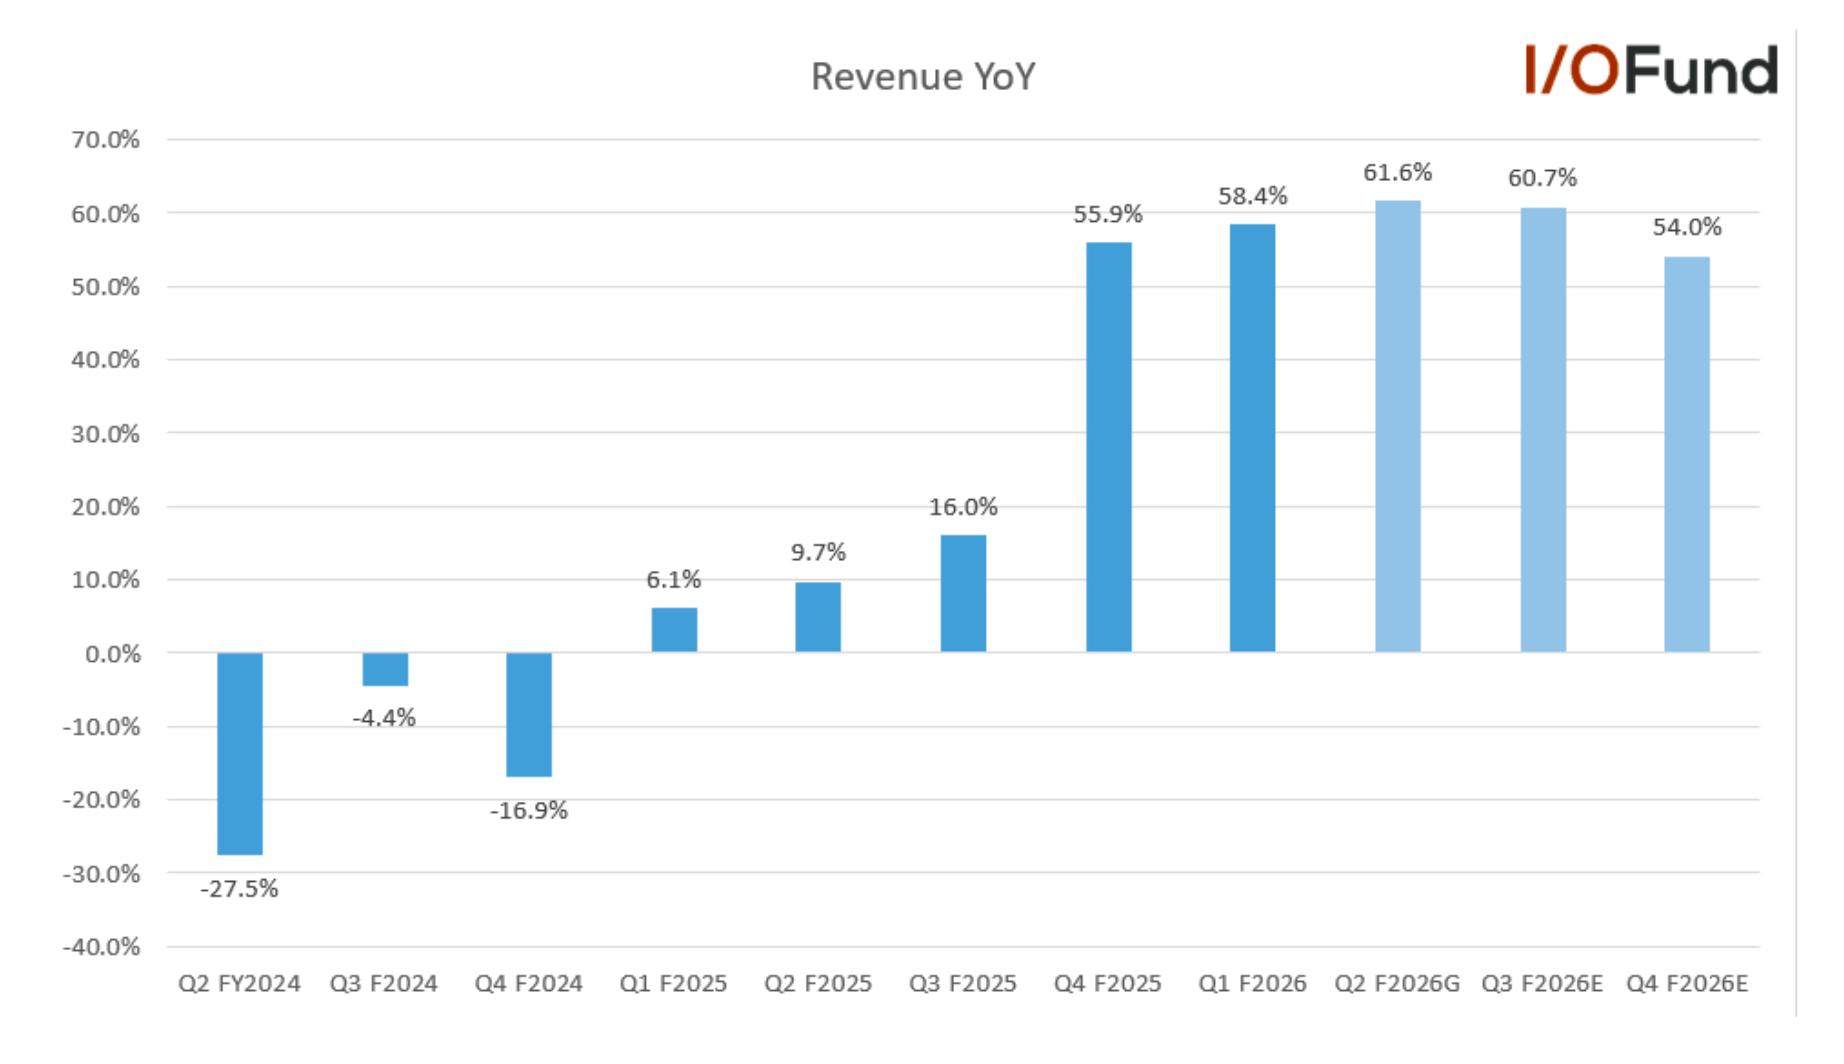
As discussed previously, Lumentum guided for $630 to $670 million in revenue in Q2, accelerating to 61.6% YoY and 21.8% QoQ, whereas consensus estimates were pegged at almost 40% growth to $561.5 million.  

Looking ahead, growth is expected to stay strong in Q3 at nearly 61% YoY, but the more impressive number is Q4’s estimated 54% growth, as this comes against a much more difficult comp of 55.9% vs 16.0% for Q3. This underscores the strength of the demand ramp Lumentum is discussing for the back half of calendar 2026. 

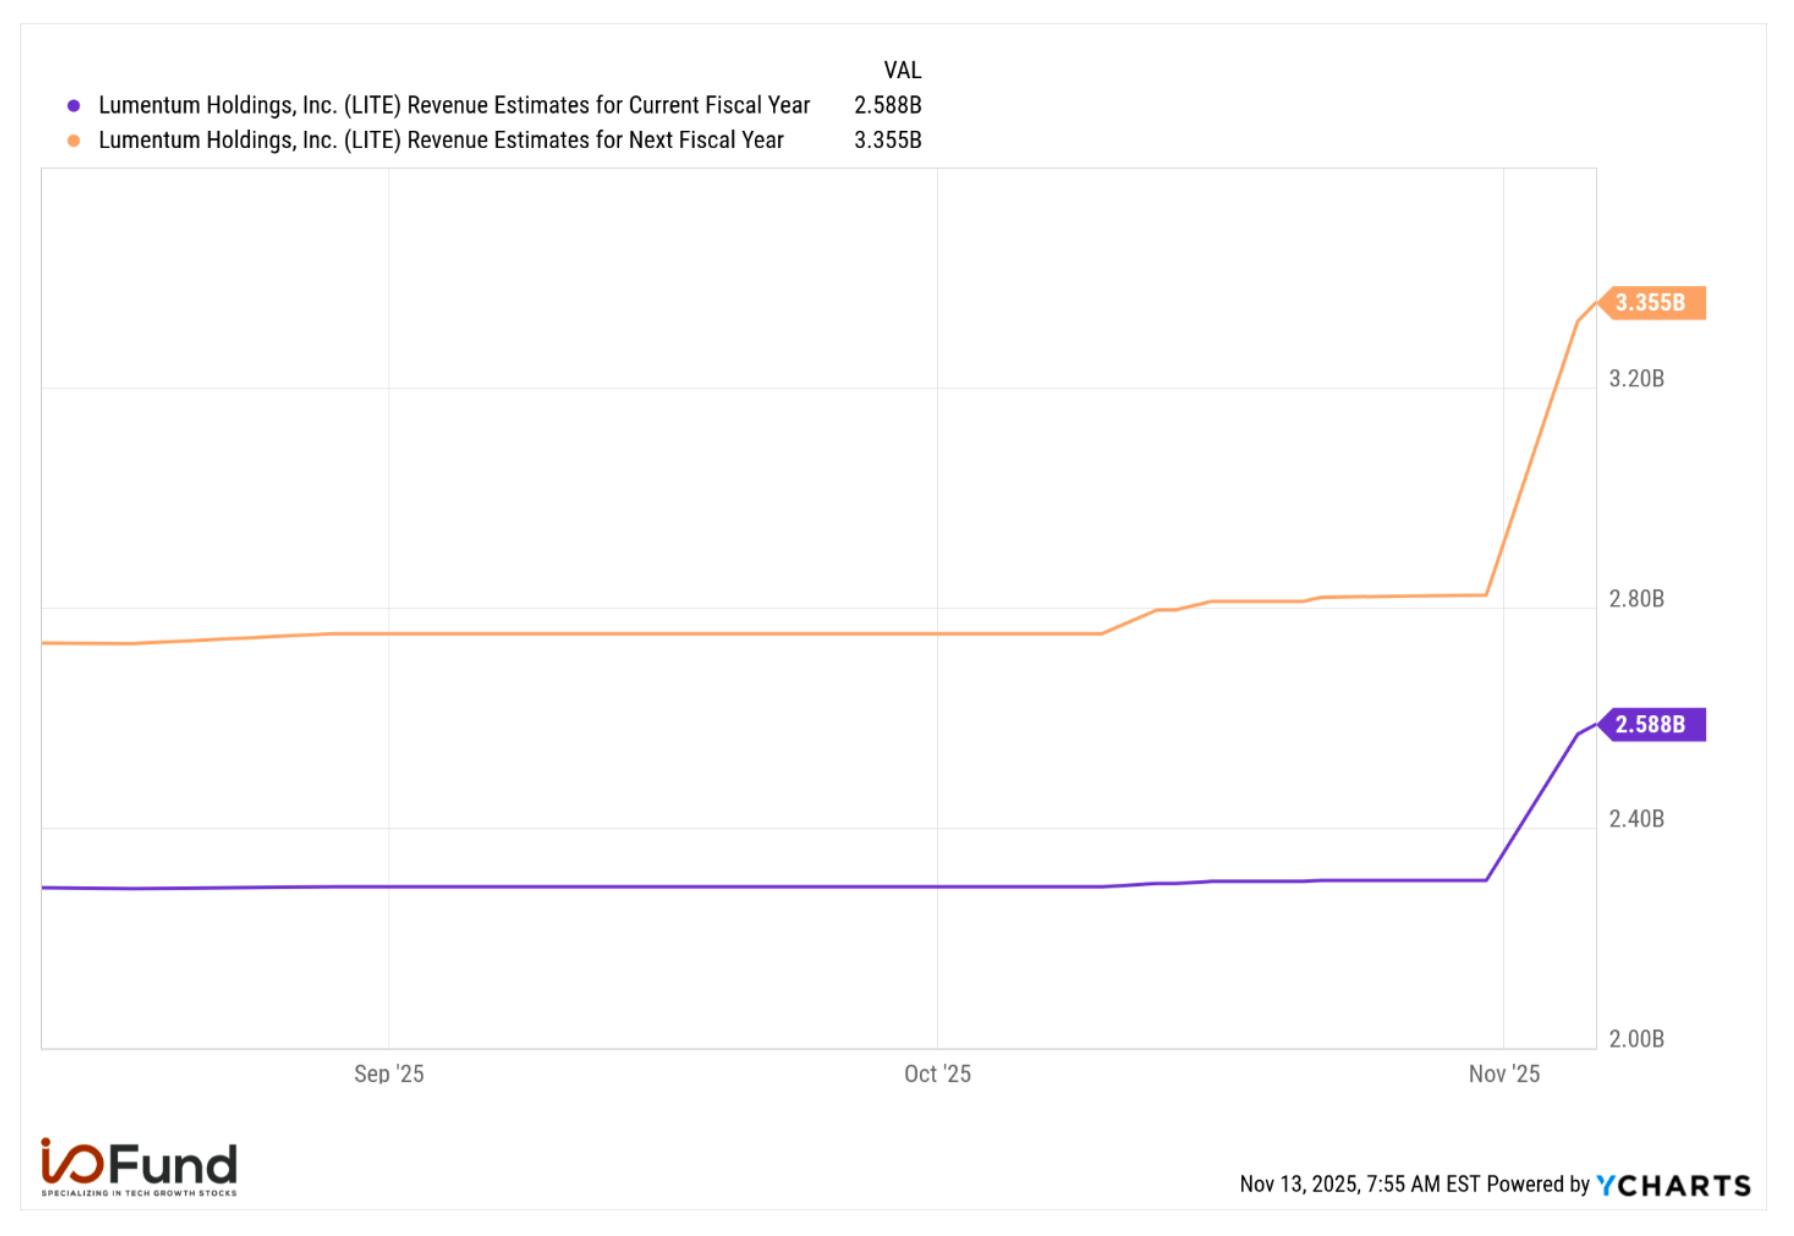
On an annual view, Lumentum is estimated to report 57.3% growth in fiscal 2026 to $2.59 billion, before slowing to 29.6% YoY to $3.36 billion in fiscal 2027. Revisions are much stronger in fiscal 2027, up $600 million since the start of October versus a $300 million increase for fiscal 2026. 

AI Revenue 

Lumentum estimates that over 60% of total revenue comes from cloud and AI infrastructure customers, or above $320 million in Q1.  

Lumentum changed its reportable segments in Q1, dropping Cloud & Networking and Industrial Tech and instead transitioning to Components and Systems. Components include laser chips, laser subassemblies, line subsystems and wavelength management subsystems, while Systems includes full stand-alone products such as optical transceivers, optical circuit switches and industrial lasers. 

Components revenue rose 18.4% QoQ and 63.9% YoY to $379.2 million, fueled by “robust demand inside the data center”, strong momentum for DCI products with narrow linewidth laser assemblies for DCI transmission up 70% YoY, and record EML shipments. Lumentum expects Components to be the cornerstone for revenue growth and profitability while Systems will scale rapidly with transceivers, OCS and other high-performance solutions. 

Systems revenue declined (3.6%) QoQ but increased 46.5% YoY to $154.6 million. Cloud transceiver revenue was approximately flat QoQ as Lumentum worked to increase capacity.  

For Q2, Lumentum expects approximately half of its sequential revenue growth (or ~$60 million at midpoint) to come from Components, and the other half from Systems, “primarily reflecting the ramp of high-speed optical transceivers for data center applications and to a lesser extent, the early phase of our optical circuit switch ramp.” 

GAAP EPS Back to Positive 

Lumentum reported a razor thin $0.05 in GAAP EPS, while adjusted EPS of $1.10, up 511% YoY, beating estimates by 6.8%. For Q2, Lumentum guided for adjusted EPS in a wider range of $1.30 to $1.50, up 233% YoY, coming in well ahead of the $1.16 estimate at the midpoint. Fiscal Q3 and Q4 are expected to see adjusted EPS continue to increase, though YoY growth technically is decelerating to 162% in Q3 and 91% in Q4 as comps get more difficult. 

Lumentum did not provide a full year adjusted EPS guide, though consensus now sits at $5.63, up from $4.90 and pointing to growth of 173% YoY. Considering Q2’s estimate remains below the midpoint of management’s guidance at $1.38, there is room for upside revisions if Lumentum provides another beat and raise next quarter. 

Margins Show Strong Expansion 

Gross margin continued to expand both sequentially and YoY, helping drive GAAP operating margin back to positive territory.  

  • GAAP gross margin was 34.0%, in Q1, up nearly 11 points YoY and 0.7 points QoQ. Adjusted gross margin was 39.4%, up 6.6 points YoY and 1.6 points QoQ.  
  • GAAP operating margin was 1.3%, up nearly 26 points YoY and 3 points QoQ. Adjusted operating margin was 18.7%, up 15.7 points YoY and 3.7 points QoQ, ahead of guidance for 16-17.5%. For Q2, management guided for continued adjusted operating margin expansion to 20-22%.  
  • GAAP net margin was 0.8%, up 25.3 points YoY and not comparable QoQ due to an income tax benefit in Q4. Adjusted net margin was 16.2%, up 12.6 points YoY and 3 points QoQ. 

Management provided a deeper discussion on margins moving through 2026, with product pricing from supply-demand imbalances serving as a strong lever for margin expansion:  

“I think we're moving the margin line up. Pricing, obviously, is a lever. And when you look at that very, very carefully, I think what you see in the guide is some pricing, very targeted price increases happening. I think as you look out next year in 2026, our agreements with customers will include more pricing, more broad-based price increases, just given the supply-demand imbalance.” 

CFO Wajid Ali added that margins are benefitting from improved manufacturing utilization, and moving into calendar 2026, gross margins are expected to move up in line with the company’s model from OFC (shown below) as OCS, 1.6T transceivers, and CPO ramp.  

Lumentum is currently tracking closer towards the $750 million model by mid-2026, which is expected to see adjusted operating margin above 20% and gross margin approaching 40%. Lumentum is currently ahead of targets for adjusted operating margin per Q2’s guide, which suggests that there could be further upside as higher-margin product ramps, or some stagnation from the initial ramp phases for OCS and CPO to remain within the target ranges.   

Cash Flows Muted 

Cash flows were rather muted, with operating cash flow margin shrinking both YoY and QoQ.  

Operating cash flow was $57.9 million in Q1 for a 10.8% margin, down from 11.8% a year ago and 13.3% in Q4. Free cash flow was ($18.3 million) for a (3.4%) margin, up from (10.2%) a year ago but down from 2.1% in Q4. 

Cash and equivalents were $1.12 billion while debt was $3.24 billion.  

Inventories for $531.6 million, up more than 13% QoQ, while accounts receivable surged nearly 23% QoQ to $307 million, both aligning with management’s commentary for strong product and revenue ramps over the coming quarters. 

Valuation 

Lumentum is trading at a stretched 6.9x forward PS multiple, more than double its five year average of 2.9x and above the 4.2x level that shares failed to break past in late 2024 and early 2025. 

On the bottom line, however, Lumentum is trading just above its average multiple, currently valued at 45x forward adjusted EPS versus its five year average of 40x. Shares have traded as high as 60x and as low as 18-20x.  

Conclusion 

A lack of InP capacity is causing a rather substantial shortfall in EML laser supply as demand continues to expand, with Lumentum one of two companies able to meet this demand. Evidence of this tight supply is seen in Lumentum’s QoQ acceleration from 11% in Q1 to 22% guided in Q2, as Lumentum was able to increase InP capacity by 40% a few quarters ago. Looking ahead, an additional 40% capacity growth is coming online over the next few quarters, and higher yields and throughput on the upcoming capacity expansion could translate into a higher revenue growth rate.  

Outside of EMLs, Lumentum is beginning to work on CW lasers for silicon photonics and co-packaged optics, which is expected to serve as the company’s next catalyst moving into 2026. This catalyst will hinge on whether Lumentum sees similar qualifications for SiPho and CPO as it has for EMLs for Nvidia’s Blackwell, or if it fails to be chosen as a lead supplier for CW moving through 2026.

Damien Robbins, Equity Analyst at I/O Fund contributed to this analysis.

Take advantage of the I/O Fund’s largest sale of the year with up to $250 off Advanced Market Signals, which offers Knox’s weekly webinars, real-time trade alerts, and in-depth analysis on the most powerful tech trends. Learn more here.Learn more here.

Please note: The I/O Fund conducts research and draws conclusions for the Fund’s positions. We then share that information with our readers. This is not a guarantee of a stock’s performance. Please consult your personal financial advisor before buying any stock in the companies mentioned in this analysis.

Recommended Reading:

Lumentum: EMLs Driving Results, CW Lasers Ramping with Q2 Guided for 22% QoQ Growth 

Lumentum’s Q1 provided more confirmation that EML laser shipments are ramping in full force, with another record quarter driven by 100G speeds and an increase in 200G shipments. EMLs have been the primary driver of growth so far for Lumentum, though the supply-demand imbalance is widening due to tight indium-phosphide (InP) capacity. Looking ahead to 2026, InP capacity will be a key factor to focus on as Lumentum is targeting 40% capacity growth over the next few quarters, with the potential for this to drive even stronger revenue growth.  

Outside of EMLs, Lumentum is beginning to work on CW lasers for silicon photonics and co-packaged optics. CW laser shipments for 800G have begun with 1.6T eventually layering in to growth next year, regardless if CW lasers or EMLs are the preferred component of choice for 1.6T rates. Management also remains confident in other growth opportunities in co-packaged optics (CPO) and optical circuit switches, though the latter is expected to be a late calendar 2026 story. 

On the financials side, the number one item was Q2’s impressive 22% QoQ revenue growth guide to $650 million at midpoint. This is significant as Lumentum is reaching its $600 million quarterly revenue target two quarters ahead of schedule, with this also marking its highest revenue in company history. The 22% QoQ guide would also reflect Lumentum’s fastest sequential growth since the September 2020 quarter. 

EML Lasers Driving Results, CW Lasers Ramping for Future Co-packaged Optics 

Electro-absorption modulated lasers (EMLs) have quickly become attractive for AI servers as these components help enable 100G and 200G per lane transmissions, thus enabling 800G and 1.6T data rates for optical transceivers. EMLs also leverage indium phosphide (InP) over silicon as InP reduces power consumption, although it is more expensive at the component level as four EMLs are needed compared to two lower-cost CW lasers for silicon photonics modules.  

EMLs are a critical component with Nvidia’s Blackwell generation, as the scale-up in GPU counts per rack from eight to 72 and subsequent increases in bandwidth and switch density will require low-power, efficient high-speed optics. The power advantages over SiPho also come to the forefront as power consumption becomes a central concern in scaling AI data centers, with Blackwell doubling power consumption versus Hopper at 140kW per rack.  

EMLs are the main driver for Lumentum’s growth as these are good for short-to-medium reach and a strong choice for 400G and 800G optical transceivers, with the company having begun its 100G EML ramp for these data rates in early 2024. EML laser shipments reached a fresh record in fiscal Q1 2026, driven once again by 100G speeds and an increase in 200G shipments.  

More importantly, Lumentum expects calendar 2026 to be another breakout year for laser chip shipments, anchored by a widening supply-demand imbalance, sharp capacity growth and mix shift to higher priced, higher margin 200G products. 

One important discussion on EMLs is that the supply-demand imbalance continues to widen, meaning that substantial growth in capacity through 2026 should quickly convert to revenue. CEO Michael Hurlston explained that “last quarter, I think we characterized it as roughly a 20% shortfall relative to total customer demand. Even with the add in supply, I would say that number has increased to 25% to 30%. We are quite a bit short right now relative to the customer demand.” 

Lumentum is not the only supplier commenting about this imbalance, with Applied Optoelectronics also echoing this in their Q3 earnings call; however, management hinted that despite industry-wide capacity increases, supply could still lag demand through 2027: “We've also said we see the supply and demand imbalance increasing we're falling further behind. And that accounts for all this other capacity that's being built out here or there and everywhere by our competition. So at least through 2027, we don't believe we catch up. We think we're still behind on supply.” 

On the positive side, Lumentum shared that while its indium phosphide fab is fully allocated due to high demand, it has made “better-than-expected progress on yields and throughput and now see a line of sight to add approximately 40% more unit capacity over the next few quarters.” CEO Michael Hurlston clarified at UBS’ tech conference that “we gave in the last earnings call a new benchmark saying, over the next 3 quarters, meaning our December, March and June quarters, we expected to add that 40%. So that's a forward-looking statement where we'd expect an increase in capacity of 40% on what already is a doubled number.” 

Breaking this down suggests that the yield and throughput improvements means Lumentum is exceeding linear capacity growth, which can translate to stronger than expected revenue from more capacity going to higher ASP products. It also has strong implications for Lumentum’s margins and EPS, driving strong expansion in operating margins that then flows through to EPS: 

“So that 40% increase in indium phosphide capacity is focused on laser chips, which has, as you know, higher gross margins than many more of our other product lines. So as that flows through in the coming quarters, that will have a positive effect on our earnings per share. What you're seeing this quarter is without that increased capacity and increase gross margin contribution from the indium phosphide capacity we talked about.” 

Lumentum is also now working on CW lasers for silicon photonics (SiPho) and co-packaged optics (CPO), which are expected to kick in with 1.6T transceivers and layer into topline growth even if CW takes share from EMLs at 1.6T.  

Management expects to be well positioned for both EML and CW lasers ramping for 1.6T transceivers, as its capacity is interchangeable between the two components, despite management noting a difficulty in forecasting how the two will ramp – the primary takeaway here is that even if faster data rates such as 1.6T are less dependent on EMLs, management believes there is more than enough content for them to do well: 

“On the battle between CW and EML, it appears to us that CW is going to ramp with 1.6T but so will EML. And so the slope of the 2 ramps was hard for us to call but it looks like no matter how you slice it, the numbers will increase. So even if the mix shifts away from EML-based transceivers at 1.6T, the absolute numbers seem to be stratospherically high. And at least in the near term, we see no end in sight. We watch it every day, Chris, just like you're sort of cautioning but I think for the next 6 quarters, we're completely sold out, and we have long-term agreements, as I said, that we've worked out with our customers to ensure that they're going to take any additional capacity we've got online.” 

For a bit more on CW lasers, its 70 mW lasers started meaningful shipments this quarter and will be a more reasonable part of the mix in the December quarter, while sampling for 100 mW CW lasers just began. 100 mW lasers are expected to be in full production by mid-year 2026, with Lumentum aiming to integrate these into its own internal transceivers, slated for the June 2026 quarter.  

Q2 Outlook of $650M, Two Quarters Ahead of $600M Target 

While Q1 produced a solid beat, the most impressive part of the report was Q2’s guidance, with the company forecasting revenue of $630 million to $670 million. This marks a sharp sequential acceleration of nearly 11 points to 21.8% QoQ growth at midpoint and 25.5% QoQ at the high-end of guidance.  

On a YoY basis, the midpoint of the guidance points to a more than 3 point acceleration to 61.6% YoY, while the high-end would reflect 66.6% YoY growth.  

Just last quarter, Lumentum had projected reaching $600 million in quarterly revenue by the June 2026 quarter (fiscal Q4) or earlier, with the company now two quarters ahead of that target. When looking at the company’s original guidance for the end of 2025, which was $500 million (and satisfied by Q1), Q2’s forecast is 30% ahead of that, reflecting the strength of the AI networking theme and the demand the company is seeing. 

For the strong QoQ guide, management said that “the thing that probably caught us flat-footed is the width of the customer demand. It's touching everything. We talked about pump lasers. We talked about narrow linewidth. We talked about the transceivers. We talked about even coherent components. So it is very, very broad-based. And every single one of our segments is up. Every single one of our segments is contributing to the growth that you see.” 

To put in perspective how strong Lumentum’s growth curve is, current estimates for the June 2026 quarter sit at $740.3 million, more than 23% ahead of the company’s target revenue. This is also up from $689.9 million on November 7, a 7.3% revision higher in less than one week. 

Out of Lumentum’s three outlined growth drivers through 2026 – cloud transceivers, optical circuit switches (OCS) and co-packaged optics (CPO) – only cloud transceivers are expected to meaningfully contribute to Q2’s growth. OCS and CPO are expected to see much stronger growth next year, with ultra-high power lasers for CPO more geared towards 2H 2026. More on this is discussed below.  

Lumentum Intentionally Keeping Customer Count Low 

Another important discussion circled back to supply allocation and possible customer consolidation. This is not something that is necessarily new to Lumentum, as we had covered in our previous analysis that the company is intentionally keeping customer count low and not taking on new customers in an effort to focus on the highest-margin opportunities.  

Analysts had asked if management would use EML supply constraints to drive new transceiver engagements and qualifications and expand the customer base. However, management countered this and said they are actually trying to “consolidate supply and consolidate our customer base around a couple of folks that we think are going to be long-term winners. Those customers in return have given us multiyear commitments that give us a lot of confidence that our business is going to be sustainable even as we continue to ramp capacity through the next probably 6 or 8 quarters.” 

Management made sure to emphasize again that they will aim to “allocate our laser capacity based on the profitability metric more than to trying to broaden our transceiver opportunities in 1.6T using our lasers.” 

This is a two-edged sword, as multi-year commitments give Lumentum security in the ramp phase with visible, long-term revenue growth, yet it also could increase customer concentration risk by tying Lumentum solely to handful of key customers and limit its opportunities to diversify its customer base. This concentration risk is already becoming a bit more evident, with two customers accounting for 45% of revenue, at 22% and 21% respectively in fiscal Q1. This is up from 31.4% of revenue in fiscal 2025, at 16% and 15.4% respectively for the two largest customers. 

Cloud Transceiver Ramp Expected to Begin Next Quarter 

Lumentum’s ramp for cloud transceivers is expected to begin next quarter, with management stating that they have a line of sight to transceivers eventually becoming a $250 million/quarter business, or a $1 billion annual run rate; this is double its $500 million annual run rate today. Lumentum does not plan to expand the business beyond that $1 billion run rate, stemming from its gross margin profile.  

Cloud transceiver revenue was roughly flat QoQ in Q1 with Lumentum focusing primarily on increasing manufacturing capacity in Thailand to meet rising demand. As a result, management expects to resume growth in Q2 with the upward trajectory accelerating for the next four to five quarters.  

Lumentum believes Q2 will serve as a ‘proof point’ that as its new 1.6T and 800G transceivers ramp, it will see “the revenue layering benefits that our larger transceiver competitors have experienced” around the middle of 2026. The ramp of 1.6T will be important to track, as Lumentum has been straightforward about 1.6T margins being “significantly better” than 800G. 

However, CEO Michael Hurlston made clear at UBS’ tech conference that Lumentum is “operating meaningfully below the mid-30s in terms of margin” for transceivers as manufacturing is “substandard” on throughput, scrap and yields. He added that there is a path to get to the mid-30s over the next few quarters as production ramps and Lumentum in-sources components (versus virtually zero in-sourced today), but this remains a headwind to the company’s target model of 42%.  

Because of the lower-than-target margins, Hurlston explained that while Lumentum has “aspirations to get it to $1 billion annually, to add another $500 million of incremental revenue. But we don't want it to run much higher than that, just given the margin headwinds we see. We think we can manage our business up from a margin perspective if we keep the business to about $1 billion top line. If it gets beyond that, it will be more challenging.” 

No Change to Co-packaged Optics Timing, But Demand is Stronger 

As we discussed in September, co-packaged optics (CPO) is not contributing to revenue now yet could materialize into one of the biggest opportunities among all of the components and subsystems that Lumentum supplies, as the company says it is enabling Nvidia’s Spectrum-X networking switches. As a reminder, CPO places optical transceivers directly on the chip package, rather than using separate optical modules, resulting in faster data transmission, reduced latency and higher bandwidth. This may be the best of both worlds: the performance of optical yet with reduced power consumption for increasingly power-hungry AI racks.  

Management provided a brief update on CPO, noting that the ramp is forecast to begin in the early stages of calendar Q3 2026 with a more meaningful contribution in calendar Q4. Hurlston explained in Q1’s call that the only change is that “demand is stronger than we initially forecast” and “getting better,” though the timing for the ramp is still the same. He clarified further that Lumentum expects “an inflection point on Ethernet-based switches. That's where we see the real step-up where our revenue would become more material” in the second half of 2026, continuing through 2027. Second-gen CPO products for 3.2T speeds are tentatively on deck for 2028.  

Ultra-high power lasers are still in the initial production ramp, though Lumentum expects significant growth in shipment volumes in 2H 2026 with accelerating adoption, with this providing further confirmation of the strength of the CPO opportunity. Lumentum had announced the production expansion in early August, giving the company multiple quarters to ramp.  

Optical Circuit Switching Also a Late 2026 Story 

Lumentum’s second upcoming growth driver, optical circuit switches, are not expected to meaningfully contribute in Q2, rather being a late 2026 story alongside CPO. Optical switches are a new kind of switch for AI clusters that handle the switching optically instead of using transceivers to convert photons to electrons, and back again. Optical switching and CPOs work together to allow for more flexibility for reconfigurations, to reduce energy and complexity while also increasing bandwidth.  

Management has outlined confidence in reaching a $100 million quarterly revenue target by the December 2026 quarter, with its two major customers expected to be qualified in the March 2026 quarter with a third customer potentially qualifying in the middle of the year. CEO Michael Hurlston provided more clarity about how Lumentum expects OCS to ramp beginning in this quarter through 2026:  

“We outlined sort of a revenue ramp of kind of mid-single-digit millions here in the December quarter, getting to double digit — very, very low double digits in the March quarter and then accelerating to kind of mid $50 million, $60 million in the middle of the year and then getting all the way to that $100 million mark in the December quarter.” 

This commentary implies that the largest ramp and impact from OCS will hit in fiscal Q2 2027, with management eyeing tens of millions of QoQ growth in the back half of next year. As seen in the revisions, current estimates only point to $59 million QoQ growth in that quarter, which may underestimate the tailwinds from simultaneous growth in OCS, transceivers and initial CPO growth in the second half of 2026.  

Financials 

Revenue Growth Maintaining >50% YoY 

Lumentum fulfilled its guidance for a >$500 million revenue quarter in calendar 2025, reporting a record $533.8 million in revenue in fiscal Q1, beating estimates by just 1.4%. Revenue growth accelerated 2.5 points to 58.4% YoY though QoQ growth slowed to 11%.  

As discussed previously, Lumentum guided for $630 to $670 million in revenue in Q2, accelerating to 61.6% YoY and 21.8% QoQ, whereas consensus estimates were pegged at almost 40% growth to $561.5 million.  

Looking ahead, growth is expected to stay strong in Q3 at nearly 61% YoY, but the more impressive number is Q4’s estimated 54% growth, as this comes against a much more difficult comp of 55.9% vs 16.0% for Q3. This underscores the strength of the demand ramp Lumentum is discussing for the back half of calendar 2026. 

On an annual view, Lumentum is estimated to report 57.3% growth in fiscal 2026 to $2.59 billion, before slowing to 29.6% YoY to $3.36 billion in fiscal 2027. Revisions are much stronger in fiscal 2027, up $600 million since the start of October versus a $300 million increase for fiscal 2026. 

AI Revenue 

Lumentum estimates that over 60% of total revenue comes from cloud and AI infrastructure customers, or above $320 million in Q1.  

Lumentum changed its reportable segments in Q1, dropping Cloud & Networking and Industrial Tech and instead transitioning to Components and Systems. Components include laser chips, laser subassemblies, line subsystems and wavelength management subsystems, while Systems includes full stand-alone products such as optical transceivers, optical circuit switches and industrial lasers. 

Components revenue rose 18.4% QoQ and 63.9% YoY to $379.2 million, fueled by “robust demand inside the data center”, strong momentum for DCI products with narrow linewidth laser assemblies for DCI transmission up 70% YoY, and record EML shipments. Lumentum expects Components to be the cornerstone for revenue growth and profitability while Systems will scale rapidly with transceivers, OCS and other high-performance solutions. 

Systems revenue declined (3.6%) QoQ but increased 46.5% YoY to $154.6 million. Cloud transceiver revenue was approximately flat QoQ as Lumentum worked to increase capacity.  

For Q2, Lumentum expects approximately half of its sequential revenue growth (or ~$60 million at midpoint) to come from Components, and the other half from Systems, “primarily reflecting the ramp of high-speed optical transceivers for data center applications and to a lesser extent, the early phase of our optical circuit switch ramp.” 

GAAP EPS Back to Positive 

Lumentum reported a razor thin $0.05 in GAAP EPS, while adjusted EPS of $1.10, up 511% YoY, beating estimates by 6.8%. For Q2, Lumentum guided for adjusted EPS in a wider range of $1.30 to $1.50, up 233% YoY, coming in well ahead of the $1.16 estimate at the midpoint. Fiscal Q3 and Q4 are expected to see adjusted EPS continue to increase, though YoY growth technically is decelerating to 162% in Q3 and 91% in Q4 as comps get more difficult. 

Lumentum did not provide a full year adjusted EPS guide, though consensus now sits at $5.63, up from $4.90 and pointing to growth of 173% YoY. Considering Q2’s estimate remains below the midpoint of management’s guidance at $1.38, there is room for upside revisions if Lumentum provides another beat and raise next quarter. 

Margins Show Strong Expansion 

Gross margin continued to expand both sequentially and YoY, helping drive GAAP operating margin back to positive territory.  

  • GAAP gross margin was 34.0%, in Q1, up nearly 11 points YoY and 0.7 points QoQ. Adjusted gross margin was 39.4%, up 6.6 points YoY and 1.6 points QoQ.  
  • GAAP operating margin was 1.3%, up nearly 26 points YoY and 3 points QoQ. Adjusted operating margin was 18.7%, up 15.7 points YoY and 3.7 points QoQ, ahead of guidance for 16-17.5%. For Q2, management guided for continued adjusted operating margin expansion to 20-22%.  
  • GAAP net margin was 0.8%, up 25.3 points YoY and not comparable QoQ due to an income tax benefit in Q4. Adjusted net margin was 16.2%, up 12.6 points YoY and 3 points QoQ. 

Management provided a deeper discussion on margins moving through 2026, with product pricing from supply-demand imbalances serving as a strong lever for margin expansion:  

“I think we're moving the margin line up. Pricing, obviously, is a lever. And when you look at that very, very carefully, I think what you see in the guide is some pricing, very targeted price increases happening. I think as you look out next year in 2026, our agreements with customers will include more pricing, more broad-based price increases, just given the supply-demand imbalance.” 

CFO Wajid Ali added that margins are benefitting from improved manufacturing utilization, and moving into calendar 2026, gross margins are expected to move up in line with the company’s model from OFC (shown below) as OCS, 1.6T transceivers, and CPO ramp.  

Lumentum is currently tracking closer towards the $750 million model by mid-2026, which is expected to see adjusted operating margin above 20% and gross margin approaching 40%. Lumentum is currently ahead of targets for adjusted operating margin per Q2’s guide, which suggests that there could be further upside as higher-margin product ramps, or some stagnation from the initial ramp phases for OCS and CPO to remain within the target ranges.   

Cash Flows Muted 

Cash flows were rather muted, with operating cash flow margin shrinking both YoY and QoQ.  

Operating cash flow was $57.9 million in Q1 for a 10.8% margin, down from 11.8% a year ago and 13.3% in Q4. Free cash flow was ($18.3 million) for a (3.4%) margin, up from (10.2%) a year ago but down from 2.1% in Q4. 

Cash and equivalents were $1.12 billion while debt was $3.24 billion.  

Inventories for $531.6 million, up more than 13% QoQ, while accounts receivable surged nearly 23% QoQ to $307 million, both aligning with management’s commentary for strong product and revenue ramps over the coming quarters. 

Valuation 

Lumentum is trading at a stretched 6.9x forward PS multiple, more than double its five year average of 2.9x and above the 4.2x level that shares failed to break past in late 2024 and early 2025. 

On the bottom line, however, Lumentum is trading just above its average multiple, currently valued at 45x forward adjusted EPS versus its five year average of 40x. Shares have traded as high as 60x and as low as 18-20x.  

Conclusion 

A lack of InP capacity is causing a rather substantial shortfall in EML laser supply as demand continues to expand, with Lumentum one of two companies able to meet this demand. Evidence of this tight supply is seen in Lumentum’s QoQ acceleration from 11% in Q1 to 22% guided in Q2, as Lumentum was able to increase InP capacity by 40% a few quarters ago. Looking ahead, an additional 40% capacity growth is coming online over the next few quarters, and higher yields and throughput on the upcoming capacity expansion could translate into a higher revenue growth rate.  

Outside of EMLs, Lumentum is beginning to work on CW lasers for silicon photonics and co-packaged optics, which is expected to serve as the company’s next catalyst moving into 2026. This catalyst will hinge on whether Lumentum sees similar qualifications for SiPho and CPO as it has for EMLs for Nvidia’s Blackwell, or if it fails to be chosen as a lead supplier for CW moving through 2026.

Damien Robbins, Equity Analyst at I/O Fund contributed to this analysis.

Please note: The I/O Fund conducts research and draws conclusions for the Fund’s positions. We then share that information with our readers. This is not a guarantee of a stock’s performance. Please consult your personal financial advisor before buying any stock in the companies mentioned in this analysis.

Nvidia Stock and the AI Monetization Supercycle No One Is Pricing In

Two weeks ago, Nvidia blew the doors off with an earnings report that defies the company’s mega-cap scale. The long-awaited Blackwell and Blackwell Ultra architectures are shipping in volume, leading to 25% QoQ growth in the data center segment and surpassing a $200 billion data center run rate. Despite this, Nvidia’s stock barely budged as the market ignored the magnitude of the QoQ inflection. Consider that Apple, trading at a similar market cap, has not seen 66% YoY growth for fourteen years, and it required a global pandemic for Apple to report 25%+ QoQ growth outside of its holiday quarter.  

When we narrow it down to Nvidia’s last earnings report – let alone subsequent reports – there is truly no comparison going back for a decade or more. However, the market dismissed the results and is instead stuck in a pit of speculative fears – meaning, there is no evidence in the financials, management commentary, industry estimates, or product roadmap (collectively referred to as “data”). Nonetheless, hypothetical risks that are immaterial today have become loud enough to bury an otherwise epic earnings report. 

As I pointed out on Charles Payne’s Making Money, I live for those moments when a company delivers a strong earnings report and yet the market hands me a lower price.  

Underneath the noise of “AI bubble” debates, Google’s TPUs, debt leverage (which is a material issue), China fears (remember the DeepSeek panic?), supply chain constraints, rare-earth material shortages, and more — I like to remind investors that those risks were immaterial to Nvidia’s recent report or management’s guide. 

Therefore, I maintain that the greatest risk is not an AI bubble or the credibility of these other risks – rather it’s that an investor misses out on what may be one of the strongest investing opportunities of our lifetime: what I’ve dubbed the AI Monetization Supercycle catalyzed by the inference phase. 

Keep in mind that to short a stock like Nvidia could hypothetically return 30% or 40% whereas going long has returned over 3,500% since the I/O Fund’s first entry. It was not only Nvidia we participated in, but rather the I/O Fund has offered one of the strongest AI portfolios in the world – proven by our strong cumulative return. Currently, we have 15 positions, beating the Nasdaq YTD up from ten last year. 

Below, I outline what I see ahead — points that warrant far more attention than the familiar media narratives, which have repeatedly underestimated the magnitude of the AI trend. Instead, you’ll find data-driven conclusions on the incoming monetization wave, including new insights to help investors connect the dots on what 2026–2027 may bring.

For a limited time, we’re offering $250 off our Advanced Tier. This Black Friday deal ends December 8th. Join here.For a limited time, we’re offering $250 off our Advanced Tier. This Black Friday deal ends December 8th. Join here.Join here.

OpenAI's Record $13B Revenue Confirms the AI Monetization Supercycle 

To see the AI monetization Supercycle in action, we can simply look at OpenAI’s trajectory. The company went from $1 billion in revenue in 2023 to $3.7 billion in 2024 to now $13 billion in annualized revenue, which is the steepest rise in tech history. This was driven almost entirely by inference (API calls and ChatGPT usage). Furthermore, OpenAI recently stated revenue is “well more” than $13 billion.  

The clues from OpenAI’s monetization trajectory is key as the market is anxiously awaiting the moment that Big Tech will show ROI from capex spend, and according to Broadcom and others, that day may soon be arriving.  

Over the past year, Broadcom joined Nvidia, Alphabet, and Microsoft in calling out surging AI inference demand, noting that this rapid growth could drive increased demand for custom silicon in the second half of 2026, and with it, higher AI revenue.  

Broadcom sees growth continuing, supported by the inference growth curve, as CEO Hock Tan said during FQ2 earnings call that Broadcom might witness an acceleration of XPU demand into the back half of 2026. He said, “In fact, what we've seen recently is that they are doubling down on inference in order to monetize their platforms. And reflecting this, we may actually see an acceleration of XPU demand into the back half of 2026 to meet urgent demand for inference on top of the demand we have indicated from training.” 

Something similar was echoed in the most recent FQ3 call, with Tan stating: “But also as for these guys, they got to be accountable to being able to create cash flows that can sustain their path. They [are] starting to also invest in inference in a massive way to monetize their models.”

mid

CoreWeave’s Q2 earnings call also echoed the incoming inference wave will lead to a period of heightened monetization: “As I always say, inference is the monetization of artificial intelligence.” 

Matthew Bryson, Managing Director of Research at Wedbush Securities, expressed optimism on the broader AI sector’s shift toward revenue generation through inference applications, stating “What we’ve started to see over the last three, four months is that there’s been a huge increase in inference. This increase in inference – the applications that drive actual revenue for cloud providers and model builders – represents a critical development for the sector. It feels like right now we’re also seeing monetization of AI, and that was the concern,” he added. “If you’d asked me 12 months ago, where’s the revenue going to come from? All we’re seeing is model building, and now it looks like we’re not. We’re seeing applications.” 

I/O Fund Lead Technology Analyst Beth Kindig discusses Nvidia’s stock after Q3 FY 2026 blowout earnings report on Fox Business

How OpenAI and Anthropic Projections Validate Nvidia Stock 

OpenAI and Anthropic are boosting long term revenue projections, underpinned by inference and inference-driven products such as AI agents. For example, in the most recent projection, OpenAI raised the tail end of its long-term forecast by as much as 25% from 2027 to 2029 versus its fall 2024 projection.  

OpenAI now sees $54 billion in revenue in 2027, a nearly 23% raise from its prior projection for $44 billion, and $125 billion in revenue in 2029, a 25% raise. Notably, this growth is not stemming from ChatGPT, where 2029 revenue was actually cut from the mid-$50 billion range to $50 billion; instead, OpenAI projects around $20 billion from APIs, over $25 billion from AI agents and another $25 billion from other products and free user monetization (such as ads). For comparison, the $125 billion target reflects nearly 10X growth from 2025’s projected revenue of $13 billion. 

Chart showing OpenAI's long-term revenue forecast raised to $125 billion by 2029, a 25% increase driven by AI Agents and Inference applications, supporting Nvidia stock bullish outlook.

Chart detailing OpenAI's raised long-term revenue projections to $125 Billion by 2029, a 25% increase over prior forecasts. This growth, fueled by Inference applications, validates the Nvidia Stock bull thesis. Source: The Information.The Information.

Competitor Anthropic is also expecting rapid revenue growth through 2028, now projecting as much as $70 billion in revenue in its optimistic scenario as of early November. This forecast is supported by Anthropic’s near-term growth expectations for its ARR, with the company said to be on track to hit its $9 billion goal this year with a target to double or nearly triple this to $20-26 billion in 2026.  

API revenue for Anthropic is expected to reach $3.8 billion in 2025, more than double OpenAI’s expectation for $1.8 billion, with Anthropic’s Claude Code model said to be close to reaching $1 billion in annualized revenue, up 150% from $400 million in July. 

Recent token usage statistics from Google and OpenAI also suggest that this wave of AI inference is on rapidly on the rise. In October, Google boasted more than 1.3 quadrillion monthly tokens processed across its platform, up from 980 trillion in June and up 170% from 480 trillion just five months earlier in May. 

Google also disclosed that its first party models like Gemini were processing 7 billion tokens per minute via direct API use in Q3, or more than 300 trillion monthly, roughly one quarter of Google’s overall tokens processed. This also outpaces OpenAI, which revealed in early October that it was processing 6 billion tokens per minute on its API, or ~260 trillion per month. 

To put this in perspective, Google was processing just 9.7 trillion tokens per month in April 2024. Barely a year and a half later, and the company is almost processing that many tokens per minute. 

Making headway on token throughput directly relates to the strength of Nvidia’s stock. For example, Microsoft has recently achieved a new AI inference record, with its Azure ND GB300 v6 virtual machines processing 1.1 million tokens per second on a single rack powered by Nvidia GB300 GPUs. It also marked a 27% speed improvement from 12,022 tokens/s per previous-generation Nvidia Blackwell GPU to 15,200 tokens/sec per Blackwell Ultra GPU and beat the previous Azure ND GB200 v6 record of 865,000 tokens/s by 27%. 

AI Will Drive Strong Bottom Line Results Too 

AI will not only impact the top line but will drive internal efficiencies to where there the first clue there is ROI on capex spend may be found in margin improvement.  

Big Tech management teams are having initial discussions on the impact of using AI to drive operational efficiencies. 

Alphabet’s CFO said in the Q2 earnings call, “So Sundar mentioned earlier, the use of AI tools within the company. So that's another area where we can drive efficiency across the businesses to use these tools internally in terms of how we run the organization. Then we're continuing on the same efforts that I've talked about before with regards to running the company with a high level of discipline, execution and driving efficiency across the business.” 

According to McKinsey survey, most respondents say their organizations are using AI, and many have begun using AI agents as 64 percent of respondents said that AI is enabling innovation and 39 percent report positive EBIT impact at the enterprise level. 

CrowdStrike announced earlier this year that the company was laying off 500 employees or about 5% of its workforce, due to artificial intelligence efficiencies. According to the World Economic Forum survey, about 41% of companies worldwide are expected to reduce their workforces in the next five years attributing to the rise of artificial intelligence.  

Amazon announced in October that they are laying off 14,000 employees as the company invests more in AI. It marks the largest jobs cuts in the company’s history. Beth Galetti, SVP at Amazon said, “This generation of AI is the most transformative technology we’ve seen since the Internet, and it's enabling companies to innovate much faster than ever before (in existing market segments and altogether new ones). We’re convinced that we need to be organized more leanly, with fewer layers and more ownership, to move as quickly as possible for our customers and business.” The company’s CEO warned about the job cuts in June this year. “We will need fewer people doing some of the jobs that are being done today.” Klarna has been most transparent about the impact of AI, revealing earlier this year that the company reduced its workforce by 40%.  

Meta also revealed in October that the company will cut 600 positions from its Artificial Intelligence unit, which underscores the internal efficiencies that AI enables. This should not be confused with a pullback in AI investment — Meta is clearly spending heavily here, with capex increasing by 81% or $31.8 billion this year.  

Morgan Stanley expects that software and internet companies to report positive return on investments from GenAI of 35% in 2025 and rise to 67% contribution margin by 2028. “[…] In fact, for the first time, return on investment (ROI) is expected to be positive with analysts expecting GenAI to yield a 34% contribution margin, or the equivalent of $51 billion in 2025. Last year, GenAI ROI, with expenses, resulted in a -5% contribution margin. By 2028, ROI is expected to remain positive and rise to a 67% contribution margin, or $722 billion return.” 

According to J.P.Morgan, “Since the launch of ChatGPT in late 2022, AI-related stocks have been responsible for roughly 75% of S&P 500 total returns, 80% of earnings growth and 90% of capital spending growth. That means AI is more than just hype – it is delivering tangible results, boosting productivity and supporting corporate margins across the economy.”  

While the media will put a negative spin on those stats, I personally look at the earnings growth piece specifically as an initial clue as to the impact that AI is having. 

Nvidia Stock Shatters Records: $50B Data Center Revenue at 66% YoY Growth  

As stated in the introduction, Nvidia blew the doors off its most recent earnings report, with the long-awaited Blackwell and Blackwell Ultra architectures now shipping in volume. Given how much time has been wasted on fearful speculation around the AI leader and the overall AI market, I think it’s appropriate to spend at least a few minutes grounding ourselves in Nvidia’s fundamentals. 

Nvidia’s Q3 revenue grew by a solid 62.5% YoY and 22% QoQ to $57.01 billion. Revenue growth accelerated by 6.9 percentage points from 55.6% YoY growth reported in Q2. Revenue beat estimates by 3.5% and is the strongest beat in the last four quarters. The company’s strong revenue growth dispelled fears of an AI Bubble. Nvidia’s CEO Jensen Huang said, “Blackwell sales are off the charts, and cloud GPUs are sold out.”  

In Q3, the GB300 sales were higher than GB200 sales, accounting for 2/3 Blackwell’s revenue, proving strong demand from cloud companies and hyperscalers. Looking forward, Rubin is on track to ramp in the second half of 2026 – which may help Nvidia continue to beat analyst estimates, especially as we approach CY2027 

Management also provided a strong Q4 revenue guide of $65 billion at midpoint, representing a YoY growth of 65.3% and up 14% QoQ, beating estimates by 5.1%. 

The company’s networking growth was an outlier, growing 162% YoY and 13% QoQ to $8.19 billion. Revenue growth accelerated by 84 percentage points from 78% YoY growth in Q2. Management stated in the earnings call that the company’s networking business is now the largest in the world.  

Nvidia surpassed the $50 billion quarterly data center revenue milestone in Q3, reporting $51.2 billion in revenue for the segment, up 25% QoQ and 66% YoY. This is the highest QoQ growth rate for data center in nearly two years since fiscal Q4 2024. An impressive feat to deliver such strong growth at scale considering the segment was just $18.4 billion when Nvidia last reported this QoQ growth.  

On a dollar basis, data center revenue rose by $10.1 billion sequentially. This sequential growth was driven by a strong inflection in Compute revenue, which surged 27% QoQ to $43 billion, its highest sequential growth rate since fiscal Q1 2025; however, this does come after a (1%) QoQ decline in fiscal Q2. Nvidia noted that Blackwell Ultra was ramping across all customer categories and became its leading architecture.  

Chart illustrating Nvidia's Data Center revenue growth, jumping $10.1 billion quarter-over-quarter to $51.2 billion in Q3, with Q4 guidance projecting up to $59 billion, reinforcing the bullish Nvidia stock thesis.

Chart of Nvidia's Data Center Revenue. The segment's QoQ growth surged $10.1 Billion in Q3 to $51.2 Billion, validating the Nvidia Stock bull thesis. While Q4’s guidance suggests the segment could reach $59 billion.

Q4’s guidance suggests that this $50 billion data center segment will quickly be in the rear-view mirror, with the $65 billion guidance implying data center revenue of around $59 billion assuming similar mix shift as Q3. This represents another 15% QoQ growth on top of Q3’s 25%, or essentially the data center segment rising nearly 44% in just two quarters.  

This would also correspond to a nearly $8 billion QoQ increase, meaning that if Nvidia maintains this growth cadence through mid-CY26, then it would reach our prediction for a $75 billion data center segment two quarters early. If this materializes, this would represent data center growth of 66% YoY, up from 56% last quarter.  

It also could suggest Nvidia potentially reaching a $90 billion quarterly data center segment if this trajectory is maintained through the end of fiscal 2027. For investors, this rapid acceleration reinforces the bullish outlook for Nvidia stock, as these revenue milestones increasingly align with long-term valuation targets. 

However, it is important to note that given the sheer scale of data center revenue, there is the potential for this inflection to be lumpy, especially in-between GPU generations. 

NVDA Blackwell Revenue Surpasses $100 Billion, Validating $500B Data Center Visibility 

As stated in our analysis “Why Nvidia Stock Could Reach a $20 Trillion Market Cap”, after taking into account Jensen Huang’s commentary in October that $500 billion in Blackwell-Rubin revenue that will ship by the end of FY2026, my firm estimates this leads to a $320 billion data center segment next year.  

Here is what was stated in the $20 Trillion analysis: “Reading between the lines on Huang’s comments suggests strong upside to Nvidia’s data center revenue through 2026. Over the prior three quarters heading into fiscal Q3’s report, Blackwell revenue has totaled approximately $63 billion. Including Networking over that time frame, total revenue would rise to $78 billion, still a fraction of the total overall opportunity management is projecting. Thus, if we assume that Blackwell and Rubin ramp over the next five quarters, fiscal 2027 data center revenue could be nearly $320 billion, versus estimates for around $270 billion.”   

We calculated this from the prior three quarters heading into fiscal Q3’s report; Blackwell revenue has totaled approximately $63 billion. Now, Q3’s Compute revenue of $43 billion implies Blackwell has delivered around $104 billion in revenue in the past four quarters, assuming the only non-Blackwell revenue was the $2 billion disclosed from Hopper.   

Including Networking and Q4’s guidance, Nvidia looks to be on track to generate $186 billion of its $500 billion opportunity in fiscal 2026. This would leave approximately $314 billion for fiscal 2027’s data center revenue to meet the $500 billion visibility, but if Nvidia can exceed that by 2-4%, it could be on track for $330 billion next year.  

At a 20 to 25 forward sales valuation, Nvidia only needs to grow its data center segment 3X to $920 billion to reach a $20 trillion market cap. 

In fact, further strengthening the $20T market cap prediction, Nvidia’s CFO has hinted they could exceed $500 billion as the CFO stated, “So there's definitely an opportunity for us to have more on top of the $500 billion that we announced.” Nvidia’s CFO later clarified this week at UBS’ tech conference that the “$0.5 trillion doesn't include any of the work that we're doing right now on the next part of the agreement with OpenAI” signed in late September for up to 10GW of compute. 

Nvidia Stock: $50 Billion Supply Commitments Guarantee Continued Growth Inflection 

What differentiates the I/O Fund’s research is that we constantly tell our members the key indicators to look at in a company’s earnings report. While we continue to hammer on the importance of Big Tech’s capex as the number one indicator for Nvidia’s data center growth continuing, there was potentially a more important, well overlooked figure in Nvidia’s report that signals this data center inflection will continue.   

Nvidia’s total supply-related commitments, such as for CoWoS wafers, HBM memory, or other components, surged nearly 52% QoQ to $50.3 billion in Q3, with management noting that they are “ordering to secure long lead-time components, meet the demand for Blackwell, and support future architecture ramps.”   

This is a notable increase from the prior five-quarter average of ~$30 billion, which is likely supporting the current ramp in data center revenue. This uptick in supply commitments, which is likely to translate into inventories and revenue over the coming four to six quarters, hints that Nvidia will continue ramping Blackwell output while preparing for Rubin’s production in the second half of 2026.    

Chart showing Nvidia's total supply commitments rising 52% quarter-over-quarter to $50.3 billion in Q3, indicating strong order volumes to secure Blackwell and Rubin production, reinforcing Nvidia stock growth outlook.

Chart detailing Nvidia's commitment surge. Total Supply Commitments jumped 52% QoQ to $50.3 Billion in Q3, signaling massive order volume to secure Blackwell and Rubin production and Nvidia Stock growth.

This also bolsters confidence in Nvidia’s order visibility to fill out and even exceed this cumulative $500 billion in Blackwell and Rubin revenue, as the company would not need to boost supply commitments by this degree if the demand signals were not there.

In Closing …. 

Nvidia’s Q3 results showed the company’s GPU momentum return, delivering a substantial data center beat with 25% QoQ growth, surpassing an important $50 billion quarterly revenue milestone for the segment. More importantly, Nvidia’s guide pointed to this momentum continuing into the fourth quarter, implying that data center revenue could be on track to increase another $8 billion QoQ for 15% growth.  

I published an article entitled Why Nvidia Stock Could Reach $20 Trillion Market Cap by 2030 Why Nvidia Stock Could Reach $20 Trillion Market Cap by 2030 – a prediction that requires a 36% CAGR over a five-year period or about 8% growth QoQ. These two quarters alone meet the criteria for next year’s CAGR plus some. 

Nvidia’s results provide a strong message that AI is not in a bubble. While many are busy debating this point, we are laser focused on identifying the companies that are going to benefit from the monetization of AI, particularly due to the shift from Big Tech companies from training to inference.

This year, my firm has 15 positions beating the Nasdaq YTD, up from ten positions last year – helping to cement the I/O Fund as one of the world’s leading AI portfolios. Our cumulative return of 210% over a five-year period would rank us #2 if we were a hedge fund and #5 if we were an ETF – notably, this strong cumulative return does not yet include our 2025 performance.

For a limited time, we are offering $250 off on our Advanced tier $250 off on our Advanced tier with real-time trade alerts, webinars, deep dives and access to our portfolio. This Black Friday deal expires soon on December 8th.Black Friday deal expires soon on December 8th.

To see our exact AI portfolio positioning including weightings of each of our holdings, along with real-time trade alerts, and the in-depth research that attracts media coverage from Fox to Bloomberg, we invite you to take advantage of our Black Friday Sale. Learn more here.take advantage of our Black Friday Sale. Learn more here.

Damien Robbins and Royston Roche, Equity Analysts at I/O Fund contributed to this analysis

Please note: The I/O Fund conducts research and draws conclusions for the company’s portfolio. We then share that information with our readers and offer real-time trade notifications. This is not a guarantee of a stock’s performance and it is not financial advice. Please consult your personal financial advisor before buying any stock in the companies mentioned in this analysis. Beth Kindig and the I/O Fund own shares in NVDA at the time of writing and may own stocks pictured in the charts.

Recommended Reading:
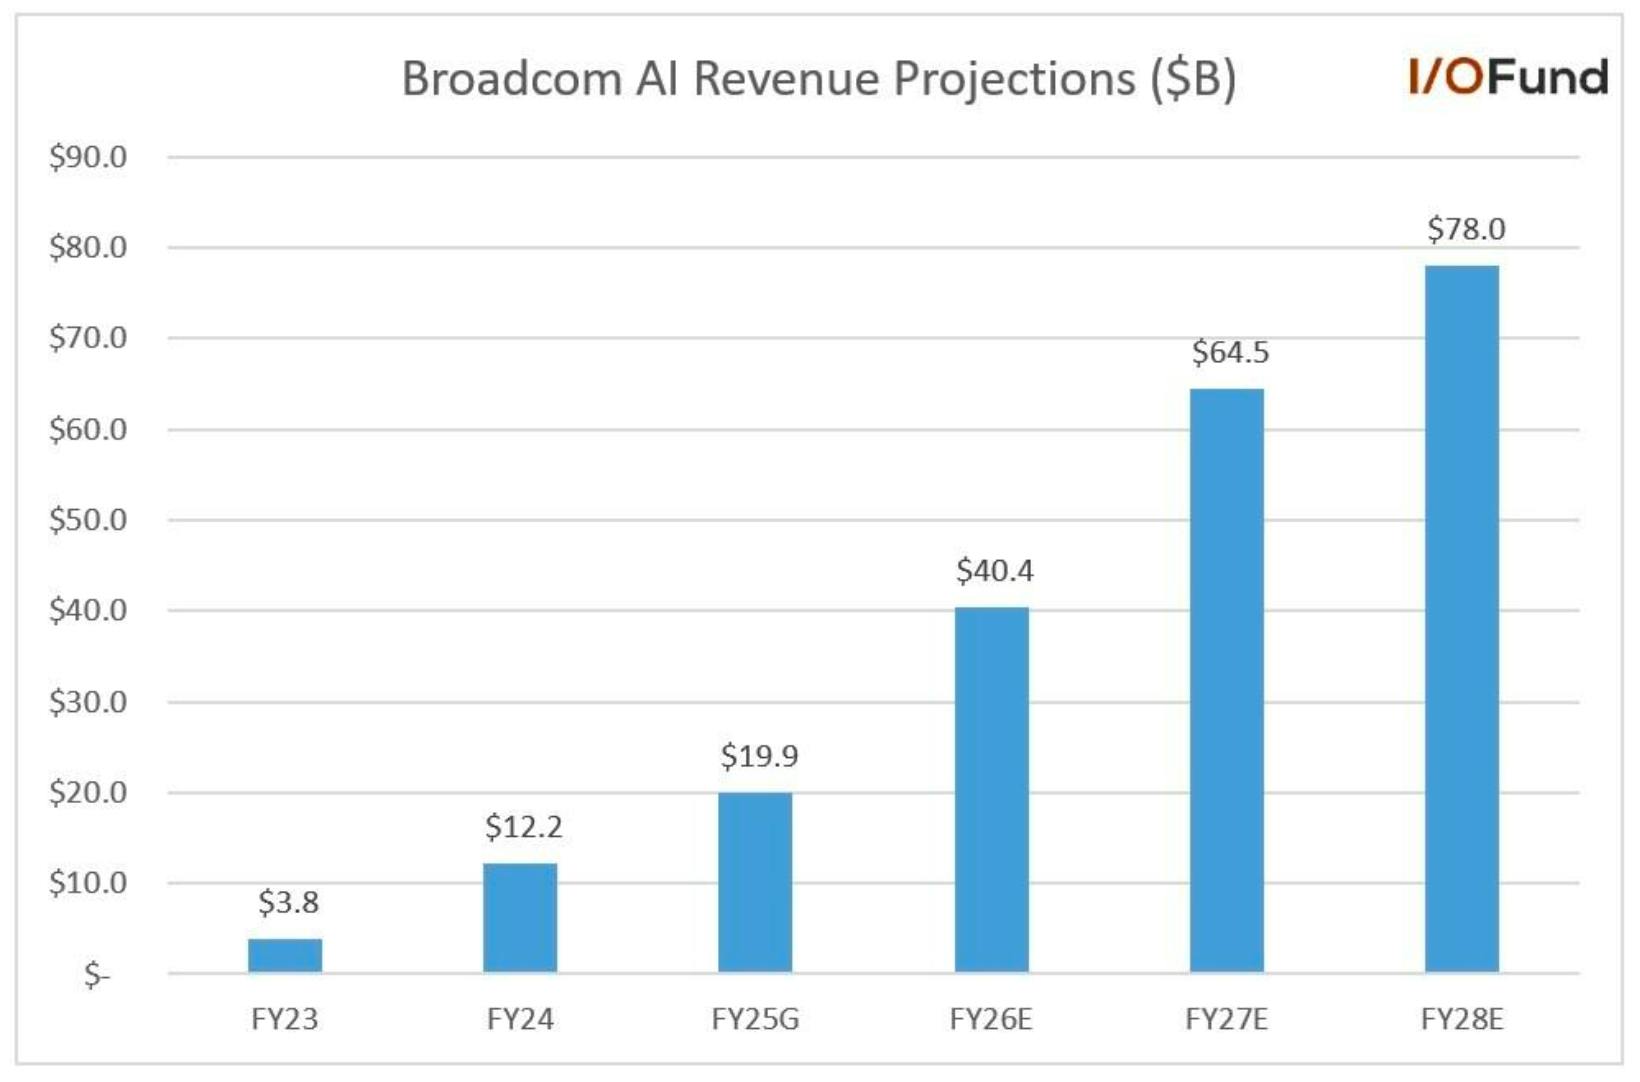
Credo Fiscal Q2: Revenue Surges as Reliability Wins in a Crowded Market  

Credo dropped another silly-good earnings report. This company simply won't stop shattering estimates and leaving analysts scrambling to revise their models. Fiscal Q2 revenue reported growth of 272% YoY and 20% growth QoQ for revenue of $268 million – beating estimates for revenue of $235 million and growth of 226%. The company is GAAP profitable with an operating margin of 29.4% and an adjusted operating margin of 46.3%. 

However, if you thought this quarter’s 14% beat coming in $33 million over expectations was impressive, next quarter’s guide is insane. Credo guided $340 million at the midpoint vs $247.6 million expected — a 37% beat, or roughly $92 million above consensus.  

Credo is capable of this strong performance due to the reliability of active electric cables (AECs). The company continues to carve out a name for itself in mission critical interconnect features such as reliability, signal integrity, latency and reach. According to management: “At 100 gig per lane today and 200 gig per lane tomorrow ZeroFlap AECs deliver up to 1,000x better reliability than traditional laser-based optical modules while consuming roughly half the power. 

In addition, management stated they had four hyperscalers contribute more than 10% of revenue with the fourth in full volume ramp and the fifth starting to contribute initial revenue. This is up from three in fiscal year 2025. This diversification helps quite a bit as the lead customer cooled off in the recent quarter while another customer stepped up in revenue percentage.  

This particular call was also loaded with details on the future road map with information on three new growth pillars that represent “multi-billion dollar market opportunities.” Make sure to read this section if you’re curious about what Credo has planned to expand their dominance to scale-up interconnects. 

AECs Lead in Front-End and Scale-Out Connectivity 

Last quarter, I made it a point to highlight the CEO’s comments on AEC reliability, because those remarks addressed why Credo continues to deliver 200%+ year-over-year growth: 

“Again, reiterating that if you have got a single link flap in, say, 10,000 or 100,000 or 1 million GPU cluster, it brings the entire cluster down because there's no redundancy from that NIC to tour connection. And so we're actually seeing the TAM expanding. And I think for the first time in history that you're seeing copper replacing optical connections. So we're quite bullish on the market generally.” 

This was repeated again this quarter with the magical words “expansion of AEC TAM,” which implies Credo is expanding its market as AECs become desirable for lengths of up to 7 meters (copper was traditionally used under 3 meters). 

“When you're installing a 100,000 GPU cluster, link flaps can delay time to stability and time to revenue. And when you're training a model costing tens of millions of dollars, link flaps can have a significant impact on overall uptime and productivity. It is this step function improvement in reliability and power efficiency that's driving the expansion of the AEC TAM in the 100 gig and now 200 gig per lane generations. And we expect that trend to continue as customers densify racks and push cluster scale to new levels.” 

The TAM is also expanding as AECs are used for front-end network connections, scale-out (or back-end) network connections and also for replacing chassis backplanes (in-rack cabling).  

Perhaps most importantly, AECs may see an opportunity for scale-up networking (also back-end networking) yet what is unique about the scale-up networking opportunity is that Credo currently does not see any revenue yet here, creating yet another expansion of TAM should AECs pass qualification: “I would say the one remaining application that will be high volume is with the scale up network as that network goes rack-scale and then ultimately goes row-scale depending on the density and the number of racks that are being deployed.” 

Aggressive 3-Year Product Road Map 

There was brand-new information on the earnings call on how Credo plans to approach CY2026-2028 with some fairly aggressive product lines.  

In the opening remarks, the CEO detailed the following: 

  • ZeroFlap optics combine the reliability from AECs with an optical DSP and switch level SDK to integrate with their customer’s software. This allows observability data to mitigate system failures from faulty link flaps. According to management: “Our ZF optics solutions expand our addressable market to any length of connection within the data center. We anticipate initial revenue in fiscal '27 and long term, a market that will be a multibillion-dollar opportunity.” 
  • Credo is also developing high-performance micro LED technology along with partner Hyperlume. The first product will be a pluggable optical solution that uses micro LEDs as the light source to product “active LED cables” or ALCs. The result will be ALCs that offer the same reliability and power efficiency as AECs yet can reach up to 30 meters. According to management, “We plan to sample the first ALC products to lead customers during our fiscal '27 with initial revenue ramping in fiscal '28. We believe the ALC TAM will ultimately be more than double the sizes of the AEC TAM.” 
  • OmniConnect gearboxes are the third growth vector and will target the XPU market (or ASICs market) that uses 112G VSR SerDes for increases DDR memory capacity and throughput. According to management: “Weaver allows designers to move to commodity DDR memory and achieve up to 30x more memory capacity and 8x the bandwidth […] We anticipate initial revenue in our fiscal '28 with significant scaling thereafter.” 

It’s important to note that Credo is future-proofing by designing optical solutions for the ZF flaps and ALCs. Per the Q&A session: “And I would say that, yes, ALCs as well as ZF optics, those are both optical solutions. But the OmniConnect family will be initially copper-based and then longer term, we'll offer near package optics options with that.” 

Perhaps most importantly, Credo stated their goal with these new products is to move from a $1 billion annual revenue threshold to $5 billion (although there has to be quite a bit of solid execution in-between): “We've been working on these things for 18 months or so. But now being able to talk about it, I think it shows that their path to a much more diversified company long term as we think about moving the company from that $1 billion threshold of revenue annually to $5 billion and beyond over the next several years.” 

We will be closely monitoring the execution around these new products in the coming quarters. 

Financials 

Stellar Revenue Growth of 272% 

Credo’s Q2 FY2026 ending Oct 2025 revenue grew by 272.1% YoY and 20.2% QoQ to a record $268 million, beating estimates by a solid 14.1%. The robust growth was primarily led by continued strong demand for its power-efficient high-speed AI connectivity solutions, particularly its Active Electrical Cable (AEC) product line.  

The company’s CEO, William Brennan, said in the earnings call, “These are the strongest quarterly results in Credo's history, and they reflect the continued build-out of the world's largest AI training and inference clusters. AI clusters are no longer measured in tens of thousands of GPUs. They're now measured in hundreds of thousands and soon millions.” 

The company’s four hyperscale customers each contributed more than 10% of total revenue. The fourth hyperscaler is now in full volume ramp, and a fifth customer started contributing initial revenue in the recent quarter. The CFO, Daniel Fleming, said in the earnings call, “The largest was 42% of revenue, and that was the customer that we've, in the past, said we expect to be the largest customer this fiscal year. The second largest was 24%, which have to be our first hyperscaler to ramp a few years back. Third largest was 16%, which was our largest customer in Q1. And the fourth was 11%, which is our newest hyperscaler that we've discussed in the past.” Management expects revenue diversification to strengthen further with the fourth customer surpassing the 10% revenue for this fiscal year. 

Management also provided a strong guide for the next quarter of $335 million to $345 million, representing a YoY growth of 151.8% and 26.9% QoQ at the midpoint. Notably, this guidance crushed analyst estimates by an extraordinary 37.3%, highlighting the company's robust outlook. 

Management expects strong growth to continue and the CFO said in the earnings call, “As we look toward the end of fiscal year '26 and into fiscal '27, we expect sequential revenue growth in the mid-single digits, leading to more than 170% year-over-year growth in the current fiscal year. We expect each of our top 4 customers from Q2 to grow significantly year-over-year in fiscal year '26.” 

Product Revenue Growth of 278% 

Credo’s product revenue grew by 278% YoY and 20% sequentially to $261.3 million. This stellar performance was primarily driven by the Active Electrical Cable (AEC) product line. The AEC product line achieved new record revenue levels after posting strong double-digit sequential growth, fueled by substantial YoY growth across four hyperscale customers.  Management also highlighted that customer forecasts have strengthened across the board in the past months. 

  • IP License revenue grew by 128% YoY and up 12% QoQ to $6.7 million. The revenue growth decelerated from 152% YoY in FQ1 and accounted for only a small 2.5% of total revenue.   

Strong Margins 

Credo reported strong profits that exceeded management guidance. During the earnings call Q&A, management reiterated that the long-term adjusted gross margin to be in the range of 63% to 65%. 

Vijay Rakesh (Analyst) 

“Got it. And then longer term, as you — you're obviously seeing a pretty strong AC ramp. How should we look at the gross margin profile as optical DSPs are starting to ramp as well? Just longer term, how to look at gross margins?” 

Daniel Fleming (CFO)  

“Yes. We've been very consistent in saying our long-term expectation for gross margins is in the 63% to 65% range. So we are clearly at a point in time right now where we're a bit above that, but we don't expect that to be the case longer term. If you look at the more medium term, probably we guided to 65% at the midpoint. So we'll be kind of near that high end of that long-term expectation. But just longer term, I expect that to settle down into an area that historically, companies like us have been in.” 

  • Gross profits grew by 298% YoY to $181.1 million with a gross margin of 67.5%, up 430 basis points YoY and up 10% basis points sequentially and higher than the guide of 64.5%. The adjusted gross margin was 67.7%, higher than the guidance of 65%. Management expects gross margin to be 64.8% and adjusted gross margin to be 65% in the next quarter. 
  • The operating margin was 29.4%, up 41.1 percentage points YoY and up 2.2 percentage points sequentially, driven by strong operating leverage. It was above the guide of 23.2%. Adjusted operating margin was 46.3% compared to 11.5% in the same period last year and 43.1% in the previous quarter. Management’s operating margin guide for the next quarter is 30.1% and the adjusted operating margin is 44.4%. 
  • Net margin was 30.8% compared to (5.9%) in the same period last year and 28.4% in the previous quarter. Adjusted net margin was 47.7% compared to 17% in the same period last year and 44.1% in the previous quarter. 

Adjusted EPS beat of 35.3% 

Credo’s GAAP EPS was $0.44 compared to ($0.03) in the same period last year, beating the estimates by 45.1%. Adjusted EPS grew by 857% YoY to $0.67, beating estimates by 35.3%. Analysts expect adjusted EPS to grow by 104.4% YoY to $0.51 in FQ3 and 53% YoY to $0.54 in FQ4.

Cash Flow and Balance Sheet 

Credo has strong cash flow driven by growth in profits.  

  • FQ2 operating cash flow grew by 500% YoY to $61.7 million with an operating cash flow margin of 23% compared to 14.3% in the same period last year. 
  • FQ2 free cash flow was $38.5 million compared to ($11.7 million) in the same period last year and $53.1 million in the previous quarter. Free cash flow margin was 14.4% compared to (16.2%) in the same period last year and 23.8% in the previous quarter. Free cash flow was down sequentially due to higher capex, driven primarily by investments in production mask sets.
  • Cash and short-term investments were $813.6 million compared to $479.6 million in the previous quarter, and the increase was primarily from the proceeds of the ATM (at-the-market) equity offering. Credo received $384.6 million in net proceeds through the issuance of 2.7 million shares. The company announced in October that it entered into an equity distribution agreement with Goldman Sachs to raise money from time to time with a total offering of $750 million. Credo remains debt-free. 
  • In September, the company also acquired Hyperlume, a developer of miniature light-emitting diode (microLED) based optical interconnect technology for chip-to-chip communication, for a total purchase consideration of $92 million.
  • The inventory was $150.2 million, up from $116.6 million in the previous quarter, suggesting strong future growth expectations.  

Conclusion: 

All around, Credo offered an earnings report that helps confirm the #1 leading trend in my Q4 Top 15 AI Stocks report, which was AI networking, is fully in play. Nvidia’s 162% growth in the networking segment was a nice clue, as well, that Credo would deliver tonight. I spoke about that here with Charles Payne.  

It’s a good feeling when you work hard at identifying a thesis and it plays out. The beat this quarter and the strong guide next quarter suggests we are on the right track. However, AI networking will challenge even the most detailed analysts as it’s rapidly evolving, with new suppliers being qualified and new standards emerging in close succession. This is the best part of tech investing — finding the disruptors, and Credo clearly demonstrated tonight that they are one of them.

Equity Analyst Royston Roche contributed to this analysis.

Please note: The I/O Fund conducts research and draws conclusions for the Fund’s positions. We then share that information with our readers. This is not a guarantee of a stock’s performance. Please consult your personal financial advisor before buying any stock in the companies mentioned in this analysis. Beth Kindig and the I/O Fund own shares in “CRDO” at the time of writing and may own stocks pictured in the charts.

Recommended Reading:
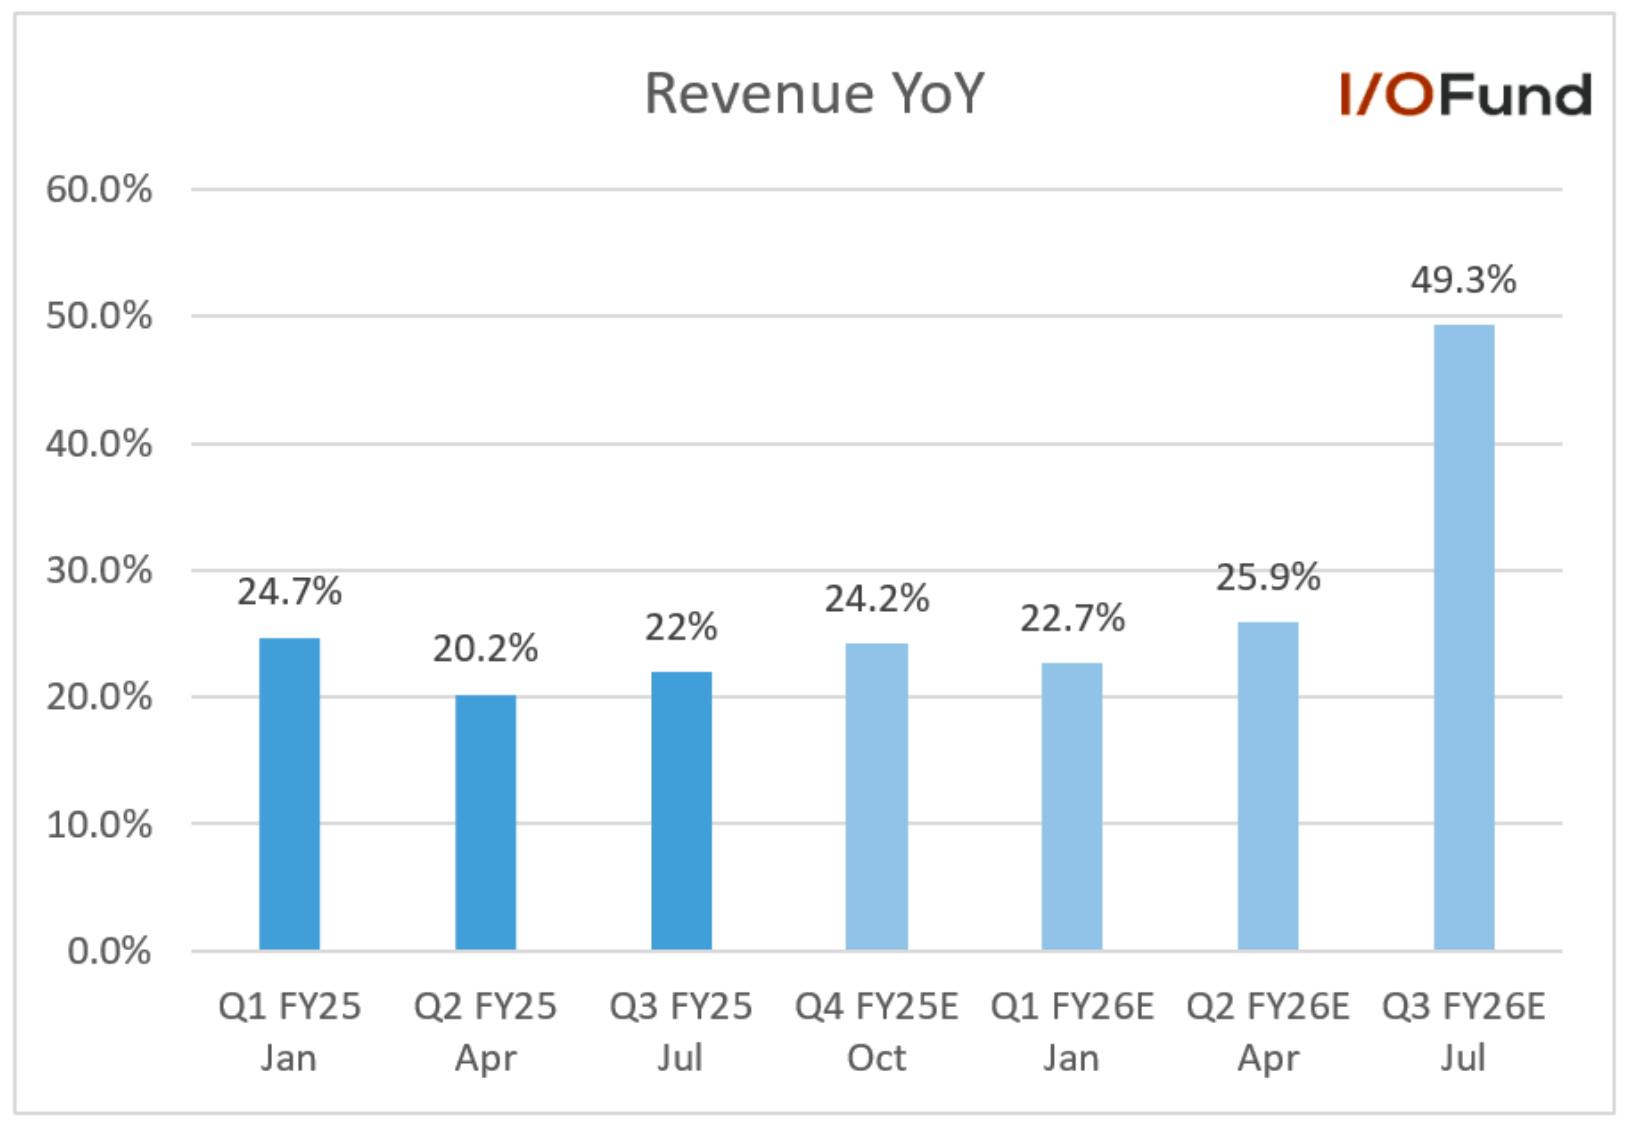
Cloudflare: Revenue Accelerates to >30%, Key Metrics Strengthen

Cloudflare’s fundamental profile strengthened in Q3 with the company reporting its fastest revenue growth rate in seven quarters, returning to >30% YoY territory, while a majority of key metrics all accelerated in unison.  

Outside of the financials, Cloudflare remains very well positioned for AI inference, though inference does not yet contribute meaningfully to revenue. Discussion on GPU utilization rates was fruitful and highlighted how Cloudflare can remain in near lock-step with demand while avoiding capacity constraints and with relatively low capex.  

Management also believes that versus the hyperscalers, they have a strong TCO advantage when it comes to inference, and in the future, the network will be one of the best places to run inference requests. Cloudflare also shed more light on Act 4, its Pay Per Crawl feature, which will enable creators to be monetized for AI data scraping, and while it is quite early, it is aiming to solve a quickly emerging pain point. 

Material Evidence of Revenue Reacceleration, Driven by US and Enterprise Clients 

Cloudflare reported its largest beat since Q1 2022, reporting revenue of $562.0 million in Q3, 3.1% ahead of estimates as growth accelerated nearly three points to 30.7%. On a QoQ basis, revenue accelerated to 9.7% from 6.9% last quarter. 

The US is emerging as a primary driver for this reacceleration, with growth rebounding 10 points sequentially, from 21.7% YoY in Q2 to 31.5% YoY in Q3. US revenue jumped 12.2% QoQ versus a 7.2% QoQ increase in Q2. 

Additionally, Cloudflare’s enterprise cohort, or customers contributing >$100K ARR (and likely primarily US-based) are another key factor behind the reacceleration. >$100K ARR customers drove 73% of revenue in Q3, or ~$410 million, rising 42% YoY and 13% QoQ. This was a sharp 12 point acceleration in YoY growth from 30% in Q1, to the fastest growth since Q1 2023, while QoQ growth was the highest since Q2 2022 at 13%.  

Q3 also marked Cloudflare’s first >30% growth quarter in the past five and its fastest revenue growth in the last seven quarters. This is the first step in confirming a sustained revenue acceleration, yet the more important piece is showing that >30% growth can actually be sustained for multiple quarters.  

For Q4, Cloudflare guided for revenue of $588.5 to $589.5 million, a slight deceleration to 28% on the topline. This was ahead of estimates for $580.8 million. Interestingly, consensus estimates, just one day following earnings, moved from $589 million to $617 million, suggesting analysts are increasingly optimistic on the company’s ability to sustain this revenue acceleration, supported by strong key metrics. 

For FY25, Cloudflare boosted its revenue guidance to $2.142 to $2.143 billion, a $28 million increase from its prior guide. This points to YoY growth of 28.3%, a slight deceleration from 28.8% growth in FY24.  

Key Metrics Strengthen, Aided by Enterprise Transition 

Despite a lack of meaningful AI contribution, other key metrics strengthened significantly in Q3 and support this material reacceleration story. Cloudflare cited its shift from a product-led, SMB-focused company to an enterprise sales company as a primary driver behind the improvement in key metrics.  

There are a few reasons that this focus on enterprise clientele is important for Cloudflare’s growth story, with the simplest being that visible acceleration of enterprise customer revenue in Q3 translated to the material topline reacceleration. Enterprise customers are also likely to expand much quicker than SMBs – for example, Cloudflare noted that accelerating QoQ and YoY growth in its >$1M and >$5M customer cohorts acted as a significant tailwind to DBNRR, which rose five points sequentially to 119%, the highest since Q4 2022.  

This DBNRR expansion is also linked to Cloudflare’s Pool of Funds billing approach, which provides a seamless vector for large customers to explore adoption of Cloudflare’s 55 products under a single contract, and allocate funds to different products based on consumption. While management explained that the rollout initially created some downward pressure on DBNRR, consumption of these deals acted as a tailwind to DBNRR this quarter. CFO Thomas Seifert added that POF is “now low double-digits of ACV” and gaining share in the quarter.  

Enterprise traction is also showing up in RPO, which accelerated four points to 43% YoY to $2.14 billion; on the other hand, current RPO decelerated three points to 30% YoY and accounted for 64% of RPO. 

Management explained that this RPO acceleration “points to primarily 2 drivers, the customer quality and the platform expansion. We are seeing exceptional strength with our large customer cohorts, specifically those that spend more than $1 million or $5 million with us, both delivered record growth this quarter. And in addition to that strength is increased consumption of our large Pool of Fund customers, demonstrating I think, the increasing strategic importance of our platform for those large enterprises globally. And in addition to that, our Workers platform, the developer platform, including Workers AI, is just providing to be a significant new vector for long-term commitment and with that growth.” 

Moving forward, it will be important to see consistent strength in both DBNRR and RPO as further evidence that Cloudflare’s large customers can continue to support >30% revenue growth.  

Bringing GPU Utilization up to 70-80% 

GPU utilization can easily be overlooked, but arguably it is one of the most important discussions for Cloudflare, as its value proposition is inherently tied to executing workloads for customers quickly, efficiently, and with a strong TCO advantage.  

Management provided a more extensive discussion on utilization than they have in recent quarters, hinting that they can potentially improve utilization rates further and quickly bring more capacity online to meet demand without becoming capacity constrained.  

From our free newsletter in February 2025 recapping Q4 results, Encouraging Growth in Key Metrics Drives 60% Gain YTD for Cloudflare Stock, we pointed out that Cloudflare was seeing peak GPU utilization around 70% with room to improve through the year. Now, in October, CEO Matthew Prince slightly raised this, saying that they are leaning heavily on their experience of running CPUs at 70-80% utilization and aiming to have GPUs match that level. This ties in to Cloudflare’s architectural differences compared to the hyperscalers, with Cloudflare’s main goal being improving utilization to serve more workload requests and the hyperscalers’ goal of making as much money from renting GPUs: 

“The other thing that I think is unique about us is that certainly versus the hyperscalers, the primary business of the hyperscaler is to essentially rent you a server or a fraction of a server, and they try to effectively get whatever they pay for the server back 5x over the life of the server. That's their business. Whereas we're about, again, getting work done for our customers. We're selling something different, which is a sort of level of abstraction up from that. What that means is that we believe it's our job, not our customers' job to make the utilization rates as high as possible, make our systems as efficient as possible. 

And so it's been remarkable to see over the last 15 years, how our team has been able to squeeze as much as possible out of the CPU capacity that we have, where we can run that CPU capacity at 70% to 80% utilization and get more out of every CapEx dollar we spend. But what's fascinating is we're sort of speed running the last 15 years now with GPUs, where we're figuring out how to make GPUs multi-tenant, how to make them load and unload models more quickly and driving the utilization of GPUs up substantially. And so that is still well below what we have with CPUs, but we see no reason that we can't get GPUs also up to that 70%, 80% utilization.” 

Continuing to bring peak utilization rates higher and improving troughs should theoretically lead to faster processing times and an ability to handle more requests for customers, all while doing so for cheaper and at a higher margin.  

A core advantage Cloudflare has is its serverless architecture spanning >13,000 networks globally with 449 Tbps of network capacity (up from 348 Tbps in January), letting the company shift workloads anywhere in the world where it has excess capacity. Prince says that while it is not always ideal, Cloudflare can move its smaller, free or low-end customers “to places across the network that have that free capacity, still give them a great performance. but then reserve the capacity that we have as close as possible to our largest customers.”  

More importantly, Cloudflare does not believe it is capacity constrained akin to the hyperscalers, as again the company can shift workloads to wherever necessary and minimize or eliminate pain points where excess demand stalls one network point. Management also said that because they use off-the-shelf equipment with no customization, their “reaction time to deploy hardware where we need it is really, really fast,” letting them quickly stand up new networks whenever needed and quickly convert this to revenue.  

Leveraging an Inference Advantage 

Cloudflare’s network architecture and positioning at the edge gives it a strong advantage to offer high-performance, low-cost inference, yet the company continues to harp on the fact that inference remains de minimis to overall revenue – i.e., the growth curve of inference has not yet been felt in results. Cloudflare clarified that no inference customer is larger than 2% of revenue, while leading AI firms primarily tap Cloudflare for security rather than inference products at the moment.  

While competition for inference workloads from the hyperscalers remains high, Cloudflare believes its key advantage lies in its TCO from handling workload optimization:  

“It continues to be the model of do you want to do this work yourself and have to optimize yourself, or do you want to hand it off to Cloudflare. And I think in the cases where we're in the conversation, we're able to show that there's just a much better TCO, total cost of ownership, a much lower cost, much better performance when we manage that for you.” 

CEO Matthew Prince also added that once customers test the platform and witness the TCO and optimization advantages, the platform becomes very sticky and can land those customers for the long-term. To this point, Cloudflare is continuing to bolster its platform for optimization, recently acquiring Replicate to integrate its expertise with containerized model building on a 50,000+ model catalog to facilitate AI deployments. 

While it still may be early for inference, as more use cases pop up, Cloudflare is well positioned to capture inference-driven workloads. Again, this ties back into its network architecture, high utilization and proximity to users with ultra-low latency. 

For example, management explained that “when you have human computer interaction, especially with something that seems almost alive when you're interacting with it, every millisecond counts, because it breaks that illusion if things slow down, especially as you get to things like voice communication and other things that need to have kind of a natural rhythm to them.” Management believes that while a lot of inference will run on handsets or in driverless vehicles, the next best place to run inference that can’t be run in those locations will be in the network, providing a structural tailwind to drive new workload wins.  

Although it may be later in the future before some of these inference vectors and use cases materialize in full swing, and meaningfully contribute to Cloudflare’s revenue, the company can leverage this network advantage to remain a key enabler of the AI inference era.  

Cloudflare to be Natively Available on Oracle Cloud 

In mid-October, Cloudflare announced a partnership with Oracle’s Oracle Cloud Infrastructure (OCI) platform, making Cloudflare’s services natively available to OCI customers in hybrid, multi-cloud and OCI hosted environments.  

Cloudflare says this gives it access to Oracle’s large pool of customers, and more importantly, an outlet to tap into OCI’s rapid growth runway through 2030. For example, Oracle is projecting a rapid 75% CAGR in OCI revenue, from $10 billion in FY25 to $166 billion by FY30, though OpenAI is projected to account for a majority of this, around $120 billion in FY30. Multi-cloud database revenue was a strong point for Oracle in fiscal Q1, rising 1,529% YoY, and Oracle is also projecting 8X growth in AI-powered database and AI platform revenue by 2030 to $20 billion.  

However, the more important piece was management stating that both companies are aligned on a multi-cloud future, which requires ‘one consistent interface where they can apply security rules, have consistent network performance,” with Cloudflare the provider of choice. 

A multi-cloud future could be a game-changer for both companies, with Oracle benefitting from incremental cloud workloads anchored by its extensive database integrations across AWS, Azure and GCP. In turn, Cloudflare benefits from its positioning as a ‘control plane’ offering unified security, performance and reliability across clouds, which will be likely increasingly important as AI proliferates. This positioning is anchored by Cloudflare’s R2 eliminating cross-cloud data sharing costs, thus addressing some of the main drawbacks of adopting a multi-cloud approach.  

More on Act 4: Pay Per Crawl 

Cloudflare discussed its new product, Pay Per Crawl, in more detail this quarter, aiming to solve an emerging pain point arising from growing LLM consumption – AI crawlers freely scraping websites for data. Reddit is a great example of this, as the site is a treasure trove of human-generated content perfect for improving AI models, yet it has seen AI companies scrape its site without consent.  

For example, Cloudflare noted that a global web infrastructure platform signed a $1.2 million, 14-month contract for AI Crawl Control and Bot Management as they experienced a “massive surge in AI scrapers and malicious bots hitting their origin servers, inflating costs without revenue conversion and obscuring visibility into legitimate traffic.” Cloudflare noted it was “already exploring a much larger opportunity with this customer for Pay Per Crawl.” 

Pay Per Crawl aims to put creators and publishers in control of who can access their content utilizing HTTP source codes. The feature will give creators three distinct options on regulating AI crawlers and unlock new monetization abilities: 1) allow full, free access to content, 2) block access entirely, or 3) require payment for crawling at a flat, per-request price.  

Under the new feature, if a publisher decides to charge for crawling, they still retain the choice to let certain crawlers access the site for free, and can still negotiate other content-accessing deals separate from Pay Per Crawl. With the new service, Cloudflare’s relationship with customers strengthens significantly, as it is no longer simply an infrastructure vendor but now a revenue generator. 

It is still extremely early for Act 4, but given the vast amount of data generated daily on the internet and the need for AI models to constantly crawl to retrieve up-to-date information, this holds potential to be quite an impactful product. 

Financials 

$3 Billion Revenue Run Rate by Q4 ’26, $5 Billion by Q4 ‘28 

Cloudflare provided some insights into its near-term and medium-term revenue targets, with management expecting to reach a $3 billion annualized run rate in Q4 2026, and scale to a $5 billion run rate by Q4 2028.  

At first glance, the $3 billion run rate forecast is not especially impressive, as it implies quarterly revenue of $750 million at the end of next year, whereas analyst estimates were $729 million prior to Q3’s report. This is just a 3% raise to consensus, and essentially signals that management is highly confident in maintaining a 27-28% YoY growth rate through the end of 2026.  

To reach the $5 billion annualized target, or quarterly revenue of $1.25 billion by Q4 2028, Cloudflare would need to maintain this 28% YoY trajectory for the next three years, at a minimum. This is slightly higher than consensus through fiscal 2027 for 26% growth, while exceeding this to ~30% could see revenue reach more than $1.3 billion. 

Other Key Metrics Strengthen 

Billings growth accelerated sharply, from 33% in Q2 to 40% in Q3, rising to $624.4 million. Cloudflare said close rates had notably ticked up both YoY and QoQ in Q3 and bookings from partner-initiated opportunities doubled YoY. 

Paying customer growth accelerated six points sequentially to 33% YoY, impressive at this scale considering paying customers now total 295,552. Growth was 10% QoQ, the highest on record since at least 2022. Cloudflare said the growth here was in part driven by customers graduating from free tier to small paid accounts during its AI Week and Birthday Week promotions. 

Making Progress on Margins

Cloudflare made some progress on GAAP margins and nearly broke to positive territory on the bottom line on a GAAP basis; however, gross margins continued to contract.  

GAAP gross margin was 74.0% in Q3, down 3.7 points YoY and 0.9 points QoQ. Adjusted gross margin was 75.3%, down 3.5 points YoY and 1 point QoQ, again impacted by increases in allocated costs from higher network traffic from paying customers.  

GAAP operating margin was (6.7%), up 0.5 points YoY and 6.4 points QoQ. Adjusted operating margin was 15.3%, up 0.5 points YoY and 1.2 points QoQ; for Q4, adjusted operating margin was guided to be 14%. Driving both a YoY and QoQ expansion on operating margin while gross margin contracts shows strong cost management while driving this revenue reacceleration, with opex up 24% YoY.  

GAAP net margin was (0.2%), up 3.4 points YoY and 9.6 points QoQ. Adjusted net margin was 18.3%, up 1.4 points YoY and 3.6 points QoQ.  

Earnings 

Cloudflare reported a solid adjusted EPS beat in Q3, reporting 35% YoY growth to $0.27 versus the $0.23 estimate. GAAP EPS was on the brink of shifting to positive territory at ($0.00), versus the ($0.07) estimate. 

For Q4, Cloudflare guided for adjusted EPS to be flat QoQ at $0.27, up 42% YoY. For fiscal 2025, Cloudflare raised its adjusted EPS forecast to $0.91, up from $0.85 to $0.86 previously. However, GAAP profitability is not expected on an annual basis until 2027. 

Cash Flow Margins Strengthen 

Cash flow margins strengthened in Q3, with operating cash flow margin up 11 points sequentially. 

Operating cash flow was $167.1 million for a 30% margin, up from a 24% margin in the year ago quarter and a 19% margin in Q2. Free cash flow was $75 million for a 13% margin, up from 11% in the year ago quarter and 6% in Q2. Network capex was 14% of revenue. 

Cash, equivalents and available-for-sale securities totaled $4.04 billion, while convertible notes outstanding totaled $3.26 billion.  

Valuation 

Cloudflare is second to only Palantir when it comes to elevated multiples in large-cap AI-exposed software, trading at 30.7x forward sales, more than 50% above its five-year average of 20x. Shares have pulled back quite sharply from nearly 42x forward sales at the end of October, its highest level since early 2022. 

On the bottom line, Cloudflare is not yet GAAP profitable, but on an adjusted basis, it trades at 205x forward EPS, above its 147x average but below its 278x peak.  

Cloudflare’s valuation presents the largest risk as the company is trading at the highest multiples in 3.5 years, with only one strong quarter under its belt to help confirm its AI-aided revenue reacceleration story. While key metrics are strong, the company still must prove that it can sustain >30% revenue growth through FY26 or the valuation may need to come to terms with a return to mid to high-20% growth.  

Conclusion 

There is a quiet strength in Cloudflare’s fundamentals and key metrics, and this became more evident in Q3, with revenue reaccelerating to nearly 31% YoY, its highest growth in seven quarters. Paying customer growth accelerated six points sequentially to 33%, DBNRR increased five points sequentially to 119%, and billings growth accelerated seven points sequentially to 40%. Cloudflare added a record number of >$1M and >$5M customers for a fourth consecutive quarter, with accelerating spending from these cohorts noted as a strong driver of the DBNRR expansion in the third quarter.

Damien Robbins, Equity Analyst at I/O Fund contributed to this analysis.

Take advantage of the I/O Fund’s largest sale of the year with up to $250 off Advanced Market Signals, which offers Knox’s weekly webinars, real-time trade alerts, and in-depth analysis on the most powerful tech trends. Learn more here.Learn more here.

Please note: The I/O Fund conducts research and draws conclusions for the Fund’s positions. We then share that information with our readers. This is not a guarantee of a stock’s performance. Please consult your personal financial advisor before buying any stock in the companies mentioned in this analysis.

Recommended Reading:
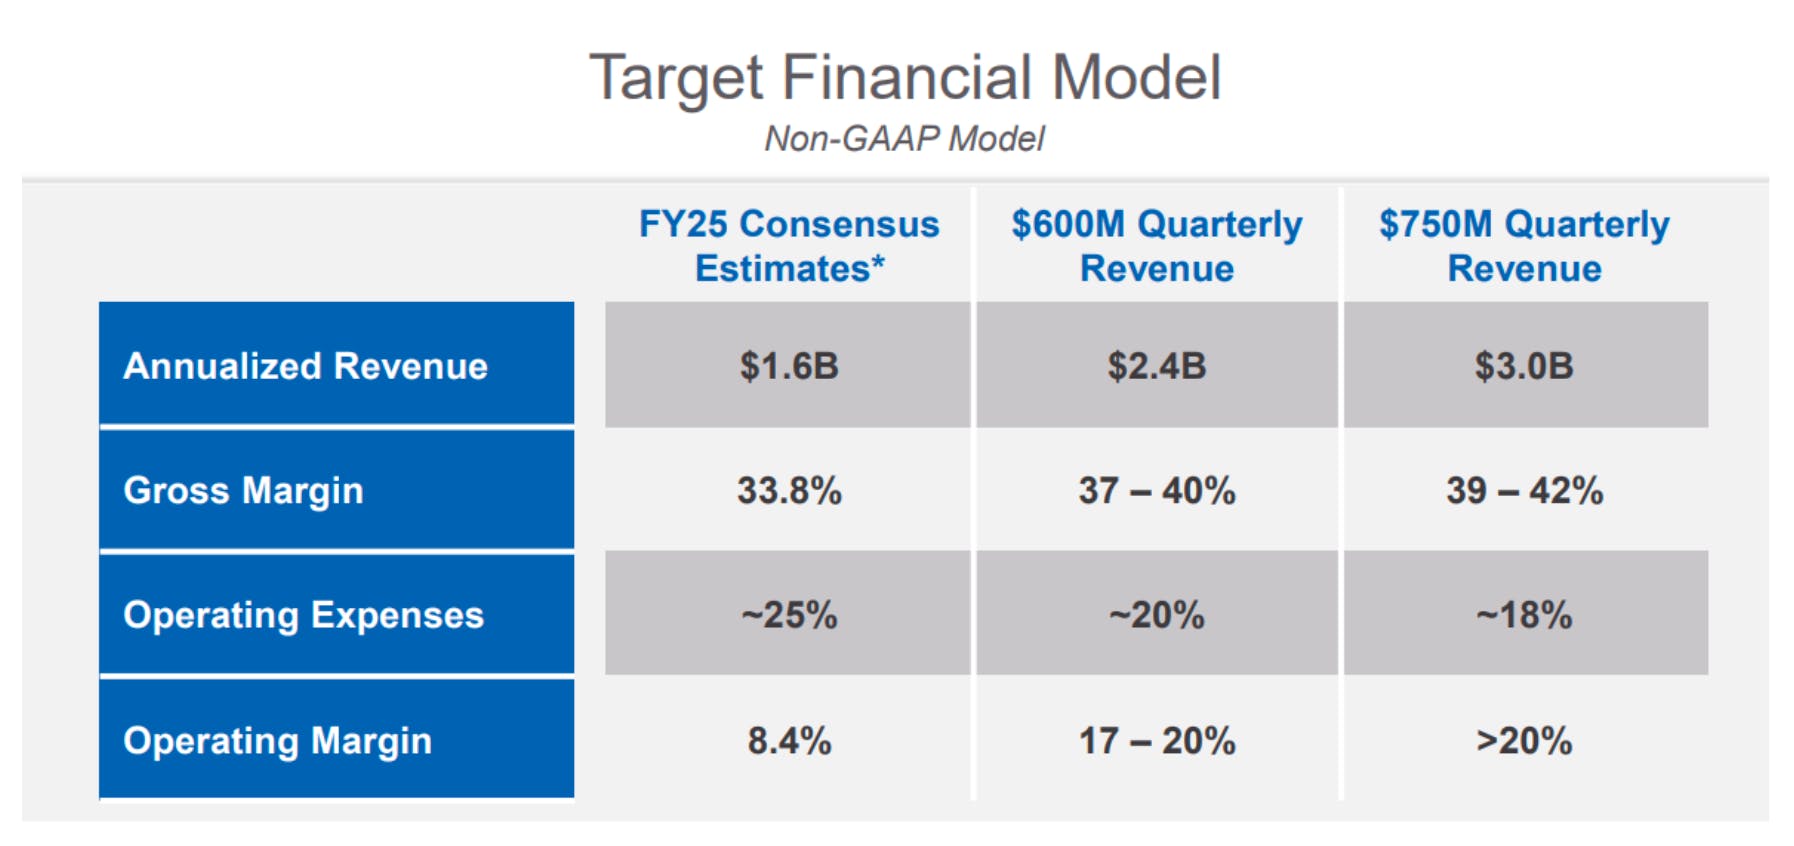
Cloudflare: Revenue Accelerates to >30%, Key Metrics Strengthen
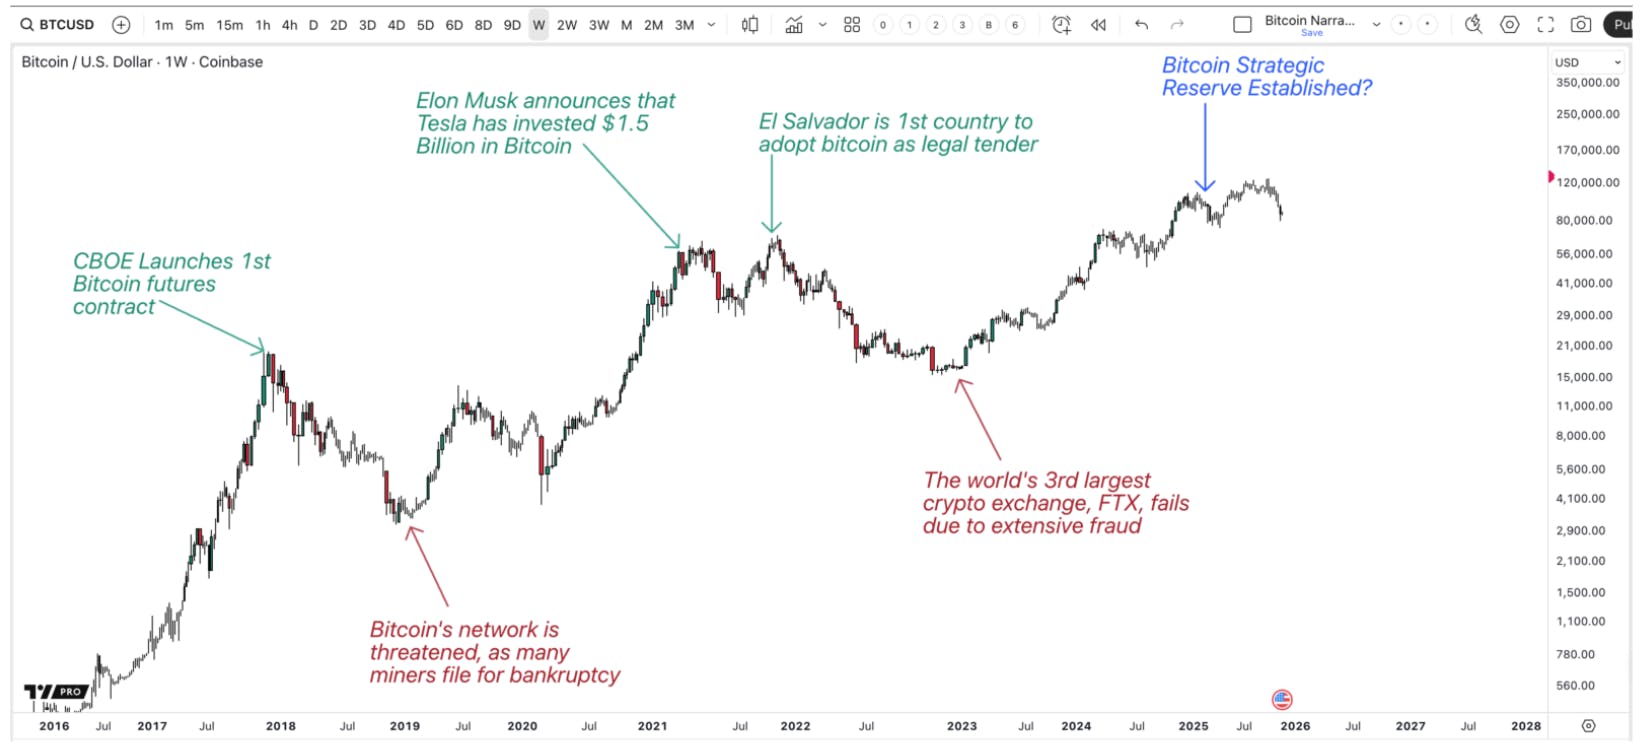
Cloudflare’s fundamental profile strengthened in Q3 with the company reporting its fastest revenue growth rate in seven quarters, returning to >30% YoY territory, while a majority of key metrics all accelerated in unison.  

Outside of the financials, Cloudflare remains very well positioned for AI inference, though inference does not yet contribute meaningfully to revenue. Discussion on GPU utilization rates was fruitful and highlighted how Cloudflare can remain in near lock-step with demand while avoiding capacity constraints and with relatively low capex.  

Management also believes that versus the hyperscalers, they have a strong TCO advantage when it comes to inference, and in the future, the network will be one of the best places to run inference requests. Cloudflare also shed more light on Act 4, its Pay Per Crawl feature, which will enable creators to be monetized for AI data scraping, and while it is quite early, it is aiming to solve a quickly emerging pain point. 

Material Evidence of Revenue Reacceleration, Driven by US and Enterprise Clients 

Cloudflare reported its largest beat since Q1 2022, reporting revenue of $562.0 million in Q3, 3.1% ahead of estimates as growth accelerated nearly three points to 30.7%. On a QoQ basis, revenue accelerated to 9.7% from 6.9% last quarter. 

The US is emerging as a primary driver for this reacceleration, with growth rebounding 10 points sequentially, from 21.7% YoY in Q2 to 31.5% YoY in Q3. US revenue jumped 12.2% QoQ versus a 7.2% QoQ increase in Q2. 

Additionally, Cloudflare’s enterprise cohort, or customers contributing >$100K ARR (and likely primarily US-based) are another key factor behind the reacceleration. >$100K ARR customers drove 73% of revenue in Q3, or ~$410 million, rising 42% YoY and 13% QoQ. This was a sharp 12 point acceleration in YoY growth from 30% in Q1, to the fastest growth since Q1 2023, while QoQ growth was the highest since Q2 2022 at 13%.  

Q3 also marked Cloudflare’s first >30% growth quarter in the past five and its fastest revenue growth in the last seven quarters. This is the first step in confirming a sustained revenue acceleration, yet the more important piece is showing that >30% growth can actually be sustained for multiple quarters.  

For Q4, Cloudflare guided for revenue of $588.5 to $589.5 million, a slight deceleration to 28% on the topline. This was ahead of estimates for $580.8 million. Interestingly, consensus estimates, just one day following earnings, moved from $589 million to $617 million, suggesting analysts are increasingly optimistic on the company’s ability to sustain this revenue acceleration, supported by strong key metrics. 

For FY25, Cloudflare boosted its revenue guidance to $2.142 to $2.143 billion, a $28 million increase from its prior guide. This points to YoY growth of 28.3%, a slight deceleration from 28.8% growth in FY24.  

Key Metrics Strengthen, Aided by Enterprise Transition 

Despite a lack of meaningful AI contribution, other key metrics strengthened significantly in Q3 and support this material reacceleration story. Cloudflare cited its shift from a product-led, SMB-focused company to an enterprise sales company as a primary driver behind the improvement in key metrics.  

There are a few reasons that this focus on enterprise clientele is important for Cloudflare’s growth story, with the simplest being that visible acceleration of enterprise customer revenue in Q3 translated to the material topline reacceleration. Enterprise customers are also likely to expand much quicker than SMBs – for example, Cloudflare noted that accelerating QoQ and YoY growth in its >$1M and >$5M customer cohorts acted as a significant tailwind to DBNRR, which rose five points sequentially to 119%, the highest since Q4 2022.  

This DBNRR expansion is also linked to Cloudflare’s Pool of Funds billing approach, which provides a seamless vector for large customers to explore adoption of Cloudflare’s 55 products under a single contract, and allocate funds to different products based on consumption. While management explained that the rollout initially created some downward pressure on DBNRR, consumption of these deals acted as a tailwind to DBNRR this quarter. CFO Thomas Seifert added that POF is “now low double-digits of ACV” and gaining share in the quarter.  

Enterprise traction is also showing up in RPO, which accelerated four points to 43% YoY to $2.14 billion; on the other hand, current RPO decelerated three points to 30% YoY and accounted for 64% of RPO. 

Management explained that this RPO acceleration “points to primarily 2 drivers, the customer quality and the platform expansion. We are seeing exceptional strength with our large customer cohorts, specifically those that spend more than $1 million or $5 million with us, both delivered record growth this quarter. And in addition to that strength is increased consumption of our large Pool of Fund customers, demonstrating I think, the increasing strategic importance of our platform for those large enterprises globally. And in addition to that, our Workers platform, the developer platform, including Workers AI, is just providing to be a significant new vector for long-term commitment and with that growth.” 

Moving forward, it will be important to see consistent strength in both DBNRR and RPO as further evidence that Cloudflare’s large customers can continue to support >30% revenue growth.  

Bringing GPU Utilization up to 70-80% 

GPU utilization can easily be overlooked, but arguably it is one of the most important discussions for Cloudflare, as its value proposition is inherently tied to executing workloads for customers quickly, efficiently, and with a strong TCO advantage.  

Management provided a more extensive discussion on utilization than they have in recent quarters, hinting that they can potentially improve utilization rates further and quickly bring more capacity online to meet demand without becoming capacity constrained.  

From our free newsletter in February 2025 recapping Q4 results, Encouraging Growth in Key Metrics Drives 60% Gain YTD for Cloudflare Stock, we pointed out that Cloudflare was seeing peak GPU utilization around 70% with room to improve through the year. Now, in October, CEO Matthew Prince slightly raised this, saying that they are leaning heavily on their experience of running CPUs at 70-80% utilization and aiming to have GPUs match that level. This ties in to Cloudflare’s architectural differences compared to the hyperscalers, with Cloudflare’s main goal being improving utilization to serve more workload requests and the hyperscalers’ goal of making as much money from renting GPUs: 

“The other thing that I think is unique about us is that certainly versus the hyperscalers, the primary business of the hyperscaler is to essentially rent you a server or a fraction of a server, and they try to effectively get whatever they pay for the server back 5x over the life of the server. That's their business. Whereas we're about, again, getting work done for our customers. We're selling something different, which is a sort of level of abstraction up from that. What that means is that we believe it's our job, not our customers' job to make the utilization rates as high as possible, make our systems as efficient as possible. 

And so it's been remarkable to see over the last 15 years, how our team has been able to squeeze as much as possible out of the CPU capacity that we have, where we can run that CPU capacity at 70% to 80% utilization and get more out of every CapEx dollar we spend. But what's fascinating is we're sort of speed running the last 15 years now with GPUs, where we're figuring out how to make GPUs multi-tenant, how to make them load and unload models more quickly and driving the utilization of GPUs up substantially. And so that is still well below what we have with CPUs, but we see no reason that we can't get GPUs also up to that 70%, 80% utilization.” 

Continuing to bring peak utilization rates higher and improving troughs should theoretically lead to faster processing times and an ability to handle more requests for customers, all while doing so for cheaper and at a higher margin.  

A core advantage Cloudflare has is its serverless architecture spanning >13,000 networks globally with 449 Tbps of network capacity (up from 348 Tbps in January), letting the company shift workloads anywhere in the world where it has excess capacity. Prince says that while it is not always ideal, Cloudflare can move its smaller, free or low-end customers “to places across the network that have that free capacity, still give them a great performance. but then reserve the capacity that we have as close as possible to our largest customers.”  

More importantly, Cloudflare does not believe it is capacity constrained akin to the hyperscalers, as again the company can shift workloads to wherever necessary and minimize or eliminate pain points where excess demand stalls one network point. Management also said that because they use off-the-shelf equipment with no customization, their “reaction time to deploy hardware where we need it is really, really fast,” letting them quickly stand up new networks whenever needed and quickly convert this to revenue.  

Leveraging an Inference Advantage 

Cloudflare’s network architecture and positioning at the edge gives it a strong advantage to offer high-performance, low-cost inference, yet the company continues to harp on the fact that inference remains de minimis to overall revenue – i.e., the growth curve of inference has not yet been felt in results. Cloudflare clarified that no inference customer is larger than 2% of revenue, while leading AI firms primarily tap Cloudflare for security rather than inference products at the moment.  

While competition for inference workloads from the hyperscalers remains high, Cloudflare believes its key advantage lies in its TCO from handling workload optimization:  

“It continues to be the model of do you want to do this work yourself and have to optimize yourself, or do you want to hand it off to Cloudflare. And I think in the cases where we're in the conversation, we're able to show that there's just a much better TCO, total cost of ownership, a much lower cost, much better performance when we manage that for you.” 

CEO Matthew Prince also added that once customers test the platform and witness the TCO and optimization advantages, the platform becomes very sticky and can land those customers for the long-term. To this point, Cloudflare is continuing to bolster its platform for optimization, recently acquiring Replicate to integrate its expertise with containerized model building on a 50,000+ model catalog to facilitate AI deployments. 

While it still may be early for inference, as more use cases pop up, Cloudflare is well positioned to capture inference-driven workloads. Again, this ties back into its network architecture, high utilization and proximity to users with ultra-low latency. 

For example, management explained that “when you have human computer interaction, especially with something that seems almost alive when you're interacting with it, every millisecond counts, because it breaks that illusion if things slow down, especially as you get to things like voice communication and other things that need to have kind of a natural rhythm to them.” Management believes that while a lot of inference will run on handsets or in driverless vehicles, the next best place to run inference that can’t be run in those locations will be in the network, providing a structural tailwind to drive new workload wins.  

Although it may be later in the future before some of these inference vectors and use cases materialize in full swing, and meaningfully contribute to Cloudflare’s revenue, the company can leverage this network advantage to remain a key enabler of the AI inference era.  

Cloudflare to be Natively Available on Oracle Cloud 

In mid-October, Cloudflare announced a partnership with Oracle’s Oracle Cloud Infrastructure (OCI) platform, making Cloudflare’s services natively available to OCI customers in hybrid, multi-cloud and OCI hosted environments.  

Cloudflare says this gives it access to Oracle’s large pool of customers, and more importantly, an outlet to tap into OCI’s rapid growth runway through 2030. For example, Oracle is projecting a rapid 75% CAGR in OCI revenue, from $10 billion in FY25 to $166 billion by FY30, though OpenAI is projected to account for a majority of this, around $120 billion in FY30. Multi-cloud database revenue was a strong point for Oracle in fiscal Q1, rising 1,529% YoY, and Oracle is also projecting 8X growth in AI-powered database and AI platform revenue by 2030 to $20 billion.  

However, the more important piece was management stating that both companies are aligned on a multi-cloud future, which requires ‘one consistent interface where they can apply security rules, have consistent network performance,” with Cloudflare the provider of choice. 

A multi-cloud future could be a game-changer for both companies, with Oracle benefitting from incremental cloud workloads anchored by its extensive database integrations across AWS, Azure and GCP. In turn, Cloudflare benefits from its positioning as a ‘control plane’ offering unified security, performance and reliability across clouds, which will be likely increasingly important as AI proliferates. This positioning is anchored by Cloudflare’s R2 eliminating cross-cloud data sharing costs, thus addressing some of the main drawbacks of adopting a multi-cloud approach.  

More on Act 4: Pay Per Crawl 

Cloudflare discussed its new product, Pay Per Crawl, in more detail this quarter, aiming to solve an emerging pain point arising from growing LLM consumption – AI crawlers freely scraping websites for data. Reddit is a great example of this, as the site is a treasure trove of human-generated content perfect for improving AI models, yet it has seen AI companies scrape its site without consent.  

For example, Cloudflare noted that a global web infrastructure platform signed a $1.2 million, 14-month contract for AI Crawl Control and Bot Management as they experienced a “massive surge in AI scrapers and malicious bots hitting their origin servers, inflating costs without revenue conversion and obscuring visibility into legitimate traffic.” Cloudflare noted it was “already exploring a much larger opportunity with this customer for Pay Per Crawl.” 

Pay Per Crawl aims to put creators and publishers in control of who can access their content utilizing HTTP source codes. The feature will give creators three distinct options on regulating AI crawlers and unlock new monetization abilities: 1) allow full, free access to content, 2) block access entirely, or 3) require payment for crawling at a flat, per-request price.  

Under the new feature, if a publisher decides to charge for crawling, they still retain the choice to let certain crawlers access the site for free, and can still negotiate other content-accessing deals separate from Pay Per Crawl. With the new service, Cloudflare’s relationship with customers strengthens significantly, as it is no longer simply an infrastructure vendor but now a revenue generator. 

It is still extremely early for Act 4, but given the vast amount of data generated daily on the internet and the need for AI models to constantly crawl to retrieve up-to-date information, this holds potential to be quite an impactful product. 

Financials 

$3 Billion Revenue Run Rate by Q4 ’26, $5 Billion by Q4 ‘28 

Cloudflare provided some insights into its near-term and medium-term revenue targets, with management expecting to reach a $3 billion annualized run rate in Q4 2026, and scale to a $5 billion run rate by Q4 2028.  

At first glance, the $3 billion run rate forecast is not especially impressive, as it implies quarterly revenue of $750 million at the end of next year, whereas analyst estimates were $729 million prior to Q3’s report. This is just a 3% raise to consensus, and essentially signals that management is highly confident in maintaining a 27-28% YoY growth rate through the end of 2026.  

To reach the $5 billion annualized target, or quarterly revenue of $1.25 billion by Q4 2028, Cloudflare would need to maintain this 28% YoY trajectory for the next three years, at a minimum. This is slightly higher than consensus through fiscal 2027 for 26% growth, while exceeding this to ~30% could see revenue reach more than $1.3 billion. 

Other Key Metrics Strengthen 

Billings growth accelerated sharply, from 33% in Q2 to 40% in Q3, rising to $624.4 million. Cloudflare said close rates had notably ticked up both YoY and QoQ in Q3 and bookings from partner-initiated opportunities doubled YoY. 

Paying customer growth accelerated six points sequentially to 33% YoY, impressive at this scale considering paying customers now total 295,552. Growth was 10% QoQ, the highest on record since at least 2022. Cloudflare said the growth here was in part driven by customers graduating from free tier to small paid accounts during its AI Week and Birthday Week promotions. 

Making Progress on Margins

Cloudflare made some progress on GAAP margins and nearly broke to positive territory on the bottom line on a GAAP basis; however, gross margins continued to contract.  

GAAP gross margin was 74.0% in Q3, down 3.7 points YoY and 0.9 points QoQ. Adjusted gross margin was 75.3%, down 3.5 points YoY and 1 point QoQ, again impacted by increases in allocated costs from higher network traffic from paying customers.  

GAAP operating margin was (6.7%), up 0.5 points YoY and 6.4 points QoQ. Adjusted operating margin was 15.3%, up 0.5 points YoY and 1.2 points QoQ; for Q4, adjusted operating margin was guided to be 14%. Driving both a YoY and QoQ expansion on operating margin while gross margin contracts shows strong cost management while driving this revenue reacceleration, with opex up 24% YoY.  

GAAP net margin was (0.2%), up 3.4 points YoY and 9.6 points QoQ. Adjusted net margin was 18.3%, up 1.4 points YoY and 3.6 points QoQ.  

Earnings 

Cloudflare reported a solid adjusted EPS beat in Q3, reporting 35% YoY growth to $0.27 versus the $0.23 estimate. GAAP EPS was on the brink of shifting to positive territory at ($0.00), versus the ($0.07) estimate. 

For Q4, Cloudflare guided for adjusted EPS to be flat QoQ at $0.27, up 42% YoY. For fiscal 2025, Cloudflare raised its adjusted EPS forecast to $0.91, up from $0.85 to $0.86 previously. However, GAAP profitability is not expected on an annual basis until 2027. 

Cash Flow Margins Strengthen 

Cash flow margins strengthened in Q3, with operating cash flow margin up 11 points sequentially. 

Operating cash flow was $167.1 million for a 30% margin, up from a 24% margin in the year ago quarter and a 19% margin in Q2. Free cash flow was $75 million for a 13% margin, up from 11% in the year ago quarter and 6% in Q2. Network capex was 14% of revenue. 

Cash, equivalents and available-for-sale securities totaled $4.04 billion, while convertible notes outstanding totaled $3.26 billion.  

Valuation 

Cloudflare is second to only Palantir when it comes to elevated multiples in large-cap AI-exposed software, trading at 30.7x forward sales, more than 50% above its five-year average of 20x. Shares have pulled back quite sharply from nearly 42x forward sales at the end of October, its highest level since early 2022. 

On the bottom line, Cloudflare is not yet GAAP profitable, but on an adjusted basis, it trades at 205x forward EPS, above its 147x average but below its 278x peak.  

Cloudflare’s valuation presents the largest risk as the company is trading at the highest multiples in 3.5 years, with only one strong quarter under its belt to help confirm its AI-aided revenue reacceleration story. While key metrics are strong, the company still must prove that it can sustain >30% revenue growth through FY26 or the valuation may need to come to terms with a return to mid to high-20% growth.  

Conclusion 

There is a quiet strength in Cloudflare’s fundamentals and key metrics, and this became more evident in Q3, with revenue reaccelerating to nearly 31% YoY, its highest growth in seven quarters. Paying customer growth accelerated six points sequentially to 33%, DBNRR increased five points sequentially to 119%, and billings growth accelerated seven points sequentially to 40%. Cloudflare added a record number of >$1M and >$5M customers for a fourth consecutive quarter, with accelerating spending from these cohorts noted as a strong driver of the DBNRR expansion in the third quarter.

Damien Robbins, Equity Analyst at I/O Fund contributed to this analysis.

Please note: The I/O Fund conducts research and draws conclusions for the Fund’s positions. We then share that information with our readers. This is not a guarantee of a stock’s performance. Please consult your personal financial advisor before buying any stock in the companies mentioned in this analysis.

I/O Fund Called the Bitcoin Selloff: What Liquidity & DXY Data Predict Next

Within crypto, there are perma-bulls and perma-bears, but both are too emotional and dogmatic to consistently participate in Bitcoin’s epic swings. Bitcoin and crypto have consistently tested investors by doing the exact opposite of what the herd is expecting.  

Last August, my firm, the I/O Fund, offered a rare explanation of how Bitcoin is sensitive to investor sentiment patterns and global liquidity trends, thus predicting the asset could be topping in an article for our free newsletter readers entitled “Is Bitcoin’s Bull Run Nearing a Top? What the Herd Missed at $16,000 and is Missing Now” 

In that article, I stated …  

“…the system that helped us identify the $16,000 bottom in Bitcoin is telling a more complex story. Global liquidity appears to be stalling and setting up for a reversal. This is historically not good for Bitcoin and tends to coincide with major tops. This inflection point lines up with our Technical Analysis that has us in the final leg of the multi-year bull market.”  

This is the core differentiator of our approach: we analyze Bitcoin not as a belief system, not as ideology, not as emotion — but as an asset driven by sentiment patterns, that also operates within a global liquidity machine.  

Today, the buzz word is “liquidity” and how it’s draining from global markets, causing volatility in risk assets. This is not a surprise to our readers, as we have been discussing liquidity dynamics for months, as it is one of the few data-driven dynamics that can help predict Bitcoin’s swings. We even hosted a free webinar to the public in August alongside WealthUmbrella, explaining how these dynamics are threatening Bitcoin’s advance higher. 

Since our free webinar, Bitcoin has dropped ~37% and even broke one of our critical supports. We followed through with four sell alerts to our premium members as Bitcoin traded between $95,000 and $113,000, securing exceptional gains and reducing our Bitcoin exposure by 80%. We did something similar with altcoins. 

However, looking forward, we could see more volatility before Bitcoin resumes its leadership to all-time highs. If you hold Bitcoin or have large unrealized gains, this is a crucial moment. The technical picture has shifted, increasing overall risk, with a scenario where we head lower. Our analysis breaks down the exact support levels that must hold, the scenario for a final push to new highs, and the path that would confirm a deeper downturn. 

Global Liquidity and DXY: The Inverse Relationship Driving Bitcoin's Cycles 

Since the market peak in late October, “liquidity” has become a buzzword, casually invoked as though its meaning were universally understood. Instead, liquidity is one of the most overused – and least understood – terms in financial markets.

Liquidity refers to the availability of capital in the system—specifically, how easily businesses, consumers, and financial institutions can obtain cash or credit. But when it comes to actually positioning a portfolio through different liquidity regimes, how this impacts risk-on assets often gets lost in translation.

In modern markets, liquidity is inseparable from debt dynamics. It is not the creation of new debt that dominates capital flows, but the ability to roll over existing obligations. In fact, three out of every four global financial transactions are related to debt refinancing, not expansion. Moreover, nearly 80% of global lending now requires collateral, typically in the form of high-quality, low-volatility assets like U.S. Treasuries.

mid

This creates a framework where liquidity—and by extension, risk appetite—is dictated by how cheaply and easily borrowers can refinance without overextending their own balance sheets. The more capital that’s freed through this process, the more capital can rotate into risk-on assets such as Bitcoin.  

A few key variables influence a country’s liquidity conditions: 

  • Central bank policy 
  • Fiscal spending 
  • The Treasury General Account (TGA) 
  • Federal Reserve repo operations 
  • Broad equity market performance 
  • Bond market volatility 

Collectively, these forces determine whether capital and confidence flow into the system or are pulled out.  An internal calculation we have created at the I/O Fund, which incorporates all of these factors, can be seen below.  Domestic liquidity has broken through the 2022 low, driven predominantly by questionable FED policy, the Reverse Repo Operations at $0, and the Treasury General Account remaining elevated due to a shift in public financing policy.

Chart from I/O Fund showing U.S. domestic liquidity (WALCL) falling below critical 2022 lows, tracked via Reverse Repo, Treasury General Account (TGA) balance, and Federal Reserve balance sheet, indicating increased downside risk for equities and risk assets.

I/O Fund chart showing Domestic Liquidity (WALCL) levels falling below the critical 2022 lows, tracked via Reverse Repo, TGA Balance, and Fed’s balance sheet, signaling increased downside risk for risk assets and equities. 

Even with Domestic liquidity in free fall, there is one factor that is the most important when discussing this topic – U.S. Dollar.  

Roughly 64% of global debt is denominated in USD—which means foreign borrowers who accessed cheap U.S. capital must continue sourcing dollars to service that debt. When the dollar weakens relative to their local currencies, less local currency is needed to meet dollar obligations. This frees up capital that can chase higher-yielding risk assets, including Bitcoin. 

This inverse relationship between the U.S. Dollar Index (DXY) and Bitcoin has been both consistent and predictive across cycles:

I/O Fund chart comparing Bitcoin’s price to the U.S. Dollar Index (DXY), illustrating that major Bitcoin bull markets align with a declining dollar, while bear markets occur during a rising dollar.

I/O Fund chart comparing Bitcoin's price to the U.S. Dollar Index (DXY), demonstrating that every major Bitcoin bull market occurs during a declining dollar, and bear markets coincide with a rising dollar.  

In the above chart, three dynamics are evident: 

  • Every major Bitcoin bull market occurred during a declining dollar. 
  • Every significant Bitcoin bear market coincided with a rising dollar. 
  • The steepness of the dollar’s trend often defines the magnitude of Bitcoin’s move in the opposite direction. 

In August, we approached a critical inflection point. The Dollar Index had been in a clear downtrend since peaking in late September 2022—just weeks before Bitcoin bottomed. The most recent leg of this decline in the dollar shows a completed five-wave structure, typically the final phase of a correction before a reversal. Momentum is starting to shift upward, and a sustained break above $101 on the DXY would confirm a major low and the onset of a new dollar uptrend.  

However, if we analyze the technical pattern in DXY, as long as DXY stays below $101, there is a setup where it drops to new lows.  – likely targeting between $93 – $89.

I/O Fund technical analysis chart of the U.S. Dollar Index (DXY) showing a potential final 5th wave decline toward $93-$89, highlighting the critical $101 resistance level and using momentum indicators to forecast an imminent move lower, which could boost global liquidity and drive Bitcoin higher.

I/O Fund Technical Analysis of the U.S. Dollar Index (DXY) showing potential final 5th wave drop toward $93-$89. The chart highlights the critical $101 resistance level and uses momentum indicators to predict an imminent move lower, increasing global liquidity and likely pushing Bitcoin higher. 

Note how the current bounce is not a direct move higher. It is a messy, and overlapping push higher, which is characteristic of corrections within a larger trend – in this case, pointing lower. Furthermore, the momentum indicators point to a rare overbought condition, while also showing that momentum is fading the higher we go. This is what we see at the end of swings, suggesting a move lower is imminent.   

If DXY fails under $101, and the following drop is a more vertical and aggressive drop lower, then we could see an extended drop in DXY to new lows, which would increase global liquidity, and by extension, should push Bitcoin higher.  

Having correctly called the U.S. Dollar Index low earlier this year, we noted that, “Until DXY can break above $101, it can still make another low, which will further support higher prices in Bitcoin. The takeaway here is to note that the U.S. dollar is closer to a major low than most think. While it can extend further, and likely will, once we get evidence of a major trend reversal, this should line up with a topping process in Bitcoin. Until then, we can and should see Bitcoin continue an upward trajectory.

Bitcoin Price Drivers: Why Sentiment and Technical Analysis Beat Fundamentals 

Bitcoin is unlike stocks. There are no earnings reports, no 10-Ks, no revenue models, no management teams to evaluate, and no real competition—despite occasional claims that alternatives like Ethereum could challenge it. The reality is simple: Bitcoin has already established itself as the definitive digital store of value.  

Thematic investing also suggests that the positive news developments are tailwinds for Bitcoin that should support higher prices from here. In fact, we are hearing the same today – A favorable administration that is supporting Bitcoin, as well as a strategic Bitcoin reserve being established. These are both bullish narratives for Bitcoin, which should logically support higher prices. However, if we look at history, Bitcoin has an uncanny inclination to do the opposite of what the news-based narrative at the time suggests. In other words, it likes to top on bullish news and bottom on bearish news.   

I/O Fund chart comparing Bitcoin price to major news events, showing that price movements are influenced by market psychology and technical analysis patterns such as the five-wave structure, rather than fundamentals or bullish narratives.

Chart comparing Bitcoin Price to major news events, demonstrating that movements are driven by market psychology and technical analysis patterns—like the five-wave pattern—rather than fundamentals or bullish narratives. 

So, if narratives do not seem to affect price, what actually drives its price? One of the major drivers of crypto is sentiment, which can only be measured through the lens of technical analysis.  

Sentiment is simply analyzing herd mentality, which manifests in repeatable patterns. It is a powerful force in the markets. When you funnel human consciousness into a quantifiable system like public markets, strange patterns emerge and they emerge time and time again on all timeframes, on all markets and going back throughout history. Patterns like triangle, bull flags, bear flags, head and shoulder patterns, cup and handle patterns, are very common technical analysis patterns that gauge where the herd is likely moving next.  

The most important pattern within technical analysis is the five wave pattern, which we have discussed in the clip below. It underpins all of this and is what marks a trend. 

The clip below from our Free Bitcoin Webinar further explains the importance of a 5-wave pattern in markets… 

I/O Fund Portfolio Manager Knox Ridley analyzes two potential scenarios that could push Bitcoin to a major top in the $200,000 range following the current pullback. 

The fact that a clear 5 wave uptrend has completed off the 2022 low, with the final push moving higher on decelerating volume, had us quite concerned. The most likely path forward has been higher, which I presented in our August report – yet this has now been invalidated, forcing me to create a more unconventional path higher. While this path is possible, it is not probable, based on the technical outlook alone.   

I/O Fund technical chart showing Bitcoin’s 2022 bull cycle completing a full five-wave pattern, with weakening volume and RSI trends indicating rising market risk. Breaking key support levels below $74,440 suggests a major warning for bullish traders.

I/O Fund Technical Chart: Bitcoin's 2022 Bull Cycle has completed a full Five-Wave Pattern, with weakening Volume and RSI trends signaling increased market risk. The breaking of key support levels below $74,440 suggests a major warning for the bulls. 

However, if any break lower can hold over $74,440, then this path is valid and worth monitoring, especially if we see DXY break lower. We could even see this drop push toward $67,000 in an extended move. However, below $67,000 and there is no path higher, before seeing an extended bear cycle take us back into the $40,000 region or lower.  

What is also concerning can be seen in the volume and momentum patterns above. Note how volume has always expanded as price went higher, then contracted as price corrected. This is a healthy trend and one we have used to time buys along the way.  

However, since the April low in 2025, we have reversed this trend. Volume has been decelerating as price went higher, and now it is expanding as price moves lower. This is not a healthy trend and is signaling that sellers are starting to show up in force.  

This is further backed by the RSI breaking through its bull market support. Note how each correction found a low when the RSI bottomed out around 33. This support has held throughout the bull cycle. However, it recently broke this support, which is not what we typically see in bull cycles.  

We are not only seeing critical supports break in Bitcoin, but the volume and momentum trends are shifting in real time. Technicals alone are flashing big warnings for the bulls, which has us in a much more defensive posture than any time during this bull cycle.

Regarding the bull scenario, we would need to see a vertical push over $114,000 before the odds start shifting in that direction. If this happens, we will continue our game plan to trade Bitcoin in its final swings of the epic bull cycle that started in 2022.

If you are sitting on outsized gains from Bitcoin or wondering how to professionally incorporate risk management into your process, join us Thursdays for our premium webinars. In the weekly webinars, we discuss what we are doing with our crypto positions in real-time.

For a limited time, get up to $250 off with one of our biggest sales of the year starting Nov 28th. For more information on our annual sale, click hereclick here.

On-Chain Analysis by WealthUmbrella: A Healthy Ecosystem held Hostage by ETF Flows. 

We’ve consistently relied on WealthUmbrella’s top-tier On-Chain Analysis throughout this cycle. Their model flashed a buy alert in December 2022, around the same time our own system showed a major opportunity in Bitcoin. The below section was contributed by Vincent Duchaine of WealthUmbrella, who sees higher levels before a cyclical top for Bitcoin.   

Since the new bull cycle in Bitcoin started in December of 2022, we are seeing the largest price drop within this cycle, which is currently greater than -35%. Strangely, and unlike any period of notable volatility we have experienced in the last 3 years, the on-chain health of Bitcoin simply does not warrant the size of this drawdown.  

While we are seeing a healthy on-chain ecosystem, what is driving the current period of volatility is ETF selling. We were expecting this dynamic at some point, because the hype around the BTC spot ETF created an unusually tight correlation between Bitcoin and the stock market. In that environment, Bitcoin was unlikely to thrive while market breadth was deteriorating and signaling a risk-off shift. 

This new dynamic has linked Bitcoin to the state of the equity market, which could see another leg lower. However, our cyclical indicators suggest that we are likely not experiencing a cyclical top, and any further volatility could be considered a mini bear phase, within a larger bull cycle, like we experienced in 2013 and 2021. 

For example, new non-zero-balance addresses remains quite healthy. People are still joining the network at a steady rate.  

WealthUmbrella on-chain analysis chart showing Bitcoin’s network adoption remains healthy, with a steady rise in new non-zero-balance addresses despite a recent 37% price decline during the bull cycle.

WealthUmbrella’s On-Chain Analysis chart showing Bitcoin's network adoption remains healthy and strong, evidenced by a steady increase in new non-zero-balance addresses despite the recent -37% price drop in the bull cycle.  

Furthermore, this is happening while the sentiment of people who hold Bitcoin as an actual crypto asset on the blockchain remains far from bearish. Not only is the influx of new participants on the blockchain still very healthy, but whales have also been aggressively buying the dips.If we look at holders controlling more than one hundredth of the total supply (around 200,000 BTC), their balances have actually increased since the end of October. 

WealthUmbrella on-chain analysis chart showing significant Bitcoin whale accumulation of approximately 110,000 BTC during the recent price drop, highlighting strong underlying network fundamentals despite ETF outflows and signaling potential seller exhaustion.

WealthUmbrella On-Chain Chart illustrating significant Bitcoin Whale accumulation (approx. 110,000 BTC) during the recent price drop, contrasting underlying network strength with masking ETF outflows and signaling seller exhaustion. 

In fact, their accumulation — roughly 110,000 BTC — is almost identical to what they accumulated during the “Tariff correction” earlier this year (about 120,000 BTC). These are not signs of desperation, and it’s entirely possible that the scenario where whales ultimately come out on top of this correction will play out once again. 

The issue is that ETF outflows are masking this underlying strength. That being said, ETF balance sheets have already shrunk by about 4% in native units (from 1.362 million BTC to 1.307 million BTC), on top of a decline of roughly 36% in value at the worst point. Not only do we expect the stock market to rebound somewhat, but Friday’s flush happened on noticeably lower BTC ETF outflows, which is a classic pattern of seller exhaustion. 

WealthUmbrella chart tracking Bitcoin Spot ETF net inflows and outflows, showing recent volatility driven by ETF selling, with a notable slowdown in outflows signaling potential seller exhaustion and reducing the likelihood of a full cycle top.

WealthUmbrella chart of Bitcoin Spot ETF Net Inflow/Outflow shows recent volatility driven by ETF selling, with a notable slowdown in outflows signaling potential seller exhaustion and a shift away from a full cycle top.  

Now, as we sit nearly $10k above the recent low, it’s clear that we are at least in a bounce. The question is whether this is just a bounce or the beginning of a renewed bullish trend? 

According to our analysis, while ETF dynamics are creating a new risk in our models, we are simply not seeing the type of signals that coincides with a cycle top. We created four cycle top indicators, which monitors different layers of the Bitcoin ecosystem. None of these indicators have reached levels that is consistent with a true euphoric/overbought top consistent with prior major tops.  

WealthUmbrella on-chain chart showing Bitcoin cycle top indicators remain below euphoric or overbought levels, suggesting current volatility is driven by ETF selling rather than signaling a final cyclical top typical of past bull cycle endings.

WealthUmbrella On-Chain Chart showing Bitcoin Cycle Top Indicators remain below euphoric/overbought levels, suggesting the current volatility is due to ETF selling and not consistent with a final cyclical Bitcoin top consistentwith the end of bull cycles in Bitcoin.  

The current correction, as shown above, has a unique dynamic, which is the result of ETF adoption. The volatility we are experiencing is being driven mostly by ETF selling and is a stark reminder of the risks associated with Bitcoin. Even in a neutral on-chain environment — not a bearish one — ETFs selling just 4% of their holdings triggered a 35% drop in price. This highlights how illiquid the market has been over the last few months. It’s something that has concerned us since 2022, when the proportion of long-term holders on the blockchain became extraordinarily high (the share of coins unmoved for a year peaked at 71% at the end of 2023). Bitcoin’s strength back then was that nobody was selling, unlike in 2017 when everyone was instead eager to buy. ETFs brought back a bit of that demand dynamic, but it became clear that unless euphoria returns on-chain, Bitcoin will remain tightly correlated to stock-market risk-off movements and may suffer from liquidity shortages during equity corrections. In our view, the long-term risk of holding Bitcoin will diminish once the balance between ETF-driven buying and on-chain buying normalizes, and once Bitcoin’s strength relies less on a pure hodler mindset and more on a healthy, rotating, and liquid market. 

In Conclusion 

Bitcoin is undeniably the most lucrative asset in market history with an astronomical return of over 100,000%. Even if you missed day one, there have been many opportunities to participate along the way. This is where our firm has excelled as we have a strong track record of trimming near local tops and loading back up at lower prices. This can significantly shift total return.  

For example, while many chased the 2021 hype with $200,000 or $500,000 price targets, we took a disciplined approach—cutting crypto exposure by half to lock in gains at $58,000. We then went on record stating Bitcoin was a strong buy at $16,000. From there, we continued to highlight Bitcoin as a buying opportunity in six additional free articles (here, here, here, here, here) all the way through October of 2024. We didn’t just talk about the early stages of the bull cycle—we acted on it, issuing 12 buy alerts to our premium members as Bitcoin advanced from $25,000 onwards. 

Beginning in August, our tone changed. We began to warn that the risk in Bitcoin was rising, even though the same talking heads that missed the lows were telling us the rally was just beginning. Since then, we’ve released two articles outlining this increased risk (here, here), and even hosted a free public webinar, just before Bitcoin dropped 35% 

No investor is perfect — rather our results reflect a disciplined, data-driven approach that has delivered a track record surpassing many of Wall Street’s most recognizable firms. That same framework informs our AI research, including a leading AI-energy position up ~500% this year. 

If you’d like to see the exact stocks we own — including weightings, real-time trade alerts, and the in-depth research that attracts Tier-1 media coverage — we invite you to take advantage of our Black Friday Sale.

Take advantage of the I/O Fund’s largest sale of the year with up to $250 off Advanced Market Signals, which offers Knox’s weekly webinars, real-time trade alerts, and in-depth analysis on the most powerful tech trends. Learn more here.Take advantage of the I/O Fund’s largest sale of the year with up to $250 off Advanced Market Signals, which offers Knox’s weekly webinars, real-time trade alerts, and in-depth analysis on the most powerful tech trends. Learn more here.Learn more here.

Please note: The I/O Fund conducts research and draws conclusions for the Fund’s positions. We then share that information with our readers. This is not a guarantee of a stock’s performance. Please consult your personal financial advisor before buying any stock in the companies mentioned in this analysis.

Recommended Reading: