Snowflake Premium Analysis

9c7f7950-f8cd-4f16-ac46-5f9dbeeb1aa1_Snowflake+Premium+Analysis+v1.pdf

Snowflake Premium Analysis:

You can find my previous analysis of Snowflake here. previous analysis of Snowflake here.

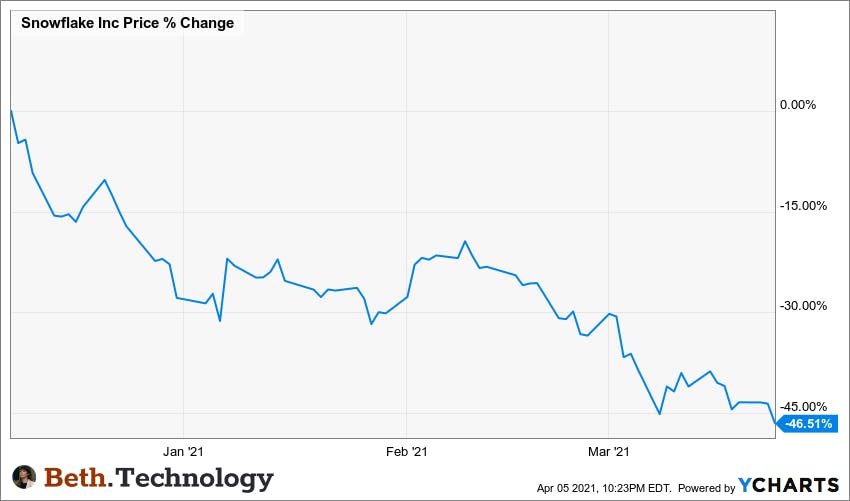
After being nearly 50% off from all-time highs, Snowflake still has a neck-breaking valuation. In this premium analysis, we spend time digging into the financials and valuation as this is a critical piece for this particular company. We also discuss product, especially as it relates to the upcoming Databricks public offering, and a few reasons why Snowflake outpaces this important competitor in terms of revenue growth. We also discuss areas where Databricks is stronger and what Snowflake must do to maintain its lead in the future. 
Best-in-Show Key Metrics:

Snowflake is a leading cloud software company in terms of revenue growth, net retention rate and remaining performance obligations (RPOs). Like all cloud software, Snowflake is declining year-over-year as the base increases.

Snowflake went public with 121% year-over-year growth, which has settled to 117% in the most recent quarter. The outlook for Snowflake is growth of 82% at the midpoint with adjusted operating margins of (19%) up from adjusted operating margins of (38%) last year.

Snowflake's two areas of strength include a net retention rate that improved sequentially from 158% to 168% in the most recent quarter. The reacceleration is important as it shows customer satisfaction and is a number that tends to decelerate.

Remaining performance obligations (RPO) is also very high at 213% year-over-year, with $1.3 billion in the pipeline. This represents the revenue that is contracted but not yet realized. The number is higher than forward revenue guidance because the future period may require more than a year. Regardless, the point is it provides a glimpse as to Snowflake’s strength in the future and 200%+ growth shows customer satisfaction. The topic of Snowflake’s future strength, particularly 3-5 years out, is discussed in the valuation section below.  

The company grew Fortune 500 customers by 46% from 127 to 186. These customers tend to remain loyal due to their size. I also pointed out Snowflake's impressive growth in customers with product revenue greater than $1 million in my previous analysis.

At the time of IPO the accounts >$1M had grown 56% compared to 22% in the year-ago period. The most recent growth shows an acceleration at 88%. The company is also a usage-based model rather than subscription. The more the world relies on data, the more revenue Snowflake will make. These larger accounts also matter more in a usage-based model.

It’s important to note that Snowflake is bleeding on the bottom line on a GAAP basis with sales and marketing costs equal to its revenue. Sales and marketing costs were at 111% of revenue in FY2020 and at 81% of revenue FY2021. These costs are high due to growing the sales and marketing departments. The company plans to hire 1,200 new employees this year with an emphasis on these two departments.
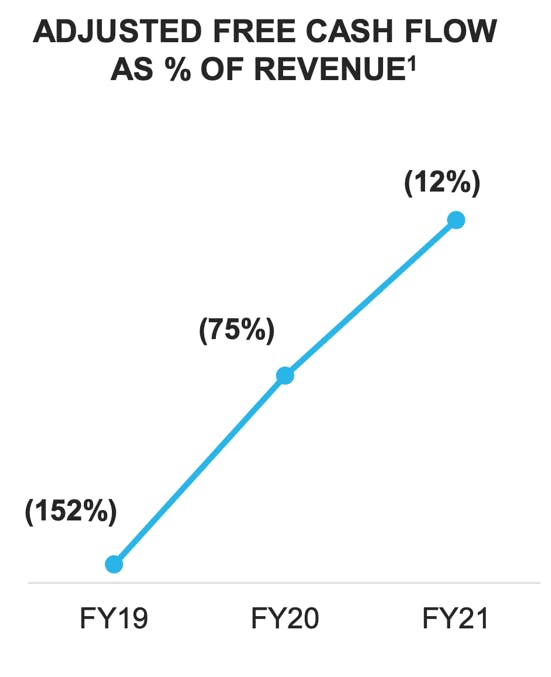
 

The operating expenses are nearly 200% of total revenue after R&D and G&A. The translation is that Snowflake is in the middle of a land grab. I imagine the aggressive sales and marketing budget strategy is that the high switching costs of data warehousing solutions will support the LTV needed. In other words, the strategy of establishing customer relationships at any cost should pay off in the long run. 

Frank Slootman, CEO of Snowflake and prior CEO of ServiceNow and Data Domain, is the main reason investors are not concerned about the bottom line. The CEO improved the cash efficiency of Data Domain, a company he took from near bankruptcy to a significant acquisition after "selling more than all its competitors combined.” He also grew Service Now from $75 million to $1.5 billion.

The free cash flow margin is set to improve this upcoming year again to "break-even" with operating losses of adjusted (19%) compared to (38%) in FY2021. The operating losses saw a 5X improvement from two years ago when the adjusted operating margins were (105%) in FY2020.

Ultimately, Snowflake has best-in-show key metrics. There is a lot of supporting evidence that Snowflake is well-loved by its customers and is positioned well for future/sustained growth. Databricks has an upcoming IPO and this is a primary risk to Snowflake as there will be a competitor on the public markets once this happens. I expect Databricks to split investor interest – more on this below.

Product Overview:

Snowflake’s decoupled architecture allows for compute and storage to scale separately with the storage provided from any cloud provider the customer chooses. By processing queries using massively parallel processing (MPP), where each node in the cluster stores a portion of the data set locally, the virtual warehouses can access the storage layer independently so as not to compete for compute power. With the competitors, such as Redshift, where compute and storage are coupled, more time is spent reconfiguring the cluster. 

Snowflake calls this offering a virtual data warehouse where workloads share the same data but can run independently. This is crucial because Snowflake’s competitors combine compute and storage and require customers to size and pay based on the largest workload

Data warehouses are centralized data repositories that collect and store information across many sources that are both internal and external. The raw data is ingested into the data warehouse and processed to answer queries. To ingest data, warehouses follow the ETL process, which is: (1) Extract the data from the internal or external database or file, (2) Transform by cleaning and preparing the data to fit the schema and constraints of the data warehouse and (3) Load into the data warehouse. The ETL method helps to organize the data into a relational format. Notably, Snowflake supports both ETL and ELT, which allows for data transformation during or after loading. 

One key product differentiator is that Snowflake is not built on Hadoop, rather the company uses a new SQL database engine with cloud-optimized architecture. Overall, this translates to faster queries and also reduces costs by scaling up or down for both capacity and performance. This also allows the shift to the cloud while still honoring traditional relational database tools. Just like cloud infrastructure does not require you to hold server space for peak times year-round, a cloud data warehouse does not require you to plan, acquire or manage resources for peak data demand (i.e. elasticity).

The need for resources could change by either increasing or decreasing (scaling up or down). Customers that have a need for storage but less of a need for CPU computations do not have to pay up front and can shrink the environment dynamically. Users either pay for terabytes or are billed on a per-second basis for computations. Notably, Snowflake charges by execution-based usage and is not a cloud SaaS-company that charges by subscription. 

Snowflake has a multi-cluster architecture which is unique from single cluster databases. The multi-cluster approach allows the clusters to access the same underlying data yet to run independently. This allows for heavy queries and operations to run very quickly and with fewer errors because the queries are not accessing the same data warehouse.

Queries are made with standard SQL, for analytics, and integrates with R and Python programming languages. The company delivers the ability to handle all incongruent data types in a single data warehouse. Because the data is accessible through SQL, there is widespread developer uptake as it’s the most common database language.

Snowflake supports both structured data and semi-structured data. As machine-generated data grows to include applications, sensors and mobile devices, Snowflake allows semi-structure data to be handled without preparation or schema definitions. The result is handling JSON, Avro, ORC, Parquet or XML data as if it were relational and structured. 

Snowflake uses a compressed columnar database. Columnar databases are optimized for the fast retrieval of columns of data and is used for analytic data queries.  Other features include centralized metadata management that is stored in a single-key value store that allows cloning of tables and databases. Security is baked into the platform to where Snowflake automatically encrypts all data to the point where unencrypted data is not even allowed. There is third-party certification and validation for security standards like HIPAA.

Beyond the value proposition of separating storage from compute for speed, and also scaling up or down to reduce costs, the third takeaway is that Snowflake is also much easier for customers to use as it’s designed to remove the role of a database administrator for monitoring and/or to tune query performance. 

The end goal of choosing Snowflake is that you load data, run queries, and do little else – which is an immense value proposition due to the amount of time wasted prepping, balancing, tuning and monitoring traditional data warehouses originally built for on-premise. 

Snowflake is capitalizing on the multi-cloud trend and growing rapidly with customers who want a choice in public cloud provider despite the cloud giants having their own data warehouse systems, such as Amazon Redshift, Azure Synapse and Google Big Query. 

Generally speaking, Big Query is a closer competitor as Google’s offering also separates storage and compute. The differences between BigQuery and Snowflake include pricing structure where Snowflake is a time-based pricing model where users are charged for execution time and BigQuery is a query-based pricing model, where users are charged for the amount of data returned from the queries. BigQuery has a serverless feature that makes it easier to begin using the data warehouse a the serverless feature removes the need for manual scaling and performance tuning. Dremel is the query engine for BigQuery.

When it comes to deciding between BigQuery and Snowflake, it can come down to what you do with the database due to pricing structure differences. For instance, Snowflake is a better choice for concurrent users and business intelligence. It’s also a great choice for data-as-a-service, where you might give client access to your data in the form of analytics. BigQuery is perhaps a better choice for ad hoc reporting, where you have occasional complex reports on a quarterly basis or recommendation models and machine learning that require high idle time. Again, these examples are mainly due to pricing structure. 

Despite BigQuery having a strong following with nearly twice the number of companies as Snowflake and growing around 40%, it tested slower than Snowflake in field tests performed by GigaOm in 2019. Vendor lock-in from BigQuery is also undesirable as companies may prefer AWS or Azure and/or more interoperability or best-in-breed solutions – we can see this in the growing trend of multi-cloud. AWS Redshift has the biggest market presence but growth is nearly flat at 6.5% and AWS is the leading partner for Snowflake.

Here's a great write-up from the Hashmap Engineering and Technology Blog that points out why implementing optimized row columnar (ORC) format data loads is ideal for either Snowflake or Amazon Redshift due to the ORC file format. Again, ultimately the choice in which system you use comes down to the individual needs for implementation although Snowflake is designed to be a competitor in nearly every case.

There’s a great write-up from analyst David Vellante that discusses how Snowflake competes with cloud native database giants. His analysis discusses survey responses from CIOs and IT buyers with Snowflake having a lead over the tech giants in spending intentions. The Enterprise Technology Research study he highlights showed 80% of AWS accounts plan to spend more on Snowflake in 2020 relative to 2019 with 35% adding Snowflake as new compared to 12% adding Redshift as new. In Azure, 78% plan to spend more on Snowflake with 41% adding new. On Google Cloud, 80% plan to increase spending on Snowflake. We can see the people have spoken.

Pricing pressure is the weakness we must monitor with Snowflake as it’s sandwiched heavily between tech giants in an area where these tech giants are very protective of their turf. How cheap will BigQuery become to attract developers to Google Cloud, which Google can then monetize the life span a customer in various ways?

You'll also see below that the tech giants are also private investors in Databricks.

Valuation Update:

Snowflake is the fastest growing cloud stock with 124% revenue growth over the last 12 months and a projected 85% over the next 12 months. The recent sell-off in tech stocks has led to a significant contraction in Snowflake's valuation. Snowflake trades at 56.8x EV/NTM revenue after seeing its valuation peak above 80x forward revenue following its IPO.  

Snowflake guided for 82% revenue growth in 2021 at the midpoint of its target. As covered in the financials, the company is also targeting breakeven in Free Cash Flow for the full year in 2021 after a -12% FCF margin in 2020.  Snowflake sees Operating Margin improving to -19% in 2021 from -38% in 2020. 

SaaS stocks are typically valued based on a multiple of forward revenue.  Below, we take a look at the ten highest valuations in the space:
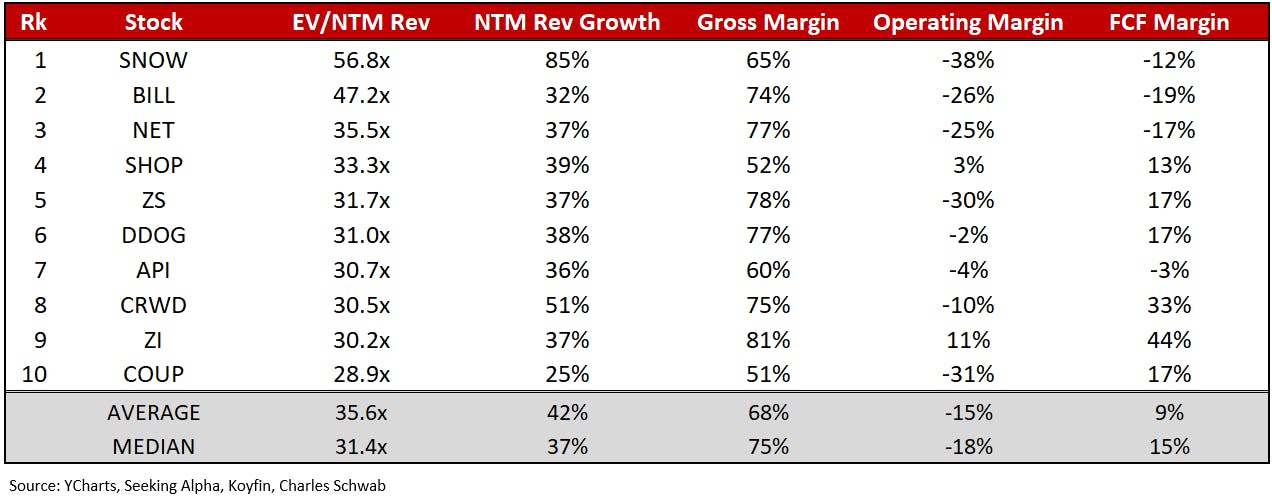
As we can see, Snowflake has the highest projected growth rate over the next 12 months by a wide margin.  Only one other SaaS stock in the table is projected to grow over 40% YoY in 2021 (CRWD).  Conversely, Snowflake is projected to grow 85% YoY in 2021, 48 percentage points above the median.

Consensus expectations show that Snowflake is projected to grow revenue 65% YoY in 2022 and 57% YoY in 2023.  In fact, Credit Suisse’s DCF Model on SNOW calls for its growth rate to exceed 40% YoY in 2024 and 2025, before retreating to 37% in the year ending 2026. 

This growth is unparalleled by any other public SaaS stock, as the median NTM growth rate for the 10 highest valuations is currently 37%.  This means that analysts are expecting SNOW to grow revenue in 2026 at the same rate that Cloudflare, Zscaler, and ZoomInfo will this year.  It becomes even more extraordinary when you consider that Snowflake is projected to achieve this growth rate after posting $3.5B in revenue in 2025. 

This revenue number comfortably exceeds the combined annual revenues of Cloudflare, Zscaler, and ZoomInfo. To put Snowflake's growth into perspective, analysts expect a higher growth rate from Snowflake in 2025 than any SaaS stock this year outside of CrowdStrike. 

This is why we believe it is essential to look beyond the NTM revenue multiples, as Snowflake will separate itself by continuing to grow faster than any of its peers over the next 5 years.  With this level of growth, SNOW will be able to compound its revenues to bigger and bigger totals. 

The farther out we look into the future, the more reasonable SNOW's valuation becomes compared to its peers.    

Major Competitor: Databricks

In my most recent Motley Fool podcast, I pointed out that Databricks planned to go public, which was a risk to Snowflake's valuation.

We don't have an S-1 filing at this time, but TechCrunch has done some preliminary work based on a $28 billion private valuation. The tech media site estimates that the company grew from a $200 million annual run rate to a $350 million annual run rate between Q3 2019 and Q3 2020.

TechCrunch's current number is a run rate of $425 million to $485.6 million for Q1 2021. CNBC reported, "$425 million in annualized sales," representing 70% growth for last year. This is quite a bit lower than Snowflake's growth last year, which was 123% for full-year growth.

We believe Databricks could open up at a higher valuation than where Snowflake is currently trading. This is because the forward growth is lower, which we estimate to be 60% for FY2021. We are assuming a $50 billion market cap at the opening. The $50 billion represents about 2X the private valuation while Snowflake opened around 3X its last private valuation.

Early backers for Databricks include Microsoft, which was later joined by Amazon Web Services, Google via CapitalG, and Salesforce. Venture firm A16Z and Tiger Global are also among the investors. This strong lineup participated in the latest $1.9 billion round. The articles that reported on the recent round point out the rarity in getting backing from all four major cloud vendors.

What’s the difference between Databricks and Snowflake?

Yesterday on our forum, there was an excellent post by a subscriber around the differences between Snowflake and Databricks.

The major difference between Snowflake and Databricks from a customer standpoint is that Snowflake is laser-focused on the public cloud/cloud native while Databricks is differentiated in that it can build information pipelines across silos, including on-premise and hybrid architectures. Snowflake's main value proposition is to reduce the time required to prep and monitor data so that a customer does not need to manage software or hardware. Even if a team has the technical skills, they may not want to spend the time required for Databricks, which is perhaps one reason why Snowflake is reporting decent growth in the Fortune 500 and other key accounts.

The architecture of a data lakehouse allows for business intelligence and machine learning through a more open paradigm. The idea is to combine best of data warehouses and data lakes to span unstructured and semi-structured data while keeping costs low. By combining both, teams can move faster and without duplicating the data. This is a key benefit to Databricks DeltaLake, and this is especially important for data analytics and machine learning. With that said, Databricks is more advanced and expert-level.

I want to point out that Snowflake is very clear as to why it's done well – which is that it handles migrations to the public cloud from legacy on-premise systems better than the competitors. Snowflake's priority is to compete with other SQL databases right now, although the company will need to eventually compete with Databricks. Management has discussed rolling out support for unstructured data, for instance, but no timeline has been set.

Looking longer-term, what Snowflake needs to answer is how will it compete with Databricks on machine learning? Databricks is superior here for ML as it’s built on top of Apache Spark and supports Spark, Python, Scala and also SQL. This was discussed in the thread on the forum here.

The forum thread points out that Databricks is more complex to upload the data, monitor and manage, but there are benefits to going through this hassle. One of the primary benefits is support for Python and Scala, which are programming languages for machine learning. For now, you must use an outside vendor or tool as connectors or integrations in order to support these programming languages and libraries with Snowflake. It’s also worth mentioning that Databricks is cheaper for processing a lot of data at petabyte scale.

Growth is the great equalizer when comparing products and my preliminary understanding is that Snowflake is growing much faster than Databricks and expects to continue to outpace the competitor. I will need to look into Databrick’s financials and see an earnings report or two to determine more about the competitor’s sustained growth rate. Here’s a snapshot of Snowflake Google search queries compared to Databricks. We should ignore the spike as it was IPO related.
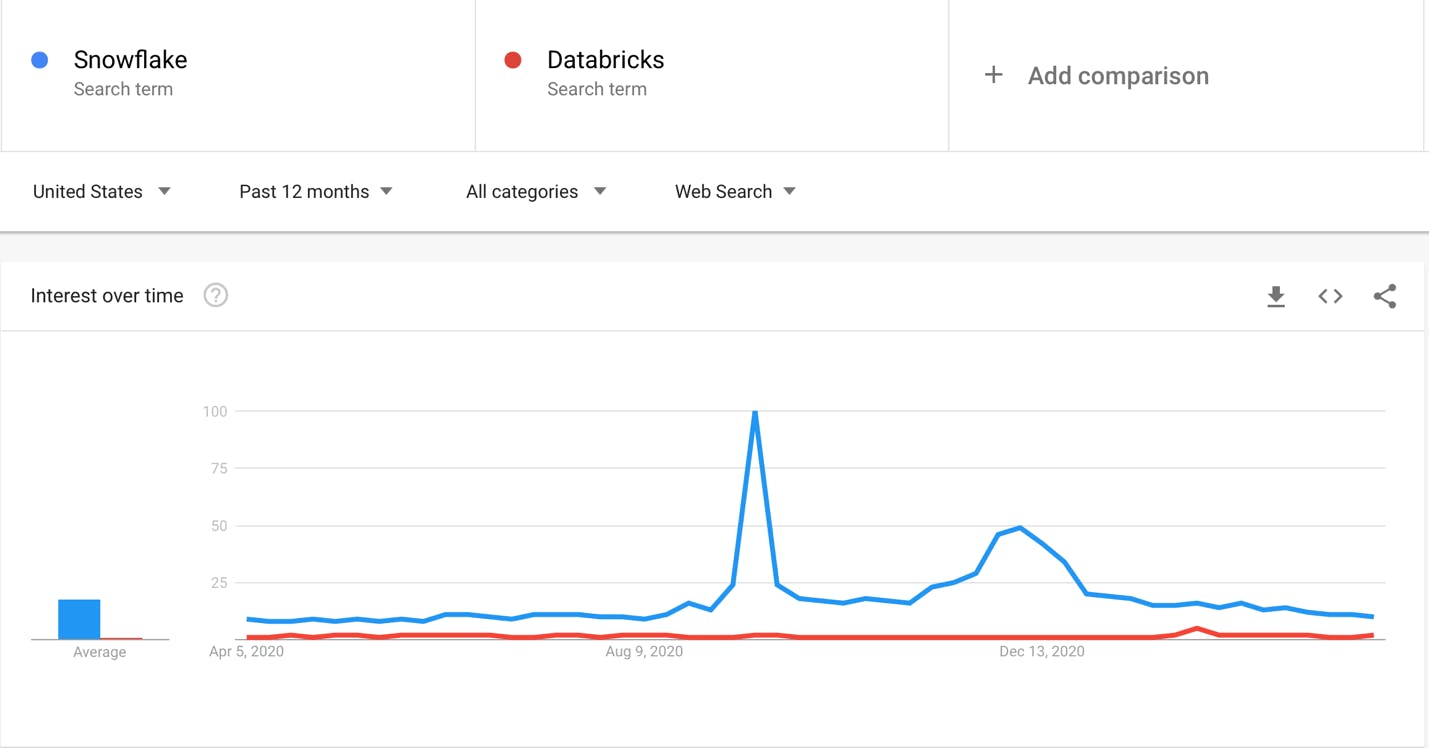
 What I find to be very intriguing is what Snowflake will do to compete on ML. This gap in product capability is not lost on the Snowflake team and management. Being laser-focused on the public cloud/cloud-native lends itself well for Snowflake to compete here theoretically, yet its laser-focus on SQL is getting in the way strategically speaking. The company is aware of this and plans to roll out support for unstructured data. Essentially, Snowflake is capable of evolving to meet the growing demands of ML … so let’s see what happens here as Snowflake's management likely has a plan.

Conclusion:

Snowflake is disrupting the data warehousing market (or cloud data market) with a superior cloud data platform that delivers across key differentiators. Snowflake demonstrates excellent product-market fit, clear competitive advantages, and strong management — the primary ingredients for a great growth stock.

I prefer to not pay over 40 forward P/S and certainly not over 50 forward P/S yet Snowflake's forward growth requires additional consideration as it promises to outpace its peers. In this case, we initiated in the 55x range and will build more into the position either on a pullback or a breakout.
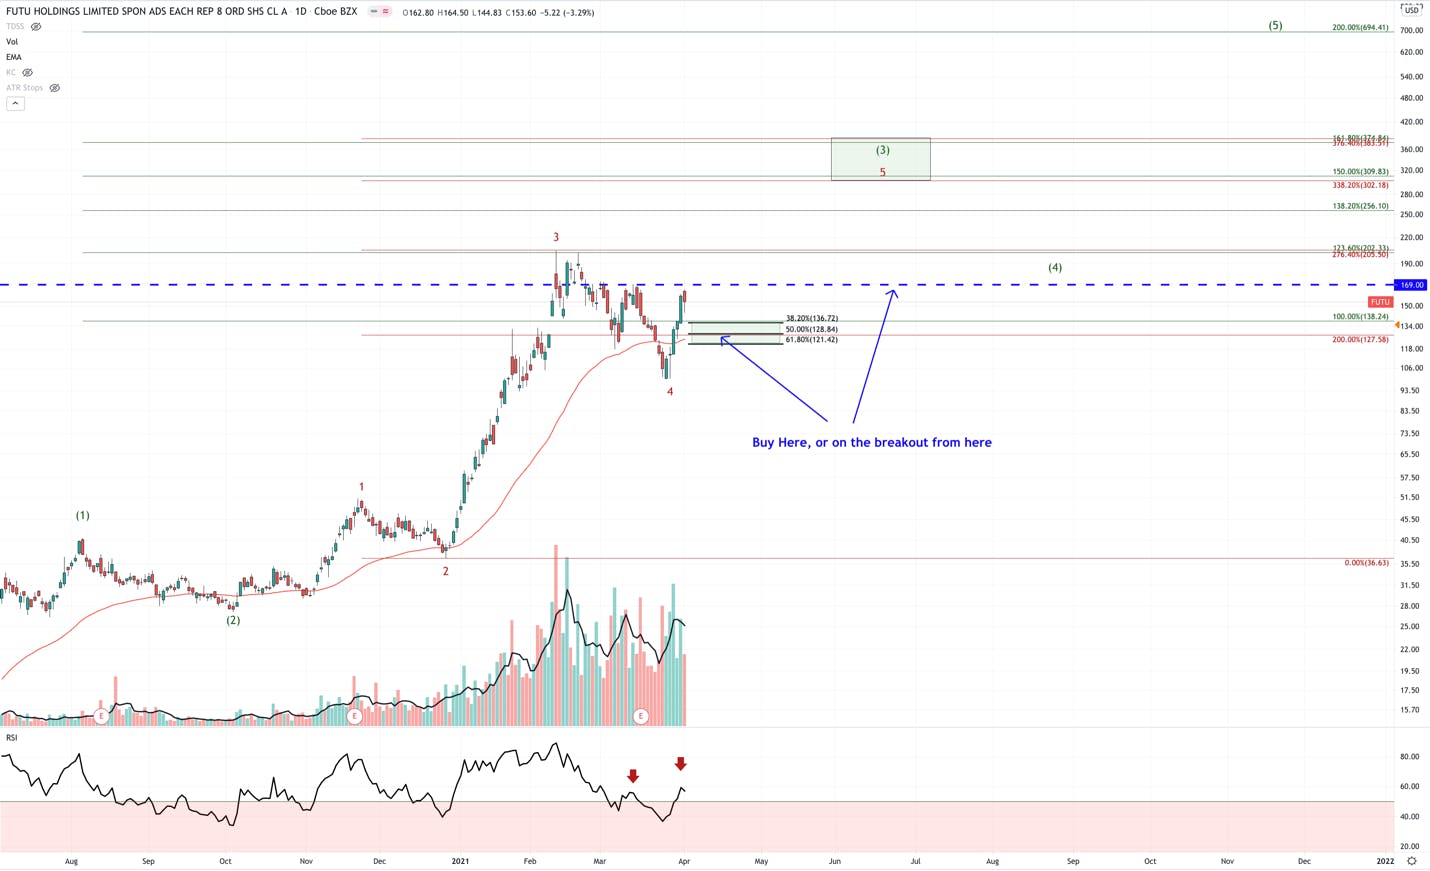

Swing Trade Setup – FUTU

We are considering a short-term trade on FUTU due to the technical setup.

Quick Overview:

Futu Limited (FUTU) is a holding company that operates in Hong Kong. They are an online broker and wealth management platform that provides a one-stop ecosystem for investors.  They provides news, market data, trading services, wealth management for Mainland China, Singapore, Hong Kong and U.S. equity markets. They even own a popular social media platform for investors.

There is nothing disruptive or technologically unique about Futu. It operates as a relatively standard online broker, much like the online options we have in the U.S. What differentiates it from other the well-known brokerage firms is its location and timing.

Since the March 2020 crash, we have seen a relative explosion of retail interest in stocks. This retail interest in equities is a global phenomenon, including China. China’s stock markets have been open for just over 30 years, compared to the U.S. that has been in operation for 229 years. As a result, in the mature U.S. equity markets, about 52% of Americans participate in the stocks markets, compared to about 13% in China. This number is up nearly 7% from a year ago.

With the growth of China’s wealth coupled with the opening of the tech focused Star Market in China, the interest in equity markets is only expected to increase, which should bode well for FUTU.

This growth shows within Futu’s projected revenue growth. It’s expected to grow revenue by 164% this year from $337M to $891M, although the 1-year forward is around 50% projected growth from $891M to $1.32B for FY2022. We will see in time if the estimates will be revised or if Futu is having its breakout year and growth will level off quickly.

Futu has strong growth this year, however, it is not anchored by a long-lasting microtrend. Instead, it’s riding the popular trend of Chinese stock investing. As long as the Chinese stock markets perform well, we believe the interest and growth in Chinese equities will continue to grow. Gains attract more retail investors, and Futu has a strong competitive edge for retail Chinese investors.

The story is not one that we would consider for the I/O Fund’s LTBH or even a longer-term momentum position. What we mainly like about Futu is its current technical setup. We like it enough to write-up a quick chart and consider taking a swing trade. We will set an initial stop to protect our losses, just in case our timing is off, and we will look to exit into strength when we believe the trend is coming to an end.


We believe FUTU is about to breakout and into the 5th wave (red count) within a larger 3rd wave (green count). The 5th wave within 3rd waves tends to extend, especially in high growth names like FUTU.

Also, note the RSI pattern. It’s flashing a reversal warning (the RSI is making a higher high, while the price is making a lower high). This, I believe, will setup for a drawdown into the $135-$125 region. It will also setup a nice inverse head and shoulders pattern just below the primary breakout price at $169.

We will look to buy on the coming pullback, or a breakout above $169. We will use a stop to limit our loss, and seek the targets overhead.

Roku: Anatomy of a Tech Darling—From Pre-Proven Business Model to Global Acceptance

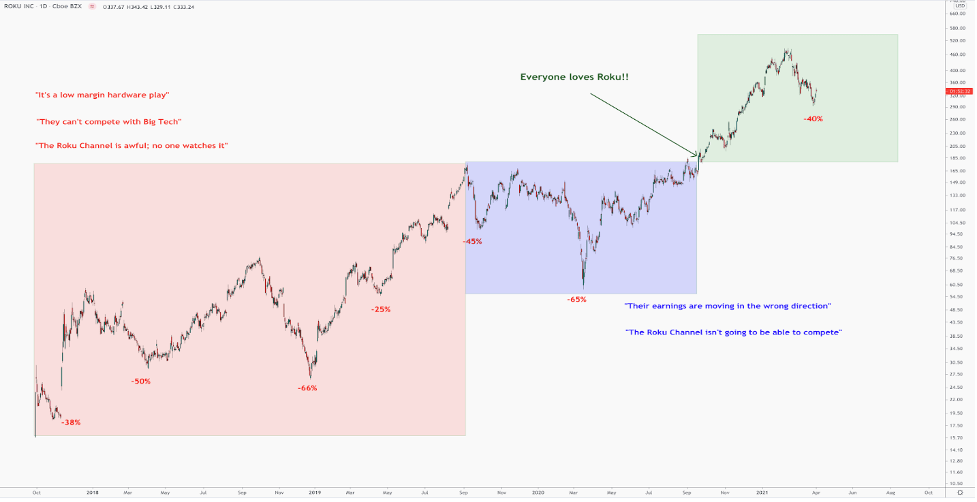
When Beth Kindig first wrote about Roku in 2018 (here and here), sentiment towards this then-unpopular stock was not in line with her primary thesis. At best, investors were hesitant. The primary arguments against her thesis were: 1) Roku will get eaten alive by Big Tech, 2) The company is undercapitalized to expand, 3) It’s a glorified hardware play, 4) Roku has no moat.

Here are some examples of the comments made on her analysis back in 2018, which characterized the prevailing sentiment at the time:

  • “ROKU's model doesn't make money. The minute they try to force others to pay a fee, Google's android system will take their customers. And don't forget, Google, Amazon and Apple have voice control of the tv and can search the web for weather and sports. ROKU cannot beat these big boys.”
  • “The problem I see with ROKU is that they have yet defined how exactly they are going to differentiate themselves from the big boys. If push comes to shove and my amazon prime membership gives me a free firestick or my 5 apple devices means I get 50% off apple TV why on earth would I choose a stand-alone platform? Assuming they will be able to drive margins up through advertising is a tough sell for me.”
  • “I love Roku, but right now, it is a hardware company on par with Sonos, while Netflix is a content provider that is spending $12bn on content. Netflix needs to be looked at as a tech company though.”

After the March 2020 selloff, hesitation resumed around the Roku Channel and the company’s earnings. Investors now complained that Roku’s earnings were moving in the wrong direction due to lower margins and its OTT channel was no competition for the already popular and crowded space in OTT.

Today, some investors are worried that the stock’s best days are behind it. Below we reexamine our long thesis for Roku, and look at the technicals to determine what might be next for the stock.

The Future of Connected TV 

Beth firmly believes Roku is benefitting from a trend that has more room to run: OTT and Connected TV Ads. In the U.S., connected TV ad spending is projected to increase from $8.11 billion this year to $18.29 billion in 2024, according to eMarketer.

Normally, it would be a concern that the overall growth is declining – yet Roku owns the majority of programmatic connected TV market with 46% of ad spend on Roku connected devices. This is followed by about 10% market share Samsung, Apple and Amazon each. There is also a 47% increase in Roku apps that support programmatic compared to 13% in Amazon Fire TV apps.

We believe Roku’s leadership will continue on a global scale, which is not accounted for in these statistics.

The power of these misunderstood microtrends are the reason why many investors missed out on Netflix and can’t understand how a company with such “terrible fundamentals” isn’t collapsing. The market simply doesn’t understand tech and that’s to our advantage.

The OTT/Connected TV ad microtrend is what propelled Roku to a recent high of $486 on Feb.16, and it’s the reason why we identified several buying opportunities within this correction. 

We think the strength of an analyst is determined by how accurate their thesis is and the sooner they get the thesis right, the more likely they will continue to get it right. Our original thesis continues to play out today: an agnostic, ad platform that supports the migration of Pay-TV ad dollars through first-party data and a strong operating system. The company is also expanding globally which will be its first attempt at doubling TAM.

I have personally watched Beth hold her original thesis through many bouts of investor doubt and market volatility, as is common with the tech growth stocks she builds a conviction around. Her conviction regarding Roku is how we were able to build the bulk of our position with a cost basis of $28. Her conviction is also how we have been able to weather the volatility to be up more than 1000% as of April 1.

Today, some investors are worried that Roku’s best days are behind it. We believe it’s best to follow the analyst who got it right from the beginning.

Below we go over current technicals, where you’ll see we are well aware of when a stock is extended and also when it’s bottoming, which can provide a good opportunity to build a position. While many traders attempt to sell at the top and buy at the bottom (wash and repeat), we prefer to remain steady with our convictions so our readers trust us and can rely on our convictions. We think trying to squeeze out gains by trading a stock rather than investing can send mixed messages and lowers the accessibility for investors who don’t trade daily. We think it is easier for our readers if our positions are clear and predictable. Very few of our readers have time to trade actively and we want to be a calming force in what can be a turbulent process.

We also take our role seriously in that we disclose our entries and exits in real-time while also being audited by a third-party for full year performance. Below, we illustrate how the I/O Fund works by looking at our current analysis of Roku and the levels we are watching.


Relative Strength

More often than not, the leaders out of a large correction tend to lead in the next leg up. Our system is setup to identify sectors and stocks that exhibit this relative strength to help guide our allocations.

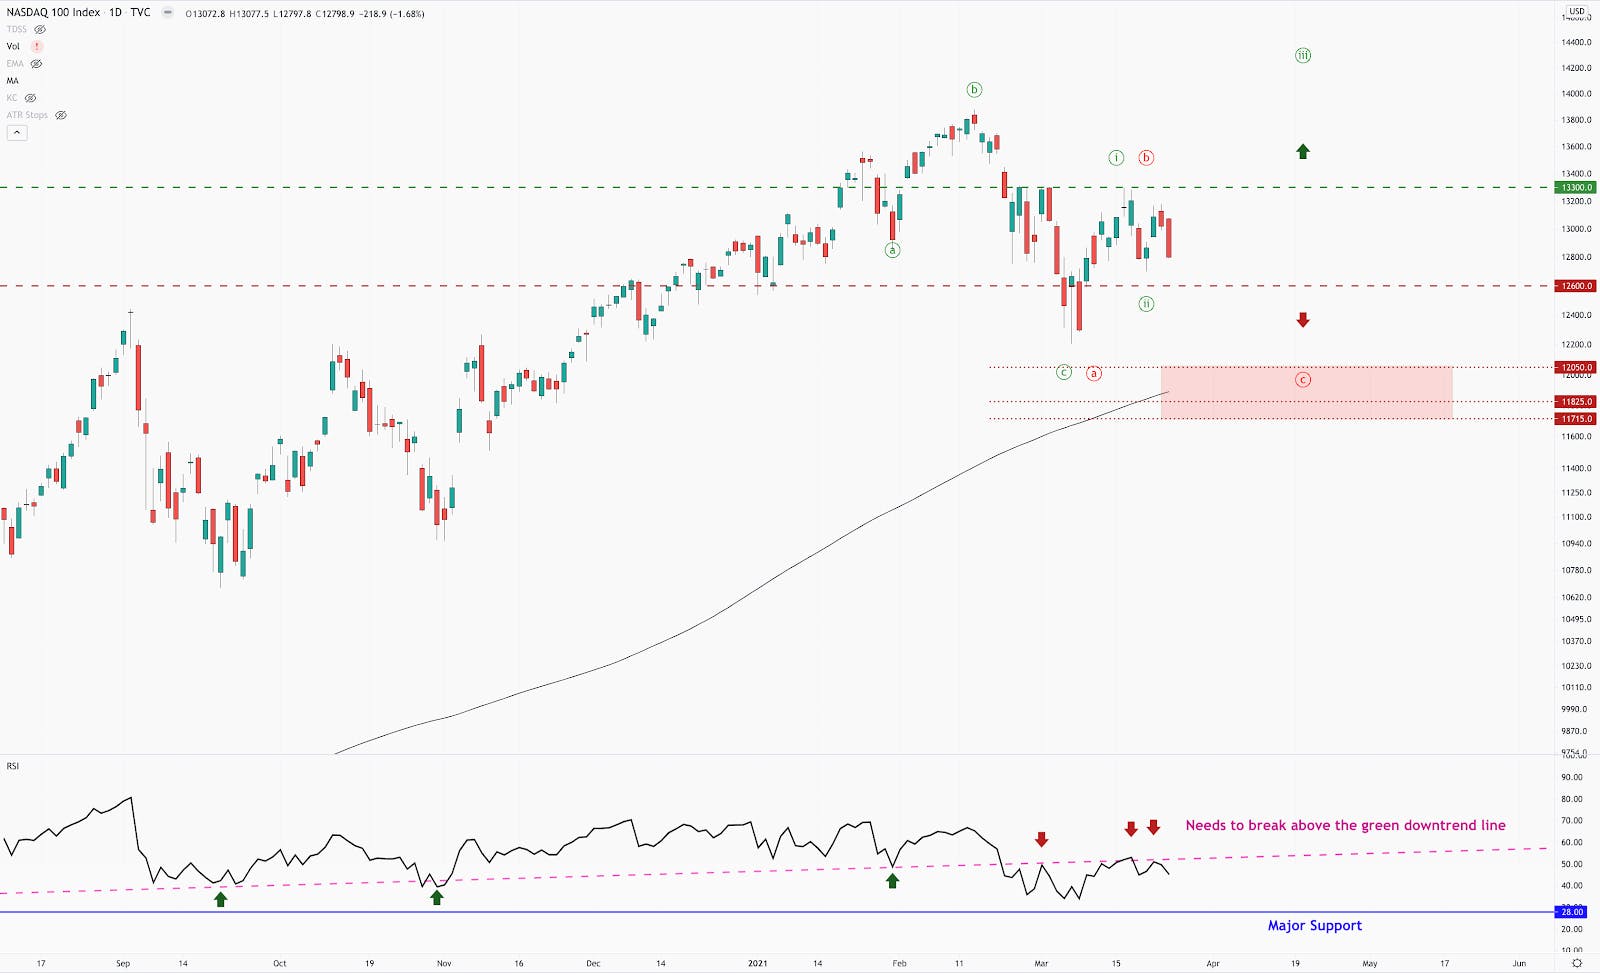
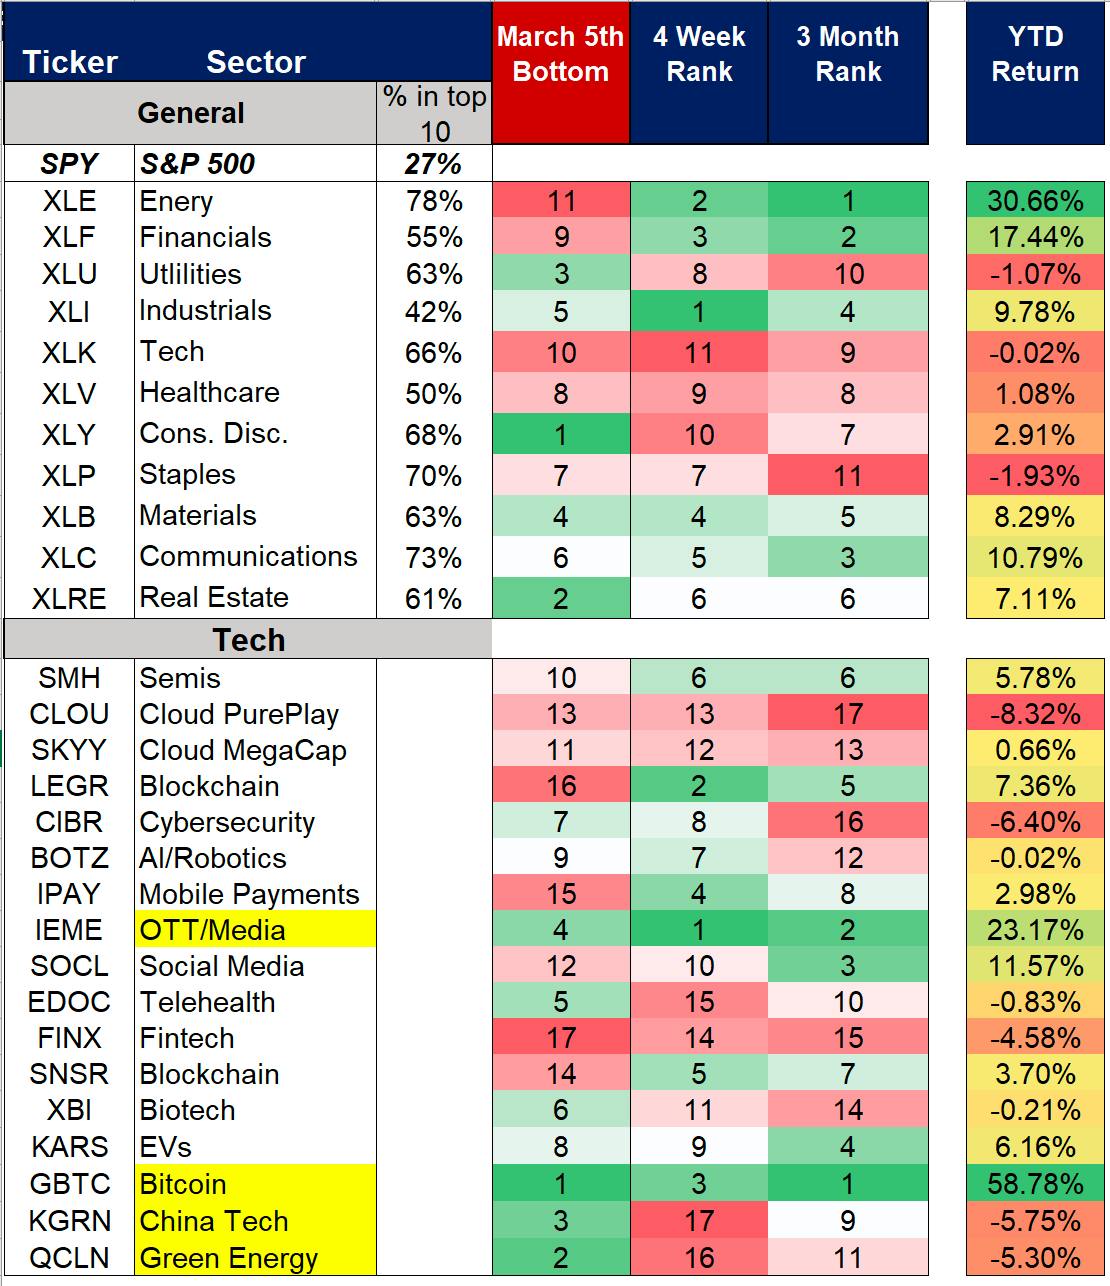
However, there are exceptions. Roku is currently trading under its 50-day moving average, which is hovering around $390. Since the March 5th bottom, Roku has shown weaker relative strength than the NASDAQ100 (NDX).  NDX is up ~5% while Roku is down ~5%).

It’s worth noting that Roku is up 1% over the last 3 months, and up 305% over the last year, compared to the NASDAQ100, which is down about 12% over the last 3 months and up about 78% over the last year. 

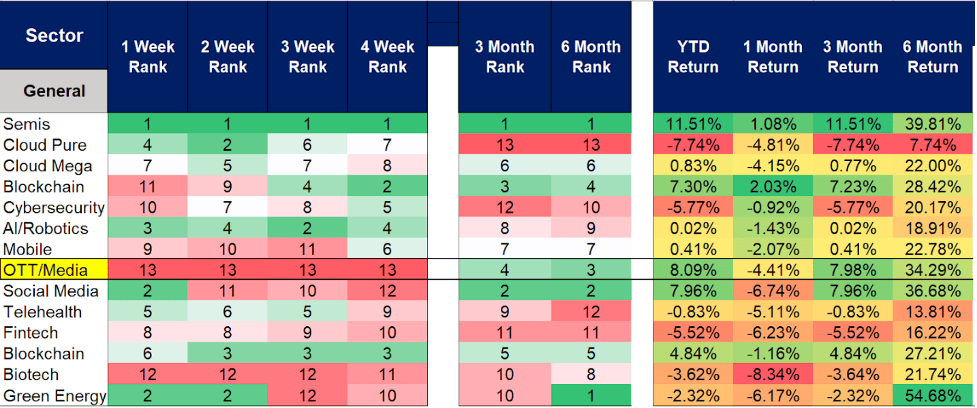
Time frames are important. In fact, the relative strength of the OTT/Ad Tech world has fallen dramatically and is ranked dead last in our screens over the last 4 weeks.

Usually, when we see this level of poor relative strength potentially coming out of a correction, we take note.

However, there is more to this story than a fading trend. Note the ranks and returns of this microsector further out. On a 3-month and 6-month basis, it’s ranked in the top percentile. This includes the recent selloff. 

The level of strength is further shown in its YTD returns of around 8%, second only to semiconductors, around 11.5%. Once again, this includes the recent bout of weakness.

What changed was Bill Hwang’s leverage bets in Chinese and American media stocks, which caused a $20 billion forced liquidation of his portfolio. Since then, we have seen a fast to slow unwind of many OTT/Ad-Tech names, which has skewed the relative strength of this microsector.

Prior to the forced unwinding, this microsector was ranked in the top decile of all the tech sectors we track. Because of this, we believe that the opportunity to accumulate specific stocks in this field is unique. 


Roku’s Opportunity

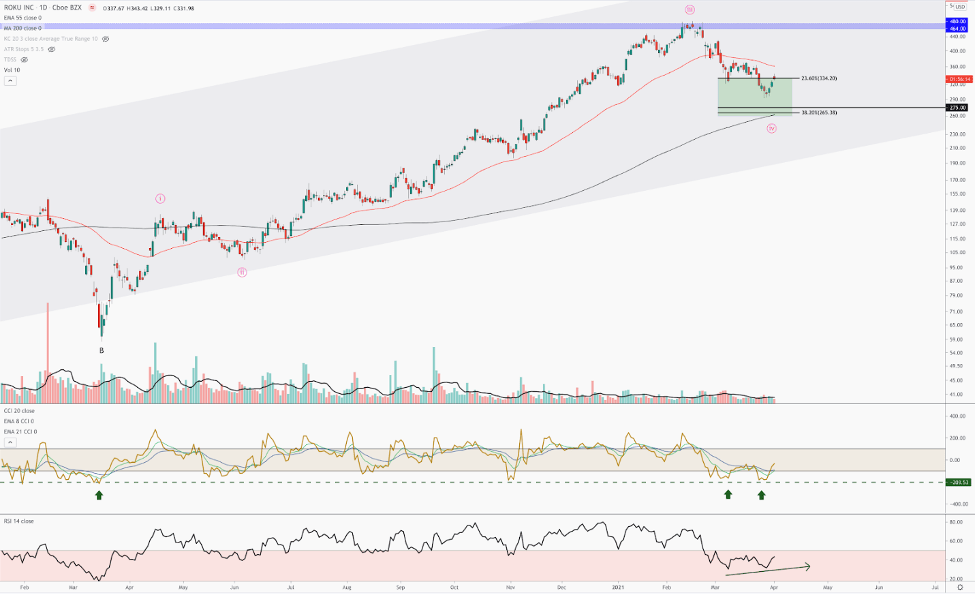
Regarding Roku, we outlined the potential 4th wave drawdown and warned our readers of a top forming. On February 11th when Roku was trading around $475, within our forum, we stated

“Note all the sell signals – overbought (check), Demark 9 signal (check), RSI and MACD are showing negative divergence (check). I believe we are coming to the end of a minor degree 3rd wave (pink), which will set up a great buying opportunity.”

We later outlined potential tragets for a bottom on March 1st in one of our premium webinars, by stating “I believe Roku has topped out in its 3rd wave. The 4th wave targets are $335 to $265.” 

Again, on March 30th, we reaffirmed our target region by stating “We are square in the 4th wave target box. The $300 level is very strong support. Below that is $275 and then $265. I doubt we tag $265 with the internals where they are.” 

Today, we think the evidence supports a bottom in Roku for this correction. 

For one, the price hit a wall of support at the $300 region, which is square in the middle of the most probable 4th wave target zone. The CCI, which is a momentum oscillator, tagged the same region we saw at the bottom of the March 2020 low. This is classic uptrend behavior, where we see momentum hit major support or lower while price is higher. 

Also, note the positive divergence with RSI, another popular momentum oscillator. RSI is making a lower high while price makes a lower low. The two of these indicators are providing classic bottoming signals.

Learn more about the crucial difference between Netflix and Roku here, and why Beth is confident that Roku’s best years are still ahead. Find out what levels we are watching on NDX to confirm an end to the correction here.


Roku: Levels to Watch

We expect the uptrend to continue to all new highs as long as the $292 low holds. Below $292, and we will look next for a bottom around the $280-$275 region, before the uptrend resumes. We think a test of the 200-day SMA ($265) to be less probable based on how oversold the momentum-based internals are with Roku.

In conclusion, the more probable scenario is that the bottom is in.

Disclaimer: Knox Ridley and the I/O Fund is currently invested in ROKU. The content in this article is intended to be used for informational purposes only. The author has not received any compensation from any third party or company discussed in this article. The content is the expressed opinions of the author and is intended for educational and research purposes. Any thesis presented is not a guarantee of any particular stock’s future prices, so please factor this risk into your own analysis. It is very important that you do your own analysis before making any investments based on your personal circumstances. The author is not a licensed professional advisor. Please seek counsel form a licensed professional before acting on any analysis expressed in this article, to see if it is appropriate for your personal situation.


CrowdStrike Update

Intro:

We recently initiated a position in CrowdStrike and want to take the opportunity to update you on the company. Previously, I covered CrowdStrike in October 2020 here.  In the report, I explained how cybersecurity would continue to be a key initiative for organizations in the remainder of 2020 and beyond.  I also covered CrowdStrike’s product offerings and explained how the company was uniquely positioned as the top vendor in a critical subsector of cybersecurity.  We discuss the previous coverage below and examine why the company has become even stronger, as well as numerous industry catalysts.

We continue to see strong C-level survey results for cybersecurity in 2021, in particular, with CrowdStrike and Zscaler the undisputed leaders. We discuss why we have chosen CRWD, yet it seems ZS is a strong second choice. We also cover Cloudflare and why we have passed for our own portfolio.

Security Software: Top Priority for 2021

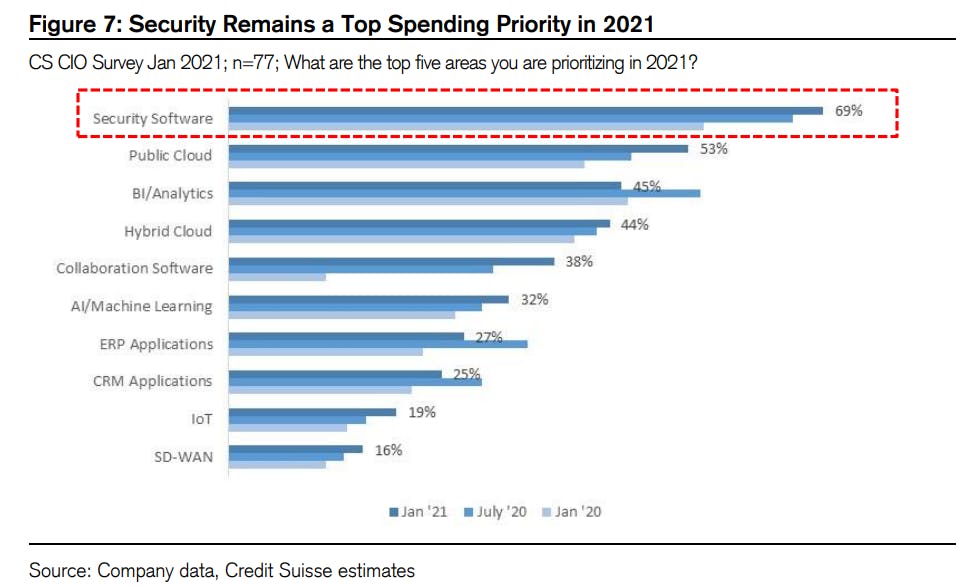
Security software has consistently ranked as a top spending priority among C-level executives, but our research shows it has become the #1 priority in 2021. The Covid-19 pandemic and shift to a more remote workforce uncovered a number of major gaps in the cybersecurity of organizations. 

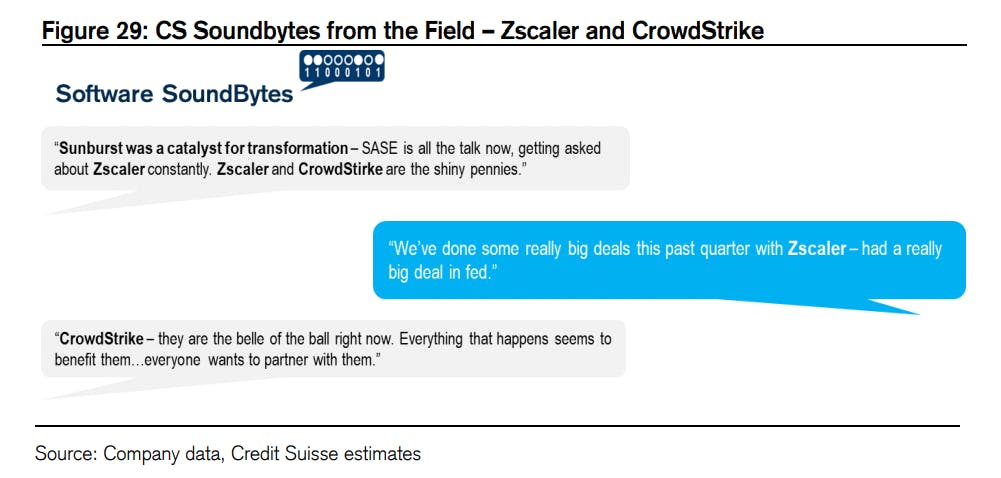
The high-profile Sunburst hack further highlights the need for businesses to transform their legacy security architectures, as legacy tech is no match for today’s adversaries.  As a result of the Sunburst hack, the current administration has talked about how cybersecurity spending is a top priority, calling on Congress to “launch the most ambitious effort ever to modernize and secure federal IT and networks.” 

Credit Suisse’s recent CIO survey suggests that security spending is the top spending priority in 2021, even more so than in July.

We view CrowdStrike and Zscaler as the best positioned cybersecurity companies to benefit from the growing security spending cycle. We are still in the early innings of the shift in security architecture towards Zero Trust and SASE, of which we believe CrowdStrike and Zscaler will benefit the most.

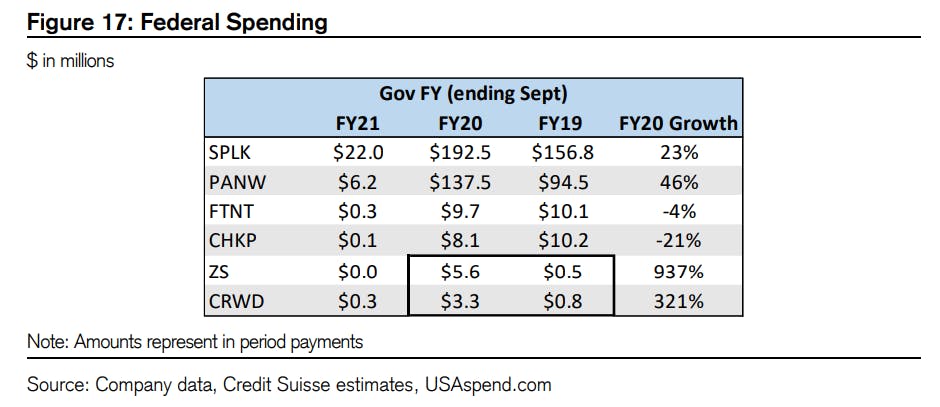
Here’s a snapshot of government spending and the triple-digit increase in FY2020 growth in federal spending for Zscaler and CrowdStrike.  The current administration’s commitment to cybersecurity should also benefit CrowdStrike and Zscaler as they continue to gain more share of federal spending. 


1.       CrowdStrike (CRWD)

In my past coverage of CrowdStrike here, I explained why the company would thrive as the fastest growing endpoint security vendor.  Endpoints are frequently the first point of entry for attackers, so endpoint security is an integral part of a multilayered security strategy.  CrowdStrike has thrived in this area, leading to the addition of a record 1,480 new subscription customers in Q4. 

While CrowdStrike has demonstrated tremendous expertise in endpoint security, the full CrowdStrike Falcon Platform now encompasses much more.  The full CrowdStrike platform, designed to define Cloud Security, includes managed services, security & IT operations, threat intelligence, identity protection, and log management.  The power of CrowdStrike’s platform is demonstrated in the financial data, as 63% of CrowdStrike’s subscription customers have 4 or more Cloud Module Subscriptions.  This number has grown from 47% two years ago and 55% last year. 

The growth of this metric is important to CrowdStrike’s growth, as they have expanded their TAM through acquisitions and the launch of new modules that cover untapped areas of cybersecurity.  We are now seeing the majority of CrowdStrike’s subscription customers, almost 2/3, adapt 4 or more modules meaning most customers are subscribing to the idea of having CrowdStrike handle most of, if not all of, their cybersecurity needs.  CrowdStrike management has talked in the past about how most customers typically sign up for 1 or 2 modules but adapt more modules over time.  This shows the success of the CrowdStrike customer life cycle.  From the time the company onboards a new customer to the adaption of more modules, they are able to add new sources of revenue from already existing customers.      

In Q4, CRWD grew revenue 77% YoY and added a record 1,480 new subscription customers (+82% YoY), with a number of marquee customer additions including Pfizer.  CRWD also enjoyed a record quarter in profitability metrics with its best ever quarter of non-GAAP EPS (+$0.13), Free cash flow (+$97M), FCF margin (+37%), EBITDA (+$45M), and EBITDA margin (+17%).      

CrowdStrike guided for 50% YoY revenue growth in FY 2021 and EPS of $0.29.  The projected growth rate leads the security SaaS industry and our comparisons of ZS and NET, despite the stock trading at a slightly lower valuation than those stocks. 

As previously discussed, with its recent acquisitions of Preempt and Humio, CrowdStrike has enhanced its capabilities beyond endpoint security to also encompass cloud workload security and identity protection.  With Preempt Security, CrowdStrike is leading the charge with a Zero Trust solution focused on endpoints and workloads.  In its Q4 earnings call, CrowdStrike CEO George Kurtz talked about how customers have become increasingly interested in its Zero Trust offering derived from Preempt following the Sunburst hack. 

The acquisition of Humio will combine Humio's data ingestion and analysis engine with CrowdStrike’s technology.  CEO George Kurtz discussed the Humio acquisition the company’s Q4 earnings call:

“With Humio, we are now redefining next-gen XDR through a platform that spans endpoints, identities, applications, the network edge and the cloud… Humio provides us the ability to expand our data leg and to solve more security and non-security use cases in real time… providing CrowdStrike with a greater time advantage over the competition and the adversary.”

It has become evident that CrowdStrike has continued to successfully enhance the capabilities it can offer and has taken a big step toward its goal of providing the “fastest, most cost efficient, and extensible cloud data platform that will deliver best-in-class visibility for security as well as observability for IT operations.”

2.       Zscaler (ZS)

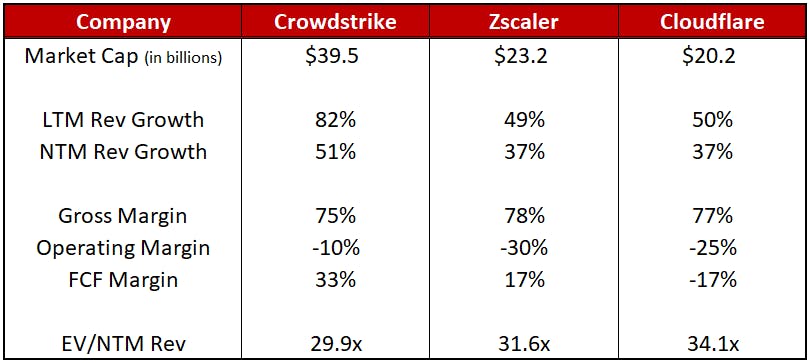
Zscaler ranks #2 behind CrowdStrike on our list of cybersecurity stocks to own.  Like CrowdStrike, we believe Zscaler is well positioned to capture the industry wide shift to Zero Trust and SASE.  We covered Zscaler’s Fiscal Q1 Results here.  Fiscal Q2 was another solid quarter for Zscaler as they continue to show their strength as a major cybersecurity player.  In Fiscal Q2, Zscaler grew revenue 55% YoY and gross billings an impressive 71%.  Although Zscaler is an industry leader with strong fundamentals, our analysis shows that the company is not as strong fundamentally as CrowdStrike despite having a slightly higher valuation. 

Over the next 12 months, Zscaler is projected to grow revenue 37% versus CrowdStrike’s 51%.  ZS has slightly higher gross margins over the trailing 12 months at 78% versus CRWD’s 75% but lags CRWD in Operating Margin and FCF margin.  We compare ZS to CRWD and NET fundamentally in the table below.       

3.       Cloudflare (NET)

We covered Cloudflare’s Q4 earnings here.  Although Cloudflare is not purely a security company, approximately half of their products are security related.  A lot of Cloudflare’s focus on the future is related, according to CEO Matthew Prince.   In its Q4 earnings call, Cloudflare management talked about their expectations for a big shift in 2021 from a traditional hardware-based security approach to a much more modern Zero Trust approach.  Cloudflare is well positioned to be one of the leading companies in enabling organizations to make this shift.  However, we still view CRWD and ZS as better ways to play the shift in cybersecurity spending.

We feel NET is not as strong fundamentally as CRWD or ZS.  The stock is also not as attractive from a valuation standpoint.  For these reasons, NET ranks third behind CRWD (#1) and ZS (#2) on our list of security SaaS stocks to own moving forward. 

Source: YCharts; data as of 3/25/21

Conclusion:

Selloffs are tough, but the silver lining is getting quality companies at much more reasonable valuations. CrowdStrike is a company that we think will do well when the market remembers that tech is not going anywhere and growth in this sector is not Covid dependent. CrowdStrike is my favorite company that had a stretched valuation throughout this past year and we see the selloff as a buying opportunity. 

2020 Audited Returns, LTBH Update and Site Update


We hope you’re doing well. The new site is now fully launched at io-fund.com. We are also working on a new Forum Guide, FAQs and customer service flow so we can respond to account access issues faster.

We will continue to update you as we find opportunities in this selloff. Many of the stocks we own, including recent additions like CRWD and SNOW, are gifts at these valuations. We are also looking to add renewables exposure to the LTBH portfolio during this sell-off.

This week, you will get an update from David Marlin on security software stocks and why we entered CRWD. I’m working on a Snowflake update that should be out Monday of next week. There’s a chance the update on SNOW gets bumped for an analysis on renewables so we can figure out our allocation here. In the meantime, please reference this past analysis on Snowflake in Forbes here.

LTBH Update

I posted on the forum that we are adding Ethereum and Snowflake as LTBH positions. When the correction is over, we feel these two will more than make up for our losses in BAND and AMWL, which we have now closed. After the weak relative strength in both these positions on the bounce, we felt it was better to log a small loss and put those funds into stocks that we believe will continue to have stronger relative strength coming out of this correction.

Fundamentally, we closed AMWL because the forward is too low. During a few interviews about Unity, I discussed the downside to being early to a trend. For early trends we prefer to keep low allocations. 

We were able to log a nice gain by cutting our position in TDOC in half close to the high.  We think telehealth will be an important trend in the future. However, we could be very early to this trend. The health industry in particular is very slow moving and this could also be contributing to the reason telehealth is facing a tough year.

We closed Bandwidth because BAND should have had a breakout year with the digital transformation and work-from-home trend. Instead, we hold a large position in Zoom as we are bullish on Zoom Phone and the platform that Zoom is building that extends beyond a web conferencing app. I also don’t think Zoom is dependent on the work-from-home trend as I believe those who have Zoom accounts will continue with those accounts, except perhaps the education sector. Many of the education accounts were provided for free or at a reduced cost and this weighed on margins recently.

I am writing a free article update on Zoom Video as it’s part of my free coverage since last year. I think the market and financial news is confused as to where Zoom can go next and I am happy to go on record by revisiting my hardware-as-a-service thesis. It’ll also allow me to follow up on my free Bandwidth analysis and to let people know we closed the position.

Quick Note on the New Site

We will continue to have the old site available for six weeks as we expect to launch our new forum in May. At this time, we will archive Beth.Technology so the team can focus on the forum launch. The next six weeks will ensure we have sufficient time to handle any customer service issues due to the site transfer.

There are a few common mistakes we are seeing for access to the new site:

  • People have two or more emails and are running into issues because the system requires the email address you signed up with through Stripe.
  • Credit card info was inputted wrong and our system did not return an error message. You can check if your account is active with this link: https://io-fund.com/account. We have fixed this to where an error message is now returned.
  • Attempting to use the Beth.Technology password on IO-Fund.com. Due to security reasons, passwords can’t be transferred and you must set a new password for the new website.

To access the new site, you must set a new password. To set a new password, go to https://io-fund.com/welcome.

If you want to learn more about the new site, we created a helpful webinar. To access it on our previous site Beth.Technology, go to https://research.beth.technology/new-website-onboarding/. The webinar is also available on the new website at https://io-fund.com/premium/new-website-onboarding

2020 Returns and YTD Returns

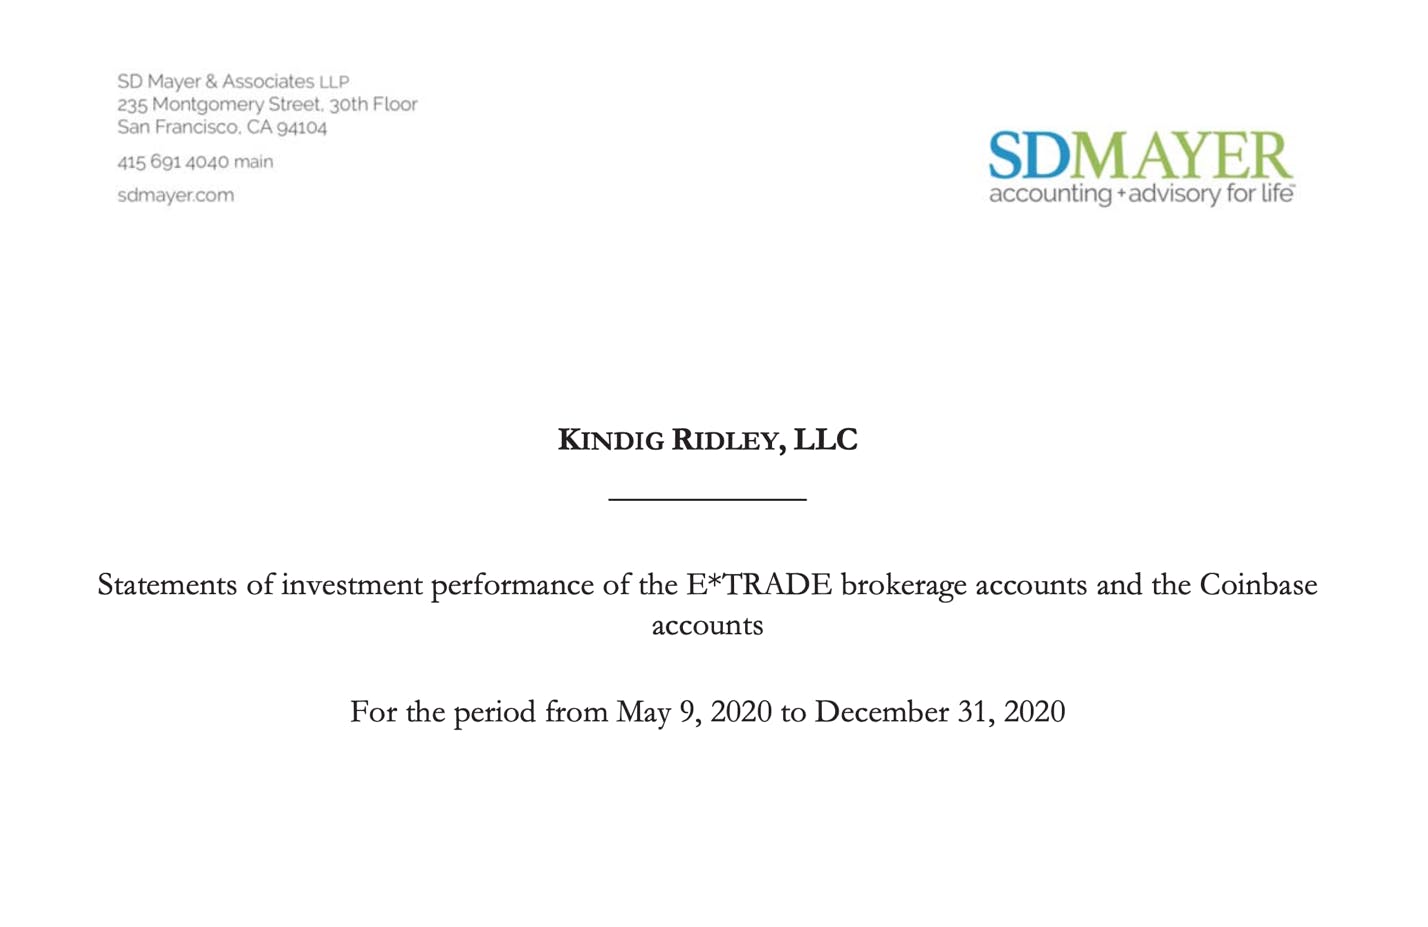
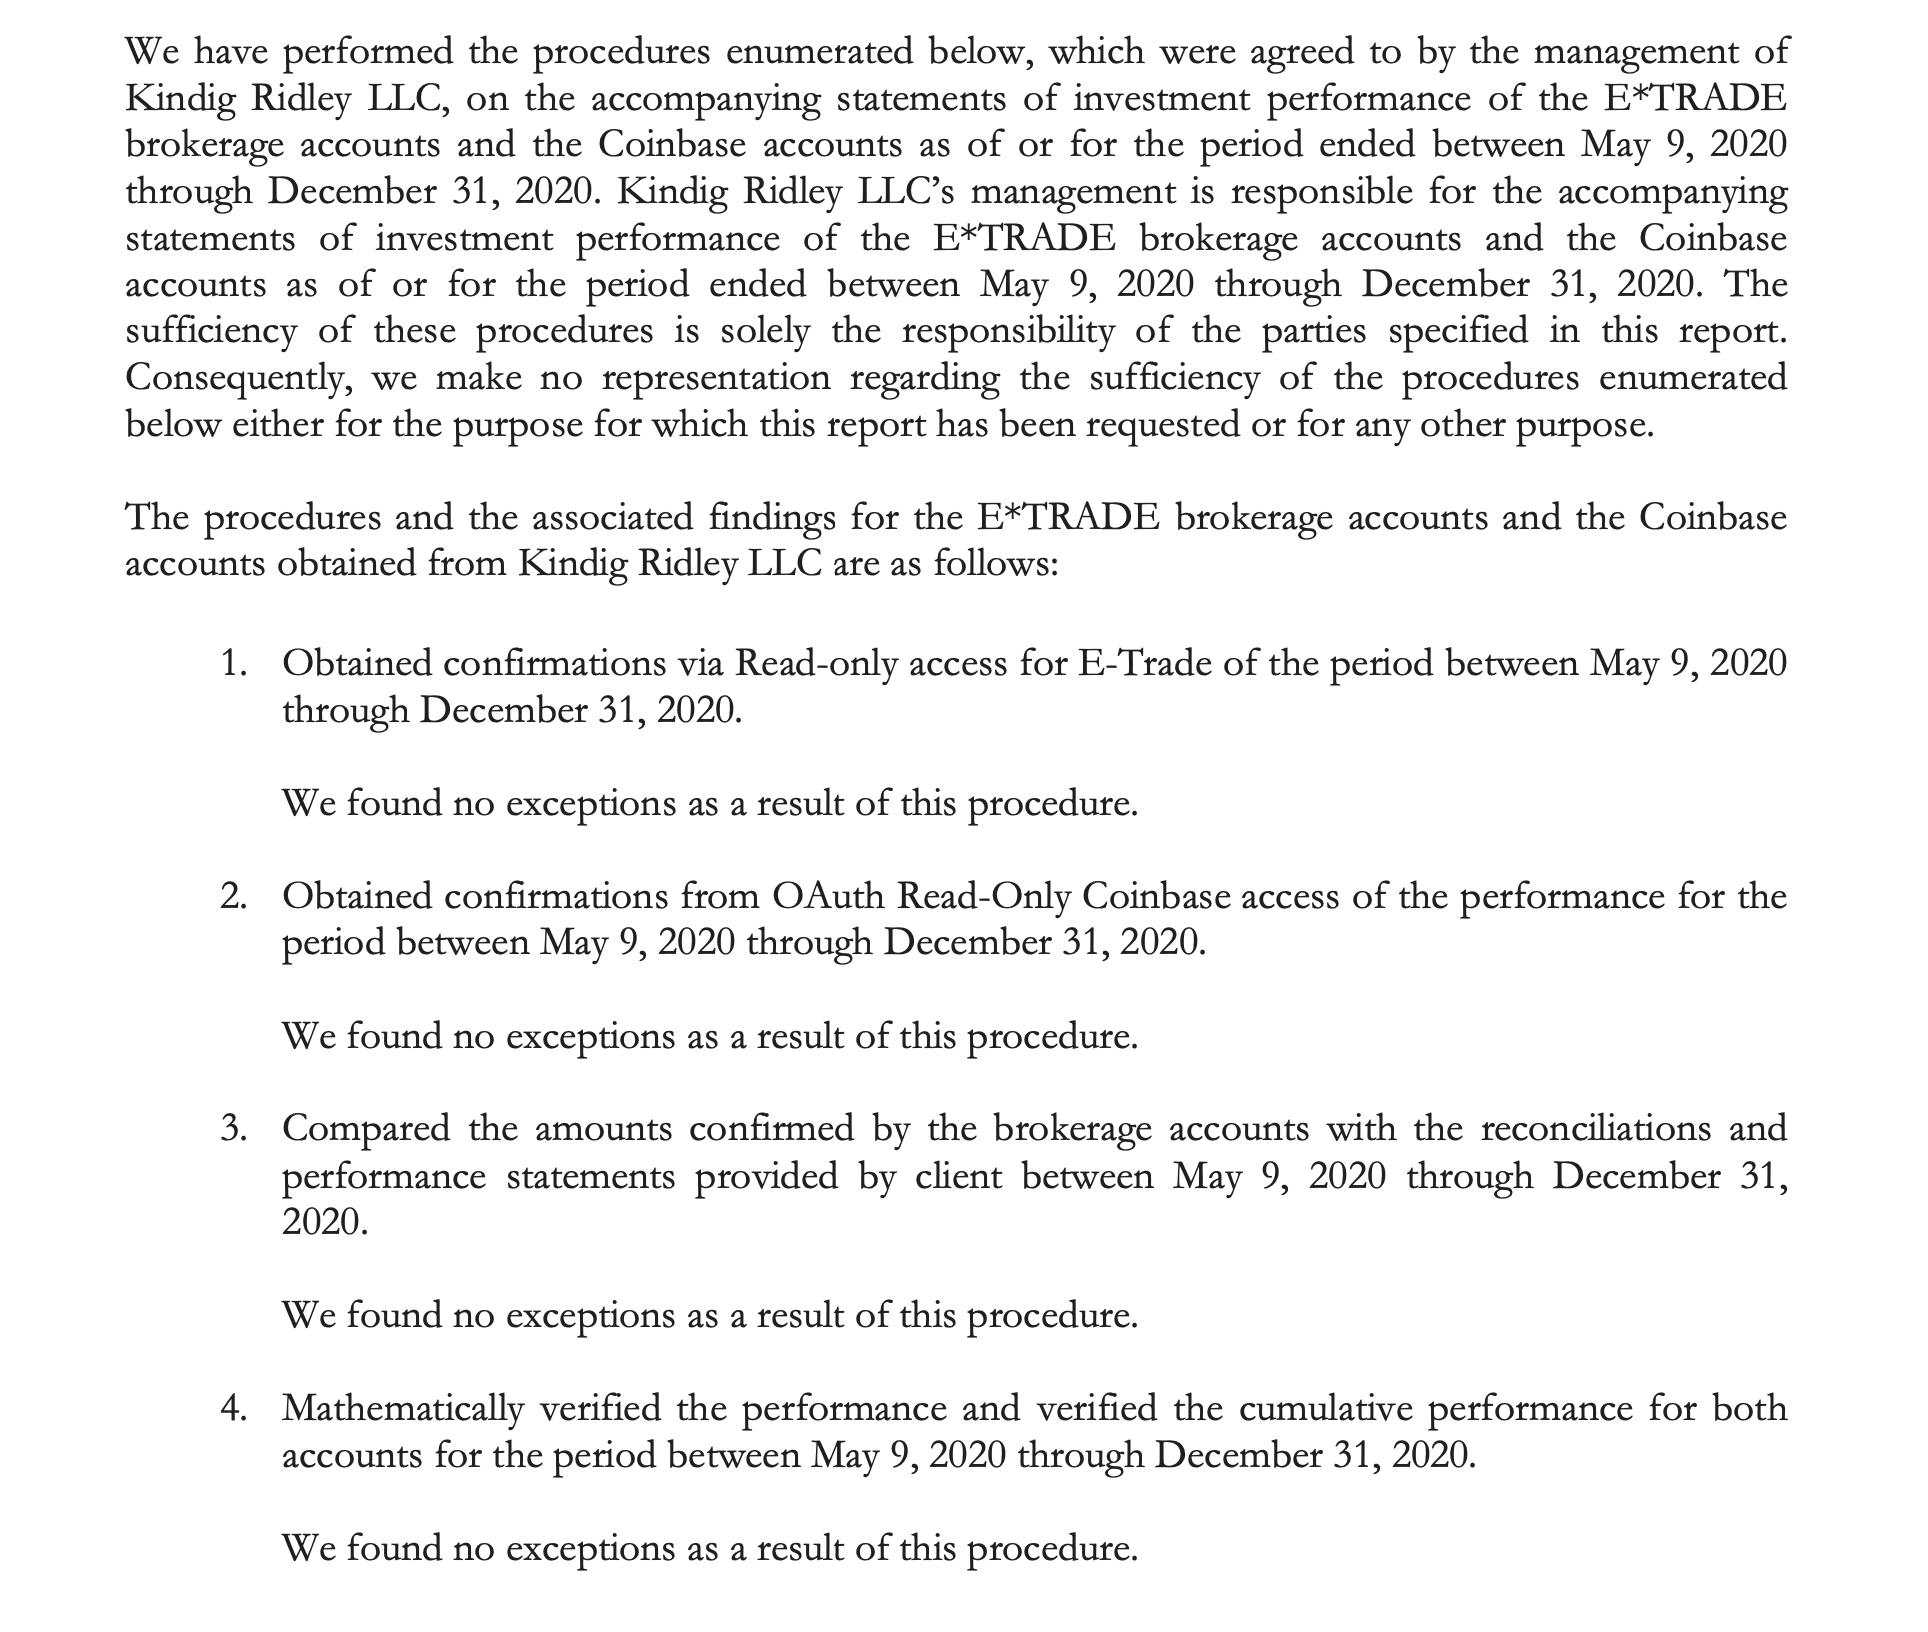
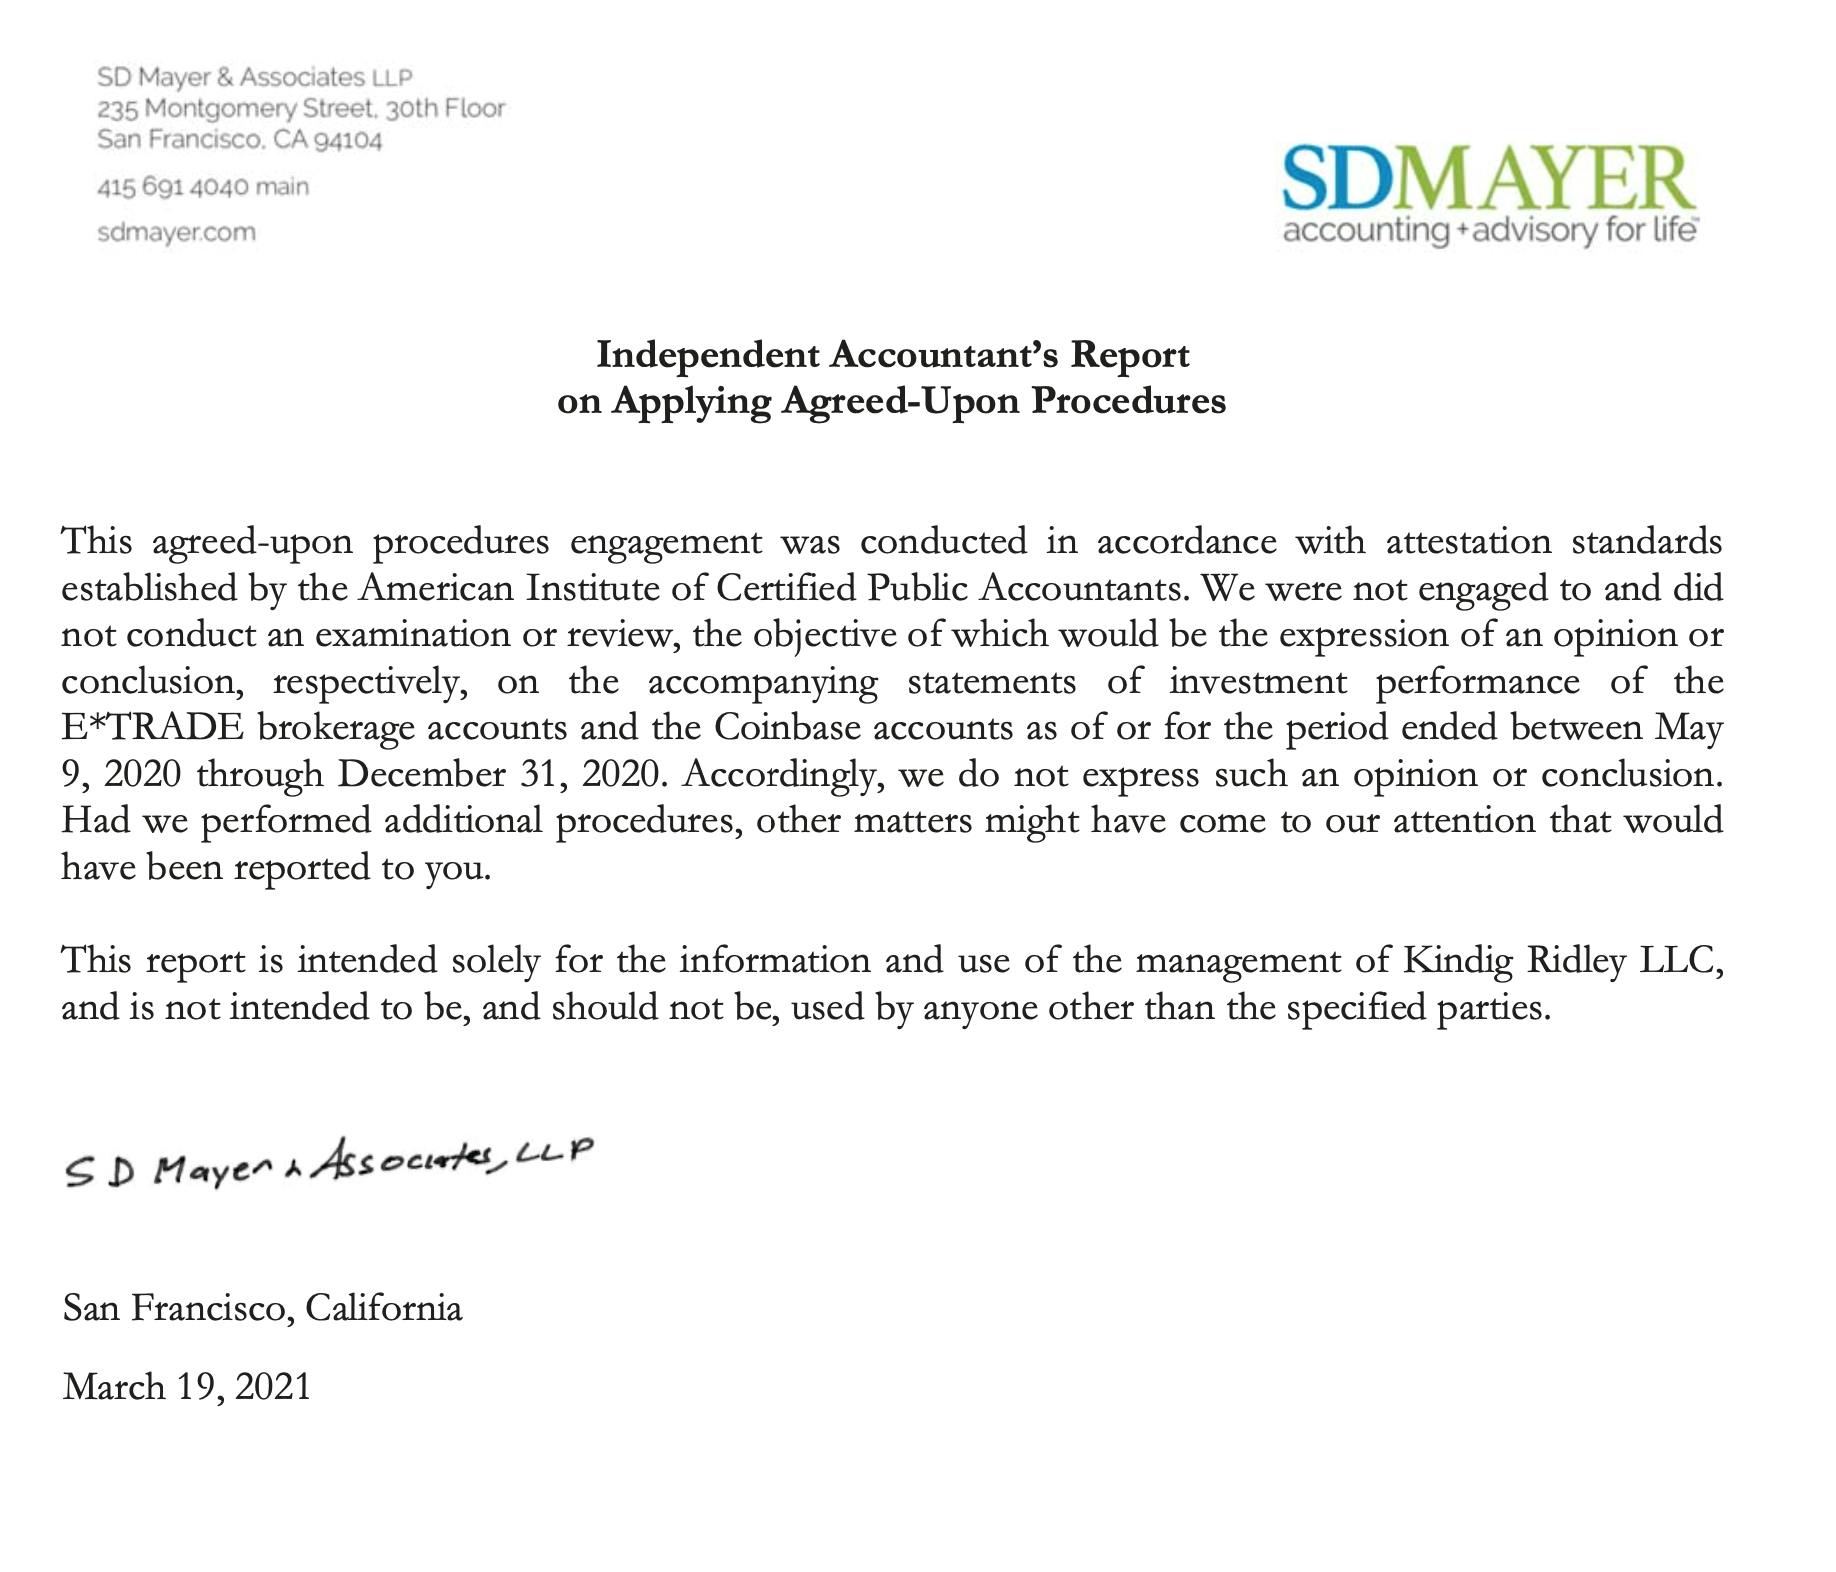
We plan to check in periodically with our returns. Please note, audited returns supersede any information we have provided that was unaudited. We pay an accountant to get our returns audited to build trust with readers and reduce any chance for error as we hold equities and crypto in separate accounts.

Our fund was founded on May 9, 2020, and this marks the inception of our fund to where the equities were combined. This is the date the auditors preferred to track returns for 2020, which makes sense because it represents our true YTD for the fund in 2020.

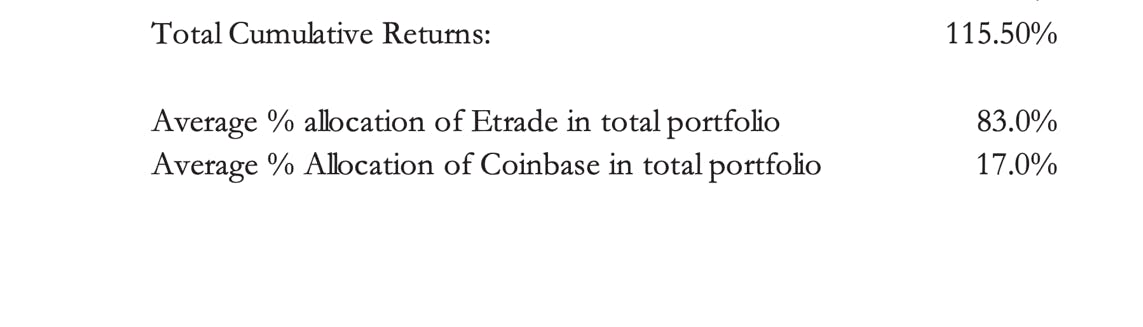
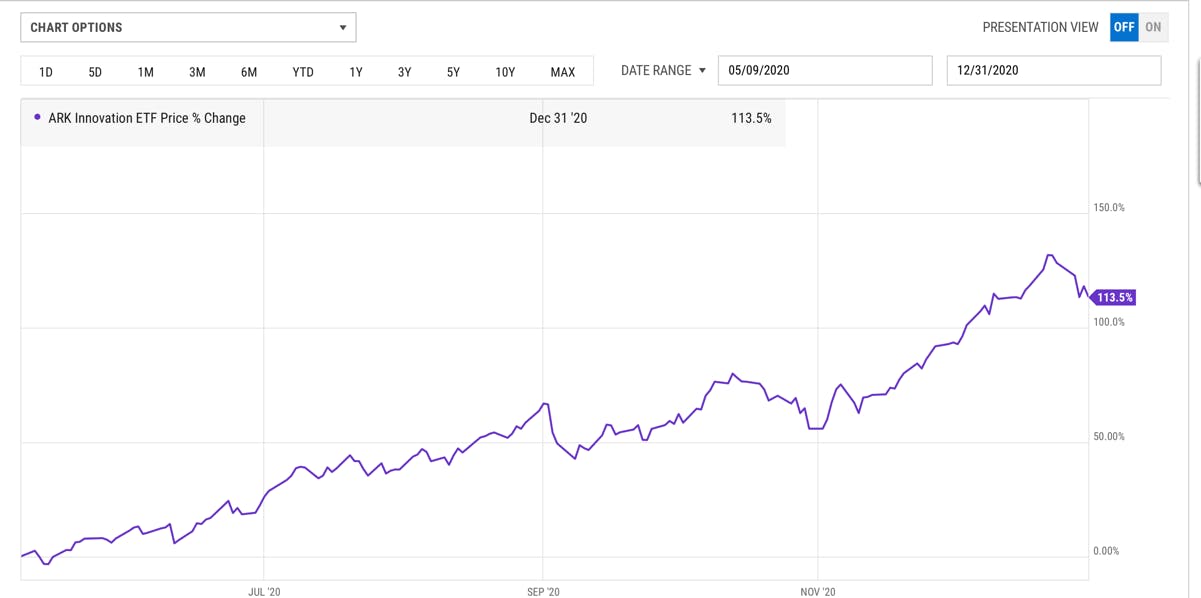
Below are the terms of the audit and our results from May 9, 2020 through December 31, 2020. We narrowly beat Ark with results of 115.5% compared to Ark Innovation’s returns of 113%.

Please note, although we are sharing our final number with you as a courtesy, we own the audit and we do not give consent for you to share this publicly. Although we will likely discuss our final number from time to time, the terms in which we do this are determined by our agreement with the accountant. 


The performance of Ark Innovation from May, 2020 through December 31, 2020 was 113.5%

YTD Returns

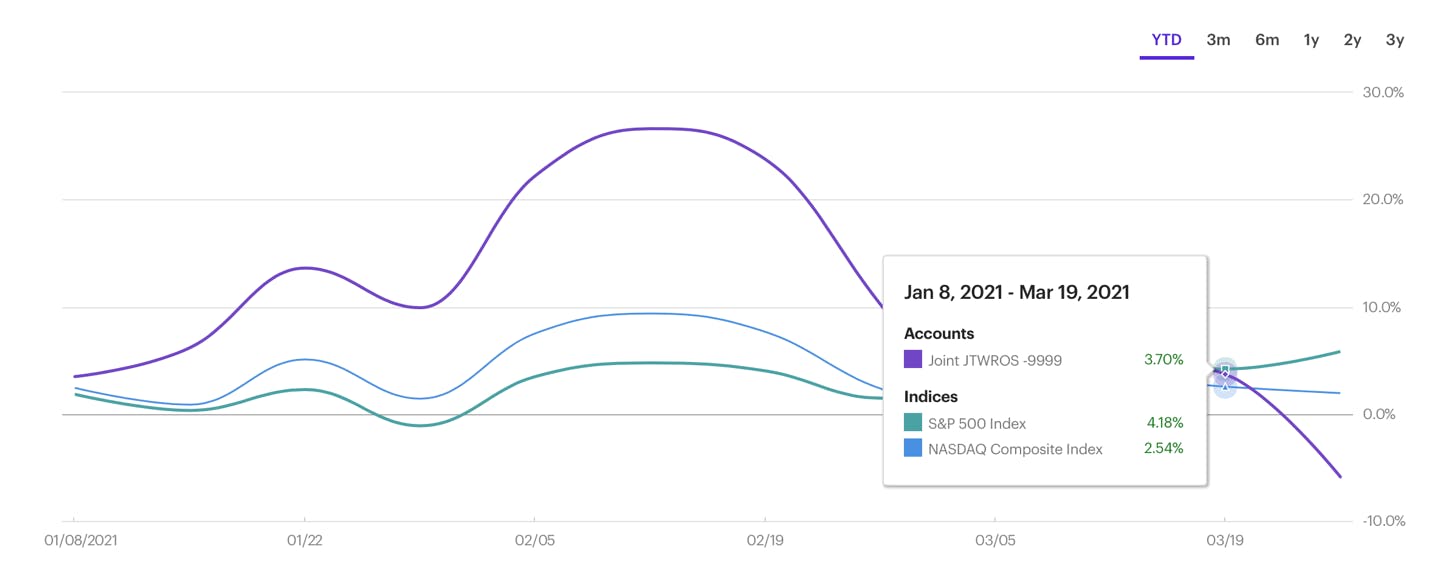
We were up nearly 2X the Nasdaq on March 19 and more than 4X the Nasdaq with crypto on March 19. You can see this screenshot below.

We decided to start buying, which hurts returns in the short-term as we are fully aware the correction may not be over. Therefore, everything we buy right now immediately weighs on our results – whereas during an uptrend, what you buy immediately improves your results.

By March 19, ARKK was negative (1.7%) per Ycharts on equities alone compared to our positive 3.7%. With crypto and equities, our returns on March 19 is positive 15% with Bitcoin being up 96% and Chainlink being up 149% YTD.

After buying many equities last week, we have now dipped to negative (5%) on equities for March 26 compared to ARKK’s negative (8.5%). However, with crypto we are at positive 7.78% YTD with 12% allocation to crypto and 88% allocation to equities.

We started the year with a higher allocation to crypto than 12%, so the 7.78% YTD is conservative.


We hope our transparency and investment in an auditor demonstrates our integrity and builds trust with you. We realize you have a choice in who you subscribe to and we want you to know that we invest in our convictions and are right alongside you during the ups and downs. Competitively speaking, we think a research site that is audited is putting forth their best effort to earn your trust in what can be a very convoluted and (sadly) sometimes unprincipled space.

As we continue to build out our services with integrity, we believe the strength of our team will become even more apparent. Please keep in mind, we launched in July of 2019 and are about 18 months from the launch. I can only imagine what the team will be capable of over the next five years as we were comfortably positive with crypto during a major and severe selloff in tech.

We are also accomplishing this as a 4-person team compared to Wall Street funds who have hundreds of analysts contributing to portfolio decisions and machines calculating entries and exits.

We do understand that we are often painfully slow in making changes to our site and the forum. We do this to make sure we don’t take our eye off the ball with the market.

With that said, the site is now live and the new customized forum will be launched in May. We think the new site is simple, effective and fast to load. The forum is an important project that we plan to continually improve on and we can’t be more excited to share this with you in May.

Thanks for your readership and for being part of the I/O community.

Sincerely,
Beth

Ethereum Network: Premium Analysis

b56b12b6-41b9-42e9-87d9-01624c5c7f3f_Ethereum+Network+Premium+Analysis.pdf

Ethereum Network: Premium Analysis

We began covering cryptocurrency and the blockchain after a month of launching our premium site because we felt it was an important component to any tech portfolio. The debate around crypto/blockchain is distracting investors from the opportunity that the blockchain will deliver. 

Below is a full-length analysis on Ethereum as the Ethereum Network is going through extensive iteration that will propel the platform to become the backbone for crypto payments and decentralized apps. If you like my Nvidia thesis on the CUDA platform for AI development or if you understand the Apple thesis over the past ten years which centers around developers supporting the iOS ecosystem (rather than only the iPhone) – then you should like Ethereum. 

The blockchain is coming … and debates over Bitcoin can’t stop the blockchain from maturing. If you don’t like Bitcoin, then that’s okay. But it shouldn’t deter you from considering blockchain investments. Ethereum is another choice and Chainlink is one I’ve been particularly keen on. In fact, Chainlink was my choice for the inaugural LTBH one-hour webinar because I think there could be notable upside and I don’t want my subscribers to overlook the technology because it trades as a crypto. 

In my opinion, Ethereum also has notable upside and we want the I/O Fund to have some allocation here. As many of you know, we lean heavily on Knox for entering, exiting, or trimming crypto as it’s especially volatile. We will not necessarily enter right away — and also be prepared for Knox to require more than one entry if the crypto market turns. However, it’s well worth the effort as its early days for the blockchain.

You could see us trim Bitcoin and add to Ethereum in an attempt to participate in the blockchain trend while having proper allocation as Bitcoin had neared 10% of our portfolio and it’s now at 7% through trimming. Ethereum also helps diversify us for decentralized applications and other tokens. Or, we could add more to LINKUSD.  

You can read our previous analysis on Bitcoin here and on Chainlink here.

The analysis below describes what Ethereum is setting out to achieve and why some of the best blockchain investments are not likely to come from a traditional stock (they’ll come from crypto). In other words, if you want to participate in the early blockchain trend, then you’ll have to get comfortable with crypto.  

History of Ethereum

In October of 2008, the markets came to the realization that the Lehman Brother’s bankruptcy was likely not an isolated incident. While the world was scrambling to discern the severity and extent of financial crisis, the stock market hit a new low that resembled a genuine panic. At the same time, a mysterious person or group of people, under the pseudonym of Satoshi Nakamoto quietly published a white paper. This report described a new monetary system that would rely on a decentralized network of computers to verify all peer-to-peer value exchanges through a digital token called bitcoin. 

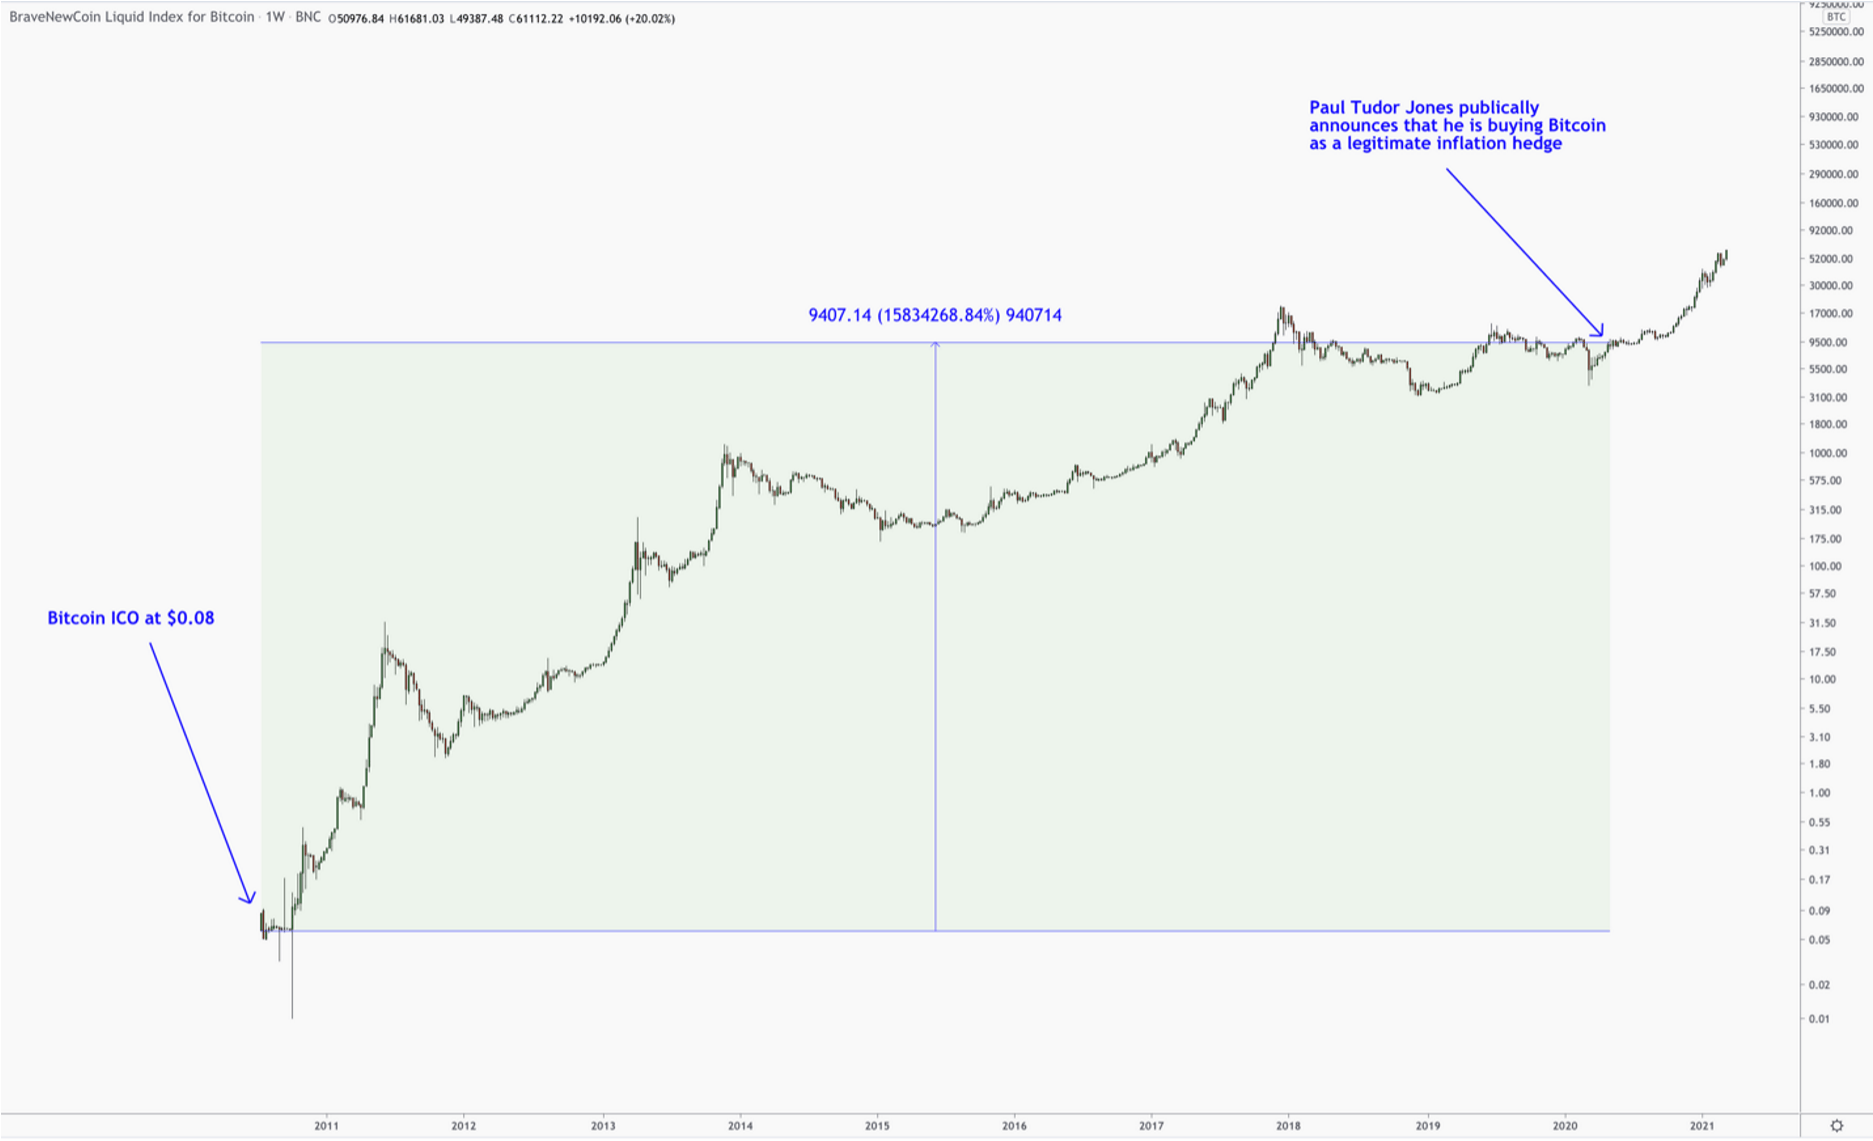
Largely unnoticed at the time, while the centralized banking system was in a full melt down, Bitcoin was suggesting a new monetary system that could make the centralized banking system largely obsolete. It wasn’t until January of 2009 that Bitcoin was released with an initial market price of $0.08/bitcoin. Still, it took just over 10 years, and over 15,800,000% appreciation before Bitcoin’s stated thesis gained public acceptance from institutional buyers.

Next to Bitcoin’s dominance, the undisputed runner-up is Ethereum, which is the second most valuable coin in terms of market cap, as well as public mindshare. Without a full understanding of why this is, most people would assume that Ethereum must have been launched soon after Bitcoin. This is not the case.

The second cryptocurrency to launch in April of 2011 is known as Namecoin. Nearly identical to bitcoin, including the same number of coins in existence, it’s stated goal was to improve anonymity for miners. Roughly six months later, Litecoin was launched and was able to take on the moniker of being known as silver to bitcoin’s gold. It also was similar to bitcoin, but offered double the number of coins, and allowed for quick mining transactions.

Most altcoins track a similar path – using the same, if not closely identical mathematics in an attempt to provide slight variation of bitcoin and compete as the dominant cryptocurrency of choice. We saw hundreds of these alt coins hit the markets prior to Ethereum’s launch in 2015, including Ripple, Monero, and Dash. Unlike the previous altcoins, what Ethereum offers is a network and platform for developers to expand the use of blockchain rather than to compete with Bitcoin as a cryptocurrency.

Ethereum Network 2.0

The primary difference between Ethereum and Bitcoin is that Ethereum is not trying to compete as a currency. The focus of Ethereum is on its network, not the coin. Butkin’s vision is to create an open network for decentralized applications (dapps[1]) and smart contracts based on the Turing complete programming language Solidity. 

The main issue that Ethereum has had to overcome is the constraints in transactions per second (TPS) and how to overcome the high energy costs of mining that comes with decentralized security. The network simply couldn’t scale without the recent release of Ethereum 2.0. 

To understand this further, we need to break down Proof of Work (PoW) and Proof of Stake (PoS). The previous method for decentralization was run through PoW, which is an algorithm that requires a miner and large amounts of computational power to create blocks and to confirm transactions. Due to the high costs in terms of both speed and energy, the Ethereum Network struggled to scale. Last November, Ethereum 2.0 was released and introduced PoS. Instead of a large consumption of energy, PoS requires a financial commitment of 32 ETH to become a validator. The network required 524.224 ETH or 16.384 validators by December 1st in order to start the new phase of Ethereum 2.0. As of mid-December, more than 1.1 million ETH had been staked from 33,000 validators. The most recent number is 1.6 million ETH.

The Ethereum that is staked in the new protocol receives interest with early yields up to 20%. The more Ethereum that is staked, the lower the interest. Interestingly, Ethereum has not built the algorithm that will allow you to unstake them, so this is a long-term bet on Ethereum for anyone that is staking their coins. 

Shards are another critical improvement for network bandwidth and the low transactions per second (TPS) as Ethereum 2.0 (ETH2) allows for improved data processing. Nodes in the previous network must download a transaction, calculate it, archive it and read every transaction in Ethereum’s history, which is terribly inefficient. Shards create a subset of the network where nodes are dispersed for more efficient processing. The Beacon Chain ensures the nodes are synchronized and the validators are reporting the blocks of transactions. 

The original Ethereum network will run in parallel with ETH2. 

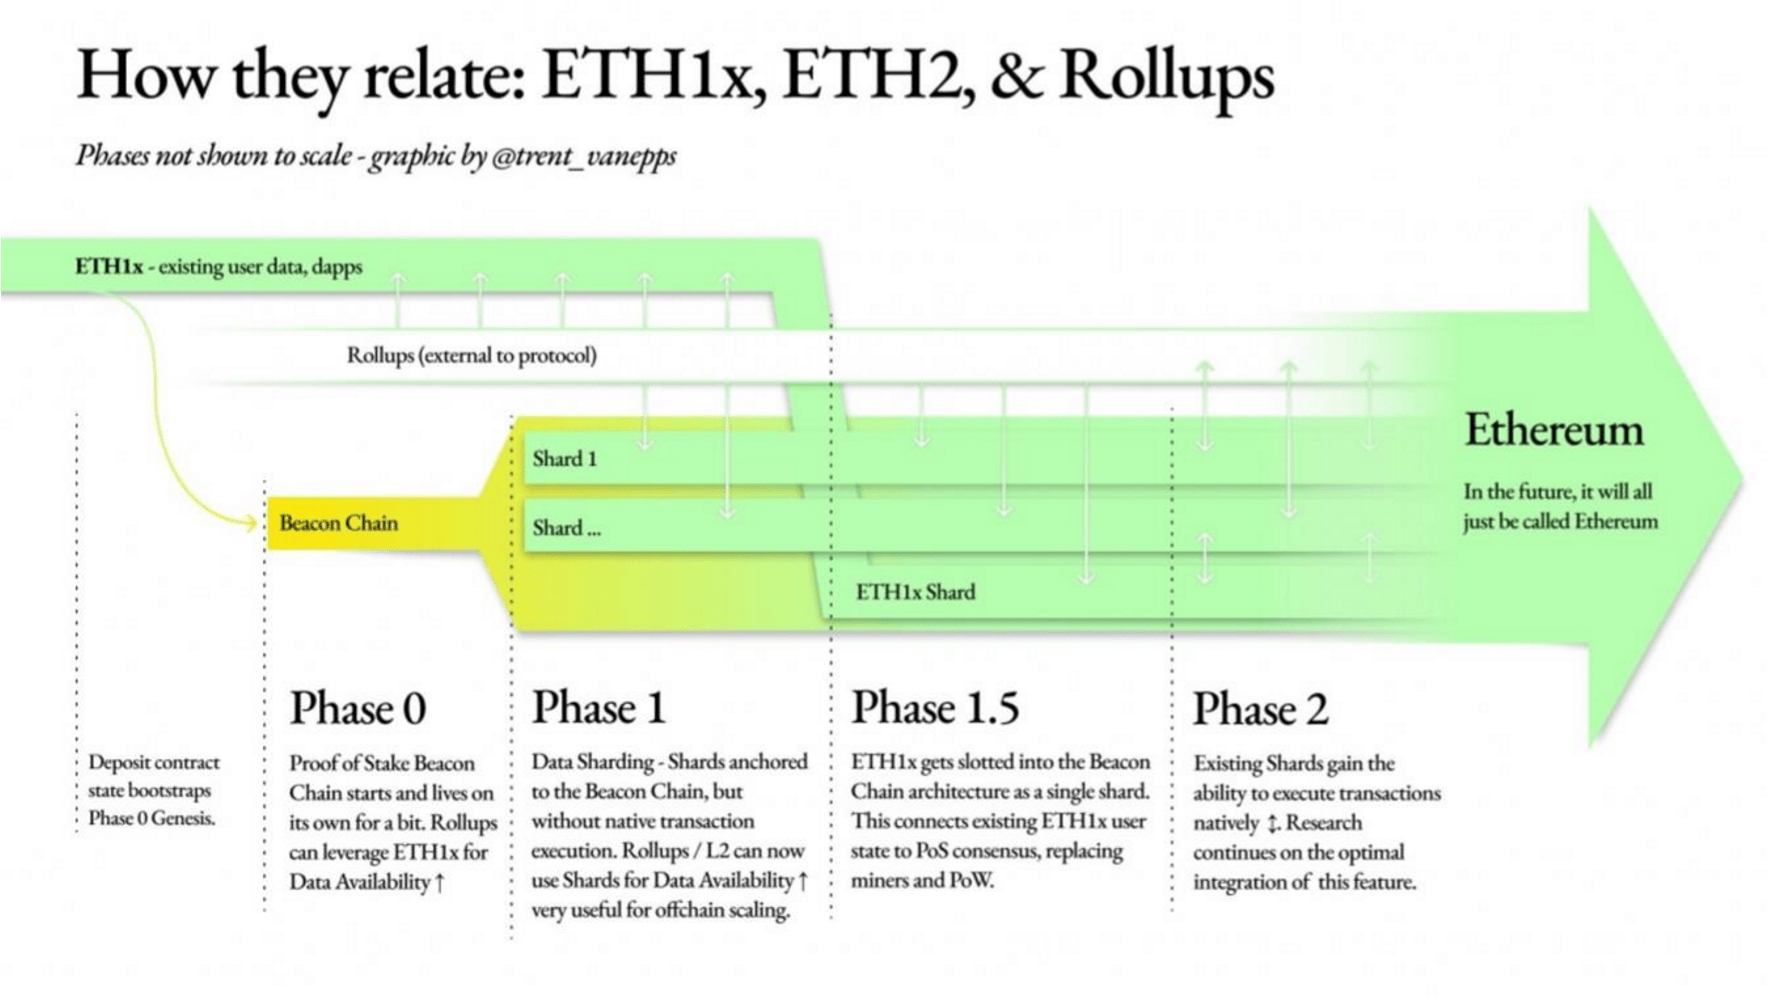
Phase 0 of Eth2 went live on December 1st and there are a total of four phases. Phase 0 included the launch of Proof of Stake Beacon Chain. 

The most recent road map released by Ethereum does not show the subsequent phases. The shaded green shows the current progress in the link provided. Missing deadlines is an issue with Ethereum so perhaps the removal of these phases is to make it easier on the team/network.

The term Rollups refers to ZK Rollups, which allows for hundreds of transfers to be rolled into a single transaction. This will replace Plasma, the current option where only a single transfer is made per transaction. In this case, the smart contract will verify all of the transfers in the Rollups. The goal is to reduce computing and storage resources by reducing the amount of data held in a transaction. 

In the ZK-Rollup scheme, a transactor and relayer are needed. The transactors create a transfer and broadcast it to the network. In this case, a shortened 3 or 4 byte indexed version of the address helps to reduce resource needs. The relayers collect hundreds of transfers and roll them up, essentially, to generate a hash that compares a snapshot of the blockchain before the transfers and a snapshot of the blockchain after the transfers. In most cases, the transfers will be recorded by a change in the wallet values. The hash that represents the wallet values or the delta to the blockchain is called SNARK proof. The changes to the hash are reported to the blockchain.

Relayers are established by staking a required bond, or token amount, in the smart contract. The result will be fewer transaction fees that are processed faster than the previous Plasma framework. In the ZK-Rollup framework, blocks are computed in a parallel computing model that lends itself to decentralization. There will be less data than the previous framework which increases throughput and scalability. 

Zero-knowledge proof techniques use mathematical equations for authentication without requiring passwords or sensitive information. The words “Zero-knowledge” means that the verifier can prove the first party can be trusted without revealing sensitive information. This is done through probabilistic assessments where the validity has a high probability. 

Zero-knowledge is essential to cryptocurrencies because a crypto transaction can be verified without revealing information about where the payment came from, where it was sent or how much currency was exchanged. Bitcoin does not use zero-knowledge as all of this information is revealed and recorded. 

The Ethereum network has more security risks than the Bitcoin protocol. The initial setup of ZK-Rollups assumes a trusted state and relies on a small group of developers to establish this initial trusted state and one of the developers could manipulate the code. The initial setup is not a decentralized.  

Quantum computing could crack ZK-Rollups if the correct hash is guessed by the computer. This is more likely than guessing an encrypted protocol. 

Ethereum is becoming the blockchain of choice through the Enterprise Ethereum Alliance, which is a list of over 200 companies, including AMD, Banco Santander SA, FedEx, Intel, JP Morgan, Microsoft, and VMWare. These companies have agreed to build smart contracts on the Ethereum blockchain, further increasing the value of Ethereum. We think the number of endorsements as Ethereum 2.0 is built out.

Decentralized Finance (DeFi)

DeFi, or decentralized finance, began in a telegram chat between Ethereum developers in August of 2018. The term refers to the open ecosystem of financial applications built on the Ethereum blockchain. Peer-to-peer (P2P) is used interchangeably as the network is verified by peer computing systems rather than one centralized source.

The basic tenants of DeFi applications are:

1) No Custodian. In other words, there is no bank or custodian in-between transactions. Each individual controls access to their own crypto, transactions and data around their activity. 

2) The network is Global. There are no borders, exchange rates, currency differentials, or waiting for global transfers. Everyone on the network, regardless of country, will be able to transact instantly with anyone else in the world with ease.

3) The network is open source. This allows developers to view the code of any and all applications on the Ethereum blockchain and for the ecosystem to evolve.  

4) Decentralized network. The Ethereum blockchain is run off of thousands of “nodes.” These nodes are constantly computing the transactions within the blockchain from around the world, making it nearly impossible to hack as well as regulate. 

There is $24 billion locked into DeFi projects as of 2020.

Decentralized applications (dapps)

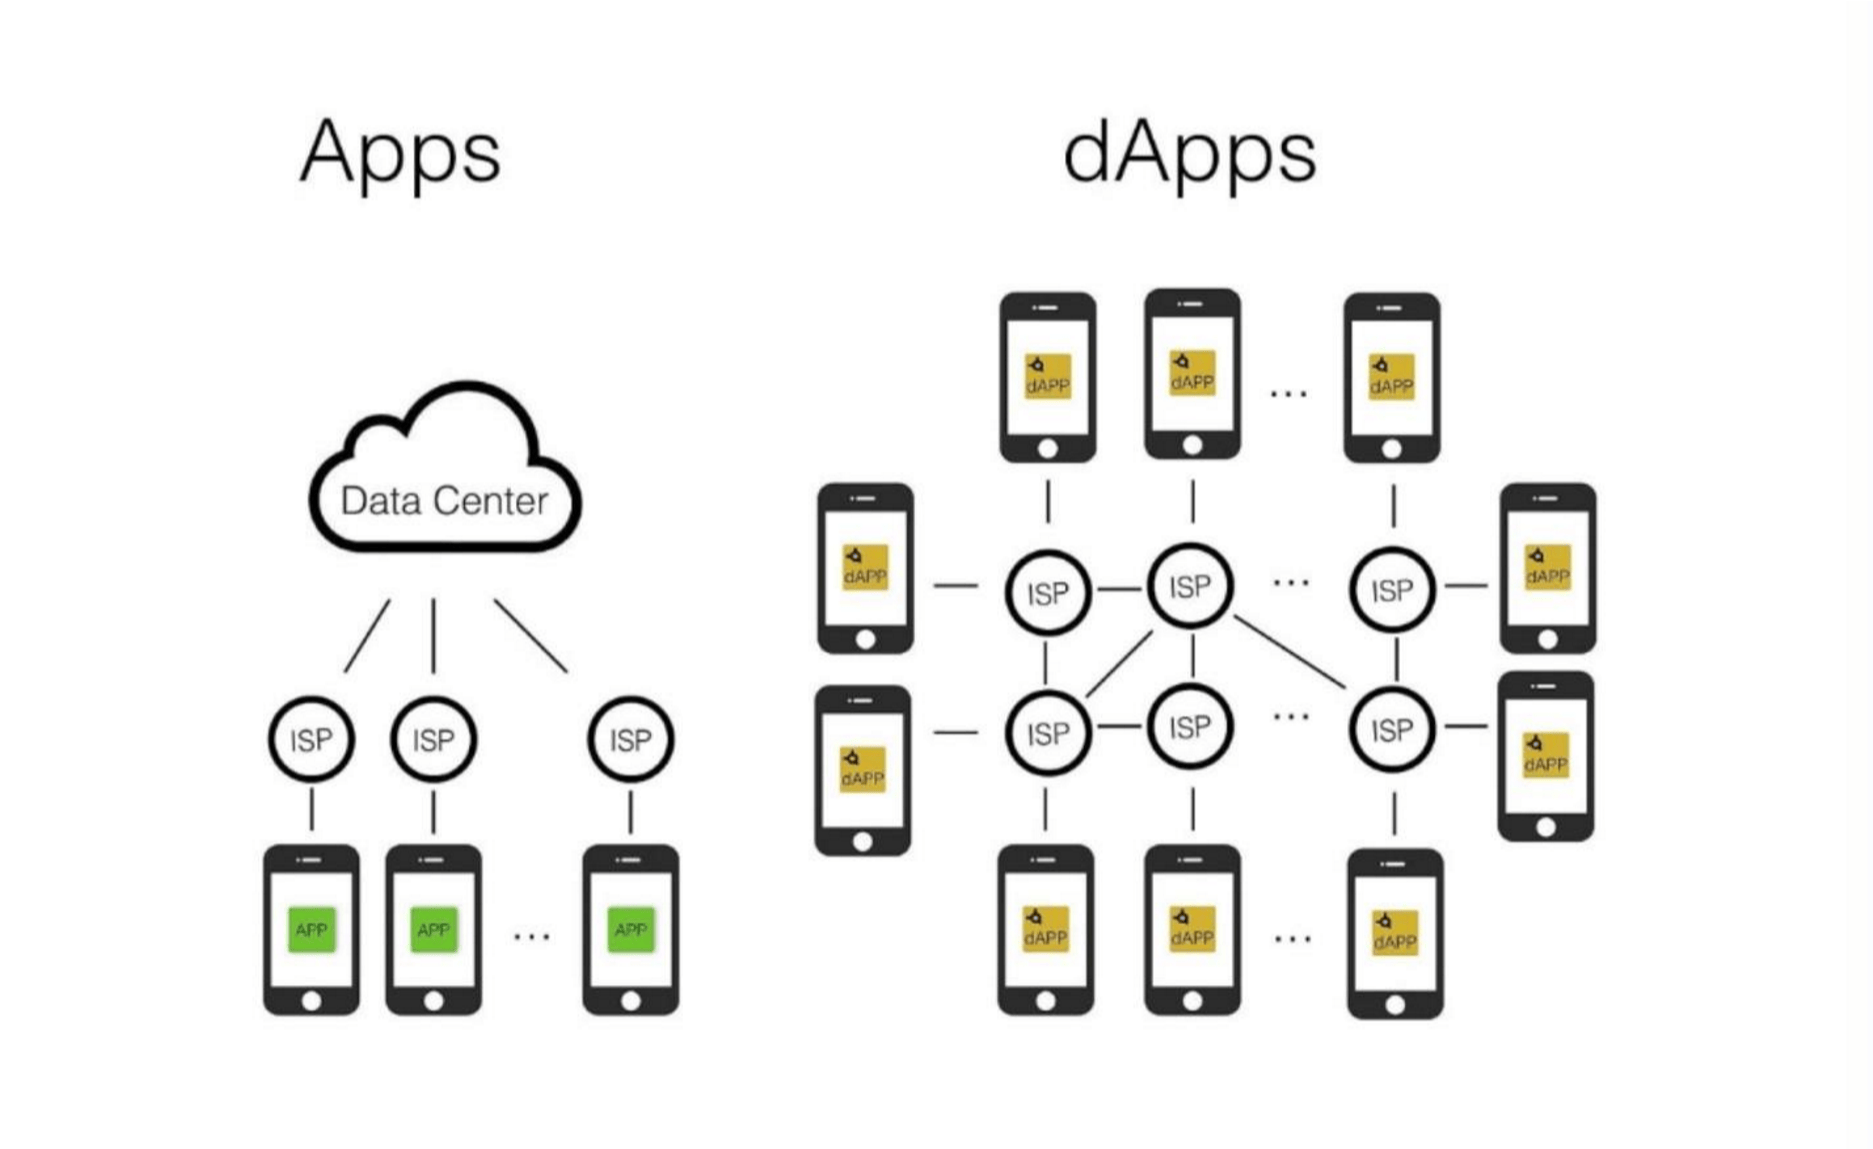
We discussed the difference between centralized and decentralized in the Chainlink webinar and why decentralized results in a more secure protocol or transaction. Ethereum’s network is often called a platform or the “world’s computer” because it allows for decentralized applications. Rather than having backend code on a centralized server, backend code is run on a decentralized network when built for the Ethereum platform. Developers use the Ethereum blockchain for data storage and smart contracts for the app logic.

We also discussed smart contracts on the Chainlink webinar. Ethereum is primarily set up for currency right now while Chainlink addresses off chain data for non-currency smart contracts. However, the principal is the same where there is a set of rules which self-execute like a vending machine. Dapps will rely on smart contracts. 

Dapps deployed on the Ethereum network are controlled by logic written into the smart contract and cannot be altered by the developer. Smart contracts function like APIs (we also talked about this in the Chainlink webinar). This allows applications to build on one another similar to the way applications use APIs today; except blockchain applications will build on smart contracts. 

The front-end application can be written in any language with calls made to the backend. The main qualities are that the applications are decentralized, can perform any action given the required resources (whereas Bitcoin is not Turing complete) and are executed in a virtual environment such as the Ethereum Virtual Machine. The virtual machine acts as a buffer to where if the application is faulty, it does not affect the blockchain network. 

There are a few key benefits to dapps:

•       Dapps are more secure and inherently protected from denial-of-service attacks.

•       Censorship will be nearly impossible as a single entity will not be able to block users from utilizing the blockchain. 

•       Fraud and other malice will be prevented as the data has complete integrity from the decentralized and cryptographic qualities of the blockchain. 

•       Because smart contracts are self-executing, they remove the need for a centralized institution. Realworld identities can also be anonymous with dapps.

There are also some drawbacks to dapps:

•       Most developers do not want to relinquish complete control over their creation*.

•       If there is a bug that need to be fixed, that developer is unable to take back control of the dapp once it’s launched onto the Blockchain*.

•       Dapps will need Ethereum 2.0 to achieve its final phase as applications will create too much network congestion at the 10-15 transactions per second.

•       User experience needs to evolve in order for users to interact with the blockchain in a secure fashion.

•       Some developers may utilize centralized servers for the frontend or to store business logic which could eliminate many of the decentralized security/anonymity benefits of the blockchain.

There are some applications that are decentralized but not built on the blockchain, like BitTorrent for peer-topeer file sharing. Tor is open-source software that enables anonymous communication and is also decentralized.  

Some of the early DeFi applications allowed for seamless swapping of coins for Ethereum and lending of collateralized loans with built in interest payments to the borrowers. Contracts can also be created between crypto and non-crypto assets like gold, silver, stock, currencies, etcetera. People are allowed to deposit what are known as “synths”, or synthetic coins that allows for the contract to be written and then exchanged. This allows individuals to trade assets on Ethereum without the intermediary of exchanges and broker/dealers.

There are even applications known as yield farms that allow investors to deposit their crypto into liquidity pools, which are loaned out, which allows them to receive yields on their crypto. 

Conclusion:

The Ethereum Network is becoming the backbone for decentralized finance and decentralized applications. Ethereum 2.0 needs another year minimum or about three years maximum to reduce energy use and increase throughput for transactions per second (TPS). Once this is achieved, Ethereum will be able to process payments faster than Visa, Mastercard or Paypal combined– going from 15 transactions per second to 100,000 transactions per second. For reference, most major credit card companies process about 2,000 TPS with 5,000 TPS as the upper limit. 

Cardano and Polkdot are competitors yet Ethereum is receiving global acceptance among developers and major endorsements from companies who are likely to be the first to develop dapps and embrace defi, as well. If Ethereum 2.0 delivers what it promises to, I believe ETH will become the backbone for the blockchain and this will be hard to disrupt.


Out of Favor With Investors, Poshmark Has Long Term Potential

Poshmark sits at the intersection of three key trends: non-new, sustainability, and social e-commerce. A consumer-to-consumer online marketplace for pre-owned items, Poshmark is a fashion-oriented platform that offers apparel, accessories, beauty and wellness, footwear, home goods, toys and games, and a new pets category. 

The app makes online shopping social, with a user experience similar to Etsy, Instagram, and Pinterest. Poshmark encourages users to follow each other, and like and share items for sale in users’ closets. It also offers video through Posh Stories, free virtual events known as Posh Party Live, and virtual meetups. Prior to the pandemic, Poshmark also supported in-person events.

As the largest fashion-oriented online C2C marketplace in the U.S., Poshmark’s IPO generated significant excitement. The company initially planned to offer 6.6 million shares at $35 to $39, but due to demand priced the IPO at $42. 

In its first day of trading Jan. 14, the stock opened at $97.50 and closed at $101.50, with an intraday high of $104.98. The stock has been falling ever since and reached a new low March 25 when it closed under $39.

Now that the valuation has come back down to earth, Poshmark may offer a good opportunity for investors who believe the future of ecommerce will be social. Below we look at competitors, fundamental, quarterly results, market opportunity, and potential tailwinds. 

Ebay Posts Record Growth  

To understand the potential opportunity in Poshmark, first we need to look at one of the largest online marketplaces in the world, Ebay. As more shopping moves online, specialized ecommerce platforms like Poshmark are fighting for current and potential Ebay customers. 

Founded in 1995, Ebay is the grandfather of the online auction. Like its much larger rival, Amazon, Ebay facilitates B2C and C2C sales through its website and makes money on transactions. Unlike Amazon, which has strict guidelines around used items, sellers can list almost anything on Ebay.  

But it has faced stiff competition from a new generation of online marketplaces that cater to niche interests, including public companies like Poshmark, Mercari, and The RealReal, which encourage users to clear their closets to make extra cash. 

In the universe of private companies, there is also a platform for every niche, from gently used children’s apparel on Kidizen to used tech on Gazelle.   

After years of declining growth, Ebay may have turned a corner last year. Due to tailwinds from Covid-19 and the resulting economic lockdown, the company reported double digit revenue growth in 2020. Here are the full year 2020 highlights

  • Revenue was $10.3 billion, up 19% on an as-reported basis. 
  • Gross merchandise volume (GMV) was $100 billion, up 17% on an as-reported basis and an FX-Neutral basis. 
  • GAAP and non-GAAP operating margin were 26.4% and 31.3% respectively. 

Due to a strong holiday season, Ebay also reported strong Q4 results

  • Revenue of $2.9 billion, up 28.1% YoY, beat expectations by $160 million. 
  • Non-GAAP EPS of $0.86 beat by $0.03.
  • GAAP EPS of $1.12 beat by $0.48.  
  • GMV was $26.6 billion versus consensus of $25.18 billion. 
  • Annual active buyers grew 7% to 185 million. 

Still, this pales in comparison with high growth e-commerce marketplaces, not all of which are young companies. 

Overstock, founded only a few years after Ebay in 1999, grew 2020 Q4 revenue 84.4% YoY. Wayfair, founded in 2002, grew Q4 revenue 45.1% YoY. Fintwit favorite Etsy, founded in 2005, grew Q4 revenue an astounding 128.7%. 

With the tailwinds from Covid looking ready to expire for Ebay, and the entire ecommerce sector, the market is dubious about whether Ebay can continue growth and beat tougher comps. Executives were upbeat in the most recent report, noting the progress the company made in executing on the three pillars of its long term vision:

  1. Defend the core business by building compelling next-gen experiences.
  2. Become the partner of choice for sellers.
  3. Cultivate lifelong trusted relationships with buyers. 

It is clear from the report that Ebay executives are aware of the risks to its core business from other ecommerce platforms. To execute on its strategic vision, Ebay is focusing on seasonal opportunities and non-new, including refurbished, which was a top trend for holiday shopping. 

How Big is the Opportunity in Non-New? 

The online U.S. resale market for apparel and footwear was estimated at $7 billion in 2019 and is expected to grow to an estimated $26 billion in 2023, according to data from GlobalData cited in Poshmark’s S-1.

A report last June by Poshmark competitor Thredup, which filed for IPO recently and is expected to begin trading on the Nasdaq March 26, valued the secondhand apparel market at $28 billion and predicted it would reach $64 billion within five years. It said the resale market grew 25 times faster than the overall retail market in 2019, with an estimated 64 million people buying secondhand products. 

Good opportunities attract competition, and competition for the online secondhand apparel and accessories market is fierce. 

In addition to Poshmark, Depop, Grailed, Mercari, Thredup, Tradesy, The RealReal, other notable competitors include Vestiaire Collective, a French company that recently raised $216 million in fresh funding, and Vinokilo, a German company that has not raise any venture capital and has been consistently profitable. 

Luxury brands and platforms are also starting to consider controlling the lifecycle of their own products. For example, luxury marketplace Farfetch launched Farfetch Second Life in November 2020. It allows customers to trade in high-end bags in exchange for a credit to shop new collections. 

Authentication is a key feature of the luxury resale market, such as designer handbags, shoes, and apparel. As part of its strategic vision, Ebay rolled out its own authentication program for secondhand watches over $2,000 and sneakers over $100 last fall.

Based on the results, it is a potentially profitable niche for Ebay, and validates part of the opportunity Poshmark and its competitors are trying to exploit. Ebay saw a double digit increase in GMV growth in Q4 versus Q3 for watches over $2,000, while sneakers over $100 grew triple digits YoY in Q4.

Investors should note that authentication has been controversial for sites such as The RealReal, an online and brick-and-mortar marketplace that offers authenticated luxury clothing, jewelry, and watches. 

The RealReal has been plagued by claims in the media, and on social platforms, that fraudulent products slip past low paid authenticators and are sold on the platform. The RealReal is also being sued by Chanel, which alleges that The RealReal is selling counterfeit Chanel bags. 

Poshmark has faced similar claims from users. So far, accusations against The RealReal seem to be more prevalent and much higher profile. The potential risk is real to any company that claims 100% authentic designer goods.

Tailwinds from Sustainability

Consumers are increasingly aware of the fashion industry’s impact on the environment. The U.S. sustainability market is projected to reach $150 billion in sales this year, according to Nielsen

In Europe, 67% of surveyed consumers consider the use of sustainable materials to be an important purchasing factor, and 63% of consumers consider a brand’s promotion of sustainability in the same way, according to July 17 report from McKinsey & Company on Sustainability in fashion. 

Secondhand is inherently more environmentally friendly, as it extends the life of consumer products. 

Seller Ecosystem: Size is a Moat

Sellers create marketplaces by offering the products that attract consumers. That is why one of one of Ebay’s three key priorities for its long term vision is becoming the partner of choice for sellers. In a virtuous cycle, sellers create the marketplace that keeps buyers coming back, which keeps sellers engaged. 

For example, of all buyers who activated on Poshmark between 2012 and 2018, 34% also activated as sellers by the end of 2019. Of all sellers who activated between 2012 and 2018, 39% activated as buyers by the end of 2019, according to the company’s S-1 Registration Statement.

For sellers, every marketplace has advantages and disadvantages. Poshmark’s fees are less complicated than Ebay’s but significantly higher:

·         Poshmark. For sales under $15, Poshmark charges a flat rate of $2.95. For sales above $15, the fee is 20%.

·         Ebay. Ebay has been working to simplify its notoriously complicated fees. For most categories on Ebay, managed payments customers pay 12.35% up to $7,500, plus 2.35% on the portion of the sale over $7,500.

Poshmark has been criticized for its high fees. But the company acknowledged in its S-1 the potential for future reductions:

“In the future, we may be unable to attract new sellers or retain current sellers at these fee levels, as they may choose to sell their merchandise on other platforms with lower fees. Furthermore, pricing pressures and increased competition generally could result in having to decrease fees, which could cause reduced revenues, reduced margins, or losses, any of which would harm our business, results of operations, and financial condition.”

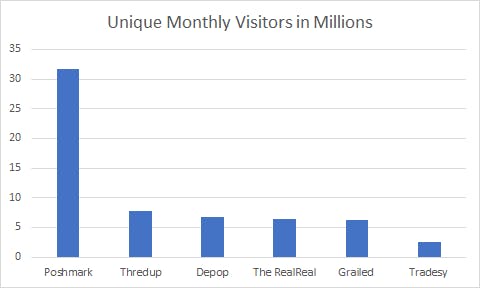
For Ebay, size is a moat. With its gargantuan user base, that moat is not easy to disrupt. The same may be true of Poshmark, which is the leading C2C marketplace for fashion, according to data from May 2020 from Statista, a German company that specializes in market and consumer data.

poshmark's number of unique monthly visitors in millions

Founded in 2011, Poshmark has grown significantly larger than other fashion oriented secondhand marketplaces, most of which were founded around the same time. 

Notable competitors in secondhand fashion include Depop, founded in 2011; Grailed, founded in 2014; Mercari, launched in the U.S. in 2014; The RealReal, founded in 2011; Thredup, founded in 2009; and Tradesy, founded in 2009. 

Mercari, a Japanese company, had 3.4 million monthly active users in 2019, according to a company press release. It can be difficult to sell on platforms with much smaller user bases, although it helps to offer desirable brand names, according to user reviews.

Some sellers dislike Poshmark’s social aspects—it creates extra work by forcing sellers to like and share items, and negotiate with potential buyers—the size of the marketplace means sellers and buyers keep coming back. In 2020, Users who spent an average of 27 minutes daily on the app continue to re-engage over time as buyers and sellers, according to Poshmark’s Q4 report. 

Fundamentals: User and GMV Growth 

Poshmark launched in the U.S. in 2011 with a valuation of more than $600 million. The company has an asset light model and does not own or manage inventory, as items are listed, sold, and shipped by sellers. 

In May 2019, Poshmark expanded to Canada, growing its community to more than 1.4 million users in that country within the first year. 

International GMV was $6.4 million in 2019, according to the company’s S-1. It grew to $32.6 million in the nine months ended Sept. 30, 2020. For each of these periods, revenue from international operations was less than 10% of the company’s net revenue.

As of Sept. 30, 2020, Poshmark had 31.7 million active users in North America, 6.2 million active buyers, and 4.5 million active sellers, according to the S-1.

Executives did not update the total number of active users or active sellers in the Q4 report. It did note an increase in active buyers to 6.5 million, a 20% increase YoY from 5.4 million in Q4 2019. Social interactions also grew 48% to 30.4 billion in 2020, according to the Q4 report.  


Poshmark Active Buyers (Thousands) 

poshmark active buyers (thousands)

Source: S-1 

Poshmark doubled the number of active buyers from June 30, 2018 to June 30, 2020, which it says has been a key driver of GMV growth.

GMV in Millions  

poshmark's gmv in millions


The company plans to continue growing through increased engagement, new product categories, and international expansion, starting with English-speaking countries. Last month, Poshmark launched in Australia

Poshmark chose Australia as its first market outside of North America due to the well-established thrift shop culture, high rates of e-commerce adoption, environmentally conscious consumers, said Chief Executive Officer Manish Chandra, in an interview with Bloomberg

Quarterly Results and Valuation 

Poshmark had a market capitalization of $3.35 billion and an enterprise value-to-sales ratio of 12.60 as of March 24. The company reported Fiscal Q4 2020 earnings March 11 for the period ending Dec. 31.

In Q4, Poshmark achieved its third consecutive quarter of profitability and had revenue of $69.3 million, a 27% increase from $54.7 million in the fourth quarter of 2019, according to the report.

Income from operations was $1.6 million, compared to a loss of ($15.1) million in the fourth quarter of 2019. GMV was $387.2 million, an increase of 28% YoY from $302.1 million in Q4 2019. Quarterly GMV has increased YoY for the past 11 quarters.

Adjusted EBITDA was $4.2 million which increased from a loss of ($12.6) million in the fourth quarter of 2019. Adjusted EBITDA margin was 6.1%.

GAAP diluted net loss per share attributable to common stockholders was ($0.31). Non-GAAP diluted net income per share to common stockholders was $0.05 a share and excludes non-cash expenses related to convertible notes and warrants due to the increase in the fair market value of our common stock share price.

For the full year 2020, income from operations was $23.4 million, compared to a loss of ($49.8) million in 2019. Net revenue was $262.1 million, a 28% increase YoY from $205.2 million in 2019.

GMV was $1.4 billion, an increase of 29% YoY from $1.1 billion in 2019. GMV has increased YoY since the company was founded in 2011.

Trailing 12 months Active Buyers reached 6.5 million in the fourth quarter of 2020, a 20% YoY increase from 5.4 million from Q4 2019. The company did not update the number of active sellers. Adjusted EBITDA was $34.3 million which increased from a loss of ($37.1) million in 2019. Adjusted EBITDA margin was 13.1% in 2020.

GAAP diluted EPS attributable to common stockholders was $0.22. Non-GAAP diluted net income per share to common stockholders was $1.25 a share and excludes non-cash expenses related to convertible notes and warrants due to the increase in the fair market value of our common stock share price, and the impact from the undistributed earnings attributable to participating securities.

Cash, cash equivalents, and marketable securities were $262.1 million as of Dec. 31, 2020. During the third quarter, Poshmark issued a $50.0 million three-year convertible note which converted into 1.4 million shares of Class A Common Stock upon completion of the IPO on Jan. 14, 2021.

Guidance for Q1 2021 is $76.5 at the midpoint versus $80 million expected, with adjusted EBITDA of $1.5 million at the midpoint. 

The company plans to continue executing on its four growth strategies: focus on innovation to drive user engagement, growing international footprint and capability, growth through category expansion, and deliver robust, easy-to-use, effective seller services, according to the report.

As part of that plan, in 2020 the company launched two new product categories: Beauty & Wellness and Toys & Games and launched several new features. Poshmark also completed the rollout of “Posh Stories,” the company’s first video feature which enables sellers to showcase and sell their listings with short videos and photos, released “Drops Soon,” feature that allows Poshmark sellers to pre-market items not yet available for purchase, and launched Reposh, a feature that provides users with a one-click way to resell items purchased on the marketplace.

Conclusion 

Poshmark is the largest online C2C marketplace in the U.S. that specializes in fashion, in a space with fierce competition. Its success is not limited to the U.S. After expanding to Canada in 2019, Poshmark grew its community there to 1.4 million users within the first year. Users apparently enjoy the social aspect of the platform, which uses an asset light model that been profitable for the last three quarters. 

The pandemic has created uncertainty for Poshmark, and the entire ecommerce sector. But with the recent expansion to Australia, and the launch of new categories and features, Poshmark has room to grow. It benefits from long term tailwinds, including an increased interest among consumers in sustainability and the rise of social commerce. 

Some investors have criticized the company’s social platform, saying it is a waste of time for sellers who will leave the platform. Poshmark has also been criticized for its high fees. We think these are relatively minor complaints about a platform with a record of success. 

Any company can lose market share to competitors. But Poshmark’s competitors have a lot of catching up to do. Now that the valuation has come down to earth, and sentiment with it, the stock may provide a good long-term opportunity—even if the growth is not what hypergrowth investors are used to.

Disclaimer: This article represents the opinion of the writer, who may disagree with the official position of Beth Kindig and I/O Fund. Jessica Ablamsky does not currently own shares of Poshmark but may initiate a position within the next 72 hours. Beth Kindig and the I/O Fund does not currently own shares of Poshmark. The content in this article is intended to be used for informational purposes only. The author has not received any compensation from any third party or company discussed in this article. The content is the expressed opinions of the author and is intended for educational and research purposes. Any thesis presented is not a guarantee of any particular stock’s future prices, so please factor this risk into your own analysis. It is very important that you do your own analysis before making any investments based on your personal circumstances. The author is not a licensed professional advisor. Please seek counsel form a licensed professional before acting on any analysis expressed in this article, to see if it is appropriate for your personal situation.


The importance of the NASDAQ100, and Levels to Watch

 Long term technical signals suggest the current selloff is a buying opportunityLong term technical signals suggest the current selloff is a buying opportunity

Coming out of the 2008 Financial Crisis, we saw a shift from value to growth for the first time since the 90s. Growth stocks took the lead and have been the general theme of the current secular bull market that we are in. With a multitude of tech focused microtrends like the internet, mobile, social media, e-commerce, now cloud and soon to be 5G and AI, the tech sector has led growth stocks. 

From a broad market perspective, the NASDAQ100 (NDX), and index of predominantly large cap stocks, has been the most important index to track within the current cycle. It has led the broad market into and out of almost every major correction since this bull market began.  

This pattern has even continued since the quick bear market in March of 2020. From peak to trough, while the S&P 500 saw a 35.40% drawdown, the richly valued NDX only saw a 30.50% drawdown. Since the March 23rd low, we have seen a consistent trend where the NASDAQ100 has led us into each correction and also bottomed before the S&P 500. 

However, since the recent correction began on February 16th, we have seen a meaningful shift from growth to value. Where the DOW is at new highs, the S&P 500 and DOW Transports are down less than 2%, while the NASDAQ100 is still about 7% away from new highs.  

This is a meaningful rotation, which we see as healthy. The microtrends in tech are not over or at the end of their cycle, regardless of stock prices. Also, we want to see as many sectors and stocks participating in this bull market, which is happening. 

Considering the importance of tech’s leadership, as well as the overall weight of tech within the S&P 500, which currently sits at about 24%, without the NASDAQ 100 participating in new highs, I would consider any bottom to be suspect. For this reason, we believe tracking the NASDAQ100 to be crucial right now in order to glean broad market cues. 

I/O Fund has been preparing for a correction since late February. We built up a nice cash position, which we were vocal about with our readers as well as on Twitter (here here here). We also added a series of hedges prior to the selloff, and have recently added them back due to the possibility of a lower low.  As of now, the long-term technical signals, and trend is still up. This suggests the current selloff is a buying opportunity, which we have been taking advantage of. 

NDX: Levels to Watch 

From a technical perspective, there are two scenarios we are tracking:

  1. The correction is over. For the green count in the chart above, we finished the final leg in the March 5th correction. If NDX holds 12,600 and we see a breakout above 13,300, the low is likely in for this correction. To confirm this scenario, we need NDX to breakout above 13,300, at which point our small hedge will come off.
  2. NDX makes a new low. If NDX breaks 12,600, that would put us in the red count. This count has us in the final leg of the correction, with a potential bottom at 11,715 to 12,050. 

Regardless of what path NDX takes, we view this pullback as a buying opportunity and when the correction is complete we expect the uptrend to resume. We have been building key positions as we feel you can’t time the market and you most certainly can’t time a bottom.

There are many tools we use to guide our entries as well as risk management. One is the RSI, which I believe will be a key technical indicator to focus on based on the pattern in the daily chart. The trendline that was acting as support has become strong resistance. NDX needs to break back above the trendline before we can call this correction over. Furthermore, NDX has major support at the blue line. This was the final capitulation point for the March 2020 lows. If NDX reaches that level, we will take it as a strong buy signal. 

Disclaimer: Beth Kindig and the I/O Fund currently owns shares of TSLA. The content in this article is intended to be used for informational purposes only. The author has not received any compensation from any third party or company discussed in this article. The content is the expressed opinions of the author and is intended for educational and research purposes. Any thesis presented is not a guarantee of any particular stock’s future prices, so please factor this risk into your own analysis. It is very important that you do your own analysis before making any investments based on your personal circumstances. The author is not a licensed professional advisor. Please seek counsel form a licensed professional before acting on any analysis expressed in this article, to see if it is appropriate for your personal situation.


Market Update – March 19th, 2021

Since the market topped on February 16th, the current correction is a very different experience depending on if one’s style of investing (value or growth). While the S&P500 only dipped 5.6% and is currently at new highs, the tech-heavy NASDAQ100 dipped 12% from peak to trough, and is still 7% from new highs. After value has underperformed for years, we are finally seeing a meaningful rotation out of tech and into beaten down value names.

The story on the rotation has to do with the quick rise in the US 10-year treasury yield. There are many reasons why bonds are being sold off, which inversely pushes up yields – inflation pressure has the bond market believing the FED will have to raise rates, which would likely stop this economic expansion. Also, the amount of fiscal debt written since the pandemic is creating a glut of supply, which the FED will likely not be able to fully absorb and this will put pressure on rates

Regardless, since many high growth stocks are projecting positive cash flow into the future, higher yields on longer duration bonds will affect future cash flows, causing a reset of current valuations. While the speed of the rise is unusual and unnerving to some investors, it is important to zoom out to gain some perspective on the recent move in yields.

As we can see above, the US 10-year treasury yield is still at historically low levels.  In the chart above, bear markets are highlighted in gray.  Going back to 1970, we have never seen a bear market begin with a US 10-year treasury yield below 3%.  Our current rate is around 1.75%. 

Further assurance comes directly from the Fed Chair, Jerome Powell, when he recently said the Fed expects to observe a momentary bump in inflation in March and April as the $1,400 stimulus checks shows up in economic data, but that they are not concerned about inflation rising above their 2.5% tolerance threshold.  If inflation start to rise more than expected, Fed officials believe they have the tools to control it. 

The Fed further claimed that they will be able to control inflation and has stated they will want to see maximum employment before changing their policy.  This suggests it could be at least 2023 before we see major policy changes from the Fed, which is in line with the timeline they have outwardly discussed.       

What’s Next?

With numerous microtrends in play, and recent earrings reports confirming or even raising future guidance, we view this correction in tech stocks as normal and temporary. We believe central banks are and will continue with an accommodative monetary policy for the foreseeable future.  Corrections in growth stocks are not uncommon or unusual, no matter how painful they may be.  A short-term price correction does not ultimately affect the underlying businesses of the stocks that we own.

In 2019, we saw a similar correction in tech growth. That year, the focus was on cloud pure plays, where the popular narrative at the time was stressing the overvalued cloud stocks as the neo-bubble stocks. While the S&P500 dipped 6.6%, and quickly recovered, many names like Twilio, Zoom, Fastly, Shopify, Okta, etc. saw corrections between 30-50%.

Our portfolio is geared towards taking advantage of powerful, long-lasting industry microtrends that will shape future generations.  It is therefore illogical to stress over daily price movements in these innovative companies.

Growth Vs. Value and the NASDAQ100

Since the current secular bull market began in March of 2009, there is not an extended period of time where value has outperformed growth. This has been a growth driven bull market, with tech leading the way.


Even since the March low in 2020, tech has continued this trend. After the pandemic shutdown, many tech names saw outsized growth due to ongoing microtrends, while others saw a bump due to a stay-at-home economy leaning heavier on tech for support. Many of the value names were hit exceptionally hard, further widening this gap. With valuations stretched in the tech sector, rates on the rise and the economy opening up, we are starting to see a real value rotation.


 As the chart above shows, the 14% Gap between Tech Growth and Value has nearly closed. In fact, while many growth names are down, much like the cloud names in 2019, value stock in the same timeframe are actually up.

We view this rotation as a positive sign for the overall market. We need all sectors participating in a bull market for it to remain healthy. Furthermore, we do not believe this market will continue with value leading the charge. There are simply to many exciting and profitable microtrends unfolding in tech, which we do not see ending anytime soon. Instead, we view this moment as an opportunity.

We have been focusing on the NASDAQ100 for several reasons. For one, it is predominantly tech focused. Also, it has been leading this bull market, and for the market to continue higher, we don’t see that being possible without the NASDAQ100. We really need it to join the other major indexes to new highs before we can count this correction as being over.

In short, if the NASDAQ100 can break above last Wednesday’s high at 13300, the probability increases that the low is in for this growth selloff. However, if we fail to break above this level, we could see another leg lower before we can write this correction off.

With the NASDAQ100 showing a negative RSI reversal signal, coupled with many charts we track whose current corrections appear to be incomplete, we may add hedges going into next week. We are 3% from the 13300 breakout, and about 10% from our downside target, if the NASDAQ100 cannot breakout above the 13300 region. This is the type of risk/reward we are willing to take for a hedge, if this final leg lower does unfold.

Relative Strength

Regardless, if we breakout and continue up, or need one final leg lower, we do not believe this bull market is over yet, and that this drawdown has provided some fantastic opportunities. In periods of market weakness, it is important to look at areas of strength. The future leaders tend to be stocks that go down less than their peers, bottom first, and lead out of a correction. That being said, the bounce off the March 5th low has provided some clues on where who might lead the next leg higher.

As the above chart shows, to lump all of tech into one category would be a mistake. Even though the S&P500 Tech Sector is showing poor relative strength in the chart above this year, as well as from the March 5th bottom, it’s important to identify what dominates that sector. Being a market cap weighted index, Apple and Microsoft makes up over 40% of the index, so it is heavily influenced by big tech.

If we dive into other microtrends within tech, there are a handful of sectors that are showing strong relative strength, even in light of the tech sell-off. What interests us are the sectors that are showing the most strength since the March 5th bottom.

Bitcoin/Crypto Currencies

The number one performer since March 5th is bitcoin/cryptos, and the businesses around this microtrend. Bitcoin is up over 58% YTD, and more notable is that it has continued its strength since the March 5th bottom. Bitcoin is our largest position, and though we are forecasting a bout of weakness in the near future, we do believe the uptrend will ultimately continue into 2022.

However, there are several businesses that benefit from the crypto market, such as Square, Silvergate Capital, eToro, Coinbase, Voyager Digital, just to name a few. We currently own Voyager Digital (VYGVF), which is a crypto exchange as well as a fintech company.

After being up over 500% YTD, we believe Voyager’s best days are ahead of it. It’s also the leader of the group just mentioned in terms of projected forward growth. If Voyager Digital continues with the revenue it already posted in February at $20 million per month, the valuation below will be cut in half.

China Tech and Green Energy

Another trend we have seen since the March 5th bounce is green tech and Chinese tech. In fact, they rank as the #2 and #3 micro sectors within tech since the March 5th bottom.

This falls in line with one of our favorite tends in 2021 – Chinese EVs. XPeng has been in a large downtrend, which we have thoroughly tracked and bought into along the way. Since the March 5th bottom, XPEV has bounced as much as 48%, showing outstanding relative strength. Nio has also bounced as much as 38% from the bottom. We used this bout of weakness in Nio to begin our position. Even if we do see another leg lower in the market, the reaction from March 5th further confirms the opportunity we see in the Chinese EV market in 2021, which we will continue to target. 

You can read Beth’s analysis on XPEV and NIO here and here.

OTT/CTV Ads

Finally, OTT/CTV Ads has also shown considerable relative strength since the March 5th bottom. Going into 2021, it was one of our biggest convictions and we allocated our portfolio accordingly. This micro sector has been considerably strong YTD, outperforming all major sectors in the broad market, short of beaten down energy stocks. It currently ranks #4 in terms of strength since the March 5th bottom, suggesting that this trend still has more room to run.  

We currently own Roku, Magnite, Fubo within this trend. Even after a considerable drawdown in these names, they are still showing outperformance against the NASDAQ100.

Stocks on our Radar that are Showing Solid Relative Strength

Two more stocks that made news from a relative strength perspective include UPST and VUZI.  UPST recently raised 2021 revenue guidance by over 50% and the stock roared higher, while VUZI stock also reacted very positively to its earnings beat. 

Conclusion

We do not believe that this is the end for tech leadership in the bull market. There simply too many important microtrends at play, and more about to go online. This rotation is healthy. We want as many stocks and sectors participating in the bull market, which is typically what we see going into the strongest leg of a bull market.

We believe this correction has provided a fantastic opportunity to buy shares of out-of-favor tech names, which we do not believe will stay out of favor for long. The relative strength in certain micro sectors is telling us what areas will likely lead into the next leg up, and we are pleased to see that they are lining up with Beth’s 2021 thesis so far.


Levels to Watch: Bitcoin Approaches Upside Target

After reaching a new all-time high of more than $61,200 per coin last weekend, Bitcoin is currently trading around $59,000.

After a large bounce off a low of $45,260, Bitcoin cleared the lower level we indicated in our last Bitcoin analysis: $53,000 to $56,000, which we used to trim our position. We stated the next level to watch is $70,000/$80,000 and we continue to believe that Bitcoin will make a local top.

After recent price action, my target is now $65,000/$75,000 before we potentially see a larger drawdown. We will continue to hold our position as long-term it will trade higher but we think there is an opportunity where we see Bitcoin trade at lower levels in the near future.

Below we look at what might be next for the world’s most popular cryptocurrency.

Levels to Watch

bitcoin chart displaying levels to watch


Bitcoin is now approaching our upside targets for the end of this larger 3rd wave, which is on the chart in blue. Several cues are pointing to this region, with a focus on $65,000, $75,000 and $107,000.

However, the internal momentum is weakening, which suggests that the lower targets are more probable than breaking the $100,000 region on this uptrend. The RSI may be particularly important. The RSI has respected the upward trend channel since the 3rd wave started in March of 2020. If this breaks to the downside, the 3rd wave is likely over.

Even more concerning is the negative divergences developing in the RSI on the daily chart. As the price makes a higher high, the RSI is making a lower high. This suggests that price is on faulty support at these levels.

Bitcoin is one of our largest holdings in our I/O Fund. We purchased Bitcoin in March 2020 at around $7,750 and sent an alert to our premium subscribers. We alerted premium subscribers for additional entries at around $10,000, $11,000, $12,000, $20,000, and $49,000.

Our deep experience in technical analysis, as well as Beth Kindig’s conviction in her fundamental analysis that institutional investorseconomic uncertainty, and mobile payments would push the price higher, gave us the confidence to average up in Bitcoin as the trend continued along our projected path.

Even with the potential for a larger drawdown in the near future, we do not have any intention to make any drastic moves with Bitcoin. We have trimmed some in the $55,000 region, and may trim some more if we reach the $65,000. However, we see any large drawdown to be an opportunity for Bitcoin and we will likely enter again if/when this happens.

Bitcoin is up almost 100% this year, and we’re long since $7,753 for a gain of more than 650% in our I/O Fund, which is invested in the most important tech microtrends.

While some traders were calling for a crash in Bitcoin after the last dip, we saw no reason to sell, and instead identified the $28,000 as a likely shallow bottom to target.

Download our free e-book on Bitcoin.free e-book on Bitcoin.

Disclaimer: Knox Ridley and the I/O Fund is currently invested in Bitcoin. The content in this article is intended to be used for informational purposes only. The content is the expressed opinions of the author and is intended for educational and research purposes. Any thesis presented is not a guarantee of any particular stock’s future prices, so please factor this risk into your own analysis.


 The author is not a licensed professional advisor. Please seek counsel from a licensed professional before acting on any analysis expressed in this article, to see if it is appropriate for your personal situation.