I recently joined the Motley Fool podcast with Brian Feroldi and Brian Stoffel where we discussed electric vehicles, artificial intelligence, and whether growth tech investors should rotate into value. Below, we provide a summary of each video and YouTube clips.
As a bonus, I’m also adding my take on Fastly from podcasts with the Motley Fool and Chit Chat Money. While I remain bullish on the future of edge computing, I voiced my doubts about Fastly when the stock was skyrocketing, reaching a peak of $136.30 last October and a lower high of $122.75 early this year. I summarize my view below.
Why I/O Fund Is Not Selling Growth Stocks
For us, the most important question is whether we are in a secular bear market. We believe in long term buy and hold—except in a secular bear market and a long economic recession. This is because the goal is to avoid holding positions at a loss during an extended period of time. Therefore, in any selloff, the question we ask ourselves is whether this is a quick correction or secular bear market. Unless you are a day trader, most investors are better off holding through these quick corrections than trying to time both an exit and an entry.
We are not financial advisors, but based on the indicators we follow for our portfolio, we are positioned for a continuation of the long-term uptrend. We anticipate potential strength into the summer months with a high consumer savings rate, strong GDP, and dovish monetary policy from the Fed. Those are excellent signs for a strong economy. The I/O Fund did some buying in late March and are not letting the news headlines push us to close our long-term positions.
On that note, I only recommend a stock if my conviction can withstand a 30% selloff. This is because most tech growth stocks go through periods of exuberance and fear/doubt a few times.
Why I’m Bullish on Electric Vehicles
Last time I spoke with Motley Fool, we discussed electric vehicles. Although stock prices have come down, we remain long. The personal savings rate in the U.S. has soared, reaching 13.9% in February and 27.6% in March. As a result, we expect the auto sector to be strong. Electric vehicles are also answering multiple problems. For example, in China where there is less access to oil the government incentivizes EVs through subsidies. Manufacturers are also producing EVs with cutting edge technology at close to the price of a traditional vehicle.
The AI Economy Will Be 4x Larger Than the Mobile Economy
We are long Nvidia for the trend of artificial intelligence. The AI economy is projected to be four times larger than the mobile economy, and the mobile economy brought us FAANG stocks like Apple, Facebook, and Google. I expect to see some FAANG-level companies arise from the AI economy.
Fastly: Not a Slam Dunk
Last December, I joined the Motley Fool Podcast and voiced my doubts about Fastly. I later discussed Fastly with Chit Chat money. Fastly is not a slam dunk, and I voiced my doubts when the stock was skyrocketing. Below I summarize both videos.
Content apps are a great market for Fastly, but for the really big problems that edge computing will solve, it will be difficult for Fastly to be a clear leader in that market. That doesn’t mean Fastly can’t pull it off, and I’m always for everyone making gains. But I prefer slam dunks and my point was that Fastly would face serious challenges and investors were not factoring that in by saying “Fastly was an edge computing leader.” In fact, Fastly has not had edge computing revenue for nearly 16 months after the launch of the Edge Compute product.
Content app developers will say that Fastly is delivering content in under 20 milliseconds and therefore it is edge. However, Fastly’s core competency is a CDN, which is a space that has been highly competitive for 25 years. CDNs saw major tailwinds from streaming and usage last year, however, this was revenue was not due to edge computing.
As a tech analyst, I stuck my neck out to make sure people knew the real story. It was bold, as this was a favorite stock on social media, and there was a flood of negative responses after I simply pointed out that edge computing was not contributing to the current growth.
There are big problems that can be solved with edge computing and I outline this in the video. There also still seems to be an absence of discussion in the retail community around AWS, Azure and GCP moving into this space with telecom partnerships. Projections show that 75% of data will come from the edge. That will be mainly answered by the companies who own the cloud computing market—Amazon, Microsoft and Google.
In the past, I was also asked what company I would choose between Cloudflare and Fastly; I said Cloudflare due to their strategic approach to capture SMBs. This is a market where Cloudflare performs well.
We made a point to cover Shopify last December to emphasize that we did not believe the company was covid-dependent. We spelled out exactly why we were writing a second LTBH PDF on the company during a time of doubt for “covid stocks” (and during the exuberance for small caps).
Most importantly, the trends we outlined in December were recently confirmed in the most recent earnings report. This is what we want to see – analysis that gets in front of results so that we can confirm our ongoing conviction and increase our position (transparently with real-time trades).
The reason we want to increase our position in Shopify throughout the year is fairly straight forward – Shopify is now reaching billions of consumers through social media. The distribution potential of these partnerships reminds me of an avalanche trigger as Shopify will reach billions with Facebook and Tik Tok and hundreds of millions with Pinterest. Now, they only need to build out the Fulfillment Center and focus on improving their own app; although borrowing these mega size audiences is probably the fastest path to growth for our purposes.
I don’t believe Facebook will let Shopify dominate its platform, so keep an eye out for attempts to strengthen Facebook Marketplace. I’m not too worried because Shopify has merchant relationships and it’ll be hard for Facebook to replicate their business model although they may certainly try.
Here are some highlights regarding Social Commerce from the call:
· “The number of shops actively selling on Facebook Shops has more than quadrupled since Q1 a year ago, as well as the GMV through Facebook. While still small, the launch of Facebook Shops in May of last year is clearly starting to make a difference here.”
· “In Q1, we expanded our marketing partnership with TikTok internationally to an additional 14 countries in North America, EMEA and APAC. So far, we've seen good traction in the adoption of TikTok in the U.S. since we launched the integration last October. And we've recently expanded our Pinterest channel into 27 additional markets, opening discoverability and sales opportunities worldwide.”
There are many exciting things going on at Shopify, which we’ve covered at length in the past, including the Fulfillment Center and Shop Pay. Most importantly, we covered exactly why Shopify had taken market share from Amazon and eBay shortly after we launched our premium site. Access October 2019 analysis here.
We also covered Shopify’s positioning in terms of taking over eBay here when we re-iterated our LTBH conviction back in December of 2020. We had been discussing why this was important leading up to the report, and why moving from third position to second position was key for investors during a time of doubt for Shopify.
We also discussed in the LTBH PDF in December of 2020 that “e-Commerce is eating retail” and the various demographics that a company like Shopify can target when partnering with social media apps. The younger demographics is key for social commerce.
To summarize, there are a few reasons that Shopify is set to continue its winning streak and why we plan to increase our position:
1. New distribution channels will reach billions of customers via social media
2. Product-market fit to be achieved in 2021-2023 (we covered this in 2019)
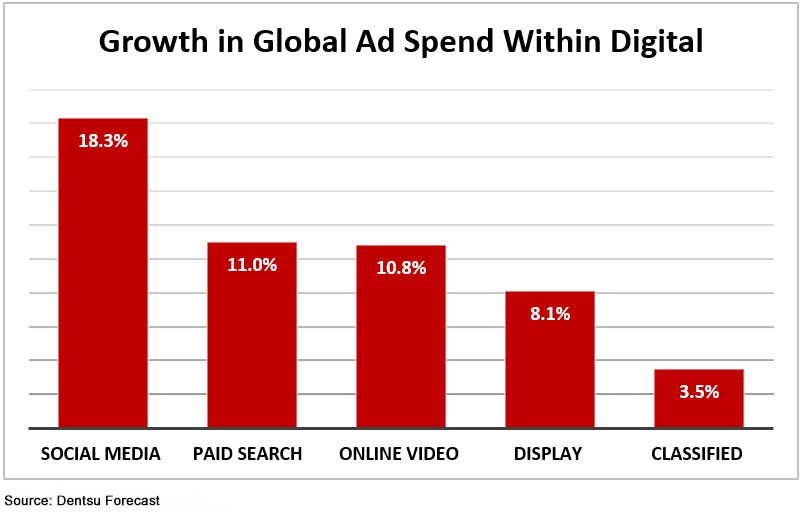
3. Social media spending on ads will increase 18% this year as covered in our free newsletter
4. Second place and has overtaken eBay (we covered this in December)
5. Behavioral ad targeting coming under pressure with Apple’s IDFA – look for an increase in social commerce to offset the shift towards potentially lower CPMs.
We were the first to talk about Snap as an AR/VR stock. The story is moving faster than we previously predicted and we hope you remember the site that brought you this trend first. J
One day, every person on Twitter will say “Snap was clearly a AR/VR story from the beginning” but nobody is talking about this right now. In fact, it’s buried under Facebook’s beat, Pinterest’s DAU concerns and Twitter’s nose dive.
Our job is to talk to you about future trends, and to also silence the noise during periods of extreme sentiment or even around earnings (lots and lots of noise around earnings). We wouldn’t want to add to that noise and assume you read the highlights of any companies you own from the dozen or so sources who cover them.
What’s not being spoken about is that Snap owns the perfect audience for AR/VR. Facebook is in a dilemma here as their subscribership skews older and are less likely to adopt a visually stimulating technology. We will see as time goes on but our money is on Snap. What is the 18-35 year old demographic and also the under 18 demographic really worth? We have yet to find out. Where most tech companies must aggressively take market share or compete at a high level, Snap has to simply keep doing what it’s doing.
Here is the more important take-aways and why are looking to increase our position:
· The company is positive free cash flow for the first time and has strong forward EPS growth this year and next year
· Off-platform AR opportunities such as Camera Kit plus partnerships with companies like Samsung and expanding Android base to reach audiences outside the United States
· Ability to surface premium content through Spotlight and Snap originals and augment these with AR; i.e., Snap is moving beyond social media into original content
· Increased monetization opportunities with AR merging with e-commerce. An example of a successful campaign can drive 30%-40% lift in incremental sales
· Although DAU growth is slow in the United States, it’s strong internationally at 57% this past quarter for Rest of World. Forward growth of 22% on DAU next quarter is impressive considering tough covid comps
· United States ARPU is on a tear at 66% growth leading to 75% revenue growth in this region. Rest of World ARPU is also healthy at 46% growth YoY. Strong guidance on revenue of 85%
Probably the most important statistic from the ER is of the countries that comprise over half of the world’s digital ad spend, Snapchat reaches 70% of 13 to 34-year olds. We want to be AR/VR investors and this is the correct demographic for this trend. Plus, this is important for targeting purposes assuming we do see the IDFA changes from Apple.
Telehealth: We remain in Teladoc …but also still like Amwell
If you want to know what it feels like to invest in the early stages of a trend, telehealth is the perfect example. Remember when I said Nvidia would be an AI leader and dominate the data center, and then there was negative growth in this segment for the first two quarters after my analysis? Seems preposterous that the data center was a low-yielding segment for Nvidia and had negative growth YoY with barely a blip being reported from AI only two years ago.
However, Nvidia/data centers is not an apples-to-apples example for Teladoc because this company faces a much bigger challenge … and nobody knows how it’ll turn out.
I’m not talking about the need for the health insurance companies to reimburse telemedicine permanently (rather than a temporary covid provision). I’d consider this a hurdle and one that I think telemedicine will clear over time.
The big challenge I am talking about is the incredible amount of competition that Teladoc faces. There are many startups receiving funding in the private markets. Zocdoc, a professional booking platform for doctors, launched video consultations last May with the help of Twilio. The company raised $150 million in its last round. Kry is a company popular in Europe that has helped over 3 million patients see a doctor, nurse or psychologist. The company recently closed a $312 million Series D round after its telehealth tools grew 100% year-over-year. Epic Systems, a medical records software company that is used by 54% of patients in the United States, also tapped Twilio for telehealth video conferencing at the start of covid.
Last year, health-tech funding broke records in 2020 with $15.3 billion in funding in the private markets, up from $10.6 billion in 2019. For the first time, healthcare surpassed biopharma with 614 total deals.
Health insurance companies are also in the space, such as United Health Care, with a motivating drive to offset reimbursement costs. This many players commoditizes telemedicine and puts pressure on pricing. This isn’t reflected in the current earnings right now, and in fact, Teladoc is able to increase revenue per user. However, the market is growing nervous because key metrics are flat and there is uncertainty as to how telemedicine will perform in a post-covid world.
Telehealth Trend Overview:
Prior to 2020, telehealth was projected to grow at a CAGR of 25.2% with the global market growing from $61.4 billion in 2019 to reach $559 billion by 2027. The global market is especially important to ensure healthcare is available in remote areas of underdeveloped countries. Internet access remains a barrier for telehealth in remote regions, such as rural India for instance, which has a 20.2% high-speed internet penetration.
In the United States, telehealth was a $26 billion market in 2019.
According to the Centers for Medicare and Medicaid Services, the U.S. spent 17.7% of GDP, or 3.6 trillion on health care in 2018, partly due to an increase in mental and chronic health conditions. The study also highlights that patient monitoring is popular with the elderly with 1 million remote cardiac monitors being used in America.
There is no denying that telehealth had a breakthrough year in 2020. Despite the many breakthroughs ushered in by covid, such as remote work (Zoom, Teams), gym workouts at home (Peloton) and online shopping (Etsy, Overstock), telehealth showed the most rapid growth by far of nearly 4,000% growth across key metrics. Therefore, it’s understandable that the market is attempting to weigh what the growth in telehealth will look like after the one-time event of 2020.
In addition to the market and management attempting to predict what a normal rate of growth will be, the telehealth trend is dependent on federal and state legislation dictating how private payers reimburse telehealth. Full reimbursement is called “payment parity.”
There are 43 states that have some state telehealth statute for commercial payers, yet only 22 states maintain laws that address telehealth reimbursement with a mere 14 states that offer payment parity for telehealth. This is up from 16 and 10 states in 2019.
In the meantime, temporary waivers were offered during covid. We’ve covered in the past how the federal government has passed telehealth bills for Medicare under the CARES Act and other covid legislation. As of now, many of the temporary waivers and emergency legislation is set to expire 90 days after covid’s emergency status is removed.
According to Blue Cross Blue Shield of Massachusetts, the insurance company will continue to support and cover telehealth. However, states like New Hampshire are discussing a bill that would eliminate payment parity as the bill asserts that in-patient care should be paid at a higher rate than telehealth. Opponents point towards mental health and substance abuse as primary reasons the bill should be struck down.
Teladoc ER Overview – Big Revenue Growth but Flat Key Metrics
Teladoc beat on revenue of $453 million, representing 151% growth. The company raised guidance for the year to $2 billion at the mid-point for FY2021 for an increase of $20 million. Revenue in the United States was up 175% and international up 29%.
Despite a strong report on revenue, Teladoc reported a net loss of $1.31 per share – missing expectations by $0.71 for a net loss of about $200 million. This partly contributed to the stock selling off nearly 12% since the report. According to management, “the larger net loss was primarily attributable to increase stock-based compensation, amortization of acquired intangibles, and income tax adjustments primarily related to the merger at Livongo.”
Gross margins increased to 67% up from 59.2% in the year-ago quarter. The adjusted gross margin was 67.8% compared to 60% in the year-ago quarter.
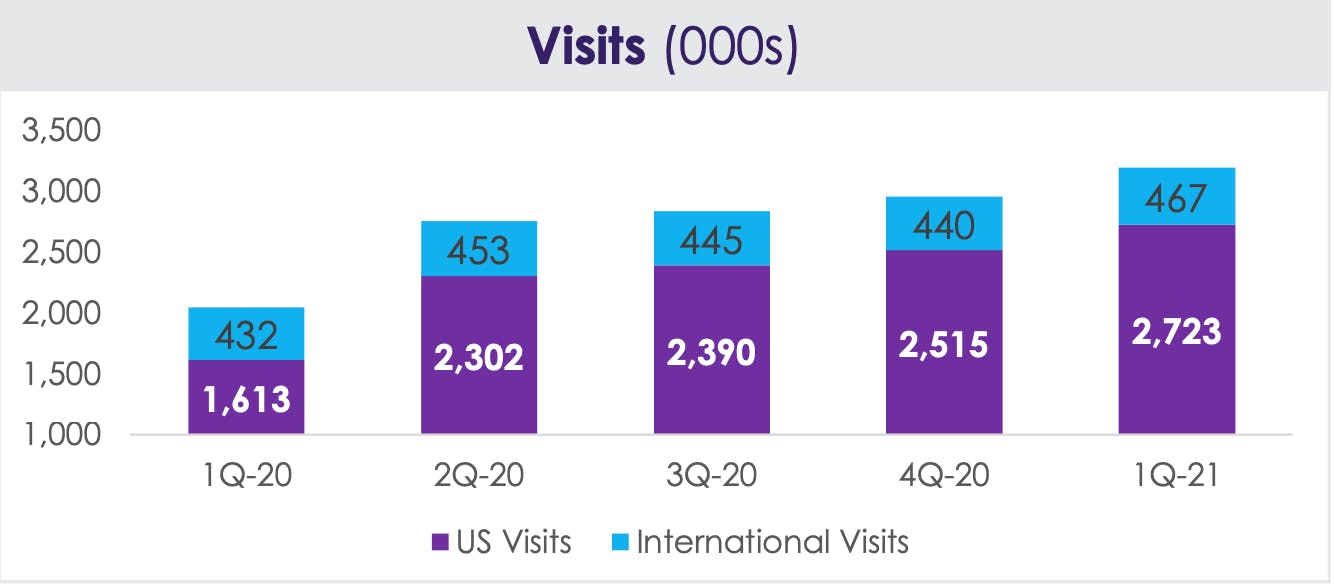
Total visits were up 56% to 3.2 million with the number of consumers enrolled in more than one chronic care program “tripling year-over-year.” The United States made up the bulk of this growth at 69% with international growth at 8%.
Forward revenue guidance is quite strong for Teladoc in the next quarter with $500 million at the mid-point on revenue and positive adjusted EBITDA of $61 million to $64 million up from $56 million adjusted EBITDA in the current quarter.
The management points towards increased revenue per customer as to one reason they are able to sustain this level of revenue growth. Average per member per month (PMPM) was $2.24 in the first quarter, up from $1.76 in the prior quarter. According to management, of the $0.48, half was driven by an extra month of Livongo revenue in the first quarter.
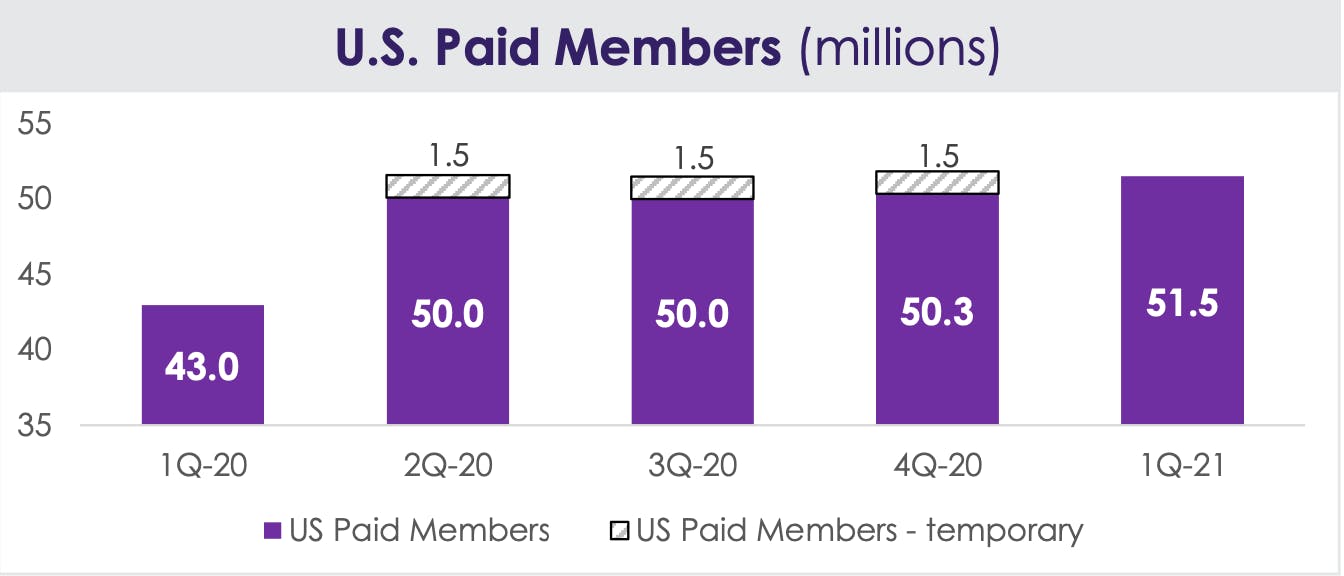
The key metric that showed lower growth (and was most alarming) was 20% growth in paid memberships from 43 million to 51.5 million and 15% growth in U.S. Visit Fee Only access from 19.2 million to 22 million. Forward guidance on this important key metric is expected to be in the range of 52 million to 53 million – in other words, flat sequentially.
For full year, the guidance isn’t much better for this metric with paid membership in the 52 million to 54 million range. Visit fee access is also flat per guidance at 22 to 23 million for FY 2021.
Pictured above: Teladoc US Paid Members are to remain flat year-over-year (YoY)
Total visits are re-accelerating, however, from a plateau in Q2-Q3 2020 where the company stagnated at 2.3 million and 2.4 million, or growth of about 100K visits. Teladoc grew to 200K visits in the last two quarters and is guiding for growth of 400K to 600K visits between Q1 and Q2 2021.
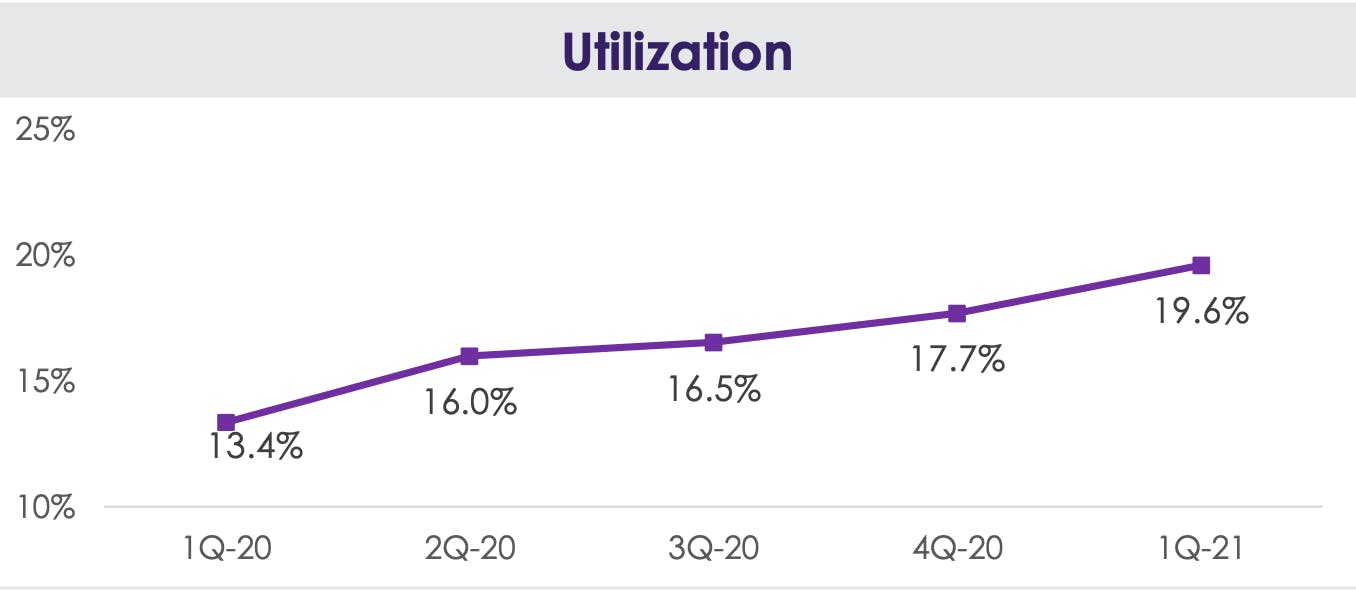
The utilization rate is also climbing, which is important to note. Telemedicine utilization is equal to the number of consults divided by the number of covered employees. Industry averages were between 1-10% prior to covid, yet we see strength in this number sequentially even after many doctor offices have opened up. Besides showing the penetration of telemedicine, the number is important because it affects the cost savings to employers.
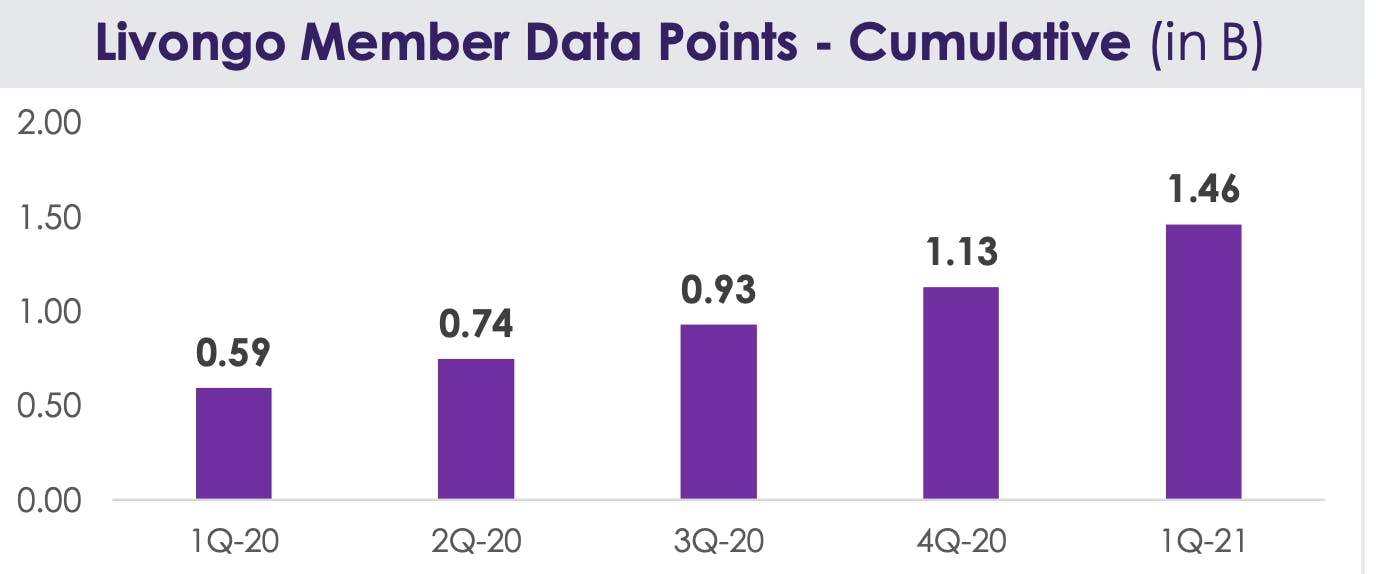
Data points from Livongo are also growing nicely and actually accelerated in the most recent quarter compared to when Livongo was a standalone company in Q1-Q2 2020.
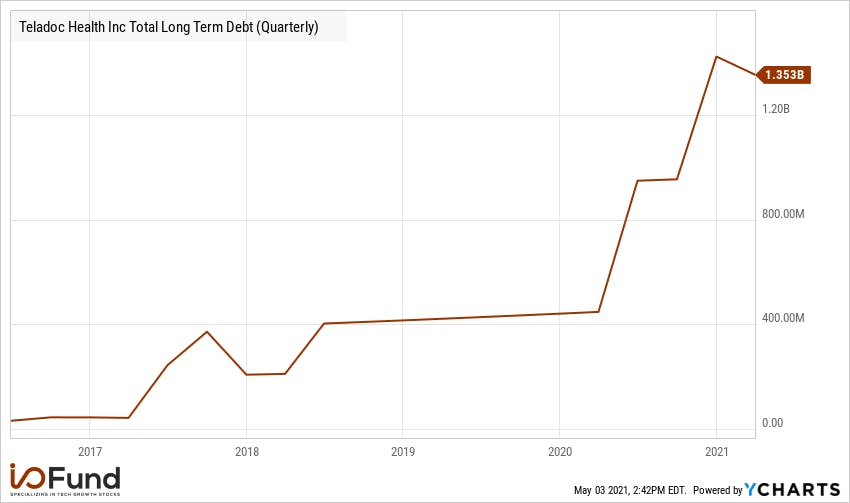
Teladoc has strategically added debt over the past several years as the company focuses on growth at all costs. TDOC ended Q1 with $1.35B in long term debt and $723 million in cash.
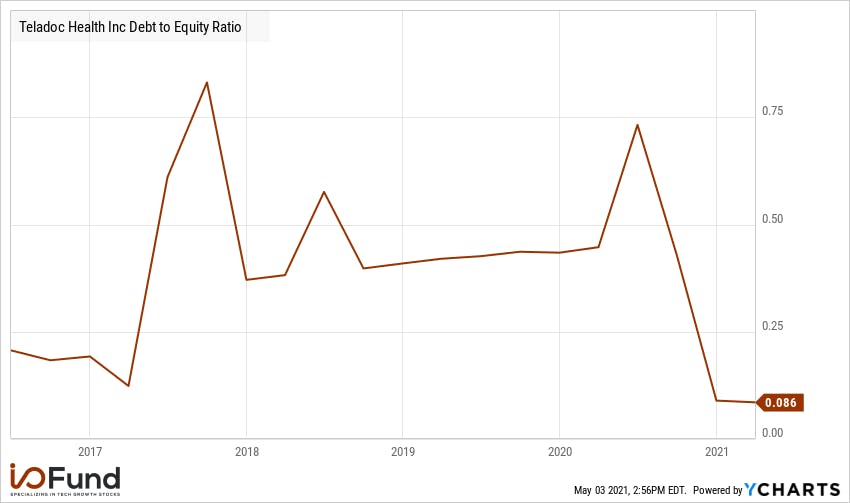
While debt has increased notably over the past year, Teladoc’s balance sheet still appears to be in very good health. Teladoc’s Debt to Equity Ratio currently stands at 0.086, which is near its 5 year low. A low debt to equity ratio indicates lower risk, because debt holders have less claims on the company's assets.
A Debt to Equity Ratio under 1.0 is ideal because it indicates that for every $1 of equity, the company has less than $1 of debt. In the case of TDOC, we are seeing a strong Debt to Equity ratio of 0.086 that has improved over time, even as the company has taken on more long-term debt.
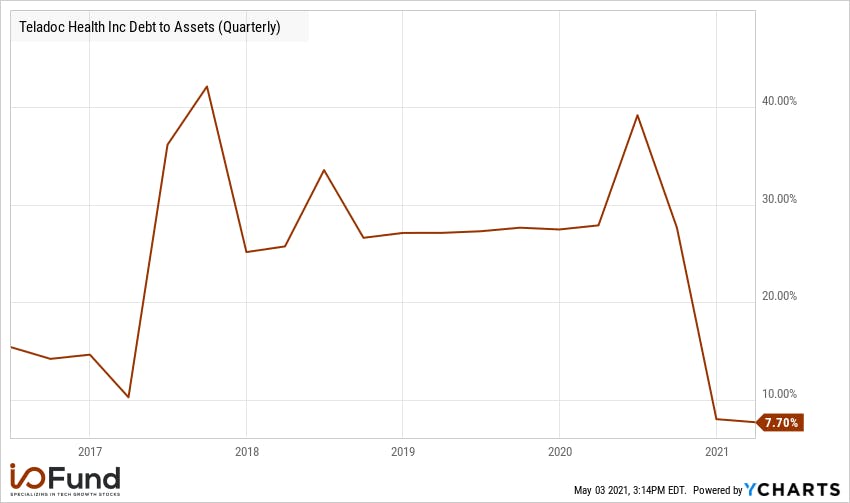
Teladoc also has a strong Debt to Assets ratio, which is a ratio used to determine how much debt a company has on its balance sheet relative to total assets.
A Debt to Assets ratio under 100% is ideal because it indicates that the company owns more assets than debt. The lower the Debt to Assets Ratio, the less risk the company is carrying on its balance sheet.
Teladoc’s Debt to Assets Ratio is currently standing at a healthy 7.7% and near a 5-year low. Teladoc’s Debt to Assets Ratio means the company is backed by 7.7% of debt, which is a significant improvement from 2020.
While Teladoc’s debt has increased over time, it is much more a factor of a company that is in hypergrowth mode than a company that is struggling financially. This becomes evident when we compare Teladoc’s long-term debt to its equity and assets. Management appears content to strategically use debt in order to fuel growth. This is not uncommon for a company in hypergrowth mode and it is evident in analyzing Teladoc’s balance sheet that the company’s debt is at sensible levels and not a major risk to the business.
Valuation
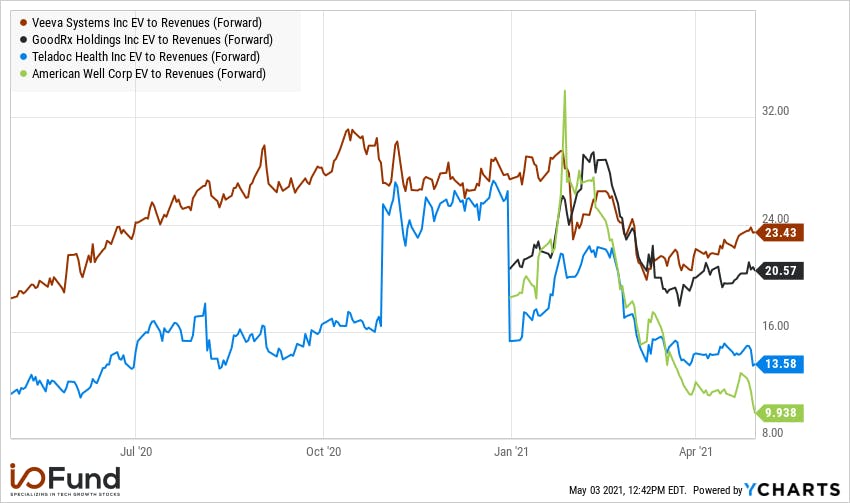
Teladoc is now valued at 13.58x forward revenue after peaking above 25x at the end of 2020.
In comparison to some others in the space, TDOC looks attractively valued with forward growth expected to eclipse 80% in 2021. The other three stocks we listed for comparison (VEEV, GDRX, AMWL) are not projected to eclipse 40% YoY revenue growth in 2021.
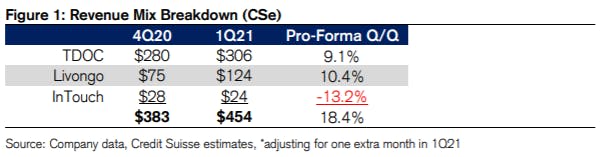
In Q1, legacy Teladoc grew roughly 69% YoY and 9% QoQ. Below is a breakdown of Teladoc’s revenue mix in Q1 from Credit Suisse:
Credit Suisse notes that it is not an apples-to-apples comparison as if Livongo were still a standalone company due to the realization of deferred revenue following the acquisition of Livongo. We are still seeing strong growth from Livongo and legacy Teladoc with 9% and 10% QoQ growth rates, respectively.
It should also be noted that InTouch is now part of TDOC’s single Hospital & Health System business. In Q1, TDOC’s Hospital & Health System business grew YoY as well as QoQ.
There is some investor concern about TDOC missing on EPS two quarters in row, with both misses being caused by expenses related to M&A.
While some Teladoc’s M&A has been more expensive than originally thought in the short-term, this does not affect the long-term thesis. Teladoc is built to be able to incur short term losses and focus primarily on top line revenue growth.
Amwell:
We closed our Amwell position after the company provided low revenue guidance for FY2021 and analyst estimates also showed low revenue guidance for 2022. We simply can’t force timing on a trend even though we continue to keep Amwell on our radar. Notably, Knox trimmed Teladoc in the high-$200s as his technical were also telling us we were too early to the trend.
After Teladoc’s earnings report, there were a few press releases that telehealth has become commoditized. If we were talking strictly about the ability to have a video call with a doctor, then this would be true. But obviously, the goal is how to provide multiple data touchpoints for virtual care. Teladoc has moved into remote monitoring while Amwell is gearing up for AI assistants/carts.
What is intriguing about Amwell is the Google backing, which we covered in the Amwell PDF last year. Google has $100 million of stock in the company with plans to merge AI with health care, including digital waiting rooms, language translations, offloading tasks from the provider to conversational AI and to help manage chronic conditions. Anthem is a large client of Amwell’s and accounts for about 25% of revenue.
The company’s customers often deploy telemedicine through a variety of proprietary Carepoints, which are medical carts and kiosks designed for various clinical and community settings. The company also offers software development kits (SDKs) and APIs to integrate telehealth digitally and to embed into workflows. This includes web and mobile apps, 24-hour nurse and customer support, and electronic health record (EHR) software.
On the same day as Teladoc’s earnings report, Amwell released an announcement on their new telehealth platform that will allow developers to host and deploy telehealth applications. The platform offers a single code base to build a unified care experience to develop apps that utilize Google Cloud’s AI and NLP technologies, TytoCare’s handheld exam kit, connections to clinic physicians (looks like the beta version will be in Cleveland), and Biobeat’s patient monitoring devices. I assume the list of integrations will grow over time.
The new platform may not change Amwell’s revenue trajectory in the short-term but it’s certainly something we are keeping our eye on.
To be frank, we don’t with who the winner is between TDOC and AMWL as long as we get to participate. Therefore, the I/O Fund is remaining flexible between these two and will be looking for signs of strength to determine what position(s) we hold and our allocation as time goes on. Notably, there is a lot of deal flow in the private markets because this a big market to crack for the company who does it.
Mohawk Group is a technology enabled consumer products goods (CPG) company. I first covered MWK in detail here. MWK is a high beta small cap stock with a current market cap of $720M. The stock is down roughly 50% from all-time-highs as many small cap growth stocks have recently undergone a significant correction. Below, I explain why there is a favorable risk/reward proposition in MWK at this valuation.
The rise of e-commerce has made it easy to sell products directly to consumers online. This has created an enormous amount of competition among third-party sellers and a space that is ripe for consolidation. Many successful third-party sellers selling DTC (direct-to-consumer) on different marketplaces such as Amazon, Walmart, etc. lack the technology and resources to scale their businesses beyond a certain point.
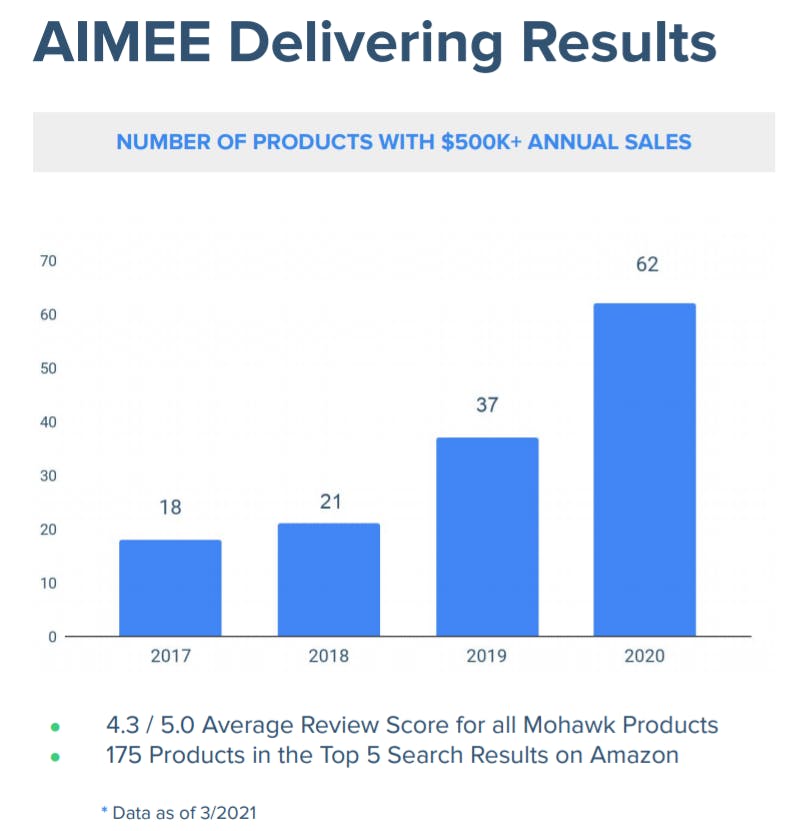
Mohawk has built an efficient consumer product platform for CPG brands with its proprietary software platform AIMEE. AIMEE is the data driven AI engine that effectively supports various tasks such as market research, forecasting, pricing, inventory management, marketing & advertising campaigns, supply chain logistics, fulfillment, and more. It is impossible for many of the third-party sellers that Mohawk’s brands compete with to replicate what AIMEE is able to do.
Mohawk currently has over 1,000 SKUs across 12 brands that sell DTC primarily on Amazon, Walmart, and Shopify. The growth that Mohawk has been able to achieve speaks to the success of the AIMEE platform, as the company has nearly tripled its number of products with over $500K in sales over the last 2 years.
Source: Mohawk Investor Presentation
Mohawk leverages AIMEE to launch new products organically and acquire existing products at accretive multiples of generally 3x-4x TTM EBITDA. As previously mentioned, there are a large amount of small third-party sellers on marketplaces like Amazon and Walmart that have built successful businesses but lack technology and scalability to compete long-term. Many of these small businesses are looking for a successful exit strategy but are not big enough to be acquired by large CPG companies. Mohawk uses AIMEE to decipher which products would make successful acquisition targets and is able to integrate and onboard these new products to AIMEE in as little as 48 hours post-acquisition.
Marketplacepulse projects GMV in the 3PS (third-party seller) space to grow at a CAGR of 16.3% from 2019-2025. Mohawks plans to continue to use its accretive M&A strategy to opportunistically add new products and categories through acquisitions. There is potential for equity dilution as a means to finance future M&A deals, but it is important to understand that any equity dilution will be accretive. Shareholders should not be concerned about equity dilution at very accretive multiples because these acquisitions will unlock shareholder value.
Many of Mohawk’s acquisitions are financed through equity and/or debt. The company recently announced that it is refinancing all its outstanding debt with a $110M senior secured note at an 8% annual interest rate with warrants convertible to equity. This refinancing deal represents an improvement in funding with a reduced annual interest rate.
Financials
For the FY 2021, Mohawk is guiding for $365M in revenue at the midpoint of its projection, representing 96% YoY revenue growth. This growth rate represents an acceleration from the 62% YoY revenue growth Mohawk recorded in 2020.
In 2020, Mohawk recorded its first full year of positive EBITDA with $2.5M. The company is guiding for $32M of positive EBITDA at the midpoint of its 2021 projection, or nearly 13x YoY growth.
Management is targeting an 8%-10% EBITDA margin for the full year, a significant improvement from the 1.3% EBITDA margin the company recorded in 2020. Long term, the company is targeting a 13%-15% adjusted EBITDA margin.
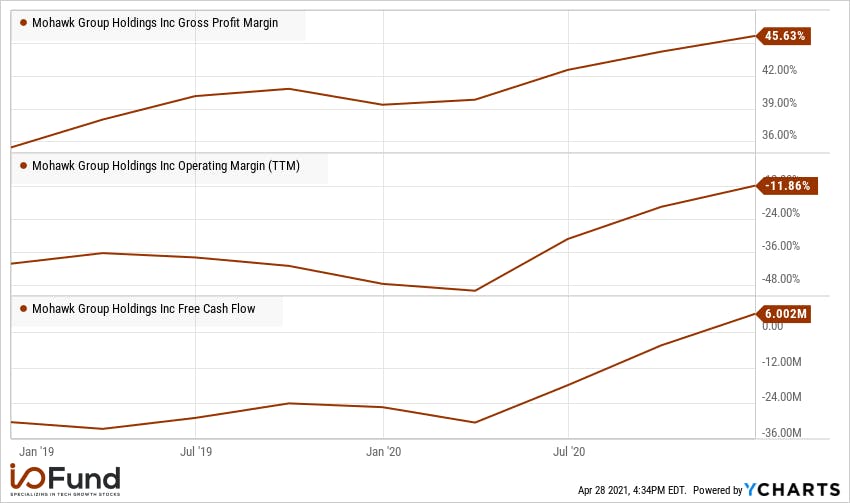
Analysts are projecting Mohawk to reach bottom line profitability for the first time in 2021 with a $0.08 FY EPS estimate, up from -$0.18 in 2020. The company has seen a significant improvement in its margins over the last year and management expects continued margin improvement in 2021.
Going into 2021, Mohawk is showing strength and positive momentum in the fundamentals. Revenue growth is expected to accelerate 34 percentage points to 96% YoY while the company is guiding for 13x EBITDA growth YoY.
Analysts are projecting Mohawk to reach EPS profitability for the first time in 2021 with improving gross margins, operating margins, and free cash flow.
Analysts are currently projecting MWK to grow revenue 26% YoY in 2022. After its Q4 earnings report, MWK raised 2021 revenue guidance 12% above consensus. The company has not guided for 2022 yet, but we believe the current consensus estimate from analysts is very conservative. We believe there is great potential for MWK to guide significantly above the consensus 2022 estimate as we get into the second half of 2021.
Valuation
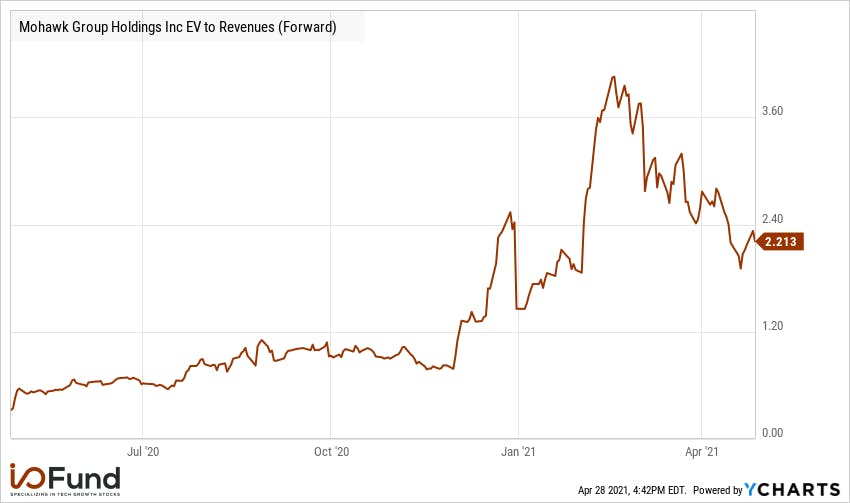
The positive momentum in Mohawk’s fundamentals has not translated to a higher valuation recently, as MWK stock is currently trading at just 2.2x 2021 revenue.
MWK stock has seen a significant contraction in its forward multiple over the last couple months, as it is currently 45% off its peak valuation. When accounting for forward growth and improving profitability, we view MWK’s 2.2x forward multiple as an attractive valuation.
Risks
MWK has proven to be a volatile stock since we first entered, and we expect continued volatility in the future as it is a high beta small cap stock. One of the main risks for Mohawk is that the company is reliant on Amazon’s marketplace and also competes with Amazon Basics. While Mohawk uses various channels for their brands to sell products, Amazon marketplace is the most important channel. While this is a risk, most third-party sellers are reliant on Amazon to some degree and we believe it would take anti-competitive and monopolistic strategies from Amazon to dominate its own 3PS marketplace that has over 1.9M active sellers.
Mohawk’s business model also carries a degree of execution risk. The company is currently dependent on certain key products and is reliant on the continued success of these key products in the future. However, as the company continues to diversify its product portfolio, they will be less reliant on any one product or brand and this risk will be mitigated.
There is also execution risk in Mohawk’s M&A strategy as future growth is reliant on the continuation of successful acquisitions. Mohawk cited an 80% success rate on its acquisitions, meaning there is a risk that this success rate will drop on future acquisitions.
Conclusion
At a 2.2x forward multiple, we believe these risks are more than priced in to MWK’s current stock price. Mohawk has an efficient proprietary software engine in AIMEE that has demonstrated proven success in the 3PS CPG space. 2021 is shaping up to be a breakthrough year for Mohawk as they accelerate top line growth to 96% YoY and reach bottom line profitability for the first time. We believe MWK can achieve high growth for years to come in addition to profitability, and the risk/reward looks favorable at this valuation.
Pinterest reports on Tuesday, April 27 after market close. The stock recently dropped as much as 10.8% in one day due to reports that the company had a soft ending to Q1.
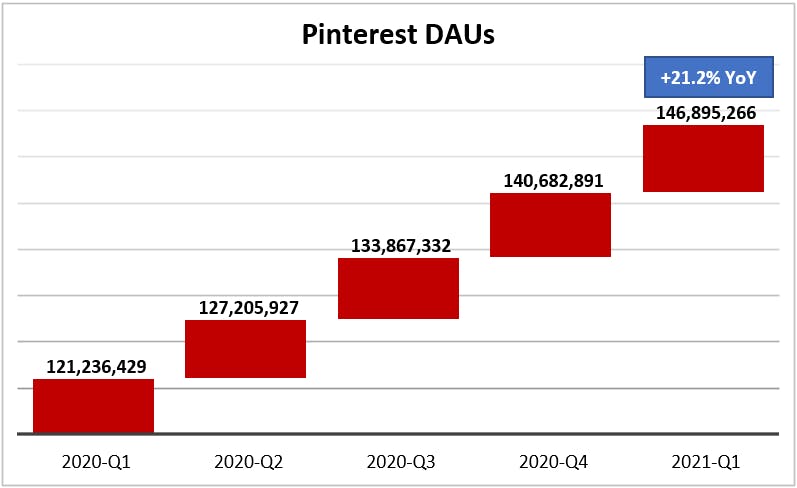
We wanted to take this opportunity to present the app data for Pinterest and provide an in-depth preview of the upcoming earnings report, which shows approximately 4% sequential growth and 21% growth year-over-year for DAUs. Interestingly enough, this is approximately the same YoY growth level that Snap reported for DAUs in its most recent earnings report, which we cover below.
A glimpse at the App Data
Please note, we use app data to spot trends—we do not use app data to make earnings calls on what a company will report. We use Apptopia data, a provider of app intelligence and competitor tracking service.Apptopia data, a provider of app intelligence and competitor tracking service.
Pinterest user engagement remained strong in Q1 2021 despite loosening of Covid restrictions, based on app data from Apptopia. Similar to Snapchat, which reported earnings April 22 and grew DAUs 22% YoY, Q1 user trends for Pinterest were mostly positive.
In Q1, daily active users were up 4.12% QoQ versus 5.09% the previous quarter, and up 21.16% YoY.
Source: Apptopia with graphs by David MarlinDavid Marlin
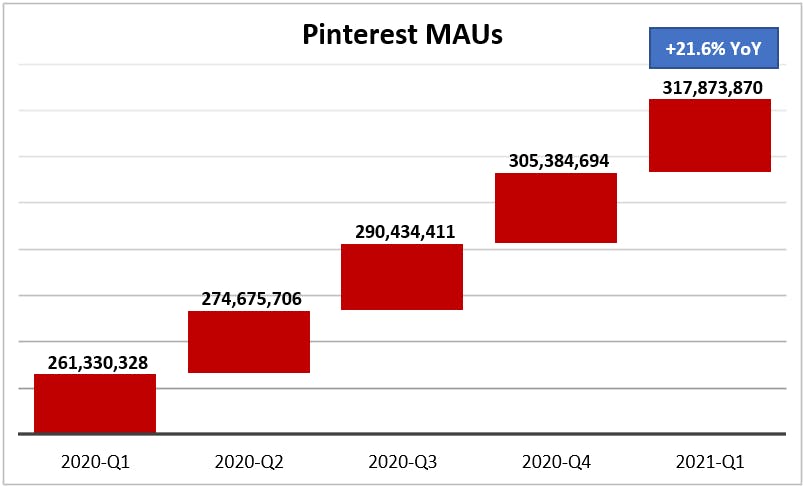
In Q1, monthly active users were up 4.09% QoQ versus 5.15% the previous quarter, and up 21.64% YoY.
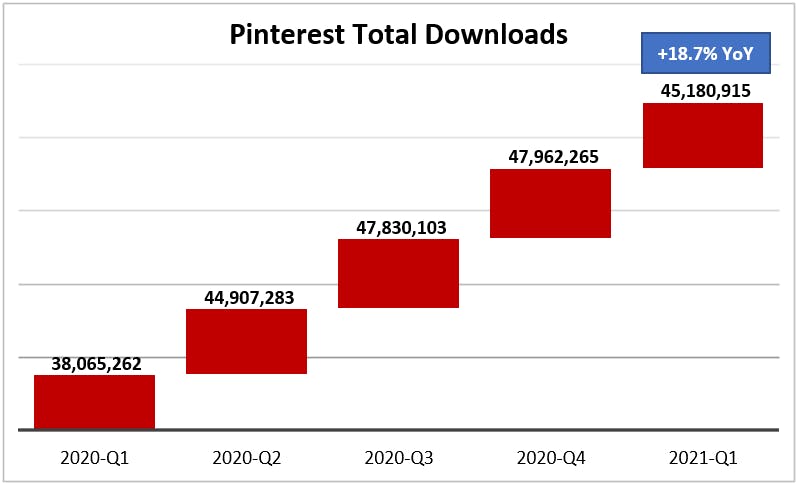
Downloads were down 5.80% QoQ versus up .28% the previous quarter, and up 18.69% YoY.
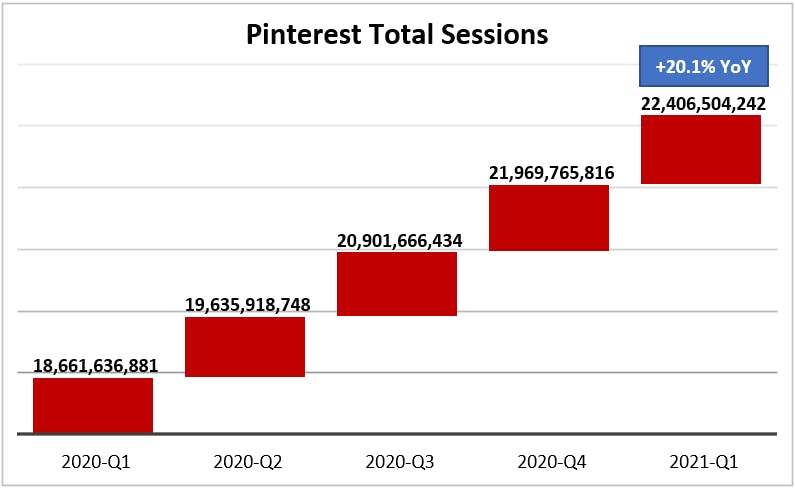
Sessions were up 1.99% QoQ versus 5.11% the previous quarter, and up 20.07% YoY.
Pinterest reports Tuesday, April 22 after close and is guiding for Q1 2021 revenue growth in the low 70% range YoY with non-GAAP operating expenses at a similar level compared to last quarter. The consensus estimate is $475.11 million, up 74.71% YoY, according to Seeking Alpha.
Pinterest executives have warned that reopening could reduce engagement. Like other adtech stocks, Pinterest saw record high engagement but reduced advertiser demand in Q1 and Q2 2020, as advertisers slowed or paused their spend. Advertisers during these early-Covid quarters shifted away from awareness campaigns and towards high performance ads. Later, revenue growth accelerated in Q3 and Q4 as advertiser demand returned.
According to last week’s ad-tech analysis, we anticipate a small deceleration YoY in user engagement due to tougher comps—engagement reached record levels last March, according to the Q1 2020 earnings report—with strong international growth. Despite usage trends being mixed, if we see an ad rebound revenue can still climb higher.
Pinterest fell as much as 10.8% on April 16, after a cautious report from independent research firm Cleveland Research that was summarized by Seeking Alpha.
Pinterest ended Q1 had a softer end to Q1 "than mid-quarter expectations would indicate and some agencies/partners are noting a deceleration from Q4 levels," according to Seeking Alpha’s synopsis of the report, which added that "some omni-channel retailers are seeing Pinterest spending decelerating."
Below, we look at Q1 2021 results from Snapchat for clues about the potential adtech rebound and compare this to Apptopia data, a provider of app intelligence and competitor tracking service.
What to look for in the upcoming report
Going into Covid, Pinterest had less exposure to highly impacted verticals such as travel, according to the Q1 earnings report. When asked in Q1 what is holding Pinterest back from capturing more travel-related advertising dollars, CEO Ben Silbermann said the company is optimizing for core shopping verticals such as home décor and apparel.
“I will say that when we look at our plans for increasing kind of purchasing activity on Pinterest, travel is not the first place that we’re optimizing for,” Silbermann said. “We think there’s a really big opportunity in a lot of our core shopping verticals, which is why shopping and conversion-driven events continues to be a focus.”
Ad dollars follow planning activity, which is why ad spending moved away from categories such as wedding planning and travel events, according to the Q1 earnings report. As normal events and activities return, we expect ad dollars to follow at some point this year.
For the full year, Pinterest executives are expecting positive trends due to investments in new tools like shopping and automation; international expansion; and monetization into Latin America during the first half of the year, according to the last earnings report. Latin America is forecast to see 10.2% YoY growth in digital ad spending this year, after an 18.4% drop last year, according to a report from Dentsu.
Snapchat Doubles Active Advertisers
Global digital ad spending is projected to grow 10.1% YoY, with 18% growth in social media, according to the Dentsu report, which we discussed recently in our earnings coverage of Pinterest, Snapchat, Twitter, and Facebook.
Snapchat reported earnings April 22, achieving the highest year-over-year revenue and daily active user growth rates in over three years, according to the earnings report. Snapchat grew revenue to $770 million, up 66% year-over-year, and grew DAUs 22% year-over-year to 280 million. The company also approximately doubled its active advertiser base YoY, and offered strong guidance of 80% to 85% YoY revenue growth.
Traditionally strong categories for Snapchat, such as theatrical films, have started to return, and the company is seeking to increase categories where it is well positioned but has had less exposure, including travel and leisure.
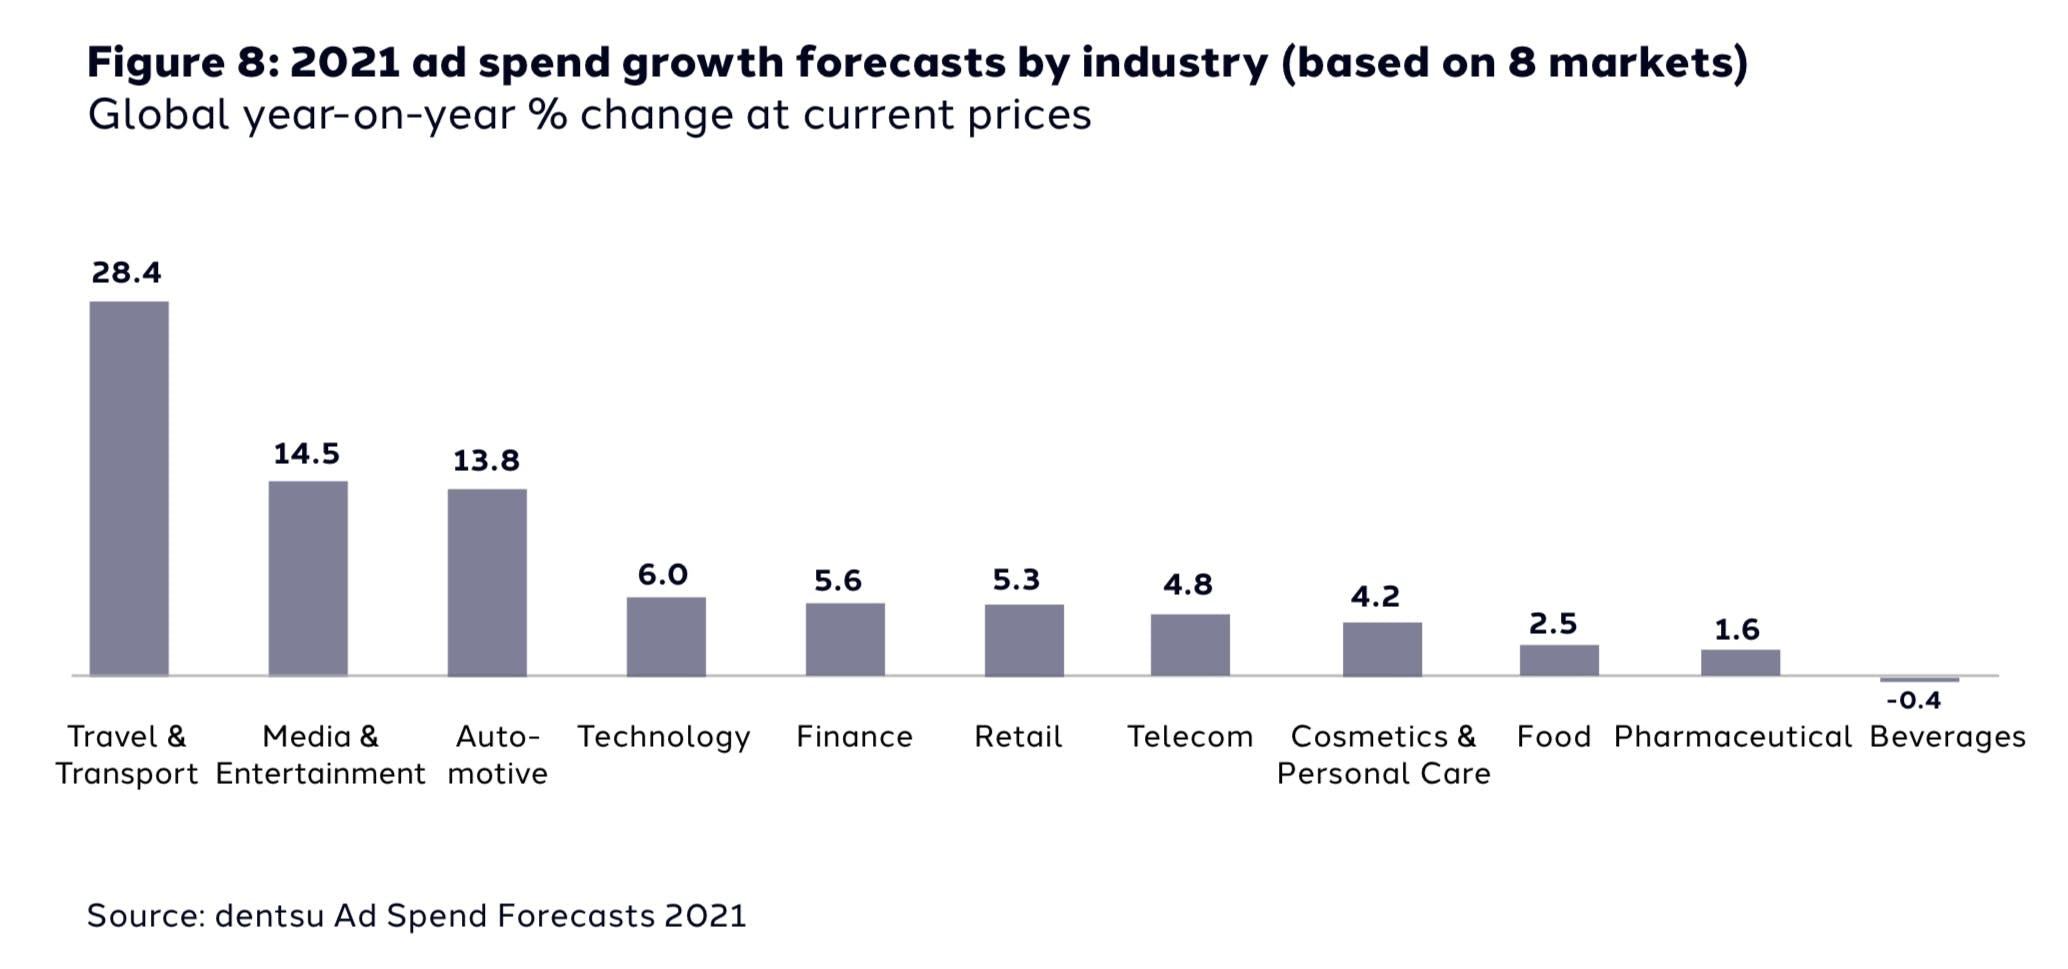
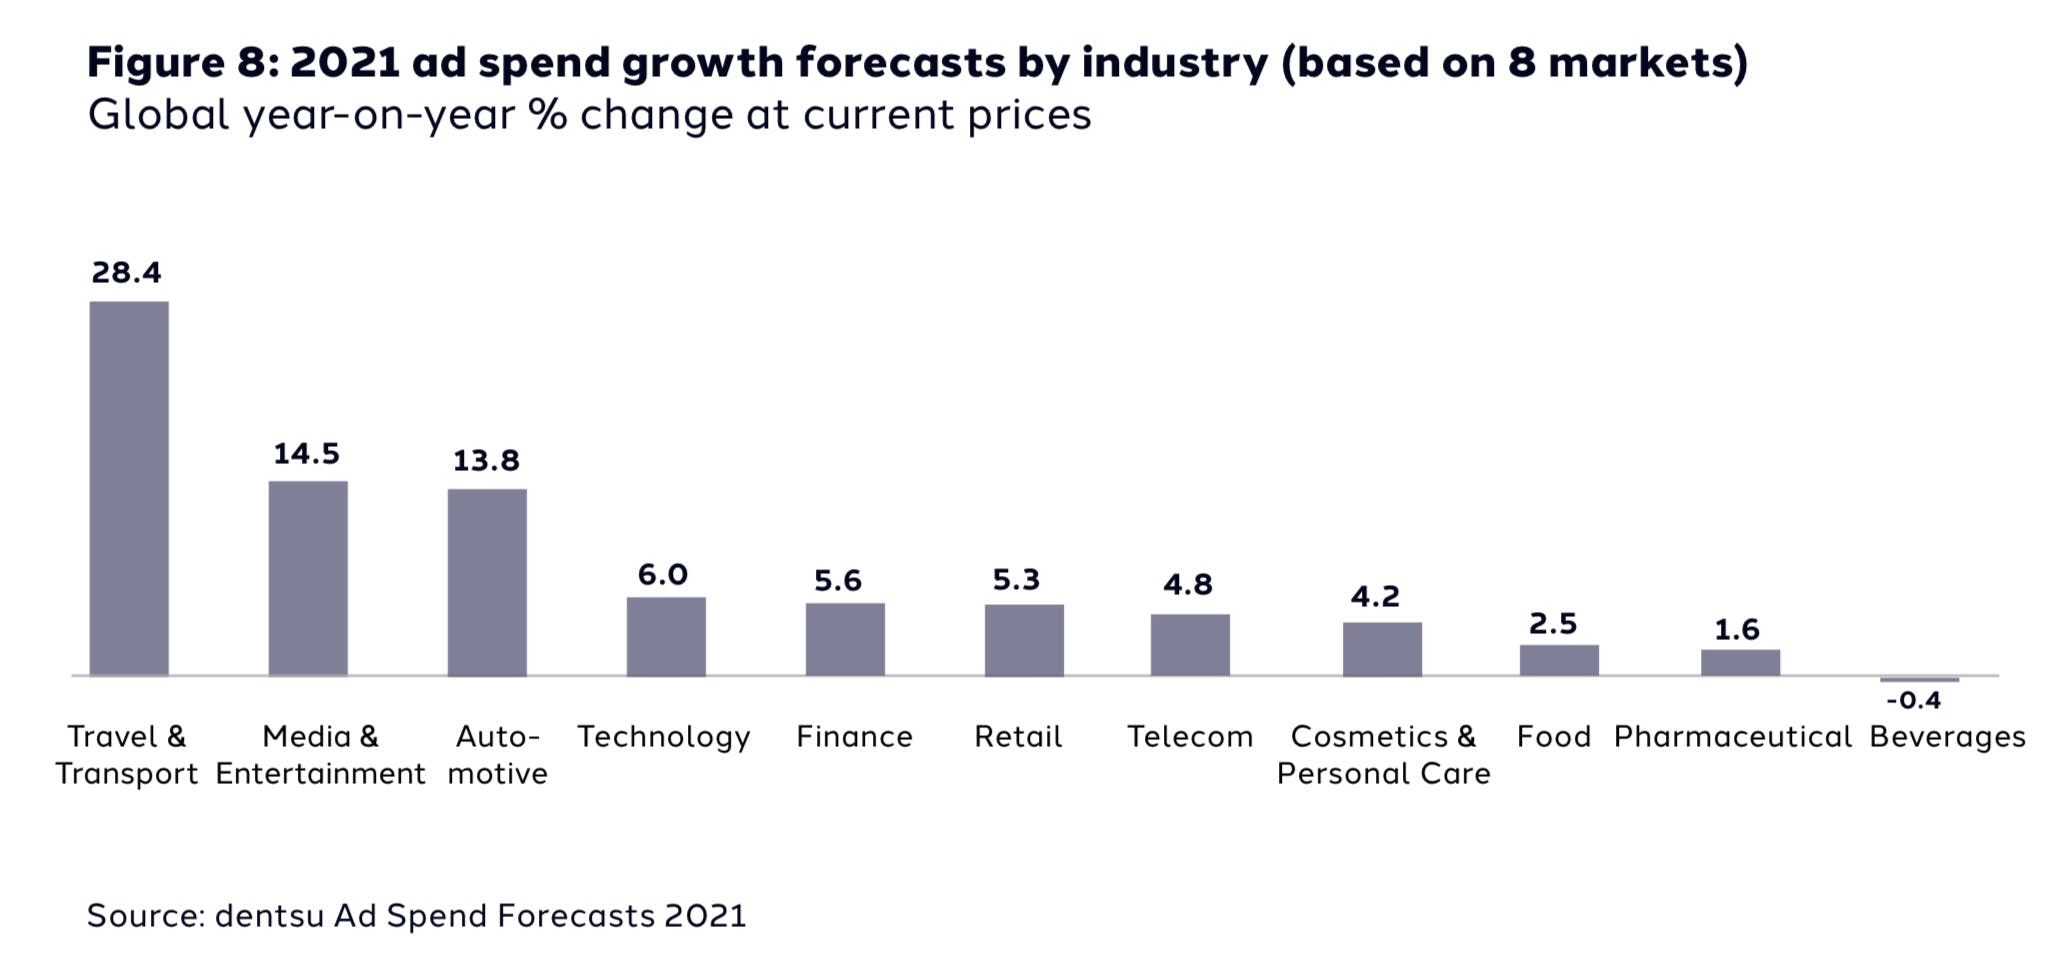
The approach could pay off, according to the report from Dentsu. Sectors that restricted advertising the most due last year are set for the biggest recovery, with ad spend in travel and transport forecast to grow nearly 30%.
Conclusion
Despite mixed reports about Pinterest’s upcoming earnings report, we are seeing similar year-over-year growth in DAUs as Snapchat reported, which is 21.16% and 22% respectively. We are hopeful that with an ad-rebound in many sectors that Pinterest will also have a healthy earnings report, where low ad revenue last year will offset tough comps in usage.
Disclaimer: I/O Fund currently owns shares of Snap and Pinterest. In addition, the author, Jessica Ablamsky, owns shares of Pinterest, has owned options on Pinterest, and may own options on Pinterest again in the future. Jessica Ablamsky has owned options on Snapchat in the past and may purchase shares or own options again in the future. The content in this article is intended to be used for informational purposes only. The author has not received any compensation from any third party or company discussed in this article. The content is the expressed opinions of the author and is intended for educational and research purposes. Any thesis presented is not a guarantee of any particular stock’s future prices, so please factor this risk into your own analysis. It is very important that you do your own analysis before making any investments based on your personal circumstances. The author is not a licensed professional advisor. Please seek counsel form a licensed professional before acting on any analysis expressed in this article, to see if it is appropriate for your personal situation.
Global digital ad spending is projected to grow 10.1% YoY, powered by 18% growth in social media, according to a report from Dentsu, an advertising and public relations company based in Japan. In China, social media ad spending is forecast to rise 29.6%.
Source: David Marlin
In the U.S., digital ad spending is projected to grow 17% YoY after only 5% growth in 2020, according to estimates from Credit Suisse. Based on these numbers, ad-tech companies like Facebook, Pinterest, Snapchat, and Twitter should continue to benefit from growth in digital ad spending in 2021.
For Q1 2021, Snapchat reported first quarter results that exceeded expectations for revenue, earnings per share, and global daily active users. The company also delivered positive Free Cash Flow for the first as a public company.
Like many stocks that did well in 2020, tougher comps for Pinterest started in March. We anticipate a small deceleration YoY due to tougher comps, with strong international growth. Despite usage trends being mixed, if we see an ad rebound, revenue can still climb higher.
For Twitter, we anticipate a solid quarter, but not on the same level as Snapchat and Pinterest due to recent download data. Twitter daily active users are trending up, but downloads struggled in March more than Snapchat and Pinterest, which faced equally difficult comps. We also expect solid results from Facebook due to less impact from privacy changes at Apple than expected and strong spending in digital advertising.
Below we look at Snapchat’s Q1 2021 results and preview Pinterest, Twitter and Facebook. But first, we take a closer look at download and monthly active user trends.
Downloads and MAUs Struggle Against Tougher Comps
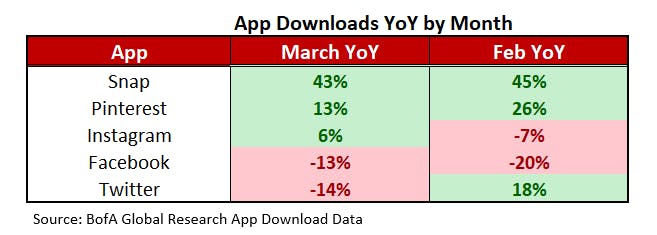
Social media downloads were mixed in Q1, with Snapchat and Pinterest showing the strongest download trends YoY.
Source: David Marlin
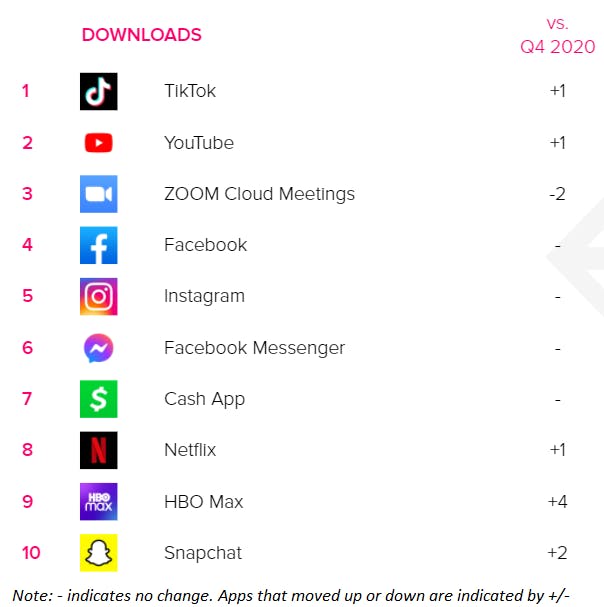
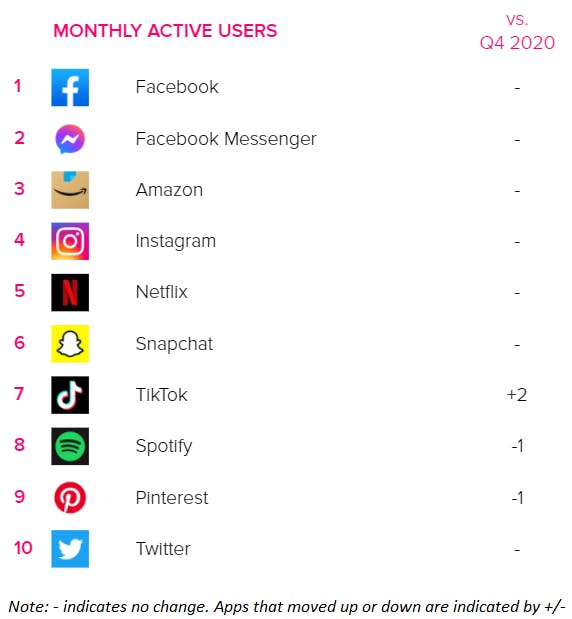
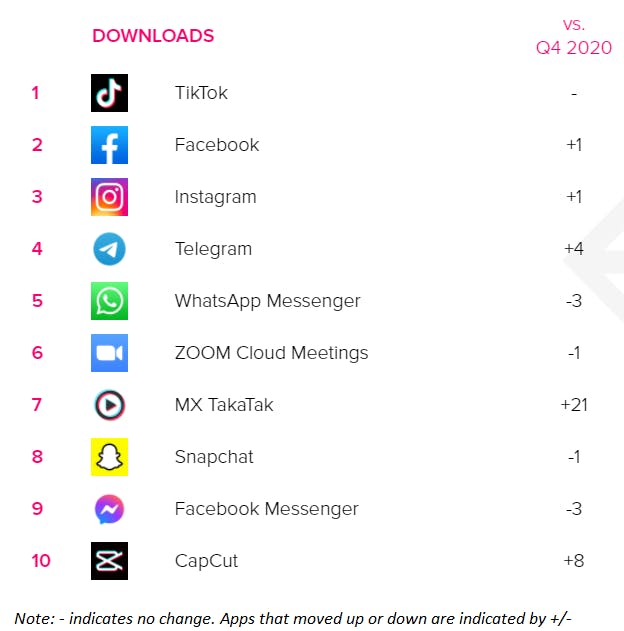
Next we look at the top 10 apps in the U.S. in Q1 2021 by download and MAU. Facebook, Instagram, and Facebook Messenger continued to be top apps by download and MAU.
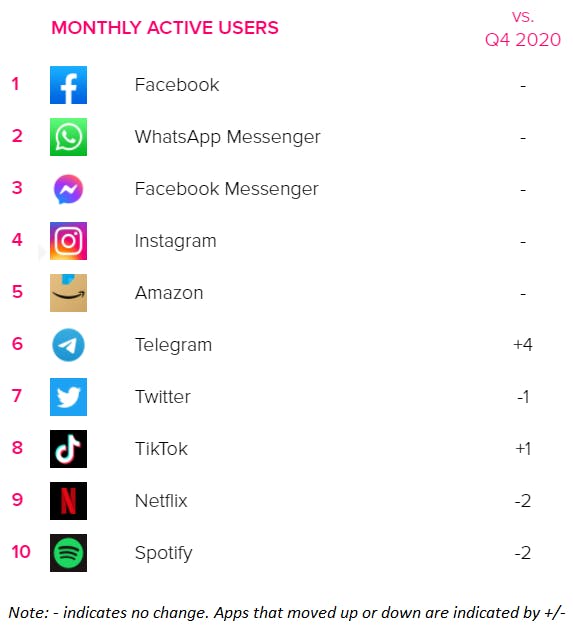
Snapchat appears on top 10 charts for downloads and MAU. The app moved up two spots in downloads with no change for monthly active users. Pinterest and Twitter made it to the bottom of the chart for monthly active users, with Pinterest moving down one spot, indicating less engagement. Twitter saw no change in monthly active users.
Q1 2021: Top Apps in the US by Downloads vs Q4 2020
Q1 2021: Top Apps in the US by MAU vs Q4 2020
Next we look at the top 10 apps worldwide in Q1 2021 by downloads and MAU. Globally, Facebook, Instagram, and Facebook Messenger continue to be top apps by download and MAU. While Snapchat was a top downloaded app globally, it is down slightly from Q4 2020. Outside of the Facebook family of apps, only Twitter made it onto the list of top global apps by MAU and it was down slightly from last quarter.
Q1 2021: Top Apps Worldwide by Downloads vs Q4 2020
Next we take a closer look at Snapchat, which reported April 22 after market.
Snapchat: Active Advertiser Base Doubles
Snapchat executives struck a bullish tone in its Q1 2021 earnings report, noting that engagement trends remained positive as users began socializing in larger groups. The company’s active advertiser base approximately doubled year-over-year in Q1, and traditionally strong categories, such as theatrical films, have started to return.
Revenue increased 66% YoY to $770 million versus $740.89 million consensus. Non-GAAP EPS of $0.00 beat by $.05 and GAAP EPS of $(0.19) beat by $0.01. Global DAUs grew to 280 million, up 22% YoY, versus 274.5 million consensus.
ARPU was $2.74 versus $2.71 consensus. Net loss and Adjusted EBITDA were $(287) million and $(2) million in Q1 2021, compared to $(306) million and $(81) million in the prior year, respectively.
Operating cash flow improved by $131 million to $137 million in Q1 2021, compared to the prior year. The company also achieved its first quarter as a public company of positive free cash flow. Free Cash Flow improved by $131 million year-over-year to reach $126 million.
Common shares outstanding plus shares underlying stock-based awards totaled 1,629 million at March 31, 2021, compared to 1,589 million one year ago.
Looking forward, Q2 2021 revenue is estimated to be between $820 million to $840 million, up 80% to 85% YoY. Adjusted EBITDA is estimated to be between $(20) million and breakeven, compared to $(96) million in Q2 2020. Daily active users are expected to reach 290 million users, up 22% YoY.
For the full year, the company plans to invest in its ad platform to drive improved relevance and ROI; scale sales and marketing to support global advertising partners; and build innovative ad opportunities, including video and AR.
Nearly 30% of consumers use mobile AR apps, with 59% reporting weekly use, according to a 2021 report by ARtillery Intelligence with Thrive Analytics.
A report from Futurum Research sponsored by SAS puts the number of smartphone owners using AR at more than 50%, with 69% saying they expect to use AR/VR/MR this year to sample products, and 63% saying they would use the technology to visit a remove venue, location, or event this year.
Pinterest: US Growth Slows, International Strength Continues
For Q1 2021, Pinterest is guiding for revenue growth in the low 70% range YoY with non-GAAP operating expenses at a similar level compared to last quarter. The consensus estimate is $473 million in revenue, up 74% YoY, according to YCharts.
For the full year, executives are expecting positive trends due to investments in new tools like shopping and automation; international expansion; and monetization into Latin America during the first half of the year, according to the last earnings report. Latin America is forecast to see 10.2% YoY growth in digital ad spending this year, after an 18.4% drop last year, according to the report from Dentsu.
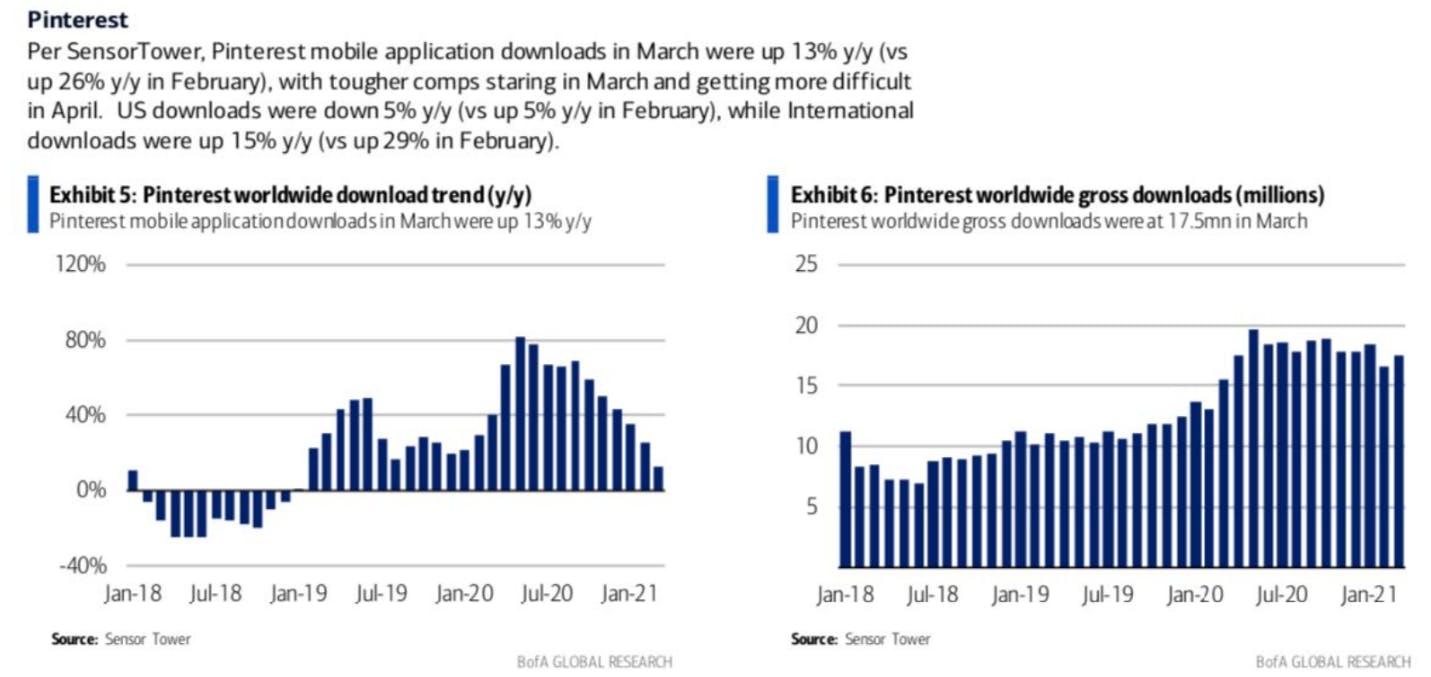
Pinterest app downloads were up 26% YoY in February versus 13% YoY in March, according to data from SensorTower, which provides market insights for the global app economy.
In the U.S., downloads were up 5% YoY in February and down 5% YoY in March. Pinterest showed strong international growth, with international downloads up 29% YoY in February and 15% YoY in March.
For Q1 2021, Pinterest DAUs were up 14% YoY worldwide and 7% QoQ, according to data from SensorTower.
In the U.S., DAUs were up 6% YoY and down 2% QoQ., while international DAUs were up 17% YoY and 10% QoQ.
Pinterest announced Wed that the existing partnership with Shopify has been extended to 27 additional countries, including Australia, Brazil, and the U.K. The company also added two new ecommerce features, multifeed support for catalogs and dynamic retargeting, which allows marketers to target individual consumers.
The partnership with Shopify offers merchants a quick way to upload catalogs to Pinterest and turn products into shoppable Product Pins. Pinterest said the number of catalog feed uploads on its platform increased by over 14 times worldwide from March 2020 through March 2021, and 97% of top searches are unbranded, according to Adweek.
In the last earnings report, Pinterest executives warned about potential headwinds from less engagement due to economies reopening. The company also discussed changes in privacy and tracking data, which was a major topic of discussion for all four social media companies during the last earnings reports.
Due to the nature of Pinterest—the company is able to capture first party data on queries, saves, and board creation—Pinterest is less exposed to privacy changes, according to Pinterest CFO Todd Morganfeld.
Twitter Ramps Up Hiring, Expenses
Twitter is guiding for total revenue of $952 million at the midpoint, with GAAP operating income between ($50) million and break even. The consensus estimates for Twitter is $1.026 billion in revenue, up 27% YoY, according to YCharts.
Executives struck a bullish tone in the last earnings report, with plans in 2021 for significant hiring and new features to boost revenue. Executives anticipate growing total costs and expenses 25% or more this year due to hiring in engineering, product, design, and research, and the final buildout of a new data center. Still, Twitter is projecting revenue to grow faster than expenses—based on its assumption that the global pandemic continues to improve and the impact from privacy changes associated with iOS 14 are modest.
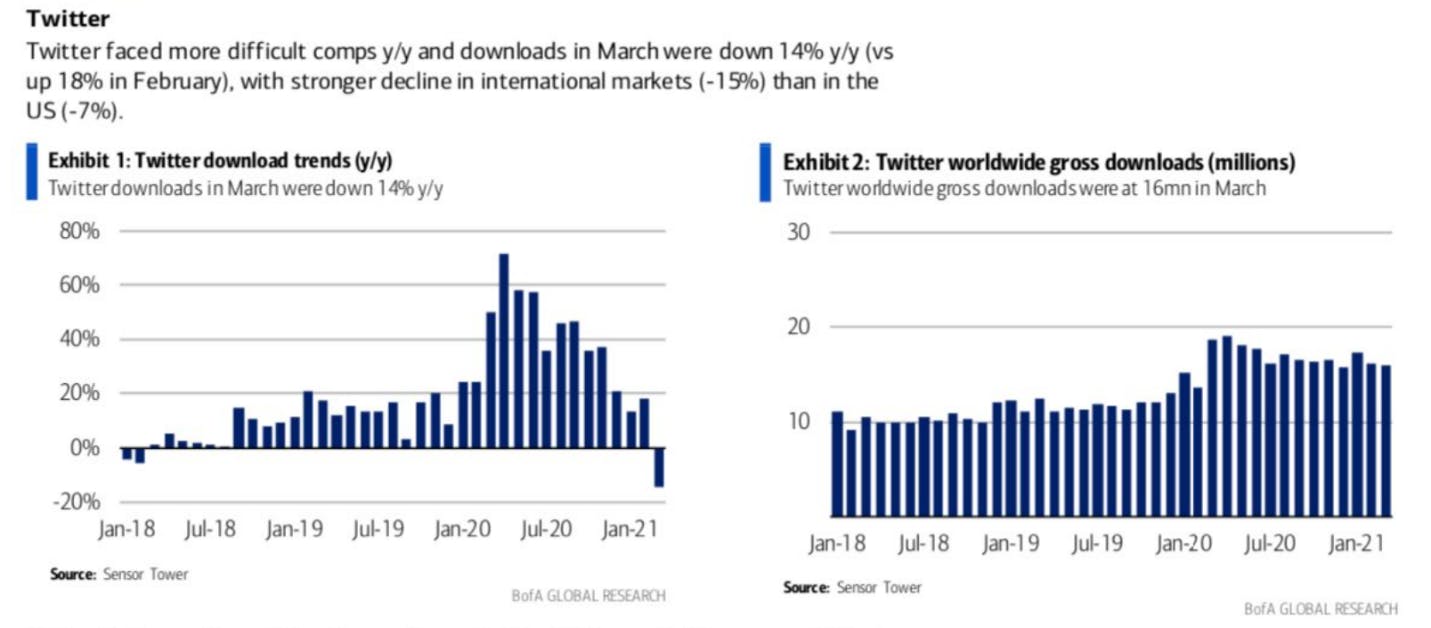
Twitter faced more difficult comps in March and downloads were down 14% YoY, versus up 18% in February, according to data from SensorTower. International markets saw a stronger decline, down 15%, compared to the U.S., down 7%.
During the last earnings call, Twitter guided for 20% YoY growth of monetizable monthly active users for Q1, and no change to the pre-pandemic goal of growing mDAU 20% or more over multiple years. Users who joined Twitter last March when shelter-in-place orders began have stayed with Twitter better than previous groups, according to the call.
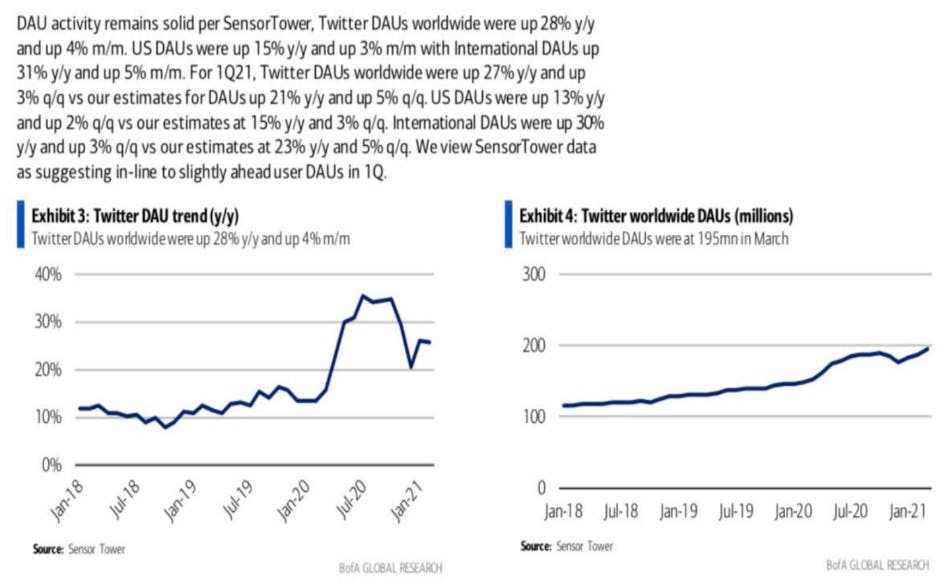
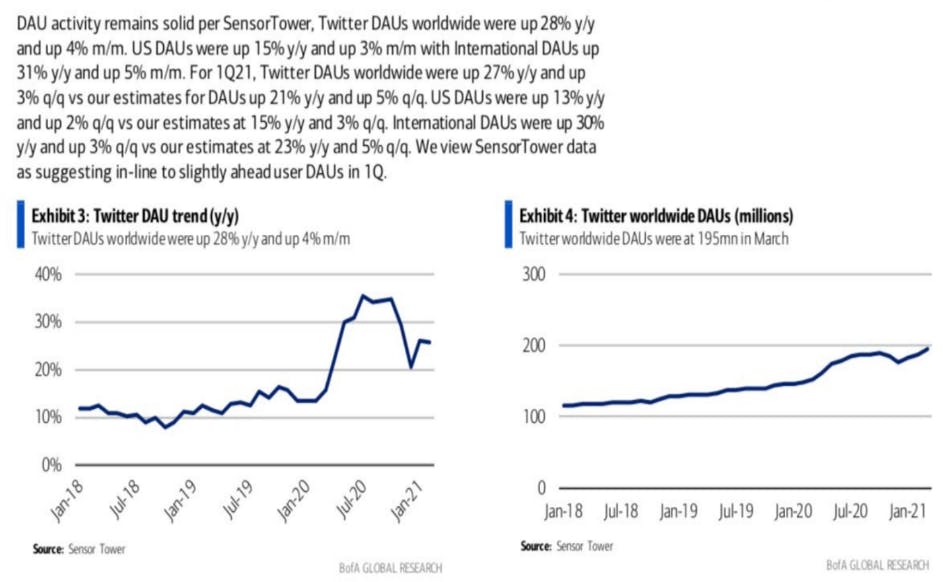
In March, Twitter DAUs worldwide were up 28% YoY and up 4% month over month, according to data from SensorTower.
For Q1 2021, Twitter DAUs were up 27% YoY and up 3% QoQ. In the U.S., DAUs 13% YoY and 2% QoQ, with strong international growth of 30% YoY and 3% QoQ.
To prepare for privacy changes associated with iOS 14, the company last quarter released mobile app promotion, which helps advertisers drive engagement on Twitter, and Twitter Click ID, which helps track conversions.
Twitter CFO Ned Segal expressed confidence at the Morgan Stanley Technology, Media, and Telecom Conference March 3 as the company prepares for privacy changes, and noted that much of the data Twitter collects is not tied to a device ID.
This year, Twitter plans to leverage data for better ad targeting, increase revenue from small and medium sized businesses; continue updating MAP; experiment with non-advertising subscription-based revenue, and capture more ad dollars from the multi-billion dollar app advertising industry.
To drive brand recall and favorability, Twitter is also experimenting with branded likes, which should be widely available later this year, according to the company’s Virtual Analyst Day on Feb. 25.
For Facebook, Apple’s IDFA Hurdle Not as Bad as Feared
The consensus estimate for Facebook in Q1 is $23.6 billion in revenue, up 33% YoY.
Facebook struck a cautious tone in its Q4 report. CFO Outlook Commentary warned that the company continues to face significant uncertainty. The business benefitted from two trends that played out during the pandemic: a shift towards online commerce and a shift in consumer demand towards products and away from services, according to the CFO Outlook Commentary.
These trends provided a tailwind to Facebook’s advertising business in the second half of 2020, due to the company’s strength in products and low exposure to services such as travel. A reversal in 2021 of one of both of these trends could be a headwind to advertising growth, according to the commentary.
In January, retail sales were up 5.3%, with every major category of spending seeing gains. In February, retail sales dropped by a seasonally adjusted 3.0% and rebounded 9.8% in March.
Retail sales are expected to continue growing strongly in April and May, according to Kiplinger’s, which said all sales categories are benefitting from the surge and have surpassed pre-pandemic levels, except for restaurants and department stores.
In 2021, sectors that restricted advertising the most due to the pandemic are set for the biggest recovery, with ad spend in travel and transport forecast to grow by nearly 30%, according to the report by Dentsu.
Like other winners of the Covid economy, Facebook will face tougher comps in the second half of 2021. However, the company expects total revenue to remain stable or modestly accelerate in the first and second quarters.
“We continue to invest to improve our exposure and travel—sorry, in service areas like travel,” said Facebook CEO Dave Wehner. “But our expectation would be in 2021, we’ll continue to have a similar skew towards products as we’ve had in the past.”
Executives anticipated high opt out rates due to privacy changes from Apple, which attacks Facebook’s core advertising business on iOS. If all personalized ads went away, small businesses would see a 60% cut in website sales, according to the report.
However, the opt-in rate for the default Apple pop-up was 73%, according to a report by Adikteev, an app reengagement platform, which conducted an experiment with thousands of random users in 10 countries from July 22 to August 5.
For Facebook’s ad auctions, pricing depends on impressions. Impression growth slowed in to 25% in Q4 from 35% in Q3. Executives expect that trend to continue into Q1 2021.
To boost revenue, last year Facebook launched branded content and shopping in Reels, with plans to launch ads. The company also launched a new shopping tab on Instagram in Q4.
Disclaimer: The information contained herein are opinions and not financial advice. I/O Fund owns shares of Snap and Pinterest. In addition, the author, Jessica Ablamsky, owns shares of Pinterest. The content in this article is intended to be used for informational purposes only. The author has not received any compensation from any third party or company discussed in this article. The content is the expressed opinions of the author and is intended for educational and research purposes. Any thesis presented is not a guarantee of any particular stock’s future prices, so please factor this risk into your own analysis. It is very important that you do your own analysis before making any investments based on your personal circumstances. The author is not a licensed professional advisor. Please seek counsel form a licensed professional before acting on any analysis expressed in this article, to see if it is appropriate for your personal situation.
Dislaimer: I/O Fund currently owns shares of Snap and Pinterest. In addition, the author, Jessica Ablamsky, owns shares of Pinterest, has owned options on Pinterest, and may own options on Pinterest again in the future. Jessica Ablamsky has owned shares of Facebook, has owned options on Snapchat in the past, and may purchase shares or own options again in the future. The content in this article is intended to be used for informational purposes only. The author has not received any compensation from any third party or company discussed in this article. The content is the expressed opinions of the author and is intended for educational and research purposes. Any thesis presented is not a guarantee of any particular stock’s future prices, so please factor this risk into your own analysis. It is very important that you do your own analysis before making any investments based on your personal circumstances. The author is not a licensed professional advisor. Please seek counsel form a licensed professional before acting on any analysis expressed in this article, to see if it is appropriate for your personal situation.
As I write this, we haven’t gotten Snap’s earnings which will be followed by other ad-tech companies reporting next week. This will be our first glimpse into the rebound from the economy opening back up. My hunch is that both of these names (MGNI and FUBO) will see a boost from increased ad spend (as well as a few others we hold in the portfolio). There was an excellent post on the forum about the boom in advertising.
Magnite
When we look at the messy ad ecosystem, it's rare to find a management with this level of focus in capturing a specific market. The market that Magnite is focused on is the Connected TV programmatic and omnichannel supply-side market. That's a mouthful, and at first glance, it may sound like every other ad platform out there, but that’s why we look deeply at product to give our readers and the I/O Fund a competitive advantage. Nuances matter.
Magnite is not the shiniest company to analyze if you’re a financial analyst. The former company, Rubicon, struggled after the walled gardens of Facebook and Google were built, which led to total domination of digital advertising.
Prior to this, Rubicon was a well-known name in online programmatic. Still, it's understandable if more traditionally trained financial analysts saw the negative revenue growth between 2016-2017 and wonder how this management can stage a comeback.
Magnite’s CEO was the former CEO of Millennial Media, a company that took an incredibly hard hit when the walled gardens (Facebook, Google) leveraged their first-party data to compete with traditional ad-tech companies.
There are critics of the CEO’s background but we are neutral and don’t extract anything meaningful here as the fate of Millennial Media was out of the CEO’s control. Google and Facebook wiped out many ad-tech companies around 2014.
In early 2020, Rubicon acquired Telaria, and then the combined company, Magnite, faced a tough two-quarters due covid's shelter-in-place. We saw juggernauts like Google report negative revenue growth, which reflects the challenges all ad-tech faced. To complicate matters, Magnite is acquiring SpotX, which requires extra work for a financial analyst to piece together, and there is uncertainty with Apple’s IDFA changes.
My point here is that Magnite requires in-depth product analysis – and we can’t solely rely on the financials. I will touch on financials and future growth, but the main key points are hidden in the product and the unique advertising environment that is Connected TV. The stock has seen extreme volatility, as has Fubo, yet it's important to revisit why we have conviction so that market sentiment doesn’t push us to fold our hand.
What “Independent SSP” Really Means
My webinar on Twilio spelled out why PII and an omnichannel marketing platform could take some budget from data management platforms, which primarily deal with second-party and third-party data. In the presentation, I had discussed how Facebook and Google have the strongest positioning for DMPs because they also mix their own first-party data (anonymously).
First-party data is always owned by the publisher. Facebook and Google are publishers, which is why they have first-party data to mix at the DMP level. Magnite is on the publisher side of the transaction. This was less desirable with display where 10 or sometimes 25 SSPs would compete on an open programmatic marketplace for a $0.20 placement.
However, Connected TV inventory is unique as the inventory is premium and goes for $25 to $40 for placements on a private marketplace. This means that publishers will work with maybe one or two SSPs total as the private marketplace does not result in higher bids because the pricing is already agreed on.
When I talk about ad-tech, I repeatedly say there’s no such thing as a moat. It’s a convoluted space and even Facebook/Google are seeing their moat become challenged by Apple. The only moat is owning the audience. The other pieces are in a state of constant flux.
However, there are advantages that a company can have to gain market share – for Roku, this is the operating system and owning the whole stack. Roku owns the audience and there is an even bigger bonus to owning the stack as Roku has access to data at the device level from thousands of apps on the device and any publishers on its ad platform.
SSPs and DSPs especially come under pressure because they don’t own the audience. However, Magnite is leveraging a few key strengths, such as becoming the primary independent SSP in the Connected TV arena. On the earnings call, the management stated that it would be hard for other SSPs to compete at this point, given the unique private marketplace environment of Connected TV. This is due to Magnite’s acquisition strategy, and we see the effects of this in the Disney partnership, where Magnite is the obvious choice on the supply side.
“And as it relates to the ability for an SSP that has never done in CTV to jump in. I just put myself in their shoe before we bought Telaria, and we were going through that build by partner scenario, and it just dawned on us that the build scenario would cost a lot of money. You'd have to hire a lot of talent, and there's a lot of risk because the market is always moving. And by the time you build your first version, the market might be onto the fourth version.” – Magnite management on why they are likely to be unrivaled as the leading independent SSP” – Magnite management on why they are likely to be unrivaled as the leading independent SSP
Being the leading independent SSP on Connected TV may mean that Magnite will likely outpace all other SSPs; however, they still have Comcast's FreeWheel and Google to compete with. For the next 18 months at least, this is very doable because the company has Disney’s data and publisher segments to work with (more on Disney below).
Being the preferred partner for Disney on CTV inventory is a considerable head start for Magnite, while the company builds out the best software solutions for publishers. With the SpotX acquisition, Magnite now has 250 software engineers aimed at building the best product possible on the supply-side.
Google clearly is not the easiest company to compete with on engineering talent yet small and mid-size publishers are more likely to work with Magnite. Case in point, Magnite and SpotX work with the following list: Discovery, Disney/Hulu, Roku, Samsung, Sling TV, ViacomCBS, Vizio, WarnerMedia, A+E Networks, Crackle Plus, The CW Network, Electronic Arts, Fox Corp., fuboTV, Microsoft, Newsy, Philo TV, Pluto TV, Tubi, Vudu, and Xumo.
As stated, it’s not uncommon for a publisher to work with more than one SSP but the private marketplace greatly reduces the number of relationships a publisher has to the point where it’s inconsequential to work with multiple SSPs.
“As I said before, on a previous question, I don't see this becoming an open market world. It will be private marketplace. And when you do private marketplace deals, you tend to do hundreds of deals and you create a deal library, and buyers get used to where this deal library sits. And they're generally not sprinkled around 10 SSP players. They're sprinkled around 1 or 2 because there's just no advantage to it. Because they're not open market, the pricing has already been agreed upon. You're just transacting through pipes. And so keeping the deal libraries with 1 or 2 players is what's occurring today and, I believe, is what you're going to see long term. So I don't see this evolving to 25 SSPs like you would see in the display world.” -Magnite management on why their positioning on CTV should not be compared to the SSP positioning on displayAnd they're generally not sprinkled around 10 SSP players. They're sprinkled around 1 or 2 because there's just no advantage to it. Because they're not open market, the pricing has already been agreed upon. You're just transacting through pipes. And so keeping the deal libraries with 1 or 2 players is what's occurring today and, I believe, is what you're going to see long term. So I don't see this evolving to 25 SSPs like you would see in the display world.” -Magnite management on why their positioning on CTV should not be compared to the SSP positioning on display
Software and Identifiers
Magnite is currently in beta on their proprietary CTV Unified Decisioning solution. This will help programmatic ad rates (CPMs or cost per one-thousand) exceed ad rates sold direct (CPMs). The software solution helps publishers drive higher yields by mixing direct and programmatic in the bidding process. This allows publishers to sell direct and programmatically in a hybrid format. Management indicated this won't be something that can be financially modeled this year as it's still in beta.
Comcast’s FreeWheel launched Unified Decisioning a year ago when the company decided to leverage its audience, create publisher segments and work with 20+ DSPs to cut SSPs out of the media buying process. This is Magnite’s primary competitor and notably Comcast owns the audience.
Regarding identifiers, Magnite packages first-party data as publisher segments and these are more insulated from Apple's mobile ID and tracking changes.
Magnite and Adform measured monetization lift based on first-party identifiers, including environments that currently disallow third party cookies such as Firefox and Safari. Initial results from Q1 2021 showed significant lift, with overall eCPMs increasing more than 30%, compared with ad requests which did not contain first-party identifiers. A similar study also showed click-through rates on Safari impressions doubled, showing an increase in performance for buyers. including environments that currently disallow third party cookies such as Firefox and Safari. Initial results from Q1 2021 showed significant lift, with overall eCPMs increasing more than 30%, compared with ad requests which did not contain first-party identifiers. A similar study also showed click-through rates on Safari impressions doubled, showing an increase in performance for buyers.
SpotX Acquisition – Why It’s Important:
In February, Magnite agreed to buy SpotX for $1.7 billion for combined revenue of $350 million, of which 67% came from CTV and video advertising in the fourth quarter. Meanwhile, the merger results in $35 million in cost savings. Non-video business will comprise 33% of total revenue.
It’s easy to see the synergy with Magnite pursuing more CTV market share. Beyond the obvious OTT ad synergies, the two main strengths of the SpotX acquisition is omnichannel online video (OLV) and also SpotX’s global reach.
By offering CTV and OLV through one SSP, Magnite can gain strategic positioning as most advertisers will want to buy omnichannel inventory across multiple digital video formats. Roku with DataXu is also omnichannel and excels at Connected TV omnichannel advertising due to first-party data. The obvious question here is why not double down on Roku – especially since the company owns the audience? It is because I believe Magnite can move faster globally than Roku.
SpotX is the largest global supply-side platform. Last year, global ad spend on SpotX grew 42% and was driven by OTT, which accounted for 70% of ad spend. Business in EMEA and APAC grew 107% and 66% respectively. SpotX reaches 25 million CTV households in EMEA, or about half of all ad-supported CTV households.
SpotX’s biggest market currently is the United States as it’s also the most mature market. The supply-side platform reaches 70 million CTV households with a 40% increase in household reach since May 2020 and a 67% increase since December 2019.
Disney Partnership:
In March, Disney announced the Disney Real-Time Ad Exchange (DRAX) which follows the launch of Disney Hulu XP (DHXP) in January. This positions Disney as a bidding solution and leverages Disney’s data for audience targeting. Specifically, DRAX is for “programmatic buys and Disney Select for data-driven targeting,” which means Disney inventory will be more attractive due to the company leveraging its audience graph.
As investors, we have to look at both scenarios – best case and worst case. The best-case scenario is that Disney renews the partnership with Magnite after 18 months. The worst-case scenario is that Disney removes the need for a SSP and handles the auction themselves like Comcast Freewheel.
Right now, Magnite is a preferred partner on Disney inventory but not ESPN.
Disney, obviously, being a far-reaching media empire with many, many, many media formats, the exclusivity or the preferred partner lies around the cross-platform inventory. So if you were to buy inventory from the DXHP that Disney cross-platform sale, all of that goes through Magnite. all of that goes through Magnite.
And specifically, if you were to buy Hulu only and didn't buy any of the cross-platform inventory, that too would go through Magnite. You're capable of buying ESPN without going through Magnite, but conversely, Magnite is very capable of selling ESPN inventory, as well. So, we have access to all of it. Some of it's in a preferred partnership, others is in an open market partnership.
The case for Disney staying with Magnite on SSP:
Comcast FreeWheel will need to attract more publishers in order to scale. If Disney becomes a SSP, then they are limited to only their inventory (Hulu, ESPN, etc) or they must attract publishers to its ad platform. It would be better if Disney sold its segments on its inventory first and then across hundreds of thousands of applications second.
Secondly, Disney will need to do omnichannel, which is desirable as advertisers can reach customers across multiple digital formats and measure campaigns.I don’t see Disney launching (or acquiring) an omnichannel ad platform on the supply side to compete with Magnite but I could be wrong. (I must admit, I do wonder if Disney would acquire Magnite someday though).
If we look at the path that Facebook and Google took, it was not only to transact on their own inventory but they eventually took the place of the SSP and signed on many publishers to build a walled garden across mobile applications. These tech giants knocked out demand side platforms, as well, because the advertisers could go direct. Therefore, it’s not clear which side Disney would go after if they entered the ad-tech market. You could argue they’ll do what Comcast did or maybe they’ll encourage media buyers to go directly to Disney with Magnite’s omnichannel programmatic offering on the backend. Right now, Magnite is building a custom marketplace for Omnicom, for example.
The case for Disney not staying with Magnite as SSP:
I think it’s very (very) unlikely that Disney would work with another independent SSP on CTV ad inventory. As stated above, Magnite really is the best choice when it comes to an independent SSP and Disney’s nod with a preferred partnership supports this.
However, the other option is that Disney becomes the SSP like Comcast’s Freewheel. There is a 50/50 chance this happens after the 18 months is up. Nobody can tell you what will happen here.
As an investor in Magnite, I prefer to see what Magnite can do with Disney’s data and preferred partnership plus the recent SpotX acquisition before jumping to conclusions around the impact this might have. Meaning, Magnite should report solid earnings over the next 1.5 years and it’ll be hard for the market to ignore this. My hope is that the global footprint is large enough by then to where Magnite will be prepared for growth without Disney’s partnership (should the worst-case scenario play out).
Financials Snapshot
In Q4, Magnite grew revenue 69% YoY, or 20% on pro forma basis, to $82 million. CTV revenue was $15.3 million, representing an increase of 53% YoY on a pro forma basis. Online Video (OLV) revenue grew 35% YoY on a pro forma basis.
In total, Magnite recorded 34% of revenue from its CTV segment, 33% of revenue from its OLV segment, and 33% from its display, audio, & other segment.
When combining Magnite with SpotX for revenue of $350 million, 67% came from CTV and video advertising in the fourth quarter.
GAAP based gross margin for Q4 was 74%, up from 66% in Q3. Net income was $5.9 million in Q4 versus net income of $1.5 million in the fourth quarter of 2019. Adjusted EBITDA was positive $30 million while free cash flow totaled $20.7 million, representing an impressive 25% free cash flow margin.
Magnite guided for $60 million of revenue at the midpoint of its Q1 outlook, representing 65% YoY growth. In the company’s Q4 earnings call, Magnite management talked about their expectations for a strong year-over-year growth rate led by CTV. Management also raised its long-term adjusted EBITDA targets to 30%-35%, based off the successful acquisition of SpotX to reflect the higher margins from SpotX.
Below is a comparison of three ad-tech stocks: MGNI, TTD, and ROKU:
Magnite management has set a long-term target of 20% top line revenue growth annually. The company expects the acquisition of SpotX to accelerate both growth rates and margins. In total, analysts are projecting 30% YoY revenue growth for Magnite in 2021 and 21% YoY revenue growth for Magnite in 2022. We don’t make earnings calls but we think the company is more than capable of meeting this guidance.
We are on the cusp of earnings from Snap and it will be interesting to see what management teams are saying in regards to the economy opening up. There are industries that spend a significant amount on ads that are finally able to reach paying customers – such as travel, auto, entertainment and sports.
When you compare Magnite’s growth during this challenging time to other ad-tech companies, it has done an excellent job despite travel, sports, etc not participating in its revenue growth.
FuboTV
FuboTV is not for the faint of heart. Regardless of the price weakness, which is probably more broad market driven, we remain long as we see a nice set-up for a company centered in the important trend of live sports OTT and a near-term catalyst with sports betting.
We outline the main risk we see below fundamentally in the Conclusion (yes, that’s my way of saying you should read the whole thing).
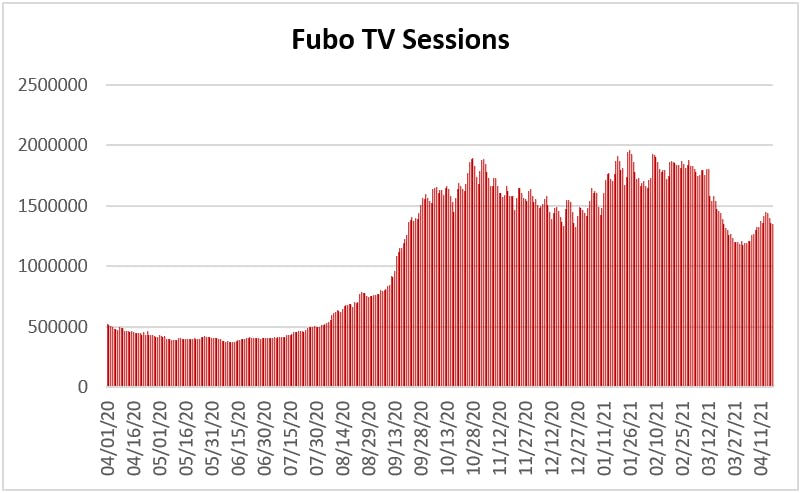
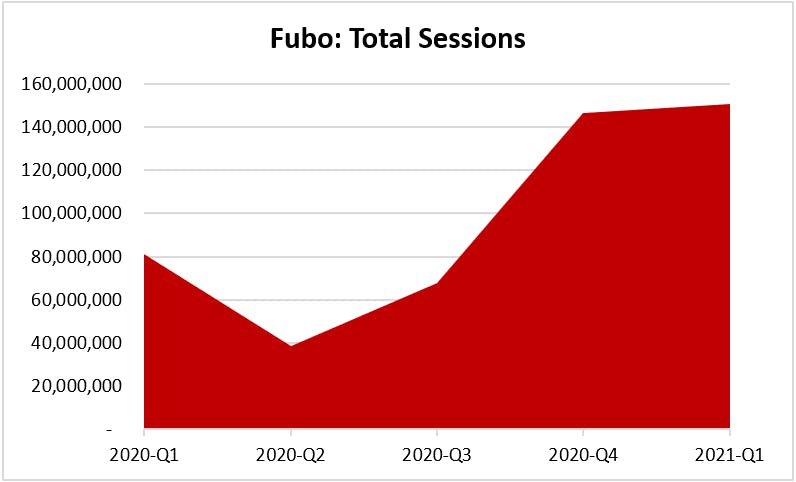
I’ve said since early January that the short sellers have one solid argument which is the negative gross margins. The issue is they are hammering on the lagging financials (and scaring retailers) and are not modeling the sports betting opportunity. In fact, the short argument has only gotten weaker since the reports were released in December, which asserted FuboTV’s traffic had fallen off a cliff and the sports betting book was an impossibility.
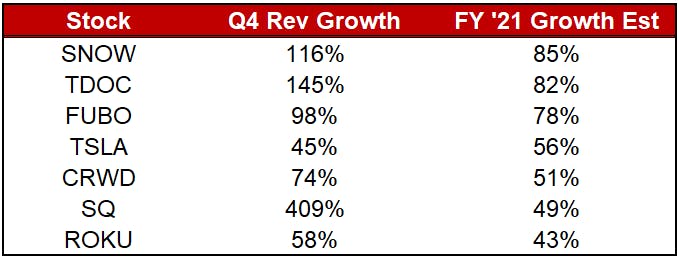
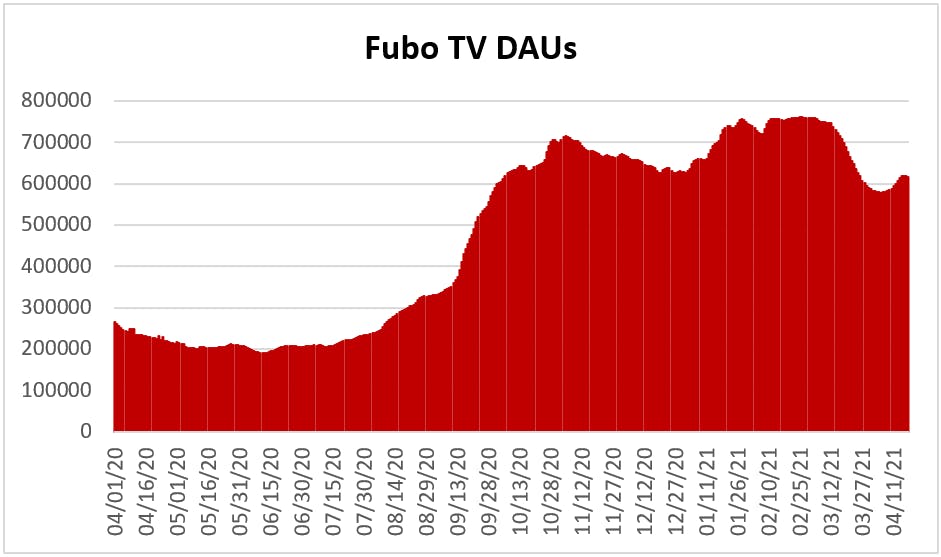
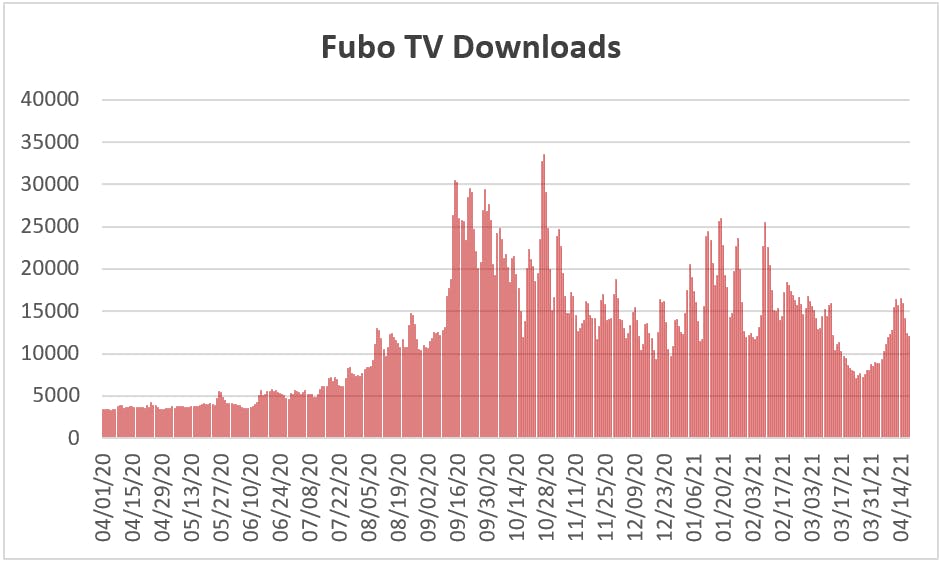
As you can see in the chart below, not only did Fubo’s traffic not fall off a cliff but the company’s growth stands out compared to other top growth stocks when you look at both Q4 and forward estimates.
The sports betting book launch is the easiest part of the equation, so I did not waver on this point before there were any announcements. Now, we have both free-to-play and the betting app coming out this year. The hard part to tech and all media is amassing an audience. It doesn't matter if you're as big as Facebook or as small as FuboTV – your company's value is determined by the size of the audience and the growth of that audience year-over-year. Products and features can be built and launched fairly quickly if you have the audience. You can pivot, expand, etc – again, as long as you have the audience.
That doesn’t mean FuboTV doesn’t have hurdles to clear – my point is that as investors we should have a mental checklist of what is most important for the stocks we own. The first for a media company is always audience.
As FuboTV investors, it's in our favor that the world's two biggest global sporting events coincide this year – the Olympics and the World Cup. What's even more interesting is the economy is re-opening this year and we may see record advertising levels during a time when FuboTV is reaching important live sports audiences.
I’m not going to say it’s a slam dunk (i.e. there are no guarantees) but FuboTV’s path to beating guidance and improving their financials is easier than it appears right now. It probably has the most tailwinds of any company we own in that regard. I say this because the Olympics and World Cup content will demand sizable ad revenue.
North American football rights are in a tug-of-war with even Amazon Prime now in the mix. Hulu announced a carriage deal with the NFL Network and NFL RedZone for Hulu’s Live TV service. The reason why I’m not too worried is that the live sports audience is massive – in fact, these moves may signal a time when cable TV no longer exists and that’s the ultimate goal for a $5 billion market cap company like FuboTV, which will see tremendous windfall if this occurs.
Roku makes this argument frequently when analysts are concerned about competitors, such as Peacock. The argument Roku management makes is that any eyeballs that cut the cord is a windfall for them. If the media conglomerates help push the remaining 74 million cable subscribers in the United States to cut the cord, this helps Roku because the stats show that about 35% to 40% of those 75 million will choose Roku.
We aren’t sure what FuboTV’s true share of the live sports OTT market is because I’ve repeatedly said live sports OTT is too early to draw definitive conclusions. Remember when I said connected TV ads was the future for Roku in 2018 and here we are three years later? I'd say that's similar to where we are with live sports OTT. Another analogy would be subscription video on-demand in its early days (maybe circa 2006). I'm not saying FuboTV’s path to monetization will look like those two companies – I’m trying to give you an understanding of how early we are to the live sports OTT microtrend. We are very early.
FuboTV is not the next Netflix or the next Roku although time will tell if the story is as misunderstood as those two stories were. I believe FuboTV could have similar staying power because of the monetization method — which to be crystal clear — is betting and gamification. Before I expand on monetization, I want to reiterate that live sports is the holy grail for cable subscribers and the microtrend we are invested in – but this is different from a monetization method. Live sports were the last to convert because sports fans are, well, fanatical. In this case, OTT saved the best and highest-paying customers for last.
I don’t have access to Board meetings, obviously, but we can follow the money to see that Disney and Comcast don’t see FuboTV as a competitor. They are backers, and in my opinion, they want a piece of the gamification of live sports. This means free-to-play, betting, and AR/VR. Fubo’s oddball merger with Facebank can lead to AR/VR integration – for instance, a virtual reality boxing match starring Floyd Mayweather. The possibilities here are endless and it doesn’t take much imagination to consider a sports audience to be the perfect AR/VR enthusiasts.
Despite short sellers not seeing how or why a sports betting app could merge with live sports content, we now see DraftKings partnering with Sling/DISH. I guess content and sports betting does go together, after all (insert sarcasm). It’s surprising that the short reports written by telco and media analysts said it cannot be done despite Sky Media having the most successful sports betting model globally.
From purely a user acquisition standpoint, in-app ads with your own content is nearly frictionless and you have a mountain of data to effectively target. FuboTV with Comcast and Disney as backers is much more interesting to me as an investment – and I also believe the NFL Network carriage deal with Hulu will affect DISH more than FuboTV.
Regarding Fubo’s monetization potential, David Gandler has made it clear in this excellent article that 22% of their customers plan to spend more than $100 a month on betting. The number will likely be higher once the product has actually launched. There is also an enviable customer acquisition cost (CAC) and lifetime value (LTV) user acquisition loop between the content and betting. For instance, Fubo can give free sports content away and offer other rewards that are not possible unless you own the audience.
Financials Overview:
In Q4, Fubo grew revenue 98% YoY to $105 million. Subscription revenue was up 91% YoY to $91.4 million, and advertising revenue was up 157% YoY to $13.1 million. Paid subscribers at the end of Q4 totaled 547,880, an increase of 73% YoY.
For the first quarter of 2021, Fubo guided for $102 million in revenue at the midpoint, representing growth of 100% YoY. In the Q4 earnings call, management talked about their expectations for a softer Q1 sequentially, which is in line with historical seasonality trends.
Fubo management discussed their plans to continue to focus on expanding the business through growing its top line. Although the key focus is on top line revenue growth, Fubo still expects to make progress in its path to profitability and margin improvement:
“In terms of the adjusted contribution margin, we don’t provide guidance at this point about these metrics, but we are clearly very focused on expanding our business focusing on growth with an eye to ensure that we continue to improve in our path to profitability delivering an year-over-year improvement of our margins.” – Fubo CFO Simone Nardi
Fubo defines adjusted contribution margin as a “figure to measure the variable costs against subscriber revenue. ACM is calculated by subtracting ACPU from ARPU.”
In the full year 2020, Fubo recorded a 10.1% positive adjusted contribution margin, up from -3.1% in 2019. In turn, gross margins improved from -16% to positive 4.6% in Fubo’s most recent quarter. Fubo did not give Q1 or 2021 guidance for contribution margin or gross margins but management confirmed that they are expecting continuous year-over-year improvement in margins. This is a positive sign for a company whose main focus continues to be growing revenue and expanding the business.
Fubo guided to end Q1 with subscribers of 520,000 to 530,000, representing growth of 82% YoY at the midpoint. Data from Apptopia shows that Fubo ended March with approximately 585,000 daily active users (DAU) versus the Q1 guide for 525,000 paid subscribers at the end of Q1.
Download data from Apptopia also revealed what appeared to be a strong Q1 in terms of app downloads.
Further, we are seeing a strong start to Q2 for Fubo as app downloads are currently tracking above 100% YoY in April.
For the full year, Fubo management guided to end 2021 with subscribers of 762,000 to 770,000, an increase of 40% YoY at the midpoint of the range. Fubo also raised its revenue outlook by 9% above the previous guide in its Q4 earnings call. In total, Fubo is expecting revenue of $465 million for the full year, representing growth of 75% YoY.
Downloads give us a one-dimensional viewpoint yet it’s important to compare downloads with sessions. When broken down week by week, we see sessions up a minimum of 100% at the low point end of March and ticking up towards 200% for about 150 million sessions by mid-April.
Here’s another glimpse of the quarterly data on FuboTV’s total sessions.
You’ll have to decide for yourself after looking at Fubo’s numbers in Q1 if you think the company can exceed this guidance.
Please note, that while Apptopia provides app data, we do not make earnings calls with this data. It is purely for informational purposes and you must draw your own conclusions based on the data provided.
We've laid out our thoughts on the Olympics, World Cup and sports betting app. These points aren't lagging, they are forward-looking, and that style isn't for every investor. It's certainly our style, however, and we are comfortable with our position in FuboTV.
Conclusion:
The risk I see will be in Q2 numbers. This should be the weakest quarter for FuboTV and this may be what’s being priced in right now. We are tracking decent growth here right now so let’s see what management says in the earnings call.
We have a new name, new website and audited 2020 results.
This week we’ve got big news to share.
First off, my team has released audited performance results that outperformed $ARKK since the Fund was founded on May 9th, 2020 and we are currently beating the Nasdaq across roughly 34 positions. You can view the press release here.
How does a team of four dedicated people beat a team of 38 at Ark Invest or a team of hundreds at Goldman Sachs and Morgan Stanley? I discuss this below.
As you are aware, I’ve been publishing under Beth.Technology, but this name no longer fits the services we provide. I’ve evolved from a tech insider with a blog to an actively managed tech fund that offers in-depth research and real-time trades.
I can no longer run a site with my name only as this is a team effort. We are rebranding Beth.Technology as I/O Fund.
I/O stands for input-output and is used across all computing (cloud, AI, ML, etc). We specialize in tech growth, and this name symbolizes our singular focus on this niche.
As you’ll see, we outperform some of the best funds on Wall Street.
With audited returns of 115.5% from May 9, 2020 to Dec. 31, 2020, I/O Fund narrowly outperformed ARKK within the same timeframe. Our actively managed fund was founded on May 9th, 2020 following the launch of the premium service on July 15, 2019.
One reason a small team of four can achieve this performance is that individual investors have more tools they can use, including hedges, small caps and allocation to crypto.
The second reason is that we believe in each other and know our respective positions very well. By combining our specialized strengths, we outperform the major indexes and larger teams.
I’m amazed at how collected my team is under pressure and how humble they are during rallies. I’ll introduce you to Knox Ridley, David Marlin and Jessica Ablamsky below. First, I want to tell you about myself and how I’ve come to analyze tech companies day-in and day-out.
An Edge on Wall Street
Ten years ago, I started a blog on startups and tech companies for the private sector called CitizenTEKK.
I worked with more than 300 startups to help communicate the importance of their products to wider audiences. I also wrote white papers and analyst reports for deals in the private sector for about 5 years.
These reports simplified complex technical concepts so busy executives could make big decisions quickly on venture investment rounds and strategic partnerships, or decide whether their company should be an early adopter.
Due to high switching costs, adopting technology is often a costly investment. My research reports helped guide these big decisions.
About three years ago, I took this experience and brought it to public markets. The reason is simple. I saw lots of errors being made when retail investors attempted to understand tech products. Even worse, financial analysts with no experience in tech were feigning expertise.
Because I was trained specifically to communicate at the highest level on the importance of complex tech products and their strategic value, I saw an area where I could help.
I’m not an engineer—and that is a good thing. Engineers built products. I was trained to communicate the purpose of those products and their strategic value.
That experience provides an edge you can’t find anywhere else. Stock screeners, algorithms, quant models, etc—these are plentiful and therefore erode competitive edge. Meanwhile, having experience in communicating the strategic value of hundreds of complex tech products is the edge that institutions seek.
This is demonstrated by my results. I predicted the biggest stock drop in history in Q2 2018 with Facebook's miss and the biggest IPO loss in history with Uber in Q2 2019. I break down company strategies and product roadmaps before they become apparent to the market, which is why invested in Zoom and Roku from the IPOs and have been holding for a more than 1,000% gain.
My free newsletter is consistent and full of original research. In a world where research is ripped off and recirculated, you can rest assured everything I publish is original—and has been dating back to 2011.
This is extremely important, because borrowed research can’t stand the test of a steep selloff. I held Roku through two pullbacks of 60% or more.
Don’t guess with your hard-earned money. Seek out experience and find someone who offers more than the dime-a-dozen algorithms and trading software. I won’t always be right, but I’m able to outperform analysts at institutions because they haven’t spent a day inside of a tech company or a day working with a product.
Cathie Wood is a great example. She’s an excellent money manager but hasn’t worked with tech products or analyzed hundreds of startups and companies. I’m probably into the thousands by now.
Experience in tech is one reason why we beat Ark in our first year and why we are beating the Nasdaq right now.
It’s been a thrilling experience to bring my skills to retailers and I have no plans of slowing down. For fun, I thought I’d give you some throwback videos on when I presented to audiences on tech products.
Portfolio Manager Knox Ridley uses technical analysis to predict tops, call bottoms and help our readers navigate major market moves. We tested a quant with algorithms against Knox and Knox beat the machine every time.
He looks at dozens of charts every day, and the ability to connect dots across multiple charts is not a match for a machine. (This is good news for anyone who thinks machines will permanently replace humans).
He also cares deeply about helping individual investors realize the highest returns and offers his entries, exits and hedges in real-time.
His dedication to our readers is unparalleled. He posts daily on our private subscriber forum and analyzes key charts during bimonthly webinars to share what actions he is taking and why.
The results speak for themselves. Knox is the I/O Fund portfolio manager who competes with hedge funds. I can’t claim the performance as that is actually Knox’s performance results as the PM.
It would be easier if we simply recommended stocks and did not disclose our activity. But this wouldn't help our readers who have to weather steep sell-offs in volatile growth tech stocks. Knox is right alongside our readers in the trenches—with full disclosure about what he is buying, when and at what price.
Our goal of beating Ark on the upside and the Nasdaq in down markets has been achieved since our inception on May 9th. This is largely due to Knox Ridley’s expertise. Details on audited results were released to our subscribers last month and are available in our recent press release.
In a recent webinar, Knox provided a general market update and levels to watch for the Nasdaq 100. For his most recent analysis of NDX, you can click here.
Taking Advantage of Momentum
Tech growth moves fast. Last year, we realized that we need a nimble and smart equity analyst to help us track small caps, SPACs, earnings revisions and adjustments to valuations. Last August, we added David Marlin to our team. A former prop trader in Manhattan, David has a keen eye for momentum stocks.
There are thousands of equity analysts working at various investment banks, but very few of them understand tech growth like David. The unique space I/O Fund specializes in requires someone who can look at high valuations and determine which stocks deserve the valuations and which do not.
We believe we are invested in the two best SPACs thanks to David’s dedication to organizing this trend for our premium subscribers. We also believe we are positioned well for tough Covid comps, with specific picks from David, due to his maniacal focus on fundamentals, forward growth estimates and valuation.
David contributes regularly to our forum, webinars and the I/O Fund portfolio of about 30 positions. He is also a weekly contributor to the in-depth research our service provides and works alongside Knox on a proprietary hot list.
When David first came on, we wanted him to help expand our coverage on stocks that we didn't previously cover. In David's first article for us, he outlined his top nine momentum stocks.
An equal weighted portfolio of David's top 9 picks since the date of the article (9/24/20) would have returned 62.23%, good for an annualized gain of 145.09%. David's top picks significantly outperformed Ark Innovation ETF ARKK, the QQQ, and the S&P 500 during the same time frame.
Holding for Big Gains
Jessica Ablamsky is a savvy tech investor who helps our team stay social and active even when we are heads-down with research. Jessica keeps track of details for the I/O Fund and is on our forum daily to help moderate important discussions.
As we have all seen over the past year, growth tech stocks are more volatile than the overall market. If you want to hold on for big gains, it’s important to maintain a strong thesis on long term holds and not get scared out of them during pullbacks.
Jessica keeps a cool head during corrections and is always there to remind investors that volatility is normal and to be expected. She is dedicated to helping retail investors outperform the Nasdaq and is always on the lookout for good opportunities to add to long term holds.
She recently covered Poshmark and has in-depth analysis coming out on Pinterest, a stock she owns and knows well. Jessica’s attention to detail and keen sense around investments is something that benefits our community.
Earnings Coverage to Resume Next Week
If you made it this far, we thank you for your support. We are incredibly excited for this new rebrand and grateful you let us share this with you. My free analysis will remain the same while the premium site offers the following:
Research
Portfolio with 30+/- positions
Real-time trades and audit
Forum
Webinars
Thanks again! We will resume coverage of earnings next week.
We recently increased our allocation to Stem Energy (STPK) and we are revisiting the stock in the write-up below. I originally covered Stem Energy (STPK) in detail in early February here and later here.
On a fundamental basis, nothing has changed with Stem (STPK) since the last time I covered the company. The stock has followed the way of most all SPACs during the recent Nasdaq correction. In a risk-off trading environment, SPACs and more speculative investments with little or no revenue are typically the hardest hit. The Defiance Next Gen SPAC ETF SPAK still sits over 23% down from its all-time-high price.
SPACs have been grouped together by many investors and sold off together with no attention paid to the underlying company beneath the shell. The fact is SPACs typically have little or no revenue, so investors can easily rationalize selling these stocks first when the market environment turns bearish. That is why it is important to step back and remind yourself why you invested in these companies in the first place. In the case of STPK, we continue to have a high conviction because nothing has changed with the thesis that led to our initial investment. The only thing that has changed is the stock price as STPK has been sold off along with hundreds of other SPACs that have been grouped together in one category.
STPK has shown solid relative strength in the face off the recent SPAC sell-off, outperforming the SPAK ETF notably YTD. Below, we compare STPK’s performance to some of the most notable SPACs of 2020:
As time goes on, SPACs will no longer be categorized as just that. In the future, the underlying business fundamentals of these public companies will be the biggest factor in how the stock performs. To get to that point, these companies may need to announce real revenue and cash flows to separate themselves from the hundreds of other SPACs with lofty projections. SPACs may never recover to all time-highs as a category; however, the very best SPACs will recover and shareholders will be rewarded. The goal is always to pick the leader and this may be more crucial in a high-risk category such as SPACs. Our allocation to STPK has increased as we believe the company is fundamentally stronger than other SPACs.
As previously mentioned, investors are taking a more cautious approach to SPACs and stocks in general. For SPACs specifically, the market is taking a skeptical view that these companies can actually deliver on their projections. From the market’s perspective, these companies are in “Prove It” mode in regards to their projections. As time goes on and these companies begin to announce quarterly financials, it will become crystal clear which SPACs are actually able to deliver and which are not.
We embrace the concept of letting the financials do the talking because we are comfortable with Stem Energy’s probability of delivering strong results. Stem utilizes its proprietary AI software, Athena, to smartly store and deploy energy, resulting in 10% – 30% monthly electricity bill reductions for its clients. Athena AI reduces volatility and enables solar generation time-shifting to support local grid capacity needs. Stem currently has over 900 systems operating on its Athena AI software in over 200 cities worldwide. The company currently has a 75% market share in California’s BTM storage market, which is the largest in the US. In 2019, Stem was the leading commercial energy storage installer in California with 3x the kW installed as its closest competitor.
Source: Citron Research
Over 75 countries, including the US, have committed to net zero emissions by 2050. An additional 35% of Fortune 500 companies have made a commitment to Carbon Neutrality. These are two massive tailwinds for Stem, as management estimates there is a projected $1.2T in new revenue opportunities for integrated storage that are expected to be deployed by 2050.
Electricity production is the #2 polluter responsible for 27% of greenhouse gas emissions. Stem’s product effectively reduces its client’s electric bills 10-30% and helps them meet their corporate ESG targets without changing the way the operate.
Stem’s full revenue projections are below:
Source: Stem Investor Presentation
Stem has two distinct business segments comprised of hardware and software. Stem makes money from their hardware segment with upfront payments for initial purchases. The company is targeting 10%-30% gross margins for the hardware segment of the business.
The more profitable segment of the business is expected to be the software segment. Stem’s software segment is a recurring SaaS model secured by 10-20 year contracts with monthly recurring cash flow. Revenue is recognized ratably during life of the contract with additional upsell revenue opportunities from Athena applications. Stem is targeting 80% gross margins for the software segment of their business and is expecting the software segment to be the main driver of gross profit by 2026.
Source: Stem Investor Presentation
Stem currently has over $200M of contracted backlog and over 100% of its $147M revenue projection for 2021 already locked in. While many SPACs will likely fail to meet their estimates, we expect Stem to deliver a nice upside surprise on the $147M estimate.
After the transaction with Star Peak Energy Corporation is complete, Stem will have $525M in net cash and 0 debt to capitalize on growth opportunities. The company plans to use the majority of this cash to fund future growth while also using about 3.6% for estimated repayment of debt.
For a more detailed report on Stem’s business, I first covered the company in detail here and again in late February here. Jim Cramer, who has been critical of the SPAC market in general, has recommended STPK as 1 of his top SPACs to own for the future.
Stem has a solid management team that includes former executives at First Solar, General Electric, and Siemens. CEO John Carrington worked as General Manager and Chief Marketing officer at General Electric for over 16 years where he led global innovation, new technology efforts and product strategy. In total, Stem has 145 employees and a management team with former leadership experience at technology, energy, and industrial companies.
Stem has a list of clients that includes Apple, Amazon, Google, Facebook, and Walmart and a backlog of contracts that will drive future growth beyond 2021. We believe Stem is positioned to win many more contracts in the future as renewable energy becomes a bigger part of the economy. In my last report covering Stem, I wrote the following:
“There remains a great deal of untapped potential for energy efficiency improvement through implementation of new technologies. Stem is ideally positioned to be an industry leader in the energy storage market as more companies follow the path that Apple and Amazon have already taken.”
This remains true despite short-term price movements in the stock. We believe Stem is one of the best companies to go public via the SPAC method and has a very bright future ahead of it. We remain bullish on the name and bullish on the renewable energy industry. We look forward to the company releasing financials because we are confident it will serve as validation for our investment.
Due to SPACs being volatile in nature, we lean heavier on technical analysis and only buy at key levels. Knox Ridley will update readers as he enters new tranches in this company.
Beth.Technology Fund has unveiled a new name, I/O Fund, new website, and audited 2020 returns as part of an extensive rebranding initiative.Beth.Technology Fund has unveiled a new name, I/O Fund, new website, and audited 2020 returns as part of an extensive rebranding initiative.new website, and audited 2020 returns as part of an extensive rebranding initiative.
SAN FRANCISCO–(BUSINESS WIRE)–Beth.Technology, an actively managed tech fund that offers in-depth research and real-time trades, has completed an extensive rebranding initiative to reflect the company’s comprehensive services, team-oriented approach, and vision for the future. The rebrand includes a new logo, updated website, and a new name: I/O Fund.
“We evolved from a tech insider with a blog to a full-service fund with an expert team. Our brand is built on credibility, transparency, and industry knowledge. I’m proud to offer these benefits and raise the bar on tech analysis for retail investors.”
I/O Fund empowers retail investors by offering an actively managed and transparent portfolio alongside institution-level research and real-time notification of entries and exits. The I/O Fund specializes in tech microtrends and has outperformed other popular tech focused innovation funds on the market. I/O Fund competes at the highest level and offers full transparency for individual retail investors.
The I/O Fund also features a free public newsletter with past stock coverage that included Roku at $33, Zoom at $137, and Bitcoin around $9,500. Premium subscribers are notified of even lower entries, such as Zoom at $62, and Bitcoin at $7,700.
With audited returns of 115.5% from May 9, 2020 to Dec. 31, 2020, I/O Fund outperformed popular tech focused innovation funds within the same time frame. The actively managed fund was founded on May 9th, 2020 following the launch of the premium service on July 15, 2019.
“This rebrand reflects a significant step forward in our evolution, redefining who we are as a team and as a company,” said I/O Fund Founder and CEO Beth Kindig. “We evolved from a tech insider with a blog to a full-service fund with an expert team. Our brand is built on credibility, transparency, and industry knowledge. I’m proud to offer these benefits and raise the bar on tech analysis for retail investors.”
Lead Analyst and CEO, Beth Kindig, uses fundamental analysis at I/O Fund to identify the leaders of the most important tech microtrends. Then Portfolio Manager, Knox Ridley, uses technical analysis to guide entries, exits, risk management, and provide market commentary on the decisions the I/O Fund makes in the actively managed portfolio.
“At I/O Fund our goal is to get outsized returns—without excessive risk-taking —by predicting future tech leaders before the run, and spotting periods of market weakness before they happen,” Knox Ridley said. “We share that knowledge with our readers, alongside real-time entries and exits in I/O Fund, so they see how decisions are made when running a competitive growth portfolio that exceeded the best funds on Wall Street last year. To communicate this expanded vision, the fund needed a new identity. I’m extremely proud of our team, and our market-beating results.”
I/O Fund is an actively managed fund that offers in-depth research and real-time trades. We specialize in tech microtrends and have outperformed popular tech focused innovation funds since our inception with audited performance results. I/O Fund empowers retail investors by offering a transparent portfolio alongside institution-level research and real-time notification of entries and exits. We also offer a free public newsletter with past stock coverage that included Roku at $33, Zoom at $137, and Bitcoin at $9,500. Premium members are notified of lower entries, including Zoom at $62, and Bitcoin at $7,700.
Please note: The I/O Fund conducts research and draws conclusions for the Fund’s positions. We then share that information with our readers. This is not a guarantee of a stock’s performance. Please consult your personal financial advisor before buying any stock in the companies mentioned in this analysis.
This article was originally published on Forbes on April 9, 2021, 12:35am EDToriginally published on Forbes on April 9, 2021, 12:35am EDT
Last year, I called Zoom Video a “pegasus” because the company stood out from the dime-a-dozen unicorns that have come out of Silicon Valley. Zoom has illustrated rare financial strength from its IPO through today due to exceptional product-market fit.
The term unicorn was first used to describe a startup with a valuation of a billion dollars or more. There have been hundreds of unicorns since the term was coined by Ailene Lee of Cowboy Ventures. However, there has been only one tech company on the public markets that has illustrated the financial strength that Zoom Video has in both its top line and bottom line.
Critics will say Zoom required Covid to generate these numbers, yet one look at the S-1 filing immediately disproves this theory. The market is overlooking Zoom’s long history of category-leading growth, which is discussed in detail below.
In the analysis, I also elucidate my thoughts on “exceptional product-market fit” and Zoom’s product strength pre-covid, during covid, and what the company will do to double its TAM in the coming year.
Please also note, per the analysis below, the I/O Fund has closed its position in Bandwidth and allocated more to Zoom. I explain why Bandwidth remains a solid choice yet we see more upside in Zoom due to the company’s sub-Top 20 valuation.
During the September 2019 selloff in cloud, which saw 40% to 50% drawdowns in many solid cloud names, I made sure to hammer on my thesis that cloud is a secular trend insulated from geopolitical risks and economic drawdowns. My thesis was proven correct by Covid as cloud software performs well in extreme economic climates because it reduces costs when budgets are constrained, and increases productivity, which is important during times of economic expansion.
This year is very unique for cloud software because many stocks are guiding for less than 40% revenue growth. We are not surprised to see lower valuations following the Q4 earnings reports as the market holds its breath to see how cloud will perform following tough comps from Covid. The Q1 reports are necessary to shed light on what companies will be the leaders coming out of the unusual year of 2020.
There is only one way forward for SMBs and enterprises — adopting cloud IaaS, platforms, and software. Traditional IT is expensive and will only hinder a company from taking advantage of AI and 5G. Competitively it can be very harmful to not transition to cloud right now, as I’ve emphasized in my past reports.
My overarching thesis about cloud software’s resiliency extends to other names, yet this analysis focuses on Zoom Video as it’s one the strongest stocks on the market in terms of its historic top line growth, strong margins, incredible free cash flow and growing profitability. I believe the market is making a mistake by dropping Zoom from the top 20 for cloud software valuations. Zoom is and lay out the reasons below.
Zoom is more than Web Conferencing
The market’s biggest misperception about Zoom is that it’s a web conferencing app. The company is more than two years into developing products and services that broaden its use beyond web conferencing with Zoom Phone launching in January of 2019, yet the market has priced Zoom for only one path (web conferencing). The company has since launched Zoom Rooms, a virtual marketplace Zoom Apps, and OnZoom. The company coined the term hardware-as-a-service because Zoom expects to disrupt nearly every area of telephony.
Last August, I pointed out that Zoom’s hardware-as-a-service products allowed companies to replace legacy systems by consolidating software and hardware for one consistent experience. ServiceNow made headlines last year when they chose Zoom Phone to replace their business phone lines by stating, “Going forward, with the addition of Zoom Phone, we’re getting a head start on an even more robust experience with Zoom — one-touch communication and collaboration features, plus Zoom-connected conference rooms.”
Zoom’s partner program saw significant expansion in 2020. Partner sales bookings increased more than 7x year-over-year. Over 20% of international business bookings in the past quarter were driven by Zoom’s partner ecosystem, and Zoom’s Master Agent business was the fastest growing in history for Master Agents AVANT and Intelisys.
Notable partnerships include carriers such as British Telecom, Lumen Technologies, and Orange Business Services. Zoom’s Distributor Partner Program includes Carahsoft Technology Corp. in the U.S., Nuvias Unified Communications in Europe, eLink Distribution AG in DACH, West Telco in LATAM and EMEA, SYNNEX/Westcon in LATAM, SB C&S in Japan, and FVC in the Middle East and Africa.
Master agents AVANT Communications and Intelisys, a ScanSource company, both reached $1 million in monthly recurring revenue (MRR) prior to the one-year anniversary of their partnerships with Zoom. Zoom also added six new Master Agent partners: AppSmart, Bridgepointe, eLink Distribution, PlanetOne, Sandler Partners, and Telecom Consulting Group (TCG).
Last year, Zoom saw growth of use cases in telemedicine, virtual events, and health and fitness after revamping its partnership program for independent software developers. The company supports more than 200 partners through its open API and SDK and expects to see further growth as new industries and markets are developed on top of Zoom.
Zoom also recently announced a multi-year partnership with Formula One, following a successful collaboration in 2020 on the Virtual Paddock Club, which offers VIP sports experiences. As part of the expanded partnership agreement, Zoom is working with Formula 1 to deliver unified communications and new business and hospitality experiences for on-site and virtual guests, including live updates from “legends of the paddock” and Paddock Club Business Lounges set up in Zoom Rooms.
Forward CAGR & Product-Market Fit
The analyst estimates for Zoom are 29.8% CAGR over the next three years through fiscal 2024. This makes little sense as the company has had a net retention rate of 130% over eleven consecutive quarters. This means analysts are essentially guiding for an increase in churn/downgrades and these projections assume Zoom will not add any new customers.
The analyst estimates for Zoom are 29.8% CAGR over the next three years through fiscal 2024. I/O FUND
As stated, management from cloud software companies are not giving analysts much for forward guidance as it’s better to play this transitional period safe. Regardless, the projections don’t match Zoom’s incredibly strong track record.
First, there is no other cloud software stock that has made the leap from enterprise to consumer. Zoom was the top app by number of customers and unique active users this past year. Yet, it is also the preferred enterprise video conferencing app and ranked among the most popular workplace apps overall, according to Okta’s 2021 Business Network Report.
We see further evidence of Zoom’s customer approval across both consumer and enterprise as the security concerns last year were quickly forgiven as the management moved quickly to respond. In Q4, Zoom Phone was the fastest growing product line quarter-over-quarter. During the most recent earnings call, Zoom announced expansions into Zoom Phone by Zoom Meetings customers Equinox, Universal Music Group, and University of Southern California. The company expects strong growth for Zoom Phone going forward with a strategy of selling into the existing install base.
For product-market fit, you need the top line to grow rapidly and for the bottom line to strengthen. This is not the only indication but it simplifies the many variables. Before I go over the recent financials, I want to emphasize that Zoom was already outperforming its category per the S-1 filing that I covered in April of 2019.
The chart below provided by Alex Clayton of Spark Capital shows how Zoom compares to other cloud software companies that had a subscription revenue run-rate of $100M in their disclosure period with the graph indexed to the quarter where they crossed $100M.
Not only was Zoom the fastest growing cloud software IPO from $100 million onward in terms of run rate but also grew 108% in their last quarter YoY compared to a median of 38% in 2018 for the companies pictured above. ALEX CLAYTON OF SPARK CAPITAL
Not only was Zoom the fastest growing cloud software IPO from $100 million onward in terms of run rate but also grew 108% in their last quarter YoY compared to a median of 38% in 2018 for the companies pictured above. Zoom was also the most efficient in terms of customer acquisition cost, with a median payback period of 9 months compared to the median of 30 months.
Below is how Zoom stacked up to other popular cloud software stocks at its IPO:
How Zoom stacked up to other popular cloud software stocks at its IPO. I/O FUND
There’s a catch to the graph illustrated above — Snowflake was only 6 years post-launch while Zoom was 8 years post-launch. Therefore, when we adjust growth rates for age of company, we see Zoom is the #1 company in terms of financial strength in cloud software:
We see Zoom is the #1 company in terms of financial strength in cloud software. I/O FUND
There’s more … Zoom was profitable at the time of IPO while the majority of cloud software companies are not profitable many years after their IPO. Not only is Zoom the strongest IPO in cloud’s history but it was also profitable. Not one other company was profitable at IPO … and only Shopify is profitable now from the list although this occurred many years after Zoom if we adjust for age of company.
Hopefully, this helps the critics see that Zoom has always been best in its class — and cloud software is not an easy category to lead with top performers such as CrowdStrike, Snowflake, Shopify and Slack (a very sticky product) coming from this category.
Doubling TAM
Founded in 2011, Zoom previously described itself as a leader in modern enterprise video communications. The CEO states that Zoom is enabling greater effectiveness in human-to-human interactions over a distance with use cases that are not possible with legacy systems. The key words here are “not possible with legacy systems.”
Zoom’s ongoing goal will be to disrupt all legacy systems with cloud-native communications — and this means every possible method of communication that is not currently done on the cloud and/or is currently on the cloud but is too cumbersome of a process due to walled gardens.
According to Gartner, by 2022, 65% of meeting solutions users will take advantage of SIP/VoIP-based audio-conferencing tools. This is up from 20% in 2017, while 40% of meetings will be facilitated by virtual concierges and advanced analytics. Here we see Gartner had already predicted audio-conferencing to grow substantially prior to Covid.
The global web conferencing market is expected to grow from $12.58B in 2020 to $19.02B by 2025, at a CAGR of 8.6%, according to Valuates, which offers market research reports.
The global web conferencing market is expected to grow from $12.58B in 2020 to $19.02B by 2025, at a CAGR of 8.6%, according to Valuates, which offers market research reports. VALUATES REPORTS
The exact size for the video communications market varies considerably depending on the source. This is because the market is very new. According to research from Markets and Markets, the video communications market is expected to grow an average of 8% per year to nearly $20 billion by 2023, with another report expecting that the industry will register a CAGR of 9.2% from 2018 to 2025. However, IDC pegs Zoom’s future addressable market much higher at $43 billion, as cited in a previous Zoom earnings call.
If we go with the more modest addressable market size of $20 billion, then Zoom Phone will double TAM as telephony is forecast to grow to $23 billion by 2024, per the Q4 fiscal 2021 report. While doubling TAM, Zoom Phone was the company’s fastest-growing product line quarter-over-quarter, according to the report, and executives expect to see strong growth in FY2022.
Some analysts claim the domestic market is close to saturation, and Zoom will have to look for more opportunities in overseas markets. This is unlikely as communications is both account based and usage based, not to mention hybrid work-from-home is the consensus among surveys of executives with only 29% stating the office will return to five days in the office per week.
Zoom sees international expansion as a major opportunity. In the first-quarter fiscal 2020, APAC and EMEA revenue grew a combined 127% year-over-year. As such, Zoom plans to add local sales support in further select international markets over time and also use strategic partners and resellers to sell in international markets.
Revenue from APAC and EMEA collectively represented about 20% of Zoom’s revenue for the quarter and management noted that it could be the beginning of a sizable opportunity to bring the Zoom platform to other regions.
Why Zoom Went Viral and Will Again …
The agnosticism of Zoom compared to Google and Microsoft means the company has the opposite goal of big tech: rather than lock users into a walled garden, Zoom created a flawless and viral mechanism where users can share web and audio-conferencing links without needing to login. Zoom exploited big tech’s weakness — the walled garden — which requires logins and a cumbersome user workflow.
Many critics think the catalyst for the virality was Covid, yet my premium site had stated this mechanism was a viral feature many months prior to the pandemic. “Viral mechanic” means the spread of growth across users as a built-in mechanism to the product. The first Zoom user in an office naturally evangelizes the product by inviting more people to a conference with a simple link. The users who are invited do not need to sign up for Zoom, and the experience is much better than other conferencing solutions that require many steps to join a conference and are not in HD.
The best growth in tech products occurs when the product multiplies across users exponentially. This is why social media reported incredible growth — one user invites many users to the platform with a simple link. Zoom is an example of the “sum of its parts is greater than the whole.” Its success is based off many micro improvements to video conferencing that adds up to a serious advantage over the competitors.
Cisco was the main competitor that Zoom disrupted as CEO Eric Yuan was a former engineer at WebEx before it was acquired by Cisco. Zoom has a “bottoms-up” viral customer base, which means junior employees evangelize the service at the company. These are often some of the most loyal customers. For instance, 55% of $100,000 or higher revenue customers were started with a single employee’s free trial. This is an important insight to the traction of the product.
Zoom’s virality with web conferencing is important because I expect the same team (and for the same reasons) to create a frictionless and viral method to replace all forms of legacy communications.
Zoom’s Current Quarter & Forward Growth
In most recent quarter, Zoom reported Q4 revenue of $882.5M, representing growth of 369% YoY, beating expectations by $71.54M. Non-GAAP EPS of $1.22 beat by $0.43 and GAAP EPS of $0.87 beat by $0.39.
GAAP income from operations was $256.1M, up 2327% year-over-year. Non-GAAP income from operations was $360.9M, up 839% YoY.
For the full year, total revenue was $2,651.4 million, up 326% year-over-year. GAAP income from operations for the fiscal year was $659.8M, compared to GAAP income from operations of $12.7 million for fiscal year 2020. GAAP operating margin was 24.9% and adjusted operating margin was 37.1%.
Please note, when you see this level of bottom-line growth, it means Zoom is spreading organically and not needing to pay for its growth. This is extremely rare in Silicon Valley and other tech startup hotbeds, as growth marketing is a tactic used to grow the top line at the expense of the bottom line.
Remaining performance obligation was up 189% year-over-year from $604 million to $1.75 billion with the company expecting to realize 70% of this amount in the upcoming year. This means before the fiscal year even began, the company will already have $1.22 billion of revenue in the pipeline of the $3.7 billion projected for the year.
Remaining performance obligation was up 189% year-over-year from $604 million to $1.75 billion with the company expecting to realize 70% of this amount in the upcoming year. ZOOM
Non-GAAP net income for the fiscal year was $995.7M, after adjusting for stock-based compensation expense and related payroll taxes, expenses related to charitable donation of common stock, acquisition-related expenses, and undistributed earnings attributable to participating securities. Non-GAAP net income per share was $3.34. Non-GAAP net income was $101.3 million, or $0.35 per share.
Net cash provided by operating activities was $1,471.2M for the fiscal year, compared to $151.9M last year. Free cash flow, which is net cash provided by operating activities less purchases of property and equipment, was $1,391.2 million, compared to $113.8 million last year.
Zoom provided the following guidance for fiscal year 2022:
· Total revenue for Q1 is expected to be between $900.0M and $905.0M vs $835.35M consensus
· Non-GAAP income from operations is expected to be between $295.0M and $300.0M.
· Non-GAAP diluted EPS is expected to be $0.96 at the midpoint versus $0.70 consensus
For the full year, total revenue is expected to be $3.770B versus $3.5 consensus, representing growth of approximately 30% YoY, and non-GAAP income from operations is expected to be between $1.125B and $1.145B.
Full fiscal year non-GAAP diluted EPS is expected to be between $3.59 and $3.65 versus $2.96 consensus, with approximately 311 million non-GAAP weighted average shares outstanding.
In the last three months, 20 analysts set 12-month price targets for Zoom, according to data from E*Trade. The average price target was $472.41, with a low of $360 and a high of $610 representing 98% upside from the current price.
Finally, it’s worth mentioning that the Zoom app is still #1 on the business charts in the App Store.
At the end of first-quarter fiscal 2020, the company had roughly 58,500 customers (with more than 10 employees), up 86% year over year. Zoom has a strong partner base that includes companies such as Salesforce, and these partnerships will be instrumental in future growth. Zoom ended the last fiscal year with more than 467,000 customers with more than 10 employees, up approx. 470% from the same quarter last fiscal year, according to the report.
Bandwidth
One reason we closed our position in Bandwidth is that we feel work-from-home should have been a bigger catalyst for Bandwidth, with major customers including Zoom, Google, Microsoft enterprise, Skype, RingCentral and Square. If there was ever a year that a Tier 1 provider should have seen rapid growth with these customers, last year would have been the year. Instead, for the full year 2020 we see Bandwidth with total revenue of $343.1M, up 48% YoY, versus Square (for example) which reported total net revenue of $9.50B, up 101% YoY for the full year 2020.
Bandwidth is a communications platform-as-a-service (CPaaS) company that offers voice, messaging and 911 APIs built on the company’s Tier 1 network. Although Bandwidth competes in a similar area as Twilio and Messagebird, the company is distinguished by owning its network and by offering competitive pricing and a stripped-down version of voice and SMS.
The company works with the very largest VoIP and video/audio conferencing companies including Google, Microsoft, Skype, Zoom and Ring Central. The work-from-home trend has benefited Bandwidth’s customers. There is a potential for another catalyst, which is the expansion into Europe. This is important as Europe in particular has proven to be a major market for VoIP due to various country codes in close proximity.
Bandwidth is overshadowed by competitors, including Twilio and Messagebird. Five9 is also in the adjacent space of the cloud contact center (top of the stack as a complete solution)
The difference between these companies is important to understand. Twilio enables communications for mobile applications, such as voice or text. When you text or make a call inside of a mobile application, you are likely using Twilio’s APIs. The company works with over 1,000 mobile carriers in over 150 countries for voice and text/SMS services. The features that come pre-packaged with Twilio are ideal for companies who want to cut down on development time, such as startups or pureplay apps. Examples include customer service calls on Zendesk and messaging home owners inside the Airbnb app.
However, large companies in the video and phone conferencing space (including business apps), with a primary focus on communications, are unlikely to incorporate an expensive third-party for out-of-the box development. As a network carrier, Bandwidth undercuts Twilio on pricing with cheaper outgoing and incoming calls plus free incoming SMS. This option is entirely focused on voice and SMS while its customers develop any additional features in-house. Twilio costs $1 for a dedicated number while Bandwidth costs $0.35 per dedicated number. This is why Bandwidth is the network provider for Google, Microsoft enterprise apps and Skype, and also Zoom.
On the flip side, Bandwidth makes a fraction of a penny for every call or message that is sent over the Tier 1 network. Therefore, Bandwidth’s revenue is not up to par with Twilio’s at about $280 million compared to $1.5 billion.
The issue may be that what Bandwidth offers is more commoditized between the various telephone networks and also cellular. Therefore, the better investment may be in the full product stack, like what Zoom offers.
More on Bandwidth’s Financials …
Excluding the acquisition of Voxbone, which closed last quarter, Bandwidth’s standalone CPaaS Q4 YoY revenue growth was 53%. Tailwinds include political messaging and factors related to Covid-19. Political messaging and Covid-related usage contributed 19 points to the company’s Q4 YoY growth rate, according to the report.
Where dedicated, daily user behavior within enterprises around VoIP and cloud native conferencing apps may have been many years out, covid-19 has sped this up. The addressable market growth was estimated to be about $1.7 billion in 2017 to $6.7 billion in 2022 for this market. Yet, we think one issue with Bandwidth having lagging growth for this category is there was too much competition for Bandwidth to increase its market share.
The recent quarter was impressive with 82.3% revenue growth yet the previous quarters were in the 30–40% range. Despite these normal comps, the company is guiding for 58% growth year-over-year for the March quarter.
Within total revenue, CPaaS revenue was $98.1M, up 84% YoY. Other revenue contributed the remaining $14.9 million for the quarter. Other revenue was $8.6 million in the same period last year. Total, CPaaS, and Other Revenue include $17.5M, $16.6M and $0.9M respectively from Voxbone starting on Nov. 1, 2020, the date of the acquisition.
Adjusted gross profit was $55.8M, compared to $31.1M for Q4 2019. Adjusted gross margin was 49% compared to 50% for Q4 2019.
Adjusted net income was $3.5M, or $0.13 per share, based on 27.2 million weighted average diluted shares outstanding. This compares to a Non-GAAP net loss of $(0.5)M, or $(0.02) per share, based on 23.5 million weighted average shares outstanding for the fourth quarter of 2019. Adjusted EBITDA was $8.3M, compared to $1.2M in Q4 2019.
Total revenue for the full year of 2020 was $343.1M, up 48% year-over-year. Gross profit for the full year 2020 was $157.9M, compared to $107.6 million in 2019. Adjusted gross profit for the full year of 2020 was $169.1M, compared to $114.4M in 2019. Adjusted gross margin was 49% for the full year of 2020 and 2019.
In the last three months, five ranked analysts set 12-month price targets for Bandwidth, according to date from E*Trade. The average price target is $210, with a low of $200 and a high of $227 for an upside of approx. 95%.
On the bullish side, Canaccord Genuity raised its price target from $175 to $225 after Bandwidth’s acquisition of Voxbone, stating the purchase: “accelerates Bandwidth’s international expansion plans and creates a stronger position in the global $18B CPaaS market.”
JMP raised BAND from $180 to $206, favoring the deal “because it accelerates Bandwidth’s international expansion in a way that is accretive to its non-GAAP gross margins and non-GAAP net income.”
Conclusion:
Inertia matters with tech growth. The companies that grow rapidly tend to continue to do well long-term. Zoom has been dropped out of the top 20 in terms of valuation for the cloud software category and is now cheaper than before the pandemic, which led to some of the most remarkable earnings reports of any stocks we have covered. Due to the low valuation and the company having plans to double its TAM quickly, among other reasons, we have closed Bandwidth in favor of a larger position in Zoom.
Sign up for Analysis on the Best Tech Stocks
I’m an industry insider who writes free in-depth analysis on public tech companies. In the last 12 months, I predicted Facebook’s Q2 crash, Roku’s meteoric rise, Uber’s IPO flop, Zoom’s IPO success, Google’s revenue miss and more. Be industry-specific. Know more than the broader markets. Sign up now. I look forward to staying connected.
If you are a more serious investor, we have a premium service that offers institutional-level research and entry/exit options. This membership offers a competitive edge in identifying growth opportunities and reducing risk in the tech sector. Learn more here.premium service that offers institutional-level research and entry/exit options. This membership offers a competitive edge in identifying growth opportunities and reducing risk in the tech sector. Learn more hereLearn more here.
Join other tech investors who receive weekly stock tips: