AR/VR H2 2021 Update and Vuzix Deep Dive

07b4faae-ff0e-44dc-b00b-d858dff800bc_ARVR+H2+2021+Update+and+Vuzix+Deep+Dive.pdf

Previous Coverage:

· AR/VR is a trend we first covered eight months ago with the release of the Unity PDF.

· We also provided an overview of the microtrend with a concentration on Snap and Apple in December.

· In February, we covered Snap’s virtual Investor Day in this update here.

· We also published an update on Unity’s Q4 earnings here.

· We also let you know our intent to enter Vuzix here.

Below, we update the leaders in this space with a concentration on a small cap that is breaking grounds in areas where big tech is struggling – primarily the intersection of enterprise use cases and smart glasses, which are lighter weight and more ergonomical compared to headsets.

AR/VR Macro Overview

According to new statistics published this week, AR/VR is set to grow at a CAGR of 46% between 2021 and 2025 worth $162.71 billion of incremental growth. The growth in 2021 will be 25.13% implying the larger growth will come from the second half of the five-year period.

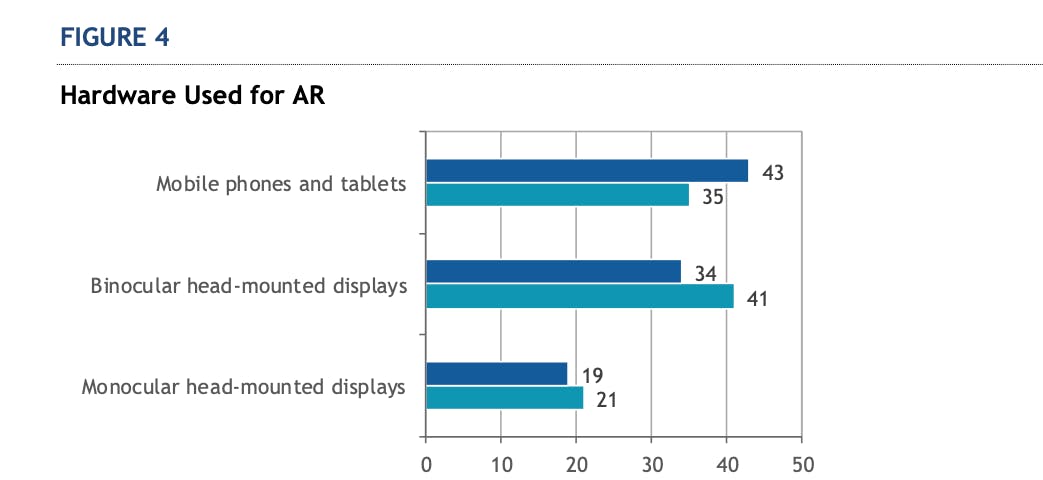
According to IDC’s Commercial AR/VR Survey, we see the most popular device for AR is mobile phones and tablets:
For virtual reality, Emergen Research points to gaming arcades, theme parks and medical training as key markets for headsets. For example, Snap has partnered with Disney to deliver VR to their theme parks and Vuzix is making key entries into medical training.

Head-Mounted Displays account for the second largest share as it provides an immersive environment for training purposes. The virtual reality market by itself is expected to grow at 27.5% to reach $43 billion by 2028.

The third driver for VR is robotic surgery, surgery simulation, and skills training. Vuzix overlaps in two markets – medical training (#1 driver) and surgery (#3 driver).

The report from Emergen also highlights APAC leading growth over North America. This is due to favorable government initiatives and the rapid rollout of 5G. We cover 5G in a separate section below as these two trends are intricately connected.

When we break the market down further for Vuzix’s sake, the estimate for smart glasses is at $33 billion by 2027. Statista also confirms healthy revenue growth for consumer and enterprise smart glasses in the near term, going from a nearly $0 market in 2019 to $13 billion in 2024.
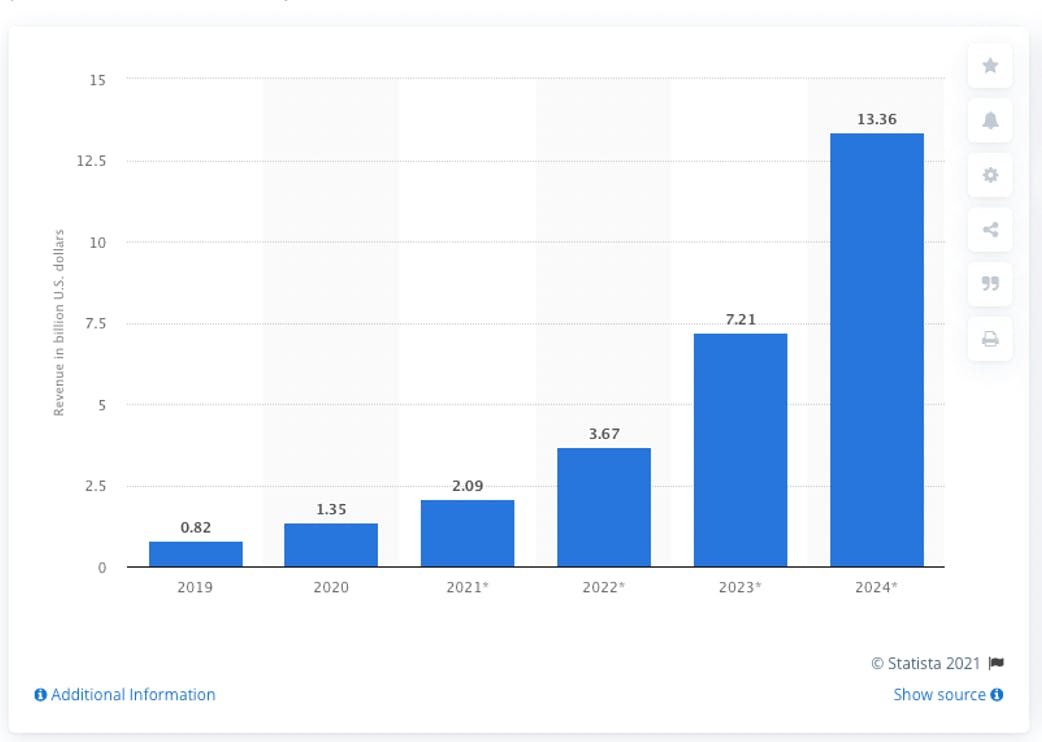
Source: Statista

Those leading AR/VR will have defensible positions based on being first movers. Artificial Intelligence, on the other hand, will like see a period of mergers and acquisitions as the bigger companies cherry pick innovation from the private markets (to compare the two).

The takeaway, is that we could see an influx of institutional interest in AR/VR this year if we see key companies break ground. It feels early because you and I are not using AR/VR in our everyday lives. This is why we need to be very careful to not use confirmation bias when choosing our investments. We also need to be prudent in knowing exactly what markets our AR/VR stocks are cornering as this market is tough to crack. The “what” is not as important in this case as the “how.”

Below, we revisit the larger companies in the space and we end with a deep dive on Vuzix. We expect to build our largest positions in Snap and Vuzix for now, and Unity later in the year or early next year, when we see signs software is reaching enough hardware.

AR/VR: Tough Nut to Crack

The caveat to AR/VR being a 0 to 100 market as we stated in the Unity PDF, is that the trend is very tough to crack. The most notorious failure is Google Glass yet Oculus hasn’t exactly crushed it since the $2 billion acquisition either. Facebook is losing money on the Oculus Quest 2 with some believing this is because they will make up for the losses with software. My personal opinion is that it’s tough to get consumers to adopt AR/VR and the price is being lowered to reflect this. Regardless of the reasons, these are two very capital efficient companies with thousands of engineers and large R&D budgets who have not done well in this trend.

Apple seems to be sleepy here, too, in terms of hardware with a headset rumored for 2022/2023 and smart glasses sometime after the headset. We see Apple foreshadowing the importance of AR/VR for the company in the ongoing augmented reality iOS updates, especially in iOS 14 along with the iPhone 12’s LiDAR that we covered in-depth here. We cover iOS 15 updates below.

Here is the “reality” to virtual reality:

1. Distribution is tough; people simply don’t want to put on a headset for entertainment.

2. If you’ve ever used a headset, you know the lack of 5G creates the obstacle of latency.

3. The demographic needs to be right; this technology requires early adopters who are keen on new experiences.

4. Consumers will be second to the enterprise to adopt AR/VR; meanwhile, the tech giants are broadly positioned across many demographics and are primarily consumer companies. In contrast, Microsoft’s HoloLens is likely seeing early success due to Microsoft having more exposure to defense and aerospace than its competitors.

5. Investors shouldn’t ignore the trust issues around FB and GOOGL. In fact, both Apple in ad campaigns and Snap in the earnings calls are capitalizing on these issues by emphasizing privacy with their software. We will see if this translates to consumers preferring smaller brands for AR/VR or those that place privacy first.

In reference to the list above, we want to circumvent the need for consumer buy-in by focusing on:

1. Lightweight hardware bc headsets are a tough sell

2. Early adopter industries

3. The availability of 5G

4. The right demographic

“Snap, Inc is a Camera Company”

The first slide of the Investor Presentation from Snap says it all: “Snap, Inc is a Camera Company.” Look for Snap to evolve away from social media by leveraging the lens software seen in the app today.

In February of this year, Snap had 150,000 lens creators globally, which is not a bad start considering Apple came out with the first features in 2017 with a bigger push when the iPhone 12 was released with LiDAR last year.

By the Partner Summit in May, Snap had updated the number of global creators to 200,000 at the Partner Summit in May, or 33% growth sequentially. I’m very keen to see what this number is by this time next year. 1 million lens creators should be tipping point and I imagine will connect the dots at that time as to the potential Snap has.

Snap is making it clear that the camera is the company’s biggest opportunity due to augmented reality Lenses. The CEO stated, “In the past few years, our substantial investments against our vision for augmented reality have put us in a position to lead the industry, and we’re doubling down on this strategy in 2021.

Augmented reality has evolved from something fun and entertaining into a real utility. Our camera can solve math equations; scan wine labels to find ratings, reviews, and prices; tell you the name of the song you’re listening to; and so much more… And we’ve barely scratched the surface of what’s possible.”

From the list above, #2 is demographic, and this is the primary reason Snap has true staying power. I had said in the Top 10 LTBH webinar that I’ve been watching this company closely because Millennials are a demographic we want exposure to. We first covered Snap for the premium site in July of 2019 when I was anticipating the launch of the Audience Network product. Audience Network didn’t happen, and instead, something much bigger is coming down the pipe. 

The company boasts 90% of the 13 to 24-year old population in the high-spending regions of the United States and leading countries in Europe. Millennials and Gen Z have very high purchasing power with a combined value of direct spending power of $1 trillion. As Snap points out on slide 6, Millennials “are expected to drive over half of the increase in expenditure growth over the next decade.”

Snap held its Partner Day on May 20th when the company announced the launch of AR-enabled spectacles for creators only (not for purchase). The frames feature four built-in microphones, two stereo speakers, and a built-in touchpad. The frames have front-facing cameras to detect objects and surfaces for interacting with graphics (such as when Snap’s CEO caught a butterfly during the presentation). The glasses weigh 134 grams and can be worn indoors or outdoors. There is also a feature called Connected Lenses that allow for multiple people to interact.

The key thing to understand is that Snap is leading in the area of software due to its mobile phone Lenses and Snap’s software should continue to lead with its growing community of creators.

The NFL is an example of a brand that has partnered with Snap during the Superbowl when customized team lenses were offered. Another example is Disney, who is using Snap’s Camera kit to build geo-located branded lenses for its theme parks. Sticker kit offers the ability to build personalized Bitmoji avatars into games and Snap Map allows for geolocated AR experiences.

Brands embrace AR because it leads to higher engagement in ads. Dior recently partnered with Snap and saw 3.8X higher return on ad spend and 6.2X on Lens Carousel. 

Management anticipates the advertising inventory potential for a fully integrated AR camera application within Snapchat will potentially lead to a flywheel effect:

We still have a lot of upside in terms of the level of optimization and efficiency that we can deliver, and are investing heavily across the board to both improve our ad platform and support our growing global advertiser base. This has developed into a positive flywheel where our improved efficiency has driven more advertisers and larger budgets to our platform, leading to more impressions and learnings, which in turn increases the rate at which we are able to further improve efficiency and ROI.
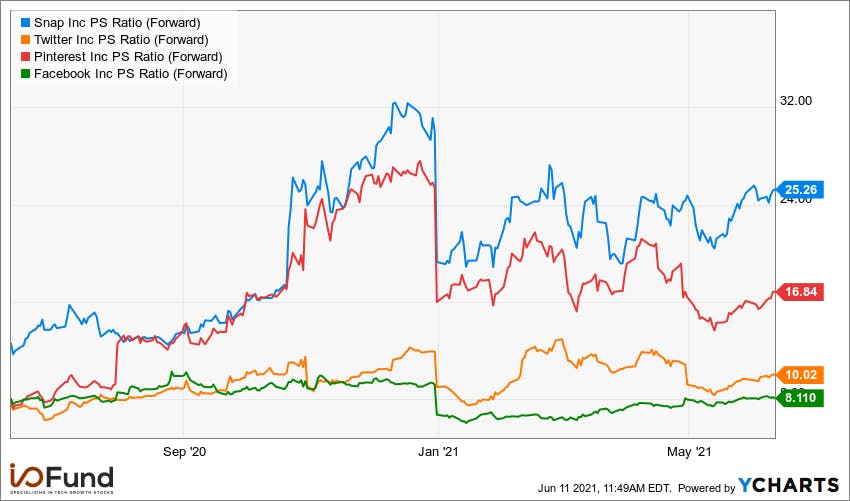
Despite all of the very important points made about Snap, the main issue is when consumers will adopt AR/VR hardware. Here is the statement the CEO made in 2019 on timing: “So I think it’ll be roughly ten years before there’s a consumer product with a display that could be really widely adopted.”

Experts from Gartner agree it can be a five to ten-year process before we see a big consumer hit in terms of hardware in this space.

This is why the iPhone and iPad are critical for Snap’s immediate-term distribution. Brands will pay for iOS users and Snap can build new revenue streams right now even without a widely adopted consumer hardware product.

iOS 15 Update: AR/VR

For the next 1-2 years, we are primarily interested in iPhone upgrades and iOS updates for our Snap position. In fact, the iPhone 12 release with LiDAR was probably one of the more bullish things to happen for Snap in its history as a public company. You can view some cool examples of how Apple’s LiDAR works here.

The latest version of Apple’s operating system added new experiences for FaceTime including Spatial Audio to position the location of sounds heard in a video call. Maps has added AR-enabled turn-by-turn walking directions and there are improved Siri features and voice input. This allows Safari browsing and other applications to be used by voice control. Visual lookup and live text allows you to dial numbers and recognize objects by looking them up online.

For developers, the release featured object capture for developers to create AR objects by taking pictures of the physical item to help speed up the time it takes to make virtual content. Spatial Audio was opened up to third-party developers and gaming also got an upgrade.

Apple’s N301 Prototype

According to reports, Apple plans to release a development kit and limited number of AR/VR headsets available as early as 2022. The prototype is named N301. The AR/VR chips have beat the M1 Mac processor in testing as Apple will attempt to deliver something with higher resolution than the competitors. Apple also plans to release AR glasses with codename N421 which could be unveiled as soon as 2023. The headset is not the final product, however, as Apple’s final consumer product will be smart glasses.

The beta headset is the size of the Oculus Quest, according to sources that spoke with Bloomberg. There are cameras to enable the AR features and gesture control. Apple has also been making acquisitions, such as NextVR, that records events such as concerts and sports games. Apple will also build an App Store for the device known as “rOS.”

Releasing AR/VR glasses will require years as Apple will be testing and iterating on how to serve the creation of app developers and how to overcome the hesitancy of consumers who don’t care to wear hardware on their face. There is also the technical challenges of supporting an internet connection with a long battery life and the various electronics that are required. As the article points out, “getting to that point requires years of work on lenses, hardware and software, component miniaturization, production techniques and content creation.”

The statement and general understanding that smart glasses are years out is one of a few reasons we like Vuzix, who is already delivering smart glasses to early adopter industries.

Unity:

In our analysis of Unity, we saw many forecasts that AR/VR would grow from nearly $0 to $100 billion in a short time frame of 3-5 years, depending on the source. We had stated in September that Unity will be a great way to participate in this trend as the company could have a near monopoly on 3D application development.

Notably, Unity and Snap are teaming up for in-game ads. The partnership allows Unity developers to use Snap Kit and tools like Snap Map, Bitmojis and other AR features. In return, advertisers on Snap can also access Unity’s inventory. This is likely the start of an important synergy on AR-related advertising across gaming and social media audiences.

Meanwhile, Unity’s primary competitor, Unreal Engine by Epic Games, is in a heated battle with Apple. This bodes well for Unity as this battle could be viewed as a risk by AR/VR app developers who want to get on Apple’s devices.

In this study done in 2019, Unity was the third most popular AR mobile platform ahead of Facebook and Amazon. ARKit from Apple is number one and ARCore from Google for Android was number two.

With that said, software will need ample hardware distribution. Therefore, we think Vuzix could see AR/VR growth sooner than Unity. We have a placeholder position in Unity, however, will look for bigger positions in Snap and Vuzix in the more immediate term.

Vuzix: Lightweight Glasses for the Enterprise

What Vuzix offers are smart glasses that are lightweight, comfortable and wireless. The company has two main products: the M4000 and the M400 wearable computers (or smart glasses). The products are backwards compatible with the M400 applications working on either device.

The M4000 Series is lightweight at 3.5oz[1], which the company says is comparable to a deck of cards. The upgraded wearable allows for see-through display and is powered by a lithium polymer battery that you can switch out during long jobs without powering down. The run time is between 2 to 12 hours depending on the battery choice and application. Other specs include PDAF 12.8mp auto-focus camera and 4K 30fps for video streaming output. The cost is $2499.
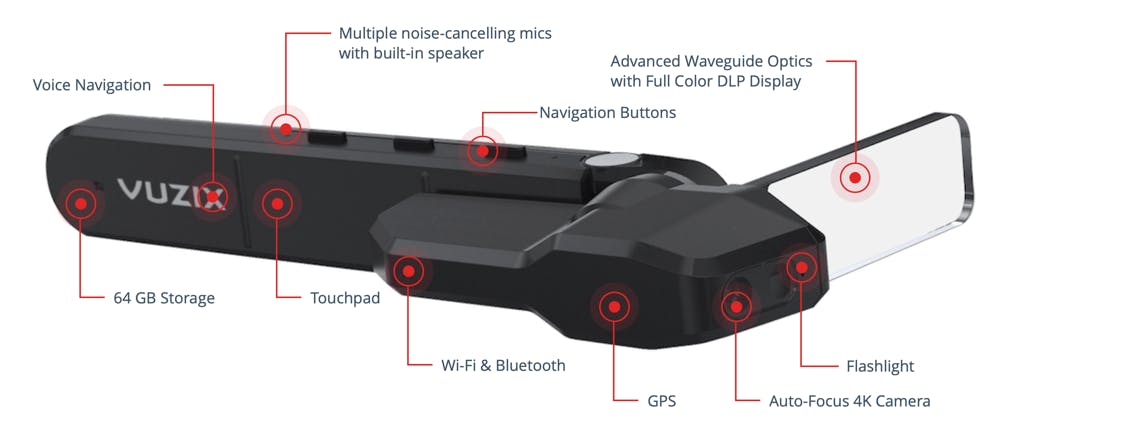
The M400 Series is the base model and drove the most revenue growth in the recent quarter with sales that tripled YoY. This model offers gesture control, voice commands and a high-performance camera for video streaming. This model also allows for a battery swap without powering down. Price is $1799.

Vuzix M4-Series is run on Android and uses the XR1 Qualcomm Snapdragon processor for AR and 4K phased-detect auto-focus camera. The glasses are IP67-rated, which means they’re waterproof and dust proof. The lightweight glasses are ideal compared to a bulky headset for industries ranging from medical work to utility work to automotive.

This has led to the adoption of the glasses for surgeries. Here are some of the recent partnerships Vuzix has made:

· Medacta International is using Vuzix glasses and the NextAR platform for knee, shoulder and spine applications. The platform uses algorithms alongside the preoperative scan to create a personalized biomechanical model for each replacement.

· Rod & Cones placed $1.2 million in orders for the M400 Smart Glasses “beginning immediately” to provide 4K broadcast imagery that allows more supported surgeries in a single day.

· Pixee has achieved FDA approval to use the M400 smart glasses for total knee replacement surgery. Pixee’s platform allows surgeons with little robotics training for better positioning of instruments using the field of view provided by Vuzix smart glasses.

· Medtronic uses Vuzix in the operating room and to also allow visiting surgeons to have the view of the operating surgeon for training purposes.

Here is a snapshot of the health care customer list which accounts for 25% of Vuzix’s revenue in the most recent quarter:
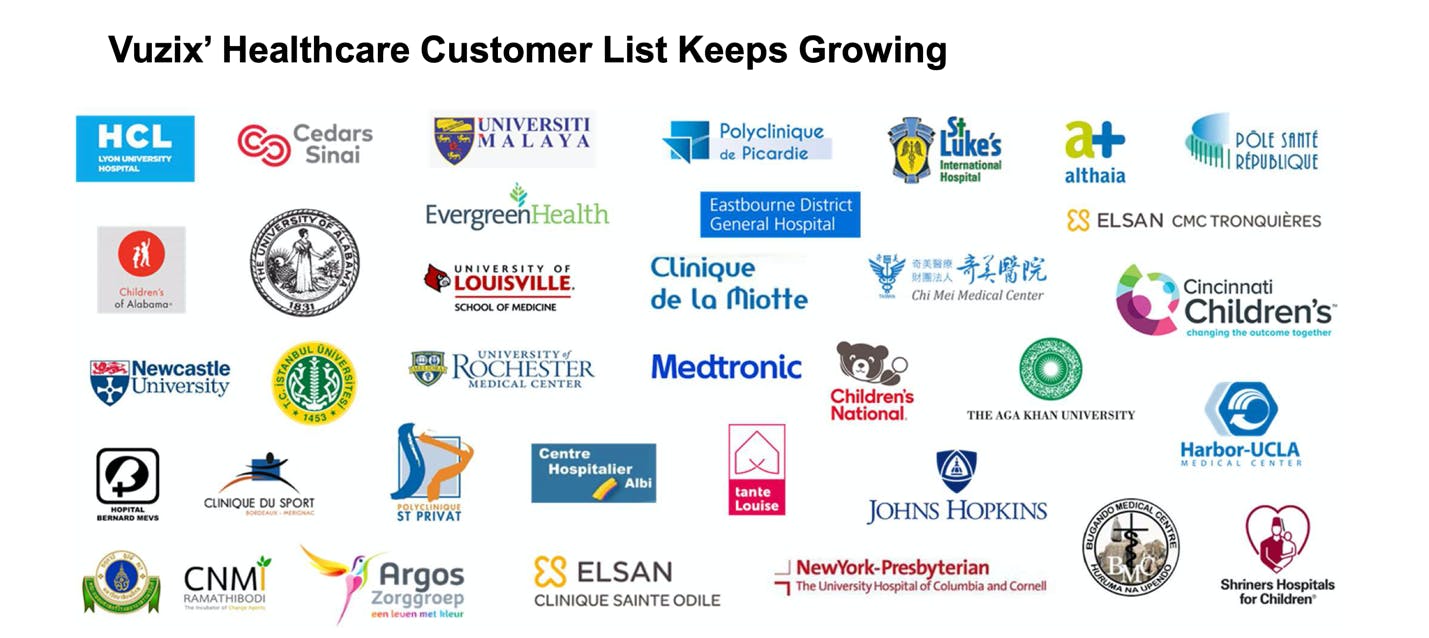
The company also mentioned a leading insurance company has become a customer with a $400,000 order and CooperVision is a manufacturing company that uses Vuzix for their warehouses.

Vuzix recently announced an advanced microLED display-based technology to be released in Q2 2021. The video here shows the microLED is the size of a pencil eraser and can be used in cameras, smart glasses and helmets.

Vuzix’s release of a microLED is important because weight is a primary issue with AR/VR hardware and an area that Vuzix is well ahead of Big Tech. This is one of 191 patents the company holds.

5G is Critical for AR/VR

Please note, we covered 5G on the premium site in anticipation for ramping up in 2020. Most 5G rollouts are delayed from Covid yet we are keeping an eye on this area. You can access 5G reports by going to the Dashboard on the Premium site and typing in “5G” in the search bar.

Commercialized AR/VR is a big challenge as the devices require heavy rendering, on-device processes and split workloads between the device and edge cloud. Because 5G is 100 times faster than 4G, the success of AR/VR is linked to the success of 5G.

For the optimal experience in AR/VR, graphics are ideally rendered on the edge cloud to reduce latency for on-device head tracking, controller tracking, hand tracking, motion tracking and photon processing. The ideal split rendering process in the cloud requires 5G in order for the intended, final experience.

Therefore, not only will it take ten years for consumer hardware to reach critical mass, yet it’ll take equally as long before 5G consumer networks are set up for network slicing on top of public networks with edge cloud infrastructure and also native core functions. Undoubtedly, telecom companies will own this space as they will own the 5G network. Qualcomm is seeing some early mover advantages in on-device processing for the headsets and Nvidia is seeing the early mover advantages across its RTX graphics processing units (GPUs), CloudXR and GPU virtualization software for the edge cloud VR servers.

With that said, urban areas are already set up for 5G with small cells in cities. Hospitals will be one of the first in terms of facilities to be 5G-enabled due to the immediate impact that will be seen in remote surgeries, the transfer of large files, and real-time monitoring. In a smart hospital, AR/VR, AI and robotic equipment that is linked to databases and sensors can aid in complex operations by recommending procedural steps based on the latest medical knowledge and data.

5G-enablement in hospitals was beginning to pick up prior to Covid with the first VA hospital in California becoming 5G-enabled in February of 2020. The first academic health system in Chicago, named Rush, is also a pioneer for 5G connectivity in medical facilities. Many forecasts project APAC to lead 5G including for hospitals and medical facilities. In January of 2000, Samsung and KT Corporation announced a partnership to build a 5G smart hospital.

Vuzix works with either 4G or 5G and has even struck partnerships with last-mile connectivity company Inseego on 5G (we covered this company here on our premium site). Vuzix is also an early partner with Verizon on Blue Jeans where the smart glasses offer support for the remote collaboration platform. Zoom Video has a blog about how AI, AR and VR will impact meetings written in 2018.

KDDI Asia is another early 5G partnership that Vuzix has with the relationship focused on remote support, facial recognition and language translation. KDDI Asia is a Fortune 3000 company that has 40 million mobile subscribers in Japan and Singapore.

Why the Enterprise is Important:

Enterprise drives 2/3 of the current revenue in AR/VR and is expected to lead through the forecast period, according to ARInsider. The forecast made in 2017 specifically points towards hardware as the main contributor as it sets up the install base for software to follow. According to more recent data, the enterprise is expected to generate more than 70% of AR/VR revenue through the end of 2022. (Please note, some of this needs to be adjusted by a year due to Covid delaying this category).

Here’s a snapshot from Perkins Coie as to the leading sectors in AR/VR:
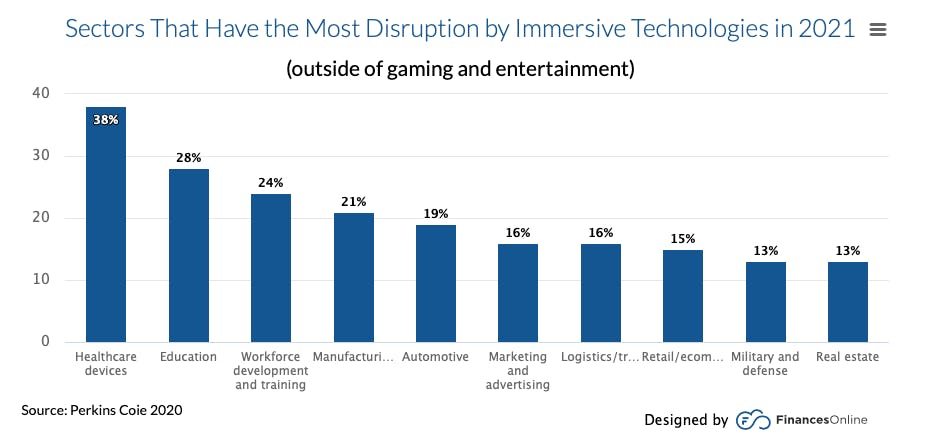
Source: Finances Online

Although a bit outdated, this article on Medium drills down into the challenges around consumer AR/VR and why enterprise will be the first market to adopt the technology. It helps solidify our understanding, which is that consumer AR/VR is a nice-to-have while enterprise is a must-have. According to the survey of 750 respondents, 88% said AR/VR had a positive impact on their business.

Financials:

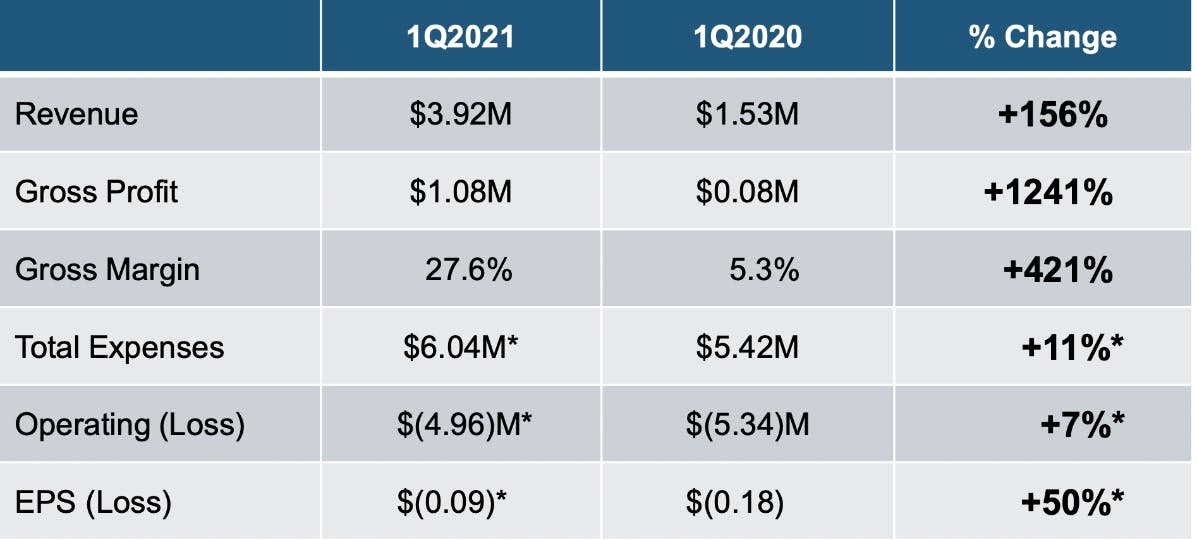
As stated in the blog from Monday, the company is small in terms of revenue and market cap. Last quarter’s revenue was $3.9 million compared to $1.5 million in the year-ago quarter, or an increase of 156%. Smart glasses sales rose by 177% year-over-year to $2.4 million. The company was break even in terms of gross profit in the past yet posted $1 million in profit in the most recent quarter. 

We also pointed out that gross margins are slim at 28% with product gross margins at 45%. As with many small cap companies, the bottom line is a bit ugly as the company has a net loss of $6.6 million. If the company continues to grow the top line, then some of this should resolve on its own as R&D is around $2 million per quarter and sales and marketing is $1.2 million.  

Despite being a small cap, the company showed significant improvement year-over-year:­

The company closed a public offering of 4,768,293 shares on April 1st for $97.75 million. The shares were priced at $20.50 while the stock was trading at $24.85. The companies proforma cash is $145 million as of April 1st. As with most small caps, the balance sheet and the need for future capital raises is the primary risk. Not only is this a concern for us investors but for larger customers who are buying into Vuzix’s technology and deserve longevity.

In addition to hardware, the company sells software for recurring SaaS revenue. This doesn’t drive meaningful revenue now but good to know there are more revenue streams in the future: “We expect that in the future, for every hardware sale that includes one of our vertical SaaS solutions, we would see an even more significant recurring revenue stream from the application itself.”

There are larger OEMs in the negotiation phase, including a Tier 1 aerospace and defense contractor in Phase 4 of contract negotiations for the company’s Waveguide-Based technology. An example of a completed OEM partnership in production phase is with Jade Bird Display, which manufacturers LED panels.

On June 9th, it was announced that Vuzix will be added to the Russell 3000 and Russell 2000 indexes on June 28th.

Valuation & Risks:

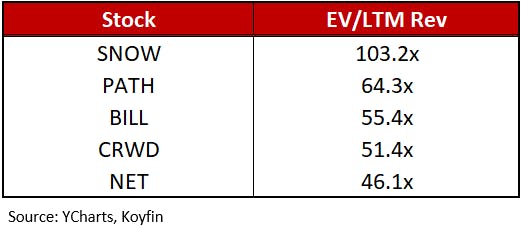
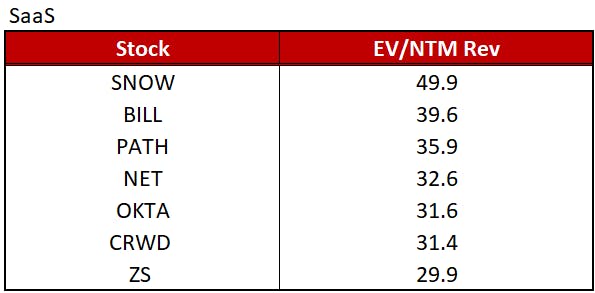
Valuation is an important risk to discuss with Vuzix. The company’s forward price-to-sales was a whopping 85 before correcting to the 50-60 range. This means the company competes with Snowflake and UiPath for the highest valued company in our portfolio.

However, when we look at 1-year forward P/S, then Vuzix looks more attractive at 28 whereas Snowflake trades at a 1-year forward P/S of 40. The consensus among the three analysts covering Vuzix is that revenue will roughly double year-over-year in 2022 at 90% growth from $22 million in fiscal year 2021 to $42 million in fiscal year 2022 ending in December.

We covered AR/VR in Q3 2020 and this was when we estimate the trend began with iOS 14. If the smart glasses market will be $13 billion by 2024, then Vuzix only needs to own 1/26 of the market to 10X revenue if we figure $40-50 million in FY 2022 and we invest in this company with the goal of reaching $500 million in revenue by 2024.

When a small cap has this kind of valuation, there is more pressure for the small cap to perform. The last earnings report had a slight $0.02 EPS miss and a beat on revenue, yet the stock fell from $17 to $15 off the report.

Investors in this company should be aware that this company has a streak of missed earnings estimates between 2016-2019. 

There is about 18% institutional ownership, which is on the low side, although 3% increased institutional ownership in the past month.

Intel bought 30% ownership of the company in 2015 and gradually reduced its share of the company to 15% before selling all shares earlier this year. The loss of a large backer is a risk.

Competitors:

Vuzix has many competitors if you look at the broader AR/VR market. Specifically for the enterprise market, the main competitors are Microsoft’s HoloLens and Magic Leap, which has Google backing. Here’s a picture of Vuzix compared to those two, as seen in ZDNet.
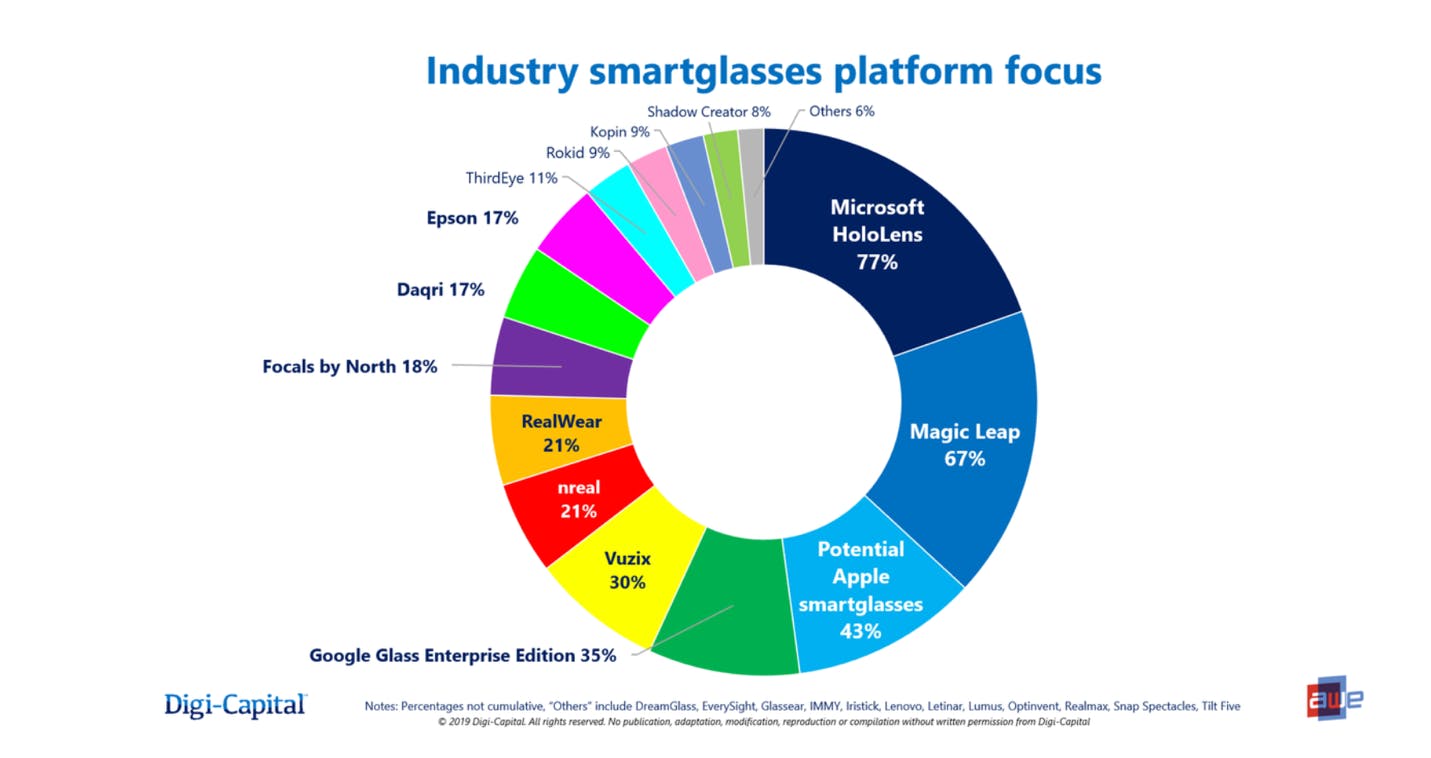
Vuzix will need to work diligently to own 1/26 of the market, but as you can see above, it’s a doable. goal. We like the 24 years of experience the management has as it’s usually seen in these incremental product improvements over the competitors. For instance, according to some product analysts, Magic Leap One is inferior in terms of battery life offering only 3 hours before needing to power down the device to change the battery. We also put in a footnote above the comparison in weight to Apple and Microsoft with Vuzix being the lightest smart glasses among the top competitors.

Conclusion:

Enterprise (check).

Passionate and long-term Founder (check).

Early adopter market – medical industries, etc. (check).

Lightweight able to overcome the major hurdle of headsets (check).

Small caps are not without risk.  However, we like that enterprise AR/VR is becoming a post-covid play and the forward consensus in the 90% range is certainly investable. We understand that Vuzix and our other small caps will be volatile at times, yet to get a $1 billion market cap entry into this space is worth the risk, in our opinion.

 

Nasdaq100 Levels to Watch for the Next Leg Higher

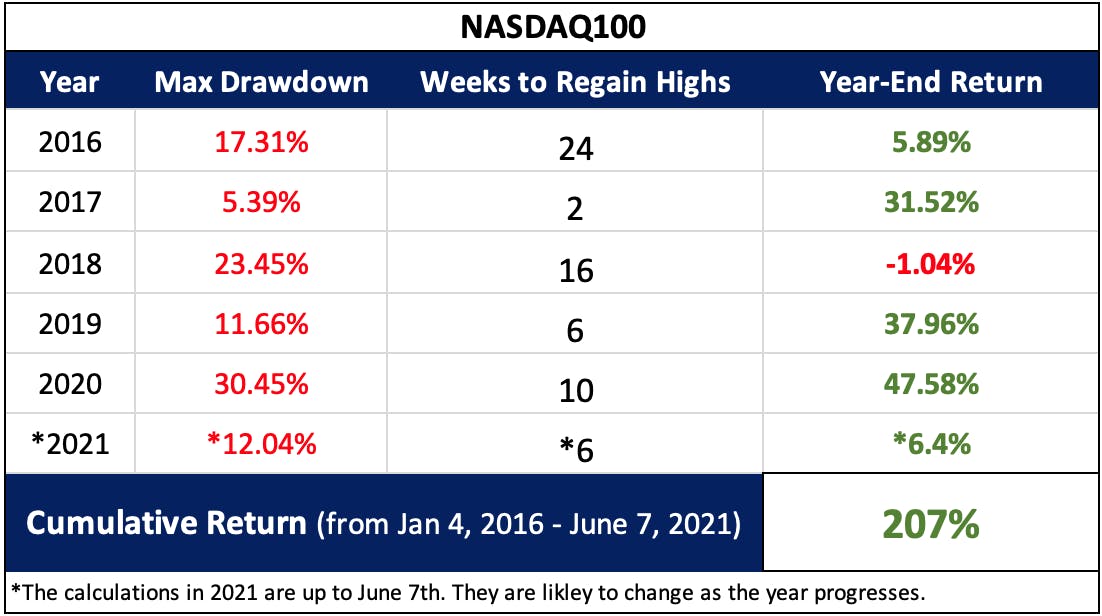
Being a contrarian in tech investing has been a rewarding strategy over the last 5 years. Believe it or not, as far back as 2016, the contrarian position in tech was to remain a bull. Each year since, floods of articles presented the popular thesis that the “tech bubble” was about to burst (2016, 2017, 2018, 2019, 2020, 2021).

For those that remained a contrarian, the cumulative returns of the NASDAQ100 since 2016 has been ~ 207% returns. Meanwhile, the average drawdown per year since 2016 was an eye popping 17%, while the average annual return for the year was about 21%.

Only those who ignored the talk of a bubble participated in the epic run that has resulted in the Nasdaq100 driving forward some of the world’s most valuable companies. Which leads to another point: analysts continually and consistently misunderstand tech in the early days of a company’s rise. Using value metrics to build the case for a bubble, these same analysts have gone silent when that bubble refuses to cooperate with soothsayer predictions.

Once again, this year is witnessing a rotation out of tech growth, as more articles claim that this is the actual popping of the tech bubble – for real, this time. Although I do believe the market will experience a true secular bear market at some point in the future, more importantly, I believe the market is setting up first for what appears to be the next leg higher.

I also believe that tech, as well as growth, will resume its lead in the next leg higher. I outline my reasons below.

1) Understanding Tech and What it is Telling us Now

From September of 2019 through January of 2020, the market narrative was that cloud computing was over stretched, resulting in a severe value rotation. At that time, we were hearing that the stocks in this sector had price/sales ratios greater than many of the tech stocks during the dot.com bubble.
A fair representation of these companies can be found in the ETF with the ticker symbol CLOU. This is a pure play on the cloud microtrend and was overweight many of the richly valued tech darlings of the time, such as Zoom, Shopify, Crowdstrike – just to name a few.

Despite cloud being “overstretched” with “dot-com like valuations,” from the February peak to the March low, CLOU saw a 32.94% drawdown, compared with the S&P500 that saw a 35.63%. Also, worth noting, CLOU finished the year up 77.9% while the S&P500 finished the year up 18.4%.

In other words, stocks with little to no earnings, and a price/sales ratio ranging between 20 – 40, provided more protection to investors during the March ’20 bear market than the value oriented broad markets. The reason behind this phenomenon is either ignored or shrugged off as an anomaly; however, understanding why this occurred is the type of information that would help one to identify companies like Amazon and Google in early stages, despite their rich valuations.

Beneath the negative earnings, and price/sales ratios well into the double digits, are powerful microtrends that can scale globally. Beth Kindig of the I/O Fund presciently wrote an article in 2019 stating that Cloud Computing would be a good safe haven in an economic contraction, even with bubble-like valuations.

“My prediction is this may be one of the last cycles when tech is considered less safe than value stocks. As the market will find out (the hard way), cloud software is actually very safe. It is insulated from trade wars and overseas manufacturing issues. It reduces costs for enterprises, which is ideal for a recession.”

Her thesis was simply that the cloud microtrend was still in the middle of its expansion, and the very nature of migrating to the cloud makes enterprises more efficient as well as reduces costly IT overhead, which can help them survive slowing GDP.

Furthermore, we are seeing companies within cloud grow YoY revenues at rates that are historical records. For example, in recent reports: Shopify grew YoY revenue by 110.4%, Zoom by 191.4% (this is after 3 consecutive quarters of greater than 350% growth), Snowflake grew by 110% and Crowdstrike grew by 70%.

All of these companies came in above consensus in the most recent quarter while most raised forward guidance. We are now lapping the most critical quarter for tougher comps from Covid and we think in the next couple of months, the words “tougher comps” will fade from memory as the better term will be “sustained growth.”

2) Technical Signals

Where is the money from growth flowing?

Since the February top in 2021, we have seen a large rotation from growth names into value. Some have posited that the growth trend is over, and the era of value is set to lead. To get a clue as to whether this thesis is correct, I think analyzing the flow of money from tech is key.

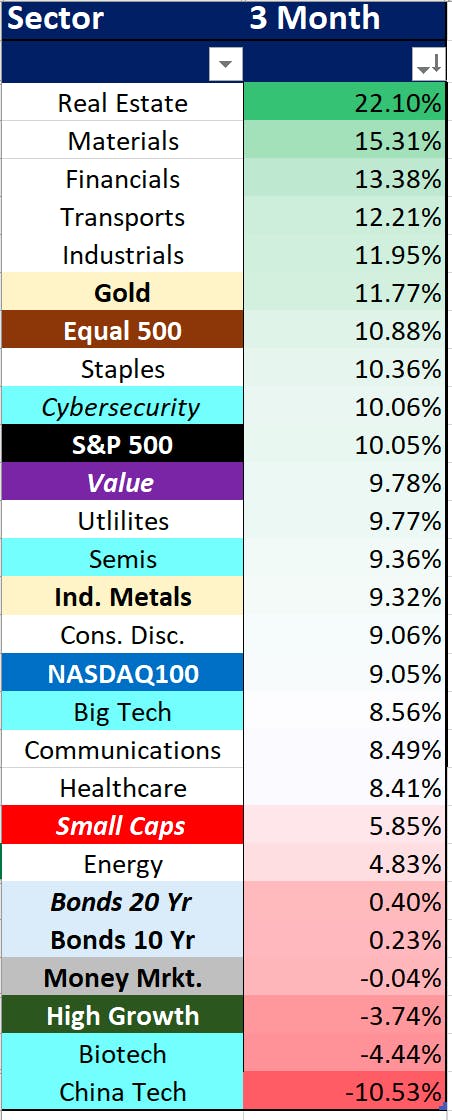
On a simple 3-month relative return, which takes us back to the start of the correction, we can see money flowing from high growth sectors and into value sectors.

However, if we dig down a little deeper, the money seems to be flowing into early-mid cycle sectors, such transportation, financials, industrials, materials. The standard late-cycle sectors, such as utilities and consumers staples, appear to be lagging, which suggests that the market is more likely positioning for a move higher than preparing for a protracted drawdown.

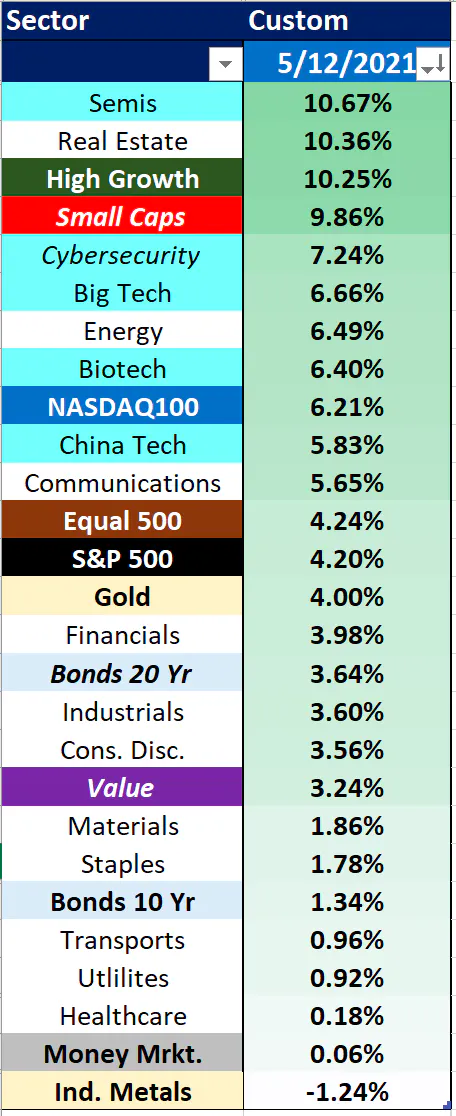
I further believe that the market put in an important bottom on May 12th. Below is a chart showing that since the May 12th bottom, quietly, we’re starting to see a rotation back to high growth names, and the selling of value as well as commodities. 

It appears that underneath the moderate price movements in the broad market, we’re beginning to see a rotation back into growth names. We will need to see this trend continue, but so far, if the bottom is in, the up days in the market are suggesting a continuation of growth outperformance.

Breakouts Around the World

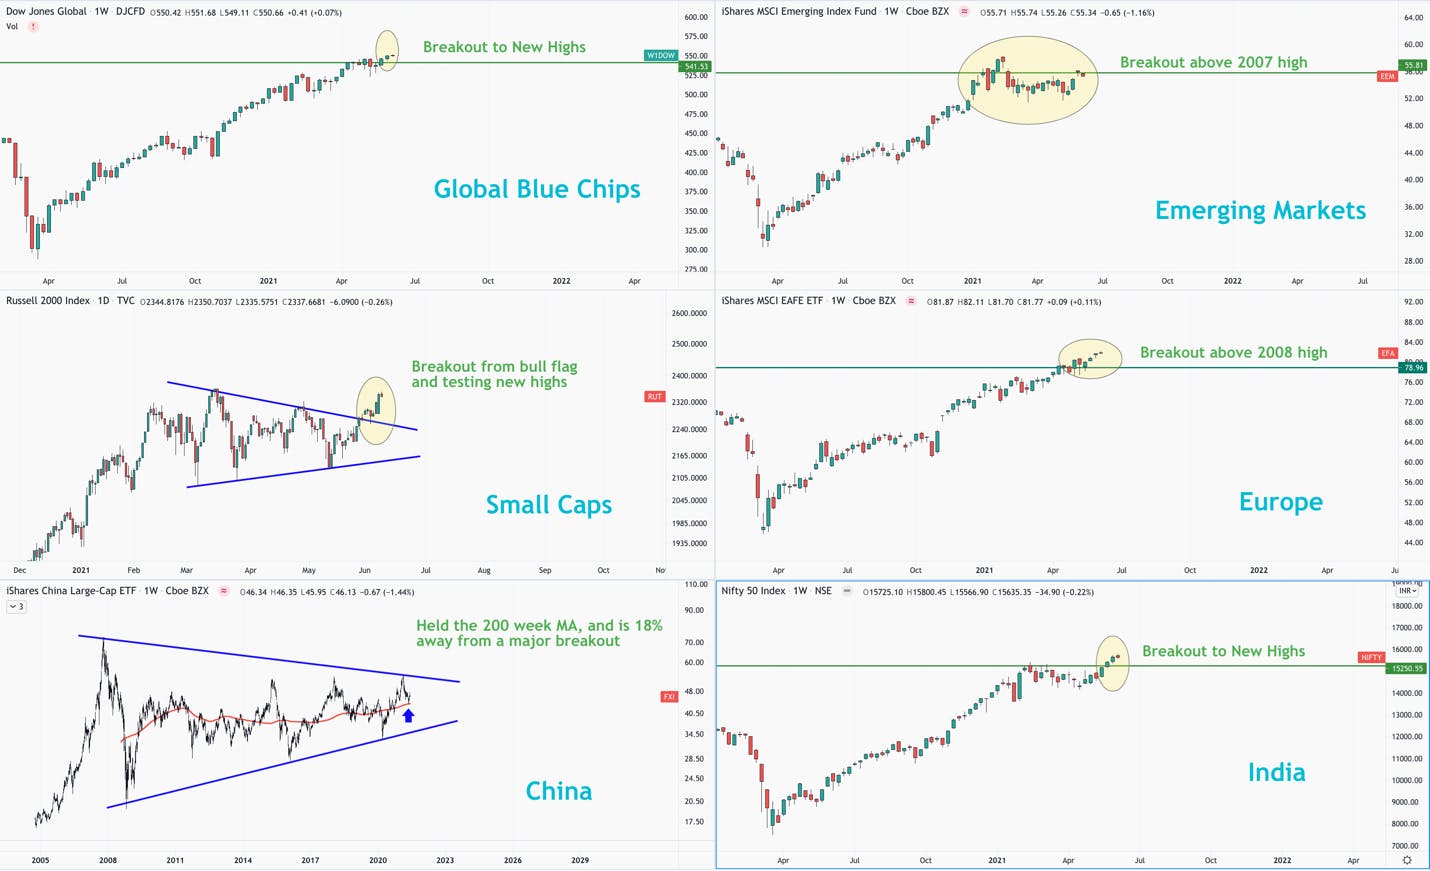
Just like in late 2016, we are seeing an abundance of analysts suggesting that the major top is in or we are close. This would be followed by a major and protracted bear market. Also, just like in late 2016, this thesis is not being supported by the price action in major markets around the world.

The above chart illustrates the breakouts we are seeing across the board: Global Blue Chips, Emerging Markets, Europe, India, even Small Caps are showing strength, as is China. These are typically not the intermarket signals we see just prior to a major bear market.

Strong Market Breadth

Market breadth is a technical measurement that measures the number of companies participating in a trend. In other words, if the number of companies that are participating in a broad market uptrend is growing with the market, then this is a healthy uptrend.

On the other hand, leading into most corrections, we see market breadth decreasing while the broad market continues higher. If fewer stocks are holding the markets up, this is typically a bad sign for an uptrend.

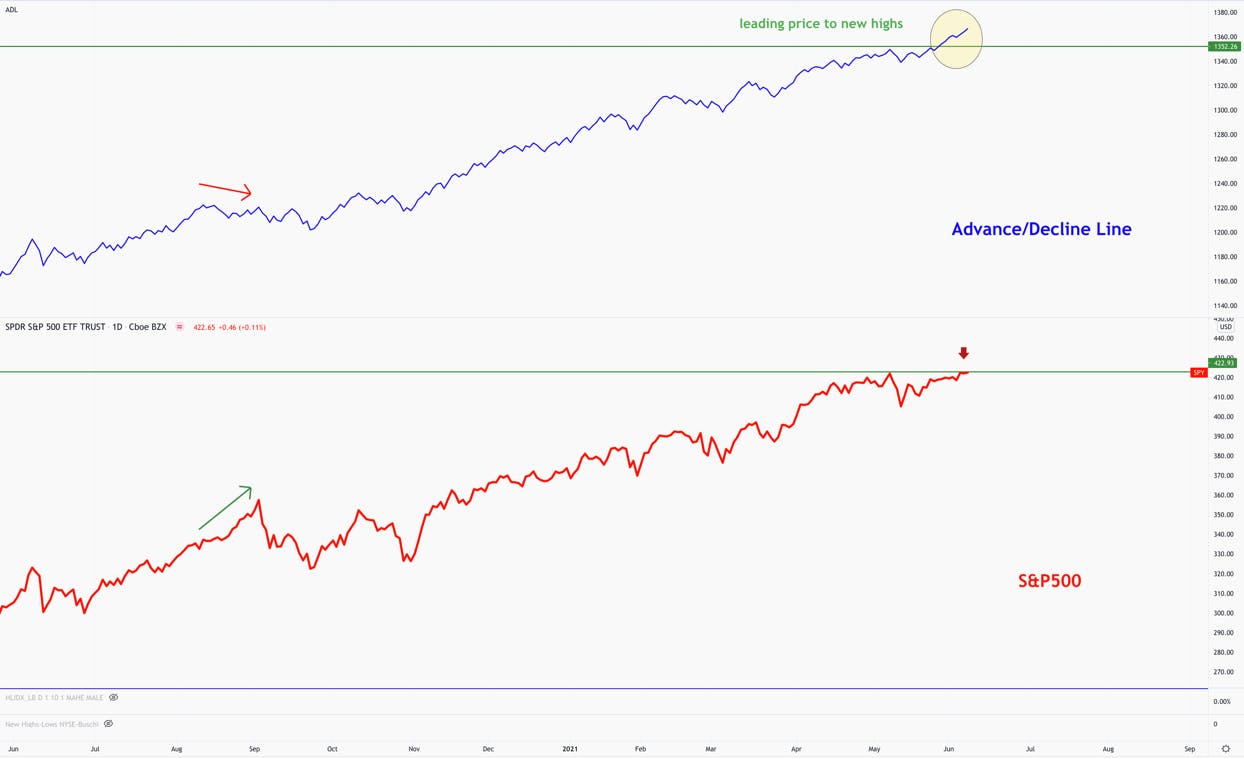
We use many methods to measure market breadth, but the simplest and oldest way is the advance decline line. Simply put, this indicator plots the difference between the number of stocks in the market that are increasing in price vs. the ones that are decreasing.

If we compare this indicator to the S&P 500, we can see an instance leading up to the September selloff in 2020 where the advance/decline line was signaling weakness, while the market continued higher. Today, we are not seeing this. In fact, the advance/decline line is breaking out to new highs before the market. This is indicating that more stocks in the market are moving up vs. down, and when we see this indicator breaking out ahead of price, more time than not, price follows.

The NASDAQ100

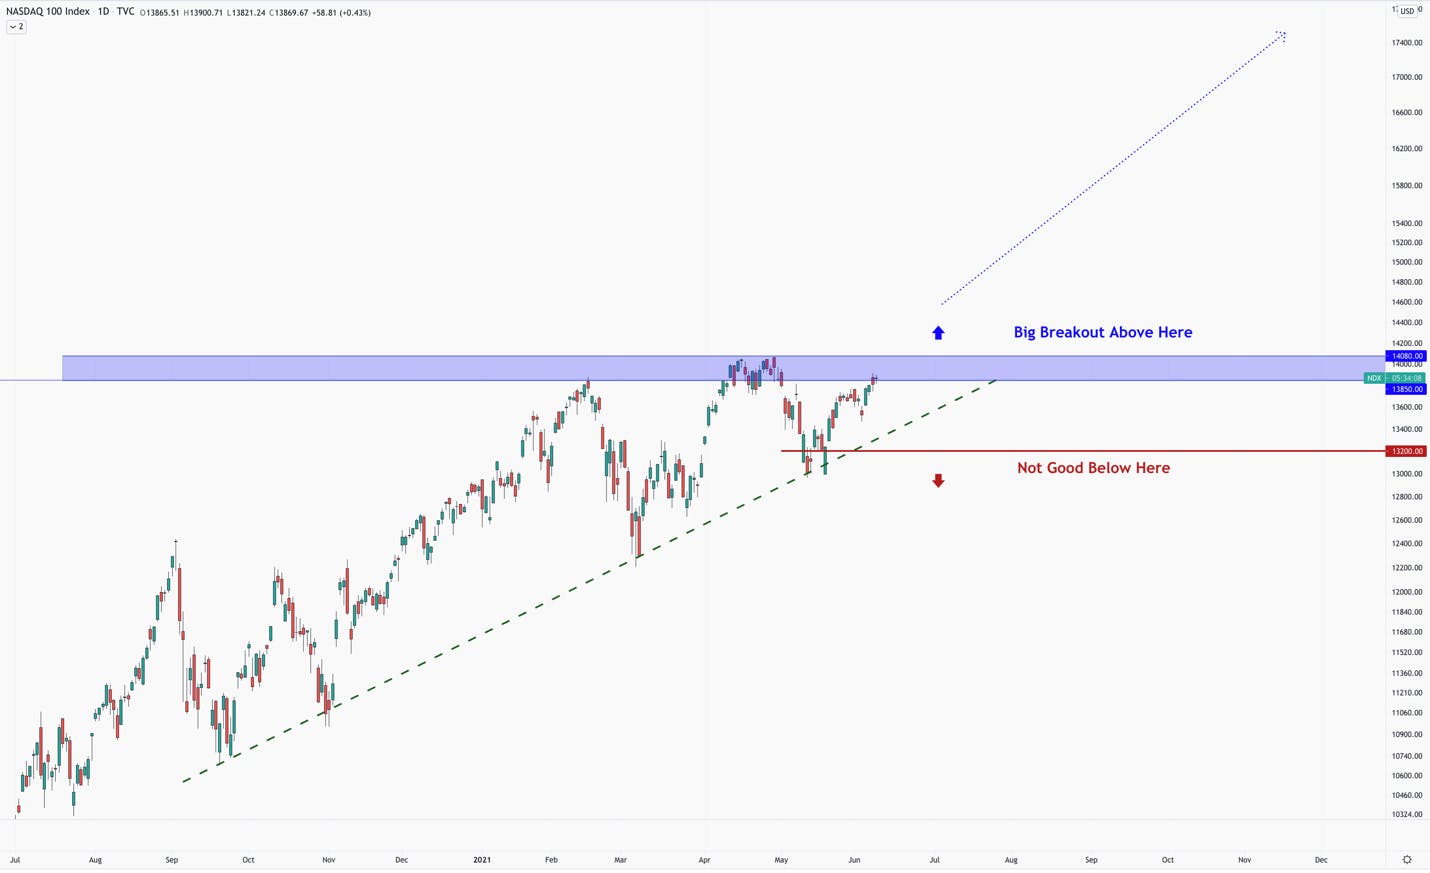
Most importantly, the NASDAQ100 (NDX) appears to be setting up for a large breakout move.

NDX is approaching a major resistance zone in blue on the chart (between 3800-4080). The upward-trending, zig-zag pattern into this resistance is typically a bullish pattern. Also, note how the price has respected the upward sloping trendline, which is highlighted with the dashed green line. This is also a promising sign, and gives us a clear level to work with regarding any coming weakness.

The Counter Argument

With as many bullish signals as we are getting, the NASDAQ100 must confirm the next leg higher with a breakout above 14080. Tech is simply too important of a sector both in the economy as well as being a large percentage of the broad market. If NDX fails to break out, and instead breaks below major support at 13200, we could see another correction before we can get another shot at a breakout setup.

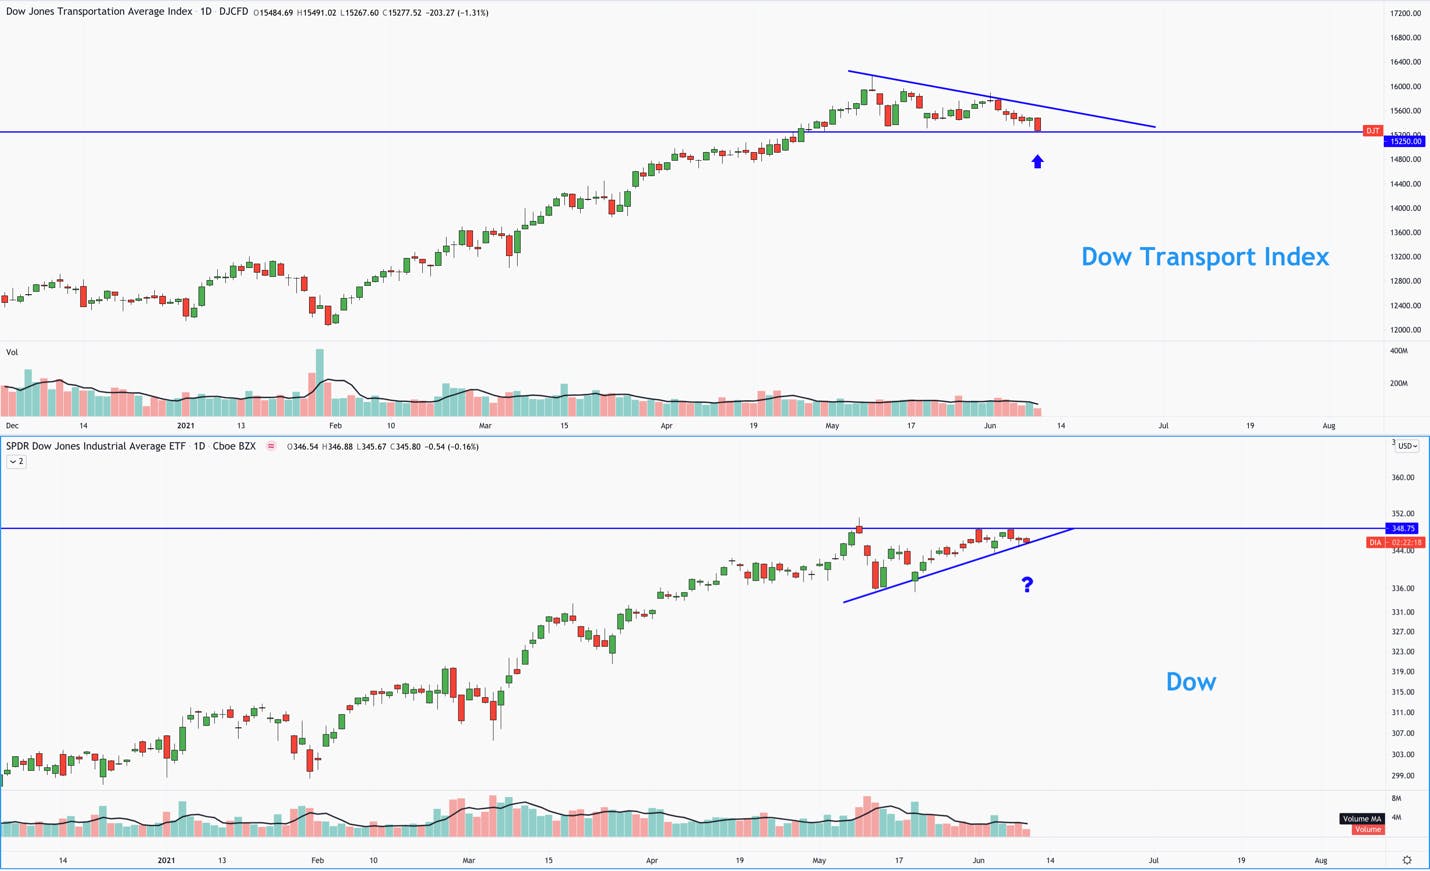
Also, the transportation index is flashing a potential warning that this breakout could be premature.

 Historically, the transportation index tends to lead the market. Because global commerce relies on transportation, a slowing down in this sector tends to signal a slow-down in the economy. Also, because equities are usually looking ~6 months out, the price of the transportation index can be a strong leading indicator.

As of today, the Dow Jones Transportation Index (DJT) is trending down while the rest of the major indexes are trending up. Because of the tight consolidation, this trend could change in an instant; however, I would not get too concerned unless supports break across the board in the U.S markets.

Supports to watch

Dow Jones Transportation Index – 15250

Dow Jones Industrial Index – 34300

NASDAQ100 – 13200

Regardless of the bullish signals and global breakouts we identified, if the above supports breakdown, we will likely look to hedge our portfolio over the short to intermediate-term time frame. We believe the outlook, as of now, is signaling a higher probability of another leg higher. However, until price agrees with our thesis, the I/O Fund remains cautiously bullish.

AR/VR Pureplay: Vuzix

I want to give you a heads-up on one stock we are circling right now. I’ll write up a full-length report on Vuzix soon.

Recommended Reading:

Unity: Premium Analysis
Mobile Augmented Reality: Snap and Unity (and Apple)

Vuzix: AR/VR Pureplay

Founded in 1997 (yes, 24 years ago), Vuzix was the first company to release a AR/VR headset for the military and also the first to release a headset for consumer purposes. When we talk about being too early to a trend, we don’t typically mean 24 years too early, yet this is the case with Vuzix. Between now and then, the company has worked with Raytheon on digital night vision for weapons and has also contracted with DARPA to develop heads up display for military ground personnel.

Intel bought 30% ownership of the company in 2015 and the company partnered with BlackBerry in 2017 to deliver smart glasses for enterprise companies.

Fast forward, and Vuzix is becoming the smart glasses of choice for industries that are early adopters of the technology – primarily the medical field. This past month has been busy for the company. John Deere announced the company is using the Vuzix M400 smart glasses to provide remote support. The M400 and M4000 received clearance for medical training this past week and the company also received over $1.2 million in new orders from Rods and Cones for virtual surgical collaboration. There are many press releases in the medical industry that I will discuss in the full-length report, these are only the most recent.

The company is small in terms of revenue and market cap. Last quarter’s revenue was $3.9 million compared to $1.5 million in the year-ago quarter, or an increase of 156%. Smart glasses sales rose by 177% year-over-year to $2.4 million. The company was break even in terms of gross profit in the past yet posted $1 million in profit in the most recent quarter.

Regardless, gross margins are slim at 28% with product gross margins at 45%. As with many small cap companies, the bottom line is a bit ugly as the company has a net loss of $6.6 million. If the company continues to grow the top line, then some of this should resolve on its own as R&D is around $2 million per quarter and sales and marketing is $1.2 million.  

The company closed a public offering of 4,768,293 shares on April 1st for $97.75 million. The shares were priced at $20.50 while the stock was trading at $24.85. The companies proforma cash is $145 million as of April 1st.

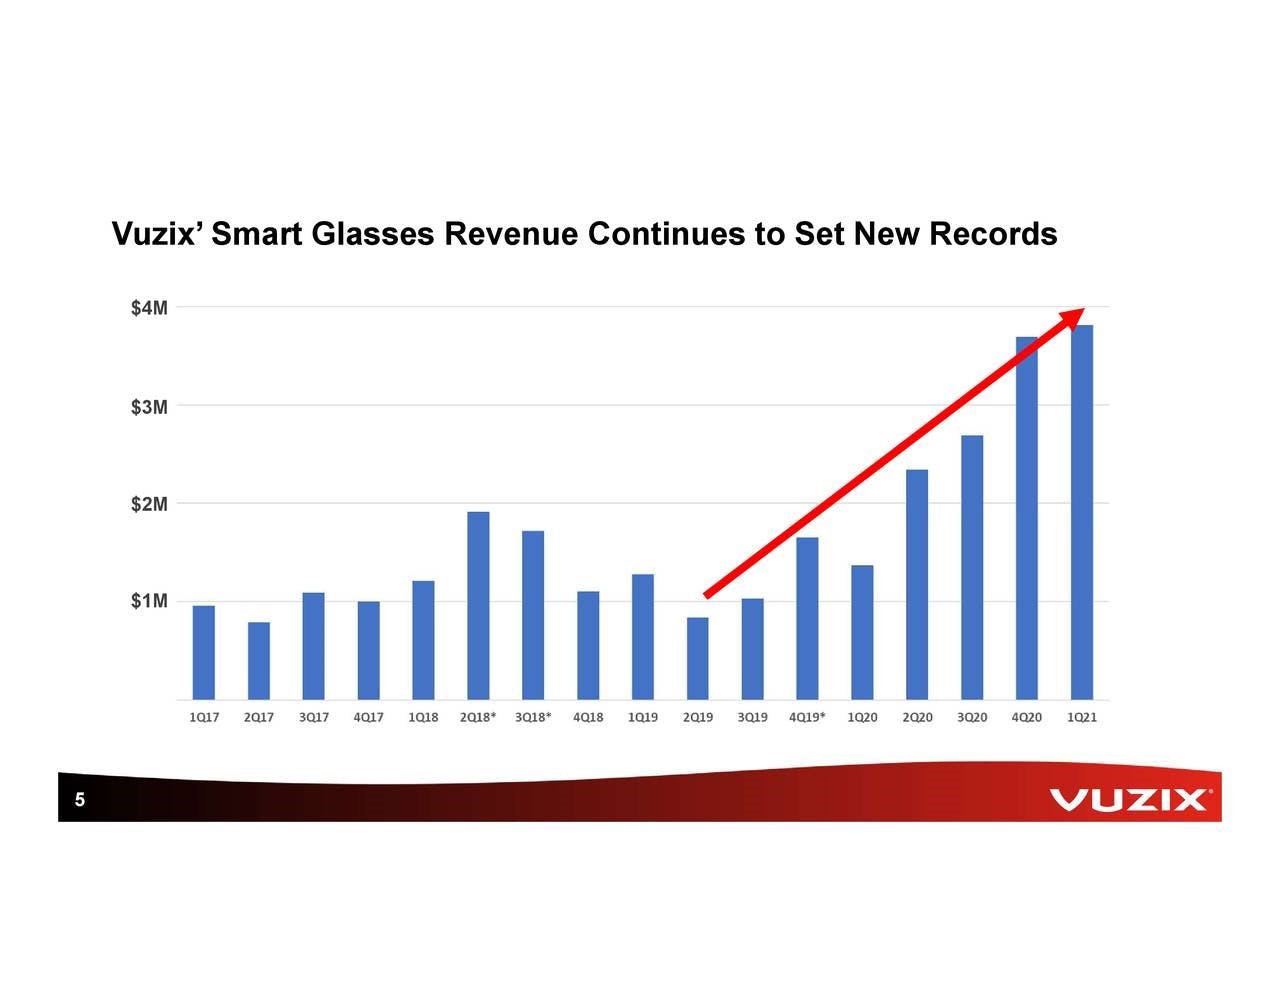
Here is how the company’s growth has looked over the past few quarters:

We began writing about this trend in Q3 2020 to discuss the start of this trend and that timing looks aligned with the graph above. Point being, I can’t imagine growth would be very impressive coming from any company in the AR/VR business until around Q3 2020 and so it seems like Vuzix’s growth is right on time.

The earnings call discussed there being “increased inbound interest in order flows related to the reopening of the economy” as industries such as logistics, warehousing, retail picking, e-commerce and third-party logistics are looking for “many 1000s of units.” The company explains that their technology increases worker productivity and can contribute to healthier margins. I find it interesting that AR/VR could be a covid rebound play. This is a bonus as the trend was set to take off around this time with or without covid.

The company also has a partnership with Verizon although this is not meaningfully adding to revenue at this point.

I’ll expand more on Vuzix soon as we are clearly focused on AR/VR as a fund. We were early to Unity and have discussed in detail our views on Snap – most recently in the LTBH webinar.

Knox likes the chart so he will probably enter soon.

Sea Limited Q1 Earnings Update

Sea Limited showed tremendous performance in each of their three business segments in their Q1 earnings report.  The dominant position Sea Limited has in three separate and growing businesses is what makes the company so strong.  The biggest risk is that one or more of their three businesses will fall off its current pace and lag growing competition.  In the company’s Q1 report, Sea Limited demonstrated that they are a company executing better than ever in each of their three business segments. 

Shopee

In Q1, Sea Limited announced e-commerce revenue of $922.3M, representing 250% YoY GAAP revenue growth.  Gross orders totaled 1.1 billion, a 153% increase YoY.  Gross Merchandise Value (GMV) was $12.6B in the quarter, representing 103% YoY growth.  Adjusted EBITDA declined to -$413M from -$264M in Q1 ’20 due to increased investments in S&M and R&D.  However, Adjusted EBITDA loss per order decreased by 38% YoY to $0.38 compared to $0.61 in Q1 ’20.  This indicates that Sea Limited continues to outgrow its costs in terms of gross order volume. 

In Southeast Asia, Taiwan, and Indonesia, Shopee ranked #1 in the Shopping category by average MAUs and total time spent in app on Android for Q1, according to App Annie.  These rankings are further indication that the strategy management has taken is to prioritize growth in favor of short-term profits – and this is paying off as the company continues to extend its leadership position in various regions. 

Sea Limited has expanded its platform into parts of Latin America, but management did not separate out financials in the region.  With that said, the company has previously discussed its plans to invest aggressively to building out the infrastructure necessary to compete with MercadoLibre. 

Garena 

Sea Limited announced digital entertainment (Garena) revenue of $781M, representing 111% YoY GAAP revenue growth.  Bookings of $1.1B grew 117% YoY, while Quarterly Active Users increased 61% YoY to 649M.  Quarterly paying users grew by 124% YoY to 80M and represented 12% of QAUs for the Q1 compared to 9% for Q1 2020. 

The company’s blockbuster game, Free Fire, was the highest grossing mobile game in Latin America, Southeast Asia, and India for Q1.  Moreover, Free Fire overtook PUBG Mobile and Call of Duty Mobile as the top grossing battle royale style game in the United States.  App data from Sensor Tower shows that Free Fire has continued its momentum into Q2, as it was the 3rd most downloaded mobile app game in the world in April. 

Source: Sensor Tower

SeaMoney

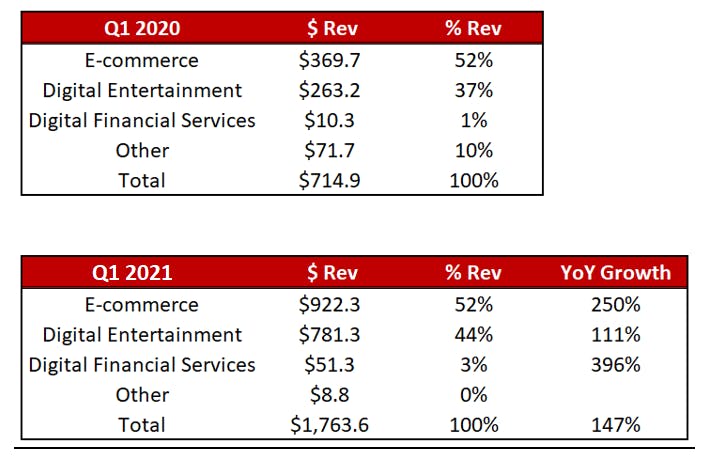
Sea Limited’s digital financial services segment saw $51.3M of revenue in Q1, representing 396% YoY growth.  This segment is still just 3% of the company’s total revenue as we are in the very early innings of the shift to FinTech in Southeast Asia.  Nevertheless, we are seeing promising growth metrics from SeaMoney, showing that they are primed to be a top FinTech player in the region. 

Mobile wallet services recorded a total payment volume of $3.4B, which more than tripled compared to the $1.1B a year ago.  Quarterly paying users surpassed 26.1M in the quarter.

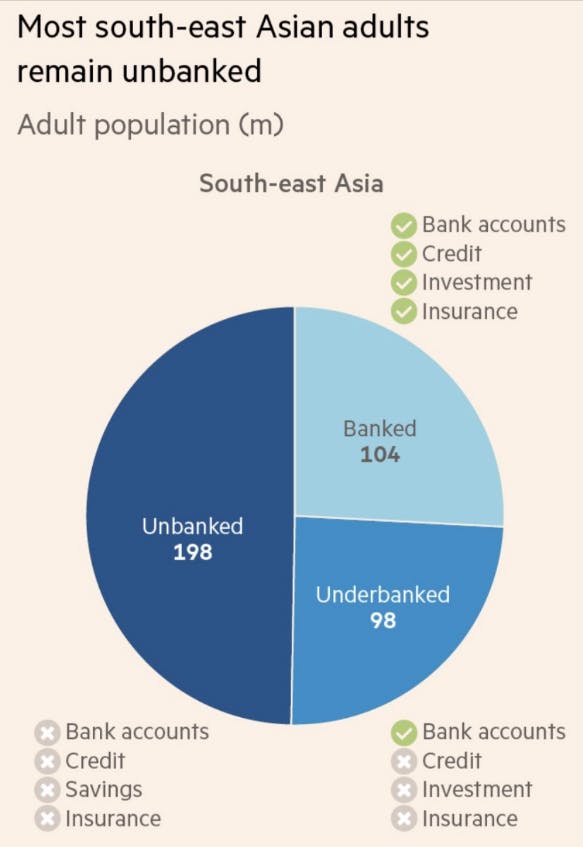
In December 2020, Sea Limited was awarded a digital banking license in Singapore.  A report by Financial Times shows that almost 50% of Southeast Asian adults are unbanked an additional 25% are underbanked.

This underscores the tremendous long-term opportunity Sea Limited is trying to capture in FinTech.  There is a long runway for growth in digital banking as well as digital payments in Southeast Asia, and we are seeing Sea Limited begin to position themselves for future growth.  Over the long-term, SeaMoney has the potential to be a legitimate source of revenue and capture a bigger piece of the revenue pie in addition to Shopee and Garena.      

Q1 Earnings Results

Sea Limited announced Q1 results last month, growing GAAP revenue 147% YoY to $1.8B (US $).  Total gross profit increased 212% YoY to $645M, while total adjusted EBITDA advanced to positive $88.1M compared to -$70M in the Q1 2020. 

The Q1 adjusted EBITDA number missed the consensus estimate of $173M, but the company has been very transparent about its strategy to aggressively reinvest profits back into the business to focus on top line growth.  In total, sales & marketing expenses increased 120% in the quarter while research & development expenses increased 118%.  Management appears to be taking the right approach to stimulating growth and engagement in each segment of the business, as evidenced by some of the growth metrics discussed below.

Sea Limited has three distinct business segments in e-commerce, digital entertainment, and digital financial services.  All three business segments executed tremendously in Q1, with each segment exceeding a triple digit growth rate.  Below is the revenue breakdown in Q1 2021 versus the breakdown in Q1 2020.

Valuation

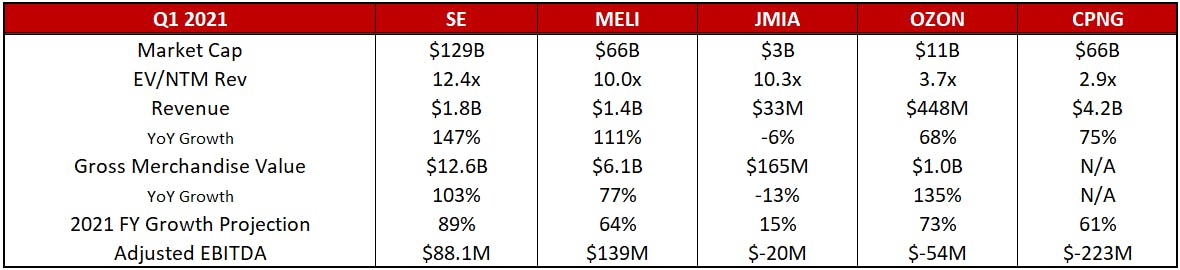
Sea Limited currently trades at a 12.4x EV/NTM revenue multiple, down from its peak valuation of around 27x last February.  Below, we compare this valuation to other international e-commerce stocks MercadoLibre and Jumia. Notably, Sea Limited has higher forward growth projections for 2021 than MercadoLibre or Jumia.  The table below shows a more detailed comparison of Sea Limited to MercadoLibre and Jumia.  We also included Ozon Group and Coupang, two less expensive e-commerce leaders, for comparison. 

Conclusion

Sea Limited did not give guidance for Q2 or FY21, but consensus estimates are calling for 89% YoY revenue growth for the full year.  All three of Sea Limited’s business segments are performing better than ever, and the company has a long runway for growth as Southeast Asia continues to become more digitalized.  Sea Limited has positioned itself as the dominant e-commerce company in the region with the success of Shopee, the top shopping platform in SE Asia.  With Garena, Sea Limited has the most dominant gaming company in the region with no signs of slowing growth.  SeaMoney, the company’s third segment, is ideally positioned to be one of the leading FinTech players in the region and will continue to benefit from increased digitalization.

UiPath: Robotics Process Automation

c15d441a-5b32-4147-8bb9-d78d991e3263_UiPath+Robotics+Process+Automation+Premium+Analysis.pdf

I’m genuinely curious as to whether UiPath will be the first in the tech universe to hold its opening IPO price. There’s a chance it does and I will attempt to communicate why this company could be one of the strongest performers the public markets have seen from my industry.

UiPath is becoming a darling within tech circles. That’s maybe the most critical thing to understand as the Partner Network for UiPath could potentially form a moat. The high switching costs most certainly help the company to become defensible. UiPath makes the choice very clear on what company to choose for RPA, no matter what your organization’s needs are, and from there they give enterprises no reason to switch by continually iterating a cutting-edge approach to RPA.

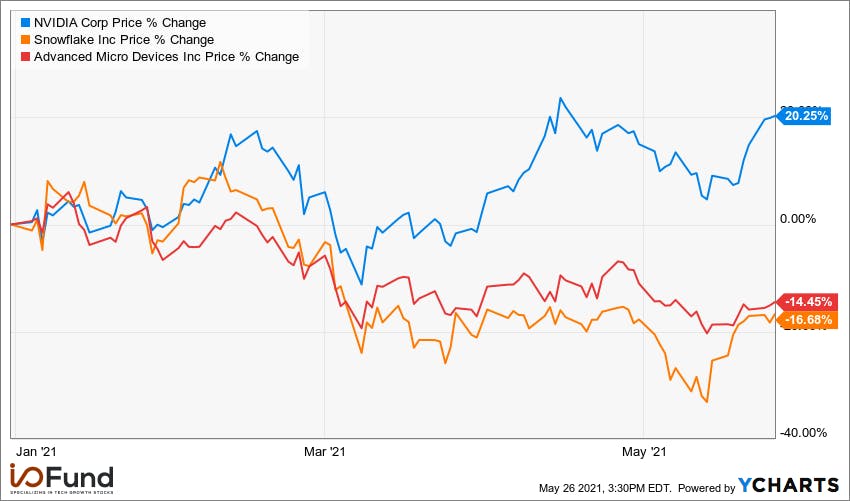
The last time I was this excited about an IPO was two years ago with Zoom Video. We held off to buy the stock post-lockup. That decision will be yours to make. What distinguishes UiPath for me is that AI stocks have a way of sneaking upward in price. We saw this with Nvidia during the tech rout as Nvidia (the AI bellwether) has performed well this year compared to other leading tech stocks with strong earnings.

Pictured above: Nvidia, the AI bellwether, has outperformed other leading tech companies this year. Little does the market know, that AMD is also becoming a force in AI with the Xilinx acquisition.


What is RPA – Macro Overview

Robotics process automation has many supporting macro statistics because its essentially machines replacing humans. The ROI is astounding when you have an error-free employee who works 24/7 and does not tire or need bathroom breaks. To illustrate, a few automations can save 20 minutes of work per person daily and enabling 10K employees with a software robot could save more than $30 million a year (based on an average salary of $35/hour).

There are many fears that RPA will eliminate jobs to the detriment of society. Proponents say this isn’t exactly true, rather RPA will eliminate menial and low satisfactory tasks. According to analysts like Forrester, 14.9 million jobs will be created by 2027 to work alongside robots. It’s not clear though how many jobs robots will replace and if the 15 million is actually a deficit.

According to McKinsey, $3.6 trillion of work can be automated. The piece of the pie that UiPath is after is the automation of applications for enterprises. The number of applications deployed by enterprises has increased by “approximately 70% over the past four years,” according to Wall Street Journal.

The 10,000-foot view of what RPA solves is that interoperability of applications is cumbersome with “a compounding effect on the complexity of business processes” and work done by IT departments.

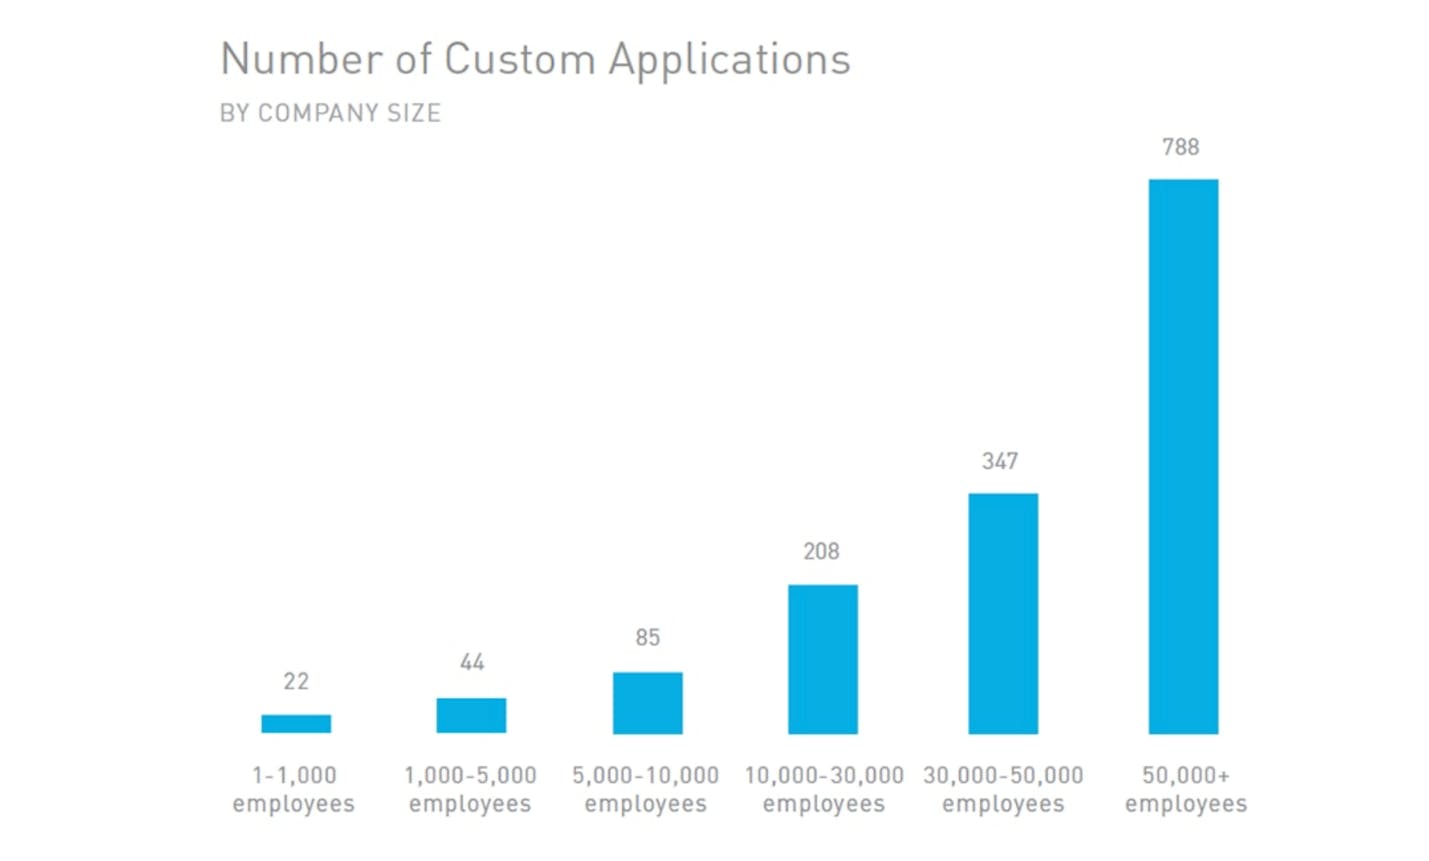
According to McAfee, the average enterprise has deployed 464 custom applications and deploys an additional 37 new applications in a 12-month time span. Companies with fewer than 1,000 employees run 22 custom applications while companies with over 500,000 run 788 custom applications, on average. The majority of these applications (58%) are used internally while 36.2% are used by customers, partners and suppliers. These larger enterprises – with the 788 applications on average — are the companies that UiPath is targeting.


Source: McAfee, 2017

In the United States, real output per hour grew 31% during the decade ending December 2009 while it grew 13% in the subsequent decade through 2019. UiPath believes this decline in output is due to the overwhelming number of applications and software within enterprises.

This is partly because applications are specialized and are not able to address the end-to-end processes that enterprises require. The concept that UiPath proposes is to automate those steps and have a human review the exceptions rather than every detail of every order.

Product Overview:

It’s important to start with product for a company like UiPath – and most companies in tech, really – because without knowing what the special sauce is, companies can get lost in the noise. UiPath is a platform that allows companies to run software bots that process automations. What separates UiPath is the use of AI computer vision to read information, hence having the acronym “UI” in the name, which stands for user interface. The company also leverages machine learning to think and process the information and robotics process automation (RPA) to interact with applications.

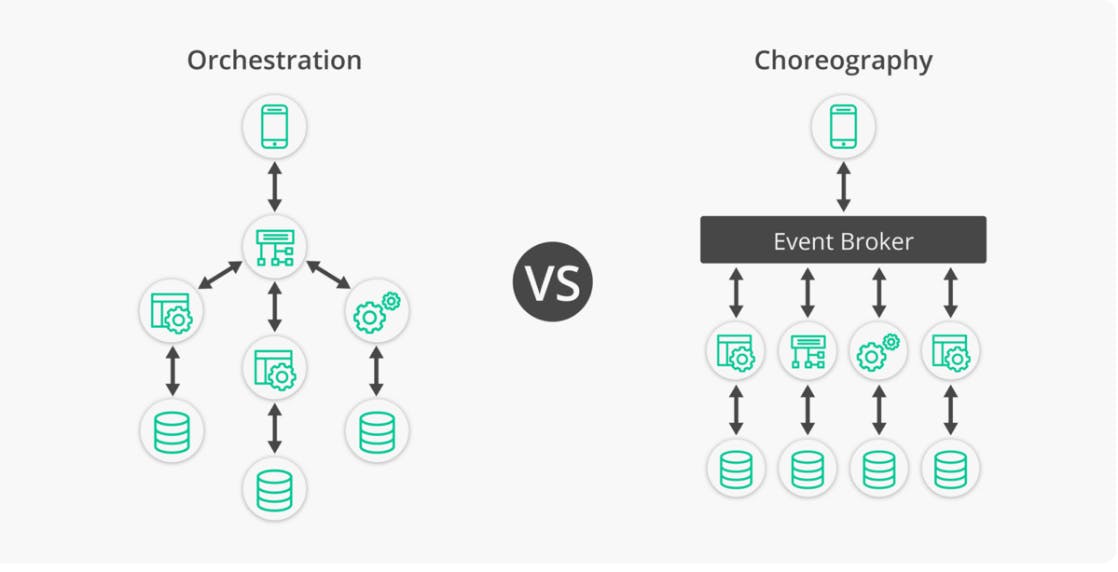
The combination of computer vision and machine learning is UiPath’s special sauce. The AI-based computer vision increases the reliability of automation. The AI-based computer vision is able to adapt and interpret varied document types and user interfaces. This is the missing piece in automation that other forms of orchestration or choreography do not have.

The key sentence in the S-1 filing is this: “Our platform enables the reusability and reliability of UI elements by capturing them as objects in a repository.” This means that the AI computer vision is able to dynamically recognize and interact with variables and dynamic objects or applications. In plain terms, it means UiPath can emulate a human by responding to variables the way that humans can. (Anyone working on autonomous vehicles will tell you, the issue with full autonomy is the variables, not the mechanics of driving). 

UiPath’s architecture is UI-based orchestration. This increases the reliability of the automation as it’s able to adapt and interpret varied document types and UIs. As stated, the platform captures UI elements as objects in a repository.

To compare, here are other ways automation and/or integrations are handled:

· Integration orchestration: When on-prem wants to integrate with SaaS platforms, companies like MuleSoft and Webmethods offer third-party connectors. This is called Integration Platform as a Service (iPaaS)

· Business process orchestration: Offers business processes a central process, yet requires human intervention.

· API based orchestration: Lacks a central component and is event driven

· Event driven architecture: Event driven to where the events are autonomous through choreography rather than orchestration (the difference being that orchestration requires a composer while choreography establishes a pattern that does not require supervision).


Source: Solace, Microservices

UiPath recently acquired Cloud Elements to add API-based automation to its core offering of UI-based automation. This is the first time the combination will be offered in a single platform. This places UiPath on the same playing field as the orchestration methods listed above, yet with the combination of computer vision/UI-based orchestration. This acquisition takes aim at that market share by providing the best of both worlds. The acquisition brings 200 new native integrations to UiPath

Why is UiPath Better?

The next question to answer is why is computer vision/UI method better? The first is that UI-based automation is not confined to specific APIs. The result of using computer vision (and the other components that I review below – but let’s keep the focus on computer vision for now) is that UiPath is an end-to-end solution rather than a point solution. The goal is to automate the process, not the API, and other orchestrations lack the ability to automate across many applications and link AI capabilities to execute. Without computer vision, the end result will not be human emulation.

The company points out in the S-1 filing that the typical AI/ML environments are developed by data scientists yet need to be used by other departments that carry the processes out (billing or customer service, for example). My takeaway on this is that the other methods for integration and automation do not necessarily cut down on the number of people required and/or does not reduce the technical abilities required to work with the automations. By requiring data scientists to be the central and only hub, end-to-end automation is not possible.

The modular setup is also an advantage. Solutions can be integrated into new, third-party technologies for future development.

When we talk about robots, we are talking about software robots that are on a desktop computer, can work across programs in the background, are able to build applications, send emails, and interact with chatbots. This is achieved with this build:

· AI computer vision can dynamically recognize and interact with variables and dynamic objects and applications

· AI-enabled platform helps identify which processes should be automated including interoperability with 75 AI technology partners

· Document Understanding leverages optical character recognition (OCR) and natural language processing (NLP) and ML to handle processes with humans handling only the exceptions

· Low-code Development drag-and-drop tools to serve a range of technical skills

· Governance and Security ensures compliance


Product Specifics:

UiPath is an expensive product and this is reflected in its customer concentration at the enterprise level. There is a Community Edition that is free, which is a smart way to onboard more developers at the student level.

Studio is UiPath’s integrated development environment (IDE) that allows access to the Automation Cloud. There are three variations: Studio, Studio Pro and StudioX. The difference is what technical level the user has with StudioX requiring very little skills (i.e. “low code”) with drag-and-drop while StudioPro requires Advanced skills.

Automation Hub:

Automation hub allows for central management of the automation pipeline. It’s a command center to see and control the end-to-end system. It also allows the administrator to visualize automation complexity and understand the impact and ROI.

Process Mining:

Process mining taps into a data source from enterprise applications and makes use of this event data. The goal is to streamline processes to become more efficient. For instance, if your goal is to improve customer retention rate, then you can track how long customer service responses take, delivery rates, and what is causing delivery problems so you can address the situation. Process mining also helps you identify bottlenecks that can benefit from automation.

Process mining changes all this by tapping into a data source that already exists. This is done through the ETL “extract, transform, load” process. Most of your enterprise applications (like SAP and Salesforce) record every activity and transaction that happens within each stage of a process. This is called event data.

Business processes suitable for process mining include accounts receivable, claims and accounts payable. In financial services, it can be used for loan approval, risk and investment management or fraud. In health care, process mining can be used to reduce paperwork and streamline processes like the spike in demand for testing we saw during Covid.

Task Mining and Task Capture:

Task capture allows for the mapping of business workflows. Employees can record the process they want to automate and Task Capture will gather data for each step. The software generates a process map into a file for the development team to use to create automations.

Task mining will have its public launch in 2021 and will allow enterprises to record work performed by users across a list of applications.

Business Model and Automation Flywheel:

UiPath benefits from a flywheel effect. The reason that a flywheel effect occurs is because when companies use UiPath to add robots, they see a substantial return on investment, and then deploy more robots.

The company is built and ready to scale with flywheel effects as UiPath can be customized for every need of the enterprise. The robots are designed to work in any environment (cloud, hybrid, on-premise), for any level of technical ability (low code to advanced code), is licensed through subscriptions annually or multi-year, and can work alongside a human or be fully automated, is additive, and can be used as a unified solution or individually (that’s a mouthful).

The point is that UiPath is prepared to offer a solution for any customer need and to scale as the needs of the enterprise changes.

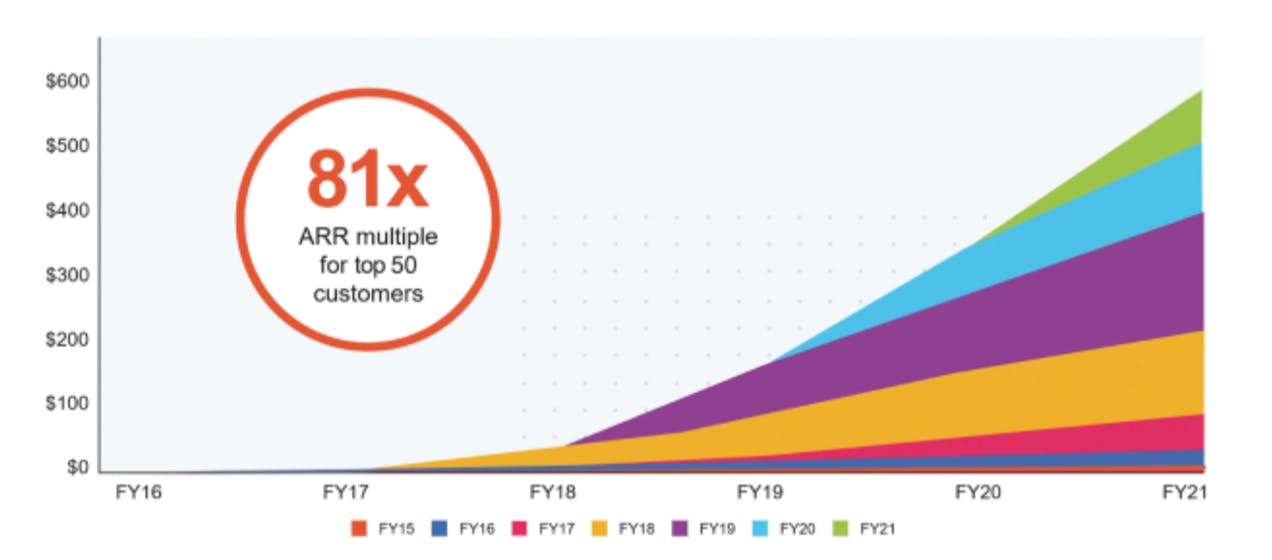
If a picture is worth a thousand words, then perhaps this helps illustrate the flywheel effect:

The graph above shows that the 2016 cohort of customers have increased their ARR from $395,368 to $22.7 million in a five-year time span. This is a multiple of 57X. The company’s top 50 customers have grown ARR by 81X. This is measured by the ARR generated in each customer’s first month as a customer.

There are some examples in the S-1 filing that show up to 69X increase in customer ARR within one year. That’s an outlier with others increasing 32X, 6X and 4X in one year. Even the lowest number here is impressive, and is driven by cross-department sales, increase of robots per employee, increased adoption across products, and expanded use cases.

Partner Program and Developer Ecosystem:

Partner programs are especially important for a company like UiPath as it can help to extend business models and also help to scale a product very quickly. It’s also important for global growth across various regions. UiPath is the automation back bone to many other products that you’re familiar with: Microsoft, Google, Amazon Web Services are integrated with UiPath so their cloud computing customers can utilize cloud-based AI capabilities. Other integrations include Adobe, Alteryx, Oracle, Salesforce, SAP, ServiceNow and Workday.

UiPath is unique in that it’s tailored to citizen developers who prefer low code and also advanced developers. Right now, the company counts 750,000 registered developer accounts. There is a marketplace with 1,200 vetted and pre-built automation activities that can be used for enterprise workflows. UiPath says there are 10,000 downloads per month in the Marketplace.

Market Size and Valuation:

I expect that UiPath will trade at a high valuation into the foreseeable future. This is because of the specific trend the company is capturing. I think individual investors can get lost in the noise of popular stocks, but I don’t think institutions fall prey to this as easily. You’ll notice the companies that are favorites among retailers are not favorites among institutions. That’s one reason we run this site, is to bring to your attention to companies that you won’t want to miss out on.

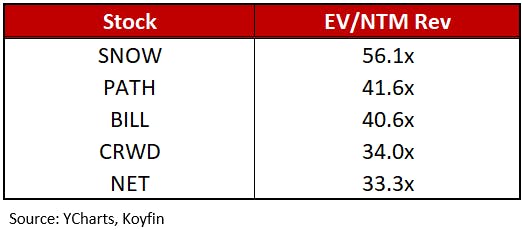
What about sector rotations, like we just had? Even still, companies like Snowflake retained their position of highest valuation, comparatively speaking. It went from a jaw-dropping 80 forward P/S in February to about 50 forward P/S – yet this company still led the pack of cloud software valuations.

We typically don’t buy above 40 forward P/S (you can reference when I discussed this during heightened exuberance in this Motley Fool video). We don’t know UiPath’s forward valuation until we see more analyst consensus numbers come out. The earnings report on June 8th will help quite a bit. However, if we adjust the revenue growth to a reasonable 65% forward, then we see UiPath trading at 41X.

Please note, this is calculated on 65% revenue growth next year, which is an educated guess. We will know more about UiPath’s forward estimates in the coming weeks.

If we take the LTM valuations, we see UiPath stretching the upper limits again. LTM is important here since UiPath’s forward is not available yet.

The I/O Fund does not give financial advice and highly valued tech companies require an appetite for risk. We simply tell you what we are doing with our own money. We bought UiPath starting last week after the blog notification went out and we will be watching it closely near the lock-up expiration as to whether we need to exit and enter again. This extra work is worth the long-term trajectory that robotics offers us as tech investors.

The reason UiPath is unique from the others on this list is because the opportunity for RPA is fully in front of the company, whereas many of the others are centered in a trend that is in motion.

I also think UiPath will continue to take more market share relative to the RPA market, and the key metrics around increased ARR help prove this as they are a bit mind-blowing. Other than ARR, I can’t quantify exactly why I think UiPath will take more market share other than it has a solid reputation and there is a buzz around the company that is hard to communicate. People are pleased with UiPath, they’re upgrading and buying more, and it’s becoming the company that everyone (who is anyone) needs to partner with.

Market Size:

There are a range of estimates on the size of the Robotics Process Automation market.

According to the S-1 filing, IDC places a $17 billion value for 2020 to reach $30 billion by 2024. Meanwhile, UiPath states in the S-1 that the “fully automated” enterprise is a market of $60 billion. There is also a reference in the S-1 to an estimate from Bain & Company placing the market for automation software at $65 billion.

Forrester states there are 1.69 billion knowledge workers globally. So, that’s helpful to picture TAM.

Third-party analysts are more conservative – no surprise there as S-1 filings usually publish the highest numbers available. According to Statista, the market will be worth $10 billion by 2023.

Global Market Insights places the market at $23 billion by 2026. Grand View Research states the market will reach $13.74 billion by 2028 at a CAGR of 32.8%.

That’s quite the range and is tough to extract a real market size from these numbers. However, there is agreement across the third-party sources that the robotics process automation market (specifically, RPA only) was $2 billion in 2020. This means UiPath owned about 30% of this specific market at $600 million in revenue. If we take the $10 billion Statista is putting out there, then UiPath can see a path to $2 to $3 billion in revenue by 2023 in RPA specifically. I always give room in these market growth estimates, by the way, so 2023 should be considered 2024 by Statista. It’s hard to nail down market growth with adoption in tech products.

Financials:

Please note, UiPath’s fiscal year ends January 31st.

We covered the financials here in a short write-up.

The good news about UiPath is that as the top line improves, the bottom line is also improving. Revenue growth from $336 million to $608 million, represents 81% growth for fiscal 2021. As mentioned in the valuation section, we won’t have a complete picture on forward growth until the upcoming earnings report on June 8th. Right now, I’m assuming we will see growth this year in the 60-percentile range. This is a guess so I will update you when we get real numbers from the earnings and analyst consensus reports.

In the past, operating margins have been an issue for the company with an operating margin that was triple digits in the red (154%) in 2019. The company’s current operating margin is (18%). Adjusted operating margins were (113%) and (4%), respectively.

The net losses have also improved from ($520) million in 2020 to ($92) million in the current year. The fiscal year 2020 losses were at (155%) of revenue compared to (15%) of revenue in the current fiscal year.

The bottom-line losses were partly driven by sales and marketing costs which were at 144% of revenue in fiscal year 2020. Surprisingly, R&D is low at 39% of revenue in 2020 and 18% of revenue in 2021.

The current gross margins of UiPath are at 89% which is among the highest in the software industry. This has been consistent with 82% margins in fiscal 2020. Free cash flow is at 4% of revenue, or $30 million in fiscal 2021.

The company is an enterprise-focused company and is well utilized. As of last year, the company counted 80% of the Fortune 10 and 61% of the Fortune Global 500 as customers. This grew to 63% of the Fortune Global 500.

As stated, the main business model is to increase spend per customer as enterprises will deploy more robots across more departments, increase number of products used, and expand use cases for automation. That’s important to repeat because typically this high of penetration could actually be a headwind for growth.

The dollar-based net retention rate for the company was 153% in 2020 and 145% in 2021. After subtracting churn, the gross retention rate is 96% and 97%. With that said, this metric is becoming less meaningful the more cloud and subscription-based companies come on the market. We have many in the 130 to 160 range and it’s similar to checking vitals – we want to know the company is healthy but it doesn’t tell us much about the nuances of longevity.

The company has a NPS rating of 71, helping to illustrate a high level of customer satisfaction. Despite serving large enterprises, including 8 of the Fortune 10, UiPath does not have any customer making up more than 10% of revenue.

Conclusion:

We finally have the AI pureplay we’ve been waiting for in the software category. This company is likely to be valued high into the foreseeable future due to the attractiveness of the trend (robotics). We feel institutions will want to participate in this trend with this risk/reward ratio that UiPath offers, which to reiterate, is lower risk on execution due to the excellent end-to-end platform, strong partner program, leading market share and ability to scale quickly across enterprises, with the differentiation of computer vision.

Please look for Knox’s trade notifications as he patiently builds this to become a core position of ours. If you made me choose, (and we do have to choose as we disclose allocations to you), I would place UiPath above Snowflake on conviction. Post-IPO lockup, and pending Knox’s excellent skills in finding the right entry, you can expect to see UiPath in our top 10 by year-end or shortly thereafter. Note that we aren’t rushing into a position at this valuation, rather keeping our toe in the water, and navigating as we see what the market does.

Q1 Earnings Analysis for Etsy, Square, and Palantir

As earnings season winds down, we review earnings reports for popular growth tech stocks Etsy, Square, and Palantir. 

Regarding Etsy, e-commerce valuations have come down as a result of the correction in growth tech, and when compared with other e-commerce stocks that are facing tougher comps, Etsy is showing slowing projected growth of 32% this year.

We also discuss Square, a fintech stock whose topline beat was driven by a surge in Bitcoin revenue. Excluding Bitcoin revenue, the company still reports decent growth of 44%. We look at Square from both perspectives below.

Palantir is guiding for Q2 revenue growth of 43%, but to prove product-market fit, the company needs to show higher growth in commercial revenue. Beth Kindig previously wrote about this in Forbes when she analyzed the product at its IPO.

Etsy: 

Like many beneficiaries of Covid-19, e-commerce benefitted from the economic shutdown through an acceleration in revenue. In 2020, consumers spent approximately $861B online with U.S. retailers, up 44% YoY, nearly three times the growth in 2019 at 15.1%, according to estimates from Digital Commerce 360

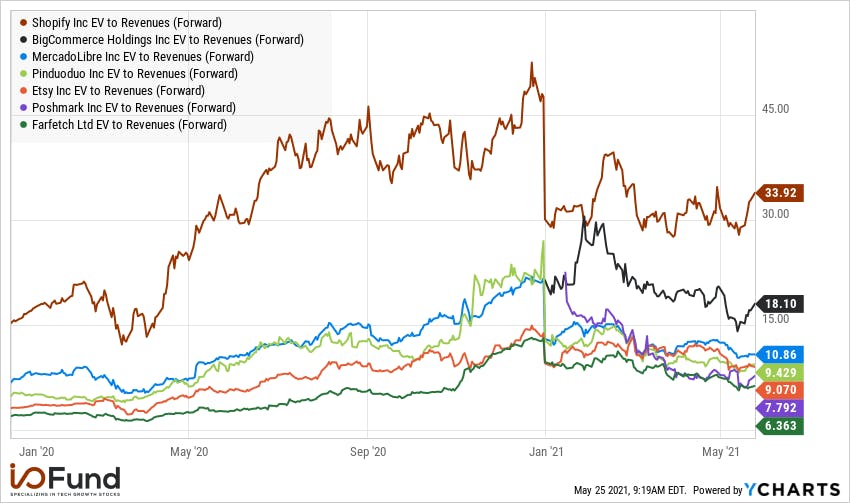
E-commerce valuations peaked for the industry in early 2021 as investors worried about more difficult comps. As you can see from the chart below, Etsy’s valuation peaked at 15x forward revenues, based on data from YCharts. As of May 25, Etsy was trading at 9x forward revenues.

e-commerce companies ev to revenues (forward) chart

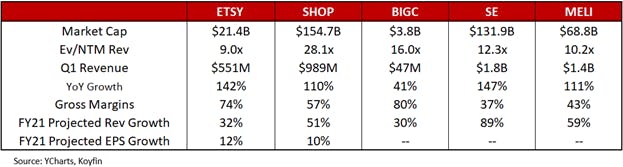
Etsy is projected to show slower revenue growth of 32% this year than popular e-commerce stocks like Sea Limited, 89%, Mercado Libre, 89%, and Shopify, 51%. Etsy is facing noticeable deceleration from its 111% YoY revenue growth in 2020.

Revenue growth for Etsy is on par with BigCommerce, which is valued at 16x revenue versus 9x revenue for Etsy. Meanwhile, Etsy is already profitable with 74% gross margins and projected EPS growth in 2021 of 12%. The company also beat on its top and bottom lines with 141% YoY revenue and EPS of $1.

e-commerce stocks metrics

GMS represents total sales and is an important metric for e-commerce stocks. In Q1, consolidated gross merchandise sales (GMS) for Etsy was up 132.3% YoY to $3.1B, while Etsy marketplace GMS was up 144.1% YoY to $2.9B. Etsy estimates that stimulus payments drove approximately 8% of GMS growth in Q1. In its guidance for Q2, Etsy is estimating consolidated GMS growth of 5% to 15% YoY.   

In Q1, the Etsy marketplace reported the highest growth rates for active buyers, repeat buyers, and habitual buyers since becoming a public company, acquiring 16.3M new and reactivated buyers. Active buyers grew 91% YoY; repeat buyers who made two or more purchases in the last year grew 114%; while habitual buyers, the company’s most loyal consumers, grew more than 205%. 

Conclusion

Like many e-commerce stocks, in 2020 Etsy benefited from Covid-19 through an acceleration in revenue. The company is now facing tougher comps and is guiding for decelerating growth. E-commerce valuations have contracted, and Etsy is not the cheapest e-commerce growth stock we analyzed above. 

As of May 25, Etsy was trading at 9x forward revenue versus 6.36x for Farfetch and 7.78x for Poshmark, which we previously covered. Unlike other popular e-commerce stocks, Etsy is profitable with a gross margin of 74%, and projected revenue and EPS growth in 2021 of 32% and 12% respectively.


Square:

Covid-19 accelerated the trend towards digital payments, with more than 70 million transactions being processed globally in 2020, representing growth of 41% YoY, according to a recent report from ACI Worldwide and GlobalData. 

The value of those transactions rose 32.8% YoY to $69T, while the share of digital transactions was 9.8%, up from 7.6% in 2019. 

Digital payments are nascent with plenty of room for growth, according to the report. 

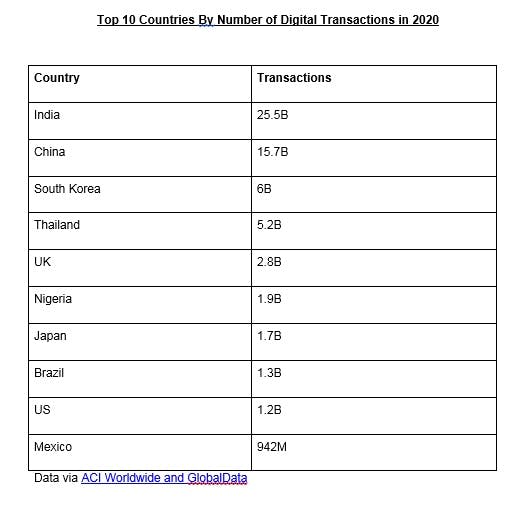
top 10 countries by number of digital transactions in 2020

Digital transactions have a projected CAGR of 12% by 2025, with the fastest growth of digital payments from 2020 to 2025 in Croatia, 374.4%, Columbia, 112.7%, Malaysia 83.9%, Peru, 74.4%, and Finland 71.4%. 

North America is expected to be the fastest growing region, with a CAGR from 2020 to 2025 of 36.5%.

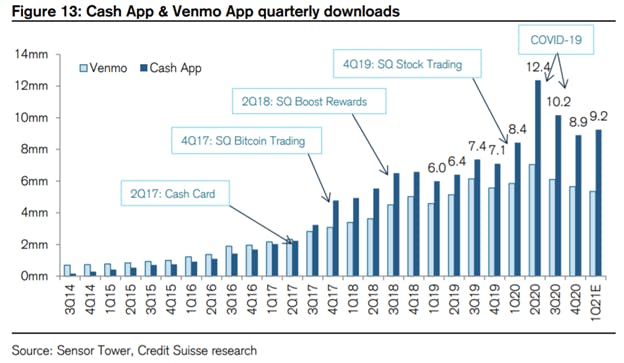
Square, a popular fintech stock, allows users to trade Bitcoin via its mobile application. Square’s Cash App has outpaced PayPal’s Venmo in quarterly downloads every quarter since launching Bitcoin trading in Q4 2017, based on data from Sensor Tower. 

cash app & venmo app quarterly downloads

Square reported Q1 earnings May 6, beating on the top and bottom lines, driven by a surge in Bitcoin revenue. Revenue of $5.06B, up 266% YoY, beat by $1.73B. Excluding bitcoin, total net revenue was up 44% YoY to $1.55B. 

 Cash App revenue was $4.04B, up over 650% YoY, with gross profit of $495M, up 171% YoY. Cash App generated Bitcoin revenue of $3.51B with gross profit of $75 million. Excluding Bitcoin, Cash App generated revenue of $529M, up 139% YoY.

Gross profit grew 79% YoY to $964M. Seller generated revenue of $1.02 billion, up 19% YoY, and $468 million of gross profit, up 32% YoY. 

To bring in new customers, last March, Square began offering Cash App users the ability to send Bitcoin for free. During the quarter, Square also integrated Square Loyalty into Cash App, which it says is “a flywheel for seller and buyer discovery, engagement, and retention.” 

Square officially launched its industrial bank, Square Financial Services, last March. It is expected to launch business checking and savings accounts, according to a recent report

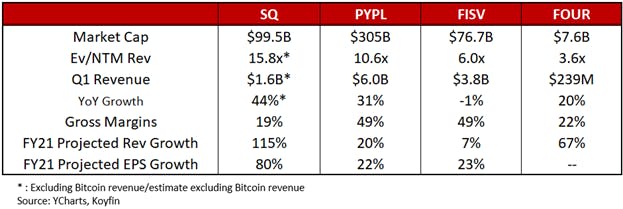
Excluding Bitcoin revenue, Square trades at a premium compared to peers PayPal, Fiserv, and Shift4. However, for 2021, Square is projected to grow revenue 115% YoY and EPS 80% YoY, which is higher than other fintech stocks. Gross margins for Square are lower than its competitors, as Bitcoin boosts revenue but reduces gross margins. 

fintech companies metrics

Conclusion 

Moving forward, Square faces increasingly difficult comps and trades at nearly 16x forward revenue, which is a premium compared to peers and related to its higher revenue growth.


Palantir:

Total commercial revenue grew 19% YoY to $133M, while US commercial revenue grew 72% YoY. Commercial growth was more muted due to the ongoing impacts of Covid-19, including in Europe, according to the report.

Palantir is continuing to make progress on commercial customer growth, according to the report. CEO Shyam Sankar struck a bullish tone, reporting a substantial increase in new leads: 

“We see strength and forward looking indicators and customer interest,” he said. “Since the beginning of February, qualified commercial opportunities in the US and the UK are up 2.5 times. Active commercial pilots across the business have more than doubled and opportunities across the US and UK government continue to develop at pace.” 

Right now, the closest competitor to Palantir is Semantic AI, a private company headquartered in San Diego, but more competitors are likely being developed in the startup ecosystem. We cover this and more in a previous write-up by Beth Kindig here.

Last April, Palantir demonstrated Apollo for Edge AI. The product is now live and takes a “pioneering approach” to AI using micro models, Sankar said: 

“Apollo for Edge AI is the next evolution to transform AI into alpha, enabling customers to train, manage and deploy multiple independently versioned chained models to the Edge with ease,” he said. 

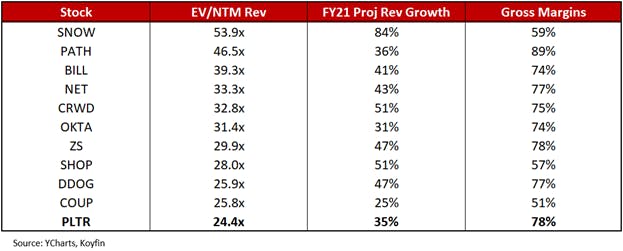
Below we compare Palantir with other high growth tech stocks. While Palantir has healthy gross margins of 78%, projected 2021 revenue growth is lower than growth tech stocks like DDOG, SHOP, and ZS, which also trade at valuations under 30x. 


palantir compared to other high growth tech stocks

Conclusion

Although Palantir is guiding for revenue growth of 30% or more through 2025, we believe the company will needs to do a lot to execute in the Commercial market against the thriving AI startup ecosystem. However, it may take a few years before AI startups can effectively compete against Palantir. The number to watch will be commercial revenue growth, which was low at 19% this past quarter. Without more growth here, the product may not show signs of product-market fit in the commercial sector.   

Disclaimer: The author, Jessica Ablamsky, owns shares of Etsy and Square. The content in this article is intended to be used for informational purposes only. The author has not received any compensation from any third party or company discussed in this article. The content is the expressed opinions of the author and is intended for educational and research purposes. Any thesis presented is not a guarantee of any particular stock’s future prices, so please factor this risk into your own analysis. It is very important that you do your own analysis before making any investments based on your personal circumstances. The author is not a licensed professional advisor. Please seek counsel form a licensed professional before acting on any analysis expressed in this article, to see if it is appropriate for your personal situation.

FuboTV: Why I Like This Stock Better Than DraftKings

This article was originally published on Forbes on May 21, 2021,12:31am EDToriginally published on Forbes on May 21, 2021,12:31am EDT

FuboTV has been dismissed by quite a few analysts and investors for its negative gross margins. This dismissal, that leans heavily on the lagging financials, is reminiscent of the many times that tech stocks have been misunderstood.

As a tech analyst who is trained in product, I see a sizable runway in live sports OTT and sports betting with Fubo having key advantages over DraftKings. The management has to execute, and while the market calls this speculation, I call it a product road map.

First, FuboTV must continue to grow its audience. I made the argument that this is the most essential piece over the coming quarters when the shorts attacked this company. The bearish reports ignored the most important piece to a media company: audience growth. Fubo has handily overcome the challenge of growing its audience year-over-year regardless of the seasonality in sports. The last two quarters could not have gone better in this regard.

Second, FuboTV must execute on launching a sports betting book. This is easier than the public markets think as Fubo has every required ingredient. Most importantly, competitors such as DraftKings do not have all of the essential ingredients that FuboTV has, and we expect Fubo will see a healthy uptake for this product launch. 

You can read my previous write-up on FuboTV here.previous write-up on FuboTV here.

Financials do matter, of course, and as mentioned Fubo is the ultimate challenge for those who rely on financials alone and ignore product. This is because live sports were canceled last year. Short seller reports that dissect a live sports company following covid are exaggerating the effects of a lagging, one-time event. Forward-looking, we have an ad rebound in digital ad spend from 5% last year to 17% this year. Plus, the World Cup is on deck (and hopefully the Olympics) which bodes well for point #1 – audience growth.

The more popular bet is to go with DraftKings. However, DraftKings is a well-known story that is fully priced. We like the risk/reward of Fubo better due to the fact that this particular company is capturing the live sports OTT trend and will be able to convert high-value users for the sports playbook because they own their audience. 

Audience Growth

FuboTV put quite a few triple digits on the scoreboard in the last earnings report, which was the strongest first quarter in company history. Due to the seasonality of sports, Q1 is typically lighter in terms of growth for Fubo, yet the company reported sequential revenue and subscriber growth.

GAAP of -$0.59 missed by $0.03 and included -$0.02 from expenses associated with the launch of sports betting and -$0.02 due to paying off debt related to senior convertible notes.

Prior to the earnings report, we reached out to Apptopia to check the app data on Fubo. Apptopia is a provider of competitive intelligence on mobile applications.

With the information, we issued the following note to our subscribers on April 20th: "Fubo guided to end Q1 with subscribers of 520,000 to 530,000, representing growth of 82% YoY at the midpoint. Data from Apptopia shows that Fubo ended March with approximately 585,000 daily active users (DAU) versus the Q1 guide for 525,000 paid subscribers at the end of Q1Fubo ended March with approximately 585,000 daily active users (DAU) versus the Q1 guide for 525,000 paid subscribers at the end of Q1." 

On May 11th, the company went on to report 105% year-over-year growth and 8% sequential growth for 590,430 MAUs with subscription revenue increasing 131% YoY to $107.1M. Therefore, we were within 6K subscribers on the estimate.

Net subscriber additions were approximately 43,000 versus a loss of 28,000 in the same quarter last year, which the company achieved while reducing sales and marketing as a percentage of revenue. Monthly ARPU increased 28% year-over-year and advertising ARPU was up 57%.

Paid and trial users streamed more than 228 million hours, up 113% YoY. MAUs on average watched 129 hours per month, up 8% YoY.

This is the second time we accurately tracked Fubo’s audience growth with Apptopia data. The first was when we pointed out during a flurry of short reports that the audience growth in Q4 was quite healthy.

According to Q2 data from Apptopia, as of May 12th, Fubo’s growth remains strong on a year-over-year basis. We are currently seeing app downloads tracking at 181% YoY against weak Q2 ’20 comps due to the cancellation of sporting events last year.

Please note that we have extrapolated the data through May 12th to the end of Q2 and we were roughly 46% through the quarter as of last week. 

Note: this data is not for earnings calls and readers must do their own due diligence. We are simply sharing information from a mobile analytics firm, which is one of the many channel checks we do when looking at tech stocks.

Fubo is tracking for a sequential QoQ decline in downloads in Q2, but it should be noted that Q2 is historically a weaker quarter than Q1 for Fubo, as evidenced by 2019 pre-pandemic data.

We are seeing similar trends in average daily active users (DAUs) thus far through Q2, with Fubo on pace for 172% YoY growth and a modest decline sequentially.

Total time spent in the Fubo app is currently on pace for a large YoY increase of 237%, with another modest decline sequentially from Q1. This helps support how sticky Fubo’s product is to its audience.

Fubo raised guidance and expects Q2 revenue of $121M at the midpoint, up 174% YoY, versus consensus of $98.37M, and FY2021 revenue of $525M at the midpoint, up 101% YoY versus consensus of $472.69M.

The company also raised guidance for subscribers. For Q2 the company expects 600,0000 to 605,000 subscribers, up 111% YoY and for the full year expects 830,000 to 850,000 subscribers, up 53% YoY at the midpoint.

Live Sports OTT

Not surprisingly, we saw the biggest drop ever in households with cable packages this past year with a record 7.5% decline. Tech Crunch recently stated the 2020 pandemic accelerated the projected cord cutting rate to 31.2 million households last year and is expected to reach 46.6 million households by 2024.

Even more pertinent, according to a survey compiled by Parks Associates, 55% of cable subscribers state that live sports is an important factor in why they are staying with expensive cable packages. That means of the 77.6 million currently subscribing to cable, satellite and telecom packages, 42 million are live sports fans. This is 10 million more than the size of the current cord-cutting audience, which has taken nearly 15 years to amass (circa 2007).

In September of last year, AT&T paid $3.75 billion for the exclusive rights to segments of major league baseball. This is a renewal of prior contracts and is a 65% increase from their prior exclusive price tag. The fact that ATT is willing to pay a 65% premium from their last contract shows the importance placed on live sports.

We can see a similar evidence as to the value placed on live sports with Amazon’s purchase for the exclusive rights to the Thursday night NFL games through 2033 at an astounding $100 billion.

As an investor, I understand FuboTV will not stream every game in every league, and I am aware exclusive rights to various sports may shift through negotiations. In fact, the Tokyo Olympics may be canceled. However, FuboTV is offering me a pure play and the company only needs to corner a percentage of live sports cord-cutters in order to be successful. FuboTV could end up owning 5% of the market or 20% of the market – both look good from this market cap.

When asked about competitors, Anthony Wood of Roku has stated a few times that any cord-cutting is a windfall for their platform. Similarly, I believe that any NFL fans cutting the cord will be a windfall for Fubo.

On that note, Fubo offers comprehensive sports coverage. According to a March 2021 press release, Fubo offers “42 of the top 50 Nielsen-ranked networks across sports, news and entertainment channels,” plus more than 30,000 movies and TV shows on-demand.

It’s also important to note that Fubo has the exclusive streaming rights to the South American Qatar World Cup 2022. When you consider there are 3.5 billion soccer fans globally, suddenly Amazon’s Thursday night NFL deal doesn’t seem so make or break (far from it, Thursday is the least popular night).

Sports Betting

In the United Kingdom, sports betting is a $20 billion industry today. There are projections that sports betting will be a $155 billion industry by 2024. To find an opportunity with exposure to this market at a $3 billion market cap is worth a closer look.

Fubo acquired Balto Sports on December 1st in the company’s first strategic move to launch free-to-play games this year. Balto Sports develops tools and contest automation software for users to organize and play fantasy sports games and is a Y-Combinator graduate.

There was criticism from the short sellers that FuboTV had bought a headline. Yet, there is nothing unusual about a stealth product that needs to attach the technology to an audience. In fact, Fubo plans to beta test its free gaming experience in the next few weeks and this rapid release is likely due to the incubation period that Balto Sports underwent beginning with its time at Y Combinator. 

In Q1, Fubo acquired Vigtory, a sports betting and interactive gaming company, for $37.2 million. The company was founded in 2019. The company is co-founded by a former gaming executive at MGM Resorts and has regulatory approval in New Jersey. Notably, the app has not gone live which is reflected in the price. 

Fubo Sportsbook is expected to launch in Q4. The company has $400 million cash and is planning to spend less than $50 million to launch sports betting, per the Q1 earnings report. Fubo plans to deliver streaming and gaming in one data analytics platform, offering users a seamless experience. We expect the company will see lower customer acquisition costs as a result of owning the audience. Fubo’s CEO, David Gandler, said during the most recent earnings call that 30% of users are willing to participate in free-to-play, according to surveys done on the platform, while 22% of paid subscribers are willing to place bets on Fubo.

Despite short sellers not seeing how or why a sports betting app could merge with live sports content, we now see DraftKings partnering with Sling/DISH. I guess content and sports betting does go together, after all (yes, I’m being sarcastic!) It’s surprising that the critics said it cannot be done despite Sky Media having the most successful sports betting model globally.

From purely a user acquisition standpoint, in-app ads with your own content is nearly frictionless and you have a mountain of data to effectively target. Fubo’s ability to gather audience data and appropriately market them, with a deep understanding of preferences, is an advantage that is currently understated. Fubo has first-party data and can specifically tailor an experience, which will either result in higher ARPU from betting or higher ARPU from ad spend.

DraftKings, meanwhile, has partnered with the number six over-the-top provider, DISH Network/Sling. We think DraftKings sees the potential threat in Fubo having access to first-party data and a closed-circuit loop for user acquisition in sports betting. Notably, DraftKings faces friction here when introducing a new brand name that is not DISH/Sling. Essentially, whatever DraftKings can do with the #6 partnership, Fubo can do better. For example, Fubo can give free sports content away to high value users who spend over $100 on sports betting and offer other rewards that are not possible unless you own the audience. The CEO talks about this here.

Fubo is already on par with DraftKings in terms of ARPU and has not added sports betting yet. These numbers show that with sports betting, Fubo could potentially see $100 ARPU or greater.

Notably, DraftKings spends an exorbitant amount on sales and marketing at 82% of revenue. This reflects the cost of acquiring users when you don’t own an audience. It’s interesting, of course, that the critics of Fubo do not look at the $1.5 billion in net losses that DraftKings accrues on its bottom line. On a forward basis, DraftKings is estimated to report ($2.82) EPS for fiscal year 2021 compared to Fubo’s estimated ($1.96) EPS.

Notably, despite having 1/3 the revenue and audience size of DraftKings, Fubo is trading at 1/6 the market cap. It’s not hard to see the potential here, and clearly a healthier bottom line isn’t the reason that DraftKings trades at a 300% higher valuation.

Conclusion:

We officially recommended FuboTV in October and did not hesitate to challenge the shorts in January before the last two earnings reports confirmed the company’s strong growth. We specialize in spotting opportunities in tech growth based on product and we were the first analyst (anywhere) to recommend Roku, we were very early to call Nvidia the future for AI during the crypto bust nearly two years before AI drove the data center segment, and we said Zoom’s product would go viral six months before covid.

We are not concerned with broader market weakness that affects short-term price movements. Instead, we look for companies that are executing on a product road map, are capturing a microtrend and are able to scale. Not only do we think Fubo can do this, but we think Fubo will overtake DraftKings in the next 2-5 years.

Please note: The I/O Fund conducts research and draws conclusions for the Fund’s positions. We then share that information with our readers. This is not a guarantee of a stock’s performance. Please consult your personal financial advisor before buying any stock in the companies mentioned in this analysis.

UiPath: LTBH Position – Report Coming Soon

Please note, Mailchimp was down for a period of time on Friday. If you rely on Mailchimp only for real-time trade notifications, then please check this page for current updates. SMS/text messages and Forum Buys/Sells are additional places the alerts are sent to.

UiPath: Robotics Process Automation (RPA)

When I think of artificial intelligence, one of the first things that comes to mind is robotics process automation (RPA). To be clear, these two are not the same – but together, advanced AI skills can be integrated into robots to understand documents including structured and semi-structured data, visualizing screens, and comprehending speech. You can think of RPA as the last-mile delivery for artificial intelligence. In other words, what do you do with AI, ML and NLP – what’s the outcome? A popular choice will be to automate processes with robotics.

I’ll go into greater detail in the upcoming PDF report but the main takeaways from the S-1 Filing are:

· Revenue growth of 81% to $608 million

· Dollar-based net retention rate of 145%, ranking it in the top 5 among public SaaS stocks who disclose this metric

· Gross margins of 89% which are among the highest in the software industry

As the top line increases, the bottom line is improving.

Over its last 12 months, UiPath has a free cash flow margin of 4% to go along with a -18% operating margin.  The -18% operating margin is a significant improvement from the -154% operating margin the company recorded in 2019. 

UiPath logged a $92M net loss in its last fiscal year, an improvement from the $520M net loss the company announced the year prior.

At the time of its S-1, UiPath had a total of 7,968 customers, exceeding a 70% CAGR in customer growth over the last 2 years.  Customers with over $100K+ ARR totaled 1,002.  UiPath automates millions of repetitive tasks for an impressive list of customers that includes 63% of the Fortune 500 and 8 of the Fortune 10. 

UiPath has an EV/NTM Revenue valuation of 35.9x using its 81% YoY growth run rate.  Below is a comparison of UiPath to some other high growth software stocks.  PATH currently ranks 3rd among the highest valuations in the software industry. 


Caution: IPO lockup periods usually see a decline in price

We’ve stated many times in the past that IPOs are tricky and we tend to not participate. We patiently waited for Snowflake, for example. We did the same on Zoom as we were prepared to find our lowest entry post-IPO.

The reason a lock-up period is followed by a lower stock price, even when the company is fundamentally strong and will go on to make bigger gains, is because some investors need to exit and go find their next big win. These are seed round and Series A investors who made plenty in the public offering and prefer to go find new portfolio companies.

Therefore, if we enter UiPath, we could exit again prior to the lock-up period expiring. This isn’t because we don’t want a position in the company, rather it’s that we need to compete on performance, and to also be transparent so our subscribers are fully aware of how we navigate volatile tech growth. 

Maybe UiPath will be the first to hold its opening price after lock-up. In the meantime, I want to give you a heads up in case the I/O Fund initiates before we release the deep dive research.

Fiverr Q1 Update

I covered Fiverr here in November 2020 as part of our free newsletter.  In this report, I made the case that the trends we were seeing from Fiverr were not dependent on Covid, but rather accelerated by the pandemic. 

I argued that these trends would be sustained post-pandemic and that the shift to a more remote and flexible workforce was permanent, especially in younger generations.  Six months later, lockdowns have eased amidst the vaccination rollout, but we continue to see positive momentum in Fiverr’s platform.

I/O Fund is looking for signs of high-level business performance among indiscriminate selling in growth tech. When the value rotation ends, I believe FVRR is one of the stocks poised to benefit most. Moving forward, FVRR is unlikely to see triple digit revenue growth again. However, consensus projections show 40% revenue CAGR over the next three years, with tremendous growth on the bottom line as the company improves profitability. 

Below I examine Q1 results and guidance, evidence of increased usage and engagement of the platform, and valuation.

Q1 Results and 2021 Guidance      

Fiverr announced Q1 results on May 6, comfortably beating top and bottom line estimates while also raising guidance.  Revenue came in at $68.3M in the quarter, representing an acceleration to 100% YoY growth.  Non-GAAP EPS of -$0.01 beat by $0.10, while adjusted EBITDA improved to ($0.7M) compared to ($2.9M) in Q1 ‘20. 

Active buyers grew 56% YoY to 3.8M, an acceleration from the 45% growth rate Fiverr announced last quarter.  Spend per buyer came in at $216, representing 22% YoY growth.  Take rate improved 10 basis points YoY to 27.2%, while the company also announced an impressive 84.1% gross margin. 

Fiverr guided for $74M in revenue for Q2 (+57% YoY) and positive EBITDA of $6M.  For the FY 2021, Fiverr raised revenue guidance to $305M at the midpoint.  The company is now expecting YoY revenue growth of 61% in 2021 versus previous guidance for a 48% YoY growth rate.  The FY outlook came in 6% above consensus estimates.  Management also guided for positive adjusted EBITDA of $22M at the midpoint, representing 142% full year EBITDA growth. 

Continued Momentum

In the company’s Shareholder Letter, Fiverr management talked about its expectation for continued strength and an elevated spend level that will be sustained well into the future.  The platform saw its most ever monthly app downloads in March 2021, reaching 215,000 downloads from US app stores (+57% YoY).  US monthly active users grew 40% YoY in March 2021, representing Fiverr’s highest ever monthly growth rate.

The Fiverr app is currently ranked 31st in “Business” on Apple’s app store and 22nd on Google Play.  When I covered Fiverr on November 20, 2020, the app had a ranking of 39th in “Business” on Apple’s app store and 26th on Google Play.  This data indicates that we are seeing continued strength from Fiverr’s platform into mid-May, even as over 32% of the US population is now fully vaccinated and over 45% of the population has received at least one dose.       

We continue to see evidence that Fiverr’s platform is performing better than ever as lockdowns ease.  Global internet and engagement trends from Alexa show Fiverr’s site currently ranks 139th in traffic and engagement over the past 90 days.   


Source: Alexa

Fiverr’s ranking has improved 79 spots from mid-February, and is currently sitting at peak traffic levels.   

Over the last 6 months, total visits to Fiverr have trended upwards and the platform is currently near peak levels with 60.6M average daily visits (+3% from 11/20).  Fiverr ranks 530th globally in total visits according to SimilarWeb.    

Source: SimilarWeb   

In comparison to my coverage of Fiverr in November 2020, we continue to see evidence of increased usage and engagement.  The trends towards adaptation of remote work and shifting businesses online are examples of lasting changes brought about by the Covid-19 pandemic.  A key component of the “New Economy” includes more remote and flexible work, where Fiverr continues to show it will be a key beneficiary.

Valuation

FVRR stock has historically commanded a premium valuation as the company has an exceptional revenue growth rate, 84.1% gross margins, and is already profitable on the bottom line.  FVRR stock currently trades at 16.0x EV/NTM revenue after reaching a peak valuation of above 40x EV/NTM revenue in early 2021. 

The sell off in high multiple stocks has hit FVRR hard and the stock is over 50% off all-time-high prices of $336.  16.0x EV/NTM revenue is the lowest forward valuation FVRR stock has traded at in the last 9 months.     

Conclusion

We are unlikely to see a triple digit revenue growth rate again from Fiverr as the company now faces tougher comps. But consensus projections show expectations of 62% YoY growth in 2021 and a 40% revenue CAGR over the next 3 years.  Analysts are also expecting tremendous growth on the bottom line as Fiverr ramps up profitability, with consensus projections for EPS of $2.09 in FY 2023 compared to the $0.29 FY 2020 EPS Fiverr just announced.        

When the value rotation eventually ends and we see a rotation back to high growth tech stocks, FVRR is one of the stocks poised to benefit the most.  We are looking for signs of high-level business performance during the indiscriminate selling in tech, and Fiverr continues to show why its business is performing better than ever. 

Disclosure: I am long FVRR; I/O Fund is long FVRR

Earnings Update: TWLO, DDOG, MGNI and ROKU

If you want to see Knox’s recent thoughts on the market, please click here. He wrote out a long explanation on the forum as to what he’s seeing and correlates this to inter-market analysis, including money flow, breadth and sector rotations.

Below, I discuss TWLO, DDOG, MGNI and ROKU. We review what was pertinent from the earnings reports. Our thesis has not changed on these 4 companies.

Also, I have a LTBH webinar planned for next Monday to go over the IDFA changes from Apple with a highlight on Magnite and also Roku. We will briefly touch base on all ad-tech stocks we own and IDFA but this is mainly a CTV ads webinar from the product perspective. I’ll send instructions on the LTBH webinar mid-week.

Last but not least, if you have not transitioned over to the new website io-fund.com, please do so soon. You will need to set a new password. The Beth.Technology password will not work on the new site. You must also use the same email address you signed up with. We are redirecting the URLs on Beth.Technology this week in anticipation of our forum launching next week. Our old site will be archived and new content will not be published starting 5/13. Thank you! J

Twilio:

We recently had our second LTBH webinar on Twilio. I thought it was important to highlight this company for the important pivot taking place. In the webinar, we stressed the first-party customer data platform and why this was an important strategic approach for a company that has PII from phone numbers in its core product and PII from emails from the SendGrid acquisition. The vehicle to maximize Twilio’s position is Segment, and the company is showing us very clearly the future for by separating R&D into three departments and placing the former CEO of Segment in charge of two of those departments.

The earnings call also communicated the importance of Segment with management stating two-thirds of their sales calls centered around this product. There was an analyst on the call who nearly verbatim discussed what we talked about on our webinar. I find management’s response encouraging as to the accuracy of our thesis (and, I guess good to know that Alex Zukin shares in this exact thesis).

Alex ZukinAlex Zukin

That makes perfect sense. And then another again kind of big picture question, if you think about the rise of IDFA, the demise of – potential demise of third party cookies, it's our thesis that we're entering the world where the notion of CDP for first-party data is going to rapidly accelerate in strategic performance.

You guys mentioned – I think George you mentioned that Segment is now in two thirds or was in two thirds of your customer conversations. I guess a couple of angles around this question. Is this something – is this future world something you contemplated when making that acquisition? Are you, you know just now reaping even greater amount of strategic benefit? Just talk to us about how you think about segments in this new world, both integrated with the rest of your solutions as part of the platform, but also on a stand-alone basis with respect to Strategic impact to all these things.

Jeff LawsonJeff Lawson

This is Jeff. I'll answer, unless George, you want to?

George HuGeorge Hu

Go ahead, Jeff. I'll chime in.

Jeff LawsonJeff Lawson

Well, I'll give my point of view and I'll let George give his point of view. You know collaboration is the answer and is harder in this virtual world.

My point of view is yes, you know we did think about the importance of first party data and how every company is having to become great digital marketers and great digital executors, and you can't necessarily rely on some of the, let's say, sloppier ways of acquiring and re-engaging your customers when you've got a lot of third party data floating around that. So we did believe – we do believe that the CDP market in and of itself as a standalone becomes ever more important to companies, not just because of the plurality of systems you have to figure out how to make sense of, but also because outside their walls it's getting more complex to actually target and reach your own customers.So it becomes even more important that once you meet a customer, so there's your marketing and they buy something or whatever it is, you do a really good job of continually engaging them, because going back out to kind of reacquire that customer is getting harder and harder and harder. And so companies have to treat their existing customers incredibly well, and those relationships are getting even more valuable. And then you add in all the value of – and then integrating that and creating that journey that's going to achieve that using Twilio's customer engagement cloud, that is the next level of benefit on top of the core CDP.

Twilio grew revenue 62% year-over-year for $590 million and guided for $596 million next quarter, or 49% year-over-year at the midpoint. This represents a 4% raise above consensus estimates of $579 million, according to FactSet.

Adjusted EPS came in at $0.05, or $0.15 ahead of estimates. Active customer accounts totaled 235,000 at the end of the Q1 compared to 190,000 in 2020, representing 24% growth YoY.  Dollar-based net expansion rate came in at 133% for the quarter compared to an organic DBNER of 135% in Q1 of 2020.  Gross margins were 55% for the quarter and the company recorded a -2% free cash flow margin.    

The blemish on the report was Twilio’s forward EPS as the company guided for adjusted losses of $0.14 per share compared to analyst expectations of adjusted losses of 4 cents per share. We posted on the forum that this does not concern us as the company had planned investments that did not materialize in 2020 due to Covid. These investments are focused on enterprise sales, flex and new growth products, plus core systems and infrastructure. Twilio management expects these investments to generate losses in the short term, but in the long term it will allow the company to grow at elevated levels.

Additional Research:

Twilio 2021 PDF here

Twilio 2019 PDF here

Datadog:

Datadog allows us exposure to the market that AWS, Azure and Google Cloud participates in but with a pureplay. If the tech giants are communicating that cloud infrastructure-as-a-service is one of the most critical markets in the future, then who are we to argue with this by not investing in the leader across cloud monitoring products?

The company capitalizes on the trend that vendor-specific is becoming unpopular due to issues that vendor lock-in creates. On the flip side, the company competes with open-source options, such as OpenTelemetry.

Here is what the company stated as to why customers choose Datadog in light of many competitors: “We lean into open-source format and libraries to instrument obligations for a very long time. And we support a large number of them. The way we see the problem is not like what matters is not with technology we use to get from here to there. What matters is to solve the end-to-end problem for our customers. And to make it as easy as possible for them to just plug us in and everything just work everything to show that we don’t get our mess, a gigantic mess with all these different technologies and applications and clouds, everything else. We turn that into something that the understanding is well ordered, without any effort.”What matters is to solve the end-to-end problem for our customers. And to make it as easy as possible for them to just plug us in and everything just work everything to show that we don’t get our mess, a gigantic mess with all these different technologies and applications and clouds, everything else. We turn that into something that the understanding is well ordered, without any effort.”

Datadog deserves an updated LTBH report as the product has evolved since we last covered the company with the acquisition of Sqreen. Keep an eye out for this after we get through cloud earnings.

I had said on a Motley Fool podcast in February that we faced a unique environment for cloud stocks this year with a tight pack of cloud stocks guiding between 20-30% and then another tight pack guiding between 30-40% on forward growth. Only Snowflake and Kingsoft Cloud were guiding higher than 50%. We provided a chart here. This is unusual as cloud guidance usually tells us our leaders in advance. Tougher comps from last year require cloud companies to show endurance and prove that any growth last year was not a pull forward from the one-time event of Covid.

You can view my explanation of cloud valuations going into 2021 here at minute 2:15 – YouTube linkYouTube link

What we want to see are cloud companies breaking through the ceiling of 40% growth. That is exactly what Datadog did this quarter and also provided >40% guidance for next quarter and full-year guidance, as well.

Notably, the tone on the earnings call was that their guidance is conservative in light of many unknowns. I can’t guarantee this but I’m hoping to see Datadog come in above guidance in the future, per comments like this: “Now, some notes on our guidance, while usage growth was strong in Q1, when providing guidance as usual, we use more conservative assumptions.”, we use more conservative assumptions.”

The company grew revenue 51% YoY to $198.5M, representing a 6% beat above consensus estimates.  Management attributed the revenue beat in Q1 to stronger than expected usage growth from existing customers. On the bottom line, EPS came in at $0.06, topping consensus estimates by $0.03.  The company logged a record EBITDA total of $24M in the quarter and free cash flow of $44M (22% FCF Margin). 

Customers with $100K+ ARR totaled 1,437 at the end of Q1, representing growth of 50% YoY.  These customers generate over 75% of Datadog’s ARR.


Additionally, Datadog announced that 75% of its customers are using two or more products at the end of Q1.  This is up from 63% in Q1 of 2020. 

For Q2, Datadog guided for $212M of revenue, or 51% year-over-year at the midpoint, beating the consensus estimate by 8%. The company is expecting $0.03 of EPS and $10M of operating income in Q2. 

For the FY21, DDOG raised revenue guidance to $885M, or 47% year-over-year at the midpoint, and 6% above consensus estimates. The company is expecting EPS of $0.15 and operating income of $50M for the full year.             

I touch on Datadog here around minute 53:00 – click here for YouTube link

Additional Research:
Datadog Premium Research
H1 2021 Cloud Software Update

Magnite:

We laid out our thoughts here on Magnite and our conviction and thesis remains the same. We go over why Magnite’s Q1 report came in weaker than expected and why we aren’t concerned as management has provided enough statements Q2’s guidance being stronger than expected. We take short-term misses as long as guidance remains strong and the story is intact.

Per my post on the forum, I do believe some of the weakness we saw in ad-tech today is due to IDFA changes from the April 30th iOS update. There was a report from Flurry, as reported by Mashable, over the weekend that stated “only 4 percent of iOS users in the United States let apps track them.” Here’s the full post from Flurry. I believe this partly caused the weakness today in TTD, MGNI, Unity plus other ad-tech companies as there is a lot of confusion in regards to IDFA.

On one hand, we have companies like Unity saying it’ll impact low single digits for their revenue, and on the other hand we see sensational comments from mobile analysts that this is an Apocalypse and “Book of Revelation” stuff  

I’ve been covering the IDFA specifically since October of 2019 after attending Advertising Week and I followed up again in 2020 with free version here. I also covered Facebook’s tracking behaviors in-depth for public investors around Q1 2018, when I criticized the company for not talking about Audience Network in their earnings calls (the IDFA threatens Facebook’s Audience Network the most). 

As the lead technology analyst at the I/O Fund, I made sure my readers were up to speed on the IDFA, such as the July 2020 Update and also here when I first covered Magnite

With that said, I don’t think information is easily accessible to public investors on this topic, and meanwhile, iOS 14.5 rolled out at the end of April. Therefore, seeing the reaction to Magnite and The Trade Desk today, Citi’s downgrade, and Flurry’s report, I think it makes sense to have our next LTBH webinar on the IDFA this Monday with a primary focus on Magnite and Roku but we will touch on other ad-tech stocks we own too (Unity, Snap, Pinterest, etcetera).

The summary of my thoughts can be found in the links above if you want the information before Monday. Similar to the tide of all boats, I believe we will see the supply side come out better than the demand side – but that’s my personal opinion and the way that we’ve structured I/O Fund with our positions. I’ll present the information from a product perspective and you can make your own conclusions when we review this on Monday.

Although I don’t think it will be Apocalypse, I do believe it will affect the ad industry enough that we should do the next LTBH webinar on this topic. We will dive deeper into Magnite and Roku, as well.

Magnite’s Earnings:

I had said that Magnite is not the “shiniest company to analyze if you’re a financial analyst” and this earnings report validated that statement. There have been two acquisitions and a major rebranding, so what we really have is really three companies reporting earnings: Telaria, Rubicon and SpotX.

Magnite reported revenue growth of 67%, up 18% on a pro-forma basis. CTV revenue was up 32% on a pro-forma basis or $12 million. Compare this to last quarter’s report which was 69% revenue growth, up 20% on a pro-forma basis, with CTV revenue up 53% on a pro-forma basis, or $15.4 million. Therefore, Q1 was meaningfully weaker than Q4 on CTV (more on this below).

The company was profitable on an adjusted basis at $0.03 EPS compared to a loss of $0.06 EPS in the year-ago quarter.

SpotX results showed considerable strength on CTV with overall revenue excluding traffic acquisition costs of $31.2 million. CTV revenue was at $19.7 million, up 70% year-over-year.

Management is guiding for revenue of $94 million with CTV revenue of $32 million, at the midpoint. This represents 90% growth if the company had closed the acquisition on SpotX on April 1st rather than April 30th. The company raised its long-term revenue targets from 20% to 25% and had raised long-term adjusted EBITDA targets to 30% to 35% in the last quarter.

This comment here provides color for the weaker-than-expected CTV revenue:

Yes, so I think, March was a bit of a disappointment for us at Magnite. I think if you look at the combined company going forward, you're just going to have a greater line of CTV products that each kind of address a different sliver of the marketplace. We talked a bit about the SpotX managed service business, which was able to extract linear dollars into CTV capability that we did not build out at Magnite, but saw as something incredibly attractive in its products, along with a few other products. But as we said, severe acceleration in Q2 for Magnite's business, and if you look at the two combined, you're 90% plus growth range for Q2. So, so all is well there.which was able to extract linear dollars into CTV capability that we did not build out at Magnite, but saw as something incredibly attractive in its products, along with a few other products. But as we said, severe acceleration in Q2 for Magnite's business, and if you look at the two combined, you're 90% plus growth range for Q2. So, so all is well there.

Another analyst also asked about March, which management provided this answer:

Suffice to say, Magnite is growing in terms of — its back to where we always thought it would be and then some. So, I think that this isn't a case of — in q2, particularly SpotX coming in and saving the show, if you will, I think both are growing exceptionally well. And any kind of slowdown that we witness in Magnite in March has been more than made up for, but David, do you have any more color to bring to that?its back to where we always thought it would be and then some. So, I think that this isn't a case of — in q2, particularly SpotX coming in and saving the show, if you will, I think both are growing exceptionally well. And any kind of slowdown that we witness in Magnite in March has been more than made up for, but David, do you have any more color to bring to that?

And there was yet another question about the weaker guidance in March. Management stressed how early in the cycle the Connected TV market is and how some inventory is still being sold direct versus programmatic.

So, I think that there's in any kind of nascent marketplace and CTV is certainly nascent … I would say that Q2 is behaving what in excess of what we would have thought going into it, and that Q1 was strong going in, and then had a weaker March. And, again, probably a handful of reasons there, but nothing systemic or anything that takes the bloom off the rose in terms of our position in CTV or the attractiveness of that marketplace.

As I said, we are comfortable with short-term misses as long as the story is intact and guidance remains strong. There was also more to the earnings call in terms of IDFA, which we will unpack during the upcoming webinar on Monday.

Past Magnite Research here

Roku:

I’ve written a library of research about this company from very early-on. If you want more information as to how we arrived here, I encourage you to read my analysis as it dates back to a time when the market doubted Roku and we withstood two 60% drawdowns.

On that note, Roku is the perfect example of how long it takes for a trend to play out. While many investors are conditioned for instant gratification following last year, we know that tech trends are a 3-5 year exit or longer. In the meantime, our job is to make sure a company is consistently reporting along the thesis we’ve laid out.

Here’s what I want to emphasize: the 3-5 year investment period for Roku begins this year. If someone were to learn about Roku for the first time today, I’d say they’re right on time. In fact, there is less risk now as Roku is a mature and consistent performer. As an analyst, I’m on cruise control with this stock as it’s been performing as we laid out nearly three years ago.

Rarely, do we get a full-stack opportunity that is centered in the middle of a future trend. It’s my belief that Apple’s IDFA deprecation will positively impact Roku – and I hope a few others we have picked out too.

That’s what my library of research answered through the past few years. We will touch on this in the upcoming webinar, as well. The simple answer is Roku delivers the targeting capabilities of mobile with the completion rates of Pay TV. This was outlined in May of 2018.

“For example, according to Nielsen in March, ratings, linear TV ratings for adults 18 to 24 was down 22%. Q1 TV ad spending was down 11% and according to Media Radar. Meanwhile, we doubled, monetized video ad impressions on the platform, ad spending by major agency holding companies with Roku more than doubled. We saw strength really up and down the ad business.”linear TV ratings for adults 18 to 24 was down 22%. Q1 TV ad spending was down 11% and according to Media Radar. Meanwhile, we doubled, monetized video ad impressions on the platform, ad spending by major agency holding companies with Roku more than doubled. We saw strength really up and down the ad business.”

Since my coverage began, Roku has become an even bigger force in the Connected TV ad space. OneView is Roku’s move into the demand side while The Roku Channel provides original content to optimize ad formats.

This sums up some of Roku’s strength competitively speaking:

I will say that the use of OneView to buy media on Roku, whether that's media we're selling, for example, a video ad that runs in The Roku Channel or an ad bought from a publisher on Roku through one year. That segment is growing even faster because, of course, we have data and identity and optimization capabilities to help them do that better than were they to buy through a third-party DSP.we have data and identity and optimization capabilities to help them do that better than were they to buy through a third-party DSP.

And also here …

“The second part of your question was about volume and CPMs. Our product remains a premium product. If anything, we've added, better data, better targeting, better measurement, newer ad products over time. And I think that, that bodes well for continuing to be able to command premium CPMs, but I will also call out to the earlier question from Ralph that streaming is increasingly also a performance media.”we've added, better data, better targeting, better measurement, newer ad products over time. And I think that, that bodes well for continuing to be able to command premium CPMs, but I will also call out to the earlier question from Ralph that streaming is increasingly also a performance media.”

Roku also recently acquired Nielsen’s advanced video advertising business and is expected to close in Q2 2021. The automatic content recognition and dynamic ad insertion will help Roku show different ads to different households based on Nielsen data.

We’ve written quite a bit on Roku and I hesitate to spend more time on the company when we have other stocks we are forming a thesis on and/or need a reiteration of our conviction. However, that should not be confused for lack of conviction by any means as Roku has received my highest conviction for some time and continues to.

Here’s a clip we created of me explaining Roku in October of last year – view on YouTube here.

Roku and The Trade Desk: 2019 Analysis
Roku Update & What’s Next in June
Disney+ Killing it on the App Store – Roku Downstream
Check-in: ROKU, TTD, BABA, UBER, TLRA, and upcoming 5G – Nov 6th
Checking in on Tech Trends and My Current Convictions – January 2020
The Crucial Difference Between Roku and Netflix
Q4 Earnings Analysis for Shopify, Roku, Fiverr And Palantir

On Earnings …

Roku delivered excellent Q1 results on May 6th led by strong growth in advertising and the expansion of content distribution partnerships. Total revenue grew 79% YoY to $574.2M, representing a 17% beat above consensus estimates. 

The growth was led by platform revenue, which increased 101% YoY to $466.5M. Gross profit rose 132% YoY to $326.8M while operating income came in at $75.8M after negative operating income $55.2M in the year-ago quarter. 

Roku also announced positive EBITDA of $125.9M in Q1 from a loss of $16.3M in the year-ago quarter. Roku added 2.4M active accounts in Q1 to reach 53.6M in total, representing 35% growth YoY. 

Streaming Hours increased 49% YoY to 18.3 billion, while average revenue per user (ARPU) grew 32% YoY to $32.14. 

For Q2, Roku management is guiding for $615M of revenue at the midpoint (73% YoY growth), representing a 13% raise above consensus estimates. The company is also guiding for total gross profit to rise 104% YoY to $300M and EBITDA of $65M after recording negative EBITDA of $3M in Q2 ’20.