Snap: Bad Management Team … & WTH is Really Going On.

I couldn’t be more disappointed with Snap’s management. Not only the lack of guidance but the lack of willingness to describe exactly what the issue is with their business.  

In the call, the management said they are seeing 9% growth to-date this quarter yet are modeling revenue to be flat year-over-year. This is an absurd comment to not substantiate. Why would August be 8% growth, October 9% growth and the holiday season be negative growth, which in turn weighs on October’s progress? I’m not sure which is worse, was this a flippant comment they made and we will see 9% or higher growth come next quarter? Or, are they really seeing such a serious headwind that November and December will greatly decelerate? I believe I have identified the serious headwind with no help from Snap’s management team, which I detail below. 

Here is one comment that was made on the call regarding the expected revenue deceleration during the holiday season:

“By the end of August, when we shared 8-K about the restructuring, the quarter-to-date revenue had improved to about 8%, and so that implied things accelerated a bit. With the full quarter number at 6% this quarter, obviously, things slowed down into about the low single digits in September, so. And then we’ve seen things move up a bit in the beginning of this quarter with the early weeks being at about 9%.”

Here they try to spin the December quarter:

“It’s Derek speaking. I’ll take the first part of that and then hand it up to Evan. I think first, just stepping back for context on Q4. Even flattish year-over-year revenue growth is about a 15% step-up on a quarter-over-quarter basis. So, we are expecting revenue to grow seasonally at a pretty good clip. So, the issue that we’re seeing here is that if you look back to a year ago, we grew at over 40% year-over-year in the prior year. And many of the really significant macro impacts that we’ve seen over the course of this year weren’t impacting the business nearly as much as they were a year ago.”

To add to the absurdity, they have relied on excuses such as Ukraine, macro for brand advertisers or Apple’s changes. This doesn’t explain why November and December would weigh on October as both are consistent (not variables) throughout Oct-Dec.

Here, an analyst calls out that it doesn’t totally add up:

“Just on the brand side. I think many are curious kind of why brand will suffer so hard going into a seasonally strong period. Is this more macro-related? Is it — given some of the restructuring, is that having some impact?”

This was the answer, which was not a good one: “And certainly, with the performance that we saw from the brand portion of the advertising business in Q3 gives the — sort of informs our expectation of the decel to move through the rest of the quarter.”

So, I’m sitting here wondering why a 19% DAU growth isn’t translating to higher revenue growth and trying to sift through the garbage being stated on the call. Following strong DAU growth for many quarters, management is providing a 6% growth rate this quarter and “maybe” a 9% growth or “maybe” a 0% growth rate. Something is very wrong here.

Furthermore, how can the 19% DAU growth not give them more confidence in terms of the revenue they can drive next quarter?

Because I’ve worked around mobile global UA, I believe the answer to this question is that Rest of World user growth greatly weighs on this company’s business model. This is the only true explanation that makes sense to me. If the majority of the user growth is in the $0.90 ARPU to $1.00 ARPU, then this is going to pull down revenue. This also means that next quarter — even with strong DAU growth — the company cannot accurately guide because ROW cannot monetize high enough to support YoY growth.

I pointed this out in the analysis here for our Re-Entry when I stated: "My interpretation is that DAU will outpace revenue growth because DAU growth will come from Rest of World where users are monetized at a lower rate than North America and Europe. This has been the trend over the past year in Snap’s key metrics."

It’s one thing to have advertiser falloff and softer ARPU in North America in the $8.00 ARPU range (which you’ll see below has not occurred!!) and another thing to have even nominal falloff in a region that is at the $1.00 ARPU range, because the majority of the user growth is occurring here, then it only requires small decimal points to drag down overall ARPU quickly.

My regret is believing management when they said it was “platform changes” or “Apple’s ATT” or “macro headwinds. Excuse my language in this write-up, but instead here is the total garbage investors were offered:

“Operationally, our advertising business has become a lot more technically complex over the past few years as advertisers are working to better measure and optimize their campaigns. That means that we need to drive increased coordination across our sales, engineering and product teams, which is one of the reasons I’m so excited to have Jerry leading these teams as our COO. I’ve already observed a significant change in the way that our teams are working together, and I’m really pleased to see the focus on our advertising customers driving everything that they do […] We saw about an 8% increase in impressions year-over-year in the quarter, which is really a function of daily active users and engagements.”

My note: again, this doesn’t address why there would be a deceleration in Nov/Dec and why they can’t guide. The company had 19% DAU growth and 8% growth in impressions and they can’t give a guide? Very strange.

They said eyeballs are doing well again:

“So, at a very high level, both in the U.S. and globally, viewership is up. And so that means that our overall opportunity is expanding if we can continue to increase folks’ depth of engagement. And that’s really important, of course, for advertisers who really value the reach that we provide.”

Here’s a question where Snap could have been more forthright:

“Ross Sandler:

I just wanted to throw the macro question out. So, it sounds like it’s mostly brand advertising that was weak in 3Q, and it seems like that’s the area that’s forecasted to really drop off as we kind of go forward here in 4Q. So, could you just maybe elaborate a little bit on what you’re seeing? What’s — we can obviously see what’s going on with the macro broadly, but specifically to like rest of this quarter, what commitments you’re looking at that would cause those growth rates to kind of dip into the negative?

And then, related to one of the prior questions, you’re growing your DAUs almost 20% and impressions 8%. So, it seems like we’ve just got a demand problem here, not a supply problem. Can you just talk to that a little bit? Thank you.”

I’ll save you the answer they gave which was evasive and focused on “restructuring, “advertisers can turn performance based advertising off very quickly” and “future of AR”

There were moments where they brought up EMEA and APAC, but this was buried and not discussed as a direct answer to the issue:

“And the third thing is bringing top talent to our three president roles for the Americas, APAC and EMEA. One of them Ronan Harris is going to join us next week. This will ensure that we’re improving our focus on customers in every region and getting closer to the customers’ needs. I think these priorities will set Snap up to be successful in this current environment.”

And then again, it was their last comment before closing the call:

“I think one thing I’m watching specifically is on the sales side. We’ve got these president roles. Ronan Harris is joining a bit later this month as our President of EMEA. We will also have an APAC President and an Americas President, and we’ll be putting folks into those roles as soon as we can. And in addition to that, we’re also thinking about how to better organize our sales teams to go to market in a way that best serves our customers. And we’re sort of thinking about Q1 as the time line for that.”

Yet, if this is what’s going on — and it’s my speculation that it is — the management did nothing to connect these dots and continues to rely on many other trivial excuses that don’t add up to the 6 month variability we are seeing (July-Dec).

I believe they are not connecting the dots because it signals something systemic (not that it matters given the severity of the selloff – they could have not shown up to the earnings call and the stock would probably be doing better today).

It’s systemic because the very regions they can grow DAU will, in turn, weigh on their revenue.

I’ve noted the ROW could be a concern in our previous write-ups, but now that I’ve gotten more information on just how disconnected DAU growth is from revenue growth in Q3, and now in Q4, I feel fairly confident we are looking at company struggling to keep up with previous ARPU that had a higher mix of North America and European growth.

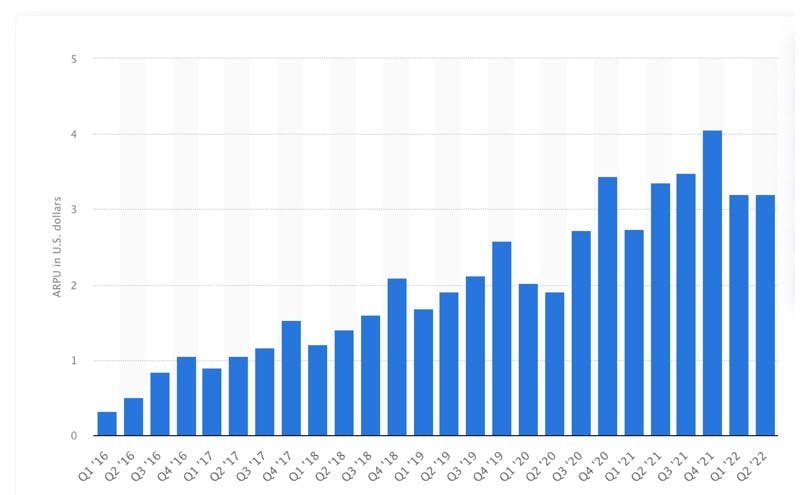
Below is Snap’s overall ARPU. Quick glance shows that it’s declining YoY for Q2. It declined again for Q3 Average revenue per user was $3.11 in Q3 2022, compared to $3.49 in Q3 2021 (not pictured below).
In fact, we can see further evidence of this as ROW declined (9%) and North America only declined (1%).
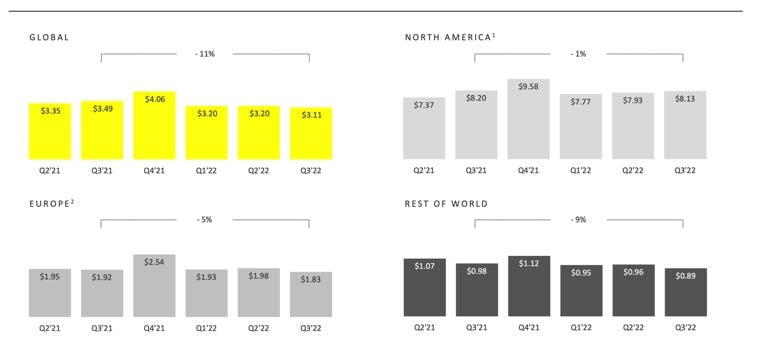
This makes my bullshit detector go off even more with the Apple excuse because iPhones are not used in ROW regions, instead these regions primarily use Android. Android has not gone through the privacy changes (yet) that Apple has.

If Apple was the issue, North America would have fallen off in ARPU by more than (1%) bc this is the highest concentration of iPhone users. Europe’s (5%) also contributes but the Apple excuse is debunked bc Q3 2021 was when these changes occurred and the YoY would be more drastic in North America if Apple was contributing.

If we look at Q2, another big miss in the earnings report, we see the same pattern. North America was up 8% debunking the Apple issues and ROW is down (11%). This creates a (4%) drag on ARPU.
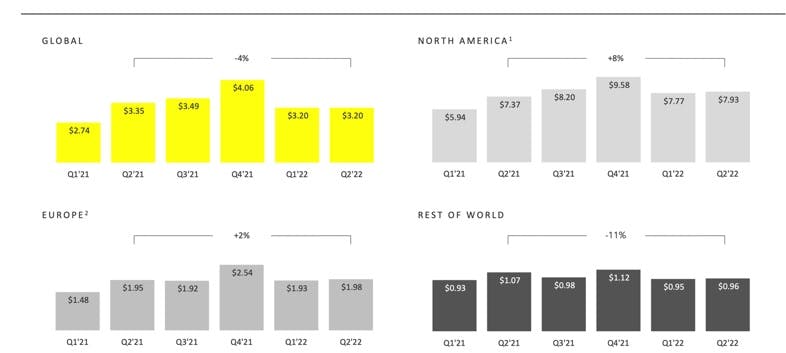
You can see the largest comp for ROW is approaching, which is Q4’s $1.12. All quarters have a high comp in Q4 but you can see the other regions have been doing a decent job of keeping pace.

On a side note, the company states Russia falls within Europe revenue, so the (9%) in the $1.00 region is also not satisfied by the Russia-Ukraine war excuse. Europe (the Ukraine region) up 2% last quarter in Q2.  

So now, it starts to make sense that Snap is not confident about the holiday season as the drag is coming from ROW.

Obviously, I’m incredibly disappointed because the company used the Apple ATT excuse and my understanding is this should be something they can overcome as Snap does not use third party data.

On another note, I firmly believe the company is not selling off due to margins but rather the opaque issues with revenue. This company is going to become FCF positive between $1 billion to $1.5 billion next year and this is well understood. Scanning the analyst notes today, they were encouraged by the bottom line in the report. Not one mentioned ROW revenue, however, despite it’s clear decline in ARPU.

It’s easy to glance at the margins and draw a quick conclusion that the company is very unprofitable, but the well-publicized budget cuts across the board has resolved this issue for the most part.  

The market is forward-looking and as soon as next quarter, the shift toward profitability will begin. In fact, the company beat on the bottom line across the board on top of moving toward greatly improved operating income next year. If anything, this was a positive as market expected ($105) million FCF and company reported +$18 million FCF.

If it were the bottom line, it’d be much more straight forward. Instead, I feel the management is dodging the real issue as to why DAU growth does not translate to revenue growth. The longer the DAU strength continues and the longer the revenue weakness continues, the more of a red flag it has become.

Management is responsible for discussing the real issues with shareholders and ROW should have been directly called out in this earnings call and the previous earnings call.

Even worse, to have so many different storylines that don’t add up … Apple, Ukraine, Macro, Brand Ads – during the holidays nonetheless — supposed to get worse from Oct to Dec …? It simply doesn’t sit right.  

Conclusion:

I had posted this on the forum in the comments and it sums up my thoughts:

“Snap is pulling levers to not burn cash and will have a 20% FCF positive margin, maybe 25%, and this is well understood at this point. Some people point towards SBC which at $700M net (minus buybacks) is 14% of annual revenue. Not the worst I've seen — cloud is certainly much higher with some favorites in the 30% SBC range.

I believe it's the disconnect between user growth and revenue growth that is causing the selloff, and I think it's important to identify the issue bc Snap will be FCF positive moving forward around $1B to $1.5B — so will Snap's new cash profile (which is widely understood to show up in Q4 and beyond following the layoffs and the shutdown of ancillary products with one-time related costs recognized in Q3) fix the issue? If so, it's a buying opportunity.  

I don't think this is a buying opportunity bc what we have is a major disconnect on DAU growth from revenue growth. Why can't the company post a higher growth rate given the 19% DAU growth — usually audience precede revenue growth. If this isn't fixed and the FCF issues are fixed, it may still be problematic business model.” 

This write-up was intended to describe what I truly think the problem is with the business model, with no help from management. This correlation would have been much easier to see if Snap had not created many smoke screens to deter from the real issue.  

I believe institutional analysts are in the same boat, where Snap’s narrative and excuses has distracted them from looking more deeply at the issue. You can sense on the call, they can’t quite grasp it. It’s not terribly difficult to put together – it’s simply a matter of searching for it, which no one is doing because management is feeding so much garbage on the call.  

The conclusion is we are out of the stock with a serious and lingering concern about this management team.

 

Divergences Point Toward Market Moving Higher (Technical Analysis)

When we see divergences building, more times than not, it’s the warning sign of a trend change. We are seeing this now across bellwether stocks, varying sectors, and global markets. Many risk assets as well as global markets did not follow the S&P 500 (SPY) to new lows last week. Instead, they are signaling that a new push higher is likely to follow.

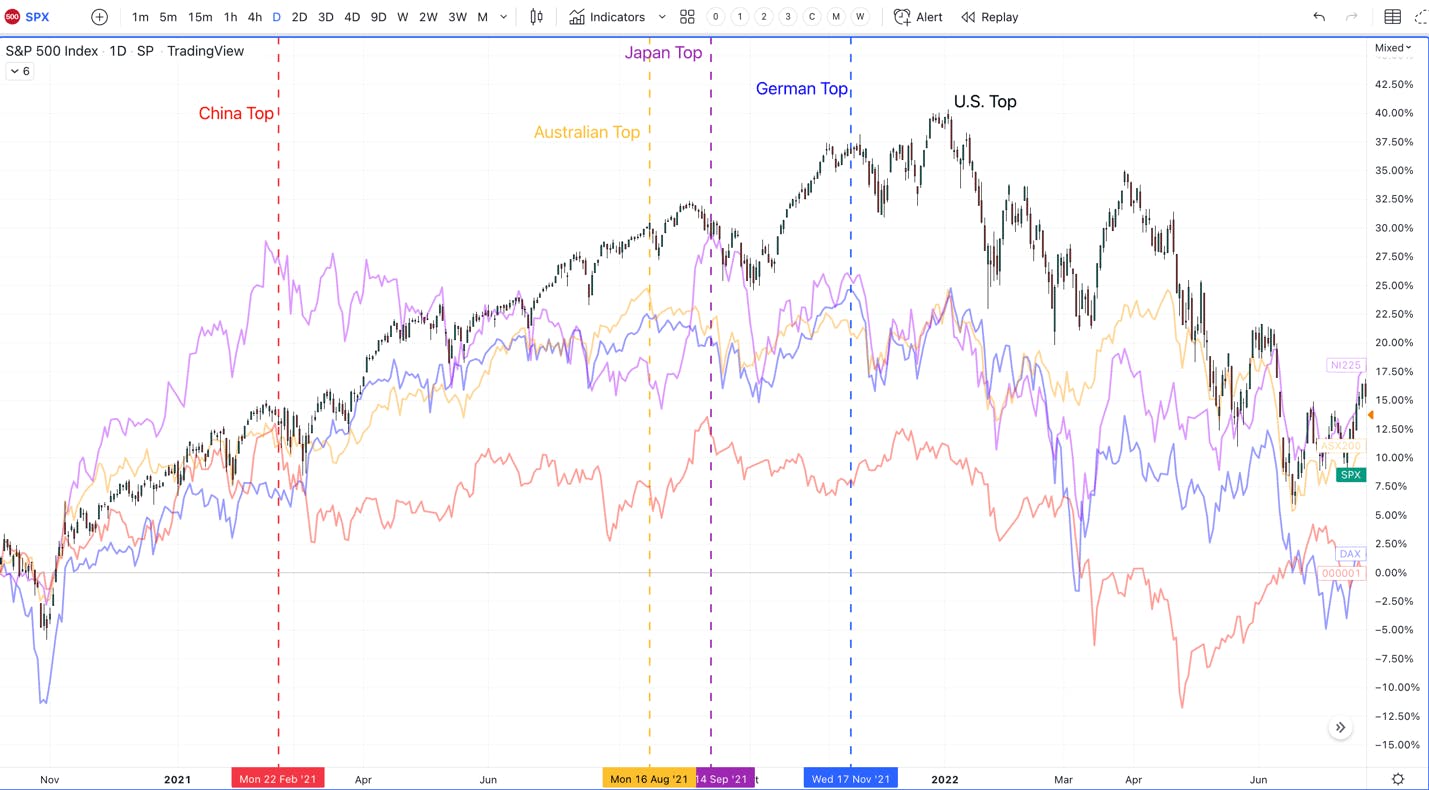
Divergences are important to track. There is always a leading market that can provide advanced warning that a top or bottom is ahead. For example, from the COVID low in 2020 through February of 2021, all major global indexes were moving up together. When you see an all-encompassing trend, it tends to be a powerful one, much like we saw into early 2021.

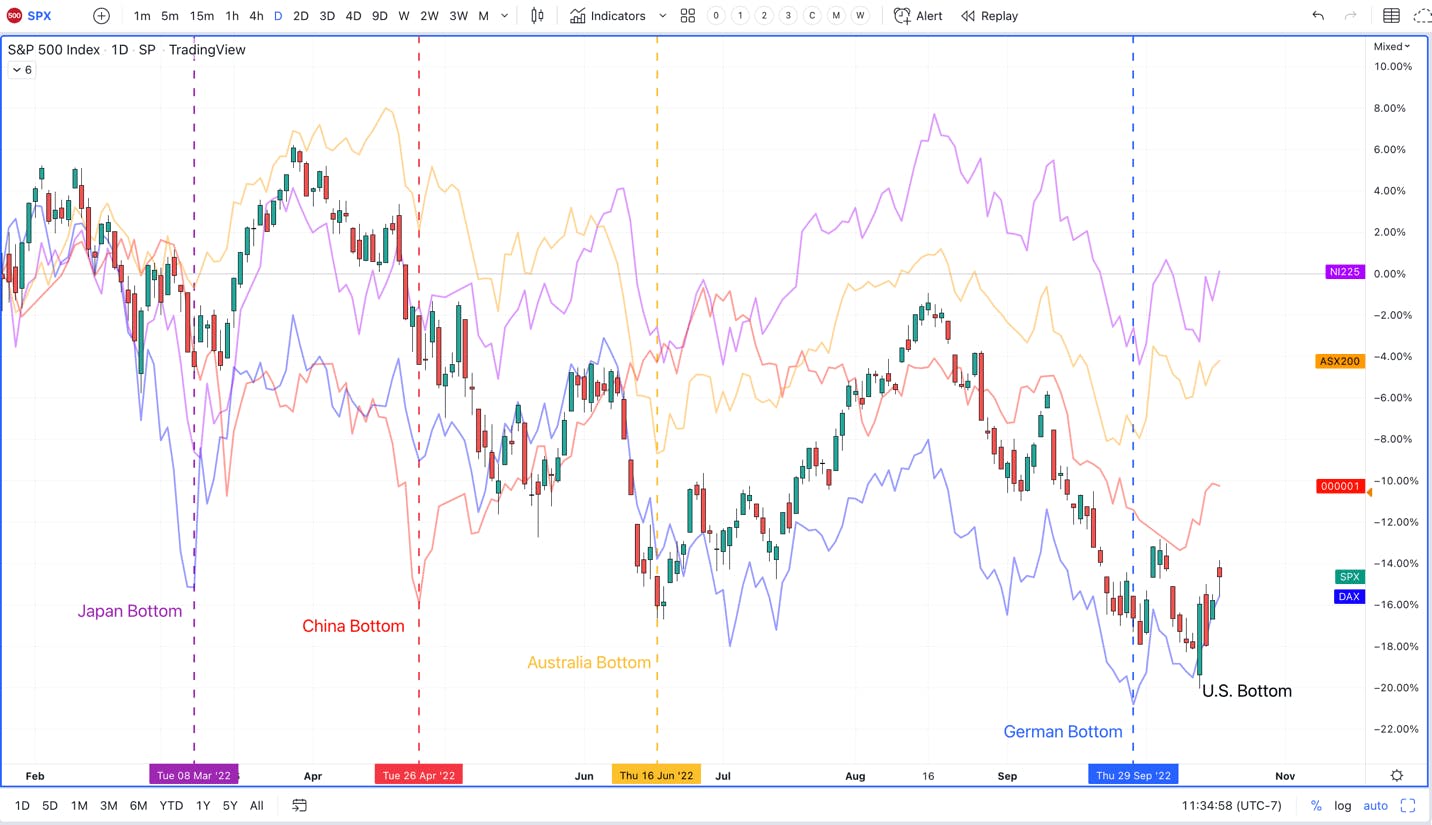
China then topped in late February and began making a series of lower highs, while the rest of the global market continued higher. One after the other – Australia, Japan, Germany, etc. – they all topped throughout 2021, while the U.S. markets continued higher. This was a warning sign that the first deep correction in the S&P 500 was imminent since the COVID lows.

S&P 500 daily chart

Source: I/O Fund

Today, we are seeing the same pattern play out, yet in reverse. Japanese markets bottomed in March, followed by China, Australia and now Germany.

S&P 500 chart showing pattern in reverse

Source: I/O Fund

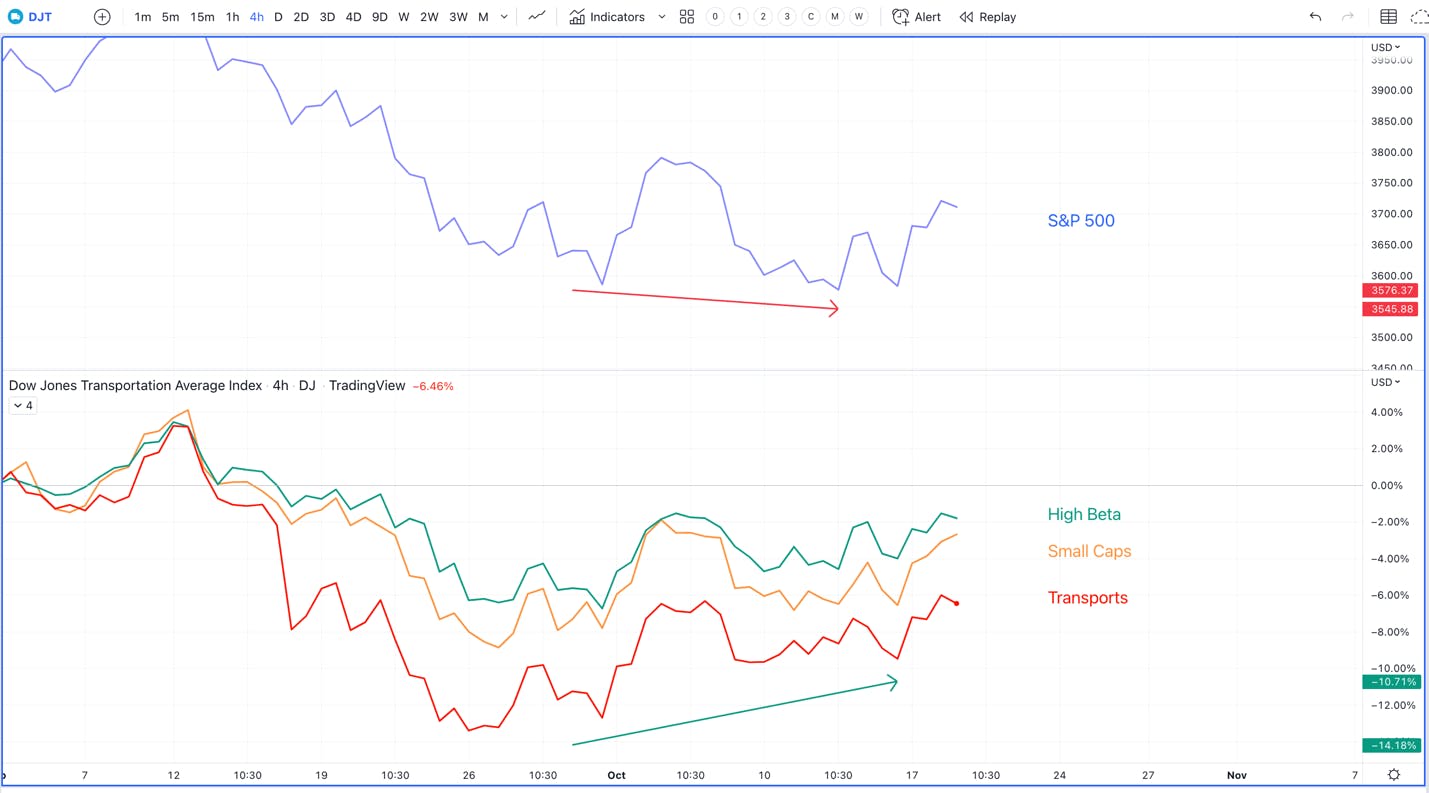
Furthermore, we are seeing multiple key sectors within the U.S. not follow the S&P 500 down to a new low last week. Transportation stocks, High Beta and Small Caps have been leading the markets since 2021, and last week, when the S&P 500 made a new low, these risk-on markets made a new high.

DJT chart with Transportation stocks, High Beta, and Small Caps

Source: I/O Fund

These types of patterns tend to signal a trend change is brewing. Nothing is guaranteed, but even if the market does drop to a new low, we will only see these divergences grow, setting up for a sharp rally into year-end. I do believe many stocks and some markets have bottomed, and those are the ones that tend to lead going into the next uptrend.

Sign up for I/O Fund's free newsletter with gains of up to 403% – Click hereSign up for I/O Fund's free newsletter with gains of up to 403% – Click hereClick here

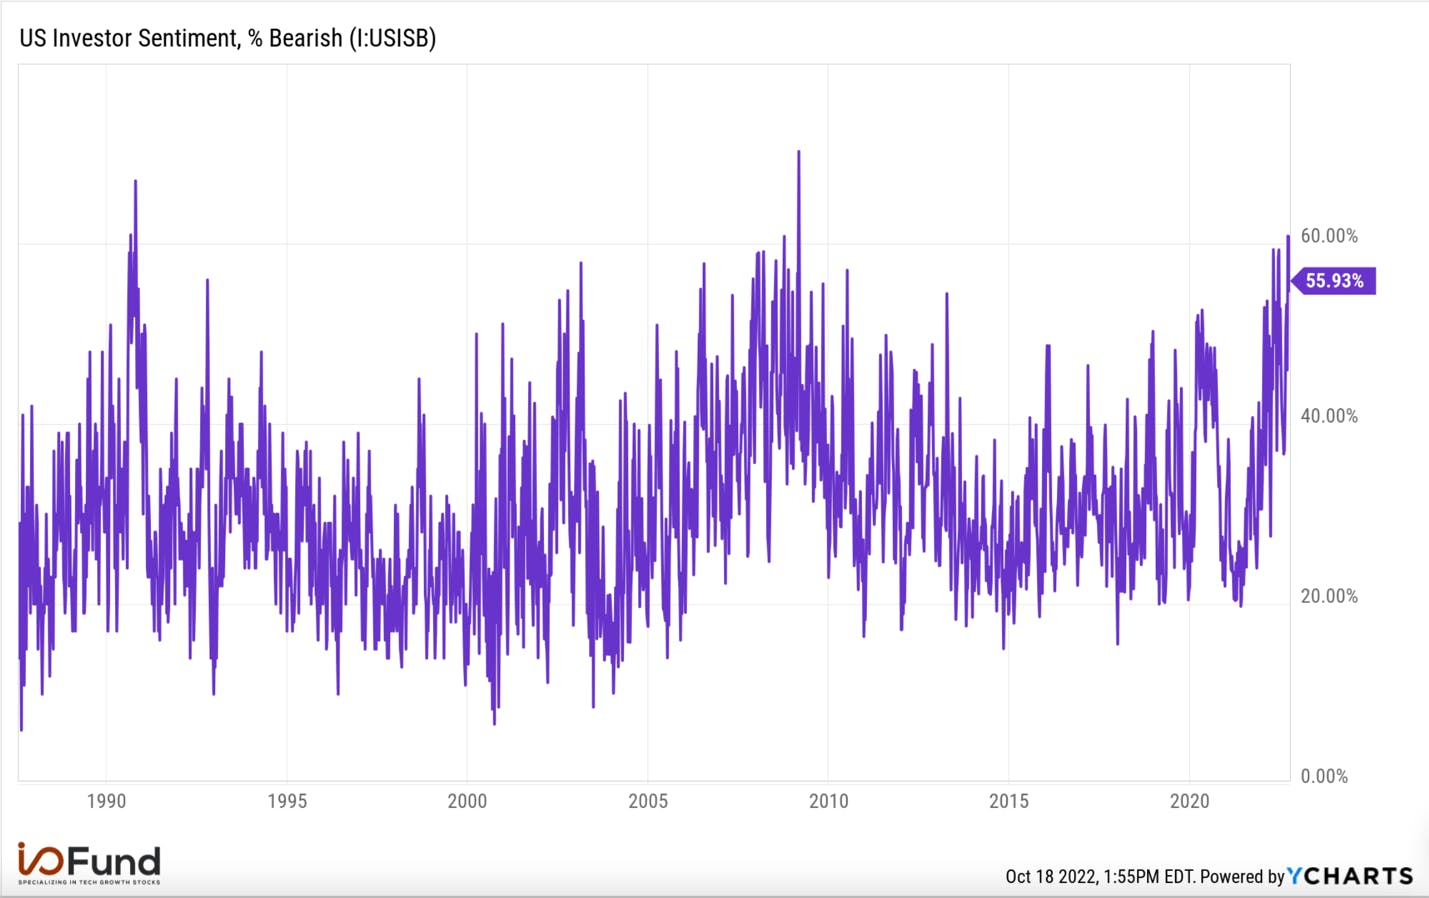
Recently, along with divergence patterns, we are seeing rare extremes in sentiment. For example, the AAII investor sentiment survey is a reasonable gauge on what retail is expecting 6 months out in the market. Last week we saw a reading of 60.87% of those surveyed had a bearish outlook on the markets over the next 6 months. For reference, the last time we saw a sentiment reading this low was nearly 2 weeks before the March low in 2009. It’s also one of the highest readings in bearish sentiment in the survey’s history.

US Investor Sentiment, % Bearish Chart

Source: I/O Fund

Even more important, this extreme sentiment was backed up by real dollars last week. According to Jason Goepfert of Sentiment Trader for the first time in history, retail traders bought over 3 times the amount of puts than calls last week.

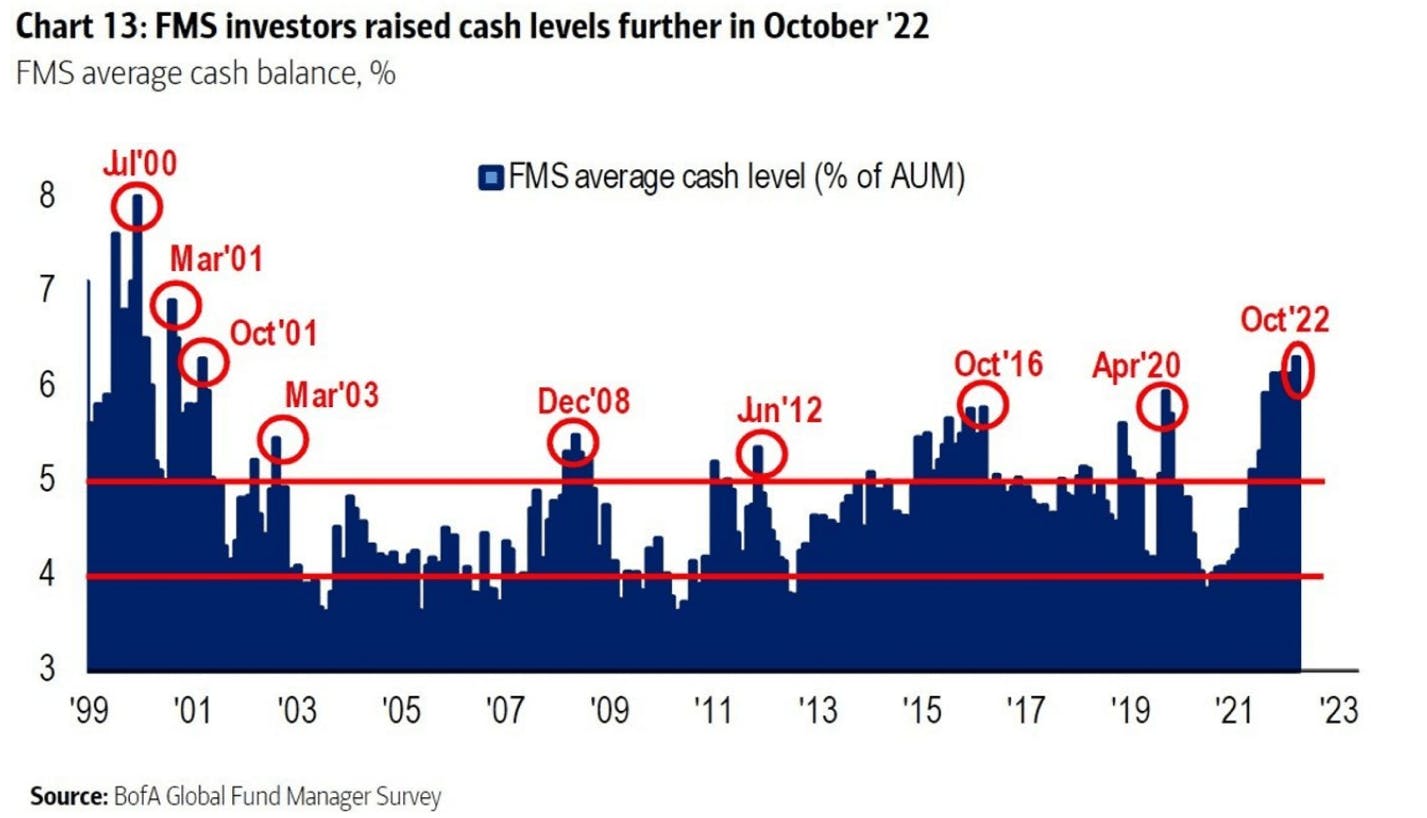
It’s not only retail that is scrambling to buy insurance for another low. Fund managers have taken their cash position to the highest in 21 years, exceeding all of 2008, 2009 and 2001.

Chart: FMS investors raised cash levels further in October 2022

Source: MarketWatch

Markets top with exuberance and bottom in despair. No one really knows if this is a bottom, but what is certain is that the level of despair and bearish bets have exceeded levels that have marked prior lows.

Where Will the Market Go Next

Two weeks ago, we provided succinct risk levels and also provided our expectation that the market looks like it wants to make at least one more low:

“If the coming bounce can break above 3800, then a major low is likely developing. However, once SPX pushes into 3730, the risk will be elevated, as the above structure does not look complete until we get at least into the 3550 range.”

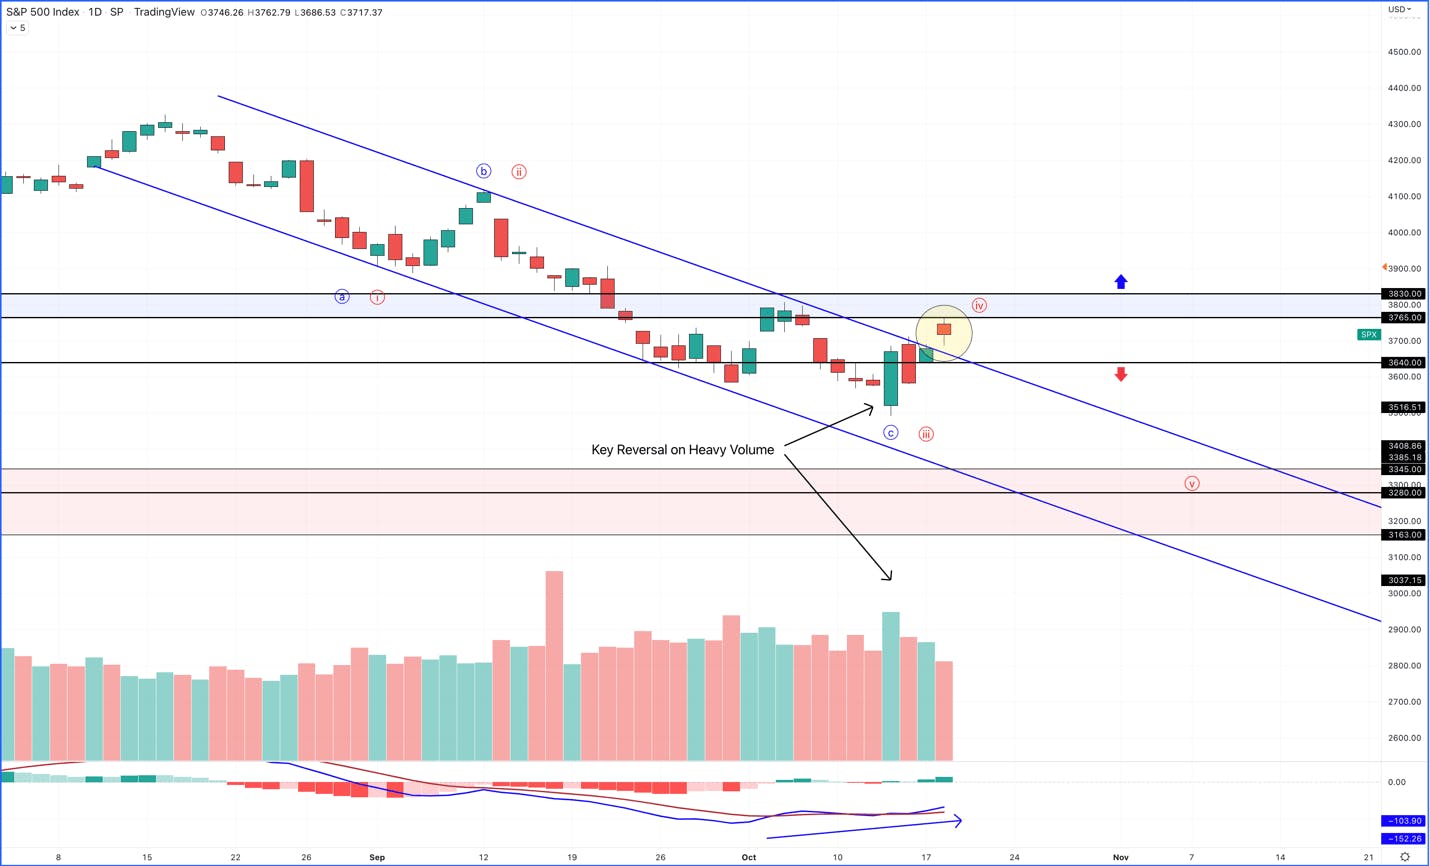
Today, we have met our target, as the market appears to have exhausted to the downside. The below chart is quite busy, so I will take it one point at a time, but we now have a new range as well as evidence that a new uptrend is developing.

S&P 500 chart showing Key Reversal on Heavy Volume

Source: I/O Fund

First off, we have been stuck in a downtrend channel since the August high. There have been multiple attempts to break out of this channel, all have failed and led to new lows. Note how we have broken out of the downtrend channel. I circled this move, and it’s also worth noting that we gapped over the channel on heavy volume and are holding it, so far. More times than not, when we see the channel broken, it’s signaling a trend reversal is in process.

Secondly, note the key reversal bar on the day of the low. This is called a bullish engulfing candlestick. It is when a candle stick covers the entire high and low from the day before. What determines if this pattern is strong is how many days does it cover and is it on heavy volume? October 13th covered 3 days prior and was on exceptional volume, which makes this a strong reversal pattern.

Our premium members have been getting deep-dive tech earnings analysis straight to their inbox. We also offer real-time trade notifications, weekly webinars, a completely transparent portfolio of 20+ positions and more. Learn more about our premium membership.Learn more about our premium membership.Learn more about our premium membership.

That being said, the price range that will determine a meaningful low being in is SPX 3830 – 3640. Whatever level breaks first will determine the counts above. If we do breakdown from here, the below SPX levels I’m targeting are 3345, 3280. Even if this does happen, the divergences and sentiment are so strong that it will only set up another buying opportunity.

On the other hand, our base case is that we do breakout above the 3765-3830 region. If this does happen, we expect a multi-month rally to take us into year-end.

In conclusion, we are seeing the types of extreme sentiment readings as well as divergences that mark a reversal. We are also seeing the market shrug off horrible inflation data. Since the PPI and CPI numbers came in hotter than expected, the market is up 6.5%. The last time we saw these patterns was in mid-June, just before the market moved up 18% in less than 2 months. Will this market THE low or will it just another bear market rally? Follow me for updates.

On Thursday, October 20th at 2:30 pm Eastern, we will be providing our weekly market webinar where we will discuss recent earnings reports, as well as analyzing specific stock charts. Our goal is to provide context, as well as identify actionable exits and entries for investors. We have used this information to successfully hedge our portfolio multiple times in 2022, as well as build positions at key levels.

Please note: The I/O Fund conducts research and draws conclusions for the Fund’s positions. We then share that information with our readers. This is not a guarantee of a stock’s performance. Please consult your personal financial advisor before buying any stock in the companies mentioned in this analysis.

Broad Market Webinar – October 20, 2022

I/O Fund – Premium – Market Update – October 20, 2022 – Broad Market, NFLX, AEHR, CRWD, ETHUSD, and DDOG

Watch Knox's webinar replay as he covers the Broad Market, NFLX, AEHR, CRWD, ETHUSD, and DDOG.

Timestamps:

00:00 – Broad Market

11:45 – Netflix

15:41 – Ethereum

17:28 – Datadog

20:32 – Crowdstrike

23:16 – Aehr Test Systems

25:12 – Q&A

Netflix Q3 Earnings

Please note, we will be writing up pre-earnings notes on the forum for the stocks we own. You can access Netflix’s pre-ER here.

Highlights:

  • No major flags in the earnings report
  • For Q3, the company beat on subscribers, revenue, operating margin and free cash flow
  • Q4 guide is in-line across the board. Next quarter will see lower operating margin due to seasonality
  • The new ad supported tier rolls out in two weeks; we believe this is an underappreciated catalyst. The ad supported tier will monetize at the same rate or even higher than legacy tiers with $6.99 monthly subscription combined with $10 ARPU over time (needs time to ramp to reach this ARPU).
  • High probability of revenue acceleration from ad tier combined with improved cash profile combines for an attractive stock for 2023. Not only will Q4 and Q1 provide some clues around the new trajectory but we will also keep an eye on the upfront season in April/May.
  • The company is still trading well below its 5-year historic valuation

Financials:

Netflix had a sizable beat on subscribers and the stock is breathing a visible sigh of relief as the company comfortably beat with 2.4M net adds compared to 1M to 1.2M expected. Consensus for next quarter was 4.1M with Netflix guiding for 4.5M.

The largest contributor to growth is the APAC region at 1.4M new subs followed by EMEA at 0.6M subs and LatAm at 0.3M subs. United States and Canada reported 0.1M subs whereas in the past this region saw churn.

Revenue was up 5.9% compared to 4.7% expected. On a constant currency basis, revenue grew 13% YoY. There is a miss on revenue for next quarter due to FX headwinds. The company guided for 1% growth versus 3.5% growth expected. On a constant currency, Q4 is expected to grow 9%. This creates a slight miss on FY2022 revenue at $31.5 billion guided versus $31.6 billion expected. As was the case last quarter, the market is willing to overlook FX headwinds.

As we’ve covered in the past, I continue to believe revenue growth is too low for the upcoming ad tier and the roll-out of how to phase out password sharing.

Here was the update from Netflix regarding the new ad-supported tier from the Investor’s Note:

“As we’ve been discussing over the past few quarters, improving our pricing strategy is an important near-term focus. Last week, we announced that we’ll be launching an ad-supported subscription plan on November 1 in Canada and Mexico; November 3 in Australia, Brazil, France, Germany, Italy, Japan, Korea, the UK, and the US; and November 10 in Spain. Cumulatively, these 12 markets account for ~$140 billion of brand advertising spend across TV and streaming, or over 75% of the global market.

To start, we’re keeping it simple by offering one low-priced ad plan – Basic with Ads – at a price that’s 20%-40% below our current starting price. So in the US, for example, Netflix will now start at $6.99 per month (compared to $9.99 today). The Basic with Ads plan will have ~5 minutes of advertising per hour, frequency capping and strong privacy protections.”

Per our Pre-ER notes, analysts are expecting $10 ARPU from the 5 minutes of advertising when it’s fully rolled out, which puts this tier on par with other tiers for revenue growth.

Password sharing is being leveraged by 100 million viewers. Here was Netflix’s update on how they plan to monetize these users:

“Finally, we’ve landed on a thoughtful approach to monetize account sharing and we’ll begin rolling this out more broadly starting in early 2023. After listening to consumer feedback, we are going to offer the ability for borrowers to transfer their Netflix profile into their own account, and for sharers to manage their devices more easily and to create sub-accounts (“extra member”), if they want to pay for family or friends. In countries with our lower-priced ad-supported plan, we expect the profile transfer option for borrowers to be especially popular.”

Operating margin came in higher than expected at 19% versus management’s previous guidance of 16%. There was a 4% decline from the previous year due to FX. The company is guiding for an operating margin of 4% to 8% next quarter, or 10% on a constant currency (CC) basis. This is due to seasonal spending on marketing and content, and on a CC basis, will be higher than last year’s 8.20%.

The revenue and operating margin beats flowed through to a net income beat of $1.39B compared to $961M expected. Operating cash flow was at $557 million and free cash flow came in at $472 million. This means management has made good on its promise to see $1 billion FCF this year. It also implies FCF could be ($287) million next quarter as we are at $1.287 billion for the year.

For our position, this being reiterated regarding FCF next year is key: “We continue to expect FCF of +$1 billion for the full year 2022, plus or minus a few hundred million dollars and substantial growth in FCF in 2023 (assuming no further material appreciation of the US dollar).”

There was a minor improvement in Netflix’s cash and debt levels with cash increasing to $300 million to $6.18B with net debt of $7.98B. This is down from net debt of $8.5B in the previous quarter.

The company had a big beat on EPS of $3.10 versus $2.17 expected. This included a $348 million non-cash unrealized gain from FX remeasurement on Euro denominated debt.

A Few More Points:

Netflix does not believe their market is saturated, rather that advertising opens up a new, sizable addressable market. The company offered the following information: “In the 190 countries in which we operate, our $30 billion-plus of annual revenue is roughly 5% of the combined estimated ~$300 billion pay TV/streaming industry, ~$180 billion branded advertising market, and $130 billion consumers spend annually on gaming6. So, we believe that we have a long runway for growth if we can continue to improve our offering steadily over time.”

Early next month, Netflix goes live with its new ad-supported tiers. Netflix has been able to launch its ad platform within 6 months of the announcement. The announcement earlier this month was good news for Netflix investors who entered early despite many institutional analysts predicting it would be six months into 2023 before it rolled out.

Here is what we had stated: “It’s certainly feasible that strong ad partners can get Netflix’s global rollout accomplished in a year’s time – which is why I believe we will hear who Netflix has chosen as soon as Q2 earnings or by Q3 earnings. I don’t think we will need to wait until Q4 2022 as testing is likely to happen sooner.” — this timing is important not only because as investors we don’t have to wait too long to get a glimpse of the impact of the new ad tier (Q4 earnings) but also because this sets up Netflix for next year’s upfronts.

I foresee Netflix doing quite well during next year’s upfront season, which is when prepaid inventory is contracted between high-paying brand advertisers and media companies. Assuming there are no changes, we fully expect to hold our position well into this time frame (Q2 2023). This is primarily because Netflix has very high-quality content and because Pay TV advertisers are in some pain right now with the need to find strong content to place ads.

On the earnings call, management discussed the “collapse of Pay TV” stating they had underappreciated the effects that the Pay TV migration is having on advertisers. They specifically pointed to the 18-49 year old demographic.

Also on the earnings call, management stated they are not expecting any material financial impact this quarter from ads due to the intra-quarter launch. However, over time, the company expects the ad tier to be margin accretive. My personal take is that it can produce a nice boost in subscribers and this glimpse is going to be one that I am very much looking forward to. Management has no visibility at this time as it launches in two weeks so it’s prudent to not guide beyond the visibility they currently have.  

Management could not be more clear in their Investor’s Letter or on the earnings call that having the streaming best content in the world is their #1 strategy for success. That is one reason I track statistics such as Netflix’s share of TV time very closely. There was discussion that Netflix fully accepts the cost of the creating content and is instead more focused on getting more value from $1 billion in content than their competitors.

Conclusion:

Given the new ad tier and the popularity of password sharing, I believe Netflix’s revenue estimates over the next few quarters and next fiscal year are quite low. When you combine this with a new cash profile for Netflix, this stock may be entering the perfect storm. Netflix has only been FCF positive in 2020, and has not been FCF positive in any other previous year. We will now be entering two years of FCF positive between 2022 and 2023.

Big Tech Continues To Buy Semiconductors At Record Levels In 2022

This article was originally published on Forbes Oct 14, 2022,09:31am EDTForbes Oct 14, 2022,09:31am EDT

Semiconductors have been rocked this year due to slower consumer spending on PCs, mobile and also slowing enterprise budgets that further affect hardware purchases, including PCs, notebooks and servers. The silver lining is Capex spending by Big Tech companies, which we’ve covered in the past for our premium members, when we stated that the increased Capex from companies like Google, Microsoft and Amazon and other big tech companies greatly benefit the semiconductor market.

The news has been in an uproar about crypto mining and the consumer-related PC markets. However, it has been our stance for some time that Big Tech capex is the true leading indicator for AI semiconductor companies. Despite an enormous increase in Big Tech capex primarily driven by data centers, this line item does not get the attention it deserves in terms of follow-through to the semiconductor industry. Below, we look at FY2022 budgets to draw the conclusion that H2 spending on data center chips is equal if not greater than the first half of 2022.

Market Opportunity

According to Gartner, the overall IT spending is expected to grow 3% to $4.5 trillion in 2022. It is lower than the 10% growth in 2021. The slowdown was mainly due to the cutdown in spending on personal computers, tablets, and printers.

The Data Center Systems segment, however, is expected to grow fastest among all the segments. It is expected to grow 11% YoY to $212 billion, higher than the 6.4% growth in 2021.

Hyperscale data centers, which are very large data centers primarily operated by Amazon, Microsoft and Google, are expected to outpace overall data center systems.

According to data from Allied Market Researchthe global hyperscale data center market is expected to grow from $59 billion in 2020 to $585 billion by the year 2030, representing a Compound Annual Growth Rate of 26% from 2021 to 2030.

Similarly, the Artificial Intelligence chip market is expected to grow from $8.02 billion in 2020 to $194.90 billion by the year 2030, representing a CAGR of 37% from 2021 to 2030.

According to a report published by Dell’Oro Group, the global data center Capex is expected to be $377 billion by the year 2026 – which implies the majority of the growth noted by Allied Market Research will occur in the next few years.

The private markets are also signaling growth will continue as there has been quite a bit of deal activity in data centers.

According to data from Synergy Research Group, 87 data center focused merger and acquisition deals were closed in the first half of 2022, worth $24 billion. There is an additional $18 billion of pending deals in the pipeline that are agreed and are yet to be officially closed. The research group mentioned that 209 deals were closed in 2021 for over $48 billion, up 41% from 2020.

One of the more significant deals this year that was completed is the acquisition of CyrusOne for $15 billion by KKR and Global Investment Partners. John Dinsdale, Chief Analyst at Synergy Research Group, said, “There is an ever-increasing demand for data center capacity, driven by rapidly growing cloud markets, aggressive expansion of hyperscale operator networks and continued growth of data-rich digital services.”

Earnings season kicked off this week and our premium members are receiving deep-dive tech earnings analysis straight to their inbox each week. We also offer real-time trade notifications, weekly webinars, a completely transparent portfolio of 20+ positions and more. Learn more about our premium membership.premium members are receiving deep-dive tech earnings analysis straight to their inbox each week. We also offer real-time trade notifications, weekly webinars, a completely transparent portfolio of 20+ positions and more. Learn more about our premium membership.

Big Tech Capex H2 2022

Alphabet’s Q2 Capex grew by 24% YoY to $6.9 billion. Ruth Porat, CFO of Alphabet, said“Turning to CapEx. The largest investments in the second quarter were in servers followed by data centers and office facilities.” were in servers followed by data centers and office facilities.” The company had invested $24.6 billion in Capex in the year 2021, up 11% YoY. The management expects Capex to rise in 2022. In the Q2 2022 earnings call, Ruth Porat said“We continue to expect an increase in CapEx in 2022 versus last year. For the balance of 2022, the increase will be particularly reflected in investments in technical infrastructure globally with servers as the largest component.” Earlier this year, the company announced its plan to invest about $9.5 billion in data centers and offices in the U.S. for the year 2022. This is up from about $7 billion spent in 2021.

Similarly, Microsoft’s Capex including financial leases, grew by 19% YoY to $8.7 billion in the Q4 FY2022 quarter (i.e., Q2 CY2022). Amy Hood, CFO of Microsoft, said, “Maybe let me start by talking about Q4's capital spend. Obviously, the big driver of our growth this quarter was in data center spend, both new and newbuilds as well as adding capacity to existing data centers. We are seeing, obviously, good demand signal.” data center spend, both new and newbuilds as well as adding capacity to existing data centers. We are seeing, obviously, good demand signal.” The management expects a sequential decrease in the next quarter due to the normal variability in the quarterly spend. In the CY 2021, Microsoft’s Capex including financial leases, grew by 33% YoY to $27.5 billion.

Amazon incurred capital expenditures, including equipment financial leases, of about $60 billion in 2021. About 40% of this is made up of technology infrastructure supporting AWS and worldwide stores business. The management expects Capex to increase over the last year with the increase in technology infrastructure.

Brian Olsavsky, senior VP and CFO, said in the Q2 2022 earnings call, “For full-year 2022, we do expect to spend slightly more on capital investments than last year, but the proportion of capital spending shifts among our businesses. We expect technology infrastructure spend to grow year-over-year, primarily to support the rapid growth in innovation we are seeing with AWS. We expect infrastructure to represent a bit more than half of our total capital investments in 2022.”

Meta’s capital expenditures in Q2, including principal payments on finance leases were $7.75 billion, up 64% YoY. The company’s CFO, Dave Wehner, said in the Q2 earnings call, “Capital expenditures, including principal payments on finance leases, were $7.7 billion, driven by investments in servers, data centers and network infrastructure. The big step-up in CapEx, both year-over-year and sequentially related to server spend, including for our AI infrastructure.”driven by investments in servers, data centers and network infrastructure. The big step-up in CapEx, both year-over-year and sequentially related to server spend, including for our AI infrastructure.”

The company expects 2022 capital expenditures, including principal payments on financial leases, to be $32 billion at the mid-point of the guidance, representing a 66% YoY growth. Tracking the Capex in the first two quarters, Meta Platforms had spent $13.3 billion which suggests the spend will be higher in 2H 2022. When we deduct from the mid-point of the guidance, it comes to $18.7 billion for H2.

Meta also recently announced its plan to expand the Eagle Mountain data center project. It is Phase 3 expansion plan and brings the total investment in the project to over $1.5 billion.

Earnings season kicked off this week and our premium members are receiving deep-dive tech earnings analysis straight to their inbox each week. We also offer real-time trade notifications, weekly webinars, a completely transparent portfolio of 20+ positions and more. Learn more about our premium membership.premium members are receiving deep-dive tech earnings analysis straight to their inbox each week. We also offer real-time trade notifications, weekly webinars, a completely transparent portfolio of 20+ positions and more. Learn more about our premium membership.

Conclusion

Thanks to very big Big Tech capex budgets, Nvidia’s data center revenue grew 71% YoY to $7.6 billion in 1H 2022. Similarly, AMD’s data center revenue grew by 83% YoY to $1.5 billion in Q2 2022 and doubled in Q1 2022.

Due to consumer-related weakness, the data center is now the leading segment for these companies, which we had predicted would occur in 2018 in my free weekly newsletter. We also provide regular deep dives for our premium research Members on a more granular level as to what will happen next in the semiconductor industry.

Royston Roche, Financial Analyst for the I/O Fund contributed to this article.

Please note: The I/O Fund conducts research and draws conclusions for the Fund’s positions. We then share that information with our readers. This is not a guarantee of a stock’s performance. Please consult your personal financial advisor before buying any stock in the companies mentioned in this analysis.

Sentiment and Divergences are Pointing Up

Weekly Stock Market Levels – 10/18/22

Markets do not top together, nor do they bottom together. It’s critical to find the leading markets for clues on what’s about to unfold. We saw this in 2021 with global markets all topping throughout the year. Today, we are seeing them bottom one after the other.

We’re also seeing this pattern with various risk-on markets. Transports, high beta, biotech, and small caps, all made higher lows as the broad market made one more low. These assets tend to lead us down, which we were seeing in 2021, but they also will lead us up, which seems to be playing out now.

This week, we will look at these patterns, as well as define the current price range for the broad market. Divergences can provide an early warning signal, but unless the market breaks out of key resistance levels, we do not have confirmation of the trend change underway. I detail this for you more below and also feel free to check out my weekly webinars on YouTube where I discuss broad market levels.

10/18 Broad Market Levels Timestamps10/18 Broad Market Levels Timestamps

00:00 – Stock Market Intro: The Gap Up from the August Downtrend

03:20 – The Price Range That Really Matters

06:00 – Divergences in the Dow Jones Transports, High Beta Stocks, and Financials

08:18 – Divergences and International Markets (German, Chinese, and Japanese Markets)

12:03 – Get more technical analysis. Sign Up for Free Stock Analysis

Get Critical Weekly Stock Market Analysis during Stock Market Crashes

On the I/O Fund premium site, we provide weekly webinars that discuss what the I/O Fund is buying and selling. We also have a proprietary hedging signal that we monitor in real-time. Following the analysis, we provided for free on YouTube last month “This is Still a Warning Sign” and also in this article “Why the Next Two Weeks Could Determine 2022” we hedged going into the CPI number for a nice gain in a tough market and have had a hedge in place most of September

To watch more stock market analysis videos, follow me on YouTube here or sign up for the I/O Fund free newsletter to be notified when I publish the next weekly webinar.

Sign Up for the Next Premium Webinar where we continue to discuss Stock Market Bounces

Premium I/O Fund Services.

About I/O Fund Portfolio Manager Knox Ridley

Knox Ridley began consulting on portfolios in 2007 and is an experienced growth investor in both bull and bear markets, which is hard to find these days. As the portfolio manager of the I/O Fund, he beat the top-performing funds on Wall Street in both 2020 and in 2021. His real-time trade notifications to premium subscribers have garnered 27 entries with over 100% gains in the last two years. Knox began his career as an ETF wholesaler in 2007 before becoming a portfolio consultant for large RIAs, FAs, and Institutional accounts. He is very keen on macro trends and is trained in Fibonacci Trading, Elliott Wave theory, as well as Gann Cycles. He also uses classical technical analysis to manage risk and identify great risk/reward setups. Knox is known for increasing and decreasing allocations for record-breaking returns.

To get more free stock analysis on fundamentals and technicals, sign up for I/O Fund's free newsletter with gains of up to 403% – Click here.To get more free stock analysis on fundamentals and technicals, sign up for I/O Fund's free newsletter with gains of up to 403% – Click here.free newsletter with gains of up to 403% – Click here.
Subscribe to Free Newsletter

About I/O Fund Premium Stock Investing Services

Premium Members currently enjoy all 7 Premium benefits below.

  1. Premium library of institutional-level research and analysis, including fundamental stock analysis and advanced market signals on technicals and macro analysis.
  2. Weekly Webinars on advanced market signals and broad market, plus quarterly portfolio reviews on Long-Term Buy and Hold tech stocks.
  3. Technical Analysis on stocks and Broad Markets with charts on all major US markets, analysis of inflation and growth, as well as 60 global markets to help us focus on risk/reward for entries and position our portfolio based on the macro-environment.
  4. An Active Forum made up of a community of like-minded investors with robust conversations including both fundamental and tech product analysis.
  5. A completely Transparent Portfolio made up of long-term buy and hold positions, crypto, and Long/Short Momentum positions.
  6. Trade Alerts are sent directly to your phone via SMS and email.
  7. NEW! Automated Hedge with advanced signals to help spot approaching risk in the markets, with a 67% win rate going back to 2003 with only 40 signals triggered.

Sign up for Premium

Please note: The I/O Fund conducts research and draws conclusions for the Fund’s positions. We then share that information with our readers. This is not a guarantee of a stock’s performance. Please consult your personal financial advisor before buying any stock in the companies mentioned in this analysis.

AMD Update: The One Critical Reason I’m Still Feeling Zen

Below, we look at the PC-related miss and what to expect from AMD in the data center.

The data center is critical right now because this is what can help AMD reclaim its stock price. I wouldn’t dismiss the possibility that this year becomes AMD’s best year in the data center as the company is perfectly positioned to make a substantial increase in market share over Intel. By best year I am not referring to growth percentage but rather judging by impact of total revenue and size of this segment. The move from AMD owning “mid-20%” of the CPU data center to owning 40% to 50% of the market is the move we want to capture — and this is entirely possible due to Intel’s most recent stumble.

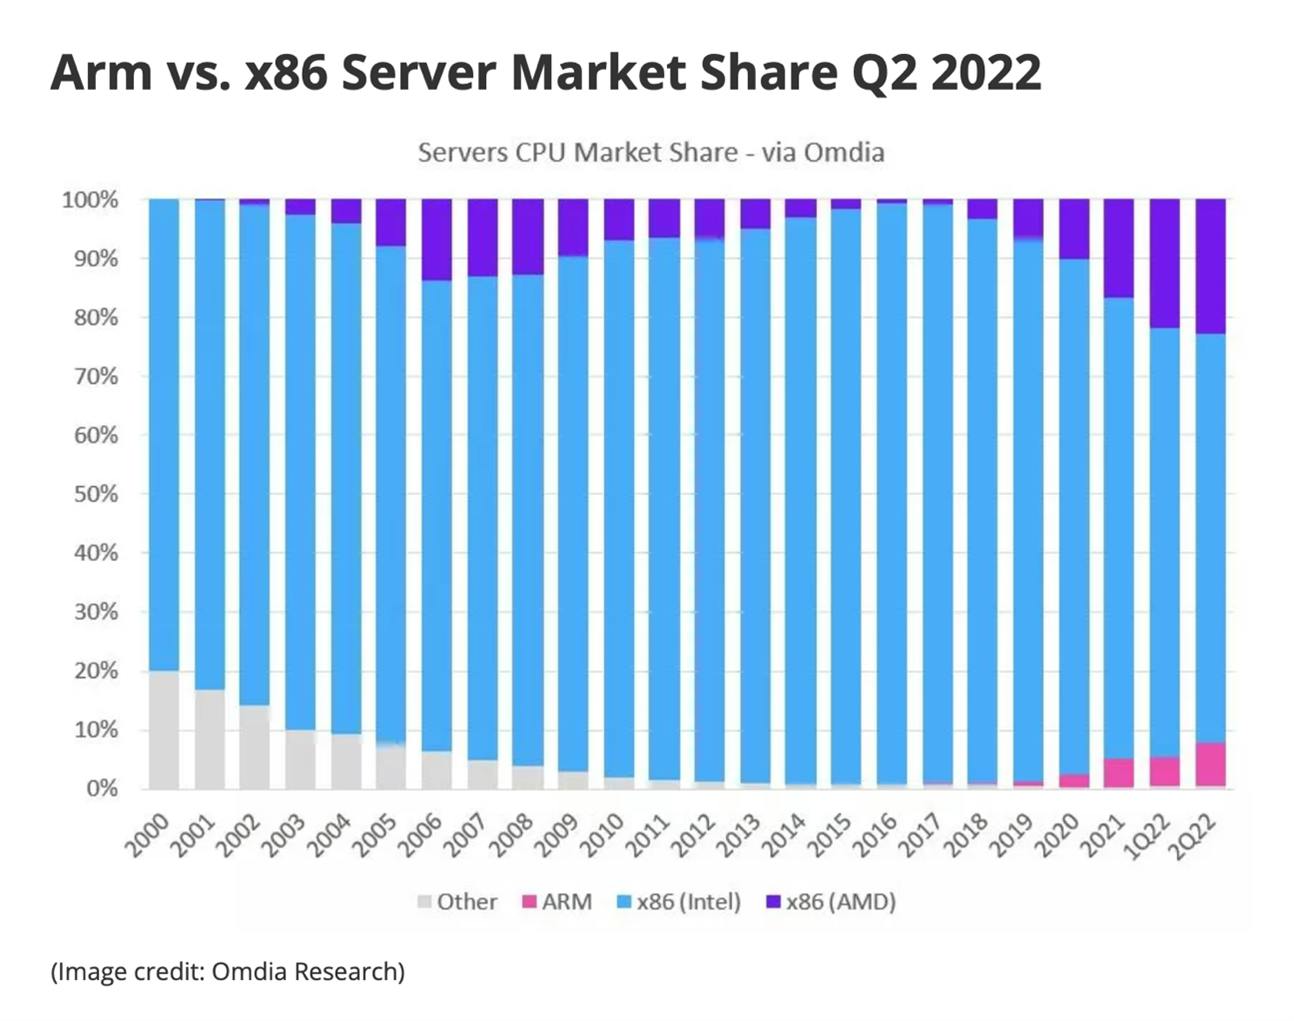
Arm vs x86 Server Market Share Q2 2022

Source: Tom’s HardwareTom’s Hardware

Pictured Above: AMD has grown from 2% market share to “mid 20-percent market share”

It’s important to note that AMD has grown over 6% of its market share in the last two quarters. Per our recent Q2 coverage: As an analyst pointed out, AMD appears to have gained 6% market share, which is “the highest share gain in the data center business that [AMD] has reported even going back to 2005.”

We have been quite thrilled to see the team at AMD led by Lisa Su and Forrest Norrod overtake Intel at times. However, what happened last quarter with Intel’s stumble is an exponentially greater mistake than the last stumble that we prepared for in March of 2020, which later materialized in July of 2020.

You may have seen tech commentary poking fun of Meta’s most recent keynote on social media and in newsletters. If you missed it, the recap is that Mark Zuckerberg demonstrated adding legs for Metaverse avatars and quickly became a target as the progress doesn’t quite reflect the company’s large level of investment.

Most investors look at Facebook’s cash and think “this will make a great stock,” which is first level thinking — yes, the FCF margin is impressive. Some are taking this further and scrutinizing “where is the cash being spent and will Meta succeed?”

However, the most important takeaway to Meta’s insatiable appetite to find the next big thing in media is that AMD stands to greatly benefit whether Meta succeeds or not.

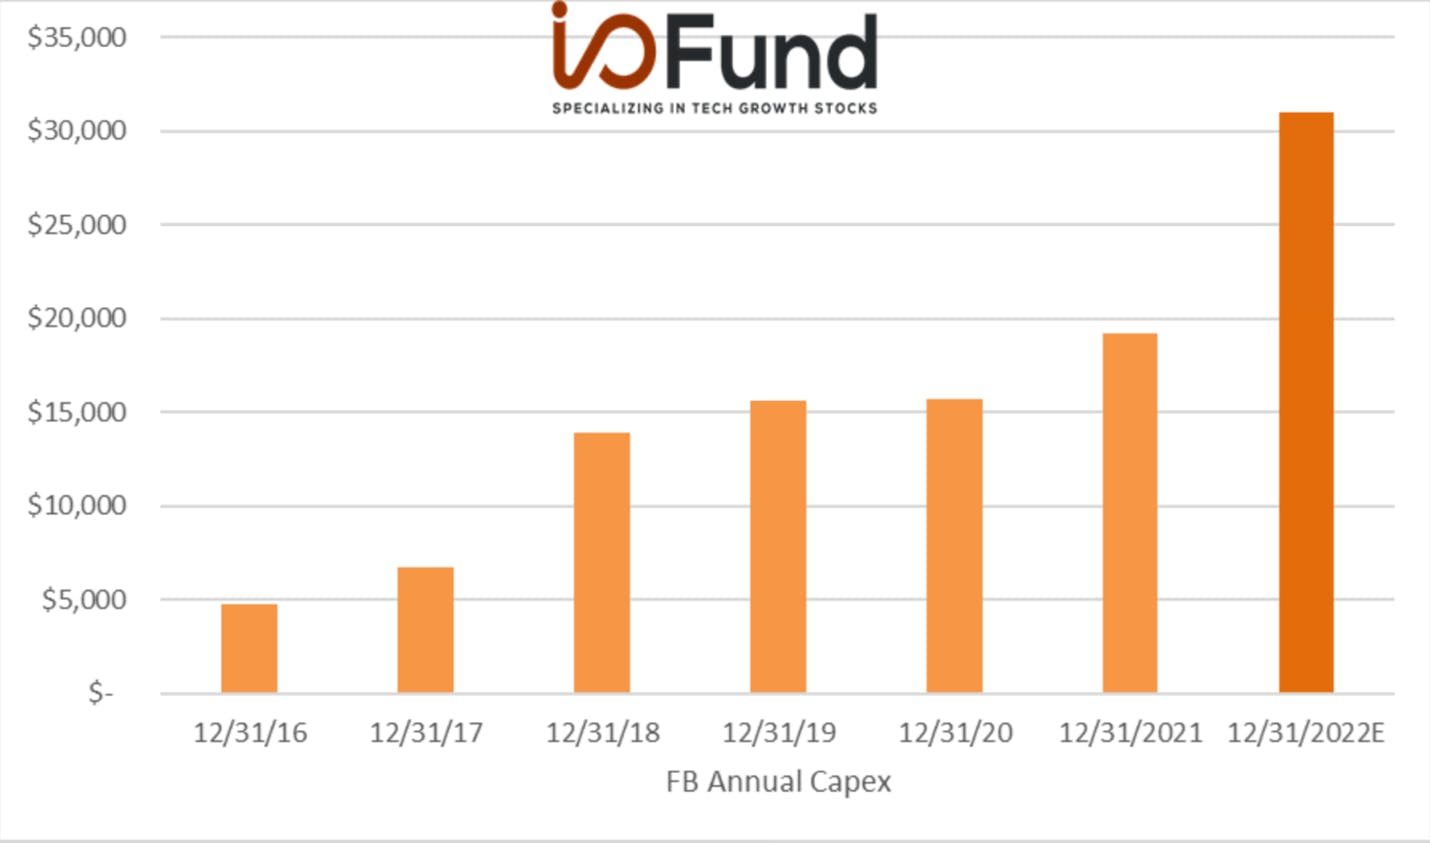
Here is data presented on the forum from last year that shows Meta’s increased capex following the Q3 2021 earnings call.

FB Annual Capex

We don’t get enough transparency to separate real estate costs from servers and data centers in the capex number but we do know that Meta chose AMD to build its data centers – which was an earth shattering announcement for AMD investors. Amazon did at one point comment about its split and said 40% of its capex is spent on data centers.

This is precisely why AMD leap frogging Intel is critical for investors to not forget or lose sight of in a consumer led selloff. Meta capex spending with AMD can grow to exceed AMD's PC revenue in the next 2-3 years alone, and of course, AMD is partnered with many hyperscalers beyond Meta.

The decision to choose AMD at Meta’s primary supplier was very likely due to AMD’s historic product lead over Intel, which we have covered in this webinar and this write-up. Point being, not only is AMD in the lead on product but AMD is in the lead at exactly the right time. Meta helps to quantify the impact.

In regard to Nvidia, one thing to remember, is that Nvidia’s Omniverse creeps onto Meta’s territory for building 3D Worlds. I imagine Meta’s ultimate goal is to attract creators and developers to build their 3D apps with Meta and this is also Nvidia’s Omniverse’s goal. AMD does not compete here and so it’s an obvious choice for Meta to partner with AMD on both CPUs and GPUs.

Brief Note on Data Center Numbers:

There is additional evidence of the impact of Intel’s previous stumble as AMD’s data center segment grew 83% year-over-year in Q2 compared to Intel’s (16%) decline. Intel has not caught up to the AMD’s products released two years ago and now AMD is being even more aggressive as the 5-nanometer line up is being released in Q4 which includes Zen-4 architecture plus the Zen-5 architecture in 2024. We covered the upcoming product road map here.

The company also stated that the Zen-3 Milan Series is still outstripping supply with visibility six quarters out, implying for full year 2023. As a reminder, Zen-2 was Lisa Su’s comeback and Zen-3 is responsible for the current move in data center market share.

However, as an AMD investor, I am actually less concerned with shiny numbers like 83% growth and I am more concerned with the data center segment becoming so large in total revenue that more cyclical segments like PCs have less impact on the stock.

Data center revenue is a $6 billion segment with Q2 data center revenue at $1.5 billion and for Q3 is $1.6 billion. AMD did not break out the data center number before but judging by the 83% in Q2 and the 45% in Q3, the company looks to be tracking in the ballpark of Meta’s capex number of 66% (I find the average growth for AMD to be roughly close to Meta’s capex if we assume Q1 was in line with Q2 and that Q4 will be roughly in line with Q3 to be interesting although there isn’t enough information about Meta’s orders to verify the correlation).

If Meta reports 30% growth in capex next year, the data center segment can easily become $7.8 billion next year. However, what this overlooks is the impact of AMD taking more market share from Intel, which will likely be seen when AMD attracts higher budgets from more hyperscalers. If AMD takes another 10% to 20% of market share over the next 18 months, we could see roughly a $9 billion to $10 billion segment, which would be 60% growth over 1.5 years (or 40% average annual growth). This is entirely possible as AMD is taking 12% market share this year, and again, I believe AMD eating into Intel’s market will actually accelerate more this year than it did last year. I am using the word “year” loosely to say Q4 2022 through the end of fiscal 2023, so about 6 quarters.

I do want to point out that Arm is starting to creep into X86 server territory as evidenced by the chart above, however, I believe this is a bigger problem for Intel and not as much for AMD who has clearly not been impacted by Arm’s growth.

More on Big Tech Capex

Royston wrote about Big Tech Capex on the forum and some of this is going out as our free newsletter this week. Here is what he wrote:

Our team has been working on looking closer at AMD and here is some research from Big Tech Capex, which was a leading indicator going into 2022. Our goal is to see if there's any sign of slowing data center and server investments from the Big 4.
Monitoring the capital expenditures of big tech companies helps to understand the demand for data centers and artificial intelligence. While not all Capex goes to data centers and AI, it remains a significant investment in recent years.

Meta’s capital expenditures in Q2, including principal payments on finance leases were $7.75 billion, up 64% YoY. The company’s CFO, Dave Wehner, said in the Q2 earnings call, “Capital expenditures, including principal payments on finance leases, were $7.7 billion, driven by investments in servers, data centers and network infrastructure. The big step-up in CapEx, both year-over-year and sequentially related to server spend, including for our AI infrastructure.”driven by investments in servers, data centers and network infrastructure. The big step-up in CapEx, both year-over-year and sequentially related to server spend, including for our AI infrastructure.”

Sheryl Sandberg said, “Third, on AI and machine learning. I want to emphasize Mark's point that this is a really important part of how we improve our ads ranking and measurement capabilities. AI-driven products like advantage detailed targeting and advantaged look-alikes help to increase the audience for an ad campaign if it's likely to improve performance. AI is also an important part of how we continue to grow video monetization.”AI and machine learning. I want to emphasize Mark's point that this is a really important part of how we improve our ads ranking and measurement capabilities. AI-driven products like advantage detailed targeting and advantaged look-alikes help to increase the audience for an ad campaign if it's likely to improve performance. AI is also an important part of how we continue to grow video monetization.”

The company expects 2022 capital expenditures, including principal payments on financial leases, to be $32 billion at the mid-point of the guidance, representing a 66% YoY growth. Tracking the Capex in the first two quarters, Meta Platforms had spent $13.3 billion. It suggests it will be higher in 2H 2022, as when we deduct from the mid-point of the guidance, it comes to $18.7 billion.

The company is planning to reduce the hiring of engineers by 30% this year due to the economic slowdown according to an internal memo. The company is facing the heat due to privacy issues and slowing ad revenues. The memo suggests a five-fold increase in the requirement of GPUs to make its feed better to increase engagement using Artificial Intelligence as the company is trying to combat the competition from TikTok.

Meta also recently announced its plan to expand the Eagle Mountain data center project. It is Phase 3 expansion plan and brings the total investment in the project to over $1.5 billion.

Alphabet’s Q2 Capex grew by 24% YoY to $6.9 billion. Ruth Porat, CFO of Alphabet, said“Turning to CapEx. The largest investments in the second quarter were in servers followed by data centers and office facilities.” were in servers followed by data centers and office facilities.” The company had invested $24.6 billion in Capex in the year 2021, up 11% YoY. The management expects Capex to rise in 2022. In the Q2 2022 earnings call, Ruth Porat said“We continue to expect an increase in CapEx in 2022 versus last year. For the balance of 2022, the increase will be particularly reflected in investments in technical infrastructure globally with servers as the largest component.” Earlier this year, the company announced its plan to invest about $9.5 billion in data centers and offices in the U.S. for the year 2022. This is up from about $7 billion spent in 2021.

Similarly, Microsoft’s Capex including financial leases, grew by 19% YoY to $8.7 billion in the Q4 FY2022 quarter (i.e., Q2 CY2022). Amy Hood, CFO of Microsoft, said, “Maybe let me start by talking about Q4's capital spend. Obviously, the big driver of our growth this quarter was in data center spend, both new and newbuilds as well as adding capacity to existing data centers. We are seeing, obviously, good demand signal.” data center spend, both new and newbuilds as well as adding capacity to existing data centers. We are seeing, obviously, good demand signal.” The management expects a sequential decrease in the next quarter due to the normal variability in quarterly spend. In the CY 2021, Microsoft’s Capex including financial leases, grew by 33% YoY to $27.5 billion.

Amazon incurred capital expenditures, including equipment financial leases, of about $60 billion in 2021. About 40% of this is made up of technology infrastructure supporting AWS and worldwide stores business. The management expects Capex to increase over the last year with the increase in technology infrastructure.

Brian Olsavsky, senior VP and CFO, said in the Q2 2022 earnings call, “For full-year 2022, we do expect to spend slightly more on capital investments than last year, but the proportion of capital spending shifts among our businesses. We expect technology infrastructure spend to grow year-over-year, primarily to support the rapid growth in innovation we are seeing with AWS. We expect infrastructure to represent a bit more than half of our total capital investments in 2022.”

AMD’s PC-Miss

As you already know, AMD pre-announced earnings with a miss of $1.1 billion for revenue of $5.6 billion, down from previous guidance of $6.7 billion. This will represent growth of 29% compared to growth of 55% at the mid-point of the guidance that was previously expected.

The low margins would also imply that average sales price is coming down quite a bit in addition to number of units. Here is what IDC said: “Shortages over the last several years have aggressively driven product mix shifts towards the premium end. This, coupled with cost increases of components and logistics, drove ASPs up five quarters in a row to $910 in 1Q22, the highest since 2004. However, with demand slowing, promotions in full swing, and orders being cut, the ASP climb was reversed in 2Q22. Another quarter of ASP declines indicates a market in retreat."

Although AMD has a clear lead ahead of Intel in the data center (where it matters most for long-term investors) this is not necessarily the case in PCs. According to Tom’s Hardware, the AMD Zen 4 series can compete against Intel’s current Alder Lake. However, AMD’s Zen 4 Ryzen 7000 coming out this month will have its hands full competing with the anticipated Raptor Lake from Intel due out later this month. You can read about the benchmarks here but the main takeaway is that average sales prices comes under pressure due to a more competitive market in PCs and gaming. This is in addition to the (15%) to (19.5%) decline in shipments noted below. Hence, we are seeing a much larger decline in revenue (40% decline in AMD’s revenue) driven by both lower ASP in addition to lower shipments.

A side note to consider is that the lower shipments are not only driven by slowing consumer demand. Some of this is coming from enterprise budgets, which raises questions around how fast enterprise budgets are deteriorating if AMD had little foresight into this issue.

I also want to note that enterprise can weigh on AMD’s data center segment even if Big Tech is a tailwind. If enterprises, government or education sectors are cutting server budgets than some effects from this will be seen on a YoY basis.

It can be tough to draw hard and fast conclusions is because comments about Q4 and next fiscal year are not available until November 1st. Operating from this unknown, I have the following information to share:

The most important question about the PC miss from AMD is when will we see a bottom?

There are two perspectives on this, the first is that Q3 is the bottom and the second perspective is that Q2 2023 will be the bottom. I imagine Q4 will be supported by the holidays to some extent, yet I would plan on lumpiness to continue in the Client category.

I also want to point out that estimates often have errors and this is true even for the very best analysts that go on record about PC sales. For example, IDC shows Apple shipments at 10 million for Q3 for 40% YoY growth whereas Gartner shows Apple’s global shipments at 5.8 million — this is a nearly 100% discrepancy between two reputable analyst firms.

IDC is reporting (16%) growth for the PC market in Q3 whereas Gartner is reporting (19.5%). The difference is primarily in the Apple numbers. Regardless, the PC market contracted 17% or 18% at the midpoint.

There are also institutional analysts who have numbers that are likely far off the mark: “September notebook shipments were up 12% month-over-month, well below Citi's expectation of up 23% due to continued inventory digestion and demand deterioration, Citi analyst Christopher Danely tells investors in a research note. As such, Q3 notebook shipments were up 3% quarter-over-quarter, well below the analyst's recently lowered forecast of up 7% quarter-over-quarter.”

This doesn’t matter for this quarter as AMD has provided the guidance but it is important to take into consideration for any upcoming forecasts.

Analysts who think Q3 will be the Bottom – Either PC Sales or Price:

Please note: the reason we look to institutional analysts particularly for a PC-related revenue miss is they have the ability to do channel checks and have well established contacts in the semiconductor industry given it’s a multi-decade market.

Jefferies analyst Mark Lipacis noted that AMD negatively preannounced Q3 revenues 17% below consensus, which is "entirely attributed" to client PC revenues being down 53% quarter-over-quarter and 40% year-over-year. Revenues for other segments, including datacenter, were in-line and he thinks Q3 revenues will "be near if not at the bottom," Lipacis tells investors. Given his belief that the stock's 39% underperformance versus the S&P 500 since November 30 discounts the bad news, he advises investors to be buyers of AMD and keeps a Buy rating with a $135 price target on the shares.

BofA analyst Vivek Arya lowered the firm's price target on AMD (AMD) to $90 from $100 and keeps a Buy rating on the shares after the company warned Q3 sales would be $5.6B, versus a prior $6.7B outlook. AMD did not update its Q4 outlook, but he expects trends to stay sluggish and models sales to decline further quarter-over-quarter on Client segment weakness, Arya said. He believes AMD's warning will have the most negative read-across for "PC peer" Intel (INTC), but also somewhat for Nvidia (NVDA) due to its exposure to consumer graphics and related memory and data center peers. He expects most semi cuts to be reflected when companies report Q3 results, which "could conceptually help create a trough in semi stocks," assuming the macro environment doesn't get worse, Arya added.

Bullet Points for a Bottom in/around Q2 2023:

Stifel analyst Ruben Roy lowered the firm's price target on AMD to $100 from $122 and keeps a Buy rating on the shares after the company announced preliminary Q3 revenue that was much lower-than-expected, driven by much lower-than-expected Client segment sales. He now forecasts Q3 non-GAAP EPS of 69c, versus a previous estimate of $1.06, but expects new product ramps and continued market share gains to drive a re-acceleration of revenue growth in the second half 2023, Roy said.

IDC stated that the PC and tablet market is forecast to decline (2.6%) before returning to growth in 2024. However, this Forbes editorial from a PC-veteran stated: “in my discussions with ODMs, the makers of PCs primarily in Taiwan and China, they suggested that for the enterprise market, we could see growth by as early as Q3 in 2023. In addition, they tell me that while consumer demand most likely will not rebound until 2024, they say they are now seeing increased orders for enterprise-based PC and laptops for delivery as early as Q3 of 2024.

PC vendors are getting comments from enterprise customers who held off buying large quantities of PCs and laptops during the last two years, and many of their PCs designated for IT use are well beyond their turnover date. With that in mind, some vendors are increasing their orders for IT-targeted PCs and laptops for delivery in late 2023.”

Northland analyst Gus Richard lowered the firm's price target on AMD to $80 from $105 and keeps an Outperform rating on the shares. Richard cut his 2023 estimates for AMD client revenue and data center revenue by $3.8B and $1.0B, respectively, due to the rapidly deteriorating PC market and declining enterprise spending following last week's pre-announcement.

My note: you can see the potential effects from enterprise budgets in Gus Richard’s estimates and this does include government and education budgets.

Note on the Other Segments:

We have 2024 tagged as the potential breakout year for automotive. If it happens sooner, we won’t complain. But, according to the product road maps that I’m tracking, 2024-2025 seems to be the sweet spot. We will table this for now but continue discussing in ongoing earnings coverage.

Regarding gaming, please note that AMD does not have exposure to crypto mining like Nvidia. On the flip side, Nvidia does not supply the CPU PC market like AMD. However, AMD does compete in the client-side GPU market which is reflected in the Client segment.

Conclusion:

Owning semis has been tough last few months, however, our research indicates Big Tech capex may be one of the strongest growth areas next year (again). We have to consider that outside of cybersecurity, there are going to be very few growth markets in tech in 2023, and of the growth markets we are tracking, very few will be in the double digits. What I’m referring to is an increase in budgets and/or spending in the areas that the tech participates in.

I like how Timothy Morgan from Next Platform worded the hybrid business model in his most recent write-up on AMD, and he also touches on Nvidia here:

“The numbers from both AMD and Nvidia demonstrate all too well how important it is to sell different kinds of compute engines across a wide variety of markets. While it is true that with such a hybrid approach there always seems to be something going wrong that limits profit and revenue growth, that hybrid vigor is nonetheless what helps a company make it through all of its hard times. IT suppliers who forget this – IBM and Hewlett Packard come immediately to mind – pare themselves down to a very tight market that makes them necessarily less resilient. And sometimes less relevant. Microsoft and Dell, and to a lesser extent Cisco Systems, seem to understand this.”

Our portfolio is centered on companies taking more market share from a competitor (AMD/Intel) or taking nearly all market share in one of the most expensive components of the data center (GPUs/NVDA). It’s not out of the question that the data center growth rates for AMD and NVDA outperform next year to help absorb the consumer-related weakness. Our best leading indicator for these stocks has been and will continue to be Big Tech capex.

Big Tech capex is important as it’s the one catalyst that can raise revenue estimates for next year, which subsequently raises bottom line estimates. Right now, the growth rate for AMD is quite abysmal at 3% for Q1 2023 so we want to see if we can get increased capex and then some revisions for H1 2023 (is the #1 thing I’m watching right now).

We will leave it to social media to stir up noise and distractions on the quality of Mark Zuckerberg’s avatar legs — and meanwhile, we will be busy digging up those capex numbers from Meta and other Big Tech companies. Last year, we got quite a bit of information regarding Big Tech capex from the October earnings reports, so you’ll be hearing from us if we get those updates in the next two weeks.

Twilio Entry: Valuation is Attractive

Twilio is often categorized as cloud yet its business model is truly unique in every sense of the word. It’s not only the company’s gross margin of 50% versus the typical 70% that separates the company, but conversely, it’s also the lower sales and marketing expenses and lower R&D that make this company unique.

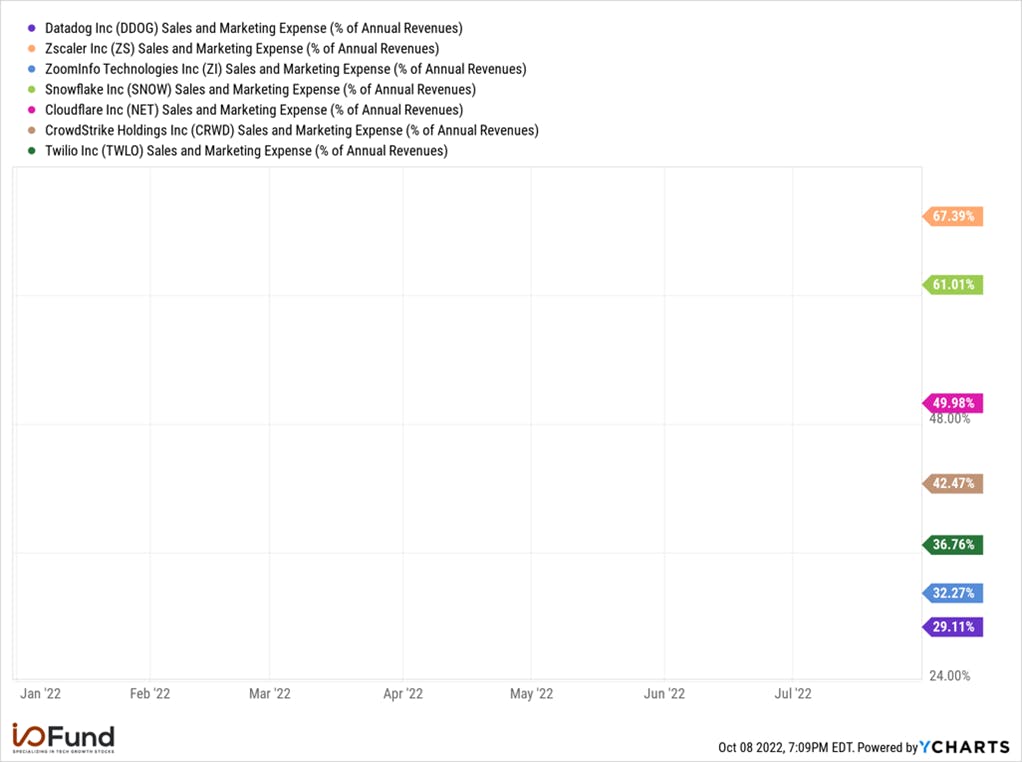
Here’s how Twilio compares to Top 10 cloud valuations on sales and marketing at 32% of revenue for sales and marketing (S&M):

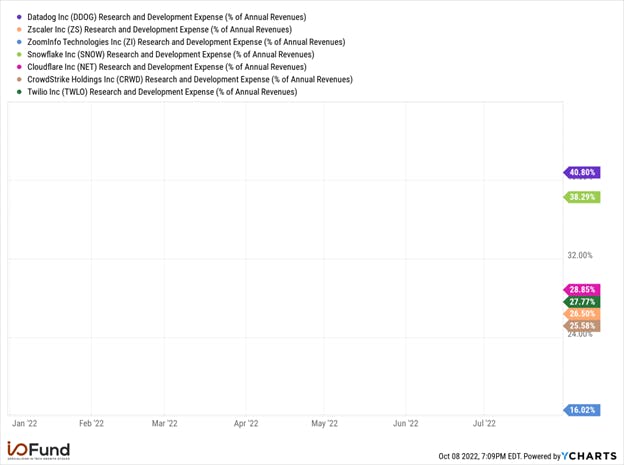
Here’s how Twilio compares with Top 10 cloud valuations with 16% spent on R&D:

When you combine the two line items, Twilio makes up for its lower gross margin with lower S&M and R&D. These line items have been range bound with the percentages seen above since 2014 with the company going public in 2016 and some financials from 2014 being available. Therefore, this is not due to scale or any type of customer mix from the pandemic or some kind of economic pressure.

I’ve made the argument that I believe Twilio has established a defensible moat when I covered the stock for MarketWatch in July of 2020. This elusive moat is why I believe those line items track much lower for Twilio as a platform compared to cloud software companies. Here’s what the article said from two years ago:

Twilio works with 1,000 mobile carriers in over 150 countries. The logistics around this are a nightmare for most developers and also for potential competitors. Uber developed this in-house but it was a rare situation where SMS and voice APIs are integral enough to warrant the investment […]

In 2017, Uber had a $60 million annual run rate with Twilio and decided to source different vendors. Even at this level, the company did not build the capability in-house and still remained with Twilio for high-performance messaging. Eventually, Uber migrated to Twilio’s main direct competitor — MessageBird.

Despite chipping away at Twilio since 2011, MessageBird has about 15,000 customers compared with Twilio’s 165,000. The company has been able to do this by serving the developer market and building out an extensive API library and documentation in which telecom features are integrated through a few simple lines of code.”

*Twilio now has 275,000 active customer accounts and MessageBird has 25,000 customer accounts. Some of Twilio’s growth is from the acquisitions.

Twilio raised the number of registered developer accounts from 5 million to 10 million at the 2020 Investor Day. This puts Twilio second to companies like Apple and Nvidia in terms of its popularity with developers. Point being, there are puts and takes with this company – gross margin is low but operating expenses are also low from strong management execution.

Rather than Twilio’s gross margin weigh on the company, I believe it could be the GAAP profitability first and foremost (which is a line item where we are not seeing improvementwe are not seeing improvement in the near term) and then it was the contracting adjusted profitability margin and contracting free cash flow margin second (adjusted OM and FCF are reversing course, which is why we entered).

We also entered the stock because the forward revenue growth is actually quite high and puts the company into a higher valuation bracket than where it currently participates – but this is only important if we see some improvement in bottom line numbers as the GAAP profitability is where Twilio ranks low as a category peer.

The improvement in FCF and adjusted operating margin was not as easy to see in the previous earnings call because the company had only announced plans to be remote first resulting in lower real estate costs. The 11% layoffs announced in September help to complete the picture.

I do believe the end result will be Twilio becoming (narrowly) free cash flow positive, which I expand on below. Management has already stated they will be profitable on an adjusted basis “by early 2023” and analyst consensus agrees with this. Twilio has not missed a top line estimate or a bottom line estimate for four years (as far back as the history allows) and so the probability the company meets this adjusted profitability expectation in early 2023 is high.

It was primarily valuation that caused us to enter as the company is priced for the worst case scenario. Yes, macro can force valuations lower yet I believe Twilio should be in the 5.5X NTM revenue bracket, and instead, the stock is trading at 3X NTM revenue. The 5.5X NTM cohort still has messy GAAP operating margins yet many are FCF positive.

With quarter or two of a return to FCF positive, Twilio can contend with 5.5X up to 7-9X NTM revenue given its growth rate. Technically, this is still at discount as the organic growth rate would put the company in the 11X NTM revenue bracket. However, GAAP profitability weighs on Twilio and must be discounted, which we discuss below.

Twilio Financials

The company reported revenue growth of 41% in Q2 and is expected to report growth of 31% next quarter. Last quarter, the company reported revenue growth of 48%. This is down from 70%-80% growth in 2019 and down from 60%-70% during 2020-2021. The management has stated their goal is 30% organic growth.

The company’s organic growth was 33% in Q2 with $37 million from acquisitions and $44 million from telecom fees. In Q1, the company reported 35% organic growth.

Twilio’s organic growth is broken out because the company collects and then pays 10DLC A2P telecom fees and the company has also had a string of acquisitions (SendGrid, Segment, Zipwhip and Syniverse, for example).

Next quarter is key because the company will only break out A2P telecom fees for total vs organic as the acquisitions will have lapped one year. For comparison purposes, had this change occurred last quarter, then Q2 revenue growth would have been reported as organic growth of 38.5%.

The company’s net retention rate has slowly eroded over time, currently at 123% down from 127% in the previous quarter and down from 131% in the year ago quarter.

The company reported a GAAP gross margin of 47% and an adjusted gross margin excluding A2P fees of 54.3%. The GAAP GM was 48% last quarter and 47% two quarters ago yet the company previously had gross margins at or above 50%. Any slippage here is penalized.

Management stated the gross margin is lower because international is increasing in percentage of revenue at 35% compared to 33% in the year ago quarter. Here is what was said:

“This decline was primarily driven by the strength of our international messaging business. U.S. 10DLC carrier fees reduced gross margin by approximately 330 basis points in Q2. The continued success of our messaging business often serves as a critical foot in the door with our customers, opening up opportunities to add more value with our higher margin software products over time. We believe this will ultimately drive higher gross margins, allowing us to achieve our long-term non-GAAP gross margin target of 60%+.”

This quarter stood out for having less growth YoY in the company’s total gross profit at 34.5% YoY growth to $445M in gross profits compared to 59% YoY growth last year for $331M in gross profits in the year ago quarter.

Twilio stated goal is to reach 60% GAAP gross margin from a mix of the software product and the core product. Although this may take a couple of years to reach 60% GM, I believe with early signs of GM expansion, the stock will be rewarded.

The adjusted operating loss for the quarter was ($7M). For Q3, the company is guiding for adjusted losses of ($65M) at the midpoint which includes a one-time expense for employee sabbaticals of $35M. As stated, Q3 is expected to be the bottom for Twilio’s adjusted operating losses. Let’s hope it’s also the bottom for Twilio’s gross margin although international mix creates some uncertainty on where this could bottom.

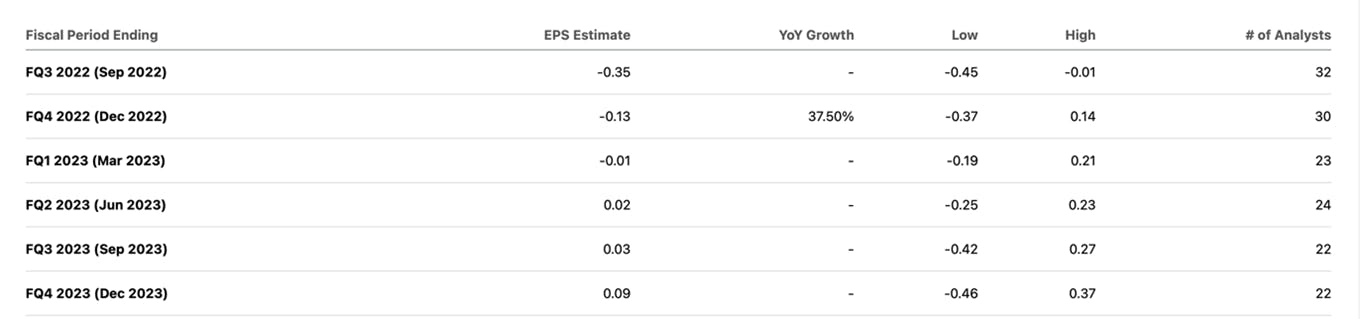
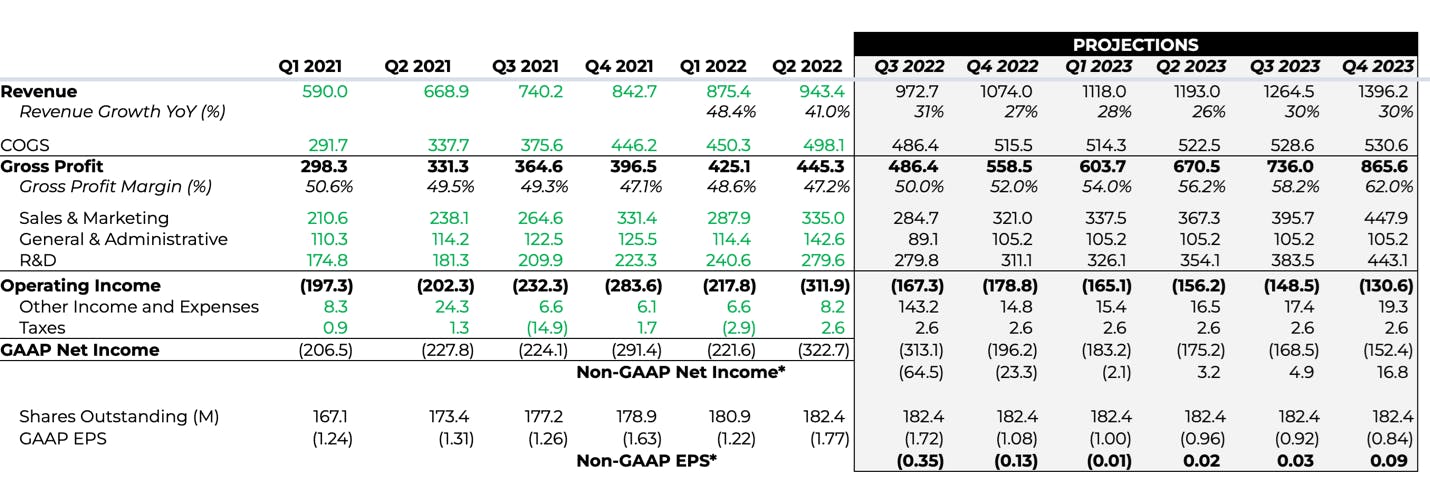
The company reported adjusted EPS of ($0.11) compared to ($0.05) in the previous quarter and is flat from the year ago quarter. The adjusted EPS for Q3 is expected to be ($0.35) and will be ($0.13) EPS in Q4. As stated, by 2023, Twilio will be profitable on an adjusted basis.

Per the CFO on the Q2 earnings call:

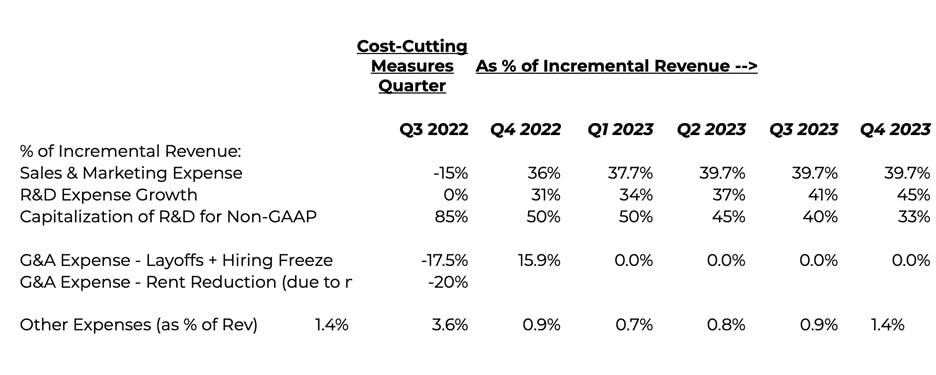
“And you probably noted that we've taken some actions with respect to slowing down hiring except for some key areas. We're taking — we guided based on having a real estate charge, which I think reflects our kind of remote-first approach to the way that we're going to work going forward. And I think both of those things will drive profitability into next year. And I think irrespective of the macro environment, we're intending to be profitable next year no matter whether it has an impact on growth or not.”

Ultimately, Twilio’s Q2 earnings report weighed on the company due to a slipping bottom line. GAAP EPS was ($1.71) versus ($1.31) a year ago. Stock based compensation was at 25% of revenue for $242M, up from 18% of revenue last quarter.

Looking forward on GAAP EPS, there are one-time items that will weigh on Q3’s GAAP EPS. The first is a $100 million expense due to real estate closures as Twilio is moving toward being remote-first. This this was discussed in the prepared remarks: “We also announced our decision to become a “remote-first company” and made a significant reduction in our real estate footprint. We’ll continue to closely monitor the returns on our investments, and make adjustments as needed, in an effort to recognize further efficiencies as we scale.”

The company also recently announced layoffs, which will result in expenses of $70 million to $90 million. This one-time expense will also be primarily recognized in Q3 – so Q3 setting up to have a couple hundred million dollars of extra one-time expenses in the GAAP operating losses.

Twilio had negative free cash flow of ($78.5M) in the most recent quarter with a FCF margin of (8.3%) this is down from (4%) in the previous quarter although a slight improvement from the (11%) in the year ago quarter.

I believe what the market will be looking for is comments on free cash flow as the company LTM FCF was ($253 million) but with the two reductions — real estate from remote work and 11% headcount reduction, Twilio has to ability to become FCF positive very soon – in the next two quarters (Q4 and Q1) once the expenses pass and the reductions start to take effect.

Due to the market being forward looking, this is likely the line item that will help the stock’s price if management can appease The Street. I believe that’s the goal as Twilio has a median salary of $150,000 and at 11% reduction results in $150 million for the year that follows Q3. If Twilio targets a small percentage higher than its median, the company can get this number to $170 million on headcount alone. It’s also reasonable to assume Twilio will see $75 million reduction in real estate expenses. Twilio's lease ends in 2025 so the $100 million fee has to be able to offset three years left in a lease. Maybe it's closer to $50 million but somewhere in that area to justify the $35 million termination fee per year averaged over three years (is my thinking).

Regarding the headcount reduction, Twilio did state that it would come from the core product where they will push customers to be more self-serve. Due to the developer friendly documentation the company provides, they do not believe there will be any additional churn from this transition. From there, they will focus on new hires for the software team.

In addition, Twilio raised equity in February of 2021 and debt in March of 2021. The company currently has debt of $986M and cash and marketable securities of $4.4B down from $5.4B last year due to a $750 million equity investment in Syniverse. Syniverse was valued at $2.85 billion at the time of that Twilio became a large shareholder. Of this, the company has cash of $800 million down from $1.49 billion in the year ago quarter.

Modeling Twilio’s GAAP Profitability

I thought it would be interesting to see a financial model for Twilio’s GAAP profitability given how many moving pieces there are — primarily, operating cost reductions yet an intention to ultimately increase headcount on the software side. Also, I thought it would be interesting to see the impact a 62% gross margin would have if/when Twilio gets there. You can see below this would result in GAAP EPS of ($0.84). This is an improvement but the company will not be GAAP profitable (by this estimate) until the company scales to much higher revenue. The gross margin will not be enough.

You can see the entire model on this Google Doc here. It was prepared by Arun Gopalakrishnan, a Financial Analyst that we are contracted with.

The following information was used for the model:

Expect sales & marketing expense to continue expanding albeit slowly "as we continue to expand our sales efforts globally" coupled with hiring freeze (Source: Q2 2022 page 31 Financials)

Expect R&D to increase as company continues to hire in growth areas and "focus on enhancing Twilio Segment and Flex products and strengthening platform infrastructure". R&D will house most of the increase in personnel costs (Source: Q2 2022 page 31 Financials)

We're focusing our hiring efforts on areas that we believe will unlock significant value and present strong opportunities for continued growth such as Segment, Engage and Flex, and we’ve frozen the vast majority of new hires and backfills outside of these areas. (Source: Khozema Shipchandler – Q2 2022 Earnings Call Page 9)

We also announced our decision to become a “remote-first company” and made a significant reduction in our real estate footprint. (Source: Khozema Shipchandler – Q2 2022 Earnings Call Page 9)

One-Time Expense of $35M in Q3 2022 for new sabbatical program for tenured employees & non cash impairment charge associated with the closure of several offices (Source: Khozema Shipchandler – Q2 2022 Earnings Call page 10)

Excludes One-Time Expenses, Non-Cash Charges, Capitalizes majority of R&D expense. Management is moving salaries to performance based salaries (non-cash) so not included in Non-GAAP.

Source: TWLO Profitability Analysis Google Doc Link Here

What is Twilio’s Thesis?

For Members who have been with our site for a few years, you’ll recall that I’m quite bullish long-term on Twilio. This has not changed, rather macro forced us to step aside and see how management weathers the new FCF-forward reality. My product thesis is best described in a 1-hour webinar from April 2021 but I’d like to take the opportunity to reiterate a few points.

An important catalyst to look for is when Google eliminates third-party data from Android and Chrome when the company officially launches Privacy Sandbox. This was expected to occur in 2023 yet has been delayed to 2024 although is being beta tested right now.

We want to watch Twilio closely around this time as its customer data platform is based off the importance of first-party data, yet the transition that Apple began with deprecating the IDFA and introducing App Tracking Transparency (ATT) will not be complete until Android and Chrome participate.

The results will be mobile identifiers and third-party cookies become obsolete by 2024 (note: I do wonder if this timeline will be moved up to end of 2023/very early 2024 if Google continues to see macro headwinds to its ad business).

Similar to how Twilio was a few years ahead of the mobile app economy, the management is very early is very early to the shift toward leveraging first-party data. Phone numbers and email addresses make up the most valuable first-party data available on the internet called personally identifiable information (PII). I believe the Twilio management team has been planning for this for 6 years since the 2018 SendGrid acquisition which combines their core product’s access to phone numbers with a trove of email data. This was a very smart strategic move that is not fully recognized yet until access to third-party data is eliminated, which will put immense pressure on companies to make the most of their first-party data. The caveat is the management team must execute.

My understanding is that very few companies will be able to help unlock the enormous value of first-party data as Twilio has a natural path to collecting phone numbers and emails on behalf of B2C companies.

Previously, I had written the following which I still believe to be true yet will take time to fully recognize (Google’s move being a lynchpin for Twilio competitors):

“Keep in mind, the power of data exponentially increases so each signal Twilio adds is not a linear increase in ROI from a marketer’s perspective – it compounds. In other words, by having four signals, Twilio can beat a competitor like Mailchimp with SendGrid because of the cross-channel data and touchpoints they offer*. The same could be said for Zendesk versus Twilio Flex as to why Flex might be stronger (cross-channel data points).

This is why, on a product-level, I see Twilio increasing its market share against competitors.”

Note: Twilio is not the marketer, the customer remains the marketer (Nordstrom’s, Kroeger’s, Chevrolet, Proctor & Gamble, etcetera) remain being the marketer. Instead, Twilio helps those companies’ market more their databases more effectively.  This is not the same asnot the same as third-party datathird-party data where Nordstrom’s (for example) mixes data that is not their own to market customers. This is done through third-party platforms with access to third-party data – which is a marketplace entirely enabled through mobile IDs and cookies.

Twilio is building the antithesis of a third-party ad exchange or marketing platform — and doing so well in advance of the first-party data era which officially began last year with Apple.

This was discussed on the Q2 earnings call:

Q: This is Abhinav on for Siti. I guess the first kind of question would be just with Google delaying recently their application of third-party cookies now, again, from 2023 to 2024, have you seen or do you expect this to change the demand environment a little bit around CDP's customer engagement more broadly and maybe that transition away from third party? And do you see some of the urgency kind of diminish for some of your customers that are coming in?

A (CEO, Jeff Lawson): Thanks for the question. Yes, I think what we see is the — it's taking a little bit of pressure off of companies. I mean, if you think about it, like 2023 is not that far away. So in some ways, it's actually pretty reasonable to give a little more time for such a big change in the Internet ecosystem to roll through.

That said, I mean we did a survey, and it was like — I think it was 70%, some number like that, of companies were not ready for this change. Now that creates demand for our products. But you also can't imagine that, that number of companies are going to magically like put the switch and completely flip their technology stack in just a month's time. And so I think it's giving a little bit of pressure release now.

But it still is a great environment for the CDP given that customers actually do have a lot more time to actually make these thoughtful changes, and we are already seeing some fantastic stories from the customer base emerge that really is giving our customers confidence that this first-party data approach is not just going to be tenable, like it's a big change for folks. But actually, it's going to be tremendously beneficial.”

Twilio also frequently discusses the higher ROI they are proving through case studies from using first-party data instead of only relying on third-party data for marketing purposes. Per the Q2 earnings call:

“A couple of the stories that we've shared publicly is Allergan using Segment was able to get a 41% reduction in their cost of customer acquisition, which is — those are amazing numbers. Another great customer story is from Domino's, who in Mexico was using Segment to build smarter customer audiences. And as a result of that, doing better ad buying, and they saw their return on ad spend increased 700%.”

In 2021, we had also discussed Twilio moving from being developer-centric to now also becoming sales/marketing-centric: “This also means Twilio is going through a pivot, not only on the product level but the customer level. Although Twilio will remain a developer-centric company, they will also need to appeal to the marketing and sales departments […] Developers will, of course, be the ones to implement Twilio’s APIs and products but there’s evidence that Twilio’s target customer is expanding to also include “marketing, sales and service leaders.”

This piece of the pivot (the new customer base being enterprises rather than developers) can be seen as either an obstacle or an opportunity. Twilio has certainly increased its serviceable addressable market and any success here will be seen in the gross margin long-term due to software sales.

5G is also a catalyst for Twilio. The company is quietly building more IoT products and will be able to tap into this market when adoption rises. I’ll leave that for a future deep dive when we revisit 5G from the consumer and enterprise standpoint. Marvell would give us the first signal this market is picking up since they are equipment related.

Risks:

A risk to consider is that Twilio’s gross margin could continue to soften from a higher international mix. Political ads will take effect in Q3 with the majority of spend recognized in Q4, which should bump up domestic spend. In Q4 of 2020, political spend was $23 million. The breakdown was not available for Q3 of 2020. Here is what was discussed in the Q4 earnings call:

“Fourth quarter non-GAAP gross margin was approximately 56% and was negatively impacted by 150 basis points from A2P fees. Twilio's gross margin, ex-Segment, was approximately flat quarter-over-quarter, aided by political traffic in the United States.”

If GM continues to soften, then we will look at how this affects the bottom line and make our decision based on both top line and bottom line margins.

Another risk to consider is Twilio’s revenue estimates are quite high in the current environment considering most ad/marketing companies are seeing reduced spend. However, with the current information we have, it seems B2C companies in some industries are less reluctant to switch off SMS compared to ads. Twilio said the following about their current trends:

“Now we did call out a couple of pockets of softness in Elena's section of the prepared remarks, where we commented that, for example, in crypto or social or on-demand related activities that we're seeing a little bit of slowdown. But on the flip, we are seeing some strength as well in financial services and IT-related spending.”

If Twilio misses on revenue, we will be forced to step aside as every management team needs to build trust right now with Wall Street given the bearish market. This is true for most of our stocks.

The third risk to consider is further acquisitions. We will close our position and step aside if this happens as the company has tested the upper limit of our appetite for M&A activity.

Additional Resources:

Earlier this week, we published a forum post about our entry in Twilio. There are additional posts from Members on Twilio that also articulate the pros/cons of this particular company and are well worth the read.

I wrote about Twilio’s gross margin in Q2 2022 here.

Twilio PDF 2021 Analysis
Twilio 1-Hour Webinar

Barron’s Podcast: What the Heck is Going on with Cloud Valuations

Earlier this week, I/O Fund CEO and Lead Tech Analyst Beth Kindig joined Jeremy Owens, Tech Editor, and San Francisco Bureau Chief of MarketWatch, on Barron’s Live. They discussed cloud valuations including those that are trading at 2X above Covid lows, what metrics matter when evaluating cloud companies, and what to watch for in upcoming earnings season — including a few comments on ad-tech. Barron’s Live. They discussed cloud valuations including those that are trading at 2X above Covid lows, what metrics matter when evaluating cloud companies, and what to watch for in upcoming earnings season — including a few comments on ad-tech.

Metrics and Valuations

As discussed in the podcast, the FOMC decisions have forced tech investors to look for cloud stocks that are expanding their margins and also have positive free cash flow. If you look at the best-of-breed companies that command the top 10 in valuations, the majority of them are free cash flow positive.

We had discussed with our premium research members back in May in a special report Compartmentalizing Cloud Stocks that “It’s true that cloud is deflationary but it’s also true that cloud can have profitability issues […] cloud is quite resilient in terms of growth, due to being deflationary, but those weak bottom lines may be questioned over time. Cash came easy over the past decade, and as cloud investors, we need to reframe our thinking on what constitutes an attractive cloud stock.”

Free cash flow is emerging as an important metric because cash gets rerated in a rising rate environment. As stated, not only were many cloud companies were not public during the previous rising rate environment of 2017 to late 2018 – but in addition to this, the previous rising rate environment was quite tame and we are currently in a more aggressive rising rate environment.

Along with free cash flow, GAAP operating margins are being closely examined. This has resulted in companies with high stock-based compensations being penalized during earnings.

The takeaway is that a best-of-breed company with a 15X or higher valuation must remain FCF positive or it will immediately lose its category high valuation. Revenue growth alone is not determining the top spots in this category any longer. This may seem obvious at first thought but we have found it’s better to close a stock at a higher valuation if it has contracting margins.

Sign up for I/O Fund's free newsletter with gains of up to 403% to get analysis like this delivered straight to your inbox every week. Sign up for I/O Fund's free newsletter with gains of up to 403% to get analysis like this delivered straight to your inbox every week. Sign up for I/O Fund's free newsletter with gains of up to 403% to get analysis like this delivered straight to your inbox every week.

The difference between Subscription and Consumption Models

Consumptions models occur in the Big Data and Analytics trend where data storage, processing, and analytic solutions are based on usage rather than on a recurring subscription fee. This trend is becoming popular because with consumption-based pricing model, revenue is uncapped. The consumption billing model does not have a ceiling on revenue, so if customer consumption rises, so does sales. There is what is meant by uncapped revenue potential.

We covered Snowflake’s Consumption Model in January of 2022 when we said in our free newsletter: “While Snowflake uses a “land -and-expand” sales strategy, it also uses a consumption billing model. For instance, Snowflake bills customers based on the amount of data they store and transfer and what resources they use. Accruing revenue based on consumption rather than a ratable subscription model decreases the predictability of quarterly revenue, but it leaves revenue uncapped. This provides revenue upside, because if consumption soars, then so will revenue.”

Some of the drawbacks, however, include the revenue growth being less predictable than subscription revenue. There also isn’t a floor on revenue because if consumption declines, then so will sales. Contracts help protect against this but are often only 1/3 of next 2.5 years of revenue.

The drawbacks were also discussed in the Snowflake’s Consumption Model article in January of 2022, “Another risk is the company’s consumption billing model, which is inherently unpredictable. This can make growth lumpy and some quarters may disappoint the Street. Investors should expect increased volatility in growth from Snowflake in the near term as new customers ramp consumption. However, management does expect revenue growth to smooth and become more predictable in the aggregate as customer consumption scales and matures on the platform.”

The lack of predictability is seen in Snowflake’s earnings history with Q1 earnings reporting revenue growth of 85% YoY to $422.4 million (beat estimates by 2.3%). However, the GAAP EPS missed by $0.02. The management had a hard time convincing the analysts in the earnings call that the company’s revenue was not discretionary and the consumption was lower due to shifting economic circumstances that impacted certain customers, particularly consumer facing cloud companies.

The company’s CFO, Mike Scarpelli, said in the earnings call, “Consumption patterns may fluctuate from quarter-to-quarter. This variability does not detract from our long-term opportunity. Customer’s overall demand for Snowflake remains unchanged. This is supported by the contractual commitments they are making with us and their longer-term plans for adopting the data cloud across their organization.”

In the podcast, we also discussed how net retention rates are often higher for consumption models as spending ramps over time and is uncapped. It’s easier to re-accelerate here for that reason and it’s not the best apples-to-apples comparison for subscription NRR. The net retention rates for subscription-based companies are in the range of 130-140 range while Snowflake has remained in the 170 range.

Another metric is the remaining performance obligation (RPO). When customers sign onto the platform, they purchase consumption at specified prices, which gets recorded as remaining performance obligations (RPO). These contracts are for about 2.5 years. Although these key metrics are important, as mentioned earlier, what the market will reward or penalize most in a rising rate environment are operating margins and free cash flow.

Over the last two weeks, we've entered two bargain priced stocks on our premium site where the market may have gone too far, too fast — particularly those with an improving bottom line. Become a premium member to unlock real-time trade notifications on every entry and exit. Over the last two weeks, we've entered two bargain priced stocks on our premium site where the market may have gone too far, too fast — particularly those with an improving bottom line. Become a premium member to unlock real-time trade notifications on every entry and exit. premium site where the market may have gone too far, too fast — particularly those with an improving bottom line. Become a premium member to unlock real-time trade notifications on every entry and exit.

Ad-tech opportunity

In the interview, Jeremy Owens reminds me that I was the first person to warn him about how the Apple’s IDFA changes that would negatively impact Facebook’s revenue many years ago. It was a bold call at the time because I called the top for Facebook when it was a stock market darling in 2018. Despite the odds, it turned out to be accurate.

We discuss how ad-tech stocks are trading at historically low valuations with many 50% lower than where they have traded during times of economic uncertainty. The share prices of these ad-tech companies can grow over 100%. When the market senses a bottom is in — which I believe was either Q2 or will be Q3 — buyers will step back in to support higher valuations.

We discuss why CTV ads is the most investable trend in media right now.

What to look in the upcoming earnings season

Microsoft’s results are to be closely watched since the company is a bellwether for Cloud. Its suite of Cloud products drives down costs and it’s the most insulated cloud company. It benefits from cloud migrations and also the need for organizations to reduce costs.

Analysts in the earnings call are concerned that the enterprise sector is the next shoe to drop following consumers. The consumer cycle is very short, whereas for Enterprises, it depends on the renewal cycle and there is a period of negotiation. In addition to constrained enterprise budgets, many startups are not able to raise funding and are going out of business, which can weigh on cloud, as collectively startups are a sizable customer for cloud companies.  

The cybersecurity sector has reported exceptional fundamentals given the economic headwinds. Many companies have been reporting high growth rates and are cash flow positive. This sector also has no exposure to discretionary spending, which will help the category sustain long-term.

Bargain Cloud Stocks

We spoke about Best-of-Breed on this podcast yet we are currently building positions in companies that are undervalued and more of a “basement bargain” or “fire sale” valuation as we believe the market has not been entirely efficient with key stocks that have been penalized with low valuations. These stocks are 50% lower than their Covid low and have the potential to bounce back. In fact, one could argue there is more room for gains in these stocks than the best-of-breed companies which are within 30% of historic valuations for cloud stocks.

Sign up for premium to learn more.

Listen on Apple Podcasts | Listen on SpotifySign up for premium to learn more.

Listen on Apple Podcasts | Listen on Spotify

Timestamps:

00:00 Intro
00:44 Valuations
04:40 Consumption-based pricing
11:24 Snowflake vs MongoDB
13:15 Ad-tech
20:15 Upcoming earnings season
22:08 Cybersecurity
24:22 Best practices for retail investors

Please note: The I/O Fund conducts research and draws conclusions for the Fund’s positions. We then share that information with our readers. This is not a guarantee of a stock’s performance. Please consult your personal financial advisor before buying any stock in the companies mentioned in this analysis.

Cybersecurity Stock Faceoff: CrowdStrike Vs. Zscaler Vs. Cloudflare

In the analysis below, I/O Fund analyst Royston Roche puts three strong cybersecurity stocks up against one another on fundamentals. He assigns 3 points for first place and 2 points for second place and 1 point for third place across each of the fundamental criteria. This helps draw a conclusion on which of the three cybersecurity stocks are strongest based on their financials. We chose these three stocks as they are often neck-and-neck on gains and investor sentiment. Read below to find out which of these contenders will win the face off!

The Cybersecurity sector has been less immune to macro environment challenges like supply chain issues, geopolitical tensions, covid restrictions, and trade wars. The Chief Information Security Officer (CISO) surveys also suggested that enterprise spending will increase in 2022 from the previous year. 

The role of Chief Information Security Officers has greatly increased in the last few years, and the recentrecent CISO survey done by Heidrick & Struggles suggests that the security teams have been increasing in size. Another finding from the survey is that CISOs have significant visibility with the board of directors, which shows the growing importance of the cybersecurity sector. Since security breaches can prove costly, corporations and governments will continue to invest in this sector.

We have also recently coveredrecently covered in our free newsletter that the cybersecurity sector continues to lead cloud stocks. This cohort of stocks continue to beat the analyst estimates which is another reason for investors to continue to closely monitor this sector. In this analysis, we compare three cybersecurity companies that all have promising products and provide cybersecurity solutions to modern cloud environments.

Below is a quick recap of the three companies that we have covered in length in our previous articles.

Zscaler’sZscaler’s product has done exceptionally well considering the crowded cybersecurity market. This is due to its best-of-breed, singular focus on security edge and zero trust. Primarily, Zero Trust architecture began to replace VPNs in a meaningful way in 2020 and this has sustained due to the Zero Trust model offering deeper and more scalable protection by eliminating implicit trust. 

Zero Trust Security is built on the premise that no one should be trusted within or outside the network. In the traditional security systems, it is difficult to obtain access from outside the network while those located inside the network were trusted. With Zero Trust, these trust assumptions are removed with tools such as multi-factor authentication, giving access for a limited time, and to also verify, authorize and to have a continuous check on all the data points that are given access.

Next up, CrowdStrikeCrowdStrike was founded with the goal of reinventing security for the cloud era.  CrowdStrike’s Falcon platform delivers comprehensive breach protection against today’s most sophisticated attacks on the endpoint. Due to the sheer number of endpoints in a corporate network, this is where the majority of attacks are made. Compromised credentials across desktops, laptops, and mobile devices are often the hardest points of access to secure.

CrowdStrike’s AI based security model is focused on collecting large amounts of data, centrally storing it in a single model, and continuously training its algorithms with vast amounts of data.  The more data that the Falcon Platform collects, the more intelligent the platform becomes in detecting and stopping breaches.

Our third contender is Cloudflare. What’s remarkable about CloudflareCloudflare is how the company has leveraged its content delivery network footprint to simultaneously be a leader in application and website security. The company further innovated with Zero Trust security, combined with SASE network connectivity, and more recently leveraged the elimination of egress fees for object storage. The latter is the most exciting as Cloudflare has already proven its ability in attracting developers and driving down costs and will now take on AWS head-to-head.

Analyst revenue estimates for the next four quarters

Revenue Estimates for Next Four Quarters

Source: Seeking Alpha 

Note: Zscaler has a fiscal year ending in July, CrowdStrike in January, and Cloudflare in December. We have adjusted the information above to reflect the calendar year quarters.

In the above chart, the three companies are ranked based on the revenue estimates for the next four quarters. CrowdStrike is expected to grow the fastest among the three companies in the next four quarters when we average each quarter's growth.

The analysts expect Zscaler’s revenue to grow 48% YoY to $340.7 million in the Q3 CY2022. The company’s revenue grew 61% YoY to $318.1 million in Q2 CY2022 (beat estimates by 4.1%). They expect CrowdStrike's revenue to increase 51% YoY to $575.05 million in Q3 CY2022. CrowdStrike grew its revenue 58% YoY to $535.2 million in Q2 CY2022 (beat estimates by 3.6%). 

The analysts expect Cloudflare’s revenue to grow 45% YoY to $250.64 million in Q3 CY2022. The company’s revenue grew by 54% YoY to $234.5 million in Q2 CY2022 (beat estimates by 3.1%). However, all three companies show a deceleration in growth compared to the most recent quarter.

Analyst adjusted EPS estimates for the next four quarters

Analyst Adjusted EPS Estimates for Next Four Quarters

Source: Seeking Alpha 

In the above chart, the three companies are ranked based on the adjusted EPS estimates for the next four quarters. Zscaler ranks first with the highest average growth. However, Cloudflare’s data was not available for all quarters. In this case, I am assigning 3 points to both Zscaler and Cloudflare, because Cloudflare’s EPS is now turning positive. It’s an important milestone when a company turns profitable and the analysis should not overlook this. Below, we look closer at the significant change for Cloudflare in the analyst adjusted EPS estimates beat history chart. 

The analysts expect Zscaler’s adjusted EPS to be $0.26 in Q3 CY2022. The company had reported an adjusted EPS of $0.25 (beat estimates by $0.04) in Q2 CY2022 compared to $0.14 for the same period last year. CrowdStrike is expected to report $0.32 in Q3 CY2022. The company had reported adjusted EPS of $0.36 (beat estimates by $0.09) in Q2 CY2022 compared to $0.11 in the same period last year. 

Cloudflare is expected to report break-even adjusted EPS in the Q3 CY2022. The company had also reported break-even adjusted EPS (beat estimates by $0.01) in Q2 CY2022 compared to a net loss per share of $0.02 in Q2 CY2021.

Analyst revenue estimates for the next three years

Analyst Revenue Estimates for Next Three Years

Source: YCharts and Seeking Alpha 

The above chart compares the three companies based on the revenue estimates for the next three years. CrowdStrike ranks at the top with the highest compound annual growth rate of 41% in the next three years.

Zscaler’s revenue grew by 62% YoY to $1.09 billion in the FY ending July 2022. Consensus for fiscal year 2023 ending in July is for revenue growth of 38% YoY to $1.50 billion. CrowdStrike’s revenue grew by 66% YoY to $1.45 billion in the FY ending January 2022. Consensus for fiscal year ending in 2023 is for revenue growth of 54% YoY to $2.23 billion. Cloudflare’s revenue grew by 52% YoY to $656.43 million in the FY ending December 2021. Analysts expect Cloudflare’s revenue to grow 48% YoY to $970.73 million in the FY ending December 2022.

Analyst adjusted EPS estimates for the next three years

Analyst Adjusted Estimates for Next Three Years

Source: YCharts and Seeking Alpha 

The above chart compares the three companies based on the adjusted EPS estimates for the next three years. CrowdStrike ranks at the top with the highest CAGR of EPS. Also, I would assign 3 points to Cloudflare as the CAGR calculation is not possible since the company previously had negative EPS. However, reaching profitability is a significant milestone for a cloud company. 

Analyst revenue estimates beat history

The next benchmark is ranking the three companies based on the number of times the company beat estimates. 

Zscaler beat revenue estimates in the last 16 quarters.

Zscaler Beat Revenue Estimates

Source: Seeking Alpha

CrowdStrike beat revenue estimates in the last 14 quarters. 

Crowdstrike Beat Revenue Estimates

Source: Seeking Alpha

Cloudflare beat revenue estimates in the last 12 quarters.

Cloudflare Beat Revenue Estimates

Source: Seeking Alpha

All three companies beat revenue estimates on all occasions and have ranked the same with three points. 

Analyst adjusted EPS estimates beat history

The next benchmark is ranking the three companies based on adjusted EPS estimates beat. 

Zscaler beat the adjusted EPS estimates in the last 16 quarters. 

Zscaler Adjusted EPS Estimate Beat

Source: Seeking Alpha

CrowdStrike beat adjusted EPS estimates in the last 14 quarters. 

Crowdstrike Adjusted EPS Estimate Beat

Source: Seeking Alpha

Cloudflare beat adjusted EPS estimates in the 10 out of the last 12 quarters and was in-line once.

Cloudflare Adjusted EPS Estimate Beat

Source: Seeking Alpha

In the above benchmark, Zscaler and CrowdStrike get 3 points and Cloudflare gets 1 point.

Price to Sales Ratio

Zscaler, Crowdstrike and Cloudflare Price to Sales Ratio

Source: YCharts

The next benchmark is ranking the three stocks based on the P/S ratio. CrowdStrike ranks the top with the lowest P/S ratio of 20.08, followed by Zscaler at 20.74, and Cloudflare at 21.63. 

CrowdStrike has also the lowest NTM P/S ratio of 14.66 followed Zscaler and Cloudflare which both have 15.79. 

Free Cash Flow Margin

Free Cash Flow Margin

Source: YCharts

The next benchmark is ranking the three companies based on the recent quarter’s free cash flow margin. CrowdStrike ranks at the top with a free cash flow margin of 25%, followed by 24% for Zscaler, and -2% for Cloudflare. Also, CrowdStrike’s free cash flow has been consistently positive, as seen in the chart above.

Operating Margin

Operating Margin

Source: YCharts

The last benchmark is ranking based on the recent quarter’s operating margin. CrowdStrike ranks at the top with an operating margin of -9%, followed by Zscaler’s -26%, and Cloudflare’s -28%.

Conclusion

Boxing Match Winner

In our cybersecurity face off, CrowdStrike is the winner with 28 points. The company has better forward revenue growth, free cash flow margin, operating margin, and the management has consistently shown its ability to beat estimates.  

Second place is Zscaler, which had a strong earnings report. The company’s revenue beat of 4.1% was higher than CrowdStrike’s 3.6% beat and Cloudflare’s 3.1%. Zscaler’s revenue guidancerevenue guidance for the next quarter is $340 million at the mid-point of the guidance, representing a YoY growth of 47.5%. It was significantly higher than the consensus estimates of $326.16 million, a 6% guidance beat for the next quarter.

Third place was Cloudflare, primarily due to the company’s negative free cash flow while peers are much stronger here. Secondly, Cloudflare has reached profitability on a non-GAAP basis in Q3 2021 which is an important milestone for a cloud company yet the margin is thin and the company could slip to unprofitable off any given earnings report. However, tech is led by product and Cloudflare has made some exciting, strategic moves lately, which we've outlined in past analysis. This is a comprehensive fundamental overview, yet truly anything can happen, and each earnings season things change. So, stay tuned as we monitor these three for progress moving forward.