The Stock Market Could Go Higher — Here’s Why

On October 13th, within the first 30 minutes of the trading day, we removed half of our hedge and went on a buying spry at the I/O Fund, notifying our advanced premium members of our every move. Our broad market work was suggesting a buyable low was likely, and since then, the patterns we are seeing off this bounce is suggesting that it could be more than another bear market bounce.

The below clip is the first part of our weekly webinar from last week. We dive into what various markets are suggesting about the bear market potentially being over. Each week we look at new information so that we can stay on the right side of the trend. We then go into various tech stocks that we are either buying or looking to buy.

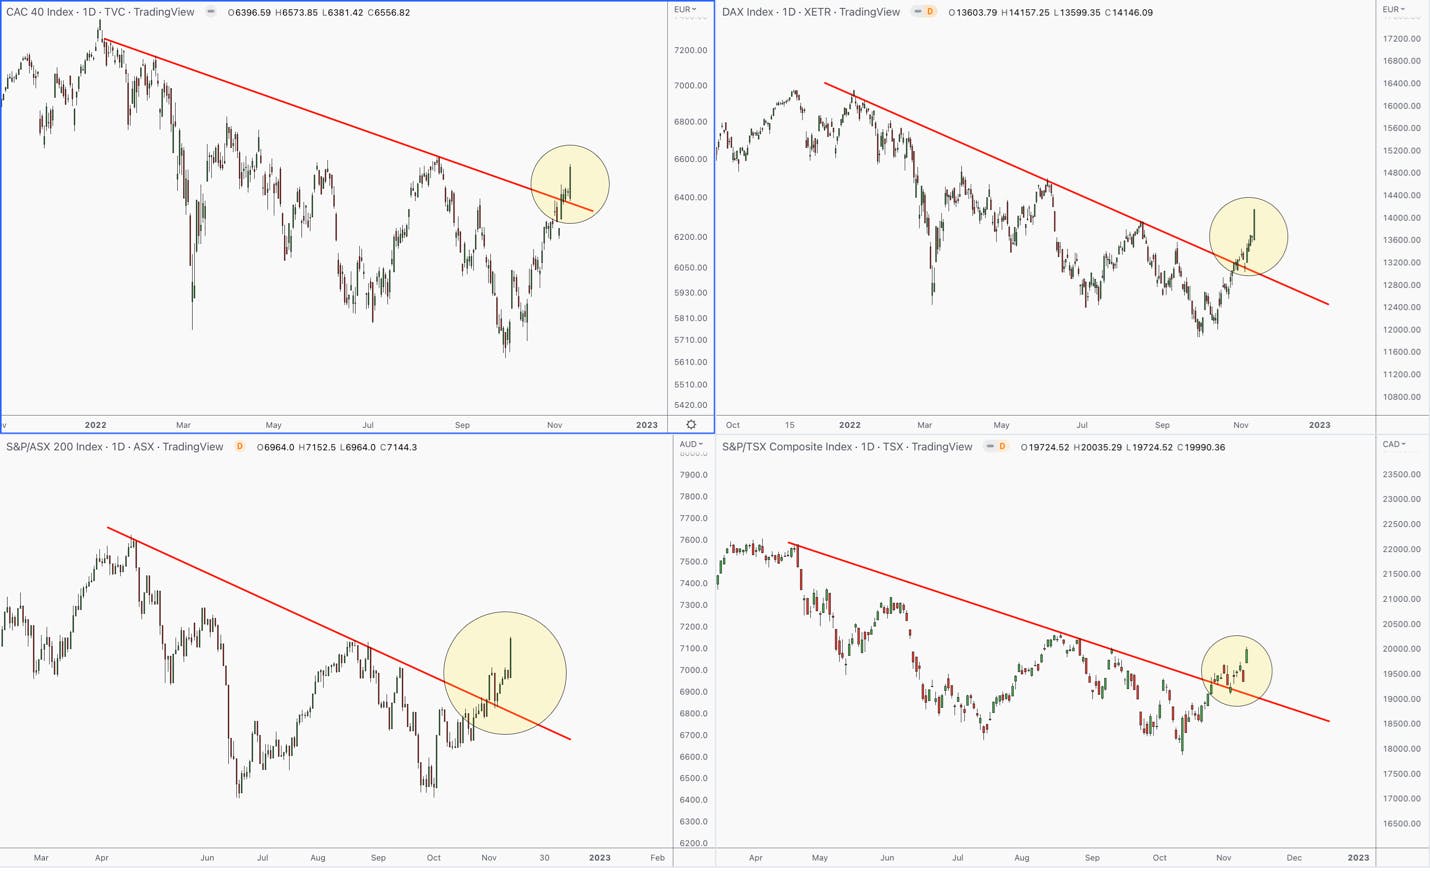
Summary: for well over a month we have been pointing out the complex bottoming process that has been unfolding. Global markets like the Australian XJO, Canadian TSX, and Japanese Nikkei appear to have bottomed before the U.S. markets, and are also suggesting that they want to make one more push to new highs in the coming months. Also, the German Dax and French CAC 40 have broken out of their bear market trend lines, which further suggests that a bigger move higher is underway. 

These are markets from different regions of the world all suggesting a meaningful low could be in place. This is accompanied by many of the boring value names in the U.S., like JP Morgan and Caterpillar who are nearly between 30-45% off their lows. These stocks, like many we track, are also suggesting that they could make a run to new highs in the coming months. This is clearly showing up in The Dow Jones Industrial Average. It is actually closer to making a new high than new low, while comfortably above its 200 day moving average.

The reason I am pointing this out is because big trends, like the ones we saw in January and September of 2022, only occurs when all markets are working together and pointing in the same direction. This is simply not happening right now. Instead, we seem to have more markets and stocks pointing higher, with new leadership taking hold.

While some tech names could make new lows, we believe many stocks will make higher lows. Furthermore, there are some tech names that we have identified that are +40% off their lows, and bottomed in May of 2022. We believe choice tech names will continue to lead but it will not be like the stocks we have become so accustomed to in the past.

On the I/O Fund premium siteI/O Fund premium site, we provide weekly one-hour webinars weekly one-hour webinars that discuss what the I/O Fund is buying and selling. We also have a proprietary hedging signal that we monitor in real-time, a fully transparent portfolio of 20+ positions, real-time trade notifications, and more. To get access to all of this, learn more about our Pro and Advanced plans here.

dLocal Q3 Earnings Update

dLocal delivered yet another strong quarter. However, the analysts concern on the Argentina crisis and the rise in company’s operating expenses in Q3 seem to dampen the upside to the stock. The company’s revenue grew by 63% YoY and up 11% QoQ to $111.9 million. The company beat the analysts revenue estimates by 1.6% and the revenue growth is good in spite of the high comps of last year. The total payment volume (TPV) grew by 51% YoY and 12% QoQ to $2.7 billion.

The company’s net revenue retention rate came at 152% compared to 157% in the Q2 2022 and 185% in the same period last year. The NRR has decelerated, however it is within the management guidance of above 150% for the year 2022.

The company’s revenue from top 10 merchants accounted for 53% of the revenue. This is down from 51% in Q2 2022 and 57% in Q3 2021.

The company’s LatAm revenue grew by 39% and flat QoQ to $87.3 million. The LatAm revenue accounted for 78% of the total revenue. Excluding the Argentina’s cross border business, it grew 43% YoY and 7% QoQ in LatAm. Argentina’s central bank has imposed some limitations to access the foreign exchange market for the payment of certain imports of goods and services as the country faced a fall in foreign currency reserves. The management mentioned in the call that the situation has improved during the quarter. However, the analysts were not too impressed as they had concerns that these issues in Argentina could be recurring unless the situation in Argentina improves.

The company’s revenue in Asia and Africa grew by 312% YoY and 80% QoQ to $24.5 million. It accounted for 22% of the total revenue compared to 9% in the same period last year. The management is positive on the growth in these regions. The company’s single API has helped it to quickly ramp up in these regions.

The company’s President, Jacobo Singer said in the earnings call, “So I think, overall, it's taking what was saying, the fact that we have a single API we call — and we have. There are a lot of analogies between the services we have been providing Latin America and opportunities that are in Africa and in Asia, and we have been able to replicate our playbook in LatAm in those two continents. And the merchants, they value a lot the fact that, that playbook is constant on the same API and on the same agreement, allow them to test our service or in the region faster than doing any other solution before.”

The company’s gross profit grew by 56% YoY and 9% QoQ to $53.9 million with a gross profit margin of 48% compared to 49% in Q2 2022 and 50% in the same period last year. The management mentioned that the slight decrease was due to the country and product mix. Diego Canay, CFO of the company said in the earnings call, “Our cost of processing for the quarter represented 2.0% of our TPV, stable quarter-over-quarter and compared to 1.8% a year ago. The increase versus Q3 2021 was driven by business mix, particularly an increase in pay-ins, which have higher processing costs than payouts.”

The operating profit was $37.2 million compared to $21.6 million in the same period last year. The operating margin was 33% compared to 31% in the same period last year. There was a rise of operating expenses that was primarily due to the increase of headcount, marketing, and travel expenses.

Diego Canay said in the earnings call, “If we look at operating expenses for the quarter, we see that they have grown 26% year-over-year, as we saw an increase in salaries as we continued expanding our team with focus on sales, expansion and technology. In addition, we increased our travel and marketing expenses. We operate in a hyper growth business and want to keep investing in building the infrastructure and harvesting long term sustainable growth with a very disciplined and lean approach.”

The company’s net profit came at $32.5 million compared to $19.7 million in the same period last year with the net profit margin of 29% during both the periods. The company’s EPS came at $0.10 compared to $0.06 for the same period last year. The company missed the analysts EPS estimates by $0.01. The profits for the current quarter include net financial losses of $2.5 million which was mainly driven by higher cost of hedges due to the changes in FX regulations and higher interest rates. The management expects these financial costs to get normalized in the coming quarters.

Jacobo Singer said, “So regarding financial expenses and related to this particular change in regulation, yes, part of Q3, we have incurred into high cost of hedges because of the change in regulation. We see these being temporary changes, which we need to incur extraordinary in order to cover our position. As we have always been saying, we take a very conservative approach towards FX. We have never been in the business of taking corrective risk — so that's why we hedge non-dollar amount. If anything, we expect in the coming quarters this cost to get again normalized going forward.”

The adjusted EBITDA increased by 58% YoY and 9% QoQ to $42 million. The adjusted EBITDA margin was 37% compared to 38% in the last four quarters. The management has a given a guidance of 35% plus for the year 2022. To an analysts question for the guidance for Q4, Diego Canay replied, “Sure. So we give you annual guidance, so we're not giving guidance per quarter. As we mentioned, all the strengths continue in terms of growth. As I mentioned, we have an increase in OpEx in the third quarter, but we don't expect that type of increase in the coming quarter. So we expect operating leverage going forward. We will guide for a new EBITDA margin level in the next year, but these are the trends that we are seeing right now.”

The company has a cash and marketable securities of $542.3 million which includes $320 million of own funds and $222 million of merchant funds. The company has debt of $14.8 million. The company generated a free cash flow of $121 million in the past year.

The Low is in for Bonds, As Well As Most Stocks (For Now)

Last week, the market went through one of the largest intraday swings since the bear market began in 2022. Since then, we have reclaimed that high. The question is: what does this mean for the market in the long term?

How the Chaos Began

It started with the FED. They indicated they are now more open to pausing interest rate hikes, which sent markets soaring. The Federal Open Market Committee (FOMC) announced that, instead of reacting to only the latest inflation numbers, they will take in the “cumulative effect” of all their rate hikes.

They further acknowledged that the aggressive actions they’ve taken to combat inflation need time to play out. In other words, it remains to be seen whether they will they be seriously damaging, ineffective, or somewhere in-between. This startling self-awareness implied that the FOMC may not need to aggressively raise rates until the effects of their rate changes are truly obvious.

The market jumped 1.5% on this announcement, as pundits began to suggest a pause was insight.

However, in the speech that followed, Jerome Powell halted bullish emotions. He acknowledged that inflation has not come down as expected, even though supply chain issues that plagued most of 2021/2022 have been resolved. But he called a pause “very premature”— there’s still so much further to go, both in how high the rate could go and in the duration that they need to stay in the stratosphere.

And so, the press conference led to a plunge in the S&P 500, which closed down -3.4% from its high earlier in the day. It became the worst sell off on a FED-day since January, which has led to a retrace of most of the bounce from the October 13th low.

What Happens Next

You might assume we should brace ourselves for a new low in the S&P 500. That would be the prevailing trend preceding every FED meeting this year, but the market isn’t operating in a vacuum, and when you look outside of the S&P 500, a different story continues to emerge.

While some FAANGs and tech darlings, like TSLA, continued lower, many sectors and global markets continued higher. We’ve been trained for over a decade to follow tech, as it will lead the market. However, a seismic shift is occurring in real-time, as new leaders are being minted. The bond market was signaling to anyone listening that this FOMC meeting was different, as the complex bottoming process we have been discussing for weeks continues to build.

This shouldn’t be a surprise to our regular readers on Seeking Alpha. Here’s what we’ve been saying:

“…more and more signs are pointing to a bigger trend reversal underway.”

“…global markets did not follow the S&P 500 to new lows last week. Instead, they are signaling that a new push higher is likely to follow.” new push higher is likely to follow.”

“…the last time we saw these patterns was in mid-June, just before the market moved up 18% in less than 2 months…”

Those predictions, by the way, were all within the past month.

Value is a Major Indicator of the Next Upward Swing

The Big Five tech companies, also known by the acronym the FAANG, are having a rough time, especially Facebook (where thousands are being laid off), and Amazon and Google, which hit new lows, most people ignored what the rest of the market was saying.

Last week we discussed how boring Caterpillar and JPM Morgan have made their first higher high, as they are closer to making all-time highs than lows. This week, we will continue with theme from a broader perspective.

The DOW

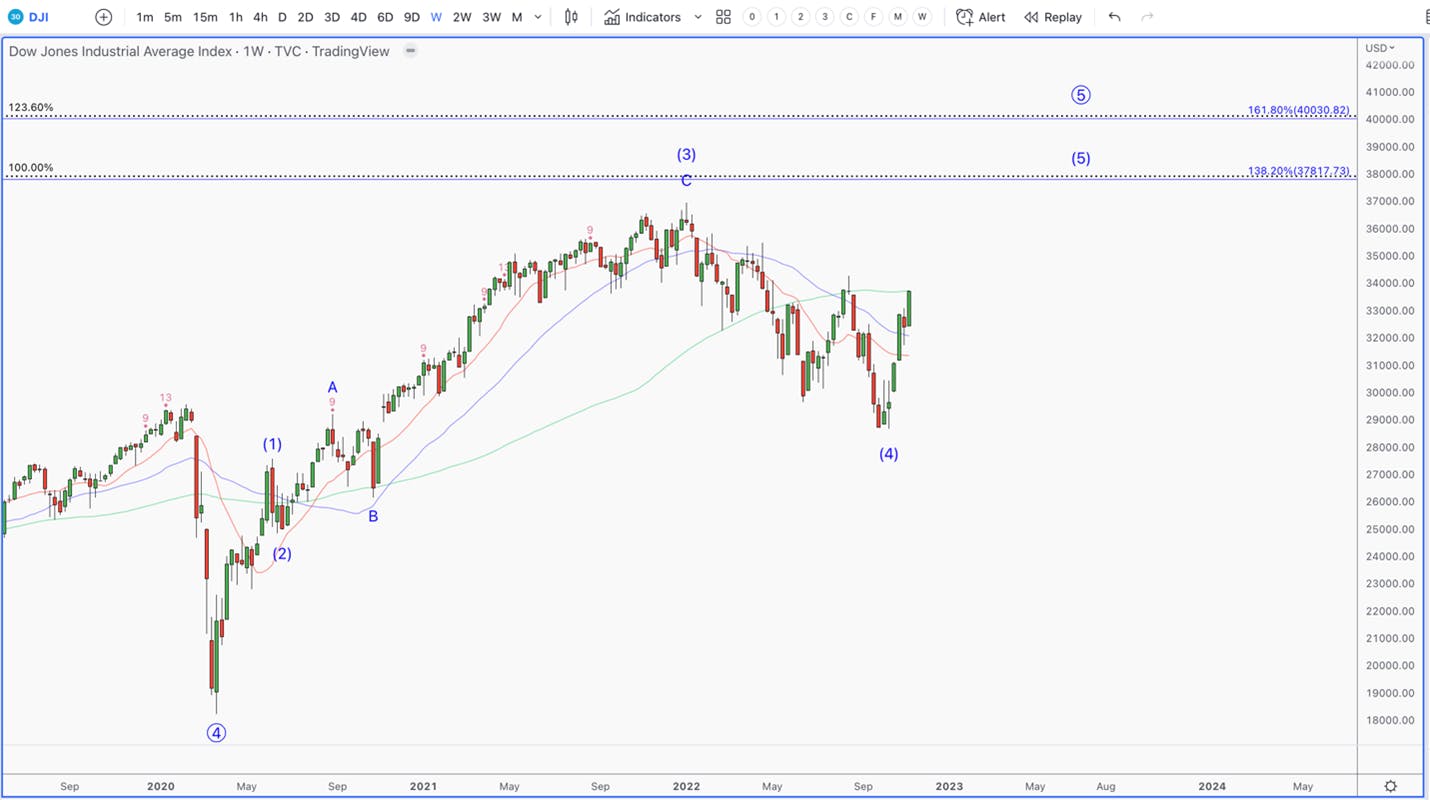
The oft-ignored Dow Jones Industrial Average (DJI) has just given us a clean and clear 5 wave pattern off its late September low, while also reclaiming the 200 day-moving average. Not only did it bottom before the NASDAQ and S&P 500, but this 5 wave pattern suggests a much larger trend is developing. Translation: If the next pullback holds the low, and we can breakout to new highs, I see the Dow Jones powering to new all-time highs in the coming months.

Dow Jones Industrial Average Index Chart

This is not only limited to U.S. value stocks. Global markets are also setting up for a bigger push higher. The French CAC-40 and German DAX have recently broken out of their bear market down trends. This is in light of Europe facing all the problems the U.S. is facing currently facing with inflation, on top of a serious energy crisis.

The Canadian TSX as well as the Australian XJO have broken out of their bear market trend lines. Interestingly, these too markets appear to be setting up for a run the higher highs like the Dow Jones.

CAC 40 Index TradingView Chart

The reason I am mentioning this is because really big trends occur when all markets are moving in the same direction. While tech and some FAANGs have a setup to go lower, the rest of the market looks like it is setting up to go higher. It’s important to track these markets in order to get clues on when bottoms (and tops) are developing. A bottom never happens when everyone is expecting it, and it almost always happens when sentiment has reached a bearish extreme.

Transportation Is Having a Bonanza

The transportation sector has historically been a leading indicator of America’s economic growth, and therefore it often leads the stock market.

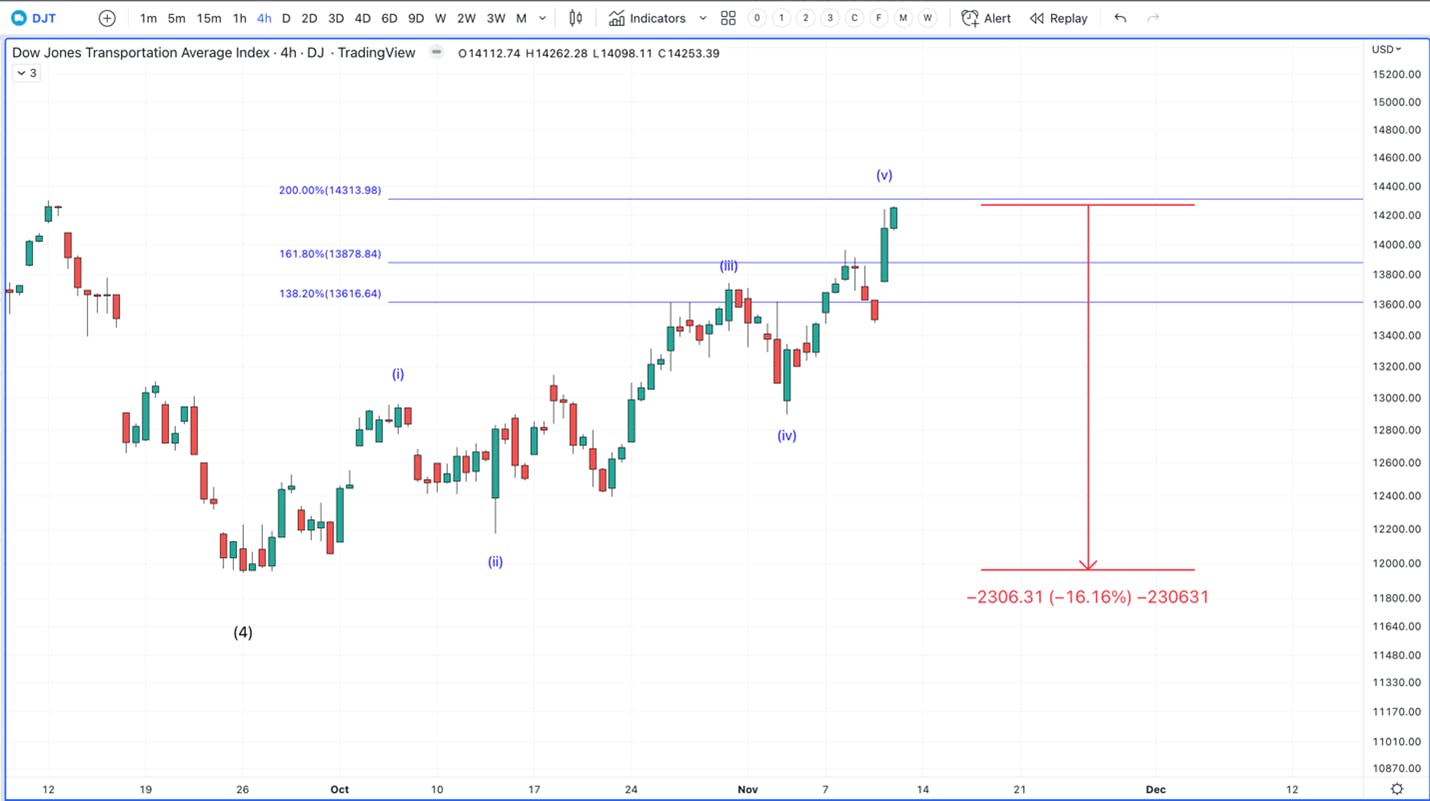
The Dow Jones Transportation ETF (DJT) is also exhibiting relative strength compared to the broad market. While the Tech heavy NASDAQ-100 is about 9% off its lows, and the S&P 500 is 12% off its lows, DJT is over 16 % off its lows.

Dow Jones Transportation Average Index Chart

Also, like the Dow Jones, it has just completed a 5 wave pattern off the low, suggesting that a bigger rally is likely.

If the next pullback can hold the low, and then turn back above to make a fresh high, it will be signaling that a major low was put in as we move into the heart of a new rally.

The Bond Market Called the FED’s Bluff

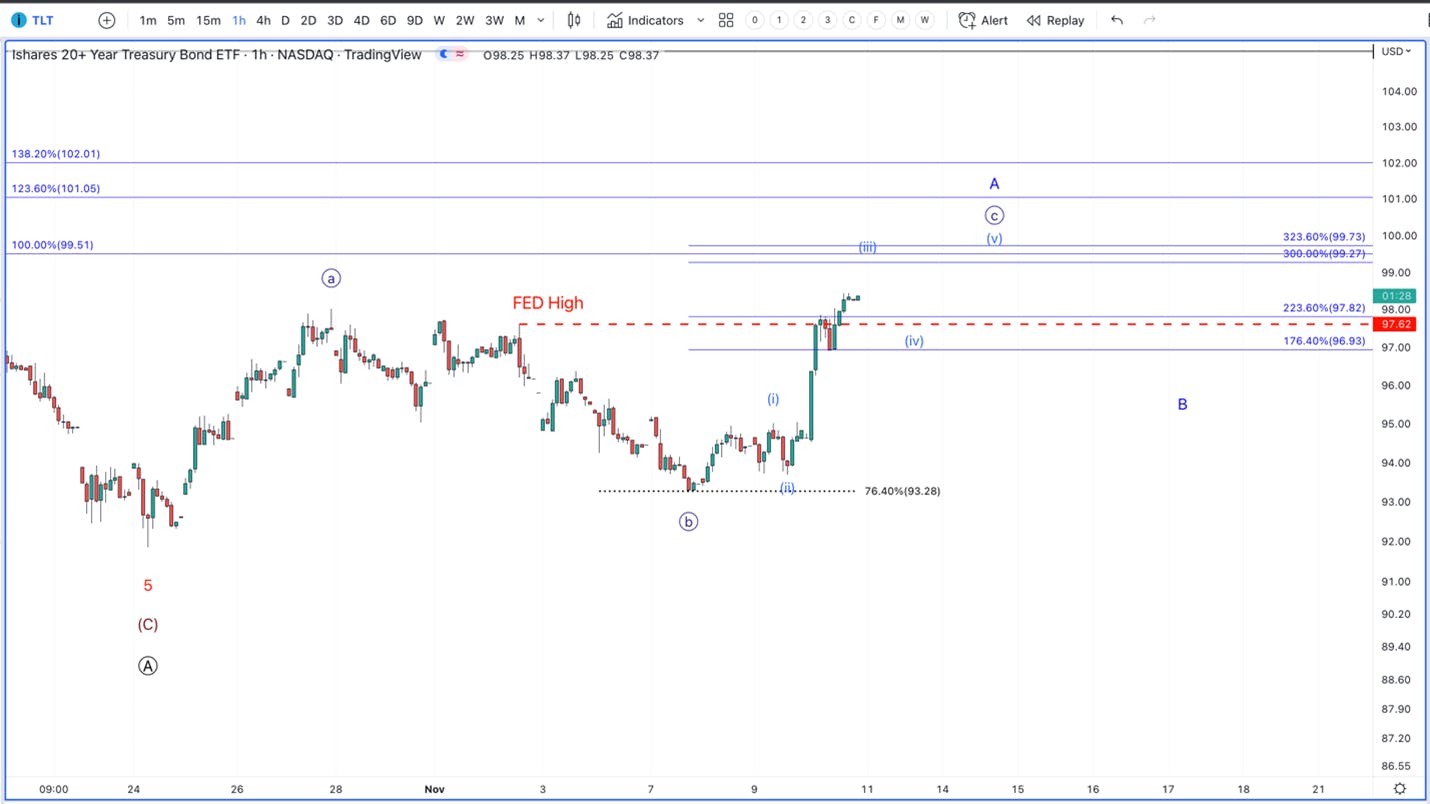
The FOMC announcement triggered an odd reaction in a sector few were paying attention to: bonds. The further one gets on the curve, in our experience, the less of an effect FED decisions has on rates; instead, growth and inflation expectations affect them more. After every hawkish policy decision this year, we have seen rates go higher, as long duration bonds hit a fresh low.

Last week, we discussed how bonds were setting up for a multi-month rally. This week we will acknowledge the very important fact that bonds not only failed to make a new low after the last FED speech, but they have since reclaimed the high on FED-day. This is significant, as the bond market is pricing in inflation and rate hikes, and signaling a low in bonds.

Ishares 20+ Year Treasury Bond ETF Chart

As bonds catch a long-term bid, rates will only go lower. This will force many beaten down tech stocks, which are simply long duration assets, to get repriced. This will be a tailwind for tech, and we believe today was the beginning of this repricing.

In anticipation of favorable repricing, coupled with tech’s beaten down valuations, we have been building key positions with real-time trade alerts sent to our premium subscribers.

Sign up for I/O Fund's free newsletter with gains of up to 221% – Click hereSign up for I/O Fund's free newsletter with gains of up to 221% – Click hereClick here

Market Levels

Reminder: the market rallied about ~12% just on a rumor of a potential pivot by the FED. Regardless of whether you believe we had it, the market definitely sold the news, and failed to make a new low. Not only that, but the S&P 500 reclaimed the 3912 level which was the high going into the FED speech. This is significant, as it is the first FED high the market has taken back in 2022.

With the divergences we have been talking about for weeks, if we do see continued volatility, it will likely be setting up a buyable low as we setup for a larger rally in the coming weeks.

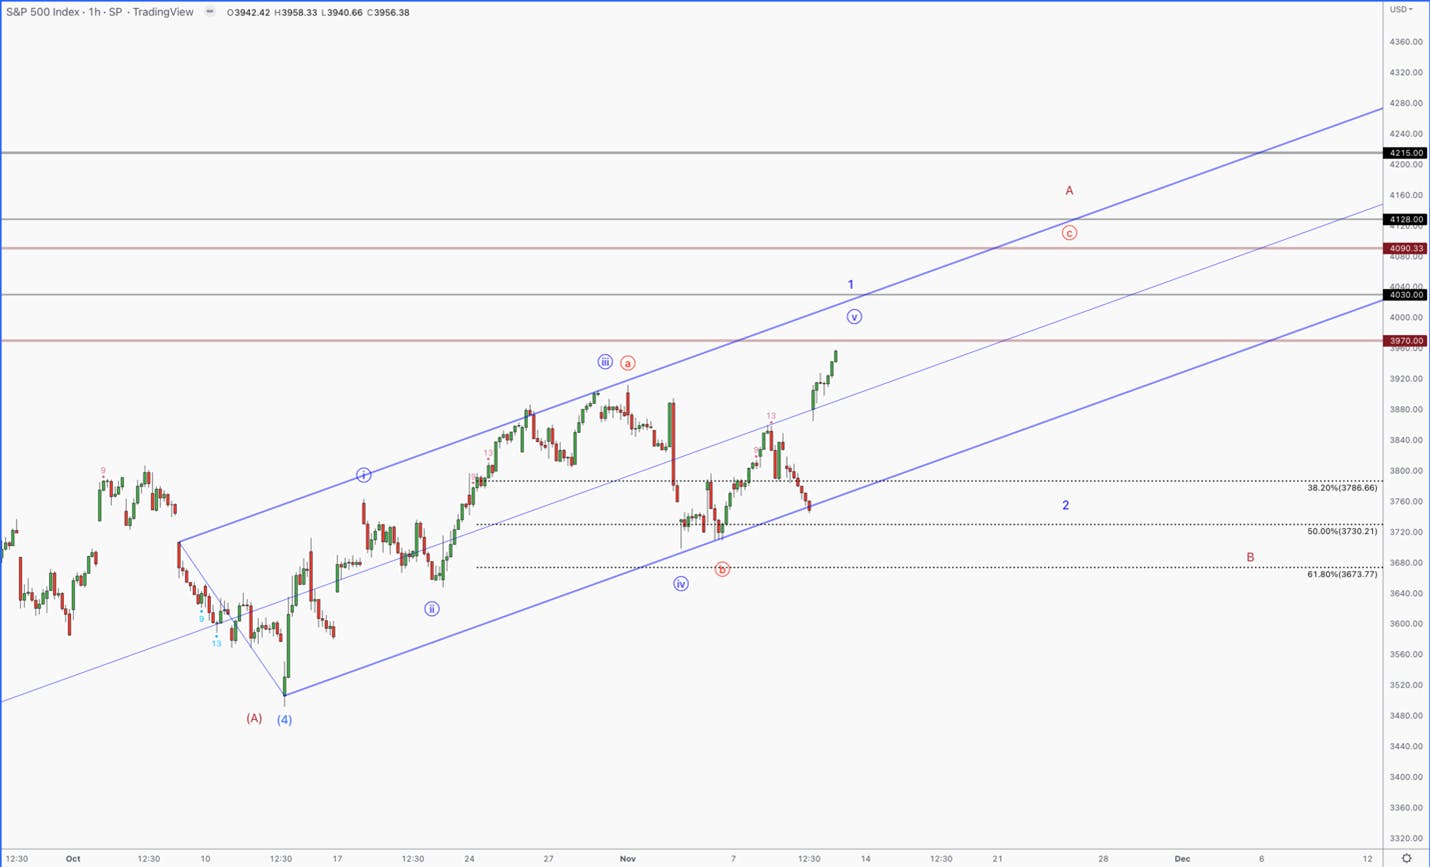
The S&P 500 is not as clear as the Dow Jones. Like DJT, it completed 5 waves off its October 13th low, but it did so in a messy fashion. There are two primary probabilities: either the S&P 500 will make a new high in 2023 OR will instead play out a larger degree bear rally. If the next pullback can hold the low, then turn back and make a new high, I will be leaning towards the S&P 500 seeing new highs into 2023.

This would occur in large swings and likely take us back to 4300 SPX. It would be the scenario where some stocks and markets make new highs, while others do not. However, what is important to understand is that when you combine what rates, the dollar, global markets and many value stocks are telling us, it is that a large rally of some kind is under way.

S&P 500 Index TradingView Chart

What’s Coming— And When

The potential for some stocks to make a new low is present. However, the larger setup is for stocks to keep pushing higher. Short of a black swan event, we think most of the risk over the intermediate to long-term time frame is up — but the FAANGs do not appear to be leading, as we have been accustomed to expect. However, weakness in these companies does not seem to be signaling weakness across the market. As long as rates hold their high, and many of the value stocks that are well off their highs hold, I see any additional volatility as a buying opportunity.

Regarding tech, not all companies are equal. One of the strongest companies in the market, is a well-known tech name, bottomed in May and is nearly 40% off its lows. While we will likely not see an all-encompassing tech rally, we do believe some names are setting up to be new leaders. The prices we are seeing, we believe, will pay off handsomely in the coming years.

Who’s ready for it?

Every Thursday at 4:30 pm Eastern we provide our Premium Members with a weekly market webinar where we discuss the stocks we’ve entered and exited throughout the week, plus stocks that are about to break out and our buy plan. The information from our weekly webinars have been used to successfully hedge our portfolio multiple times in 2022, as well as build positions at key levels. When we buy positions, sell positions or hedge the market, real-time trade alerts are sent to our Premium Members plus we offer a fully managed portfolio including details on allocations.

Please note: The I/O Fund conducts research and draws conclusions for the Fund’s positions. We then share that information with our readers. This is not a guarantee of a stock’s performance. Please consult your personal financial advisor before buying any stock in the companies mentioned in this analysis.

Meta Stock: The rising expenses and Capex are worrying

Meta shares nosedived 25% after the company's recent Q3 results. Meta's expenses are rising and the company is seeing softer revenue growth and softer margins. The slowing advertisement revenue has forced the company to look for new investments and the market is doubting when or if these investments will pay off.

Perhaps most importantly, the increase in expenses and Capex has plummeted Meta's cash flow margin in the most recent quarter. This is a material change to Meta’s story as the company was the leading FAANG stock on free cash flow yet reported a sudden, drastic reversal in Q3.

Below, I discuss the company's recent results in a detailed analysis below.

Meta’s Revenue is Slowing

The company’s revenue in Q3 fell by 4% YoY to $27.71 billion and was up 2% on a constant currency basis. The company managed to beat the consensus estimates by 1.2%. This is the company's second consecutive quarter of declining revenue.

CEO Mark Zuckerberg attempted to address concerns in his opening remarks yet the market was not buying it, “We now reach more than 3.7 billion people monthly across our Family of Apps. And while we continue to navigate some challenging dynamics of volatile macro economy, increasing competition, ad signal loss and growing costs from our long-term investments, I have to say that our product trends look better from what I see than some of the commentary I have seen suggests.”I have to say that our product trends look better from what I see than some of the commentary I have seen suggests.”

While the company does not fully acknowledge the change in business model that we discuss in our analysis “Facebook Stock: A Permanent Change To The Business Model” results show that the company is struggling with growth. The management expects growth to return next year as Mark Zuckerberg said, “We are still behind where I think we should be, but we believe that we will return to healthier revenue growth trends next year. That said it’s not clear that the economy has stabilized yet.”

Management’s guide for next quarter is $31.25 billion at the mid-point of the guidance, representing a YoY decline of 7.2% and the guide includes 7% foreign exchange headwinds. Analysts expect revenue to decline by 6.1% in Q4 and 1.6% in Q1 2023. The consensus estimates suggest that revenue growth is expected to return in Q2 2023.

Softer Operating Margins

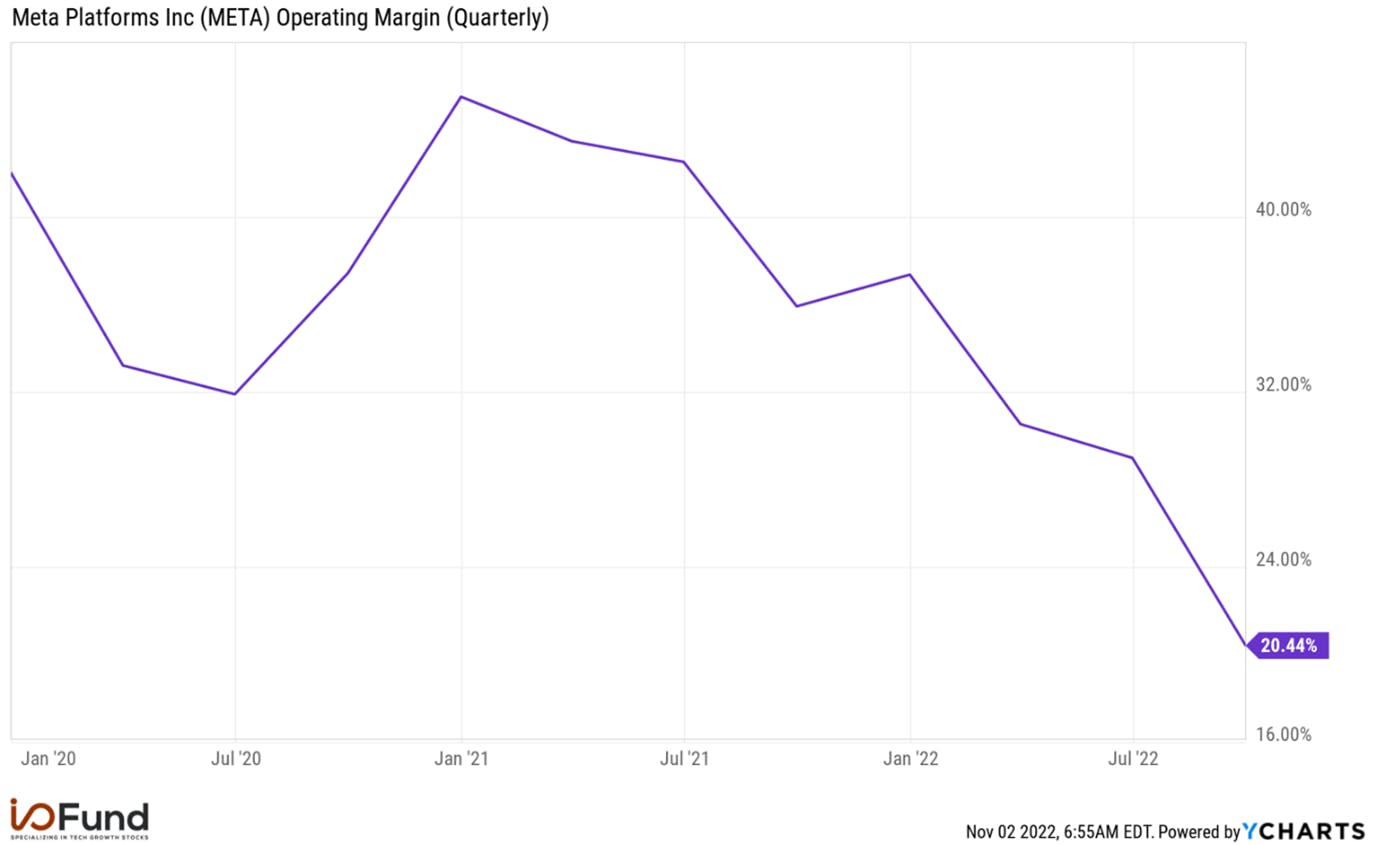
In addition to revenue declining, the sell-off was also fuelled by a declining operating margin. Operating income fell 46% YoY to $5.66 billion. The Family of Apps segment operating income was $9.3 billion and Reality Labs operating loss was $3.7 billion. Total costs and expenses rose 19% YoY to $22.1 billion.

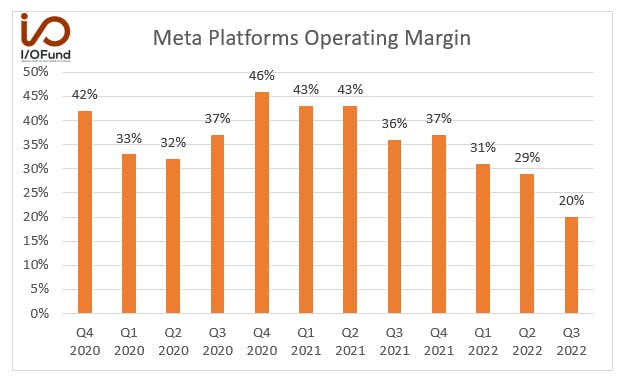
The company has seen a significant drop in the operating margin. Operating margin was 20% compared to 29% in Q2 2022 and 36% in the same period last year. It is significantly lower than the company’s historical period as seen in the chart below.

Chart: Meta Platforms Operating Margin

Source: YCharts

The management expects total expenses to be $86 billion at the mid-point of the guidance for the full year 2022, which represents YoY growth of 21%. This includes $900 million in additional charges for consolidating the office facilities that the company expects to record in the fourth quarter. I estimate the operating margin for Q4 to be 23% which would be significantly lower than the 37% in the same period last year.

Sign up for I/O Fund's free newsletter with gains of up to 403% – Click hereSign up for I/O Fund's free newsletter with gains of up to 403% – Click hereClick here

Meta Capex

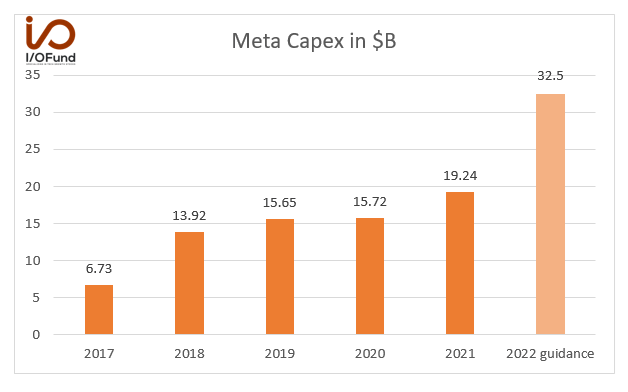
For Q3, Meta had capital expenditures, including principal payments of financial leases of $9.52 billion, up 109% YoY.

YTD 2022, the Capex is $22.8 billion, and the management guidance for the full year 2022 has been revised to $32-$33 billion from the previous range of $30-$34 billion.

This represents YoY growth of 69% at the mid-point of the guidance. Doing the math suggests Q4 Capex will be about $9.7 billion, up 75% YoY and up 1.9% QoQ.

Chart: Meta Capex in $B

Source: Company Investor Relations

Dave Wehner, CFO of the company said in the earnings call, “Turning now to the specific CapEx outlook for ’22 and ’23. We expect 2022 capital expenditures, including principal payments on finance leases, to be in the range of $32 billion to $33 billion updated from our prior range of $30 billion to $34 billion. For 2023, we expect capital expenditures to be in the range of $34 billion to $39 billion driven by our investments in data center servers and network infrastructure. An increase in AI capacity is driving substantially all of our capital expenditure growth in 2023.”For 2023, we expect capital expenditures to be in the range of $34 billion to $39 billion driven by our investments in data center servers and network infrastructure. An increase in AI capacity is driving substantially all of our capital expenditure growth in 2023.”

Turning now to the specific expense outlook for ’22 and ’23, we expect 2022 total expenses to be in the range of $85 billion to $87 billion updated from our prior outlook of $85 billion to $88 billion. This includes an estimated $900 million in additional charges in Q4 related to consolidating our office facilities footprint that we expect to record in the fourth quarter of 2022. We anticipate our full year 2023 total expenses will be in the range of $96 billion to $101 billion. This includes an estimated $2 billion in charges related to consolidating our office facilities footprint.”

Chart: Meta Platforms Operating Margin Quarterly

Source: YCharts

It's earnings season and our premium members have been getting deep dive analysis on the top tech stocks each week, on top of real-time trade notifications, technical analysis from our portfolio manager, weekly webinars, and more. Learn more about becoming a premium member here. It's earnings season and our premium members have been getting deep dive analysis on the top tech stocks each week, on top of real-time trade notifications, technical analysis from our portfolio manager, weekly webinars, and more. Learn more about becoming a premium member here. Learn more about becoming a premium member here.

The Bottom Line

The increasing expenses, particularly in the reality labs segment, have weighed on the company’s profits. The management expects the reality labs segment losses to continue in the next year and investors don’t seem confident the company’s spend on the metaverse will materialize into growth or profits for some time.

On the other hand, the company has been investing heavily in cloud infrastructure and artificial intelligence. The increase in Capex reduces the company’s free cash flows. This is a concern since Meta led Big Tech on a strong free cash flow margin in the past. The free cash flow margin was 1% in the recent quarter and down significantly from 37% in the December quarter.

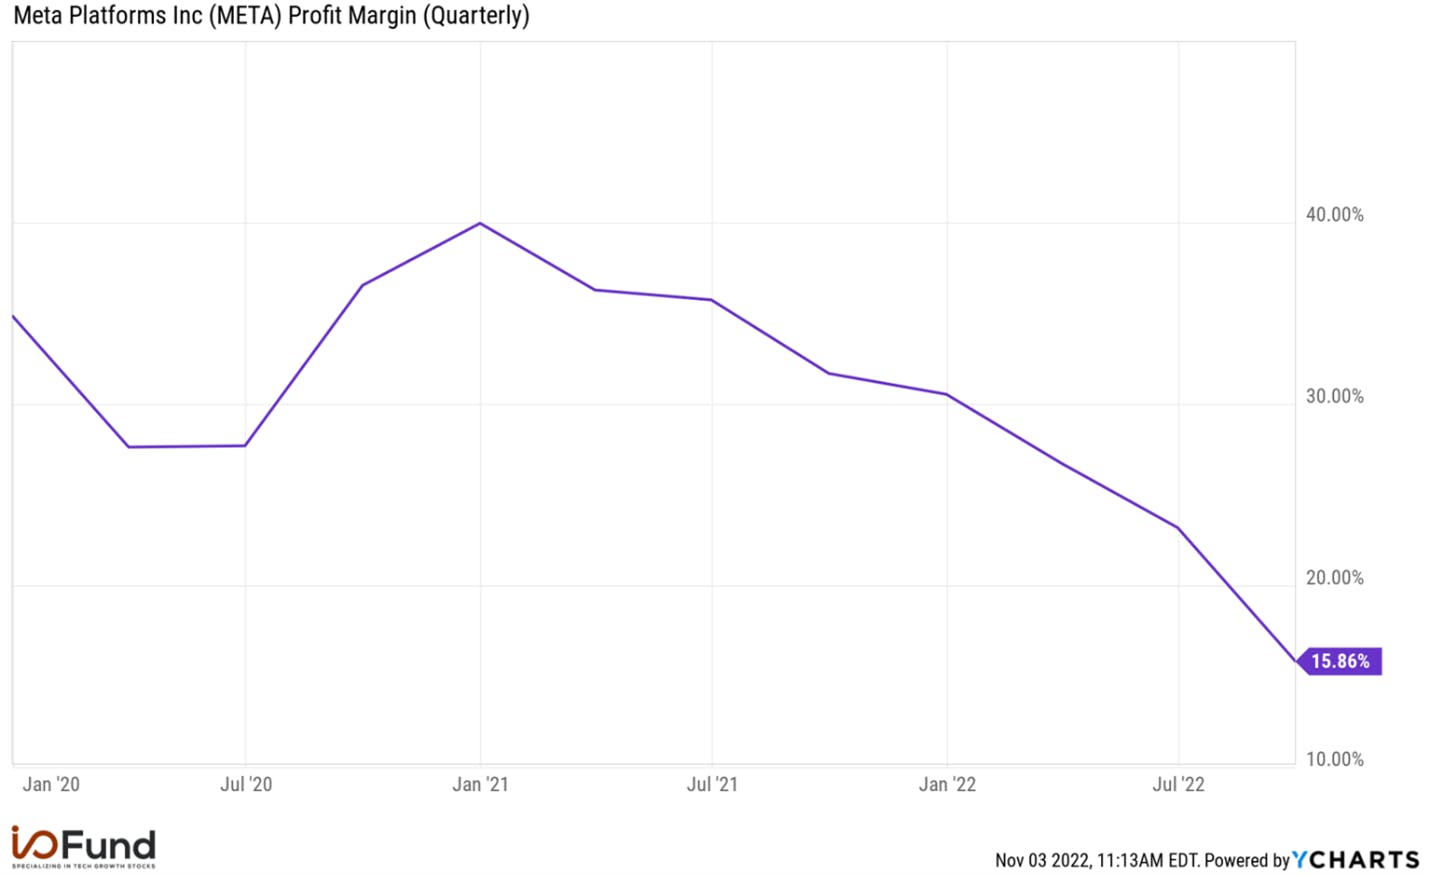
The company’s net income fell 52% YoY to $4.4 billion. EPS of $1.64 compared to $3.22 for the same period last year. The company’s net profit margin was 16% compared to 23% in Q2 2022 and 32% in Q3 2021.

The company has cash and marketable securities of $41.78 billion at the end of Q3 2022. The debt was $9.92 billion.

The operating cash flow was $9.69 billion (35% of revenue) and free cash flow was a meagre $173 million (1% of revenue) in the recent quarter. The difference between operating cash flow and free cash flow is the high Capex.

Chart: Meta Platforms Profit Margin Quarterly

Source: YCharts

Conclusion:

Meta Platforms was once a stock market darling for its solid revenue growth, strong profits and cash flow. Times have changed, and the company is now struggling with slowing ad revenue. It’s not only the increased expenses and capex that are an issue, rather a clear path to monetization that goes with it.

If you’d like more information regarding how the business model has changed, please reference the articles below.

Facebook Stock: A Permanent Change to the Business Model

Please note: The I/O Fund conducts research and draws conclusions for the Fund’s positions. We then share that information with our readers. This is not a guarantee of a stock’s performance. Please consult your personal financial advisor before buying any stock in the companies mentioned in this analysis.

Datadog Q3 Earnings: Having Déjà vu from Q2

I was feeling a little bit of Déjà vu on the Datadog call as we got a nearly identical report as Q2. I’m not complaining by any means; a consistent management team that guides conservatively is rare in the environment and exactly what we are looking for.

Our previous write-up from Q2 can be found here.

The price action reversed from +10% in the pre-market to (3%) on the RPO growth of 31% which I discuss below. I’m certain it was when this comment was made and was not due to Q4 growth as that was outlined in the earnings report and had been released for some time with the +10% intact. We had outlined key metrics were “what to watch” so I am not surprised RPO was a hot item in this earnings report. 

Notably, the stock price reversed again to about +2.5% when the CFO stated October was strong so far. He is remaining conservative and saying they need to “wait and see” on November and December but analysts (and the market) like it when management provides a glimpse into the current quarter. 

Every earnings report right now has something of concern so we make sure to note the areas of concern below. Overall, we are happy with the report yet want to provide a prudent analysis of Q3.

Pre-earnings report write-up can be found here

Q3 Financials:

Revenue this quarter came in at $437 million for 61% revenue growth compared to $414.2 million expected for consensus of 53% revenue growth. This represents 7% growth QoQ. 

Many investors on our site have owned Datadog for a while now, and will agree that management has a strong track record of sizable top line beats. Despite has slowing revenue growth of 37% next quarter, but my guess by management using the words “conservative” is that we will have another beat in Q4. 

The company provided Q4 guidance of $445 million to $449 million which matches consensus of $447 million for 37% growth. FY2023 Guide of $1.65 billion is higher than estimates of $1.63 billion, which reflects the beat in Q3. This represents growth of 60.5% compared to analyst consensus of 58.4% growth.

GAAP EPS of ($0.08) was a bit softer than previous quarters as referenced by the softer GAAP operating margin. 

Adjusted EPS was a beat at $0.23 compared to $0.16 expected. This is in line with previous quarters. The adjusted EPS guide is for $0.19 EPS. 

Full year adjusted EPS was raised from a guide of $0.74 to $0.81 to $0.92 EPS as the midpoint.

The company reported GAAP Gross Margin of $324 million or 78.2% compared to GAAP GM of 77% a year ago. This is down 180 basis points from previous quarter margin of 80%. 

GAAP Operating Margin was (7%) down from (2%) last year and (1%) last quarter. This led to an operating loss of ($31.3) million. GAAP Net Margin was (5.9%) for net losses of ($25.9) million. The difference in the GAAP margin versus Non-GAAP is the high stock based compensation. 

Adjusted operating profit of $75 million with Adj OM of 17% beat management guidance for $53 million and growth of 12.8%. The adjusted net margin was 19% for adjusted net income of $81M.

The company is guiding for adjusted operating profit of $58 million for growth for a margin of 12.8% however it does come out to a (20%) decline in YoY growth in adjusted operating profits, at the midpoint. The company stated the softer YoY adjusted gross margin was due to two large events: the DASH user conference and AWS Re:Invent. 

FY2022 guide was raised from a margin of 16.4% to a margin of 18.2% for full year adjusted operating profit of $302 million, at the midpoint.

The company’s operating cash flow of $83.6 million is up QoQ and YoY yet represents a lower operating cash flow margin of 15.5% compared to 18% last quarter and 25% in the year ago quarter. 

Free cash flow of $67 million is also up QoQ and YoY yet the FCF margin is a bit softer at 15.3% compared to the 21% reported a year ago and is flat sequentially from 15% last quarter. The company has $738M in debt.

Stock based compensation is a blemish at $101 million or 23% of revenue. This is up from 20.2% of revenue last quarter and up from 16% in the year ago quarter. 


Key Metrics:

ARR of > $100,000 customers grew 44% to 2,420 compared to 66% growth a year ago. Last quarter, the > $100,000 cohort grew 54%.

Billings accelerated QoQ to 51% YoY for revenue of $467 million, up from $397 million last quarter and 47% growth in Q2. However, YoY Billings are certainly decelearting from 98% growth or $309M.

RPO decelerated and is a concern. The deceleration we noted in our last earnings report and our pre-earnings write-up where we noted the deceleration went from 85% to 51%. This quarter, the deceleration steepened to 31% year-over-year growth for $941 million. RPO is still up on a sequential basis with $858M in RPO in Q1, $881M in RPO in Q2 and $941M in RPO this quarter. If it were to decline on a QoQ basis, the stock would be deeply penalized, so we will monitor this as we go along. 

Regarding RPO, the company said the following:

“As a reminder, we signed several large multiyear renewals in Q3 2021, which may make current RPO, a more useful indicator with — as it excludes the multiyear duration impact. We also had a challenging comparables of that metric as Q3 of last year, current RPO growth was about 100%. We continue to believe revenue is a better indication of our business trends than billings or RPO as those can fluctuate relative to revenue based on the timing of invoices and the duration of customer contracts.”

What the market is worried about is that RPO is forecasting a further decel in FY2023 in revenue growth than what Q4 represents. 

The company stated “churn remains low” with retention in the mid to high 90s. 

Datadog management emphasizes they are a land and expand model. This is best seen in the key metrics in customer-to-product growth: “At the end of Q3, 80% of customers were using two or more products, up from 77% a year ago. 40% of customers were using four or more products, up from 31% a year-ago and 16% of our customers were using six or more products, up from 8% a year ago.”


Additional Notes:

I’m going to quote a few important things from the call on the two items of most concern which is RPO and Q4 guidance.

Here an analyst asked about the CRPO number (current RPO). 

Brent Thill

And just a quick follow-up on the CRPO. I know David, you mentioned, stay focus on that. It is continuing to decelerate, I guess, is that just a function of the large comps? Are you seeing larger enterprise customers? You've seen a slower cadence of large deals come in. Can you give us your take on that?

David Obstler

Yeah, I think we had — the comps are very significant in this quarter. In Q3 of last year, and I think we said this at the time, we had some large multiyear deals. As a reminder, we don't try to target multiyear deal we had from the client side. So that's why the current probably is more over time correlated. It is also moves. So if you look at the average of this, it tends over the longer time to correlate with revenues, but there's a lot of noise in this number. So we steer everyone back to revenues and then the computation we've given everybody how to convert revenues into ARR.”

Here is what was said regarding Q4 guidance remaining unchanged:

Matt Hedberg

Great. Thanks guys. David, for you. Last quarter, you talked about a stronger July versus June. I'm wondering if you could comment a little bit on how the linearity of the quarter played out, and then maybe also how is — how did October trend relative to September?

David Obstler

Yeah. So we — for linearity, it was very similar linearity to what we've had. There was no difference. And so we saw — unlike last quarter a bit, we saw pretty much of a pro rata type of quarter. And we normally have a strong October in terms of the flow of our customers and what they're doing in the platform before pro freezes. We're pleased with what we have seen so far, but still recognize that October is usually strong for us. And it's only the beginning of the quarter.

Oli, anything else you want to add that?

Olivier Pomel

No, I think the one thing you're trying to get through the over time during the quarter, we exited the quarter pretty much at where we entered it. There's no change there. And again, as David said, we're happy with what we see there, and we're also usually happy with our product.

We — Q4 has a bit more seasonality in other quarters, in particular, December tends to be a little bit weaker as a lot of our customers take time off and sit down their development environment and things in that. It's also been a little bit harder to forecast in recent years with the pandemic and the behavior that — the vacation behavior that change after the pandemic. So we are little bit careful with that, and that's all incorporated in our guidance.

Conclusion:

My main concern with Datadog is not the fundamentals or this report but rather the valuation and where it goes from here. We have DDOG at a current P/S of 17.85 with 20 being the ceiling. We could see 30 P/S if the stars align but I would say 20 is where will return to pretty quickly if that happens. I expect cloud to trade range bound between 15-20 for the top 5 or top 10 until macro clears.

This means 40% growth rate can lead to 40% gains if we assume a constant valuation from 2022 to 2023 and any tech investor would take that right now. However, if we see cloud extending, we may be conservative and trim at times.

Roku: Revenue and EBITDA Miss for Q4

Q3 was strong in terms of beating on the top and bottom line whereas the Q4 guide was very weak.

In the September quarter, Roku reported revenue of $761 million compared to $696 million expected. This represented 12% growth compared to 2.5% growth expected. On the bottom line, EPS of ($0.88) beat estimates of ($1.29). The company was expected to report adjusted EBITDA of ($75M) and instead reported ($34.4M)

In Q3, Platform revenue was up 15% and player revenue was down (7%). Strangely enough, Player revenue was stronger in Q3 compared to the two previous quarters when it was down (19%).

ARPU grew 10% to $44.25 and the company added 2.3M users. These two key metrics were strong compared to what other ad-tech companies have reported.

Despite the Q3 beat, the Q4 guide was troublesome. Roku was expected to report revenue of $906.6M for growth of 4.77% yet came in over $100M low with a guide of $800M. This represents growth of (7.6%). The adjusted EBITDA guide of ($135M) compares to Q3 adjusted EBITDA of ($34.4M).

I believe this statement is Roku’s admission they got the timing wrong on increasing opex:

“Our significant Q3 OpEx (operating expense) YoY growth was largely the result of robust hiring in late 2021 and early 2022 when we believed that the economy was emerging out of pandemic-related disruptions, and we were accelerating investments that we had previously deferred. We started taking steps to significantly slow the rate of hiring and other OpEx growth in late Q2, however, it will take a few more quarters for this YoY OpEx growth rate to normalize. We will continue to slow headcount and OpEx growth in response to the macro environment, while continuing to make disciplined investments in our most strategic projects that will increase both the market penetration of our platform and long-term customer value.”

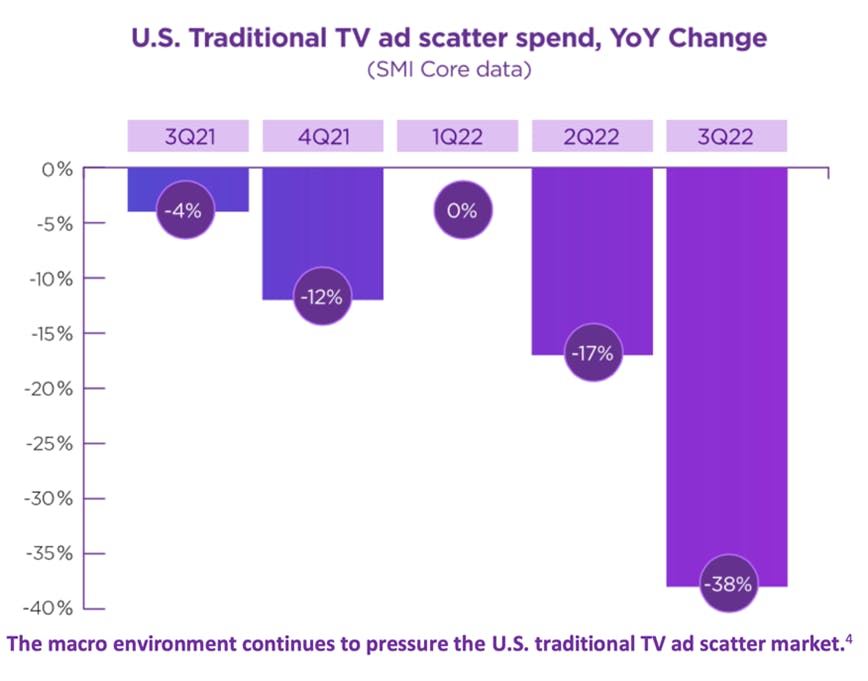
Roku believes the scatter market is dropping quickly and they clearly stated it was not unique to them and was industry wide. They stated that advertisers lack confidence in the economy. This is affecting the Q4 guide on revenue. What you see below has essentially worsened for Q4, per Roku’s management.

Here is what was stated:

Anthony Wood

This is Anthony. So we are seeing – like Steve said, there's a lot of uncertainty. It's hard to say exactly what's going to happen in Q4, but we are seeing signs that Q4 is going to be worse in terms of the ad market than Q3 was, I mean we're seeing lots of big categories, pull back telecom, insurance. We're even seeing telemarketers planning on reducing their spend in Q4.

I think traditionally, Q4 is a very – the holiday season is typically the strongest period for a lot of companies, including Roku. But companies are pulling back their ad budgets because they're uncertain if there will be a recession or not. And so a lot of Q4 ad campaigns are being canceled. And so that's why I think this holiday season, given the unique set of environments and characteristics, is probably going to be different than the typical holiday season.

Conclusion:

Due to EBITDA issues, which management has stated “it will take a few more quarters for this YoY OpEx growth rate to normalizewe are looking for an exit. It will be Knox’s choice on how/when this happens given the valuation is already quite low.

When Roku opens tomorrow, it will be a 2 P/S. This is the type of valuation a company has that is going bankrupt or has a near-zero risk. Meanwhile, Roku has $2.02 billion in cash and is reporting ($91.9M) in free cash flow in the first 9 months. It’s unlikely Roku will need to raise next year or the year after. It’s also not isolated in its issues with ad budgets as we’ve seen the concerns around Q4 echoed across nearly every ad-tech company that has reported. The 2 P/S is more reflective of a company that needs to raise cash soon or a company that may go out of business or even a company that has inherent issues not reflected widely in its industry.

I believe we will buy this company again in the future if active accounts and ARPU continues to grow. These are leading indicators for media companies, and Roku will be on our radar quarterly to see when adjusted EBITDA gets sorted.

AMD Q3 Earnings: Data Center is Resilient

We covered AMD’s pre-announcement in “The One Critical Reason I’m Still Feeling Zen.” The company has a lot of lost ground to recover and I believe it has enough horse power in its product line up to do so.

This was a stronger report than first glance because by guiding flat from Q3 to Q4 for 14% revenue growth, AMD stated data center and embedded will grow sequentially to absorb PC weakness. One analyst mentioned working with a number between $800M to $900M on Client Revenue for Q4, which would be down from $1 billion in Q3. It was also directly stated gaming revenue would be flat sequentially.

Rough Idea of Q4:

$850M Client Segment, at midpoint (hinted at)
$1,600 Gaming (confirmed)
$1,750 Data Center (rough estimate)
$1,350 Embedded (rough estimate)

This would mean sequential data center growth of 9% from Q3 to Q4 compared to 8% sequential growth from Q2 to Q3. Embedded was up 4% sequentially from Q2 to Q3.

I believe the timing of the Genoa product and the glimpse of Meta’s capex means we are setting up for a strong 2023 with data centers. I believe the analysts fully understood this point on the call as PCs were certainly discussed but was not the main focus. Data center discussions had more air time in the Q&A.

Q3 Financials

Most notable from the Q3 report is that the company missed on Q4 revenue guidance with $5.97 billion for growth of 23.8% expected versus $5.5 billion reported for actual growth of 14%. The market shrugged this off as AMD stated data center and embedded would grow year-over-year and sequentially. I believe this was a solid reaction as AMD is becoming a leading AI company and holding the stock hostage to cyclical PC sales is missing the larger picture.

This brought the full year estimates down by $300 million from $23.8 billion to $23.5 billion. This will represent growth of 43% down from 44.9% expected. We can see that PCs will have a $2.8 billion drag on revenue this year as originally revenue was expected to be $26.3 billion.

Adjusted EPS of $0.67 missed estimates of $0.76 adjusted EPS. GAAP EPS was $0.04.

Where AMD had some positive surprises was in the adjusted margins and cash flow. The adjusted GM of 50% is higher than the year ago quarter at 48%. This is also true for Q4’s guide of 51% adjusted GM, which is higher than the year ago quarter at 50%.

The adjusted operating margin was also higher than what we had for expectations. It came in at 23% versus 13% expected and is flat from the year ago quarter. This led to adjusted operating income of $1.3 billion for 20% growth YoY and adjusted net income of $1.1 billion compared to $893 million a year ago for 23% growth YoY. Notably, this is down from $1.7 billion in Q2.

The GAAP GM was at 42% and GAAP OM was at ($64) million and both are lower than usual due to PCs/Client Segment.

The operating cash flow of $916 million is up from $849 million in the year ago quarter and free cash flow of $842 million helped maintain a steady FCF margin of 15%.

Apples-to-apples, I think this was a stronger report than Microsoft’s – a tech titan exposed similarly to PCs – because AMD’s other segments are so strong the company is able to maintain double digit growth of 14% next quarter compared to Microsoft’s low guide of 2%.

Data Center Strength:

This was an important comment regarding cloud spending specifically within the data center segment:

Cloud revenue more than doubled year-over-year and increased sequentially as multiple hyperscalers expanded deployments of EPYC processors to power their internal properties and more than 70 new AMD instances were launched by Microsoft Azure and Amazon, Tencent, Baidu and others in the quarter.”

Analysts pressed AMD on if they expect 20% to 30% growth in the data center next year but management declined to comment “precisely” this early. Instead, AMD went on to call out North America hyperscale spending as a key driver for next year and mentioned China will not see a significant recovery (similar to 2022).

“Now it varies by segment, and so if I go through each of the segments, what we are seeing is I think North America cloud is, probably, the most resilient out of the segments within the Data Center market and this is where AMD is the strongest […] As we go into 2023, we expect growth in that market, particularly customers moving more workloads to AMD, just given the strength of our product portfolio, and overall, Genoa coming forward.

“Moving more workloads to AMD” = That’s a comment on Intel losing market share. Woohoo! Let’s gooooo!

Below is a notable conversation about how analysts are viewing Big Tech capex and cloud infrastructure growth as a leading indicator for AMD:

Harlan Sur

Great. Thank you. And despite the macro concerns, and as you mentioned, some near-term workload optimization, your North American cloud customers, I mean, they are still growing their cloud services business at a strong 30%, 40% year-over-year growth rate and I assume that these types of growth rates like the consumption of compute networking, storage workloads and therefore, installed utilization, like, this is all quite strong in driving the need to build out more compute capacity. Is this what’s driving the team’s sort of strong mid-term outlook for this segment or is it more a function of your strong product lineup with Genoa and continuing to capture greater compute share or both?

Dr. Lisa Su

Yeah. Right. Harlan, I would say, it’s a little bit of both and I think you said it well. In the very near-term, there is a little bit of optimization that each cloud vendor is doing. But in the medium-term, what our customers are telling us is they need more compute.

And the more compute is for additional workloads building out. It’s also for upgrade of, let’s call it, older compute, given our new products have very strong TCO, power efficiency, given the cost of power and energy around the world. We are actually seeing that also be a driver for some of the conversion to AMD in the cloud as we go into 2023.

Notably, one analyst stated the company missed their model and estimate for data center revenue. The CEO replied this is due to GPUs having a tough comp from last year due to the timing of a high-performance computing release – Frontier Exascale Supercomputer. She also pointed toward lower enterprise revenue.

In addition to Data Center, Embedded was strong and AMD called out 5G infrastructure specifically. I’m hoping this translates well for Marvell.

Information on PC Market for 2023

The data center may be resilient but certainly PCs are weighing on this company. I think this question and answer was important for AMD investors to hear so I’m quoting the conversation.

Vivek Arya

[…] what does client recovery look like, do you get back to the $2 billion quarterly rate, do you get to $1.5 billion? And I asked that because your competitor was suggesting that next year the PC TAM would only be down 4% or 5%, which seems a little bit optimistic. What do you think AMD is kind of — what kind of PC TAM does AMD have in mind for next year so that we get a sense for how this de-risk the model is from a PC perspective?

Dr. Lisa Su

Yeah. So, a couple of different points, Vivek. Let me just answer the sort of the expectations around Q4. I would say, we are guiding, let’s call it, modestly down for Client and Gaming, and obviously, we are coming off of what is already a low base in Q3. We want to do that to correct the sort of the inventory situation as quickly as possible, and as a result, we are going to under ship consumption again in the fourth quarter to do that.

As it relates to next year, I think, there are a lot of factors. I mean this year PCs will be down quite a bit, let’s call it, high-teens, close to 20%. As we go into next year, I think, the industry is calling mid-single digits. I think that would be a good case. I think we should model down to minus 10%.

And again, within our PC business, we expect as we get through this inventory correction, I mean, we have very good products, and I feel very good about our product portfolio and very good about our platforms overall. So I do think the PC business will recover as we go into 2023, but we will have to work through these dynamics over the next quarter or so.

My translation: Perhaps I am being optimistic but I believe AMD is saying the recovery will happen earlier in 2023 (H1) rather than later in 2023 (H2) per the language chosen and that AMD plans to be on the earlier side within H1 by under shipping in Q4.

Conclusion:

AMD had a better earnings report than Microsoft and a better report than Nvidia is expected to have. These companies are comparable because of the one-time event hitting a non-thesis segment. Where they are not comparable is that AMD’s strongest segments are keeping the company in double digit growth territory.

I like Microsoft and Nvidia very much but it is uncanny how AMD continually finds a way to unexpectedly have a good report. I get to call this stock The Dark Horse for a little longer until it surpasses Intel on the data center; which means the name will likely be retired by 2024.

Netflix Stock Will Be A FAANG Again

This article was originally published on Forbes on Oct 27, 2022,11:14pm EDTForbes on Oct 27, 2022,11:14pm EDT

Netflix lost it’s status as a FAANG when the stock fell from a $300 billion market cap to a $100 billion market cap this year. My firm entered Netflix in August as we fully expect the stock to become a FAANG again due to its revenue potential from ads and improving cash profile.

Given macro, very few tech companies have a catalyst of any kind on the horizon with many companies in a defensive stance. Netflix, on the other hand, has an offensive plan to grow subscribers and revenue even in the face of macro pressures.

In my free newsletter published on Forbes, I had stated in both June and July: “I would argue the day that Netflix’s stock price dropped 35% was consequently one of the most important days in the company’s history in terms of its chances for a boost in revenue and a renewed uptrend. Patience, though, will be required, as Netflix has work to do.”

My target for the roll-out was originally Q1 to Q2 2023, and instead, Netflix is rolling out the ad supported tier next week. My firm had entered the stock in August with a real-time trade alert, so the surprise 6-month roll-out was welcomed. The ad supported tier will monetize at the same rate or even higher than legacy tiers with a $6.99 monthly subscription combined with a $10 ARPU over time (needs time to ramp to reach this ARPU).

A high probability of revenue acceleration from ad tier combined with improved cash profile combines for an attractive stock for 2023. Not only will Q4 and Q1 provide some clues around the new trajectory but there is an additional catalystan additional catalyst in Q1/Q2. We are reserving details about this lesser known catalyst for our research members.

The biggest names in tech are reporting their earnings right now, and our premium members are getting updates almost daily. Learn more about about our premium membership here.The biggest names in tech are reporting their earnings right now, and our premium members are getting updates almost daily. Learn more about about our premium membership here.Learn more about about our premium membership here.

Netflix is Expected to Return to 2021 Subscriber Growth Levels

Netflix had a sizable beat on subscribers and the stock breathed a visible sigh of relief as the company comfortably beat with 2.4M net adds compared to 1M to 1.2M expected. Consensus for next quarter was 4.1M with Netflix guiding for 4.5M. This will be the largest account growth since Q3 2021.

The largest contributor to growth is the APAC region at 1.4M new subs followed by EMEA at 0.6M subscribers and LatAm at 0.3M subscribers. United States and Canada reported 0.1M subscribers whereas in the past this region saw churn.

Revenue was up 5.9% compared to 4.7% expected. On a constant currency basis, revenue grew 13% YoY.

There is a miss on revenue for next quarter due to FX headwinds. The company guided for 1% growth versus 3.5% growth expected. On a constant currency, Q4 is expected to grow 9%. This creates a slight miss on FY2022 revenue at $31.5 billion guided versus $31.6 billion expected.

The AVOD tier is most likely targeting the 100M who are sharing passwords. Therefore, I believe Q1 is when the stronger results will appear from Netflix’s AVOD entry due to the password sharing being phased out early next year.

Here was the update:

“Finally, we’ve landed on a thoughtful approach to monetize account sharing and we’ll begin rolling this out more broadly starting in early 2023. After listening to consumer feedback, we are going to offer the ability for borrowers to transfer their Netflix profile into their own account, and for sharers to manage their devices more easily and to create sub-accounts (“extra member”), if they want to pay for family or friends. In countries with our lower-priced ad-supported plan, we expect the profile transfer option for borrowers to be especially popular.”

Operating margin came in higher than expected at 19% versus management’s previous guidance of 16%. There was a 4% decline from the previous year due to FX. The company is guiding for an operating margin of 4% to 8% next quarter, or 10% on a constant currency (CC) basis. This is due to seasonal spending on marketing and content, and on a CC basis, will be higher than last year’s 8.20%.

The revenue and operating margin beats flowed through to a net income beat of $1.39B compared to $961M expected.

Operating cash flow was at $557 million and free cash flow came in at $472 million. This means management has made good on its promise to see $1 billion FCF this year. It also implies FCF could be ($287) million next quarter as we are at $1.287 billion for the year.

Netflix reiterated regarding the FCF next year: “We continue to expect FCF of +$1 billion for the full year 2022, plus or minus a few hundred million dollars and substantial growth in FCF in 2023 (assuming no further material appreciation of the US dollar).”

There was a minor improvement in Netflix’s cash and debt levels with cash increasing to $300 million to $6.18B with net debt of $7.98B. This is down from net debt of $8.5B in the previous quarter.

The company had a big beat on EPS of $3.19 versus $2.17 expected. This included a $348 million non-cash unrealized gain from FX remeasurement on Euro denominated debt.

Was the Market Wrong About Netflix Saturation?

Netflix does not believe their market is saturated, rather that advertising opens up a new, sizable addressable market. The company offered the following information: “In the 190 countries in which we operate, our $30 billion-plus of annual revenue is roughly 5% of the combined estimated ~$300 billion pay TV/streaming industry, ~$180 billion branded advertising market, and $130 billion consumers spend annually on gaming. So, we believe that we have a long runway for growth if we can continue to improve our offering steadily over time.”

We had stressed in our previous free newsletter that the lagging discussion on Netflix is that there was a subscriber decline in Q1 of 200,000, excluding Russia and a subscriber decline of 970,000 in Q2. While critics believe this is due to saturation, it’s much more likely the decline is coming from a pull forward due to Covid as all media stocks – both streaming and social media – demonstrated outsized audience growth through Q2 2021. Therefore, Netflix is lapping some tough quarters for audience growth comps and announced in April their plan to have an ad tier to help combat this.

Management’s willness to combat subscriber falloff with an ad tier is why we entered in August prior to the subscriber beat.

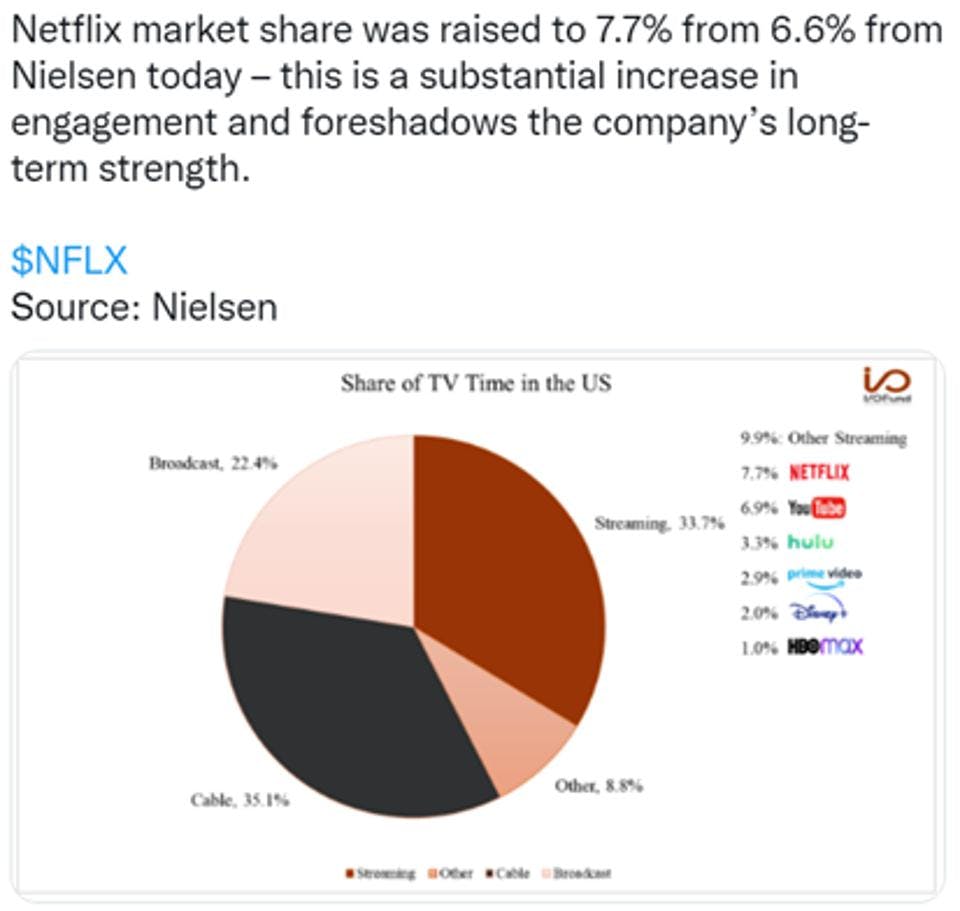
Another important point we had highlighted was there is already evidence that Netflix is taking more market share than its peers. In fact, Nielsen raised Netflix’s market share earlier this year for engagement to 7.7% from 6.6%, which puts Netflix in the lead over any other competing subscription service.

Netflix Market Share by Beth Kindig

Source: Beth Kindig Twitter

Management could not be more clear in their Investor’s Letter or on the earnings call that having the streaming best content in the world is their #1 strategy for success. That is one reason I track statistics such as Netflix’s share of TV time very closely. There was discussion that Netflix fully accepts the cost of creating the content and is instead more focused on getting more value from $1 billion in content than their competitors.

Sign up for I/O Fund's free newsletter with gains of up to 403%Sign up for I/O Fund's free newsletter with gains of up to 403%Click hereClick hereClick here

More on the Ad Tier

Here was the update from Netflix regarding the new ad-supported tier from the Investor’s Note:

“As we’ve been discussing over the past few quarters, improving our pricing strategy is an important near-term focus. Last week, we announced that we’ll be launching an ad-supported subscription plan on November 1 in Canada and Mexico; November 3 in Australia, Brazil, France, Germany, Italy, Japan, Korea, the UK, and the US; and November 10 in Spain. Cumulatively, these 12 markets account for ~$140 billion of brand advertising spend across TV and streaming, or over 75% of the global market.

To start, we’re keeping it simple by offering one low-priced ad plan – Basic with Ads – at a price that’s 20%-40% below our current starting price. So in the US, for example, Netflix will now start at $6.99 per month (compared to $9.99 today). The Basic with Ads plan will have ~5 minutes of advertising per hour, frequency capping and strong privacy protections.”

Netflix has been able to launch its ad platform within 6 months of the announcement. The announcement earlier this month was good news for Netflix investors who entered early despite many institutional analysts predicting it would be six months into 2023 before it rolled out.

Also on the earnings call, management stated they are not expecting any material financial impact this quarter from ads due to the intra-quarter launch. However, over time, the company expects the ad tier to be margin accretive. My personal take is that it can produce a slight boost in subscribers in Q4 and this glimpse is going to be one that I am very much looking forward to. Management has no visibility at this time as it launches in two weeks so it’s prudent to not guide beyond the visibility they currently have.

Summary/Conclusion:

I believe that one day, investors will look back and see that it was a buying opportunity when Netflix went down 35% in April of 2022 after the company announced it’s plans to move into advertising. The goal of the ad tier is address saturation head-on by increasing the addressable market.

Netflix beat on revenue, subscribers, operating margin, and free cash flow in the recent Q3 results with small improvements from Q2 across the board in what may have marked the bottom for this company. The Q4 guide is also in-line across the board.

The company is expected to be free cash flow positive this year. Netflix has only been FCF positive in 2020 and has not been FCF positive in any other previous year. The company also lost $3.3 billion in 2019 when it built its original content pipeline. The stock will now enter two years of FCF positive between 2022 and 2023.

Advertisers are likely to pay a high premium for Netflix’s Hollywood-level content. Notably, it was recently revealed Netflix plans to only have 5 minutes of advertisements which is why the ARPU target is $10, however, that comes out to a target of $16.99 per user with the $6.99 pricing tier.

It’s not only the 100 million people sharing passwords that illustrates what the uptake could be for a lower-priced tier, it’s also the high level of engagement the company’s content garners that could make for a nice equation for with demand from exclusive advertisers and supply from the premium content, that Netflix offers.

Please note: The I/O Fund conducts research and draws conclusions for the company’s portfolio. We then share that information with our readers and offer real-time trade notifications. This is not a guarantee of a stock’s performance and it is not financial advice. Please consult your personal financial advisor before buying any stock in the companies mentioned in this analysis. Beth Kindig and the I/O Fund own Netflix at the time of writing.

Why We Closed Shopify

Despite the market liking the report, we closed the position based on the following:

  • Gross Margin slipped from 51% last quarter to 48.30% this quarter. On the call, they discussed the following reasons: “Lower margin merchant solutions, lower margin shop pay, impact of deliverr and increased cloud infra” (This is a paraphrase as the transcript is not avail yet). Merchant Solutions gross margin is 37.2%.
  • In the past, Shopify had a 71% GM in 2020 and a 61% GM in 2021.
  • Operating margin from (15%) last quarter to (25%) this quarter yet could be more persistent if SHOP will see a weaker GM.
  • The net margin of (11%) is actually (21%) if you remove the investments Affirm, Global-E and Silvergate. The (21%) gives a better idea of business operations. In this case, I removed the $173M gain in equity listed.
  • Free cash flow of ($228M) this quarter up from ($136M) last quarter. For our purposes, this is a red flag in the report given the market’s sensitivity to a rising rate environment. We’ve detailed this a few times especially with cloud that worsening FCF will cause us to redirect.
  • Shopify did improve this SBC outlook from $750M to now $575M for the year. This may reflect the new comp program and more employees electing cash. However, it's a notable variable into the foreseeable future (if stock does well, dilution will rise if employees go with more stock, which is a likely outcome).
  • Stock based compensation for the quarter was $149.9 compared to SBC of $139M last quarter. This implies $100M +/- on SBC next quarter given the FY guide.

There was a nice revenue beat and nice EPS beat. Key metrics are mixed with the lower margin Merchant Solutions driving the growth at 18% last quarter and 26% this quarter. However, the predominant key metric Gross Merchandise Volume ticked down from last quarter at $46.9 billion to $46.2 billion this quarter. Monthly Recurring Revenue dropped from 13% to 8% this quarter. It was stated on the call that SMBs were (3%) on MRR. I don’t have the transcript but that is what was said by an analyst.

Something to watch for is if Deliverr is dilutive to the company beyond gross margin. I don’t have enough visibility and management did state some of the GAAP OpEx was affected by litigation costs of $97M and severance of $30M (again, don’t have the transcript) yet this is something to watch out for if it was dilutive to GM.

These decisions are hard but it’s our investing discipline to not remain in stocks with worsening margins and worsening free cash flow. 2023 is remarkably uncertain in many regards and we feel it will be easier to navigate the macro uncertainty if the underlying business supports both revenue and bottom-line growth.

Microsoft Fiscal Q1 Ending in September Overview

We posted the following on the forum. If you scroll down, I’ve added additional commentary. This is primarily driven by personal computing which is expected to decline from $17.5 billion in the December quarter last year to $14.7 billion in the upcoming quarter, at the midpoint. Productivity and Business is expected to be soft by 7 points decel YoY and Intelligent Cloud softer by 3 points deceleration YoY.  

Why Microsoft Sold Off After Earnings: 

Microsoft is guiding down for next quarter with analyst expectations for the December quarter at $56.04 billion compared to management guidance on the call for revenue of $52.75 billion, at the midpoint. This represents 2% growth.  

The primary reason for this decel was this comment from the CEO, which is the most comprehensive view we have of Microsoft’s expected deceleration in cloud: 

With that context, this quarter, the Microsoft Cloud again exceeded $25 billion in quarterly revenue, up 24% and 31% in constant currency. And based on current trends continuing, we expect our broader commercial business to grow at around 20% in constant currency this fiscal year, as we manage through the cyclical trends affecting our consumer business.” 

That’s a 11% deceleration over the next few months. Some of this may be coming from Azure as the company is expected Azure to decline 5% next quarter for its current growth rate. This will be 37% growth on a constant currency basis, down from 42% this quarter.  

From the CFO: 

“Revenue will continue to be driven by Azure, which, as a reminder, can have quarterly variability primarily from our per-user business and from in-period recognition depending on the mix of contracts. We expect Azure revenue growth to be sequentially lower by roughly 5 points on a constant currency basis.” 

Notably, Azure missed management’s guidance by one point, coming in at 42% on a CC basis compared to guidance of 43% on a CC basis. 

This was preceded by this comment, which helps provide color but didn’t stop the AH price from slipping: 

“In commercial bookings, continued strong execution across core annuity sales motions and commitments to our platform should drive solid growth on a moderately growing expiry base against a strong prior year comparable, which included a significant volume of large long-term Azure contracts.

As a reminder, the growing mix of larger long-term Azure contracts which are more unpredictable in their timing, always drives increased quarterly volatility in our bookings growth rate.”

The comment is primarily about bookings which were at 37% growth on a CC basis for fiscal Q2 of last year compared to 14% on a CC basis in fiscal Q1 of last year.

However, Azure as a revenue driver did not have high comps (to clarify the comment). Our records have Azure at 46% on a CC basis for fiscal Q2 ending in December with fiscal Q1 last year at 48% on a CC basis and fiscal Q1 was at 49% on a CC basis. The neighboring quarters were both higher.

The other thing to note is the FX headwinds result in more to unpack in this particular earnings report. Some articles online are reporting substantially lower EPS and a declining net margin – however, this is a wrong takeaway from the report. At a quick glance, it could appear that Microsoft saw a net margin decrease of 14% but net margin actually saw an increase of 11%.

The lower net margin and EPS is due to a one-time tax benefit of $3.291 billion in the year ago quarter, which resulted in unusually high net income of $20.5 billion. In all previous quarters, Microsoft had $16 billion to $18 billion in net income, and thus, the $17.6 billion from this quarter is actually in-line. Excluding the one-time tax benefit, the net income in the year ago quarter would have been $17.2 billion.

Therefore, the correct EPS comparison is actually EPS of $2.35 this quarter compared to EPS of $2.27 in the year ago quarter after adjusting for the one-time tax benefit. On an adjusted constant currency basis, this is 11% growth YoY.

Regarding the segments, the rest were in line except Azure’s 1% miss. Despite the slight miss, Intelligent Cloud came in as expected at 20%. What the market is concerned about is Azure being the leading indicator for the slowing Commercial Cloud growth that was stated at the beginning of the call by the CEO (the 11-point decel).

Productivity and Business saw a slight beat with growth of 15% on a CC basis compared to guidance of 12% to 14%. Personal Computing was in line at flat growth for $13.3 billion.

Interesting enough, the CFO reiterated FY2023 guidance as “At the total company level, we continue to expect double-digit revenue and operating income growth on a constant currency basis. Revenue will be driven by around 20% constant currency growth in our commercial business, driven by strong demand for our Microsoft cloud offerings. That growth will be partially offset by the increased declines we now see in the PC market.”

Additional Commentary on Next Quarter’s Low Revenue Growth:

The 2% growth rate is being dragged down by personal computing. Here’s more on the breakdown of what to expect:

Personal Computing is expected to decline (19%) from $17.5 billion in the December quarter last year to $14.7 billion on CC basis in the upcoming quarter. This will be down from growth of 15% in the year ago quarter.

·       The 19% deceleration is coming from PCs with Windows and Surface declining in the 30-percentile range.

·       The segment is being held up (somewhat) by advertising with 6% growth.

·       Gaming is expected to decline in the mid-teens 

Productivity and Business is expected to be soft by 7 points decel YoY for growth of 11% to 13% and revenue of $16.75 billion on CC basis. This will be down from 19% in the year ago quarter.

·       On-premise business is dragging down the results with a decline in the low to mid-30s

·       Office 365 is expected to report seat growth and ARPU growth

·       Office Consumer will decline single digits

·       LinkedIn will grow low to mid-teens

·       Dynamics will grow low double digits to low 20s, which is Microsoft’s business solutions and ERP such as for financials, operations and other business tasks. It’s also CRM similar to Salesforce designed for larger companies.  

Intelligent Cloud will softer by 3 points deceleration YoY for growth of 22% to 24% and revenue of $21.25B to $21.55B on a CC basis. This is down from 26% growth on a CC basis.

·       Azure is expected to decelerate by 5% to 37% growth on a sequential basis yet Intelligent Cloud is expected to be flat. Energy costs for Azure will be $250M per quarter. Notably, the company believes they will see more public cloud migrations from the rising costs of energy as the cost of on-prem is rising.

·       Enterprise services will be in the low single digits 

A note on Commercial RPO:

Commercial Remaining Performance Obligations have been oddly strong, and this was pointed out on the call. This quarter, Commercial RPO was up 31% YoY from $137 billion to $180 billion. 45% will be recognize the next twelve months and the remaining 55% will be recognized after 12 months.

This can certainly decelerate moving forward yet the management did call out that Azure tends to be volatile and so this is technically a sign of underlying strength despite the volatility. Commercial Bookings were (3%) due to FX yet was up 16% on a CC basis. This is up 2 points on a CC basis from last year.

Here is what was discussed in terms of Commercial RPO and how it translates to Azure growth:

Mark Moerdler:

Thank you. I'd like to follow-up on the last question on Azure specifically. So next quarter, you're guiding to sequential further slowing in the business. Is that the factor of optimization? Is it something else that's going on in here? How should we think about that specific component of the guidance, given the fact that you've got good bookings, strong RPO growth, et cetera?

Amy Hood:

Thanks, Mark. I'll – you're right. Let me go ahead and reiterate part of that, which is that this quarter, as you saw, we did have very good bookings growth. And within the RPO number that you're referring to, we had what we would call long-dated growth, which means we're having and seeing customers continue to sign commitments to the platform, and that goes really to what Satya mentioned is that the plans to invest here remain intact. And so, it's about both the optimization that you're talking about, and we are seeing and the guide includes that, and it also includes new workload starting. And those also may not be matched up one-to-one to see sort of a consistent pattern. And that does result in some volatility.

The other piece of it, Mark that we didn't talk on before because I was really focused on consumption is that there is per user headwinds as well, right, because we're getting and seeing some of these [loss] (ph) of large numbers in terms of the per seat business. So, there's a couple of things going on here Mark again, as you said, a very large base. So, it's not just the optimization to new workloads. It's also some per user work as well.

Translation:

It’s primarily loss of headcount affecting Azure and not renewals in contracts. It’s also not surprising that Microsoft is prioritizing optimization as the recent keynote at Ignite was about “Do More with Less.” We actually covered this early-on in this analysis here where we stated “increase in cloud spending and wanting to lower costs. This is differentiated from budget cuts, such as headcount. Most importantly, our slides showed that despite Gartner’s forecast for 2020-2021 shifting by $100 billion to what became actual spend (or essentially a pull forward). Pull forward might not be the right term, however, as cloud growth is not slowing down as a result, instead it’s predicted to be a tick higher from 2019 to 2022, if we remove the anomalous 2020-2021.

Therefore, we wanted to emphasize that the trend towards reducing costs should not be confused as being prohibitive to the trend for cloud adoption, rather, it can offer investors an edge if they identify what companies serve both needs.

As you can see from our portfolio, we are best-of-breed investors and I do not believe Microsoft is a best-of-breed company, rather they aggregate cloud services to help drive down costs. This is especially attractive for the Fortune 500 whereas startups, SMBs and mid-sized enterprises are likely to seek out and manage a larger portfolio of cloud services from various vendors. We can easily evidence this by Microsoft’s Fortune 500 penetration with 95% using Azure, which was achieved through hybrid computing where Microsoft was first-to-market on serving a mix of on-premise, private and public clouds for their large enterprise customers. Secondly, as this analysis is about, Microsoft is undercutting other services on price to win the aggregate, long-term contract.”

Microsoft Making Headway with AI: 

Microsoft is a sleeping AI/ML giant. Google gets a lot of attention here yet I think they are equally prepared to serve this market. Maybe Microsoft even more so because of its penetration in the Fortune 500, which are the companies most likely to invest in AI/ML for the practical reason it requires a certain size budget. Here are some comments on the call: 

“In Azure machine learning, provides industry-leading ML apps, helping organizations like 3M deploy, manage and govern models. All up, Azure ML revenue has increased more than 100% for four quarters in a row.” 

To help Microsoft rival Google and DeepMind, the company has been investing in OpenAI, which is a large R&D operation that is breaking ground with AI algorithms that help computers to create images from text, reduce the amount of code that developers need to write, and to also help robotics think and act like humans, among other things. GPT-3 is the language generation model that has gotten quite a bit of attention for its ability to build websites and games using a language like English rather than a programming language. As of now, GPT-3 is known as the advanced text autocomplete program.

DALL-E is a “12-billion parameter” version of GPT-3 that creates images from text. The partnership with Microsoft will bring DALL-E to apps and services, including the Designer app and Image Creator tool in Bing and Microsoft Edge – this was announced earlier this month at Ignite. According to TechCrunch, 1.5 million users were using DALL-E 2 to create images with brands such as Nestle and Heinz piloting DALL-E for ad campaigns.

Here is what was said on the call:

Mark Murphy

Yes. Thank you, very much. Satya, this quarter, we're seeing an inflection in many of your AI breakthroughs, thinking of GitHub Copilot and the image generation in your designer product. What is it that's enabling you to innovate so rapidly and essentially to be first to market? I'm wondering if it’s the OpenAI relationship or maybe some of your inferencing capabilities or something else?

Satya Nadella:

“Thanks for the question. First, yes, the OpenAI partnership is a very critical partnership for us. Perhaps, it's sort of important to call out that we built the supercomputing capability inside of Azure, which is highly differentiated, the way computing the network, in particular, come together in order to support these large-scale training of these platform models or foundation models has been very critical.

That's what's driven, in fact, the progress OpenAI has been making. And of course, we then productized it as part of Azure OpenAI services. And that's what you're seeing both being used by our own first-party applications, whether it's the GitHub Copilot or Design even inside match […] The AI comment clearly has arrived. And it's going to be part of every product, whether it's, in fact, you mentioned Power Platform, because that's another area we are innovating in terms of corporate all of these AI models. So, yes, so I think AI is a place where I think we have differentiated capability at an infrastructure layer for training and inference and the model that sells or platforms for third parties and our first-party applications are getting better because of the use of those AI models.”

Side note: I know it’s hard to be excited about innovation right now but I do believe Big Tech’s AI fortresses will be built during a recession when other companies are comparatively weaker.