Credo: Reliability Leader Aggressively Moves into Optics

Credo is a force to be reckoned with in the networking space. The company brought to market active electric cables (AECs) that integrates a DSP and retimer, which were more reliable and power efficient than the alternative, laser-based optical modules for short-reach connections. 

As Nvidia’s racks scaled-up to 72 GPUs, the impact of Credo’s AECs were instrumental to the systems seeing “up to 1,000x greater reliability than commodity laser-based optical modules” while consuming much less power. In past our past coverage on Credo, we’ve included pictures of their signature purple cables blanketing Nvidia’s in-rack connectivity, which resulted in hypergrowth fundamentals for Credo especially when Blackwell and Blackwell Ultra shipped.  

However, as we approach Rubin and certainly Rubin Ultra, it’s expected the copper-to-optics boundary will move in optics favor. As a growth investor, I have to be cautious anytime a company’s market share recedes to the adjacent market, even if that company’s revenue is growing YoY. In other words, Credo’s AECs alone are unlikely to sustain 200%+ growth, especially given that optics are becoming the preferred approach as reach and speed requirements increase, combined with tough comps from the Blackwell architectures. 

And yet, despite the AEC story offering less gunpowder, the stock has been particularly resilient and is approaching an important technical level. The reason is that, as the reliability-and-power-efficiency supplier, Credo may be innovating within its space again – but this time, with optics.  

The ramp that Credo foresees is fast at $600 million this fiscal year across three product lines. When pressed in the earnings call, management agreed that the ZeroFlap optics platform is expected to be the fastest-growing product within optics as it solves the same problem that Credo’s AECs are known for, which is network reliability. By continuously monitoring link health, the ZeroFlap optics platform autonomously detects and mitigates link instability before it impacts the cluster. 

The ZeroFlap optics platform also comes with an upsell opportunity for the company’s PIC technology, which can reduce the number of lasers that a link requires, and 100G and 200G DSPs. Combined, the platform combines hardware and software to keep the network stable. 

Awaiting the Optics Inflection in 2H FY27 

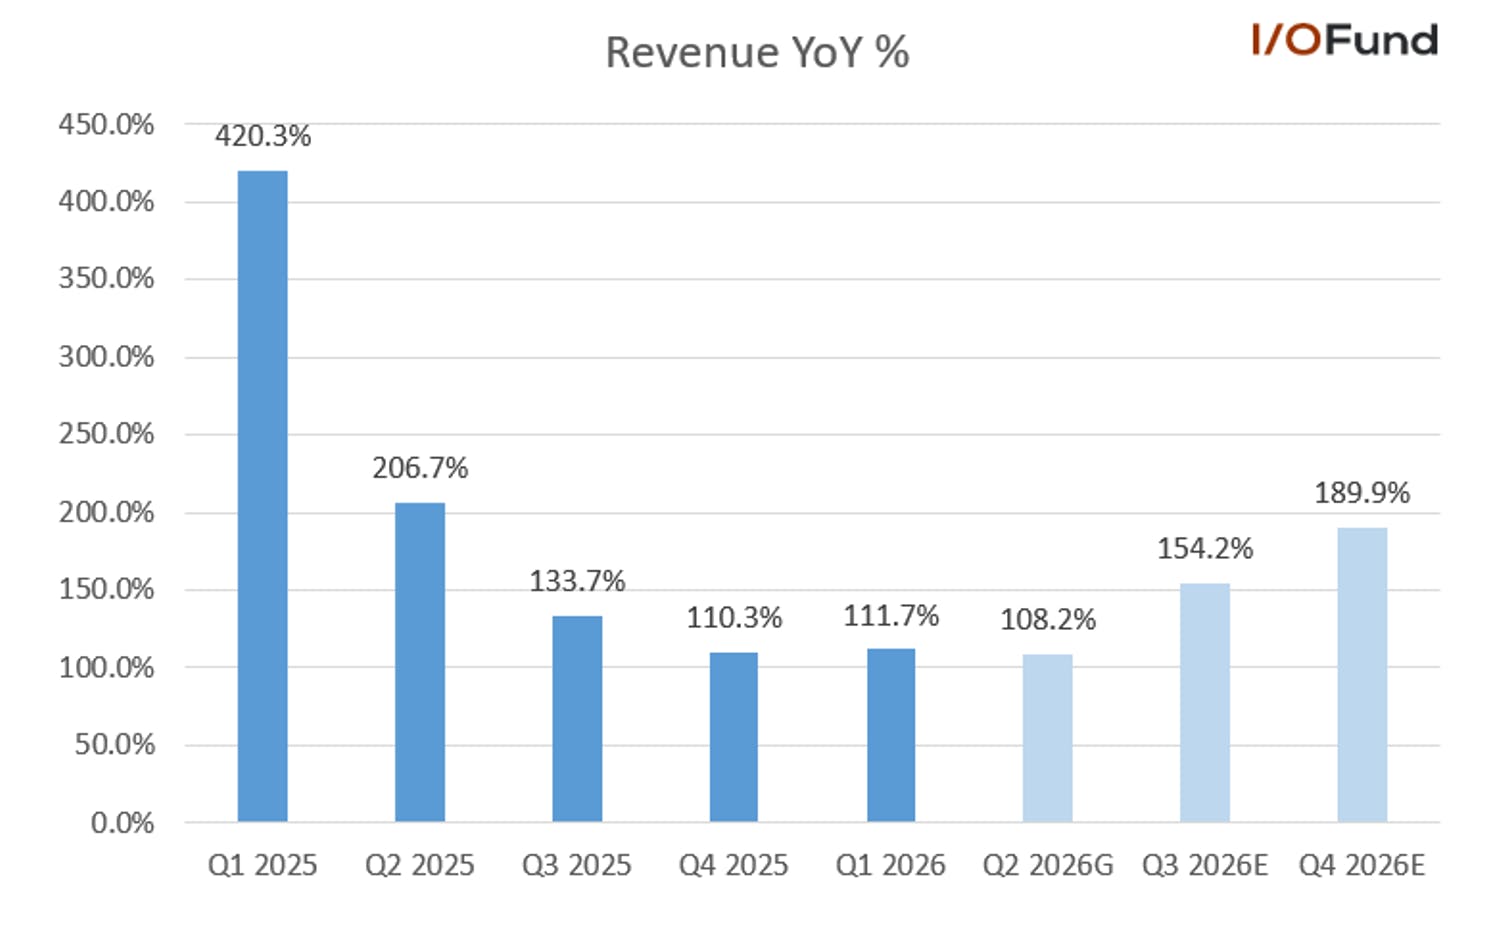
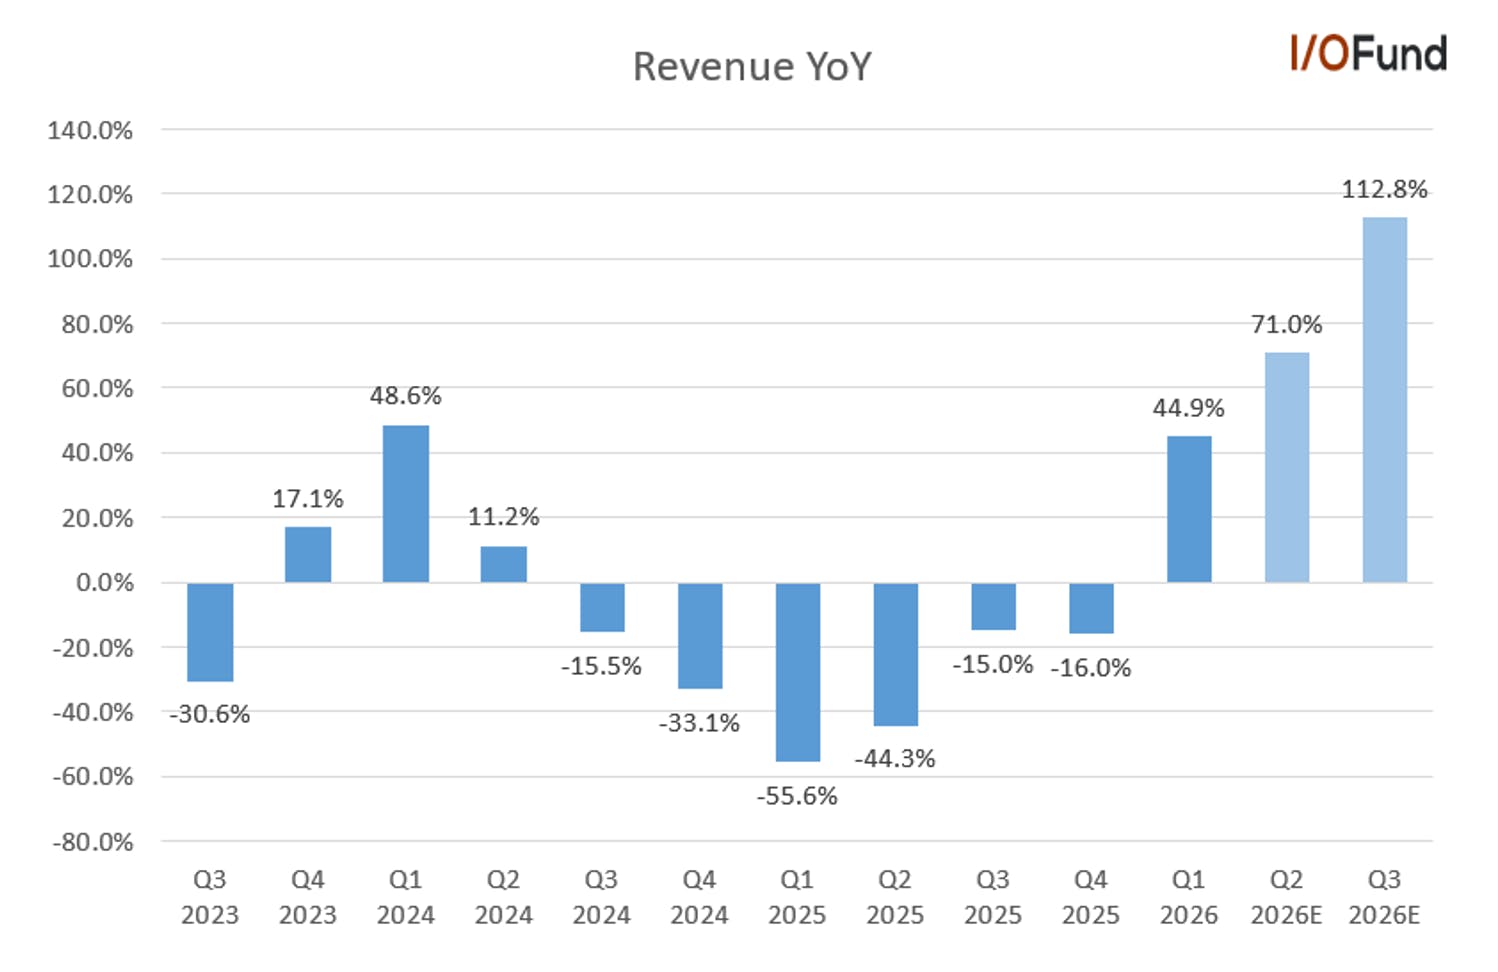
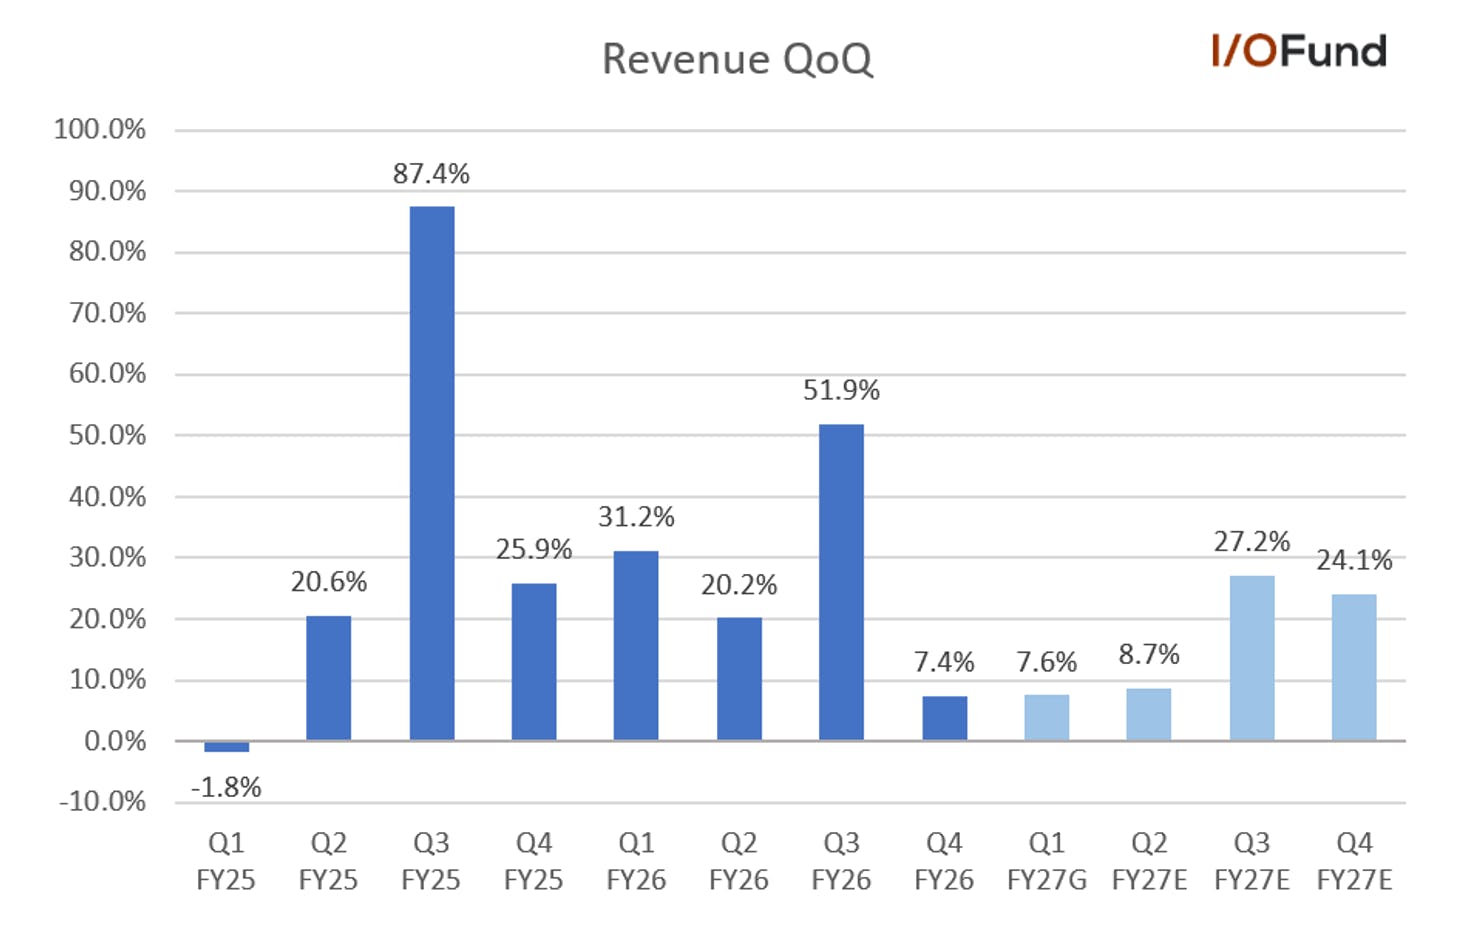
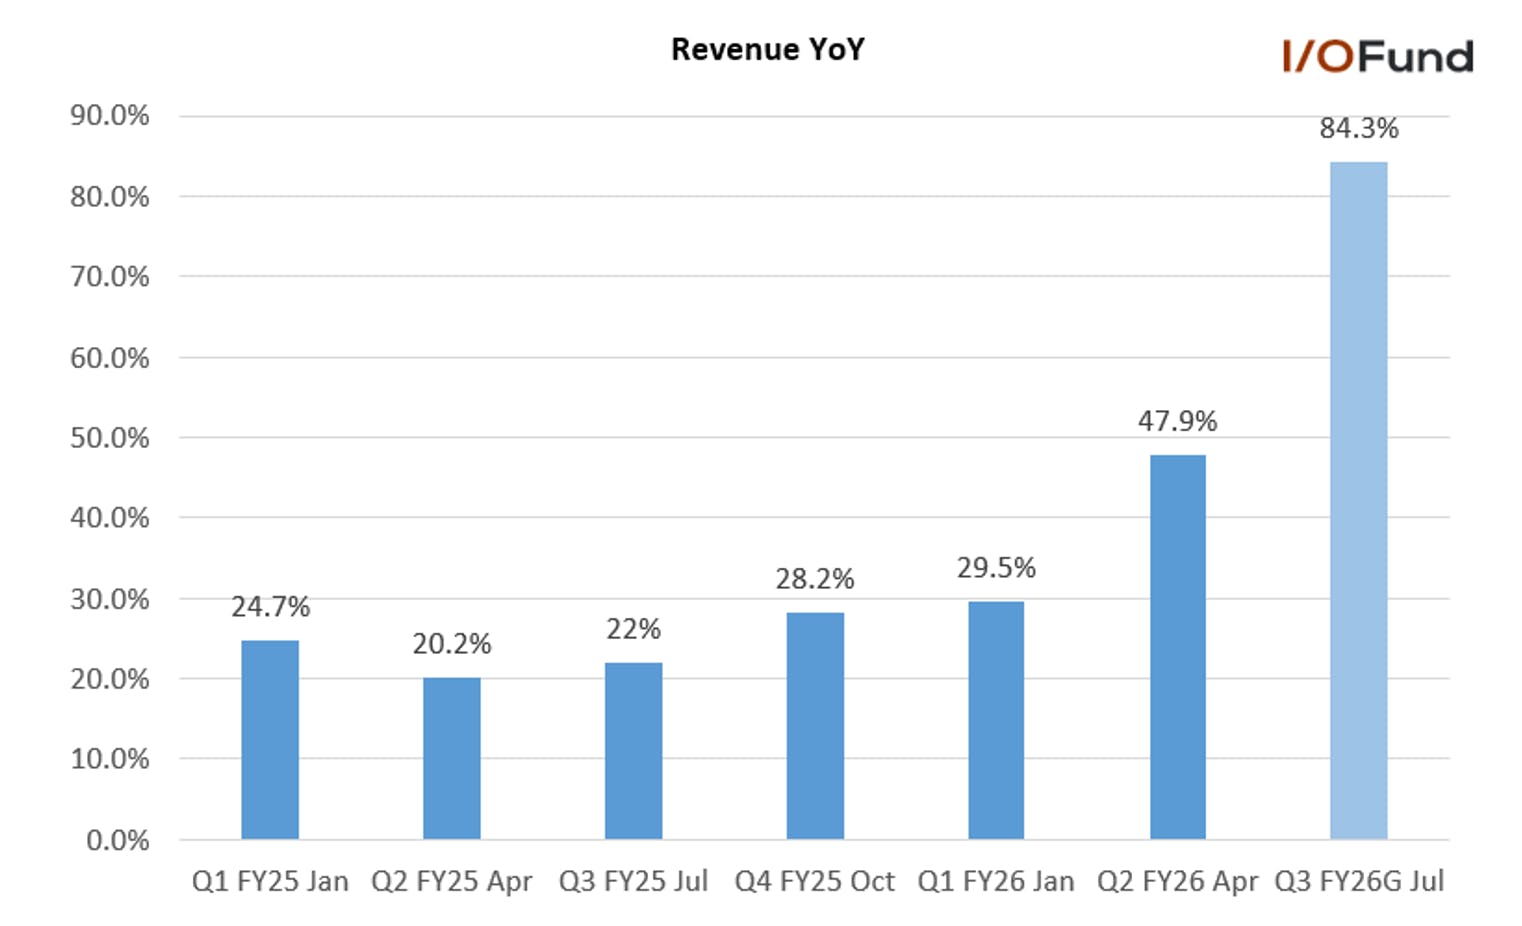
Credo’s growth is decelerating as optics replace AECs with growth peaking at 201% YoY last quarter, and growth is now at 157% this quarter for revenue of $437 million. As we move along, Credo’s YoY growth is expected to sustain in the 50% to 80% range. 

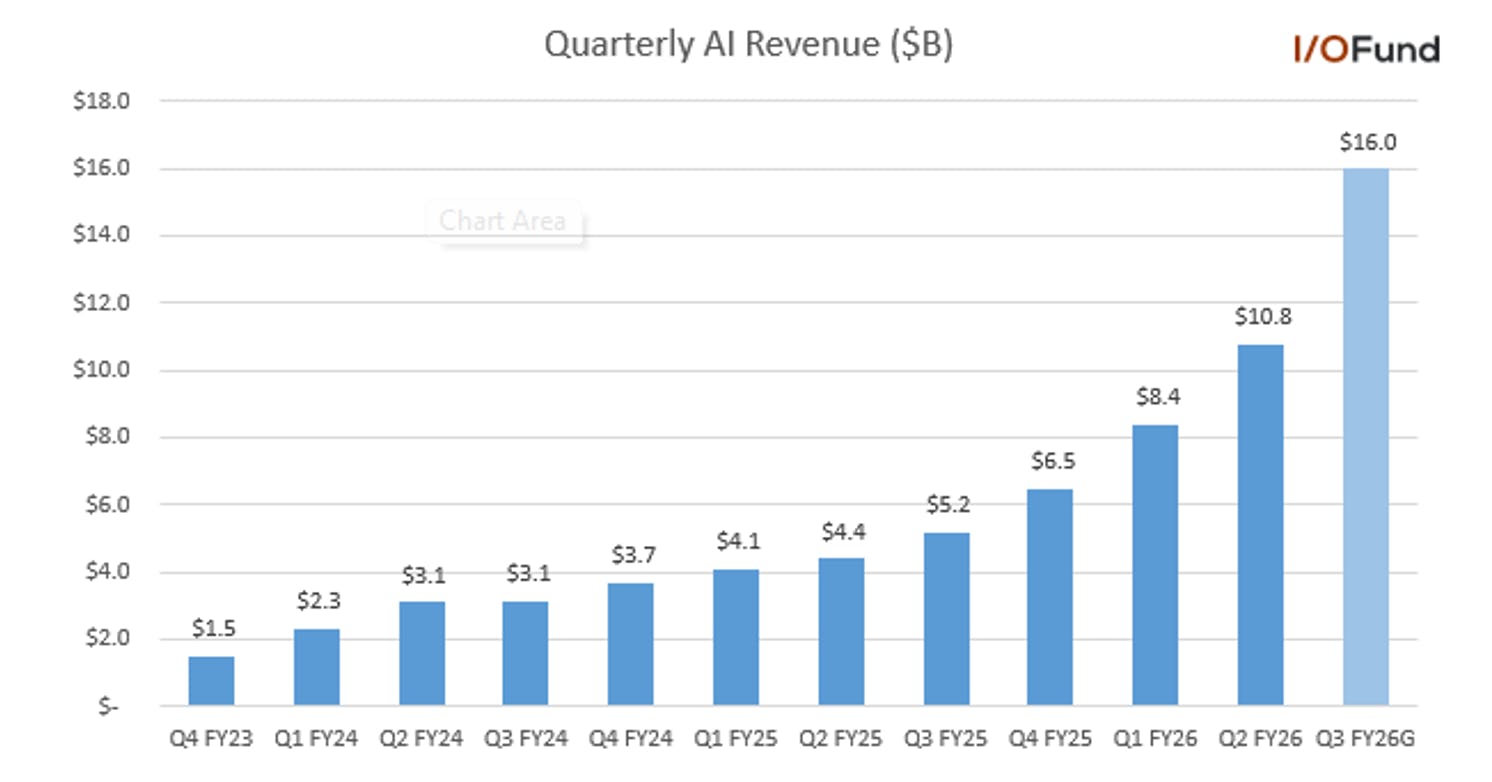
However, Credo’s guide makes it abundantly clear that optics is their growth story moving forward. The company is expected to exit the year with about $150 million or more in optics revenue per quarter, which represents the entirety of the QoQ growth as we enter FQ3 and FQ4. In other words, without optics, Credo would have been moving into flat to negative QoQ growth by the January and April quarter.  

This is important because it helps to frame the challenge that lies ahead for Credo, which is that already in this fiscal year, they had to innovate quickly to keep growth rates sustained. As the company exits the year, it’s expected to report 30% QoQ growth by combining a strong base off AECs with its new optics growth market. 

The growth is expected to sharply inflect in the back half of the year as Credo prepares to ramp a trio of optical products – optical DSPs, SiPho photonic ICs (acquired from Dust), and ZeroFlap optics. Credo expects each of the three to contribute more than $100 million in revenue in FY27, with optics in total contributing more than $600 million for the year with the ramp accelerating in 2H. As it stands, current estimates point to growth reaccelerating to nearly 28% QoQ in FQ3 (the January 2027 quarter) and maintaining roughly 24% QoQ in FQ4 as optics layers in to growth.   

While analysts rightfully picked up on the fact that the $100 million each and $600 million total optical revenue guidance implied revenue is skewed towards one of the three products (it was later revealed to be ZeroFlap), the bigger takeaway is that optics are contributing half of Credo’s YoY growth on a dollar basis:  

“If you kind of break that down or dive into that a little bit deeper, what you'll see is based on that guidance, if you look at absolute dollars year-over-year expectation for fiscal '27, about half of that growth in absolute dollars is coming from our optical portfolio and about half of that is coming from our existing copper portfolio, predominantly AECs, but also retimers.” 

Credo also provided some context ASPs for its optical suite, with the ZF optics ramp in part due to it carrying a triple-digit ASP versus a double-digit ASP for PICs and DSPs: 

To give a little more color on your first question earlier, the ASPs on the discrete components, optical DSPs and cyclo PICs, those ASPs are typically 2-digit ASPs. On the ZF Optics, we're going to see 3-digit ASPs. And so I didn't mean to be a bit elusive or not answer your question. But I think the math clearly says that as we ramp ZF Optics, that's going to be clearly our largest revenue contributor for our optical portfolio that the potential there is great.” 

CEO Bill Brennan also commented that a majority of the growth in FY27 will likely be attributed to scale-out demand, with scale-up only beginning to ramp with FY28 being more substantial, though mix will ultimately depend on customer deployment.  

Major Nvidia Supplier for AECs 

Credo is known for its ‘purple cables’, its AECs, that were pivotal in helping Nvidia scale to 72 GPUs per rack, with systems seeing up to 1,000x greater reliability versus commodity optical modules with lower power consumption.  

As Blackwell and Blackwell Ultra ramped, Credo’s dominance over the AEC market was quite clear, with analysts implying in late October that the company held as much as 88% market share, benefiting from high-volume deployments. For example, xAI asked Credo specifically for 7 meter AECs as it re-architected its 100K-GPU Colossus cluster for liquid cooling, with the extended reach allowing them to “connect all of their GPUs, switches with AECs, which are fundamentally bulletproof from a reliability perspective.” 

However, it’s not just for Nvidia where Credo finds success, as this reliability improvement and an up to 7 meter reach for both intra-rack and multi-rack connectivity has seen other hyperscalers adopt Credo’s AECs. For example, Amazon displayed the hallmark purple cables for intra-rack connectivity for its Trainium servers:  
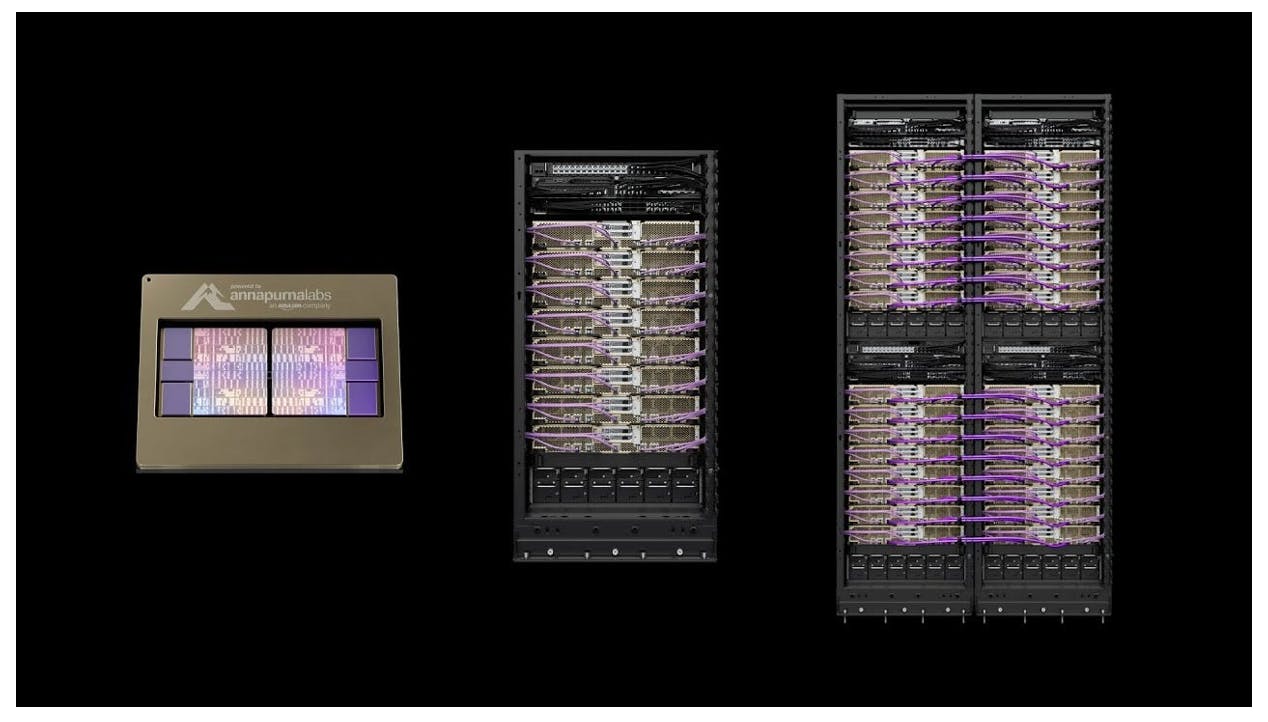
Source: Amazon 

Despite constant shifts in narrative over copper’s remaining useful lifetime at 200G speeds and concerns over reach and signal integrity, Credo’s copper growth is remaining in the near term, and could still have a solid foundation with Nvidia’s Rubin, as the copper-to-optics boundary is not expected to move heavily in favor of optics until Rubin Ultra later next year.  

More on ZeroFlap Optics, Ramp and Supply Preparations in Place 

Given its experience in AECs and the success it has built on the accelerator-agnostic purple cables, it’s not a leap to think Credo will do well on an optical version of cables, its ZeroFlap (ZF) optics. Credo’s ZF optics support 400G, 800G and 1.6T speeds with reach of up to 500 meters, with Credo’s PILOT software used for telemetry and link health monitoring.  

As noted above, ZF optics are expected to drive Credo’s revenue inflection in 2H as the line ramps, though management explained that there could be shifts in timing for the upgrade cycle from 800G to 1.6T depending on Nvidia’s Rubin and customer preference. This could have some impacts on the shape of the revenue ramp, as 1.6T carries a higher ASP versus the 800G products, similar to ASP dynamics at other transceiver vendors: 

“On the transition from 800-gig to 1.6T. Of course, the timing is going to shift a lot about the deployment of Rubin and really each of the customers' individual strategy. Some will be very delayed. Some will be first to deploy. But I think the exact timing of the transition will move somewhat as the platforms evolve.” 

Management added that 200G/lane revenue (1.6T) is expected to be relatively light in FY27, implying larger 1.6T contributions could arise in FY28. 

Regardless of the timing of the 1.6T transition for Credo and the ASP uplift, management has been quietly preparing for the optics pivot behind the scenes, with CEO Bill Brennan explaining at BofA’s conference shortly after earnings that the company has been building demand for six months, and securing supply for 12: 

“We've been in the demand generation mode for probably 6 months or so since OCP last year. But we've been in a mode of locking in supply for more than 12 months. And so leaning in with 3 partners that will assemble these transceivers, locking in supply of lasers, locking in supply of every component and the overall capacity. 

I mentioned on the call that exiting this year, we'll be producing numbers that are measured in 100,000 unit increments monthly, and then we're going to be doubling and tripling that in the following year. So we're going to have the supply to match the demand that we're generating.”exiting this year, we'll be producing numbers that are measured in 100,000 unit increments monthly, and then we're going to be doubling and tripling that in the following year. So we're going to have the supply to match the demand that we're generating.” 

For a bit of speculative, back-of-napkin math, assuming $0.75/gig pricing for the 800G optics and assuming those take majority share in FY27, ramping to 100K monthly capacity and sustaining that for one quarter implies quarterly optics revenue of up to $180 million. Doubling or tripling capacity to ~300K and shifting to a higher mix of 1.6T in FY28 (say 50/50 with 800G), for example, could help push optics-driven quarterly revenue towards $900 million in that upper scenario. 

Credo’s Reliability Advantage 

As mentioned above, Credo’s main advantage comes down to reliability, and it’s why you will hear management refer to reliability as their ‘North Star’ that guides their product roadmap. This dedication to reliability also underpins Credo’s pivot to optics, and why the company could have more of an edge than expected with its optics portfolio against the incumbents via rich telemetry. 

As clusters scale from tens of thousands to hundreds of thousands of accelerators, reliability becomes one of the most important factors. Credo’s management explained that connections between top-of-rack (TOR) switches and NICs have no redundancy, so any instabilities within these first link connections from GPU to switch could bring the entire cluster down.  

When you factor in the cost of building a 100K GPU cluster, or roughly 1,390 GB200 NVL72 racks costing approximately $4.2 billion (at a $3 million ASP), extended downtime from link instability affecting cluster stand-up or deployment directly impacts revenue and margins. This is especially important for neoclouds in ramp phases, who cannot afford delays and are increasingly turning to Credo for its reliability and advantage in helping stand up clusters quicker: 

“So basically, bringing up a cluster quickly, time to stability, which is dollars. If you buy billions of dollars of gear and it takes you 8 weeks or 12 weeks to bring the cluster up to a stable point so you can start generating revenue, that is hugely expensive compared to bringing it up in a week and then keeping it at near 100% uptime.” 

As to how this fits in to Credo’s burgeoning optics portfolio, the acquisition of Dust Photonics brought SiPho PIC tech into Credo’s stack, complementing its 100G and 200G DSPs, Robin and Cardinal. Extending its ownership of the optical stack down to the DSP and PIC level for its ZF optics gives Credo a much higher degree of visibility into signal performance and link behavior:  

“[ZF optics] was designed for that link or eliminating link instabilities between GPUs and switches, not at a core technology level, but by going up the stack. So designing a custom DSP that was capable of lighting up rich telemetry on every link. … The tighter DSP to PIC integration enables richer telemetry, enhanced diagnostics and more intelligent system-level optimization. …  

So lighting up rich telemetry on all of those links so that we can predict when a link instability is going to happen because we're monitoring signal integrity continuously across the entire cluster where ZF Optics are deployed.” 

This is how Credo finds its differentiation factor versus the incumbent optics vendors, within telemetry, reliability and visibility into optical performance. Credo is not competing against commodity optics but rather providing an upgrade with a more feature-rich product, offering an ability to preemptively identify potential causes of link failure, address it before it occurs, and increase cluster reliability and time to deployment. These are all key features that will help hyperscalers and neoclouds maximize GPU utilization, minimize downtime and maximize revenues. 

Dust Photonics for CPO/NPO  

Credo recently closed on its acquisition of Dust Photonics, not only bringing its SiPho PIC tech to its optics stack as mentioned above, but also providing Credo with a direct path to CPO and NPO architectures, letting the company quickly branch into the upcoming higher-growth vectors in the optical landscape.  

Dust provides an immediate expansion of Credo’s optics portfolio to 800G and 1.6T, with a roadmap to >3.2T, giving Credo a quick path to entry into the leading data rates on the market with potentially simplified development timelines for next-gen 3.2T products. This may help position Credo at the forefront of the optical transitions from 1.6T to 3.2T over the coming years, considering 800G is still ramping in volume and the 1.6T transition is currently underway.  

Credo also expects the path to CPO and NPO via Dust to happen relatively quickly, building off of its SiPho suite. Management outlined initial revenue for both CPO and NPO designs to arrive in FY28 (starting July 2027) based on current customer engagements, which aligns with current timing discussions from Astera expecting NPO to begin ramping in 2027.  

However, the most important part of the Dust acquisition is that Dust’s designs enable simpler optical architectures and reduced laser counts, both of which could facilitate stronger optical growth for Credo in a laser-constrained industry. Dust says its L3C tech uses simple lasers and reduced laser counts, which reduces bill of materials and increases yield for optical modules, while also reducing power consumption and lessening supply chain constraints. This could facilitate Credo’s entry and ramp into CPO and NPO-based architectures considering the supply chain challenges that Lumentum and other incumbents are facing when it comes to InP-based lasers.  

Next Year’s Catalyst: Active LED Cables and Weaver Chiplets 

Credo has a few more cards up its sleeve and two new catalysts on the horizon for 2027 (fiscal 2028): active LED cables and its Weaver gearbox chiplets. We first covered the two back in December with Q2’s report

Active LED cables are pluggable optical solutions that use micro LEDs as the light source (acquired with Hyperlume), which effectively extend its AEC strengths to longer distances, serving both scale-out and scale-up needs. ALCs represent Credo’s preparation for a cable-based future beyond AECs at 400G speeds, as management notes ALCs deliver the same reliability, power and cost efficiency as AECs with connections reaching up to 30 meters, or >4X that of the 7 meters AECs offer.  

Sampling of first ALC products is expected to occur in FY27, though the production ramp and revenue generation is currently slated for FY28. As we discussed in our Q2 write-up, management ultimately believes the ALC TAM to be more than double the size of its AEC TAM, with the opportunity likely rooted in the extension towards a 30 meter reach. Management this quarter described ALCs as having a very natural evolution from AECs for customers deploying the product, which could set the stage for a rapid revenue ramp come FY28 and FY29: 

“And so for certain customers, that's going to be a really natural product to get from a design in and beginning of production. So the dynamic there could be very much similar to AECs and ZF Optics in the sense that we can see large revenue quickly.” 

Moving over to Weaver, which is the first product of Credo’s OmniConnect strategy to leverage its copper (and optics) portfolio for die-to-die solutions. Weaver is Credo’s solution to attack the inference memory wall with a fanout gearbox chiplet leveraging 112G very-short-reach SerDes. This addresses the ‘fanout’ problem, where DDR memory systems become constrained by limited I/O density as memory dies can only be accessed by a limited number of pins. Credo/s fanout gearbox aims to increase I/O density by 10X and offer 16TB/s of memory bandwidth and 6.4TB of memory density to mitigate this limitation.  

Credo’s first customer for Weaver, AI chip startup Positron, is preparing to launch two inference accelerator engines in 2027, Asimov and Titan. Asimov features LPDDR memory capacity of up to 2.3TB per chip (without using HBM), which Credo states is “more than 10x any other inference engine that's been announced in the market. So game changing from the standpoint of performance.” Compare this to the GB200 Superchip, which carries 372GB of HBM memory per chip, or AMD’s MI355X, which carries 288GB. 

Asimov also packs in realizable memory bandwidth of 2.76 TB/s per chip with a power draw of just 400W, scaling to 16,384 chips in a single cluster, which could make it an interesting memory-optimized, power efficient choice for inference.  

Positron’s Titan combines four Asimov chips into one system, offering more than 8TB of LPDDR memory with 32TB/s of external chip-to-chip bandwidth (half of Vera Rubin NVL72’s 65TB/s) in an air-cooled form factor capable of scaling to 4,096 chips per cluster – at that 4,096 chip cluster size, Titan would offer nearly 33 PB of LPDDR memory, whereas a similar sized cluster of Rubin NVL72’s would offer nearly 1.2 PB of HBM4. With this memory, Positron says Titan is capable of supporting 10 million token context windows and could enable a 2030-class of frontier- model in 2027.   

While it is still unclear how quickly Positron will ramp these new chips, Credo is seeing a rather large revenue opportunity from Weaver, benefiting from a high ASP: “Now if 2 terabytes are deployed, that requires many, many Weaver chips. And what I've said in the past is that the revenue contribution per GPU can be between $2,000 and $3,000.  And so you can see that, that product category will ramp very quickly as well as we've got customers that go into volume with their inference GPUs that utilize that solution.” 

Financials Overview 

Credo’s growth decelerated in FQ4 to 157% YoY to $437 million, a more than 44 point deceleration, while QoQ growth came in at 7.4%, moderating from FQ3’s 51.9% print. Credo guided for this YoY deceleration to continue in FQ1 to 111% YoY at $465-475 million, while QoQ growth would be sustained at 7.6%. QoQ growth is expected to inflect come 2H FY27 (the Jan 2027 quarter) with Credo returning to >24% QoQ in both FQ3 and FQ4.  
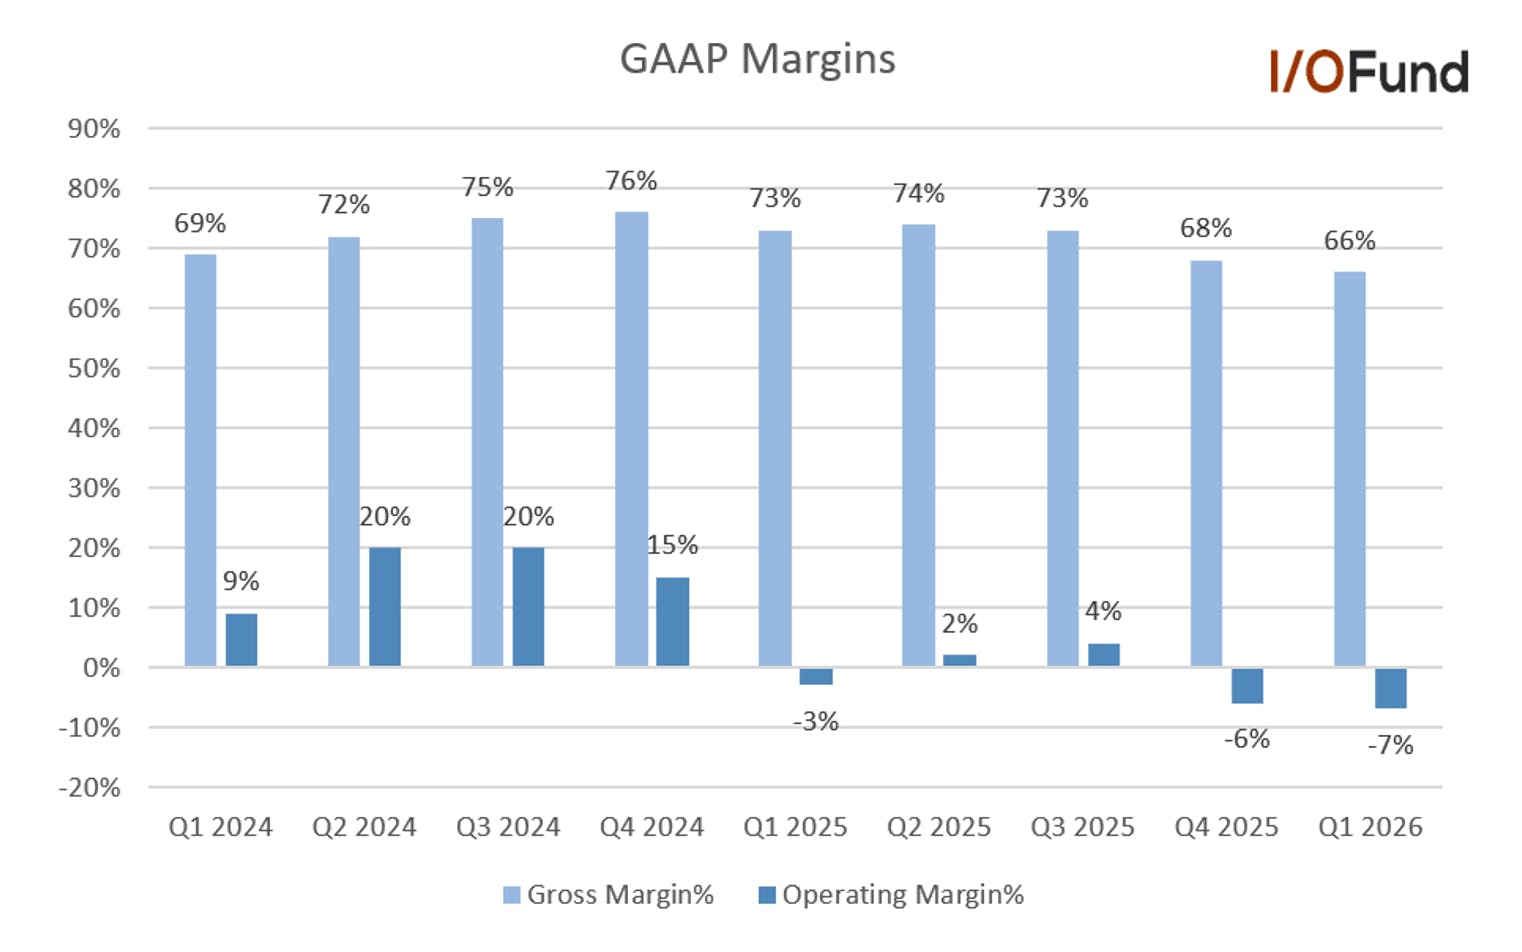
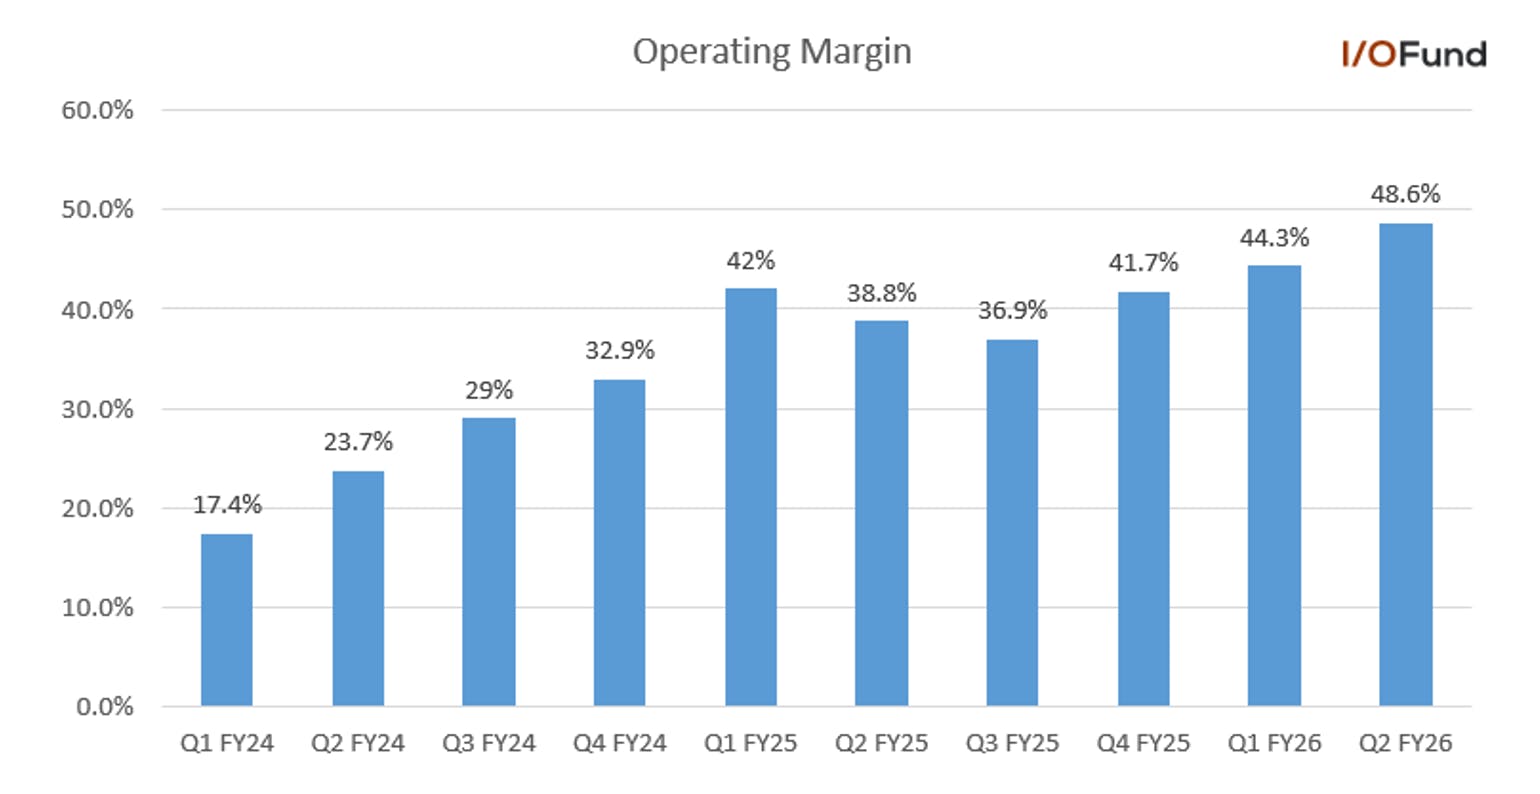
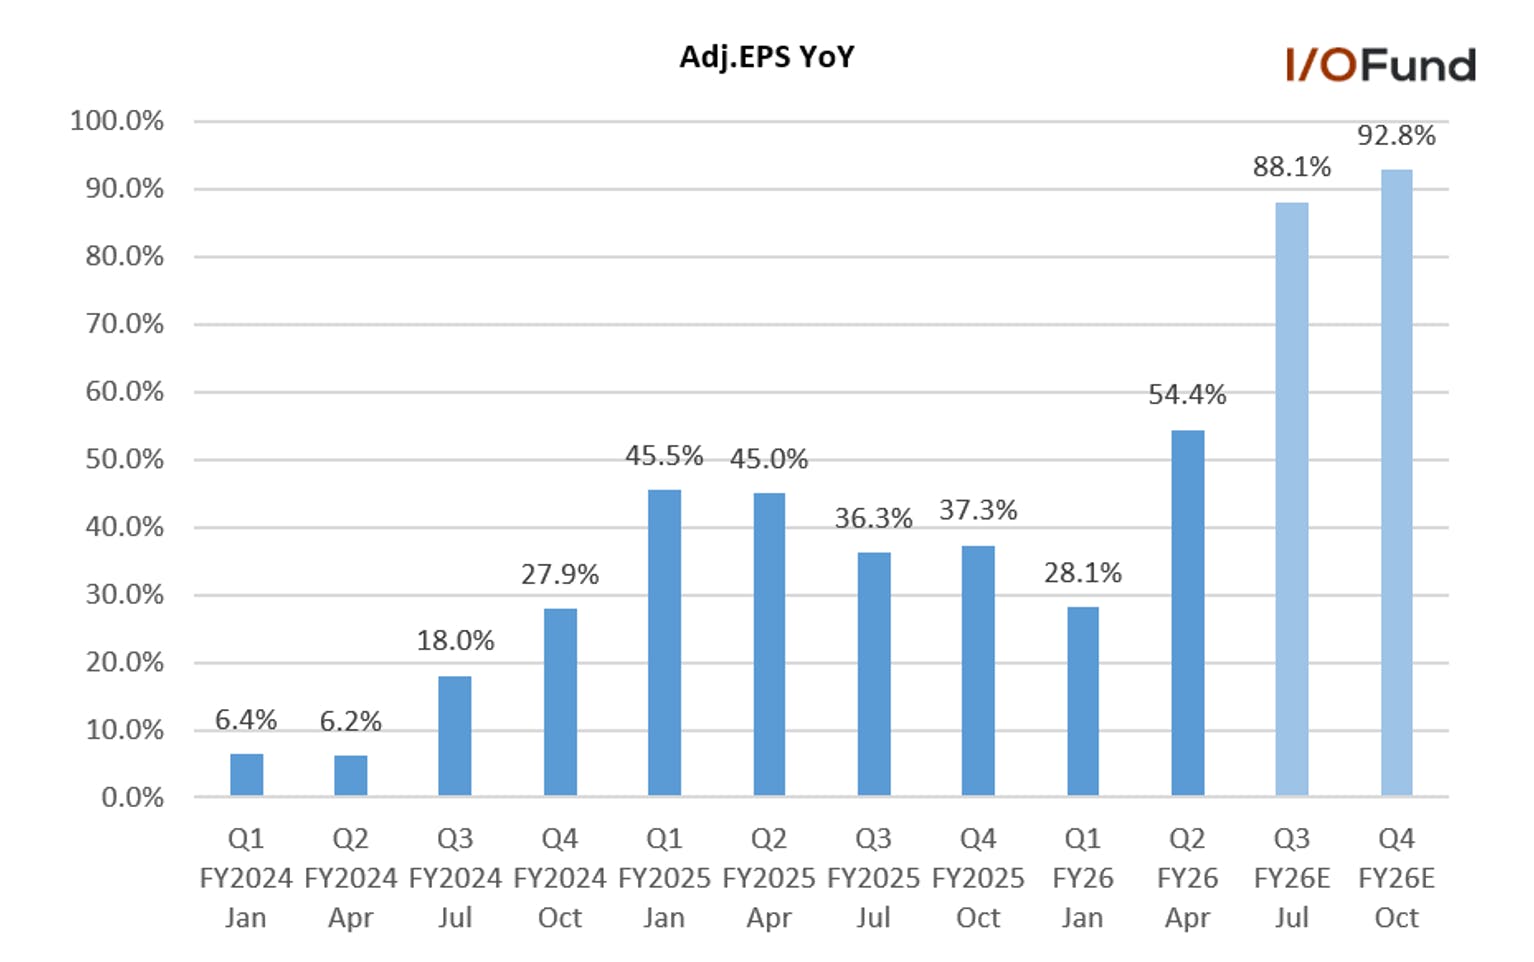
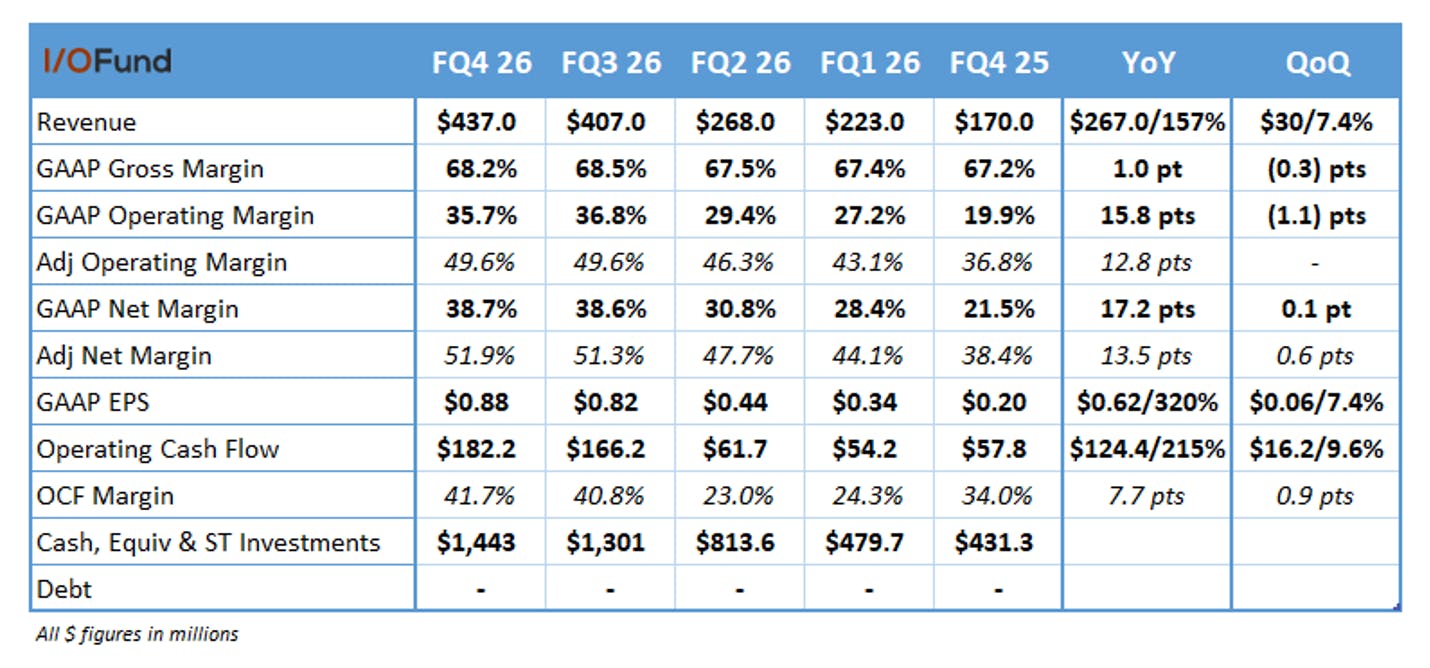
Credo is benefitting from strong operating leverage – while GAAP gross margin expanded 1 point YoY to 68.3%, GAAP operating margin expanded nearly 16 points YoY to a strong 35.7%. This operating leverage is visible in Credo’s strong GAAP EPS growth, up 340% in FQ4 to $0.88.  

For a quick look at FY27, Credo guided for YoY growth of >80%, implying revenue exceeding $2.41 billion. Credo’s bottom line is expected to remain strong, with GAAP EPS currently expected to rise 98% YoY to $4.98. 
Key Metrics 

Credo’s inventories as of FQ4 were $250.8 million, up 20.6% QoQ from $208 million in FQ3, with this growth predominantly driven by a $49 million increase in raw materials, up 320% QoQ, offsetting a slight decrease in finished goods. This adds a layer of confidence in Credo’s upcoming growth inflection and optics ramp in 2H. Credo does have a high degree of customer concentration, reporting three >10% customers in FY26, accounting for 84% of revenue; its two largest customers accounted for 65%, at 32% and 33% respectively (with the 33% customer down from 63% in FY25).  

Conclusion 

Credo’s AECs were instrumental in driving up to 1,000x greater reliability versus commodity optics as Nvidia’s racks scaled to 72 GPUs, while consuming much less power. The company is looking to take this reliability and power-efficiency advantage to quickly iterate for optics, with its ZF optics platform expected to be the cornerstone of a rapid ramp to >$600 million in optics revenue this year.  

The driving factor behind management’s confidence in achieving this accelerated ramp in a crowded optics landscape is two-fold: leveraging its reliability strengths, with ZF optics continuously monitoring link health, autonomously detecting and mitigating link instabilities to maximize GPU utilization and minimize cluster downtime; and building a full-stack platform with upsell opportunities for its PICs and 100G and 200G DSPs.

Damien Robbins, Equity Analyst at I/O Fund contributed to this analysis.

Please note: The I/O Fund conducts research and draws conclusions for the company’s portfolio. We then share that information with our readers and offer real-time trade notifications. This is not a guarantee of a stock’s performance and it is not financial advice. Please consult your personal financial advisor before buying any stock in the companies mentioned in this analysis. Beth Kindig and the I/O Fund do not own shares in CRDO at the time of writing and may own stocks pictured in the charts.

Recommended Reading:

Macom: Data Center Revenue Accelerating to 35% QoQ in FQ3 

Macom operates in a similar space as MaxLinear, selling the analog and photonic content around DSPs, including drivers, photodetectors, TIAs, lasers and equalizers. The company’s product portfolio is highly diversified across the different laser architectures, though revenue growth is increasingly tied to 800G and 1.6T PAM4 products.  

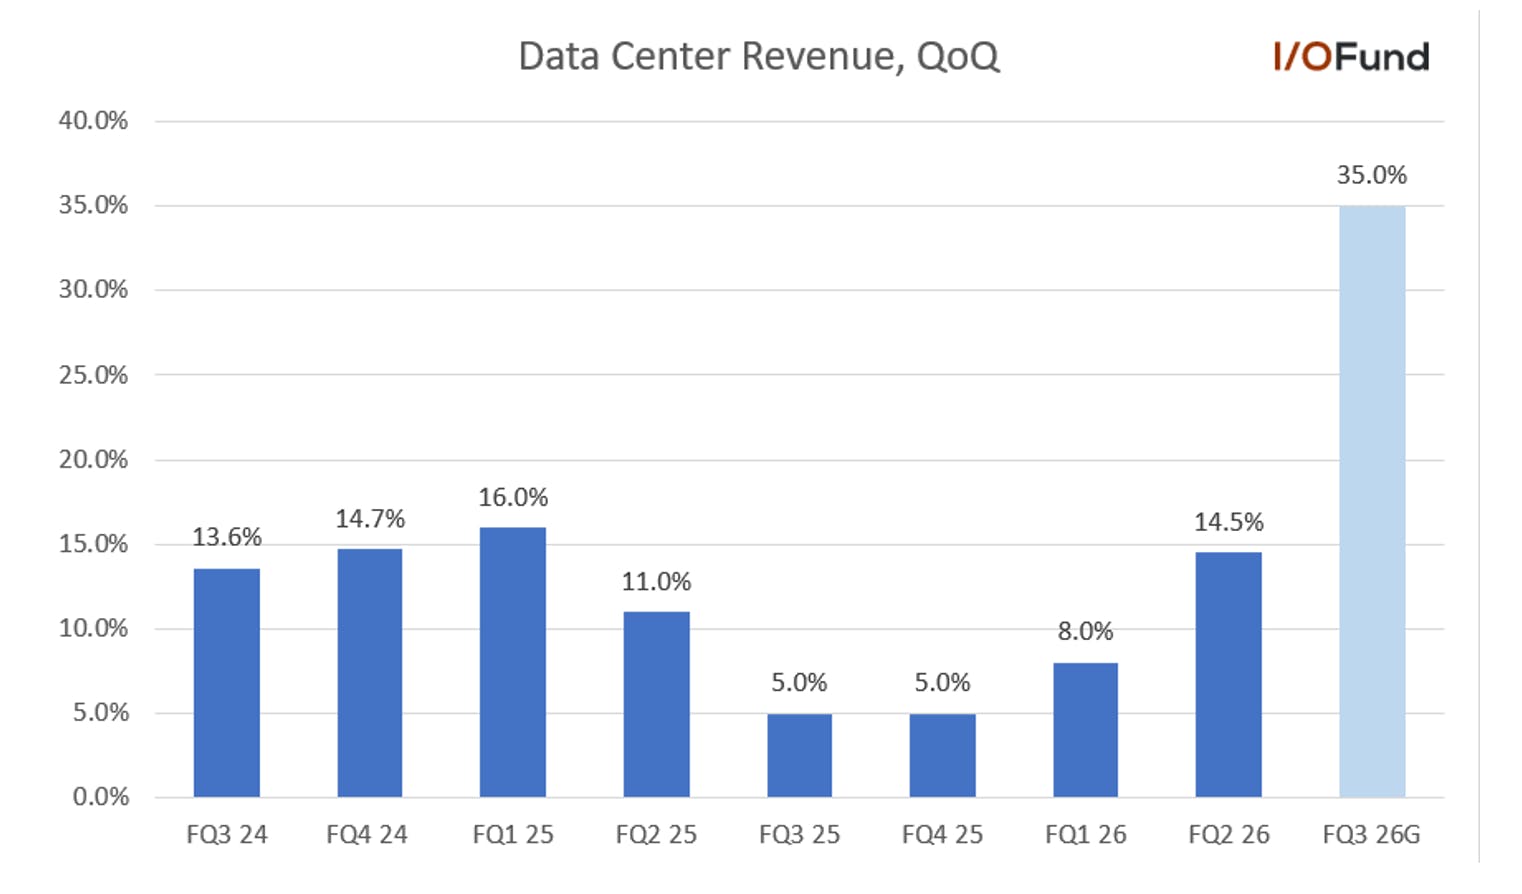
Riding this strong momentum, plus its largest quarterly bookings in company history, Macom boosted its Data Center growth forecast for the year by more than 20 points, now forecasting 60% YoY growth, up from 35-40% previously. Much of this growth is arising in the second half of its fiscal year (with FQ3 the current quarter ending June), with Macom projecting Data Center growth of 35% QoQ, representing a 2.5X increase from 14.5% QoQ in FQ2.  

Supporting this growth and additional revenue upside is increasing capacity at existing fabs, with North Carolina increasing by 30%, and improving yields, which are translating into improved operating leverage and earnings growth. This is becoming more visible in Q3 with adjusted operating margin forecast to improve to 30%, up more than 2 points QoQ, with more expansion likely in 2027 as Data Center revenue ramps. Fab expansion is also a cornerstone for Macom’s goal of doubling to $2 billion in annual revenue, and management signaled they can reach this without substantial investments.  

Macom is not an AI pure-play due to having defense as the majority revenue contributor, but it has a rather enviable position within the optics supply chain as it benefits regardless of who wins on DSPs and also stands to benefit if/when DSPs get removed.  

Brief Product Overview and Differentiation 

Macom has a degree of differentiation within its business model that helps it stand out within the optical supply chain – the company owns its own fabs with defense, GaN and InP products clearing on those fabs, giving it some defensibility over fabless competitors when it comes to capacity.  

On the product side, Macom is flexible in offering its analog and photonic components as discrete, in integrated sub-assemblies, or in fully integrated chipsets, allowing them to meet customers wherever their needs arise. Macom also has a couple other key advantages strengthening its moat in content surrounding DSPs – it has an early lead on the fastest speeds, with 200G/lane photodetectors ramping for 1.6T support with 448G/lane PAM4 drivers preparing for the shift to 3.2T, and is poised to benefit regardless of who wins on DSPs and if DSPs eventually get replaced by CPO solutions. Growth is also being supported by stacking its photodetectors on to its TIAs: “We demonstrated, I think, a year ago at OFC, the idea of stacking the PDs on our TIAs. And so that has certainly been beneficial in terms of supporting not only TIA growth, but also PD growth.” 

Macom also has a dominant position within LPOs as it sells into the module makers, and is poised to win regardless of which module maker emerges on top: “as part of our strategy, we want to be diversified. So as you know, we don't sell DSPs just for the record, but we want to support module manufacturers that are, for example, using LPO or if a particular customer wants to electrify copper or maybe they want to experiment with coherent or coherent light.” 

CPO presents another opportunity, with management explaining that its newest optical products are designed for CPO and NPO applications, with an ability to differentiate in the CPO market versus competitors due to deep customer relationships, photonic and IC expertise. While management offered no clear timeline for when CPO revenue could ramp, considering it builds off the same TIA, driver and laser platform, contributions could begin appearing as soon as late 2026 if Macom plays early as it had for 1.6T. 

To touch upon some other products and growth outlets, Macom is providing promoting linear equalizers to help extend copper interconnect reach at 800G and 1.6T, noting that AECs could also be additive in the future. Legacy products such as DFB lasers for 100G modules were highlighted as potentially strong drivers over the next one to two years, as customers and competitors pivot to higher-power CW lasers for SiPho, leaving a gap in DFB.  

Higher-power CW lasers are also an unexpected tailwind, with growth potentially emerging in fiscal 2027 though management hinted not to expect this until fiscal 2028. CEO Stephen Daly explained that Macom is seeing excellent optical performance on its 75mW CW lasers and is currently working on reliability testing, and when “we feel like we have a reliable product, then we'll start working with module customers so that they can start their module quals. And then after that comes the hyperscaler qualification. So when you add all that up and look at the time line, you're really talking about potentially, and this is assuming everything goes well and oftentimes it doesn't, a fiscal '27 or '28 time frame of contribution.” 

Data Center Growing Rapidly with Future Catalysts into 2027 and Beyond 

Macom is seeing its Data Center revenue growing quite rapidly in fiscal 2026 (ending September), as management raised FY26’s growth forecast by >20 points to 60%. This momentum is likely to extend well into 2027, as the company is leveraging its diverse product portfolio, an early lead in 1.6T and potentially an early lead in 3.2T.  

As noted above, diversification is a strength for Macom to be able to support a range of modulations across different optical architectures, yet its main advantage (and likely key driver of this revenue growth raise), is that it was early to 1.6T:  

“We tend to gravitate towards the highest data rate type products. We were one of the early suppliers to the 1.6T rollout, and that is paying big dividends right now as that use case expands across the data center and various hyperscalers. And so we're able to solidify strong positions there.” 

The early presence at 1.6T would be the main differentiator for Macom, considering other vendors such as Lumentum are highlighting 1.6T ramps on deck starting in the current quarter. While growth is being driven by higher shipments of pluggable optic modules and optical cables using its 800G and 1.6T PAM4 products, management explained that 1.6T deployments are expected to remain strong throughout calendar 2026. The upcoming shift to 3.2T deployments in the future provides another layer of growth come 2027 and 2028 as Macom is already preparing for the faster data rate with the new 448G PAM4 drivers.  

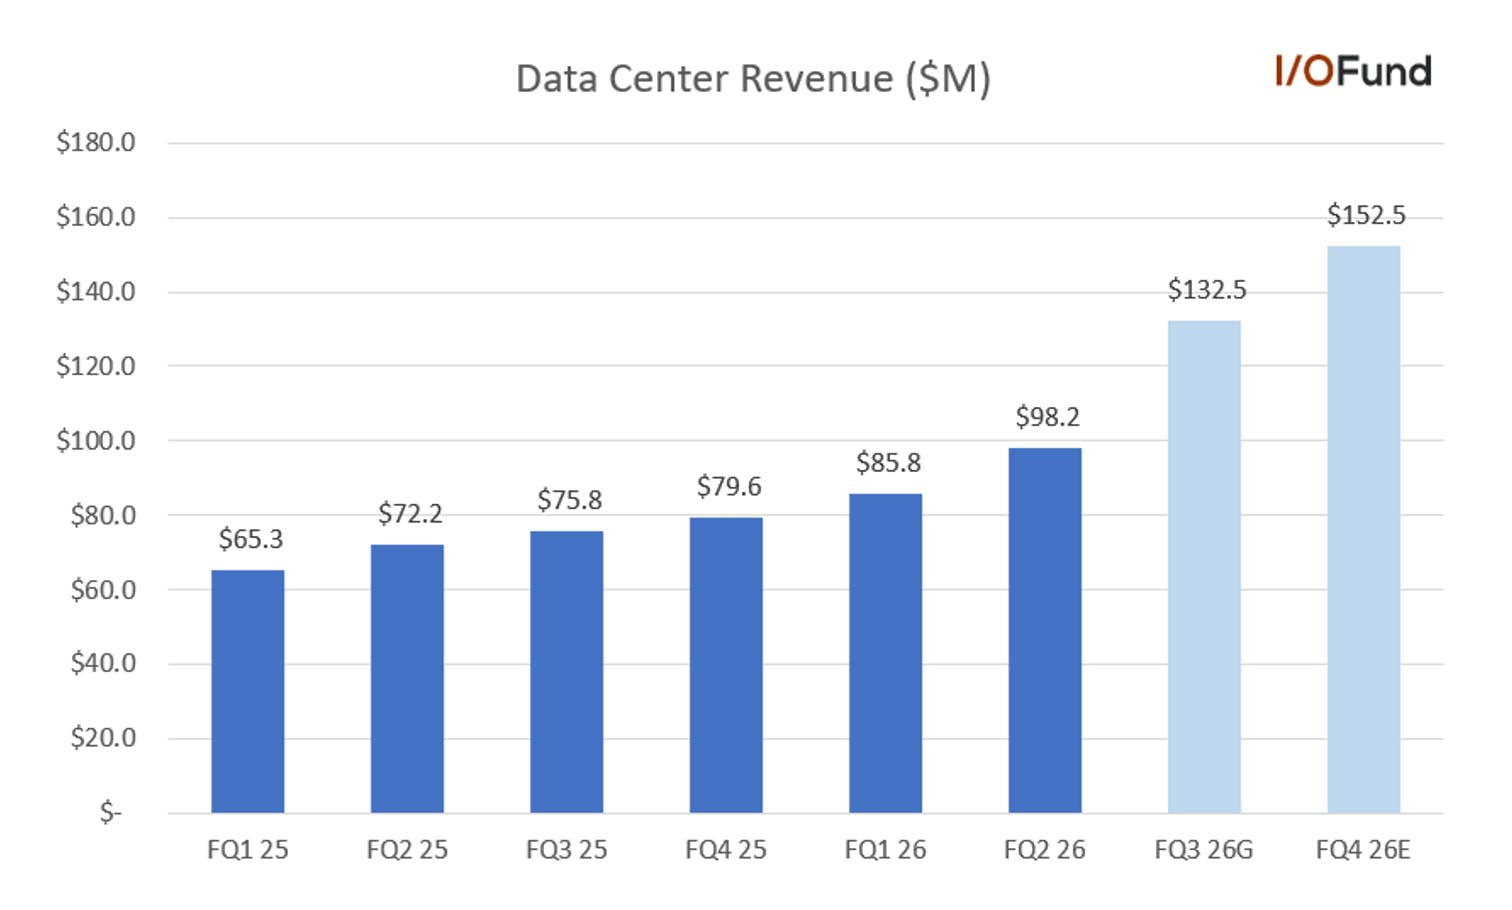
This 800G and 1.6T strength is the likely driver behind management raising its base case FY26 Data Center revenue growth forecast from 35-40% guided in FQ1 to 60%; this also represents a 40 point raise from the initial 20% growth guidance offered. This would roughly project Data Center revenue to be $469 million for the year; for a quarterly breakdown, FQ3’s guide for 35% QoQ growth would project revenue at roughly $132.5 million (up 74.8% YoY) with FQ4 landing at $152.5 million, up 91.6% YoY and 15.1% QoQ. 

Further supporting this raise and implying that revenue still could have more upside into Q4 and beyond was Macom’s bookings strength. Macom recorded its largest quarterly bookings in company history in FQ3 with the strongest portion of orders coming from the Data Center. Q3’s book-to-bill also reached 1.5:1, ramping from 1.3:1 in Q2 and ~1 to 1.1:1 through FY25, with a 12 month recognition window: “We typically, just as a practice, only recognize bookings that are within a 12-month period as well. So this 1.5 book-to-bill really reflects orders that would be delivered within 12 months.” 

The other impressive factor within this growth is that CEO Stephen Daly implied that growth is tied to unit growth in the optical networking industry, rather than being an inflection: “So it's not really an inflection point. I would say it's consistent with really the unit growth within the market as well.”  

This is important as 1.6T is in its early stages of mass adoption and commercialization this year, with some industry estimates pointing to shipment volumes of ~10 to 15 million this year, with demand potentially scaling as high as 40 million by 2027 (the question remains if supply constraints can meet that). While this may not necessarily be correlated 1:1 with revenue, the 2-3X increase in 1.6T unit shipments next year provides a strong backdrop for 1.6T growth alone for Macom over the coming seven quarters. 

Given the scope of the raise this quarter, analysts questioned about where the new revenue was layering in, with management chalking it simply up to demand and the expansion of its portfolio, including 3.2T and higher-speed CW lasers through 2027 and 2028:  

I had a question on the Data Center growth now basically targeting more than 60%. Just curious, above and beyond just higher CapEx from some of your end customers, what's some of the delta here, some of the new revenue that's layering in? 

Stephen Daly, CEOStephen Daly, CEO 

Very much the expansion of our product portfolio. And we have talked about really over the last 12 months, the ramp-up of some of our optical components. And so that has certainly helped drive some of the growth. But I would say, generally speaking, our focus is on 1.6T, 800 gig. These are areas where we're seeing a lot of strength. We expect that strength to continue. And in fact, we're seeing more and more demand as we sort of enter our second half. 

In terms of the new revenue or the new categories of revenue for our fiscal '27, certainly, the higher data rates, so 3.2T, possibly some coherent light ramp-ups. And also depending on the work that we're doing with our laser portfolio, we may be able to add some revenue to our fiscal '27 or even fiscal '28 on CW lasers.” 

Path to $2B Revenue with Disciplined Capex, Secured Supply 

As noted in the intro, Macom is aiming to double its annual revenue from $1 billion (having hit that on a TTM basis in FQ1) to $2 billion primarily via increasing capacity at existing fabs. Macom is aiming to increase North Carolina capacity by 30% by the end of calendar 2026, adding advanced GaN and expanding InP capacity in Massachusetts, and improving capacity in France by moving from 3-inch to 6-inch wafers.  

While Macom has noted that they are increasing production while simultaneously improving yields, a key factor in improving margins, the larger and more important lever at play here is that Macom does not need to build a new greenfield fab or buy one to reach this $2 billion target: 

“Now that we hit $1 billion of revenue, we want to hit $2 billion. And we don't need to buy a fab or build a fab to do it. What we need to do is expand incrementally capacity within the walls of our existing facilities.”  

This ability to expand capacity within its existing footprint without having to lay out substantial capex for a greenfield build is important as it is expected to lend to improved operating leverage as new capacity comes online and “tremendous earnings growth.” For example, Macom is adding the 30% uplift in North Carolina for just $15-16 million, or barely 1% of annual revenue by purchasing heavily discounted fab equipment.  

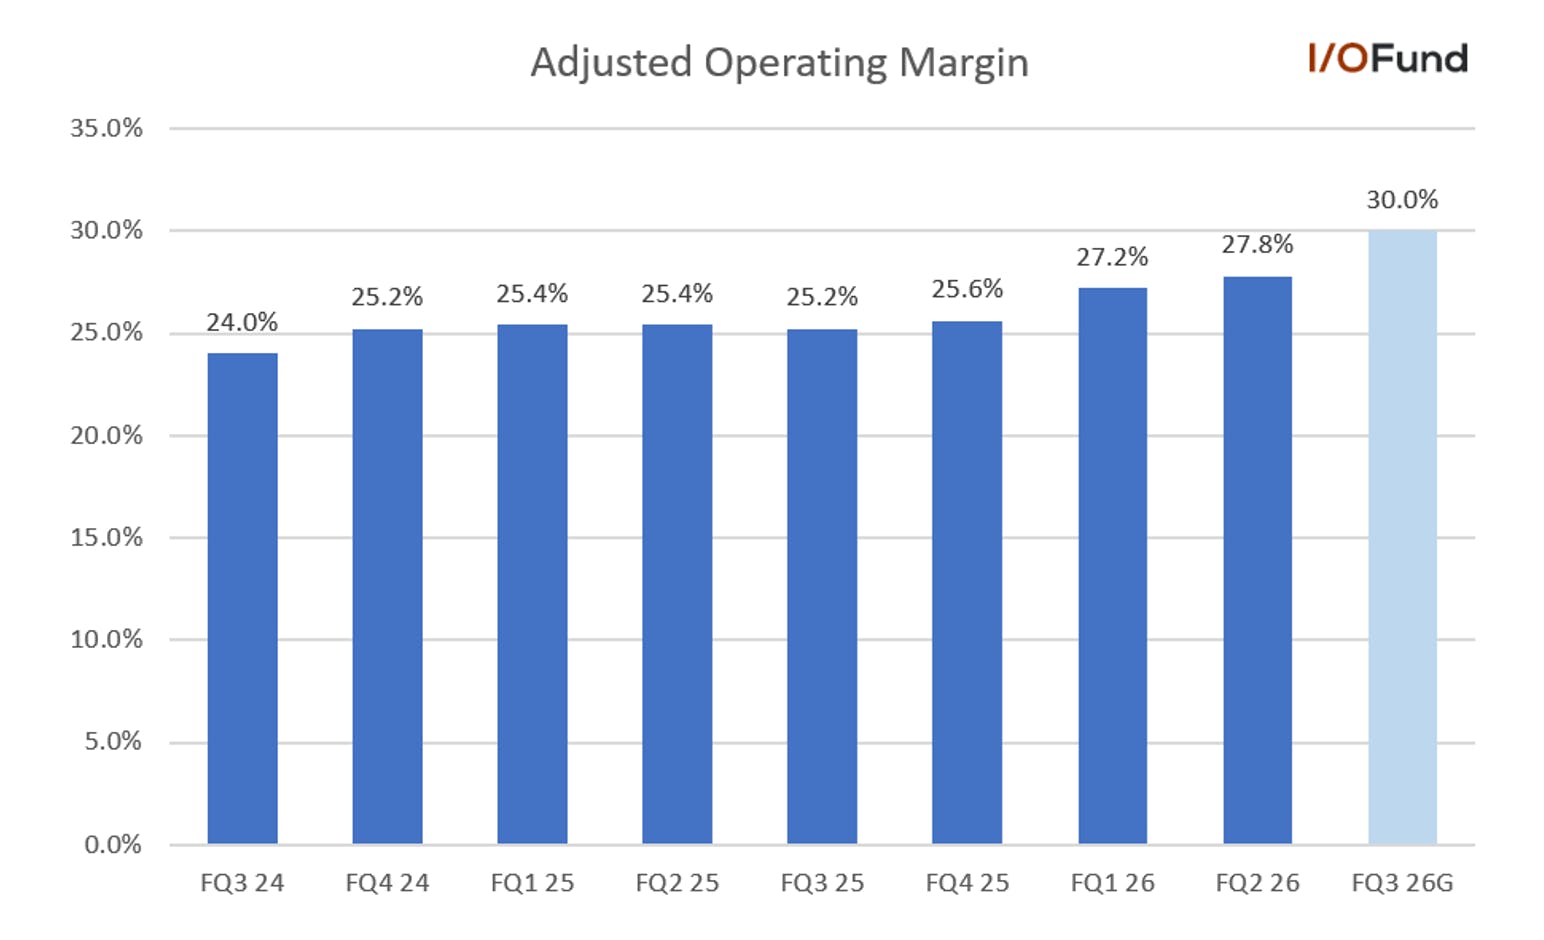
Overall, capex is expected to remain very low, at 4% to 5% of revenue, such as FY26’s guide for $55 to $65 million. This capital-light capacity expansion and yield improvement plan is expected to translate to improved operating leverage, with management guiding for FQ3 adjusted operating margin to reach 30%, up more than 2 points sequentially and representing the fourth consecutive quarter of sequential expansion. This is contributing to rather strong adjusted EPS growth, with the next four quarters expected to grow >50% YoY, or 10 to 25 points faster than revenue growth.  

Also supporting management’s goal of doubling to $2 billion in revenue is that they have secured supply for InP and SiC products, especially important considering the InP constraints currently affecting the industry. Macom invested £45 million into epitaxial provider IQE, and as part of the transaction Macom “is put in place a long-term supply agreement to make sure that we have adequate supply of the technologies that we're currently acquiring from them and from others.” Management explained that this will “backstop our expected growth, not only as it relates to indium phosphide-based products, but also silicon carbide-based products and some other technologies as well.” 

Defense is a Leading Segment 

Outside of the Data Center, Industrial & Defense is a leading segment for Macom, currently contributing the majority of revenue at ~41%, though this is likely to change next quarter as Data Center quickly catches up.  

In Defense, Macom serves a broad customer base, supporting radar, drone and drone defense, missile and missile defense, and electronic warfare and communication systems. Management expects revenue from its top 25 defense customers to increase significantly YoY in FY26 versus FY25, though did not offer a clear guide on revenue contributions or growth percentages. 

Increased global conflict provides a solid backdrop for increased defense spending in the US and Europe over the medium-term, with Macom positioned well to benefit via its federal exposure with the DoD and ability to offer domestically sourced, turnkey solutions.  

Satellite and 5G Offer Future Opportunities 

Low-Earth orbit satellites and 5G were also detailed as future growth opportunities, as analysts pointed out that other companies mentioned 7,000 to 10,000 LEO launches over the next three years, opening the door for solid annual growth.  

Macom explained that this upcoming LEO opportunity is expected to drive momentum in its Telecom segment entering fiscal 2027 with the broader revenue ramp occurring through calendar 2027, as it currently has LEO programs in development and is engaged with the major players in the space market. LEO could become more lucrative for Telecom growth as Macom sees content growth in three areas – satellites, gateways and terminals. Additionally, one of Macom’s largest customers in LEO is finalizing its system design and is expected to reach its full production run rate later in 2026 or in early 2027.  

On 5G, Macom has made expanding its market share one of its five goals for FY26, underpinned by its new GaN4 process for high-power linear amplifiers that it says offer both performance and cost benefits. Management commented that 5G growth is expected to be driven by both market share and content gains, as well as the GaN4 rollout.  

Financials 

Revenue Growth Inflecting in Q3 

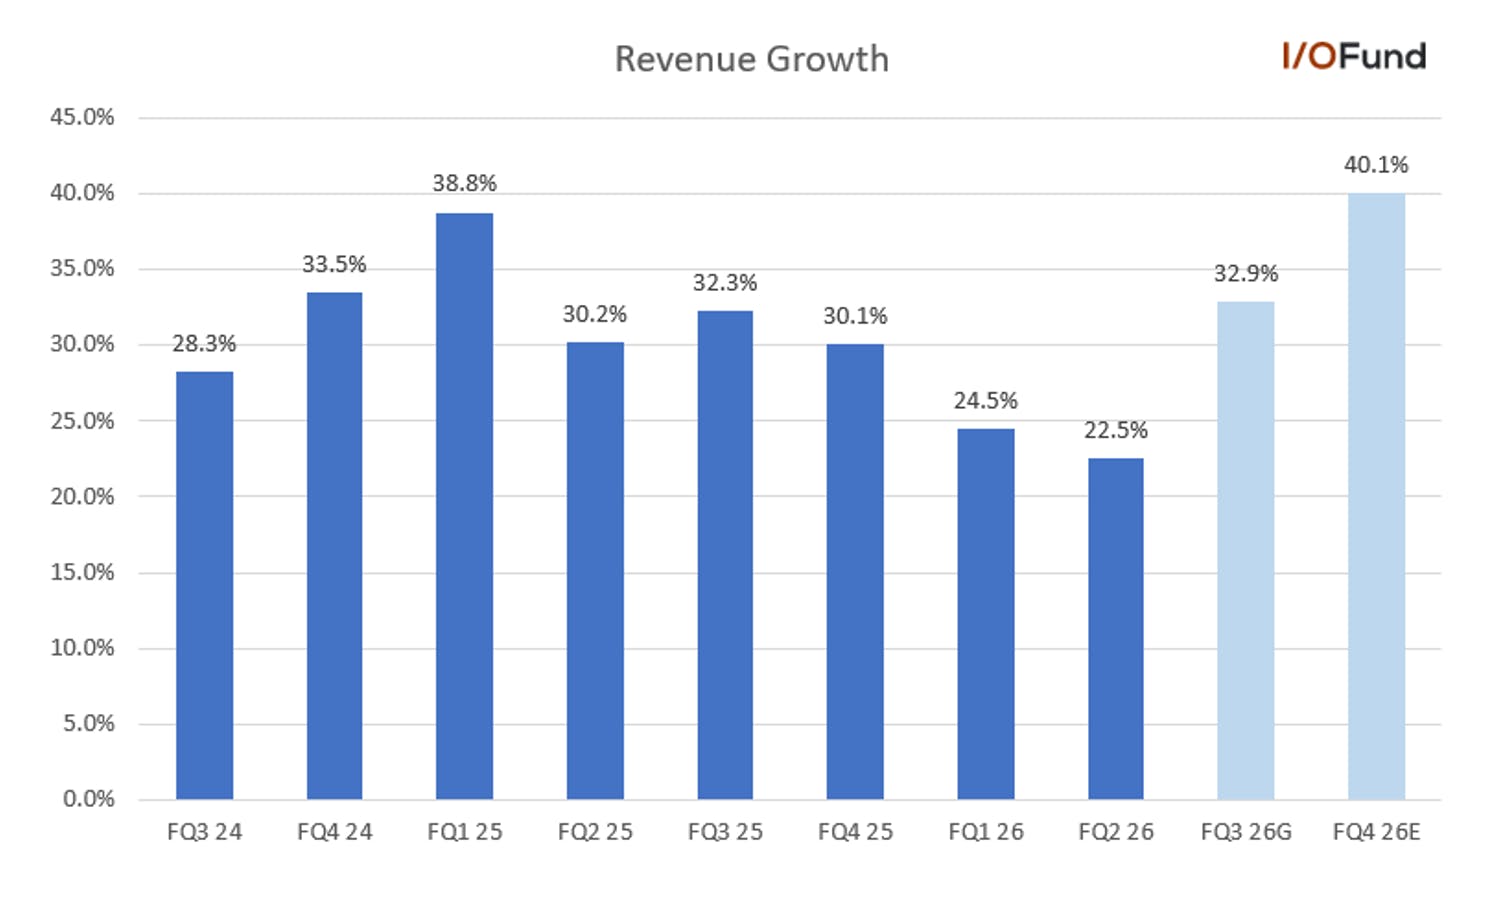
Macom reported a solid fiscal Q2, with revenue up 22.5% YoY and 6.4% QoQ to $289 million, marking a slight deceleration from 24.5% YoY in Q1. Growth came in as expected across the company’s three key segments, Data Center, Industrial & Defense, and Telecom (discussed below), with Data Center the largest contributor to growth.  

Looking ahead, management forecast a sharp inflection in FQ3, projecting revenue to be $331 to $339 million, reaccelerating more than 10 points to 32.9% YoY and up 15.9% QoQ. This double-digit QoQ growth is quite the standout figure, bucking a trend of eight consecutive quarters with single-digit QoQ growth, and also marking its highest QoQ growth rate in more than seven years.     

As a quick refresher, Macom’s record quarterly bookings and strong book-to-bill of 1.5:1, up from 1.3:1 last quarter, both suggest strong growth will continue into FY27.

Macom did not provide full-year guidance, but consensus estimates point to FQ4 revenue of $365.9 million, accelerating to 40.1% YoY and nearly maintaining double-digit QoQ growth at 9.2%. At the guide and FQ3 estimate, FY26 revenue would project out to $1.26 billion, up 30.4% YoY, slightly decelerating from 32.6% in FY25. 

Key Segments: Data Center to Grow 35% QoQ, 2.5X of Q2’s Growth 

Macom’s Data Center segment was the primary contributor to both YoY and QoQ growth in fiscal Q2, and is expected to see a step-function increase in FQ3, and potentially become the company’s largest segment. This is quite a rapid transformation considering Data Center was the smallest contributor to revenue as soon as FQ3 2024.  

Data Center revenue was a record $98.2 million, up 14.5% QoQ and 36% YoY, accelerating from 8% QoQ and 31.4% YoY in Q1. Growth is primarily being driven by pluggable optic module and optical cable volumes using Macom’s 800G and 1.6T PAM products, with modest contribution from 100G single-mode and multi-mode optics.  

Looking ahead, Macom projected a step-function increase in FQ3, projecting 35% QoQ growth in the segment, which would roughly project revenues to be $132.5 million. This is 2.5X of Q2’s 14.5% QoQ increase, one of the largest QoQ accelerations we have seen so far in the AI industry. On a YoY basis, this also represents a sharp, almost 40-point acceleration to nearly 75% YoY.  

As noted above, Q3’s guide is likely the cornerstone for management raising FY26 Data Center growth guidance to 60%, up from 35-40% YoY guided in FQ1. 

Industrial & Defense remains Macom’s largest segment, with revenue of $120.7 million in Q2, up 22.5% YoY and just 2.5% QoQ, roughly maintaining the same growth rates as Q1. Management pointed out that improved utilization at its Lowell fab for Defense would aid revenue growth. For FQ3, Macom guided for an acceleration for the segment, guiding for QoQ growth to approach 10%, roughly projecting around $130-$131 million in revenue.  

Telecom revenue was soft with revenue of $70.1 million, up 7.5% YoY and 3% QoQ. Management explained that they expect to see strong momentum from Telecom approaching FY27 and into calendar 2027 from ramping low-Earth orbit (LEO) space programs. Telecom was guided to be up low-single digits QoQ in FQ3, implying roughly $72 million in revenue at 3% QoQ. 

Margins Seeing Slight Expansion 

Margins saw a slight 1-2 point sequential expansion in FQ2, with management projecting similar expansion in FQ3 as Data Center becomes a larger contributor. Gross margins were also guided to expand sequentially in FQ4. 

GAAP gross margin was 56.9%, up 1.7 points YoY and 1 point QoQ, while adjusted gross margin was 58.5%, up roughly 1 point YoY and QoQ. The margin expansion was primarily chalked up to increased fab utilization and output as well as increasing Data Center mix.  

GAAP operating margin was 17.6%, up 2.8 points YoY and 1.7 points QoQ. Adjusted operating margin was 27.8%, up 2.4 points YoY and less than a point QoQ, with both pointing to a slight degree of operating leverage. 

GAAP net margin was 16%, up 2.6 points YoY but down 2 points QoQ. Adjusted net margin was 29.2%, up 2 points YoY and less than a point QoQ. 

Looking to FQ3, Macom guided for adjusted gross margin to be 59-60%, up 1.9 points YoY and 1 point QoQ at midpoint. Management also set a tentative goal of exiting the fiscal year at (or above) a 60% margin, though noted that there was still work to be done to reach that level.  

Adjusted operating margin was guided to be 30% in FQ3, up 4.8 points YoY and 2.2 points QoQ, again reflective of a slight degree of operating leverage emerging in the quarter.  

EPS Growth to Reaccelerate 

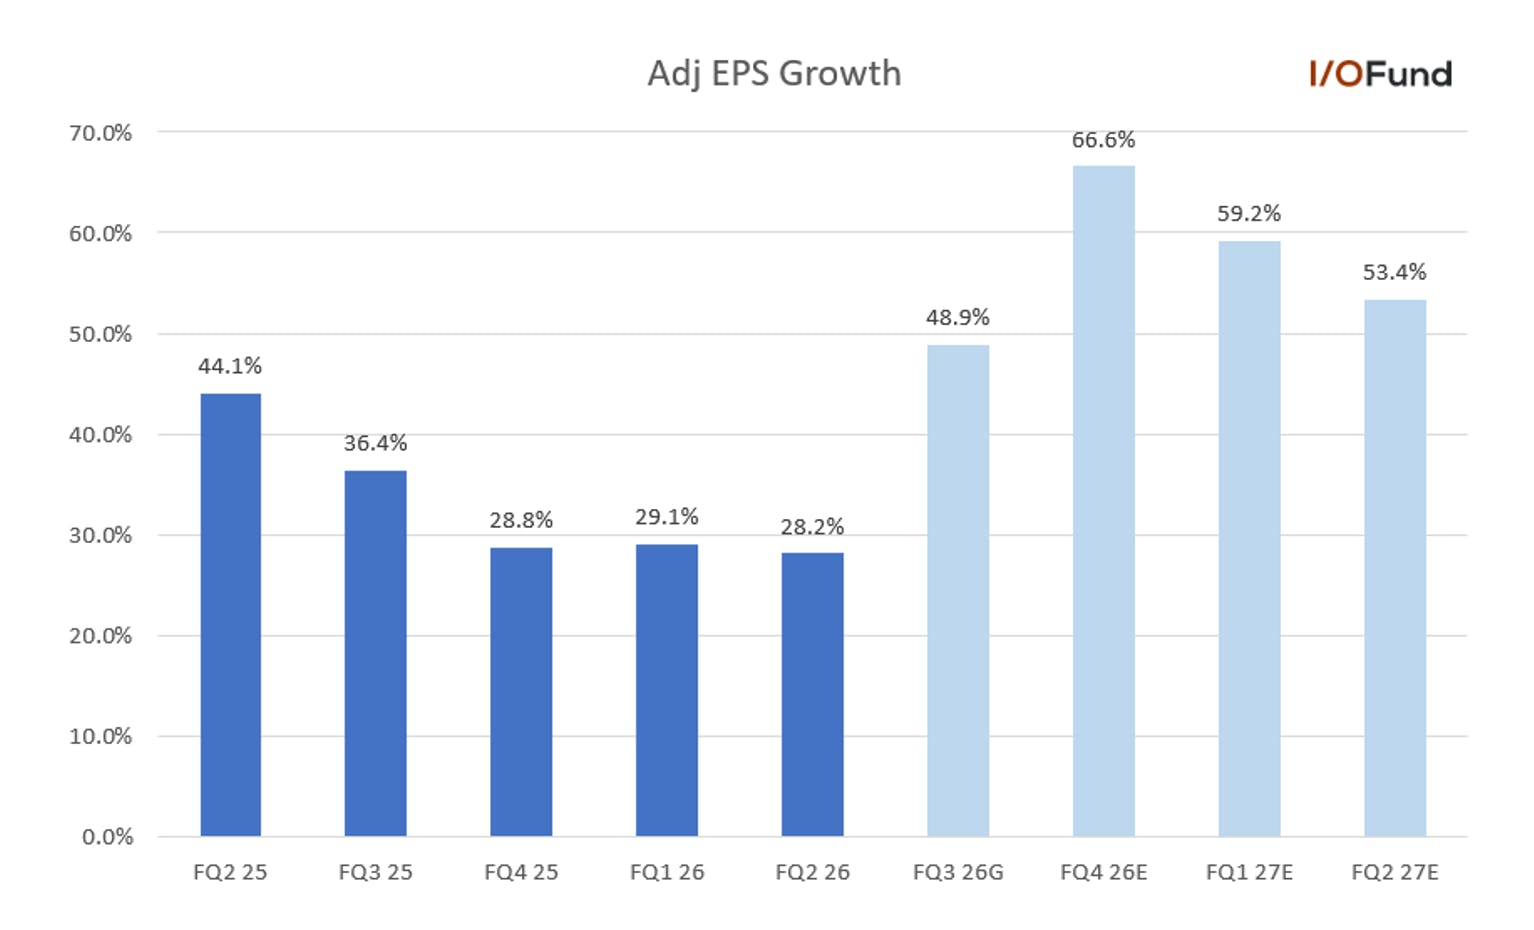
Macom’s adjusted EPS growth is projected to inflect in FQ3 alongside revenues and the step-up in margins, with growth estimated to accelerate nearly 40 points between FQ2 and FQ4. 

Macom reported $1.09 in adjusted EPS in the quarter, up 28.2% YoY and slightly ahead of estimates for $1.07. GAAP EPS was $0.60, missing estimates for $0.71.  

For FQ3, Macom guided for adjusted EPS between $1.31 to $1.37, up 48.9% YoY at midpoint, a 20 point acceleration. This acceleration is expected to continue into FQ4 and the first half of FY27, with consensus pointing to 66.6% growth in FQ4 to $1.57 before moderating to the 50% range in the first half of FY27. 

On an annual view, FY26 adjusted EPS is projected to be $5.03, up 44.8% YoY, with FY27 estimated to be $6.84, up 36.2% YoY.  

Cash Flows and Balance Sheet 

Cash flows were solid in FQ2, and capex was guided to be around 4-5% of revenue for this year and over the medium-term, offering solid leverage within FCF.  

FQ2 operating cash flow was $78.7 million for a 27.2% margin, up from a 16.4% margin a year ago and 15.8% in FQ1. Management guided for FQ3 operating cash flow to exceed $80 million, representing a 23.9% margin at the midpoint of guide, down more than 3 points sequentially and flat YoY. FY26 operating cash flow was guided to exceed $300 million, implying ~$98.4 million for FQ4.  

Free cash flow was $65.5 million in the quarter for a 22.7% margin, up from 12.9% a year ago and 11% in FQ1. Considering the capex range, FQ3 free cash flow is likely to be in the mid to high-$60 million range once more, or around a 19-20% margin, down nearly 3 points QoQ and nearly 1 point YoY. Additionally, given the FY26 capex guide of $55-65 million and OCF guide, FY26 FCF is projected to be roughly $240 million for a 19% margin, with Q4 around $80 million.  

Cash and equivalents totaled $664.9 million, while debt was $340.2 million. 

Inventories were $252.2 million, up roughly 5.6% QoQ. 

Conclusion 

Macom is benefitting from a diverse optical portfolio spanning drivers, photodetectors, lasers and TIAs, as well as its early positioning in 1.6T. Revenue growth in its Data Center segment was guided to accelerate to 35% QoQ, among the highest across the AI stocks we track closely, representing a 2.5X increase in growth rate from Q2’s 14.5% QoQ. For FY26, Data Center growth was raised by >20 points to 60% YoY from 35-40% previously, building on Q3’s strength. 

Macom’s record quarterly bookings and book-to-bill expanding from 1.3:1 to 1.5:1 further support this projected growth next quarter and momentum persisting into FY27 as 1.6T ramps more broadly. Capital-light expansion, such as boosting capacity in North Carolina by 30% with capex barely at 1% of revenue, underpins a longer term revenue target of $2 billion, roughly 60% higher than FY26’s estimate, and securing epitaxial supply via IQE adds a layer of confidence to the longer-term growth story.

Please note: The I/O Fund conducts research and draws conclusions for the Fund’s positions. We then share that information with our readers. This is not a guarantee of a stock’s performance. Please consult your personal financial advisor before buying any stock in the companies mentioned in this analysis.

Damien Robbins, Equity Analyst at I/O Fund contributed to this analysis.

Recommended Reading:

Why the S&P 500 Shrugged Off the Iran War — and What Could Finally Break the Rally 

On February 28th, the U.S. went to war with Iran, and the market was handed the kind of shock it hasn't contended with for years. The conflict set off a chain reaction across the region: an ongoing supply disruption in essential commodities, a 30-year Treasury yield pushed to 5.2%, and a CPI print of 4.2%, more than double the Fed's target. By most measures, this was the most uncertain backdrop since COVID. 

And yet the S&P 500 fell just 9.7% in an orderly, almost polite decline, then staged the second-most aggressive snapback in its history. The recovery that followed trailed only the 1980 bear market. Most investors were left asking the same question: how could so many market-moving headlines move the market so little? 

The answer is one we have written about for years. Decades of studies have reached the same conclusion: news, on its own, has almost no lasting effect on markets. One of the most famous is “What Moves Stock Prices?” by Harvard and MIT economists Cutler, Poterba, and Summers. Their goal was to model how news and macroeconomic events might predict stock market movements. To their surprise, they found that only about one-third of major price swings could be linked to identifiable news events.   

News only matters insofar that it can affect underlying market forces that correlate with market movements. In the case of the Iran War, that underling force is global liquidity dynamics, and sentiment. Neither has broken down in any meaningful way. As far as equities were concerned, the Iran War was a liquidity and sentiment event, and on both counts the trend held. 

This is the heart of what we do at the I/O Fund: filter out the noise and focus on the few forces that drive price. In this report, we break down the global liquidity dynamics that explain why equities shrugged off the headlines, and why this was the only metric that mattered over the past few months.  

From there, we examine the deteriorating breadth beneath the surface, conditions that often precede a turn in the trend. Finally, we look at the historic institutional positioning building at the highs, which tends to mark a meaningful floor or ceiling depending on how price resolves. 

For now, we are leaning defensive — not because the trend has broken, but because the risk-reward has become less forgiving, considering the weight of evidence. We remain ready to pivot, and add exposure if the market invalidates that view with a decisive move higher, all of which is discussed in detail in this report.  

The Real Story Behind the S&P 500 Pullback: A Historic Supply Shock 

When the Iran War kicked off on February 28th, the broad market accelerated its correction, finally bottoming at -9.7% into the March 30th low. By market norms, that was a minor dip, and it bore little resemblance to the severity of the geopolitical events still in play. 

The war closed the Strait of Hormuz, locking up roughly 20% of the world's oil supply for nearly four months. Crude ran from $66 a barrel to $119, then settled into an $80 to $117 range that has held until this week. Roughly one-third of the world's fertilizer and about 20% of its natural gas were choked off as well, producing the largest commodity shock since the 1970s. 

That supply shock filtered into prices. Year-over-year CPI moved from 2.4% before the war to 4.2% as of May 30th, and the yield on the 30-year Treasury climbed to 5.2%, a level we have not seen since 2007. That climb may not sound dramatic but consider the backdrop – the U.S. debt-to-GDP ratio in 2007 was roughly 63%, versus about 125% today. The more we must pay just to cover the interest on our debts, the more we have to borrow to do it, and that new borrowing adds even more interest on top, so the cost keeps feeding on itself; a self-reinforcing loop where debt grows faster than we can keep up, and ultimately ends in a debt spiral and/or yield curve control enforced by the FED. 

mid

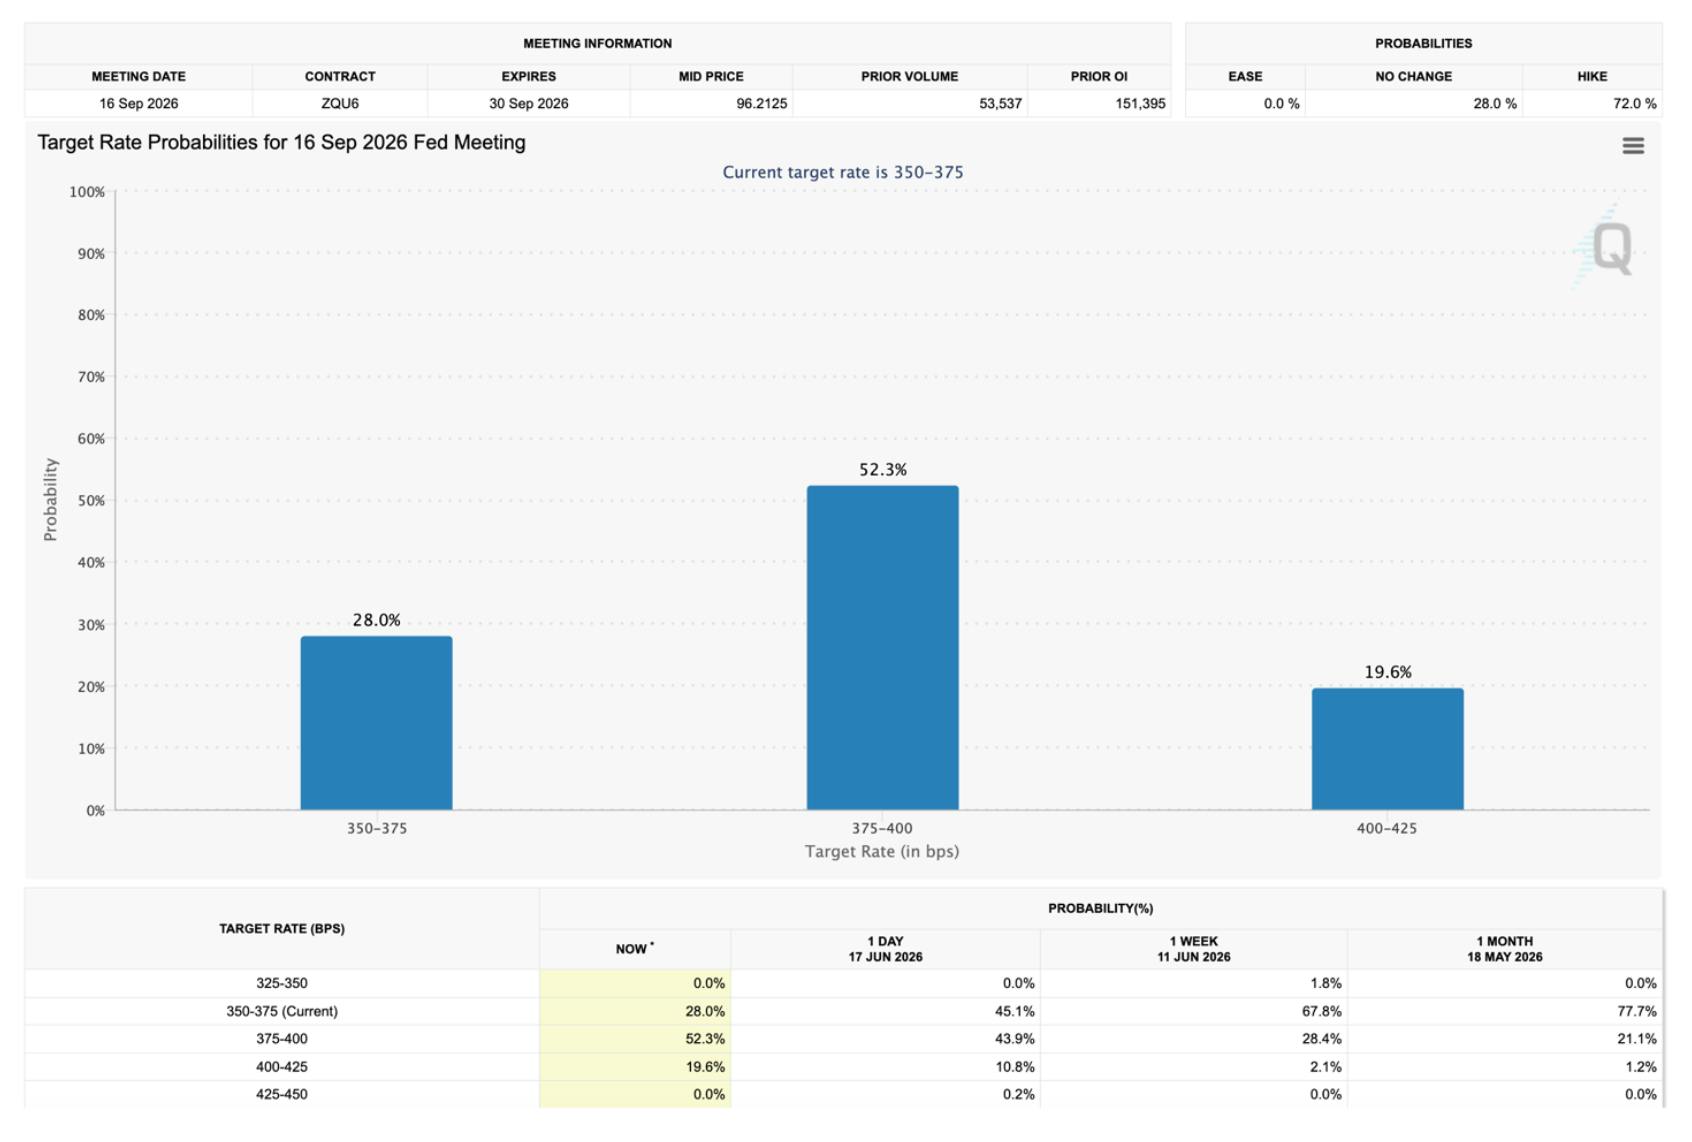
If we dig deeper into the inflation data, stripping out energy does not make the problem go away. Core CPI rose 2.8%, its third consecutive month of acceleration. That tells us the inflation pressure is not simply a function of soaring energy prices; it signals an economy running hot. Unsurprisingly, the Fed's tone has turned more hawkish, with officials signaling a willingness to raise rates if inflation does not subside. As of today, the market is pricing a 70% chance of a rate hike by year-end. 

Bar chart showing Fed target rate probabilities for the September 16, 2026 FOMC meeting, with a 52.3% likelihood of rates rising to 375–400 bps, 28.0% staying at 350–375 bps, and 19.6% increasing to 400–425 bps, indicating a greater than 70% chance of a rate hike.

The chart shows a greater than 70% probability that the FOMC will raise rates by September. Source: CMR GroupCMR Group

And still, against every one of these macro risks, the S&P 500 corrected just 9.7% and now sits 9% higher than where it stood when the war began. This fact has forced news pundits to scramble to find a reason based on current events, while failing to look at the underlying force the market is taking its cues from. 

How Liquidity Drives Markets and the S&P 500 

Liquidity is one of the most overused and least understood terms in markets. At its core, it refers to the availability of capital in the system, specifically how easily businesses, consumers, and financial institutions can access cash or credit. 

In today's global economy, liquidity is inseparable from debt dynamics. It is not the creation of new debt that dominates capital flows, but the ability to roll over existing obligations. Roughly three of every four global financial transactions relate to refinancing, not expansion, and nearly 80% of global lending now requires collateral, typically high-quality, low-volatility assets like U.S. Treasuries. 
This creates a framework where liquidity, and by extension risk appetite, is dictated by how cheaply and easily borrowers can refinance without overcollateralizing. The more capital that process frees up, the more can rotate into risk-on assets like Bitcoin. 

A number of variables influence liquidity conditions: Central bank policy, Fiscal spending, The Treasury General Account (TGA), Federal Reserve repo operations, Broad equity market performance, Bond market volatility 

Collectively, these forces determine whether capital and confidence flow into the system or are pulled out. But among all of them, the most powerful and persistent driver of global liquidity is the U.S. Dollar. 

Roughly 64% of global debt is denominated in dollars, which means foreign borrowers who tapped cheap U.S. capital must keep sourcing dollars to service that debt. When the dollar weakens against their local currencies, less local currency is needed to meet those dollar obligations, freeing up capital to chase higher-yielding risk assets. 

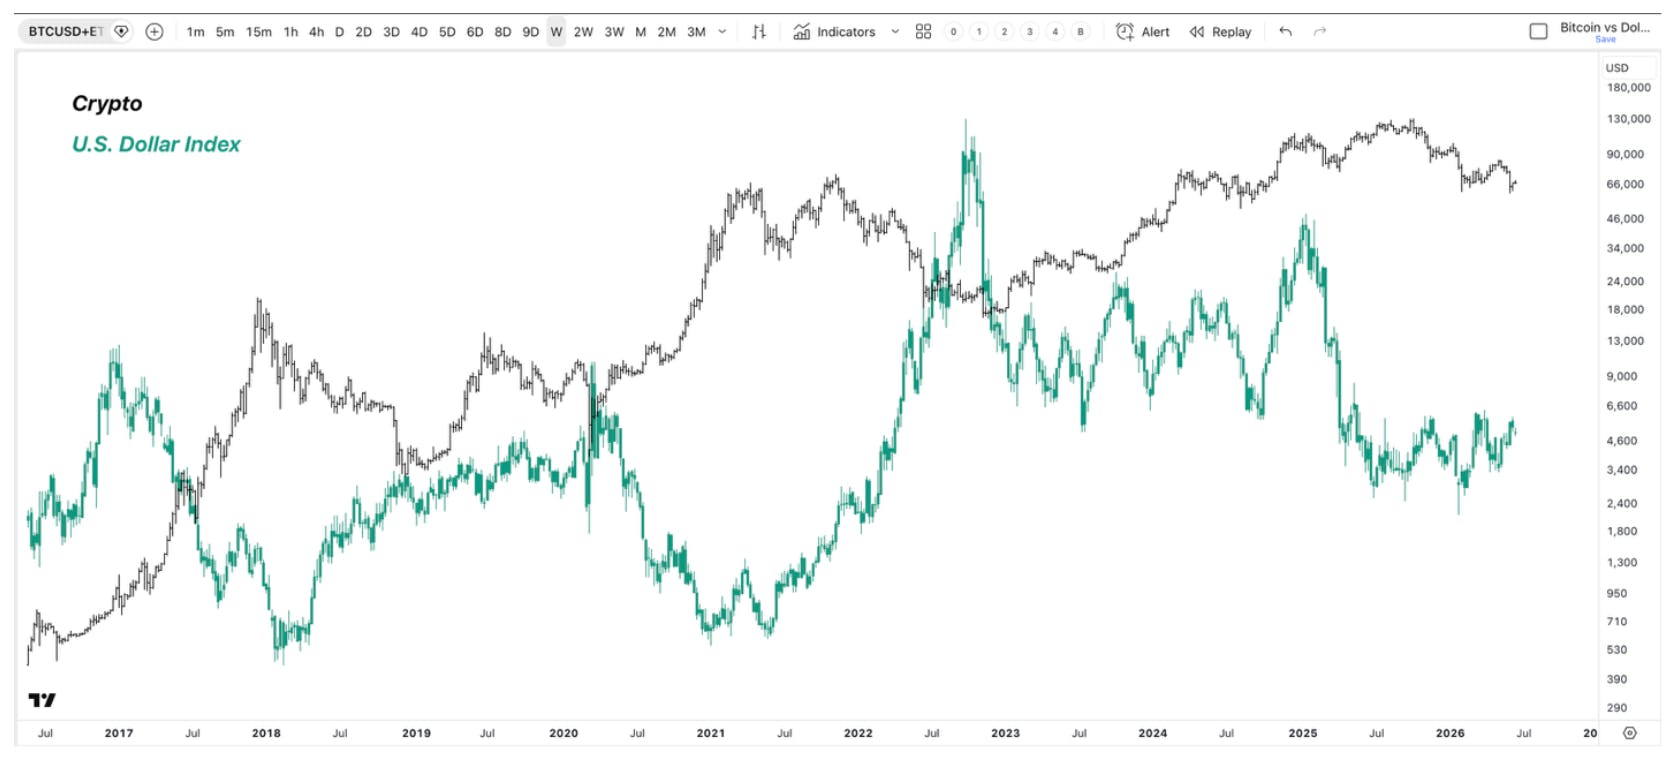
This inverse relationship between the U.S. Dollar Index (DXY) and risk assets is easy to see in the chart below. The black line is a composite of Bitcoin and Ethereum's price action. Crypto sits at the margin of risk assets, and it is usually where liquidity undulations hit first. The green line is DXY, an inverse proxy for global liquidity. As shown, major trends in risk assets and the dollar tend to move opposite one another. 

Line chart comparing Bitcoin price and the U.S. Dollar Index (DXY), showing an inverse relationship where Bitcoin rises as the dollar weakens and declines when the dollar strengthens.

This chart compares Bitcoin price (black line) with the U.S. Dollar Index (green line) over time. It shows a clear inverse relationship: when the dollar weakens, crypto prices tend to rise, and when the dollar strengthens, crypto markets decline.  

Oil Trade and the Flow of U.S. Dollars 

Global liquidity is a powerful force, and the Iran War threatened it. The danger for equities was never the war itself, or even the spike in oil prices. The danger was what those events could have triggered, which was a sharp reduction in global liquidity. 

Roughly 80% of all oil transactions globally are priced in U.S. dollars, a constant for decades that continually pushes dollars into the financial system. When the Strait of Hormuz closed, we did not just lose 20% of the world's oil. We lost the much-needed flow of dollars that those oil purchases would have circulated. 
That is why the Treasury Secretary announced that several countries in the region, including the UAE, were requesting dollar swap lines. The message here is that there were not enough dollars in the region to satisfy demand. 

This is how a currency crisis can begin. Because most regional debt is denominated in dollars, debtors must acquire dollars to service their interest payments. If they cannot access them, or if demand outstrips supply, they are forced to sell more of their local currency to source the dollars they need. That selling pressure feeds on itself. 

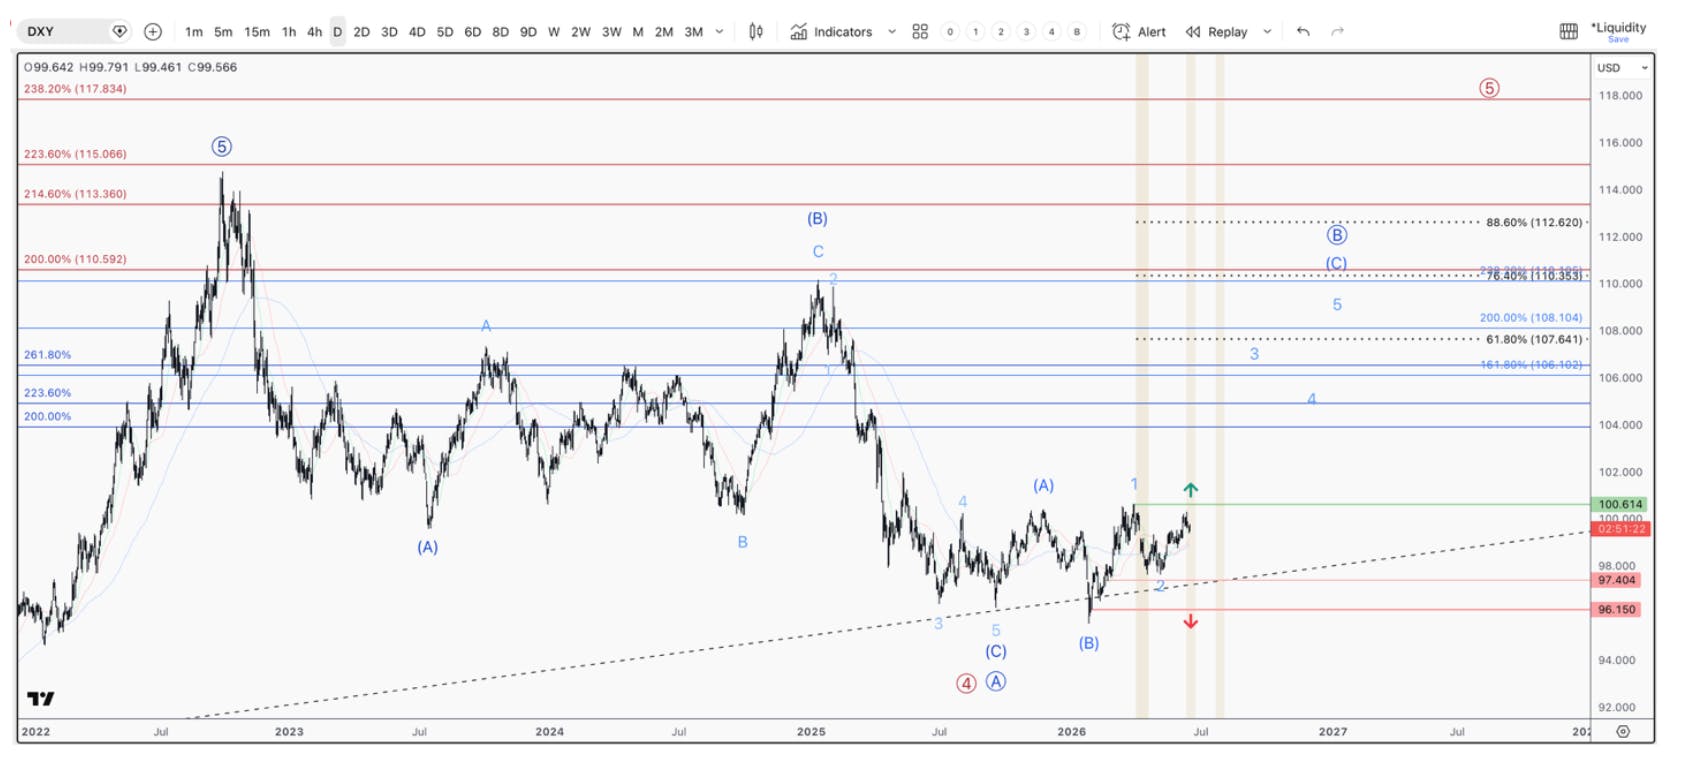
While we are seeing cracks in the global liquidity cycle, so far, an extreme imbalance has not materialized, and DXY confirms it. Since the war began, the DXY is up only 1.8%, nowhere near enough to trigger a liquidity crisis. But the setup is worth watching closely. DXY has just made its first higher high and higher low since January 2025, and the large corrective pattern that began in 2022 appears complete, which suggests a sizable bounce is the next likely move. A break above the key level would trigger a vertical push higher and sap global liquidity in a dangerous way. 

Technical chart of the U.S. Dollar Index (DXY) showing price action, key support and resistance levels, and a potential breakout structure indicating rising dollar strength and liquidity tightening risk.

This chart shows the U.S. Dollar Index (DXY) with key technical levels, Fibonacci retracements, and wave structure. Price is forming a potential breakout pattern after establishing higher highs and higher lows. 

Crude Oil Setup: A Key Signal for Market Risk 

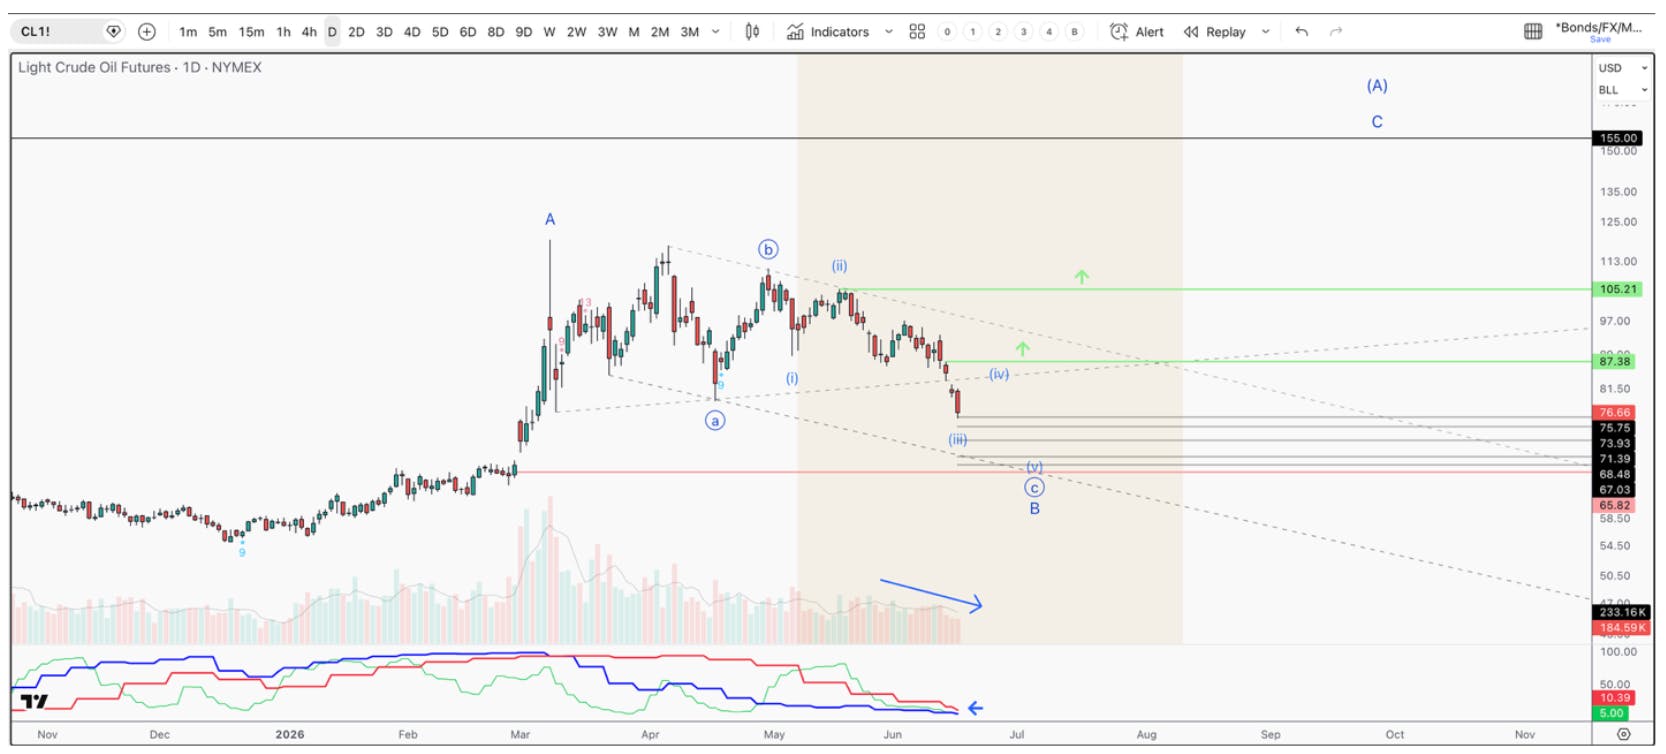
Interestingly, the same setup is in play in crude oil. The move up off the December 2025 low is a clean three-wave advance, and what has followed is another three-wave move lower that appears to be in its final swings. 

Note how volume fades the lower we go, with momentum sitting at one of the most extreme oversold readings in crude's history. Sellers are exhausting themselves, and momentum does not stay this depressed for long. If the bounce holds under $87, the pattern points to one more drop toward $67 to $70 to complete it. If instead we push above $87, it signals a new uptrend is likely underway, which would not be good for risk assets. 

Technical chart of crude oil futures showing a downward trend with wave structure, declining momentum, and key support levels between $67 and $70, indicating potential downside before a reversal.

This chart shows crude oil futures (CL1!) with a clear downtrend and corrective wave structure. Price is approaching key support levels around $67–$70, with weakening momentum and declining volume suggesting potential seller exhaustion. A break below support could extend the decline, while a rebound would signal a possible trend reversal and renewed upside risk for inflation and equities. 

The market is pricing in a transitory move for global oil. In other words, now that the Straight if Hormuz is open, we will get right back to peak production. This is an impossibility based on the nature of active oil rigs turning off temporarily, or what is known as shut in. To bring these rigs back on-line can take anywhere from 2 weeks – to a year, depending on how complex the equipment is. Furthermore, more than 80 energy assets, totaling ~$56 billion in damages. These repairs, as noted, could take up to 2 years.  

What’s keeping oil prices suppressed is the 1.1 – 1.3 million barrels being pushed onto the global economy from the US Strategic Petroleum Reserve (SPR). Considering the 300-million-barrel hard floor that must be maintained in the SPR, or else it risks failure, that estimates an inability to suppress oil prices past mid-July, at best.  

If this smooth and complex transition is unable to happen, the setup in the chart will likely trigger higher, sapping the global dollar demand further and greatly affecting global liquidity.  

Record Market Divergences Beneath the Surface 

These setups sit within two macro factors that feed directly into global liquidity. But liquidity is not the only warning light flashing. We are also witnessing some of the most extreme divergences on record. 

When markets move in unison, it usually marks a strong trend that lasts for many months. But markets rarely top and bottom all at once. There is almost always one market running ahead of the one everyone is watching, and that leader can offer early clues about the next major move. 

Right now, three key sectors with a history of leading the broad market are refusing to confirm the move higher. 

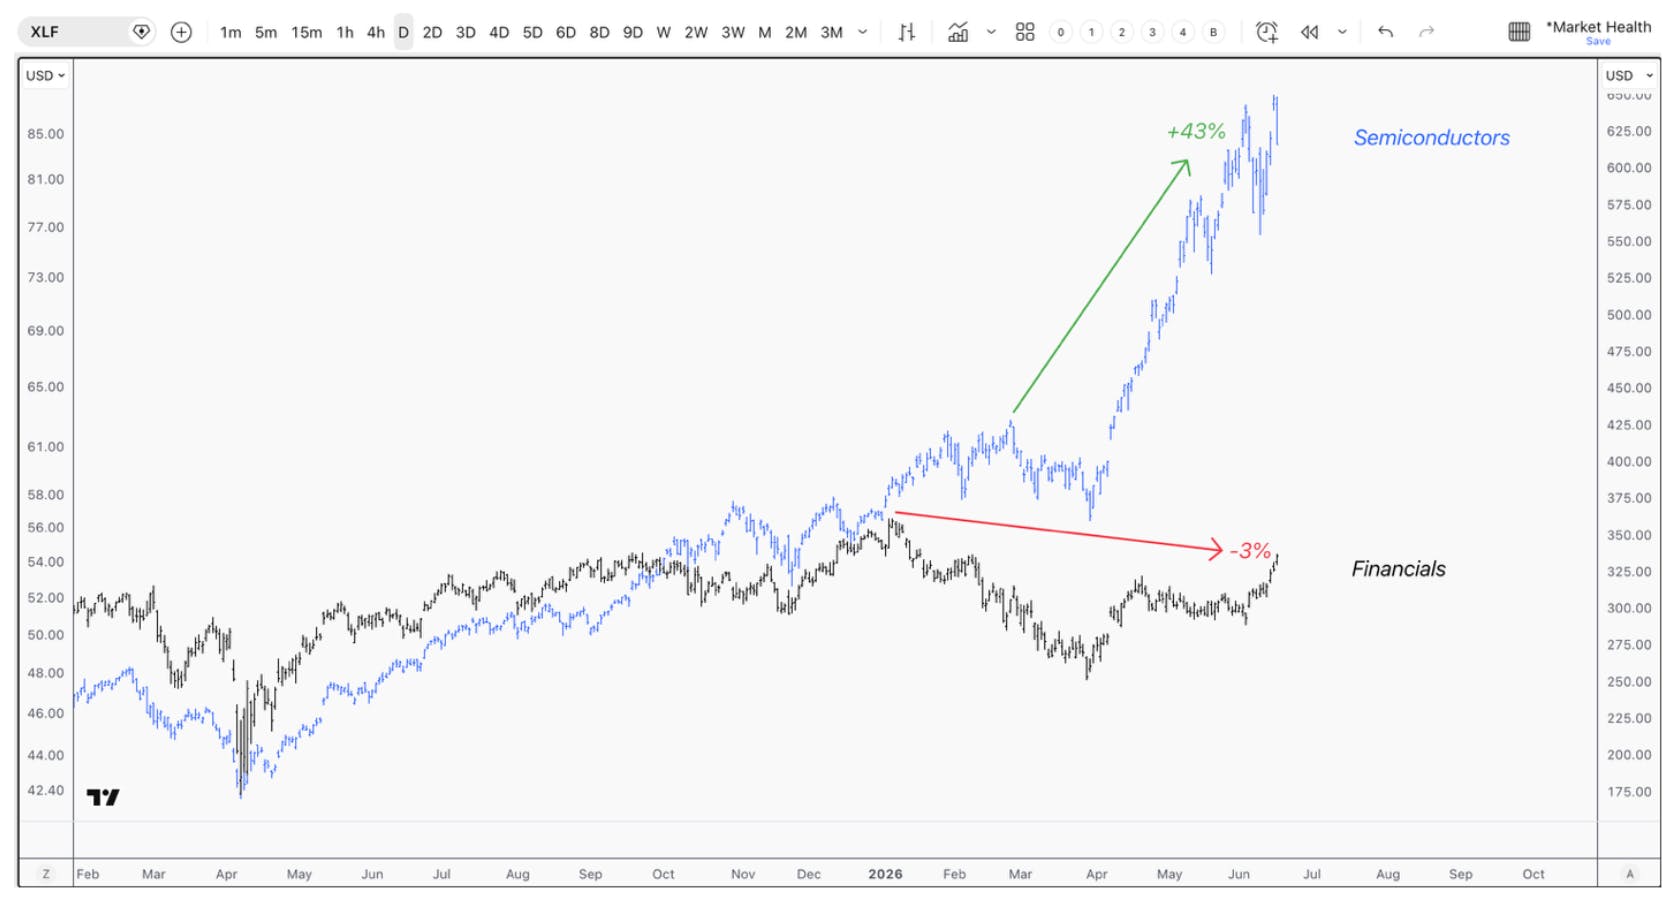
The most striking is the gap between Semiconductors and Financials. Financials topped in January and sit roughly 3% below their 2026 high, even as Semiconductors trade 43% above their prior 2026 high. That is the widest divergence between these two sectors on record. 

Chart comparing semiconductor stocks and financials, showing semiconductors up 43% while financials are down 3%, highlighting a significant divergence in S&P 500 sector performance.

This chart compares semiconductor stocks (blue) and financials (black), showing a sharp divergence in performance. Semiconductors have risen approximately 43%, while financials have declined about 3%, marking one of the widest gaps between these sectors on record. 

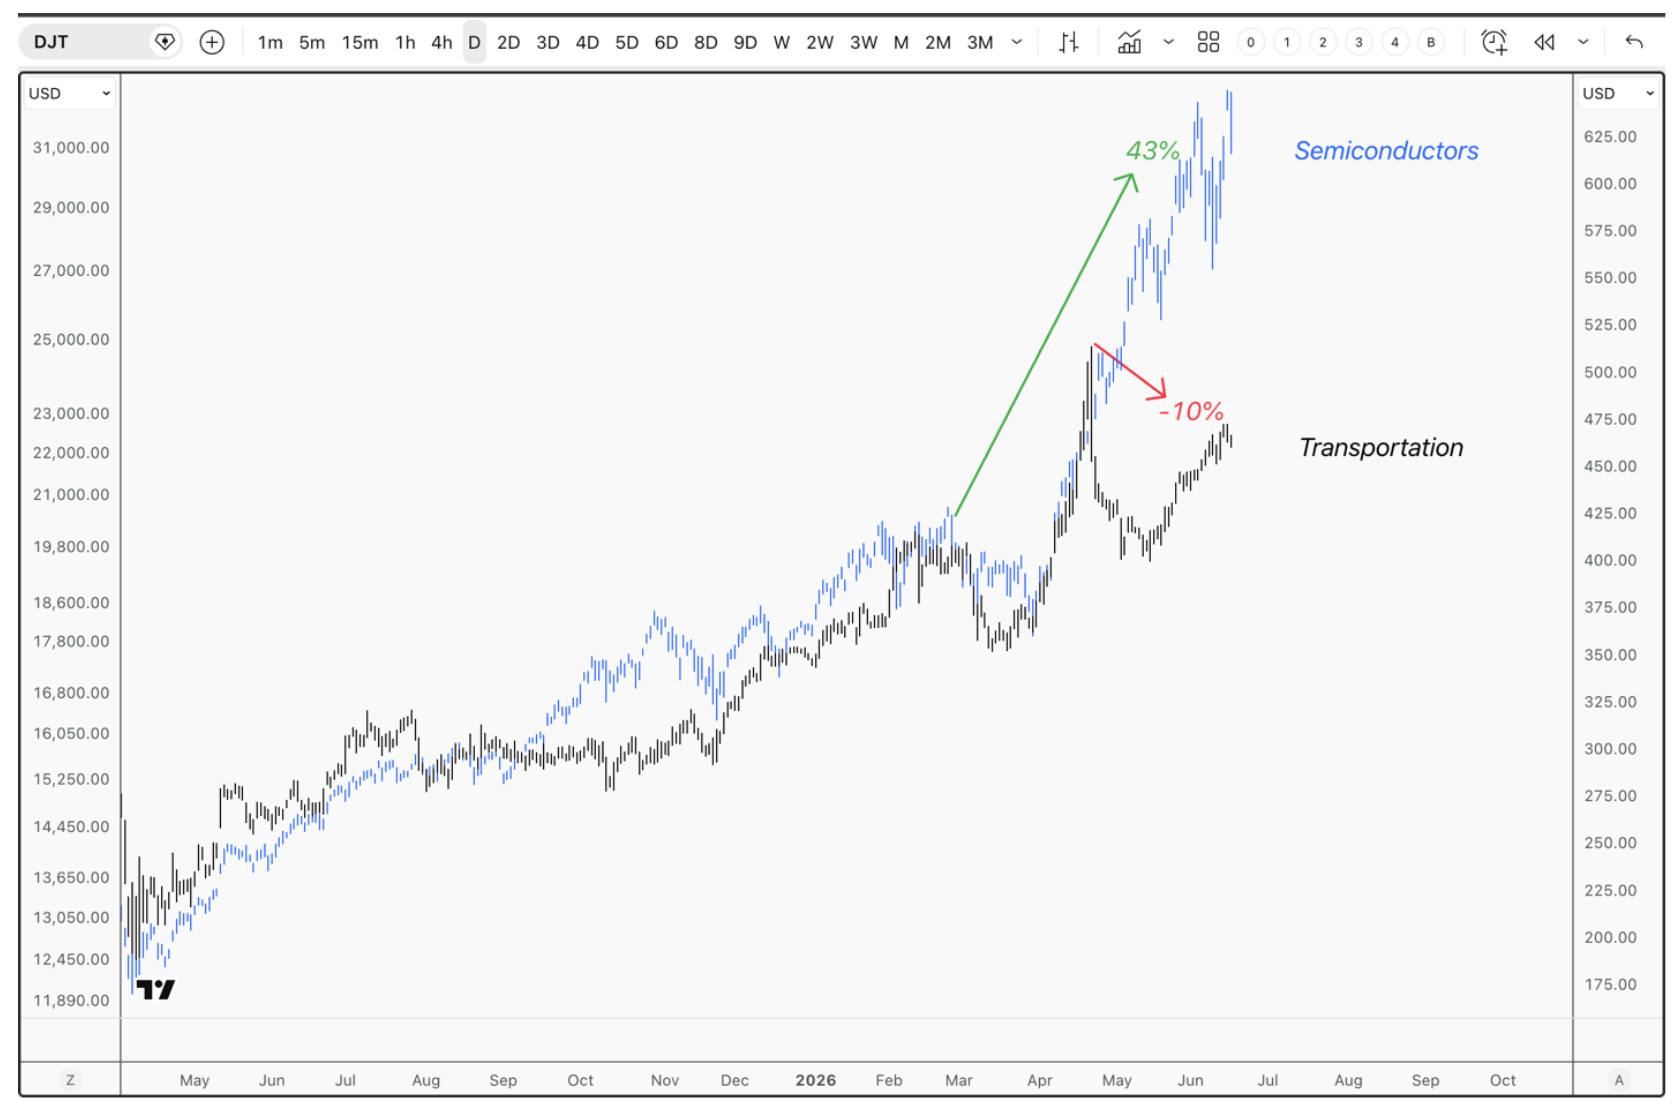
The economically sensitive Transportation sector is also flashing the same warning. It’s down about 10% while semiconductors are up 43%.  

Chart comparing semiconductor stocks and transportation stocks, showing semiconductors up about 43% while transportation stocks are down roughly 10%, highlighting a major sector divergence.

This chart compares semiconductors (blue) and transportation stocks (black), showing a sharp divergence in performance. Semiconductors have gained about 43%, while transportation has declined roughly 10%, one of the largest gaps on record. 

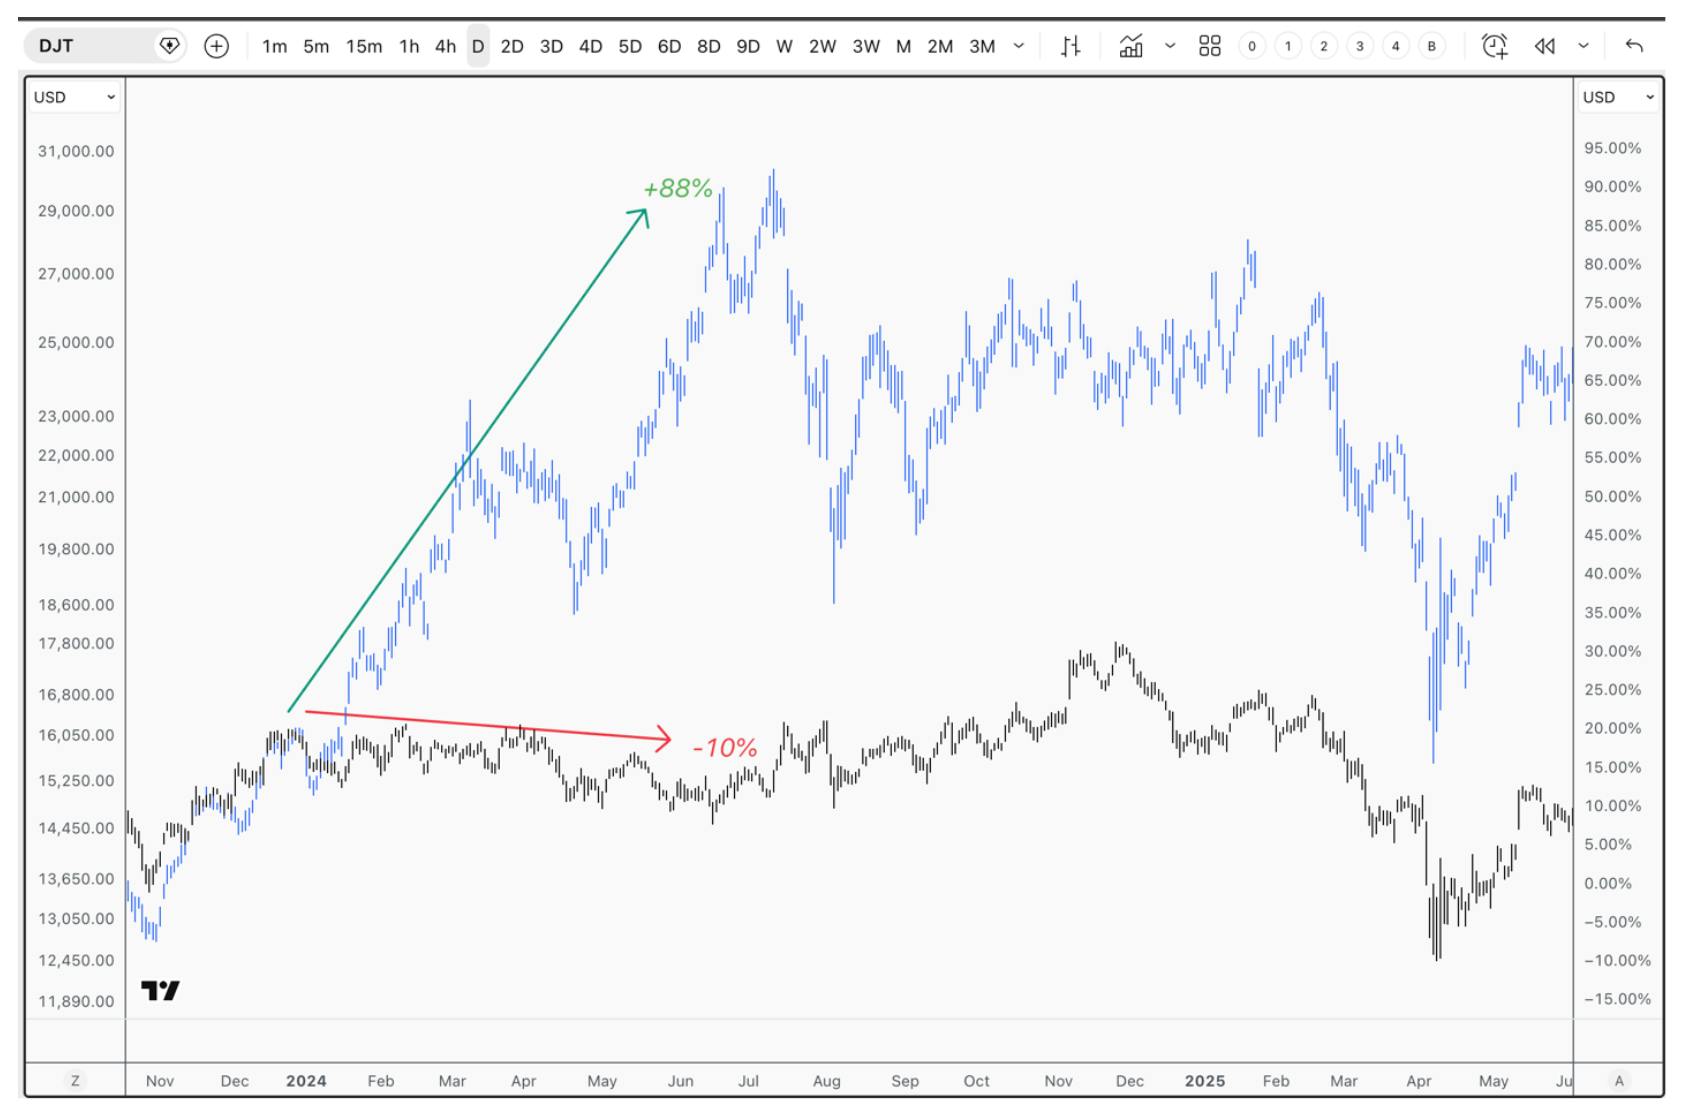
The only other time these two sectors diverged this sharply was July 2024, when transports were down 10% and semiconductors had ripped 88% higher. That divergence marked a one-year top in semis and gave way to a 48% drawdown into the April 2025 low. 

Chart comparing semiconductor stocks and transportation index, showing semiconductors up approximately 88% while transportation declines around 10%, highlighting a major divergence in market leadership.

This chart compares semiconductors (blue) with the Dow Jones Transportation Index (black), showing a dramatic divergence. Semiconductors have surged roughly +88%, while transportation stocks have fallen about 10%. 

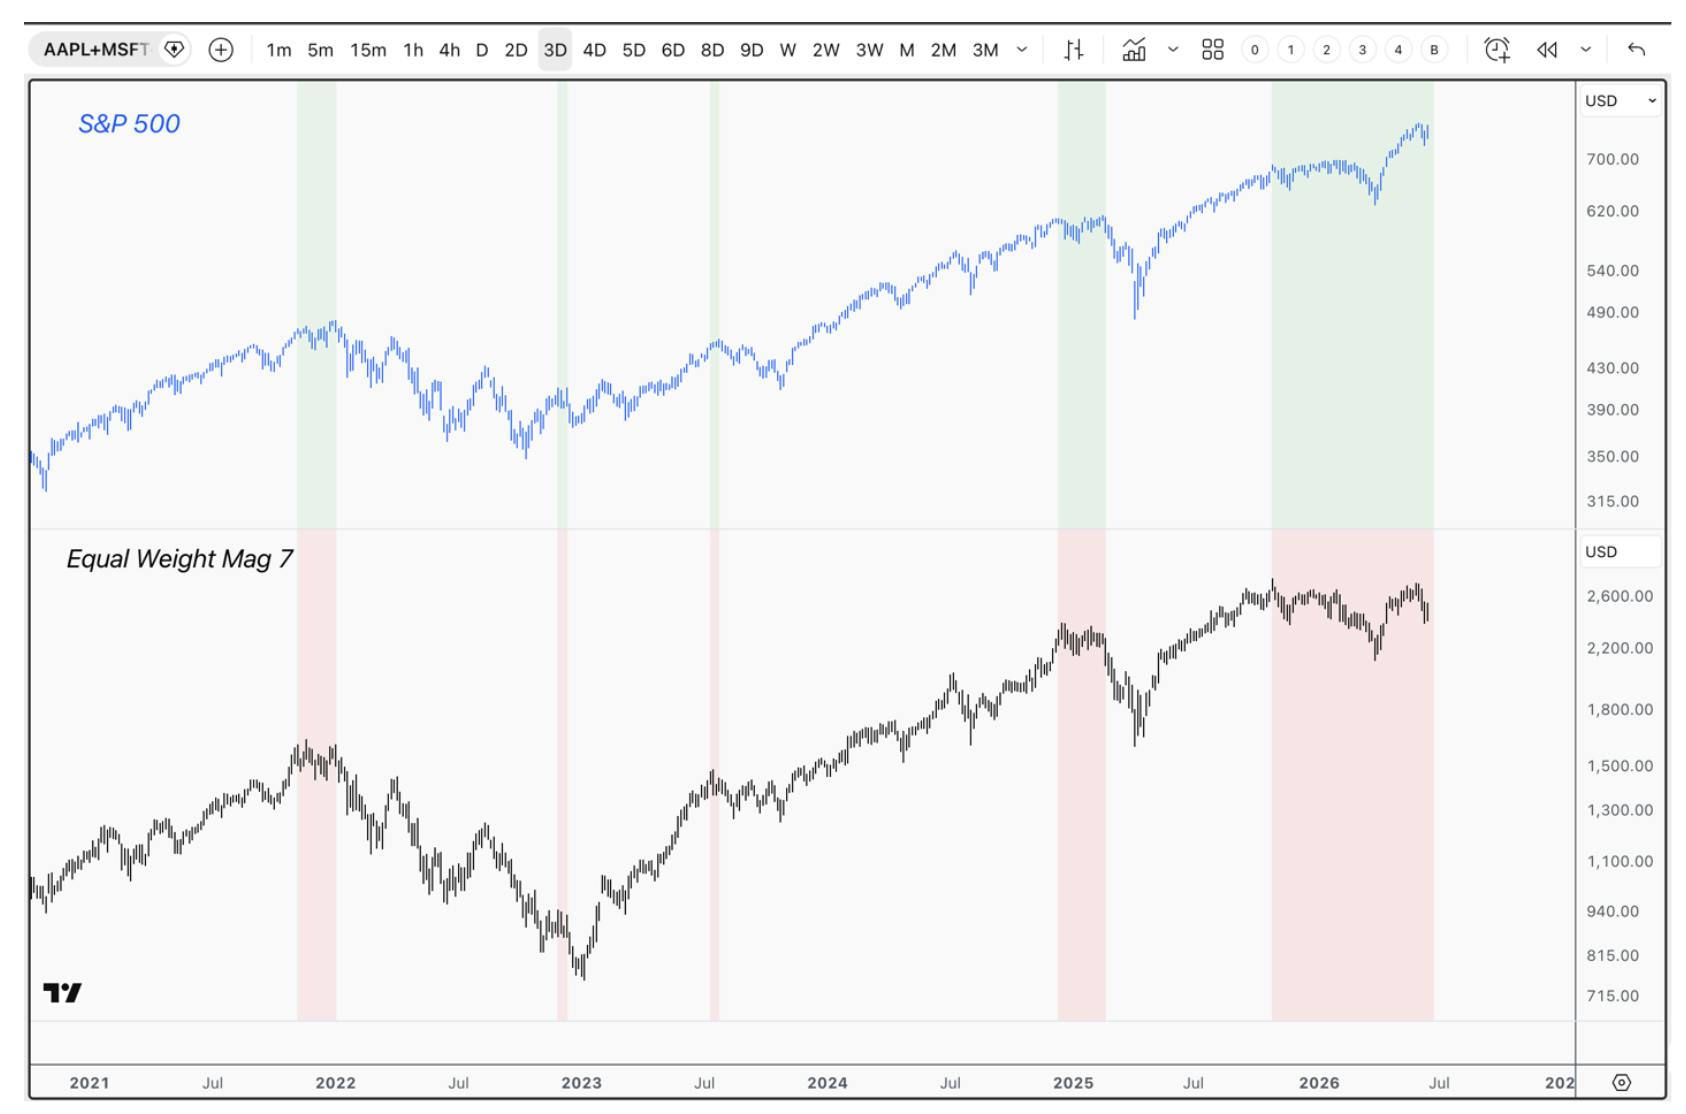
The most concerning signal, though, comes from the equal-weighted Mag 7 index. It rarely triggers, but when it does, it has a perfect record of flagging trend reversals going back to 2021. Today, the equal-weighted Mag 7 topped in October 2025 while the S&P 500 has continued higher, the widest divergence ever recorded between the two. 

Chart comparing the S&P 500 index and the equal-weighted Mag 7 stocks, showing the S&P 500 trending higher while the equal-weight index lags, highlighting a divergence in market leadership.

This chart compares the S&P 500 (top panel) with the equal-weight Mag 7 index (bottom panel). While the S&P 500 continues to trend higher, the equal-weight index has lagged and peaked earlier, signaling a growing divergence. 

Furthermore, of the 11 major sectors that make up the U.S. economy, only three sit above their February 2026 highs: technology, industrials, and real estate. What is masking the broader weakness is semiconductors.  As of this week, 33 semiconductor companies in the S&P 500 account for ~18% of the index's total weight, more than double the sector's exposure at the dot-com peak. 

While divergences and extreme concentration are a warning that precedes almost every volatility event, as long as they persist, these dislocations can go on for much longer than most investors realize.  

An important clue to the size of the next move can be seen by excessive institutional positioning that has been happening over the last few weeks.  For reference, institutions tend to create highs and lows through offloading supply or creating demand with their size.  

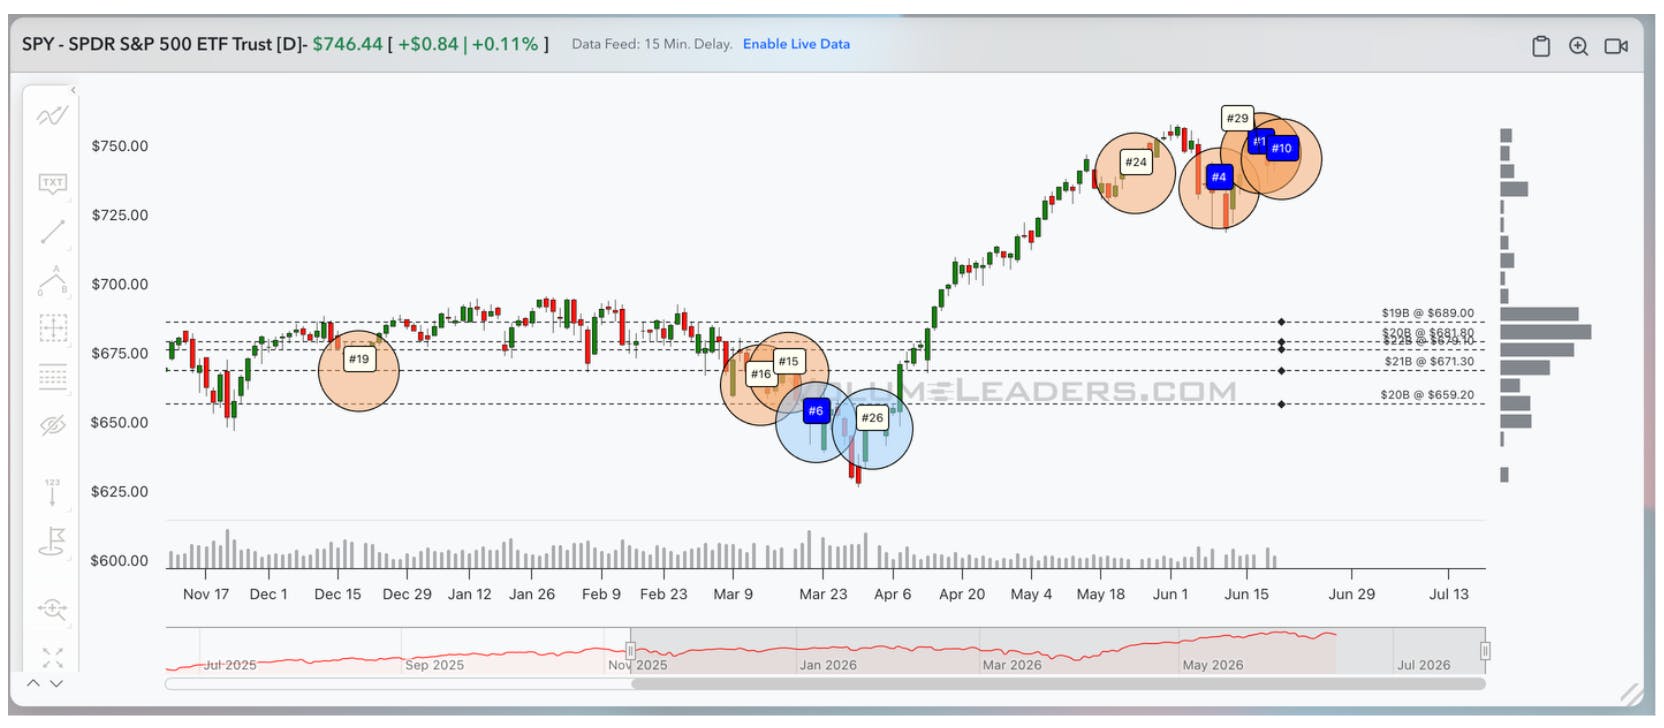
The below chart comes from VolumeLeaders, and tracks large institutional block trades in SPY. Over the last 2 weeks, we’ve seen the 1st 4th and 10th largest trades in SPY’s long history. So, in three trades, $13 Billion dollars was either sold or bought. As you can see, these large block trades tend to happen around meaningful turning points in market trends. 

Annotated SPY (SPDR S&P 500 ETF) price chart highlighting large institutional block trades clustered near recent highs around $740–$750, with additional volume profile data and historical price movement indicating strong institutional positioning at current levels.

This chart shows SPY (S&P 500 ETF) with highlighted large institutional block trades around recent highs. Several of the largest transactions on record appear clustered near current price levels, suggesting heavy positioning by institutional investors. 

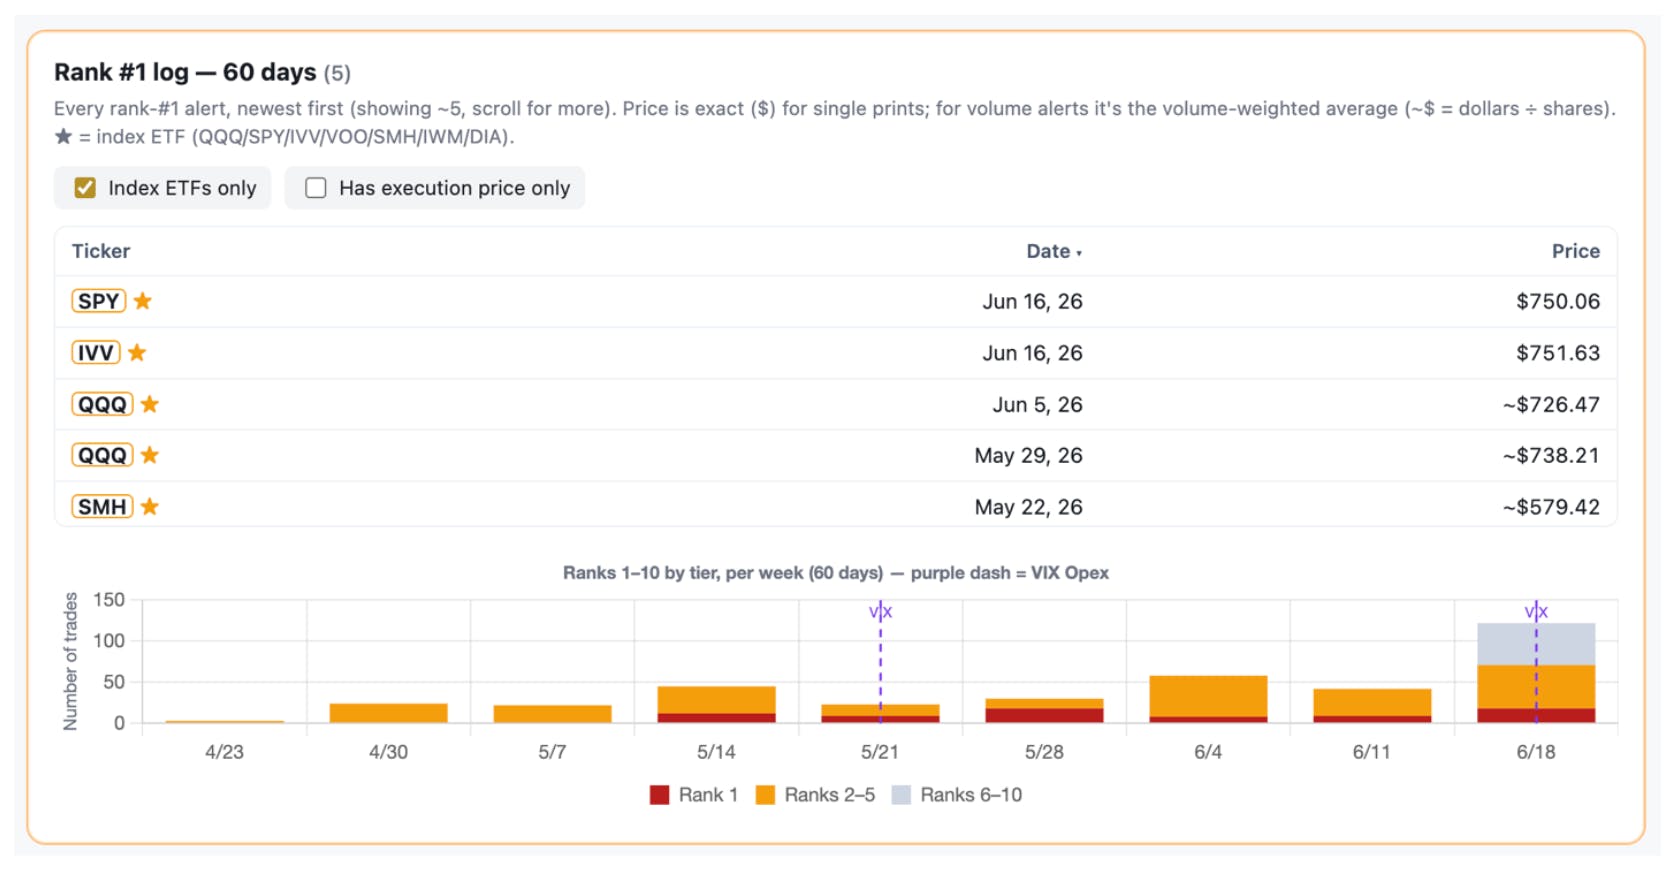
But it’s not just SPY. If we go back 60 days, all major broad market broad market ETFs are seeing a growing number of historic institutional trades, signaling that they are positioning for a large move.  

Dashboard showing recent large block trades in SPY, QQQ, and IVV, alongside a bar chart tracking the number of high-ranking institutional trades over the past 60 days.

This image shows is derived from VolumeLeader data. The top 10 largest trades in SPY, IVV, QQQ, SMH, VOO history.  VolumeLeader data. The top 10 largest trades in SPY, IVV, QQQ, SMH, VOO history.  

Because of the size and frequency of these trades, they are either creating a meaningful ceiling or floor for equities. Whatever direction the market breaks from the consolidation range they are creating, will determine the next swing, which will likely be quite notable due to the level of activity in this region. 

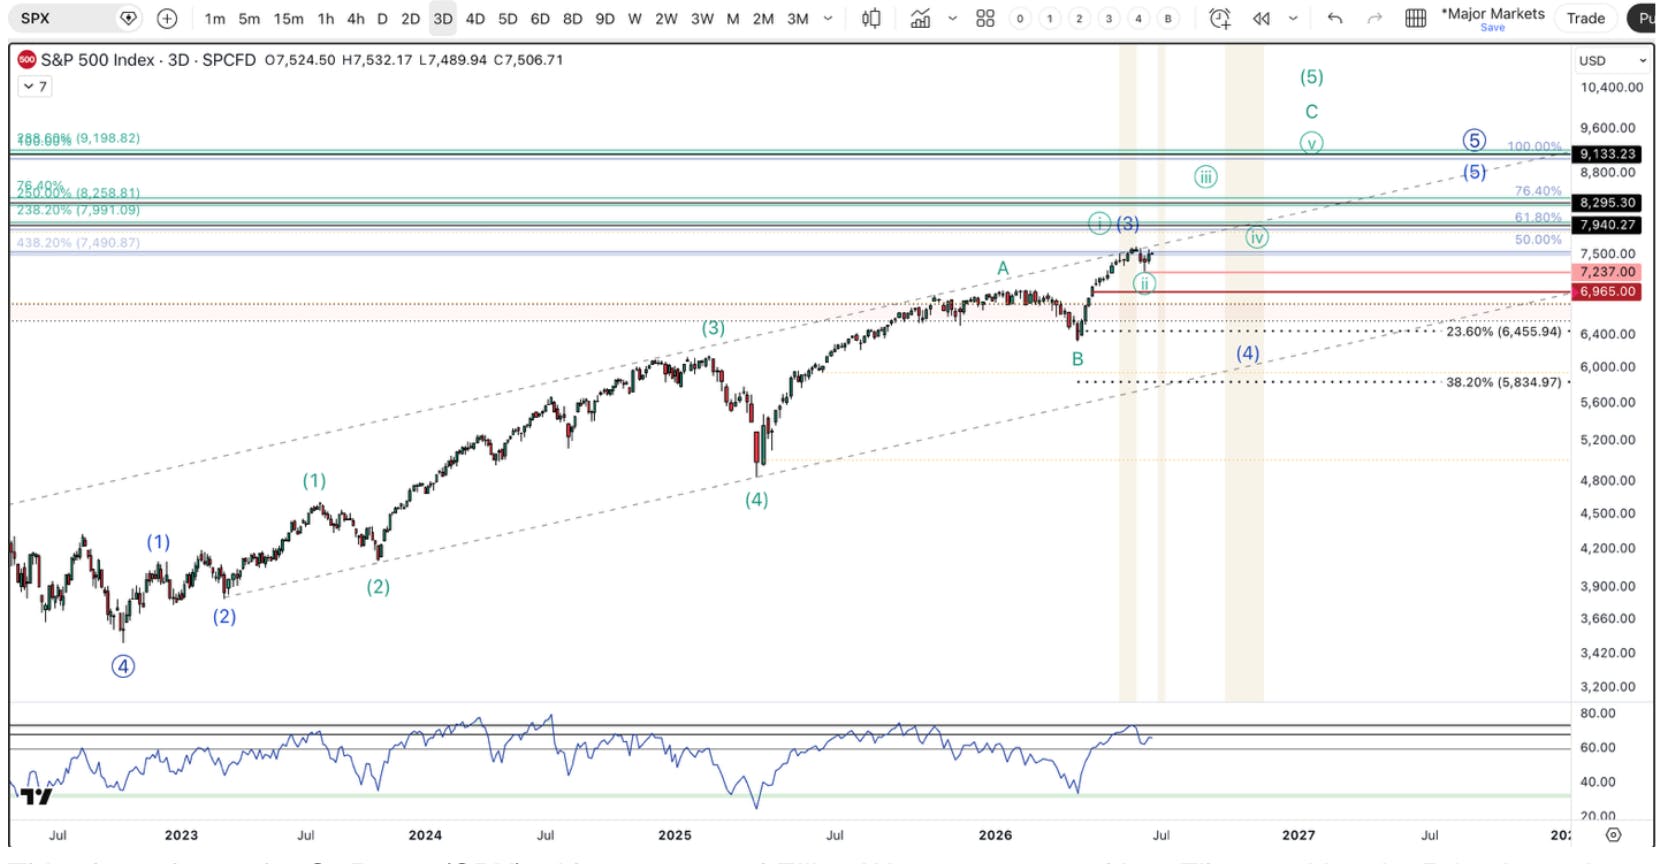
We can see these two moves in the potential chart patterns in play in the broad market. Since the 2022 low, the bull market pattern has been characterized with large and frequent swings in both directions, with an obvious upward bias. This pattern best represents an ending diagonal pattern. 

Based on the current price data, there are two scenarios I am tracking: 

  • Green – We are in a 2nd wave dip, which should hold 7238. We’ll then see a breakout to new highs on expanding volume and momentum, signaling that we are in the 3rd wave of this swing. This would be a continuation of the current melt-up with targets in the 9000s for SPX. If this plays out, then it tells us that institutions have been accumulating at these highs in preparation for this push higher. 
  • Blue – We break below 7238 and we will test 6965 next. If we break below this region in a meaningful way, we are likely in a very large 4th wave with targets between 6000 – 5700 SPX, that will likely find a low into Fall of this year. If these supports break, it will indicate that institutions have been distributing at the highs.  
Technical chart of the S&P 500 (SPX) showing Elliott Wave structure, Fibonacci levels, and key support and resistance zones with potential bullish and bearish scenarios.

This chart shows the S&P 500 (SPX) with a structured Elliott Wave pattern and key Fibonacci levels. Price is testing a critical resistance zone after a strong advance, with defined support levels below. 

Conclusion: 

In conclusion, since 1985, the NASDAQ-100 has fallen into a 10%+ correction roughly every 13 months. Since the new bull market started in October of 2022, that cadence has compressed to every 8. We are seeing volatility increase in frequency. 

You would think this would alarm investors, yet we are seeing some of the most extreme sentiment readings being backed with recent margin debt readings coming in at a new all-time high of $1.3 Trillion, which is roughly 4% of GDP and a 36% YoY increase in debt to buy. 

The reason for this is because of how investors have been trained to invest since the 2018 Christmas Eve Selloff. Markets always come back, and usually in an aggressive V-Shaped fashion. 

No example of this new norm has been more evident than the recent push to new highs. In fact, on April 15th, the NASDAQ-100 made history. A correction that had taken 103 days to bottom at roughly -12% on March 30th was erased in just 11 days. This was the most distorted drawdown-to-recovery ratio on record, with the index climbing back nearly nine times faster than it fell. Since 2022, the average drawdown is 46 days, while recoveries are just 35. Markets are climbing back faster than they fall, which is shaping investors' behavior. 

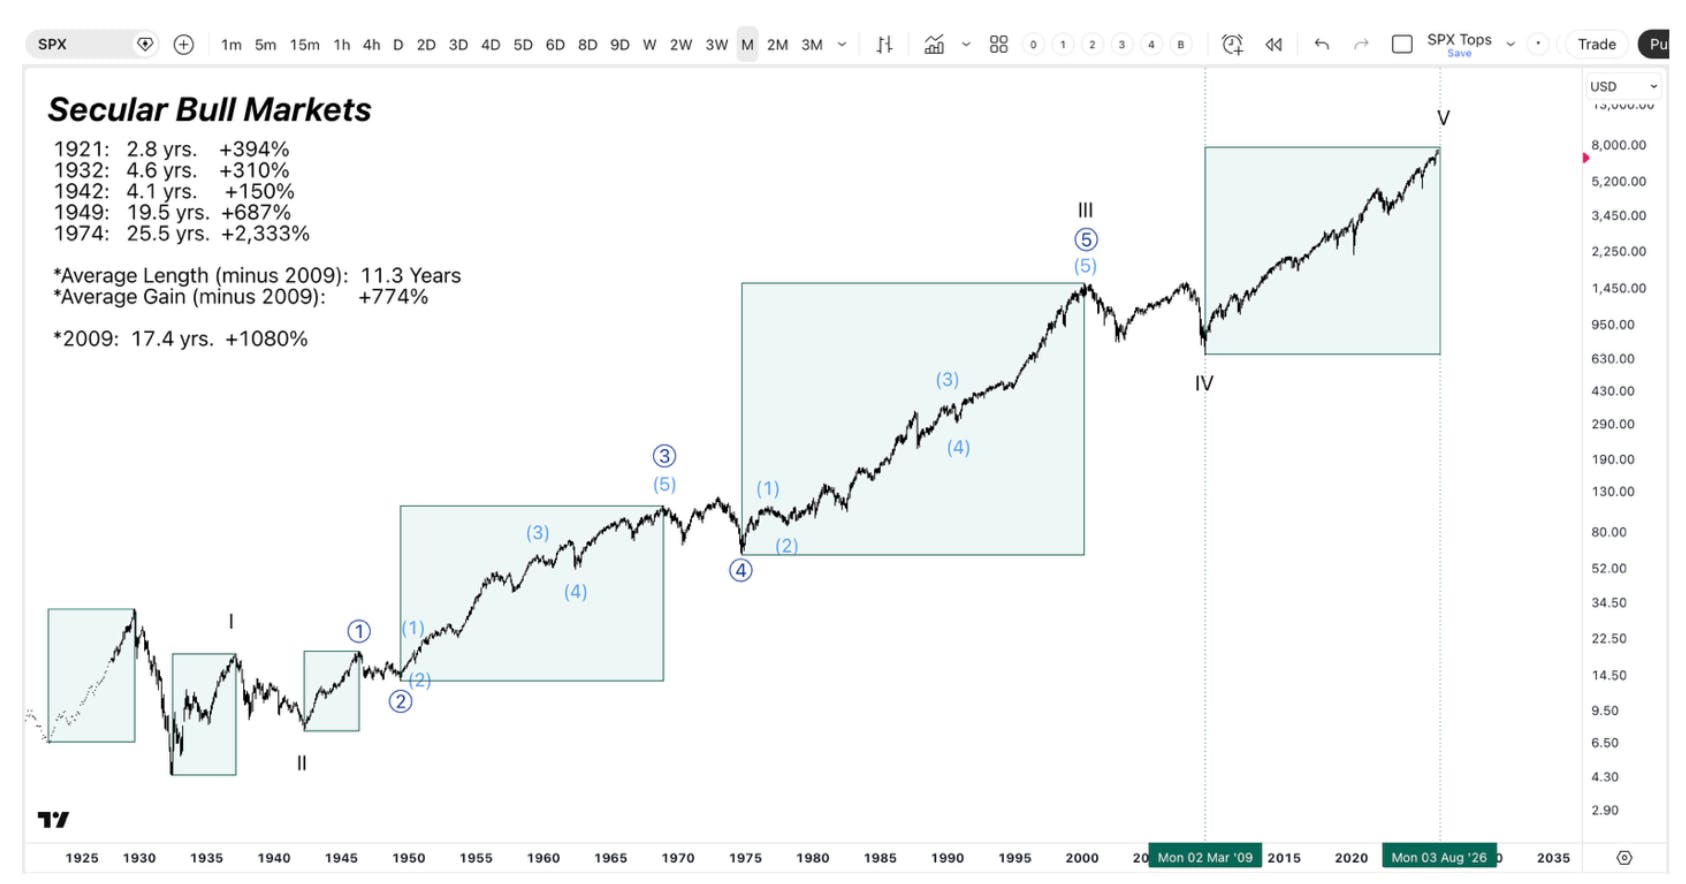
This kind of resilience is characteristic of secular bull markets, and the current one is among the longest and most profitable since 1900, now well into a roughly 17-year run as the sentiment cycle enters its final stages.  

Long-term chart of the S&P 500 showing secular bull market periods with historical returns, durations, and wave structure across multiple decades.

This chart shows the long-term S&P 500 (SPX) across multiple decades, highlighting major secular bull market phases. Each period is marked with its duration and total return, illustrating how long-term market cycles are characterized by sustained upward trends punctuated by shorter-term corrections. 

We do expect volatility to continue its frequency, but the secular uptrend likely has a bit further to run. That is precisely what makes this environment so hard to navigate: investors are taking on record levels of debt to buy speculative securities, even as the warning signals that tend to precede volatility events continue to build.  

As long as supports hold and liquidity stays stable, we expect the trend to continue higher. However, the sentiment pattern we are in is characterized by large and frequent swings in both directions. If the market decides to take the more volatile blue path outlined above, we will view this as another excellent buying opportunity in an ongoing secular bull market. On the other hand, if the market decides to continue higher, we will abandon our defensive posture and buy the breakout. Given the level of institutional activity in this range, whatever move comes next is likely to be substantial. 

Our firm specializes in marketing positioning, with a disciplined approach to liquidity and sentiment. Our approach helps us distinguish between selloffs worth buying, trends worth respecting, and risks that warrant a more defensive stance. 

Since launching in May 2020, our team has delivered a cumulative return of 326% – which would rank us #1 if we were a hedge fund and #3 if we were an ETF or mutual fund. We apply our market and risk framework to high-conviction AI and technology positions. For example, our firm owned four of the ten best-performing large-cap stocks during the historic April 2026 rally – on top of an already strong cumulative. 

Premium Members receive our Top 15 AI Stocks, real-time trade alerts, weekly webinars, portfolio, and deep-dive research across the AI infrastructure stack. 

Join I/O Fund Premium to get the research, positioning, and trade alerts behind our highest-conviction AI and technology ideas.
Join I/O FundJoin I/O Fund

Please note: The I/O Fund conducts research and draws conclusions for the Fund’s positions. We then share that information with our readers. This is not a guarantee of a stock’s performance. Please consult your personal financial advisor before buying any stock in the companies mentioned in this analysis.

👉🏻 Share with a Fellow Investor
He
are with a Fellow Investor
H
elp someone else benefit from this insight.

Recommended Reading:

Arm: Computex Update, CPU Core Demand Hinted at Being Higher   

We believe it is worthwhile to revisit Arm for a couple of reasons: the first being the fact that shares have meaningfully broken out post-earnings, at one point up more than 100% over the last month, and the second being to make sure the we have not overlooked any pieces of Arm’s story given the strengthening thematic tailwinds from agentic AI driving the CPU to GPU closer to parity due to higher orchestration needs.  

Computex Takeaways – AGI CPU in Production, New Customers 

There were a handful of notable updates from Arm regarding the AGI CPU at Computex, while discussion around the CPU industry provided further confirmation on the thesis that agentic AI is quickly driving the CPU-GPU ratio towards 1:1 (or better).  

At Computex, CEO Rene Haas confirmed that the AGI CPU is in production at TSMC, hinting that it could begin recognizing AGI CPU system revenue sooner and potentially accelerate its ramp (pending supply). Haas also revealed two other large-scale customers joining the fray for the AGI CPU – Oracle and ByteDance, complementing launch partners Meta, OpenAI, Cloudflare, Cerebras and others. Still, the challenge likely remains securing supply to push initial revenue forecasts higher, as Arm did not offer much on that front at Computex. Haas later stated on Bloomberg that he was “very confident” that Arm would reach its $15 billion target by FY31 with demand remaining strong, adding that he hopes Arm could reach that target sooner.   

Also at Computex, Nvidia revealed its RTX Spark, its Arm-based PC superchip, featuring a slimmed-down 20-core Grace CPU alongside a Blackwell RTX GPU offering  up to 1 petaFLOP of FP4 performance on Windows laptops. Microsoft says RTX Spark offers “industry-leading performance per watt for creative, AI and gaming workloads” on Windows, with the chip helping consumers build and run AI models, inference and agents locally on PCs with native CUDA support. First PCs built with Spark are expected this fall, which could alleviate concerns to Arm’s growth related to PC softness stemming from elevated memory costs cutting into demand. 

Key rival Intel added more color to the CPU-GPU ratio thesis, explaining that due to immense orchestration needs, agentic AI is “leading to a situation where the 1 CPU to 8 GPU ratio in frontier model training has shifted CPU density to 1:1 or better.” This is along the lines of what AMD had implied as well, with the ratio potentially moving beyond 1:1 in favor of CPUs. This is up from 1:4 to 1:8 today, a substantial shift that has to happen quickly considering agentic applications are rapidly proliferating. 

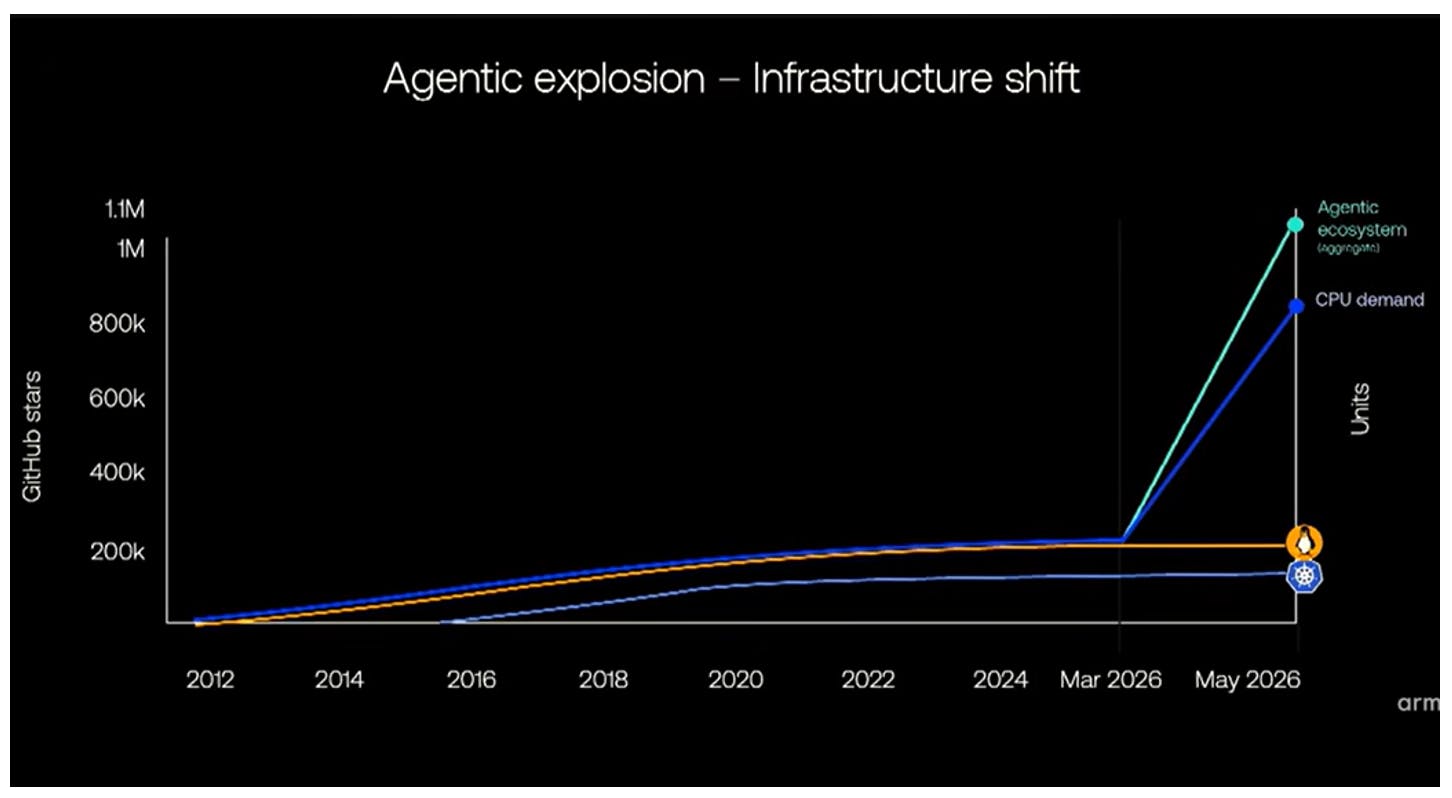
Source: Arm Arm 

The main takeaway here is that CPU demand is expected to explode – Arm outlined at Computex that the agentic ecosystem (based on Github stars) has risen roughly 5X in the past three months, wildly outpacing the growth of both Linux and Kubernetes, with CPU demand following shifting from following Linux to following closely behind this agentic curve. While CEO Rene Haas had outlined a 4X growth in CPU cores per GW in March, from 30M to 120M, he stated at Computex that “4X, 8X, 10X, it’s a hard number to predict just based upon the growth rates of these agents,” which at its core implies that there could be certain agentic applications or deployments that require much greater CPU density and thus a much higher CPU:GPU ratio.  

To put this more in dollar terms, what this suggests is that TAM estimates for server CPUs, including Arm’s $100B forecast and AMD’s recently doubled $120B forecast, could still have significant room to the upside if the CPU:GPU ratios moves quickly towards 1:1 or better, or if CPU core growth per GW starts advancing towards that >8X number Arm laid out.  

Touching on v9, CSS and Hyperscaler Deployments 

Given that we are still awaiting the broader ramp and strongest contributions from Arm’s AGI CPU, growth in the meantime will remain tied to royalty and licensing revenue. For royalties, the question here is whether v9 and Arm’s compute subsystems (CSS) designs can help accelerate growth in the near term. 

For reference, as we had pointed out in our post-Q4 FY26 earnings analysis, Arm FQ4: AGI CPU Demand Hits $2B, Revenue Outlook Stays at $1B, Q1 guidance was relatively in line while 1H is expected to be softer with revenue growth dipping below 20% YoY. This dynamic has not changed much since, with FQ1 revenue projected to be ~20% before decelerating to 18% in FQ2 and rebounding in FQ3. 

There are a handful of factors that could support stronger royalty revenue growth through the rest of 2026 into 2027 as the AGI CPU prepares to ramp, stemming from hyperscaler deployments of Arm-based chips. 

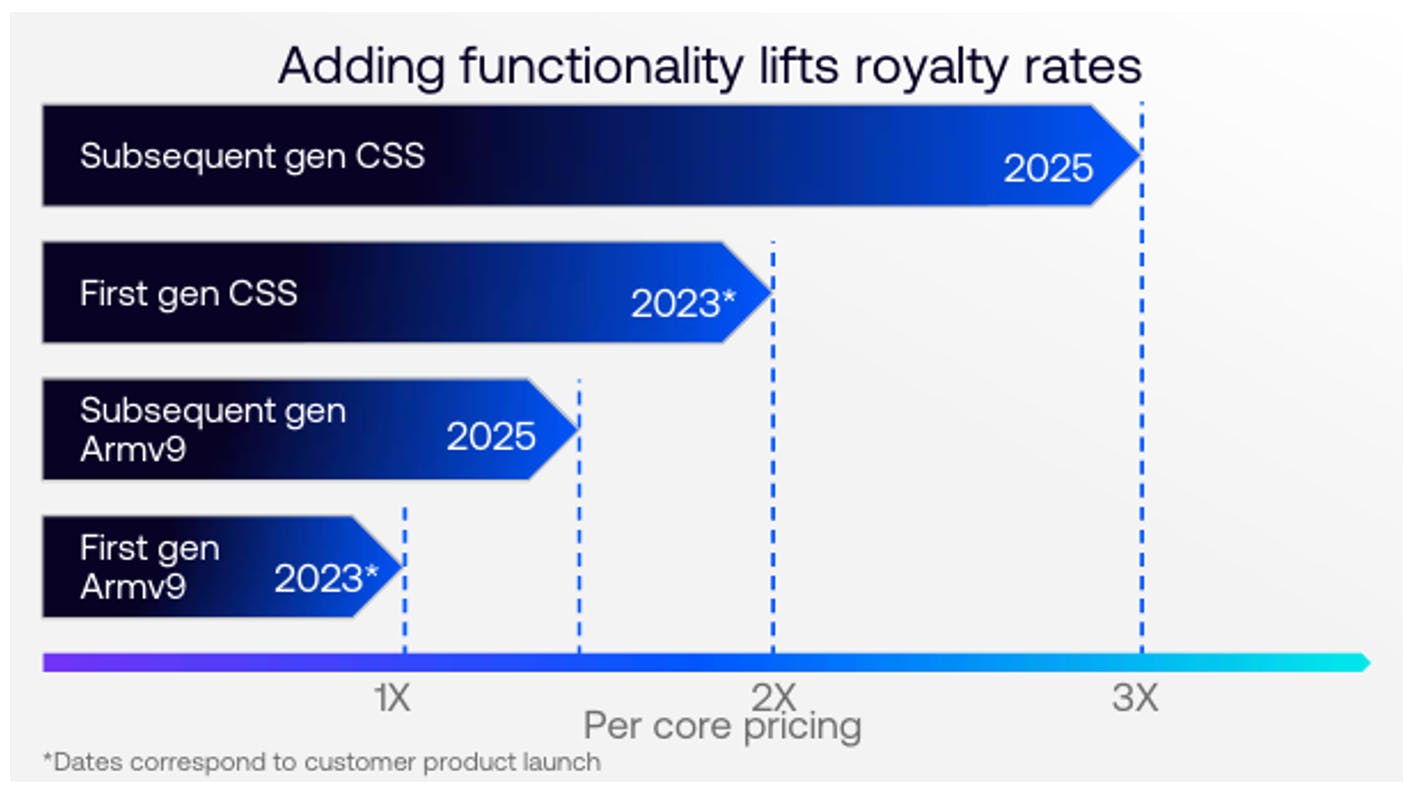
To start, Arm’s latest v9 and CSS architectures carry much higher royalty rates per core, with the subsequent v9 generation carrying a 1.5X higher price versus the first v9 gen, with a similar dynamic occurring with CSS; to note, Arm sees its subsequent gen CSS carrying a 3X higher rate than its first gen v9, emphasizing why CSS wins are increasingly crucial for royalty growth (with two deals signed last quarter, one of which is for data center networking chips and the other for smartphones).  

Source: Arm Arm 

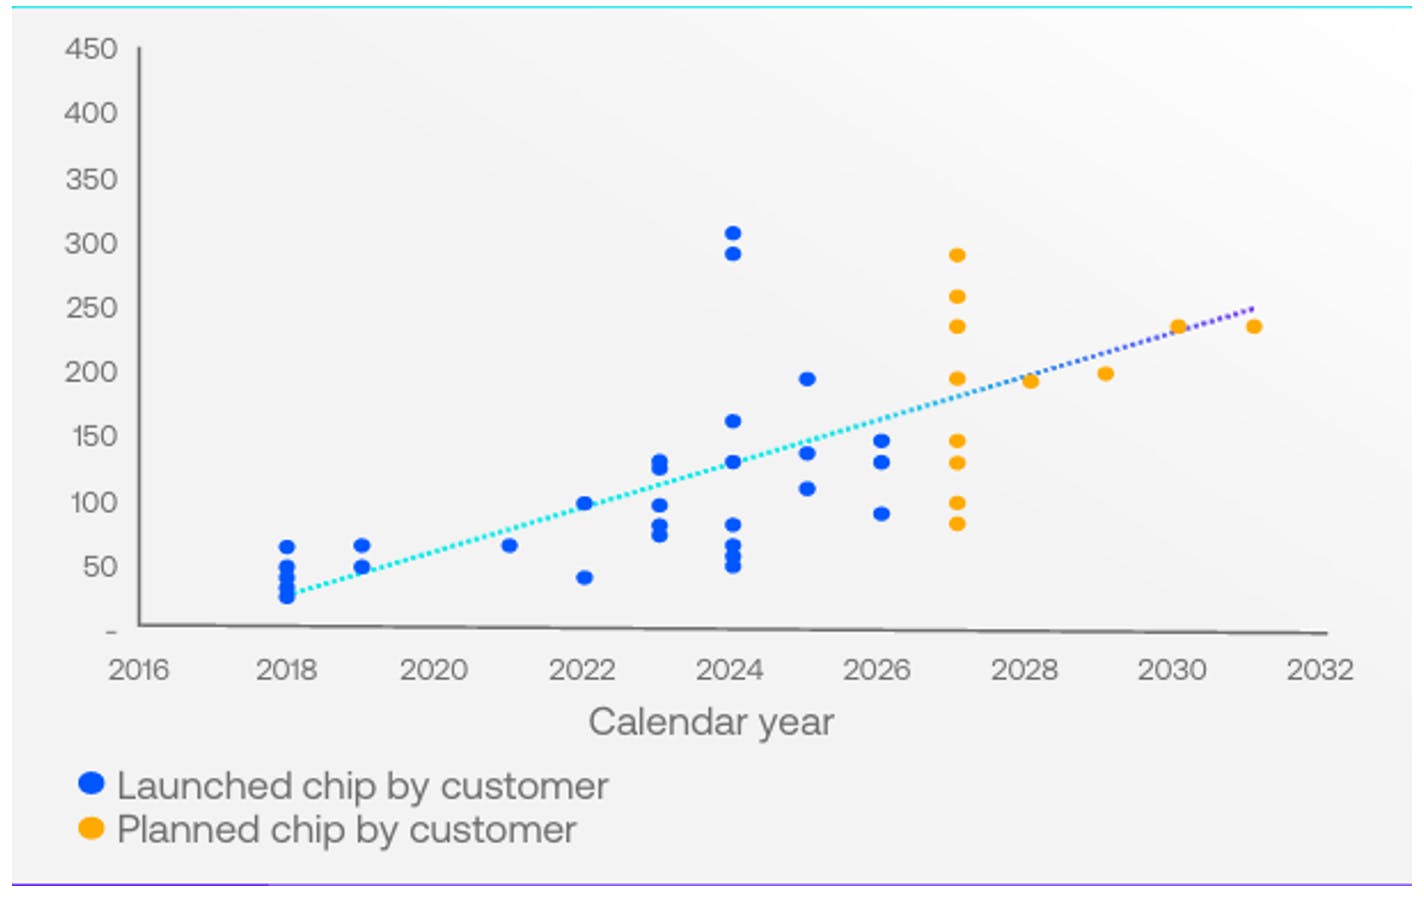
Also layering in to growth next year is a broad line-up of new data center chips based on Arm’s architecture – the company sees at least 8 new chips coming online in 2027, more than double the three new Arm-based data center chips that came online in 2026. Four of the eight feature substantially higher cores than 2026’s launches, providing a direct outlet for royalty growth, with three of these being among the top five highest-core count chips launched since 2018.  

Source: Arm Arm 

For a rough, speculative estimate on what 2-4X growth in CPU core demand could suggest for server CPU royalty revenue growth through 2028:  

Assuming server CPUs account for roughly two-thirds of Cloud AI royalty revenue (as this also includes DPUs, networking, etc, but with significant concentration in hyperscalers’ custom CPUs), this would project server CPU royalty share of around 8-9% in FY26, or ~$220 million at midpoint, based on Cloud AI taking roughly 12-13% share.  

Estimating 2X growth in CPU core demand from here by 2028 combined with ~2X higher royalty rates from blending v9, CSS v3 and upcoming CSS v4 (slated for 2027 though exact release data), this would project server CPU royalties to $880 million. A 4X increase in core demand combined with the same ~2X increase in royalty rates would roughly estimate server CPU revenue of up to $1.76 billion. This would roughly estimate server CPU share of overall revenue for Arm to rise from the 4-5% range to the 18-19% range under the 4X core growth assumption by the end of 2028. 

Hyperscaler Chip-Based Demand Signals 

Notably, Google’s newest TPUs, 8t and 8i, will both see the Arm-based Axion CPU replace x86 chips at the head node, which Google says will “remove the host bottleneck caused by data preparation latency.” TPU shipments are expected to see a rapid ramp in 2027, with UBS modeling shipments rising nearly 139% YoY from 4.13 million in 2026 to 9.87 million in 2027. Reports have suggested that the new generation will adopt a 1:2 CPU-to-TPU ratio, which would imply demand of close to 4 million Axion CPUs in 2027 if the v8 TPU accounts for roughly 80% of UBS’ estimated shipments.  

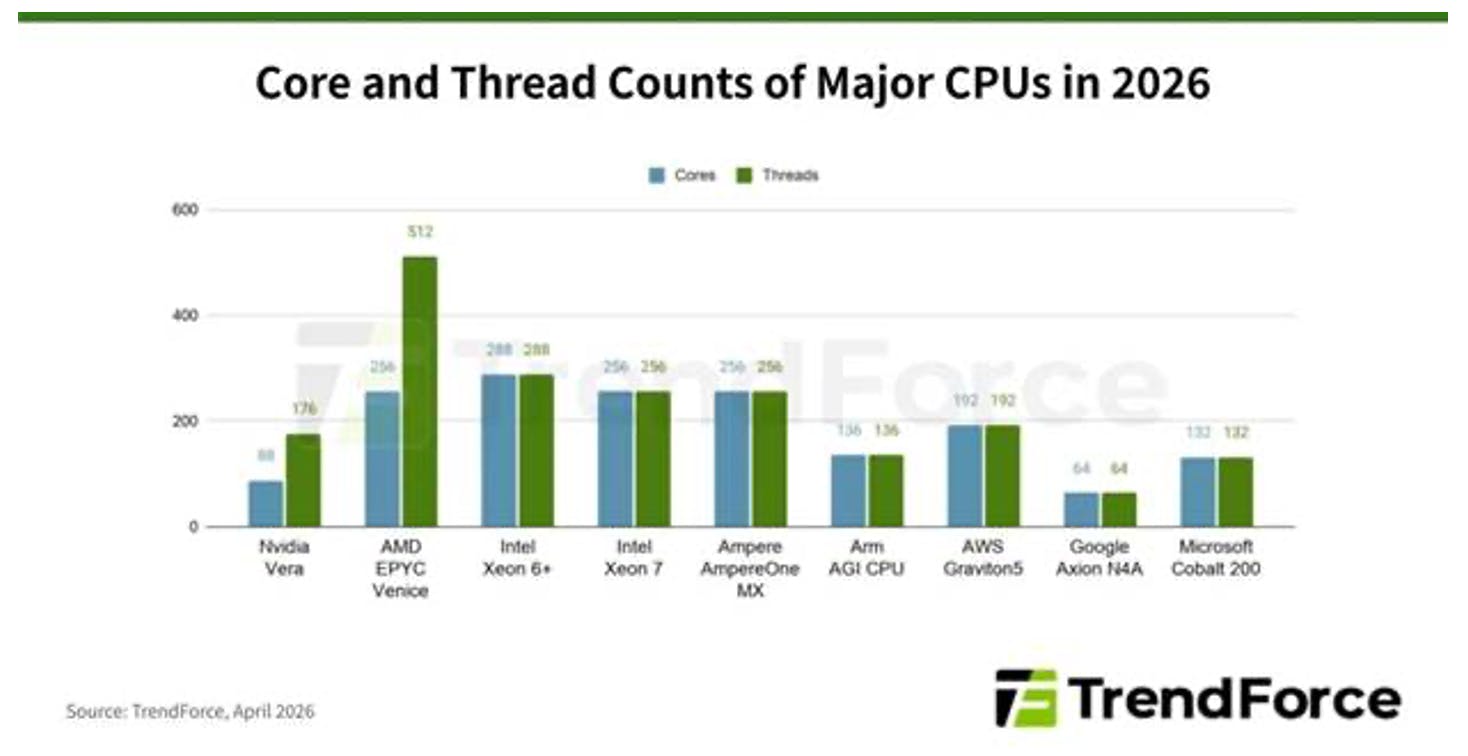
Amazon highlighted in early April that its Arm-based Graviton CPU was seeing exceptionally strong demand, noting that “two large AWS customers have already asked if they could buy all of our Graviton instance capacity in 2026.” Amazon also signed a deal with Meta, letting Meta access tens of millions of Graviton cores for at least three years; in terms of chips (based on 192 cores for Graviton5 and assuming 30-50M cores), this would represent 156K-260K individual chips. Amazon also noted that Graviton accounted for more than half of the CPU capacity it added last year for the third year in a row. 

Nvidia’s Vera CPU cannot be forgotten either, as Nvidia recently outlined a $200 billion TAM for the new CPU with visibility into $20 billion in total CPU revenue this year, as it plans to utilize it in four different ways (Vera Rubin, standalone CPUs, Vera CPU plus CX-9 and storage, and Vera CPU plus CX-9 and security/confidential computing). The standalone Vera racks also offer 7X more CPUs in one rack, at 256 compared to the 36 CPUs in the Vera Rubin NVL72 (and thus 22,528 cores vs 3,168 for the NVL72), offering room for royalty growth for Arm if the rack does indeed scale towards $20 billion in revenue.  

Analysts Increasingly Bullish on Arm 

Analysts look to be getting increasingly bullish on Arm despite the rather lukewarm Q4 report a month ago.  

The most notable (and active) is Mizuho, which has increased its price target on Arm three times since May 28, taking it from $290 to $360 on growing agentic AI demand, then again to $425 on June 1 due to its view on supply constraints driving server CPU upside. Mizuho raised this to $500 on June 4 on increased confidence in Arm’s ability to hit its $15 billion AGI CPU goal.  

Wells Fargo recently hiked its price target on Arm from $255 to $410, with its main takeaway from its ‘Bus Tour’ being that the “proliferation of AI inferencing / Agentic AI [is] driving significant incremental server CPU demand.” Bernstein also believes Arm is the “structural beneficiary of the renaissance” of CPUs with agentic AI, stemming from its “unparalleled power efficiency.”  

Conclusion 

Despite a rather lackluster earnings report and soft guide, Arm’s shares meaningfully broke out with a nearly 100% rally in the back half of May on increasing momentum and optimism on agentic AI’s tailwinds for CPU growth. Arm hinted at Computex that CPU core demand per GW could move meaningfully higher than the 4X it described at the launch of its AGI CPU, depending on how agentic AI deployments unfold, while key rivals have also laid the foundation for CPU:GPU ratios to quickly move towards 1:1 or better.

Please note: The I/O Fund conducts research and draws conclusions for the company’s portfolio. We then share that information with our readers and offer real-time trade notifications. This is not a guarantee of a stock’s performance and it is not financial advice. Please consult your personal financial advisor before buying any stock in the companies mentioned in this analysis. Beth Kindig and the I/O Fund own shares in ARM at the time of writing and may own stocks pictured in the charts.

Damien Robbins, Equity Analyst at I/O Fund contributed to this analysis.

Recommended Reading:

Nvidia, CoreWeave, and Nebius: Inside the Circular Financing of the GPU Boom

  • Neoclouds are seeing massive hyperscaler demand as companies race to scale AI infrastructure, resulting in rapid revenue and backlog growth. 
  • Leaders like CoreWeave and Nebius enable this through access to the latest Nvidia GPU’s while also optimizing compute utilization.  
  • However, the bearish argument behind hyperscaler demand lies in their desire to offload their capex spending and shift costs to the operating expense line. 
  • CoreWeave’s and Nebius’ growth is far from profitable, as they seek to capture AI demand with limited cash flow and soaring debt loads in an increasingly tough macro backdrop.  
  • Circular financing, demonstrated by Nvidia’s investments and financial backstopping, is another key item to monitor closely 

Neoclouds are one of the more hotly debated AI business models, with CoreWeave and Nebius being the two most widely recognized names. These companies have seen their sales, backlog, and share prices soar, differentiating themselves through quick access to the latest GPU compute and GPU utilization advantages that allow hyperscalers to rapidly add efficient compute capacity. 

Notably, CoreWeave and Nebius have each secured 3.5 GWs of contracted power capacity; while these power footprints are key considering power is a hindrance to data center expansion, the vast majority of their contracted power capacity has yet to come online. CoreWeave is targeting 1.7 GW of active power by the end of 2026, while Nebius is targeting 800 MW to 1 GW of connected power. 

In turn, they are quickly working to convert their contracted power to active power, and thus convert large backlogs into revenue. Yet doing so is extremely expensive, and neoclouds do not have the same cash nor operating cash flow profiles of Big Tech. This is leading neoclouds to employ unique and circular financing structures, raising some red flags. 

In this analysis, I dive into the two public neoclouds that are riding Nvidia equity, hyperscaler contracts, and GPU-backed debt to fund the buildout, and what it means for the durability of the surge. 

Microsoft and Meta’s $120B+ Bet on Neoclouds 

The size of hyperscaler-neocloud partnerships compared to their current revenue is astounding. Microsoft has struck the most neocloud deals, with approximately $60 billion worth of commitments between CoreWeave, Nebius, and other private players such as Nscale. Meanwhile, Meta has committed $35.2 billion to CoreWeave in total after its recent $21 billion expansion, and an up to $27 billion deal with Nebius for a total commitment of up to $62.2 billion. Along with Meta, OpenAI is one of CoreWeave’s two largest customers, while CoreWeave also has a multi-year compute agreement with Anthropic.  

Alone, Microsoft and Meta’s total commitments extend up to $122.2 billion – for perspective, that is ~90% of the TTM revenue of AWS being allocated towards neoclouds over long-term capacity deals. When factoring in hyperscaler-backed deals from OpenAI and Anthropic (although exact deal value is unknown), total potential commitments surpass $145 billion.  

Keep in mind, CoreWeave’s FY2026 estimated revenue is $12.6B and Nebius FY26 revenue is expected to be $3.4B – therefore, these partnerships are leading to commitments that are an order of magnitude higher than current sales.  

The reason hyperscalers are willing to allocate this capital to a relatively new business model in the neoclouds is three-fold – quick access to leading GPU generations, optimized compute utilization, and the added benefit of not having to recognize capex on the balance sheet – we look at each of these drivers below. 

Neocloud Advantage is Offering Quick Access to GPUs 

At its root, neocloud demand is a product of hyperscalers' insatiable demand for compute capacity. However, neoclouds can often add compute capacity much faster than hyperscalers can through internal builds, offering a key value proposition for Big Tech. As hyperscalers spend hundreds of billions a year on AI compute, minimizing the lag between data center expenses and revenue generation is critical to maximizing their return on investment. 

Supporting the argument around neocloud’s advantage lying within time to deployment, commercial real estate giant JLL notes, “Neoclouds can deploy high-density GPU infrastructure within months compared to multi-year builds for hyperscale data centers, providing crucial time-to-market advantages for businesses needing rapid AI development.”

mid

In CoreWeave’s S-1 Registration filing, it lists “Faster access to the latest AI infrastructure advancements” as one of its key benefits to customers. Specifically, CoreWeave says “we were among the first to deliver NVIDIA H100, H200, and GH200 clusters into production at AI scale, and the first cloud provider to make NVIDIA GB200 NVL72-based instances generally available. We are able to deploy the newest chips in our infrastructure and provide the compute capacity to customers in as little as two weeks from receipt.”  

Nebius makes a similar statement in its Annual Report, noting its “consistent track record of being one of the first to deploy the latest generation of NVIDIA GPU chips.” 

CoreWeave and Nebius' relationship with Nvidia is key to acquiring the latest GPUs ahead of others. Nvidia recently invested $2 billion in both CoreWeave and Nebius. Under these partnerships, CoreWeave and Nebius will each look to deploy more than 5 GW of data center capacity by 2030. 

CoreWeave recently demonstrated its ability to offer quick access to the latest chips and newest architectures to hit the market once again, being the first to have a Vera Rubin system up and running at the start of June.  This provides evidence that partnering with CoreWeave and Nebius can help hyperscalers access as much of the latest GPU compute as possible in short order. 

Beyond Hardware: Neocloud Platforms Offering Higher GPU Utilization  

Aside from raw compute access, CoreWeave and other neoclouds layer on software and additional capabilities that improve GPU utilization – a key value add for hyperscalers.  

For example, CoreWeave Kubernetes Service (CKS) helps coordinate the allocation of workloads across thousands of GPUs, while its SUNK service helps optimize GPU utilization by allowing training and inference workloads to run on the same cluster. CoreWeave Tensorizer enables high-speed model loading, reducing GPU idle time. 

Combining these software and optimization capabilities with rapid fault detection and remediation services, CoreWeave believes it can offer higher GPU utilization rates than hyperscalers, based on the model FLOPs utilization (MFU) metric. The “MFU gap” is a metric that describes the gap between compute capacity and usage, which today often ranges between 30% to 40%. 

The MFU gap can become quite costly as it represents a more realistic way to measure the performance of GPUs — rather than only taking into account if a GPU is sitting idle or not. According to Trainy AI: “GPU Utilization is only measuring whether a kernel is executing at a given time. It has no indication of whether your kernel is using all cores available, or parallelizing the workload to the GPU’s maximum capability.”  

Chart showing AI model FLOPS utilization with 100% theoretical vs 35–45% observed performance and efficiency gap

Chart comparing theoretical model FLOPS utilization (100%) with observed performance (35%–45%), illustrating a significant efficiency gap in AI workloads. Source: CoreWeave CoreWeave 

When going public, CoreWeave published its MFU rate at 35% to 45%, stating it is 20% higher than competitors, which means other AI data centers had MFU rates more in the 30% range. However, in a March 2025 blog post, CoreWeave noted that it was achieving an MFU of >50% on Hopper GPUs. This ability to stand up next-generation GPU hardware in short fashion combined with improved utilization rates is where the neoclouds’ advantage lies.  

Behind the Balance Sheet: Why Hyperscalers Are Leasing Neocloud Capacity 

By leasing compute capacity from neoclouds, hyperscalers shift their cost timeline from being a large upfront capex outflow to an operational expense outflow spread over long-term contracts. The need to spread costs is becoming increasingly evident due to the massive spending hyperscalers are engaged in.  

Although this is the “bear” case on why hyperscalers work with neoclouds—contrasting this with the rationale behind GPU access and utilization is key because one could argue that hyperscalers are quite capable of software optimizations and GPU utilization on their own (in fact, they are the longstanding incumbent here with deep expertise in cloud operations and workload optimizations). 

Take Meta for example. Analysts are currently expecting the company to generate $136 billion in cash from operations in 2026. With its stated capex guidance of $125 billion to $145 billion, the company could easily be free cash flow negative during the year. However, as noted, Meta also has up to $62.2 billion in neocloud agreements. If Meta built the equivalent value of capacity itself, the firm would recognize that spending as balance sheet capex, weighing further on its already pressured free cash flow.  

On the other hand, neocloud agreements add nothing to Meta’s capex, as the costs are recognized as operating expenses over the life of the contracts. Notably, Meta’s contracts with CoreWeave and Nebius extend through 2031-2032, meaning that opex payments could average less than $10 billion annually. 

Looking at Microsoft, we can see a similar situation. In calendar year 2026, the company is guiding for capex of $190 billion, while analyst forecast $200 billion in cash from operations over the same period. If these figures materialize, the company would consume 95% of its OCF on capex. The $60 billion in neocloud agreements, recognized as operating expenses over many years, expands its capacity while keeping that spend off its cash flow statement. 

As hyperscalers offload their capex, neoclouds are the ones taking that capex on—resulting in their massive funding needs.  

Circular Financing: Nvidia’s Role as an Investor, Supplier, and Demand Backstop 

Both Nebius and CoreWeave lend some of their advantage to Nvidia, as it is this partnership with the GPU leader that offers them that ability to be among the first providers to stand up and deploy next-gen platforms such as Blackwell Ultra and now Rubin.  

Having Nvidia as a partner also could play a role in helping CoreWeave and Nebius secure funding at much better terms, extending presence and support beyond the hyperscalers to another investment-grade firm with a strong balance sheet and cash flows. Nvidia’s LTM free cash flow was $119 billion, the second highest of any company in the world, only behind Apple. The downside, however, is that Nvidia’s relationship with the two is one of the most identifiable instances of circular financing.  

This stems from the multi-billion-dollar investments that Nvidia has made in CoreWeave and Nebius. Notably, Nvidia’s latest $2 billion investments in each company were not its first. Nvidia’s Q1 2025 13F filing revealed a CoreWeave stake worth $896.7 million at the time, while its Q4 2025 13F revealed a $33 million stake in Nebius. Thus, the investment relationship between Nvidia and these firms extends well beyond one year. 

Furthermore, in the case of CoreWeave, Nvidia has also provided a significant financial backstop against unsold GPU capacity. Under the agreement with an initial value of $6.3 billion, “in instances where [CoreWeave’s] datacenter capacity is not fully utilized by its own customers, NVIDIA is obligated to purchase the residual unsold capacity through April 13, 2032.” In other words, Nvidia is committed to purchasing unsold GPU capacity if CoreWeave is unable to find another buyer. With an initial value of $6.3 billion, there is the potential that the arrangement could become larger over time. 

As Nvidia makes these investments, CoreWeave and Nebius are going right back to Nvidia to purchase large volumes of GPUs – a clear representation of circular financing. By providing a relatively small amount of equity funding, Nvidia secures relationships with these neoclouds that intend to purchase tens of billions' worth of GPUs.  

Nvidia could see long-term benefits by supporting CoreWeave and Nebius through their ramp-up phases where cash flow is deeply negative. If the firms can eventually become self-sustainable, Nvidia would have two large-scale customers that it can continue selling its latest systems to for years to come. However, for the neoclouds, the concern is whether they have to continually raise cash into the foreseeable future to build new infrastructure and when that would level out, as revenue lags capex 2:1. 

How Neoclouds Are Funding AI Expansion: Debt, Equity, and Circular Financing 

Both CoreWeave and Nebius are eyeing rapid ramps in active power – CoreWeave currently has 1GW of its 3.5GW contracted power pipeline active, but it aims to convert the majority of that over to active capacity by the end of 2027, while Nebius similarly has 3.5GW of contracted power and a goal of reaching up to 1GW of connected (active or can be activated upon GPU installation) by the end of 2026.  

However, as with all AI buildouts right now, the keywords are “active power” as energy constraints are intensifying across the board.  

CoreWeave’s Balance Sheet Challenged, Debt Quickly Rising 

CoreWeave’s balance sheet is in a difficult position, as the company looks to rapidly expand its active power footprint at a rate that is not supported by its cash balance and its operating cash flow. 

Revenue of $2.08 billion rose by 112% YoY in its latest quarter. However, operating cash flows (OCF) came in at $2.98 billion, compared to capex of $7.7 billion, leading to free cash flow of -$4.71 billion. This mismatch led to the firm’s cash balance falling by $890 million, or 28.3% QoQ to $2.27 billion. Meanwhile, debt increased by nearly $3.5 billion, or 16.1% QoQ to $24.86 billion – this is set to rise further in Q2 as CoreWeave just announced a $3.5 billion senior note raise on June 11. 

Line chart showing CoreWeave quarterly capex rising to $7.7B vs revenue at $2.07B in 2026

Chart showing CoreWeave’s quarterly capex rising sharply to approximately $7.7 billion, while revenue reached around $2.07 billion over the same period. Source: YChartsYCharts

For the full-year, CoreWeave expects to spend $31 billion to $35 billion on capex, or $33 billion at the midpoint. This implies capex spending for the remainder of the year of $25.3 billion. Analysts currently estimate that the company will generate $8.68 billion in operating cash flow in 2026, or just $5.7 billion for the rest of the year. Given CoreWeave’s $2.27 billion cash balance, this creates a huge funding gap of $17.33 billion. In practice, CoreWeave is likely to raise more than this to avoid further decreasing its already somewhat thin cash cushion. 

CoreWeave has used equity issuance in the past as a funding source, but debt issuance far outweighs this. Looking at its first five earnings reports since going public, its total equity issuance is only $3.5 billion, while debt issuance was more than 5X higher at $18.81 billion. Thus, a further increase in debt is likely to be the primary way that CoreWeave continues to fund its capex plans while already having a net cash position of -$22.6 billion. Looking into its unique funding structures shows that debt will continue to be a key lever that the firm pulls. 

Nebius: Stronger Balance Sheet but Ongoing Funding Needs 

Nebius is comparatively in a much better position, with $9.37 billion in cash to $8.45 billion in debt, for a net cash balance of $920 million. Revenue rose 684% YoY to $339 million in its latest quarter, while operating cash flow was $2.26 billion, rising by 170.7% QoQ due to significant customer prepayments. Capex came in at $2.47 billion, resulting in FCF of -$214.9 million.  

However, Nebius is also looking to rapidly expand its active power footprint, with the firm’s midpoint capex guidance for the full year at $22.5 billion. This implies $20 billion in spending over the remainder of the year. Including the company’s cash and contractual commitments of approximately $6.9 billion, Nebius currently needs to draw $6.3 billion in additional funding to support the midpoint of its capex forecast. 

Like CoreWeave, Nebius has also leaned heavily on debt rather than equity issuance to fund itself, although to a lesser extent. Since Q4 2024, Nebius’ total equity issuance was approximately $3.92 billion when including the $2 billion in pre-funded warrants Nvidia recently purchased. Over the same period, its debt issuance was $8.32 billion. In its latest earnings call, Nebius noted asset backed financing, corporate debt, and equity issuance as options for raising capital.  

Notably, Nebius’ undeployed 25 million share at-the-market equity program could go a long way toward bridging its 2026 funding gap. At a $200 share price (around 10% below the stock’s current level), fully utilizing this program would generate gross proceeds of $5 billion while diluting shareholders by approximately 8%. However, given past trends, asset backed and corporate debt are likely to be the primary path forward. 

Overall, this breakdown of CoreWeave and Nebius’ funding requirements for 2026 is just one stage of a much larger push to convert its contracted power into active power. After all this spending, CoreWeave aims to have just under 50% (1.7 GW) of its contracted power active. Meanwhile, Nebius hitting the upper bound of its connected power target would account for less than 30% of its contracted power, which includes power that is either active or can be activated once GPUs are installed.  

In turn, the companies will continue to need to find more and more funding to scale until CFO converges with capex. With the spread between these figures still very wide, the likely result is further increases in debt loads and/or shareholder dilution over several years. 

GPU-Backed Debt: Inside CoreWeave’s Funding Engine for AI Infrastructure 

CoreWeave relies heavily on GPU-backed delayed draw term loans (DDTLs), having closed six separate facilities. Under DDTLs, CoreWeave draws down funds intermittently as it uses them to pay for different stages of data center buildouts.  

Notably, the company’s $8.5 billion DDTL 4.0, closed in March, was the first of its kind to receive an investment-grade credit rating. As of Q1 2026, CoreWeave had only drawn $1.26 billion worth of DDTL 4.0. This is the only portion of the $8.5 billion that currently shows up in CoreWeave’s total debt. Thus, as the firm draws down more of DDTL 4.0 over time, its debt will also increase.

Table showing CoreWeave’s debt obligations in Q1 2026, including DDTL 1.0–4.0 facilities, senior notes, and total debt of approximately $25.1 billion, with DDTL 4.0 drawn at $1.26 billion out of $8.5 billion

Table showing CoreWeave’s debt structure with total debt of approximately $25.1 billion, including multiple delayed draw term loan (DDTL) facilities and senior notes. Notably, the DDTL 4.0 facility totals $8.5 billion, but only $1.26 billion has been drawn, indicating significant future debt expansion as capital is deployed. Source: CoreWeaveCoreWeave 

CoreWeave notes that the investment-grade rating is “supported by a long-term customer contract with an investment-grade AI enterprise," which is presumably tied to Meta’s latest contract. Essentially, the contract that CoreWeave has signed with the investment-grade customer, as well as the value of the GPUs it buys, are collateral for the debt. This is why the facility can achieve an investment-grade credit rating despite CoreWeave itself having a poor balance sheet, allowing for much more favorable interest rates that CoreWeave could not otherwise receive. 

Still, CoreWeave's ability to receive better interest rates than peers relies on backing from investment grade customer contracts. Notably, DDTL 5.0, closed in May (and is thus not included in the table above), was backed by two non-investment-grade customer contracts. This resulted in the facility not receiving an investment grade rating and thus having a higher interest rate. 

Interest Rate Pressure: A Growing Risk to Profitability 

Increases in general rates apply further upward pressure on the rates that CoreWeave and other neoclouds can receive in future funding rounds. The fixed rate tranche of DDTL 4.0 is tied to U.S. Treasuries with an average weighted maturity of 3.14 years, plus a 2% premium. This portion of the yield curve has seen rates rise significantly since the beginning of the year from less than 3.6% to nearly 4.2%.

Line chart showing 3-year U.S. Treasury yield rising from below 3.6% to 4.16% in 2026

Chart showing the 3-year U.S. Treasury rate rising from below 3.6% in early 2026 to approximately 4.16% by June, reflecting a sharp increase in short- to mid-term interest rates. Source: YCharts.YCharts.

Notably, CoreWeave’s interest payments are already elevated, coming in at $536 million in Q1. This equates to 25.8% of its $2.08 billion in revenue, and 46.3% of its $1.157 billion in adjusted EBITDA. The company is guiding for midpoint revenue of $2.525 billion next quarter, and midpoint interest expense of $690 million—which would push its interest to revenue ratio up to 27.3%. With this, interest expense is expected to become an even more relevant line item while already putting significant pressure on profitability. 

The Neocloud Race: Balancing Surging AI Demand With Rising Debt and Circular Risk 

Overall, neoclouds clearly have significant growth momentum, with revenues and backlogs spiking, while attracting interest from investment-grade hyperscalers such as Microsoft and Meta, and AI labs including OpenAI and Anthropic. Access to leading Nvidia systems, and GPU utilization advantages make neoclouds an option for hyperscalers looking to quickly scale AI compute capacity. 

At the same time, the mismatch between operating cash flow and capex is causing debt levels to rise rapidly, which is a dynamic that is unlikely to change in the near term. Elevated interest rates remain an external risk, while circular financing raises questions around the degree to which neocloud growth depends on Nvidia’s capital support, and the extent to which Nvidia’s GPU demand is increasingly tied to the neocloud model. 

As Q2 wraps up, I/O Fund is preparing to identify the next wave of AI winners in our upcoming Top 15 AI Stocks for Q3 2026 report, with coverage across AI networking, memory, energy, custom silicon, and the infrastructure bottlenecks driving the next leg of the trade. 

Premium Members will also receive upcoming thematic reports on the latest shifts in AI networking and a new catalyst we believe could become one of the more important opportunities in the second half of the year. 

We publish more than 100 paywalled articles each year on AI stocks, supported by an actively managed portfolio and real-time trade alerts.

Don’t miss out on the AI trade 👉 Join I/O Fund Premium today.oin I/O Fund Premium today.

Please note: The I/O Fund conducts research and draws conclusions for the company’s portfolio. We then share that information with our readers and offer real-time trade notifications. This is not a guarantee of a stock’s performance and it is not financial advice. Please consult your personal financial advisor before buying any stock in the companies mentioned in this analysis. Beth Kindig and the I/O Fund own shares in NVDA at the time of writing and may own stocks pictured in the charts.  

Leo Miller, AI and Semiconductor Investment Writer at I/O Fund, contributed to this analysis. Leo Miller owns shares of NVDA and META.

👉🏻 Share with a Fellow Investor
He
are with a Fellow Investor
H
elp someone else benefit from this insight.

Recommended Reading:

CoreWeave: Revenue Inflecting in 2H, Margin and Profit Questions  

CoreWeave’s Q1 was a bit of a mixed bag, with the company beating revenue estimates by 5.5% yet guiding Q2 revenue roughly (6.5%) below consensus. Despite the soft guide, management maintained its full year guide at $12 to $13 billion, suggesting a strong ramp into the back half of the year, with revenue forecast to accelerate more than 80 points from Q2’s guided 108% to 190% by Q4.  

Margins contracted across the board in Q1, with adjusted operating margin coming down 16 points YoY to just 1%. Similar to revenue, management remained optimistic on the margin front, projecting 2H operating income growth of >11X versus 1H, and a return to low double-digit adjusted operating margins by Q4. 

Looking through 2026 and 2027, CoreWeave is targeting a rather aggressive ramp in active power, noting that it expects to have a “substantial majority” of its 3.5GW contracted power pipeline become active by the end of next year. For context, CoreWeave currently has >1GW active, adding roughly 150MW in the quarter. Bringing new capacity online is imperative for CoreWeave, as despite its backlog rising 49% QoQ to almost $100 billion, current backlog conversion looks to be largely priced in.  

The challenge remains capex and the strain it is placing on CoreWeave’s balance sheet. Part of the reason that CoreWeave saw weak price action after the report is they raised fiscal year capex; “For the full year, we now expect CapEx of $31 billion to $35 billion. The increase on the low end from our previous guidance is related to increases in component pricing.” 

To simplify this, CoreWeave needs a euphoric market environment for the stock to do well (and likely one where interest rates are going down), as for every $1 made about $2 is spent in capex. The concern is when does the bleeding stop, or will CoreWeave remain on a never-ending build cycle given the rapid iterations around GPUs and system components.  

The second concern is the supply environment is becoming trickier with the increasing complexity of AI systems. CoreWeave’s management described this best when it was stated: “Like the truth of the matter is the limiting factor isn't just power, it's labor, it's memory, it's storage, it's our ability to bring up infrastructure.” Each of those introduces an element of risk, more so when you are upside down on capex. 

CoreWeave is No Longer Just a GPU Provider 

As we pointed out a year ago in our analysis CoreWeave: AI Infrastructure Built for the Next Decade; Upside Down Business Model:  

“CoreWeave brands itself as the world’s first “AI hyperscaler” as they offer both infrastructure and a software platform for developing large language models and deploying them. Being dubbed an AI infrastructure player means CoreWeave must offer a compelling value proposition to attract business from arguably the largest competitors in the world – AWS, Microsoft Azure and Google Cloud. In its S-1 fling, the company points out it was built for AI workloads as opposed to the legacy cloud infrastructure-as-a-service providers that were primarily optimized for the cloud software era and e-commerce era. CoreWeave also asserts that outdated cloud infrastructure leads to lower utilization rates when you factor in usage. its S-1 fling, the company points out it was built for AI workloads as opposed to the legacy cloud infrastructure-as-a-service providers that were primarily optimized for the cloud software era and e-commerce era. CoreWeave also asserts that outdated cloud infrastructure leads to lower utilization rates when you factor in usage.  

The company also offers proprietary software to help achieve higher total system performance and more favorable uptime relative to competitors.” 

This quarter, CoreWeave highlighted more progress in its full-stack software approach, offering customers a higher degree of flexibility in consumption. CoreWeave introduced Flex Reservation and spot pricing this quarter, which aim to help customers budget for and manage unpredictable bursts of demand, with both of these new offerings “immediately oversubscribed.” CoreWeave also recently launched CoreWeave Interconnect in collaboration with Google Cloud, following its SUNK Anywhere and LOTA Cross-Cloud offerings.  

These three services aim to minimize friction in managing multi-cloud environments, helping organizations run AI workloads anywhere in the cloud. CoreWeave says the three “are already proving to be highly effective at capturing increased wallet share.” 

Outside of GPUs, CoreWeave is also seeing strong momentum in CPUs, networking and storage, with both CPUs and networking similarly expected to exceed $100 million ARR and storage noted to be multiplying quickly. Overall, these still remain just a tiny fraction of CoreWeave’s ARR.  

Hyperscalers Becoming CoreWeave’s Main Customers 

CoreWeave’s main value proposition lies within its ability to offer high GPU utilization rates, early access to next-gen systems such as Vera Rubin, and circumventing the hypervisor layer with bare metal servers. However, infrastructure is likely to weigh on margins (and currently is), which is why CoreWeave is aiming to pivot towards a SaaS-augmented model with Omni.  

CoreWeave says Omni enables them to “deploy and operate our full cloud stack in customers' own data centers with their GPUs,” with early interest said to be strong across cloud, enterprise and sovereign customers. While this opens the door for CoreWeave to build higher-margin, recurring revenue streams at third-party data centers on third-party-owned GPUs, layering in on top of its core GPU rental model, the main challenge with this approach is that its main customers are hyperscalers, who do not need this offering.  

For example, Meta and OpenAI are CoreWeave’s two largest customers, contributing ~65% of revenue in Q1, with contractual obligations worth roughly $57.6 billion in total or well over half of its backlog. CoreWeave also has a unique relationship with Google, selling capacity to Google Cloud which will then resell that to OpenAI.  

Although CoreWeave believes its customer base is beginning to diversify, such as with financial services approaching $10 billion, and ten customers committing to >$1 billion in spending, the overall nature of its business remains highly concentrated in the hyperscalers. Thus, the company’s target customer, one that needs both compute and high-margin software add-ons, is not appearing in its current customer base. Realistically, this presents a major challenge of how CoreWeave will be able to monetize a SaaS offering considering two-thirds of its business lies within customers who likely have no need for it.  

Targeting Aggressive Ramp in Power; Carries Execution Risk 

CoreWeave is targeting an aggressive ramp in active power over the next 18 months, as it aims to convert a “substantial majority” of its 3.5GW contracted power pipeline over to being active and revenue-generating. This is part of CoreWeave’s broader goal of reaching >8GW of active power by 2030, or an 8X increase over the next four years. The main question that this begs is how CoreWeave can sustain the level of capex needed for such an aggressive ramp.  

As of Q1, CoreWeave surpassed 1GW of active power, adding more than 150MW during the quarter, while simultaneously increasing its contracted power to 3.5GW, up more than 400M during the quarter.  

Breaking this down, and assuming that management’s commentary applies only to the 3.5GW figure and not subsequent intra-quarter increases in the contracted power pipeline, we can roughly estimate CoreWeave’s trajectory and potential capex costs associated with this buildout. 

Under that framework, and assuming “substantial majority” equates to ~80% of the 2.5GW of contracted but not yet active power, this would estimate CoreWeave bringing on 2GW of new active power by year-end 2027, taking total active power to 3GW. This would be roughly 3X its current capacity. 

Management stated in Q1 that they “remain firmly on track to reach or exceed our target of more than 1.7GW by the end of 2026,” so the above assumption would represent a sharper acceleration of capacity additions in 2027, requiring around 1.3GW of new additions if the 1.7GW active power target is met. However, some analysts are expecting a much more rapid ramp in power, with Oppenheimer penciling in potential new additions of 1GW by Q3 2026. 

CoreWeave also shed a bit more light over its power strategy: “We plan to continue to expand our contracted power footprint through leases while also accelerating our development of self-build sites, which will provide us with greater operational control and long-term financial upside. We expect our first self-build site to come online later this year.”  

CoreWeave’s Leasing Strategy Reduces Capex Shock, But Adds Counterparty Risk 

There are a couple of puts and takes to this approach, notably that the lease-based approach can offer a faster time to power with lower capex, while also opening the door up to execution risk from its counterparts. For example, it was reported in December that Core Scientific’s facility in Texas faced a two-month delay due to weather, with this spilling over to CoreWeave as a result (per management on Q4’s timing miss: “the delays in powered-shell delivery associated with the data center provider will have an impact on our fourth quarter results.”) 

However, the benefit of this lease-heavy approach is that it offers CoreWeave a higher degree of financial flexibility when it comes to managing its balance sheet, which is in rather rough shape with less than $2.3 billion in cash to nearly $25 billion in debt.   

Connecting CoreWeave’s active power target to its projected capex for 2026 illustrates why it is opting to go the lease route versus prioritizing primarily greenfield development.  

This is evident when viewing this via the lens of its deal with Core Scientific. Under that deal, CoreWeave is paying $1.5 million per MW in capex during development; this would project CoreWeave’s capex obligations to be roughly $525 million for the remaining ~350MW of capacity Core Scientific has yet to deliver. 

Compare this to a greenfield 350MW build with construction costs of ~$11 million per MW. Such a build would cost CoreWeave $3.85 billion, meaning the lease approach saves it roughly 86% on capex. This also allows CoreWeave to funnel a majority of its capex dollars into high-end GPUs – at current estimates for GB300 GPUs to cost $33 million per GW per Morgan Stanley, CoreWeave could outfit a 350MW facility with GB300 racks for $11.55 billion, versus around $15.4 billion from the ground-up, or savings of ~25%. For CoreWeave, every dollar of savings matters in this buildout.  

In total, bringing on 2GW of power by the end of next year, such as what we outlined above, could cost ~$66 billion via primarily leases (where capex goes almost directly to GPUs), or $88 billion including construction for GB300 capacity. With Rubin estimated to cost $41 million per MW, per MS, costs could reach $82 to $104 billion for 2GW.  

Interest Payments Surging to $2B Annualized 

The reason that every dollar matters for CoreWeave is tied to its debt, as the company is forking out nearly $2 billion annualized as of Q1 on interest payments, with this figure only set to rise further in Q2. This is one of the core problems with utilizing debt to fund its buildout – interest payments are rising faster than revenue, and reductions in the weighted cost of debt, stated as an 80 bp reduction year-to-date, are not yet enough to slow this train down.  

For Q1, CoreWeave’s net interest payments reached $536 million, or more than $2 billion annualized, rising more than 38% QoQ. For Q2, CoreWeave guided for interest payments to be $650 to $730 million, or up nearly 29% QoQ, and moving up to almost $2.8 billion annualized with no real signs of slowing. On a YoY basis, interest payments will be up more than 2.5X next quarter.  

When looking at CoreWeave’s projected capex needs for 2026 – not even including 2027, which is likely to be much higher considering the active power goals management has laid out that – alongside its thin balance sheet with debt 11X more than its $2.27 billion in cash, it’s clear that CoreWeave is not close to breaking this cycle.  

With nearly 90% of its debt carrying >6% to 15% interest rates and not maturing until 2029 at the earliest, this cycle has years to continue.  

Backlog Reaches a Record $99.4 Billion, Fully Priced In? 

CoreWeave reported record revenue backlog additions in Q1 as it began signing initial Vera Rubin deals, while contracting out capacity expected to come online in 2027. Notably, CoreWeave is largely sold out of 2026 GPU capacity, providing a high degree of visibility into this year’s revenue and ARR guidance, with potential for upside if capacity can come online faster.  

Backlog reached $99.4 billion in Q1, up 284% YoY and nearly 49% QoQ, accelerating from 20% QoQ in Q4 and driven by substantial growth from both existing and new customers. Management added that the backlog is all tied to contracts either currently online, or expected to come online in 2026 or 2027.  

For additional color on backlog, CoreWeave expects 36% of this backlog to be recognized as revenue over the next 24 months, representing roughly $35.8 billion.  

Looking ahead to Q2, backlog should move substantially higher as CoreWeave closed a deal with Meta worth $21 billion through 2032, a $6 billion deal with Jane Street (who is also backing CoreWeave with a $1 billion equity investment), and a multi-year deal with Anthropic in April. 

Turning briefly to ARR, CoreWeave inched its 2026 ARR target higher, now projecting to exit the year with annualized revenue of $18 to $19 billion, raised from $17 to $19 billion previously. Management opted to maintain its 2027 exiting ARR guide at $30 billion, adding that 75% of that ARR is already contracted and booked.  

The challenge here is that CoreWeave’s backlog conversion and ARR targets roughly line up with consensus estimates, suggesting that growth is currently priced in. Taking Q1’s $2.1 billion in revenue with the entirety of the expected backlog conversion (although a portion will be recognized in 2028) equals out to $37.9 billion, whereas current consensus estimates point to 2026 and 2027 combined revenue of $37.6 billion.  

For ARR, CoreWeave’s exit ARR target of $18.5 billion for 2026 suggests December 2026 revenue of $1.54 billion, which, based on ramp dynamics, would likely project Q4 revenue to be around $4.4 billion. This is below current estimates for $4.56 billion in revenue in Q4. The same applies for 2027’s exit ARR of $30 billion, which projects December 2027 revenue of $2.5 billion, or Q4 2027 revenue around the $7.3 billion range. This again is below current estimates for $7.57 billion.  

The takeaway here is that CoreWeave has to build and expand capacity at a quicker rate, placing much more emphasis on capex and funding needs, given current revenue targets over the next seven quarters already look to be largely priced in. Management stated that they have “already secured sufficient power capacity to deliver on our 2027 [ARR] target and expect to continue to add new capacity and customer commitments,” yet that power still has to be brought online and become revenue-generating. 

Financials 

Revenue Misses Estimates yet Growth to Inflect into 2H 

While CoreWeave reported a solid 5.5% beat to revenue estimates in Q1, its Q2 guidance fell short of the mark, with the neocloud guiding for revenue nearly (6.5%) below consensus at midpoint. 

Q1 revenue increased 111.7% YoY to $2.08 billion, maintaining a similar YoY growth pace as the prior quarter. On a sequential basis, Q1 revenue increased 32.2% QoQ, a sharp acceleration from Q4’s 15.2% QoQ print. Strong pricing trends aided growth in the quarter, as CoreWeave noted that “average pricing for the A100s, H100s and H200s and L40s all increased QoQ,” while near-term capacity remains largely sold out. 

For Q2, CoreWeave guided for revenue to be $2.45 billion to $2.6 billion, roughly (6.5%) below consensus estimates for $2.7 billion at midpoint. This would project a slight deceleration in YoY growth to 108.2%, while QoQ growth would also moderate back to 21.5% QoQ.  

Management was straightforward in saying that they do expect revenue to inflect as they cross from Q2 into Q3, setting the stage for a stronger 2H. Given the full-year guide of $12 to $13 billion, CoreWeave is looking at around $7.9 billion in 2H revenue given the implied 1H revenue of $4.6 billion. Current estimates have 2H plotted out (with a bit of upside at $8 billion) at $3.47 billion in Q3 for 154.2% YoY and 37.2% QoQ growth, and $4.56 billion in Q4 for 189.9% YoY and 31.4% QoQ growth. 

This acceleration into 2H is tied to a few factors, with the first simply being CoreWeave’s active power ramp translating to a larger installed base for it to generate revenue from. It is also supported by strong pricing dynamics with management noting that prices were rising across the board for Ampere, Hopper and Blackwell GPUs, as well as a potentially larger mix of higher-priced Blackwell Ultra instances entering the fray. Pricing strength is extending into 2027 as CoreWeave begins to contract out next year’s capacity, providing more legs for revenue growth to remain strong. 

Margin Questions Remain, though Expectations of Improvement in 2H 

Q1 showed a rather bleak picture for margins, with contraction appearing across the board from gross to net margins. However, management expects Q1 to be the trough for margins for the year, with the largest inflection expected to occur crossing from Q2 to Q3, similar to revenue. Management also reaffirmed that they remained on track for sequential margin expansion through the rest of the year.   

Q1 gross margin was 66%, down seven points YoY and two points QoQ. Management chalked this up to timing of capacity and scale. For the timing point, management explained that during data center fit-out for leased capacity, it incurs lease, power and depreciation expenses for one to two months before revenue generation begins. For scale, management explained “So if you think of it as we're running 50 megawatts, and we add 300 megawatts in a quarter, the impact on gross margin is going to be enormous. On the other hand, when you're running 2,000 megawatts and you add 50 megawatts, it's not going to have as material an impact on your gross margin.” 

Q1 GAAP operating margin was (7%), down four points YoY and one point QoQ. Adjusted operating margin was 1%, in line with management’s guide and contracting 16 points YoY and five points QoQ. For Q2, adjusted operating margin was guided to be roughly 2.4% at midpoint, a slight sequential expansion yet still down more than 13 points YoY – more on this and 2H dynamics below. The difference between the two margin figures boils down to SBC. 

Q1 GAAP net margin was (36%), down four points YoY and seven points QoQ. Adjusted net margin was (28%), down 13 points YoY and 10 points QoQ. 

Double-Clicking on Margin Dynamics 

Q1’s call featured some discussion about CoreWeave’s margin trajectory given the Q1 contraction, signs of inflection in Q2 and management’s expectation to return to low double-digit adjusted operating margin by Q4. This would represent more than 10 points of expansion relative to Q1.  

To put this in dollar form, CoreWeave delivered $21 million in adjusted operating income in Q1, guided for $60 million at midpoint in Q2, and maintained its FY26 guide for $1 billion at midpoint. This suggests 2H adjusted operating income of $919 million at midpoint, or >11X what CoreWeave delivered in 1H. Rightfully so, analysts questioned about this sharp inflection and why management has conviction in achieving this, with CFO Nitin Agarwal stating that it comes down to executing its plan of ramping active power, and seeing adjusted operating income begin to outpace revenue growth in 2H. 

On the point of operating margins, CoreWeave downplayed the impact of rising component costs, such as memory. While component price inflation was a factor in the slight FY26 capex raise from $32.5 billion to $33 billion, management emphasized that deal pricing means any such costs are effectively passed on through to customers: 

“We build our contracts to incorporate the cost of all of the components that are necessary to deliver infrastructure. And so by and large, we are insulated from the price inflation on some of the components because we include that in our pricing that we ultimately bring to clients in order to target the margins that Nitin spoke to, right, is up in the mid-20s is how we think about it on a unit basis. … 

And so we've done a really good job of understanding what the components and electricity costs are going to be, we have it structured so that it is effectively passed through when we enter into the contract once again, to ensure that we're able to hit our targeted margins on a unit basis.” 

EPS and Adjusted EBITDA 

Considering the margin contraction this quarter, CoreWeave reported larger losses than expected this quarter. FY26 and FY27 revenue revisions over the past six months illustrate how much farther CoreWeave has moved from profitability, emphasizing that this path remains challenging. 

Q1 GAAP EPS was ($1.40), coming in below the ($1.20) estimate. Q1 adjusted EPS was ($1.12), missing the ($0.91) estimate by more than 22%, and widening from ($0.61) a year ago. 

Q2 is expected to see minimal improvement, with GAAP EPS projected to be ($1.24) and adjusted EPS projected to be ($1.03). Despite the expected progress on the margin front, CoreWeave is estimated to remain unprofitable this year, with Q4 adjusted EPS currently projected to be ($0.34). 

To illustrate how much further CoreWeave has moved from profitability, its FY26 adjusted EPS estimate now sits at ($3.29), down from ($0.23) in November. For FY27, adjusted EPS estimates sit at ($0.63), down from $2.26 in November, with profitability not projected until Q4 FY27. This is likely driven by a handful of factors – gross margin compression from timing of bringing capacity online, possible impacts to gross margin from higher power prices, increased D&A hitting the opex line via technology and infrastructure expenses as CoreWeave expands its GPU fleet, component price inflation, and ballooning interest pyaments weighing on widening operating margins. It’s also important to note that specifically for component pricing, it’s likely that we are currently just seeing a baseline: “Having said that, in the last 6, 9 months, there has been an acute shortage of certain components that have moved up.” 

Turning to adjusted EBITDA, CoreWeave reported $1.16 billion in Q1 for a 56% margin, down six points YoY and one point QoQ. 

Cash Flows, Balance Sheet in Rough Shape due to Elevated Capex Needs  

As expected, CoreWeave’s cash flows and balance sheet are in rather rough shape, though the company highlighted that it has no debt maturities until 2029 aside from self-amortizing contract-backed debt and OEM vendor financing. This gives some leeway for revenue to scale and cash flows to (hopefully) begin improving to help service debt, considering interest payments on said debt are now running at more than $2 billion annualized and expected to reach above $2.5 billion annualized next quarter. 

Q1 operating cash flow was $2.98 billion for a 144% margin, driven primarily by depreciation and changes in accounts receivable. This improved from a 99% margin in Q4 and a 6% margin a year ago. 

Q1 free cash flow was ($4.71 billion) for a (227%) margin, widening from a (159%) margin in Q4 and (137%) a year ago. Capex was $7.7 billion in the quarter, while Q2 capex was guided to be similar at $7 to $9 billion. 

Cash totaled $2.27 billion while debt reached $24.86 billion. Debt will move higher in Q2 as CoreWeave closed a $3.1 billion loan in mid-May as well as $4.5 billion of senior notes in April. Management commented in Q1’s call that they have reduced the cost of debt by 80 bp year to date, though interest expenses are still rising. Overall, CoreWeave has raised >$20 billion year-to-date, including the “first ever investment-grade Delayed Draw Term Loan backed by HPC infrastructure, achieving an A- equivalent rating from Moody's, Fitch, and DBRS.”  

Conclusion 

There are two ways to view CoreWeave, and both deserve a discussion, as the company is at the intersection of the quality AI trade and AI hype. At one point, we had CoreWeave on a Top 15 list, yet as more circular investments unfolded and capex ballooned relative to revenue, our process, which is to seek strong fundamentals, caused us to drop the stock from the list. That circularity is intensifying, as even its non-hyperscaler customer Jane Street is providing a $1 billion loan on a $6 billion sale.  

Key supplier Nvidia also bought another $2 billion in CoreWeave shares in Q1, which creates a triangle where Nvidia’s is the supplier, investor and customer. Right now, the economics are such that 2026 capex is $30-$35B versus $12.5B in revenue at the midpoint, or about $2.60 in capex for every $1 of new revenue. Another risk to consider is CoreWeave’s ARR targets, as 2026 and 2027 targets both suggest potential Q4 revenue this year and next a bit below current consensus estimates, placing the emphasis on accelerating its buildout, and thus capex, to fuel higher growth. 

Overall, macro may matter more to CoreWeave than any of the stock-specific information above. As a heavily debt-funded, long-duration cash-burn story, it will do better in a lower-rate environment. For this stock, if we do enter, it will be 90% technicals.

Please note: The I/O Fund conducts research and draws conclusions for the company’s portfolio. We then share that information with our readers and offer real-time trade notifications. This is not a guarantee of a stock’s performance and it is not financial advice. Please consult your personal financial advisor before buying any stock in the companies mentioned in this analysis. Beth Kindig and the I/O Fund do not own shares in CRWV at the time of writing and may own stocks pictured in the charts.

Damien Robbins, Equity Analyst at I/O Fund contributed to this analysis.

Recommended Reading:

AMD, Nvidia, Arm, Intel: Inside the $120 Billion CPU Gold Rush

Three months ago, GPUs were all the rage, and the idea that CPUs could challenge GPUs when it comes to AI budgets was unfathomable. The shift in this perception is evident not only in management commentary, but also in CPU design companies and OEMs raising forecasts that are now 2X+ higher, as many of the largest players have stated they did not foresee the magnitude of the surge in CPU demand from agentic AI. 

In just six months, AMD has issued a massive increase to its server CPU market forecast, nearly doubling its expected CAGR to 35%—estimating that the market will eclipse $120 billion by 2030. Arm made a similar announcement in March, projecting that the total addressable market (TAM) for data center CPUs will grow to over $100 billion by its fiscal year 2031 (roughly calendar year 2030). This would represent a more than 4X increase over its current TAM estimate of $24 billion, equating to a 33% CAGR. 

An important shift is driving these forecasts as the AI market transitions away from chatbots, which saw a CPU-to-GPU ratio that was heavily weighted toward GPUs from 2023-2025. As we move into agentic AI, an Intel and Georgia Tech paper has stated that “tool-dominated agentic AI workloads are significantly bottle-necked" with CPUs consuming up to 88% of the end-to-end latency. The paper further concludes that “with better quality GPUs, the bottleneck can swiftly shift more towards CPUs.” 

What Intel and Georgia Tech are referring to, is that to scale agentic AI efficiently, CPU orchestration capacity will need to catch up to GPU reasoning capacity to minimize latency and prevent GPU underutilization. The answer to this problem is increasing the CPU-to-GPU ratio in AI clusters to keep token costs down.  

Below, I break down why CPUs are positioned to take a larger share of AI cluster bill of materials (BOM) and the explosion in demand we are already seeing. I examine server CPU forecasts that indicate this market will continue to grow rapidly over the coming years. Lastly, I look at the competitive dynamics and key players in this space, and how Nvidia is playing both sides of the CPU-GPU equation, and what front runners Intel and AMD are doing to maintain their lead.  

Ultimately, CPUs have gone from an afterthought to becoming the AI trade’s next great bottleneck – and with AMD, Nvidia, Arm and Intel circling a market that is doubling nearly overnight, the only question left is which company walks away with the lion’s share.

Why Agentic AI Is Driving a Massive Shift to CPUs 

Agentic workloads are structurally different from non-agentic workloads like chatbot queries, which is what has dominated the AI trade up to this point. Chatbots respond to simple requests and provide an output, moving at the pace of the human on the other side. Agents are far more complex, handling hundreds of concurrent tasks autonomously and reasoning through a problem to reach a conclusion, often with limited direction from humans. 

The Intel and the Georgia Tech paper highlights why CPUs are becoming increasingly important as agentic AI proliferates. Researchers noted that while CPU-GPU systems are needed to serve the diverse responsibilities of agents, the “majority of the external tools responsible for agentic capability either run on or are orchestrated by the CPU.” This is not the case in non-agentic workloads, where GPUs are the workhorses that CPUs feed data to. 

Why CPUs Handle Orchestration in AI Workloads 

The key bottleneck this creates on AI infrastructure is orchestration—or the need to call tools, direct API requests, and coordinate tasks between dozens of independent agents. Orchestration is where CPUs thrive. GPUs continue to handle inference reasoning, but CPUs tell GPUs where, when, and how to allocate their resources. 

As AI progresses over the next few years, inference demand is expected to explode—largely driven by agentic AI. Goldman Sachs estimates that by 2030, agentic AI will drive a 24X increase in total token consumption versus today to 120 quadrillion tokens per month. Its forecast shows agentic workloads accounting for over 80% of token consumption in 2030—dramatically higher than their share today.

mid

TrendForce notes that today, the CPU-to-GPU ratio in AI data centers sits between 1:4 and 1:8. For agentic AI applications, TrendForce sees the CPU-to-GPU ratio moving “to between 1:1 and 1:2, significantly boosting market demand for CPUs.”

Other forecasts, like those from Arm, rely on the CPU core count per GW metric. This measures the number of CPU cores per unit of data center power, regardless of the discrete number of CPUs. It is the more accurate way to measure the shift in CPU demand as chip density is increasing, with upcoming generations featuring higher core counts per chip. 

Notably, Arm CEO Rene Haas sees agentic AI driving CPU core demand as much as 4X higher to 120 million cores per GW, compared to around 30 million cores per GW today. Aside from the raw increase in core demand, packing more cores into each chip is a margin expansion opportunity for CPU designers. 

CPU Shortages: Supply Constraints and Pricing Power 

We are already seeing the CPU bottleneck start to play out through worsening CPU server shortages. Reuters reported in February that Intel has a substantial backlog of unfulfilled CPU orders, and that delivery times stretch as long as six months. It also noted delivery times for some AMD products of between eight and ten weeks. KeyBanc issued upgrades on Intel and AMD in January, noting that both firms were nearly sold out of CPU servers for 2026. At the time, KeyBanc noted ASP increases of 10% to 15%. 

Intel and AMD Backlogs and Lead Times 

It appears that the situation has become even more dire since, based on several reports from late May. Reuters now says that TikTok parent company ByteDance is working to accelerate its in-house CPU efforts, as Intel and AMD have raised prices by between 10% and 35% QoQ. ByteDance’s move suggests that it sees a prolonged CPU shortage, leading it to lean into this early-stage initiative. This adds weight to the structural increase in CPU demand implied by AMD’s forecast and shows the pricing power that CPU vendors are exerting.

Electronic equipment distributor Fusion Worldwide says that Intel distributors are only fulfilling around 40% of their yearly backlog allocations. It highlights lead times of 8 to 22 weeks domestically, with Asian customers waiting as long as 8 months. Overall, the firm estimates that Intel is under-shipping real demand by 20% “at best." It notes that AMD’s EPYC CPUs are effectively sold out in 2026, with delivery windows stretching more than 30 weeks. 

The Elec, a South Korean electronics industry trade publication, notes won-denominated price increases as high as 3X for some x86 (Intel and AMD) CPUs. This comes as Intel and AMD prioritize supply for U.S. hyperscalers—leaving little capacity for other customers. The Elec also said that the expected timeline for mass production of Intel’s next-gen Xeon 7 “Diamond Rapids” CPU has been delayed, moving from the second half of 2026 to the middle of 2027.

This data points to a shortage that is intensifying, putting pricing power into the hands of CPU vendors as they seek the highest-margin opportunities. 

AMD Sees Record CPU Server Sales, TAM Estimate Doubles to $120B 

The cause of these shortages is the rapid growth in server CPU demand seen at top players like AMD, and expectations that this market will grow much faster than it traditionally has over the coming years. AMD released its Q1 2026 results in early May, posting its fourth consecutive quarter of record server CPU revenue. Sales rose more than 50% YOY, with both cloud and enterprise end markets up over 50%. AMD expects growth to accelerate significantly in Q2, projecting server CPU revenue growth above 70% YOY, “with robust growth continuing through the second half of 2026 and into 2027.” 

Citing this acceleration in demand and the structural increase on CPU compute requirements that agentic AI is putting on data center infrastructure, AMD has doubled its server CPU TAM estimate. Per CEO Lisa Su, the company anticipates that this will be an over $120 billion by 2030—growing by a 35% CAGR. In November, AMD’s server CPU growth TAM CAGR forecast was just 18%. AMD’s decision to double its market growth forecast and add $60 billion to its TAM in just seven months demonstrates how rapidly current demand signals are translating to long-term confidence among industry leaders. 

Beth Kindig of the I/O Fund discussed in 2024 why AMD would be a winning AI stock and surpass Nvidia's returns over a 3-year time frame. Since then, Nvidia returned 80% and AMD has returned 220%

Thinking about margins going forward, AMD noted at the Bank of America 2026 Global Technology Conference that two-thirds of its server CPU growth in Q1 and expected growth in Q2 are coming from unit increases. Thus, units rather than ASPs are the primary growth driver. Given the worsening supply and demand gap, it’s possible that ASPs could drive an increased share of growth—providing a further lever for margin expansion. 

Server CPU Market Growth Forecasts Surging TAM 

Notably, server CPU TAM forecasts among several Wall Street banks line up with AMD’s forecast. For reference, AMD’s forecast implies a 2025 TAM of just under $27 billion. 

UBS projects that the market will grow from $31 billion in 2025 to $170 billion in 2030, or a 40.6% CAGR. It sees AI CPUs driving the vast majority of this growth, with the TAM increasing from $7 billion to $125 billion, or an 88% CAGR. Their forecast also includes a 56% increase in AI CPU ASPs over this period—implying a significant margin expansion opportunity. 

CPU TAM Revised Higher by Analysts 

Bank of America forecasts a TAM expansion from $43 billion in 2026 to $125 billion in 2030, or a CAGR of 30.6%, recently raising its 2030 estimate from $110 billion. While BofA’s growth rate is lower than AMD’s, this is likely because it accounts for the particularly high growth rates already being seen in 2026. 

Citi breaks down its forecast into three buckets: general purpose CPUs, AI head nodes, and agentic CPUs. It sees the overall market growing from $29.3 billion in 2025 to $132 billion in 2030, or a 35% CAGR. Within this, general purpose CPUs grow by a 20% CAGR to $50.9 billion, and AI head nodes grow by a 21% CAGR to $21.1 billion. Citi estimates that agentic CPU growth will drastically outpace the rest of the market, hitting $59.4 billion in 2030 for a massive 185% CAGR. Overall, the estimates from these three banks circle around the 35% CAGR that AMD outlined. 

Why Growth Rates Are Unprecedented for CPUs 

These very high CAGR forecasts highlight why server CPU shortages are escalating. This market has historically experienced single-digit annual growth rates. Thus, the supply chain was not necessarily prepared for a scenario where customers suddenly look to procure CPUs at a drastically higher pace, and long-term expected growth rates soar in a matter of months. 

AMD’s Goal: 50% Server CPU Market Share 

As AMD looks to increase its share of the CPU market to over 50% by 2030, it is targeting all three of the CPU categories Citi described. This will come through its Venice family of EPYC CPUs, including Verano, its first EPYC CPU purpose-built for AI infrastructure. AMD has begun to ramp production of Venice, while it plans to launch Verano in 2027. 

With this, AMD clearly expects CPUs to be a core growth driver over the coming years. If AMD achieves a 50% market share in the server CPU market, it would imply $60 billion in annual revenue. With server CPUs representing around half of data center revenue, this side of AMD’s business generated approximately $2.9 billion in revenue last quarter, or nearly a $12 billion run rate. Thus, hitting its $60 billion target would require a 5X increase in server CPU sales by 2030—an ambitious goal.

AMD vs Intel: x86 Market Share Dynamics 

There are two ways to think about market share in server CPUs. Mercury Research is one of the key authorities that estimates share in this space, with their estimates often centered around the x86 market. 

AMD is already very much in range of a 50% market share within x86. At its Investor Day, AMD noted that based on metrics from Mercury Research, its share of the server CPU market was around 40%. This lines up with Mercury’s estimate of AMD x86 market share of 41% at the time. Since then, AMD has gained considerable ground on Intel. Mercury Research estimates that AMD controlled 46.2% of x86 server CPU revenue share in Q1 2026 to Intel’s 53.8%. At this pace, AMD is well on its way to achieving a 50% market share in x86.

AMD data center revenue growth and server CPU market share approaching 40 percent shown at Investor Day 2025

At Investor Day 2025, Lisa Su said AMD has a clear path to capturing more than 50% of server revenue market share, up from 40% today, alongside a 50% data-center CAGR and a goal of 40% PC revenue share.

AMD, Intel and Arm Market Share Dynamics 

Arm estimates that in terms of chip value, it held 20% of the cloud compute market share at the end of its fiscal year 2025, which ended in March 2025. Considering Mercury’s estimates on x86, or the 80% of the market that is not Arm-based, these figures imply overall market shares of 43% for Intel, 37% for AMD, and 20% for Arm. However, note the figures from Arm are stale. 

Thus, AMD would need to increase its market share by around 2.6% annually through 2030 to achieve its 50% goal. At least in the x86 market, AMD has cleared a much higher bar over the past several years. In Q2 2023, the company’s server CPU revenue share was just 25.1%, meaning that AMD increased its share of the x86 market by more than 7% annually through Q1 2026.  

While this historical pace is encouraging, it shows AMD’s progress only against Intel—not including Arm’s traditional IP business, nor its move to become a CPU designer through its Arm AGI CPU. Additionally, Nvidia is pushing more aggressively into the CPU market, largely through its standalone Vera racks. However, the Diamond Rapids delay is one factor that could give AMD a leg up in continuing to take share from Intel. 

AMD has its hands full as some of the world’s strongest IP and chip-design companies are targeting the same TAM – including the incumbent Intel, mobile-IP superstar Arm, and the newest entrant, Nvidia. 

Nvidia’s CPU Strategy: Expanding Beyond GPUs 

Within AI-specific infrastructure, CPUs have been traditionally deployed as AI head nodes paired with GPUs in the same rack. A critical development to track is the emergence of standalone CPU racks as this marks a significant shift in architecture.  

Customers will increasingly be able to deploy full CPU racks independently without automatically having to increase GPU counts—one of the key arguments for why CPUs can increase their BOM share in AI clusters. 

Nvidia Vera Standalone CPU Rack Overview 

For example, Nvidia’s Vera rack marks the first time that it will market a standalone CPU rack; a clear signal of the current opportunity in this space. With 256 CPUs in the standalone Vera rack, customers can deploy nearly 7X more CPUs in one rack compared to the 36 CPUs in the Vera Rubin NVL72, which also contains 72 GPUs. Total CPU cores sit at 22,528 for the Vera rack versus 3,168 for the Vera Rubin NVL72. Note that Vera is based on Arm architecture, rather than x86 architecture. 

Arm specifically mentioned the standalone Vera rack as a reason why its 4X CPU core count growth estimate is likely conservative. Arm CEO Rene Haas said, “we probably have undercalled the CPU demand in terms of the transition here. We talked about a 4x increase. We could get our heads around a bigger number than that.”  

Haas went on to say that the number of CPU cores “probably will” exceed the number of GPU cores, even though the number of CPU chips may not exceed the number of GPU chips. 

Nvidia Quickly Eclipses AMD with $20 Billion in CPU Revenue in 2026 

Importantly, Nvidia said on its latest earnings call that the Vera rack opens up a $200 billion CPU TAM for the company—dramatically larger than AMD’s +$120 billion estimate. Within this, Nvidia says it has visibility into generating nearly $20 billion in CPU revenue this year, primarily for standalone Vera racks. Meanwhile, about 50% of AMD’s data center revenue comes from server CPUs, putting this at $2.9B or about a $12B run rate. I expect that to change but allows for a baseline comparison, which is that Nvidia is entering the market aggressively. 

When asked whether CPUs are cannibalistic to GPUs, Nvidia CEO Jensen Huang did not offer a direct yes or no, but framed CPUs as additive to GPUs. He argued that more AI agents require more orchestration—increasing CPU demand—but that more agents also require more inference—increasing GPU demand. This lines up with AMD CEO Lisa Su’s statements that CPUs are largely additive/incremental to their overall TAM.  

Additionally, the standalone Vera rack is just one of four ways that Nvidia targets the CPU market—and is the only one that could substantially change its current CPU-to-GPU ratio. Its other markets include selling head node CPUs paired with Rubin GPUs at a 1:2 ratio in the Vera Rubin NVL72. Nvidia also sells Vera alongside its ConnectX-9 SuperNICs for both storage and confidential computing use cases. 

Still, with the standalone Vera rack, Nvidia is indicating that it expects the CPU-to-GPU ratio to shift—creating a need for the product. Ultimately, while the mix of AI BOM should move toward CPUs, Nvidia is still positioned to capture growth from both chip types. It can benefit from the increasing size of the overall pie, rather than CPU spending going up at the expense of GPU spending. 

Arm Makes Historic Move into Merchant Standalone CPU Racks 

Arm is also forwarding the CPU rack approach through its AGI CPU. Leveraging Arm’s history of delivering high performance with low power requirements for mobile devices, the new AGI CPU is designed to offer a similar balance between high performance and low power consumption. 

The AGI CPU was co-developed with key partner Meta, the chip’s first customer, who revealed they turned to Arm almost two-and-a-half years ago to see if there was a CPU option that fit Meta’s needs: “put in a lot more cores per watt, but we do not want to compromise on the performance piece.” Meta had only been finding options satisfying one of the two criteria: meeting the performance but with too much power, or meeting the power but with too little performance. 

Arm CPUs Deliver Higher Performance Per Watt vs x86 

One of the main advantages that Arm touts is higher performance per watt. Based on internal estimates, the firm says the Arm AGI CPU can provide up to 2x greater performance per watt vs. Intel and AMD’s x86.  

Higher performance per watt is a key value proposition for hyperscalers, allowing more power to be dedicated to compute or networking equipment. 

Bar chart comparing Arm AGI CPU and x86 CPUs (with and without SMT) showing higher sustained performance per thread, threads per rack, and performance per watt for Arm in AI workloads

Bar chart comparing the performance of Arm’s AGI CPU against x86 CPUs (with SMT enabled and disabled) across three metrics: sustained performance per thread, sustained threads per rack, and performance per watt. Arm’s AGI CPU leads in all three categories, with roughly 1.2× higher performance per thread, up to 1.8–2.0× higher thread density per rack, and approximately 2× better performance per watt–highlighting Arm’s efficiency advantage in AI data center workloads, particularly for agentic AI applications where CPU orchestration, scalability, and energy efficiency are critical. Source: Arm Arm 

For more details on Arm, see my analysis from April: Arm Stock Could Win as Agentic AI Shifts the Bottleneck to CPUsArm Stock Could Win as Agentic AI Shifts the Bottleneck to CPUsArm Stock Could Win as Agentic AI Shifts the Bottleneck to CPUs 

In an air-cooled rack, Arm can pack 30 blades (or 60 CPUs) for a total of 8,160 cores in a 36kW power envelope, saying this configuration can deliver up to 2X the performance per rack versus x86 chips based on its internal estimates. Arm says this 30-blade design is “setting records for air cooled” racks that is not feasible with other systems, as power consumption is too high. 

Arm is taking this a step further with a fully-liquid cooled, 200kW open-standard rack in partnership with Super Micro, packing 168 blades, or 336 CPUs, delivering a total of up to 45,696 cores. Arm EVP of Cloud AI Mohamed Awad stated that while it is a “200-kilowatt rack. We actually will consume about half that much power. We ran out of space. That’s why we couldn’t put more cores in there.” 

This is one of the key advantages – it is not just about offering 2X the performance of x86 chips, but providing that performance boost while freeing up power for more compute or for more networking. 

Intel’s Fight to Maintain Server CPU Market Leadership 

Intel is positioning itself to be a stronger competitor in the server CPU market as it relates to agentic AI, announcing its intention to deploy rack-scale CPU systems at Computex. Intel’s new racks look to have quite an edge over Arm when it comes to core density, benefitting from its lead in cores at the individual chip level.  

Intel revealed two blueprints for its upcoming rack-scale CPU systems, with one design targeting maximum density and the other targeting latency-sensitive agentic AI workloads. The two designs can support 128 of Intel’s Granite Rapids Xeon 6 or Clearwater Forest Xeon 6+ chips, which will provide either 16,384 or 36,864 cores based on the chip of choice, alongside up to 384 TB of DDR5 memory per rack. 

Intel also leads on core counts at the individual chip level. Intel’s Xeon 6+ offers 288 cores per chip, slightly beating out AMD’s Venice at 256 cores and Arm’s AGI CPU at 136 cores; AMD has yet to release Verano’s core count. Despite the lead in core count, Intel’s Xeon 6+ only packs 288 threads whereas Venice offers up to 512 threads via multi-threading, allowing each core to handle two sets of instructions, reducing core idle time and increasing efficiency.

Bar chart comparing core and thread counts of major CPUs in 2026 including AMD EPYC Venice, Intel Xeon, Nvidia Vera, Arm AGI CPU, and hyperscaler chips like AWS Graviton and Google Axion

Bar chart comparing core and thread counts of major data center CPUs in 2026. AMD’s EPYC Venice leads with 256 cores and 512 threads, while Intel’s Xeon 6+ and Xeon 7 offer higher core counts at 288 but fewer threads due to no SMT. Nvidia Vera, AmpereOne, and Arm AGI CPUs have lower counts, while hyperscaler chips from AWS, Google, and Microsoft range from 64 to 192 cores. Source: TrendForce 

Intel vs Arm: Power Efficiency Battle 

Where Intel could find its edge in the rack-scale systems is power, with the blueprints fitting inside a 100kW power envelope. Compared to Arm, Intel is offering more than 368 cores per kW, while Arm’s AGI CPU is offering 228 cores per kW. This can also be viewed at the 200kW envelope of Arm’s AGI CPU, at which Intel could theoretically offer 73,728 cores across two 100kW racks, or more than 60% of Arm’s rack.  

This advantage stems from Intel’s 18A node, which in general offers up to 15% better performance per watt and up to 30% better density versus the Intel 3 node. Manufacturing on more advanced nodes is how x86 is fighting back against Arm – AMD’s Venice is the first CPU to ramp on TSMC’s 2nm (N2) process, which is designed to deliver 10%-15% higher performance at the same power level, or a 25%-30% reduction in power at the same  performance level.  

While Clearwater Forest just launched at the start of June, the most important part of Intel’s story is that its next-gen Xeon 7 ‘Diamond Rapids’ is rumored to be delayed. The new chip was originally expected to launch in the later part of 2026, yet is now expected to launch in 2027, giving AMD a bit more of a head start with Venice. 

CPUs Are the Next Major Bottleneck in AI Infrastructure 

It would be a mistake to think the AI trade begins and ends with Nvidia’s GPUs. Although GPUs are still the heart of AI compute, agentic AI is placing additional emphasis on making sure those accelerators do not sit idle while the rest of the system catches up. 

The addressable market is expanding overnight, as this no longer about adding a few more CPUs as head nodes next to GPU clusters. The bigger opportunity is the move to standalone CPU racks, which is a major architectural change that allows more orchestration capacity to be added without adding more GPUs at the same attach rate. Nvidia’s Vera rack is leading the way, with CEO Jensen Huang projecting roughly $20 billion in standalone CPU revenue this fiscal year, yet AMD, Intel, and Arm are not going to concede the market. 

This is the same framework the I/O Fund has used to identify massive AI winners across memory, networking and energy with CPUs now becoming the next bottleneck. Behind our paywall, we publish over 100 articles on the AI trade per year alongside portfolio allocations and real-time trade alerts.  

For example, we identified lesser-known AI winners, including Bloom Energy, up 1600% since our initial entry last year, a networking player that has delivered roughly 7X Nvidia’s returns YTD and an optical networking stock up more than 810% since November

Don’t miss out on the AI trade.
Join Now
Join Now

Please note: The I/O Fund conducts research and draws conclusions for the company’s portfolio. We then share that information with our readers and offer real-time trade notifications. This is not a guarantee of a stock’s performance and it is not financial advice. Please consult your personal financial advisor before buying any stock in the companies mentioned in this analysis. Beth Kindig and the I/O Fund own shares in AMD and NVDA at the time of writing and may own stocks pictured in the charts. 

Leo Miller, AI and Semiconductor Investment Writer at I/O Fund, contributed to this analysis. Leo Miller owns shares of NVDA.

👉🏻 Share with a Fellow Investor
He
are with a Fellow Investor
H
elp someone else benefit from this insight.

Recommended Reading:

Broadcom Offers Strong AI Growth at Scale; Yet Enters Circular Investing

By most measures, Broadcom offered a solid report with record revenue of $22.2 billion, up 48% YoY driven by AI semiconductor revenue of $10.8 billion, up 143% YoY. The Q3 outlook topped estimates on total revenue with management guiding for $29.4 billion, yet the Q3 AI guide came in below expectations for $17.2 billion. In addition, management did not offer a raise to previous commentary that they foresee $100 billion in FY27 AI revenue. The softer AI guide is due to a slight pivot in how they plan to supply Anthropic, which will be with XPU chips instead of AI systems, with the latter offering higher revenue yet weaker margins (more on this below).

Overall, Broadcom is well positioned, based on a combination of being the strongest XPU player and a formidable networking giant. In fact, networking comprised 40% of AI revenue this quarter, and even though it's expected to be lower in the near future, that is only because XPUs are expected to eclipse networking from 60/40 to 70/30.

Perhaps somewhat buried by the AI number miss is that Broadcom is entering the circular investing arena by standing up an external financing vehicle with Apollo, Blackstone and other investors to deploy 20GW of compute through 2028, with the first tranche valued at $35 billion. The announcement is a reminder that demand is being heavily funded for companies that are deep in the red and would otherwise see bad credit terms (such as Anthropic and OpenAI).

Below, we look at what caused the softer AI guide and why a softer AI guide is not a concern, whereas circular investing raises questions.

"Only Chips” is What Caused the Softer AI Guide 

The softer AI guide traces back to the fiscal Q3 and fiscal Q4 call awhile back when Broadcom management stated they would be delivering Ironwood racks: “Last quarter, one of these prospects released production orders to Broadcom, and we have accordingly characterized them as a qualified customer for XPUs and, in fact, have secured over $10 billion of orders of AI racks based on our XPUs.”

However, management was quite evasive when analysts had asked for clarification between chips and racks two quarters ago. There was more than one attempt for clarification, yet the one below stands out. Here is what was stated in the FYQ4 call:

Vivek Arya: BofA Securities, Research Division:
And on the clarification, Hock, Anthropic racks versus chips.

Hock Tan: President, CEO & Executive Director:
I'd rather not answer that, but we're okay. As Kirsten said, we're good on our dollars and margin.”

However, on the earnings call this evening, the CEO had a change of heart and decided to stop dodging the question and rather inform investors they are only supplying the chips.

Ross Seymore 
Deutsche Bank AG, Research Division
And the rack versus chip side of things, is that all clarified now?

Hock Tan 
President, CEO & Executive Director
No racks it's all chip…

Kirsten Spears 
CFO & Chief Accounting Officer
We are on a chip business only.

Hock Tan 
President, CEO & Executive Director
We are only chips.

Kirsten Spears 
CFO & Chief Accounting Officer
Only chips.”

This shift in deal structure has puts and takes for how analysts model Broadcom’s AI revenue this year, as booking the full revenue for the full AI system inflates revenue (because the components would become a passthrough) yet would have diluted Broadcom’s margins. That’s why directly preceding the “only chips” exchange; the analyst was pressing Broadcom on how their margins would be affected by selling systems. Personally, I’m not a fan when there are repeated attempts by analysts to clarify guidance assumptions; those questions are not answered directly, and then a miss occurs after walking back the original framing. 

However, that opinion aside, the miss is inconsequential to the bigger picture. Broadcom emphasized they booked $30 billion in AI orders compared to the $10.8 billion shipped. Management also stated they have visibility into 2028, although that might not be a good thing if the visibility stems from sourcing chips well in advance while having to secure power and other supply constrained components.  

For additional color on the growing backlog and visibility, this was stated on the call: “See a lot of large — this few six customers now, they realize that lead time to get compute, you need lead time. You need to be thoughtful. And that's not just asking for wafers to get the chips or memory to ensure that HBMs are available or DRAM is available. They're also talking about, hey, I got to have the power, the power shell. So all this is planning ahead.

And what we are seeing the bookings that are coming is not for immediate delivery. Some are hope to have, but the reality, they all accept is they need to align quite a few other things in place before they can deliver. But they are placing their orders early and they're placing their orders now, and they are placing orders in fairly huge demand, which basically gives us a lot more visibility than we normally otherwise would have in semiconductors.” 

On the earnings call, an analyst pointed out that if you look at the 10 gigawatts that Broadcom expects to help deploy next year, priced at $15 billion to $20 billion, the $100B medium-term forecast seems low.  

Furthermore, there aresix customers driving the AI orders, whereas in the past Broadcom has been highly concentrated with Google as the primary customer. These customers include Anthropic, OpenAI, Meta, and two more unnamed customers.

Lastly, content per gigawatt was touched on, with the CEO stating Broadcom’s revenue will increase from one generation to the next: “Our revenue — our content per gigawatt will increase. Put it simply, our content from the fact that our compute chip will — XPU will go up in price very dramatically, particularly when you not only put SRAMs into it, as far as it cost, you start putting a lot — you start putting embedding CPU costs into the same XPUs and making those chips basically multi-die with lots of HBM.”

Broadcom to Backstop Anthropic; Deploy 20GW through 2028 with Blackstone, Apollo 

Broadcom is helping to arrange a $35-$36 billion private-credit facility arranged by Apollo and Blackstone to help fund and purchase the deployment of custom TPUs. According to Bloomberg, Broadcom has agreed to backstop part of the debt (about $25 billion) with its top-tier investment-grade credit rating around 5.75% compared to the portion without a backer at 8% to 9% yield. In other words, Broadcom’s strong balance sheet is the reason lenders are extending tens of billions to a customer that is not yet profitable. 

Oddly enough, when asked on the call if Anthropic’s deal was backstopped, the CEO pushed back and said the company is strictly supplying chips. Here is what was stated on the call: “As the deal we did with Anthropic is we use our TPU chips that we developed to provide the compute capacity to Anthropic. We want that it wasn't backstop in that sense. We were the ones providing the chips to Anthropic. We were the ones providing the compute capacity Anthropic.” 

Although Broadcom is not taking equity, and the capital is private credit, according to Bloomberg, the company is lending its credit rating to manufacture demand from a buyer that cannot yet fund the purchase on its own. Therefore, it does closely resemble a backstop. 

Noteworthy Discussions: Incremental Supply and 2027-2028 Commentary 

There was an exchange on the call that points toward 2027-2028 being strong years for Broadcom, with management stating: “Well, good question. Yes, for '27, we indicated about 10 gigawatts shipment in '27. That's still very much intact. That will be shipping — and we are planning to ship 10 gigawatts in '27. And that nothing has changed. Back half loaded, to that extend? Yes, and which really provides an interesting trajectory into '28 with this back half trajectory. So '28, we expect a lot more gigawatts.” 

Also, in another exchange, an analyst asked if Broadcom can secure incremental supply, which would point toward a ceiling to growth. There wasn’t much revealed in the exchange, yet an analyst having this concern in a very supply constrained market (CPUs, HBM, NAND, CoWoS capacity, etc) is noteworthy: 

Timothy Arcuri 
UBS Investment Bank, Research Division 

Right. But if a customer comes to you and wants incremental supply, are you able to go to your suppliers and get it the way that it seems like some of your competitors are? 

Hock Tan 
President, CEO & Executive Director 

Customers have been coming to us incrementally over the last few months. We expect that to continue. And by and large, yes. 

Q2 Revenue Beats by 0.3%; Q3 Guide Implies Acceleration to 84% YoY  

Broadcom reported Q2 revenue of $22.19 billion, beating consensus of $22.12 billion by a marginal 0.3%, growing 47.9% YoY and 14.9% QoQ. While the headline beat was modest — Broadcom’s smallest in five quarters — YoY growth accelerated for the fifth consecutive quarter, picking up another 18 points from 29.5% in Q1 and marking Broadcom’s fastest YoY growth since the immediate post-VMware-close quarters. 

For Q3 FY2026, Broadcom guided to revenue of approximately $29.4 billion, ahead of consensus for $28.47 billion. At the midpoint, the guide implies sharp acceleration to 84.3% YoY and 32.5% QoQ — a sequential dollar increase of more than $7.2 billion, which is itself larger than the company’s entire quarterly revenue base just three years ago. The QoQ dollar step-up of $7.2 billion exceeds the $2.9 billion QoQ step-up between Q1 and Q2, underscoring that Broadcom’s AI ramp is materially compounding. 

Fiscal 2026 consensus revenue estimates have inched slightly higher over the last three months, moving up 5.4% from $97.7 billion to $103.1 billion; the nearly $1 billion beat on Q3’s guide implies FY26 estimates have a bit more upside ahead. Fiscal 2027 consensus have jumped even more sharply to $161.0 billion (+56.2% YoY) from $135.9 billion in March, representing a +$25 billion revision driven by management’s commentary into >$100 billion in chip revenue alongside multiple multi-GW commitments from OpenAI, Anthropic and key customers Meta and Google. 

AI Revenue Up 143% YoY; Q3 Guide Implies >200% YoY but Short of $17.2B Estimate, Possible Q4 Decel 

AI semiconductor revenue was once again the centerpiece of the report. Q2 AI revenue grew 143% YoY and 28.6% QoQ to $10.8 billion driven by increasing demand for custom silicon and networking, beating management’s own guide of $10.7 billion (+140% YoY). YoY growth accelerated another 37 points from 106% in Q1, marking the fourth consecutive quarter of acceleration.  

For Q3, Broadcom guided AI semiconductor revenue to $16.0 billion, implying 200% YoY growth and a material acceleration to 48.1% QoQ. This sequential dollar step-up of $5.2 billion in AI revenue is more than double Q2’s $2.5 billion; however, it fell short of the $17.2 billion estimate.  

For FY26, Broadcom guided for $56 billion in AI revenue, up 180% YoY, while reiterating its >$100 billion guidance for FY27.  

This would plot out $20.8 billion in AI revenue in Q4, decelerating from the 48.1% QoQ guided in Q3 to 30% QoQ, and implying sequential dollar growth to moderate from $5.2 billion to $4.8 billion. JP Morgan’s Harlan Sur questioned about this deceleration dynamic, noting that 2X growth in 2H over 1H would put revenue closer to $60 billion, rather than the $56 billion guided. While the exchange with CEO Hock Tan suggests Broadcom may be taking quite a conservative stance in guiding through 2H while remaining positive on FY27’s prospects, the sequential deceleration on both a percent and dollar basis presents a risk to watch:  

“Hock, on this fiscal year, AI sort of 2x growth second half over first half, that would put AI revenues over $60 billion with sequential growth in fiscal Q4, but you gave us this $56 billion number, which is only like 1.5x half-over-half growth with 4Q AI actually being down sequentially. So if you could just help us kind of square the numbers there. 

Hock Tan
President, CEO & Executive Director 

To begin with, let's start with '26. Doing a math basically 2x to 2x, the first half, we ship about in total AI revenue, something in the range of $19 billion, you're going to be precise. So — and if you do what I indicate and 2x that in the second half, you get pretty much in the range of what we're talking about, which is around $56 billion, Harlan. 

So that number is still very, very — does tie up very well. Now your bigger question on the second half, which you're going to need a very detailed analysis of is, yes, we keep the momentum going as we expect to see in 2027. What we will see in 2027 is continued growth of the level we're talking about. And if you drive on that basis of what we're seeing here, almost 2x — in the range of 2x what 2026 will be. 

I think you will easily see that 2027 will exceed very easily $100 billion in 2027, which is pretty much what we indicated last quarter, and we are continuing to say that it will be over $100 billion in 2027. So in that sense, if anything else, it might be based on what we're doing, very much on track, if not stronger.” 

Semiconductors Up 79% YoY; Software In-Line at 9% YoY  

Semiconductor Solutions revenue was $15.01 billion in Q2, up 78.5% YoY and 20.1% QoQ, beating the company’s own guide of $14.8 billion (76% YoY). YoY growth accelerated 26 points from 52% in Q1, with AI now contributing approximately 72% of Semiconductor segment revenue, up from 67% in Q1.  

Infrastructure Software revenue was $7.18 billion, marginally below the company’s ~$7.2 billion guide and up 8.8% YoY and 5.4% QoQ. YoY growth rate decelerated from the elevated VMware-integration period a year ago. For Q3, Broadcom guided for Semiconductor revenue of $20.5 billion, up 124% YoY and 36.6% QoQ, and Infrastructure Software revenue of $8.9 billion, accelerating sharply to 31% YoY and 24% QoQ.  

Margins: Operating Leverage Drives GAAP Expansion  

Q2 margins highlighted the operating leverage thesis that has underpinned the Broadcom story since the VMware close, with GAAP profitability expanding as revenue scaled against a largely fixed cost base. 

Q2 GAAP gross margin was 69.5%, expanding 150bps YoY and 140bps QoQ. Adjusted gross margin was 77.1%, in line with management’s 77% guide and expanding 10bps QoQ from 77.0% in Q1 — notable because it dispelled the prior concern that the rising XPU mix would pressure gross margins. Adjusted gross margin remains down 230bps YoY (from 79.4% in Q2 FY25) due to a higher custom-silicon mix, but the QoQ stability suggests the mix headwind has largely played through.  

Q2 GAAP operating margin was 48.6%, expanding 980bps YoY and 430bps QoQ — a solid demonstration of operating leverage as semiconductor revenue scaled approximately $4.5 billion above Q2 FY25 levels while opex grew only ~6%. Adjusted operating margin was 67.3%, beating the 67% guide and expanding 200bps YoY and 90bps QoQ. For Q3, Broadcom guided adjusted operating margin to ~67% (flat sequentially).

Q2 GAAP net margin was 42.0%, expanding 890bps YoY and 390bps QoQ. Adjusted net margin was 54.4%, expanding 250bps YoY and 170bps QoQ.  

EPS and Adjusted EBITDA 

Adjusted EPS was $2.44 in Q2, beating estimates of $2.40 by 1.7%, marking Broadcom’s second consecutive quarter of sub-2% EPS beats. Adjusted EPS grew 54.4% YoY, accelerating from 28.1% in Q1. GAAP EPS was $1.91, growing 85.4% YoY. 

While Broadcom did not guide directly for Q3 earnings, the $1 billion beat on revenue and margin maintenance suggests potential upside to current estimates for $3.18 in adjusted EPS, up 88.1% YoY. This is also likely to put upwards pressure on FY26 estimates, which sit at $11.33, up 66.1% YoY. Similar to revenue, FY27 EPS estimates have seen a strong upwards revision over the last three months, up 27% from $14.56 in March to $18.50, driven by the expected surge in AI revenue next year.   

Adjusted EBITDA was $15.24 billion at a 68.7% margin, beating the 68% guide and growing 52.4% YoY and 16.1% QoQ. Adjusted EBITDA was guided to be ~68% of revenue in Q3, a marginal step-down versus Q2. 

Cash Flows and Balance Sheet  

Cash generation in Q2 was exceptional, with both OCF and FCF margins reaching post-VMware highs and dollar generation setting new records. 

Operating cash flow was $10.49 billion in Q2 for a 47.3% margin, up 60.1% YoY in dollar terms and 27.0% QoQ. OCF margin expanded 360bps YoY and 450bps QoQ as higher-margin AI revenue mix flowed through to cash conversion.  

Free cash flow was $10.26 billion for a 46.2% margin, up 60.1% YoY and 28.1% QoQ, with capex of just $231 million (1.0% of revenue, down slightly from $250 million in Q1). FCF margin expanded 350bps YoY and 470bps QoQ. 

Cash and equivalents climbed to $19.63 billion at quarter-end, up from $14.17 billion in Q1. Debt declined modestly to $64.91 billion. The combination of moderating buybacks and accelerating FCF means Broadcom’s net debt position has improved by approximately $6.6 billion over the past two quarters, providing meaningful flexibility for either an acceleration of buybacks, M&A, or — given the AI ramp — potential incremental capacity investments. 

Inventory rose sharply to $4.33 billion at quarter-end, up 46% QoQ from $2.96 billion in Q1, a meaningful supply-side signal that reinforces management’s confidence in the Q3 and Q4 AI ramp. Days sales outstanding extended to 44 days (from 40 days in Q1), reflecting the rising mix of larger hyperscaler customers with longer payment terms, though still well within historical norms. Both metrics — accelerating inventory build and modestly extending receivables — are consistent with a company gearing up for a sharp sequential ramp rather than one facing demand softness, mirroring similar supply-side signals seen at Nvidia and other AI infrastructure peers.

Conclusion: 

Broadcom’s AI revenue growth on a YoY and QoQ basis is stunning on all accounts, especially given its growth at scale. Most importantly, Broadcom is diversifying its customer base to six customers with bookings running 3X shipments with visibility into 2028.

Management did not provide an updated guide for FY27, which may be partly due to the chip-only content that led to next quarter’s miss, but it could also be they are not sure when their customers will secure the other supply constrained components.

The more immediate reason the report is likely selling off after hours due to bringing up an important modeling question, which is how much revenue should be assigned to each gigawatt of XPU compute? Rack-level assumptions imply a much larger revenue opportunity than chip-only content, thus we are seeing an adjustment after hours. As you can tell from my write-up, I think this was an avoidable communication issue on management’s part, especially given the repeated attempts by analysts to clarify the rack-versus-chip economics in previous earnings calls.

However, a minor miss on surging AI revenue will soon be water under the bridge. The larger concern is around circular AI investments, which are likely here to stay. Broadcom is now tethered to AI customers that need enormous compute capacity but are not yet profitable at the scale required to fund it internally. The creation of financing vehicles with Apollo, Blackstone and other investors is one strategic solution, yet it’s not exactly ideal to lend your own credit rating to manufacture customer demand, especially given Anthropic is likely years away from profitability.

That’s a wrap! I/O Fund just had one of our best quarters ever, helped by strong positioning ahead of the Nasdaq’s historic April rally. Let’s see if we can do it again. Keep an eye out for upcoming analysis on new stocks we may add to the portfolio as we rotate out of weaker names, plus my Q3 Top 15 AI Stocks report, due next month.

Please note: The I/O Fund conducts research and draws conclusions for the company’s portfolio. We then share that information with our readers and offer real-time trade notifications. This is not a guarantee of a stock’s performance and it is not financial advice. Please consult your personal financial advisor before buying any stock in the companies mentioned in this analysis. Beth Kindig and the I/O Fund own shares in AVGO at the time of writing and may own stocks pictured in the charts.

Damien Robbins, Equity Analyst at I/O Fund contributed to this analysis.

Recommended Reading:

Core Scientific: Multi-GW Pipeline, New Hyperscaler Interest but Still Tied to CoreWeave 

Core Scientific represents one of the stronger Miners as they are already earnings revenue on 243 megawatts with another 200 megawatts expected to be earning revenue in the coming months. This helps transition Core Scientific away from being pure speculation as the company is beginning to execute. With that said, Core Scientific must continue to execute to reach its full potential, and this is particularly important because of the company’s debt structure.  

As a reminder, Core Scientific is pivoting from being a Bitcoin miner to offering multisite infrastructure buildouts as a colocation data center provider. Therefore, at the moment, Core Scientific offers a challenging fundamental profile, with operating margins and cash flows still in the red. However, management stated the 243MW currently being billed will result in $350 million annualized colocation GAAP revenue, and raised their expected cash gross profit margin up 500 bps to 82.5% at the midpoint. The takeaway is that Core Scientific can offer enough profitability and visibility to support more growth.  

Notably, Core Scientific has expanded its gross power pipeline to 4.5 GW with 3GW of that pipeline leasable by customers, suggesting annual revenue opportunities of more than $5 billion under current deal economics at full scale. Although this is quite promising, it circles back to execution and debt structure, which is discussed more below.  

Lastly, Core Scientific still remains closely tied to CoreWeave (whose planned $9 billion acquisition of the miner fell through). The first attempt to diversify beyond CoreWeave with a hyperscaler fell through as a deal under exclusivity was allowed to expire. It’s a yellow flag that a hyperscaler deal fell through (raises important questions), although management seems optimistic as they are in discussions with three hyperscaler customers.  

Quick Recap on Miners’ Value Proposition 

Time-to-power is becoming a central bottleneck for AI data centers, as grid constraints rise, connection queues lengthen, putting the emphasis on quick, suitable on-site and behind-the-meter solutions such as Bloom’s fuel cells and GE Vernova’s gas turbines.  

Bitcoin miners offer a third solution for the time-to-power thesis, offering up to several GW of capacity in quick fashion, bypassing interconnection queues for greenfield builds, and offering cheaper electricity costs from long-term power contracts. For example, miners such as IREN and TeraWulf have touted electricity costs around $0.046-$0.047/kWh in the past, compared to PJM’s ~$0.08/kWh in 2025 and commercial sector rates averaging $0.08-$0.22/kWh. For a 400MW data center, electricity expenses at miner rates would be roughly $162 million, versus $280 million to $771 million under commercial sector average rates, or annual savings of ~42% to 79%. 

For neoclouds such as CoreWeave, these lease-based deals and cheaper electricity costs offer a compelling structure to quickly bring significant capacity online to scale revenue, without bearing the construction capex (around $12-14 million per MW) or dealing with power procurement.  

Overall, the value proposition is that miners are cheaper and faster than new, greenfield data center sites that are not energized, yet the downside is that they are capital constrained and may be unable to build-out capacity beyond what is currently in their pipelines. 

According to Core Scientific, they can offer five sites with the first of them ready-for-service (RFS) with a timeline of 18 months or less. Part of Core Scientific’s current strategy is to stop retrofitting the existing infrastructure and to pursue greenfield instead. Thus, the 18 months reflects a (very quick) newer build rather than the unpredictable nature of upgrading older sites. Here is what was stated on the call: “I think the thing that was much more difficult than we certainly gave a credit for was the — was actually executing on brownfield conversions, which is why everything you see that we're doing forward is actually a greenfield site with a very highly standard basis design that allows us to get kind of leverage over our supply chain and be super predictable in terms of our delivery dates.” 

Although this pushed back the timeline on when a Miner like Core Scientific becomes a more viable stock, it also could increase the predictability of deals getting signed and executed as we move further into the 18-month lead time (i.e., 2027). 

Gross Power Pipeline Expanded to 4.5GW, Lots of Execution to Get There 

When we first covered Core Scientific more than a year ago for Advanced members here, Core Scientific: Hypergrowth with 21X AI Segment Growth Potential, the miner’s contract power pipeline spanned 1.3GW, yet today, it is more than 3X higher at 4.5GW. Notably, this excludes the 590MW already contracted by CoreWeave, meaning Core Scientific’s gross power pipeline technically exceeds 5GW, more than double TeraWulf’s 2.3GW and in a similar boat as IREN and Applied Digital around 4.5GW each in North America.  

This 4.5GW power pipeline translates to 3GW of leasable capacity, with 1.5GW of that 3GW figure currently grid-connected. Two sites – Muskogee, Oklahoma and Pecos, Texas – account for the majority of Core Scientific’s pipeline, both with potential to scale to 1.5GW gross power each, or 1GW leasable. 

However, Core Scientific’s current focus remains on delivering its capacity for CoreWeave, ramping from the 243MW billable as of Q1 to 450MW by the end of Q2, with the target of reaching full capacity in early 2027:  

"Across our remaining contracted sites, we will continue delivering billable megawatts over the coming months while scaling execution on the CoreWeave contract, positioning us to deliver more than 450 billable by the end of the summer, while remaining on track to deliver the full 590 megawatts by the early 2027.” 

Executing on CoreWeave’s ramp will be the primary focal point for 2026 and early 2027, as management hinted that delivery of non-CoreWeave capacity within the 4.5GW pipeline will not occur until early 2027: “strategically positioning the business to sign attractive new customer contracts with capacity outside of CoreWeave available for delivery starting in early 2027.”  

What is Core Scientific’s Pipeline Worth? 

We can roughly translate what this power pipeline could suggest for Core Scientific’s revenue potential at 3GW of total leasable power. At roughly $1.4 million per MW per year, or the current run rate of its CoreWeave deal, its entire pipeline (should it materialize and at similar terms) could be worth $4.2 billion in annual revenue potential. Should it advance towards $1.7 million per MW, or in line with Applied Digital’s recent deal, that annual revenue potential moves to $5.1 billion.  

Overall, Core Scientific’s power strategy is all about ‘proactive positioning’, as management put it – securing land, labor and equipment to keep delivery timelines and ready-for-service dates on track for within 18 months, securing gas and behind-the-meter power to enable expansion, and showing prospective customers on-the-ground progress to entice deal-making discussions.  

As you can see, to get to the full pipeline, it comes down to strong execution. 

Shifting to Greenfield Development 

There was one interesting topic of discussion late in Q1’s call about lessons learned from developing multiple sites for CoreWeave, and how that translates into a competitive advantage. On this, management revealed that the advantage lies within their development approach – they are not retrofitting sites, but rather developing them from scratch: 

“I think the thing that was much more difficult than we certainly gave a credit for was the — was actually executing on brownfield conversions, which is why everything you see that we're doing forward is actually a greenfield site with a very highly standard basis design that allows us to get kind of leverage over our supply chain and be super predictable in terms of our delivery dates. 

Brownfield sites are highly unpredictable. They require a lot of customization. It's a lot of effort to try to retrofit an existing building. While sometimes that could be faster, it comes with a lot more complexity.” 

This is a key distinction we raised in our Hyperscaler Power analysis, Why Power is Critical for Data Centers and their Hyperscaler Customers:  

Brownfield sites (retrofitting) are the path other Bitcoin miners are taking as it is cheaper and faster than greenfield, allowing them to convert old Bitcoin mining halls into AI data center capacity at a relatively quick pace. However, greenfield builds – where the developer owns the land, power, and building – offer a higher degree of customization, though at a much higher cost and often with the longest timelines to completion due to permitting, site selection, and grid connection. 

It is that last point where Core Scientific gets its greenfield advantage – it does not have to deal with lengthy site selection or grid connection requestions, with a repeatable development playbook that can pencil in RFS dates within the next 12 to 18 months. It also represents (somewhat of) a faster path-to-market compared to typical greenfield hyperscale builds, which can take >16 months to reach first operations since starting construction.  This is evident in the Muskogee campus with the Polaris deal adding 440MW of contracted energy to its facility, bypassing the grid interconnection queue and opening the door for quick expansion (pending demand and capex). 

However, the main challenge is financing these greenfield builds faster than its miner peers, as these new sites are crucial in diversifying customer exposure outside of CoreWeave. For example, TeraWulf is targeting 2H 2027 delivery of up to 480MW at a single campus in Kentucky, while IREN is aiming to add more than 700MW in 2027. 

$3.3 Billion Financing Helping Accelerate Site Development 

We can roughly infer what Core Scientific’s pipeline would cost to build out, based on management’s estimates for development costs of million per MW. Core Scientific is estimating build costs to be roughly $11 million per leasable MW, meaning that its leasable pipeline of 3GW would cost in the ballpark of $33 billion.  

On this topic, Core Scientific recently closed a $3.3 billion secured senior note raise due in 2031, netting $2.9 billion in gross proceeds, to be allocated across its five sites currently under development.  

Of the proceeds, $2-2.2 billion is expected to help support development of roughly 1 GW in leasable capacity, or two-thirds of its current grid-connected 1.5GW of leasable capacity. It’s important to note that the $2-2.2 billion figure merely represents a 20% cash outlay necessary to land project financing, with this completing the remaining 80%, or ~$8.8 billion.  

All told, the 3GW pipeline would likely require $6-6.6 billion in cash and potentially more than $25 billion in related project financing to be fully developed under a similar structure. This is more than 6X Core Scientific’s current cash balance, meaning debt or project financing will be leaned on quite heavily. The problem with that is high interest – the $3.3 notes carry a 7.75% rate (essentially a junk bond), meaning Core Scientific will add $256 million in interest payments annually, placing further strain on its balance sheet. While it does help avoid diluting shareholders, it opens the door to execution risk, both by Core Scientific and its key customer CoreWeave.  

Importantly, management emphasized that they are not waiting for a deal to be signed before advancing site development, with current capital letting Core Scientific build and target 12 to 14 month ready-for-service timelines. Considering that debt is funding the non-CoreWeave-associated buildouts and that Core Scientific is not waiting for deals to be signed to continue building, analysts questioned what guardrails Core Scientific had on capex:  

“Is there any guardrail on how much CapEx you would start putting forward before getting a lease? 

Adam Sullivan, CEOAdam Sullivan, CEO 

“I mean the way we're thinking about it right now is we want to take the first data hall to full RFS. And as part of that, that means we're securing the labor, securing the trades, we're securing long lead equipment. And we're putting ourselves in a position where if a customer signs really within any time period leading up to the RFS, the first data hall, we can just continue to extend all of that labor that we have secured on site. So that's kind of our guardrail right now in terms of where we sit. But we feel very confident in the strategy and the ability to show the progress that we're making across each of these sites to customers is really what's forcing the engagement here because everyone is incredibly interested in capacity that's getting delivered in '27 right now.” 

The main readthrough here is that Core Scientific does not really have a financial guardrail in place, and instead is banking on a deal being signed, based on high interest in the market and the fact that they are making construction progress. This means that Core Scientific will likely be on the hook for a majority of the construction costs of the new facilities, a shift in strategy from its CoreWeave deal where the neocloud is fronting some of the capex bill for its capacity. Management also noted that they are looking to deploy behind-the-meter power solutions over the same 12 to 14 month timeframe, which, if not included in the above capex portrait, could add $500 to $600 million per GW to project costs. 

The longer that a deal takes to come to fruition, the more capex, and more debt, that Core Scientific will have to incur.  

Touching on Behind-the-Meter Power 

It’s necessary to briefly touch upon Core Scientific’s willingness to turn to behind-the-meter power solutions as a key method of increasing its power pipeline. Based on commentary for the planned Pecos and Muskogee expansions, Core Scientific expects behind-the-meter solutions to account for as much as ~1.86GW across both sites (to reach 1.5GW each), if additional grid power under load study does not pan out.  

One of the main benefits of the miners that we had originally highlighted was that miners already have power secured, yet the main risk here is that Core Scientific’s goal of having two GW-scale sites do not have power secured, and instead may rely on more expensive sources of power.  

Core Scientific noted that behind-the-meter offers a faster time to power than waiting for grid interconnection, which is reasonable considering the scale of these two sites;  however, as noted above, behind-the-meter solutions are not necessarily cheap, and could run as much as $500 million per GW. This could add more than $1 billion to development costs across the two sites, an expensive endeavor assuming power would have to be procured prior to a deal. The other risk is that there is no guarantee that Core Scientific would be able to secure the power necessary for both sites to expand, either via the grid or behind-the-meter. 

Core Scientific’s Crux – No Second Deal (Yet) 

The main drawback, to say, is that Core Scientific has yet to diversify beyond CoreWeave, partially because CoreWeave had attempted to acquire Core Scientific, likely limiting its deal-making ability. Additonally, Core Scientific had a hyperscaler in exclusive discussion across its Pecos and Muskogee campuses, yet the customer's exclusivity expired without a deal being signed.  

Despite that exclusivity agreement expiring, management explained that “three hyperscalers immediately engaged on those same sites, and we are now in active discussions.” CEO Adam Sullivan added that it was “hard to determine the exact reasons why” the original hyperscaler did not follow through with a deal, though Core Scientific believed it was “the best time for us to bring these back to market because hyperscalers were knocking at the door and asking questions about the sites. And we knew we could have an opportunity to bring another hyperscaler into the fray.”  

Given that Core Scientific essentially has taken a step back in the deal-making process, analysts questioned about the three hyperscaler engagements, and if this would be starting the process again from scratch or if there were previous discussions that could accelerate a potential deal. Management confirmed the latter, explaining that it was simply “bringing back both Pecos and Muskogee back to the table. And that's really why we are able to immediately reengage with those customers.” Core Scientifc added that it was also in conversations with AI labs, neoclouds and chipmakers.  

Though there was no indication around when a potential deal could be signed, management believes they are closer to a deal than in Q4 and uniquely positioned to close potential deals. This stems from their focus on having ready-for-service dates within the next 18 months with active construction progress, with five sites expected to have first data center halls ready in 2027:  

How does the negotiation get altered with some of these potential customers when you've secured the supply chain and you're kind of moving forward? Does that accelerate discussions? Does that keep them more engaged?  

Adam Sullivan, CEOAdam Sullivan, CEO 

Yes. I mean it definitely keeps them more engaged. I mean they rarely see sites that come across their desk where there's an RFS time line really within 18 months, but even more so less than that. And so for us, being able to show photos and videos of sites with active construction going on and the list of equipment that are on order that dramatically changes the dynamic of the discussions because this isn't just a photo of a piece of land. This is an active construction site actively progressing towards building a data center.  

Although management did not specifically discuss why the hyperscaler fell through, our readthrough is the change in tone from brownfield to greenfield may be where the delay came in. If you go back about 6 months ago, Miners were attempting to retrofit. According to this earnings call, that is a dead-end of sorts and greenfield is the way forward, which would naturally cause a delay in a deal.  

Financials 

Revenue Inflects in Q1 as Colocation Revenue Ramping  

Core Scientific’s revenue inflected in Q1 as Colocation revenue showed a strong ramp with billable capacity for CoreWeave reaching 243MW, up from 185MW in Q4. Q1 revenue was $115.2 million, up 44.9% YoY and 44.5% QoQ, accelerating from (16%) YoY and (1.7%) QoQ in Q4. 

For a segment breakdown: 

Colocation revenue was $77.5 million, up 804.5% YoY and 147.4% QoQ, driven by incremental capacity delivered to CoreWeave during the quarter. This marked a sharp acceleration from 267.8% YoY and 109.6% QoQ in Q4.  

Within Colocation, lease revenue was $59.2 million, up 892.4% YoY and 136.7% QoQ. Power fees passed through to CoreWeave were $21 million, while maintenance cost ($2.7 million).   

Management added that the 243MW of billable capacity represents roughly $350 million in annualized revenue, with 200MW of incremental billable capacity expected to come online by the end of the summer (Q2). This additional 200MW would represent roughly $288 million in annualized revenue, or $72 million quarterly; however, assuming half lands in Q2 due to the intra-quarter ramp timing, Colocation revenue would roughly estimate to $113 million next quarter, up 45.8% QoQ and 966% YoY. 

Digital Asset (Bitcoin) Mining revenue totaled $37.7 million across self-mining ($30.1 million) and hosted mining ($7.6 million), declining (46.9%) YoY and (22.1%) QoQ. Core Scientific is expecting a “meaningful step down” in miners in 2H as it transitions to Colocation. 

Currently, Q2 revenue is projected to be $134.5 million, accelerating to 71% YoY though QoQ growth would moderate to 16.8%. Q3 is projected to see a further acceleration to 112.8% YoY and 28.3% QoQ to $172.5 million in revenue driven by the capacity ramp. 

For the full year, revenue is currently projected to be $622 million, up 95% YoY, with FY27 estimated to reach $1.04 billion, up 66.5% YoY. Considering Core Scientific is aiming to deliver five sites in 2027 and satisfy the full 590MW for CoreWeave in the early part of the year (representing $850 million in annualized revenue), there is potential for upside to the current revenue estimate if it can contract out some of these sites to new customers. 

Operating Margin Impacted by Impairment Charge, Colocation Margin Dynamics 

Q1 saw gross margin improve double-digits YoY as Colocation takes a larger mix and as Bitcoin operations are wound down. However, impairment charges related to the Bitcoin operations had an outsized impact on operating margin.  

GAAP gross margin was 26.1%, up 15.8 points YoY and roughly flat QoQ.  

GAAP operating margin was (269.4%) due to recording a $266.5 million impairment charge in the quarter, widening from (59.1%) a year ago and (147.3%) in Q4. Excluding the impairment charge, operating margin would’ve been (38.1%).  

GAAP net margin was (301.3%), which was not comparable to 724.6% a year ago or 270.8% in Q4 as both quarters benefitted significantly from changes in fair value of warrants.

It’s also important to touch a bit upon Colocation margins, as power fees passed through to customers are recorded as revenue, yet because they are fully passed through, carry a 0% margin.  

Thus, Colocation reported an 57% gross margin overall in the quarter, up 52 points YoY and 11 points QoQ. However, when stripping out passed-through power costs, Colocation gross margin (lease revenue minus maintenance and other expenses) was 78%, up 21 points QoQ. Management added that they have “increased our target cash gross profit range for the CoreWeave contract to 80% to 85%, up from our original target of 75% to 80%” as they now have “much greater visibility into the associated cost structure given we are now billing for a meaningful portion of the contracted megawatts.” 

EPS 

Driven by the impairment charge, Core Scientific reported a large GAAP loss this quarter, though GAAP profitability is expected as early as Q3.  

GAAP EPS was ($1.06) in Q1, down from $1.25 a year ago and $0.42 in Q4. Adjusted EPS was ($0.11), improving from ($0.13) a year ago and ($0.18) in Q4.  

Looking ahead to Q2, GAAP EPS is projected to be ($0.02), likely accounting for no impairment charges, while adjusted EPS is projected to be ($0.06). Q3 is expected to see GAAP EPS turn thinly positive at $0.01, while adjusted EPS would remain negative at ($0.06); however, this profitability likely assumes no impairment charges, which are a real possibility given the expectation of a significant wind down in Bitcoin operations in 2H. 

Adjusted EBITDA in Q1 was $4.4 million for a 3.8% margin, up from (7.6%) a year ago and (53.5%) in Q4.  

Balance Sheet and Cash Flows 

One of Core Scientific’s advantages in the miner landscape is that CoreWeave is fronting a majority of the capex at up to $750 million ($1.5M/MW), whereas other miners are turning to debt and paying the entire construction/retrofitting costs themselves. However, Core Scientific’s current strategy of progressing greenfield builds pre-contract may require a higher degree of self-funding moving forward.  

Q1 operating cash flow was $249.9 million for a 216.8% margin, driven by the impairment charge and sale of ~$208 million in Bitcoin. This was up from a (56.6%) margin a year ago and 197.3% in Q4. 

Q1 free cash flow was ($136.7 million) for a (118.6%) margin, improving from (162.2%) a year ago and (152.7%) in Q4. Capex was elevated at $389.3 million, or ~3.4X of revenue. 

Deferred revenue was $654.2 million, up from $555.9 million in Q4. 

Cash was $1.0 billion, while debt was $2.1 billion; this does not include the $3.3 billion senior secured notes raised in Q1. Debt and project financing will need to be tracked closely given the current health of Core Scientific’s balance sheet with a ($1.3 billion) deficit. 

Conclusion 

Fundamentally, Core Scientific’s revenue is beginning to inflect as it delivers more capacity for CoreWeave, aiming to deliver an additional 200MW by the end of Q2 to take its total billable capacity to nearly 450MW, more than 75% of the way to its full 590MW obligation. Margins remain negative, though GAAP EPS is expected to potentially shift positive as early as Q3 as Colocation revenue ramps into year-end. 

Core Scientific is making solid progress in expanding its power pipeline, with up to 4.5GW of gross power potential with behind-the-meter and load expansions under study, offering up to 3GW of leasable capacity if fully developed. Pecos and Muskogee are expected to be the company’s primary campuses, both with potential to expand to 1GW of leasable capacity each, and likely the main cornerstones in diversifying exposure outside of CoreWeave to hyperscaler customers. 

While the company is working to progress rapidly with greenfield development of its non-CoreWeave-tied sites, aiming to have five sites ready for service in 2027, capex and debt needs must be watched closely as Core Scientific is funding this development itself. The weak fundamental profile of Core Scientific’s financials makes this stock an Advanced-only momentum play, and one we would only participate in for momentum purposes if we felt it was breaking out. Join Knox this week in his weekly webinar for more information.

Damien Robbins, Equity Analyst at I/O Fund contributed to this analysis.

Please note: The I/O Fund conducts research and draws conclusions for the company’s portfolio. We then share that information with our readers and offer real-time trade notifications. This is not a guarantee of a stock’s performance and it is not financial advice. Please consult your personal financial advisor before buying any stock in the companies mentioned in this analysis. Beth Kindig and the I/O Fund do not own shares in CORZ at the time of writing and may own stocks pictured in the charts.

Recommended Reading:

Monolithic Power: Enterprise Data Growth Boosted by 35 Points, 800G Optical Growth Appearing

Monolithic Power Systems (MPS) is entering 2026 with solid AI-driven momentum in its Enterprise Data segment, recording growth of 97.7% YoY and 12.6% QoQ, a third consecutive quarter of double-digit sequential growth albeit decelerating each time.  

While management last quarter had laid out a ‘conservative’ floor for 50% YoY growth for Enterprise Data, this quarter saw management increase the floor to 85% YoY for the segment. This would represent a nearly $250 million raise in just one quarter, underpinned by strong ordering patterns continuing and increasing visibility in Q1. Additionally, the rollout of next-gen systems such as Nvidia’s Rubin and AMD’s MI450X serve as additional 2H catalyst.  

Monolithic also had an unexpected catalyst this quarter, seeing strong optical-driven growth emerge in its Communications segment, driving growth of 33.1% QoQ, the segment’s strongest sequential growth since Q3 2024. This growth was driven primarily by 800G optical modules, which are expected to see shipments rise as much as 2.6X this year. Additional levers for optics-driven growth include increasing optical attach rates with Rubin as well as the ramp of 1.6T.  

On the capacity front, Monolithic is increasing its near-term capacity goal to $6 billion, having reached its $4 billion target last quarter. This capacity expansion is imperative in preventing the company from becoming supply constrained given that FY26’s revenue estimates are already within 10% of that $4 billion mark.  

Brief Recap on Products, Vertical Power Delivery 

For a brief recap, Monolithic supplies a range of power management ICs, a broad suite of DC-DC converters, power modules, and multi-phase regulator modules. 

Power management ICs help regulate, distribute and optimize power within chips, and also help regulate heat dissipation to prevent overheating, an especially critical function as AI GPUs continue to push the thermal boundary higher.    

DC-DC converters help enable precise voltage regulation from 400V DC power entering the rack to lower voltage rails required by AI accelerators. DC-DC converters can also handle higher power densities, reducing power consumption and optimizing performance of increasingly-power hungry GPUs. 

Power modules combine DC-DC converters with built-in, integrated power MOSFETs, inductors, and other necessary components into a single module to lower BOM, reduce amount of external components required, and simplify AI chip design. 

Multi-phase voltage regulator modules (VRMs) are increasing in content as GPUs push into higher power requirements. GPUs operate at very low voltage at roughly 1V — but draw extremely high current, which means power must be converted from 12V at the board level down to the GPU core. Rather than relying on one oversized regulator, engineers distribute the load across multiple phases to improve efficiency and thermal management. 

However, as AI GPUs heat up to 2,000W and beyond (where Rubin and AMD’s MI450 generation are headed), the traditional placement of VRMs and lateral power delivery carried a major drawback that must be addressed.  

Lateral routing increases power loss and drives heat generation higher, causing overheating (when next-gen GPUs are already getting hotter) and reduced performance. This is essentially forcing a shift to vertical power delivery (VPD), which places voltage regulators directly under the PCB and shortening delivery lengths. VPD helps enable higher power density, lets modules more efficiently power GPU, CPU and memory rails, while also freeing up space on the PCB for additional HBM stacks or other components.   

With these key advantages and push to more powerful GPUs with each generation, MPS expects VPD to essentially become a non-negotiable in 2026: “This is just the direction of the market. It's the only energy-efficient solution you can put in place if you're going to operate in these high-voltage — high-current.”  

Enterprise Data FY26 Growth Raised from 50% to 85% 

While Q1 showed more evidence of Monolithic’s growing AI-driven revenue opportunities outside of its Enterprise Data segment, management’s updated growth guidance for the segment in FY26 arguably stole the show. This growth in Enterprise is likely being driven by VPD and higher content per socket, as VPD is becoming increasingly necessary with more powerful chips such as Rubin and the MI450. 

After guiding for a floor of 50% YoY growth last quarter, management raised this forecast to 85% YoY growth, a substantial 35 point raise in just one quarter (and with three more to go in the year):  

“We tend to be fairly conservative in how we look at these things, waiting for the backlog to be in place. So late last year, we talked about 30% to 40% growth year-over-year. In the last call, we kind of rose that to a 50% floor. And the strong ordering patterns that we saw start last year has kind of continued through Q1. So at this point in time, I think we're comfortable raising that floor up to around 85% year-over-year growth.” 

To put this in perspective, Enterprise Data revenue in FY25 was $701.9 million, so the updated forecast essentially represents a nearly $250 million raise just one quarter into the year – FY26 revenue would project to almost $1.3 billion at 85% versus $1.05 billion at 50%. 

Two pieces of additional commentary from management suggested that this growth guide is likely to move higher through the year – that the guide is underpinned by strong ordering patterns emerging through the quarter, and that Monolithic is not facing any supply chain constraints.  

As we had pointed out in our write-up covering Q4’s results, Monolithic Power: Strong AI Tailwinds to Drive 50% Enterprise Data Segment Growth in FY26, the 50% growth guide was supported by increased visibility into ordering patterns, yet visibility into 2H was limited. We explained that “the key takeaway is that 2H will likely be the determining factor for where Enterprise Data growth lands.”  

This quarter, the takeaway remains very similar. VP Tony Balow explained that Monolithic is comfortable increasing the growth floor to 85% because order visibility is extending with strong ordering patterns in Q1. Similar to last quarter, Monolithic did not offer any visibility into 2H, yet signals from Nvidia that Rubin will begin its initial ramp in Q3 and accelerating into Q4, alongside strong demand for server CPUs, all suggest order momentum can persist well into the year.  

The second piece of commentary relates to supply constraints, with management stating: “nothing about our outlook or anything we've said about Enterprise Data floor is because we see any constraints in the supply chain.” Simply put, supply will not be a constraint to growth, and will not prevent Monolithic from reaching or exceeding its 85% target. It also suggests that if demand strength and order momentum persists into Q2 and extends through 2H, that Monolithic likely has the supply in place to meet that upside.  

Combining these factors of persisting order momentum, increased visibility, and a lack of supply constraints with product-driven tailwinds in server CPUs and across AI accelerators and servers, all suggest this 85% growth guide could have more upside. If Monolithic raises growth by ~15 points in each of the next two quarters for ~115% YoY, Enterprise Data revenue would project out to $1.51 billion, or a $200 million raise from Q1’s guide (also smaller than the nearly $250 million raise this quarter). 

Looking ahead, Monolithic hinted at a key advantage they have as XPUs heat up to 2,000W and beyond – monolithic solutions built on a single piece of silicon: “We are the best in the market segment because we provide a total monolithic power solutions. And we can use a single piece of silicon versus our competitor use multiple piece of silicon. And that clearly shows our advantage.” Fully integrated power modules provide higher power density, and can offer more efficient power delivery even with more compact designs. Monolithic is also planning to further increase power density on smaller modules, as it plans to move from 60nm silicon to 40nm. 

This also leads into a second advantage, an ability to be flexible with integrations. Monolithic can offer fully integrated, cost effective modules to help reduce board space, accelerate chip design and increase system efficiency in increasingly complex chips, or offer a range of discrete components if its customer needs require those:  

“And we do what is the most cost effective – and how we do the integrations. And we have the capabilities to integrate or disintegrate, okay? And the integrations, we can put it in one module. And that's a huge advantage. And with the multiple other chips, and if you use particularly discrete power components, discrete power FETs, and it's very difficult to do for manufacturing the modules.”  

These monolithic and integration-based advantages may become increasingly important in driving growth alongside VPD as next-gen GPU platforms ramp and as chips progress past 2,000W. 

Communications Unexpectedly Strong, Benefitting from AI Networking 

Monolithic previously mentioned optical modules as a driver of growth for Communications (nearly a year ago at this point), yet Q1’s call was filled with discussion over 800G optical modules driving this unexpected QoQ inflection for the segment.  

Communications revenue rose 33.1% QoQ to $111.5 million in Q1, a rapid acceleration from 4.8% QoQ in Q4 and marking the segment’s fastest sequential growth since Q3 2024. On a dollar basis, Communications recorded almost the same QoQ growth as Enterprise Data at $27.8 million versus $29.3 million. Management chalked up the sequential increase to strength in both optical modules and networking switches.  

The reason why Monolithic is seeing strong growth ties in to what was discussed above, in its ability to offer a full module within optical modules with higher power density, better efficiency in more compact sizes: “why are we winning all these segment is because the power density, as I said earlier. And nobody want to waste the power and efficiency is — power density is directly related to power efficiency. And so they want a smaller size, and they want to have a higher efficiency.” 

As usual, Monolithic would not offer segment-level guidance for Q2, but hinted that Communcations is also seeing strong order momentum and will grow faster than corporate average this year: 

Quinn Bolton, NeedhamQuinn Bolton, Needham 

“I wanted to ask on the Comms segment. It was up 33% sequentially in March, it sounds like it's going to be one of the faster-growing segments in the June quarter. When I look at optical modules, I think 800-gig modules are more than doubling in '26. So — my question is, do you think the comms segment could actually grow as fast, if not faster, than Enterprise Data this year given those trends? 

Tony Balow, VP FinanceTony Balow, VP Finance 

“I think as ordering patterns have continued to be strong and extend, we still don't have them all the way through the year. So I think it's pretty tough for us to call all the way through the back half right now. But certainly we put that end market above the corporate average.” 

Monolithic does not have visibility into 2H, yet considering the strength of demand across the optics industry for >800G speeds, it’s unlikely that ordering patterns will materially slow. For example, as we highlighted in our free newsletter on Lumentum, TrendForce has predicted that “optical transceivers shipments of 800G and higher will hit 24 million units in 2025, then jump by 2.6 times to nearly 63 million units in 2026.” This 2.6X growth, or almost a 40 million increase in unit volumes, offers a strong backdrop for Monolithic’s optics-driven growth through the rest of 2026.  

Running the math on management’s commentary for Communications to grow above corporate average, coupled with calendar-Q2 guidance from other optical beneficiaries paints quite a positive picture for the segment this year.  

To start, assuming Communications grows roughly 40% YoY – below Q1’s 55.5% YoY growth but roughly 8 points faster than estimated FY26 corporate growth of 32.5% — projects the segment’s FY26 revenue out to $432.7 million.  

This is below Q1’s annualized run rate of ~$445 million, suggesting the segment sees no chance of sequential growth throughout the remainder of the year, an unlikely scenario considering the estimated >800G shipment growth and combined tailwinds from networking switches, where Monolithic has opportunities to provide power across switches, NIC cards, and other processors within the trays.  

Assuming ~15% QoQ for the segment in Q2 (as it is not entirely optics driven but also to account for potential strength in switching) and mid-single digit QoQ in 2H, revenue would project out to $520 million, up more than 68% YoY. Perhaps a bit speculative, moving the needle higher to 20% QoQ in Q2 and 10% QoQ in the back half would project Communications revenue at $555 million, up nearly 80% YoY.  

It should be noted that Monolithic’s presence in 1.6T optics is a bit unclear, as commentary this quarter primarily surrounded 800G modules; however, this may simply be due to timing as we are still quite early in the 1.6T ramp cycle and 800G could account for the bulk of growth and revenue so far. The reason optics and 1.6T (and switches) could emerge as a strong driver through 2026 is because higher power consumption at faster data rates is a critical factor to solve, especially in scale-out as optical transceiver and switch content is projected to increase sharply with Rubin. This is where Monolithic’s expertise lies in offering highly efficient power-dense modules, with CEO Michael Hsing hinting that fast execution is helping them capture the market.  

Goldman Sachs estimates that current optical transceiver (800G/1.6T) to GPU attach ratio for the GB300 racks range between 1:2 to 1:3, depending on cluster architectures in either two or three-layer configurations. With Rubin, GS projects this ratio to increase to 1:4 to 1:6, while spine, leaf and top-of-rack switch counts would increase 1.8-2.2X. This sheer content growth within transceivers supports strong optics-driven growth for Monolithic extending through 2027 as Rubin ramps.  

Near-Term Capacity Plan Increased to $6B 

Monolithic announced last quarter that it had reached its capacity target of $4 billion, and this quarter it unveiled a new near-term capacity target of $6 billion, a 50% increase. Management emphasized that this upcoming capacity will look to be geographically diverse inside and outside of China to preserve supply chain diversity. 

While comments on capacity were limited otherwise, it’s rather imperative for Monolithic to quickly expand beyond the $4 billion mark. Current revenue estimates for FY26 sit at $3.7 billion, meaning immediate capacity expansion will likely be critical in supporting future revenue upside throughout the remainder of the year, and to prevent Monolithic from capping its revenue upside.  

Historically, it can be roughly inferred that it took Monolithic around two years to expand from $2 billion of capacity (around FQ4 23) to the $4 billion mark last quarter, yet this updated plan may need to be accelerated. This could put more emphasis on higher capex, which already reached a record $70.9 million in Q1. 

Quick Note on SiC and 800V 

As we noted in our prior analysis, Monolithic was named as a key silicon provider and industry partner for Nvidia’s planned 800V DC architecture shift, which it believes will be needed to address rising power needs with next-gen rack architectures, from Rubin Ultra and beyond.   

For a quick refresher, Monolithic has begun sampling its 800V solutions and was the first to do so, per the CEO, yet it expects revenue ramps from these solutions to land in 2027 to 2028.  

800V would represent a major shift in where Monolithic Power sits as multi-phase controllers, ICs and PMICs are located on the accelerator board (or motherboard). 800V DC is about rack-level power distribution and this also shifts MPS from specializing in low voltage MOSFET-based devices to offering high voltage Sic/GaN devices in the future.  

While discussions in the past have suggested Nvidia may be seeking GaN solutions, whereas MPS is offering SiC-based ones, management this quarter emphasized that their solutions will remain SiC-based.  

Financials 

Revenue Inflecting in Q1, Accelerating in Q2 

Monolithic’s revenue began to inflect on both a YoY and QoQ basis in Q1, with Q2’s guide implying this acceleration strengthens next quarter. Q1 revenue was $804.2 million, up 26.1% YoY and 7.1% QoQ, accelerating from 20.8% YoY and 1.9% QoQ in Q4. Growth was mixed on a segment basis (discussed in more detail below), with Enterprise Data and Communications leading the sequential growth while Consumer and Industrial showed double-digit QoQ declines.  

For Q2, Monolithic guided for $890 to $910 million in revenue, accelerating to 35.4% YoY and 11.9% QoQ at the midpoint. This would mark Monolithic’s fastest sequential growth since Q4 2024. Management also added that sales channels have been very lean, implying they are shipping at demand levels and suggesting that they are not facing any supply constraints or headwinds to growth.  

For the full year, Monolithic has not provided guidance, though current consensus estimates point to 32.6% growth to $3.7 billion, a roughly six point acceleration from 26.4% growth in FY25.  

Key Segments 

Monolithic’s growth was mixed across its key segments, with Enterprise Data and Communications recording the strongest growth in Q1: 

Enterprise Data revenue was $262.8 million, up 97.7% YoY and 12.6% QoQ and accounting for 32.7% of revenue. Monolithic said the QoQ increase was driven by increased sales of power management solutions for AI and server applications, though QoQ growth decelerated from 21.9% in Q4. YoY growth accelerated 78 points in the quarter. 

Communications revenue was $111.5 million, up 55.5% YoY and 33.1% QoQ, accounting for 13.9% of revenue. This marked a sharp acceleration from 4.8% QoQ and 31.2% YoY in Q4, with growth driven by growth in 800G optical modules and networking switches. 

Storage & Computing revenue was $174.5 million, down (7.5%) YoY but up 7.6% QoQ, accounting for 21.7% of revenue. Storage was the primary driver this quarter with HDD and SSD remaining strong, while notebook revenue remained soft. Monolithic also began sampling its first high-speed interface product for DDR5, but noted not to expect this to be a contributor in 2026. 

Automotive revenue was $152.4 million, up 5.1% YoY and 0.9% QoQ, accounting for 18.9% of revenue. This decelerated from 17.6% YoY while QoQ was roughly steady after being essentially flat in Q4. Auto revenue is expected to be roughly flat in the first half before ramping later in the year.  

Consumer revenue was $54.5 million, down (4.2%) YoY and (17.5%) QoQ, accounting for 6.8% of revenue.  

Industrial revenue was $48.6 million, up 14.2% YoY but down (11.2%) QoQ, accounting for 6% of revenue. 

Margins Improving Down the Line 

Gross margins continue to remain flat with minimal expansion, with management noting headwinds arising in 2H. Operating margins are showing signs of improvement, likely tied to increasing server and optical module growth.  

GAAP gross margin was 55.3%, roughly flat YoY and QoQ, while adjusted gross margin was 55.5%, down marginally YoY and flat QoQ. Management provided some color as to the lack of expansion and flagged headwinds arising in the second half: “For the last 4 quarters, we've been flat at 55.5%, which is at the low end of our gross margin model for growth, which ranges mid-50s to upper 50s. For Q2, as you noticed, we did have the confidence to increase incrementally our gross margins, mainly because we've gotten better visibility to our backlog. We saw this happening in the fourth quarter of last year and it's continued into the first quarter of this year. So that has, again, given us some confidence. We do, however, do see some strong headwinds potentially in the second half.” Management also hinted that yield improvements in modules are still improving, but not creating much of a headwind. 

GAAP operating margin was 30%, up 3.5 points YoY and 3.4 points QoQ and coming in fairly ahead of guidance for 28.3%, suggesting more operating leverage is now appearing. Adjusted operating margin was 35.8%, up 1.1 points YoY and flat QoQ. Management noted that input component costs are rising, but they will look to offset that with price raises to maintain margins.  

GAAP net margin was 24%, up 3 points YoY and 1.4 points QoQ; adjusted net margin was 31.2%, up less than a point YoY and roughly flat QoQ. 

For Q2, Monolithic guided for a tiny step up in gross margins, projecting GAAP gross margin to be 55.1% to 55.7% and adjusted gross margin of 55.3% to 55.9%, both up marginally QoQ at midpoint. GAAP operating margin was guided to be 30.7%, up nearly 6 points YoY and less than a point QoQ; adjusted operating margin was guided to be 36.8%, up 2 points YoY and 1 point QoQ. 

EPS  

Monolithic has a strong bottom line, with adjusted EPS forecast to top $24 this year. However, considering the minimal margin expansion, EPS growth is forecast to largely track revenue growth through the year. 

Q1 GAAP EPS was $3.92, up 40.5% YoY and slightly ahead of estimates for $3.86. Adjusted EPS was $5.10, up 26.2% YoY and beating estimates by 4%, marking its largest beat since Q1 2024. 

For Q2, GAAP EPS is projected to be $4.72, accelerating to 69.8% YoY, while adjusted EPS is projected to be $5.86, accelerating to 39.2% YoY.  

For FY26, GAAP EPS is projected to be $19.40, up 51.4% YoY, while adjusted EPS is forecast to be $24.02, up 35.2% YoY. 

Cash Flows and Balance Sheet 

Cash flows were solid in Q1, with operating cash flow rebounding to north of 30% after a soft Q4.  

Operating cash flow was $250.3 million for a 31.1% margin, down from a 40.2% margin in the year ago quarter but up sharply from 14% in Q4.  

Free cash flow was $179.4 million for a 22.3% margin, down from 33.9% in the year ago quarter but up from 8.5% in Q4.  

Cash and equivalents totaled $1.37 billion, while debt remained zero. 

Inventories jumped nearly 10% QoQ to $619.2 million, while accounts receivable surged more than 18% QoQ to $302.1 million.   

Conclusion 

Monolithic is seeing strong, multi-faceted growth emerge across its Enterprise Data and (unexpectedly) Communications segment, underpinned by a shift to VPD with increasingly powerful GPUs, and its power density and cost advantages stemming from its monolithic approach and flexibility with integrations.  

Enterprise Data remained a core growth driver with revenue up 97.7% YoY and 12.6% QoQ in Q1, marking a third consecutive quarter of double-digit sequential growth. Strong order momentum and increasing visibility led management to raise the segment’s FY26 growth floor from 50% to 85%, a nearly $250 million increase, with upcoming growth levers from next-gen GPU platforms arising in 2H.  

Communications emerged as an unexpected catalyst in Q1 with 800G optical modules driving 33.1% QoQ growth for the segment. Optics could emerge as a strong secondary growth story to Enterprise Data given that >800G optics are expected to increase 2.6X this year, while optical attach rates are expected to surge with Nvidia’s Rubin platform.  

Working to expand capacity to $6 billion, a 50% increase from $4 billion in Q4, is necessary given Monolithic is quickly approaching that $4 billion level and has remained constraint-free on the supply side (so far). Quickly expanding capacity should allow MPS to capitalize on the multiple tailwinds above without becoming constrained.

Damien Robbins, Equity Analyst at I/O Fund contributed to this analysis.

Please note: The I/O Fund conducts research and draws conclusions for the Fund’s positions. We then share that information with our readers. This is not a guarantee of a stock’s performance. Please consult your personal financial advisor before buying any stock in the companies mentioned in this analysis.

Recommended Reading: