

Taiwan Semiconductor (TSMC) is world’s dominant player in semiconductor manufacturing, holding over 70% of pure-foundry market share. Intel’s Foundry business is also sizeable, but nearly all of the company’s foundry demand comes from itself. As Intel looks to scale its external foundry sales, providing advanced packaging capacity through its EMIB-T approach could be a key path forward amid TSMC’s CoWoS constraints. Taiwan Semiconductor (TSMC) is the single, most important company to the AI industry. However, to compete with the incumbent, Intel does not need to beat TSMC at leading-edge manufacturing. It only needs to solve a problem that TSMC may not be able to solve quickly enough. As of Q1 2026, TSMC held approximately 73% of pure foundry market share by revenue, and an even greater share of advanced node manufacturing. Intel’s Foundry revenue, by comparison, was $5.8 billion in Q2, but nearly all of this demand came from Intel’s own chip design division. External Intel Foundry revenue was just $293 million in Q2. Compare this to TSMC’s revenue of $40.2 billion in Q2, which was over 137X higher. The conventional thinking among investors is that Intel needs to “beat” TSMC in developing more advanced node processes to attract significant external demand. In the article below, the I/O Fund challenges this narrative by highlighting one of the AI industry’s key constraints: advanced packaging. CoWoS Packaging vs Advanced-Node Manufacturing Advanced node wafer production capacity and advanced packaging capacity are largely separate processes, creating an opportunity for Intel to capture demand that TSMC may not able to meet quickly enough. Chip dies are produced through advanced node wafer fabrication, while advanced packaging combines dies with high–bandwidth memory into finished AI accelerator designs. TSMC’s advanced packaging method for the AI market is CoWoS (Chip-on-Wafer-on-Substrate). Epoch AI estimates that Nvidia, Google, AMD, and Amazon, the world’s four largest AI chip designers, consumed over 90% of CoWoS packaging capacity in 2025. Meanwhile, they consumed just 12% of advanced logic die production. Chart comparing 2025 consumption of CoWoS packaging, HBM, and advanced logic dies by major AI chip designers. Nvidia, Google, AMD, and Amazon accounted for roughly 90% of CoWoS demand and 92% of HBM demand, highlighting packaging and memory as key AI chip bottlenecks. Source: Epoch AI. TSMC's CoWoS Capacity Expansion Still Cannot Keep Up With AI Demand TSMC has pointed to constrained CoWoS capacity for multiple years at this point. In Q2 2023, TSMC said that it did not have a problem in supporting logic die demand, also called “front-end” demand. However, they said “for the back end, the advanced packaging side, especially for the CoWoS, we do have some very tight capacity to — very hard to fulfill 100% of what customers needed.” In Q3 2024, after more than doubling its CoWoS capacity versus 2023, TSMC said “our customers’ demand far exceeds our ability to supply”. In 2025, industry analysts estimate that TSMC doubled its CoWoS capacity again. Goldman Sachs estimates that CoWoS capacity will also nearly double in 2026, and that from 2025-2027, capacity will more than triple. Chart showing TSMC's projected CoWoS advanced packaging capacity from 2025 to 2027. Capacity is expected to grow from 675,000 wafers per month in 2025 to 1.275 million in 2026 and 2.31 million in 2027. The 2027 forecast represents a significant upward revision from the previous estimate of 1.74 million wafers per year, reflecting accelerating AI-driven demand. Source: Goldman Sachs. TSMC itself expects CoWoS capacity to rise by more than an 80% CAGR from 2022-2027—or a more than 19X increase in just five years. Despite this, TSMC CEO C.C. Wei said on its July 2026 earnings call, “our packaging capacity is so tight that now it limits my customers' growth.” Given that CoWoS capacity could limit AI accelerators’ growth, below we look at ways that Intel is helping to fill the gap for alternative advanced packaging solutions. Intel EMIB-T: Why Nvidia and Google Are Exploring an Alternative to TSMC CoWoS EMIB (Embedded Multi-die Interconnect Bridge) is one of Intel’s advanced packaging approaches, with EMIB-T being the latest evolution. Importantly, Intel notes “EMIB-T enables designs to be converted from other packaging technologies with minimal redesign.” In other words, customers that currently use TSMC CoWoS could design their chips to be compatible with EMIB-T packaging. This could allow for a scenario where TSMC continues to produce leading edge compute dies for customers, but offloads some of the advanced packaging to Intel’s EMIB-T. mid There is a notable, yet unconfirmed report that Google has placed an order to use Intel’s advanced packaging on more than 3 million TPUs during 2028. The same report notes that Nvidia is evaluating EMIB-T for use in its Feynman-generation four-die chip design. This is largely due to design advantages over CoWoS that allow for larger chip packages with less complexity. Amazon may also be interested in using EMIB-T for its Trainium chips. Intel Expects Billions in Advanced Packaging Revenue From EMIB-T Aside from reports, Intel’s CFO Dave Zinsner said in March that the company is “close to closing some deals that are in the billions of dollars per year in terms of revenue on packaging.” Intel’s CEO Lip-Bu Tan, added to this in May saying “And we ask our customer, if you are serious to use our EMIB-T, can you help me on the substrate prepay? They jump on it. So they meant that they show the commitment, they really want our technology. And this is not a few million, it's billions in the next few years.” Tan is not only indicating that Intel’s EMIB-T could reach billions in revenue, but also that customers are willing to help with pre-payments on substrates, which are in a significant shortage as well. This signals that customer interest in EMIB-T is strong enough to where discussions have moved beyond initial evaluations and could be closer to qualification. Why EMIB-T Adoption Could Be a Win-Win For TSMC, Intel and Chip Designers Chip designers adopting EMIB-T could be a mutually beneficial situation for not only these players, but also TSMC and Intel. TSMC’s CEO indicated this much himself on the Q2 call. When asked about EMIB-T gaining traction, C.C. Wei said “we welcome that additional flexibility in the market. And so that will help TSMC's front-end wafer business growth, which is a majority part of TSMC's business. The technology looks good, according to the newspaper. And we hope they will be successful and so that share some of the loading from TSMC.” Wei is affirming the idea that customers using Intel for advanced packaging would allow TSMC to sell more wafers. It’s rare to hear a management team discuss a competitor as the way forward. However, in this case, Intel’s packaging would not necessarily take wafer share from TSMC, rather it would allow TSMC to ship more front-end wafers. How EMIB-T Could Accelerate Intel Foundry Revenue Growth From Intel’s perspective, the multi-billion-dollar opportunities it attributes to EMIB-T could clearly have a huge impact on its external foundry sales, which are currently at just a $1.17 billion run rate. In terms of total revenue, the impact may not be huge but could still be meaningful. As an illustration, achieving $3 billion in annual EMIB-T revenue would be equal to 5.3% of Intel’s LTM sales. However, it is worth noting that from Q2 2024 to Q2 2026, Intel’s LTM revenue increased by only 3.5%. In turn, EMIB-T could also provide a growth lever during a period of growth stagnation. Notably, TSMC said that advanced packaging represented just over 10% of its total revenue in Q3 2025. Holding this figure steady, and using TSMC’s expected total revenue of $166 billion in 2026, the company could generate advanced packaging revenue of over $16.6 billion. Considering this, a $3 billion advanced packaging opportunity for Intel over the coming years may not be unrealistic. Intel’s Q2 Earnings: External Foundry Sales Rise Sharply Versus Q1 Intel had a strong Q1, seeing revenues rise 25%.4 YoY, its highest quarterly growth rate in well over a decade. Notably, Intel Foundry revenue rose 31% YoY to $5.8 billion, but this demand still overwhelmingly came from its own design business. External foundry sales of $293 million accounted for just 5% of overall foundry sales. Nonetheless, it was a positive to see external foundry sales rise 68.3% QoQ compared to $174 million in Q1. The company also noted that customer interest in EMIB-T continues to be “very high”, and that its EMIB-T backlog continues to grow, but did not provide concrete metrics. Related to this, Intel said it was “focused on ramping the technology into high volume and high quality to support customer ramps in 2027.” Intel reiterated its view that advanced packaging was one of several “multibillion-dollar annual revenue opportunities for us in the not-too-distant future.” Overall, the company made meaningful progress in growing its external foundry business, but did not disclose any large customer agreements. Conclusion The investor takeaway is that Intel’s most credible near-term foundry opportunity may be advanced packaging rather than leading-edge wafer manufacturing. In an unexpected twist, TSMC and Intel may be more complementary than competitive. EMIB-T could allow Intel to absorb overflow packaging demand while TSMC continues producing the underlying compute dies, to where the companies work together to increase AI accelerator supply. Advanced packaging is only one of the bottlenecks shaping the next phase of the AI trade. The I/O Fund just released our new 90-page Top 20 AI Stocks for Q3 2026 report, where we identify the companies best positioned across AI accelerators, memory, networking, optics, energy infrastructure and other critical layers of the AI stack. We currently have five positions up more than 100% year to date and ten positions up more than 50%, with many held at high allocations. By comparison, the Nasdaq-100 is up just 13% YTD. Access the Top 20 AI Stocks report now to find out which stocks we believe are positioned to lead in the second half of 2026. Learn more here. Please note: The I/O Fund conducts research and draws conclusions for the company’s portfolio. We then share that information with our readers and offer real-time trade notifications. This is not a guarantee of a stock’s performance and it is not financial advice. Please consult your personal financial advisor before buying any stock in the companies mentioned in this analysis. Leo Miller, AI and Semiconductor Investment Writer at I/O Fund, contributed to this analysis. 👉🏻 Share with a Fellow Investor
Help someone else benefit from this insight. Recommended Reading: Big Tech’s Free Cash Flow is Turning Negative – Who's Next? Big Tech Earnings Preview: Is AI Monetization Finally Catching Up to Capex? Nvidia, CXL, and the Battle to Improve AI Inference Economics Why Nvidia’s Next AI Battle Is About Tokens per Watt
Author: io-fund
Discovery Positions Report – July 2026
The stock setups below continue the recently released Positions Report and are exclusive to our Discovery Members. This report outlines the setups we're currently tracking for potential new additions to our portfolio. Not every Discovery stock appears here — only those that have passed our screens. We've also included a few names not yet discussed in any tier that we see as having a high probability of entering our portfolio in the coming weeks. Vistra Corp (VST) Primary – We are in wave C of 4. We should drop to $120 – $106. This is the buy zone. We have to hold $91. the 5th wave targets are $260 – $371. Alt – We break above $203 – $219.82. this signals the 4th wave is over and constitutes a Big Breakout. Breakout: $203 – $219.82 Breakdown: $91 Lower Target: $120 – $106 Upper Targets: $260 – $371 Constellation Energy Corp. (CEG) Primary – We are in a 4th wave. The final move should target $223.93 – $194. This is the buy zone. the 5th wave targets are $587 – $870. The breakdown zone is $186. Alt – We breakout over $282.77, which invalidates the pattern I’m tracking lower. This would be the buy and supports wave 4 being over. Breakout: the warning is $282.77. The big breakout is $411.04 Breakdown: $186 Lower Target: $223.93 – $194 Upper Targets: $500 – $870 Credo Technology Group (CRDO) Primary – It looks like 5 waves up off the March low. Volume is also expanding, but momentum is not. If we can break over $308.67, and momentum and volume expand, we’ll be in a 3rd wave targeting $619 – $1663. Alt – We breakdown below $175, signaling a large B wave. the targets will be around $80 – $60 Breakout: $308.71 Breakdown: $175 Lower Target: $308.71 breakout or $207 – $175 Upper Targets: $619 – $1663 Seagate (STX) Primary – We are in wave 4 of a larger 3rd wave. We will break below $872 – $786 confirming this scenario. We should find support between $631 – $386 for a buy. We must hold $290 and then turn higher for the 5th wave targets overhead. Alt – We hold $786 and then breakout over $1145. This would signal we are still in the 3rd wave and should push to the next overhead levels at $1403 – $1991. As long as volume and momentum continue to fade, any breakout will likely be a 5th wave, which will eventually give way to the larger 4th wave correction. Breakout: $1145 Breakdown: $700.39 Lower Target: $631 – $386 Upper Target: $1991 – $2997 Western Digital (WDC) Primary – We are in wave 4 of a large 5 wave move. We’ll break below $530 – $433 to confirm this move, then head to the 4th wave Lower Target around $379 – $278. We’ll then head toward the 5th wave Lower Target of $1243 – $5,700. Alt – We hold $433.89, and then breakout over $799.87. This will suggest we are still in the larger 3rd wave, as we push toward $1243 in wave 5 of 3. Breakout: $799.87 Breakdown: $530 – $433.89 Lower Target: $379 – $278 Upper Target: $1243 – $5700 Cloudflare (NET) Primary – NET is setting up for a large 3rd wave breakout. If we break above $276.82 then it will be confirmed. We will want to see volume and momentum expand with this breakout for more confirmation. Furthermore, if we instead drop in 3 waves, and hold $221 – $160, then that would be a potential buy for the coming breakout. Alt – We instead break below $160. This would imply that we are in a larger B wave. This drop would need to be a 5 wave/direct drop and will target $123 – $78. Breakout: The big breakout is $221.64, and we are above it. The next move higher needs to be a dramatic move, and breakout over $276.82. Breakdown: $185.75 – $160 Lower Target: $221 – $160 Upper Target: $1097 – $1630 Monolithic Power (MPWR) Primary – We are in a 4th wave of a very large ending diagonal pattern. We have bro1ken through the critical support level at $1300, which means that the larger correction is likely underway. The targets for this 4th wave are $1051 – $807. We must hold $702 for the ending diagonal pattern to be valid. After the 4th wave, we should see a 5th wave push toward $1871 – $2890. Alt – We push back over $1300 and then breakout over $1605 – $1707.62. If this happens, the 4th wave was very shallow, and we will likely be in the 5th wave heading to the overhead targets. Breakout: $1605 – $1707.62 Breakdown: $1300 Lower Target: $1051 – $807 Upper Target: $1871 – $2890 Reddit (RDDT) Primary – We are in wave 3 of 1 of the larger 3rd wave. This pattern is playing out as a leading diagonal. We really need to push to $260 – $290 to confirm the 1st wave is complete, and then see a 3 wave retrace from that zone. The next move would be a large 3rd wave breakout, targeting $763 – $1000. Alt – We instead break below$140.65. This would signal that we are still in a downtrend and would likely target sub-$100. Breakout: $233 – $282.95 Breakdown: $140.65 Lower Target: $178 – $152 Upper Target: $763 – $1000 Meta Platforms (META) Primary – META is in a 2nd wave. The B wave will fail under $799 and then head toward $452 – $414. We should hold around these levels and then breakout over $799 in a large 3rd wave. Alt – We breakout over $799 directly, signaling that we are in the larger 3rd wave. Breakout: $799 Breakdown: $414 Lower Target: $452 – $297 Upper Target: $6145 – $12874 Palantir (PLTR) Primary – We are in a complex 4th wave on a large scale. We should hold under $139 and then head toward $99 – $82, which would complete the 4th wave decline. We should set up for new highs in the 5th wave. Alt – We breakout over $139 and then $163.70, signaling the 4th wave is likely over. We should hold the low and move toward a larger breakout over $199. Breakout: $139 – $163.70 Breakdown: $112.79 Lower Target: $99 – $82 Upper Target: $243 – $388 Texas Instruments (TXN) Primary – We are in a large ending diagonal. We’ll break below $273 and then head toward $246 – $205 in a large 4th wave. The final 5th wave swing should target $390 – $520. Alt – We break above $334.03 and head to $350 – $390 in an extension of wave 3. Breakout: $334.03 Breakdown: $273 Lower Target: $246 – $205 Upper Target: $390 – $520 Marvell (MRVL) Primary – MRVL is completing wave 4. It is in the lower target zone at $247 – $197. As long as it holds $167.38, we should push higher to $492 – $770. The breakout for this move is $300 – $330.07. Alt – We instead break below $167.36. This would indicate that a much larger top is likely in place. Breakout: $300 – $307.07 Breakdown: $167.36 Lower Target: $247 – $197 Upper Target: $492 – $770 Penguin Solutions (PENG) Primary – We are in an overlapping push higher, which appears to be a leading diagonal. We should hold $59.13 and breakout for a final 5th wave push to $97 – $123. This will complete a 3rd wave, with the 4th wave targeting $66 – $45.50 Alt – We breakdown directly below $59.13, signaling the that we are in the 4th wave. This would set up a buying opportunity that should hold over $40. Breakout: $77 Breakdown: $59.13 Lower Target: $66 – $46.50 Upper Target: $165 – $260 Datadog (DDOG) Primary – We broke out over $199.68 and are consolidating over these highs. We’ll move over $278.81 on expanding volume/momentum, confirming that we are in wave 3 of 3 of 3. The target for this 3rd wave will be $426 – $722. The larger pattern is pointing to +$3000. Alt – We fail under $223.68 in an extended 4th wave. We must hold $167, or else the bullish patten gets negated. Breakout: $199.68 – $278.81 Breakdown: $167 Buy Targets: $202 – $170 Upper Targets: $426 – $722 Bitcoin (BTCUSD) Primary – We are in a complex decline. The next drop will head to $55,000 – $40,000. This will either be the low, or the end of a larger A wave in a larger bear cycle. Alt – We instead hold the recent low and then break above $77,575. This will signal that we are in a larger B wave that should target $82,000 – $105,000. As long as any bounce holds under $105,316 – $126,296, we should head back toward the $30,000 region, which would complete this bear cycle. Breakout: $77,575 Breakdown: $57,718 Lower Target: $55,000 – $33,337 Upper Target: $82,000 – $105,000 Please note: The I/O Fund conducts research and draws conclusions for the Fund’s positions. We then share that information with our readers. This is not a guarantee of a stock’s performance. Please consult your personal financial advisor before buying any stock in the companies mentioned in this analysis. Recommended Reading: Marvell: Strong Interconnect Growth, but Really an FY28 Story Corning: Glass Manufacturing Powerhouse Pivoting Hard into AI Networking Credo: Reliability Leader Aggressively Moves into Optics Macom: Data Center Revenue Accelerating to 35% QoQ in FQ3
GE Vernova Q2: Laying a Strong Foundation for Years to Come
GE Vernova’s Q2 confirms the company is laying a strong foundation, which consequently was the title of the GEV section in our Q3 2026 Top 20 stocks report. The company is well diversified across key products needed for power delivery and power generation. While backlog and orders continue to impress, the growth story remains the combination of pricing power in the Gas Power segment, and accelerating revenue and margins in the Electrification segment. Gas Power is capacity constrained with GEV having an output rate of approximately 20 GW this year, with plans to increase it to 24 GW by 2028, and 30 GW by 2030. Because the company is sold out through 2030, future growth is less about producing more turbines and/or tracking orders and backlog growth, and it’s more about higher equipment pricing and product mix. As you’ll see below, 1H26 equipment orders were priced 20% higher than Q4 2025 levels as higher-priced Slot Reservation Agreements (SRAs) convert into firm backlog. Looking forward, management stated they expect orders in backlog will be greater than SRAs by 2H 2026, translating to more pricing power. According to management, Q4 is expected to be the strongest in the calendar year: “We continue to expect 2026 GE Vernova adjusted EBITDA to be more second half weighted than 2025 with the highest revenue and EBITDA in 4Q '26.” Higher Dollar Per KW is the Growth Story The growth story is found in management commentary on charging higher dollar per kilowatt for equipment. Management stated 1H 2026 equipment orders were priced 20% higher than Q4 2025 levels, indicating pricing power as higher-priced SRAs converted into backlog. Management also indicated that pricing power will continue in 2H 2026: “Given our large SRA balance, we would expect gas equipment orders in the second half to have a dollar per kilowatt at the higher end of the range of 10 to 20 points versus 4Q 2025 orders for services.” We covered the 10-20 point higher pricing in January, with commentary suggesting the pricing power would become more visible over time. At the time, about half of the GWs under contract were eligible to be priced at a higher dollar per KW yet management indicated the mix would increase over time, which in turn, will also improve backlog margins and earnings power: “We expect significant growth again in Power and Electrification's backlog in '26 at better margins as we convert higher-priced gas slot reservation agreements into orders and benefit from strong demand and pricing for grid equipment.” The Q1 update is that 56GWs from Q1 are under SRAs. Pricing strength is also extending into services, as new contracts are signed for service orders alongside the higher pricing on equipment, with the CEO stating: “[…] but if you think about the pricing on the service contract that comes along with a new heavy-duty gas turbine as the pricing is accelerating on the equipment itself, as we sign those new contracts for service orders, we'll see incremental pricing there.” For services, it’s a mix of both volume and pricing, with one-time transactional orders rising “double digits annually as customers invest in upgrades and greater scope and outages all at higher prices.” For our purposes, if we take management’s commentary at face value on the 20GWs to 30GWs output, then growth in gas power is unlikely to come from shipping more turbines. Rather, it will come from higher equipment pricing, service orders, improved time-to-power products in Power (see below), and also a higher mix of electrification products. One thing to keep in mind is labor costs, which was discussed on the call, as fixing any kind of price while there are inflationary pressures across labor and materials could erode margin. Electrification to Help Drive Near-Term Growth Electrification is a strong near-term growth story that can add an impact given Gas Power’s limited 20GW to 30GW capacity. Orders rose 66% organically to approximately $6.3 billion, including 4X growth in equipment-order growth. Although that’s lower than Power’s 134% order growth, Electrification is converting into revenue faster as organic revenue rose 29% compared to Power’s 14% growth. Data center revenue within Electrification totaled $2.7 billion, exceeding $5B in 1H 2026, which is more than 2X what was booked in all of 2025. The growth is also profitable as electrification EBITDA more than doubled while margins expanded 700 bps to 18.4% compared to Power’s 320 bps margin expansion. At least half the fiscal year raise of $1 billion came from Electrification, as well: “In Electrification, we're raising our revenue expectations by $0.5 billion to $14.5 billion to $15 billion due to accelerated output on our capacity plans and better Prolec revenue. We continue to expect Electrification EBITDA margin to be 18% to 20%. Time-to-Power Comes from AeroDerivatives and Combined-Cycle Equipment GEV’s time-to-power products are aeroderivatives and combined-cycle equipment, such as steam turbines that capture heat exhaust from GE’s gas turbines to create electricity. In addition to the Power segments 10 to 20 point pricing power noted above, this also helped to boost dollars per kilowatt because it expands equipment sales into heat recovery systems and steam turbines. For Q2 specifically, management called out these two products as contributors to the pricing power: “In 2Q we booked a higher dollar per kilowatt price in orders given a higher mix of aeroderivatives versus Heavy-Duty Gas Turbines and incremental combined cycle equipment as SRAs converted to orders.” While large heavy-duty gas turbines take years to manufacture and commission, GEV’s website states they can install and operate steam turbines in as little as eight months: “GE Vernova’s steam turbines equip 35% of the world’s combined-cycle plants. Right now there are more than 1,100 combined-cycle steam turbines operating in 70+ countries, generating more than 195 GW of power. Our steam turbines can be installed and operational in eight months or less for industry-leading commissioning.” Notably, competitor Siemens has indicated about 3 years for steam turbines. We’ve covered aeroderivatives in the past, stating ten aero units can produce 1GW of power. Last October, it was stated GEV had secured 27 aero units compared to 1 unit in the previous year, with incoming high demand expected: “Well, there's a need for incremental bridge power and the beauty of aeroderivatives is, they can be commissioned faster and that's needed in the environment today and our customers are able to price at a premium for expedited power […] But in the near term, demand for aeroderivatives is very strong and that's in the U.S. but it's also in global markets” The update in the most recent quarter was that orders for aeroderivatives exceeded orders for heavy-duty units at 61 units in Q2 versus 52 units, respectively. Of the 29 gas turbines shipped, there were 16 aero units. When asked about this in the earnings call, management stated aero units can be shipped as quickly as six months – creating a strong combination of aero orders in the short-term while customers wait for heavy-duty in the long-term. Per the CEO: “Because we also need to remember, even if the shipments are 24 months apart between an aero and a heavy-duty, the commissioning of that aeroderivative is reasonably quick. It could be six months, whereas the ultimate commissioning of the heavy-duty could take another 18 months at site after it's actually shipped from Greenville. So they're in very real ways providing another level of integrated solutions for us where the aeroderivative are providing the bridge. They're buying customer time with the first tranche of incremental electrons, while they're securing the EPC capacity for the early 2030s on those contracts that we're citing today are already signed for 2030 and 2031, and that will be largely sold out of 2030 and more than half of 2031. Part of that dynamic is the complement of aero that comes first and heavy-duty that will be shipped in 2030-2031, but then really commissioned in 2032 and 2033 at site.” Financials: Revenue Accelerates to 22% YoY as Orders Surge 88% GE Vernova reported Q2 2026 revenue of $11.10 billion, up 22% YoY (+12% organically), accelerating from 16.3% YoY (+7% organically) in Q1 2026 and marking the fastest growth rate of the last five quarters. Revenue also grew 18.9% QoQ, well ahead of typical seasonality. However, the headline growth numbers do not necessarily reflect the true strength of Power and Electrification, as Wind provided a rather heavy drag on growth with revenue down (10%) YoY in the quarter. Orders of $24.2 billion grew 88% organically, accelerating from 71% organic growth in Q1. The accelerating order growth provides solid visibility over the next few years, as capacity remains limited to 20GW in the near term with plans to expand to 30GW by 2030. The strong order growth also pushed backlog up $13.0 billion sequentially to a record $176.3 billion, up 37% YoY, remaining on track to reach $200 billion by 2027. One thing to note here on backlog growth is that Q2 marks the third consecutive quarter where backlog growth outpaced revenue growth by 15+ points, suggesting that expanding capacity to increase shipments is key to further accelerating revenue and converting this backlog over to revenue. Gas Power equipment backlog and slot reservation agreements grew from 100 GW to 116 GW in the quarter. Management is now expecting to reach at least 125 GW of gas equipment under contract by year-end 2026 (up from prior expectations for 110 GW), supported by 52 heavy-duty units (including 15 HA turbines) and 61 aeroderivative turbine orders. Electrification data center orders reached over $5 billion year-to-date, more than double the full-year 2025 total, underscoring the segment's growing exposure to hyperscaler grid buildouts. GE Vernova raised full-year 2026 guidance for the second consecutive quarter, with revenue guidance moving to $45.5–$46.5 billion (from $44.5–$45.5 billion) for YoY growth of 20.7% at midpoint. Management raised the organic growth outlook for Power, now projecting 18-20% growth, up from 16-18% previously. Electrification revenue was guided to be $14.5-15 billion, a slight raise from $14-14.5 billion previously. Wind was guided to be down low double-digits. Segment Breakdown Power Revenue to Accelerate to High-Teens in Q3 Power revenue of $5.48 billion grew 14% YoY and organic, with Gas Power revenue increasing 13% to $4.43 billion, benefiting from higher aeroderivative volume and pricing. Growth is expected to accelerate further in Q3 with GE Vernova guiding for 17-19% organic growth. Power orders showed a sharp acceleration in Q2, up 134% YoY organically to $16.7 billion, up from 59% YoY in Q1, with Equipment orders up 259% YoY. Order growth was driven by strength in Gas Power, led by volume and price. GEV signed 20 GW of new gas equipment contracts – 18 GW of slot reservations and 2 GW of orders – driving backlog up 9 GW to 53 GW and slot reservations up 7 GW to 63 GW. To put that in perspective, GEV signed the equivalent of its entire annual capacity in new contracts in Q2, highlighting why gas turbine lead times stretch 3+ years and why revenue growth remains in the teens despite triple digit order and backlog growth, as these new orders simply cannot get out the door. Power segment backlog reached $111.6 billion, with equipment backlog up 143% YoY to $39.3 billion. Electrification Leads with 29% Organic YoY Growth, and 23% QoQ Electrification revenue of $3.64 billion increased 68% YoY (inclusive of Prolec GE) and 29% organically, driven by switchgear and transformer growth and continued strength in HVDC/AC substation equipment. Electrification stood out for its strong sequential growth this quarter, up 22.9% QoQ and 17.6% organic, after being flat QoQ in Q1. Q3 revenue was guided to be $3.8 to $4.0 billion, representing 50% YoY growth at midpoint, a bit of a steep deceleration, and with QoQ decelerating to maintain a modest 6.6% QoQ pace. Electrification orders of $6.3 billion grew 66% organically, with a strong book-to-bill of roughly 1.7x on increasing grid equipment demand, from transformers to switchgear and substations. Equipment backlog rose 69% YoY to $40.6 billion (including $5 billion from Prolec GE), driven by a 72% increase in Equipment orders to $5.67 billion. Wind Continues to Drag On Revenue with Fourth Consecutive Decline Wind remained the lone soft spot: revenue of $2.03 billion declined (10%) YoY and (11%) organic, weighed down by lower Onshore Wind equipment deliveries, a result of soft orders in the first half of 2025. Q2 orders fell (40%) organically on weaker North American Onshore demand. This marked the fourth consecutive quarter of declining revenue for the segment, although growth did inflect from (23%) YoY in Q1. Margins Expand as Adjusted EBITDA Reaches a Record 11.3% Despite Wind’s Challenges Margin expansion was modest across the board in Q2, with gross margin of 21.3%, up 100 bp YoY and 220 bp QoQ. Operating margin was 5.9%, up 170 bp YoY and 400 bp QoQ, benefitting from a small degree of operating leverage but remaining quite thin in the mid-single digit range. Net margin was 5.8%, up marginally YoY and not comparable QoQ due to Q1’s M&A-related gains. Adjusted EBITDA of $1.25 billion grew 62% YoY, with adjusted EBITDA margin expanding to 11.3%, up 280 bps YoY (+340 bps organically to 11.2%), and up 170 bps sequentially from 9.6% in Q1 2026. This marks the highest quarterly adjusted EBITDA margin since the spin-off, driven by higher volume and favorable price across Power and Electrification. Power EBITDA margin reached 18.8% (+240 bps GAAP, +320 bps organically), Electrification EBITDA margin reached 18.4% (+390 bps GAAP, +700 bps organically) on volume, productivity and price at Power Transmission and Power Conversion & Storage. Wind weighed heavily on EBITDA with a margin of (13.6%), down (630) bps YoY as lower Onshore equipment volume and higher Offshore project costs outweighed improved Onshore services. For Q3, Power is expected to see a slight step down to a 17-18% EBITDA margin. Electrification is expected to deliver “modest” sequential expansion while Wind is expected to approach breakeven. For the full year, Power EBITDA margin was guided to be 17-19%, Electrification at 18-20%, while Wind is expected to deliver a ($400 million) loss, essentially maintaining corporate adjusted EBITDA at 12-14% for FY26. EPS GAAP EPS was $2.47, up 33% YoY from $1.86 in Q2 2025, tracking the improvement in net income and margins. This was a notable (22.3%) miss to consensus estimates for $3.18, with GE Vernova flagging $100 to $200 million in increased costs through the remainder of the year from global tariffs. GAAP EPS is expected to increase 163% YoY to $4.31 in Q3, while Q4 GAAP EPS is estimated to reach $6.01, down (55%) YoY against Q4 2025’s $2.56 billion income tax benefit-related print. Cash Flows Strong in 1H, but Expected to be Much Softer in 2H Cash flow generation was the standout of the quarter, though this is not a trend that will continue through the second half of the year. Operating cash flow was $5.49 billion for a 49.5% margin, and free cash flow was $5.11 billion for a 46.0% margin, both up sharply from $367 million and $194 million, respectively, in Q2 2025 — a free cash flow conversion of net income of roughly 787%. While free cash flow was raised significantly for the full-year, with management raising the outlook to $11.5–$12.5 billion, nearly double the prior range of $6.5–$7.5 billion, the fact of the matter is that this implies very little FCF generation in 2H. Management explained that this is because many of their slot reservations signed in 1H will convert over to orders; to put it in dollar terms, FCF in 1H totaled $9.9 billion, leaving just $2.1 billion spread across 2H, or barely $1 billion per quarter. The company ended the quarter with $13.1 billion of cash, while total debt was $2.79 billion. Conclusion (Takeaway) The market is selling the report likely for one of two reasons: the wind segment weighed on the headline numbers, although it’s not the investment thesis, and thus, we give it very little weight. Secondly, repeated discussions on 20GW to 30GW of annual output through 2030 could spook investors if interpreted as a ceiling on growth. As discussed in this post-earnings analysis, GEV can drive revenue and margin expansion through stronger pricing, rapid growth in Electrification, and higher mix of time-to-power solutions such as aeroderivative and steam turbines. GEV is not a stock our analyst team questions. We view it as a low-beta juggernaut and a core holding in our AI portfolio. When we move in or out of the position, it is typically in response to broader risk-on or risk-off market conditions. Please note: The I/O Fund conducts research and draws conclusions for the company’s portfolio. We then share that information with our readers and offer real-time trade notifications. This is not a guarantee of a stock’s performance and it is not financial advice. Please consult your personal financial advisor before buying any stock in the companies mentioned in this analysis. Beth Kindig and the I/O Fund own shares in GEV at the time of writing and may own stocks pictured in the charts. Damien Robbins, Equity Analyst at I/O Fund contributed to this analysis. Recommended Reading: The I/O Fund’s Top 20 Stocks for Q3 2026 AI Networking in 2026: What’s in Motion Tends to Stay in Motion Broadcom Offers Strong AI Growth at Scale; Yet Enters Circular Investing Nvidia Fiscal Q1: Perfect Quarter, Imperfect Catalysts
Marvell: Strong Interconnect Growth, but Really an FY28 Story
Following the last earnings report, Marvell’s stock surged after raising FY27 revenue by $500 million and FY28 by $1.5 billion, with FY28 growth of 45% from a strong base in FY27. For the FY27 outlook, optical networking is driving the raise as interconnect growth was raised from 50% to 70%, across a suite of products including 800G DSPs, an early 1.6T ramp, TIAa and drivers reaching $1B annualized run rate, scale-up from near-packaged and CPOs, and also data-center interconnects (that’s a mouthful!). For our purposes, the custom silicon guide remained underwhelming with $10 billion guided for FY2029, whereas companies like Broadcom have well exceeded that per quarter this year, and AMD will soon, as well. In addition to an underwhelming guide on custom silicon, the fiscal year raise indicates we are still quite a ways out from Marvell’s higher growth period, given the guide for FY28 was 3x higher than the raise for FY27. Overall, Marvell is physically positioned in all of the right places, yet thus far, has been eclipsed by either 800-pound gorillas like Broadcom or agile pureplays in the networking stack. Marvell’s main value proposition is that they own more of the interconnect stack. Leveraging strengths in being first-to-market with 200G/lane DSPs and SiPho engines, Marvell is aiming to benefit from increasing attach rates on both sides of the equation, Nvidia’s GPUs and XPUs. Nvidia’s new partnership with Marvell exemplifies this, bringing Marvell into the NVLink Fusion ecosystem to help hyperscalers build clusters with any combination of Nvidia GPUs and Marvell’s interconnects. However, the concern with Marvell has rested with its margins and bottom line. For most of the last seven years, Marvell has struggled to consistently maintain positive operating margins with the bottom line residing in the negative. Marvell is trying to build some momentum on the bottom line through FY28 after flipping to positive territory in FY26. Marvell Aiming to Offer End-to-End Solutions from Component to XPU Although it sits in quite a competitive market, Marvell is leveraging its strength across interconnects and aims to offer end-to-end solutions from component to XPU, spanning scale-up, scale-out, and scale-across applications. As we pointed out in our Networking thematic: “Scale-out is the main area where growth is arising for the optical module and interconnect suppliers with the transition to 1.6T underway. This primarily stems from an expected surge in >100K clusters over the coming six quarters, with scale-out being the only method of expanding Nvidia-based cluster sizes at present considering its roadmap across Blackwell, Blackwell Ultra and Rubin’s first iteration stay at the same scale-up domain of 72 GPUs. Scale-up optics could represent one of the larger growth opportunities for the optics industry, creating a substantial multi-billion dollar market as optics moves within the rack come 2027 to 2028. Discussions regarding scale-across networking are popping up more as it relates to inference, but it may be more of a 2027 and beyond story.” To start chronologically on scale-out, Marvell is aiming to leverage its first-to-market cadence for in-demand 200G/lane DSPs for 1.6T optics, and maintain this cadence with 400G/lane PAM4 DSPs for future 3.2T designs. Marvell’s broad portfolio of surrounding components, from TIAs to drivers, are expected to ramp quickly in FY27, after entering production in 2H FY26, with management expecting these components to reach a $1 billion annualized run rate in the next few quarters. Marvell is also extending its Ethernet switching portfolio from 51.2T to 102.4T speeds, forecasting scale-out switch revenue doubling YoY to $600 million in FY27 and reaching $1 billion by FY28. Scale-up is where Marvell sees that main advantage arise – its ability to offer full end-to-end solutions, from optical components, solutions for NPO and CPO, to switches and XPU-attach with support for any scale-up protocol. This allows customers to flexibly architect data centers for any type training or inference-optimized deployment. Management explained that customers are wanting to have XPUs integrate to the same photonics elements on the switch and component side, with Marvell supply both the XPUs and switches as well as all of the optics in between: “Scale-up is almost a perfect example where a customer can work with us on the entire rack-scale infrastructure upfront. We can design all the chips for them, the entire signal path and give them different optimization paths, which is a fairly unique ability. There's not that many other people which you can do it in the world today.” For scale-across, Marvell offers coherent DSPs and integrated ZR/ZR+ modules, spanning 400G, 800G and 1.6T, with management having a line of sight to $1 billion in annualized DCI module revenue during FY28, or double the $500 million in revenue achieved in FY26. Marvell was also the first to introduce coherent-lite products, optimized for extremely lower power envelopes versus coherent DSPs, and primarily serving campus DCI applications with the first 1.6T solution now shipping. Marvell has other growth outlets in XPU attach and CXL-based solutions, which we covered in detail in our recent two-part free newsletter, as well as emerging technologies such as microLEDs for future optical solutions and photonic fabrics. Marvell Raises Interconnect Growth to >70% from 50% Previously Marvell is seeing momentum continue to strengthen for its Interconnects business, now guiding for Interconnect revenue growth of >70% in FY27, raising this from 50% in Q4 and a 40-point increase from its original guide for 30% growth. However, the main concern is that this new growth forecast is not outpacing hyperscaler capex growth, which is tracking towards the low/mid-70% range currently for 2026, suggesting share-based gains might be limited. With Interconnects stated to be roughly half of Data Center revenue in FY26, or ~$3 billion, this would project FY27 revenue of at least $5.1 billion. Marvell has not put an exact percentage guide out for FY28, rather explaining that they expect Interconnects to continue to outpace capex growth (questionable), which they see moderating to the 30% range, driven by a substantial step up in 1.6T revenue complemented by contributions from scale-up and scale-across. Management faced an important question about this conservatism on growth and capex: Ross Seymore
Deutsche Bank AG, Research Division I want to go to the interconnect side of things. Matt, you talked about the growth rate going to, I think, over 70% this year. If I recall right, it was at the beginning of this year, 30% and then 50% and now 70%. So it's clearly accelerating. I guess the question is, why would you think other than just conservatism that, that would slow to kind of closer to, but still above the hyperscaler CapEx rate next year? Is that just conservatism? Or because everything that you rattled off before about the DCI side of things, AEC, 1.6, the scale up, et cetera, et cetera, all sounds like those are still very, very strong tailwinds. So I just wanted to get a little more color as to what you're thinking in fiscal '28 for that business. Matthew Murphy
CEO & Chairman I think when you look out to next year, I think this is where we are today. But if you start building a bottoms-up model, you can see that there's definitely a possibility for a lot of upward bias because our traditional business in DSPs, right, obviously, we talked about a big step-up next year in 1.6T that's higher content. You have DCI ramping. You have the new initiatives, things like retimers and AECs, but also you have scale-up optics, which we're effectively calling at this point to be about $300 million, which is true NPO and CPO-based solutions. This is like the beginning of a major growth cycle for us. So I think there's a lot of optionality is what I would say at the moment, Ross. But I think today, net-net, you look overall, 16.5 where we're comfortable overall, but I think there's upward bias for sure.” Baking in a bit of upside and assuming slightly faster growth at 40% in FY28, this would project Interconnects revenue to be ~$7.2 billion. When combined with custom silicon at ~$4 billion, the two would roughly be contributing $11.2 billion in revenue for the Data Center. For example, in a speculative scenario where Interconnects move to 90% YoY growth in FY27 and 50% in FY28, supported by strong 1.6T, DCI and scale-up demand, this would roughly estimate revenue to reach $5.7 billion and ~$8.6 billion, respectively. All else held equal, this could push FY28 revenue towards $18 billion. Such a trajectory is likely what is needed (or higher) to drive upside from current levels, considering the $16.5 billion looks to be largely priced in especially with the recent ascent in valuation. No ‘Wow Factor’ for Custom Ramping to $10B by FY29 Up to this point, Marvell’s primary custom silicon customers were said to be Amazon for its Trainium2 program (its lead customer) as well as Microsoft for its Maia 100/200, as it was rumored to have lost the Trainium3 design to Taiwan’s Alchip. It was also reported in April that Google was possibly in discussion with Marvell over a TPU or memory processing unit design. Marvell noted in Q1 that they have a new Tier 1 XPU program ramping into volume production, with firm requirements in place for all of FY28. Custom silicon currently represents a much smaller portion of Marvell’s Data Center segment, at $1.5 billion in FY26 or roughly 25% of segment revenue, yet management stood firm on its forecast to ramp quickly to $10 billion by FY29 (Jan 2029), or more than 6X growth in just three years. However, there is no ‘wow’ factor to this growth, as this $10 billion forecast is essentially in line with management’s guidance from a year ago, and only a $2 billion raise from 2024, whereas Broadcom is quickly moving towards >$100 billion: “At our custom silicon event last summer in June of 2025, we then said basically the TAM is bigger. So the implied again, if we achieved our share targets in fiscal '29, would indicate something over $10 billion. It was like a $55 billion TAM. Take 20% on that. That's $11 billion. So call it in that range. And yes, we're still tracking to it. … We definitely see line of sight to hit those targets.” Although there has been no change to that upper target at $10 billion, a key area of concern given the traction competitor Broadcom is seeing for its custom suite, the acceleration into FY28 and FY29 still is strong. To offer some perspective, Marvell guided for roughly 20% growth in custom revenue in FY27 last quarter, maintaining that guide in Q1. This would project custom revenue out to roughly $1.8 billion this year. For FY28, Marvell guided for custom silicon revenue to more than double, with analysts pegging this at $4 billion, or roughly 28% of Data Center revenue. Marvell shed some light on its XPU revenue split for FY28’s outlook, noting that this growth would be “1/3, 1/3, 1/3 in those different buckets, the existing programs, XPU attach and then in our new program,” implying each of the three running at ~$1.33 billion each under a $4 billion assumption. This would roughly assume $6 billion in YoY growth needed in FY29, or ~150% YoY, to reach management’s $10 billion target, or a 130 point acceleration from FY27. Marvell is sticking with its roughly 1/3 split across existing XPUs, attach and the new XPU, noting explicitly that XPU attach would be roughly $3 billion with $1 billion each from CXL and custom NICs. Acquisitions Expanding Product Roadmap to 3.2T DCI, Scale-up Switching, Both to be $1B+ by FY28 Marvell closed its acquisitions of XConn and Celestial AI in Q1 while also acquiring Polariton, expanding its product roadmap and improving its positioning in future growth outlets from CXL to CPO to scale-up switching. The acquisition of XConn puts Marvell more directly in competition with Astera, bringing advanced PCIe 6.0 solutions and CXL switches to its portfolio, and expanding its presence in scale-up switching. This is where management believes they have a key advantage via an ability to support all scale-up switch protocols, from internally developed UALink and ESUN switches as well as its new NVLink Fusion integration. Marvell is optimistic about its scale-up switch growth, with management expecting revenue to double to more than $600 million in FY27 before reaching $1 billion annualized in FY28. Marvell also noted that it has multiple engagements with Tier 1 customers for scale-up switches, with each presenting a multi-billion dollar lifetime opportunity. Building on its expertise in electro-optics, Marvell is aiming to play more in next-gen optical solutions including NPO (near-packaged optics) and CPO, as well as photonics-based scale-up fabrics with its acquisitions of Celestial AI and Polariton. Marvell has multiple Tier 1 engagements for Celestial AI’s 6.4T light engine for NPO and CPO deployments, while Celestial’s photonics scale-up fabric has been selected by a Tier 1 customer for a next-gen XPU scale-up deployment. However, revenue from NPO/CPO is expected to be rather immaterial in FY27 with the ramp landing more in FY28, with management projecting $300 million in revenue contribution next year, double its prior view. Marvell acquired Polariton for its plasmonic-based modulation technology, which it says offers “meaningful advantages” over traditional SiPho by enabling 10X modulator bandwidth at up to 1 terahertz. Marvell believes that this low-power plasmonic tech will be critical in supporting faster data-rate optics, planning to incorporate the tech into its future 3.2T DCI and coherent-lite road maps. Similar to scale-up switching, Marvell is expecting DCI to also reach $1 billion annualized by FY28 (doubling from FY26), building off its lead with the industry’s first secure 1.6T ZR/ZR+ modules incorporating its 2nm DSPs, sampling later this year. While it is still early, Polariton’s tech could give Marvell a bandwidth and power advantage when it comes to 3.2T. $2 Billion Nvidia Investment, NVLink Fusion Integration Following its spree of billion-dollar partnerships across the optics industry, Nvidia struck a strategic partnership with Marvell covering three main fronts – optics, NVLink Fusion, and AI-RAN — alongside a $2 billion investment. Of the three, optics and NVLink Fusion carry the most importance for Marvell’s Data Center growth story. For optics, Marvell explained that it has been a key supplier for DSPs, TIAs and drivers, and it is now extending this partnership with Nvidia to collaborate on SiPho, primarily for scale-up networking applications. NVLink Fusion is perhaps a more important (or most important) facet of the partnership, as entry into the NVLink Fusion ecosystem means Marvell’s custom chips and interconnects can seamlessly integrate with Nvidia’s hardware stack. Marvell executives explained that NVLink Fusion means “now you can have hyperscalers being completely fungible in terms of how they design their network,” mixing and matching Nvidia GPUs or networking with custom chips in whatever fashion they desire, with Marvell bridging between both ecosystems. Essentially, data center designs no longer will be limited to custom or merchant, but rather now can be constructed with complete hardware flexibility. For AI-RAN, Marvell’s Octeon base station processors can now work directly with Nvidia’s GPUs, enabling telecom operators to run 5G, 6G and high-performance AI applications on the same hardware concurrently. Financials Overview Revenue Reaccelerating in Q1 and Further in Q2 Marvell delivered record Q1 FY27 revenue of $2.42 billion, up 28% YoY and 9% QoQ. The YoY growth trajectory has been volatile: 63% (Q1'26) to 58% (Q2'26) to 37% (Q3'26) to 22% (Q4'26) to 28% (Q1'27), meaning YoY growth decelerated sharply through most of FY26 before reaccelerating in Q1'27. Sequentially, growth has steadily accelerated after a slight dip in FQ3: 6% (Q2'26) to 3% (Q3'26) to 7% (Q4'26) to 9% (Q1'27), the strongest QoQ print in the trailing five quarters. Management guided FQ2 to grow double digits QoQ, currently projected as a further acceleration to 11.7% QoQ from Q1’s 9%. Management provided visibility into revenue through the back half of the year, expecting both FQ3 and FQ4 to also see double-digit QoQ growth, with Q3 expected to hit the $3 billion revenue milestone (up 45%), one quarter ahead of management’s original expectation, and Q4 seeing YoY growth approach 50%. AI Revenue – Data Center Growth Accelerating to Mid/High-Teens QoQ Data center revenue hit a record $1.83 billion , up 27% YoY and 11% QoQ. Similar to overall revenue, YoY growth decelerated from 76% (Q1'26) to 69% (Q2'26) to 38% (Q3'26) to 21% (Q4'26), then reaccelerated to 27% in Q1'27. QoQ growth has inflected higher: 4% (Q2'26) to 2% (Q3'26) to 9% (Q4'26) to 11% (Q1'27). Management guided Q2 data center growth to accelerate further into the mid-to-high teens QoQ. For the full year, Data Center was guided to rise 50%, raised from 40% previously, again driven by the >70% growth in Interconnects. Key Segment Breakdown Marvell reports in two segments, Data Center and Communications and Other. Communications and Other revenue reached $585.1 million, up 29% YoY and 3% QoQ — the smallest QoQ gain in five quarters. Growth is expected to be 10% for FY27 for the segment. Margins to Step Higher in Q2 after Underperforming in Q1 GAAP gross margin expanded slightly to 52.1%, up 1.8 points YoY and marginally QoQ, while adjusted gross margin slipped less than a point to 58.9%. Q2 is expected to see a slight step-up to 52.6% for GAAP gross margin. Marvell underperformed on GAAP operating margin in Q1 due to acquisition-related impacts, with Q2 expected to see a bit of a step higher as these costs clear. GAAP operating margin remained roughly flat YoY at 14.0%, but came in well below the 17.9% guide, while adjusted operating margin held roughly flat at 35%. Q2 was guided to see GAAP operating margin rebound to 17%. GAAP net margin was a thin 1.4%, down from 9.4% a year ago; adjusted net margin was 29.7%, up from 28.5% a year ago. Moving forward, Marvell is eyeing increasing operating leverage arise in FY28 as FY27 faces ~$2.45 billion in acquisition related cost impacts. Management projected FY28 adjusted opex growing mid to high-teens versus 45% for revenue, driving them towards the upper end of their target adjusted margin model of 38-40%. This leverage and improved margin trajectory, especially for GAAP operating margin, will be critical as margins have been a main concern for Marvell in the past. EPS GAAP diluted EPS was $0.04, down 80% YoY due to $250.7 million in acquisition-related charges; adjusted EPS was $0.80, up 29% YoY. Marvell is guiding for a healthy recovery in GAAP EPS in Q2 to $0.37, +/- $0.05, up 68% YoY, while adjusted EPS was guided to be $0.93, +/- $0.05, up nearly 39% YoY. Profitability is expected to improve each quarter through the end of FY27, with GAAP EPS estimated to step up to $0.54 in Q3 and $0.68 in Q4. This is key to watch considering Marvell is aiming to drive profitability higher via improved operating leverage yet has struggled historically to maintain a positive bottom line. Cash Flows Operating cash flow was a record $638.8 million for a 26.4% margin (up 8.8 points YoY), while free cash flow was similarly strong at $482.6 million for a 20% margin (also up 8.8 points YoY). Marvell is expecting $1 billion in prepayments this year to lock in future capacity to support growth, with payments beginning in Q2. Inventories were $1.4 billion, roughly flat QoQ. Cash and equivalents totaled $3.84 billion while debt totaled $4.96 billion. Conclusion: Marvell offers a path to participate in a more complete connectivity solution, which could prove key if the components Marvell offers excel in becoming optimized for lower latency or lower power. This includes the components that sit closest to the custom XPUs they offer, such as SerDes, switching, optical DSPs and silicon photonics. The technical setup right now in Marvell is favorable, yet the fundamentals are somewhat muted compared to hypergrowth networking competitors, at least until we get to FY28 (barring any unforeseen earnings surprises, which are possible). Given FY28 is already guided to 45% growth with comparatively low operating expenses, it’s as much of a bottom line story as top line – something I did not think I would ever say about Marvell. Please note: The I/O Fund conducts research and draws conclusions for the Fund’s positions. We then share that information with our readers. This is not a guarantee of a stock’s performance. Please consult your personal financial advisor before buying any stock in the companies mentioned in this analysis. Damien Robbins, Equity Analyst at I/O Fund contributed to this analysis. Recommended Reading: Corning: Glass Manufacturing Powerhouse Pivoting Hard into AI Networking Credo: Reliability Leader Aggressively Moves into Optics Macom: Data Center Revenue Accelerating to 35% QoQ in FQ3 Monolithic Power: Enterprise Data Growth Boosted by 35 Points, 800G Optical Growth Appearing
The I/O Fund’s Top 20 Stocks for Q3 2026
The AI trend is bringing to light major limitations in how institutions and hedge funds are participating in this secular technology cycle. I believe the biggest pain point in Wall Street today is that owning AI’s safest choices, such as Nvidia, Google, Microsoft or Amazon, results in immense opportunity cost. This past year, the Magnificent 7 has not been so magnificent, but rather has lagged the QQQs, along with any AI portfolio that was not bold enough to concentrate across the varying layers of the AI stack. If 2026 has proven anything, it’s that the largest gains are coming from technologies that are deeper in the stack. This spans memory, networking, optics, power, cooling, custom silicon, and many other bottlenecks. For institutions, being first to a trend or concentrating in a lesser-known name creates career risk, and therein lies one of the greatest advantages of being a truly independent firm like the I/O Fund. In a cycle like this, identifying the company is only half of the battle. The harder challenge is having the conviction to hold it at an allocation large enough to matter. A so-called active strategy that owns 1% or 2% of a position in a multi-bagger may protect an investor from looking wrong, but it’s rarely enough to outperform. One of our best moments of outperformance came in April 2026, when we owned four of the top ten best-performing stocks during the Nasdaq-100's strongest rally in six years. We launched our verified portfolio in May of 2020; a nice moment to come full circle and track the progress we have made. This rally was particularly challenging for conservative AI investors as the Magnificent 7 and other well-known names did not participate much. Currently, in the face of immense volatility, we are holding strong with five positions above 100% YTD and ten positions up more than 50% YTD. The five positions up more than 100% – with most held at our highest allocations of up to 10%+ include: BE, AAOI, LITE, MU and SNDK. An additional five positions are up more than 50%: AEHR, CLS, GEV, ALAB and AMD. This is serious work, but we also want to have fun doing it. We will not get every call right, and there should be a sense of levity in that. But when we do get it right, we want our I/O Fund members to feel they are getting something unique. More than anything, what drives our team forward is hearing from Members how our work has impacted their lives. We received one email recently that captured the exact mission that drives us every day – which is to level the playing field for individual investors. Source: I/O Fund Reviews It has taken seven years to get to the point where the I/O Fund can say that retail investors have an equal playing field as institutions. All the quants in the world, and all the business handshakes on Wall Street, are not beating what a small, disciplined team is producing. On a cumulative basis, we have outdone Wall Street’s very best investors – which is saying a lot given their ability to fund large 50-person analyst teams, run the most elite quant systems, access extensive sell-side and buy-side research, meet directly with tech management teams and gather end-to-end supply chain signals. It is astonishing that we are keeping pace with this – and we are doing it to where individual investors can join us. For those who have been with us for some time, I hope it’s abundantly clear that we do not coast on past-performance. The 90-page report below helps to substantiate this claim. Section 1: Thematics Overview 1. AI Accelerators Custom Silicon Could Overtake GPUs by 2028 To anyone following our coverage, the assertion that custom silicon could overtake GPUs should not come as a surprise. Last quarter, our Q2 Top 15 report prepared our research members for the eventual erosion of Nvidia’s leading market share in AI accelerators, citing aggressive industry forecasts that call for custom silicon to surpass GPUs in shipments by 2028. On a technical level, inference is more repetitive and generally requires less compute than training. Once a model is trained, it may be run millions of times per day, creating a very different set of requirements than the experimentation-heavy training phase. This reduces the need for deep CUDA integration, which up to this point, has been Nvidia’s moat as it offers extensive libraries for optimizing, experimenting and debugging. Instead, serving platforms and inference frameworks such as vLLM and TensorRT-LLM are helping reduce the dependency on developing within a specific software ecosystem like Nvidia’s CUDA. There is also a broader push toward open standards in inference, with the goal of reducing reliance on hardware-specific code in serving paths. Tools such as ONNX Runtime, vLLM, and the Triton compiler help export or compile models so they can run more agnostically across different AI accelerators. Overall, the open-source ecosystem is becoming a more serious contender to proprietary optimization software such as TensorRT-LLM. Community-driven alternatives, including vLLM and SGLang, are increasingly capable of accomplishing similar goals, which further weakens the software lock-in that has historically protected Nvidia’s GPU dominance. These intricacies matter because CUDA has long been one of Nvidia’s strongest sources of vendor lock-in. As inference workloads scale, larger players such as Cloudflare will build their own custom engines, while smaller players can diversify away from Nvidia’s expensive GPUs. The developments above are important stepping stones, yet major ground was gained this past quarter as Google announced it will begin to sell merchant TPUs. In the I/O Fund analysis “Google TPU v8 vs Nvidia: How Inference is Rewriting the AI Market,” it was stated: “In April, Google announced it would begin selling its TPUs to select third-party data center operators, which is something the market has anticipated for nearly a decade. The TPU-versus-Nvidia-GPU debate has long fueled both bulls and bears; yet it may finally carry real stakes. Google’s announcement is far from a coincidence—it is driven by several converging factors that make now the right moment to move. As hyperscalers look to monetize their models, AI workloads are expanding from training to inference. This changes the focus away from accumulating expensive compute to a very different goal, which is lowering cost per token in order to scale inference economically.” Anthropic‘s commitment to merchant TPUs versus Amazon’s in-house Trainium chips helps to quantify the importance of Google’s strategic announcement this past quarter. Today, Amazon is Anthropic’s primary cloud provider, with the R&D lab committing $100 billion over the next ten years to AWS, allowing it to secure up to 5GW of new capacity. However, one report suggests that it's commitment to Google Cloud is worth $200 billion over the next five years—or double the spending in half the time. Google may be the first hyperscaler to push custom AI accelerators into the third-party data center market, but it is unlikely to be the last. Amazon is the most obvious next contender, while Microsoft and Meta are likely to ramp their custom silicon primarily to lower their own infrastructure costs. Arm is entering the merchant CPU silicon market with its AGI CPU, positioning the company beyond IP and compute subsystems. The next few years will be an exciting time to be an I/O Fund member as diversifying away from Nvidia’s GPUs and its proprietary stack will open more opportunities across high-speed networking, optical interconnects, advanced packaging, memory and memory-enabling technologies, cooling and thermal management – and of course, power. Nvidia has an Advantage Should There be Supply Chain Disruptions Let’s play devil’s advocate, as Nvidia holds an advantage that should not be overlooked, which could hypothetically surface if the supply-chain is disrupted beyond the accelerator companies themselves. CoWoS is perhaps the clearest example of Nvidia’s supply chain advantages, as it has secured the majority of TSMC’S CoWoS supply, helped by the sheer scale of Nvidia’s revenue and cash flows. For 2025 and 2026, Nvidia is expected to have secured more than 55% of TSMC’s total CoWoS supply, leaving less than half to be shared across Broadcom, AMD and its other competitors. This is also evident within the optical landscape, as Nvidia has several multi-billion dollar deals to lock in multi-year supply, including with Coherent and Lumentum. There are also rumors Nvidia may look to secure long-term substrate deals for CPO. The math is quite simple — Nvidia reported $119 billion in supply-related commitments last quarter, more than doubling in just two quarters – a scale that none of its competitors can afford. The scale of its free cash flow, also at $119 billion over the last four quarters, offers Nvidia the edge to pay substantial premiums, lay down large pre-payments, and lock in multi-year supply agreements simultaneously. This protects Nvidia if there is a shortage in wafer and CoWoS capacity at TSMC, constrained HBM4 supply from Micron, SK Hynix and Samsung, or scarce networking components and materials. On the flip side of this, Broadcom, AMD and Marvell would be more exposed. 2. Memory: AI’s Biggest Bottleneck Double-Clicking on Context Windows: Model complexity and the KV cache are two primary drivers of increased HBM demand, especially as it pertains to inference deployments. Increasingly complex models are being trained and deployed for multi-step inference or agentic tasks, requiring larger context windows. Context windows represent the amount of information that the model can remember at a given time to execute tasks, with window length increasing dramatically over time, such as for OpenAI’s models. For example, according to Artificial Analysis, OpenAI’s GPT-3.5 Turbo, released in 2023, had a context window of just 4k tokens. This increased to 128k tokens in GPT-4.5 Preview in early 2025, while OpenAI’s latest model, GPT-5.5 (xhigh), has a context window of 922k tokens, a 230X increase in the span of three years. Chart showing the context windows of three OpenAI models. GPT-3.5 Turbo’s context window is 4k tokens, increased to 128k tokens in GPT-4.5 Preview, while OpenAI’s latest model, GPT-5.5 (xhigh), has a context window of 922k tokens. Source: Artificial Analysis We can roughly put in perspective potential memory requirements for frontier models, using OpenAI’s GPT-4 with an estimated 1.8T parameters and a 128K context window as a benchmark. At FP8 precision, storing the model weights would require 1.8TB of HBM capacity (at 1 byte per parameter), while a 25% activation buffer would add 450GB. On a single Nvidia GB200 NVL72, this would leave roughly 11.1TB of HBM capacity free for the KV cache. Assuming 120 layers and a hidden size of 16,384, KV cache requirements per token would be ~3.9MB at FP8, meaning one NVL72 could in theory support maximum tokens of ~2.85 million, or around 22 concurrent requests at the max 128K context window. This problem becomes further multiplied as inference demand grows, resulting in more requests from many concurrent users. Consider that OpenAI has dozens of production models available and over 900 million weekly activeusers, implying that at peak usage it could be handling tens of millions of concurrent requests, each consuming KV cache memory. In other words, longer context windows are turning memory capacity into a direct constraint on AI revenue growth, reinforcing our view that HBM remains one of the most important bottlenecks in the AI stack. Why the Memory Surge Could Sustain Longer than Expected: Here are a few key points as to why the memory surge could sustain at least another year, if not longer: Memory has grown at a 198% CAGR over three years: To put into context how fast the HBM market has grown, consider that the HBM market was at $4 billion in 2023 compared to $34.6 billion in 2025. Taking the $3.9 billion2023 estimate, the HBM market grew by an astounding 198% CAGR from 2023-2025. Notably, BofA forecast additional growth of 58% YOY to $54.6 billion in 2026. Adding to this outsized growth, Micron stated last week that HBM TAM will reach $100 billion in 2027, whereas it was previously estimated to reach $100 billion in 2028, setting up for nearly a doubling from 2026 levels. Building more capacity was not feasible in 2023: Considering this growth rate, making capacity investments at the scale required to balance supply and demand was antithetical to the position of memory suppliers in 2023. Even if they wanted to, actually achieving this would not have been feasible, given that increasing production capacity is a lengthy and expensive process. Notably, these three companies reported cash flow losses of $18.5 billion in 2023. HBM Requires 3X the Wafers: One of the key factors contributing to conventional DRAM tightness is memory makers reallocating capacity away from these products and toward higher-margin HBM. Importantly, this move from conventional DRAM to HBM does not translate into a 1:1 shift in bit supply. Current generation HBM3E requires approximately 3X the wafer capacity per GB compared to DDR5. This makes the strain on conventional DRAM exponentially worse. Larger Context Windows are a Primary Catalyst: Model complexity and the KV cache are two primary drivers of increased HBM demand, with inference workloads requiring larger context windows. The reason this sharp increase in context windows is important for the memory thesis is because context windows define the potential size of a model’s KV cache, or the actual working memory that a model continually references during inference. HBM is particularly as the goal is to keep as much of the KV cache on HBM as possible. Management Commentary Suggests Shortages through 2028: Micron's VP of Marketing, Christopher Moore, said in a January interview, “you're not really gonna see real output, meaningful output by the time we get all the qualification done and customers are accepting it and you get the tools, everything up and running until 2028.” In a May interview with Bloomberg, Micron CEO Sanjay Mehrotra echoed this, saying, “we see that meaningful new supply in the industry doesn't really start ramping until 2028 timeframe.” In its latest earnings report, Micron added “Even as we expect industry supply to improve gradually in 2028, we currently do not have line of sight as to when memory supply will be able to catch up with increasing demand." Here is a bombshell quote from SK Hynix CEO Kwak Noh-jung: “We forecast that next year will be the worst year in the industry's history from the supply perspective. We still forecast that customer demand will remain higher than our supply capacity even beyond 2030.” NAND flash SSDs are also facing a supply crunch: Larger model training data sets are driving higher demand for storage like SSDs, and SSDs are also becoming increasingly relied on to solve KV cache bottlenecks in inference. The CEO of Silicon Motion has stated the supply of NAND in 2027 will worsen compared to 2026 as NAND suppliers tell the company that CSPs and data center operators continue to increase their demand. These comments are particularly telling, as they come from a controller supplier rather than a NAND maker itself. Specific to NAND, SanDisk’s CEO said at the JPMorgan Technology Conference, “We see this market undersupplied for a long period of time.” More specifically, he noted that in 2025, the company had a “clear point of view” that the market would become undersupplied through 2026. He added, “And I think we can say through the end of '27, we have that same level of conviction now.” Memory Pricing Dynamics: SK Hynix has reportedly removed price caps in its long-term memory supply agreements, with the new structure reportedly allowing spot market increases to be fully reflected in contract pricing when supply shortages push higher. According to Global Economy News, SK Hynix is the only major memory supplier not applying a price cap in its long-term agreements. To contrast, Micron has disclosed SCAs that have set a price floor and ceiling with the cap tied to market levels from April to June. As management stated: “The price gets negotiated every quarter based on market conditions, the price cannot exceed the ceiling no matter what, cannot go below the floor no matter what. And consequently, the value of these agreements can be readily determined.” However, one key detail is the cap does not apply to newer generations of HBM, DDR6 and LPDDR6, which will be priced separately at higher levels. This helps to preserve the upside from AI while locking-in attractive pricing and margins on the current generations become commoditized. That is why the stock reacted positively following the earnings report, despite the mention of a ceiling. Here was the key statement: "Transitions like LP5 to LP6, DDR5 to DDR6 and newer generations of HBM all come with rising bit costs… Our customer SCAs provide for appropriate price premiums for such new products to be negotiated in the future.” Micron also stated their customers would like to lock-up more supply, but Micron is “unwilling to do so right now, these SCAs contain volumes that are less than customers would actually like to sign up for. And in fact, in a lot of these negotiations, we spend a lot of time helping customers understand that this is all we can do in this time frame.” Q2 Pricing Data: If you follow me on X, you'll see that from time to time we publish pricing estimates for memory suppliers. Our most recent estimates are as follows. In April, it was expected that conventional DRAM contract prices will rise 58% to 63% quarter-over-quarter in Q2 2026, while NAND Flash contract prices will jump 70% to 75% QoQ, according to TrendForce. The final numbers published by TrendForce on July 3rd show actual numbers came in close to estimates for DRAM up 58%-63% as expected, with NAND pricing coming in lower (but still impressive) at 55% to 60% QoQ. However, UBS has published lower numbers for both DRAM and NAND. Excluding LTAs, DRAM is estimated to have grown 67% QoQ and blended NAND is expected to be up 43%. Micron continues to show strength as its fiscal quarter ending in May reported DRAM ASPs rose in the low-60%s and NAND rose in the mid-80%, likely benefiting from stronger pricing in March given the off-quarter reporting. Q3 and Q4 Pricing Estimates: Year-end pricing estimates disagree with a 25-point spread, yet the information above where SK Hynix is dropping price caps helps to substantiate that perhaps the estimates are too low. According to Jefferies, it is reported that memory prices are expected to see a 40-50% rise in Q3 2026 versus the current quarter. Following Q3, the market is expected to see another 30-40% QoQ hike in Q4 2026 for both DRAM and NAND combined. UBS models 21% QoQ growth for DRAM ASPs incl LTAs (vs 43% incl LTAs in Q2), and 13% QoQ in Q4. For NAND, UBS models ASPs up 25% QoQ in Q3 and 10% in Q4. Overall, around 23% QoQ in Q3 and 11-12% QoQ in Q4 – so much lower than Jefferies estimates up above TrendForce is the most conservative, noting that while AI server demand continues to support prices, record-high contract prices are hitting consumer affordability limits (PCs, smartphones) and high comparison bases are moderating the sequential gains. The spread pictured above is more of a disagreement about mix. Jefferies is weighting AI-server-driven demand, where pricing power is strongest and where SK Hynix's uncapped LTAs and the carved-out HBM/DDR6/LPDDR6 categories let suppliers capture upside. TrendForce is weighting the consumer/commodity side, where affordability ceilings and base effects cap the upside. UBS sits in between, and its blended figures read low largely because they fold LTAs back in. If the uncapped-contract trend spreads, the realized numbers should skew toward the bullish end of this range rather than the middle. Samsung is said to be "aggressively" negotiating DRAM price hikes of up to 20% QoQ for Q3, with LPDDR hikes suggested to exceed 20% on supply tightness. With SK Hynix dropping caps and Samsung pushing hikes and extending LTAs, that leaves Micron as the one major supplier still holding a capped structure, and if peer pressure kicks in, Micron may decide to follow as new generations come online. Rubin Ultra Complicates Things: Blackwell offered 192GB of HBM3E with Blackwell Ultra offering 288GB of HBM3E. Nvidia’s Rubin generation is preparing to ship in the second half of this year (our estimates place the Jan 2027 quarter as the bigger impact). Much of the memory shortages right now are driven by Rubin, which packs 288GB of HBM4, which requires more wafers despite being the same GBs as the previous Blackwell Ultra generation. This equals about 20,700 GB of HBM per rack. However, as we set our sights on the late 2027-early 2028 generation of Rubin Ultra, the memory shortage could reach a tipping point following the highly-supply constrained environment of 2026 and early 2027. Rubin Ultra will require 83,000 GB, or a 4X jump per-rack in HBM content in a single generation, catalyzed by the increase to 144 GPUs per rack, 576 GB per GPU of HBM4E. Overall, the dollar content of HBM rises 10X from Blackwell to Rubin Ultra. It will be interesting to see how this plays out given the timing of 2H 2027, which comes at a time when the market is already seeing DRAM and NAND contract pricing climb double-digits QoQ, with SK Hynix stating they are dropping price caps. The words “an escalating situation” come to mind as we approach Rubin Ultra, coupled with uncapped pricing and contract durations pushed out to three-to-five years. AI Energy: The Systemic Race for "Time-to-Power" My previous Top 15 report focused on the inference market, connecting important dots as to why the emphasis was shifting from raw compute to efficiency improvements and token costs. The subheading, “AI Accelerators: Shifting from Raw Compute to Unit Economics,” focused on how design companies are lowering the power requirements of AI systems from a design perspective, citing examples such as Arm’s 200kW open-standard rack, which is stated to consume half the power of competing racks with similar CPU core counts, with “up to $10B in capex savings per GW of AI data center capacity.” Following GTC in March, the raw compute leader, Nvidia, is effectively agreeing that unit economics matter more than FLOPs. There are two primary ways Nvidia plans to improve unit economics, such as cost per token and performance per watt. The first is to make each system they sell more efficient, and the second is to increase GPU density within the same power envelope. The subtle hint from Nvidia’s March GTC is that the core KPI is no longer simply FLOPs, but tokens per watt. In other words, if a data center has 100MW of power, the winning architecture will be the one that can produce more inference within that same power envelope. GB300 NVL72s offer 50X better performance per watt and 35X lower cost per token compared to H200s, while Vera Rubin NVL72 delivers 4X better training performance and up to 10X better inference performance per watt versus Blackwell. Vera Rubin therefore allows substantially more inference in the same facility power envelope, which is critical for hyperscalers constrained by power availability. Why am I revisiting AI accelerators in a Q3 2026 energy thesis? Because the question is no longer simply, “How much compute can we build?” With Big Tech waiting in interconnection queues and even considering nuclear power plants that will take years to complete, the more pressing question is: “How much compute can we actually power?” I made a similar point in my last report, but the evidence is becoming harder to ignore. These architectural changes are not being made out of convenience; they are being made out of necessity. Energy timelines could increasingly determine how quickly the AI trade can grow. Bitcoin miners help to illustrate how the problem is compounding, as their primary AI value proposition has been faster time-to-power through the conversion of existing, grid-connected mining sites into AI data centers. Yet even Core Scientific, one of the more developed operators in this transition, now estimates that behind-the-meter power could take 12 to 14 months to deploy, while its investor materials allow for a timeline of up to 24 months. Regardless of whether it's 12 months or 24 months, this timeline is a yellow flag. In March 2025, Core Scientific emphasized that its secured power agreements differentiated it from competitors making “ambitious capacity promises” without the tangible power agreements to support them. A year later, the company is now joining those it criticized for not having power, as the Miner is now increasingly discussing behind-the-meter generation, suggesting that its existing grid access alone may not be sufficient to support its expansion plans. If we look beyond timing, and instead focus on gross infrastructure capacity, Core Scientific reveals another headwind found in the gross-to-critical conversion calculations. The gross capacity of the 900MWs that Core Scientific advertised is equaling 590MW in gross-to-critical load conversion. The closest disclosure I could find was in the May 2026 investor slides, where it stated: “the 590 MW CoreWeave contract as covers ~590 MW of infrastructure across an estimated 800 MW gross capacity.” The issue of gross facility power translating to lower usable critical IT load is systemic as hyperscalers seek to convert older data center infrastructure for AI systems. Older data centers are designed around 5kW, 15kW or perhaps up to 40kW racks, resulting in a loss of resources when converting higher loads for AI racks in the 120kW to 200 KW level. As stated, the net reduction in gross facility power is known as usable critical IT load. So, while the thesis remains “waiting for interconnection queues,” investors must also consider that even those with interconnection queues are not converting gross power capacity one-to-one with billable AI loads. Looking at CoreWeave, we can see the company is doing many things to add power as quickly as possible, passing 1GW of active power this past quarter with confidence they will reach 1.7GW by end of 2026. As the company expects to expand to 3.5GW by the end of 2027, it’s clear that power must be secured first, stating: “Each new build-out is complex with five phases: power, cooling, networking, servers, and the software orchestration layer.” Broadcom is also noting energy as a major bottleneck in their commentary in early June: “See a lot of large — this few six customers now, they realize that lead time to get compute, you need lead time. You need to be thoughtful. And that's not just asking for wafers to get the chips or memory to ensure that HBMs are available or DRAM is available. They're also talking about, hey, I got to have the power, the power shell. So all this is planning ahead.” Nvidia also has shifted their tone, no longer saying AI factories are compute-constrained but rather saying: “Today's data centers are revenue-generating AI factories. Constrained by power and capital, AI factory operators must choose the right architecture.” What this means for investors: The energy problem is systemic as the AI energy bottleneck is too large for any single company to solve alone. Bloom Energy is one of the clearest early examples of how the market is responding to the need for faster onsite power, but it is not the entire solution. In response, the I/O Fund is broadening our coverage to identify winners across several layers of the energy and AI infrastructure stack, especially as the definition of time-to-power begins to broaden. Bitcoin miners help substantiate the energy bottleneck is tightening. Brownfield retrofitting is not as frictionless as originally expected, even when considered a leading time-to-power solution. This means the next phase of the AI energy buildout will likely require more greenfield construction, a mix of power solutions to compress deployment timelines, and other highly supply-constrained optimizations that go far beyond one company's solid oxide fuel cells. Our analyst team has known time-to-power is critical for about two years now and positioned accordingly; what’s changed is that time-to-power solutions are broadening – and we are carefully (and slowly) building our positioning now. Rubin Ultra Complicates Things … (for energy too) If HBM content is the tipping point for memory, then power is the second physical crux as we look toward 2H 2027-2028. The same Rubin Ultra Kyber rack that requires roughly 10X more of HBM dollar content over a roughly two-to-three year time frame, is also expected to draw about 600kW, or nearly 5X what was being deployed last year (and continues to be deployed) with the GB200 NVL72 systems. To put this another way, at 600kW per rack, one GW of capacity can support only 1,650 Rubin Ultra racks compared to 8,300 Blackwell GB200 NVL72 systems. However, Nvidia’s design progress is not linear; it’s exponential. Rubin Ultra is not delivering merely 5X more output for 5X more power, rather it’s doing much more. At roughly 15 exaflops of FP4 compute versus 1.4 for the GB200 NVL72, Rubin Ultra delivers on the order of 10X the throughput for that 5X the power, or about 2X better performance-per-watt. Nvidia goes further, claiming Vera Rubin produces up to 10X the tokens per megawatt of GB200. On a per-unit-of-compute basis, Rubin Ultra is the more efficient machine, and for a fixed compute target it would draw less power than the Blackwell fleet that replaces. However, the superior economics from Rubin Ultra (and custom silicon) will pull demand forward. Lower cost per token and greater output per megawatt will encourage hyperscalers to deploy more compute, not simply achieve the same output with fewer racks. This is therefore not merely a discussion about MLPerf benchmarks or tokens per watt. It is a discussion about fixed facility-level power envelopes. There is no performance-per-watt advantage to speak of if the gigawatts required to energize the systems cannot be secured. The race is now on for powered shells. As we’ve covered at length, grid interconnection queues in major U.S. data center markets take four to seven years, while high-power transformers carry roughly five-year lead times. The risk is that Nvidia can ship the silicon and memory faster than the United States can energize it. Unlike a memory shortage, this mismatch cannot be settled in something like supply-capacity agreements (like memory) or by re-allocating wafer capacity toward more advanced nodes. Powering these racks requires years of energy infrastructure – and neither Nvidia, Broadcom, Micron, SK Hynix nor Big Tech can change that fact. 3. AI Networking The Thrilling Trend (but you have to get comfortable with the ride) The I/O Fund’s early lead in AI networking reflects years of preparing for a trend before it fully took shape. You can see us beginning to do the same today with custom silicon and related suppliers, even though Nvidia’s current results provide little evidence that XPUs are close to surpassing GPUs. We took a similar approach with networking years ago, when Hopper was still shipping. AI systems were limited to eight GPUs per server, and clusters had not yet scaled to tens of thousands. Now, we are seeing 72 GPUs per server, soon to be 144 GPUs, plus clusters have scaled to more than 100,000 accelerators. By now, it is clear that as AI systems scale, performance is no longer determined by GPUs alone. Rather, it increasingly depends on how quickly accelerators can communicate with memory, storage, CPUs, and other critical system components. AI networking is evidence that the I/O Fund is not constrained by either product complexity or the timing of a trend. On a cumulative basis, it may prove to be one of the most lucrative themes we have ever participated in. There will be thrilling ups and downs, but volatility is often a necessity for alpha. On that note, let’s discuss what sharp turns the AI networking roller coaster is likely to take next. Agentic AI is Operating the Roller Coaster Like round two on a roller coaster, Agentic AI is a new catalyst that will send daring AI investors around the track “one more time.” AI output is shifting from query-and-response systems to autonomous workflows. This will increase token per user, but it will also increase the amount of traffic that moves between accelerators, CPUs, memory and storage. Most importantly, for this section of the analysis, agentic AI will also increase the amount of traffic moving between networking fabrics. We’ve covered this thoroughly from the angle of why agentic AI requires more orchestration, best handled by CPUs. However, consider that an autonomous workflow is now taking on the following tasks that query systems do not: it will continuously call tools, retrieve data, invoke models, evaluate intermediate outputs, and repeat those steps into dozens of backend operations. This end result will be that an AI user can effectively leave their computer for hours and then come back to a full day’s work completed. We aren’t there yet, but that’s the over-arching vision of where agentic AI will land. Here’s what that means if we look at stats: Arm estimates agentic AI will drive up to a 15X increase in tokens per user and Nvidia concurs AgencyBench has forecast that agentic tasks will eventually require 90 tool calls, 1 million tokens and will result in hours of execution time. For a more extreme example, and perhaps one of the biggest case studies yet on the token consumption of agentic AI, OpenClaw consumed 603 billion tokens from 7.6 million API calls in one month for an estimated $1.3 million in spend. Those stats are essentially saying that one prompt is turned into many workloads. When each request results in more backend operations, it creates what’s called “east-west traffic,” which describes traffic across AI accelerators, memory, CPUs and other hardware components. This is unique from traditional cloud computing, which created what’s called “north-south traffic,” which refers to traffic between the user and an application. Because of the increase in east-west traffic, things like GPU utilization, optimizing memory, and increased speeds from 800G to 1.6T are top of mind for how to scale agentic AI. Specifically, the bandwidth growth from 400G to 800G, and eventually to 1.6T, is foundational as agentic AI becomes more distributed and yet must coordinate heavy data movement while tackling low latency output. Circling back to the custom silicon discussions, the fact is that Nvidia uses a lot of proprietary networking whereas Big Tech cannot absorb R&D costs and the distraction of owning the entire connectivity stack. The combination of agentic AI and a higher penetration of custom silicon intersecting will result in additional smaller players contributing across switches, NICs, retimers, cables, optical modules, DSPs, SerDes, co-packaged optics, Ethernet fabrics, and memory-adjacent interconnects. Below, I highlight the top 3 incoming trends for networking. For a more comprehensive overview, reference the I/O Fund’s networking deep dive published this month that totals over 18 pages entitled: AI Networking in 2026: What’s in Motion Tends to Stay in Motion. Networking Trend 1: Scale-Up Networking Picks Up Speed Scale-out networking is driving much of the AI networking revenue today as clusters move beyond 100,000 accelerators and the industry transitions to 800G and 1.6T. Larger clusters require not only more bandwidth, but also significantly more optical modules and interconnect components. That opportunity is already well understood, as reflected in the sharp stock moves across optical transceiver, laser and module suppliers such as Lumentum and Applied Optoelectronics. The less understood opportunity is scale-up networking, where the number of accelerators communicating within a tightly connected system is rising rapidly. Going back to agentic AI, the demands of autonomous agents require high inference throughput due to extreme levels of data movement, along with large context windows and high concurrency. The most effective way to meet those demands will be through a larger, singular compute domain. You might hear that larger, singular compute domain currently referred to ass the GB200 NVL72, but it will eventually become a 576-GPU rack called the NVL576, for example. The petabytes per second of HBM bandwidth and NVLink bandwidth will increase about 8X to 12X, alongside an increase in shared memory. Latency is another obstacle that lesser-known AI networking stocks are uniquely positioned to address. The NVL576 is expected to deliver 4.6 PB/s of HBM bandwidth and 1.5 PB/s of NVLink bandwidth, compared to 576 TB/s of HBM bandwidth and 130 TB/s of NVLink bandwidth for the GB200 NVL72. That represents roughly an 8X increase in HBM bandwidth and a 12X increase in NVLink bandwidth. To compare, using optics in the scale-up network at 576 GPUs can contain latency to roughly 320 nanoseconds, compared to more than 1,500 nanoseconds for a similar 576-GPU node built through scale-out copper links today. We are also keeping a close eye on the TAM as it relates to Nvidia’s architectural choices. Goldman Sachs estimates the scale-up TAM could reach $20.4 billion by 2028 in its low-end scenario, and as high as $82.8 billion in its high-end scenario, depending largely on whether Rubin Ultra adopts a copper plus CPO scale-up fabric versus a PCB midplane. However, because we track the market quite closely on a vertical basis as well, Credo has essentially confirmed that copper is no longer a growth story by year-end 2026 as their optical content will drive the most of the growth, as outlined here. Therefore, the TAM could very well be toward the higher end. To summarize, scale-out is still an important, investable market for 2026 – and one we have covered dozens of times. We continue to invest heavily here. However, our eye is always on the horizon, and the next major inflection will come from scale-up. For example, Lumentum sizes the first phase of scale-up at 3–4X the initial scale-out CPO opportunity and up to 10X once optics moves fully inside the rack, with NPO shipments expected to begin in the second half of 2027. Keep in mind that many players will be competing for a share of this market. The networking stack is highly fragmented, can shift quickly depending on which vendors are qualified, and Nvidia is notoriously selective in disclosing upcoming architectural changes for competitive reasons. The roller coaster metaphor fits because this trend is already moving quickly, but the path will be volatile. As recently as this year, some of our largest winners have experienced drawdowns of 60% peak to trough, such as Astera Labs and Applied Optoelectronics (both drawdowns aptly expected and navigated well by Knox in his recorded webinars – for example, trimming AAOI at $180.86). Even the current networking darling, Lumentum, can fall 15% in a single day. For these reasons, the far majority of so-called AI investors will avoid this trend entirely; but with over 50% allocation to networking at time of writing, the I/O Fund clearly has the stomach for it. Networking Trend 2: Sharp Turn into CPU Enablement If you have ever been on a roller coaster that turns sharply, throwing you hard to the left or to the right as your body leans over the side of the roller coaster car, then you can visualize the sharp jerk from agentic AI pulling more resources toward the CPUs, which are tasked with coordinating the autonomous workflows. According to earnings transcripts, even the leading CPU management teams did not fully anticipate this shift six months ago. Yet, the orchestration layer cannot work in isolation; it requires an optimized networking fabric to connect CPUs, GPUs, memory and other components in the AI system. In our 2026 Networking thematic, we pointed out that a rough 1:6 CPU:GPU ratio works out to about 1.5 million CPU units from the 8.8 million accelerators shipped in 2025. Assuming a 30% increase in accelerator shipments and a shift toward 1:2 attach rate, CPU demand could rise to 5.7 million CPUs by 2026. Looking to next year, the pivot toward 1:1 would result in demand of 14.9 million units, if we again assume 30% accelerator growth. If we look at the growth in networking content across Hopper, Blackwell and Rubin, we find there is a 3.5 to 1 attach rate for PCIe switch and NIC demand. When you combine both, which is the increased attach rate of CPU:GPU plus the increased attach rate of PCIe links/switches and other components, such as DSPs, our model indicates the market will see an increased demand of CPU-to-GPU networking components of about 20 million by the end of 2026. There are a few assumptions here that have to be confirmed, such as whether standalone-CPU racks maintain a similar ratio for NICs and PCIe switches as GPU racks, and what networking products will decrease, transfer equally, or potentially even expand as we see more standalone CPU racks ship. For what we know today, stocks closely connected to CPU-to-GPU coordination would be Astera and Broadcom, for NICs, for higher bandwidth per link, it would be Credo, Marvell, Lumentum and Coherent, and for more east-west cluster traffic, it would be Nvidia, Broadcom, Arista and Marvell. Networking Trend 3: Hands in the Air for Memory Enablement As noted in our recent analysis, Google’s TPU 8i is bringing the importance of shared memory to the forefront. In the analysis, we noted that Google is positioning 8i around coherent shared memory as a key driver of inference efficiency. As the 8i pod scales to 1,152 TPUs, the pod-level HBM capacity increases to 331.8 TB, with the memory shared across all 1,152 chips. Here is what was stated: “This is arguably the most critical point to understand surrounding Google’s architectural advantage with the 8i, that this 331.8 TB of memory is shared across the entire pod over Google’s inter-chip interconnect (ICI). ICI is similar to Nvidia’s NVLink—with both allowing for the fastest chip-to-chip memory access within a pod. Compare this to Nvidia’s NVL72, where true memory coherency only extends at rack-scale across 72 GPUs and just 20.7TB of HBM. Scaling out to 1,152 of Nvidia’s GPUs would span 16 racks, yet memory does not become a unified pool shared across the entire cluster. By keeping the maximum amount of memory in a shared domain with the TPU 8i, large frontier models with long context windows can run with minimal latency.” There are a few reasons shared memory is a key, investable trend, that go beyond the ability to lower latency and efficiently communicate across processors. Shared memory also reduces energy consumption and allows memory resources to be reallocated more efficiently at a time when AI systems are increasingly memory-bound rather than compute bound. CXL 2.0 is a key enabler for memory pooling and switching, as it allows host CPUs to allocate only the necessary amount of memory for each workload. This prevents ‘over-provisioning’, or when a specific device such as a GPU has too much memory allocated, which introduces latency as other devices are not able to benefit from the unused, pre-allocated memory capacity. With these features, 2.0 helps improve memory utilization across a cluster from 50-60% towards 85%. CXL 3.0 builds upon 2.0’s memory pooling with memory sharing – this allows more than one host device to access a common shared section of memory simultaneously, which allows GPUs, CPUs, NICs and other devices to all move and share data from memory coherently. This coherent shared memory is key – Dell says CXL “allows for the decoupling of memory from traditional host CPU dependencies, enabling data mobility and scalability previously unattainable,” with sharing scalable across 4,096 device nodes with CXL fabric. CXL-based architectures also introduce substantial improvements on speed, with latency of 200-500 nanoseconds (versus 100 microseconds for NVMe SSDs, a 99.5% reduction). This improves time to first token and GPU utilization for inference requests, both key factors in increasing tokens per watt and thus revenues. For example, HBM is estimated to account for ~63% of total AI chip component costs at Nvidia, AMD, Google and Amazon (for TPUs and Trainium chips), up from <52% at the start of 2024, per Epoch AI. Microsoft also finds that DRAM can account for ~50% of Azure server cost and ~40% of rack costs at Meta. These estimates do not account for the recent rise in memory pricing, which threatens to push memory BOM content in upcoming server architectures much higher. For example, Morgan Stanley estimates Rubin’s memory costs to rise 435% versus Blackwell Ultra to roughly $2 million per rack. By reducing stranded memory, CXL can lower both DRAM requirements and total cost of ownership. Microsoft found that its CXL-based Pond memory-pooling system could reduce cluster DRAM demand by approximately 10% and lower costs by 7% while maintaining nearly equivalent performance. Given memory’s growing share of accelerator and server costs, even modest improvements in utilization can translate into meaningful savings at cluster scale. 4. AI Software For most of the AI buildout, the market's winners have concentrated in the "picks and shovels" trade. Software has lagged as the market is on high alert for how much disruption AI-native startups will inflict on incumbents, and whether application-layer companies can actually monetize this very expensive technology. It also hasn't helped that Big Tech companies are AI's largest customers and they compete directly with many best-of-breed enterprise software products. However, we're seeing initial signs of monetization as the cost of inference falls sharply. Models are getting cheaper and more efficient to run, while agentic AI points toward a usage explosion. Notably, software's margins hinge on what it costs to serve each query, and cheaper inference is an important lever that transitions AI into revenue generation the market is likely to reward. One quarter of results isn't enough to confirm the trend, but our team is beginning to hunt for the winners. We're watching software earnings closely this quarter, and have flagged a few names to keep an eye on in the report below. Section 2: Q3 2026 Top 20 Stocks The stocks below are grouped by category and ranked by conviction within each category. Our rankings weigh the strength of the underlying theme, company fundamentals, product positioning and technical setup. We have expanded the list from 15 stocks to 20 stocks to account for the first signs of an inflection in AI software, while continuing to focus heavily on the infrastructure companies leading the AI market. For detailed technical analysis of these stocks, join our Advanced tier. Members will receive Knox’s July 2026 Positions Report, real-time trade alerts, and weekly one-hour webinars. To join Advanced Market Signals with 30% off, click here to email us or email premium@io-fund.com and mention code ADVANCED30. 1. AI Accelerator Stocks: AMD: CPUs Provided the Boost, but the Bigger Breakout will be Helios In the past, CPUs were in the background, buried behind the importance of Nvidia’s GPUs in the AI infrastructure market. We covered in April in a free article on Arm that: “For investors, what matters is that CPUs account for 50% to 90% of total latency in workflows, which means the CPU-to-GPU ratio in AI clusters will need to increase. Earlier this year, both AMD and Intel saw analyst upgrades based on the outstripped supply of CPUs leading to higher average sales prices of roughly 10% to 15%. Reuters also reported that Intel’s unfulfilled orders are reaching longer than six months while AMD delivery times are believed to be eight to 10 weeks.” If we look broadly, CPU estimates are moving higher and AMD is a major beneficiary. Lisa Su stated at the AI Investor Day 2025 that AMD has a “clear path to capturing more than 50% of server revenue market share,” up from roughly 40%, combined with a 50% data-center CAGR. AMD and Intel are concentrated in the x86 architecture which still leads on volume across mainstream servers and general-purpose compute. The clear takeaway is that AMD is taking share from Intel. The I/O Fund covered this in detail six years ago when AMD held 4% of the server market compared to 40%-50% today, stating: “It’s estimated that for every $1.00 in Rome chip sales, Intel loses $2.25 on average in Intel Xeon SP sales. The savings are then deployed to buy more Rome chips, which can further depress Intel’s revenue.” However, for where it stands today in 2026, it’s important investors look at the x86 versus Arm debate more narrowly, because when it comes to AI’s biggest buyers, they prefer Arm due to the ability to license the IP (more on this is located under Arm’s section). AMD’s customers primarily span neoclouds, enterprises and sovereign clouds where custom CPUs are not feasible. In this case, they rely on AMD’s EPYC or Intel’s Xeon. However, even though Arm is dominating the hyperscaler custom CPU designs, and winning these custom CPU bids, the supply chains for x86 are able to ship high core counts today, ranging from Venice’s 256 cores to Clearwater Forest’s 288 cores. Both are highly optimized for agentic AI workloads. So while as I/O Fund has made abundantly clear, Arm excels on performance-per-watt, yet AMD is preparing to take on this battle with the company’s chiplet design and the move to N2 nodes will make a strong case that x86 can keep up with Arm’s efficiency, especially with the Verano release. Per our most recent free article on CPUs: “Manufacturing on more advanced nodes is how x86 is fighting back against Arm – AMD’s Venice is the first CPU to ramp on TSMC’s 2nm (N2) process, which is designed to deliver 10%-15% higher performance at the same power level, or a 25%-30% reduction in power at the same performance level.” Another reason x86 sales will remain healthy despite Arm-based custom CPU designs being preferred by hyperscalers is that agentic latency is solved for with tool processing on the CPU, and the tools being called are primarily run on x86 – which includes databases, code-execution sandboxes, internal APIs and legacy enterprise apps). As pointed out in an Intel-Georgia Tech paper, because these are x86-native tools, orchestrating them with Arm head nodes accomplishes very little. Net-net, investors can expect x86 to perform well in the near-term, yet AMD’s competitors reach far beyond Intel and Arm, given hyperscalers are now aggressively pursuing custom CPU standalone systems, such as Amazon’s Graviton, Google’s Axion, Microsoft’s Cobalt, and of course, Nvidia’s Vera CPUs, and eventually Arm’s AGI CPU (2027-2028). The reason for the discussion around x86 versus Arm, and the many competitors ramping in volume (and why) is to get to the final takeaway which is that CPUs have provided AMD a nice, unexpected boost, yet my primary thesis remains AMD’s Helios GPUs. The chances are high that CPUs become commoditized over time, whereas GPUs are a two-player competition. Where AMD has an advantage is that any market share gains in GPUs will be aptly rewarded (silver lining to being the underdog), and even if Nvidia staves off AMD as a majority player, the optics of losing even 10% or 20% of the GPU market will weigh on the heavyweight champ. Regarding Helios, the following was shared in the last earnings report on timing for the 72-GPU systems: “The more important inflection for AMD’s Instinct GPUs is the upcoming ramp of MI450 and the Helios rack-scale platform. AMD expects initial MI450/Helios volume in Q3, followed by a more significant ramp in Q4 and continued growth into 2027.” Also, keep in mind that OpenAI and Meta have signed up for a combined 12GWs from AMD, which puts the company in striking distance of Broadcom’s 20GW deal. From there, AMD has an opportunity to secure the CPU-GPU attach rate, similar to how Broadcom secures the networking-XPU attach rate. Exciting stuff. Revenue: AMD reported an inflection in the company's growth trajectory and a structural shift in the business mix. Revenue of $10.3 billion exceeded the high end of guidance, growing 38% year-over-year. Management guided to second quarter revenue of $11.2 billion, implying year-over-year growth of 45.7% at the midpoint and sequential growth of 9.2%. Sequential growth is expected to be driven by double-digit growth in both the Data Center and Embedded segments, with modest growth in Client and Gaming. Server CPU revenue specifically is guided to grow more than 70% year-over-year in Q2. AI Revenue: The Data Center segment delivered record revenue of $5.8 billion, up 57% year-over-year and 7% sequentially. Server CPU revenue grew more than 50% year-over-year, marking the fourth consecutive quarter of record server CPU revenue, with both Cloud and Enterprise customers each contributing more than 50% growth. Turin (5th-gen EPYC) crossed 50% of server revenue mix during the quarter. Data Center AI revenue grew by a significant double-digit percentage year-over-year but declined modestly sequentially due to lower China revenue versus Q4. Management guided double digit sequential AI data center growth in Q2. Earnings: Q1 adjusted EPS grew by 43% YoY to $1.37, beating estimates by 6.2% Margins: Non-GAAP gross margin of 55.0% expanded 170 basis points year-over-year, driven by higher product mix of EPYC 5th gen CPUs. Q2 gross margin is guided to approximately 56%, a further 100 basis-point sequential expansion. Non-GAAP operating margin reached 25% in Q1, with operating income of $2.5 billion growing faster than revenue and demonstrating meaningful operating leverage in the model. This came despite a 42% year-over-year increase in operating expenses to $3.1 billion, reflecting aggressive investment in AI roadmap R&D and go-to-market expansion. The principal headwind is the MI450 ramp beginning in Q3 and ramping significantly in Q4, which will run below the corporate gross margin average in its early phases. The long-term target range remains 55%–58% non-GAAP gross margin, as set at the November Financial Analyst Day. Cash: AMD generated $3.0 billion in cash from continuing operations in Q1 and a record $2.6 billion in free cash flow, representing roughly 25% of revenue. Free cash flow more than tripled year-over-year, materially outpacing the 38% revenue growth. Inventory was roughly flat sequentially at approximately $8.0 billion. The company had cash & short-term investments of $12.3 billion, while the debt was $3.2 billion at the end of Q1. Valuation: AMD trades significantly higher than any other period in its multi-decade history with TTM PS Ratio in the 3-4X range during the dot-com boom and also well above the 15X range where it topped during the consumer device euphoria during Covid 2020-2021 and the strong 2024 AI market where it also topped at 15X. The TTM PS is at 24 and the forward is at 18X compared to the 3-year median of 9.7X, likely pricing in any remaining upside from CPUs. The stock has a PE Ratio of 180 and a forward PE Ratio of 74, with the forward below the 3-year median of 124. To be objective, these are risky valuation levels. Risks: Valuation is high. Intensifying CPU competition. Execution risk on GPUs. Broadcom’s AI Growth Is Surging, so Why is FY27 Guidance Conservative? Broadcom’s AI revenue growth easily places it at the top of the list for AI growth, yet this is even more impressive when you consider Broadcom’s scale. AI semiconductor revenue grew 143% YoY last quarter, and the upcoming quarter is guided to grow 200% YoY. The company has also diversified across six AI customers and bookings are running roughly 3X shipments with visibility into 2028. The bull case is that inference is still in its early stages and content per gigawatt continues to rise. Plus, Broadcom is more diversified than ever across Google, Anthropic, OpenAI, Meta, and additional large customers. However, the stock topped following the last earnings report as Broadcom’s current AI growth rate is now coming to a critical juncture given management did not raise its prior $100 billion FY27 AI revenue guidance. Eventually, one of these has to give: either AVGO’s AI growth rate materially slows, or management is sandbagging guidance. Broadcom’s current FY26 AI revenue guide is $56 billion, which implies Q4 FY26 AI revenue of roughly $20.8 billion. That would represent 30% QoQ growth, down from the 48.1% QoQ growth guided for Q3 FY26. From there, if Q4 FY26 comes in at the implied $20.8 billion, Broadcom would need to grow AI revenue by about 20.2% sequentially to reach a $25 billion quarterly run-rate for the annualized $100 billion. Looking out to FY27, once Broadcom reaches a $25 billion quarterly AI revenue run-rate, the company’s current guide for FY2027 implies 0% QoQ growth for the next four quarters if we take the $100 billion guide at face value. The stock topped at the time of the last earnings report, with the softer AI guide partly related to management clarifying that Broadcom is supplying chips, rather than full AI racks. This was an avoidable communication issue, especially given analysts had already pressed management on rack-versus-chip economics in prior calls. However, what hasn’t been answered is whether management’s commentary shifting from racks to chips is, at its core, a supply chain issue – in other words, is Broadcom struggling to source rack-level components? Management has already pointed to the fact that customers are ordering well in advance because they need to line up more than just chips. Hock Tan stated the following on the earnings call: “See a lot of large — this few six customers now, they realize that lead time to get compute, you need lead time. You need to be thoughtful. And that's not just asking for wafers to get the chips or memory to ensure that HBMs are available or DRAM is available. They're also talking about, hey, I got to have the power, the power shell. So all this is planning ahead. And what we are seeing the bookings that are coming is not for immediate delivery. Some are hope to have, but the reality, they all accept is they need to align quite a few other things in place before they can deliver. But they are placing their orders early and they're placing their orders now, and they are placing orders in fairly huge demand, which basically gives us a lot more visibility than we normally otherwise would have in semiconductors.” The commentary is essentially hedging when delivery on the backlog will take place and is appropriate given what is described are supply constraints that are beyond Broadcom’s control. Notably, the disconnect between management guidance and deal announcements widens when considering the forecast is that 10GWs will be delivered next year, yet this would typically go for at least $150 billion to $200 billion: “Well, good question. Yes, for '27, we indicated about 10 gigawatts shipment in '27. That's still very much intact. That will be shipping — and we are planning to ship 10 gigawatts in '27. And that nothing has changed. Back half loaded, to that extend? Yes, and which really provides an interesting trajectory into '28 with this back half trajectory. So '28, we expect a lot more gigawatts.” In the previous earnings call, a sell-side analyst pegged Broadcom’s content per gigawatt at $20B per GW. Therefore, it gets even stranger (for lack of a better word) when you consider the Blackstone-Apollo-Anthropic deal for 20GWs to be deployed by 2028. If we assume the $15B to $20B content per GW going to Broadcom, that would be about $300B to $400B in AI revenue, or up over 6X from FY26 in two brief years. That leads us back to the clarification on the call about racks versus chips-only. Chips-only would go for less, let’s call it $10B per GW instead of $20B per GW, bringing the 10GW deal to $100B for FY27 (aligned with management’s commentary) and $200B for FY28. That is why the last earnings call was disappointing, especially given a sell-side analyst asserted it was $20B per GW in content in the prior call three months earlier. Yet, selling only the chips lines up better with management maintaining the $100 billion guide for FY2027. What Broadcom needs to do is raise the $100B FY27 guidance to signal the growth rate on chips is strong enough to maintain its current valuation – I don’t see a path higher for the stock until this number budges. Notably – somewhat buried by the AI number miss, is that Broadcom is entering the circular investing arena by standing up an external financing vehicle with Apollo, Blackstone and other investors to deploy 20GW of compute through 2028, with the first tranche valued at $35 billion. The announcement is a reminder that demand is being heavily funded for companies that are deep in the red and would otherwise see bad credit terms (such as Anthropic and OpenAI). Despite these puts and takes, my investment strategy tends to focus on the bigger picture. Broadcom’s largest customers are positioned to take meaningful market share over the next several years, which should continue to support an upward stock trajectory over the medium to long-term. Revenue: Broadcom reported Q2 revenue of $22.19 billion, beating consensus of $22.12 billion by a marginal 0.3%, growing 47.9% YoY and 14.9% QoQ. While the headline beat was modest — Broadcom’s smallest in five quarters — YoY growth accelerated for the fifth consecutive quarter, picking up another 18 points from 29.5% in Q1 and marking Broadcom’s fastest YoY growth since the immediate post-VMware-close quarters. For Q3 FY2026, Broadcom guided to revenue of approximately $29.4 billion, ahead of consensus for $28.47 billion. At the midpoint, the guide implies sharp acceleration to 84.3% YoY and 32.5% QoQ AI Revenue: AI semiconductor revenue was once again the centerpiece of the report. Q2 AI revenue grew 143% YoY and 28.6% QoQ to $10.8 billion driven by increasing demand for custom silicon and networking, beating management’s own guide of $10.7 billion (+140% YoY). YoY growth accelerated another 37 points from 106% in Q1, marking the fourth consecutive quarter of acceleration. For Q3, Broadcom guided AI semiconductor revenue to $16.0 billion, implying 200% YoY growth and a material acceleration to 48.1% QoQ. This sequential dollar step-up of $5.2 billion in AI revenue is more than double Q2’s $2.5 billion; however, it fell short of the $17.2 billion estimate. For FY26, Broadcom guided for $56 billion in AI revenue, up 180% YoY Earnings: Adjusted EPS was $2.44 in Q2, beating estimates of $2.40 by 1.7%, marking Broadcom’s second consecutive quarter of sub-2% EPS beats. Adjusted EPS grew 54.4% YoY, accelerating from 28.1% in Q1. GAAP EPS was $1.91, growing 85.4% YoY. While Broadcom did not guide directly for Q3 earnings, the $1 billion beat on revenue and margin maintenance suggests potential upside to current estimates for $3.18 in adjusted EPS, up 88.1% YoY. Margins: Q2 GAAP gross margin was 69.5%, expanding 150bps YoY and 140bps QoQ. Adjusted gross margin was 77.1%, in line with management’s 77% guide and expanding 10bps QoQ from 77.0% in Q1 — notable because it dispelled the prior concern that the rising XPU mix would pressure gross margins. Adjusted gross margin remains down 230bps YoY (from 79.4% in Q2 FY25) due to a higher custom-silicon mix, but the QoQ stability suggests the mix headwind has largely played through. Q2 GAAP operating margin was 48.6%, expanding 980bps YoY and 430bps QoQ — a solid demonstration of operating leverage as semiconductor revenue scaled approximately $4.5 billion above Q2 FY25 levels while opex grew only ~6%. Adjusted operating margin was 67.3%, beating the 67% guide and expanding 200bps YoY and 90bps QoQ. For Q3, Broadcom guided adjusted operating margin to ~67% (flat sequentially). Q2 GAAP net margin was 42.0%, expanding 890bps YoY and 390bps QoQ. Adjusted net margin was 54.4%, expanding 250bps YoY and 170bps QoQ. Cash: Operating cash flow was $10.49 billion in Q2 for a 47.3% margin, up 60.1% YoY in dollar terms and 27.0% QoQ. OCF margin expanded 360bps YoY and 450bps QoQ as higher-margin AI revenue mix flowed through to cash conversion. Free cash flow was $10.26 billion for a 46.2% margin, up 60.1% YoY and 28.1% QoQ, with capex of just $231 million (1.0% of revenue, down slightly from $250 million in Q1). FCF margin expanded 350bps YoY and 470bps QoQ. Cash and equivalents climbed to $19.63 billion at quarter-end, up from $14.17 billion in Q1. Debt declined modestly to $64.91 billion. Valuation: The current PS ratio of 25 is above the forward PS Ratio of 17. There is some brief history of the forward PS ratio of 17.5 maintaining, as Broadcom had a 20+ forward PS for 2H CY25. The PE forward PE ratio of 33.5 is also within range of where the stock has traded in 2024-2025. This is also reflected in the current PE ratio of 61.7 being in-line with the 3-year median of 65. Notable Risks: The factors that prevented Broadcom from raising its fiscal 2027 outlook could persist. One theory we are monitoring internally is that the shift between chip-level and systems-level revenue reflects a more systemic supply-chain constraint. This could indicate that Broadcom is having difficulty securing either 3nm wafer capacity or the rack-level components required to convert chip demand into completed systems. Management’s changing commentary around the mix of chips versus systems also introduces an execution and credibility risk. Ideally, investors receive consistent information that allows them to track the business from one quarter to the next. When the explanation changes, it becomes more difficult to determine whether the issue is simply timing or evidence of a broader supply constraint. Nvidia: Seeking to Defend Its Throne Nvidia’s earnings report can best be described by a Shakespeare line in Henry IV: “Heavy is the head that wears the crown.” When it comes to stocks, being on top is harder than it looks. You are no longer afforded the element of surprise, and particularly important for Nvidia, you must produce new catalysts that can contend with the previous, hard-hitting catalyst that drove the company’s historic growth in previous years. The catalysts on the horizon are imperfect, whether it’s custom silicon gaining traction as inference scales or the attach rate on CPUs-to-GPUs shifting as agentic AI requires more orchestration. Nvidia is also seeing heightened supply-related commitments, likely due to steep HBM and NAND pricing. The company also changed its reporting segments, which raises concerns as it’s likely a defensive move to illustrate diversification as hyperscalers prepare to spend less on GPUs, and more on their own custom silicon. However, on the positive side, Nvidia is a beast on the bottom line. Apple has historically been tech’s biggest cash cow, yet Apple as of late is firmly in the rear-view mirror when comparing profits and cash flows. Nvidia’s operating income is north of $50 billion compared to Apple’s $36 billion, plus cash flows are nearly 2X Apple’s at $48.6B versus $28.7B. To be picky about its growth status, there is a deceleration in QoQ growth as the guide is for 11.5% QoQ growth compared to the previous three quarters, which all reported 19.5% to 22% QoQ growth. If we look a bit further ahead, analyst estimates are calling for flat-ish QoQ growth in the September quarter and then a leveling off to 7% and 6% QoQ growth. All of that will clear up when Rubin ships in volume, although in the most recent earnings report, volume shipments may not occur until the Jan 2027 quarter. I also want to flag that Nvidia’s supply-related commitments for Rubin are surging, well beyond what we saw with Blackwell. Here is what was stated in our post-earnings writeup: “As seen above, this is the largest two-quarter step-up in supply commitments Nvidia has seen at nearly $70 billion, and as it stands, this also is more than 2X its reported cash and equivalents, the first time exceeding this level since Hopper’s breakout quarter. Supply commitments are also substantially higher heading into Rubin’s ramp than prior generations – early FY24 ramped into the teens, before stepping up to the ~$30 billion level for Blackwell […] Considering that Blackwell Ultra and Rubin contain 60% more HBM content versus Blackwell and with memory prices up ~6X since September, it’s entirely possible that securing HBM and auxiliary memory account for the bulk of this increase. For example, Morgan Stanley estimates that Nvidia’s bill of materials on memory for Rubin has reached $2 million per rack, up 435% from the GB300’s $374,000. Putting this a different way, memory could account for 25% of the total BOM for Rubin, versus <10% for the GB300; when translating this to a $500 billion SKU, this is quite a substantial uplift in memory costs that Nvidia must offset via higher prices to avoid operating margin contraction. It’s clear that supply-related commitments are surging above and beyond what is normal for previous GPU generations – which could indicate either a very strong pipeline or incoming margin pressure from higher memory costs/commitments.” Nvidia will remain the AI leader for the long haul, but as a growth investor, I have to be careful about allocating to a company losing market share. I see a path forward for the stock to rebound on valuation, and I certainly see a second wind during the AI software and robotics era (especially automotive). However, tying up allocation on yesterday’s biggest winners is not the I/O Fund way. For that reason, Nvidia is ranked lower than the two aggressors of 2026-2028, which are Broadcom and AMD. Revenue: Nvidia reported $81.62 billion in revenue in Q1, beating its own guidance for $78 billion and marking a fresh record for sequential dollar growth at nearly $13.5 billion (versus $11.1 billion last quarter). Revenue growth accelerated 12 points from 73.2% YoY in Q4 to 85.2% YoY in Q1, while QoQ growth was steady at 19.8% QoQ, an impressive growth rate considering the sheer scale of Nvidia’s revenue. For Q2, Nvidia guided for revenue to be $91 billion, +/- 2%, implying YoY growth accelerating further to 94.7% while QoQ growth would moderate to 11.9%. However, dollar growth would remain rather strong sequentially at $9.4 billion guided. This was notably $4 billion ahead of consensus for $86.95 billion. AI Revenue: Data Center momentum remained robust, with revenue up 92% YoY and 21% QoQ to $75.25 billion. This marked a 17 point acceleration from 75% YoY growth in Q4 while QoQ again remained steady with Q4’s 22% growth off a larger base. Nvidia said that growth was driven by the GB300 ramp as well as demand across its Networking portfolio, including InfiniBand, Spectrum-X Ethernet and NVLink. Compute revenue was $60.4 billion, accelerating 19 point to 77% YoY with QoQ growth of 18%, roughly maintaining the 19% QoQ growth from Q4. On a dollar basis, growth was $9.1 billion, increasing from Q4’s ~$8.3 billion. Nvidia added that it recorded no China-based Hopper revenue in the quarter. Networking growth remained robust, up 199% YoY and 35% QoQ to a record $14.8 billion, or nearly $60 billion annualized, compared to $20 billion annualized last Q1. Earnings: Nvidia’s GAAP EPS benefitted from the equity investment gains, though growth for adjusted EPS was also robust at 140% YoY. GAAP EPS was $2.39, up 214% YoY due to the equity gains, which contributed roughly $0.64 to the bottom line. Adjusted EPS was $1.87, up 140% YoY (versus Q1’s new adjusted figure of $0.78, per Q4’s change in reporting to include SBC). For Q2, GAAP EPS is projected to be $1.91, up 76.9% YoY, while adjusted EPS is projected to be $1.96, up 86.6% YoY. Margins: GAAP gross margin was 74.9% and adjusted gross margin was 75%, both in line with guidance. Both were up >14 points YoY due to the H20 impacts last Q1, and marginally lower QoQ. For Q2, Nvidia guided for both to be flat QoQ at 74.9% and 75% respectively, representing roughly 2.5 and 2.3 points of expansion YoY. GAAP operating margin was 65.6%, coming in above guidance for 65%; this marked a >16 point YoY expansion again from the H20-related impacts, and a slight increase from 65% in Q4. Adjusted operating margin was 65.9% and saw a similar dynamic, up >13 points YoY and expanding from 65.3% in Q4. Looking ahead to Q2, guidance implies operating margins to remain flat QoQ at 65.6% and 65.9% respectively. On a YoY basis, this would represent a 4.8 point expansion for GAAP operating margin and a smaller 1.4 pointexpansion for adjusted operating margin. GAAP net margin was 71.5%, as Nvidia benefitted from nearly $16 billion in gains related to its equity investments, more than offsetting its $11.6 billion in income tax payments this quarter. Adjusted net margin was 55.8%, up more than 10 points YoY but down 1.4 points QoQ. Cash: Q1 operating cash flow margin was $50.3 billion for a 61.7% margin, down from a 62.2% margin a year ago but a rebound from 53.1% in Q4. Nvidia says OCF was driven by higher revenue and lower cash taxes, projecting higher taxes in Q2 which is likely to weigh on OCF. Q1 free cash flow was $48.6 billion for a 59.5% margin, up slightly from 59.3% a year ago and 51.2% in Q4. Cash, equivalents and marketable debt securities were $50.3 billion (excluding marketable equity securities which were previously included in Q4). Debt remained steady at $8.47 billion. Valuation: The headwinds from custom silicon competing for overall AI accelerator market share may be priced in, given the stock is trading below its 3-year median on both top line and bottom line. The current PS ratio of 19.3 is well below the 3-year PS ratio of 27.3. The forward PS ratio of 12.7 is rock bottom given where the stock has traded in recent years. The current PE ratio of 50.8 is below the 3-year median of 64.8. The forward PE ratio of 22.9 is particularly attractive as this stock has traded above 30X for most of 2024-2025. We are eyeing this very closely and will partly use technicals to guide how we approach this. Notable Risks: Incoming market share loss to custom silicon and AMD’s GPUs in 2027-2028. The CUDA moat matters less with inference. TSM: Robust HPC Growth Comes Head-to-Head with 3nm, CoWoS Tightness TSMC has had a longer, historied position as a key pressure point for the AI ecosystem, with CoWoS constraints first emerging in mid to late 2023 following the boom in demand for Nvidia’s H100 GPUs. While CoWoS capacity is still extremely tight, and predominantly allocated to Nvidia, the more critical constraint on TSMC’s end arguably comes down to its 3nm node capacity. Q2 revealed the challenging landscape that TSMC faces – on one hand, the company is seeing robust AI chip demand driving revenue higher, with HPC revenue up 20% QoQ for a second consecutive quarter, accounting for 66% of revenue, with full-year growth raised 10 points to 40% YoY. On the other hand, management commented that CoWoS packaging is so tight that it is limiting customers’ growth, while analysts guessed that 3nm capacity could be falling significantly short of demand. Behind the 3nm constraint lies the convergence of all major AI accelerator roadmaps to the node, alongside CPU, networking, optical component and smartphone chip production. The leading roadmaps across Nvidia, AMD, Google and Amazon are forecast to see potential >3X growth in chip shipment volumes versus just a 2X increase in 3nm wafer capacity. On the CPU side, TSMC was rather upfront about its potential tailwinds from agentic AI and the expected increase in CPU demand in future data center deployments. While CPU vendors from x86 to Arm all are competing head-to-head for a larger piece of this agentic-AI CPU pie, TSMC is playing a simpler game – management expects to benefit regardless of whether x86, Arm or RISC-V chips take the most share as almost all of those vendors are TSMC’s customers. To help mitigate these dual structural constraints and help meet rising industry-wide demand for AI accelerators, CPUs and adjacent components, TSMC boosted capex by $8 billion, from its initial view for $54 billion at midpoint to $62 billion at midpoint. Management also hiked its Arizona commitments by $100 billion, taking its total investment up to $265 billion to support more than a dozen facilities. Capex and construction of new cleanroom space is the key to providing actual relief to 3nm and CoWoS constraints, which has wide-ranging implications for the broader WFE industry – check out our 3nm thematic for more details on who stands to benefit. Where TSMC could surprise to the upside is pricing power. We have an additional 3nm thematic write-up coming out soon that explores this topic in depth. Revenue: TSMC reported Q2 revenue of $40.2 billion, at the upper end of its guided range for $39.0 to $40.2 billion and beating estimates by 2.3%. This represented YoY growth of 33.7%, decelerating from 40.6% in Q1, while QoQ growth accelerated from 6.4% QoQ in Q1 to 12% in Q2. This QoQ strength is expected to carry over to Q3, with management guiding for $44.6 to $45.8 billion in revenue, for 12% QoQ and 37% YoY growth. TSMC once again highlighted robust AI demand as the driver for full-year revenue growth, raising its forecast to 40% YoY from 30% previously, a notable 10 point raise. This would project 2026 revenue to be roughly $171.3 billion. AI Revenue: Under the surface, TSMC showed strong momentum within HPC, with revenue maintaining 20% QoQ growth for a second-straight quarter, after Q1 showed an acceleration from 4% QoQ in Q4 to that 20% level. HPC accounted for 66% of revenue in the quarter, up from 61% in Q1. To put this in dollar terms, this would project HPC revenue to be roughly $26.5 billion, up from $21.9 billion in Q1 (note this is not exactly apples-to-apples with the QoQ growth rates in NTD). Assuming a slight gain in HPC mix in Q3 to 68%, this would project HPC revenue out to be ~$30.7 billion, up in the mid-teens QoQ. TSMC did not provide an exact update to its five-year AI semiconductor CAGR of mid-to-high 50% when questioned by analysts, simply stating that it was stronger than what they said before. Earnings: TSMC reported a solid 9.4% earnings beat, reporting 77.4% YoY growth in GAAP EPS to $4.31. Operating leverage was also evident as EPS rose 23.4% QoQ, more than 11 points faster than revenue growth. For Q3, GAAP EPS is estimated to be $4.50, up 54.1% YoY. Margins: Margins were a highlight of Q2’s report with TSMC showing solid expansion across the board with increased operating leverage flowing down the line. However, Q3 is expected to see a bit of a pinch on gross and operating margins as TSMC projects dilutive impacts from quickly ramping 2nm capacity. Q2 gross margin was 67.7%, up 9.1 points YoY and 1.5 points QoQ. For Q3, management guided for gross margin between 65-67%, down 1.7 points QoQ at the midpoint, with a 3-4 point dilutive impact from a steep 2nm ramp being partially offset by strong demand for advanced nodes. Q2 operating margin was 60.3%, up 10.7 points YoY and 2.2 points QoQ. For Q3, operating margin was guided to be 56-58%, down 3.3 points sequentially as the gross margin pressure weighs down the line. Q2 net margin was 55.6%, up 12.9 points YoY and 5.1 points QoQ. Cash: Q2 OCF was $24.79 billion for a 61.7% margin, up from 53.8% a year ago and roughly flat QoQ. Q2 FCF was $9.09 billion for a 22.6% margin, up less than a point from 21.8% a year ago and down from 30.7% in Q1, as capex increased from $11.1 billion to $15.7 billion sequentially. As noted above, TSMC boosted its capex guidance for 2026 by $8 billion at midpoint, now seeing full-year capex between $60-64 billion, up ~50% YoY. Given 1H capex was $26.8 billion, this implies a stronger 2H with $35.2 billionneeded to reach the midpoint. Cash, equivalents and marketable securities totaled $110.2 billion, while debt reached $30.8 billion. Valuation: TSMC’s valuation is elevated, with its current PS ratio of 16.2 well above its 3-year PS of 10.1. The forward PS is also a bit stretched at 13.2 relative to its average of 10.2. The current PE is a bit above its 3-year average, sitting at 34.3 versus the 28.7 average. The forward PE of 25.9 is also above the average of 22.7, with the company having been unable to break past a forward PE of 30 over the last three years. Notable Risks: One of the main risks associated with TSMC is geopolitical risk with China, as the majority of TSMC’s advanced node and packaging fabs remain in Taiwan and are exposed to geopolitical tensions. Capacity constraints on TSMC’s 3nm node are emerging as a key risk for the broader AI buildout – read our upcoming 3nm thematic for a deeper dive on this risk. Marvell: Strong Interconnects Growth, but Puts/Takes to Consider Interconnects are becoming Marvell’s primary growth story through FY27 and FY28 with management guiding interconnect revenue of >70% YoY, raising this from 50% in Q4 and 30% originally. The main concern here is that this is only now finally in line with current hyperscaler capex, which is tracking towards the low/mid-70% range currently for 2026. Though Marvell often falls into Broadcom’s shadow for custom silicon given its much smaller scale, its strengths across interconnects and positioning within scale-out, scale-up, and scale-across networking shouldn’t be dismissed. On the scale-out side, Marvell’s 1.6T DSPs, TIAs and other components are projected to ramp rather quickly in FY27 after entering production in 2H FY26, with Marvell expecting to maintain its first-to-market cadence for 200G/lane and soon 400G/lane speeds with its PAM4 DSPs. Marvell’s broad range of TIAs and drivers support VSCEL, EML or other laser architectures, with management saying in Q1 that this business is expected to reach a $1 billion annualized run rate in the next few quarters. Marvell is also extending its Ethernet switching portfolio from 51.2T to 102.4T speeds with support for scale-out and scale-up. For scale-across, Marvell offers coherent DSPs and integrated ZR/ZR+ modules, spanning 400G, 800G and 1.6T, with management having a line of sight to $1 billion in annualized DCI module revenue during FY28, or double the $500 million in revenue achieved in FY26. For scale-up, this is where Marvell sees its main advantage – its ability to offer full end-to-end solutions, from optical components, solutions for NPO and CPO, to switches and XPU-attach, with support for any scale-up protocol. This would allow customers to flexibly architect data centers for different types of training or inference-optimized deployment. Management explained that customers are “going to want to have the XPU integrate the same photonic element as the switch side. And we are able to walk in and show our capability and switches, our ability to integrate into XPUs or build the XPU and then all the optics in between. So it's a very, very powerful combination. And I think the end-to-end is getting a lot of attention. … Scale-up is almost a perfect example where a customer can work with us on the entire rack-scale infrastructure upfront. We can design all the chips for them, the entire signal path and give them different optimization paths, which is a fairly unique ability. There's not that many other people which you can do it in the world today.” Marvell also has other growth outlets in XPU attach and CXL-based solutions, which we covered in detail in our recent two-part free newsletter, as well as emerging technologies such as microLEDs for future optical solutions and photonic fabrics. Note, this stock is being included in the Top 20 report due to stronger scoring on technicals. Our Advanced tier gets trade setups including potential entries and exits. Revenue: Marvell’s revenue began to inflect in Q1, accelerating more than five points to 27.6% YoY to $2.42 billion, with Q2 guided to accelerate to 34.6% to $2.7 billion; QoQ growth would also accelerate further to 11.7% in Q2 from 9% in Q1. Management provided visibility into revenue through the back half of the year, expecting both Q3 and Q4 to also see double-digit QoQ growth, with Q3 expected to hit the $3 billion revenue milestone (up 45%), one quarter ahead of management’s original expectation, and Q4 seeing YoY growth approach 50%. AI Revenue: Data Center is the primary driver, with growth accelerating to 27% YoY and 11% QoQ in Q1 to $1.83 billion (from 21% YoY and 9% QoQ in Q4); Q2 was guided to accelerate to mid-to-high teens QoQ and mid-40% YoY. For the full year, Data Center was guided to rise 50%, raised from 40% previously. Margins: GAAP gross margin expanded slightly to 52.1%, up 1.8 points YoY and marginally QoQ, while adjusted gross margin slipped less than a point to 58.9%. Q2 is expected to see a slight step-up to 52.6% for GAAP gross margin. Marvell underperformed on GAAP operating margin in Q1 due to acquisition-related impacts, with Q2 expected to see a bit of a step higher as these costs clear. GAAP operating margin remained roughly flat YoY at 14.0%, well below the 17.9% guide, while adjusted operating margin held roughly flat at 35%. Q2 was guided to see GAAP operating margin rebound to 17% and adjusted operating margin to expand to 36.5%. GAAP net margin was a thin 1.4%, down from 9.4% a year ago; adjusted net margin was 29.7%, up from 28.5% a year ago. Earnings: GAAP diluted EPS was $0.04, down 80% YoY due to $250.7 million in acquisition-related charges; adjusted EPS was $0.80, up 29% YoY. Marvell is guiding for a healthy recovery in GAAP EPS in Q2 to $0.37, +/- $0.05, up 68% YoY, while adjusted EPS was guided to be $0.93, +/- $0.05, up nearly 39% YoY. Profitability is expected to improve each quarter through the end of FY27, with GAAP EPS estimated to step up to $0.54 in Q3 and $0.68 in Q4. This is key to watch considering Marvell is aiming to drive profitability higher via improved operating leverage yet has struggled historically to maintain a positive bottom line. Cash: Operating cash flow was a record $638.8 million for a 26.4% margin (up 8.8 points YoY), while free cash flow was similarly strong at $482.6 million for a 20% margin (also up 8.8 points YoY). Cash and equivalents totaled $3.84 billion while debt totaled $4.96 billion. Valuation: Marvell’s valuation has cooled off following its early June run, though it remains elevated. Its current PS ratio has declined from June’s peak at 31.6 to 19.5, well above its average 10.9; its forward PS shows a similar trend, cooling from 24 to 14.8 and again remaining above its average 10.4. Marvell’s current PE ratio sits at 66.8, above its average 45.9 multiple, with its forward PE ratio also slightly elevated at 48.3 versus its 39.3 average. Notable Risks: Marvell’s future growth leans heavily on its custom AI silicon programs through FY28 and FY29, and scale-up/scale-out optics ramping as forecast in a competitive market, and any slip in design wins could pressure its growth forecasts. Honorable Mention: Arm: The Revenue Multiplier is v9 and CSS; High Valuation Arm’s ability to infiltrate AI data centers over the past few years by single-handedly becoming the architecture of choice for Nvidia and Big Tech’s custom CPUs can be described in one word: efficiency. According to Arm, its upcoming AGI CPU offers 2x performance-per-watt compared to x86, which is attractive to hyperscalers who view every watt not being spent on CPUs as a watt available for GPUs and networking. Stemming from its widespread success on mobile, Arm dominates in smaller cores at lower-power, which contrasts against the x86 designs which favor more heavy-lifting per core. However, as agentic AI creates highly concurrent orchestration work, Arm’s edge in high-efficiency output offers an advantage. However, Arm is a complicated stock for growth investors like us. The revenue mix of licensing/royalites does not offer unbridled growth, the way it does for their IP customers. The structure of Arm’s fundamentals and growth story is both unique and nuanced. Going in order of importance, Arm’s licensing revenue from the v9 architecture is what’s driving the growth today and will be driving growth for at least through 2026; perhaps also 2027. On the IP licensing side, we discussed in a free article and premium Computex update that Arm’s latest v9 and compute subsystems (CSS) architecture designs carry much higher royalty rates per core, with the subsequent v9 generation carrying a 1.5X higher price versus the first v9 gen. There is a similar dynamic with CSS, which is that it carries a 3X higher rate than its first gen v9, emphasizing why CSS wins are increasingly bullish for royalty growth. There were two deals signed last quarter, one of which is for data center networking chips and the other for smartphones. Also layering into 2X to 3X higher royalties, is the higher volume of chips coming online in 2026-2027. According to Arm at Computex, the company sees at least eight new chips coming online in 2027, more than double the three new Arm-based data center chips that came online in 2026. Four of the eight chips feature substantially higher cores than 2026’s launches, providing a direct outlet for royalty growth, with three of these being among the top five highest-core count chips launched since 2018. Notably, while CEO Rene Haas had outlined a 4X growth in CPU cores per GW in March, from 30M to 120M, he stated at Computex that “4X, 8X, 10X, it’s a hard number to predict just based upon the growth rates of these agents,” which at its core implies that there could be certain agentic applications or deployments that require much greater CPU density and thus a much higher CPU:GPU ratio. However, even when taking in the skyrocketing growth in CPU cores per GW, the royalites paid to Arm do not lead to hypergrowth status. More on what is Pictured Above: Despite the CPU boom, Arm’s fiscal year revenue is expected to decline. In FY26 ending in March, Arm grew 23% YoY to a record $4.92 billion — the third consecutive year of more than 20% revenue growth since IPO — with royalty revenue up 21% YoY to $2.61 billion and license revenue up 25% YoY to $2.31 billion. Looking ahead, analysts expect FY27 revenue to decelerate slightly to 20.9% YoY to $5.92 billion, before reaccelerating to 28.5% YoY to $7.61 billion in FY28, the latter benefitting from initial contribution of the Arm AGI CPU silicon business. Standalone merchant CPUs are where Arm has an opportunity to become a true growth stock as it will sell CPUs direct to customers for the first time, such as Meta, Cloudflare, and large telecoms. However, we had cautioned in our post-earnings writeup that hyperscalers are unlikely to be customers when they’ve already licensed the IP and designed their own custom CPUs, combined with management providing an outlook for $1 billion in revenue for FY28 (beginning April of 2027). Here is what was stated on the earnings call: “So the number that we talked about at the end of March was supply in place to support $1 billion of demand. And that includes memory that includes wafers, that includes packaging, that includes access to test equipment. So for the $2 billion, we are now in the process of securing supply to support that.” Overall, Arm is not an easy stock to own. As you’ll see below the valuation is gut-wrenching, there is not true hypergrowth potential for many years due to licensing/royalty revenues being the primary driver, and yet, the narrative of how Arm is moving into the data center from nearly 0% market share a few years ago to exiting the decade at 50%+ share offers tempting headlines that are in contrast to the company’s mediocre growth. For those reasons, this is not a stock we can own in a long-term buy and hold manner until we see more from the AGI CPUs but is one we watch closely and will buy when technicals give us the green light. Revenue: Arm’s Q4 FY26 revenue grew by 20% YoY and 20% QoQ to a record $1.49 billion, beating the midpoint of management’s guidance of $1.470 billion by 1.36%. Royalty revenue decelerated from 27% YoY in Q3 to 11% YoY in Q4 with revenue of $671 million; this also represented a (9%) QoQ decline off Q3’s strong $737 million. YoY growth was driven primarily Cloud AI with data center royalties more than doubling YoY. Arm also continues to benefit from an increasing mix shift to Armv9 and CSS, which carry meaningfully higher per-chip royalty rates than prior architectures. License and other revenue grew 29% YoY and 62% QoQ to $819 million, driven by continued strong demand for Arm IP, the timing and size of multiple high-value license agreements and contributions from backlog. Management guided Q1 FY27 revenue to $1.26 billion at the midpoint (+/- $50 million), implying YoY growth of 19.7% but down (15.4%) QoQ on the typical seasonality that follows a Q4 license catch-up. The Q1 guide is roughly in line with consensus of $1.25 billion. Both royalty revenue and license and other revenue were guided to be up around 20% YoY in Q1 FY27. For the full year, FY26 revenue grew 23% YoY to a record $4.92 billion — the third consecutive year of more than 20% revenue growth since IPO — with royalty revenue up 21% YoY to $2.61 billion and license revenue up 25% YoY to $2.31 billion. AI Revenue: Data center royalties more than doubled YoY, no exact contribution given Earnings: Q4 adjusted EPS was $0.60, up 9.1% YoY and beating estimates for $0.58. GAAP EPS in the quarter was $0.29, up 45% YoY but missing consensus of $0.37 by (20.7%) on the higher GAAP opex line. Management guided Q1 FY27 non-GAAP fully diluted EPS to $0.40 at the midpoint (+/- $0.04), implying 12.5% YoY growth. For the full year, FY26 adjusted EPS was a record $1.77, up 8.6% YoY, while GAAP EPS increased 13.3% to $0.85. Margins: Gross margin remained near best-in-class IP-business levels, but operating margin compressed as Arm continued investing in its AGI CPU and CSS roadmaps. Management expects FY26 to mark the peak of opex growth, with non-GAAP opex CAGR slowing from 26% in FY24–FY26 to the mid-teens through FY31, supporting future operating leverage. Q4 GAAP and adjusted gross margins were essentially flat at 97.9% and 98.3%, respectively. However, GAAP operating margin declined to 29.4% from 33.0%, while adjusted operating margin fell to 49.1% from 52.8%, as adjusted opex rose 30% YoY to $734 million, outpacing revenue growth by 10 points. Adjusted net margin also declined to 43.0% from 47.1%. For FY26, GAAP and adjusted gross margins improved slightly to 97.5% and 98.2%. In contrast, GAAP operating margin contracted 2.4 points to 18.3%, and adjusted operating margin fell 3.7 points to 43.0%, as opex increased 33% to $2.72 billion. GAAP net margin declined 1.4 points to 18.4%, while adjusted net margin fell nearly 5 points to 38.4%. Cash: Cash flow generation was strong on a full-year basis, although Q4 cash conversion was light. Q4 operating cash flow was $260 million, essentially flat with $258 million a year ago, for an operating cash flow margin of 17.4%, down from 20.8% a year ago as receivables grew. FY26 operating cash flow was $1.52 billion for a 31% margin, up sharply from FY25’s $397 million for a 9.9% margin. Q4 adjusted free cash flow was $152 million, down from $163 million a year ago, for an FCF margin of 10.2%, down from 13.1%. FY26 adjusted free cash flow was $882 million for a 17.9% margin, up from just $99 million in FY25 (a 2.5% margin). Cash and short-term investments totaled $3.60 billion at quarter-end, up from $3.54 billion in Q3, and the company continues to carry no debt. Valuation: The forward PS ratio is neck-breaking at 53X and was 80X last month. The lumpy quarters over time are weighing on the stock’s valuation (a few strong quarters mixed with slower, seasonal quarters, plus a surging stock means the valuation gets lofty quickly). The current PS ratio of 64.7 compares to its median of 36.8 since going public. The forward PE ratio of 138 is clearly quite high, with previous forward PE topping out at 100X max and has been as low as 50X. The current PE is wild at 353, although has been as high as 600. Notable Risks: Valuation does not fit I/O Fund criteria In our view, the risk-reward is unfavorable at current levels. Even if the long-term story remains intact, investors are being asked to pay too much today for growth that is less predictable than the valuation implies. 2. Memory Stocks: Micron: Pricing Increases to Moderate; Trend to Accelerate The bulk of Micron’s earnings call was spent on long-term agreements, referred to as strategic customer agreements (SCAs). As stated above, one key detail is that the cap does not apply to newer generations of HBM, DDR6 and LPDDR6, which will be priced separately at higher levels. This helps to preserve the upside from AI while locking-in attractive pricing and margins on the current generations as they become commoditized. That is why the stock reacted positively following the earnings report, despite the mention of a ceiling. Here was the key statement: “Transitions like LP5 to LP6, DDR5 to DDR6 and newer generations of HBM all come with rising bit costs… Our customer SCAs provide for appropriate price premiums for such new products to be negotiated in the future.” There are three key things to know about Micron as it stands, being up already 900%+ in about a year’s time. The first is that Micron’s position in the stack has strategically shifted, likely for many years to come: Consider that over the past three years, Micron’s positioning has been transformed from a commoditized, boom-bust business where oversupply could threaten pricing power within a few quarters, to now a contracted runway of many years with strong earnings visibility. Whether it’s the long discussions on SCAs, SK Hynix’s ability to remove price caps, or the widespread wafer tightness across HBM, the biggest difference between cycles of the past and this secular memory trend is that supply is being built against contracted demand rather than speculatively. However, the second point is that Micron's fundamentals could see a cooling off in the immediate-term. Two analysts on the call attempted to nail down Micron’s management team on where margins will land, stating: “I think the prior peak was in the low 60s. So as your long-term investors build their models for '27, '28, et cetera, should we be assuming a normalized gross margin range somewhere in the mid-70s" and also: “Your prior peak gross margin was somewhere in the low 60%, 62% range. If I try to plug in what a 64 gigabyte server DRAM is, I can get like a $700 price for it compared to $1,500 today, which kind of puts you at like $10 to $12 a gigabyte as the floor and a mid-$20 a gigabyte for the current price. Is that the range we should think about for these LTAs, i.e., low teens to mid-20s a gigabyte is kind of like the range of LTAs for the pricing?” It’s clear in the financials below that growth is being driven by higher ASPs, however, management also stated price will “moderate”: “And so our continued deployment of bits to data center and edge device, higher performance applications is going to be helpful as price moderates and price growth moderates, and we move to optimize the placement of our bits with customers, including those that we do these — have done these SCAs with.” When you take all of the above commentary, and you combine the fact the SCAs are locked in around mid-$20s GB for the ceiling (per the analyst), you get a fairly strong margin profile. However, what’s important to note is that Micron is shifting to a bottom-line story, as capping 40% of your revenue to CYQ2 2026 is going to weigh on growth. The 343% YoY growth rate recently reported is in the rear view mirror. Analysts are expecting the following: 81% growth in FY27 ending in August 11% growth in FY28 2% growth in FY29 From there, growth goes negative This represents an opportunity if an investor can find the inflection point from the 60% uncapped kicking in as next-gen products roll-out, as these estimates are not modeling the sheer pricing power memory suppliers will have over the next few years. Third, outside of AI systems loaded with HBM, also consider that memory architectures are going through frequent iteration right now. Instead of CPUs using DDR5, customers are planning to increase use of low-power DRAM (LPDRAM), originally a phone technology with a new form factor called SOCAMM. LPDRAM can cut power requirements substantially compared to DDR5. For reasons described in the Memory thematic section, probability favors the memory trend remaining intact for at least another year as 2027 is expected to be extremely supply constrained. The longer-term drivers for Micron include automotive and humanoid robots; something to keep an eye on toward the close of the decade. Revenue: FQ3 revenue reached $41.46 billion, up 74% QoQ and 346% YoY, marking Micron’s fifth consecutive quarterly record. DRAM revenue rose 67% sequentially to $31.3 billion, while NAND increased 99% to $9.9 billion. Management guided FQ4 revenue to $50 billion, implying approximately 20.6% QoQ growth at the midpoint. AI Revenue: Cloud Memory and Core Data Center revenue totaled $25.29 billion, up from $13.44 billion in FQ2, implying 88.2% QoQ growth. Data-center SSD revenue exceeded $5 billion and more than doubled sequentially. Micron did not provide an FQ4 data-center guide; assuming data center remains approximately 61% of revenue, implied FQ4 revenue would be roughly $30.5 billion, or 20.6% QoQ growth. Earnings: Adjusted net income more than doubled sequentially to $28.86 billion, while adjusted EPS increased from $12.20 to $25.11. FQ4 adjusted EPS guidance of $31 implies another 23% sequential increase. Margins: Adjusted gross margin expanded 10 percentage points QoQ to 84.9%, while operating margin reached 81.2%. FQ4 gross-margin guidance is approximately 86%, despite management expecting pricing increases to moderate. Cash: Operating cash flow reached $25.39 billion, adjusted free cash flow was $18.3 billion, and cash and investments ended at $30.2 billion. FQ4 capex is expected to rise to approximately $10 billion, while free cash flow increases again. Valuation: As to be expected following the stock’s surge, Micron is trading well above its 3-year median with a current PS ratio of 12.5 and a 3-year median of 5.2. The stock has a forward PS ratio of 8.6. The PE ratio is more in line with historic averages as the current PE Ratio is 22 compared to a 5-year median of 18. The forward PE ratio of 13.5 is at the low end of where the stock has traded during the AI boom Notable Risks: Pricing increases are slowing for Micron due to SCA agreements, clearly reflected in the expected decelerating growth from 74% QoQ growth to 20.6% QoQ. SanDisk: Decelerating yet Industry-Leading Growth; Reasonable Valuation The market is growing numb to the string of historic earnings reports we’ve seen from the memory industry. SanDisk delivered one of the best single-quarter earnings reports in NAND history with revenue nearly doubling sequentially, data center inflecting 233% QoQ and gross margin expanding 27.5 points – all of that in three, brief months. Total revenue of $5.95B beat estimates for $4.73B with data center revenue up 233% QoQ to $1.47B. Edge revenue of $3.66B also inflected 118% QoQ. The bottom line was exceptional with GAAP EPS of $23.03 and adjusted EPS of $23.41; beating estimates for $14.66 … (crazy!) Today, data center represents 25% of SanDisk’s revenue compared to 15% last quarter. Looking forward, revenue guidance indicates growth of 34.5% QoQ and 321% YoY for revenue of $7.75-$8.25B, beating estimates for $6.63 billion. In similar fashion, the adjusted EPS beat on next quarter’s guide is also substantial at $30-$33 versus estimates of $23.44. As it stands, SanDisk’s revenue is 2/3 triple-level cell (TLC) and 1/3 quad-level cell (QLC). TLC is driving the bulk of the revenue as enterprise SSDs are dominating with 8TB and 16TB PCIe Gen 5 products for speed and latency. QLC is expected to grow as it’s more of the storage-focused enterprise SSD product at 128TB and scaling to 512TB. Right now, KV cache requirements are driving more TLC demand with management stating: "Given the inference architectures and some of the comments earlier around KV cache and how important it is and quite frankly, how it can scale dramatically based on your assumptions of the use case you're serving. There's a very, very strong demand on TLC." However, QLC will increase in importance over time as it stores more bits in the same cell, it’s cheaper per bit and higher density, and has become a desirable capacity layer for the KV cache. On the earnings call, the more important development is the introduction of New Business Models (NBMs) which are essentially long-term agreements. Management mentioned they have signed five NBM agreements, three in FQ3 and two more in FQ4. Management stated they are targeting 50% of the supply under NBM agreements compared to current levels of 1/3rd: “So I expect the number that we said at least 1/3. So we're over 1/3, and I expect that number to go up over the next several quarters. Where can it get to? I definitely think it can get above 50%. And — but we'll see.” The market has been assuming that multi-year agreements cap price in the same manner that LTAs have constrained HDD pricing. Overall, the market tends to sell these announcements because the takeaway is that it limits the upside from pricing increases. However, it was stated in the call that NBM pricing is variable and not fixed. In this case, volume is committed while pricing flexibility remains: “These agreements are tailored to meet the needs of our customers and in aggregate, provide us with demand certainty and financials that we expect will be consistent with our fiscal fourth quarter guidance. The duration of this agreement varies, with the longest contract extending to 5 years. In aggregate, volume commitments increased during the life of the contracts with quarterly commitments and a combination of fixed and variable pricing. This agreement with variable pricing allows us to capture upside if prices rise while allowing our customers some upside if prices decline over time.” When asked if the margins can sustain, the answer was vague but did hint the NBMs are not compromising on margins in exchange for certainty: “And I think that now we're getting a more even distribution of those — of that value. So we're not necessarily interested in trading that value for certainty. We're interested in getting that value and getting certainty as well.” SanDisk is a stock where we overweight technicals for entries and exits, with plans to participate given our thematic coverage signals an extension of the memory trend. Revenue: SanDisk delivered a blockbuster Q3 FY26 ending April, with revenue surging to $5.95 billion, representing 251% YoY growth and 96.7% QoQ growth. Revenue beat consensus estimates by a remarkable 25.7%, reflecting the severity of the structural NAND supply-demand imbalance that has taken hold through 2025 and into 2026. Revenue growth accelerated sharply from 61.2% YoY and 31.1% QoQ in the previous quarter. Looking ahead, management guided FQ4 revenue of $7.75 billion to $8.25 billion, implying a YoY growth of 320.8% YoY and 34.5% QoQ at the midpoint and beating estimates by a solid 20.7%. Analysts expect FQ1 revenue to grow by 241.9% YoY to $7.89 billion and 183.4% YoY to $8.57 billion in FQ2. AI Revenue: Data Center revenue exploded to $1.47 billion in FQ3, up 645% YoY and 233% QoQ, reflecting hyperscaler demand and the ramp of AI-adjacent storage solutions. The segment reported sharp acceleration from 76% YoY and 64% QoQ growth in the previous quarter. Earnings: SanDisk reported adjusted EPS of $23.41 in FQ3, beating estimates by 59.7%, indicating that analyst models continue to structurally underestimate NAND pricing strength. GAAP EPS came in at $23.03, beating estimates by 62.4%. Looking forward, management guided FQ4 adj. EPS to $30–$33, implying a midpoint of $31.50 and beating estimates by 34.4%. The company has witnessed strong EPS revisions recently and the magnitude of these revisions reflects a complete repricing of SanDisk's earnings power by the sell-side, consistent with the company's supply-constrained, pricing-dominant operating environment. Margins: Gross margin reached 78.4% in FQ3, up 27.5 points QoQ and 55.9 points YoY, taking gross profit to $4.66 billion versus just $382 million a year ago. Management guided FQ4 to 79.9%, a further 150 bps of expansion that signals pricing power remains intact. Adjusted operating margin rose to 70.9% (+33.4 points QoQ) from 0.1% a year ago, and is guided to 73.9% in FQ4 — a clear read on operating leverage. Adjusted net income was $3.68 billion, or 61.8% of revenue, against a ($43 million) loss last year. Cash: FQ3 operating cash flow was $3.04 billion or 51.1% of revenue compared to a mere $26 million or 1.5% of revenue in the same period last year. Adjusted free cash flow was $2.96 billion or 49.7% of revenue compared to $220 million or 13% of revenue in the same period last year. Notably, SanDisk has zero debt and $3.74 billion in cash. The company repaid the outstanding $603 million debt in the recent quarter, funded by strong cash flows. Valuation: The stock has a PS ratio of 19.4 and a forward PS ratio of 5.5, which has quickly become re-rated downward from the forward PS ratio of 17.5 a month ago given the combination of the selloff and the new fiscal year. This has created an attractive sales ratio for SanDisk. SanDisk has a PE ratio of 58.7, with no 3-year median since becoming a standalone stock in February of 2025. Notable Risks: Narratives around memory being a cyclical and commoditized industry. It’s a highly volatile stock that will see surges/sell-offs many times as memory seeks to maintain a secular arc. Silicon Motion: SSD Controller Stock finds Second Wind with AI Silicon Motion’s growth story is shifting beyond traditional mobile and client SSD controllers to now participating in the memory boom from the AI buildout. Mobile is the current growth engine with revenue growing 30% to 35% QoQ, as NAND manufacturers outsource more controller development. However, the more differentiated opportunity is found in the MonTitan enterprise SSD controllers and boot driver products for AI systems. Silicon Motion’s MonTitan enterprise SSD controller platform is being positioned for compute SSDs near CPUs and GPUs, plus Nvidia’s CMX architecture for offloading KV cache during inference. We’ve covered the differences between TLC and QLC NAND, with the shift toward TLC NAND being more favorable to Silicon Motion given that smaller-capacity TLC configurations require more SSDs, and therefore, more controllers: “While we anticipate more initial revenue contribution to come from TLC configurate MonTitan solution, we believe QLC configure solution will begin contributing more meaningful later this year and long term.” MonTitan is in production with two customers, with five additional “major cloud service providers” expected to ramp later in 2026. However, per the earnings call in April, the run rate for MonTitan is expected to be around 10% of revenue in 2026, given the strength in mobile and client SSDs combined with a stronger ramp for MonTitan in 2027. Boot-drive storage is another AI opportunity as Silicon Motion began shipping boot drives for Nvidia’s BlueField DPU platform, although is competing with other suppliers. SIMO’s content opportunity may expand into the GPU-CPU platform, moving beyond DPU content, to where storage density could increase 2x to 4x: “As our customer transition to the next-generation GPU CPU platform, our opportunity is increasing rapidly with a much broader footprint beyond the DPU boot drive and with the density that increased 2 to 4x from the previous generation.” Revenue: Revenue of $342.1M, up 105% YoY and 23% QoQ, well ahead of guidance for $292-306M and accelerating from 46% YoY and 15% QoQ in Q1 Q2 revenue guided to be $393-411M, up 15-20% QoQ and 98-107% YoY; continues to see sequential growth in each quarter. AI Revenue: SSD controller sales: 1Q of 2026 decreased 5% to 10% Q/Q and increased 40% to 45% Y/Y; new PCIe 5 controllers carrying higher ASPs ramping eMMC+UFS controller sales: 1Q of 2026 increased 30% to 35% Q/Q and increased 140% to 145% Y/Y Ferri & Boot Drive solutions sales: 1Q of 2026 increased 205% to 210% Q/Q and increased 755% to 760% Y/Y MonTitan will enter volume commercial production in the current quarter, earlier than planned, and our customers expect to ramp five tier-one CSPs, three in Asia and two in the US, in the second half of this year. QoQ Revenue: 23% QoQ in Q1, Q2 guide of 15-20% QoQ (overall rev) Earnings: Q1 GAAP EPS of $1.97, up 239.7% YoY; adj EPS of $1.58, up 163.3% YoY Q2 GAAP EPS est of $1.87, up 281.6% YoY; adj EPS est of $2.11, up 205.9% YoY Margins: GAAP gross margin of 47.1%, flat YoY and down 2 pts QoQ; adj gross margin of 47.2%, roughly flat YoY and down 2 pts QoQ; Q2 gross margin guide of 48.5-49.5%, up 1.3 pts YoY and 1.9 pts QoQ at MP GAAP operating margin of 15.3%, up 7.4 pts YoY and 3.9 pts QoQ; adj operating margin of 18.2%, up 9.3 pts YoY but down 1.1 pts QoQ GAAP net margin of 19.5%, up 7.8 pts YOY and 2.4 pts QoQ Cash: Q1 OCF of ($31.2M) for a (9.1%) margin, down from 30.2% in the year ago quarter and 0.6% in Q4 Q1 FCF of ($49.4M) for a (14.4%) margin, down from 23.2% in the year ago quarter and (2.2%) in Q4 Cash and equivalents of $135.7M, debt of zero Valuation: The company’s PS ratio is 10X compared to a 3-year median of 3.2X. The forwad PS ratio is 6.4X Silicon Motion has a PE ratio of 62X and a 3-year median of 31X. The forward PE ratio is 36X. Notable Risks: Most of Silicon Motion’s growth today is from mobile, rather than the AI systems. Therefore, the shift into the AI will require strong execution. SIMO is a small player partnered with larger NAND players, and highly dependent on these partnerships for its growth. Honorable Mention: Western Digital Rides the Nearline Capacity Cycle This past quarter, Western Digital reported 45% YoY growth and 11% QoQ growth for revenue of $3.34B, both above the high-end of guidance. Adjusted gross margin broke above 50% for the first time, growing over 10 points to 50.5%, adjusted operating margin grew over 12 points to 38.6% and adjusted EPS nearly doubled to $2.72. Perhaps most importantly, the business is almost entirely hyperscaler customers now with 89% of revenue from Cloud customers and 6% from Consumer. Looking forward, Western Digital is guiding to $3.6B at the midpoint for growth of 40% with 100 bps gross margin expansion (which analysts nitpicked) and adjusted EPS of $3.25. Pricing was up 9% YoY with management guiding to “high-single-digit" in 2H CY26. It was stated that long-term agreements extend into CY28 and CY29 with reset points. This represents “base volume” and anything above base is priced at a higher price point. Ramping in the near-term is the 40TB ePMR HDDs, in qualification with three customers and expected to ship in volume 2H CY26 with a 25% capacity increase from 32TB drives. Looking into 2027, the more important product is the HAMR 44TB drives, in qualification with four customers and is stated to be ahead of schedule. The HAMR roadmap is expected to eventually go beyond 100TB drives. Also, in 2027, UltraSMR technology which works across both ePMR and HAMR, is expected to deliver a 20% capacity to any drive it’s added to and will boost margins. Management stated it will reach 60% of shipped exabytes by year-end 2027. One of the most important quotes from the earnings call was regarding persistent data: “[…] If you look at it, if you talk about inferencing, the resources that are used in inferencing, whether it's compute or whether it's memory, they can get recycled. But the data that's getting generated for inferencing is not being recycled. All that data that is getting generated is getting stored and that storage data that's being stored is persistent.” Management also pointed out that 80% of all data is stored in hyperscale data centers is large-scale object storage on HDDs, with the new data created from inferencing also being stored on HDDs. Valuation: Western Digital trades at a forward sales valuation of 10.5, yet was at 20X two weeks ago. The stock has been re-rated due to a new fiscal year and memory selloff. The forward PE ratio re-rating is also quite evident, with the stock trading at a foward PE Ratio of 70X two weeks ago and is now at 30X. We’ve covered Western Digital in the past on our Discovery tier here. Honorable Mention: Seagate's HAMR Ramp Accelerates in 2027 There was a lot to like from Seagate’s FQ3 report, with the company reporting a material acceleration in Data Center growth, with QoQ growth stepping up from 5% in FQ2 to 12% this quarter. Pricing looked to improve this quarter with Seagate confirming a mid-single digit increase in revenue per TB this quarter, while strong demand trends and the Mozaic4+ ramp present tailwinds for pricing strength into 2027. Mozaic4+ began volume shipments at its first two hyperscale customers in March and is expected to see an aggressive ramp through the end of calendar 2026, expected to overtake Mozaic3’s share and drive HAMR to account for a majority of exabyte (EB) shipments. Pricing and margin leverage with the new generation will likely flow disproportionately to Seagate’s bottom line, driving EPS growth at >2X the rate of revenue through the end of FY27. While Seagate emphasized multiple times that it will not be changing its pricing strategy and remain true to its promise of delivering predictable economics for customers, there were a few tidbits that hint that pricing will remain strong(er) moving through calendar 2026 and build off of Q3’s momentum. Management explained that they witnessed a mid-single digit YoY increase in revenue per TB in the quarter, and expect this trend to continue, while analysts such as Bernstein’s Mark Newman implied pricing per EB seemed to accelerate mid-single digits QoQ. This likely represents a few points of acceleration from last quarter’s pricing – we had noted in our Western Digital analysis that WDC saw prices up 2-3% QoQ per TB, while Seagate was likely closer to flat as data center revenue (up 5% QoQ) only marginally outpaced exabyte growth (up 4% QoQ). Seagate added that pricing will depend both on timing of when new contracts hit as well as product mix, such as customers shifting from one product to a newer one (ie Mozaic3 to Mozaic4+). This is the first clue that Seagate could have stronger pricing levers to pull moving through the rest of calendar 2026 and 2027, stemming from Mozaic4+. Seagate believes that it is entering a period of structural growth with robust market demand, raising its longer-term annual growth forecast from the low to mid-teens to >20% over the next few years. This is underpinned by HDD’s strong value proposition of cost and energy efficiency at scale, with Seagate believing high-capacity HDDs will remain essential for data center architectures as inference, agentic AI and soon physical AI arise. Valuation: Seagate trades at a sales ratio of 10.5, adjusted downward from 20X due to the new fiscal year and memory selloff. The forward PE ratio of 30X is adjusted down from 70X two weeks ago. We’ve covered Seagate for our Discovery tier here. 3. Energy Stocks: Bloom Energy: Right Place at the Right Time The importance of Bloom Energy’s time-to-power thesis has only intensified over the past quarter (and I wonder how long I will be saying this to you). The I/O Fund had a banner month in April of 2026 as our top allocation was the leading stock in the biggest Nasdaq rally since 2026 – but, our initial Bloom Energy entry was already nearly a year old. The April surge was based on a new deal with Oracle for a total of 2.8GW of fuel cell capacity with 1.2GWs shipping now. We had covered previously that Bloom delivered a fuel cell system to Oracle in 55 days, in sharp contrast to many longer-term solutions in the energy sector. Following the capacity announcement, Oracle announced Project Jupiter in April stating the company will utilize up to 2.45GWs “to fully power the AI data center campus” located in New Mexico. This is an important development as it means the AI data center will not use gas turbines and the diesel generators as originally planned. According to the press release, nitrous oxide emissions will be cut by 92% compared to the previous gas turbine plan. The following was stated about the new deal: “It will be 100% Bloom. When completed, it will be one of the largest islanded microgrid power facilities in the world. Oracle pivoted to Bloom only solution for 2 main reasons: first, be a responsible corporate citizen and partner by being responsive to resident concerns about air quality, water use, noise and increasing electricity rates.” What’s being described here is key as inference workloads perform best in high-density areas, where users are located. Yet, this compounds the issue of emissions, noise and the unsightly appearance of competing solutions (in addition to crucial time-to-power). My understanding is the Jupiter deal will mark the first time an AI data center will be powered entirely by Boom Energy’s solutions – an easy data point to miss, but is actually, quite an important moment in BE’s history. Another important data point is that I cannot recall the CEO discussing hyperscaler customers and neoclouds in any previous earnings call. AEP and Brookfield are well-known customers yet don’t fit the description in the following statement, as it was explicitly stated that looking beyond Oracle “more than half of our current data center backlog comes from other hyperscalers, neo clouds and colocation providers.” Bloom continues to rank at the top for AI energy stocks, as even if the company keeps a very modest 5 GW output annually, analyst estimates remain far too low. Revenue: Bloom Energy delivered a historic Q1 2026, reporting revenue of $751.1 million, up 130.4% YoY and beating estimates by a remarkable 39.1%. The quarter did moderate slightly on a sequential basis, declining (3.4%) QoQ from $777.7 million in Q4 2025 — a natural giveback following Q4's outsized 49.8% QoQ ramp — but on a year-over-year basis this represents the company's strongest growth in its public history, a strong acceleration from 38.6% YoY in Q1 2025 and 35.9% YoY in Q4 2025. While the management usually does not provide the next quarter's guidance. Due to the strong visibility, they said in the earnings call, “After a strong start to the year, and anticipating that Q2 revenue should be at least as good as Q1.” AI Revenue: Bloom did not update on its backlog in Q1, though at the end of 2025, product backlog reached $6 billion, up from $2.5 billion in 2024, while services backlog reached $14 billion. Bloom did reveal that its manufacturing footprint will allow them to deliver 5GW of product annually. Our current manufacturing footprint will allow us to deliver 5 gigawatts of product annually. We will expand to that capacity and meet the delivery dates needed by our customers. In other words, today, we are not order-constrained and not capacity-constrained. The pace of our revenue growth is decided by how fast our customers can build their greenfield sites, not how fast we can power them. Earlier this year, key customer AEP exercised its option to fulfill its 1GW deal with Bloom for $2.65 billion for a data center in Wyoming. In June, key partner Brookfield expanded its partnership with Bloom by 5X to $25 billion – with Brookfield hinting that its initial $5 billion deal covered 1GW, taking the midpoint of both deals at ~$3.8 billion per GW implies that the full 5GW run rate could translate to $19 billion in revenue. Earnings: Bloom reported Q1 2026 adjusted EPS of $0.44, well above the $0.13 consensus estimate and up from $0.03 a year ago. GAAP EPS was $0.23 versus expectations for a slight loss, signaling stronger-than-expected revenue growth and margin leverage. For full-year 2026, management raised adjusted EPS guidance to $2.05 at the midpoint, implying roughly 170% YoY growth, up sharply from prior guidance of $1.405. Consensus expects adjusted EPS of $0.25 in Q2 and $0.40 in Q3. Margins: GAAP gross margin improved 280 basis points YoY to 30%, while adjusted gross margin reached 31.5%. Management raised its full-year adjusted gross margin outlook to 34%, from 32%. Adjusted operating margin expanded to 17.3%, up from 4% a year ago, driven by operating leverage. Management also raised its 2026 adjusted operating income guidance to $675 million at the midpoint, from $450 million. Adjusted EBITDA rose to $143 million, or 19% of revenue, from $25.2 million, or 7.7%, a year ago. Cash: Q1 operating cash flow was $73.6 million or 9.8% of revenue compared to operating cash outflow of ($110.8 million) or (34%) of revenue in the same period last year. Q1 free cash flow was $47.4 million or 6.3% of revenue compared to a free cash outflow of ($125.9 million) or (38.3%) of revenue in the same period last year. The company had cash of $2.49 billion and debt of $2.60 billion at the end of Q1 2026. Valuation: Bloom Energy has a forward PS ratio of 17.6 and a current PS ratio of 25. Compare that to GE Vernova with a PS ratio of 6.3 and a current PS ratio of 7.5. Typically, due to strong product-market fit, Bloom is a better candidate for using technicals for risk management. Notable Risks: Bloom has to scale manufacturing and complete increasingly large data-center projects on compressed timelines. GE Vernova: Laying a Strong Foundation for Years to Come GE Vernova is heavily diversified across key products needed for power delivery and power generation. The booming Electrification segment best illustrates GEV's ability to scale a market quickly, with this high-growth segment tied to the time-to-power bottleneck described in the introduction. Data centers ordered approximately $2.4 billion of GEV electrification equipment in Q1 2026 alone, which was more than all of 2025 combined (!) Electrification orders grew 86% year-over-year to $7.1 billion, while the segment’s backlog has expanded from $9 billion at year-end 2022 to $42 billion. This includes transformers, switchgear, substations, HVDC, and grid-stability products, which is the equipment required to move power from generation or grid access into usable data center power. The Prolec acquisition gives GEV ownership of one of the most supply-constrained parts of the AI power chain. Transformers are a leading bottleneck with lead times of 2 to 4 years, making them a gating item for AI data center power connections and grid expansion. Prolec’s backlog grew from $1 billion in Q3 2025 to $5 billion, and the acquisition is expected to represent roughly 20% to 22% of Electrification revenue in 2026. Even if generation is available, transformers are still required to deliver that power to the site. Aeroderivative gas turbines are GEV’s quickest time-to-power product. Management stated that aeroderivatives are in high demand because “there’s a need for incremental bridge power” and “they can be commissioned faster.” GEV secured orders for 27 aeroderivative units in the quarter compared to only one unit in the prior-year period. As GEV’s core product, gas turbines remain the most important opportunity over the long-term. In Q1 2026, GE Vernova signed 21GW of new gas turbine agreements, increasing total gigawatts under contract from 83GW to 100GW sequentially. Backlog grew from 40GW to 44GW, while slot reservation agreements increased from 43GW to 56GW. Management now expects to end 2026 with at least 110GW under contract. GE Vernova stated that approximately 20% of its total gigawatts under contract explicitly supports data centers, with the remaining 80% tied to traditional customers; this is a key metric to watch closely in the coming quarters and years. Pricing also confirms that GEV is at the center of one of AI’s biggest bottlenecks. Management expects first-half 2026 gas turbine orders to be priced 10 to 20 points higher than Q4 2025 orders on a dollar-per-kW basis. Momentum has also continued into April, with quarter-to-date power equipment orders by value already exceeding all of Q1 2026. GE Vernova is capable of expanding significant, large-scale production capacity. Management said the company has installed more than 280 new machines in its gas power factories and remains on track to reach 20GW of annualized output by Q3. Revenue: GE Vernova Q1 2026 revenue grew by 16.3% YoY and down (14.8%) QoQ to $9.34 billion, beating estimates by 1%. The company’s organic revenue grew by 7% YoY to $8.59 billion and accelerated 5 percentage points from the previous quarter, primarily driven by rising AI energy demand. AI Revenue: Q1 Power organic orders grew by 59% YoY to $10 billion, primarily driven by robust Gas Power equipment orders which more than doubled YoY on higher pricing and HA units. Power Services orders increased 29%, driven by large orders for upgrades at nuclear power, as well as continued growth at Gas Power. Q1 Power segment organic revenue grew by 10% YoY to $5.0 billion. Equipment revenue increased due to higher volume and price, driven by both heavy-duty gas turbine and aeroderivative growth at Gas Power. The company shipped a total of 25 gas turbines in the quarter, up 32% YoY. Services revenue also increased due to growth at nuclear power. Management expects continued strong growth in gas equipment orders in the next quarter. They have guided 15% to 17% organic revenue growth driven by both higher equipment and services revenue. Q1 Electrification organic orders grew by 86% YoY to $7.1 billion. The strong growth in orders was primarily due to growing grid equipment demand, particularly for substations, HVDC, switchgear, and transformers. Q1 organic revenue grew by 29% YoY to $2.3 billion primarily due to substantial growth in switchgear, transformers, substations, and HVDC equipment. Management expects revenues of $3.3 billion to $3.5 billion in the next quarter. Earnings: The company’s GAAP EPS came at $17.44, and it included M&A net gains of $4.5 billion or $16.5 per share. Excluding the gains, the EPS would be $0.92 compared to $0.91 in the same period last year. Margins: The company’s Q1 adjusted EBITDA grew by 96.1% YoY to $896 million primarily due to strong growth in the Electrification and Power segments. Adjusted EBITDA margin improved by 390 basis points YoY to 9.6%. The strong improvement in the adjusted EBITDA margin was primarily due to better pricing, more profitable volume and improved productivity more than offsetting inflation, including the impact of tariffs, which started in the second quarter of 2025. Management also raised the 2026 adjusted EBITDA margin to 12%-14%, up from the previous range of 11%-13%, primarily due to improved profitability in the power and electrification segments. Management expects 2026 adjusted EBITDA to be more second half weighted than 2025 with the highest revenue and adjusted EBITDA in Q4 26. Cash: The company’s cash flows were robust in Q1 2026 primarily due to higher adjusted EBITDA and better working capital. Q1 operating cash flows grew by 347.4% YoY to $5.19 billion with an operating cash flow margin of 55.6% compared to 14.4% in Q1 2025. The improvement in operating cash flow was primarily due to higher down payments on increased orders and slot reservations at Power as well as higher orders at Electrification segment. Q1 free cash flow grew by 391.3% YoY to $4.79 billion with a free cash flow margin of 51.3% compared to 12.1% in Q1 2025. Management also raised the full year free cash flow guidance range to $6.5 billion-$7.5 billion, up from the previous $5.0 billion -$5.5 billion. The company had cash of $10.2 billion and debt of $2.6 billion at the end of Q1 2026. Valuation: GEV’s sales valuation has been steadily climbing from around 2X to now 6X on a forward basis and 7.2X on a current basis. The forward PE ratio is higher than its current PE ratio due to negative EPS growth this year from a one-time tax benefit in 2025. The current PE ratio of 30 is a better reflection of the current valuation. Notable Risks: In my opinion, GEV carries less risk in the medium-to-long term of 2028 onward, and rather has to justify its valuation with more near-term energy solutions for 2026-2027. For the near-term risks, management cites production capacity, project timelines and supply-chain execution as material uncertainties. Honorable Mention: Vistra: Helix and a Faster AI Energy Solution Vistra should be viewed through two lenses: how quickly can the company convert AI demand into contracted PPAs, and how quickly can it reprice its existing fleet into a tighter power market? The Helix announcement in early June offers a more favorable answer to both of those questions. The Helix announcement combines major players Nvidia, Vistra, KKR and Kuwait Investment Authority to build a new AI infrastructure company to advance data center construction rather than having individual hyperscalers handle the bulk of the data center deployments. Helix Digital Infrastructure will use its existing fleet to deliver near-term power while also adding future development and grid expertise. The company also highlighted that it has already executed more than 5,000 MW of PPAs with hyperscalers, which gives Helix a starting point that most new AI infrastructure platforms do not have. The practical implication is that Helix could accelerate future PPA formation. It does not mean power is available overnight, and it does not mean every Helix project automatically becomes a Vistra PPA. But it does mean Vistra is now inside a purpose-built AI infrastructure channel where large-load customers are looking for data centers, power, connectivity, and financing together. That should reduce friction versus the traditional process where a hyperscaler has to stitch each piece together separately. For Vistra, the second part of the thesis is repricing. Vistra cannot fully reprice its entire portfolio immediately because much of its generation is already hedged. As of May 1, 2026, the company had hedged approximately 98% of expected generation volumes for 2026, 89% for 2027, and 65% for 2028. That means 2026 has limited open exposure to a sudden power-price reset, and 2027 is still substantially protected. The trade-off is that Vistra has strong earnings visibility while it works to convert AI demand into longer-duration contracts. This makes 2028 the more important repricing year. By then, hedge coverage falls to roughly 65%, leaving more of the portfolio exposed to market prices or available for new contracts. Meanwhile, Vistra’s 2027 EBITDA midpoint opportunity excludes the pending Cogentrix acquisition and the recently signed Meta PPAs, part of which are expected to begin contributing in 2027. In other words, the official outlook does not yet fully reflect the newer AI-related contracts or the additional gas assets. The Meta agreement is a good example of how Vistra can turn existing power into a longer-duration AI cash flow stream. Vistra signed 20-year PPAs with Meta for more than 2,600 MW of zero-carbon energy from its PJM nuclear fleet. This includes 2,176 MW of operating nuclear generation and 433 MW of incremental output from uprates. Meta’s purchases begin in late 2026, with additional capacity added through 2034. The key point is that if Vistra can convert more of its assets into long-duration AI contracts, the market will begin to value it less as a cyclical stock. Valuation: Similar to CEG, Vistra has an attractive forward PS of 2.3X. The forward PE ratio of 18.6 also has performed well over the past two years, with most trading history being at or above this level since July 2024. Honorable Mention: Constellation Energy: Colocation Opportunities for Owned Power Constellation Energy’s time-to-power approach is very different from Bloom Energy or GE Vernova. Bloom can help customers deploy onsite power faster, while GE Vernova supplies equipment to accelerate electrification and the deployment of gas resources. Constellation’s edge is that it already owns ample power, with its key value proposition found in allowing access to those existing assets as soon as possible. The regulatory backdrop is also moving in Constellation’s favor. In December 2025, FERC directed PJM to create clearer rules for data centers and other large loads that are co-located with power plants. This means that co-located data centers may be able to contract for a defined amount of grid backup while drawing most of their power from a nearby generator. That is a very different setup than forcing PJM to plan as if the entire data center load will be served by the grid. FERC’s order does not remove regulation, but it does create a clearer pathway for large loads to sit closer to existing generation. In practice, Constellation’s Crane project is the clearest example of how powerful this can become over time. Constellation’s restart of the Crane Clean Energy Center, formerly Three Mile Island Unit 1, is backed by a 20-year Microsoft agreement and is expected to bring approximately 835 MW of carbon-free nuclear power back to the grid. In this case, the assets already exist, yet PJM had identified transmission upgrades that could delay full deliverability until the end of 2030, even when the plant itself was ready sooner. Constellation then received a FERC waiver allowing it to transfer 760 MW of capacity interconnection rights from its Eddystone plant to Crane. That waiver is important because it moved the timeline up from 2028 delivery to 2027, and it directly addresses one of the biggest time-to-power bottlenecks: a plant can be ready, but the grid may not be ready to accept the power. The Freestone is a second path for CEG to expedite delivery. Through Calpine, Constellation signed a 380 MW agreement with CyrusOne to connect and serve a new data center adjacent to the Freestone Energy Center in Texas, with an exclusive second phase for another 380 MW. Including prior Calpine agreements with CyrusOne, Constellation now has more than 1.1 GW under contract to support CyrusOne data centers in Texas. This is the “powered land” model in practice: pair a large load with an existing power site, rather than forcing the data center developer to solve the power problem from scratch. Freestone is important because it is closer to the type of structure AI data center developers want. The agreement gives CyrusOne access to power, grid connectivity, and site infrastructure at the same location. This does not mean the grid disappears from the equation, and it does not remove regulatory risk, rather we are seeing regulatory rulings reduce friction for CEG. Constellation’s edge is not that it can make new power appear overnight. Rather, its edge is that it already owns power the market increasingly needs, and in some cases, it owns the pathway to make that power deliverable. That is why Crane, Freestone, and the FERC/PJM colocation framework are important to keep an eye on. They show that time-to-power is not only about building new supply, but rather, it’s also about finding ways to unlock the power that is already there. Additionally, the Calpine acquisition shifted Constellation into a more diversified power company by adding a large gas footprint, with expanded exposure to ERCOT and CAISO, and a more direct path into data center co-location through Calpine’s Powered Land model. Gas gives Constellation more flexible, dispatchable assets and will add an estimated $2+ of EPS contribution and more than $2 billion in annual free cash flow, while preserving investment-grade ratings. Valuation: Constellation Energy is trading at a spot that has held up well typically with 20X forward PE often creating a floor over the past 1-2 years. The forward PS ratio of 2.7 is attractive, as well. 4. AI Networking Stocks Lumentum: 800G Ramping in Full Force; 1.6T to Follow Closely Behind Fundamentally, Lumentum is firing on all cylinders, with YoY growth forecast to accelerate to 105% YoY and sequential growth guided to maintain >20% QoQ for a third straight quarter in FQ4. Margins showed strong expansion, with GAAP gross margin up more than 15 points YoY to 44.2% and GAAP operating margin up more than 30 points YoY to 21.6%. Supply-demand imbalances for EMLs widened, transceivers face a similarly large imbalance, but the largest supply constraint this past quarter arose in an unexpected area – pump lasers for DCI. Lumentum reached another quarterly record for EML shipments in FQ3, driven by 100G but with 200G EML revenue more than doubling QoQ. While Lumentum remains capacity constrained in EML, the company is working quickly to expand in Japan, noting that it expects to achieve >50% YoY growth in EML units by the December 2026 quarter versus the December 2025 baseline. Layering in higher-ASP 200G EML units in the back half of 2026 is likely to drive revenue at a higher rate than the >50% YoY growth in capacity. While the EML constraints are rather widely known at this point in time, it’s important to touch upon pump and narrow linewidth lasers serving scale-across applications. Not only is Lumentum effectively sold out of both for the foreseeable future, but pump lasers were highlighted as an “unanticipated” constraint this quarter. Both products serve scale-across applications and witnessed robust growth in Q3, with narrow linewidth lasers recording a ninth consecutive quarter of growth, up 120% YoY, and pump lasers up 80% YoY. However, Lumentum detailed in Q3 that pump lasers are even more constrained than EMLs, with this hitting rather suddenly. Another bright spot for Lumentum was its transceiver business, accounting for the majority of growth in its Systems segment, which was up 121% YoY and 24% QoQ to $275.1 million, or 34% of revenue. Cloud transceivers grew more than 40% QoQ with record shipments, with this likely largely driven by 800G as the ramp of 1.6T transceivers is slated for FQ4. As should be expected by now, Lumentum said that the “the supply-demand imbalance on our own transceivers was somewhere in that ZIP code” of EMLs at >30%. Management said that they could have actually shipped quite a bit more in Q3 and in Q4’s guide had supply constraints for electrical components or laser diodes not been this tight, and that its pricing power suggests the supply-demand imbalance “isn't going to be solved for a while,” shooting down concerns over laser oversupply. To help alleviate some of the external laser supply constraints, Lumentum began insourcing CW lasers in Q3, a quarter earlier than originally expected. Insourced supply is expected to scale further in Q4, accounting for ~20% of transceiver modules in the quarter. This pivot is expected to augment transceiver margins as 1.6T ramps, alongside better yields and lower scrap rates. Pricing power can act as an important lever in Q4 — having stronger pricing power on 800G while leaning into the 1.6T ramp in Q4 should help further improve margins, as 1.6T already carries higher margins versus 800G. Revenue: Lumentum's Q3 FY2026 ending March revenue came in at $808.4 million, missed estimates marginally by (0.2%), but represents a strong reacceleration on a YoY basis from the previous quarter. Revenue grew 90.1% YoY and 21.5% QoQ and accelerated 24.6 percentage points from 65.5% on a YoY basis although decel’d slightly from 24.7% QoQ growth in the previous quarter. Sequential dollar growth of $142.9 million reflects the scale of Lumentum's ramp, with the company now approaching the $1 billion quarterly revenue threshold. Management issued a strong guide for Q4 FY2026 of $960 million to $1.01 billion, implying a YoY growth of 104.9% YoY and 21.8% QoQ at the midpoint. AI Revenue: Overall revenue up 21.5% QoQ, slight deceleration from 24.6% in Q3; Components revenue grew by 77.3% YoY and 20.2% QoQ to $533.3 million. However, was below the guidance of $536.7 million. Revenue growth accelerated from 68.3% YoY and 17% QoQ growth in the previous quarter. Systems revenue grew by 121.1% YoY and 24% QoQ to $275.1 million. The strong growth was primarily due to the cloud transceivers revenue that grew by over 40% sequentially. Earnings: FQ3 adjusted EPS grew by 315.8% YoY to $2.37, beating estimates by 4.6% reflecting favorable product mix and operating leverage. Management also provided a strong adjusted EPS guide of $2.85 to $3.05 for the next quarter, implying a YoY growth of 235.2% at the midpoint and beat estimates by 9.7%. Looking ahead, analysts expect adjusted EPS to grow 200.1% YoY to $3.30 in FQ1 and 138.2% YoY to $3.98 in FQ2. Margins: FQ3 adjusted gross margin improved 12.7 percentage points YoY to 47.9%, while adjusted operating margin expanded 21.4 points to 32.2%, driven by better utilization, pricing, mix and operating leverage. Adjusted net income rose 185% YoY to $225.7 million, with net margin increasing to 27.9% from 9.6%. Adjusted EBITDA margin reached 36.3%. For FQ4, management expects adjusted operating margin to improve further to 35.5%, supported by 1.6T transceiver growth and insourcing of CW lasers. Cash: FQ3 operating cash flow improved to $203.8 million, or 25.2% of revenue, while free cash flow reached $79.1 million, or 9.8% of revenue, reversing year-ago outflows. Cash and short-term investments rose to $3.17 billion, largely due to Nvidia’s $2 billion investment, roughly matching $3.28 billion of convertible debt. Inventory increased 10.9% QoQ to support growth. Valuation: Lumentum’s forward PS ratio of 9.8 is much more attractive than the 25X sales the company traded at two weeks ago, prior to the fiscal year adjustment. However, it’s still well above where the stock has traded historically at <5X in 2024-2025. To further illustrate, the current PS ratio is at 25 and the 3-year median is 3.3 Lumentum’s PE ratio has seen an adjustment from 120X about two weeks ago to 42X due to a new fiscal year and a selloff in the stock. However, the current PE ratio is 142 and the 3-year median is 34, still showing a wide gap. Notable Risks: Lumentum must rapidly scale 1.6T transceivers and internal CW laser production while maintaining yields and margins. AAOI: A Product-Cycle Story for 800G and 1.6T High-Speed Optics Applied Optoelectronics' Q1 results came in roughly in line with other AI networking companies, with revenue of $151.1M up 51% year-over-year and 13% sequentially. The more material development was the forward guide: management now expects 2026 revenue above $1.1B, well above the prior consensus of $962M and compared to $455.7M in 2025. The updated guide implies 141% year-over-year growth, and with Q2 guided to $180M-$198M, the math points to a heavily back-weighted year as clearly the bulk of the revenue is expected to arrive in the second half. AAOI joined a growing list of AI networking management teams talking about a very strong 2H. It’s unlikely the Street rewards forward-looking guidance for two quarters out especially with a tricky supply chain environment. However, it's worth a minute to look at the acceleration that AOI is guiding to, with the model below showing about 70% QoQ growth between Q3 and Q4. Management sees an even further ramp into 2027 with an indication they could see $471M in revenue per month at full utilization. The revenue ramp aligns with what we covered last quarter, which was a roughly 5X increase in monthly transceiver output. However, analysts on the call were cautious as they pointed toward limited InP capacity as an industry-wide issue that AAOI has to overcome to reach these targets. Typically, for an aggressive forecast, analysts also want to see progress in the current quarter, but Q1 offered 13% QoQ growth (a solid print but not helpful for the forecasted numbers that are much higher). Overall, management has some serious execution milestones to reach in the near future, and that was the overall tone on the call. When we examine further how AAOI can guide for 70% growth QoQ at the midpoint in 2H, it helps to look at current product mix versus anticipated product mix of 800G and 1.6T. In the current quarter, only $4.6M was from 800G for 5.6% of data center revenue and 0% of revenue was 1.6T. The far majority of the data center was still 400G, which grew 10X year-over-year. Over the 12-18 months, management is building toward 46% of revenue driven by 800G and 35% of revenue driven by 1.6T. In other words, two product categories that currently represent 3% of revenue will represent 80% of revenue. Revenue: AAOI Q1 revenue grew by 51.4% YoY and 12.6% QoQ to $151.1 million. However, missed estimates by 1.8%. Revenue growth accelerated by 17.5 percentage points from 33.9% YoY growth and 13.2% QoQ growth in the previous quarter. Management guided Q2 revenue in the range of $180 million to $198 million, implying a YoY growth of 83.6% and 25% QoQ at the midpoint. Missed estimates by 1.9% as growth pushed to 2H. The more material development was that the management raised full-year 2026 revenue guidance to over $1.1 billion, up from the prior guidance of over $1.0 billion issued during Q4 results, implying 141.4% YoY growth for the full year. AI Revenue: Q1 Data Center revenue grew by 154% YoY and 8.7% QoQ to $81.4 million. 100G products revenue increased by 36% YoY, while sales for the 400G products increased tenfold YoY. In the first quarter, 41.9% of data center revenue was from 100G products; 46.7% was from 200G and 400G products, 800G transceiver products accounted for 5.6% of revenue, and 5.6% was from 10G and 40G transceiver products. Management expects a sequential increase in Data Center revenue in the next quarter. Earnings: The company reported Q1 adjusted EPS of ($0.07) and missed the estimates of ($0.05) primarily due to higher data center revenue mix. Management has guided Q2 adjusted EPS in the range of ($0.03) to $0.03, the midpoint implies breakeven in the next quarter. Margins: Q1 adjusted gross margin declined 150 basis points YoY to 29.2%, slightly below guidance, as higher data-center revenue created a mix headwind. Management still targets a long-term return to roughly 40% gross margin through a shift toward higher-margin products and operating efficiencies. Adjusted operating loss was $7.3 million, or 4.8% of revenue, while adjusted net loss widened to $4.9 million, or 3.3% of revenue. For Q2, management expects adjusted net income to be roughly breakeven at the midpoint. Cash: Cash flow weakened as working-capital needs and growth investments increased. Q1 operating cash outflow widened to $85.4 million, while free cash outflow reached $143.6 million as capex more than doubled to $58.2 million. The company ended the quarter with $449.4 million in cash and short-term investments versus $206.5 million of debt, supported by $382.5 million in share issuance. Valuation: Similar to other networking stocks, the valuation has surged to 15 current PS ratio compared to 3X being the 3-year median. The forward PS ratio is 8.6, down from 16+ before the stock sold off. The PE Ratio of 25 compares to the 3-year median of 18.8 Notable Risks: The data-center mix is currently a margin headwind, so the long-term goal of returning gross margin to 40% depends on better product mix, utilization and manufacturing efficiency. AAOI is spending heavily to scale 800G production and build additional U.S. manufacturing capacity. Execution risk given the guide a few quarters out requires flawless execution. SiTime: Precision Timing Solutions Seeing Solid Tailwinds On the I/O Fund Discovery tier, we covered SiTime, a MEMS timing supplier that is seeing solid tailwinds in AI data centers from the increasing complexity of rack-scale platforms and the shift to faster data rates in networking switches and optical transceivers. This shift places more emphasis on the timing solutions that SiTime provides to ensure that all components operate as one cohesive unit with maximum performance and reliability. As it relates to AI server buildouts, increasing rack and cluster sizes means data must move across hundreds to thousands of chips at once, requiring precise synchronization across components and interconnects to minimize latency, prevent data loss and maximize system efficiency. SiTime’s high-performance oscillators are prevalent across the compute tray within the GPU and CPU boards, NIC cards, and networking switches, and also within the networking fabric, from top-of-rack and spine switches to optical transceivers and AECs. SiTime says its MEMS oscillators can reduce power consumption by 30–50% versus quartz with similar or better frequency in a more compact footprint. SiTime’s Communications, Enterprise and Datacenter segment (CED) grew 158% YoY and 17% QoQ for the eight consecutive quarter of triple-digit growth. According to the earnings call, the primary driver for CED strength is the shift from training to inference with newer XPUs requiring 2X to 4X more content per system than previous training workloads. According to management, utilization rates in inference workloads are running 20% to 40% today yet need to reach 50% to 60% for reasonable ROI on capex. SiTime delivered a strong print last quarter by dramatically beating Q1 estimates, guiding far above Q2 estimates and raising full-year guidance. Q1 revenue of $113.6 million beat consensus of $103.5 million for a 10% beat, yet EPS grew 5X YoY and reported a 23% beat for $1.44. Gross margin was especially strong for a 7-point expansion, yet the operating margin expansion was spectacular at 25-points. Supportive of future growth, the company is seeing higher ASPs and increased unit volume from the inference market. To be the first to learn about stock picks like SiTime and to access the full write-up, sign up for our Discovery tier. To subscribe to Discovery with 40% off, click here to email us or email premium@io-fund.com and mention code DISCOVERY40 Revenue: SiTime reported Q1 2026 revenue of $113.57 million, beating consensus estimates by 9.1%. Growth accelerated to 88.3% YoY, up from 66.3% YoY in Q4 2025, marking a re-acceleration in the top line for the second consecutive quarter after deceleration through mid-FY25. On a sequential basis, revenue was essentially flat at +0.2% QoQ, an atypical break from Q1’s seasonal declines in the teens to twenties. Looking ahead, management guided Q2 2026 revenue to be $140 million to $150 million, implying YoY growth of 108.6% YoY and 27.7% QoQ growth at the midpoint, beating estimates by a solid 29.1% AI Revenue: CED revenue of $75.7 million — up 158% YoY and 17% QoQ; slight deceleration from 160% YoY in Q4 and larger decel from 53% QoQ; marked 8th consecutive quarter of >100% YoY growth Assuming similar mix of 66.7% of revenue, implies 27.7% QoQ in Q2 Earnings: Q1 adjusted EPS grew by 453.8% YoY to $1.44, beating estimates by 21.4% primarily due to strong operating leverage. Management also provided a strong Q2 adjusted EPS guide of $1.85 to $2.00, implying a YoY growth of 309.6%, beating estimates by a stellar 65.9%. Looking ahead, 2026 full year adjusted EPS is expected to grow by 81.7% YoY to 5.81 and 33.6% YoY to $7.77 in 2027. Margins: Adjusted gross margin reached 64.5%, up 7.1 points YoY and 3.3 points QoQ, driven by a stronger CED mix and weaker consumer revenue. Management guided Q2 gross margin to 65%, but expects margins to moderate later in the year as consumer becomes a larger share of revenue. Adjusted operating margin was 28%, up 24.6 points YoY but down slightly QoQ due to seasonality. Q2 guidance implies improvement to 32.9%. Adjusted net margin was 34.3%, up 23.8 points YoY but down 2.2 points sequentially. Cash: Q1 operating cash flows grew by 108% YoY to $31.2 million or 27.5% of revenue compared to 24.9% of revenue in the same period last year. Q1 free cash flow was $17.9 million or 15.7% of revenue compared to ($1.4 million) or (2.3%) of revenue in the same period last year. The company also maintains a strong balance sheet of $788.6 million of cash & short-term investments with no debt at the end of Q1 2026. Inventories increased by 11.6% QoQ to $91.1 million, suggesting demand visibility and preparation for the anticipated Q2 ramp. Valuation: SiTime trades at a forward PS ratio of 21 and has a current PS ratio of 41 with a 3-year median of 20.7. The forward PE Ratio is 71 and the current PE Ratio is 136. Although a 3-year median is not available, if we look at Lumentum’s we see that a 30-40 range is typical. Notable Risks: Gross margins could moderate as consumer revenue returns to the mix, while the Renesas timing acquisition introduces integration and financing risk. The stock’s premium valuation leaves little room for execution setbacks. Photonics Stock Boosts Data Center Growth By 20-Points, to accelerate 2.5X on QoQ Growth Rate On our Discovery tier, we covered a stock that sells the analog and photonic content around DSPs, including drivers, photodetectors, TIAs, lasers and equalizers. The company’s product portfolio is highly diversified across the different laser architectures, with revenue growth increasingly tied to 800G and 1.6T PAM4 products. Riding this strong momentum, plus its largest quarterly bookings in company history, this stock boosted its Data Center growth forecast for the year by more than 20 points, now forecasting 60% YoY growth. Much of this growth is arising in the second half of its fiscal year (with FQ3 the current quarter ending June), with this photonics stock projecting Data Center growth of 35% QoQ, representing a 2.5X increase from 14.5% QoQ in FQ2. Although not a pureplay, what’s important about this stock is that it has a rather enviable position within the optics supply chain as it benefits regardless of who wins on DSPs and also stands to benefit if/when DSPs get removed. Join the Discovery tier for early access to stock ideas and to stay ahead of where the market is heading next. To subscribe to Discovery with 40% off, click here to email us or email premium@io-fund.com and mention code DISCOVERY40 Credo: Reliability Leader Moves Aggressively into Optics Credo is a force to be reckoned with in the networking space. The company brought to market active electric cables (AECs) that integrates a DSP and retimer, which were more reliable and power efficient than the alternative, laser-based optical modules for short-reach connections. Despite the AEC story offering less gunpowder, the stock has been particularly resilient and is approaching an important technical level. The reason is that, as the reliability-and-power-efficiency supplier, Credo may be innovating within its space again – but this time, with optics. The ramp that Credo foresees is fast at $600 million this fiscal year across three product lines. When pressed in the earnings call, management agreed that the ZeroFlap optics platform is expected to be the fastest-growing product within optics as it solves the same problem that Credo’s AECs are known for, which is network reliability. By continuously monitoring link health, the ZeroFlap optics platform autonomously detects and mitigates link instability before it impacts the cluster. The ZeroFlap optics platform also comes with an upsell opportunity for the company’s PIC technology, which can reduce the number of lasers that a link requires, and 100G and 200G DSPs. Combined, the platform combines hardware and software to keep the network stable. The growth is expected to sharply inflect in the back half of the year as Credo prepares to ramp a trio of optical products – optical DSPs, SiPho photonic ICs (acquired from Dust), and ZeroFlap optics. Credo expects each of the three to contribute more than $100 million in revenue in FY27, with optics in total contributing more than $600 million for the year with the ramp accelerating in 2H. As it stands, current estimates point to growth reaccelerating to nearly 28% QoQ in FQ3 (the January 2027 quarter) and maintaining roughly 24% QoQ in FQ4 as optics layers in to growth. While analysts rightfully picked up on the fact that the $100 million each and $600 million total optical revenue guidance implied revenue is skewed towards one of the three products (it was later revealed to be ZeroFlap), the bigger takeaway is that optics are contributing half of Credo’s YoY growth on a dollar basis: “If you kind of break that down or dive into that a little bit deeper, what you'll see is based on that guidance, if you look at absolute dollars year-over-year expectation for fiscal '27, about half of that growth in absolute dollars is coming from our optical portfolio and about half of that is coming from our existing copper portfolio, predominantly AECs, but also retimers.” Credo also provided some context ASPs for its optical suite, with the ZF optics ramp in part due to it carrying a triple-digit ASP versus a double-digit ASP for PICs and DSPs: “To give a little more color on your first question earlier, the ASPs on the discrete components, optical DSPs and cyclo PICs, those ASPs are typically 2-digit ASPs. On the ZF Optics, we're going to see 3-digit ASPs. And so I didn't mean to be a bit elusive or not answer your question. But I think the math clearly says that as we ramp ZF Optics, that's going to be clearly our largest revenue contributor for our optical portfolio that the potential there is great.” Revenue: FQ4 revenue of $437 million, up 157% YoY and 7.4% QoQ, decelerating from 201.5% YoY and 51.9% QoQ in FQ3 FQ1 guide of $465-475 million, up 110.7% YoY and 7.6% QoQ FY26 revenue of $1.335 billion, up 205.7% YoY; FY27 estimate of $2.43 billion, up 81.7% YoY AI Revenue: In fiscal '27, we expect our optical DSPs, SiPho PICs and ZeroFlap optics will each contribute more than $100 million of revenue and in total, more than $600 million of revenue, with this expected ramp accelerating in the second half of the year. Margins: FQ4 adjusted gross margin was 68.3%, up nearly 1 point YoY, while adjusted operating and net margins expanded sharply to 49.6% and 51.9%, respectively. For FY26, adjusted gross margin rose 3.1 points to 68.1%, adjusted operating margin increased 21.4 points to 47.8%, and adjusted net margin improved 19.8 points to 49.5%. Earnings: FQ4 GAAP EPS of $0.88, up 340% YoY; adj EPS of $1.16, up 231.4% YoY FQ1 GAAP EPS est of $0.84, up 147.1% YoY; adj EPS est of $1.16, up 123.1% YoY FY26 GAAP EPS of $2.51, up 765.5% YoY; adj EPS of $3.46, up 394.3% YoY Cash: FQ4 OCF reached a record $182.2 million for a 41.7% margin, up 7.7 pts YoY and up marginally QoQ; FCF also reached a record $177.5 million for a 40.6% margin, up 8.7 pts YoY and 6.3 pts QoQ. Cash and equivalents totaled $1.44 billion while debt remained zero. Valuation: The PE Ratio is 98X and the forward PE ratio is 40X. The forward PS ratio is 18 and the current PS ratio is 33X. Notable Risks: Credo carries execution risk as the company is expands beyond its core active electrical cable business and increases its exposure to optical connectivity. This could result in more competition and higher investments to compete, ultimately pressuring margins. Under-the-radar Optical Networking Beneficiary On our Discovery tier, we covered another networking stock that is flying under-the-radar as it goes head-to-head with Marvell on DSPs for 400G, 800G and 1.6T solutions. Based on the 400G and 800G ramp, the company raised its optical data center growth forecast by 40% last quarter. As the company pivots toward 1.6T, it’s expected to benefit from higher ASPs, resulting in even higher revenue and margins into 2027, as attach rates increase from larger GPU systems. Fundamentally, margins have remained pressured, and cash flows are quite thin, but there are some green shoots emerging as the stock is forecasting a return to GAAP operating profitability in Q2 for the first time in three years. Join the Discovery tier for early access to stock ideas and to stay ahead of where the market is heading next. To subscribe to Discovery with 40% off, click here to email us or email premium@io-fund.com and mention code DISCOVERY40 Coherent: InP Capacity Doubling to Drive CY26 Inflection Coherent’s earnings report reinforced a theme being echoed by many AI optical companies, which is that demand is outpacing the industry’s ability to keep up. The company delivered another quarter of accelerating growth with improved profitability, while also discussing demand visibility as “exceptional.” The company posted revenue of $1.81 billion, up 7% QoQ and 21% YoY, and up 27% YoY on a pro forma basis (excluding the divested businesses). GAAP gross margin reached 37.7% with adjusted gross margin was 39.6%. Adjusted EPS grew 55% YoY with guidance that implies further growth on the bottom line. Datacenter and Communications grew 13% QoQ and was up 41% YoY with the Communications business leading the growth at 16% QoQ and 60% YoY. Within this, scale-across is the fastest growing driver, including DCI. The 800G transceiver business is also set to grow YoY as 1.6T is ramping faster than expected. There are additional growth vectors, such as pump lasers, CPO and OCS discussed in detail. The guidance for June implies continued growth across the board with 10% QoQ revenue growth at the midpoint, adjusted gross margin of 40%, and EPS guided to 62% growth. The most important takeaway is that management positioned the June quarter as an inflection point, driven by a 2X increase in indium phosphide (InP) capacity by the end of the calendar year. The 6-inch InP ramp is tracking a quarter earlier than expected, with Coherent expected to 4X InP capacity over a two-year period. Overall, Coherent is not a stock that has moved as quickly as its peer Lumentum. This comes down to InP capacity and the transition from 3-inch to 6-inch wafers. Although we continue to keep Coherent on the list, we can’t deny it has been somewhat of a waiting game. The June quarter is important for this stock as management as the market will want to see management execute on the InP ramp, given Lumentum is firing on all cylinders. Revenue: Coherent’s Q3 FY2026 ending March revenue grew by 20.6% YoY and 7.1% QoQ to $1.81 billion, beating estimates by 1.4%. On a pro forma basis (organic), revenue increased 9% QoQ and 27% YoY, excluding revenue from the Aerospace and Defense business and the Munich product division, which were sold in FQ1 and FQ3, respectively. Organic revenue growth accelerated from 22% YoY in the previous quarter, primarily driven by growth in AI data center and communications revenue. Management guided strong FQ4 revenue in the range of $1.91 billion to $2.05 billion, implying a YoY growth of 29.5% YoY and 9.6% QoQ, beating estimates by 3.7%. AI Revenue: Data center revenue grew by 37% YoY and 13% QoQ and represented a second consecutive quarter of double-digit sequential growth. Earnings: Coherent’s FQ3 adjusted EPS grew by 54.9% YoY to $1.41, beating estimates by 1.1%. Management also provided a strong adjusted EPS guide of $1.52 to $1.72 for the next quarter, implying a YoY growth of 62% at the midpoint, beating estimates by 5.2%. Margins: FQ3 adjusted gross margin improved by 110 basis points YoY to 39.6% primarily due to the reductions in product input costs, yield improvements from 6-inch indium phosphide production as well as significant benefits from pricing optimization. Management has guided adjusted gross margin to improve to 40% in the next quarter. FQ3 adjusted operating margin improved by 170 basis points YoY to 20.3%. However, marginally missed the guidance of 20.9% due to higher operating expenses to support the Datacenter & Communications segment product road maps. Management has guided adjusted operating margin to improve to 21.3% in the next quarter. Adjusted net income grew by 56% YoY to $276.2 million with an adjusted net margin of 15.3% compared to 11.8% in the same period last year. Cash: Cash flow weakened as working-capital needs and growth investments increased. FQ3 operating cash outflow was $93.8 million, while free cash outflow reached $383.5 million as capex rose 159% YoY to $290 million. Management expects capex to increase again in FQ4. Coherent ended the quarter with $2.41 billion in cash and short-term investments versus $3.19 billion of debt. Liquidity improved primarily due to Nvidia’s $2 billion investment, while leverage declined to 0.5x after $162 million of debt repayments. Valuation: The current PS ratio of 8.5 is quite a bit higher than the 3-year median of 2.4. Coherent’s forward PS Ratio of 6.3 is nearly 50% lower than it was in June at 12X due to a selloff combined with new fiscal year. Coherent’s PE Ratio is 146.7 compared to a 3-year median of 27.3. The forward PE Ratio is 37, coming down from a fairly extreme forward PE ratio of about 80X about wto weeks ago, prior to the start of the fiscal year. Notable Risks: Coherent is investing aggressively to meet AI optical demand, with capex rising sharply and expected to increase again next quarter. Production delays, weak yields or slower customer qualifications could pressure valuation. Astera Labs: The Market Questions the PCIe Pureplay; Yet My Conviction Remains When I speak of investing in AI networking as being similar to a roller coaster, this is the banner stock for that analogy (although all of these networking stocks are fully capable of similar volatility). As the market continually doubts the PCIe pureplay, my conviction has only solidified. The company’s future road map is loaded, and as a pureplay, the company can pivot seamlessly and quickly – a necessity when competing with Broadcom and Marvell. Proof in point, this last quarter Astera announced the Scorpio X-Series 320 Lane Smart Fabric Switch, which is the largest open, memory semantic fabric switch on the market with 5.12 TB/s bidirectional bandwidth in a single ASIC. The 320 Lane variant offers 16 lanes per device and 20 accelerators per switch, which is roughly “2x the radix in a single hop,” which means twice the number of GPUs are connected on the same switch. With Scorpio-X, only one switch is needed for 320 GPUs, and fewer switch hops means lower latency. Astera differentiates itself from Broadcom’s Ethernet switch Tomahawk 6 and Nvidia’s NVSwitch by providing an open PCIe-based fabric for CPUs, NICs and storage with the P-Series and improving accelerator-to-accelerator performance specifically around memory sharing with the X-series. The X-Series is timed to the scale-up networking opportunity and the inference market. Mixture of Experts (MoE) inference is a steady stream of tasks, which requires very fast accelerator-to-accelerator communication. As discussed in the call, MoE requires frequent routing of tokens and data across expert models, which places more emphasis on the scale-up fabric. Astera Labs is uniquely positioned to enable GPUs and AI accelerators to communicate more efficiently across PCIe, especially when it comes to direct memory access. This is a significant shift as it brings the math operations inside the switch instead of the GPUs, which Astera is referring to as “in-network compute.” Hypercast refers to handling operations inside the switch, which reduces the networking overhead associated with GPU-to-GPU coordination. The result for inference tasks is more tokens per dollar as Scorpio-X removes the need for GPUs to wait on other GPUs during MoE and agentic workloads. It's important to double-click on the memory-semantic piece. Astera's fabric lets accelerators access each other's memory directly like a single unified memory pool, eliminating the overhead of translating data into network packets. This is important for AI workloads, and especially MoE inference, which depend on constant sharing of weights, activations, KV cache, etc., across accelerators. Per the press release: “Its memory-semantic connectivity enables accelerators to access fabric resources through native load/store operations, eliminating software overhead and improving fabric efficiency at scale.” Astera’s X-Series offers communication across mixed architectures (both GPUs and ASICs) but also solves for memory sharing – both are key as we move into the inference market. We’ve covered the X-Series for about a year in our post-earnings analyses. For investors, some of the most important takeaways is that the Scorpio product is expected to increase from 15% of product mix at the end of CY25 to 50% of product mix by the end of CY26. Although the P-Series is driving the current growth, the X-Series will be the higher mix as we exit the year – which means this ramp is second-half weighted. Last October, Astera acquired a scale-up photonics company to offer optical scale-up interconnects. On the earnings call, it was shared that near-packaged optics will roll-out first following this acquisition in 2027, which is a bridge solution while co-packaged optics may take longer than the market cares to wait. Revenue: Astera Labs reported Q1 2026 revenue of $308.4 million, beating estimates by 5.5%. Growth continued at a robust pace on a YoY basis, with revenue up 93.4% YoY and accelerating 1.6 percentage points from 91.8% growth in the previous quarter. On a sequential basis, revenue grew 14.0% QoQ from $270.6 million in Q4 2025. Management guided strong Q2 revenue guidance of $355 million to $365 million, implying a YoY growth of 87.6% and 16.7% QoQ at the midpoint, beating estimates by 16.1% AI Revenue: Aries product revenue grew strongly in Q1 2026, with PCIe Gen 6 solutions for both scale-out and scale-up signal conditioning driving solid adoption. Management noted that PCIe Gen 6 revenue across AI fabric and signal conditioning contributed more than one-third of total revenue in the quarter — a significant milestone reflecting the accelerating industry transition to Gen 6. The Scorpio product family also performed well in Q1, driven by strong demand for PCIe Gen 6 switching applications and continued expansion of designs across various platforms. During the quarter, Scorpio X-Series products began shipping in initial production volumes. Management expects Scorpio X-Series shipments to increase in Q2, along with initial shipments of the new Scorpio X 320 lane product and then ramp to full volume production in the second half of 2026. Taurus product family continued to deliver solid results in Q1 2026, driven by broad adoption of Active Electrical Cable (AEC) to extend reach in both AI and general-purpose compute platforms. Leo's CXL memory expansion products continue to advance, with management highlighting an early production ramp of CXL-attached memory with Microsoft Azure M-Series virtual machines and a new custom design win for a KV Cache offload application with shipments expected in 2027. Earnings: Q1 adjusted EPS grew by 84.8% YoY to $0.61, beating estimates by 13.5% primarily due to operating leverage. GAAP EPS growth was even stronger as it grew by 144.4% YoY to $0.44 and beating estimates by 26.5%. Management also provided a strong EPS guide for the next quarter. GAAP EPS guide is $0.45 at the midpoint, up 55.2% YoY and beat estimates by 37.6%. Adjusted EPS guide is $0.69 at the midpoint, up 56.8% YoY and beat estimates by 25.5%. Margins: Astera Labs delivered strong Q1 margins, with GAAP gross margin reaching 76.3%, ahead of 74% guidance and up 140 basis points YoY on favorable mix. Adjusted gross margin was 76.4%. Management expects adjusted gross margin to decline to 73% in Q2, including an estimated 200-basis-point noncash impact from a customer warrant agreement. Adjusted operating margin improved to 36.2%, above 34.5% guidance, while adjusted net income rose 85% YoY to $110.7 million, or 35.7% of revenue. Cash: The company’s cash flows were strong primarily due to higher profits. Q1 operating cash flow was $74.6 million or 24.2% of revenue compared to a mere $10.5 million or 6.6% of revenue in the same period last year. Q1 free cash flow was $67 million or 21.7% of revenue compared to $5.97 million or 3.7% of revenue in the same period last year. The company maintains a robust balance sheet with cash & marketable securities of $1.18 billion and no debt. Valuation: Astera’s valuation causes the wild ride in this stock more than any concrete, fundamental change. The PS Ratio can see levels as low as 20X versus 70X. The forward PS Ratio can be anywhere from 10x to 50x in a year’s time. Right now, it’s trading 40X forward PS. The PE Ratio is also hard to nail down, at a 244 current PE Ratio. The forward PE ratio of 120 can be as low as 35 or as high as 142. Notable Risks: Competitors are Marvell and Broadcom, and customers are highly concentrated with silicon programs across these competitors. Honorable Mention: Corning: Glass Powerhouse Pivoting Hard into Optical Networking Corning’s GenAI fiber products offer 2X to 4X more fiber in an existing conduit, which is key as cluster sizes continue to scale. Their single-mode SMF 28 fiber for CPO applications features 40% smaller cross section, saving space while delivering strong performance. The Contour Flow cables simplify deployments by delivering 2X the fiber in the same diameter, and their miniaturized multifiber connectivity (MMC) connectors enable 3X more connections versus legacy connectors, while its MMC assemblies can accommodate 36X more fiber within a data center rack. Historically, Corning has offered a co-investment model on its glass business and will replicate this for GenAI products. It results in a highly profitable business as they lock-in multi-year and multi-billion dollar commitments with Meta and will be adding two more hyperscalers, per the earnings call. Consider that the Meta deal alone of $6B is 2X Lumentum’s revenue – although not an apples-to-apples given the Meta deal is multi-year, the point is that Corning is just getting started. If we see similar size deals from the next two hyperscalers, Corning could eclipse smaller networking players quite quickly in terms of AI revenue. There are numerous levers a company like Corning can pull to steer incremental capital and capacity toward higher-growth segments. Leaning hard into a mix shift for its GenAI products won’t happen overnight, but it will happen profitably. Revenue: Q1 core revenue up 18% YoY but down (1%) QoQ to $4.35 billion; GAAP net revenue of $4.14 billion, up 20% YoY but down (2%) QoQ Q2 revenue guide for core revenue to be $4.6 billion, up 14% YoY and nearly 6% QoQ at MP AI Revenue: Optical Communications revenue of $1.85 billion, up 36% YoY and 9% QoQ, accelerating from 24% YoY and 3% QoQ; “robust demand”; Sales in both Enterprise and Carrier rose 36% year-over-year. In Enterprise, building off our multiyear up to $6 billion agreement with Meta, we entered into large long-term agreements with 2 additional hyperscale customers, and we are working to conclude others. And in Carrier, we are seeing growth stemming from both data center interconnects and strong demand for fiber-to-the-home. Earnings: Q1 GAAP EPS of $0.43, up 139% YoY buy down (31%) QoQ; adj EPS of $0.70, up 30% YoY but down (3%) Qo Q2 adj EPS guide of $0.73-0.77, up 25% YoY and 7% QoQ at MP Margins: Q1 GAAP gross margin of 36.9%, up 1.7 pts YoY and 1.4 pts QoQ; core gross margin of 39.1%, up 1.2 pts YoY and 1 pt QoQ Q1 GAAP operating margin of 15.4%, up 2.5 pts YoY but down 0.5 pts QoQ; core operating margin of 20.2%, up 2.2 pts YoY and flat QoQ Q1 GAAP net margin of 9%, up 4.5 pts YoY but down 3.8 pts QoQ; core net margin of 14.1%, up 1.4 pts YoY and flat QoQ Cash: Q1 OCF of $362M for an 8.7% margin, up 4.4 pts YoY but down 16.3 pts QoQ on seasonality; adj OCF of $512M Q1 adj FCF of $188M for a 4.3% margin, up 4.3 pts YoY but down 12.3 pts QoQ Cash and equivalents of $1.76 billion, debt of $8.97 billion Inventories of $3.28 billion, up 6.6% QoQ Valuation: Corning trades at 8.8X forward PS ratio. The current PS ratio of 9.7X compares to the 3-year median of 3X. The PE Ratio is 88X compared to 70X as the 3-year median. The PE Ratio of 57X Notable Risks: Corning has two paths, either hyperscalers ramp faster than currently announced, and the stock deserves it’s valuation, or AI expectations are becoming too aggressive, and the stock remains a diversified materials company for longer than the market is pricing in. 5. AI Software Stocks Meta: Second only to Nvidia for AI Revenue About six months ago, we wrote a series of articles on the AI monetization supercycle, which is timed to the inference market inflecting. At the time, we had pointed out that Meta was second only to Nvidia for AI revenue: “What may surprise you is that Meta’s Advantage+ is outpacing OpenAI by 3X and is also offering the strongest AI revenue among the FAAMGs. Unless you track earnings reports as closely as my firm, the information from this past quarter could have easily flown under radar as Meta’s management team offered an update on Advantage+ that nobody was expecting: “This quarter, we saw meaningful advances from unifying different models into simpler, more general models, which drive both better performance and efficiency. And now the annual run rate going through our completely end-to-end AI-powered ad tools has passed $60 billion.” The $60 billion run rate was achieved within 3.5 years, which is on par with when OpenAI began to monetize in 2023 through year-end 2025. The last update we got from Meta's management on AI powered ads was in March of 2025 with a stated $20 billion annual run rate – which means AI ads have grown 3X in 7 months' time. Perhaps an even bigger shocker is that Meta may be ahead of Microsoft for AI revenue. The last update we got from Microsoft is from Fiscal Q2 ending in January, where AI revenue was stated to be $13 billion, growing at a pace of 175% year-over-year. Overall, it would require a step-up from 175% growth YoY to 460% year-over-year for Microsoft to match Meta’s AI revenue – an aggressive growth rate that I believe Microsoft would have already discussed with investors. Therefore, I believe probabilities favor Meta being in the lead on AI revenue, as it stands today. That means Meta would be in second place – second only to Nvidia – on AI revenue.” More recently, last quarter in our post-earnings write-up, our analysis pointed toward Meta had reported its fastest topline growth since late 2021, with Q1 revenue up 33% YoY, more than double Q1 2025’s 16% YoY growth, an impressive feat at this scale. Meta is also executing quite well with strong growth in engagement across Instagram and Facebook, while advertising key metrics were quite robust with ARPP notably seeing a meaningful step-up in growth. The company believes that there is ‘massive upside’ for delivering superintelligence via personal agents, but this also goes for the ad side to deliver increasingly relevant content and ads, keeping growth strong. We touched on this part in our Q4 earnings write-up, Meta Q4 Earnings: A New Era Driven by AI Agents, that Meta is moving away from pattern and behavior-driven algorithms driving its feed to LLMs. These LLMs offer reasoning for a level of personalization not possible in the current pattern recognition-based approach, helping drive both engagement and ROI higher. Meta also shared more details on its adaptive ranking model that that began to roll out in the second half of 2025, leveraging LLM-scale complexity of 1T parameters while maintaining millisecond speeds to serve ads at scale. In Q1, Meta expanded coverage of the model to support off-site conversions, driving a 1.6% increase in conversion rates on major surfaces on Facebook and Instagram. Stemming from this ability to increase conversion rates via a variety of different AI models or features, Meta is seeing strong momentum in its ‘value optimization suite’, which it says helps advertisers maximize ROAS by “prioritizing the highest value conversions rather than optimizing solely for the most conversions at the lowest cost.” The annual run rate of this suite has now surpassed $20 billion, more than doubling YoY. Even more recently, Meta announced a new pivot in its business model with the launch of Meta Compute, its push into selling its excess AI data center capacity in the cloud. This could open the door up for Meta to monetize its growing data center footprint and create additional recurring revenue streams outside of ads, though it comes with the steep challenge of putting Meta in direct competition with the hyperscalers. Meta could have an ace up its sleeve should it choose to offer access to its data-rich proprietary AI models like Muse Spark, though details over its offerings are unknown and could remain limited to raw compute capacity. The company has received one vote of confidence in that regard, with Anthropic reportedly discussing leasing $10 billion of capacity from Meta over the next two years. Revenue: Meta's Q1 2026 revenue came in at $56.31 billion, beating estimates by 1.4% and accelerating sharply to 33.1% YoY from 23.8% YoY in Q4 2025, representing the company’s fastest top-line growth since Q3 2021. On a sequential basis, revenue declined (6%) QoQ, which is typical seasonal softness after the holiday-heavy Q4. The strong print was driven almost entirely by Meta's advertising business, which continues to benefit from AI-powered improvements to its ad delivery systems and accelerating ad impressions and pricing. Looking ahead, management guided Q2 2026 revenue of $58 to $61 billion, implying YoY growth of 25.2% and sequential growth of 5.7% QoQ at the midpoint, in line with the estimates. AI Revenue: Advertising revenue reached $55 billion in Q1 2026, up 32.9% YoY — an acceleration from 24.3% in Q4 and 25.6% in Q3 2025. The dual drivers of this growth — ad impressions and ad pricing — both strengthened concurrently. Ad pricing saw a more pronounced acceleration, up six points from 6% in Q4 to 12% in Q1, marking its second fastest YoY growth since 2022. This combination of volume and pricing uplift underscores the effectiveness of Meta's AI-driven ad stack, including tools such as Advantage+, Andromeda, and GEM, in delivering measurable ROI improvements for advertisers. The last we heard on Advantage+ was a $60 billion run rate from Q3 results, although it’s likely far higher by now. Margins: Gross margin was 81.9%, effectively flat with Q4 2025 and in the same period last year, reflecting consistent unit economics in Meta's advertising-dominant business. Q1 gross profits grew by 32.7% YoY to $46.1 billion. Operating margin came in at 40.6%, a modest decline from 41.3% in Q4 2025 and 41.5% in the same period last year. Operating income was $22.87 billion, up 30.3% YoY. Meta's management has committed that operating income will grow in FY2026, even as total expenses are guided to $162–$169 billion for full-year 2026. Net income was $26.8 billion or 47.5% of revenue compared to $16.6 billion or 39.3% of revenue in the same period last year. Net income included a one-time tax benefit of $8 billionin the recent quarter and excluding the benefit net income would be $18.7 billion, up 12.4% YoY. Earnings: Meta reported Q1 2026 GAAP EPS of $10.44 and included a one-time tax benefit $3.13. Excluding that benefit, GAAP EPS would be $7.31, beating estimates by 9.8% — a healthy beat that reflects the strength of underlying operating performance. Looking ahead 2026 GAAP EPS is expected to grow by 26.2% YoY to $29.64 in 2026 and 16.1% YoY to $34.42 in 2027. Cash: Q1 operating cash flow was $32.23 billion or 57.2% of revenue compared to $24 billion or 56.8% of revenue in the same period last year. However, the increase in cash flows weredue to one-time tax benefit. Q1 free cash flow was $12.39 billion or 22% of revenue compared to $10.33 billion or 24.4% of revenue in the same period last year. Capex in Q1 2026 was $19.84 billion, up 44.9% YoY. As discussed above, management increased the FY2026 capex guide to $125 billion to $145 billion from the previous range of $115–$135 billion, implying a YoY growth of 86.9% at the midpoint. The increase was primarily due to higher component costs, primarily memory prices. The company had cash & marketable securities of $81.2 billion and debt of $58.8 billion at the end of Q1 2026. Valuation: Meta trades at a very reasonable valuation of 6.5 Fwd PS with the majority of its trading history since the AI boom being in the 9X forward range. The stock trades near it’s 3-year median of 8.9 compared to 7.7 for current PS ratio. The PE Ratio of 23.5 compares to the 3-year median of 27.4. The forward PE ratio is 20.2, in the middle of its typical trading range. Notable Risks: Meta is deeply entrenched in circular financing deals and will likely be free cash flow negative at some point between 2026-2028. Cloudflare: Agentic AI Drives Early Signs of Platform Adoption Cloudflare’s key metrics were stronger than the 34% revenue growth suggests, with remaining performance obligations outpacing revenue with 36% growth. There were a couple of inflection points hidden in the report, with deals worth $1 million reporting its fastest growth rate since 2024. Also, new-customer bookings grew at its fastest pace since 2023. Customers spending more than $1 million increased 73% and customers spending more than $5 million increased 50% YoY. Management stated they added as many new $5M+ customers in the first quarter as they did in all of 2025. On the Workers platform, the company added one million new developers compared to 1.5M during all of 2025. This is pointing to early signs of agentic AI making an impact, especially coupled with the fact that an R&D lab (announced as Anthropic) scaled nearly overnight from 0 to 1 million Dynamic Workers in 15 days. Dynamic Workers referring to environments where AI agents can run code without allowing unrestricted access to the entire system. Here is what was stated on the earnings call: “one of the large AI studios in just the last 15 days went from essentially zero Dynamic Workers to over one million Dynamic Workers running across the platform.” We’ve covered Cloudflare extensively on our site, particularly how it’s physically positioned at the edge to reduce latency, such as in our analysis Cloudflare Bringing AI Inference to the Edge written in 2023, and a follow up in 2025 Entering Act 3 to Become a Leader in AI. This was described on the call with Cloudflare stating they can lower global latency by 30%: “This customer wants to be the fastest and most reliable AI provider in the market, and Cloudflare is delivering. After deploying Argo, they immediately reduced their average global latency by 30%. In the AI space, that kind of speed is a real advantage that our hyperscaler competitors simply can't match.” Perhaps the most explosive comment on the call was when management compared their utilization rates to hyperscalers, a quote you have to hear directly to believe: “And so across most of the hyperscalers, you're seeing utilization rates of their GPUs that are in the single digits, whereas we're slowly getting our GPU utilization to approach what our CPU utilization is, which is up in the 70% to 80% range.” Revenue: Cloudflare reported revenue of $639.8 million, up 34% year over year, up from $479 million last year. Revenue increased 4.1% QoQ, which is slower QoQ growth than we’ve seen in recent quarters of 7% to 9%. Forward guidance was for $664.5M at the midpoint, for growth of 30% YoY and 3.9% QoQ. FY26 revenue is expected to come in at 29.6% YoY growth. Net retention rate was down 2 points from 120% to 118%. AI Revenue: Cloudflare does not report AI revenue at this time, yet added 1 million developers during Q1, for a total of 5.5. million on the Workers platform. Management said GPU utilization was approaching 70% to 80%. Margins: GAAP gross margin of 71.2%, down 4.7 pts YoY and 2.4 pts QoQ; adj gross margin of 72.8%, down 4.3 pts YoY and 2.1 pts QoQ GAAP operating margin of (9.7%), up 1.4 pts YoY but down 1.7 pts QoQ; adj operating margin of 11.4%, down marginally YoY and 3.2 pts QoQ; Q2 adj operating margin guide of 13.6%, down marginally YoY but up 2.2 pts QoQ GAAP net margin of (3.6%), up 4.4 pts YoY but down 1.6 pts QoQ; adj net margin of 14.7%, up 2.5 pts YoY but down 2.7 pts QoQ Cash: Q1 OCF of $158.3 million for a 24.7% margin, down 5.7 pts YoY and 6.3 pts QoQ; FCF of $84.1 million for a 13% margin, up 2 pts YoY but down 3 pts QoQ. Cash and equivalents of $4.16 billion, debt of $3.27 billion. Network capital expenditures represented 9% of revenue during Q1, although management continues to expect full-year network capital expenditures of approximately 14% to 15% of revenue. Near-term cash generation will be affected by Cloudflare’s workforce restructuring as the company laid off 1,100 employees. The company expects total charges of $140 million to $150 million, including approximately $105 million to $110 million of cash expenditures primarily related to severance, benefits and notice periods. Most of these charges are expected during Q2, with the restructuring substantially completed by the end of Q3. Valuation: The company’s PS ratio is 42 and the forward PS ratio is 35. This compares to a 3-year median of 24. The company is not GAAP profitable. Notable Risks: Gross margin compression was noted on the earnings call from lower-margin Workers, developer and AI compute products becoming a larger part of revenue. Actual AI revenue is not being broken out yet, combined with 2-points lower net retention rate and a modest 4% QoQ growth, puts the valuation at risk. Palantir: Undeniable Leader in AI Software; Much More Reasonable Valuation Palantir posted another strong quarter with revenue of $1.63 billion, representing growth of 85% YoY and 16% QoQ. The company continues to accelerate across many key metrics, including net retention rate, Rule of 40 soared to 145 and RPO also came in strong. The adjusted gross margin has expanded to 88%, the operating margin has expanded to 60% and the free cash flow margin to 57%. This remark helps to illustrate how fundamentally strong the company is “Our free cash flow this quarter is larger than our revenue a year ago in the same quarter.” Overall, you will find little fault with the company’s headline numbers. In fact, the company’s guidance for U.S. Commercial to be in excess of $3.2 billion for growth of more than 120% implies Palantir maintains a QoQ growth rate between 22% and 24% for the next three quarters. If it materializes, this growth rate will help maintain Palantir’s standing as one of the strongest AI software companies that we track. Government still remains critical to Palantir’s success despite its robust US commercial momentum. To hammer this point home, US government revenue also outpaced US commercial growth on a sequential basis this quarter at a larger scale, up nearly 21% QoQ to $687 million. Expanding its Government offerings is cornerstone for continued growth, with Palantir recently teaming up with Nvidia to bring secure, sovereign AI to US government agencies leveraging Nvidia’s Nemotron models. Notably, there was a timing issue which created a softer total contract value (TCV) metric. TCV Booked was down (43%) QoQ, leaving TCV of $2.41 billion – which is still flat to minimal growth over three quarters (more on this below). Last year, we did not see this flat growth over a 6-month period in TCV booked, instead there was an upward trajectory of roughly 50% growth over that 6-month period. Additionally, both RPO and Remaining Deal Value (RDV) are growing at a slower pace than revenue growth at 9% QoQ and 6% QoQ, respectively. Typically, it’s better when both RPO and RDV are higher than revenue growth. That may sound nitpicky, but when a company is priced to perfection, subtle shifts in forward indicators matter. Overall, Palantir is primarily a valuation story. We expect the stock to become attractive at lower levels for the foreseeable future, but at more than 40X to 50X forward sales, it remains too risky for our criteria. Given the sharp swings in both valuation and market sentiment, we prefer to trade Palantir rather than own it as a long-term position. Revenue: Palantir reported $1.633 billion in revenue in Q1 2026, up 16% QoQ and beating estimates by 5.8%, driven by an extraordinary surge in both US Commercial and US Government. On a YoY basis, revenue growth accelerated 15 points to 85% YoY, the company's highest growth rate since going public and the eleventh consecutive quarter of acceleration. Over the last eleven quarters, topline growth has compounded roughly 72 points, from just 12.7% in Q2 2023, an achievement matched by virtually no other enterprise software company. For Q2 2026, Palantir guided for revenue of $1.797 to $1.801 billion, implying 79.1% YoY growth at the midpoint and 10.2% QoQ growth, once again well ahead of prior consensus for $1.68 billion for 67.5% growth. This represents a sequential deceleration at face value, though at this scale and against a steepening compare base, the magnitude of absolute dollar growth remains exceptional. For the full year, Palantir raised its revenue outlook to $7.650 to $7.662 billion, representing 71.1% YoY growth at the midpoint, a 10-point upgrade from the $7.182–7.198 billion guidance issued just last quarter for 61% growth. Going back to our Q4 analysis, Palantir Q4: Highest Growth as Public Company; US Commercial to Accelerate, we had covered what Palantir’s historical beat-and-raise patterns implied for 2026 growth, noting that 2025 had ended more than 25 points higher than initial growth guidance. A similar pattern in 2026 would see Palantir exit the year at ~86% YoY, requiring a slight acceleration into Q2 and maintaining that pace through year-end. AI Revenue: Palantir's US Commercial segment delivered its third consecutive quarter of triple-digit YoY growth, with revenue up 133% YoY and 18% QoQ to $595 million in Q1. Since the start of 2025, US Commercial growth has accelerated 62 points; since the start of 2024, it has accelerated 93 points. Palantir reported its largest sequential increase in NRR since this key metric began inflecting back in late 2023, with Q1 seeing an 11 point expansion to the coveted 150% level. AIP (and US Commercial) is likely the core driver behind Palantir’s ten-quarter NRR expansion, as customers are increasingly expanding usage of the platform. It’s also worth noting that Palantir is in a league of its own when it comes to NRR, as other best-of-breed names like Snowflake have seen NRR flatline at 125% for the last three quarters. This sharp sequential uptick in NRR suggests that Palantir’s customers are increasingly expanding AIP usage at a faster rate, laying the groundwork for both overall revenue and US commercial revenue growth to remain at these elevated levels for a longer period. It also signals a higher degree of stickiness for Palantir in a time where the market is growing fatigued with software and threats of AI disruption, as the company can offer something beyond just workflow automation. NRR does not include revenue from new customers acquired over the last twelve months, and Palantir’s deal velocity in late 2025 and in Q1 supports continued upside to NRR in 2026, as many of Palantir’s larger deals closed (those >$5M and >$10M) begin to contribute. Looking more closely at deal counts below, Palantir has signed 747 deals over the last twelve months, with 203 of those deals worth >$10 million; none of these have yet to appear in NRR. When considering that NRR has yet to see impacts from the prior few quarters with >180 total deals and more than 40 >$10 million, and instead is only reflecting quarters with <150 deals and ~30 >$10 million deals, there is ample evidence supporting continued strength and upside in NRR as these customers begin to expand through 2026 and 2027. Should NRR follow the acceleration in deals into Q3, there is potential for NRR to begin approaching or exceeding 160%. On the flip side, Palantir’s TCV was a bit soft in Q1 with TCV booked showing a sharp deceleration on a YoY growth basis as well as a sharp (43%) QoQ decline. This is not necessarily an immediate red-flag for Palantir’s growth story, as there is an element of seasonality mixed in with a $1.3 billion impact last quarter tied to long-term International contracts. However, the decline does signal that there could be trouble ahead if TCV numbers do not begin to materially rebound next quarter. Key metrics for the segment remained strong. US Commercial TCV closed was $1.18 billion, up 45% YoY, while remaining deal value (RDV) stood at $4.92 billion, up 112% YoY and 12% QoQ. Palantir closed 206 deals of at least $1 million, 72 of which were at least $5 million, and 47 of which were at least $10 million across the company. Margins: Margins strengthened dramatically in Q1 2026, with Palantir setting a new benchmark for the combination of growth and profitability. Palantir’s Rule of 40 score (revenue growth rate plus adjusted operating margin) reached 145%, surpassing Q4 2025's record 127%, arguably the most elite margin-and-growth profile of any enterprise software company. Gross margin expanded to 86.8% in Q1, up two points QoQ from 84.6% in Q4 2025 and continuing its multi-quarter uptrend. GAAP operating margin was 46.2%, an expansion of roughly 13 points QoQ and over 26 points YoY, as operating leverage scaled impressively against accelerating revenue. Adjusted operating margin was 60%, beating guidance of 56.8% at the midpoint by approximately 320 basis points and expanding 3 points from Q4 2025's 57% actual result. For the full year, Palantir raised its adjusted income from operations guidance to $4.440– $4.452 billion, implying a full-year adjusted operating margin of approximately 58.1% at the midpoint—up from the prior $4.126–$4.142 billion guidance for a 57.5% margin. GAAP net margin was 53.3%, up roughly 10 points QoQ and over 29 points YoY—a remarkable achievement for a company growing revenue at 85%. Adjusted net margin was 52.5%. Stock-based compensation was $201.6 million, or 12.3% of revenue, a continued improvement from 14.0% in Q4 2025 and 17.6% in Q1 2025, reflecting growing revenue leverage over fixed equity costs. EPS: Palantir reported $0.34 in GAAP EPS in the quarter, beating estimates of $0.24 by 33.3%, while adjusted EPS was $0.33, beating estimates of $0.28 by 17.9% and representing a 154% YoY increase from $0.13 in Q1 2025. Palantir did not provide specific EPS guidance for Q2 2026; prior consensus had pegged adjusted EPS at approximately $0.28 for the quarter, which may see upward revisions following the Q1 beat and raised annual guidance. For FY2026, consensus had been tracking approximately $1.32 in adjusted EPS as of early May, though the Q1 beat suggests those estimates are likely to increase. Cash: Cash flows were exceptionally strong with Palantir maintaining mid-50% margins for both operating and adjusted free cash flow. Operating cash flow was $899.2 million for a 55.1% margin, roughly flat with Q4 2025's 55.0% margin and materially above Q1 2025's 35.1% margin. Adjusted free cash flow was $924.6 million for a 56.6% margin, marginally higher from 56.0% in Q4 2025 and a notable expansion from 42.0% in Q1 2025. For the full year, Palantir raised its adjusted free cash flow guidance to $4.2–$4.4 billion, an increase from the prior $3.925–$4.125 billion range; this represents a 56.2% margin with the updated revenue guide, up from a 56% margin previously. Cash, cash equivalents, and short-term Treasury securities totaled $8.03 billion at quarter-end, up from $7.18 billion at the end of Q4 2025. Debt remains zero. Valuation: Palantir trades at 66 current PS ratio compared to 64X being the 3-year median. The forward PS ratio of 42 could certainly catch a bid, but it would require the right technical setup for the IOF to participate. The PE ratio is 152X compared to the 3-year median of 271X. The forward PS ratio of 92X trades at a discount compared to the forward PE ratio of 260X. Notable Risks: Valuation. This Software Stock Just Landed Two Major AI Lab Deals This past quarter, a software stock reported 22 AI-native customers spending more than $1M annually and five customers spending more than $10M annually. R&D labs are now counted among the customer list with management stating AI-native customers include “the leading companies in foundational models, code-gen tools and vertical-specific AI solutions.” Additional key metrics that support the initial inflection includes large language model observability, which nearly tripled QoQ, MCP server tools calls, which nearly 4x’d QoQ, Bits assistant messages up 12x, and Bits AI SRE Agent investigations more than doubling from Dec to March. These products sit at the data center level, allowing developers to pull live production data into AI code environments, helps to triage security concerns using automation, and GPU monitoring. Of these, GPU monitoring is the most promising as it’s picking up AI training customers, especially as custom silicon grows more fragmented across Trainium, Graviton, TPUs, and Maia, with management stating: “The heterogeneity of the silicon is definitely a trend that plays in our favor… The more heterogeneous, the more you need someone else to make sense of everything for you and tie it all together." When broadening out the definition of AI revenue to include non-AI native customers, it was reported that 6,500 customers send data through one or more AI integrations, representing 20% of total customers – yet these customers are driving 80% of annual recurring revenue (ARR) – showing broad-based demand beyond the AI-native cohort. A few more initial signs to note: the company reported its strongest Q1 sequential revenue growth in four years (seasonally, a slower quarter) and also saw the strongest QoQ usage growth from existing customers in four years. To remain balanced, the company’s GAAP margin of 1% is slim due to stock-based compensation. However, cash is healthy with a FCF margin of 29%. This stock also receives a high technical ranking from Knox and will be featured in his upcoming July 2026 Positions Report for Advanced Market Signals members. I/O Fund Pro Members Get 30% Off Advanced Market Signals Unlock real-time trade alerts, access to the I/O Fund’s momentum stock list, and weekly webinars every Thursday at 4:30 p.m. ET. To join Advanced Market Signals with 30% off, click here to email us or email premium@io-fund.com and mention code ADVANCED30 Risks to the AI Trade In terms of risks that we watch closely, the two that come to mind are cash flows/circular financing and supply-chain constraints. We’ve recently covered the cash flow and circular financing concerns, particularly with neoclouds here. For some hyperscalers, capital expenditures are approaching, and could exceed the cash generated from operations. Big Tech having cash flows in the red is something Wall Street has not previously seen after these companies reached scale. We discussed which Big Tech companies are most likely to report negative free cash flow here. Circular arrangements, in which chip suppliers invest in or help finance customers that use the capital to purchase more compute, do not entirely invalidate the underlying demand. However, they make it harder to determine how much demand is independently funded and how durable it would remain if access to capital tightened. Financing vehicles, such as those involving Broadcom, Apollo, Blackstone and other investors may solve the near-term capacity problem, but they also demonstrate that even AI’s biggest beneficiaries, the design companies, are becoming dependent on private credit and externally financed demand. The larger concern is not a one-quarter AI revenue miss like Broadcom reported, but whether an increasing share of the AI buildout depends on capital markets being highly accommodating. Supply-chain constraints: AI demand continues to run ahead of the industry’s ability to manufacture and deploy the required infrastructure. TSMC’s leading-edge capacity remains a bottleneck as Nvidia, Broadcom, AMD, Apple and custom-silicon customers compete for advanced-node wafers. Our upcoming thematic on TSMC’s 3nm capacity covers the challenges that the node faces through 2026 and 2027, as accelerator shipment forecasts outpace capacity growth with analysts expecting substantial shortfalls in supply. The thematic will be published later this week, and explores the persisting constraints hitting TSMC’s advanced packaging, and the only method that will provide true relief for these bottlenecks. Constraints also extend beyond 3-nanometer production into memory, optical components and power infrastructure. These shortages can support pricing and revenue in the near term, but they also create execution risk when companies have demand they cannot convert into shipments or revenue on schedule. Conclusion: Consensus can provide a useful baseline, but by definition, it reflects what the market already expects. Therefore, consensus offers very little investment edge. This report is designed to unearth what the market has not priced in yet. Plenty of commentary is available that explains the AI stack, summarizes earnings estimates or identifies companies with the most obvious AI exposure. What this 90-page report seeks to do is something entirely different – I want to give my readers a path forward. Let’s be real, information in the AI era is cheap. If anything, investors are more overwhelmed today than ever before. What large language models cannot do is offer discernment, the one ingredient that transforms analysis into alpha. What you have is 90 pages of carefully crafted discernment, bold enough to share openly because the work behind it cannot be copied. Anyone can pull the same data; what they cannot replicate is what facts matter, which consensus views are wrong (or too early; said to be the same thing), and where the market has yet to catch up. Discernment is the one thing that doesn’t get cheaper even as information becomes more abundant. Q3 tech earnings officially kicks off on Wednesday – the I/O Fund team is ready. LINK TO PREVIOUS REPORTS: The I/O Fund’s Top 15 Stocks for Q2 2026 The I/O Fund’s Top 15 Stocks for Q1 2026 The I/O Fund’s Top 15 AI Stocks for Q4 2025 The I/O Fund’s Top 15 Stocks for Q3 2025 I/O Fund Members Get 40% off Discovery Discovery members recently received an analysis on a stock poised to benefit as Nvidia tackles the context memory bottleneck and extends KV cache memory with its new Inference Context Memory Storage platform. To subscribe to Discovery with 40% off, click here to email us or email premium@io-fund.com and mention code DISCOVERY40 I/O Fund Pro Members Get 30% Off Advanced Market Signals Unlock real-time trade alerts, access to the I/O Fund’s momentum stock list, and weekly webinars every Thursday at 4:30 p.m. ET. To join Advanced Market Signals with 30% off, click here to email us or email premium@io-fund.com and mention code ADVANCED30 Please note: The I/O Fund conducts research and draws conclusions for the Fund’s positions. We then share that information with our readers. This is not a guarantee of a stock’s performance. Please consult your personal financial advisor before buying any stock in the companies mentioned in this analysis. Damien Robbins, Equity Analyst at I/O Fund contributed to this analysis.
Corning: Glass Manufacturing Powerhouse Pivoting Hard into AI Networking
As a leading glass manufacturer in the United States, Corning is uniquely positioned to benefit as optical content grows. Whether it’s from the medium-term shift from copper to optical fiber, the incoming growth from near-packaged optics and co-packaged optics, or just what we are seeing from Lumentum’s strong growth on scale-out photonics: it’s clear that optical content is growing quickly in AI clusters. In all directions: scale-up, scale-out, scale-across and CPOs/NPOs, more fiber cables and connectivity will be needed, which Corning sells as integrated systems. Corning’s GenAI fiber products offer 2X to 4X more fiber in an existing conduit, which is key as cluster sizes continue to scale. Their single-mode SMF 28 fiber for CPO applications features 40% smaller cross section, saving space while delivering strong performance. The Contour Flow cables simplify deployments by delivering 2X the fiber in the same diameter, and their miniaturized multifiber connectivity (MMC) connectors enable 3X more connections versus legacy connectors, while its MMC assemblies can accommodate 36X more fiber within a data center rack. The management team spent a good portion of last quarter’s earnings call going over how they achieve a lower total installed cost. First, by owning the entire stack, Corning is not as exposed to rising ASPs across the optical content industry. The company is entirely U.S.-based, which reduces supply chain risks. Historically, Corning has offered a co-investment model on its glass business and will replicate this for GenAI products. It results in a highly profitable business as they lock-in multi-year and multi-billion dollar commitments with Meta and will be adding two more hyperscalers, per the earnings call. Consider that the Meta deal alone of $6B is 2X Lumentum’s revenue – although not an apples-to-apples given the Meta deal is multi-year, the point is that Corning is just getting started. If we see similar size deals from the next two hyperscalers, Corning could eclipse smaller networking players quite quickly in terms of AI revenue. There are numerous levers a company like Corning can pull to steer incremental capital and capacity toward higher-growth segments. Leaning hard into a mix shift for its GenAI products won’t happen overnight, but it will happen profitably. $6B Meta Deal and More Incoming Deals with Hyperscalers Corning is already locking in substantial revenue streams via long-term supply deals with hyperscalers, having first announced an up to $6 billion deal with Meta for multi-year supply of optical fiber, cable and connectivity solutions, followed similar deals with Amazon and a third unnamed hyperscaler. Reports noted that the Meta deal would see Corning’s optical suite utilized in Meta’s 1GW Hyperion and 5GW Prometheus data center campuses, with CEO Wendell Weeks stating that Hyperion would require 8 million miles of optical fiber. While the scope of the deal was not confirmed – if it was exclusive to these two data centers or includes other facilities for Meta – rough speculative math implies Corning’s revenue opportunity at a max of $1 billion per GW for just the two. In Q1, Corning explained that it was in discussions with other customers for the “same size and duration as the Meta agreement,” adding that they now have “concluded two more large, long-term agreements with hyperscale customers, and they are each similar in size and duration to the Meta agreement.” The three deals were implied to primarily focus on scale-out applications. One of these customers was revealed to be Amazon, who announced its multi-year supply deal with Corning earlier in June – while Amazon did not put a specific size on the agreement, Corning’s wording from Q1’s call also implies this is likely to be around a four-year, $6 billion scope similar to Meta’s. Considering that the three deals likely amount to >$15 billion in long-term supply agreements (almost equivalent to Corning’s current TTM revenue), analysts had a flurry of questions in Q1’s call about supply allocation and risk mitigation, capacity expansion, and pricing power. On the first part, BofA’s Wamsi Mohan questioned about how tight supply was, if Corning had enough to meet demand and how this related to pricing, considering some international competitors were moving to raise prices. CEO Wendell Weeks explained that Corning was pursuing LTAs because optical growth is accelerating robustly, with the agreements helping Corning “get very balanced coverage so that we aren't dependent on any one model maker or any one AI cloud provider,” rather than trying to pick a specific winner to allocate the majority of their supply to. Weeks added that Corning also was aiming to “appropriately share the risk of the required expansions to support this rapidly accelerating growth,” which was revealed in a later answer to take on a blend of take-or-pay contracts, capital commitments or accelerating share agreements from hyperscalers, depending on how they wanted to share said risk. On the second part, analysts questioned if the deals would require material optical glass capacity expansion, to which Weeks explained that the three LTAs are “driving so much growth” that there would be expansion across all of Corning’s major optical operations, including fiber. One way Corning will expand capacity is via its agreement with Nvidia to increase domestic optical connectivity capacity by 10X, though there is a chance Nvidia will secure much of that – more on this below. On the third part, Corning did confirm that pricing is favorable to suppliers who have capacity readily available, yet management emphasized that they are not playing the pricing game and leveraging the supply environment for their gains, rather aiming to preserve customer relationships: “We don't focus on raising the price of our commodity product sets. Over here is an annuity and driving significant gains across big numbers and delighting customers. Over here, I have a demand supply exploitation. And when you want to create the type of customer franchises we seek to create, memories are long. And so that is our approach to that. We will improve our profitability directly linked to our ability to invent, serve and then make at a lower cost.” Nvidia Investment to Expand Optical Manufacturing Capacity Supporting its optical ambitions, Corning and Nvidia struck a strategic partnership in early May, which will see Nvidia invest up to $3.2 billion in Corning to help the company expand its domestic optical connectivity manufacturing capacity by 10X and its domestic fiber capacity by 50%. Corning will also build three new advanced manufacturing facilities in North Carolina and Texas. The increased capacity “will supply the optical connectivity hyperscale data centers use to deploy Nvidia-accelerated computing at scale,” according to the companies. Reports from CNBC suggest that the capacity increase and decision behind Nvidia’s dealmaking is to support its CPO ramp. This follows a series of multi-billion dollar investments from Nvidia across the optical supply chain, such as in Coherent and Lumentum, suggesting Nvidia is looking to substantially increase capacity across the landscape and lock in a majority of that supply for itself. Optics Driving ‘Springboard Plan’ Upgrade to 19% CAGR Corning recently upgraded its ‘Springboard’ plan at the beginning of May, with optical opportunities and photonics growth driving a majority of the upgrade to Corning’s longer-term revenue, margin and earnings targets. The latest plan roughly projects Corning’s revenue growth rates to see a rather prolonged acceleration from the low-teens currently to nearly the 30% level by late 2028. In January, Corning upgraded its Springboard plan’s run rate from $18 billion by Q4 2026 and $21 billion by Q4 2028, to $20 billion in 2026 and $24 billion in 2028 Now, management is eyeing a $30 billion run rate by 2028, and a $40 billion run rate by Q4 2030. This implies Corning’s revenue run rate doubling from the end of 2026 to the end of 2030, or representing an accelerated 19% CAGR starting the end of this year, compared to its original 15% CAGR from 2023 through 2026. To note, these figures above represent Corning’s internal plan, while its high-confidence plan projects $27 billion by Q4 2028 and $35 billion by Q4 2030, remaining more conservative by $3 billion and $5 billion respectively. Source: Corning The largest driver of this upgrade is Corning’s Photonics Market-Access Platform (MAP), a completely new vertical emerging from scratch this year to a multi-billion dollar segment by 2030, complemented by growth in Enterprise. Combined, the two are expected to account for roughly $20 billion in run rate revenue by Q4 2030, or around half of overall revenue. Corning offered one main driver for the increase in its Springboard plan: “one of the most significant areas we're adjusting for is the timing on scale-up of the network. This impacts both Enterprise and Photonics. … So the timing of when scale-up happens could have a significant impact to our numbers and determine whether we track to the internal plan or the high-confidence plan.” Enterprise MAP: Cluster Size Increases Driving Near-Term Content Growth While management expects scale-up timing and adoption to be the determining factor for growth, much of the near-term growth, at least over the next six quarters, is likely to come from the scale-out side within Corning’s Enterprise MAP. The primary driver for this is expected to be increasing cluster sizes, enabled by the transition to 1.6T. Broadcom’s current Tomahawk6 switch can support >100K-XPU clusters on a two-tier topology at 200G per link, yet Corning explained that moving beyond 130K clusters (also corroborated by Celestica) would require a three-tier topology, increasing switch density and links. This would drive optical content per GPU 50% higher: “The logic is that cluster sizes greater than 130,000 GPUs will require a third optical layer. As clusters grow, that is good for our content opportunity. When clusters get larger than 130,000 GPUs, a third switch layer is added to connect all of the GPUs to each other. Now let's take a deeper look at how this actually works. As shown here, once cluster sizes get above 130,000 GPUs, we exceed the network scale capability that can be achieved with a 512 radix switch with 2 layers. That adds a third layer. Basically, 3 layers divided by 2 layers yields 50% more content.” This is the immediate and near-term driver for Corning (alongside DCI for intra-campus connectivity), as cluster sizes are rapidly progressing beyond the 130K accelerator threshold. Per Epoch AI, as of Q1 2025, there was only one cluster with 100K GPUs – xAI’s Colossus 1. Source: Epoch AI However, by Q1 2027, Epoch AI estimates that there will be 46 frontier data centers with >100K H100 equivalents, and eight with >500K. While there is an important distinction to be noted with Epoch AI’s data being listed as H100 equivalents, meaning actual GPU counts could be lower due to Blackwell-class GPUs being more powerful, it’s indicative of the broader trend of rapidly scaling cluster sizes to accommodate both training of larger models and inference at larger scales. Source: Epoch AI Corning outlined a secondary driver for growth within its Enterprise MAP, with this being GPU bandwidth increases, though this is not appearing to be a driver with Rubin. The way Corning could drive growth with Rubin would be through higher ASPs on the shift up to 200G, as content remains the same: “When we move from Hopper to Blackwell, the SerDes stayed the same at 100G but the bandwidth needed to double, thus requiring that we increase the fibers from 8 to 16, doubling the amount of our potential optical connectivity content. Now as we are moving into the Rubin era of GPU architectures, we see a jump in SerDes to 200G. Thus, we're able to keep the lane quantity consistent, resulting in a neutral impact on fiber content.” Management expects the next bandwidth upgrade for Nvidia’s GPUs to occur with Feynmann in the 2029-2030 time frame, though if this is driven by the shift to 400G, content would also stay the same (whereas remaining at 200G would double fiber content by doubling lanes). While bandwidth is not likely to be a key driver for growth aside from a potential uplift in ASPs with 200G on Rubin, management expects cluster sizes to drive an up to 50% uptick in demand: “When I put all of these technical drivers together and focus on the near term, we calculate that the demand for optical content per GPU in our Enterprise MAP will increase by 1.3 to 1.5x by 2028.” Taking into account potential ASP gains with Rubin moving to 200G alongside the immediate-term expansion of clusters beyond 130K GPUs and the subsequent 50% increase in optical scale-out content, Corning has the ingredients to sustain >30% growth in its Enterprise Networks sub-segment within Optical Communications. For context, Q1 growth for Enterprise Networks was 36% YoY, accelerating from 30% in Q4. Photonics MAP: Scale-up, Rubin Ultra and ‘Inside-the-Box’ Opportunities Corning’s more near-term opportunity within scale-up comes with Rubin Ultra and the expansion in scale-up domains from 72 GPUs to 576 GPUs and beyond. This is expected to drive significant growth in optical content as agentic AI and reasoning models require extreme throughput that copper can no longer accommodate at these rack-scale distances. This boils down to latency. CEO Wendell Weeks explained that it theoretically would be possible to connect more NVL72 racks together in the scale-out network using copper to reach a 576-GPU node, yet it would introduce a 10X increase in latency to >1,500 ns. However, with optics in scale-up, latency could be contained to 320 ns, or a ~5X improvement and maintaining the fast throughput required for agentic AI at scale. Corning provided some benchmarks for the overall content opportunity that the shift to optical scale-up brings with Rubin Ultra: At the lowest end, with 100% of scale-up being done as it is today with copper, the optical opportunity remains the same: zero scale-up content, and scale-out content of 16 fiber pairs per GPU (two fibers per lane and eight lanes using 200G SerDes), or 9,216 pairs per NVL576 rack. At the high-end, assuming 100% optical scale-up, this translates to 72 200G lanes, each requiring two fiber pairs, or 144 per GPU, alongside the same scale-out content of 16 pairs per GPU. This translates to a 10X optical fiber pair content per GPU, rising from 16 to 160; for the entire rack, this would equal 92,160 pairs. Source: Corning However, neither of those two will be the case as it would not be feasible to either adopt optics at 0% or 100%, but rather it would be somewhere in between. Corning noted that the exact opportunity could be determined by hybrid scale-up penetration, which is unknown, and by the percent of optical ports in the NVL576, which was said to be confidential. Even assuming 25% optical scale-up penetration in the near-term, or 36 fiber pairs per GPU, the total opportunity from today more than triples to 52 fiber pairs per GPU, or 29,952 per NVL576 rack. Moving the needle to 50% optical scale-up penetration, and per Corning’s math, fiber pairs per GPU rises to 72, or 88 total including scale-out for 50,688 per NVL56, a 5.5X increase. Inside-the-Box Could Reach $10 Billion by 2030 Up until this point, Corning had not forecast significant scale-up revenue appearing between now and 2028, but management explained in Q1 that discussions with key customers and architectural shifts have increased the probability of scale-up revenue appearing through 2028. However, it should still be noted that the largest opportunities from scale-up, CPO/NPO and moving ‘inside-the-box’ with its Photonics MAP are likely more geared towards 2028 and beyond. Historically, Corning has had zero inside-the-box content, which is why this new growth vector is particularly appealing as it is entirely additive to current revenue streams. For reference, Corning’s current opportunities remain outside the box with its fiber connectors linking to pluggable transceivers. Corning offered a diagram to highlight where its inside-the-box opportunities arise, notably with the company seeing multiple single-mode fiber (SMF) connections between ELS modules and fiber array units (FAUs) on CPO switches (for context, Corning highlights its content opportunities in yellow). Both components are critical as the FAUs help align the optical fibers to the PIC on the optical engine with low insertion loss to preserve signal integrity. Corning’s density advantage with SMFs could help it emerge as a key winner inside-the-box by delivering higher throughput with that low insertion loss and low latency. Source: Corning CPO switch bill-of-materials estimates from Goldman Sachs help put in perspective what the fiber and FAU content opportunities could look like for Corning. Goldman estimates a total BOM of ~$75,800 for Nvidia’s upcoming Quantum-X Photonics InfiniBand switch, which includes 72 FAUs and 1,152 single-mode fibers, where Corning aims to play. With a $50 ASP estimate for the FAU and $11 for the SMF, the total potential revenue opportunity from these two pieces for Corning could reach ~$15,943 per switch (or 21% of the BOM) at 100% market share, though this may be an unrealistic expectation for Corning to achieve. Source: Goldman Sachs Management is confident in this new inside-the-box opportunity being substantial, outlining the potential to add $10 billion in incremental revenue by 2030; the challenge, however, comes down to timing and adoption: “First, it depends on when CPO is launched. Like optical scale-up, there is much debate among market participants, especially in the near term. But most would agree that it will begin in scale-out as early as next year. Second, you must decide how much of the market will need optical scale-up and decide to adopt it. Many think that it begins in earnest in 2028. And by 2030, co-packaged optics inflects towards becoming the predominant solution for scale-up switches. Now we will see. But regardless of when, count on us to be ready. We have gone through a few of our assumptions today but not all of them. In total, this is very difficult to assess with traditional modeling techniques. Ultimately, you'll have to decide your point of view on the timing and speed of adoption. But if we're correct on these 2 things, we see the inside-the-box opportunity adding an incremental $10 billion of revenue by 2030.” Reading between the lines on management’s commentary implies that scale-out CPO contributions on Nvidia’s Spectrum-X Ethernet switch, which is preparing to ramp come 2H, are rather inconsequential compared to the broader opportunity within scale-up CPO switches – that time will come, but it is not there yet. Financials Overview Corning delivered Q1 core (non-GAAP) revenue of $4.35 billion, up 18.2% YoY but down (1.5%) QoQ on seasonality. Q2 core revenue was guided to be $4.6 billion, representing a deceleration to 13.7% YoY with QoQ growth of 5.9%. As noted above, revenue growth is expected to fluctuate in the mid- to high-teens YoY over the next six quarters. Margin expansion was minimal, with core gross margin expanding just 1.2 points to 39.1%, while core operating margin showed a bit of leverage, expanding 2.2 points to 20.2%. Core EPS growth was steady, up just under 30% YoY to $0.70. Despite the seasonality, operating cash flow more than doubled, with adjusted OCF margin up more than 6 points YoY. Capex was $332 million, well supported by OCF, with Corning guiding for capex of $1.7 billion for the year, ramping into 2027 and 2028. Cash to debt is elevated at $8.97 billion in debt to $1.76 billion in cash. Key Metrics and Segments Given the conglomerate nature of Corning’s business, AI driven growth is shrouded by lower-performing segments. Optical Communications revenue was $1.85 billion, up 36% YoY and 9% QoQ, with growth spread almost equally between Carrier (DCI and fiber-to-home) and Enterprise (GenAI). Carrier revenue rose 36% YoY and 9% QoQ to $884 million, while Enterprise grew 36% YoY and 8% QoQ to $962 million. Glass Innovations revenue was $1.42 billion, up just 1% YoY and down (5%) QoQ. Automotive revenue declined (1%) YoY and (1%) QoQ to $437 million, while Life Sciences and Emerging Growth revenue was flat YoY and down (8%) QoQ to $272 million. Solar revenue rose 80% YoY yet declined (22%) QoQ to $370 million. Conclusion Corning is sandwiched between the dual trends within scale-out and scale-up networking with the added benefit of CPO tailwinds in the future. Corning’s single-mode fibers and MMC connectors enable substantial increases in fiber density, which will help deliver the throughput and latency advantages needed for agentic AI and multi-step reasoning at scale as clusters scale beyond 130K GPUs and as racks scale to 576 GPUs. Near-term optics opportunities look to remain concentrated around scale-out and cluster size increases driving higher optical content per GPU, while Corning’s larger revenue opportunities within its Photonics MAP, inside-the-box, look to be weighted towards 2028 and beyond. Please note: The I/O Fund conducts research and draws conclusions for the Fund’s positions. We then share that information with our readers. This is not a guarantee of a stock’s performance. Please consult your personal financial advisor before buying any stock in the companies mentioned in this analysis. Damien Robbins, Equity Analyst at I/O Fund contributed to this analysis. Recommended Reading: Credo: Reliability Leader Aggressively Moves into Optics Macom: Data Center Revenue Accelerating to 35% QoQ in FQ3 Monolithic Power: Enterprise Data Growth Boosted by 35 Points, 800G Optical Growth Appearing MaxLinear: Optical Data Center Demand Accelerating, Margins to Improve in Q2
The IPO Glut of 2020: Why Valuations Have Gone Too Far

This article was originally published on Forbes on Jun 18, 2021,12:43am EDToriginally published on Forbes on Jun 18, 2021,12:43am EDT
There is an outsized risk with Snowflake, AirBnB, DoorDash and Roblox’s IPOs showing an extreme increase in valuation since the last private funding round that will be hard for the public markets to absorb. I dug up some comparative research between 2019 IPOs and 2020 IPOs and describe this outsized risk, which is 10-fold from the IPO class of 2019.
More times than not, IPOs lead to losses for retail investors and there are specific reasons as to why. These reasons have only gotten worse with loosened IPO regulations. We also look at why raising capital at the same time as a Direct Listing shifts too much risk to the general public.
The IPOs of 2020: Snowflake, AirBnB, DoorDash and Roblox (2021)
Despite the hype that flashy IPOs draw, more than 60 percent of the 7,000 IPOs from 1975 to 2011 had negative absolute returns five years later. However, the 40% odds for success through 2011 are better odds than what investors face today.
IPOs in Review: 2019
Before we talk about the serious red flags in the IPO scene of 2020, I want to visit what 2019 looked like as a reference point.
In 2019, Zoom Video and Crowdstrike went public with the fastest growth levels the tech industry has ever seen. We will use these two as a baseline because their top line financials at time of IPO continue to exceed any tech IPO we have seen since.
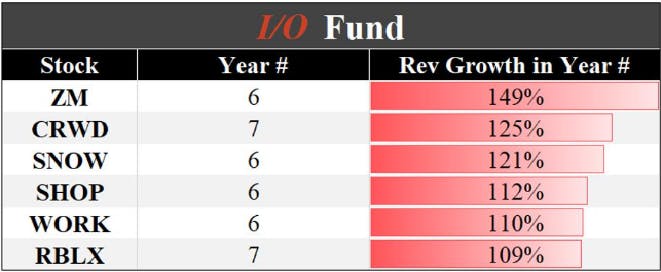
Source: Snowflake IPO: In-Depth Analysis
In the case of Crowdstrike, the company’s last private valuation prior to going public was in May of 2018 for $3 billion. The initial price that institutions paid was $7 billion and the shares began trading at a $11 billion valuation. When we average out the premium paid between the last private valuation and the opening price of $8 billion on a per month basis for the time it took to go public, retailers paid a premium of $615 million per month across 13 months.
Crowdstrike went on to have a volatile trading history in the first year with a peak to trough drop of roughly 50% within six months.
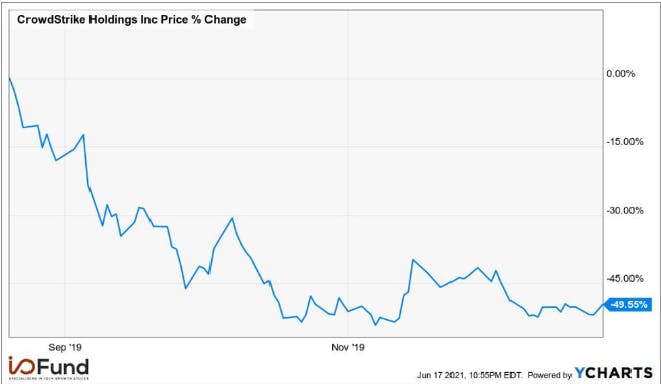
YCHARTS
Zoom Video’s last private valuation prior to going public was $1 billion in April of 2017. The initial price institutions paid was $9.2 billion in April of 2019 with shares opening at a $20 billion valuation. When the $19 billion is averaged out across the 27 months between Zoom’s last private round, the premium retailers paid on valuation is $703 million per month. This is about $90 million more per month than Crowdstrike.
Notably, I covered Zoom Video as the “Best Silicon Valley IPO” at the time of its listing but the I/O Fund waited until the following January 2020 to enter the stock at $62. Despite perfect earnings beats, it took Zoom Video an entire year before it consistently traded above its opening price
The point of this is to illustrate that tech’s top growth companies had their valuations increase an average of $600 to $700 million per month range since the last private valuation. These opening prices, which ranged from an increase in valuation of $5 to $10 billion required a year to absorb.
IPOs of 2020 and 2021:
The opening valuation for Zoom Video caused Barron’s to call Zoom Video’s IPO a Crazy Bubble. If that’s a crazy bubble, then I’m not sure what the words are for 2020. The word “glut” comes to mind as Snowflake, AirBnB, DoorDash and Roblox increased their valuations from the last private by an order of magnitude compared to the IPO class of 2019.
Let me explain:
Snowflake’s last private funding round was at a valuation of $12.4 billion in February 2020 with an initial price of $33 billion and an opening price of $68 billion in September of 2020. That means Snowflake opened trading at a premium of $8 billion per month since the last private valuation compared to Zoom’s $700 million and Crowdstrike’s $600 million. Snowflake essentially 5X’d it’s valuation in 7 months while revenue declined.
This also means the market must absorb a $35 billion premium on top of the initial price. How long do you think that will take considering it took Zoom Video a year to recoup a $10 billion premium? It’s impossible for a valuation to spike that much in one day without it taking a substantial amount of time for the valuation to catch up to financials.
This is a tough pill to swallow as we’ve published favorably on Snowflake as a company and a product. Yet, there is no real valuation here if the last private valuation was $12 billion within the last year; it’s simply pie-in-the-sky pricing that insiders hope will last. The company did not change and there were no catalysts.
Consumer favorites AirBnB and DoorDash came public recently and the difference in private valuation versus public valuation is even more absurd as these companies carry a higher risk in terms of performance post Covid. AirBnB’s last private valuation was on April of 2020 for $18 billion. Eight months later the initial pricing was at $42 billion and the opening price at $90 billion.
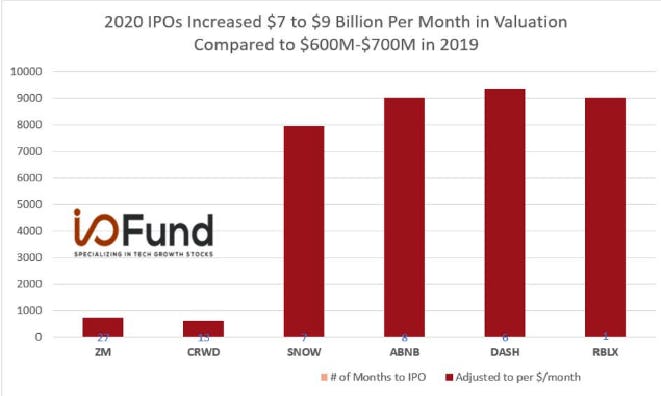
2020 IPOs Increased $7 to $9 Billion Per Month in Valuation Compared to $600M-$700M in 2019 – I/O FUND
AirBnB’s opening price equates to $9 billion in valuation per month in premium that retailers are paying on a company that was worth $18 billion earlier in the year with the same growth numbers and revenue. In fact, AirBnB only grew revenue by $1 billion in 2019 before declining by $1 billion in annual revenue in 2020 due to Covid. The forward revenue for this year is $300 million more than the revenue in 2019. Most certainly, growth did not drive the opening valuation.
DoorDash carries the most risk of the four names we are analyzing as the economy opening up will translate to fewer food deliveries. This company had a $16 billion valuation in its last private round in June of 2020. The initial price was at a $34 billion valuation and the opening price at a $72 billion valuation.
Technically, DoorDash should be valued below its Covid valuation as there’s more risk with the economy opening up as to how the company will perform. All Covid winners have taken a hit to their valuations: Zoom, Crowdstrike, Peloton, etcetera.
Roblox is another blatant example of how IPO valuations are overpriced for retailers. The company raised a private round at $29 billion in February of 2021 before going public at a $39 billion valuation one month later. This means retailers were charged at $10 billion per month premium. We will have to check back this time next year to see how long it took for Roblox’s stock price to permanently absorb the $10 billion it charged retailers. Notably, all of these examples do well in bull markets while the real impact comes out during downturns.
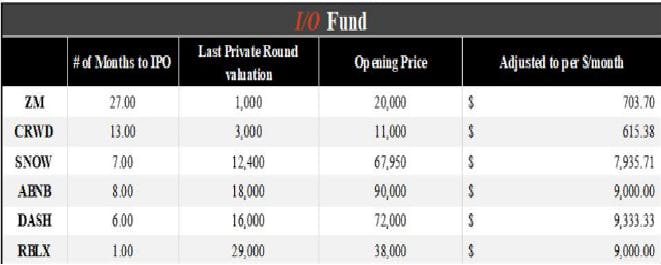
I/O FUND
Often times, retailers will cheer on 15% or 30% gains in one day when a stock really pops. Yet, most IPOs are seeing 80% to 100% gains for an average of $30 billion generated in one day between the initial price and the opening price. What retailers must understand is that valuations have a ceiling and this means the company must earn this $30 billion pop in valuation over time.
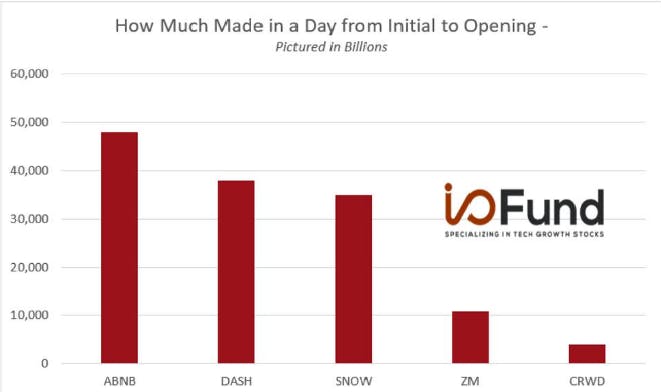
How Much Made in a Day from Initial to Opening – I/O FUND
SEC IPO Regulations that Have Changed:
Here are a few of the new regulations being leveraged:
· Direct listings can now raise capital, which means retailers are exposed to more companies that have no lockup expiration. The company can list at a high valuation and insiders can liquidate as soon as it’s listed. You’ll see below examples of failed direct listings, such as Spotify and Slack. Prior to the recent change, direct listings could not raise capital.
· According to Forbes, SPACs made up 50% of the IPO market last year. The volume is high because SPACs allow companies to go public faster. Although there are some gems that have come from reverse mergers, SPACs often have a complicated business history and some proxy statements have become the subject of litigation.
· SPACs also come with fees known as “the promote” which allows 20% of the shares to go to the SPAC manager. The 20% of shares is effectively taken from investors plus 5% in other fees.
· The SEC may start to treat warrants as liabilities which could slow the pace of SPACs; this comes after nearly 250 SPACs went public last year and 340 have already gone public this year. The percentage of IPOs that were SPACs is at 72% this year, up from 55% this year. The speed in which SPACs go public has created byzantine filings.
· Traditionally, lockup periods lasted 180 days yet we are seeing many creative ways of approaching lockup periods, such as partial lockup expirations that come sooner or opportunities for employees to sell before investors. “Blue Sky Laws” were put into place to help protect investors by ensuring full lockup period yet this has become looser over the last few years. If a company has a partial lockup period expire, they often bury this in the S-1 filing.
A Note on Direct Listings
Retailers have no voice on Wall Street, and this is evident by the way that venture capitalists openly criticize the IPO process because they’d like to see the fat surplus between the initial price and the opening price go to the company and other insiders rather than institutions.
Translation – it’s okay to keep charging high prices to retail, but instead, make sure the cash is funneled to the right people. Direct listings accomplish nothing when it comes to the outsized risk that IPOs have presented in the last year; which is raise money, continue to charge the $7 to $9 billion per month in valuation to retailers, and have no lockup expiration (rarely, does a private company increase $7 to $9 billion in one year let alone one month)
Direct listings propagate high valuations because the stock does not need to perform for six months; it can immediately fail and still provide an exit. In this case, 100% of the risk is transferred to retail at the open trade and there are crumbs left in terms of reward.
I was critical of Slack’s DPO two years ago and also Spotify’s DPO. Notably, Slack is a stock my company ended up owning after it plummeted more than 50% from its DPO opening price. From experience, the I/O Fund has concluded there is too much downward pressure from DPOs and the immediate exit for insiders is a flag as a serious company will look for long-term investors.
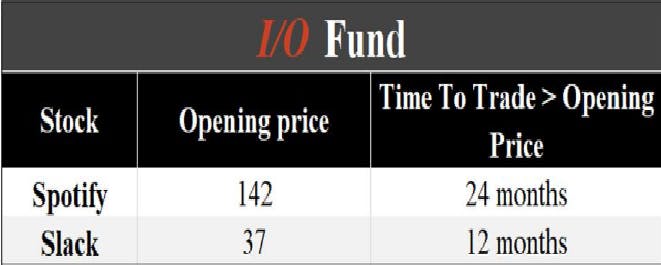
I/O FUND
You can access my previous analysis on Slack’s DPO here where I stated:
Slack is not looking to raise money, and has chosen a direct listing as opposed to a traditional initial public offering. This means insiders will initially sell their stock and there will be no lock-up period. Eliminating the lock-up period creates even more risk than usual compared to traditional IPOs that have six-month lock-up periods.
Around the time of Slack’s DPO, we discussed why we did not like this process. We cited Spotify as an example as Spotify took twenty-four months to reach its opening price again, and Slack – arguably one of the best products to come out of Silicon Valley – only touched its opening price again 12 months later after Salesforce announced they were acquiring the company.
That’s a very long time to park your money with no return not to mention the scary roller coaster ride on the way down.
Know Who Your Advocates Are:
Retailers need representation and better information on IPOs and valuations. As advocates for retailers, we often hold off from buying IPOs until after the lock-up period, and we always disclose every entry and exit we make with real-time notifications. If we do participate, it’s with an active stance and the understanding we may exit before the lock-up period expires if the chart looks weak. We will then re-enter when the stock stabilizes – usually a year or so after the IPO.
In the case of the new class of IPOs, there’s a chance the companies don’t stabilize for many years as the true valuation is likely the initial price that institutions paid (i.e., there’s a reason they paid that price and not a penny more – both sides have teams of professionals to fairly price the transaction for a funding round).
Confirmation bias is also commonly used against public investors. In this case, because DoorDash and Airbnb are well-known and well-loved consumer brands, the opening price was especially lavish. I had gone to great lengths to warn retailers about Uber while many talking heads said the stock could reach $100 or higher. That analysis is worth a read as it became one of my best calls in terms of protecting losses for my readers.
Conclusion:
There is undeniable evidence that something odd happened in 2021 in terms of the run-up in valuation on IPOs as we saw the premium retailers pay grow from $600-$700 million to $8-10 billion per month since the last private valuation. The glut in the IPO process will eventually catch up to market as this run-up is not sustainable without a meaningful change in story or re-acceleration in growth (the opposite happened; there was as deceleration in growth in all four companies).
The loosening of IPO regulations leading to outsized risk is reminiscent of loose lending laws during the financial crisis. If history is any indication, the banks will be bailed out and the individual will suffer. Therefore, we do our best to avoid participating in frenzies as there is no magical market where valuations don’t have a ceiling, rather they can hit a ceiling very quickly and take time (years) to be absorbed.
Note: If we do keep our Snowflake position, we will plan to exit on any weakness. This is distinct from the list of stocks we hold with no plans to exit.
Zoom Discusses Two Important Catalysts In Q1 Earnings
This article was originally published on Forbes on Jun 3, 2021,11:31pm EDToriginally published on Forbes on Jun 3, 2021,11:31pm EDT
Zoom has had record-breaking earnings results for four quarters now and the market is growing complacent with this stock. The company has (again) posted the highest growth in the cloud software category with revenue at of $956.24 million, or 191% year-over-year growth. The bottom line is also the best in its category (yet again) with adjusted EPS of $1.32 and free cash flow of $454.2 million – which is nearly double the consensus of $280.4 million.
Meanwhile, we saw very little reward in terms of price action. This could change as there was 19 institutional analysts on the call; a surprisingly high number. Zoom also had the Head of Zoom Phone join the call, Graeme Geddes, who announced there are now 1.5M seats of the Zoom Phone, which means the company added 500K new lines in 5 months.
As offices reopen, the growth of the Zoom Phone will be particularly important for investors who want to see more than a web conferencing app. As evidenced by Q1, we continue to see great demand for Zoom Phone, which bodes well for Zoom as they begin to face difficult comps in the second half of 2021.
Geddes also discussed the momentum and accelerating growth the company has observed with Zoom Phone: “At the end of December, we announced reaching 1 million seats of Zoom Phones sold. Well, that momentum continues and I am excited to announce that we have now surpassed 1.5 million seats of Zoom Phones sold as of the end of September. It’s been absolutely amazing to see the growth continue to accelerate.”
In the Q1 Conference Call, Zoom management announced their new device category, the Zoom Phone Appliance. The head of Zoom Phone & Rooms, Graeme Geddes, discussed the new device category in the company’s conference call:
“Our new Zoom Phone Appliances allow our customers to take advantage of the powerful audio and video capabilities of Zoom and they are a great solution for touchdown spaces, huddle rooms and executive offices alike.”
Founded in 2011, Zoom previously described itself as a leader in modern enterprise video communications. The CEO states that Zoom is enabling greater effectiveness in human-to-human interactions over a distance with use cases that are not possible with legacy systems. The key words here are “not possible with legacy systems.”
Zoom’s ongoing goal will be to disrupt all legacy systems with cloud-native communications – and this means every possible method of communication that is not currently done on the cloud and/or is currently on the cloud but is too cumbersome of a process due to walled gardens.
According to Gartner, by 2022, 65% of meeting solutions users will take advantage of SIP/VoIP-based audio-conferencing tools. This is up from 20% in 2017, while 40% of meetings will be facilitated by virtual concierges and advanced analytics. This means prior to Covid, audio-conferencing was predicted to grow substantially.
International Growth
After growing rapidly in the United States, Zoom is now eyeing international expansion as the key to sustaining its trajectory. According to the most recent earnings results, Zoom has been making strategic investments to improve its international presence, which paid off in the Q1 results. The company’s combined APAC and EMEA revenue grew 288% YoY to approximately 34% of revenue, up from 25% a year ago.
Here is what the CEO said on the call:
Number two is really about the international market expansion. There is a huge opportunity. From 25% to more than 30%, I think we do see a lot of opportunities from other, EMEA, APAC, Japan, a lot of opportunities, right.
The company has indicated that international channels are about a year behind the United States:
“And then in terms of international expansion, specifically around the channel, this is a really great question. We had a discussion about that in the last couple of weeks. So, the team has done a really good job in focusing on our U.S. channel strategy, especially around Zoom Phone and building out our master agent program and we are now working on building that out internationally. It’s probably guessing, but we are probably where we were in the U.S. a year ago or so. So, it’s probably about a year behind in terms of our international channel strategy.”
Zoom’s Consensus Raised 3 Times This Year:
At the start of this year, the consensus on Zoom was for 19% year-over-year revenue growth. We have only seen Q1 earnings, thus far, and the company is now expecting 50% YoY growth.
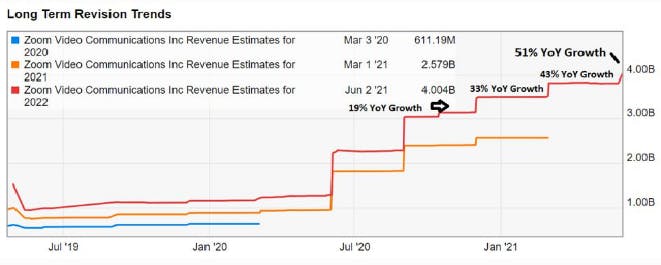
Chart: David Marlin
We’ve emphasized Zoom’s exceptional financials in previous analysis at IPO, in the first month of Covid and prior to this earnings report. In September of 2019, we also stated the company has a viral mechanic prior to the product going viral from shelter-in-place. That’s important to understand because the growth Zoom is reporting is inherent to the product, not due to the one-time event of Covid.
We discussed this in-depth in our analysis on Zoom Video here:
“Competitors such as Cisco Webex, Microsoft Skype and LogMeIn require bulky user accounts, downloaded applications and software, which restricts the one-to-many model. Technically, Google Hangouts also wants you to be logged into a Gmail account. This doesn’t work for enterprise teams on Microsoft Outlook. Corporate teams are also increasingly mobile, switch between devices, and need to join meetings very quickly.
Again, joining a video conference without downloading an application or software may seem minor but it’s actually a driving force in adoption and virality. This micro improvement has an effect on the speed at which Zoom’s conference URLs are shared from one-to-many users.”
There is a saying from John Maynard Keynes that “the markets can remain irrational longer than you can remain solvent.” In this case, I don’t think the market can remain irrational long enough to outlast Zoom’s strong product growth. If Zoom keeps putting up impressive numbers on the scoreboard then the market’s “efficiency” will eventually relent.
Three Risk Management Tools the I/O Fund Offers
The thrill of making money in the stock market is short-lived if an investor doesn’t have a plan to protect their gains. All too often, investors cheer their paper returns, only to find out later, the money they made evaporates on the next drawdown.
Considering the advancements we are seeing within the tech sector, discussions around how to maximize exposure in tech while better managing the downside are more necessary than ever. Our mission is to solve this dilemma, which we consider to be the billion-dollar question – how to safely participate in tech. We feel strongly that this question has not been answered and is widely ignored within the retail world.
While eliminating all volatility is impossible, especially in tech, our goal is to greatly mitigate the major drawdowns, like 2022, which can take years to recover. The below three methods are how we manage risk in an all-tech portfolio, which has led to past outperformance since our inception in May of 2020.
We are not financial advisors, rather we transparently disclose our buys/sells in various positions and provide the risk management tools that we use in our own portfolio. Please refer to our Terms and Conditions here.
Risk Management Tool #1: Real-time trade alerts
Trade Alerts are the investment end of our research. Before we send an alert, we first provide extensive reports regarding the tech industry, stocks of interest, and ongoing earnings reports. This research dictates what we want to buy and sell. We then discuss the technical setups in these stocks in the weekly webinars, so members can see the risk/reward, plus potential setups we are tracking.
This multi-dimensional approach is unparalleled among research sites yet is extremely effective. All buys, sells, and hedges, are disclosed in real-time via emails, and push notifications on our site. For example, we sent real-time trade alerts when we were buying Nvidia in October of 2022 at $10.85 for gains that greatly outperformed a buy-and-hold strategy. We also sent trade alerts when we were selling Bitcoin in the $58K range in 2021, then subsequently sent buy alerts when we bought back in the $16K to $18K range. We then sent out numerous sell alerts to close Bitcoin between $85K – $113K in Q2 and 3 of 2025.
To put it simply:
- When you see sell or trim alerts, it’s because we are deeming the risk too high to enter or add to the position.
- When you see buy or add alerts, we believe it is good timing to create a bigger position.
Tech is especially sensitive to the broad market, thus, often when we buy or sell, it has very little to do with the stock itself and more to do with broad market signals flashing a warning. Many of our readers simply use our trade alerts as additional information to understand if the market is risk-on or risk-off, in addition to being offered valuable (and rare) information on whether we are currently building a position or waiting for a better opportunity.
We are not financial advisors, so cannot tell any individual what or when to buy/sell. Instead, we funnel all our research, including broad market risk, into our investment actions, which are provided to members through trade alerts. If you see a long string of sells/trims, it is an indication that we believe market risk is elevated. If you see a long string of recent buys, we believe the risk is reduced, as stocks hit our predetermined buy zone, or we are adding to new positions based on fundamental shifts.
Portfolio Management and How to Read Our Trade Alerts
Regarding Our Cash Position – We are an all-tech portfolio so must manage risk in creatively. This report outlines our primary strategies. We tend to trim or sell our positions before periods of weakness manifest, without issuing buys alerts. The proceeds raised from these actions we keep in cash or cash-like instruments (ETFs that track T-bills and/or money markets) when we believe the market and economic environment support this. For example, we went from 10% cash in Q3 of 2024 to ~50% cash in February of 2025.
While we will, at times, mention in our weekly webinars where we are in terms of cash, we do not list our cash position as part of our posted portfolio. The reason for this is because we are not financial advisors and so cannot and do not want to take on the role of managing others’ money indirectly. This is not the purpose of this service.
How one holds cash is based on their personal risk profile, which is based on a host of factors unique to that individual. What may be appropriate for us may not be appropriate for someone in their early 20s or in retirement. Instead, we provide tech-focused research, broad risk analysis, and how we are suing this analysis through trade alerts. We further provide weekly webinars to discuss risk in the markets, as well as answer any questions our members may have. It is up to every individual investor on how to best use this information, or not.
How to read SMS alerts – All the trade notifications are derived from the technical setups presented in the weekly webinars, which are designed to arm investors with the analysis to create their own buy/sell plans.
When a trade alert says “Bought XYZ at $30.36 – 3% Added” we are saying that we bought XYZ at the price listed and the amount we added is based on 3% of our total portfolio’s value.
For example, if we have a portfolio $1000, and $200 (20% cash) is in cash while $800 is invested (80% invested), the above example will buy $30 of XYZ (3% of the total, including cash). All buy alerts and sell alerts include cash, so we are basing the percentages on the total value of our portfolio.
How to Read the Pie Chart – Considering that we do not provide cash holdings, what the pie chart is showing is the percentage allocation of our invested portfolio. The positions with the highest percentage allocation constitute our highest convictions at the time.
Our newest Members should look into our current allocations on the pie chart in order of highest percentage, and then search for the research and read the deep dives that correspond to those stocks for faster onboarding.
Risk Management Tool #2: Actively Managed Portfolio & Webinars
The I/O Fund does not believe in a buy and hold approach for tech investing. The difference between an actively managed portfolio and a buy-and-hold strategy is quite visible in our cumulative returns, which have a 152% spread between our active approach. The NASDAQ-100 during the same time period.
The reason that we approach investing from an active stance is due to the nature of investment losses being geometric.
For example:
- If a portfolio or position goes down 50%, it has to go up 100% to breakeven.
- If a portfolio or position goes down 80%, it has to go up 400% to breakeven.
Tech is highly susceptible to large drawdowns. Many cloud stocks saw 60% or greater drawdowns in 2022, and some have never come back. Furthermore, even highfliers like Nvidia have seen 7 drawdowns greater than 20%, two of which were greater than 35%, since the AI boom started in early 2022.
Active management means you have a plan for your stock positions. The I/O Fund favors technicals analysis for our active management as the tech industry responds well to sentiment.
Knox Ridley, Portfolio Manager, discuss the I/O Fund’s plans for actively managing the portfolio weekly on Thursdays at 1:30 PST (4:30 pm EST).
Here are a few things you can expect to hear in the weekly webinars:
1) Technical Analysis – For those new to this field, please reference our “Resources.” Here you’ll see an entire section dedicated to basic concepts in technical analysis, plus an overview of Elliott Wave analysis.
The study of technical analysis is the study of the herd (or large group) sentiment. It has been well documented that people retain their individuality and rational thought process in small groups. However, when the group grows, at some point, a new consciousness takes over, which has been deemed the herd mentality. Individual I.Q.s drop, as this new herd mentality becomes the driving force of individuals.
While the specifics always change, human emotions and herd mentality do not. Because of this, we tend to see repeatable and predictable price patterns show up time and time again. Understanding what potential pattern is in play can help you get ahead of the herd’s next move. We use the below techniques to identify good risk/reward entries and stops for our hedges.
Critical Support and Resistance – While markets move in patterns, being able to identify the pattern not only allows you to project with accuracy where the market is going, but it also allows you to establish moving support or resistance levels that confirms the pattern in play or negates it.
For example, the stock below appeared to be in a 5-wave uptrend off the April 2020 low. Knowing that 4th waves tend to correct to the 23.6% – 38.2% retrace of the 3rd wave, this stock should have held $266. When it did not, this was a warning that the final 5th wave is not likely to happen, and that a pivot is needed.
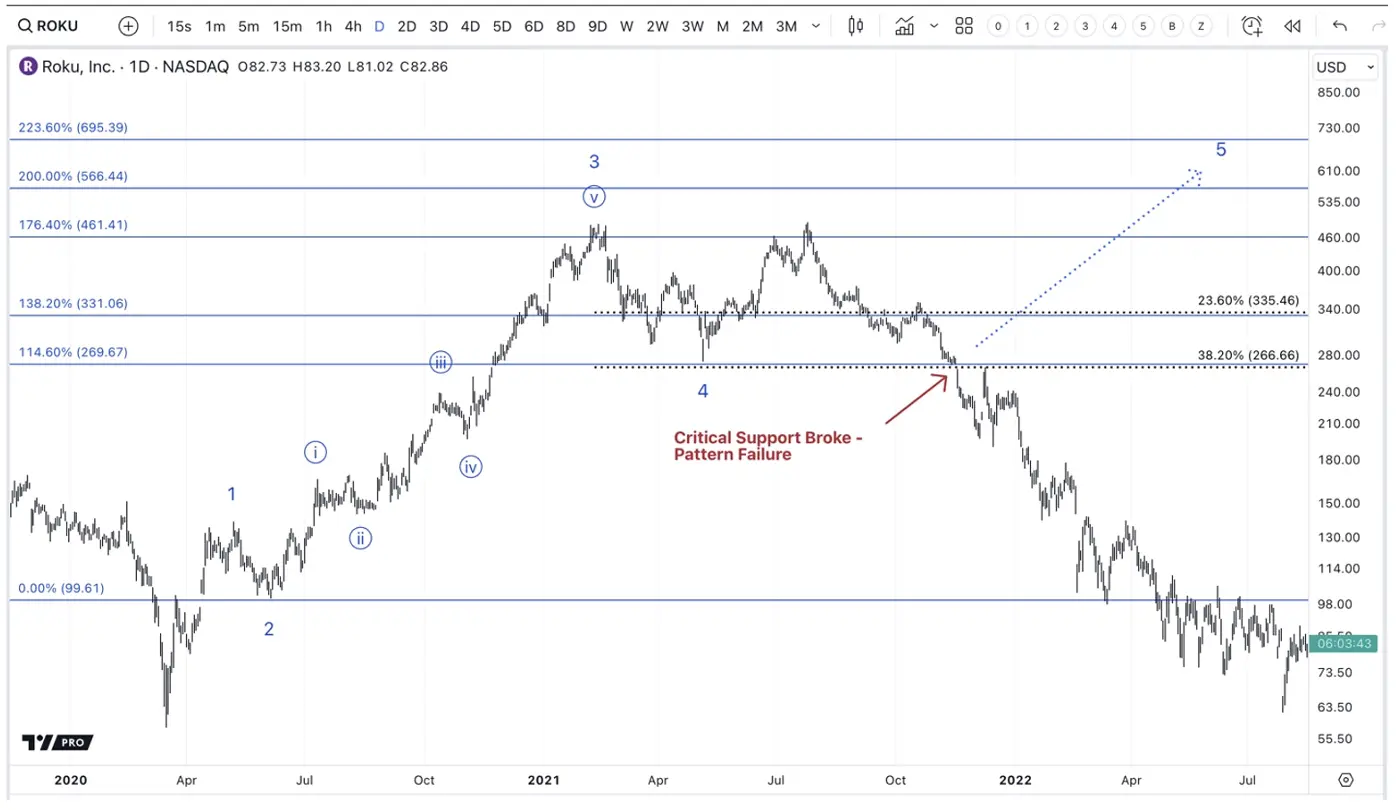
With the broad market, just like all markets and stocks, the pattern that the trend is taking allows for corrections that must hold certain levels. If those levels break, then you will see us begin to hedge our positions.
Do We Have a Downside Setup? All corrections, whether they are multi-year bear markets or quick moves in a day, are 3-wave patterns. There is the A wave down, the B wave up, which tends to make a lower high, followed by the most devastating part of the correction, which is the C wave down. The C wave is always a 5-wave pattern.
These patterns are fractal, so a small 5-wave pattern turns into a larger one, until you reach your target. So, if we know C-waves are 5-wave patterns, this is crucial information for missing the worst part of a correction.
For example, if we see a 3-wave drop followed by a 3-wave lower high, we have an A and B wave in place. Let’s say the next minor drop is a small 5-wave pattern followed by another small lower high. The most ideal place to hedge here is on the smaller high, placing a stop just above the start of minor drop. The image below shows this setup, and the gray box is where you would take protective hedges with minimal risk.
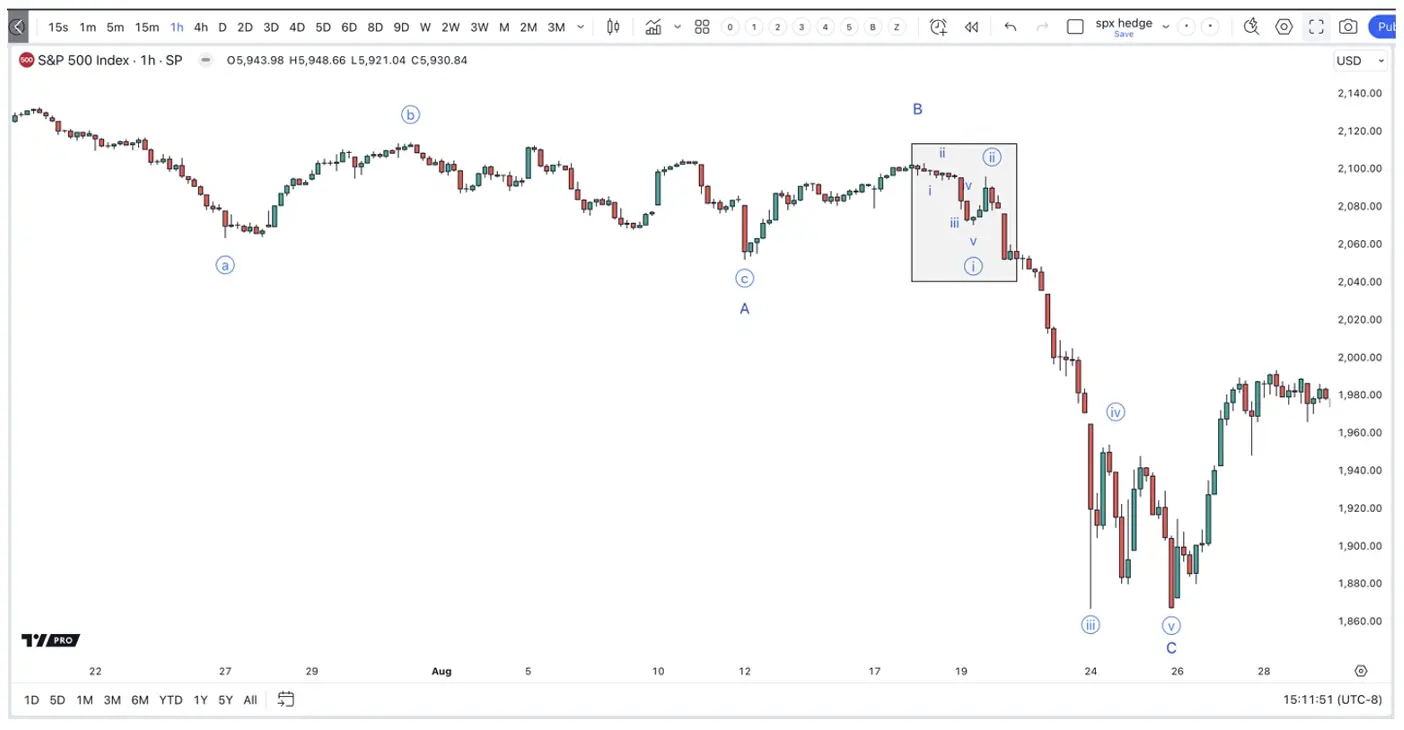
2) Stops – All investors have a buy plan, but many fail to have a sell plan. The idea of a stop is a price that tells you when you are wrong. For example, if I buy a stock at $10, and place a stop at $9 (closing price). Then, if at any point my position closes the day below $9, the next day, I sell at the market with no questions asked.
We believe it is better to stop out of a position early and miss a few percentage points on the rally when it resumes (if we were to miss the new momentum by a couple of days). This is a better alternative to being stuck in a stock wishing we could get out. We use this technique, at times, on opening positions because we want to manage our potential losses, just in case we are wrong.
We do not post our stop prices because we are a popular research site. These stops can be used by market manipulators to trigger us out of a position. We will let our readers know that a position has a stop when we open it, but we will not post the exact price, as this information can be used against our position.
We also follow fundamental stops. There is a specific criterion that all our positions have to adhere to. If we see a critical metric reverse and begin decelerating, or if we get evidence that a specific tech trend is getting saturated, we will exit the stock. This can be jarring to retail investors, specifically if a stock has been rewarding.
However, more times than not, we have seen tech investors fall in love with a stock and believe that their future will be bright. They’ll hold this belief despite the fundamentals (and technical) not agreeing with them. Ignoring these technical and fundamental stops can lead to substantial losses. We do not believe hope is sound investment strategy in tech and therefore adhere to our stops.
Risk Management Tool #3: Hedging
While using technical analysis to gauge market risk, we do believe a rules base, automated risk signal is key to side stepping periods of volatility in the market. This is arguably our most valuable resource when managing risk, as it introduces a rules-based, long-volatility element to a portfolio. We have outsource this automated risk signal to the company WealthUmbrella. Led by CEO and lead developer, Vincent Duchaine, WealthUmbrella is a team of machine learning and robotics engineers that have systematically developed a purely quantitative and automated risk signal to warn of deteriorating market conditions. They have over 6 years of live data, and an exceptional track record.
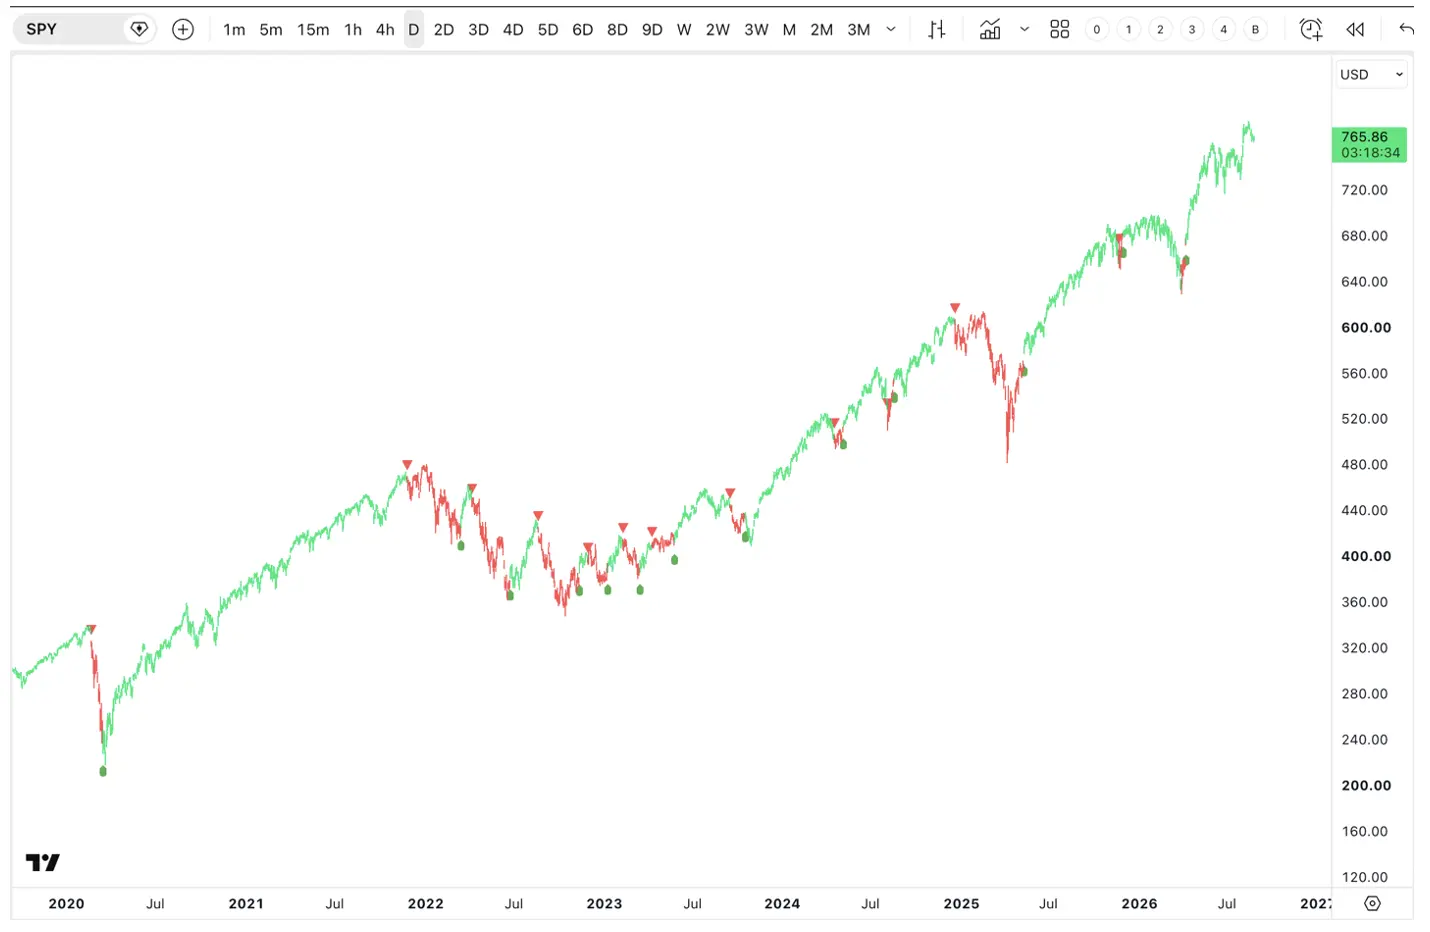
For those members interested in a quantitative approach to risk management, like us, please visit WealthUmbrella’s offerings.

You can gain access to real-time market updates, access to the above indicators and signals into TradingView, as well as a similar hedge signal for Bitcoin.
How to use the hedge signals? Hedging is advanced and can lead to losses. This practice may not be suitable for some investors, so we encourage all members interested to discuss with a licensed financial advisor to see if this strategy is appropriate for you.
The below information is designed to educate members on what we are trying to do when hedging our portfolio.
Hedging and Going Market Neutral
The quant-based signals along with our technical analysis are simply ways to measure periods of elevated risk in the markets. While all periods of volatility tend to be accompanied with a measurable deterioration in market health, not all periods of market weakness result in large drawdowns.
While in a bull market, most hedges will be closed for a minor loss, which can drag on returns. However, the point of the hedge is to protect us from periods of extreme volatility, which are hard to predict. We see it as insurance, and necessary for playing the highly cyclical and emotional tech sector.
With that being said, we believe it is important to separate the hedge signal from how we hedge. Our hedge is designed for our portfolio. Our goal is to be as close to market neutral as possible with a simple ETF or combination of ETFs.
How this is achieved is by measuring the beta of our portfolio and then finding an ETF or combo of ETFs that replicate our portfolio’s beta. The measurement of beta is a measurement of how a portfolio or stock performs in relation to a benchmark. Our benchmark is the NASDAQ-100, so if our portfolio beta of 1.5 means that for every 1% up move in the NASDAQ-100, our portfolio would go up 1.5%. This is also the case on downside moves – for every -1% move in the NASDAQ-100, or portfolio would be -1.5%.
Why this is important is that everyone’s portfolio beta is different. If someone has a more diversified portfolio, say, a mix of blue-chip stocks, some bonds and commodities, and then a sliver of their portfolio is dedicated to high beta tech, then that portfolio would have a significantly lower beta than the I/O Fund. So, if that portfolio copied our specific hedge, instead of going market neutral they would be going net short in a way that could harm long-term returns. For this reason, separating the risk signals that WealthUmbrella provides from how one decides to use those signals is very important to understand. The hedge signal tells us when market is elevated. How one chooses to act (or not) is entirely discretionary.
Do we rebalance our hedge to account for weekly fluctuations? The short answer is no. For example, if we say that we are hedging 100% of our portfolio, on that day, we calculate the total amount invested (not cash), and then short the ETF or combination of ETFs that will get us 100% hedged.
If the following week we add some of our cash to into beaten down stocks, our invested amount will be more than our hedge, making us not 100%. Also, let’s say or our stock portfolio goes down, say, 3% while our hedge goes up 5%, based on the relative performance of our hedge, we would also not be 100% hedged anymore. In virtue of us adding cash to our investments and the relative performance of the hedge to our invested portfolio, we will need to rebalance our hedge to account for these fluctuations if we want to remain 100% hedged.
We do not do this. Our goal is to keep it simple by having a counterweight on our all tech portfolio in periods of volatility. We are trying to reduce our portfolio’s drawdown. So, we simply calculate the % we are hedging on the day we issue the alert and leave that hedge alone until we decide to take it off.
How to read Hedge Trade Alerts:
When we say “Hedge QLD at $111.39 – 10% Hedged” we are saying that we have shorted the ETF QLD at the price listed. Most importantly, we only hedge the invested portion of our portfolio. So, the above example is shorting 10% of the invested amount of our portfolio.
For example, if we have a $1000 portfolio, and $200 is in cash, the above example would short $80 worth of QLD. This would be 10% of the $800 invested.
Conclusion:
Unlike many retail services, we are not hiding behind a stock report that we wrote about years ago. Like these services, we could easily say that we recommended NVDA based on our 2018 article; however, the real questions that need to be answered for real investors are – do you own it now? Have you always owned it? Did you ever take gains? If so, how much and when? Is it worth owning now? If so, at what price?
Not providing an answer to these questions is the difference between analysis and investing. Great analysts are not always great investors, and how one executes analysis over the long-haul is what real investors are seeking.
As real investors that have survived, and even thrived, through the tech-focused volatility from 2019 – 2024, we have done so through an arduous approach that includes risk management. It’s rare to see this many risk management tools offered at the retail level, but these are the actual investing tools that successful investors use.
Wall Street is not so generous as to share their every trade, and the Street certainly does not discuss their plans in advance. Retail sites rarely have enough consistent performance to be confident enough in disclosing their daily actions, as too many sites claim that solid research is enough evidence of being a great investor (it is not). This combination leaves investors in the dark on how to truly approach stock investing.
The I/O Fund has built a loyal base of Members as we were one of the first to provide high quality risk management tools alongside in-depth and original research. We feel this combination is hard to replicate. Our team is dedicated to continuing to serve our customers with the highest level of integrity as we seek to answer the billion-dollar question: how to safely participate in the world’s most rewarding industry — tech.
Micron Is Up 900%. Here’s Why the AI Memory Trade May Still Have Room to Run
- In less than a year’s time, memory stocks have gone from just another way to play the AI trade to arguably its biggest beneficiaries from a return perspective.
- Micron, Samsung and SK Hynix now rank among the world’s top 20 most valuable stocks, each with market capitalizations well above $1 trillion.
- Widespread shortages across HBM, conventional DRAM, LPDDR5 and NAND SSDs are affecting the industry, putting immense pricing power in the hands of memory companies.
- The top AI processor companies have greatly increased memory content across their systems to meet the changing needs of frontier model developers.
- While memory makers are pointing to a prolonged shortage, there are multiple key risks to stay aware of as it relates to the memory trade.
Over the past 10 months, memory chip stocks have gone from being solid beneficiaries of the AI boom to capturing a massively outsized piece of the return pie.
The inflection in Micron’s performance demonstrates this. From the beginning of 2025 to the end of August 2025, Micron added around $36 billion to its market capitalization, rising to $133 billion for a strong 37% gain. Since then, returns have exploded, with Micron (MU) soaring more than 900% from August 2025, and up over 1600% since the April 2025 low.
Perhaps the most striking figure is that over these 10 months, Micron added more than $1 trillion to its market capitalization, which now sits near $1.35 trillion. Along with this, industry watchers expect the memory market to far exceed $1 trillion in revenue by 2027.
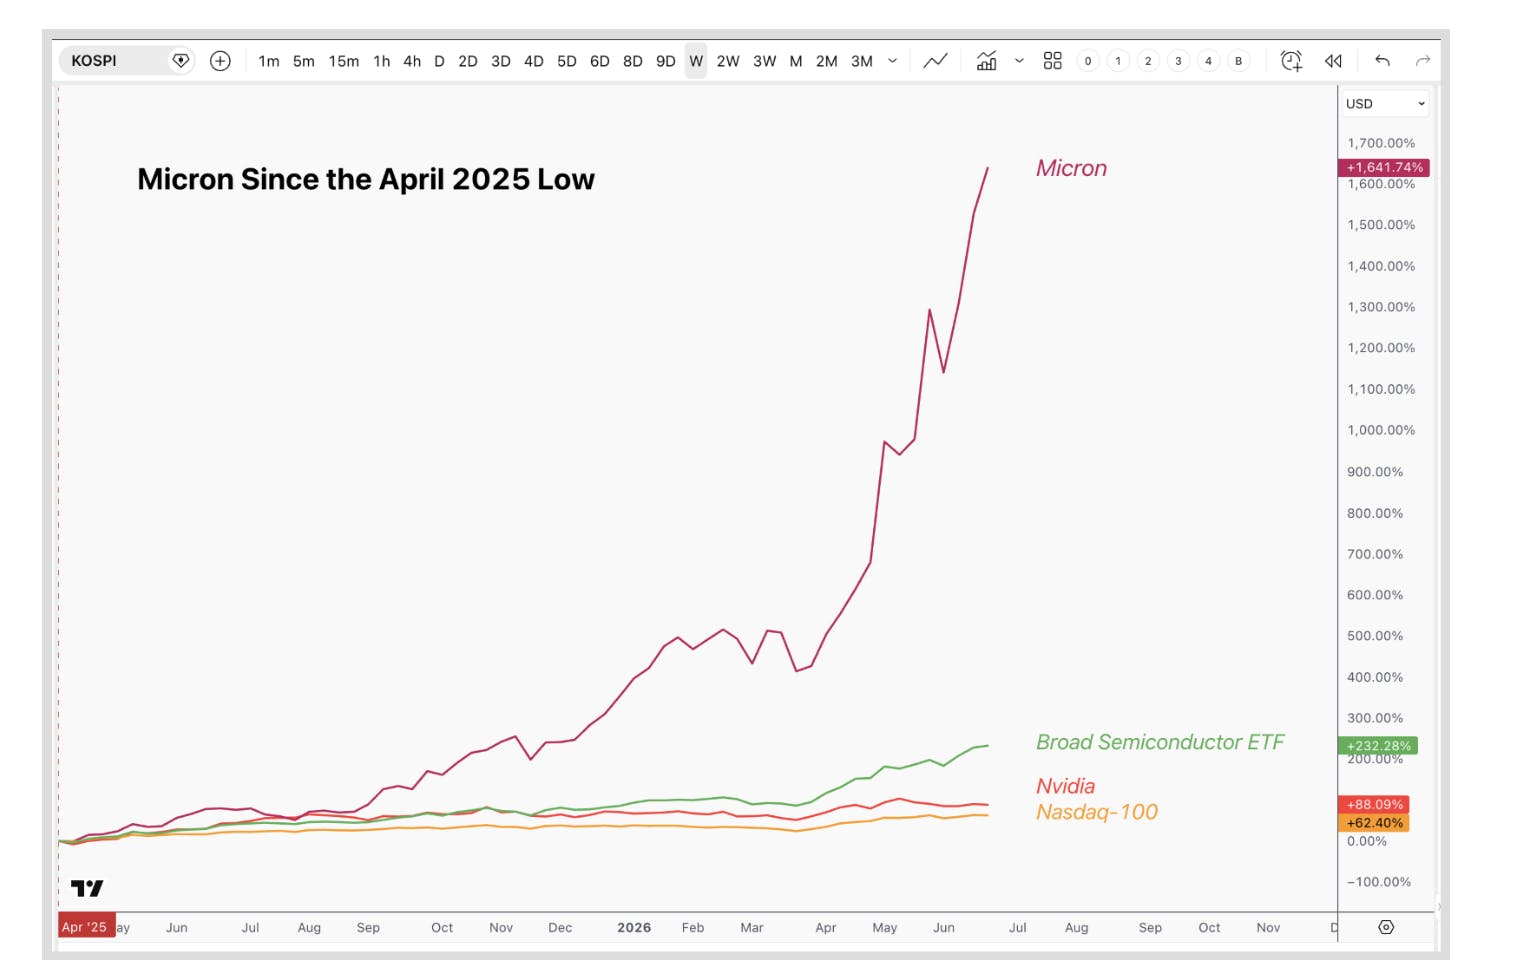
This chart is a comparison of Micron’s stock performance since the April 2025 low, showing a gain of over 1,600%, far outpacing Nvidia, the semiconductor ETF, and the Nasdaq-100, highlighting the strength of the AI memory-driven rally.
The sheer velocity of the move reflects how quickly investors have repriced memory’s role in AI infrastructure. What was once viewed as a cyclical, commoditized segment of semiconductors is now becoming one of AI’s most drastic bottlenecks, as shortages spread across HBM, conventional DRAM, LPDDR5X and NAND SSDs.
The I/O Fund has been covering this dynamic for nearly three years. We first explored it in our deep dives on AMD’s AI acceleration strategy and Lam Research’s leadership in HBM and DRAM equipment in the summer of 2023. In December 2023, we expanded on this theme in our analysis of the 2024 memory and PC rebound, highlighting the shift from cyclical demand to AI-driven secular growth “that is strong enough to transform commoditized hardware into a secular trend,” with HBM and high-performance DRAM “in the early stages of a multiyear growth cycle.”
This thesis led us to make memory stocks some of our highest allocations of 10%+ in 2026, even as many market participants feared memory had topped for good.
The question now is whether the memory trade has already run too far, or whether shortages and the upside in memory pricing support more upside. Below, you’ll see pricing power is still intact, with meaningful new supply not arriving until 2028, or later, with the only overhang being how pricing power flows to memory suppliers under long-term agreements.
The discussion is data-driven, but also nuanced, because there may be no bigger debate in the market today than whether memory can continue its historic run.
What Triggered the AI Memory Supply Crunch?
First off, it is worth taking a step back to understand what brought about the shortages seen today. Traditionally, memory demand has been very cyclical, with much of the market driven by consumer spending on mobile phones and PCs. H2 2022 saw the memory market enter its worst cyclical downturn since the Great Financial Crisis. Sales and earnings plummeted from pandemic highs, with Samsung’s operating profit falling by 95% YoY in Q1 2023.
This led to significant production cuts, with Micron and SK Hynix announcing reductions of 15%–25% and cutting capex by 40%–50%. Samsung also implemented meaningful cuts to conventional DRAM and NAND output in 2023. At the same time, both Samsung and SK Hynix began aggressively expanding HBM capacity for 2024, albeit from a relatively small base—with estimates placing HBM at just 8% of total DRAM sales in 2023.
mid
Amid this, the AI market had its watershed moment: the release of ChatGPT in November 2022. Nvidia’s data center revenue would go on to soar 217% in its fiscal year 2024 (roughly calendar year 2023), its fastest growth rate during the AI era.
This helped memory demand improve, but companies supported this demand by drawing down inventory from extremely high levels. Notably, at the beginning of 2023, Micron’s days of inventory outstanding, excluding write-downs, were 235. Without adjusting for impairments, it would have taken the company nearly eight months to sell its inventory. By the beginning of 2024, that figure had fallen drastically to 160.
The decisions to cut capacity, reduce capex, and allow inventory levels to drop were logical, considering that these firms were fresh off their worst decline in a decade and a half. However, as data center demand continued to explode and HBM capacity remained relatively low, those decisions set the stage for the drastic supply shortages we are seeing today.
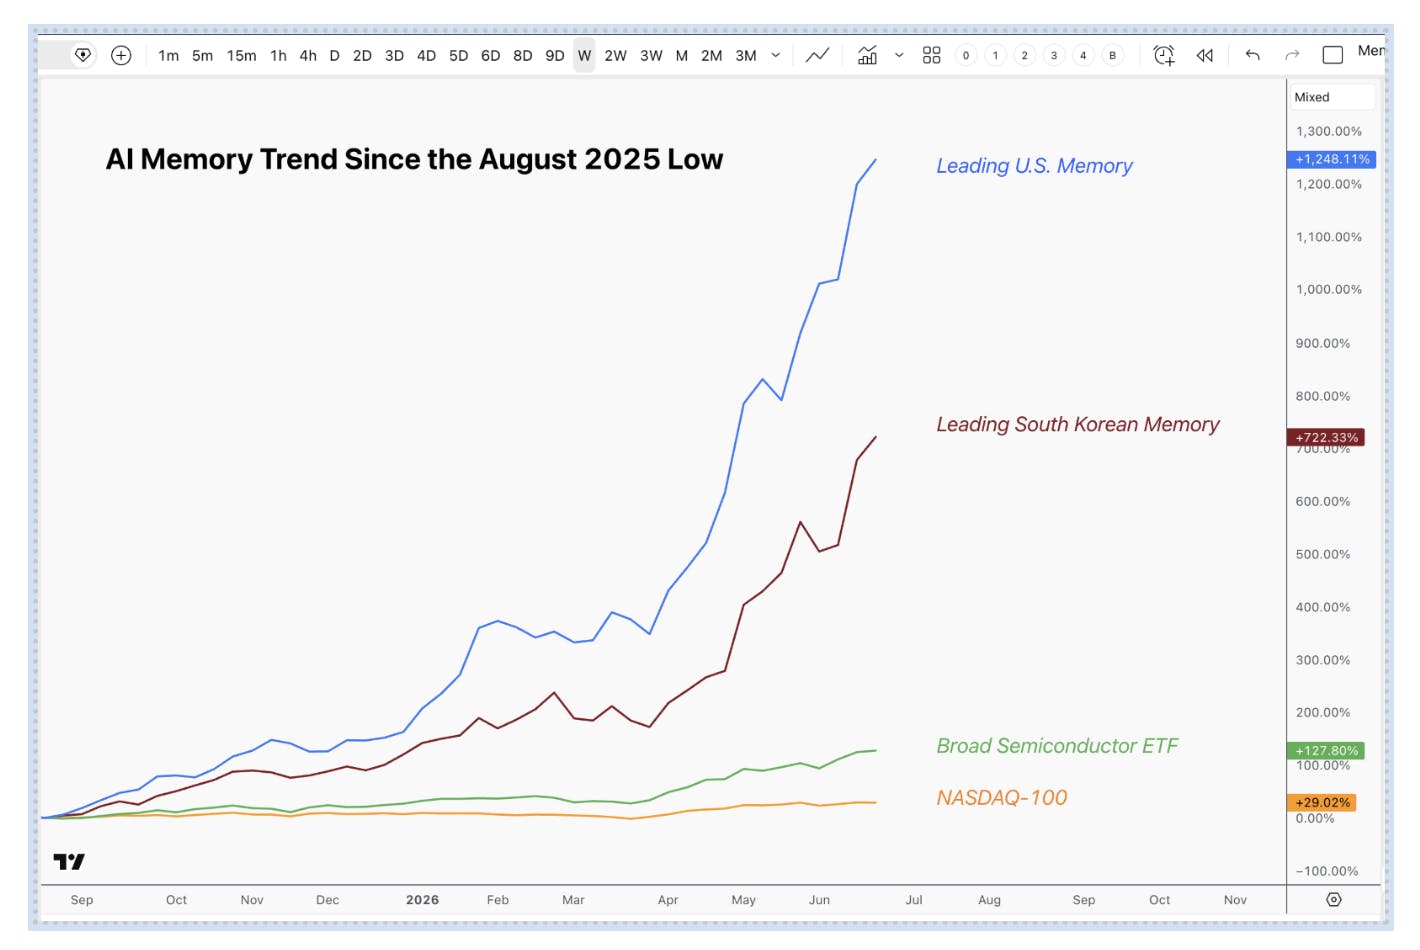
This chart is a comparison of AI memory stock performance since the August 2025 low, showing U.S. memory up over 1,200% and South Korean memory over 700%, significantly outperforming the semiconductor ETF and Nasdaq-100.
HBM Shortage: AI Infrastructure’s Core Memory Bottleneck
Memory shortages are surfacing across essentially all product types. However, perhaps the most easily identifiable shortage is in high-bandwidth memory (HBM). This comes as HBM is the type of memory packaged directly alongside AI accelerators, from NVIDIA and AMD GPUs to Google TPUs. HBM, a DRAM form factor, uses advanced packaging to stack up to 12 (and soon 16) DRAM chips, offering higher bandwidth, capacity, performance, and power efficiency compared to conventional DRAM.
Micron, Samsung, and SK Hynix are the three companies that control the HBM market. Due to massive hyperscaler demand, all three are sold out of their HBM capacity for 2026.
Rapid Market Growth Outpaces Supply Increases
Looking back a few years, we can see how fast the HBM market has grown. Bloomberg Intelligence placed the size of the HBM market at $4 billion in 2023. Meanwhile, at the beginning of 2026, SK Hynix cited data from Bank of America placing the HBM market at $34.6 billion in 2025. Taking the $3.9 billion 2023 estimate, the HBM market grew by an astounding 198% CAGR from 2023-2025. Notably, BofA forecasts additional growth of 58% YOY to $54.6 billion in 2026.
Considering this growth rate, making capacity investments at the scale required for supply and demand to balance was antithetical to the position of memory suppliers in 2023. Even if they wanted to, actually achieving this would not have been feasible, given that increasing production capacity is a lengthy and expensive process. Notably, these three companies combined for free cash flow of -$18.5 billion in 2023. Looking at conventional DRAM, a knock-on effect from HBM imbalances is exacerbating shortages there.
HBM Reallocation Is Tightening DRAM Supply
In conventional DRAM, which centers around double-data rate 5 DRAM (DDR5), the situation is somewhat similar but has different mechanics. DDR5, and increasingly low-power DDR5 (LPDDR5), are high-performance memory chips paired with AI CPUs. Nvidia uses 480 GB of LPDDR5X per Grace CPU, and will more than triple that figure to 1.5 TB in its Vera CPU.
Meanwhile, AMD uses standard DDR5 in its current generation EPYC Turin CPUs. The company plans to first support LPDDR5X in its next generation EPYC server CPU "Verano," which is expected to become available in 2027.
DRAM Pricing Surges
Related to this, SK Hynix noted all the way back in October 2025 that its conventional DRAM, NAND, and HBM capacity was all sold out for 2026. Micron and Samsung have not said their conventional DRAM capacity is sold out, but we can see based on price increases that the shortage is very significant. As commodity products, conventional DRAM sales take place at monthly/quarterly contract prices or spot prices, while memory suppliers are allocating HBM capacity through long-term contracts.
In Q3 2025, DRAM contract prices soared by 171.8% YoY. Meanwhile, in Q1 2026, TrendForce estimates that conventional DRAM contract prices increased by 93%-98% QoQ and projects another 58%-63% QoQ increase during Q2 2026.
One of the key factors contributing to conventional DRAM tightness is memory makers relocating capacity away from these products and toward higher-margin HBM. Importantly, this move from conventional DRAM to HBM does not translate into a 1:1 shift in bit supply.
Why HBM Production Reduces DRAM Supply
Current generation HBM3E requires approximately 3X the wafer capacity per GB compared to DDR5. This makes the strain on conventional DRAM exponentially worse, as reallocating wafer capacity toward HBM disproportionately reduces the wafer supply available for conventional DRAM production.
Furthermore, Micron noted in May 2026 that this ratio will continue to grow as suppliers transition from HBM3E to future generations in HBM4 and HBM4E. Notably, Nvidia’s upcoming Rubin generation and AMD’s upcoming Instinct MI450 accelerators will use HBM4, while Google’s TPU v8 will use HBM3E.
SSD Shortages Add to the AI Memory Crunch
NAND flash SSDs, which store large amounts of data beyond what DRAM can store at a given time, are also facing a supply crunch. Kioxia has a joint venture with SanDisk in operating SSD fabs. Near the beginning of 2026, Shunsuke Nakato, Managing Director of Kioxia's Memory Business Unit, said that the company’s capacity was sold out for the year. Notably, 60% of the capacity from the joint venture goes to Kioxia. Furthermore, while interviewing SanDisk’s CEO, Bernstein analyst Mark Newman estimated that the company’s ASP per GB increased by 140% QoQ in Q1.
Perhaps even more striking are statements made by Everpure (formerly known as Pure Storage) CEO Charles Giancarlo in an open letter to customers. Everpure, which makes NAND-based storage systems, says its “input costs of many high-volume semiconductor components have surged between 300 percent and 900 percent (4x to 10x) since mid-2025.” Additionally, HDD makers Seagate and Western Digital have said their capacity is sold out for 2026.
How Long Will the Memory Shortage Last?
Looking ahead, memory suppliers are all saying that shortages will continue but are providing differing statements about how long.
SK Hynix Signals Prolonged AI Memory Shortage Into the Next Decade
SK Hynix has outlined a particularly long path to normalization. At Computex in June, Chairman Chey Tae-won reiterated his stance that shortages would persist into 2030. This comes even as the firm plans to nearly double its monthly DRAM wafer capacity from 550,000 today to 1 million by 2030. By 2034, the company expects to triple DRAM capacity, a timeline that is 10 years ahead of its previous plan.
Pursuant to its investment plans, SK Hynix is said to be in the final stages of listing its American Depository Receipts (ADRs) on the NASDAQ. The current expectation is that the offering will represent around 2.5% of the firm’s outstanding shares. This would imply a gross proceeds value near $26 billion based on recent prices and exchange rates. That would be very significant, potentially increasing its cash by 72% from $36.1 billion last quarter to around $62 billion.
Micron, Samsung, and SanDisk Expect Tight Supply Through 2027+
Micron is also adding fabs, with initial wafers expected at its Idaho 1 facility in mid-2027, and with several others to follow. Related to this, Micron's VP of Marketing, Christopher Moore, said in a January interview, “you're not really gonna see real output, meaningful output by the time we get all the qualification done and customers are accepting it and you get the tools, everything up and running until 2028.”
In a May interview with Bloomberg, Micron CEO Sanjay Mehrotra echoed this, saying, “we see that meaningful new supply in the industry doesn't really start ramping until 2028 timeframe.” In its latest earnings report, Micron added “Even as we expect industry supply to improve gradually in 2028, we currently do not have line of sight as to when memory supply will be able to catch up with increasing demand."
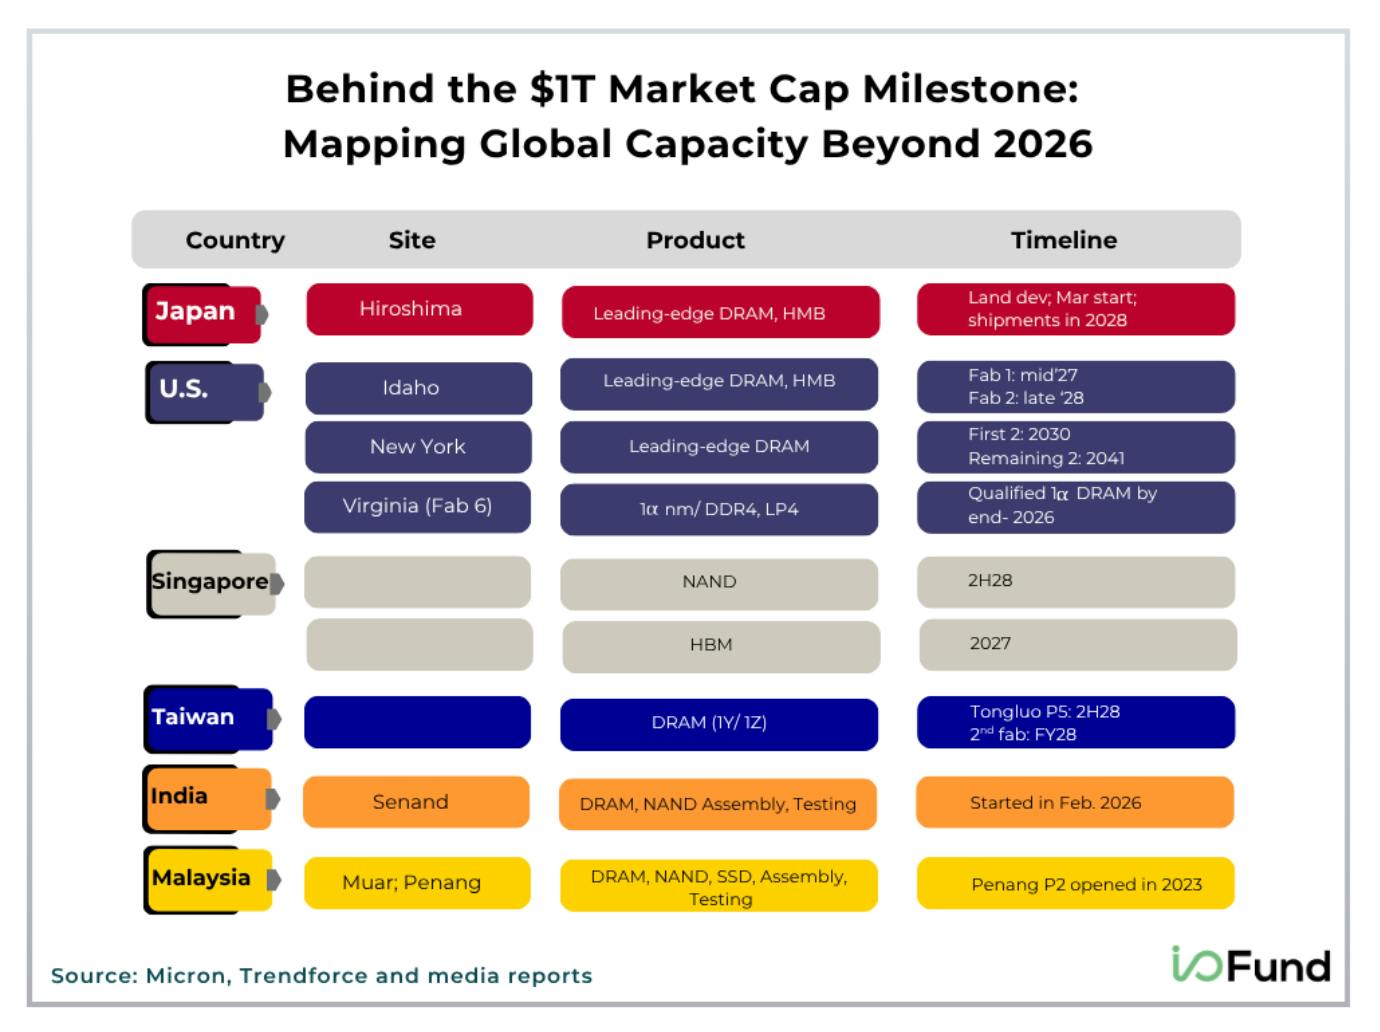
Image showing Micron’s planned fab expansions. The first leading edge DRAM and HBM site in Idaho is not expected to come online until mid-2027, with the second not coming online until late 2028. The first two leading-edge DRAM sites in New York do not come online until 2030, while shipments from the leading-edge DRAM and HBM site in Japan are not expected until 2028. Source: TrendForce TrendForce
Meanwhile, in its latest earnings call, Jaejune Kim, EVP of Samsung’s Memory Business, said, “And unlike previous years, customers who are concerned about supply shortages are actually bringing forward their demand for 2027 already. So currently, just based on prebooked demand alone, the supply-demand gap is looking to widen further in 2027 versus this year.”
Specific to NAND, SanDisk’s CEO said at the JPMorgan Technology Conference, “We see this market undersupplied for a long period of time.” More specifically, he noted that in 2025, the company had a “clear point of view” that the market would become undersupplied through 2026. He added, “And I think we can say through the end of '27, we have that same level of conviction now.”
Across these statements, we can see that executives from top memory companies are all indicating that shortages will continue until at least some part of 2028. Importantly, Samsung indicated that shortages would intensify in 2027, while Micron doesn’t expect meaningful output increases until 2028. Given this, it may not be so far-fetched to think supply and demand will not balance until near the end of the decade.
HBM and DRAM Demand Surge as AI Models and Infrastructure Scale
While the memory shortage is clearly in place today, it is important to understand the underlying factors within AI models and infrastructure driving this shortage and contributing to its continuation.
Model Complexity and KV Cache Requirements on HBM
Model complexity and the KV cache are two primary drivers of increased HBM demand, especially as it pertains to inference deployments. Increasingly complex models are being trained and deployed for multi-step inference or agentic tasks, requiring larger context windows.
Context windows represent the amount of information that the model can remember at a given time to execute tasks, with window length increasing dramatically over time, such as for OpenAI’s models. For example, according to Artificial Analysis, OpenAI’s GPT-3.5 Turbo, released in 2023, had a context window of just 4k tokens. This increased to 128k tokens in GPT-4.5 Preview in early 2025, while OpenAI’s latest model, GPT-5.5 (xhigh), has a context window of 922k tokens, a 230X increase in the span of three years.
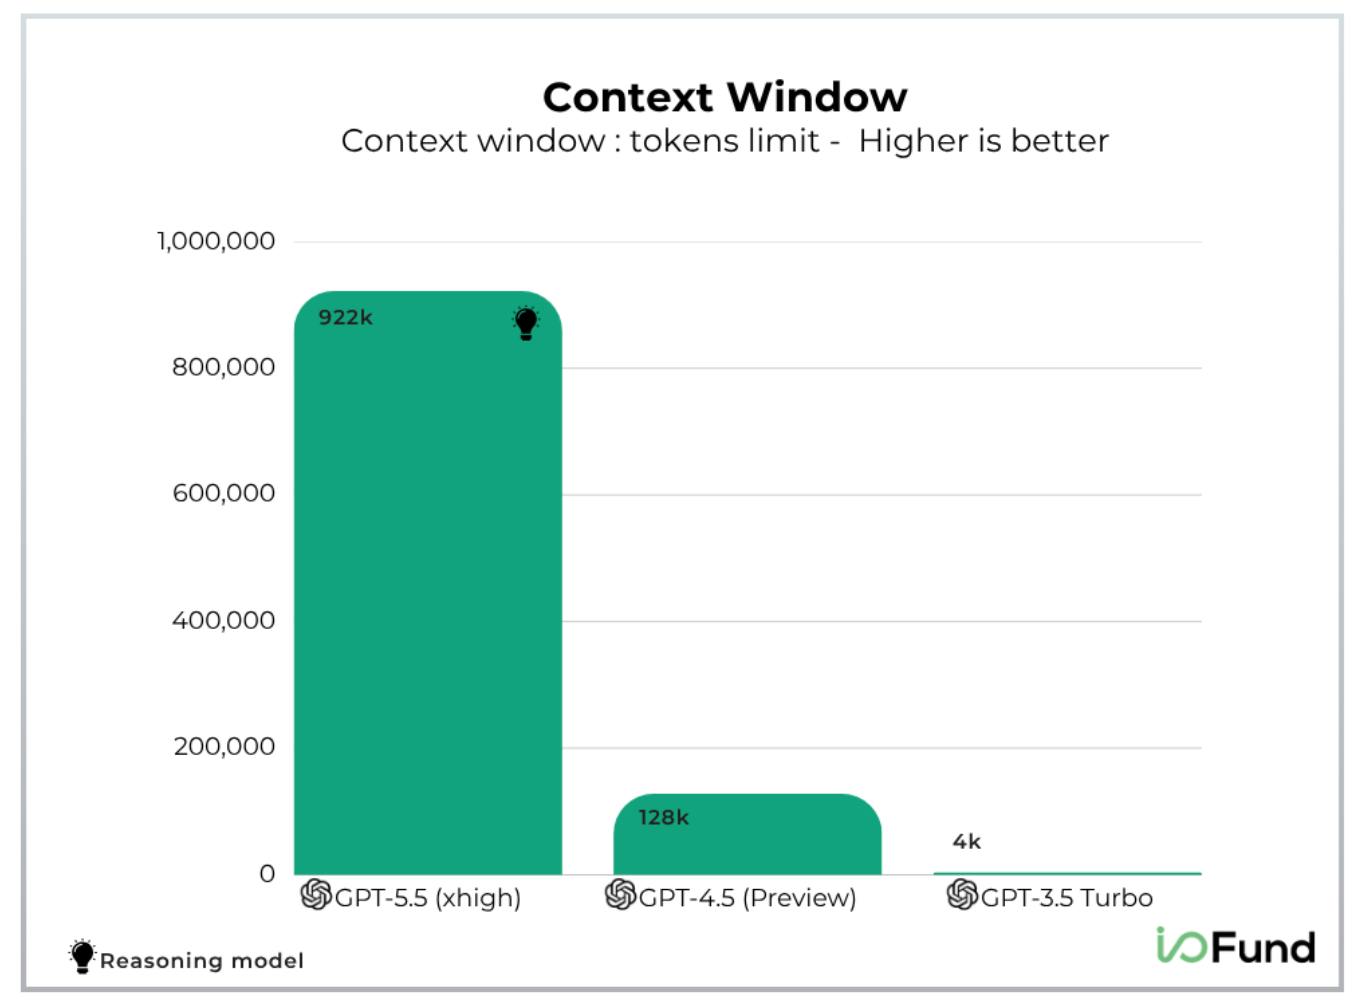
Chart showing the context windows of three OpenAI models. GPT-3.5 Turbo’s context window is 4k tokens, increased to 128k tokens in GPT-4.5 Preview, while OpenAI’s latest model, GPT-5.5 (xhigh), has a context window of 922k tokens. Source: Artificial Analysis
The reason this sharp increase in context windows is important for the memory thesis is because context windows define the potential size of a model's KV cache, or the actual working memory that a model continually references during inference. HBM is particularly important here as the goal is to keep as much of the KV cache on HBM — the fastest memory available — as possible.
However, if HBM capacity is not large enough to hold the entire KV cache, that remaining portion can be offloaded to slower conventional DRAM or SSDs, introducing latency during inference or leaving expensive GPUs (or other accelerators) underutilized.
We can roughly put in perspective potential memory requirements for frontier models, using OpenAI’s GPT-4 with an estimated 1.8T parameters and a 128K context window as a benchmark. At FP8 precision, storing the model weights would require 1.8TB of HBM capacity (at 1 byte per parameter), while a 25% activation buffer would add 450GB.
On a single Nvidia GB200 NVL72, this would leave roughly 11.1TB of HBM capacity free for the KV cache. Assuming 120 layers and a hidden size of 16,384, KV cache requirements per token would be ~3.9MB at FP8, meaning one NVL72 could in theory support maximum tokens of ~2.85 million, or around 22 concurrent requests at the max 128K context window.
This problem becomes further multiplied as inference demand grows, resulting in more requests from many concurrent users. Consider that OpenAI has dozens of production models available and over 900 million weekly active users, implying that at peak usage it could be handling tens of millions of concurrent requests, each consuming KV cache memory.
HBM Content Soars Over GPU Generations
Notably, Nvidia’s 8-GPU DGX H100 server contained 640 GB of HBM, or 80 GB per chip. The B200 moved to 1.44 TB of HBM in an 8-GPU configuration, resulting in 180 GB per chip, or 125% higher than the H100. The B300 contained 288 GB of HBM per chip, 60% more than the B200, and 3.6X more than the H100.
Overall, the latest system available, the 72-GPU GB300, supports up to 21.7 TB of HBM. This results in rack scale deployments that contain nearly 34X more HBM content than the DGX H100 server. This shift came over approximately three years, with the H100 entering full production in September 2022, while the GB300 entered full production in August 2025. This rapid increase in HBM content over a short period is another significant contributor to HBM shortages. However, it is important to note that Rubin will remain at 288 GB per chip, but use HBM4 rather than the HBM3E in Blackwell to provide higher bandwidth.
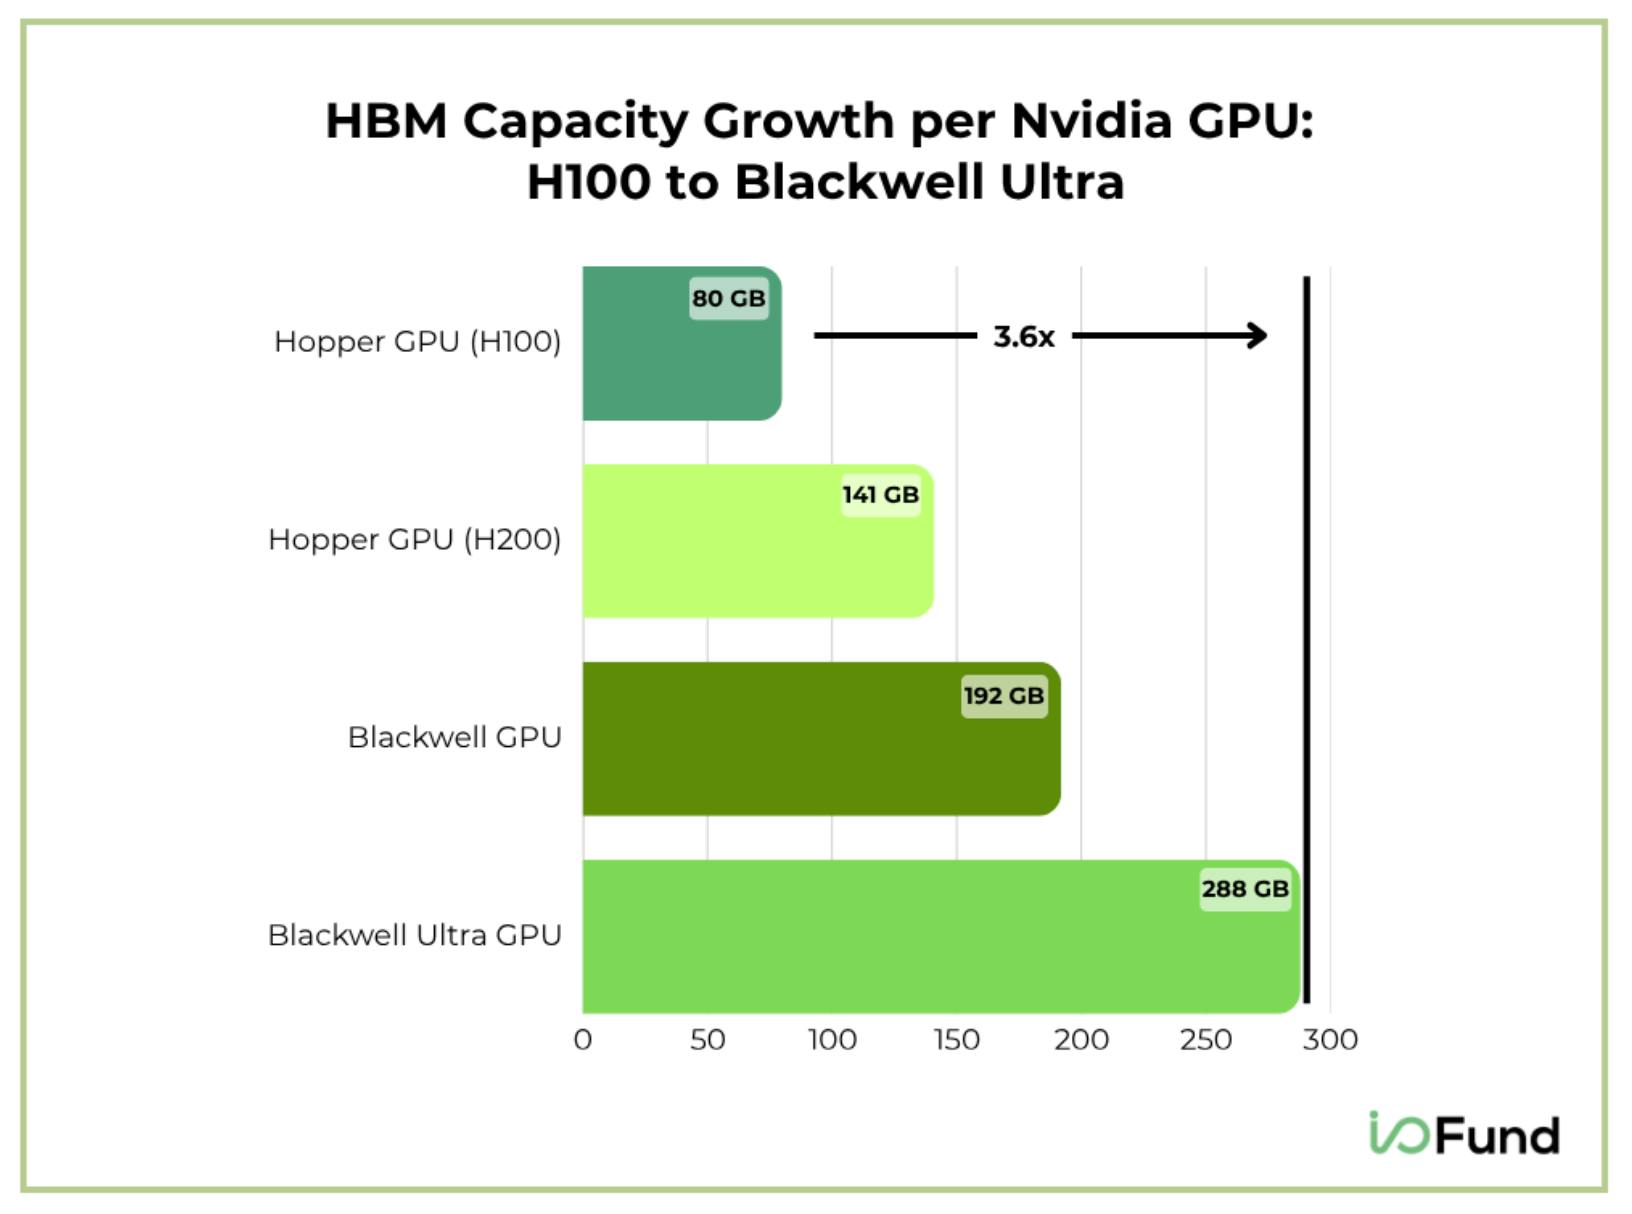
Chart showing the increase in HBM content per Nvidia GPU from H100 to Blackwell Ultra. HBM content starts at 80 GB in H100 and moves progressively higher to 141 GB in the H200 and 192 GB in Blackwell to 288 GB in Blackwell Ultra, equating to 3.6X increase across these GPU generations. Source: Nvidia Nvidia
This shift is similarly evident at AMD. The company’s Instinct MI250 GPUs, launched in November 2021, supported 128 GB of HBM per chip. Meanwhile, the company’s MI450 series will deliver nearly 3.4X HBM capacity than MI250 at 432 GB per chip. The “Helios” MI450 72-GPU rack scale system delivers 31 TB of total HBM4 content—or 1.5X higher than the GB300 NLV72. Shipments are expected in the second half of 2026.
Conventional DRAM Pressure Points: Vera Content Triples as CPU Demand Increases
As noted, Nvidia’s Vera CPUs will support more than triple the LPDDR5X per chip of the Grace CPU, which is likely to put additional pressure on conventional DRAM demand. However, this comes down to more than just per-chip DRAM content.
Nvidia has announced that it will launch a standalone Vera rack containing 256 CPUs—or 7X more than the 36 CPUs in the Vera Rubin NVL72. This is due to the increasing importance of agentic AI, which is expected to increase CPU demand significantly. With this, LPDDR5 demand could be further pressured from two sides: higher content per CPU and higher overall CPU sales.
Notably, TrendForce cites the rising importance of CPUs as a rationale for increasing its 2026 DRAM market forecast to $618.7 billion, representing 303% YoY growth. The firm projects DRAM growth of another 46% YoY in 2027, and for the overall DRAM and NAND market to hit $1.28 trillion. This would equate to a 5.7X increase in just two years versus the $225 billion market in 2025.
To learn more about the emerging CPU bottleneck, read I/O Fund’s June 2026 article: AMD, Nvidia, Arm, Intel: Inside the $120 Billion CPU Gold RushAMD, Nvidia, Arm, Intel: Inside the $120 Billion CPU Gold RushAMD, Nvidia, Arm, Intel: Inside the $120 Billion CPU Gold Rush
Risks to the Memory Thesis: TurboQuant and Long-Term Agreements
There are two major risks investors should watch as the memory trade matures, which is whether shortage-driven pricing surges will continue to flow disproportionately to memory suppliers, and whether software-based efficiency gains could reduce the intensity of memory usage.
In recent earnings calls, memory suppliers have discussed hyperscalers and AI infrastructure customers seeking longer-duration contracts of up to five years. There are some positives to these agreements, which is they smooth out the cyclicality that many investors fear given these agreements guarantee any inventory will be quickly absorbed, resulting in more stability.
On the flip side, memory stocks are surging precisely because pricing is uncapped right now, therefore this introduces a new era for many memory stocks to where they transition to becoming secularly certain, yet the epic volatility in both directions is more muted.
Notably, there are various deal structures for these agreements, yet in most instances, they lock-in demand for many years in exchange for some kind of cap in memory component pricing.
The second risk is model and system efficiency through improvements such as Google’s TurboQuant. TurboQuant is a compression method that directly addresses the KV cache bottleneck. Google says that TurboQuant can reduce KV cache memory size by 6X while simultaneously preserving model accuracy and accelerating speed by up to 8X.
However, the increased usage of HBM in Google’s own systems is a telling point that pushes back on TurboQuant fears. The company’s latest TPUs, the 8t and 8i, support 216 GB and 288 GB of HBM per chip, respectively. These figures are 13% higher and 50% higher than the 192 GB of HBM capacity offered by Ironwood v7. Thus, Google, which developed TurboQuant, is itself substantially increasing HBM capacity in spite of the efficiency gains.
Conclusion:
Micron has been one of our largest positions in 2026, and for good reason. Over the past 10 months, the company added more than $1 trillion to its market capitalization, which now sits near $1.35 trillion. That move reflects not only Micron’s execution, but also the market’s growing recognition that memory demand is entering a much larger cycle.
Investing in memory has been anything but easy. Many market participants feared the cycle was topping at the start of 2026, but the I/O Fund’s disciplined process kept us in the position at a high allocation, frequently above 10%, for year-to-date returns of 277%.
This analysis is a small sample of what we do behind our paywall. We are not simply stating memory is an important bottleneck, but rather we show, with data, how the shortage is pressuring every layer of the memory stack, including HBM for accelerators, LPDDR5X and DDR5 for CPUs, and NAND SSDs for storage and agentic inference.
As Q2 wraps up, the I/O Fund is preparing to identify the next wave of AI winners in our upcoming Top 15 AI Stocks for Q3 2026 report. Previous reports identified Micron as a major beneficiary, along with names such as Bloom Energy, up over 1800% since our April 2025 entry, and lesser-known AI networking stocks up over 600% since our November 2025 entry.
We publish more than 100 paywalled articles each year on AI stocks, hold weekly 1-hour webinars, and offer an actively managed portfolio with real-time trade alerts.
Don’t miss the next wave of the AI trade
Join I/O Fund
Please note: The I/O Fund conducts research and draws conclusions for the company’s portfolio. We then share that information with our readers and offer real-time trade notifications. This is not a guarantee of a stock’s performance and it is not financial advice. Please consult your personal financial advisor before buying any stock in the companies mentioned in this analysis. Beth Kindig and the I/O Fund own shares in MU at the time of writing and may own stocks pictured in the charts.
Leo Miller, AI and Semiconductor Investment Writer at I/O Fund, contributed to this analysis.
👉🏻 Share with a Fellow Investor
Heare with a Fellow Investor
Help someone else benefit from this insight.
Recommended Reading: