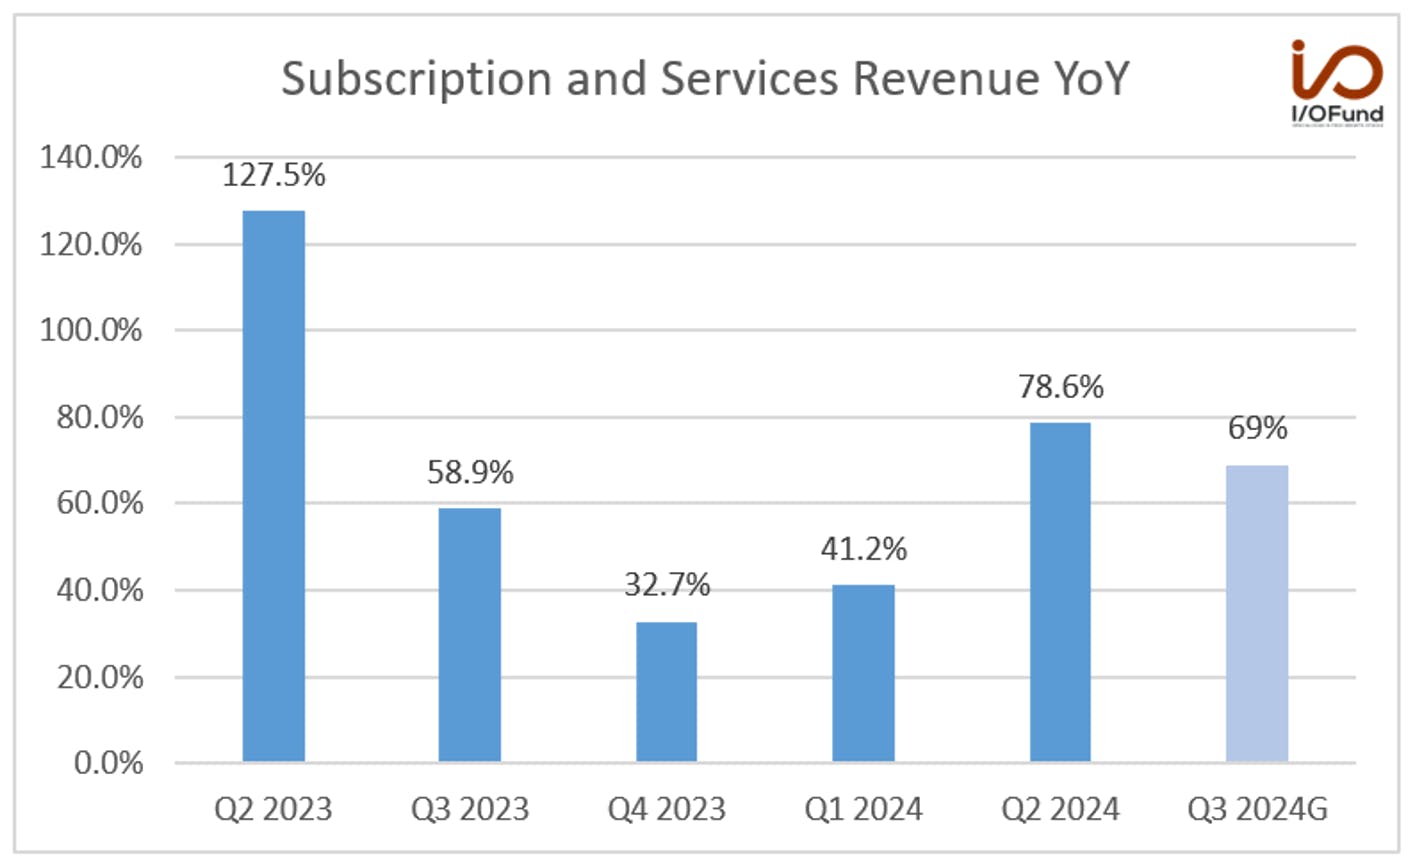
Coinbase will release its Q3 2024 results on 30th October. Analysts expect Q3 revenue to grow 86.1% YoY to $1.25 billion and GAAP EPS of $0.38. Management has guided Subscription and Services revenue in the range of $530 million to $600 million, representing YoY growth of 69% at the midpoint.
We entered Coinbase primarily based on technical analysis. Coinbase’s fundamentals are not a reliable indicator of future performance. Instead, asset prices and volatility in crypto are more important than traditional fundamentals.
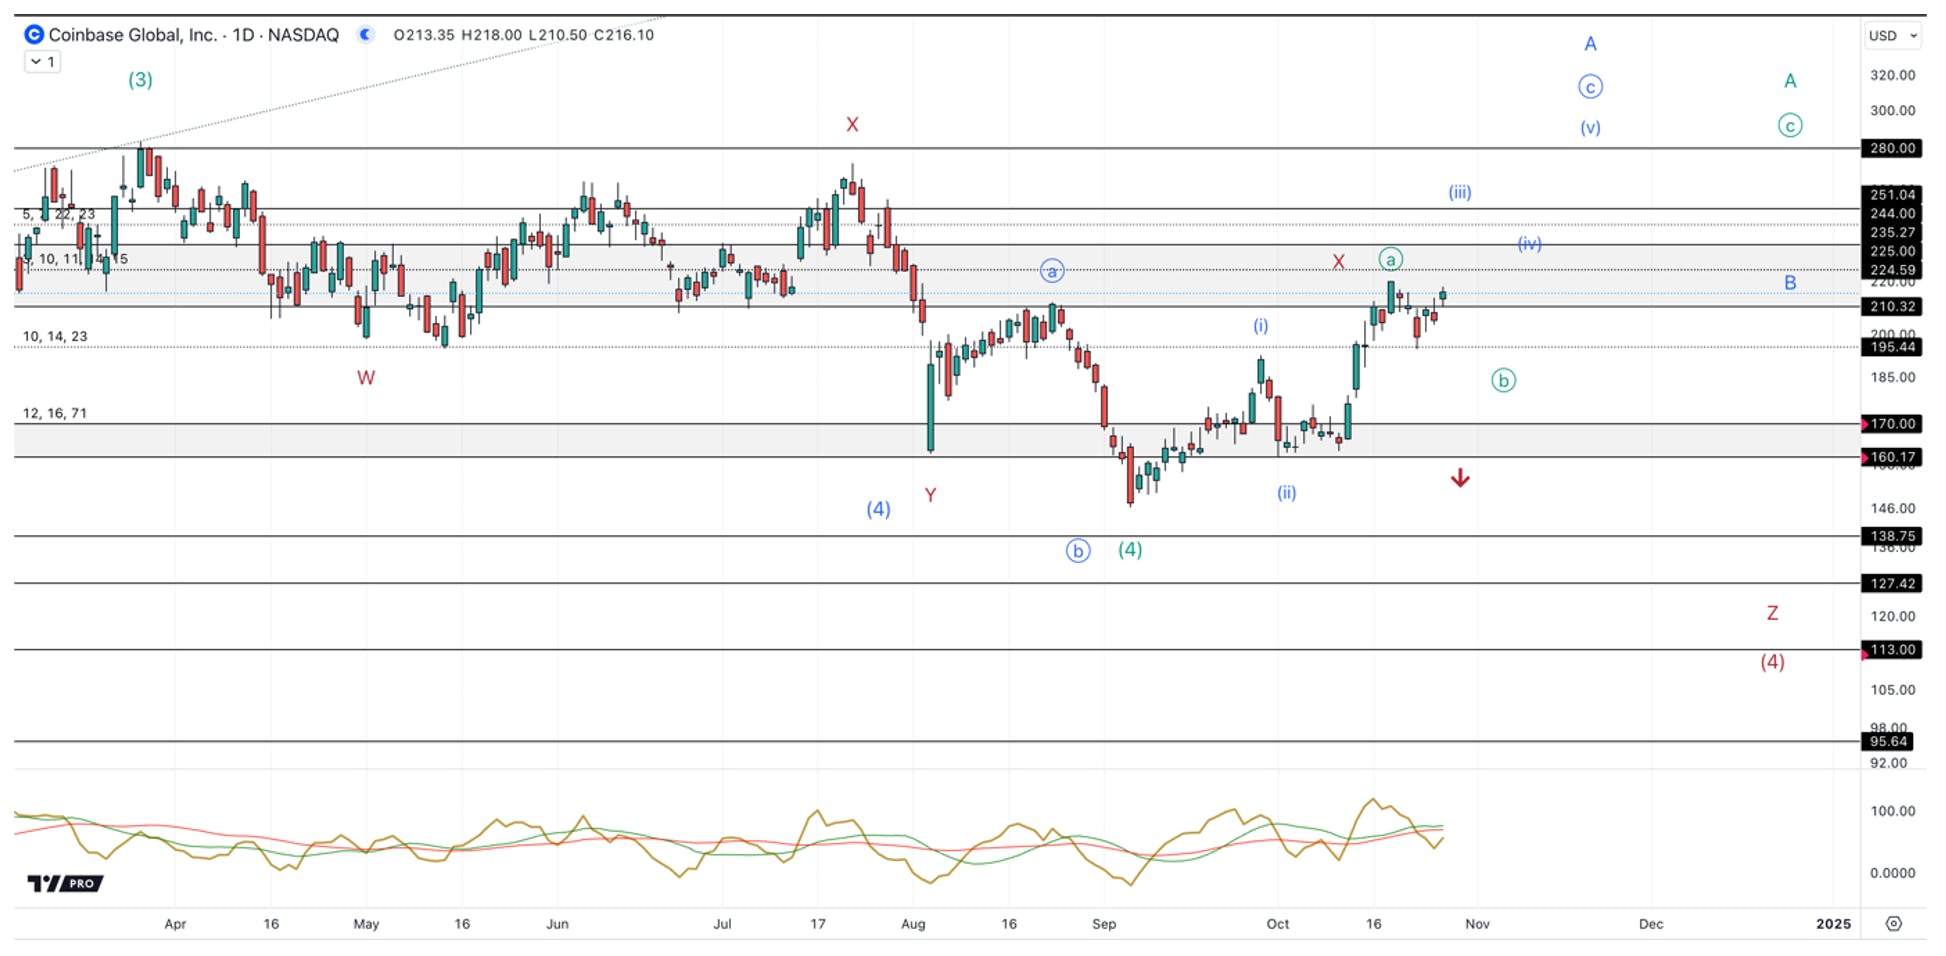
Technical analysis shows a potential for a pullback, and if so, we will be watching $160 to $170 for our next potential tranche. Given the election is next week, anything can happen and if the setup changes and the stock does not pullback, then Advanced members will be updated in our weekly webinar as to the plan.
Revenue
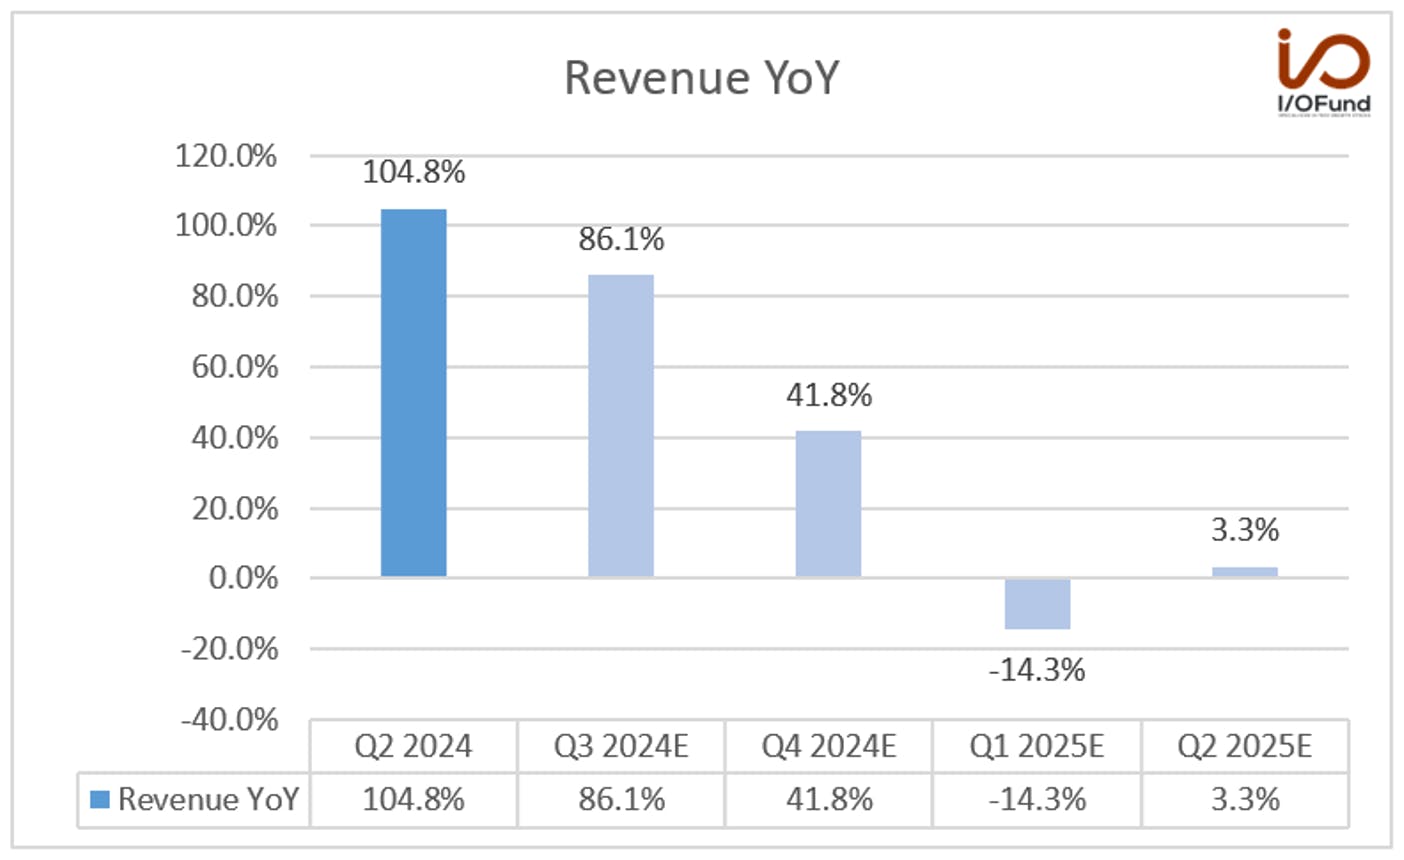
The company’s revenue growth rate is expected to slow as it laps tough comps more often than a typical growth stock. By virtue of Bitcoin and crypto reaching a new high in March 2024, the company is expected to see negative growth of (-14.3%) the following year in the March quarter of 2025. The current estimates suggest a bottom in Q1 2025. Notably, on a sequential basis, revenue is expected to increase from Q3 2024 to Q2 2025.
Q2 revenue grew by 104.8% YoY to $1.45 billion.
Analysts expect Q3 revenue to grow 86.1% YoY to $1.25 billion and 41.8% YoY to $1.35 billion in Q4.
Analysts expect 2024 revenue to grow 83.1% YoY to $5.69 billion and 2025 revenue to grow 3.3% YoY to $5.88 billion.
Revenue is expected to decline by (-7.2%) YoY to $5.45 billion in 2026. Analysts shy away from predicting too much growth in either direction in the next few years, which is why technical analysis matters quite a bit with Coinbase.
Margins
Margins have widely fluctuated with revenue. The company also implemented an accounting change in Q1 2024, wherein they will report the fair value of their crypto assets. This means that the company will report unrealized profits or losses based on the crypto prices at the end of the quarter.
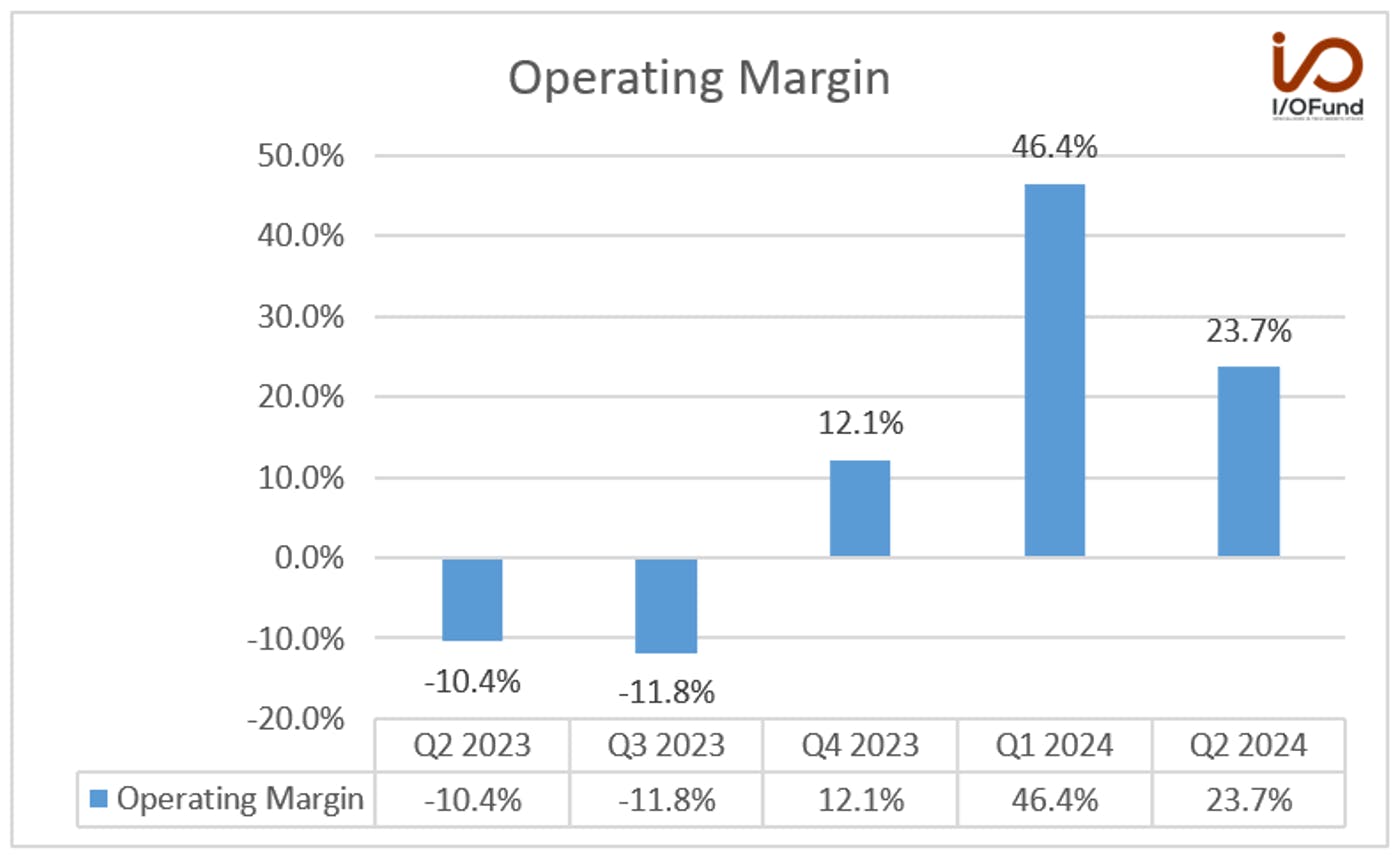
Q2 operating margin was 23.7% compared to (-10.4%) in the same period last year. Operating expenses increased 26% QoQ to $1.1 billion due to unrealized losses in Q2 compared to gains in Q1 and higher marketing and policy spending.
Technology and administrative expenses are expected to increase in Q3 due to uneven stock-based compensation recognition, while marketing expenses will increase due to increased online marketing spending.
Management stated, “We expect Q3 transaction expenses will be in the mid-teens as a percentage of net revenue. We expect technology & development and general & administrative expenses to increase Q/Q to $700-$750 million, largely driven by the non-linear expense recognition of our stock-based compensation.
Finally, we expect sales and marketing expenses to increase Q/Q to $160-$210 million, primarily driven by higher variable digital marketing.” The company also plans to increase its headcount in the second half of the year to support product and international expansion.
Net income was $36.1 million or 2.5% of revenue (includes $319 million in pre-tax crypto assets losses vast majority of which were unrealized as crypto prices were lower at the end of Q2 compared to Q1) compared to a net loss of (-$97.6 million) or (-13.8%) of revenue last year.
Adjusted EBITDA was $595.55 million or 41.1% of revenue compared to $188.73 million or 26.7% of revenue in the same period last year.
EPS
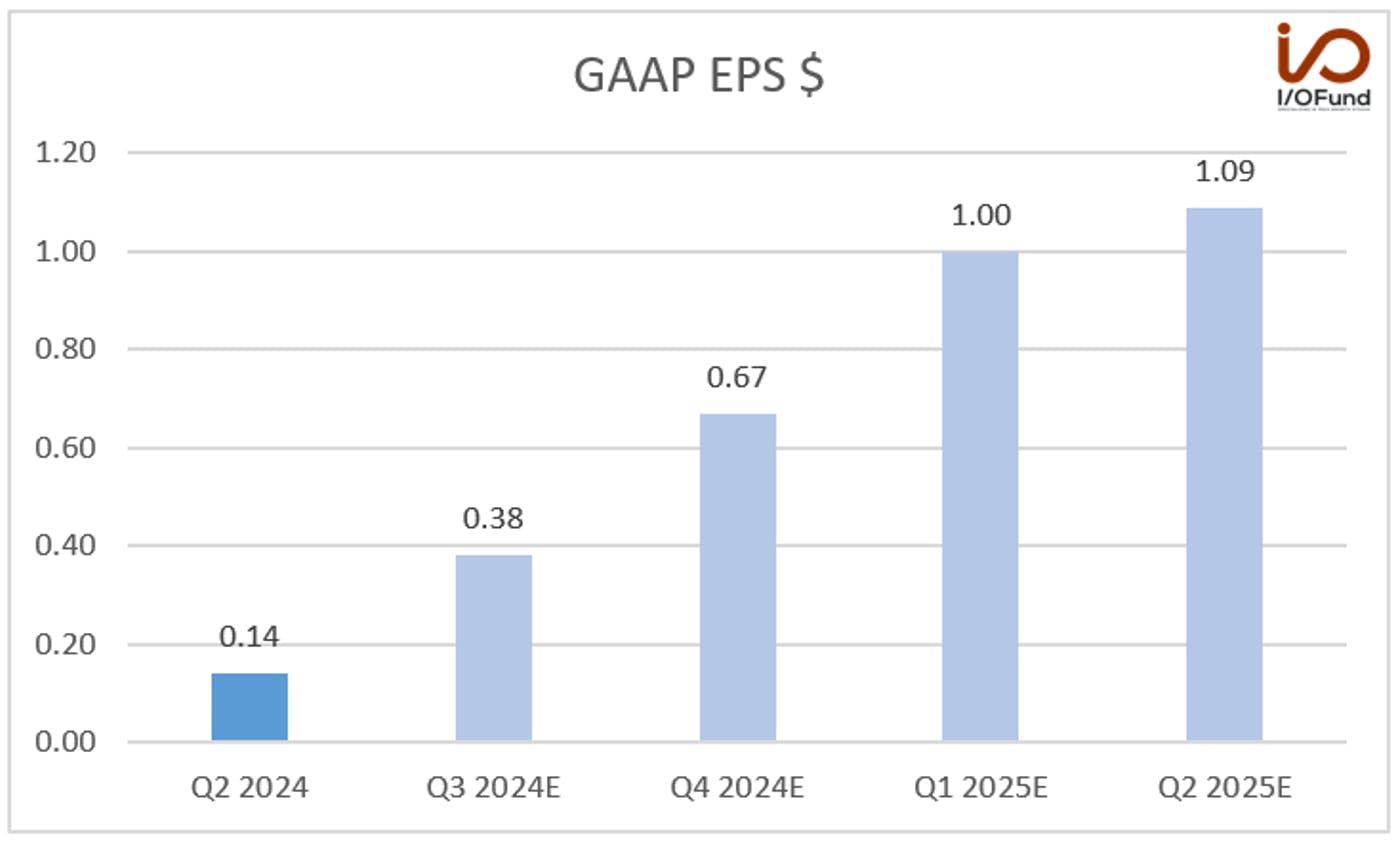
EPS has been lumpy in the past as discussed in the above paragraph. It is expected to increase sequentially in the next few quarters.
Q2 GAAP EPS was $0.14 compared to (-$0.42) in the same period last year.
Analysts expect Q3 EPS to be $0.38 compared to (-$0.01) in the same period last year. Q4 EPS is expected to be down (-35.6%) YoY to $0.67.
2024 GAAP EPS is expected to grow 1413% YoY to $5.6 and down (-4.6%) YoY to $5.34 in 2025 due to high comps.
2026 EPS is expected to decline by (-36.5%) YoY to $3.39. This will be highly dependent on crypto’s performance, however, and the subsequent trading volume.
Cash Flow and Balance Sheet
The company is generating strong cash flows. Coinbase’s cash flows have seen a remarkable turnaround, from (-51.6%) in 2022 to 27.7% in 2023.
Free cash flow was $484.2 million or 33.4% of revenue compared to $151.1 million or 21.4% of revenue in the same period last year.
Cash was $7.23 billion, and debt of $4.23 billion, compared to $6.7 billion and $4.23 billion in Q1. The company issued $1.3 billion of convertible notes in Q1 and plans to use the net proceeds of $1.1 billion to repay the outstanding debt at or before maturity, depending on market prices. Management also clarified in the earnings call that the other reasons for maintaining large cash balances were to support the ETF launches and for potential investment opportunities, both organic and inorganic.
Alesia Haas, CFO, answered the analyst's question on the cash build-up. “Yes, we're really pleased with the balance sheet strength. We are using cash, as we've mentioned in our prime financing business. A large amount of that cash was used to support the ETF launches in Q1 and Q2 with the Bitcoin ETF and now hopefully be a Ethereum ETF where you can see a lot of day-to-day or week-to-week volatility of those loan balances. We did grow prime financing fees within the quarter. And so you can see while the balance at the end of quarter was down versus of Q2. We saw growth intra-quarter for those balances. So using our cash to support our products is a primary use case for us.”
Key Segments:
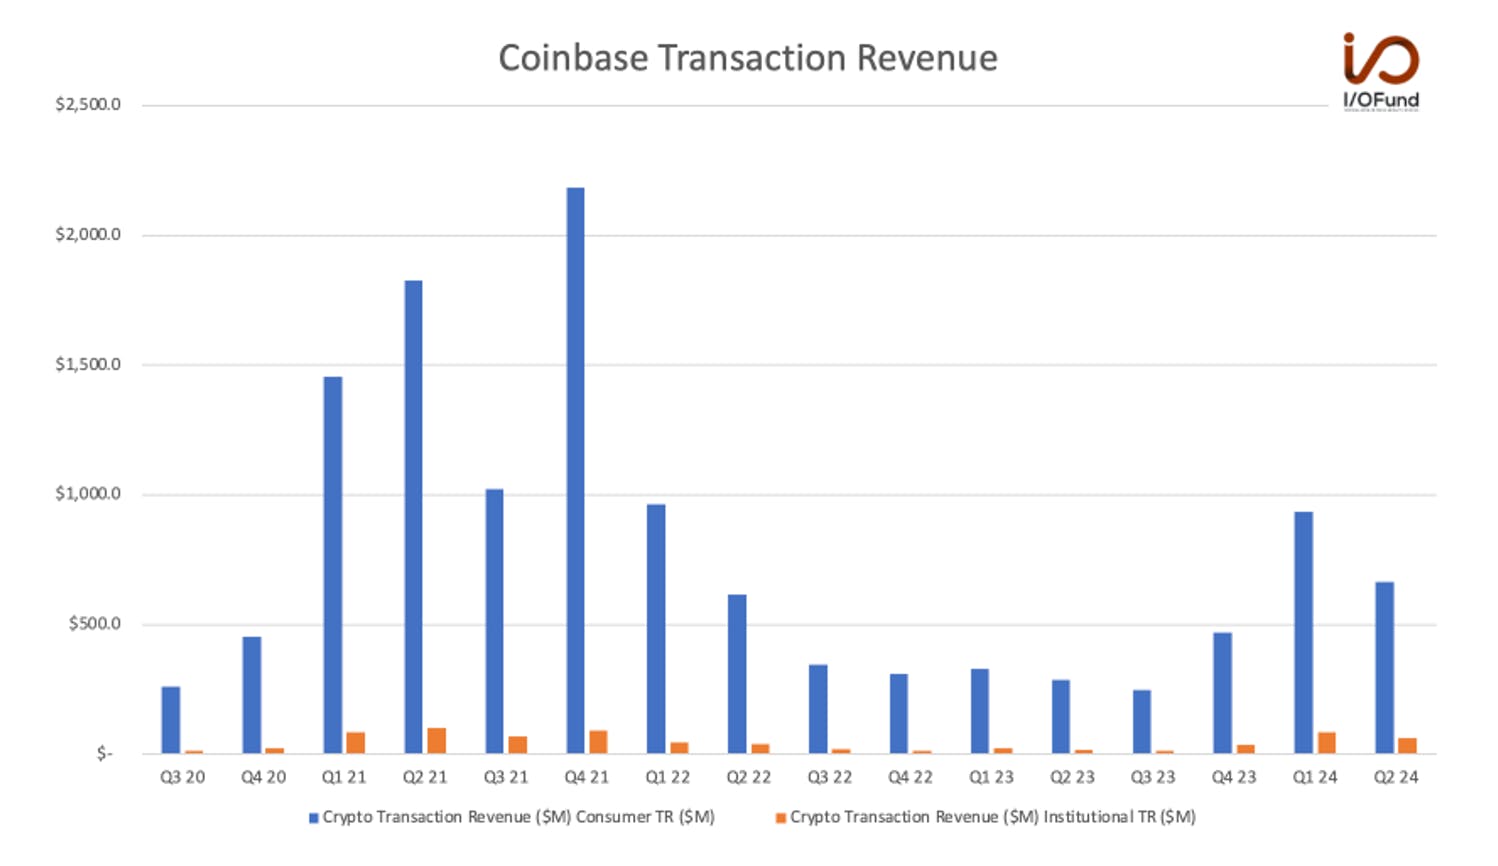
Coinbase’s Q2 transaction revenue grew 138.7% YoY and down (-27%) QoQ to $781 million. Crypto asset volatility declined approximately (-13%) compared to the Q1 average, resulting in softer crypto spot market trading in Q2 compared to Q1.
Within Transaction revenue, Consumer is the main driver at $664.8 million, up 130% YoY, compared to Institutional revenue of $63.6 million, up 272% YoY.
Base and payment-related revenue has been reclassified to other transaction revenue. It grew 149% YoY to $52.5 million. Improved efficiency and reduced fees led to the number of base transactions growing 300% sequentially.
Management stated they saw $210 million in transaction volume for July, pointing toward mid-$600 million for transaction revenue. This compares to $110 million in July of last year.
Q2 subscription and services revenue grew by 78.6% YoY to $599 million. This is an all-time high for Coinbase in this segment and helps to diversify from being entirely dependent on transaction revenue. The growth was due to stablecoin revenue and blockchain rewards revenue; it also benefitted from a one-time blockchain validator reward of $8 million. Management guide for Q3 is $530 million to $600 million, representing a YoY growth of 69% at the midpoint.
Stablecoin revenue grew by 58.8% YoY to $240.4 million. This was primarily helped by higher average USDC on-platform balances and higher average USDC market capitalization.
Blockchain rewards revenue grew by 111.3% YoY to $185.1 million. This segment opens an exciting opportunity as interest rates go lower. Staking yields are not determined by FOMC policy; instead, by the participation rate of coins being staked. As demand increases for crypto, yields will increase to entice more coins to be staked. As a non-correlated yield to traditional financial instruments, which are mostly tied to central bank policy, this creates an opportunity for portfolios to diversify incomes in an interesting way, and adoption should increase as rates go lower.
Interest and finance fee income grew by 33.7% YoY to $69.4 million. This segment is tied to interest rates, Coinbase offers loans against the coins being held in-house. This is unlikely to be sustained now that the FED has lowered rates.
Custodial fee revenue grew by 102.9% YoY to $34.5 million.
Other subscriptions and services revenue grew by 153.1% YoY to $69.6 million.
Other Key Points to Watch:
Regulatory Changes
Improving regulatory clarity is another catalyst for the stock in the near term. With the elections around the corner, both candidates show support for crypto. Management was also optimistic about the regulatory clarity during Q2 results.
“In Q2, we made extraordinary progress towards driving regulatory clarity in the US and around the world. Crypto legislation has become a mainstream issue in the US, garnering bipartisan support, and there is real energy within both the House and the Senate to pass meaningful legislation. We continue to support Stand With Crypto – which now has over 1.3 million advocates – and will continue to invest in policy initiatives throughout the 2024 election cycle to help elect pro-crypto candidates. The approval and launch of the ETH ETFs was another huge step forward for regulatory clarity as it confirmed what we have been saying for years: ETH is not a security. Outside the US, we saw USDC become the first stablecoin to achieve compliance with the European Union's landmark Markets in Crypto-Assets (MiCA) regulatory framework.”
Institutional Adoption
For institutions, there is a product called Coinbase Prime. This full-service prime brokerage platform facilitates trades and custodian services for large institutions. Management has stated that institutions have maybe 1% to 3% of their funds in crypto. This is a low allocation, which has a lot of potential for growth. Management has mentioned that lack of regulatory clarity is the main hindrance for more institutional adoption.
Brian Armstrong, Co-founder and CEO, said in the Q2 earnings call, “90% of institutional investors say regulatory clarity would boost their confidence in investing more in crypto. For these reasons, Coinbase will continue to push for clear rules in the courts, in Congress and in the November elections.”
He further answered in Q&A, “Well, I think you're right that the lack of regulatory clarity is probably the biggest blocker for institutions to put more and more funds into crypto. We have a huge number of them as clients in Coinbase Prime, our institutional product. And when I meet with them, they'll often say, we've got 1% or 2% or 3% of their funds in some portfolio, holding in crypto. And I asked them, what would it take for it to be 10, 20, 30, and they all say regulatory clarity.”
Derivatives
Coinbase has primarily been a spot trading exchange, where crypto traders buy the asset at current market prices. In November of 2023, Coinbase added derivatives trading, which will help the exchange participate in a higher percentage of trading activity. Derivatives trading is roughly 2/3 of all crypto trading compared to spot trading at 1/3.
Management mentioned during the Q2 earnings call that the company’s focus has been on adding users and growing market share. This has included additional contracts and margin trading for crypto futures. The derivatives market is expected to be an important growth market in the future.
Valuation
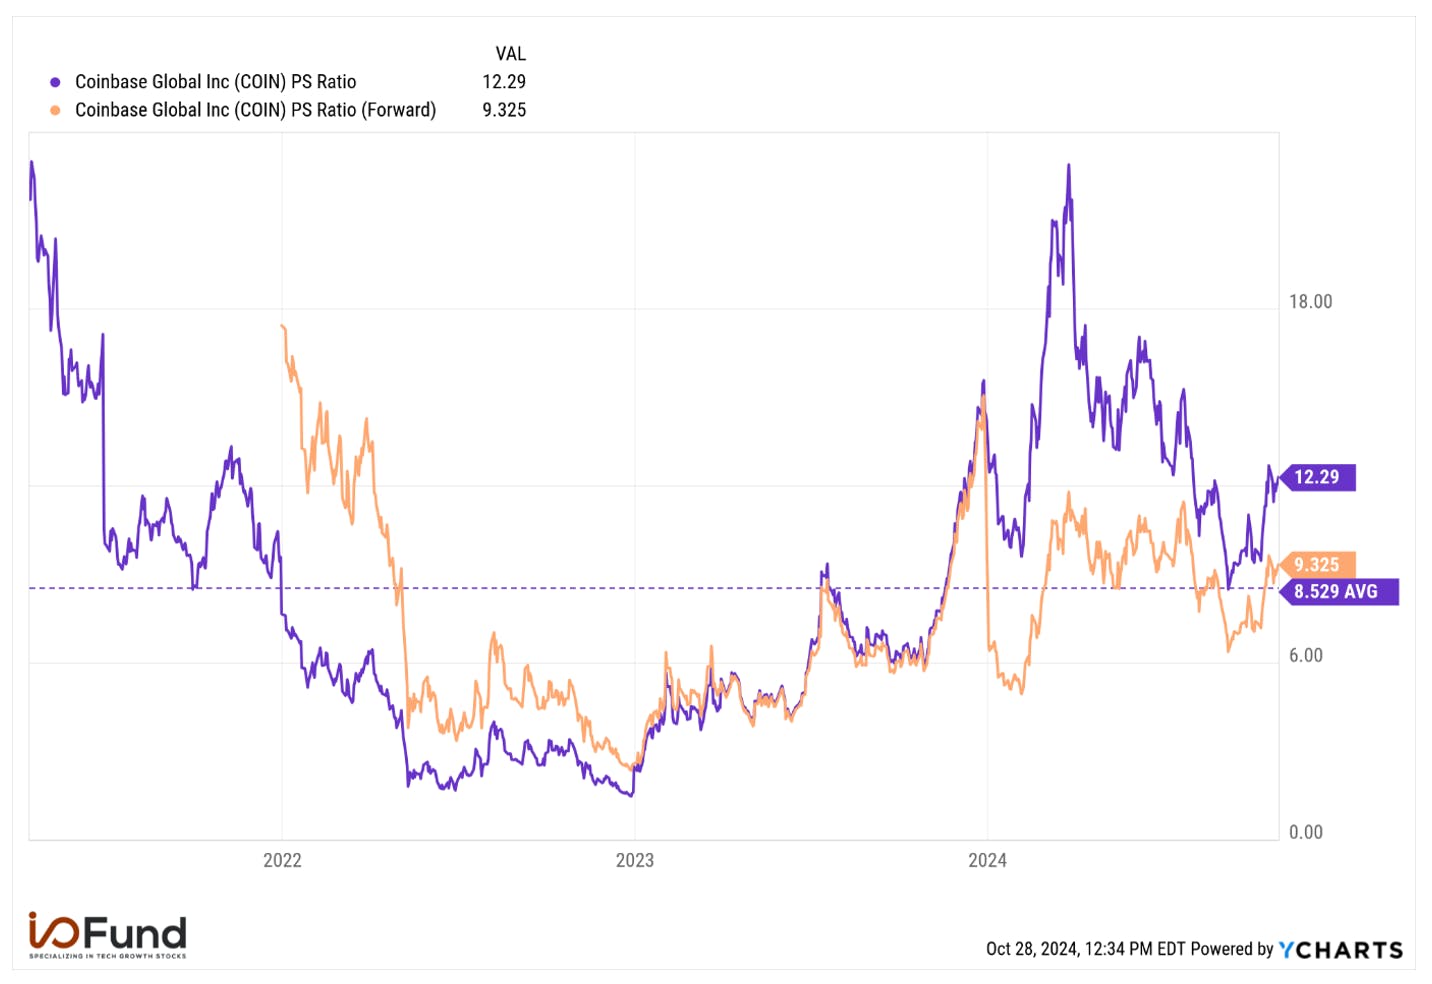
Coinbase is trading at a P/E ratio of 37.7 and a forward P/E ratio of 38.9. P/S ratio is 12.3 and a forward P/S ratio of 9.3. It is trading above its average P/S ratio of 8.5.
Technical Analysis
By Portfolio Manager Knox Ridley
Like Bitcoin, Coinbase has been in a correction since March of 2024. Based on the lack of a clear trend, and on-going overlap, there are numerous interpretations of the current price action. Below, I present the three most likely, along with what levels need to hold/break to confirm each.
Green – The correction that started in March is a 4th wave that ended in early October. The final 5th wave is tracing a large degree 3 wave uptrend (A,B,C). This means that the path higher will not be a typical, direct move, but an overlapping push higher. If this is playing out, we will see a correction start soon, which will hold over $170 – $160. If this happens, the general target for the next leg higher will be around $280.
Blue – We will see a gap higher on heavy volume that breaks above $235. This means that the 4th wave correction ended in August and we are further along in the final swing higher. We should push toward the $280 region before seeing our first larger correction within this new uptrend.
Red – We break below $170 – $160. This will indicate that we are still in the 4th wave, which will be targeting $128 – $95.
Conclusion
Coinbase’s move into the derivatives market and its role as a trusted custodian for institutional investors in the crypto space, will continue to entice institutions to its platform. The regulatory clarity is another catalyst to watch in the near term. We continue to successfully navigate the crypto volatility by using technical analysis.
Last month, we covered the importance of optical interconnects in linking GPUs together in clusters in our thematic deep dive “Optical Interconnects Overview: Strong Growth Expected Ahead.” Optical transceivers address bandwidth, or the speed of data transfer in the data center. As hyperscalers work to expand capacity, it’s expected there will be a surge in optic connections.
Fabrinet provides advanced optical communications components for datacom and telecom end markets, customized optics and glass fabrication, and advanced laser and other electro-mechanical parts. Fabrinet has reported consecutive quarters of strong datacom growth, stemming from one of its flagship customers, Nvidia. Fundamentally, Fabrinet possesses stable margins and strong cash flow generation, as top and bottom line growth is expected to accelerate from the low-teens to the 20% range over the next few years.
Fabrinet is clearly a beneficiary of Nvidia’s surging growth in the AI GPU market, with Nvidia’s contribution nearly tripling from 12.5% to 35.1% over the past twelve months. We’ve covered how Blackwell brings an enormous revenue opportunity for Nvidia and its suppliers, and Fabrinet is expected to be a beneficiary of Nvidia’s upcoming superchip, with long-term growth opportunities for optics in the AI data center and in 800G+ data rates.
Fabrinet reports earnings on Nov 4th.
Revenue Growth Reaccelerated in 2024; 149% Q3 Datacom Growth
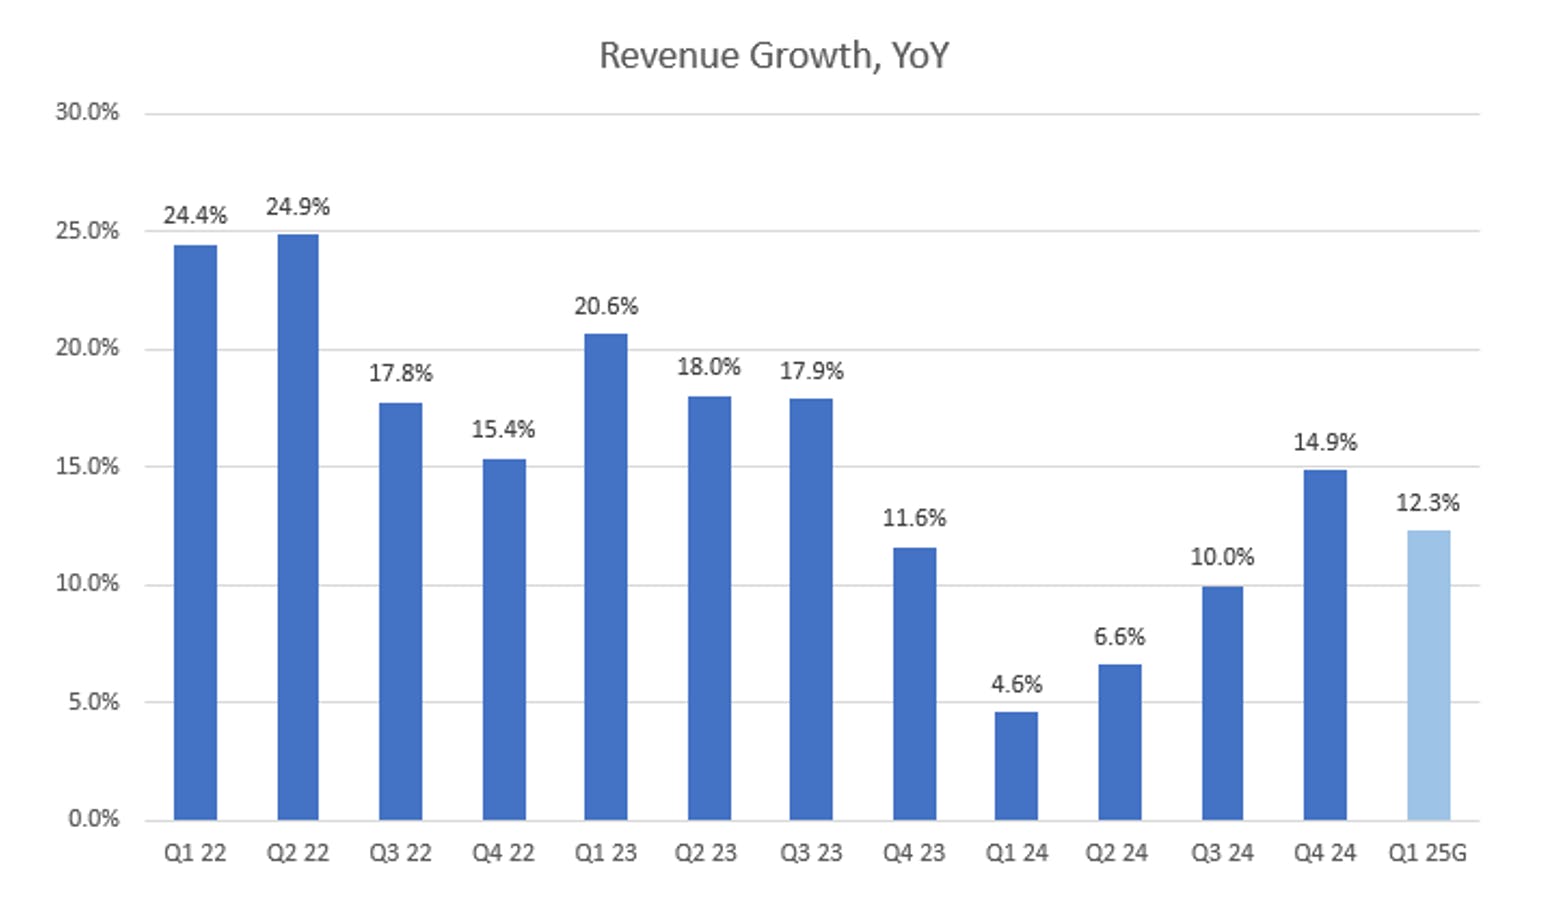
After a weak start to fiscal 2024 with low single digit revenue growth, Fabrinet finished its fiscal year with revenue growth reaccelerating in each quarter. Over the long-term, analysts currently estimate revenue growth to accelerate each year through fiscal 2027, as Fabrinet captures tailwinds from growth in optics.
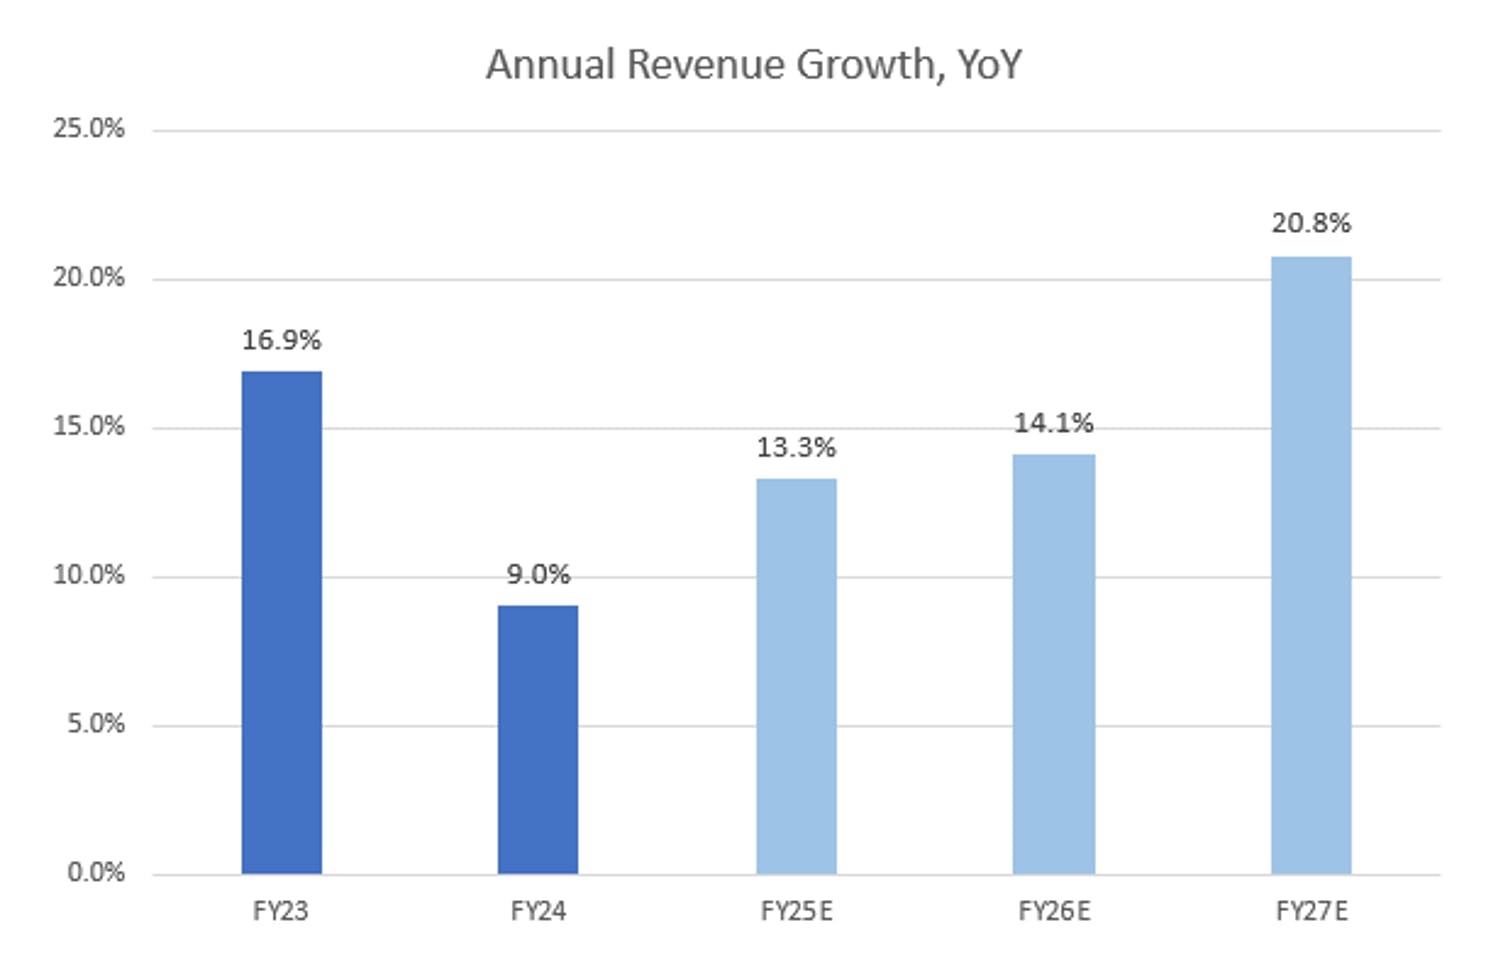
Fabrinet reported 9% YoY growth to $2.88 billion in revenue in fiscal 2024, decelerating from 16.9% YoY growth in fiscal 2023. Much of this decline was weighted in the first half of fiscal 2024, as the broader optics industry suffered from a sharp inventory correction in the telecom industry.
Moving forward, analysts expect Fabrinet’s revenue growth to accelerate again on the back of strong datacom revenue growth, with estimates pointing to an acceleration through fiscal 2027. Fabrinet is currently estimated to report 13.4% growth in FY25 to $3.27 billion in revenue, a 5.4 percentage point acceleration, before rising to 14.1% growth in FY26 and 20.8% growth in FY27.
Here's what CEO Seamus Grady said about the long-term opportunity: “If your time horizon is much longer, I think we're in the very early stages of this. So, you can add or subtract as many various as you like, but I still think we're in the very, very early stages of this. And we're just beginning to see what this explosive growth in AI and the infrastructure that's required to power this network will do and what it will need in terms of optical interconnect.
I think it's because optical is the only way that you can get the speed and the bandwidth that you need to get the signals to move around. You just can't do it with traditional interconnect. So, I think there's a kind of a paradigm shift to optical interconnect becoming kind of almost mainstream. And you have to have optical for this. There's no other way to do it.”
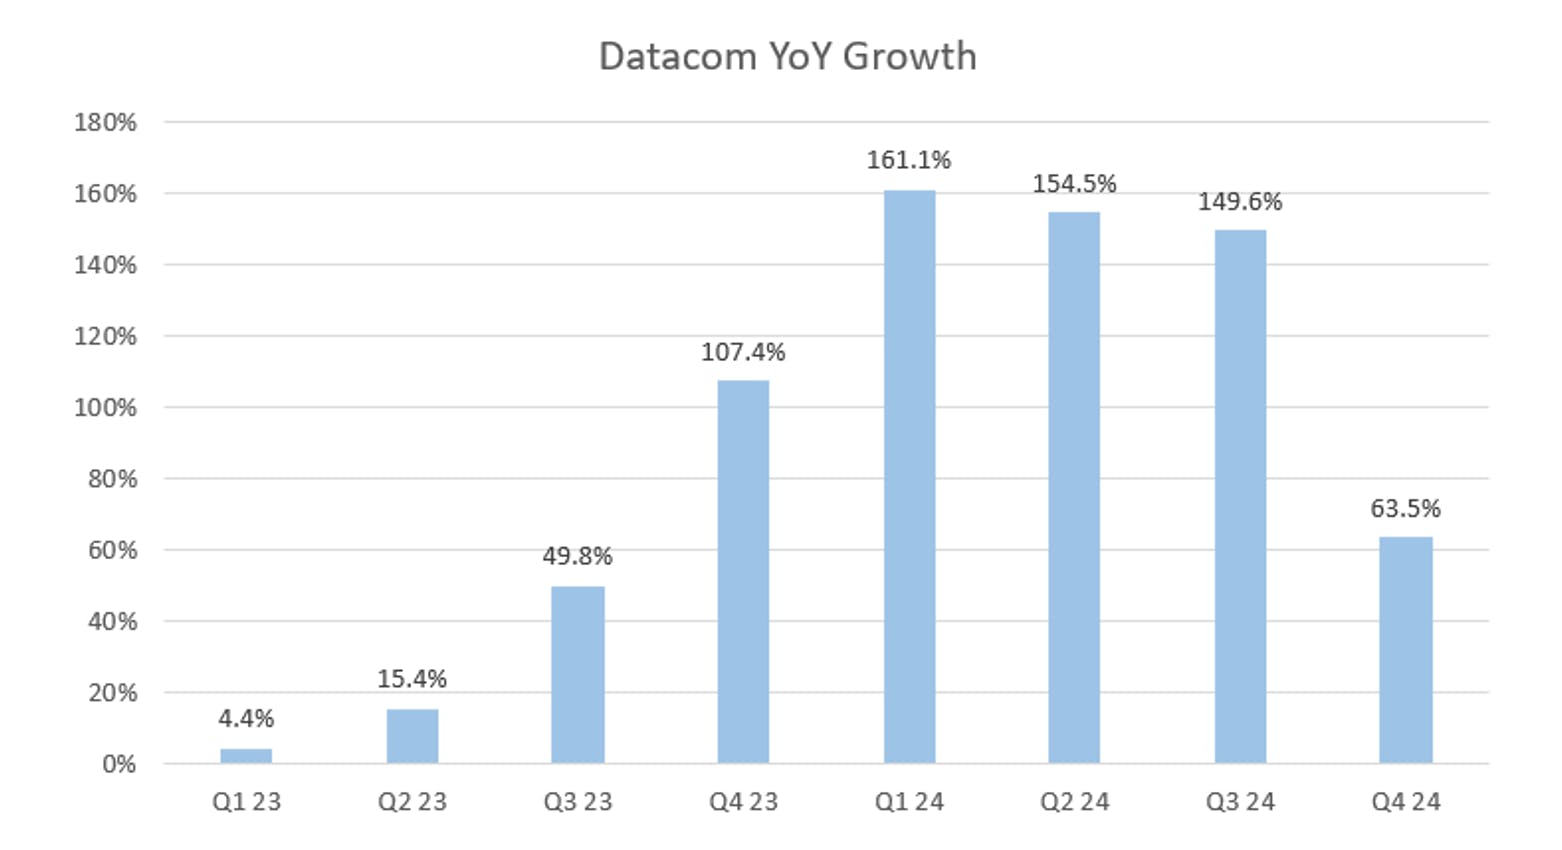
On a quarterly basis, fiscal Q1 2024 was Fabrinet’s weakest quarter, with revenue growth of 4.6% YoY, decelerating 7 percentage points sequentially and 16 percentage points from the year ago quarter. This was both in part due to a quarter that was a week shorter (growth was 8% YoY when normalizing for weeks), as well as telecom revenue declining more than (28%) YoY, offsetting 161% YoY datacom growth.
Telecom headwinds continued to persist through Q2 and Q3, with declines of nearly (29%) YoY and (25%) YoY respectively. Datacom growth of 154% and 149% YoY in both quarters offset the lingering weakness in telecom, aiding revenue growth and pushing growth rates up to 10% YoY by Q3. Revenue growth accelerated nearly 5 percentage points QoQ to 14.9% in Q4, as telecom declines moderated as data center interconnect growth ticked up. Datacom remained strong in Q4, with 800G products leading growth, offset by the wind down of 100G products.
For Q1, Fabrinet expects revenue between $760 million and $780 million, for YoY growth of 12.3% at midpoint, with sequential growth in all product categories. This would represent a 2.6 percentage point deceleration at the midpoint, and a 1.1 percentage point decel at the high range to 13.8% growth. With 800G demand remaining strong, datacom is set to remain a primary driver for quarterly performance moving through 2025.
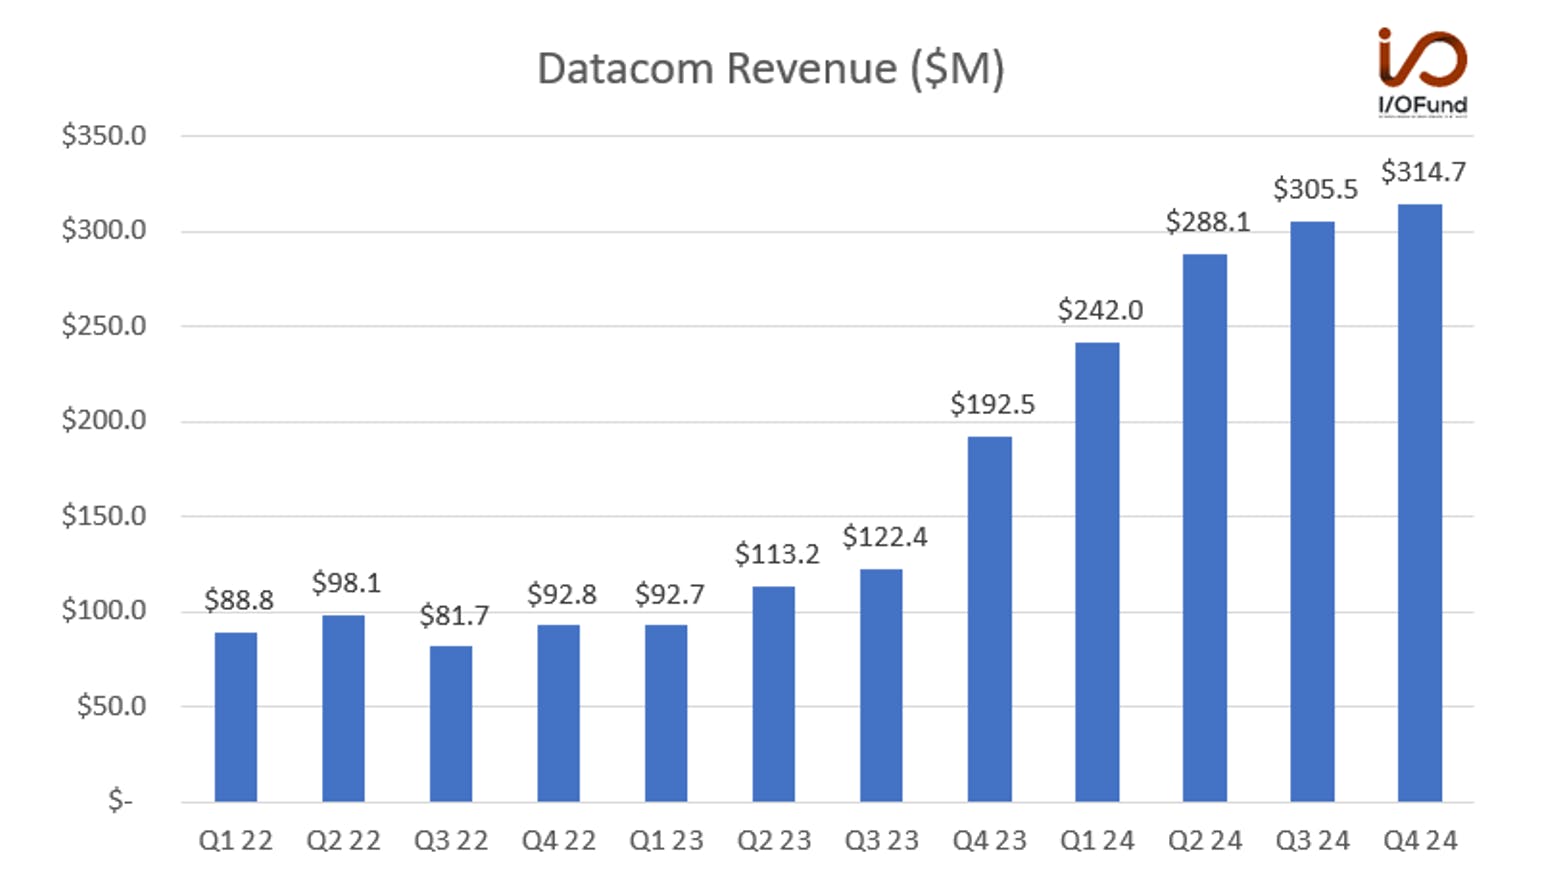
Similar to what we discussed last month in our optics overview, Fabrinet’s management sees 800G data center transceivers as its largest growth tailwind, followed by 400 ZR and 400G transceivers as the next largest tailwinds. In just eight quarters, Fabrinet’s quarterly datacom revenue has grown nearly 3.5x, from $92.7 million in Q1 of fiscal 2023 to nearly $315 million in Q4 of fiscal 2024.
Taking a step back, growth visibly accelerated sharply in Q4 of fiscal 2023, or the June 2023 quarter, where datacom revenue surged to a record high at $192.5 million, more than doubling YoY and rising more than 50% QoQ. Management said that the “datacom growth was primarily driven by an 800-gig AI data center transceiver program for one of our customers.”
While not named, it’s likely that the customer being referenced is Nvidia, as this growth coincided with Nvidia’s breakout quarter (the July 2023 quarter) with Hopper driving more than 100% YoY and 88% QoQ revenue growth. Management explained that that AI data transceiver program “is ramping very fast, and has obviously become a meaningful contributor to our revenue and our growth rates and has really helped us to absorb the decline in the telecom business.”
They further clarified that they believe it is “very much in the early days of this [particular] program and this [broader] opportunity, very, very much in the early days. We're really just a couple of quarters into this of what we believe, as we understand, it will be a very long cycle and a very long trend.”
Four quarters later, in fiscal 2024 (June 2024 quarter, most recent reported), Fabrinet reported $314.7 million in datacom revenue, an increase of more than 63% YoY. Datacom now accounts for nearly 42% of total revenue, up from 29% a year ago.
However, Q4 saw the start of revenue deceleration in the segment as Fabrinet laps stronger comps with its ramp cycle. Datacom revenue accelerated extremely rapidly, rising from 4.4% YoY to 161.1% YoY in the span of four quarters, before hovering at ~150% YoY for three quarters in a row. While Fabrinet did not provide an exact guide for datacom revenue in Q1, it’s likely that there will be a slight deceleration sequentially as the company laps its peak growth quarter in Q1 2024.
Nvidia Jumps to 35% of Revenue
Despite passing peak growth, management remains optimistic about datacom’s opportunities, especially with core 800G customer Nvidia, which significantly boosted its purchases and relationship with Fabrinet to meet red-hot GPU demand.
Analysts pressed about the potential impacts of Nvidia’s once-rumored Blackwell delay, and if that would affect Q1’s guide, with Fabrinet CEO Seamus Grady saying that Nvidia “continue[s] to see strong demand for their products. And our understanding is that they will extend and expand production based on current GPUs to meet the demand that's there, and we're happy to continue to support them.”
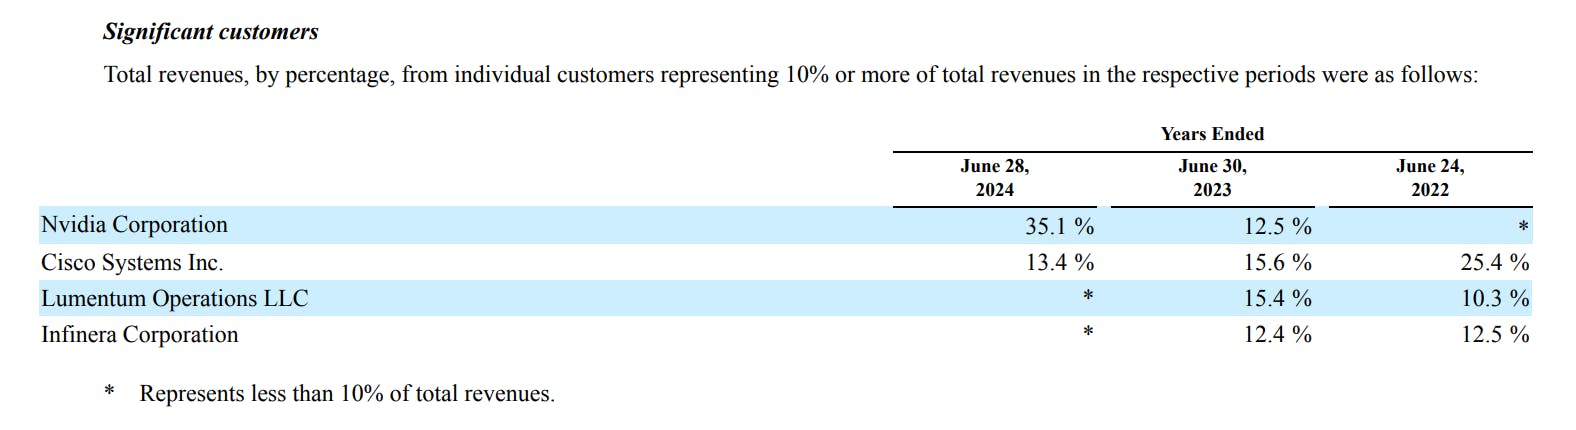
Nvidia has rapidly become a core customer for Fabrinet through fiscal 2024, with its contribution to revenue nearly tripling from 2023. Nvidia was a non-significant customer through fiscal 2022, contributing anywhere from 0% to 9.99% of revenue, before contributing 12.5% of revenue in fiscal 2023 and now 35.1% in fiscal 2024 (June 2023 to June 2024).
In dollar terms, Nvidia’s revenue surged 206% YoY, from approximately $331 million in fiscal 2023 to $1.01 billion in fiscal 2024. Cisco remained Fabrinet’s second-largest customer, contributing 13.4% of revenue (~$386 million) in fiscal 2024, down from 15.6% in fiscal 2023 (~$413 million). Lumentum and Infinera had previously been major customers, accounting for more than 10% of revenue each in fiscal 2022 and 2023, but both fell below the 10% reporting threshold in fiscal 2024.
While Nvidia presents a strong growth opportunity, it’s also a risk, as the significant concentration in Nvidia opens up the door to a large chunk of lost revenue if Fabrinet lost Nvidia as a customer. However, management is working on additional opportunities outside of Nvidia in merchant transceivers and with hyperscalers, noting that they “really don't mind whether it's Ethernet or InfiniBand or anything else” supporting AI infrastructure buildouts, having the flexibility to work across different networking infrastructure.
Additionally, Fabrinet is one of a handful of suppliers to Nvidia, who is now expected to be expanding its supplier base in order to expand its GPU supply. Analysts from B. Riley stated earlier in October that its “latest checks indicate that Nvidia may have added another supplier for 1.6T, which it believes is Eoptolink. As such, Nvidia’s 1.6T allocations will be in question between incumbers Coherent, Innolight, Fabrinet and a newcomer in Eoptolink.”
Margins
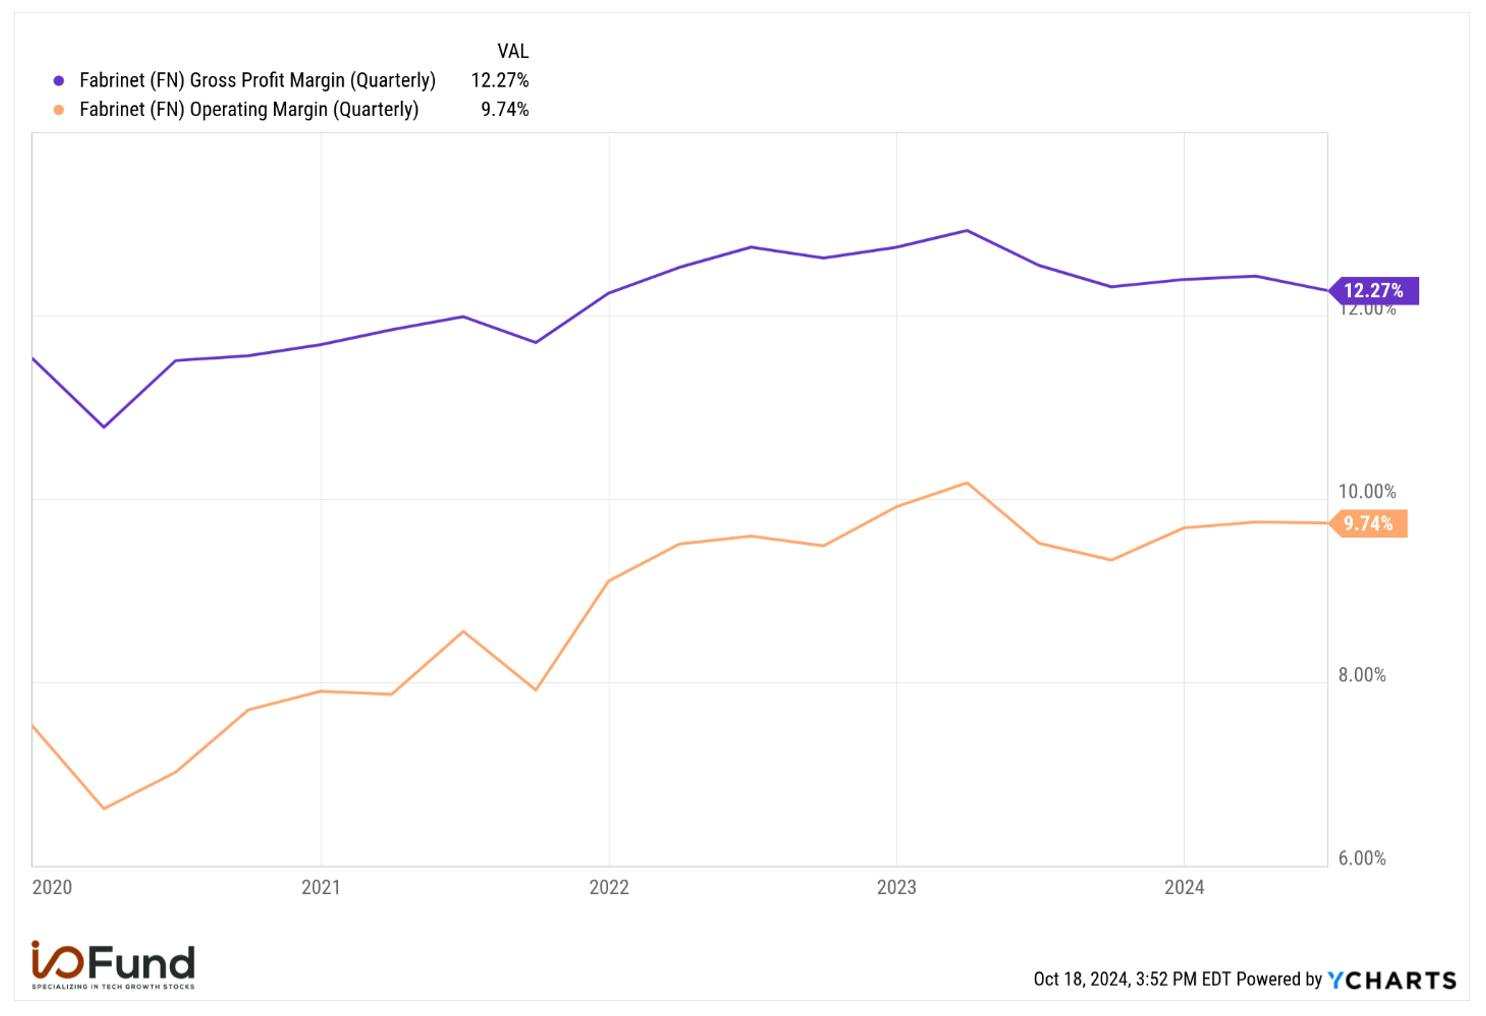
Compared to other companies in the optics space that we covered in our prior update, Fabrinet has a much thinner gross margin profile in the 12% range, but stable and strong operating margins and a strong bottom-line.
Fabrinet has maintained its GAAP gross margin above 12% since Q1 of fiscal 2022, with some minor FX-impacted fluctuations. GAAP operating margin has steadily risen since 2020, rising from ~7% to the high 9% range in fiscal 2023 and 2024. Given the thin gross margins, this is a great example of Fabrinet’s operational leverage, to drive a 200 bp+ increase in operating margin on a <100 bp expansion in gross margin.
GAAP net margins reflect the strength of Fabrinet’s operating margin profile, with the company reporting a 10.3% GAAP net margin for fiscal 2024, expanding 70 bp from 9.6% in fiscal 2023. This is what gives Fabrinet a very strong bottom line: GAAP EPS was $8.10 in fiscal 2024, a 20.4% increase from $6.73 in fiscal 2023.
Looking ahead, GAAP earnings are expected to continue growing, with analyst estimates calling for 15.1% YoY growth to $9.32 in EPS in fiscal 2025 and 19.0% growth to $11.09 in fiscal 2026.
Balance Sheet and Cash Flows
Fabrinet also has a robust balance sheet alongside rapidly increasing cash flows.
Cash, equivalents and investments totaled $858.6 million at the end of fiscal 2024, up from $550.5 million at the end of fiscal 2023 due to strong operating cash flow growth.
Fabrinet reported zero debt at the end of fiscal 2024.
Operating cash flow was $83.1 million, or 11% of revenue, in Q4. For fiscal 2024, operating cash flow was $413.1 million, or 14.3% of revenue; this was an increase of nearly 94% YoY from $213.3 million, or 8.1% of revenue, in fiscal 2023.
Free cash flow was $70.4 million, or 9.3% of revenue, in Q4. For fiscal 2024, free cash flow was $365.6 million, or 12.7% of revenue, increasing more than 140% YoY from $152.0 million, or 5.7% of revenue, in fiscal 2023.
Valuation
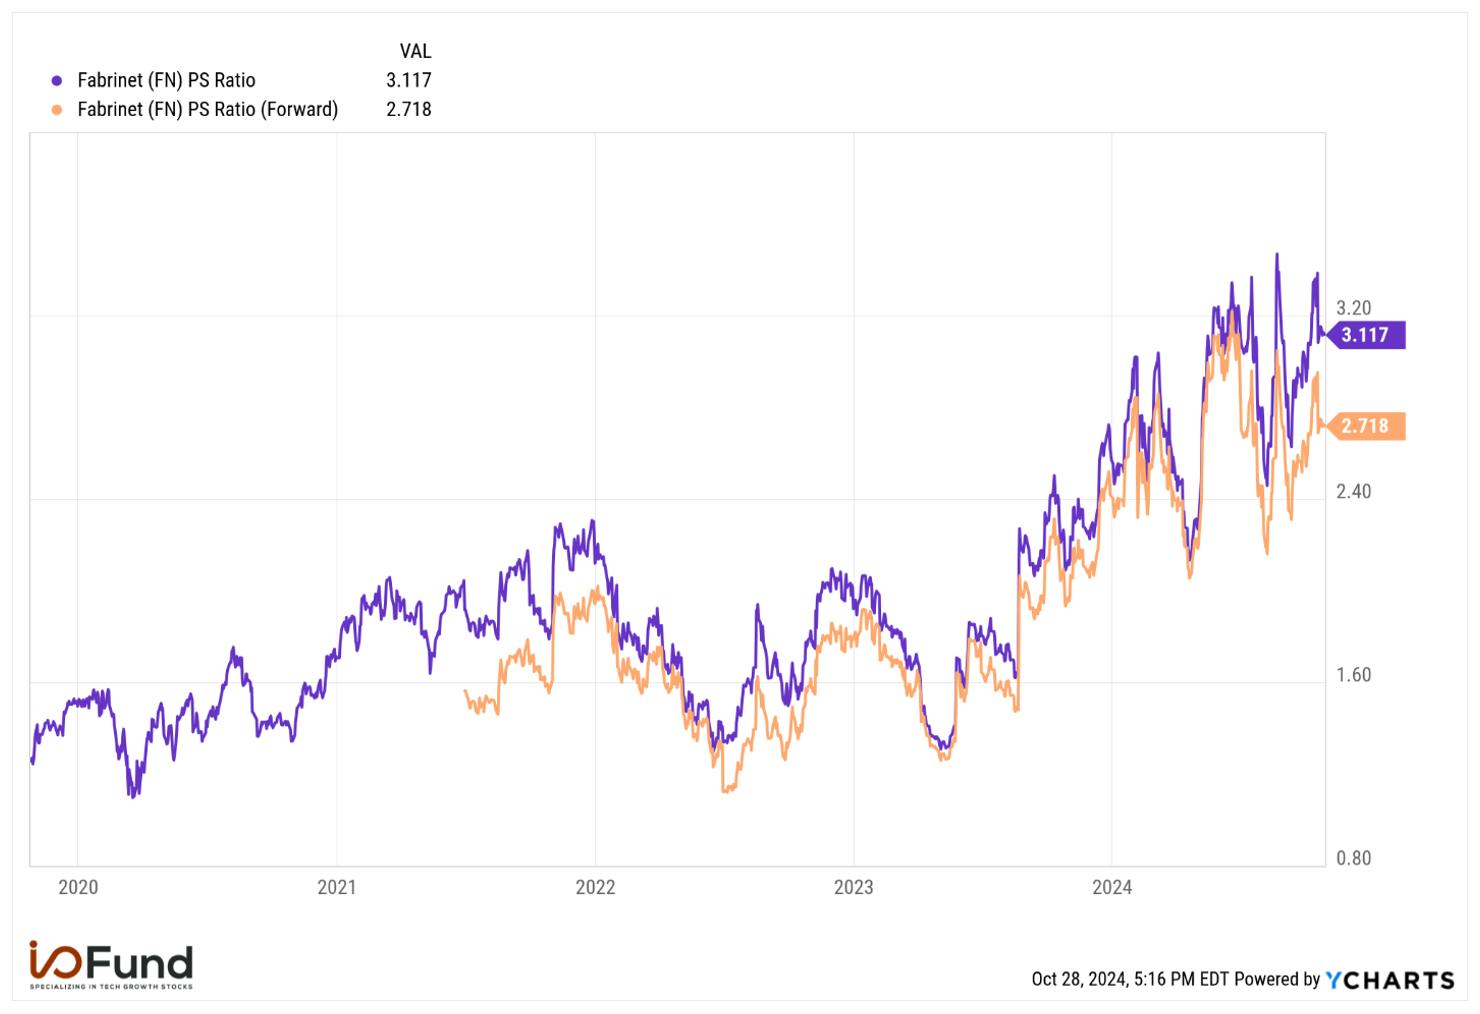
Despite its strong bottom line, Fabrinet is trading at elevated multiples relative to historic trends. This is important to track as well given the longer duration of both its top line and bottom line acceleration, with growth expected to accelerate to above 20% by FY27.
Fabrinet is trading slightly above 3x sales and 2.7x forward sales, both elevated relative to its prior highs in 2021 at ~2.2x sales and 2x forward sales. Fabrinet has also struggled to maintain multiples above 3x sales – in each of the last four times Fabrinet traded above 3x sales in 2024, it pulled back to below 2.75x to 2.25x within the next six weeks.
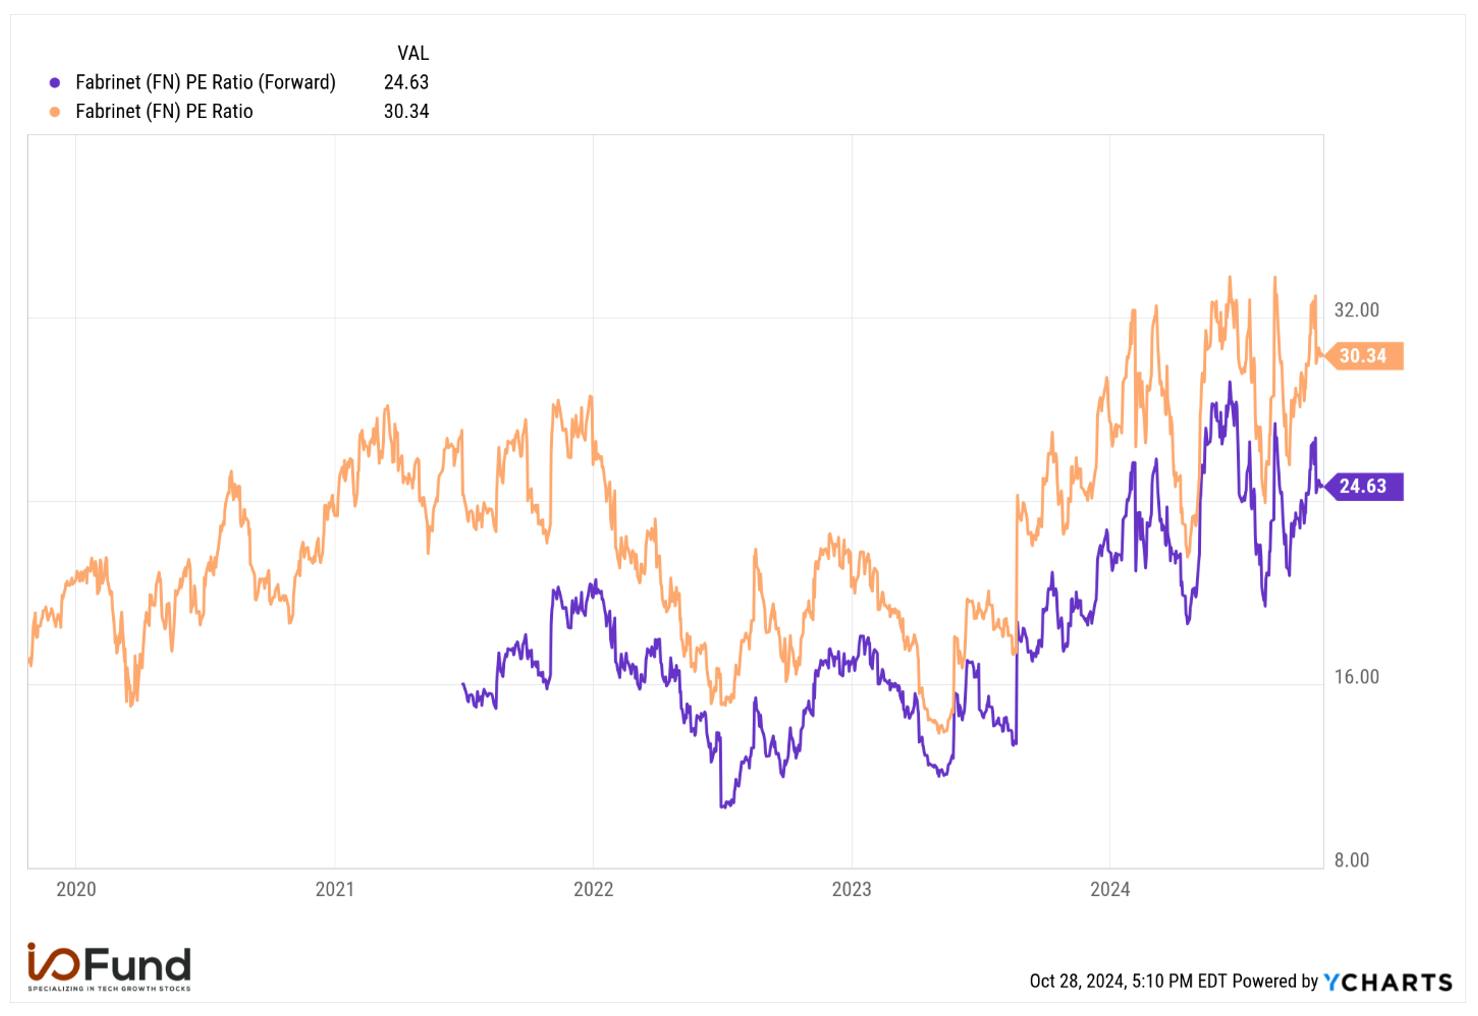
On the bottom line, Fabrinet is trading at a ~30x PE ratio and a 24x forward PE, both elevated compared to historical highs. Through much of 2021, Fabrinet failed to sustain a 27x PE ratio, with shares currently more than 10% above that level on a TTM basis. Fabrinet’s 5-year average PE is ~22.7x, with shares briefly trading below that level just once since AI tailwinds from Nvidia became visible in August 2023.
Conclusion
Fabrinet has caught our attention due to Nvidia’s rising revenue contribution, and ahead of Blackwell’s imminent launch this quarter. Fabrinet’s datacom revenue has been strong, and a primary driver of this recent quarterly revenue growth acceleration.
Despite management guiding for a slight sequential deceleration in fiscal Q1, Fabrinet’s revenue growth is expected to accelerate in fiscal 2025 and beyond, as the company captures tailwinds from high-data rate optics and tailwinds from Nvidia. Unlike Coherent, Lumentum, and Marvell that we previously covered in our prior optics overview, Fabrinet has a solid margin profile, a strong bottom line, and exceptional cash flow growth.
This analysis is a preview of what you can expect in our upcoming Discovery tier, which will provide additional analysis on new idea generation stocks that are not currently in the I/O Fund portfolio. We look forward to launching this tier November/December. There will be no changes to our current service tiers, rather I/O Fund Discovery is a service for those who want more new stock ideas beyond what our service currently provides. Stay tuned for more information!
Damien Robbins, Equity Analyst at I/O Fund, contributed to this analysis.
AMD will release its Q3 2024 results tomorrow. Analysts expect Q3 revenue to grow 15.8% YoY to $6.71 billion and adjusted EPS to grow 30.8% YoY to $0.92.
There are three primary growth segments for AMD. In data center CPUs, AMD has been a force to reckon with and continues to stomp on Intel. The most recent numbers for data center market share is at 34%, up from 4% in March of 2020 when our firm first predicted AMD was setting up for an epic comeback. The Turin EPYC processors were previewed in June and are expected to ramp with broad availability into the second half of the year.
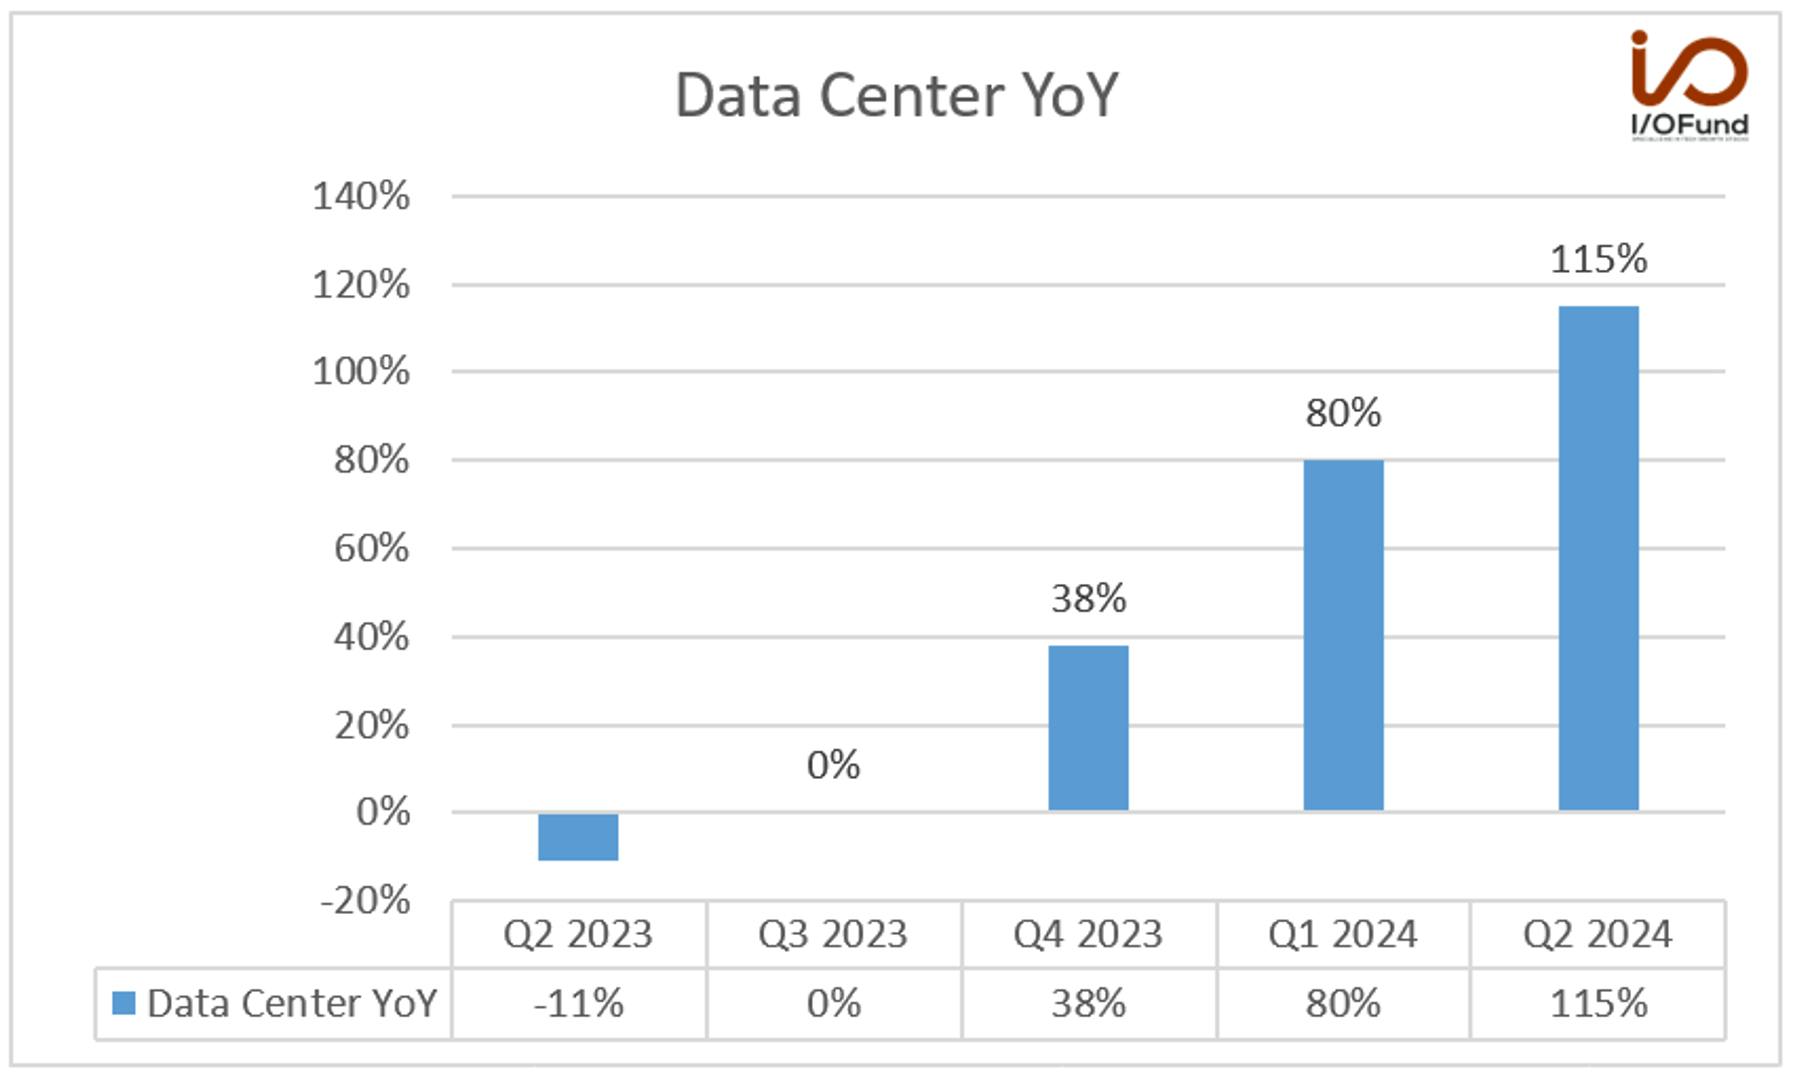
Secondly, given Nvidia sparked an AI boom, the market is hyper focused on AI accelerators, and thus, there is outsized pressure on AMD to raise its revenue on MI300 GPUs. The Street whisper is that AMD will raise this number to $5 billion for this year (up from $4.5 billion), with some analysts predicting AMD will report $10 billion in GPU revenue next year. Regarding analyst expectations of $5 billion this year, this aligns with AMD’s commentary: “When you look at the second half we will continue to see Data Center to be the major driver of our top-line revenue growth” and expectations data center will grow sequentially. Last quarter, data center grew 115% year-over-year in Q2.
If we assume the $5 billion will be guided in tomorrow’s call, this equates to 19.5% of revenue this year, and if we assume the $10 billion materializes, it means AMD will end 2025 with 30% of the company’s revenue from AI. Management has already pointed out the MI300 series marks the fastest ramp in company history, and given they are sitting on tech’s second-best comeback of all time with EPYC processors, this is not a casual statement to make. For perspective, Broadcom will end this year with 23% in AI revenue, if we take their current fiscal year guide. Recently, AMD moved to an annual cadence for its GPUs with the MI325X expected to ship in Q4 2024 and MI350 expected in H2 2025.
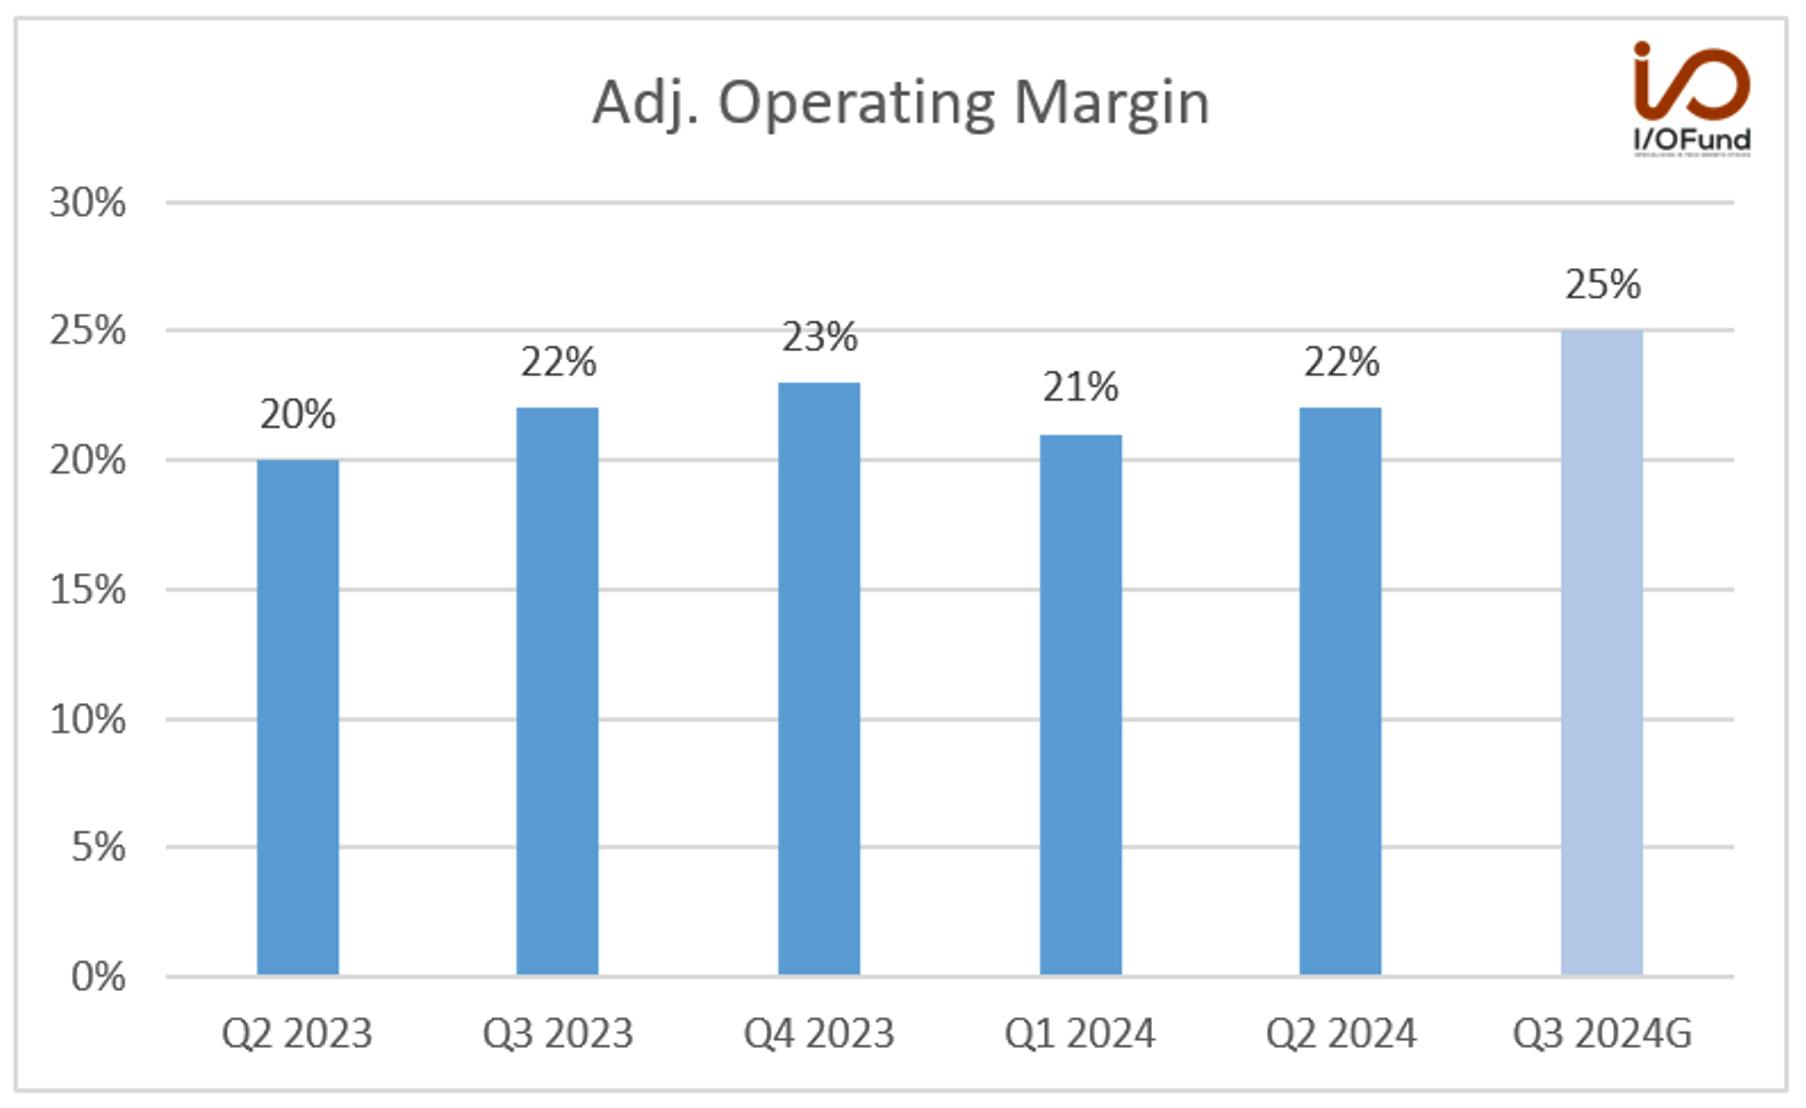
Investors who own AMD are contending with market psychology around what it means to be second place in the highly competitive industry of tech. Additionally, AMD is known for undercutting on price, and thus, the MI300s are expected to be dilutive to margins, whereas Nvidia’s H100s and H200s have provide historic margins. Long-term, management has emphasized that GPUs will be accretive and above the corporate average (see paragraph below). With that said, for this report, AMD is expected to report an expansion in adjusted operating margins from 22% last quarter to 25% this quarter due to EPYC CPUs helping product mix. If reported, it will mark the highest adjusted operating margin in two years.
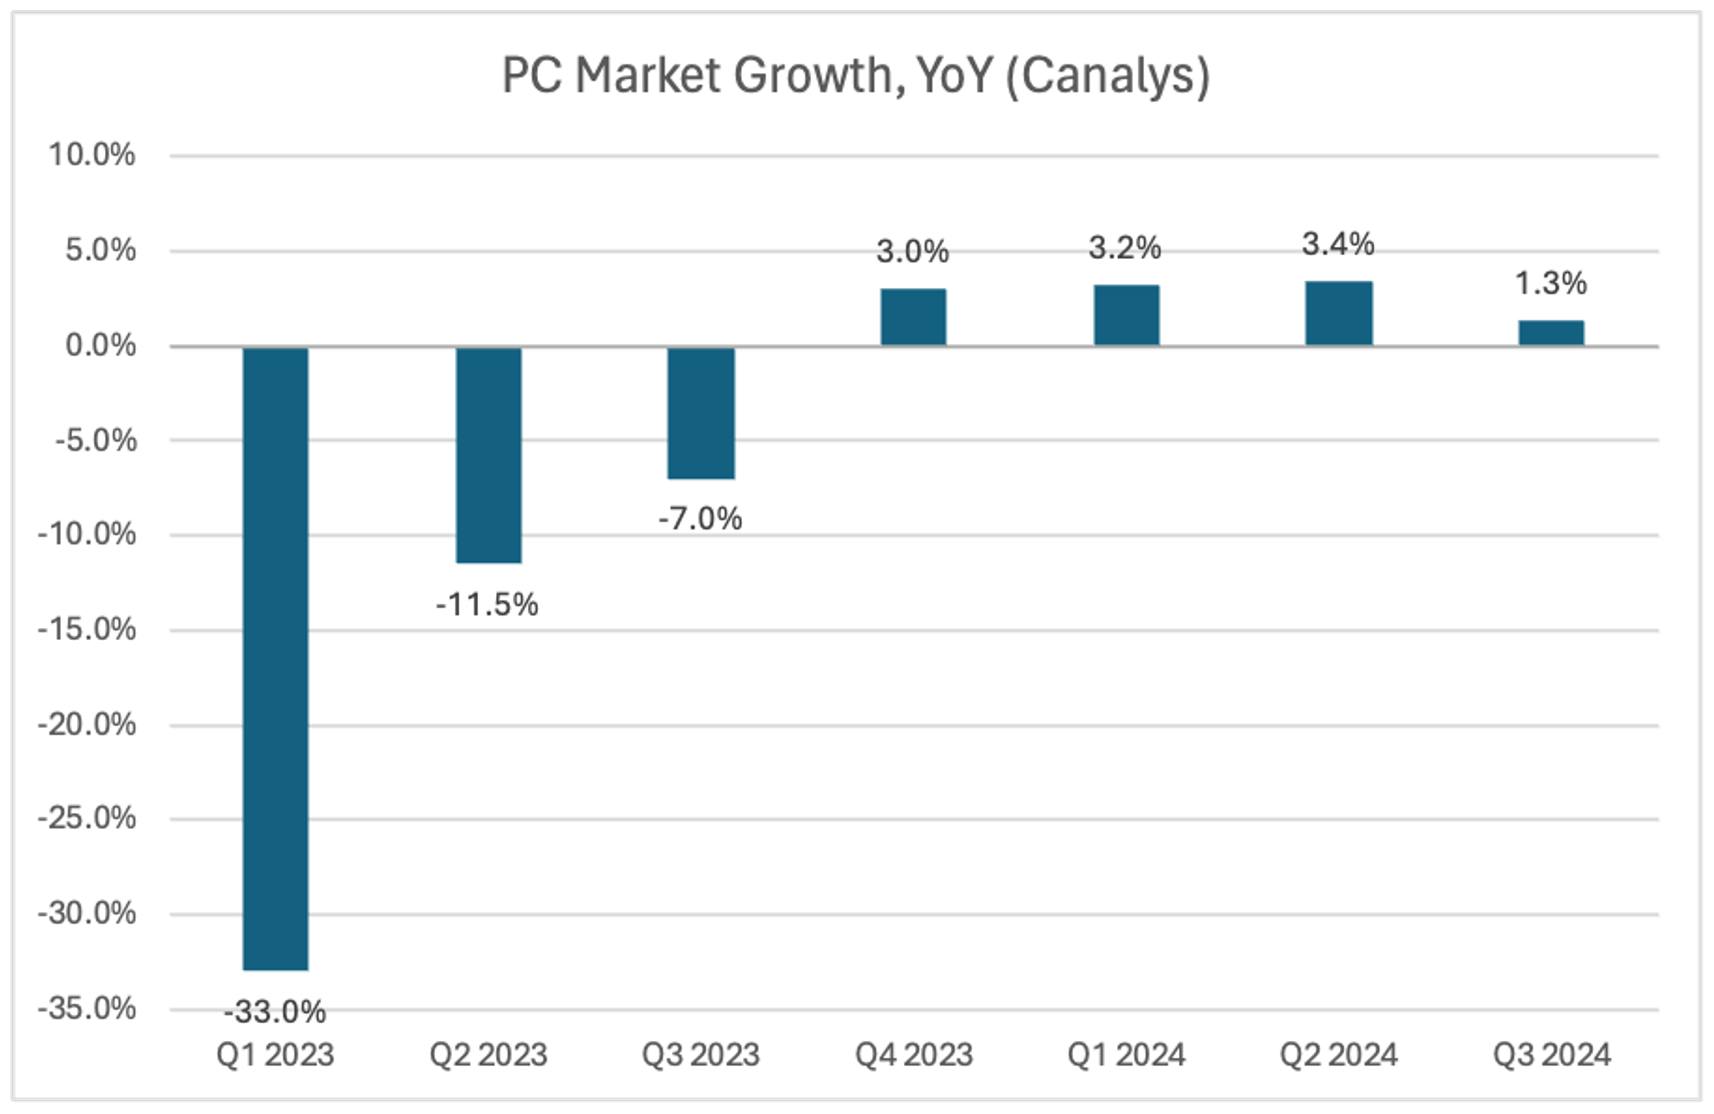
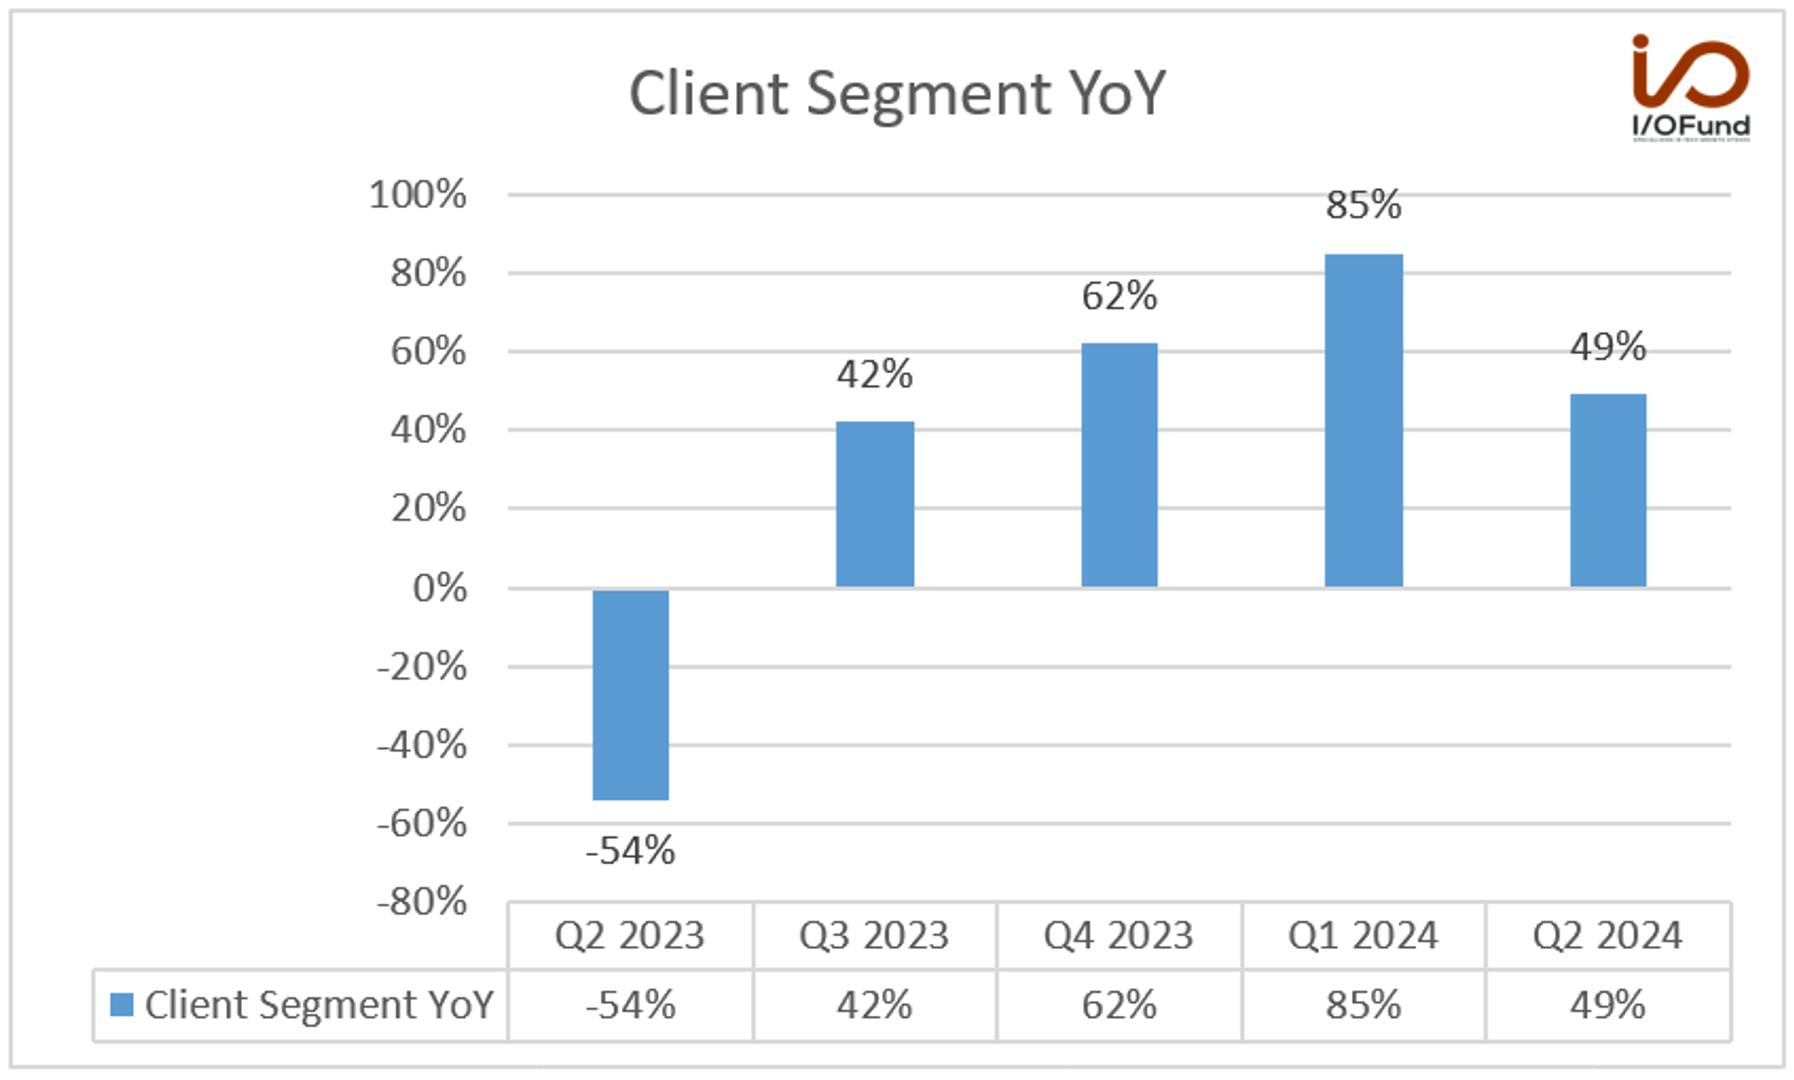
The third point to consider going into tomorrow’s report, is that it’s widely expected that client-facing semiconductor segments will be softer than expected this quarter. We’ve seen evidence of this in ASML, Texas Instruments and ON Semi. For AMD, this refers to the company’s PC exposure. We covered in the webinar the PC data the I/O Fund is closely tracking, which shows Q3 being meaningfully softer than expected, and that ultimately PCs will miss the 2024 estimates that industry analysts had going into this year. Last quarter, Client revenue was $1.492 billion, up 49% YoY and up 9% QoQ. Management stated at the time: “In summary, we delivered strong second quarter results and are well positioned to grow revenue significantly in the second half of the year, driven by our data center and client segments.”
There is QoQ growth in PCs from Q2, yet within the industry estimates for Q3 across the PC industry, YoY is negative. AMD has a strong CFO (which helps with guiding correctly) and the company incrementally stronger than its peers on PCs. There is a scenario where AMD squeaks by unscathed by PC softness and its peers do not, as the company recently released the Zen 5 architecture including the Ryzen AI 300 laptops with a neural processing unit (NPU) with 50 TOPS of AI performance, and the Ryzen 9000 series for desktops. Management was positive about this upcoming quarter, stating to expect “above-typical seasonality given the strength of our product launches.”
Canalys has the most optimistic estimates for PCs, whereas IDC and Gartner are negative on a YoY basis at (-2.4%) and (-1.3%) respectively.
Revenue
Revenue is expected to accelerate in the coming quarters, driven by strong demand for data center CPUs and GPUs, coupled with the expected rebound in the Client segment.
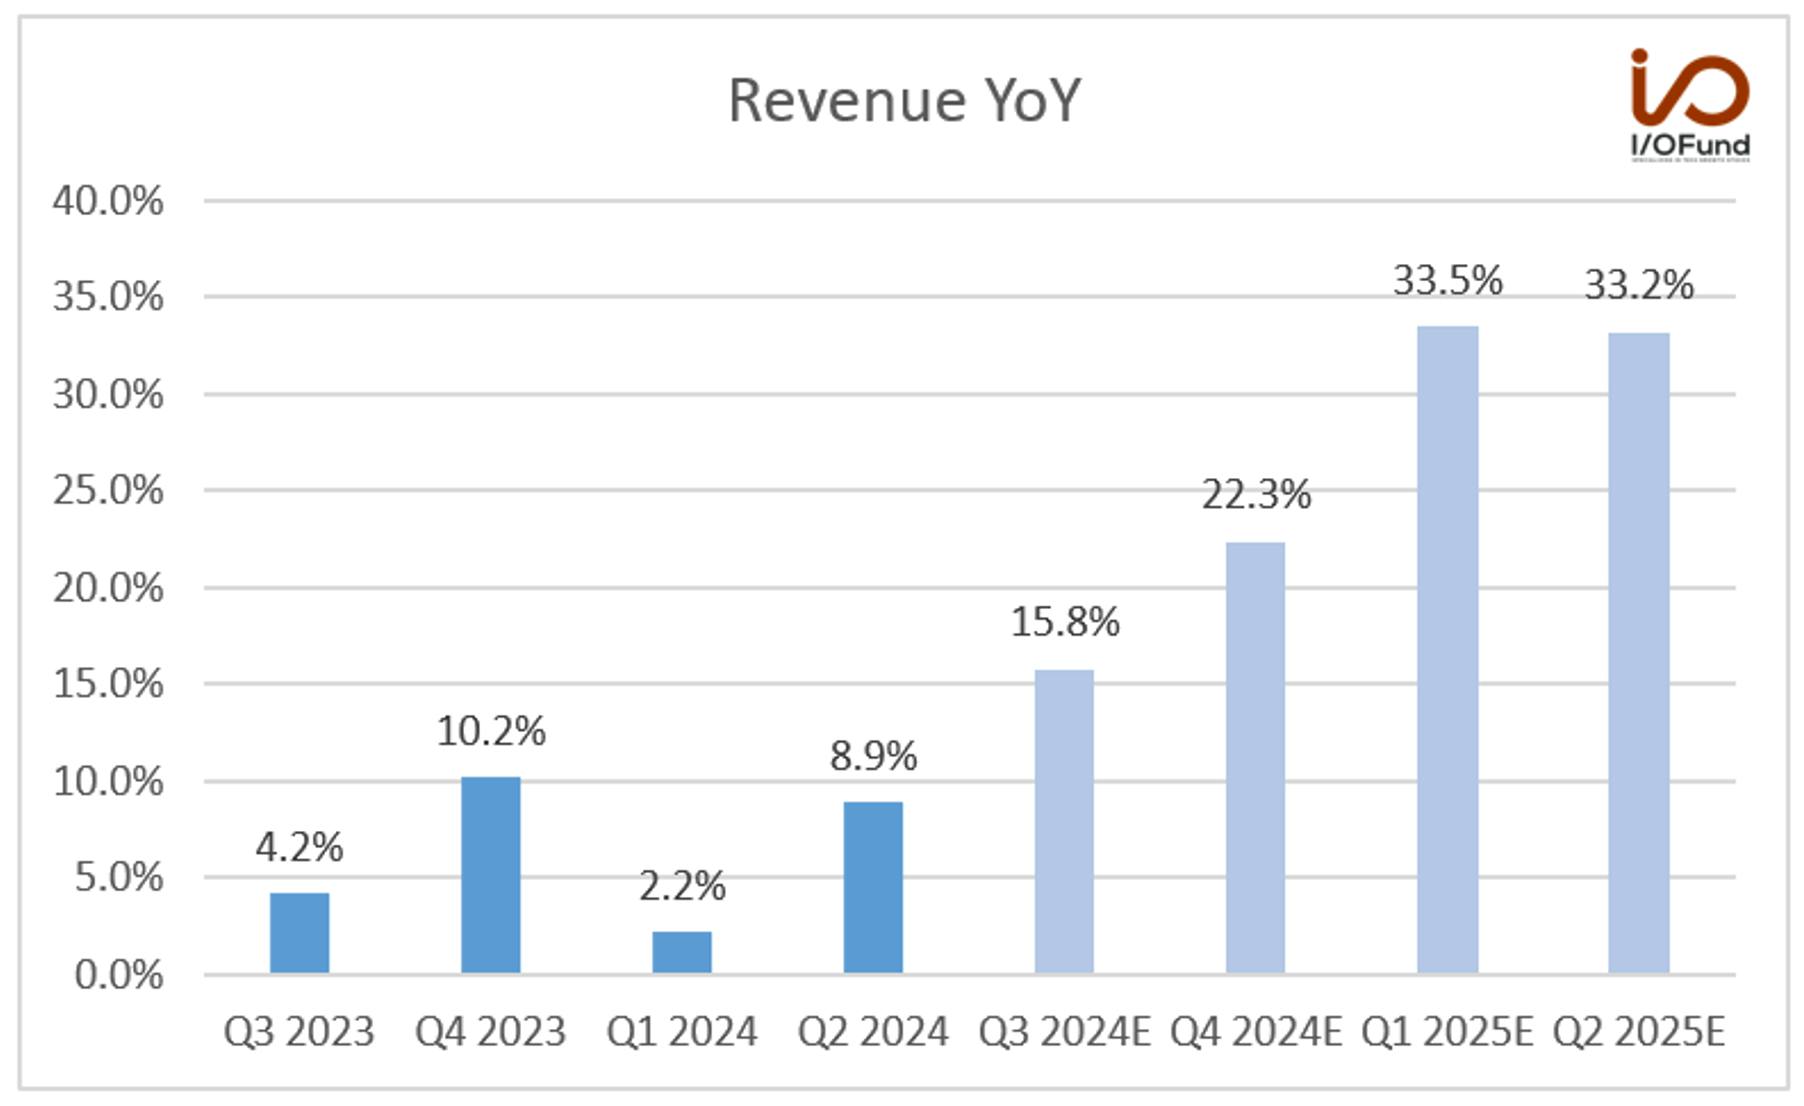
Analysts expect Q3 revenue to grow 15.8% YoY to $6.71 billion and accelerate to 22.3% in Q4. Revenue is expected to further accelerate to 33.5% in Q1 2025.
Management revenue guide is $6.7 billion, representing YoY growth of 15.5% at the midpoint. This represents a 6.6-point acceleration from 8.9% growth to $5.84 billion in Q2.
Lisa Su said in the Q2 earnings call, “We delivered strong second quarter results and are well positioned to grow revenue significantly in the second half of the year, driven by our data center and client segments. Our data center GPU business is on a steep growth trajectory as shipments ramp across an expanding set of customers. We're also seeing strong demand for our next generation Zen 5 EPYC and Ryzen processors that deliver leadership performance and efficiency in both data center and client workloads.”
Analysts expect 2024 revenue to grow 12.9% YoY to $25.61 billion and accelerate to 28.3% growth in 2025.
2026 revenue is expected to grow 19.9% YoY to $39.38 billion.
Margins:
AMD’s margins are benefiting from a higher mix of data center revenue. This quarter is expected to report the highest adjusted operating margin in two years.
Q2 gross margin was 49%, compared to 46% last year. Adjusted gross margin improved to 53% from 50% in the same period last year, helped by a higher portion of data center revenue. Management guide for Q3 is 53.5%, up from 51% in Q3 2023.
Q2 adjusted operating margin was 22%, compared to 20% in the same period last year. Operating expenses increased 15% YoY to $1.8 billion due to higher R&D expenses required to address AI growth. Management guide for Q3 is 25%, up from 22% in Q3 2023.
Q2 net income was $265 million or 5% of revenue compared to $27 million or 1% of revenue in Q2 2023. Adjusted net income was $1.13 billion or 19% of revenue compared to $948 million or 18% of revenue in the same period last year.
EPS
EPS is expected to grow significantly in the coming quarters.
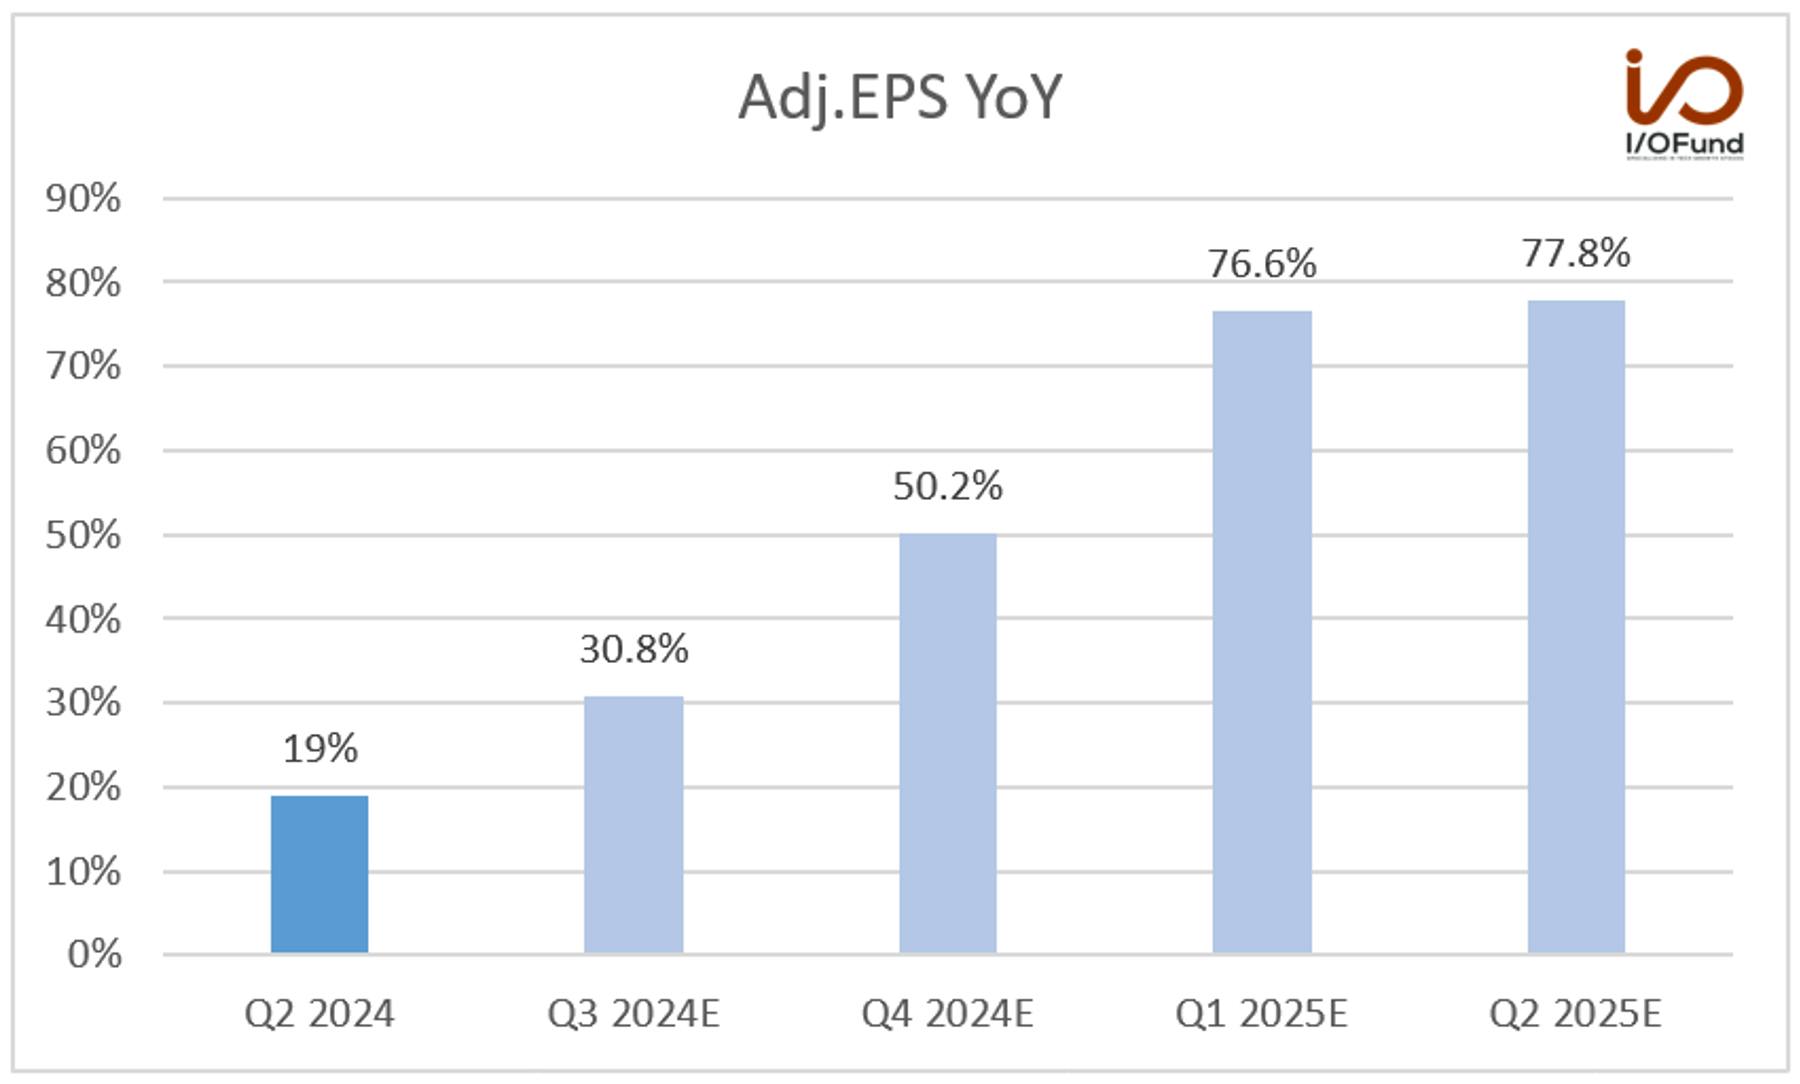
Analysts expect Q3 adjusted EPS to grow 30.8% YoY to $0.92, by 50.2% to $1.16 in Q4, and by 76.6% to $1.09 in Q1 2025.
Analysts expect 2024 adjusted EPS to grow 27.9% YoY to $3.39 and accelerate to 59.7% growth to $5.41 in 2025.
Analysts expect 2026 adjusted EPS to grow 36% YoY to $7.36.
Cash Flow and Balance Sheet
The company has increasing cash flows with room for improvement. At its peak in 2021, AMD reported over 25% cash flow margins.
Q2 operating cash flow was $593 million or 10% of revenue compared to 7% in Q2 2023.
Free cash flow was $439 million or 8% of revenue compared to 5% in Q2 2023.
Inventories were $4.99 billion, compared to $4.65 billion in Q1. They were up primarily due to the continued ramp-up of a data center GPU product.
Cash and short-term investments were $5.34 billion, and debt of $1.72 billion, compared to $6.04 billion and $2.47 billion in Q1. The company repaid $750 million in debt that matured in June with existing cash. It repurchased shares worth $352 million, with $5.2 billion of share authorization remaining.
The company completed the Silo AI acquisition in August for about $665 million in cash. AMD also announced the acquisition of ZT Systems for $4.9 billion, which will close in the second half.
Segments
Data Center revenue grew 115% YoY and 21% QoQ to $2.83 billion. The company reported record data center revenue in Q2, accounting for 49% of revenue. The company witnessed strong demand for AMD Instinct GPUs and double-digit EPYC server revenue growth. Data Center is expected to continue to be a major driver of top-line growth in the second half of the year. Data Center’s operating margin was 26% compared to 11% in the same period last year.
Client segment revenue grew by 49% YoY and 9% QoQ to $1.49 billion. It was primarily helped by strong demand for Ryzen processors and initial shipments of the next-generation Zen 5 processors. The client segment is expected to grow sequentially in Q3, and management said in the Q2 earnings call that the customer response for the new Ryzen processors was strong, and it is expected to capture additional revenue market share (see below). Operating margin was 6% compared to (-7%) in the same period last year.
The gaming segment continues to struggle due to soft demand. Revenue declined by (-59%) YoY and (-30%) sequentially to $648 million. Management expects gaming segment revenue to decline double digits sequentially in Q3. “Semi-custom demand remains soft, as we are now in the fifth-year of the console cycle and we expect sales to be lower in the second half of the year compared to the first half.” The operating margin was 12% compared to 14% in Q2 2023.
Embedded segment revenue declined by (-41%) YoY and was up 2% sequentially to $861 million. Management observed initial signs of improving order trends and expect embedded revenue to gradually recover in the second half of the year, with revenue expected to be up sequentially in Q3. Operating margin was 40% compared to 52% in the same period last year.
Other Key Points
AI Revenue
AMD’s AI accelerator, the MI300, is the fastest-ramping product in AMD’s history. The company reported over $1 billion in MI300 revenue in Q2. Management expects MI300 revenue to ramp in Q3 and Q4. During Q2 results, the company raised the data center GPU guide from $4 billion to $4.5 billion for the year 2024. The company also cited in the earnings call that Microsoft was the first hyperscaler to announce the general availability of MI300X instances.
“Turning to our data center AI business, we delivered our third straight quarter of record data center GPU revenue with MI300 quarterly revenue exceeding $1 billion for the first time. Microsoft expanded their use of MI300X Accelerators to power GPT-4 Turbo and multiple co-pilot services including Microsoft 365 Chat, Word, and Teams. Microsoft also became the first large hyperscaler to announce general availability of public MI300X instances in the quarter.”
Strong Product Roadmap
The company announced earlier this year its expanded AMD Instinct accelerator roadmap and annual cadence for chip release. During the recent Advancing AI Event, the company also confirmed that MI325X chips are expected to be shipped in Q4 2024 and the launch of MI350 chips in the second half of next year.
Lisa Su said in the Q2 earnings call, “Looking ahead from a roadmap perspective, we are accelerating and expanding our Instinct roadmap to deliver an annual cadence of AI accelerators, starting with the launch of MI325X later this year. MI325X leverages the same infrastructure as MI300 and extends our generative AI performance leadership by offering twice the memory capacity and 1.3 times more peak compute performance than competitive offerings. We plan to follow MI325X with the MI350 series in 2025 based on the new CDNA 4 architecture, which is on track to deliver a 35x increase in performance compared to CDNA 3. And our MI400 series powered by the CDNA “Next” architecture is making great progress in development and is scheduled to launch in 2026.”
Lisa Su predicts that AI Data Center Accelerators TAM to reach $500 billion by 2028 growing at a CAGR of 60% from $45 billion in 2023, compared to the earlier prediction last December of reaching $400 billion in 2027. She also highlighted the strong MI300X performance during the Advancing AI Event. “If you look today at MI300x performance, we have more than doubled our inferencing performance and significantly improved our training performance on the most popular models. Today, over 1 million models run seamlessly out of the box on Instinct, and that's more than 3x the number when we launched in December.”
She further pointed out, “MI300X consistently outperforms the competition, which is H100 in inferencing. So, for example, using Llama 3.1 405B, which is one of the most newest and demanding models out there, MI300 outperforms H100 with the latest optimizations by up to 30% across a wide variety of use cases.”
I/O Fund note: It would be stronger to benchmark the MI300X against the H200s but the competition in releases is likely to become tighter with each generation. The MI325 is due out this quarter, and thus AMD is about two quarters behind Nvidia’s H200.
AI Software
AMD completed the acquisition of Silo AI in August. Silo AI specializes in large language model development, which will further enhance AMD's AI inference and training tools. The acquisition will also help to tap the talent pool of engineers and scientists of Silo AI who have used AMD hardware and provide customized AI solutions to its clients.
AMD announced in August that it would acquire ZT Systems for $4.9 billion. The deal is expected to boost data center AI solutions. Once the deal closes, AMD plans to sell the ZT Systems manufacturing business. The acquisition is expected to close in the first half of 2025 and be accretive on a non-GAAP basis by the end of 2025.
AI PCs and Zen 5 EPYC Processors
At the Advancing AI Event, Lisa Su discussed the success of EYPC CPUs since their launch in 2017. She pointed out that “EYPC has become the CPU of choice for the modern data center.” The cloud providers offer more than 950 EPYC instances, and on the enterprise side, larger server OEMS offer over 350 EPYC platforms, increasing the company’s serverCPU market share to 34%.
Recently, AMD launched the 5th Gen AMD EYPC CPUs, formerly codenamed Turin. They are suited for cloud, enterprise, and AI use cases. They use the advanced 3nm/4nm process technology. The new Zen 5 core architecture, provides up to 17% better instructions per clock (IPC) for enterprise and cloud workloads and up to 37% higher IPC in AI and high-performance computing (HPC) compared to Zen 4 architecture.
During the Q2 earnings call, Lisa Su also said that the Client segment is also expected to do well in the second half of the year along with Data Center segment. It is expected to be above seasonal due to the launch of new products. The new Ryzen AI 300 laptops and the Ryzen 9000 series for desktops are powered by the 5th generation of the Zen architecture. The Ryzen AI 300 laptop has a XDNA 2 neural processing unit (NPU) that is designed for Microsoft Copilot+ AI software. This will deliver 50 TOPS of AI performance, exceeding Apple’s M4.
“We are launching Zen 5 desktops and notebooks with volume ramping in the third quarter. And that’s the primary reason that we see above-seasonal. The AI PC element is certainly 1 element of that, but there is just the overall refresh. Usually, desktop launches going into a third quarter are good for us, and we feel that the products are very well positioned. So those are the primary reasons.”
Note on GPU Margins:
It’s prudent to make a note that another area where AMD is not keeping pace with Nvidia is pricing power, leading to GPU margins that are currently below the corporate average. Here was a statement from management when questioned on the margins last quarter:
“Yes. On your second question about the profitability, first our team has done a tremendous job to ramp the product MI300. It is a very complex product. So we ramped it successfully. At the same time, the team also started to implement operational optimization to continue to improve gross margin. So we continue to see the gross margin improvement. Over time, in the longer term, we do believe gross margin will be accretive to corporate average.”
Valuation
The company trades at a P/E ratio of 185.5 and a forward P/E ratio of 44.9.
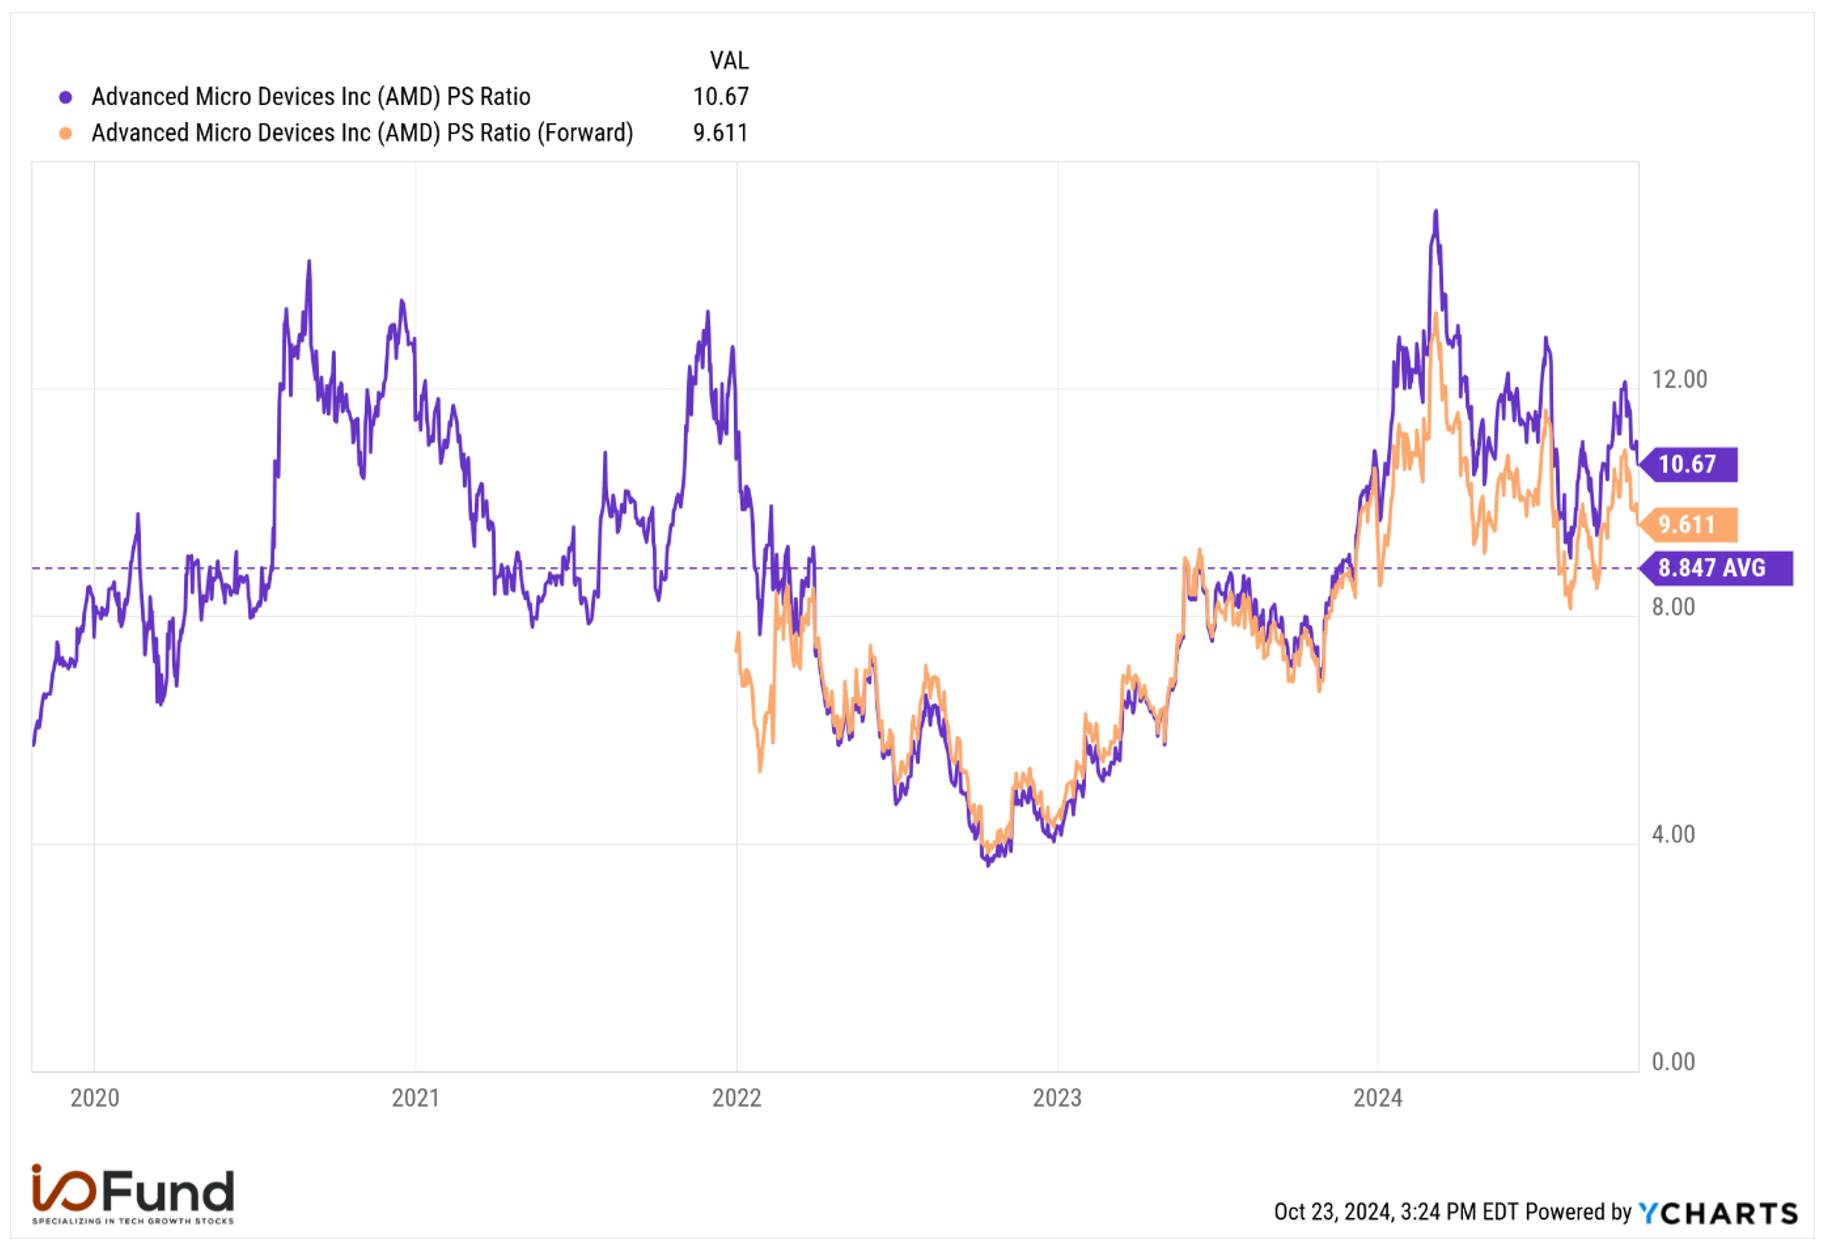
P/S ratio is 11.5 compared to the five-year average of 8.6. The forward P/S is 10 and the 1-year forward is 7.8.
Conclusion
Fundamentally, AMD is quite strong due to the continued strength in CPUs, the ongoing growth in GPUs, and the expected rebound in the Client Segment. We feel AMD is a win-win for our portfolio. Should the company beat, we will participate. If the company misses or something more broad weighs on the company (such as tariffs on semiconductors) then we will gladly buy shares lower.
We like Lisa Su reiterating the 2027 time frame for a $400B TAM, and increasing the estimate to $500B the following year for 2028. We will match that timeline and say we hope to see AMD be a leader in the market and in our portfolio by 2027-2028. CDNA 4 architecture is due out in 2025-2026, and is the most likely catalyst that I see today to narrow the product road map with Nvidia.
Royston Roche, Equity Analyst at the I/O Fund, contributed to this article. Beth Kindig, Lead Tech Analyst, contributed to this article.
Coinbase will release its Q3 2024 results on 30th October. Analysts expect Q3 revenue to grow 86.1% YoY to $1.25 billion and GAAP EPS of $0.38. Management has guided Subscription and Services revenue in the range of $530 million to $600 million, representing YoY growth of 69% at the midpoint.
We entered Coinbase primarily based on technical analysis. Coinbase’s fundamentals are not a reliable indicator of future performance. Instead, asset prices and volatility in crypto are more important than traditional fundamentals.
Technical analysis shows a potential for a pullback, and if so, we will be watching $160 to $170 for our next potential tranche. Given the election is next week, anything can happen and if the setup changes and the stock does not pullback, then Advanced members will be updated in our weekly webinar as to the plan.
Revenue
The company’s revenue growth rate is expected to slow as it laps tough comps more often than a typical growth stock. By virtue of Bitcoin and crypto reaching a new high in March 2024, the company is expected to see negative growth of (-14.3%) the following year in the March quarter of 2025. The current estimates suggest a bottom in Q1 2025. Notably, on a sequential basis, revenue is expected to increase from Q3 2024 to Q2 2025.
Q2 revenue grew by 104.8% YoY to $1.45 billion.
Analysts expect Q3 revenue to grow 86.1% YoY to $1.25 billion and 41.8% YoY to $1.35 billion in Q4.
Analysts expect 2024 revenue to grow 83.1% YoY to $5.69 billion and 2025 revenue to grow 3.3% YoY to $5.88 billion.
Revenue is expected to decline by (-7.2%) YoY to $5.45 billion in 2026. Analysts shy away from predicting too much growth in either direction in the next few years, which is why technical analysis matters quite a bit with Coinbase.
Margins
Margins have widely fluctuated with revenue. The company also implemented an accounting change in Q1 2024, wherein they will report the fair value of their crypto assets. This means that the company will report unrealized profits or losses based on the crypto prices at the end of the quarter.
Q2 operating margin was 23.7% compared to (-10.4%) in the same period last year. Operating expenses increased 26% QoQ to $1.1 billion due to unrealized losses in Q2 compared to gains in Q1 and higher marketing and policy spending.
Technology and administrative expenses are expected to increase in Q3 due to uneven stock-based compensation recognition, while marketing expenses will increase due to increased online marketing spending.
Management stated, “We expect Q3 transaction expenses will be in the mid-teens as a percentage of net revenue. We expect technology & development and general & administrative expenses to increase Q/Q to $700-$750 million, largely driven by the non-linear expense recognition of our stock-based compensation.
Finally, we expect sales and marketing expenses to increase Q/Q to $160-$210 million, primarily driven by higher variable digital marketing.” The company also plans to increase its headcount in the second half of the year to support product and international expansion.
Net income was $36.1 million or 2.5% of revenue (includes $319 million in pre-tax crypto assets losses vast majority of which were unrealized as crypto prices were lower at the end of Q2 compared to Q1) compared to a net loss of (-$97.6 million) or (-13.8%) of revenue last year.
Adjusted EBITDA was $595.55 million or 41.1% of revenue compared to $188.73 million or 26.7% of revenue in the same period last year.
EPS
EPS has been lumpy in the past as discussed in the above paragraph. It is expected to increase sequentially in the next few quarters.
Q2 GAAP EPS was $0.14 compared to (-$0.42) in the same period last year.
Analysts expect Q3 EPS to be $0.38 compared to (-$0.01) in the same period last year. Q4 EPS is expected to be down (-35.6%) YoY to $0.67.
2024 GAAP EPS is expected to grow 1413% YoY to $5.6 and down (-4.6%) YoY to $5.34 in 2025 due to high comps.
2026 EPS is expected to decline by (-36.5%) YoY to $3.39. This will be highly dependent on crypto’s performance, however, and the subsequent trading volume.
Cash Flow and Balance Sheet
The company is generating strong cash flows. Coinbase’s cash flows have seen a remarkable turnaround, from (-51.6%) in 2022 to 27.7% in 2023.
Free cash flow was $484.2 million or 33.4% of revenue compared to $151.1 million or 21.4% of revenue in the same period last year.
Cash was $7.23 billion, and debt of $4.23 billion, compared to $6.7 billion and $4.23 billion in Q1. The company issued $1.3 billion of convertible notes in Q1 and plans to use the net proceeds of $1.1 billion to repay the outstanding debt at or before maturity, depending on market prices. Management also clarified in the earnings call that the other reasons for maintaining large cash balances were to support the ETF launches and for potential investment opportunities, both organic and inorganic.
Alesia Haas, CFO, answered the analyst's question on the cash build-up. “Yes, we're really pleased with the balance sheet strength. We are using cash, as we've mentioned in our prime financing business. A large amount of that cash was used to support the ETF launches in Q1 and Q2 with the Bitcoin ETF and now hopefully be a Ethereum ETF where you can see a lot of day-to-day or week-to-week volatility of those loan balances. We did grow prime financing fees within the quarter. And so you can see while the balance at the end of quarter was down versus of Q2. We saw growth intra-quarter for those balances. So using our cash to support our products is a primary use case for us.”
Key Segments:
Coinbase’s Q2 transaction revenue grew 138.7% YoY and down (-27%) QoQ to $781 million. Crypto asset volatility declined approximately (-13%) compared to the Q1 average, resulting in softer crypto spot market trading in Q2 compared to Q1.
Within Transaction revenue, Consumer is the main driver at $664.8 million, up 130% YoY, compared to Institutional revenue of $63.6 million, up 272% YoY.
Base and payment-related revenue has been reclassified to other transaction revenue. It grew 149% YoY to $52.5 million. Improved efficiency and reduced fees led to the number of base transactions growing 300% sequentially.
Management stated they saw $210 million in transaction volume for July, pointing toward mid-$600 million for transaction revenue. This compares to $110 million in July of last year.
Q2 subscription and services revenue grew by 78.6% YoY to $599 million. This is an all-time high for Coinbase in this segment and helps to diversify from being entirely dependent on transaction revenue. The growth was due to stablecoin revenue and blockchain rewards revenue; it also benefitted from a one-time blockchain validator reward of $8 million. Management guide for Q3 is $530 million to $600 million, representing a YoY growth of 69% at the midpoint.
Stablecoin revenue grew by 58.8% YoY to $240.4 million. This was primarily helped by higher average USDC on-platform balances and higher average USDC market capitalization.
Blockchain rewards revenue grew by 111.3% YoY to $185.1 million. This segment opens an exciting opportunity as interest rates go lower. Staking yields are not determined by FOMC policy; instead, by the participation rate of coins being staked. As demand increases for crypto, yields will increase to entice more coins to be staked. As a non-correlated yield to traditional financial instruments, which are mostly tied to central bank policy, this creates an opportunity for portfolios to diversify incomes in an interesting way, and adoption should increase as rates go lower.
Interest and finance fee income grew by 33.7% YoY to $69.4 million. This segment is tied to interest rates, Coinbase offers loans against the coins being held in-house. This is unlikely to be sustained now that the FED has lowered rates.
Custodial fee revenue grew by 102.9% YoY to $34.5 million.
Other subscriptions and services revenue grew by 153.1% YoY to $69.6 million.
Other Key Points to Watch:
Regulatory Changes
Improving regulatory clarity is another catalyst for the stock in the near term. With the elections around the corner, both candidates show support for crypto. Management was also optimistic about the regulatory clarity during Q2 results.
“In Q2, we made extraordinary progress towards driving regulatory clarity in the US and around the world. Crypto legislation has become a mainstream issue in the US, garnering bipartisan support, and there is real energy within both the House and the Senate to pass meaningful legislation. We continue to support Stand With Crypto – which now has over 1.3 million advocates – and will continue to invest in policy initiatives throughout the 2024 election cycle to help elect pro-crypto candidates. The approval and launch of the ETH ETFs was another huge step forward for regulatory clarity as it confirmed what we have been saying for years: ETH is not a security. Outside the US, we saw USDC become the first stablecoin to achieve compliance with the European Union's landmark Markets in Crypto-Assets (MiCA) regulatory framework.”
Institutional Adoption
For institutions, there is a product called Coinbase Prime. This full-service prime brokerage platform facilitates trades and custodian services for large institutions. Management has stated that institutions have maybe 1% to 3% of their funds in crypto. This is a low allocation, which has a lot of potential for growth. Management has mentioned that lack of regulatory clarity is the main hindrance for more institutional adoption.
Brian Armstrong, Co-founder and CEO, said in the Q2 earnings call, “90% of institutional investors say regulatory clarity would boost their confidence in investing more in crypto. For these reasons, Coinbase will continue to push for clear rules in the courts, in Congress and in the November elections.”
He further answered in Q&A, “Well, I think you're right that the lack of regulatory clarity is probably the biggest blocker for institutions to put more and more funds into crypto. We have a huge number of them as clients in Coinbase Prime, our institutional product. And when I meet with them, they'll often say, we've got 1% or 2% or 3% of their funds in some portfolio, holding in crypto. And I asked them, what would it take for it to be 10, 20, 30, and they all say regulatory clarity.”
Derivatives
Coinbase has primarily been a spot trading exchange, where crypto traders buy the asset at current market prices. In November of 2023, Coinbase added derivatives trading, which will help the exchange participate in a higher percentage of trading activity. Derivatives trading is roughly 2/3 of all crypto trading compared to spot trading at 1/3.
Management mentioned during the Q2 earnings call that the company’s focus has been on adding users and growing market share. This has included additional contracts and margin trading for crypto futures. The derivatives market is expected to be an important growth market in the future.
Valuation
Coinbase is trading at a P/E ratio of 37.7 and a forward P/E ratio of 38.9. P/S ratio is 12.3 and a forward P/S ratio of 9.3. It is trading above its average P/S ratio of 8.5.
Technical Analysis
By Portfolio Manager Knox Ridley
Like Bitcoin, Coinbase has been in a correction since March of 2024. Based on the lack of a clear trend, and on-going overlap, there are numerous interpretations of the current price action. Below, I present the three most likely, along with what levels need to hold/break to confirm each.
Green – The correction that started in March is a 4th wave that ended in early October. The final 5th wave is tracing a large degree 3 wave uptrend (A,B,C). This means that the path higher will not be a typical, direct move, but an overlapping push higher. If this is playing out, we will see a correction start soon, which will hold over $170 – $160. If this happens, the general target for the next leg higher will be around $280.
Blue – We will see a gap higher on heavy volume that breaks above $235. This means that the 4th wave correction ended in August and we are further along in the final swing higher. We should push toward the $280 region before seeing our first larger correction within this new uptrend.
Red – We break below $170 – $160. This will indicate that we are still in the 4th wave, which will be targeting $128 – $95.
Conclusion
Coinbase’s move into the derivatives market and its role as a trusted custodian for institutional investors in the crypto space, will continue to entice institutions to its platform. The regulatory clarity is another catalyst to watch in the near term. We continue to successfully navigate the crypto volatility by using technical analysis.
Royston Roche, Equity Analyst at the I/O Fund, contributed to this article.
Please note: The I/O Fund conducts research and draws conclusions for the Fund’s positions. We then share that information with our readers. This is not a guarantee of a stock’s performance. Please consult your personal financial advisor before buying any stock in the companies mentioned in this analysis.
This article was originally published on Forbes on Updated Oct 17, 2024, 09:02pm EDTForbesForbes on Updated Oct 17, 2024, 09:02pm EDT
Palantir has been one of the top-performing AI software stocks this year with a 156% YTD return, thanks to accelerating revenue growth and strong business momentum from its Artificial Intelligence Platform (AIP) released last year.
AIP sets Palantir apart from the rest of the SaaS universe, driving visible AI-related growth and acceleration in multiple different metrics – at this time, other leading AI favorites such as Snowflake or MongoDB can’t say the same. Outside of the cloud hyperscalers, Palantir is one of the rare few that sees AI drive both real returns for its business and real value for its customers due to AIP.
Below, I break down how Palantir’s AIP is putting it a step above peer Salesforce, MongoDB and Snowflake with visible AI growth, and its undeniable ‘secret sauce’.
Palantir’s AI Growth is Visible
AIP has driven tremendous growth for Palantir’s business since its release, with primary impacts arising in the commercial segment. A clear inflection point in Palantir’s growth is visible following AIP’s release, while other ‘AI’ cloud peers can’t say the same about AI-driven growth.
Palantir said that “US commercial continues to accelerate in Q2 2024 alongside [the] AIP revolution” with “unprecedented demand”, and the numbers to back this up:
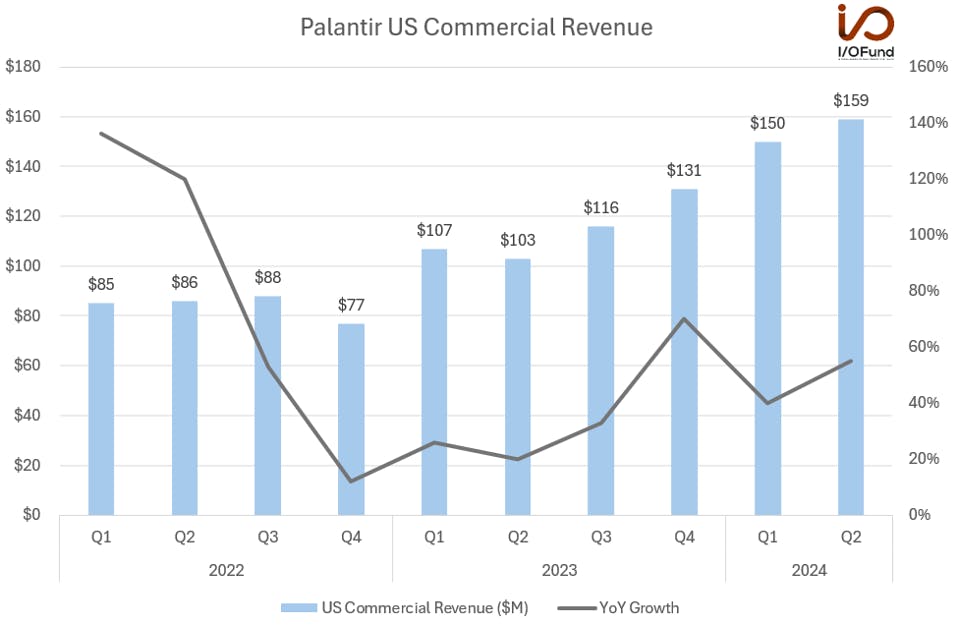
55% YoY revenue growth in US commercial to $159 million, accelerating from 40% YoY in Q1.
US Commercial revenue growth accelerated to 55% YoY in Q2 as revenue rose to $159 million.
Source: I/O Fund
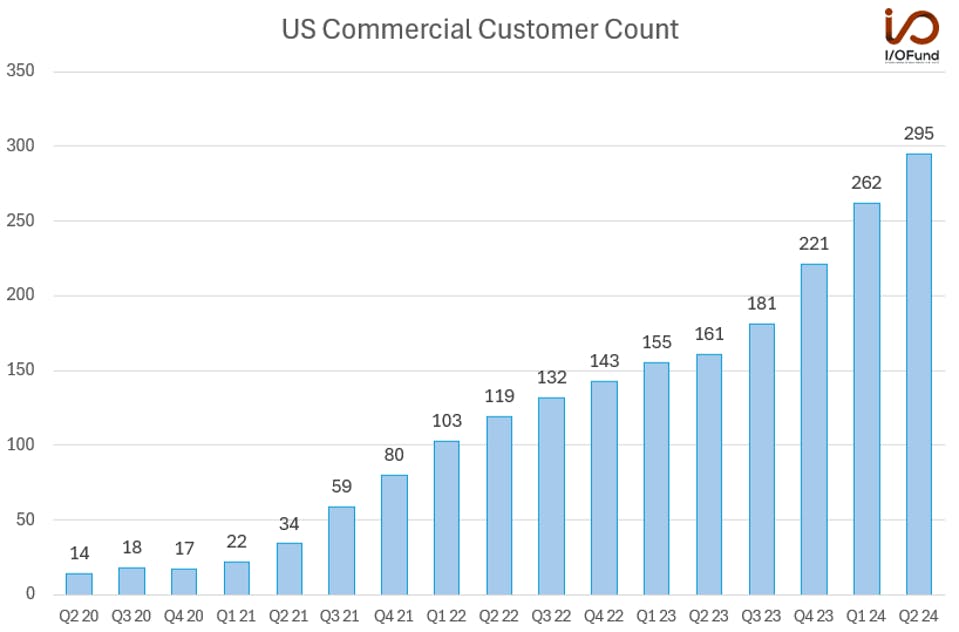
83% YoY growth in US commercial customers to 295 and 98% YoY growth in US commercial deals closed to 123.
103% YoY growth in US commercial remaining deal value and 152% YoY growth in US commercial total contract value to $262 million. Chief Revenue Officer Ryan Taylor explained that “one of the most notable indicators of our delivery is the volume of existing customers who are signing expansion deals, many of which are a direct result of AIP.”
Here’s what the growth in US commercial customers looks like:
Palantir's US Commercial customer growth has reaccelerated over the past few quarters thanks to AIP.
Source: I/O Fund
US commercial customer growth began to stagnate through late 2022 and early 2023, but following AIP’s release in Q2 2023, customer count re-accelerated. There is a clear inflection point from where QoQ customer additions were decelerating – from 12 net adds in Q1 2023 to six net adds in Q2 2023. Following the AIP-driven acceleration, net adds rose to 20 QoQ in Q3 2023, then 40 QoQ in Q4 2023.
This matches a similar acceleration in commercial customer growth as Palantir quickly became a market darling following its IPO, which was seen as a way to drive growth in the commercial sector. From Q4 2020 to Q4 2021, commercial customers grew nearly 5X. Now, as a stock market darling once more with a unique and unbeatable AI offering, Palantir is seeing commercial growth resume.
Sign up for I/O Fund's free newsletter with gains of up to 2600% because of Nvidia's epic run – Click hereClick hereClick here
Palantir is King of AI Among Cloud SaaS Stocks
Other leading cloud ‘AI’ stocks are struggling to put up AI-driven growth numbers like Palantir.
Salesforce reported 8% YoY revenue growth in Q2, decelerating from 11% YoY in Q1, as subscription revenue growth decelerated to 9% YoY, down from 12% YoY in Q1. Salesforce sees Q3 revenue growth of 7%, another deceleration. The full-year revenue growth of just 8% to 9% translates to the SaaS giant struggling to realize AI gains. Furthermore, Salesforce’s more AI-aligned offerings, MuleSoft and Tableau, decelerated sharply in Q2, from 27% YoY to 13% YoY for MuleSoft and 21% YoY to 11% YoY for Tableau.
MongoDB witnessed a much steeper deceleration in Q2, as Atlas and new workload wins struggled at the start of the year. In Q1, MongoDB reported 22% YoY growth with Atlas growth of 32% YoY, and this decelerated to 13% YoY revenue growth in Q2 as Atlas declined 5 percentage points QoQ to 27% YoY. For the full year, MongoDB guided to about 14.6% YoY growth in Q2 as it slightly boosted its outlook, a steep deceleration from 31% YoY growth in fiscal 2024.
Snowflake’s product revenue growth decelerated from 34% YoY in Q1 to 30% YoY in Q2, and while this was ahead of its guidance by 3 percentage points, growth is set to decelerate further in Q3. Management guided for 22% YoY growth in product revenue for the third quarter, a steeper QoQ deceleration rate, with the full year product revenue guide of 26% YoY. Despite management saying that they see “great traction” in early stages of AI products, there’s no visible inflection or acceleration in growth.
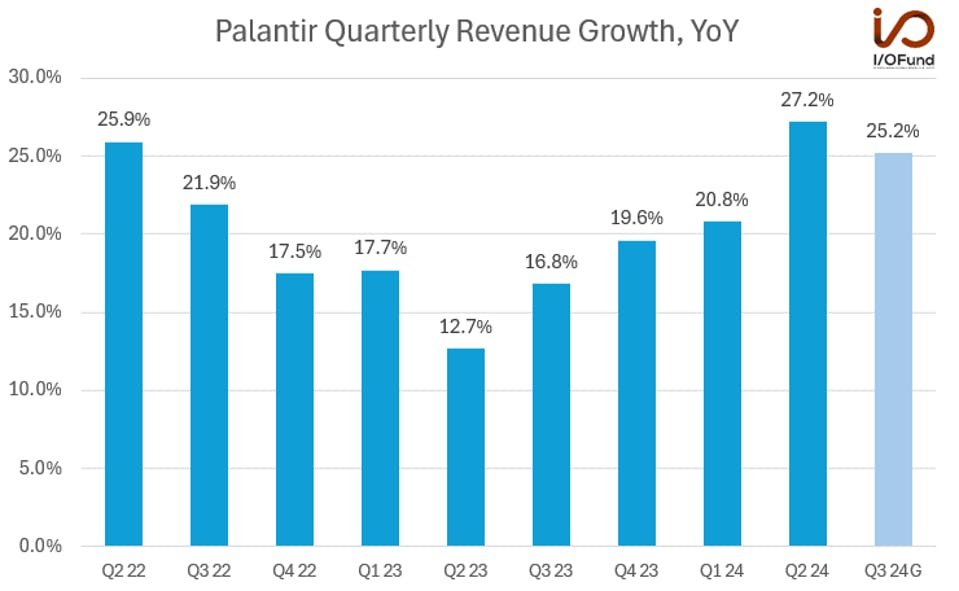
In sharp contrast, AIP has helped Palantir drive a significant topline acceleration over the past four quarters.
AIP's strong momentum has helped drive quarterly revenue growth to 27.2% YoY in Q2 2024, up from 12.7% in Q2 2023.
Source: I/O Fund
Palantir reported 27.2% YoY revenue growth in Q2, aided by strength in US commercial stemming from AIP as well as government revenue accelerating significantly. Palantir’s YoY revenue growth bottomed in Q2 2023 at 12.7%, the same quarter as AIP’s release, with revenue growth now 15 points higher. Despite guiding for a slight 2 percentage point deceleration in Q3 to 25.2% YoY growth, Palantir would only need to beat its guide by 1.5% to keep this revenue acceleration intact.
Fundamentally, what’s most critical for shares is maintaining a revenue growth rate above 20% for the foreseeable future – analysts currently estimate fiscal Q2 2025 to be the one quarter of the next eight with revenue growth just below that threshold. Given AIP’s strength just one year following its launch, with clear inflections in customer and revenue growth, it will be the telling sign of Palantir’s AI status if it can maintain these revenue growth rates as it scales.
Palantir’s AIP Separates it From the SaaS Universe
Palantir’s standout performance so far in 2024 against SaaS peers can be attributed to the success of AIP, which, at its core, is a comprehensive AI platform that lets enterprises lever Palantir’s AI and machine learning tools and harness the power of the latest large language models (LLMs) within Foundry and Gotham.
Gotham was the company’s first product and is built for government operatives in defense and intelligence sectors. The platform enables users to identify patterns hidden deep within datasets using semantic, temporal, geospatial and full-text analysis, with mixed reality capabilities to allow operations to be run in virtual environment as well. Graph allows data objects to be seen as nodes and edges, while Map track geo-located objects, run searches and display key data.
Foundry was built for the commercial sector, and is centered around the three-layer Ontology Core, integrating semantic, kinetic, and dynamic layers for real-time data analytics and AI-powered decision making capabilities:
The Semantic layer brings volumes of data into one place, and lets users generate detailed object properties
The Kinetic layer brings operations and business behaviors into a real-time graph linked back to the Semantic layer, creating the basis for AI-driven analytics, real-time monitoring, identification of inefficiencies, and ability to optimize workflows
The Dynamic layer connects models to objects and actions, reasoning across both the Semantic and Kinetic layers for AI-powered automation and AI-driven decision making, alongside multi-step simulations with AI predictive analytics to explore possibilities of changing actions or events
AIP combines with Foundry’s data operations suite and Apollo’s autonomous software deployment capabilities as part of Palantir’s ‘AI Mesh’, providing enterprise and government customers with a full suite of AI products from the web to mobile to the edge. With the Ontology, linking data and logic into an AI-accessible environment, Palantir brings generative AI directly to an enterprise’s operations, delivering real-time AI-driven operational decision-making abilities.
Palantir describes Gotham and Foundry as the “ability to construct a model of the real world from countless data points.” AIP links this all together, and this is what separates Palantir as a standout in the SaaS space — outside of the cloud hyperscalers, Palantir is one of the rare few that sees AI drive both real returns for its business and real value for its customers due to AIP.
What further sets AIP apart is its scalability, interoperability and versatility. With AI Mesh, organizations can integrate AI across different operations and applications, while its design facilitates interoperability with existing enterprise software and systems. AIP is also extremely versatile, having been successfully and seamlessly integrated into enterprises spanning a wide range of industries from tech to healthcare to aerospace, while still driving value to customers.
The uniqueness of Palantir’s AIP and value that it can quickly provide has driven growth for the company. CEO Alex Karp said in Q2 that “growth across the commercial and government markets has been driven by an unrelenting wave of demand from customers for artificial intelligence systems that go beyond the merely performative and academic.”
Essentially, there is constant strong demand for an applicable, scalable, versatile AI platform that can drive real-time results with an instant value-add for an organization. Chief Revenue Officer Ryan Taylor added that Q2’s “exceptional results are a reflection of a market that is quickly awakening to a reality that our customers have already known, we stand alone in our ability to deliver enterprise AI production impact at scale.”
Every Thursday at 4:30 pm Eastern, the I/O Fund team holds a webinar for premium members to discuss how to navigate the broad market, as well as various stock entries and exits. We offer trade alerts plus an automated hedging signal. The I/O Fund team is one of the only audited portfolios available to individual investors. Learn more here.Learn more hereLearn more here.
Government is Palantir’s Secret Sauce
While Palantir is undoubtedly seeing strong business momentum in the commercial sector, the government sector remains Palantir’s bread and butter, being that the government sector has funded the company and allowed it to aggressively invest in AIP while expanding margins, with a recent growth acceleration
In Q2, US government revenue accelerated to 24% YoY growth, up 12 percentage points from 12% YoY growth in Q1. Overall, government revenue growth was 23% YoY, up 7 percentage points from 16% YoY in Q1. Management noted that Palantir was “selected for several notable awards in Q2, which led to the strongest US government bookings quarter since 2022, reflecting the growing demand for our government software offerings.”
This included a production contract from the DoD, Chief Digital and Artificial Intelligence Office (CDAO) for an AI-enabled operating system for the DoD, with an initial $153 million order and additional awards for up to $480 million over a 5-year period.
The acceleration in the government segment aided overall revenue growth in the quarter, as the government continues to remain Palantir’s primary revenue source, accounting for nearly 55% of total revenue. This is why the government segment is vital for Palantir, and is its ‘secret sauce’ – these long-term, high-value government contracts provide consistent and recurring revenue and financial stability, allowing the company to venture and invest to scale AIP while expanding margins and increasing its profitability.
Conclusion
Palantir has been on a tear this year, and is outperforming major cloud competitors, thanks to the strength and uniqueness of its AIP offering. Palantir has the best of both worlds in government contracts and AI exposure, as well as accelerating enterprise AI adoption and strong customer and revenue growth.
The one caveat is Palantir’s valuation, at 34x FY24 revenue and 29x FY25 revenue, is increasingly challenging to sustain. In the past, the low 20x revenue multiple range has tended to be the level that even the industry’s leading SaaS names have struggled to break past over the last few years.
Given the outsized valuation, the I/O Fund is looking for a lower entry in Palantir before adding the stock to our portfolio. Join the I/O Fund’s next webinar on Thursday, October 24th where Knox Ridley, Technical Analyst, will discuss the firm’s buy zones and targets for AI leaders. Learn more here.
Please note: The I/O Fund conducts research and draws conclusions for the Fund’s positions. We then share that information with our readers. This is not a guarantee of a stock’s performance. Please consult your personal financial advisor before buying any stock in the companies mentioned in this analysis.
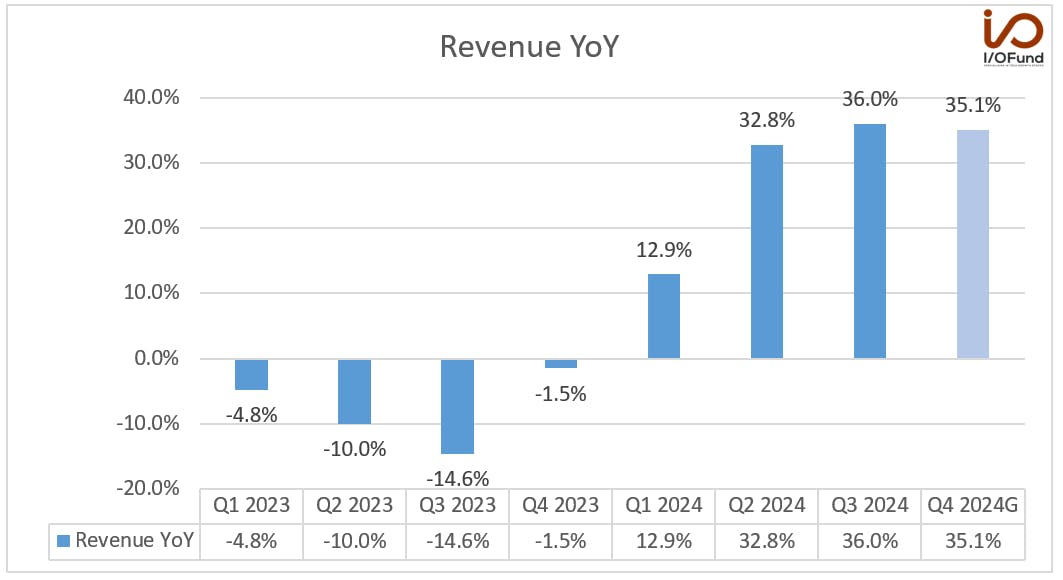
TSMC Q3 results beat across the board, helped by strong demand for AI chips. Revenue grew 36% YoY to $23.5 billion and beat the management guide of $22.4 billion to $23.2 billion. The bottom line was even stronger, as EPS grew by 50.4% YoY to $1.94, beating analysts’ estimates by 8.6%. Management also raised the full-year revenue guidance from above mid-20% to close to 30%, primarily due to the robust demand for AI chips.
Revenue
Q3 revenue grew by 36% YoY and 12.9% QoQ to $23.5 billion, beating the management guide of $22.4 billion to $23.2 billion. The strong revenue growth was primarily helped by demand for AI and smartphone chips.
Management guide for the next quarter is $26.1 billion to $26.9 billion, representing a YoY growth of 35.1% and 12.8% sequential growth at the mid-point.
Management raised the full-year revenue guidance from above mid-20% to close to 30%. By calculating the Q4 guide, the FY 2024 revenue is expected to grow 29.4% YoY to $89.69 billion in US dollar terms.
C.C. Wei, Vice Chairman and CEO, said in the earnings call, “Moving into fourth quarter, we expect our business to continue to be supported by strong demand for our leading-edge process technologies. We continue to observe extremely robust AI-related demand from our customers throughout the second half of 2024, leading to increasing overall capacity utilization rate for our leading-edge 3-nanometer and 5-nanometer process technologies.”
Due to the technological leadership, the company is able to capture robust demand for the most advanced AI chips. The revenue contribution from server AI processors is expected to triple this year and will account for a mid-teens percentage of 2024 revenue. “At TSMC, we define server AI processor as GPUs, AI accelerators, and CPUs performing training and inference functions, and do not include networking, edge, or on-device AI. We now forecast the revenue contribution from server AI processors to more than triple this year and account for mid-teens percentage of our total revenue in 2024.Supported by our technology leadership and broader customer base, we are well-positioned to capture the industry's growth opportunities. We now forecast our full-year revenue to increase by close to 30% in U.S. dollar terms.”
Margins
Margins continue to expand due to cost controls, economies of scale, and better price negotiation with customers.
Q3 gross margin was 57.8%, up from 54.3% in the same period last year and 53.2% in Q2. It beat the management guide of 53.5% to 55.5%. The strong gross margin was due to better capacity utilization and cost improvements.
Management has guided Q4 gross margin to increase 20 basis points sequentially to 58% at the midpoint helped by higher capacity utilization, partially offset by dilution from N3 ramp, higher electricity prices in Taiwan, and N5 to N3 tool conversion cost.
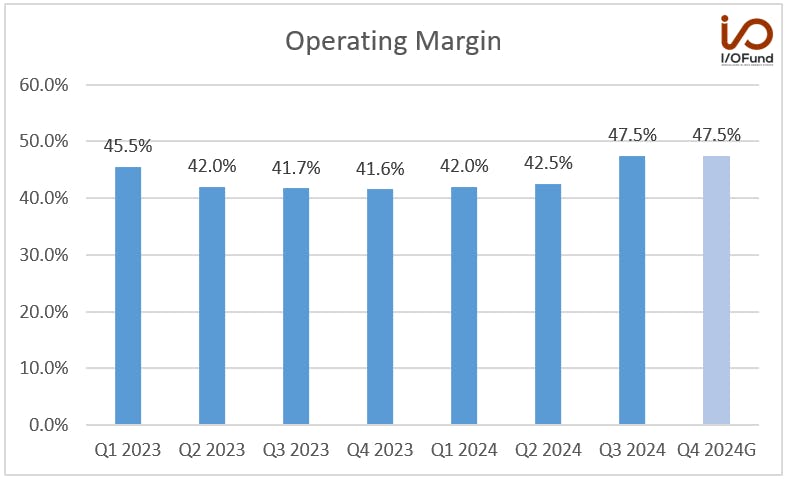
Operating margin improved to 47.5% from 41.7% in the same period last year and 42.5% in Q2 due to operating leverage. Management guide for Q4 is 47.5% at the midpoint.
Net income grew by 52.4% YoY to $10.06 billion or 42.8% of revenue compared to 38.6% in the same period last year and 36.8% in Q2.
EPS
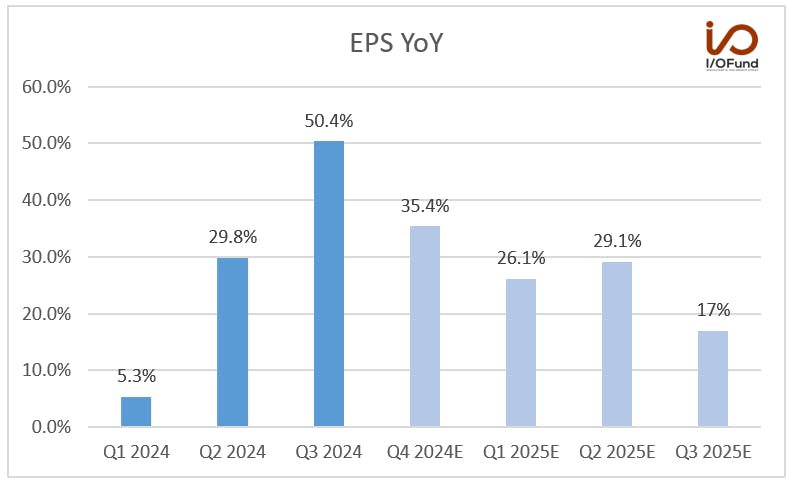
EPS grew by 50.4% YoY to $1.94, beating analysts’ estimates by 8.6% due to better capacity utilization, cost improvement and operating leverage.
Analysts expect Q4 EPS to grow 35.4% YoY to $1.95 and 26.1% YoY to $1.74 in Q1 2025.
EPS is expected to grow significantly. Analysts expect EPS to grow 26.8% YoY to $6.57 in 2024 and 29.2% YoY to $8.49 in 2025.
Cash Flows and Balance Sheet
The company’s financial stability is evident in its stable cash flow generation.
Q3 operating cash flow was $12.13 billion or 51.6% of revenue compared to $9.31 billion or 54% of revenue in the same period last year and 56.1% in Q2.
Free cash flow grew by 166% YoY to $5.72 billion or 24.4% of revenue compared to 12% of revenue in the same period last year and 25.5% of revenue in Q2. Capex was down (-9.9%) YoY to $6.4 billion.
Management expects capex to be slightly higher than $30 billion for 2024, revised down slightly from the previous guide of $30 billion to $32 billion. As the company continues to invest due to the expected strong AI growth, capex is likely to increase next year, and management mentioned that they will provide more details during the January earnings call.
Inventories were $9.26 billion compared to $8.39 billion in Q2. Inventory turnover days increased to 87 days from 83 days in Q2 due to the pre-build of N3 and N5 wafers.
Cash and marketable securities were $68.5 billion, and debt of $30.6 billion, compared to $63.05 billion and $30.4 billion in Q2.
Revenue by Platform
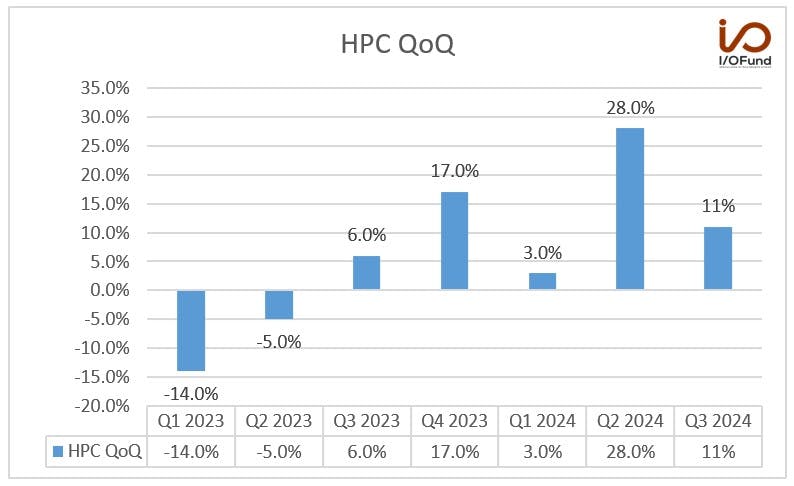
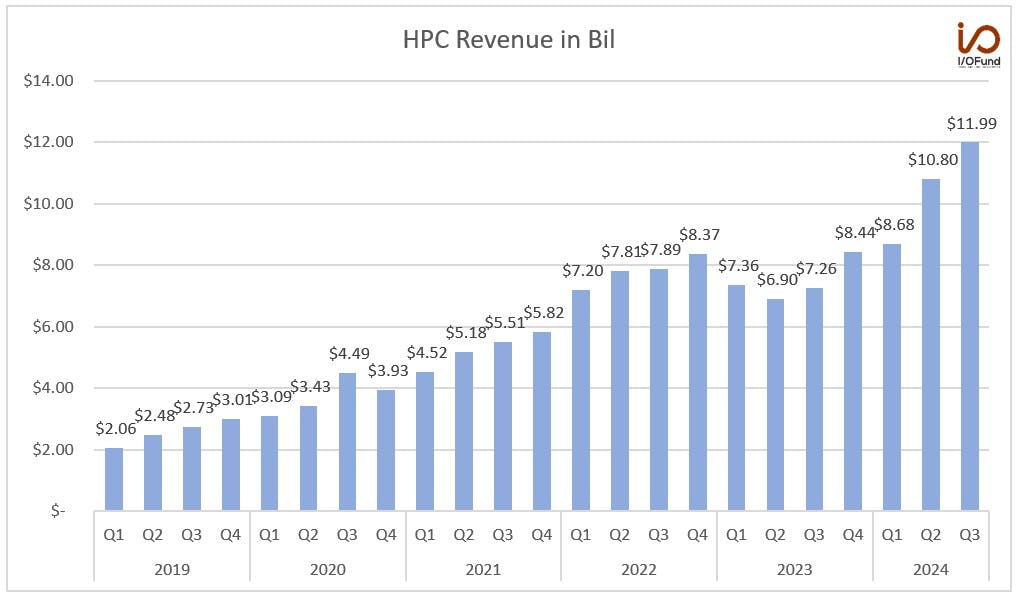
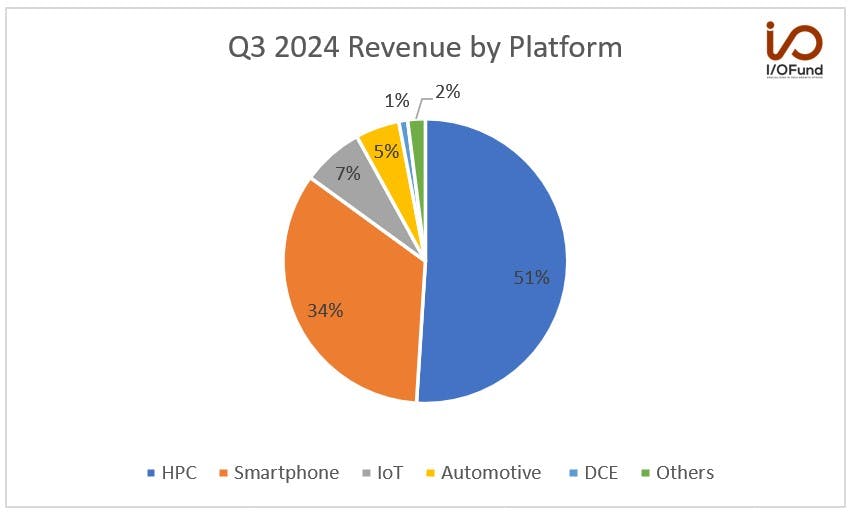
As the leading foundry for AI accelerators, TSMC is riding the enormous wave of demand from Big Tech. The chipmaker’s high-performance computing (HPC) revenues rose 11% QoQ to $11.99 billion and accounted for 51% of revenue, surpassing the 50% mark for the second time.
The chart below also shows that HPC revenue reached a record $11.99 billion in Q3.
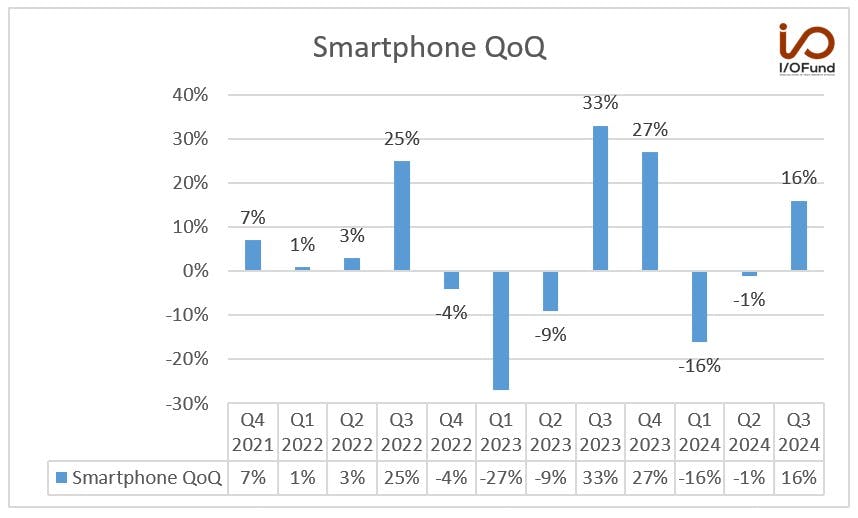
Smartphone grew by 16% sequentially and accounted for 34% of revenue from 33% of revenue in Q2.
Internet of Things revenue grew by 35% sequentially and accounted for 7% of revenue.
Automotive revenue grew by 6% sequentially and accounted for 5% of revenue. Digital Consumer Electronics decreased by 19% and accounted for 1% of revenue; others grew by 8% to account for 2% of revenue.
Revenue by Technology
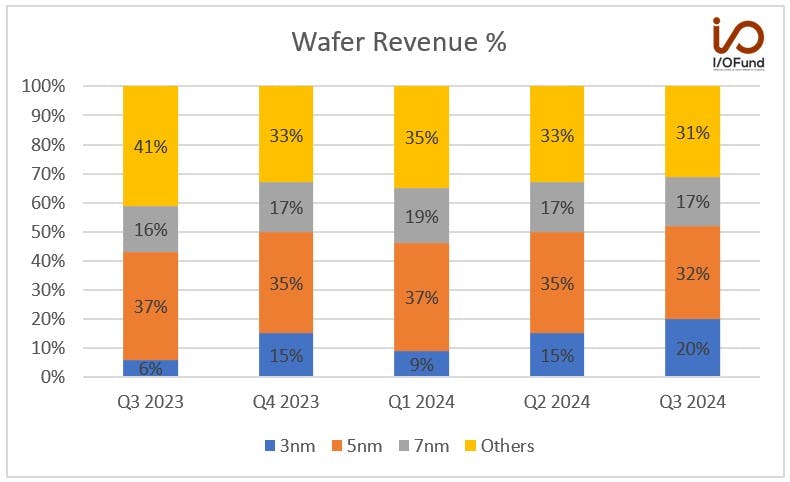
The Advanced nodes are defined as 7-nanometer and below. It accounted for 69% of wafer revenue in Q3 compared to 67% in Q2.
In Q3 2024, 3-nanometer process technology contributed 20% of wafer revenue, while 5-nanometer and 7-nanometer accounted for 32% and 17%, respectively.
In Q2 2024, 3-nanometer process technology contributed 15% of wafer revenue, while 5-nanometer and 7-nanometer accounted for 35% and 17%, respectively.
Earnings Call
“AI Demand is Real”
The management clarified in the earnings call to allay fears about the AI opportunity, stating that the demand is real and the return on investment from AI is high.
Question
Gokul Hariharan (Analyst)
“My first question is on the AI investments and the growth that you see. Recently, obviously, there's been a lot of questions about ROI of Gen AI investments, whether this could end up being a bubble. How does TSMC view this trend as you're making your capacity plans given you are enabling pretty much the processing capacity for pretty much everybody?”
Answer
C. C. Wei (Executive)
“Okay Gokul, let me answer your question. Simply, whether this AI demand is real or not, okay? And my judgement is real.We have talked to our customer all the time, including our hyperscaler customers who are building their own chips. And almost every AI innovator is working with TSMC. And so we probably get the deepest and widest look of anyone in this industry.
And why I say it's real, because we have our real experience. We have using the AI and machine learning in our fab and R&D operations. By using AI, we are able to create more value by driving greater productivity, efficiency, speed, qualities.
And think about it, let me use you know 1% productivity gain, that was almost equal to about 1 billion to TSMC. And this is a tangible ROI benefit. And I believe we cannot be the only one company that has benefited from this AI application. So I believe a lot of companies right now are using AI for their own improving productivity, efficiency, everything. So I think it's real.”
PC and Smartphone demand
The management expects healthy growth in the PC and Smartphone demand due to the increasing content due to AI.
Krish Sankar (Analyst)
“Yes, hi. Thanks for taking my question. The first one I had was, I'm kind of curious on the non-AI demand. How do you look at your wafer demand for PC and mobile into calendar ‘25, and have you seen any meaningful revision upwards or downwards on that?
C. C. Wei (Executive)
Okay, Krish. The unique growth of PC and smartphone is still in a low single digit, but the more important is the content. The content now we put more AI into their chip, and so the silicon area increase faster than the unique growth. So again, I would like to say that for this PC and smartphone business, not only — is gradually increased, and we expect it to be healthy in the next few years because of AI-related applications.”
Advanced Packaging
Advanced Packaging demand is strong and will account for high single-digit of revenue this year.
Krish Sankar (Analyst)
“How do you think about that advanced packaging revenue growth over the next few years, and do you think at some point in the next couple of years, advanced packaging can reach corporate-level growth margins, or would it always be below that?
Wendell Huang (Executive)
Yes, Krish, advanced packaging in the next several years, let's say five years, will be growing faster than the corporate average. This year, it accounts for about high single-digit of our revenue. In terms of margins, yes, it is also improving. However, it's still approaching corporate, but not there yet.
Rick Hsu (Analyst)
All right. Thank you so much. A little question as a follow up, the second one. Can you share with us your CoWoS capacity buildup for this year and next year? I know you guys seem to have revised it up several times, so can you share the latest one?
C. C. Wei (Executive)
Okay, Rick. In fact, we are putting a lot of effort to increase the capacity of the CoWoS. Roughly, let me share with you, today's situation is our customers' demand far exceeds our ability to supply. So even we work very hard and increase the capacity by about more than twice, more than two times as this year compared with last year, and probably double again, but still not enough. But anyway, we are working very hard to meet the customers' requirement.”
Conclusion
The company beat across the board and showed its resilience in capturing the demand for advanced chips due to its technological leadership. The top-line growth, along with the bottom-line strength, distinguishes TSMC from other companies that are struggling in the current tough macro environment. The company is the denominator to the biggest AI winners as it supplies to Nvidia, Apple, AMD, Marvell, Intel, and Qualcomm. We look forward to adding this stock to our portfolio.
Pro premium members receive deep-dive research on the stocks in the portfolio and quarterly earnings kickoff webinars. In addition, the Advanced Market Signals Members receive regular technical and broad market analysis and weekly webinars from our Portfolio Manager, Knox Ridley. Learn more here.here.
Royston Roche, Equity Analyst at the I/O Fund, contributed to this article.
The demand for the newest generation of Nvidia’s Blackwell chip is strong. According to Morgan Stanley, after meeting with management said that the Blackwell GPU is fully booked for the next one year and is progressing on schedule. Nvidia CEO, Jensen Huang, had also earlier stated that the demand for Blackwell is “insane.” The supply chain data also points favorably as Foxconn is building a new facility in Mexico for Blackwell orders. Foxconn Chairman said that the capacity would be “very, very enormous”.
The fundamental story is intact and strong for NVDA, which is why the technical setup is somewhat contrarian. As growth investors, sentiment can drive a stock in the opposite direction suggested by the fundamentals over the short to intermediate time frame. This may be what is playing out for Nvidia today.
The technical pattern since the June high best resembles a large degree correction that is still playing out. Note the 3 waves down from the June high. This, so far, has been followed by a 3 wave bounce that has made lower highs. If we are in a large degree correction, then we should see the final drop into the $90 – $70 range in the coming weeks. This scenario is marked in red in the chart below.
The alternative interpretation of the price action is presented in green. If this is playing out, we are in the middle of a 5th wave push to new highs. The pattern would have to be an ending diagonal, which is typically a 5 wave pattern that consists of large swings in both directions. If this is playing out then any further weakness should hold over $120 – $114, and then breakout to new all-time highs over $141. A break below $114 will confirm the red count, as we set up targets to buy around the August low.
Taiwan Semiconductor (TSM)
TSM has a similar setup as NVDA. Strong revenue growth is expected in the coming quarters due to the robust demand for AI and smartphone chips. We have recently discussed the stock here. However, the technical setup suggests that we could see one more leg lower before the larger uptrend resumes.
We have a 3 wave bounce off the August low that is stalling at the highs. The most common interpretation of this 3 wave bounce is a corrective bounce within a larger correction. If this is instead a bullish pattern, it will also be in the form of an ending diagonal pattern. As long as any further weakness holds $179 – $176 and then definitely push towards the $225 region next, then the bullish scenario remains a viable path. If we break below $176, then we are heading back to the August lows.
Bitcoin (BTCUSD)
Bitcoin appears to be setting up for a breakout to all time highs. Note price breaking above the downtrend line. This pattern is also in the form of an ending diagonal that is targeting $78,000 – $86,000. If we fail to definitely break above the downtrend line, any additional weakness must hold over $58,500. Below this level and the correction that started in March will have one more drop before completing.
Pro premium members receive deep-dive research on the stocks in the portfolio and quarterly earnings kickoff webinars. In addition, the Advanced Market Signals Members receive regular technical and broad market analysis and weekly webinars from our Portfolio Manager, Knox Ridley. We have also recently discussed with the Advanced Market Signals members an AI stock that is up 415% in the last three months. Learn more here.
While Nvidia’s dominance in AI GPUs is more clearly visible downstream in the HBM market, it’s also driving growth in a lesser-known but equally as important market, in metrology/process control equipment.
Metrology, by definition, is the study of measurement. In the semiconductor industry, metrology plays a critical role, as the ability to measure circuit dimensions, microstructures inside chips, film thickness, accuracy of layers and overlays are all necessary to ensure chipmakers can consistently produce high-quality, flaw-free chips at high yields.
While KLA dominates the metrology market, reportedly holding a more than 50% market share for over 20 years, Onto Innovation and Nova are two smaller players in the market putting up accelerating revenue growth with strong margins, with exposure to AI megatrends and long-term growth drivers.
Metrology Has Multiple Drivers
The metrology market has multiple drivers of future growth, and while it’s not limited to the AI data center mega-trends spearheaded by Big Tech, there are many levers within this AI buildout to drive demand for Onto Innovation and Nova.
This is how Nova’s management team recently described the opportunity: “Artificial intelligence is reshaping our digital world and expediting the implementation of scaling agents in integrated circuits to boost performance and power efficiency which are at the core of enabling large language models through training and infra stages. Scaling is manifested in more complex designs through three avenues, dimensions, materials and advanced packaging.
It is also manifested in the size of manufactured dies and in the number of dies required in solutions such as high bandwidth memory. These developments profoundly impact our industry in the number of the wafers needed to supply demand and in the yield ratio, you must obtain to secure profitability with a lower number of dies per wafer. Couple that with the growing complexity of architecture and materials and you have the growth drivers of process control in the coming years.”
Here’s a brief look at how AI and the data center are generating demand for metrology equipment across these different drivers:
Shift to Advanced Nodes
Advanced nodes require more process steps as node sizes shrink, so for a chipmaker or foundry like TSMC or Intel to move from primarily producing on 5nm nodes to 2nm or below over the next couple of years, there will be a greater need for metrology equipment. Currently, the 5nm and 4nm nodes are primarily being used for AI chip production, such as that for Nvidia’s Hopper and Blackwell chips, while 3nm production is ramping at TSMC with volume production at the 2nm node expected in 2025, primarily for smartphone applications.
This is because the manufacturing tolerances shrinks as nodes shrink in size – the chipmaking process now becomes increasingly more sensitive to minute deviations in the process. Moving to more advanced nodes warrants much greater precision throughout the entire manufacturing process, as the smallest of deviations could greatly affect the process’ yield.
For example, Samsung has reportedly been struggling with severe yield issues for its most advanced nodes, with unstable yields reportedly around 50% or below for its gate all-around GAA 3nm second-gen process, and yields as low as 20% for its 2nm process.
TSMC sees higher yields for the 3nm process, reportedly between 60% and 70%, allowing it to command a majority of production on advanced nodes and thus a majority of market share.
Metrology needs also rise as chip designs get increasingly complex, from the entire GPU to memory cubes.
AI accelerators are getting larger and more complex with each generation packing more transistors than the last. Nvidia’s upcoming B200 GPU packs 208 billion transistors and 192GB of HBM3e memory, versus 80 billion transistors and 80GB HBM3 memory for the H100. Though Blackwell is in a dual-die configuration, it’s still a more complicated chip to produce using TSMC’s customized N4P process (the same as for the H100).
Having a more complex chip design increases the chances of errors, as there are more steps in the manufacturing process to produce said chips. This also goes for DRAM and NAND cubes – as HBM cubes stack higher, from 8-high cubes to 12-high cubes for the current HBM3e generations from SK Hynix, Samsung and Micron, it also increases process steps. Other advanced memory chips have seen a 6x increase in layers from 64 to 400 over the past few years. 3D stacking and building more layers necessitates more sophisticated metrology equipment to ensure critical measurements are met within each stack and layer.
Gate All Around Advanced Packaging
TSMC is phasing out FinFet after the 3nm node, and its upcoming 2nm node will be the first to use gate-all-around field-effect transistors (GAA FETs). GAA will increase chip density, and increase performance-per-watt to enable higher levels of output and efficiency.
These GAA nanosheet transistors have channels surrounded by gates on all sides to reduce leakage yet it will also uniquely widen the channels to provide a performance boost (with another option to narrow the channels to optimize power cost). The 2nm node will also allow chipmakers to customize the width and height of cells. Because of the increased complexity of GAA FETs compared to FinFETs, Nova estimates that GAA requires 20% to 30% more metrology steps than FinFET.
We’ve covered gate-all-around in a TSMC analysis that stated the following in terms of timing for N2 starting production in the last quarter of 2025 and reaching “meaningful revenue” by the Q1 to Q2 of 2026.
Accelerated Chip Development Timelines
Nvidia and AMD are both shifting to annual release cadences, aiming to bring next-generation GPUs to market once per year, compared to prior cadences of every two years. This is a major technological feat – as we had said previously for Nvidia, it’s a ‘move-fast-break-things’ problem, where Nvidia is pushing the boundaries of what had previously been seen as impossible in the chip industry.
By moving to these quicker release cycles, there’s a much greater emphasis on metrology and process control to ensure that the manufacturing process remains sharp, while also ensuring a faster ramp, and high yields to meet mass production thresholds and demand.
Fab Buildouts
Another driver for metrology equipment is chip fab buildouts, such as HBM fab construction and investments from SK Hynix, Micron and Samsung, as well as other expansion plans, such as TSMC’s planned expansion in Arizona.
Onto’s management put this in perspective from the HBM side, saying that “even if AI just stayed flat, which nobody is projecting, AI is supposed to go up, the HBM side is already doubling. … customers [are] talking about supply constraints and that they're looking at expanding factories into next year, early half of next year in order to alleviate these supply constraints.”
Currently, there are 19 global high-volume chip fabs under construction this year, with another 10 expected to be added next year to meet rising demand for semiconductors, driven by AI/HPC. Total equipment spending for these 29 fabs is expected to be approx. $140 billion. Through 2030, there are more than 100 fab projects planned, with more than $200 billion in global funding and incentives for these projects.
Building out new fabs from the ground-up will require metrology and process control equipment, providing a long-term growth runway for the industry.
Product Snapshot: Addressing Critical Challenges in Advanced Packaging, Memory, More
Onto and Nova’s management teams highlighted a few core products that are driving growth or seeing strong orders and adoption from major customers. These products address some of the more pressing challenges in advanced packaging, HBM and memory, and leading-edge nodes.
Israeli-based Nova has a diverse metrology equipment and software portfolio, from dimensional to materials to chemical metrology. One of Nova’s leading products is PRISM 2, the next-generation PRISM which offers improved sensitivity and accuracy in critical dimensions metrology.
Nova noted that its PRISM 2 product saw strong adoption last quarter, especially in GAA, with around half of its record bookings stemming from “advanced packaging processes, such as Through-Silicon Via, where PRISM has a unique advantage in filtering information from specific underlayers.”
PRISM 2 provides improved accuracy and reliability for critical component measurements in processes such as advanced logic chip fabrication and stacking nanosheets for GAA fabrication, as well as 3D NAND and DRAM.
Nova also added that “demand is also consistently high for our advanced integrated metrology and XPS material metrology platforms,” as it saw “record booking of VeraFlex XPS platforms this quarter, of which over 40% resulted from capacity growth” in FinFET advanced nodes.
Nova’s VeraFlex XPS (X-ray photoelectron spectroscopy/materials metrology) helps analyze surface structures, identifying bonding, contaminants or defects in advanced nodes for process control in high-volume manufacturing.
US-based Onto’s core products span defect inspection equipment, dimensional (optical CD) and material metrology, and lithography tools. Onto’s Dragonfly systems, which drove Q2’s performance, witnessed “better-than-expected demand” for advanced packaging for AI chips as it reached another revenue record.
Dragonfly G3 provides combo 2D and 3D inspection and process control for advanced packaging, HBM and chip-on-wafer GPUs. For example, Onto noted last August that it finalized more than $100 million in Dragonfly G3 orders for chip packages “that combine a graphics processor (GPU) and numerous high bandwidth memory (HBM) devices to create an AI GPU in a single package.”
Onto also said that Atlas and Iris demand for GAA investments were a driver of Q2’s performance, while new product launches in panel lithography, 3D bump metrology sensors for smaller interconnects in HBM, and subsurface defect inspection sensors are expected to see strong adoption through the end of the year.
By comparison, leader KLA offers a comprehensive portfolio of metrology equipment for measuring “pattern dimensions, film thicknesses, layer-to-layer alignment, pattern placement, surface topography and electro-optical properties” for chip and substrate manufacturing, from new process development, product verification, and high volume manufacturing. KLA provides advanced wafer packaging equipment, overlay metrology equipment, reticle metrology and inspection tools, OCD, shape and film metrology equipment, sheet resistance metrology equipment, and more.
Customer Concentration Extremely High
It’s common for small cap semiconductors to have high customer concentration, especially at the equipment level, as there are a limited number of fabs globally. Nova and Onto are no exception.
For Nova, its top five customers accounted for 52% of revenue in 2023, down from 57% of revenue in 2022 and 70% in 2021. Nova’s largest customer accounted for 19% of revenue, while its fifth largest customer contributed 5% of revenue. The customers are not named.
Revenue from Nova’s largest customer(s) declined from ~$130 million in 2021 and 2022 to $108 million in 2023.
Onto Innovation has provided a breakout for its top three customers, along with another figure that highlight its customer concentration.
For Onto, its three largest customers accounted for 56% of revenue in the first half of fiscal 2024. TSMC accounted for 23% of revenue, up from 13% in the same period last year. Samsung accounted for 20% of revenue, down slightly from 21% last year.
SK Hynix has risen to be Onto’s third largest customer at 13% of revenue, up from <10% last year. Onto also has shared that TSMC accounted for 21% of its net accounts receivable in the first half of 2024, with Samsung accounting for 8%.
Both Nova and Onto are reporting accelerating revenue growth in Q2 after returning to growth in Q1 this year after four consecutive quarter of declines. However, Onto guided for revenue growth to decelerate in Q3, while Nova forecast this acceleration to continue but be short-lived.
Onto reported 27.1% YoY growth to $242.3 million in revenue in Q2, accelerating from 14.9% growth in Q1. Management said that Q2’s growth and revenue above its guided $230-240 million range was “driven by additional pilot line expansions for high-performance computing using gate-all-around transistor architecture and high bandwidth memory (HBM) supporting AI market growth.” This was likely driven primarily by increased spend by TSMC and SK Hynix, seen within the customer concentration figures.
Advanced packaging and specialty device revenue reached a fourth-consecutive record at $164 million, up 49% YoY, while Onto added that it “closed over $300 million of volume purchase agreements issued by two customers for their AI advanced packaging and gate-all-around investments through 2025,” again likely to be coming from TSMC. Management expects that GAA and advanced packaging at multiple customers will be primary growth drivers through 2025.
Nova reported revenue growth of 27.8% YoY to $156.9 million in revenue in Q2, accelerating from 7.3% in Q1. Metrology product revenue was $124.6 million, accelerating to 30% YoY growth from just 6% YoY in Q1 and (16%) in Q4.
Management said that it saw “record revenue from chemical metrology, driven by demand in high-bandwidth-memory and front-end logic processes,” while demand for GAA and advanced packaging was increasing with “faster-than-expected adoption” for its PRISM 2 platform. Management added that they also saw record bookings for advanced packaging and materials metrology.
Q2 also marked both companies’ fastest YoY growth rates in two years — here’s a look at how Onto and Nova have recovered from 2023’s slowdown:
Looking ahead for Q3, Onto guided for revenue growth of 20.7% YoY to $250 million in revenue at midpoint, a more than 6 percentage point deceleration. Nova forecast a nearly 6 percentage point acceleration to 33.5% growth to $172 million in revenue at midpoint.
Through 2025, analysts expect Onto to maintain growth in the high-teens each quarter, while Nova’s higher growth rate of 30%+ is expected to decelerate into the low-teens and high-single digit range five quarters out.
Onto is expected to see quarterly revenues rise to above $300 million, while Nova is currently forecast to see revenues begin to flatline in the mid-$190 million range. Nova may be more exposed to cyclicality in the metrology industry with its focus on film metrology equipment, which may see faster growth in the ramp phase that stabilizes later on.
Onto provided a quick look into what’s driving 2025 growth: “We expect to benefit from continued investments in gate-all-around capacity, and the announced capacity expansions from several high-bandwidth memory and logic packaging manufacturers, specifically for HBM. We expect new capacity coming online in the first half of the year to support the increase of HBM content for NVIDIA's AI processors from 80 to 192 gigabytes and for AMD's AI processors from 192 gigabytes to 288 gigabytes.”
However, it’s not all AI revenue for the two. Onto clarified that AI packaging drove over half of specialty and advanced packaging revenue in Q2, implying AI packaging revenue of at least $82 million, or just over one-third of quarterly revenue. Nova is seeing demand stem from AI-driven end markets such as HBM, GAA and TSVs, though they have not broken out AI’s specific impact on revenue.
Long-Term Financial Targets:
Revenue
Both companies have set out long-term financial targets, including revenue, margins and EPS. The revenue targets will likely be achieved in 2027 to 2028 based on current expectations and historical trends. Both companies expect to have enough capacity by year end to reach these long-term revenue targets.
Nova set its long-term target of $1 billion, more than 50% higher than FY24’s projected $648 million. There are currently six analysts covering Nova with only two analysts providing estimates through Dec of 2027 with consensus at $995.7 million.
Onto has its long-term revenue target at $1.8 billion, nearly double FY24’s projected $980 million. There are eight analysts covering Onto with only three analysts covering the stock through Dec of 2027 with estimates at $1.56 billion. The Dec 2028 estimate is more in line with Onto’s projections with only one analyst providing an estimate of $1.84 billion.
Here’s Onto’s target model, which provides a more detailed view down the line as revenue increases incrementally by $200 million:
Nova is currently ahead of its long-term margin targets, currently benefiting from higher ASPs due to product mix, while Onto is behind on gross margin targets for its $1 billion model.
Here’s how Nova’s margins look relative to its long-term target (referencing non-GAAP margins):
Nova reported GAAP gross margin of 59% in Q2, flat QoQ and up 200 bp YoY. Non-GAAP gross margin was 61% in Q2, again flat QoQ and up 200 bp YoY.
For Q3, Nova guided gross margins to dip 300 bp QoQ sequentially, to a GAAP gross margin of 56% and non-GAAP gross margin of 58%. Nova said that faster adoption of higher ASP/margin products has previously boosted margins, but they remain at the high-end of targets despite this fluctuation.
GAAP operating margin was 29% in Q2, expanding 300 bp QoQ and 600 bp YoY. Non-GAAP operating margin was 34%, up 200 bp QoQ and 600 bp YoY. Management pointed out that non-GAAP operating margin was ahead of targets of 27% to 31%, and while Q3’s non-GAAP margin was guided to decline sequentially to 32%, this is in line with previous quarters with Q2 being a strong outlier.
Onto sits behind gross margin targets, though it sees margins expanding in the coming quarter.
Onto reported GAAP and non-GAAP gross margin of 53% in Q2, up 100 bp QoQ and flat YoY. Though current FY revenue estimates are just 2% below the $1 billion target model, gross margins are shy of its range, with Onto targeting non-GAAP gross margins of 56% to 57%.
For Q3, management guided to gross margins between 53% to 55%, flat to up 200 bp QoQ, driven by growth in advanced nodes and optimization in manufacturing. Though it’s a step in the right direction, it’s still short of targets by ~200 bp at midpoint.
GAAP operating margin was 20% in Q2, up 100 bp QoQ and 700 bp YoY. Non-GAAP operating margin was 27%, up 200 bp QoQ and 600 by YoY.
Excluding amortization (to align with long-term targets), non-GAAP operating margin was 32%, in line with the high end of the $1 billion model despite the gross margin shortfall.
For Q3, management’s guidance implies non-GAAP gross margin of 28%, up 100 bp QoQ.
EPS
Both Nova and Onto are reporting strong EPS growth, with Nova reporting 48% YoY growth to $1.41 in GAAP EPS of $1.41 and Onto reporting 102% YoY growth to $1.07 in GAAP EPS. It’s rare to see such high EPS numbers from small cap stocks, and long-term targets are both strong and rather achievable.
For Nova, management is targeting non-GAAP EPS of at least $7 per share by the time it reaches $1 billion in revenue. For the first half of 2024, Nova’s non-GAAP EPS is currently $3 per share, suggesting that if margins can be maintained at the high end of its model, $7 in EPS is easily achievable. Analyst estimates currently project $9.58 in EPS on $996 million in revenue in 2027, foreseeing Nova surpassing the $7 EPS target next year on $757 million in revenue.
Onto is targeting non-GAAP EPS of $5.50 to $6.00 at $1 billion in revenue, and long-term up to $8.50 in EPS at $1.4 billion in revenue. Non-GAAP EPS for the first half of 2024 was $2.50, and with Q3 guided to $1.30 at midpoint, Onto would need to report $1.70 in non-GAAP EPS in Q4 to reach the low end of its target at $5.50.
Onto’s longer-term view emphasizes increased operating leverage to drive earnings growth as gross margin expansion is minimal. Management is eyeing just a 2% expansion in gross margin but a 4% expansion in operating margin. This is expected to drive EPS more than 40% higher, from $6 to $8.5 per share at the high end of the range. Analysts are much more optimistic on the degree of operating leverage that Onto can drive at $1.4 billion in revenue, with estimates calling for about $9.35 in EPS on $1.44 billion in revenue in 2026. Again, it’s rare to see EPS numbers this high with small cap semiconductor stocks.
Balance Sheets, Cash Flows Healthy
With operating and net margins in the high-20% to low-30% range, Onto and Nova enjoy healthy balance sheets and cash flows.
Onto has $786 million in cash, equivalents and marketable securities on hand, zero debt, and total liabilities of $174 million. Operating cash flow for 1H 2024 increased 50% YoY to $122 million, or 26% of revenue (versus 21% of revenue in same period last year). Free cash flow rose 49% YoY to $103 million, or 22% of revenue (versus 18% of revenue in the same period last year).
Nova has $759 million in cash, equivalents, and marketable securities, and $198 million in convertible senior notes, which, if converted, would equal about 3.4% dilution to existing shareholders. Nova has no outstanding debt outside of the convertible notes. Operating cash flow for 1H increased nearly 154% YoY to $120 million, or 40% of revenue (versus 19% of revenue in the year ago period). Free cash flow rose more than 178% YoY to $115 million, or 38% of revenue (versus 17% of revenue in the year ago period).
Inventories are where the two differ, with Nova increasing inventory as Onto is working to reduce inventory. Nova reported inventory of $156.6 million at the end of Q2, up more than 13% from the end of 2023. Onto is working on inventory management, reporting $319.7 million in inventory in Q2, down from $327.8 million at the end of 2023. Management expects to further reduce inventory by $10 million to $15 million in Q3 and exit 2024 with inventory below $300 million, or a $50 million YoY reduction.
Valuations Have Enjoyed a Premium
With clear exposure to AI and HPC trends in HBM and advanced packaging, as well as strong operating, net and cash flow margins — and triple digit cash flow growth for Nova – the two have recently enjoyed premium valuations to other chip equipment stocks and metrology leader KLA.
Onto currently trades at nearly 62x TTM earnings and Nova at almost 42x TTM earnings, compared to 38x TTM earnings for KLA and 22x TTM earnings for Applied Materials, which also has exposure to metrology and advanced packaging. Multiples have compressed slightly, with Onto trading above 80x earnings and Nova above 55x earnings earlier this year; however, it’s quite a large premium to their three-year average TTM earnings multiples of 37x for Onto and 31x for Nova.
On a forward basis, strong EPS growth of 40% YoY for Onto and 31% YoY for Nova has brought forward multiples lower, though still elevated relative to peers. Onto trades at nearly 40x forward earnings of $5.22 for FY24, while Nova trades at 31x forward earnings of $6.37 for FY24. KLA trades at 26x forward earnings with 25% YoY growth expected, and Applied Materials at 23x forward earnings with just 6% YoY growth expected.
On a top-line basis, Onto, Nova and KLAC are currently trading in the high 10x, to mid 11x PS range. Multiples for the trio have been in lockstep for more than a year, following each other quite closely since the 5-6x range around Nvidia’s blowout earnings report in May 2023, the first signs of the present AI and HBM boom.
Looking longer-term, it’s quite clear that these are some of the highest top-line multiples Onto and Nova have traded at in the past decade. Both companies’ 10-year average PS multiple hovers around 4.5x to 5x, so the two are currently trading at more than double their 10-year average. If earnings or revenue growth falters, multiple compression is a possibility given the premium valuations of the two.
Technical Analysis
By Knox Ridley
What caught our eye about the technical patterns in both NVMI and ONTO was how similar their long-term trends appear to be unfolding. Like many AI names that we track, they appear to be setting up for a correction within a larger uptrend that should go on for several years.
Most stocks and markets appear to have either topped in 2021 or are in their final swing higher in 2024/2025. So, while the broad market makes a series of lower highs into the coming years, these names would trend higher.
Onto Innovation (ONTO)
The below chart is a weekly chart. In other words, every candle is one week’s worth of price data. This better helps us decipher the long-term trend. Note the vertical move off the 2009 low, which was followed by a multi-year, messy and overlapping correction into 2015. This best resembles waves 1 and 2 in a very large 5 wave uptrend.
This is further supported by the price action into today’s developing top. The below Elliott Wave count has us in the final swing of wave 3 within the larger 3rd wave. We ccould see a final push into the $257 – $339 region. However, this is not a move that we would chase, considering the warning signs.
For one, we have a completed 5 wave pattern off thew COVID low. What follows 5 waves higher is usually a 3 wave retrace. Secondly, since mid-2023, we have seen price make higher highs while momentum is making lower highs. This is characteristic of 5 wave pattern, where peak momentum typically is seen in wave 3, as we wave 5 is met with less volume and less momentum.
Nova (NVMI)
NVMI has a similar long-term chart as ONTO. We can see a near vertical 5 wave move off of the 2009 low, followed by a pullback into 2011. This lines up well as waves 1 and 2 of a very large 5 wave pattern.
Like ONTO, Nova is in the final swing of wave 3 of the larger 3rd wave. If this count is accurate, the 4th wave pullback should take us back to around projected the halfway point of this larger 5 wave pattern, which is where we would look to potentially enter both stocks.
If we zoom in on the current correction, it appears that NOVA is setting up for the final drop in this correction. A move below $186 will confirm this as we target $152 – $138 for our first entry. If NOVA can instead hold $186 and then breakout above $230, we will be in the final swing of this 3rd wave. This stock has a lot to prove before we’d consider it a longer-term buy rather than a momentum stock.
Conclusion
Nvidia, TSMC, and Micron are bellwethers for AI accelerator, advanced packaging and HBM demand, with the three showing no signs of slowing any time soon. This will continue to create opportunities for growth in the metrology equipment market, as AI accelerator-related HBM and advanced packaging demand continues to grow and outstrip supply.
Metrology equipment is positioned well to capture the increase in complexity from advanced nodes, memory stacking and other chipmaking processes where demand is outstripping supply into the foreseeable future.
Onto and Nova share in these tailwinds, evidenced by accelerating quarterly revenue in Q2 and strong margins, cash flows and healthy balance sheets. We will be watching for further evidence that these companies are participating in the Ai boom in the upcoming quarters.
This analysis is a preview of what you can expect in our upcoming Discovery tier, which will provide additional analysis on new idea generation stocks that are not currently in the I/O Fund portfolio. We look forward to launching this tier November/December. There will be no changes to our current service tiers, rather I/O Fund Discovery is a service for those who want more new stock ideas beyond what our service currently provides. Stay tuned for more information!
Damien Robbins, Equity Analyst at I/O Fund, contributed to this analysis.
Please note: The I/O Fund conducts research and draws conclusions for the Fund’s positions. We then share that information with our readers. This is not a guarantee of a stock’s performance. Please consult your personal financial advisor before buying any stock in the companies mentioned in this analysis.
While Nvidia’s dominance in AI GPUs is more clearly visible downstream in the HBM market, it’s also driving growth in a lesser-known but equally as important market, in metrology/process control equipment.
Metrology, by definition, is the study of measurement. In the semiconductor industry, metrology plays a critical role, as the ability to measure circuit dimensions, microstructures inside chips, film thickness, accuracy of layers and overlays are all necessary to ensure chipmakers can consistently produce high-quality, flaw-free chips at high yields.
While KLA dominates the metrology market, reportedly holding a more than 50% market share for over 20 years, Onto Innovation and Nova are two smaller players in the market putting up accelerating revenue growth with strong margins, with exposure to AI megatrends and long-term growth drivers.
Metrology Has Multiple Drivers
The metrology market has multiple drivers of future growth, and while it’s not limited to the AI data center mega-trends spearheaded by Big Tech, there are many levers within this AI buildout to drive demand for Onto Innovation and Nova.
This is how Nova’s management team recently described the opportunity: “Artificial intelligence is reshaping our digital world and expediting the implementation of scaling agents in integrated circuits to boost performance and power efficiency which are at the core of enabling large language models through training and infra stages. Scaling is manifested in more complex designs through three avenues, dimensions, materials and advanced packaging.
It is also manifested in the size of manufactured dies and in the number of dies required in solutions such as high bandwidth memory. These developments profoundly impact our industry in the number of the wafers needed to supply demand and in the yield ratio, you must obtain to secure profitability with a lower number of dies per wafer. Couple that with the growing complexity of architecture and materials and you have the growth drivers of process control in the coming years.”
Here’s a brief look at how AI and the data center are generating demand for metrology equipment across these different drivers:
Shift to Advanced Nodes
Advanced nodes require more process steps as node sizes shrink, so for a chipmaker or foundry like TSMC or Intel to move from primarily producing on 5nm nodes to 2nm or below over the next couple of years, there will be a greater need for metrology equipment. Currently, the 5nm and 4nm nodes are primarily being used for AI chip production, such as that for Nvidia’s Hopper and Blackwell chips, while 3nm production is ramping at TSMC with volume production at the 2nm node expected in 2025, primarily for smartphone applications.
This is because the manufacturing tolerances shrinks as nodes shrink in size – the chipmaking process now becomes increasingly more sensitive to minute deviations in the process. Moving to more advanced nodes warrants much greater precision throughout the entire manufacturing process, as the smallest of deviations could greatly affect the process’ yield.
For example, Samsung has reportedly been struggling with severe yield issues for its most advanced nodes, with unstable yields reportedly around 50% or below for its gate all-around GAA 3nm second-gen process, and yields as low as 20% for its 2nm process.
TSMC sees higher yields for the 3nm process, reportedly between 60% and 70%, allowing it to command a majority of production on advanced nodes and thus a majority of market share.
Metrology needs also rise as chip designs get increasingly complex, from the entire GPU to memory cubes.
AI accelerators are getting larger and more complex with each generation packing more transistors than the last. Nvidia’s upcoming B200 GPU packs 208 billion transistors and 192GB of HBM3e memory, versus 80 billion transistors and 80GB HBM3 memory for the H100. Though Blackwell is in a dual-die configuration, it’s still a more complicated chip to produce using TSMC’s customized N4P process (the same as for the H100).
Having a more complex chip design increases the chances of errors, as there are more steps in the manufacturing process to produce said chips. This also goes for DRAM and NAND cubes – as HBM cubes stack higher, from 8-high cubes to 12-high cubes for the current HBM3e generations from SK Hynix, Samsung and Micron, it also increases process steps. Other advanced memory chips have seen a 6x increase in layers from 64 to 400 over the past few years. 3D stacking and building more layers necessitates more sophisticated metrology equipment to ensure critical measurements are met within each stack and layer.
Gate All Around Advanced Packaging
TSMC is phasing out FinFet after the 3nm node, and its upcoming 2nm node will be the first to use gate-all-around field-effect transistors (GAA FETs). GAA will increase chip density, and increase performance-per-watt to enable higher levels of output and efficiency.
These GAA nanosheet transistors have channels surrounded by gates on all sides to reduce leakage yet it will also uniquely widen the channels to provide a performance boost (with another option to narrow the channels to optimize power cost). The 2nm node will also allow chipmakers to customize the width and height of cells. Because of the increased complexity of GAA FETs compared to FinFETs, Nova estimates that GAA requires 20% to 30% more metrology steps than FinFET.
We’ve covered gate-all-around in a TSMC analysis that stated the following in terms of timing for N2 starting production in the last quarter of 2025 and reaching “meaningful revenue” by the Q1 to Q2 of 2026.
Accelerated Chip Development Timelines
Nvidia and AMD are both shifting to annual release cadences, aiming to bring next-generation GPUs to market once per year, compared to prior cadences of every two years. This is a major technological feat – as we had said previously for Nvidia, it’s a ‘move-fast-break-things’ problem, where Nvidia is pushing the boundaries of what had previously been seen as impossible in the chip industry.
By moving to these quicker release cycles, there’s a much greater emphasis on metrology and process control to ensure that the manufacturing process remains sharp, while also ensuring a faster ramp, and high yields to meet mass production thresholds and demand.
Fab Buildouts
Another driver for metrology equipment is chip fab buildouts, such as HBM fab construction and investments from SK Hynix, Micron and Samsung, as well as other expansion plans, such as TSMC’s planned expansion in Arizona.
Onto’s management put this in perspective from the HBM side, saying that “even if AI just stayed flat, which nobody is projecting, AI is supposed to go up, the HBM side is already doubling. … customers [are] talking about supply constraints and that they're looking at expanding factories into next year, early half of next year in order to alleviate these supply constraints.”
Currently, there are 19 global high-volume chip fabs under construction this year, with another 10 expected to be added next year to meet rising demand for semiconductors, driven by AI/HPC. Total equipment spending for these 29 fabs is expected to be approx. $140 billion. Through 2030, there are more than 100 fab projects planned, with more than $200 billion in global funding and incentives for these projects.
Building out new fabs from the ground-up will require metrology and process control equipment, providing a long-term growth runway for the industry.
Product Snapshot: Addressing Critical Challenges in Advanced Packaging, Memory, More
Onto and Nova’s management teams highlighted a few core products that are driving growth or seeing strong orders and adoption from major customers. These products address some of the more pressing challenges in advanced packaging, HBM and memory, and leading-edge nodes.
Israeli-based Nova has a diverse metrology equipment and software portfolio, from dimensional to materials to chemical metrology. One of Nova’s leading products is PRISM 2, the next-generation PRISM which offers improved sensitivity and accuracy in critical dimensions metrology.
Nova noted that its PRISM 2 product saw strong adoption last quarter, especially in GAA, with around half of its record bookings stemming from “advanced packaging processes, such as Through-Silicon Via, where PRISM has a unique advantage in filtering information from specific underlayers.”
PRISM 2 provides improved accuracy and reliability for critical component measurements in processes such as advanced logic chip fabrication and stacking nanosheets for GAA fabrication, as well as 3D NAND and DRAM.
Nova also added that “demand is also consistently high for our advanced integrated metrology and XPS material metrology platforms,” as it saw “record booking of VeraFlex XPS platforms this quarter, of which over 40% resulted from capacity growth” in FinFET advanced nodes.
Nova’s VeraFlex XPS (X-ray photoelectron spectroscopy/materials metrology) helps analyze surface structures, identifying bonding, contaminants or defects in advanced nodes for process control in high-volume manufacturing.
US-based Onto’s core products span defect inspection equipment, dimensional (optical CD) and material metrology, and lithography tools. Onto’s Dragonfly systems, which drove Q2’s performance, witnessed “better-than-expected demand” for advanced packaging for AI chips as it reached another revenue record.
Dragonfly G3 provides combo 2D and 3D inspection and process control for advanced packaging, HBM and chip-on-wafer GPUs. For example, Onto noted last August that it finalized more than $100 million in Dragonfly G3 orders for chip packages “that combine a graphics processor (GPU) and numerous high bandwidth memory (HBM) devices to create an AI GPU in a single package.”
Onto also said that Atlas and Iris demand for GAA investments were a driver of Q2’s performance, while new product launches in panel lithography, 3D bump metrology sensors for smaller interconnects in HBM, and subsurface defect inspection sensors are expected to see strong adoption through the end of the year.
By comparison, leader KLA offers a comprehensive portfolio of metrology equipment for measuring “pattern dimensions, film thicknesses, layer-to-layer alignment, pattern placement, surface topography and electro-optical properties” for chip and substrate manufacturing, from new process development, product verification, and high volume manufacturing. KLA provides advanced wafer packaging equipment, overlay metrology equipment, reticle metrology and inspection tools, OCD, shape and film metrology equipment, sheet resistance metrology equipment, and more.
Customer Concentration Extremely High
It’s common for small cap semiconductors to have high customer concentration, especially at the equipment level, as there are a limited number of fabs globally. Nova and Onto are no exception.
For Nova, its top five customers accounted for 52% of revenue in 2023, down from 57% of revenue in 2022 and 70% in 2021. Nova’s largest customer accounted for 19% of revenue, while its fifth largest customer contributed 5% of revenue. The customers are not named.
Revenue from Nova’s largest customer(s) declined from ~$130 million in 2021 and 2022 to $108 million in 2023.
Onto Innovation has provided a breakout for its top three customers, along with another figure that highlight its customer concentration.
For Onto, its three largest customers accounted for 56% of revenue in the first half of fiscal 2024. TSMC accounted for 23% of revenue, up from 13% in the same period last year. Samsung accounted for 20% of revenue, down slightly from 21% last year.
SK Hynix has risen to be Onto’s third largest customer at 13% of revenue, up from <10% last year. Onto also has shared that TSMC accounted for 21% of its net accounts receivable in the first half of 2024, with Samsung accounting for 8%.
Both Nova and Onto are reporting accelerating revenue growth in Q2 after returning to growth in Q1 this year after four consecutive quarter of declines. However, Onto guided for revenue growth to decelerate in Q3, while Nova forecast this acceleration to continue but be short-lived.
Onto reported 27.1% YoY growth to $242.3 million in revenue in Q2, accelerating from 14.9% growth in Q1. Management said that Q2’s growth and revenue above its guided $230-240 million range was “driven by additional pilot line expansions for high-performance computing using gate-all-around transistor architecture and high bandwidth memory (HBM) supporting AI market growth.” This was likely driven primarily by increased spend by TSMC and SK Hynix, seen within the customer concentration figures.
Advanced packaging and specialty device revenue reached a fourth-consecutive record at $164 million, up 49% YoY, while Onto added that it “closed over $300 million of volume purchase agreements issued by two customers for their AI advanced packaging and gate-all-around investments through 2025,” again likely to be coming from TSMC. Management expects that GAA and advanced packaging at multiple customers will be primary growth drivers through 2025.
Nova reported revenue growth of 27.8% YoY to $156.9 million in revenue in Q2, accelerating from 7.3% in Q1. Metrology product revenue was $124.6 million, accelerating to 30% YoY growth from just 6% YoY in Q1 and (16%) in Q4.
Management said that it saw “record revenue from chemical metrology, driven by demand in high-bandwidth-memory and front-end logic processes,” while demand for GAA and advanced packaging was increasing with “faster-than-expected adoption” for its PRISM 2 platform. Management added that they also saw record bookings for advanced packaging and materials metrology.
Q2 also marked both companies’ fastest YoY growth rates in two years — here’s a look at how Onto and Nova have recovered from 2023’s slowdown:
Looking ahead for Q3, Onto guided for revenue growth of 20.7% YoY to $250 million in revenue at midpoint, a more than 6 percentage point deceleration. Nova forecast a nearly 6 percentage point acceleration to 33.5% growth to $172 million in revenue at midpoint.
Through 2025, analysts expect Onto to maintain growth in the high-teens each quarter, while Nova’s higher growth rate of 30%+ is expected to decelerate into the low-teens and high-single digit range five quarters out.
Onto is expected to see quarterly revenues rise to above $300 million, while Nova is currently forecast to see revenues begin to flatline in the mid-$190 million range. Nova may be more exposed to cyclicality in the metrology industry with its focus on film metrology equipment, which may see faster growth in the ramp phase that stabilizes later on.
Onto provided a quick look into what’s driving 2025 growth: “We expect to benefit from continued investments in gate-all-around capacity, and the announced capacity expansions from several high-bandwidth memory and logic packaging manufacturers, specifically for HBM. We expect new capacity coming online in the first half of the year to support the increase of HBM content for NVIDIA's AI processors from 80 to 192 gigabytes and for AMD's AI processors from 192 gigabytes to 288 gigabytes.”
However, it’s not all AI revenue for the two. Onto clarified that AI packaging drove over half of specialty and advanced packaging revenue in Q2, implying AI packaging revenue of at least $82 million, or just over one-third of quarterly revenue. Nova is seeing demand stem from AI-driven end markets such as HBM, GAA and TSVs, though they have not broken out AI’s specific impact on revenue.
Long-Term Financial Targets:
Revenue
Both companies have set out long-term financial targets, including revenue, margins and EPS. The revenue targets will likely be achieved in 2027 to 2028 based on current expectations and historical trends. Both companies expect to have enough capacity by year end to reach these long-term revenue targets.
Nova set its long-term target of $1 billion, more than 50% higher than FY24’s projected $648 million. There are currently six analysts covering Nova with only two analysts providing estimates through Dec of 2027 with consensus at $995.7 million.
Onto has its long-term revenue target at $1.8 billion, nearly double FY24’s projected $980 million. There are eight analysts covering Onto with only three analysts covering the stock through Dec of 2027 with estimates at $1.56 billion. The Dec 2028 estimate is more in line with Onto’s projections with only one analyst providing an estimate of $1.84 billion.
Here’s Onto’s target model, which provides a more detailed view down the line as revenue increases incrementally by $200 million:
Nova is currently ahead of its long-term margin targets, currently benefiting from higher ASPs due to product mix, while Onto is behind on gross margin targets for its $1 billion model.
Here’s how Nova’s margins look relative to its long-term target (referencing non-GAAP margins):
Nova reported GAAP gross margin of 59% in Q2, flat QoQ and up 200 bp YoY. Non-GAAP gross margin was 61% in Q2, again flat QoQ and up 200 bp YoY.
For Q3, Nova guided gross margins to dip 300 bp QoQ sequentially, to a GAAP gross margin of 56% and non-GAAP gross margin of 58%. Nova said that faster adoption of higher ASP/margin products has previously boosted margins, but they remain at the high-end of targets despite this fluctuation.
GAAP operating margin was 29% in Q2, expanding 300 bp QoQ and 600 bp YoY. Non-GAAP operating margin was 34%, up 200 bp QoQ and 600 bp YoY. Management pointed out that non-GAAP operating margin was ahead of targets of 27% to 31%, and while Q3’s non-GAAP margin was guided to decline sequentially to 32%, this is in line with previous quarters with Q2 being a strong outlier.
Onto sits behind gross margin targets, though it sees margins expanding in the coming quarter.
Onto reported GAAP and non-GAAP gross margin of 53% in Q2, up 100 bp QoQ and flat YoY. Though current FY revenue estimates are just 2% below the $1 billion target model, gross margins are shy of its range, with Onto targeting non-GAAP gross margins of 56% to 57%.
For Q3, management guided to gross margins between 53% to 55%, flat to up 200 bp QoQ, driven by growth in advanced nodes and optimization in manufacturing. Though it’s a step in the right direction, it’s still short of targets by ~200 bp at midpoint.
GAAP operating margin was 20% in Q2, up 100 bp QoQ and 700 bp YoY. Non-GAAP operating margin was 27%, up 200 bp QoQ and 600 by YoY.
Excluding amortization (to align with long-term targets), non-GAAP operating margin was 32%, in line with the high end of the $1 billion model despite the gross margin shortfall.
For Q3, management’s guidance implies non-GAAP gross margin of 28%, up 100 bp QoQ.
EPS
Both Nova and Onto are reporting strong EPS growth, with Nova reporting 48% YoY growth to $1.41 in GAAP EPS of $1.41 and Onto reporting 102% YoY growth to $1.07 in GAAP EPS. It’s rare to see such high EPS numbers from small cap stocks, and long-term targets are both strong and rather achievable.
For Nova, management is targeting non-GAAP EPS of at least $7 per share by the time it reaches $1 billion in revenue. For the first half of 2024, Nova’s non-GAAP EPS is currently $3 per share, suggesting that if margins can be maintained at the high end of its model, $7 in EPS is easily achievable. Analyst estimates currently project $9.58 in EPS on $996 million in revenue in 2027, foreseeing Nova surpassing the $7 EPS target next year on $757 million in revenue.
Onto is targeting non-GAAP EPS of $5.50 to $6.00 at $1 billion in revenue, and long-term up to $8.50 in EPS at $1.4 billion in revenue. Non-GAAP EPS for the first half of 2024 was $2.50, and with Q3 guided to $1.30 at midpoint, Onto would need to report $1.70 in non-GAAP EPS in Q4 to reach the low end of its target at $5.50.
Onto’s longer-term view emphasizes increased operating leverage to drive earnings growth as gross margin expansion is minimal. Management is eyeing just a 2% expansion in gross margin but a 4% expansion in operating margin. This is expected to drive EPS more than 40% higher, from $6 to $8.5 per share at the high end of the range. Analysts are much more optimistic on the degree of operating leverage that Onto can drive at $1.4 billion in revenue, with estimates calling for about $9.35 in EPS on $1.44 billion in revenue in 2026. Again, it’s rare to see EPS numbers this high with small cap semiconductor stocks.
Balance Sheets, Cash Flows Healthy
With operating and net margins in the high-20% to low-30% range, Onto and Nova enjoy healthy balance sheets and cash flows.
Onto has $786 million in cash, equivalents and marketable securities on hand, zero debt, and total liabilities of $174 million. Operating cash flow for 1H 2024 increased 50% YoY to $122 million, or 26% of revenue (versus 21% of revenue in same period last year). Free cash flow rose 49% YoY to $103 million, or 22% of revenue (versus 18% of revenue in the same period last year).
Nova has $759 million in cash, equivalents, and marketable securities, and $198 million in convertible senior notes, which, if converted, would equal about 3.4% dilution to existing shareholders. Nova has no outstanding debt outside of the convertible notes. Operating cash flow for 1H increased nearly 154% YoY to $120 million, or 40% of revenue (versus 19% of revenue in the year ago period). Free cash flow rose more than 178% YoY to $115 million, or 38% of revenue (versus 17% of revenue in the year ago period).
Inventories are where the two differ, with Nova increasing inventory as Onto is working to reduce inventory. Nova reported inventory of $156.6 million at the end of Q2, up more than 13% from the end of 2023. Onto is working on inventory management, reporting $319.7 million in inventory in Q2, down from $327.8 million at the end of 2023. Management expects to further reduce inventory by $10 million to $15 million in Q3 and exit 2024 with inventory below $300 million, or a $50 million YoY reduction.
Valuations Have Enjoyed a Premium
With clear exposure to AI and HPC trends in HBM and advanced packaging, as well as strong operating, net and cash flow margins — and triple digit cash flow growth for Nova – the two have recently enjoyed premium valuations to other chip equipment stocks and metrology leader KLA.
Onto currently trades at nearly 62x TTM earnings and Nova at almost 42x TTM earnings, compared to 38x TTM earnings for KLA and 22x TTM earnings for Applied Materials, which also has exposure to metrology and advanced packaging. Multiples have compressed slightly, with Onto trading above 80x earnings and Nova above 55x earnings earlier this year; however, it’s quite a large premium to their three-year average TTM earnings multiples of 37x for Onto and 31x for Nova.
On a forward basis, strong EPS growth of 40% YoY for Onto and 31% YoY for Nova has brought forward multiples lower, though still elevated relative to peers. Onto trades at nearly 40x forward earnings of $5.22 for FY24, while Nova trades at 31x forward earnings of $6.37 for FY24. KLA trades at 26x forward earnings with 25% YoY growth expected, and Applied Materials at 23x forward earnings with just 6% YoY growth expected.
On a top-line basis, Onto, Nova and KLAC are currently trading in the high 10x, to mid 11x PS range. Multiples for the trio have been in lockstep for more than a year, following each other quite closely since the 5-6x range around Nvidia’s blowout earnings report in May 2023, the first signs of the present AI and HBM boom.
Looking longer-term, it’s quite clear that these are some of the highest top-line multiples Onto and Nova have traded at in the past decade. Both companies’ 10-year average PS multiple hovers around 4.5x to 5x, so the two are currently trading at more than double their 10-year average. If earnings or revenue growth falters, multiple compression is a possibility given the premium valuations of the two.
Technical Analysis
By Knox Ridley
What caught our eye about the technical patterns in both NVMI and ONTO was how similar their long-term trends appear to be unfolding. Like many AI names that we track, they appear to be setting up for a correction within a larger uptrend that should go on for several years.
Most stocks and markets appear to have either topped in 2021 or are in their final swing higher in 2024/2025. So, while the broad market makes a series of lower highs into the coming years, these names would trend higher.
Onto Innovation (ONTO)
The below chart is a weekly chart. In other words, every candle is one week’s worth of price data. This better helps us decipher the long-term trend. Note the vertical move off the 2009 low, which was followed by a multi-year, messy and overlapping correction into 2015. This best resembles waves 1 and 2 in a very large 5 wave uptrend.
This is further supported by the price action into today’s developing top. The below Elliott Wave count has us in the final swing of wave 3 within the larger 3rd wave. We ccould see a final push into the $257 – $339 region. However, this is not a move that we would chase, considering the warning signs.
For one, we have a completed 5 wave pattern off thew COVID low. What follows 5 waves higher is usually a 3 wave retrace. Secondly, since mid-2023, we have seen price make higher highs while momentum is making lower highs. This is characteristic of 5 wave pattern, where peak momentum typically is seen in wave 3, as we wave 5 is met with less volume and less momentum.
Nova (NVMI)
NVMI has a similar long-term chart as ONTO. We can see a near vertical 5 wave move off of the 2009 low, followed by a pullback into 2011. This lines up well as waves 1 and 2 of a very large 5 wave pattern.
Like ONTO, Nova is in the final swing of wave 3 of the larger 3rd wave. If this count is accurate, the 4th wave pullback should take us back to around projected the halfway point of this larger 5 wave pattern, which is where we would look to potentially enter both stocks.
If we zoom in on the current correction, it appears that NOVA is setting up for the final drop in this correction. A move below $186 will confirm this as we target $152 – $138 for our first entry. If NOVA can instead hold $186 and then breakout above $230, we will be in the final swing of this 3rd wave. This stock has a lot to prove before we’d consider it a longer-term buy rather than a momentum stock.
Conclusion
Nvidia, TSMC, and Micron are bellwethers for AI accelerator, advanced packaging and HBM demand, with the three showing no signs of slowing any time soon. This will continue to create opportunities for growth in the metrology equipment market, as AI accelerator-related HBM and advanced packaging demand continues to grow and outstrip supply.
Metrology equipment is positioned well to capture the increase in complexity from advanced nodes, memory stacking and other chipmaking processes where demand is outstripping supply into the foreseeable future.
Onto and Nova share in these tailwinds, evidenced by accelerating quarterly revenue in Q2 and strong margins, cash flows and healthy balance sheets. We will be watching for further evidence that these companies are participating in the Ai boom in the upcoming quarters.
This analysis is a preview of what you can expect in our upcoming Discovery tier, which will provide additional analysis on new idea generation stocks that are not currently in the I/O Fund portfolio. We look forward to launching this tier November/December. There will be no changes to our current service tiers, rather I/O Fund Discovery is a service for those who want more new stock ideas beyond what our service currently provides. Stay tuned for more information!
Damien Robbins, Equity Analyst at I/O Fund, contributed to this analysis.
Please note: The I/O Fund conducts research and draws conclusions for the Fund’s positions. We then share that information with our readers. This is not a guarantee of a stock’s performance. Please consult your personal financial advisor before buying any stock in the companies mentioned in this analysis.
This article was originally published on Forbes on Oct 10, 2024,10:58pm EDTForbesForbes on Oct 10, 2024,10:58pm EDT
The Fed surprised the market with an aggressive 50 bps cut recently, which has pushed the S&P 500 back to new all-time highs. However, not all markets are celebrating this move. Bond yields and mortgage rates, for example, have been in an uptrend since this decision, which is not normal to see at the onset of a rate cutting cycle.
Also, the bull market leaders – the Mag 7 and AI focused semiconductors – are making a series of lower highs, not confirming this move in the S&P 500. This divergence between the market leaders and the broad market has been the consistent theme of the I/O Fund’s broad market reports in 2024. More times than not, the bull market leaders will lead on the way up, as well on the way down. So, when my firm sees the primary beneficiaries of a bull market start to make lower highs while the broad market makes higher highs, it tends to be a warning.
In this report, my team will address the risks brewing in the market. The strange behavior in the bond market could be signaling that the FOMC has made a policy error. This coupled with key tech stocks trending lower against the S&P 500’s advance, has my firm cautious for the time being.
What Big Tech and AI Stocks Are Telling Us
In 2023 we saw these market leaders trending higher with the broad market. This was a powerful trend that lasted into late 2023. As a result, the collective Mag 7 returned around 90% in 2023 vs. the S&P 500 returning 24%. However, this trend is not continuing into 2024, as we are beginning to see cracks in market leadership.
This year, the Mag 7 are up ~30% compared to the S&P 500’s ~20%. Though this year has been excellent for investors, it’s concerning the relative strength between the bull market leaders and the broad market is narrowing, which has been a constant theme in our broad market analysis throughout all of 2024.
“When the cycle leaders start to underperform, it tends to mark the start of a trend change. The FAANGs have been the undoubted leaders of this bull run, and we are now seeing them start to trend lower against the indexes. More times than not, the leaders on the way up, tend to be the leaders on the way down.”
More importantly, the Mag 7 is making a lower high, while the S&P 500 makes a higher high. In other words, the bull market leaders are not confirming this push higher in the broad market. This is a rare pattern that has only shown up one other time in this bull market – July of 2023, just before we saw an almost 11% correction in the broad market.
A rare pattern observed in the bull market, similar to July 2023, preceding an 11% correction in the broad market. – I/O Fund
This divergence is not only happening with the Mag 7, but it’s also happening with the most important sub-sector within tech due to AI – semiconductors.
Since the current bull market began on October 13th of 2022, the Mag 7 has returned over 102% vs. the S&P 500’s 61%. During the same period, semiconductors have returned over 174%. The leading stock, Nvidia, is up over 967% over the same period. So, while the Mag 7 are the popular market leaders, the true market leaders of the current bull cycle are semiconductors, and specifically, Nvidia. This is a trend that the I/O Fund positioned for in 2022, making NVDA our largest position, as we rotated out of cloud stocks and into AI.
Performance of the Mag 7, S&P 500, and semiconductors since October 13, 2022: The Mag 7 returned over 102%, the S&P 500 returned 61%, and semiconductors returned over 174%, with Nvidia up over 967%. – I/O Fund
Semiconductor Index (SMH)Semiconductor Index (SMH)
SMH has a history of leading market swings in the broad market. Since 2021, every time the S&P 500 made a new high without SMH, it preceded a period of volatility. Today’s divergence is one of the largest on record. The Semiconductor Index topped in July at $283, and is still well below this high, compared to the S&P 500 that just pushed to new a new high this week at 5796.
Chart illustrating the semiconductor sub-sector’s corrective pattern, featuring a 3-wave drop since June followed by a bounce from the August 5th low, suggesting a potential final drop targeting $190 to $165. – 123
When digging deeper into this key sub-sector, we can see that a clear corrective pattern is playing out. Since the June top, there is a clear 3 waves down. This has been followed, so far, by a symmetrical 3 wave bounce off the August 5th low. This pattern best fits a standard corrective patten. This implies that a final drop is still needed, which is targeting between $190 – $165.
The advance seen today is poking above the downtrend line from the July top. However, this is happening on less volume and less momentum. Note the momentum indicator below the chart. It has given three lower highs while price provided three higher highs. This is a rare pattern that tends to precede a trend reversal.
Chart depicting the current market advance above the July downtrend line, showing decreasing volume and momentum. The momentum indicator reveals three lower highs, while the price shows three higher highs, suggesting a potential trend reversal. – I/O Fund
Sign up for I/O Fund's free newsletter with gains of up to 2600% because of Nvidia's epic run – Click hereClick hereClick here
Nvidia (NVDA)Nvidia (NVDA)
Nvidia topped in June at $140, and failed to make a new high in July with the rest of the Semiconductor Index. This was a warning that semis, and the broad market, were heading lower.
This same relative weakness is still present today. While most semiconductors have broken out above their August high, NVDA remained below it. This week, it has moved above the August high, which appears to be the final move in this bounce which is happening on less momentum and less volume. This lines up with the I/O Fund’s game plan, which was to sell a quarter of our NVDA position in June around $129, and attempt to buy it lower in the coming months, which was discussed in detail on my recent interview.
Chart illustrating NVDA’s incomplete corrective pattern, indicating potential drops below $114 and $108, which could lead to a decline toward the $90 – $70 region, completing a multi-month correction. – I/O Fund
Like SMH, NVDA appears to be tracing an incomplete corrective pattern. A move below $114 and then $108 will signal that the stock is heading toward the $90 – $70 region, which would complete this multi-month correction.
NVDA remains weaker than the broad market, as well as SMH. Considering the importance of this stock, as long as it remains below its June high, it is a warning to the current broad market advance.
Are New Leaders Developing?
Some have argued that the market is taking gains in the AI leaders and spreading that money out into beaten down sectors. In other words, there is a healthy broadening out of the market, which typically exhibits strength.
The narrative that supports this idea is that the FOMC just offered a surprise 50 bps rate cut into a seemingly healthy economy. The cheaper cost of borrowing should propel more economically sensitive sectors to play catch-up as the economic expansion continues.
As plausible as this sounds, it’s just not showing up in data, yet. Since the Fed cut rates on September 18th, we are not seeing money flowing into your beaten down sectors that should do well if this narrative is playing out.
Sectors like, transportation, small caps, retail sales, consumer discretionary and high beta are still under their 2021 highs. These are the sectors that would benefit from a soft-landing. As you can see below, aside from consumer discretionary, they are all underperforming the S&P 500.
Chart illustrating the market dynamics where AI leaders are gaining, but beaten down sectors like transportation, small caps, retail sales, consumer discretionary, and high beta are still lagging behind the S&P 500, showing no significant investment flow after the FOMC’s 50 bps rate cut. – I/O Fund
While Nvidia and Semiconductors are making a lower high, there is more money flowing into defensive and inflationary markets, like, Energy, Apple, Utilities and even the US dollar is doing better than the markets that would support the broadening out narrative.
What the Bond Market is Telling Us
Another unusual development since the Fed cut rates is that bonds are not acting as they should at the onset of a rate cutting cycle. Historically, the relationship between long-dated bonds and the Fed cutting rates has been an inverse relationship. As the Fed cuts rates, it is usually in the face of a weakening economy. If prices are going down due to demand collapsing, then a fixed yield is desirable in that environment, meaning that we should see bonds going higher.
This is not what is happening today. The day the Fed cut rates, the 10-year government bond began a sharp decline and is currently down nearly 4% from its high. This is a big move for the 10-year bond.
Chart showing the 10-year government bond’s sharp decline after the Fed’s rate cut, highlighting an unusual trend where bond prices typically rise in a weakening economy. The bond is down nearly 4% from its high. – I/O Fund
This is unusual behavior, as the above chart shows. Bonds should be going higher, not lower, based on historical comparisons. The popular narrative for this behavior in the bond market is that this is evidence that the FED accomplished a soft landing.
If we were going into a slowing economy, which could lead to a deflationary event, then bonds would be catching a bid. So, the fact that we are not must mean that the economy is strong, and the economic expansion will only continue. This will then propel asset prices higher, as well as inflation, making the need for fixed yields a poor investment.
As we just saw, the market is not buying this narrative, as money is not flowing into the sectors that would support this thesis. So, what could be going on?
It’s important to understand that the Fed does not control the 10-year yield; this is controlled by the bond market’s expectations for future growth and inflation. The Fed’s reasoning for aggressively dropping rates on September 18th was that inflation is heading to 2% and the employment market is starting to show weakness.
Since then, the ISM non-manufacturing PMI posted its hottest reading since February of 2023. Twelve out of the 18 segments of this report stated that prices are rising, not falling.
Chart highlighting the ISM non-manufacturing PMI’s highest reading since February 2023, with 12 of 18 segments reporting rising prices. Additionally, the labor market added 107,000 more jobs than expected, revising September figures up by 17,000, causing the unemployment rate to drop from 4.22% to 4.05%. – YCharts
This was accompanied with a labor market that is much stronger than expected. The most recent jobs report showed that the US added 107,000 more jobs than expected, while September’s report was revised higher by 17,000 jobs. This caused the unemployment rate to drop back to 4.05% from 4.22%.
This is further confirmed with current mortgage rates. Everyone was expecting mortgage rates to drop with the Fed Funds Rate. However, since the cut, there has been a sharp increase in average mortgage rate from 6% to 6.32%.
Current mortgage rates defy expectations, rising sharply from 6% to 6.32% following the Fed’s rate cut, contrary to the anticipated decrease. – YCharts
The reason for this is because mortgage rates are not determined by the Fed. Instead, they are the result of an equation that includes the 10-year yield and the borrower’s credit score. So, the 10-year getting sold, means yields are going up.
This happening on the day of the FED’s rate cut policy means the bond market is not convinced inflation is heading to 2%, which is pushing mortgage rates higher. This means that we could be getting signals that the FED made a policy error, and dropped rates too soon, as yields continue to climb in the weeks after this decision.
Interesting enough, at the Grant’s Annual Fall Conference, Druckenmiller stated that his largest bet is shorting the US bond market.
His reasoning is not because the Fed achieved a successful soft landing, which the consensus believes, but it is because “bipartisan fiscal recklessness is on the horizon.” In other words, the larger our deficits become, the more money will need to be borrowed to cover interest payments. As more and more debt gets created, yields will have to go up to attract more buyers, which will put pressure on fiscal budgets, and therefore creates a vicious cycle.
To put this into perspective, the budget deficit for the fiscal year 2024 is going to come in around $1.9 Trillion, or 6.7% of GDP. There is no other year in US history where the budget deficient was this large outside of a major war, like WW I & WW II, or dealing with a major recession, like 2008. It is unheard of to have fiscal spending this high, in an expanding economy, with historically low unemployment. This makes you wonder what the deficit will look like in the face of a contraction.
This was an issue that the market has been aware of for decades but was able to ignore due to historically low interest rates. With rates low and trending lower, this fiscal recklessness was allowed to go on. However, we are seeing for the first time in 30 years, bond yields are starting a new uptrend.
Since 1981, the 10-year yield has been in a classic downtrend, making a series of lower highs. This trend made borrowing easier, as low rates made the cost of borrowing affordable. However, in 2021, yields broke this downtrend and made their first higher highs in 30 years. Today, yields are higher than they were in 2008, making the cost of borrowing higher than most investors are used to in over 20 years.
Diagram illustrating the market’s awareness of excessive debt and low interest rates enabling fiscal recklessness. Since 1981, the 10-year yield has followed a downtrend until breaking the trend in 2021, resulting in the highest borrowing costs seen in over 20 years. – I/O Fund
If this uptrend in yields continues, which looks likely, it would become problematic for inflation expectations, as well as the Fed’s ability to lower rates. It will also become problematic for the cost to service government debts, as more debt will be issued at higher rates to cover current service requirements. And, it will become problematic for stocks, specifically high beta stocks that need to borrow to fund operations, as estimates on future cash flows will have to account for a higher cost to borrow. In short, the last +20 years have built on the idea that inflation will not happen, and the FED can keep rates close to zero.
Every Thursday at 4:30 pm Eastern, the I/O Fund team holds a webinar for premium members to discuss how to navigate the broad market, as well as various stock entries and exits. We offer trade alerts plus an automated hedging signal. The I/O Fund team is one of the only audited portfolios available to individual investors. Learn more here.Learn more hereLearn more here.
Broad Market Analysis
The bull market pattern off the 2022 low has taken the shape of a messy diagonal pattern. This is a 5 wave pattern where the internal waves are 3 waves in all directions. It is also marked with large, overlapping swings. Note how wave 4 went into wave 1 territory – this is typical of diagonals. The 5th wave in this pattern is a blow off, and from what I can tell, we are in the final swing of this pattern.
If SPX can breakout above 5825, then it can likely push into the 6000 – 6185 region. If instead, it breaks down below 5675 this will be your first indication of a potential trend change. Below 5500 and then 5115 will be the final confirmations.
Chart illustrating a messy diagonal pattern in the bull market since the 2022 low, consisting of 5 waves with overlapping swings. Key breakout points are at 5825, while downtrend confirmations are at 5675 and 5500, indicating potential trend changes. I/O Fund
In conclusion, as the economic expansion continues, the odds of a recession remain low. However, money is not flowing into the beaten down sectors that would benefit from this reality. Instead, defensive and inflationary names are getting more flows than transportation, small caps, high beta and retail sales. The market leaders continue to make lower highs while the broad market pushes higher, and bonds are getting sold as if the FED stopped cutting rates, not started. The warning signs are high, and my firm remains defensive until these signals reverse, or the market corrects.
If you want to track the potential top in equities, join I/O Fund next Thursday, October 17th at 4:30 pm EST, for our premium webinar. We will go over the levels that need to hold and the specific AI stocks we are targeting for the next leg higher.
Knox Ridley, Portfolio Manager of the I/O Fund, contributed to this analysis.
Please note: The I/O Fund conducts research and draws conclusions for the company’s portfolio. We then share that information with our readers and offer real-time trade notifications. This is not a guarantee of a stock’s performance and it is not financial advice. Please consult your personal financial advisor before buying any stock in the companies mentioned in this analysis. Beth Kindig and the I/O Fund own shares in NVDA at the time of writing and may own stocks pictured in the charts.