AOSL Q1 2025: Foreshadowing Consumer Weakness

This quarter, Alpha and Omega reported a beat in Q1, yet gross margins are contracting due to eroding average sales prices (ASPs). AOSL guided Q2 below consensus with further margin pressures for both gross and operating margin. The commentary implies a weak Q4, one that is weaker this year than it was last year, despite 2024 largely being an expected rebound year.

Regarding AOSL’s partners, it seems that AMD’s beat on desktop is flowing through to AOSL, with management stating desktop helped offset laptop weakness. Although there is bound to be progress in the graphic cards and AI accelerator cards eventually, the emerging AI use case is less clear in this quarter as these both took “a pause before the next platform transition.”

Our firm is weighing sitting a quarter or two out on AOSL, but it’s worth noting management reiterated the bullish comment about bill-of-materials expected to increase from $5 to $6 for MOSFETS to up to $20 for the MOSFETs powering GPUs.

This and more is detailed below.

Revenue

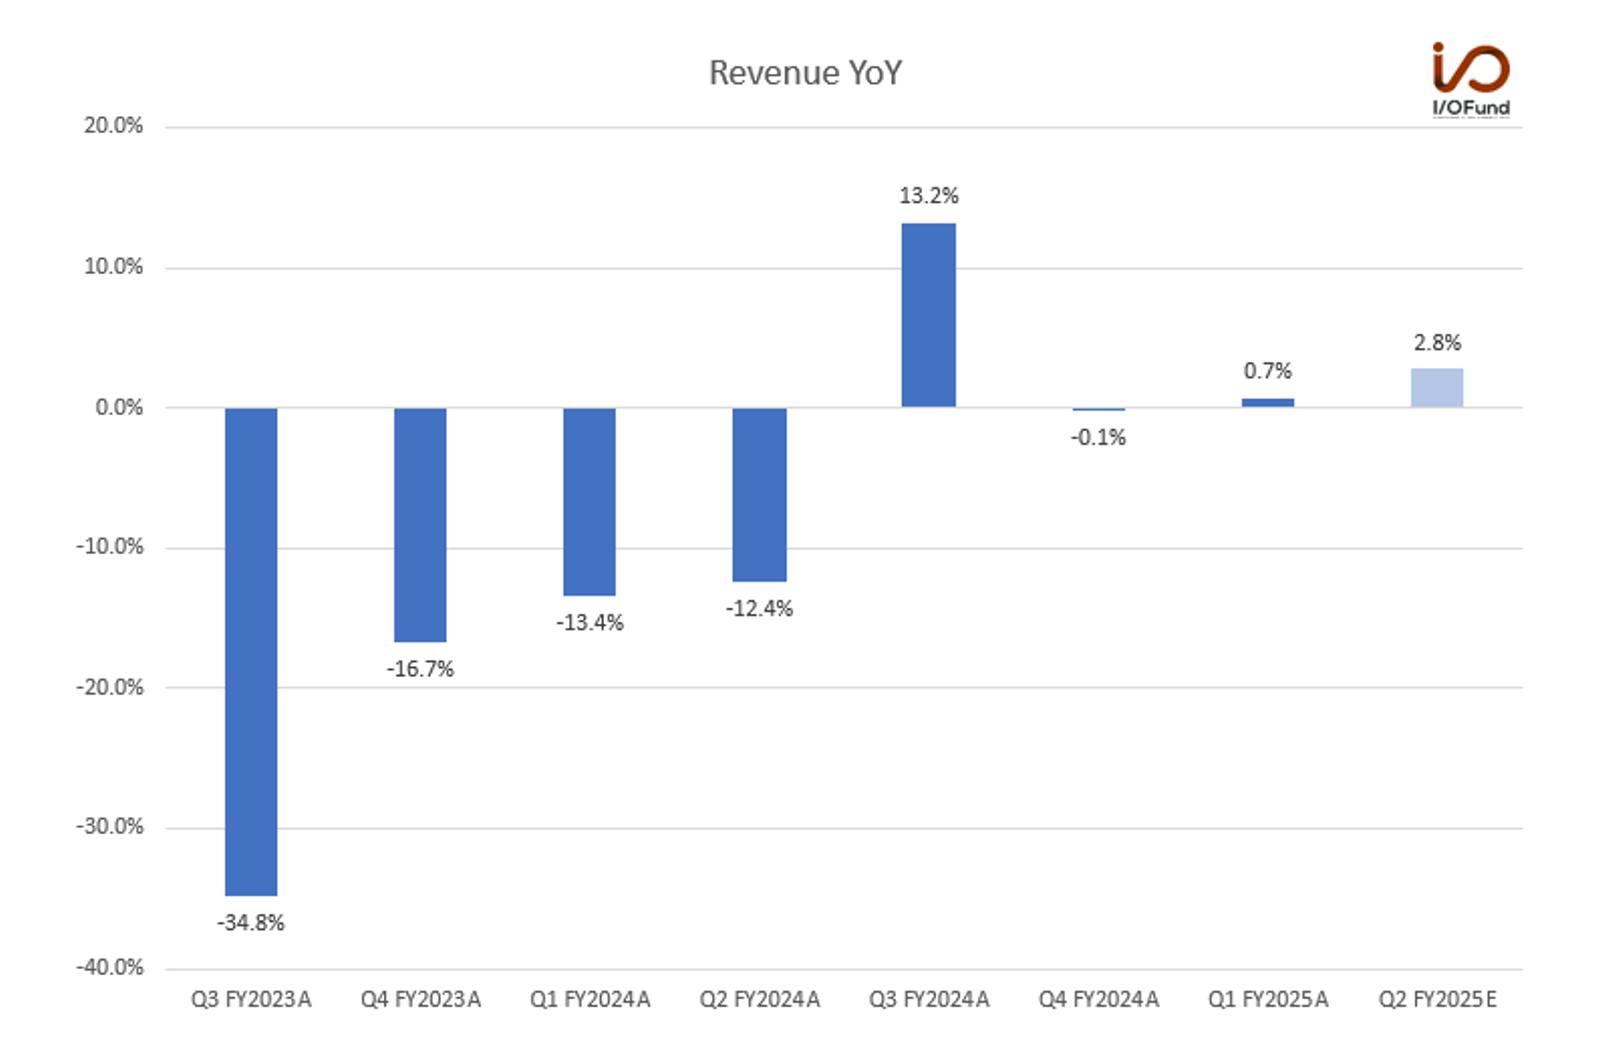
Due to consumer weakness, AOSL missed revenue guidance for the December quarter. The company was expected to report 6.3% growth for revenue of $175.7 million, and is instead guiding for 2.8% growth for revenue of $170 million. This was more than $5 million below the analyst estimates.

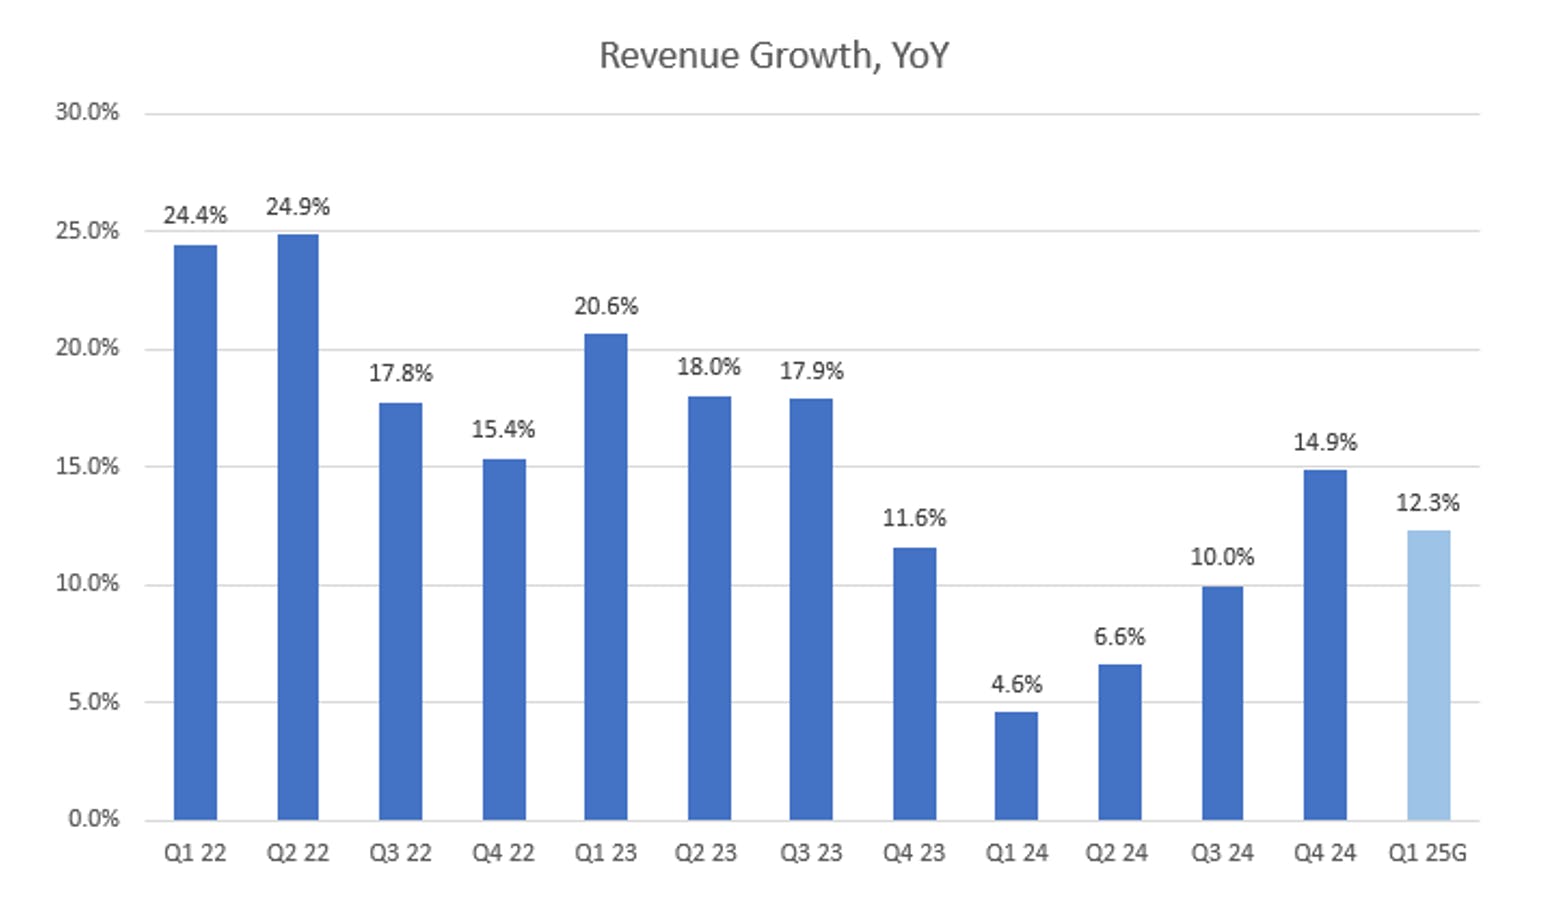
This quarter ending in September, AOSL reported $181.9 million in revenue in fiscal Q1, up 0.7% YoY and ahead of expectations by $1.3 million. AOSL reported YoY growth in the quarter despite expectations for a marginal YoY decline.
The miss for next quarter is primarily due to an erosion in average sales prices, as the CFO stated: “During the quarter, we did see increased pricing pressure. I mean, I guess this is a reflection of softer overall market recovery. Competitors impacted by inventory correction and demand slowdown, especially in automotive and industrial. They're shifting more toward consumer-related markets to fill their fabs.

So we see increased competition from all players, large or small. Right now, I mean, the ASP erosion for this year is more trending toward high single-digits annual erosion versus typical mid to high single-digits. Here, what we want to do is to accelerate our new product rollout to counter the ASP erosion. So that has been what we have been doing all along the years.”

Looking forward, AOSL seemed to imply that it would be more of a calendar Q2 turnaround with comments that they lack visibility into 2025 (which is not exactly encouraging): “At this point, our visibility into 2025 is limited and the calendar first quarter of 2025 is typically seasonally soft as well.”

Margins

Q1’s report missed on the guided gross margin and guided adjusted gross margin, at the midpoint. Management is also guiding for further contraction on gross margin next quarter and also a contraction on the operating margin next quarter. As stated above, the weaker gross margin is due to lower average sales prices.

  • GAAP gross margin was 24.5%, slightly below guidance for 25% at midpoint and contracting 120 bp QoQ and 370 bp YoY. Adjusted gross margin was 25.5%, below guidance for 26.4%, and contracting 90 bp QoQ and 330 bp YoY. Management said the contraction in adjusted gross margin was “mainly impacted by ASP erosion and mix changes.”
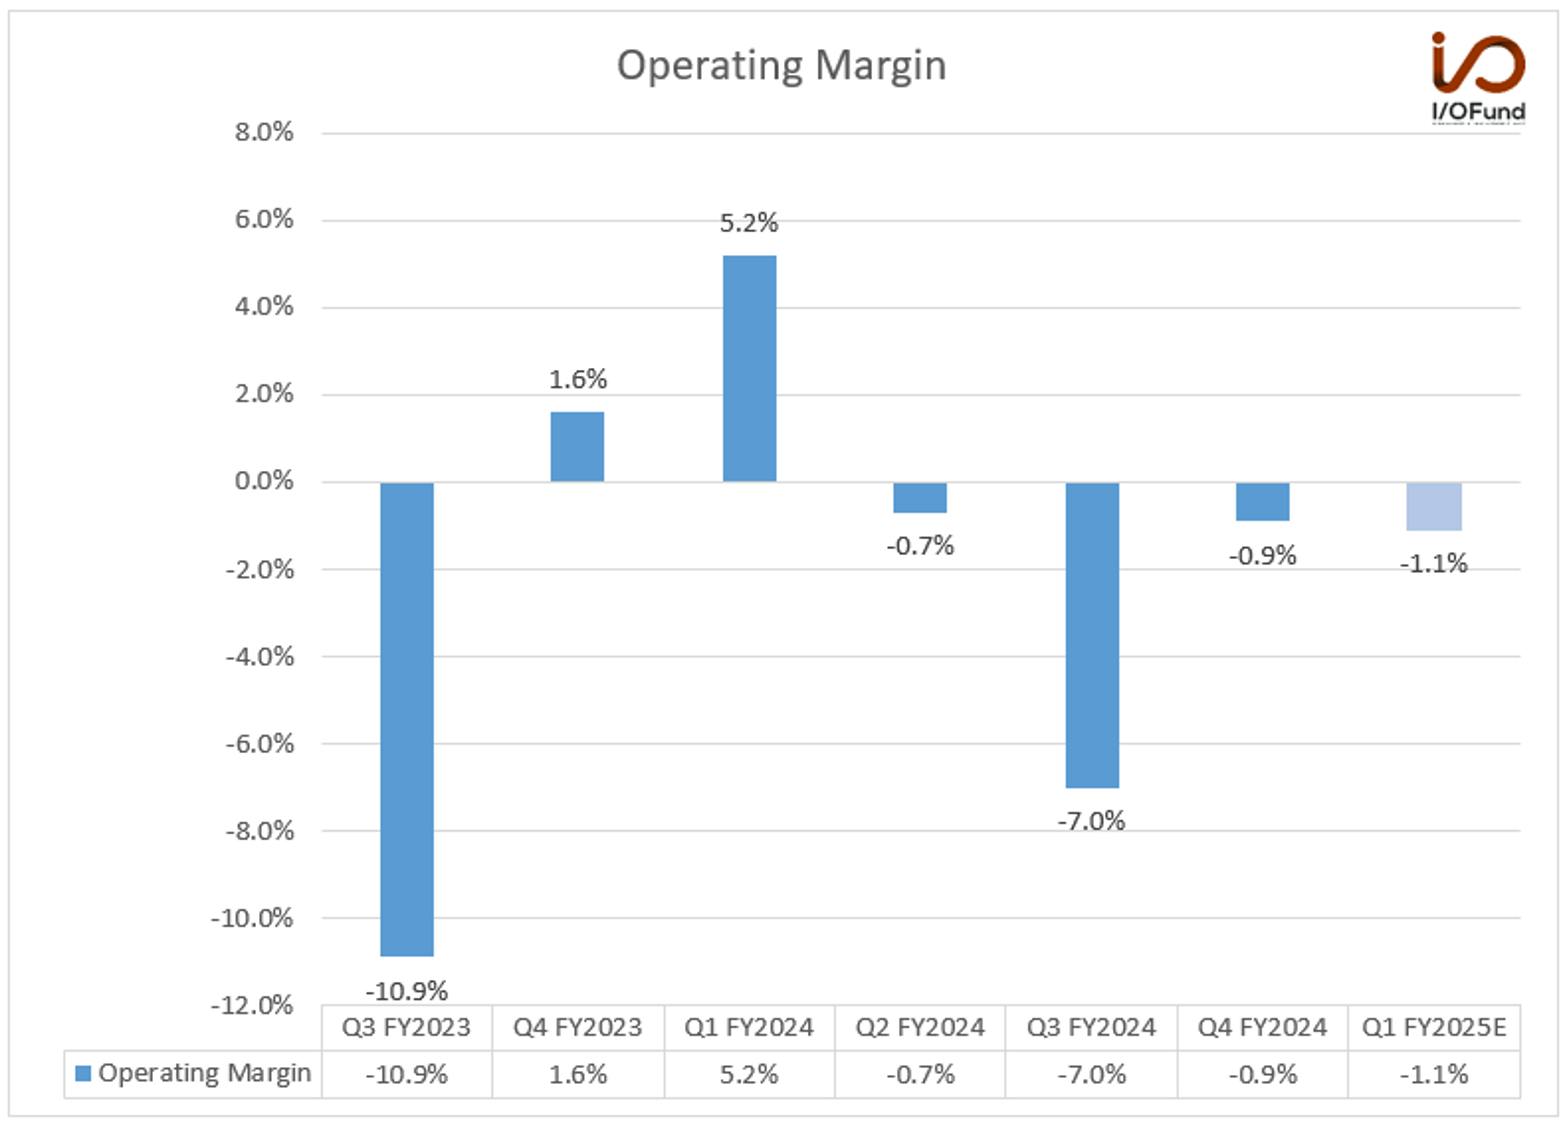
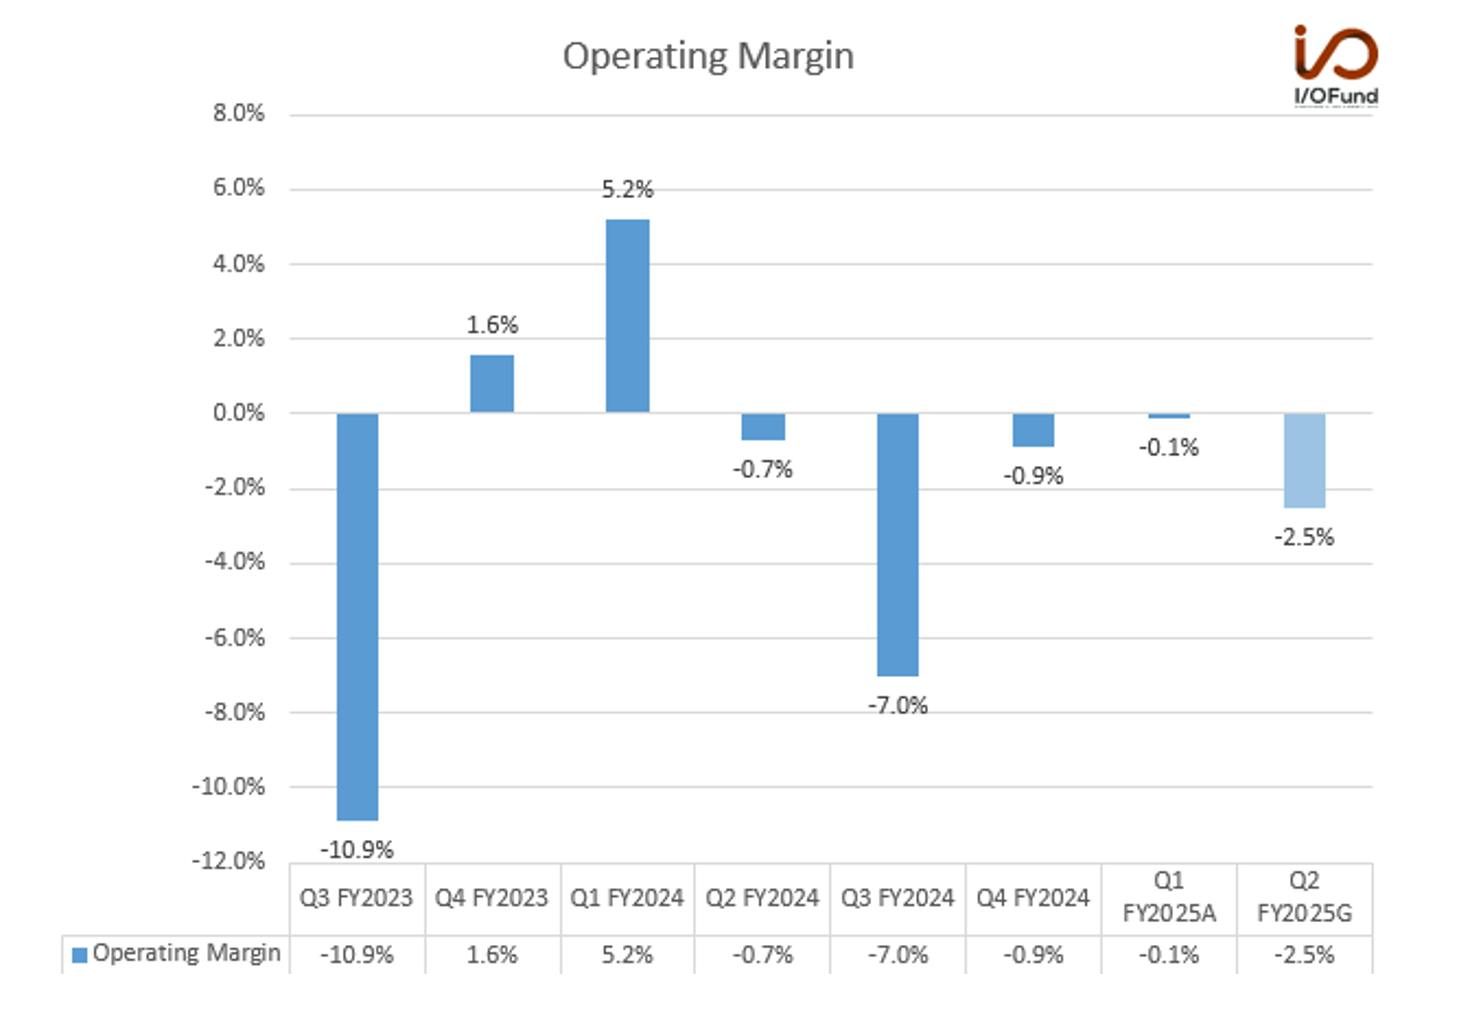
  • GAAP operating margin was (0.1%), improving from (0.9%) last quarter and ahead of guidance for (1.1%); however, this was a 530 bp YoY contraction from 5.2% in Q1 FY2024. Adjusted operating margin was 4.4%, improving from 2.0% last quarter but contracting from 6.2% in the year ago quarter.
  • GAAP net margin was (1.4%), improving from (1.7%) last quarter but down from 3.2% in the year ago quarter. Adjusted net margin was 3.5%, improving from 1.6% last quarter but down from 5.5% in the year ago quarter.

Looking ahead, management forecast pressure on margins across the board in Q2:

  • GAAP gross margin was guided at 24.0%, +/- 1%, for a 50 bp QoQ and 260 bp YoY contraction. Adjusted gross margin was guided at 25.0%, +/- 1%, for a 50 bp QoQ and 300 bp YoY contraction.
  • Based on operating expenses guidance, GAAP operating margin is expected to be (2.5%), down 240 bp QoQ and 180 bp YoY. Adjusted operating margin is expected to be 2.2%, down 220 bp QoQ and 290 bp YoY.

EPS

Given the margin weakness, AOSL slightly missed EPS expectations.

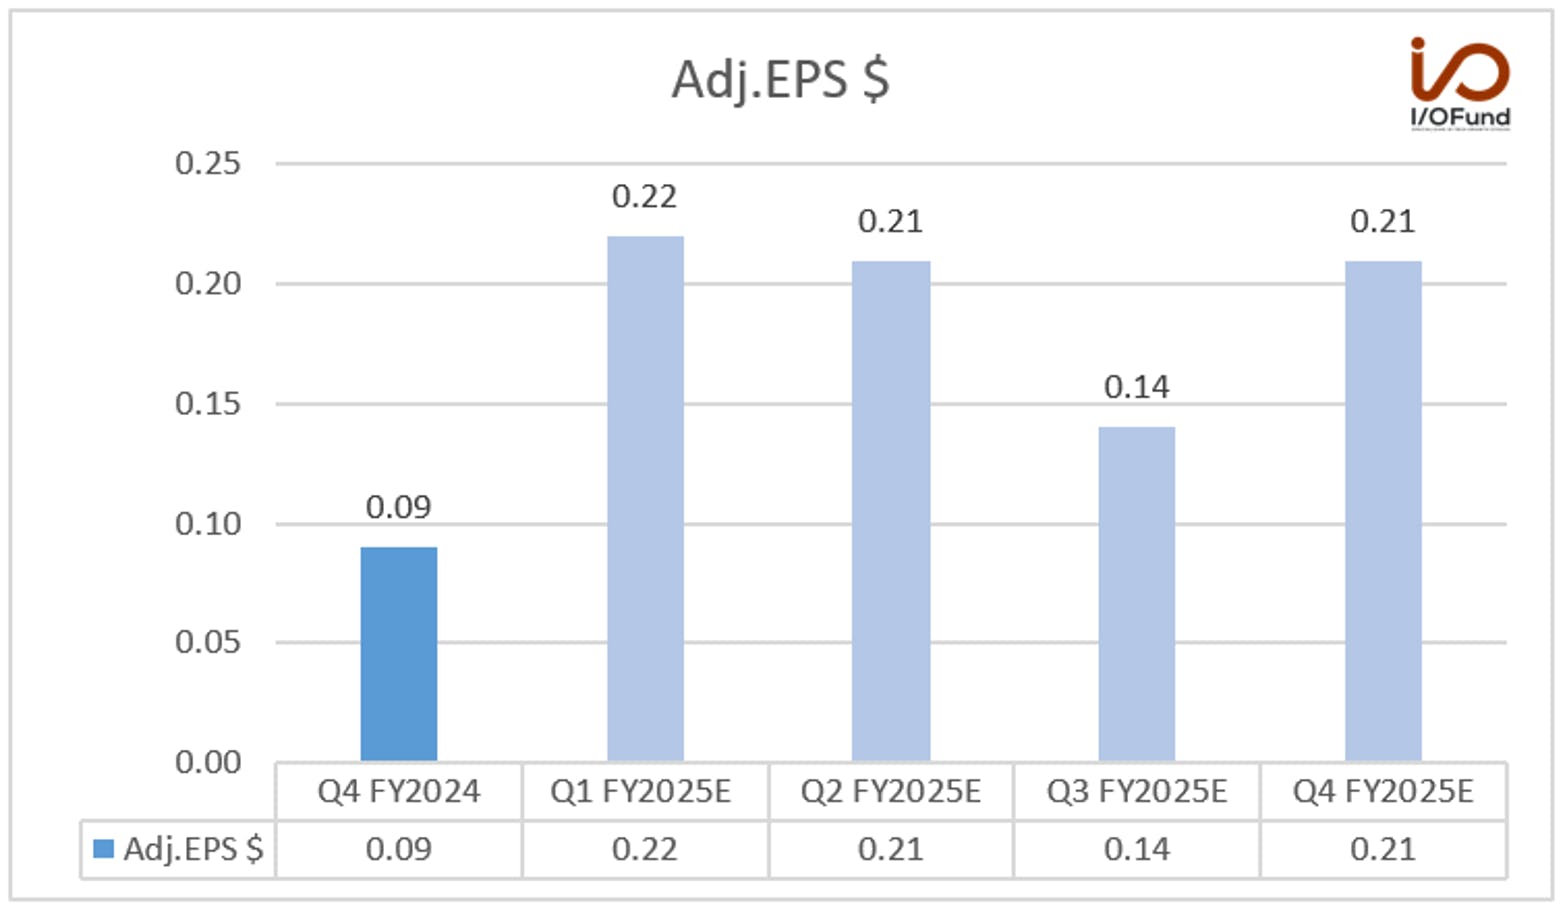
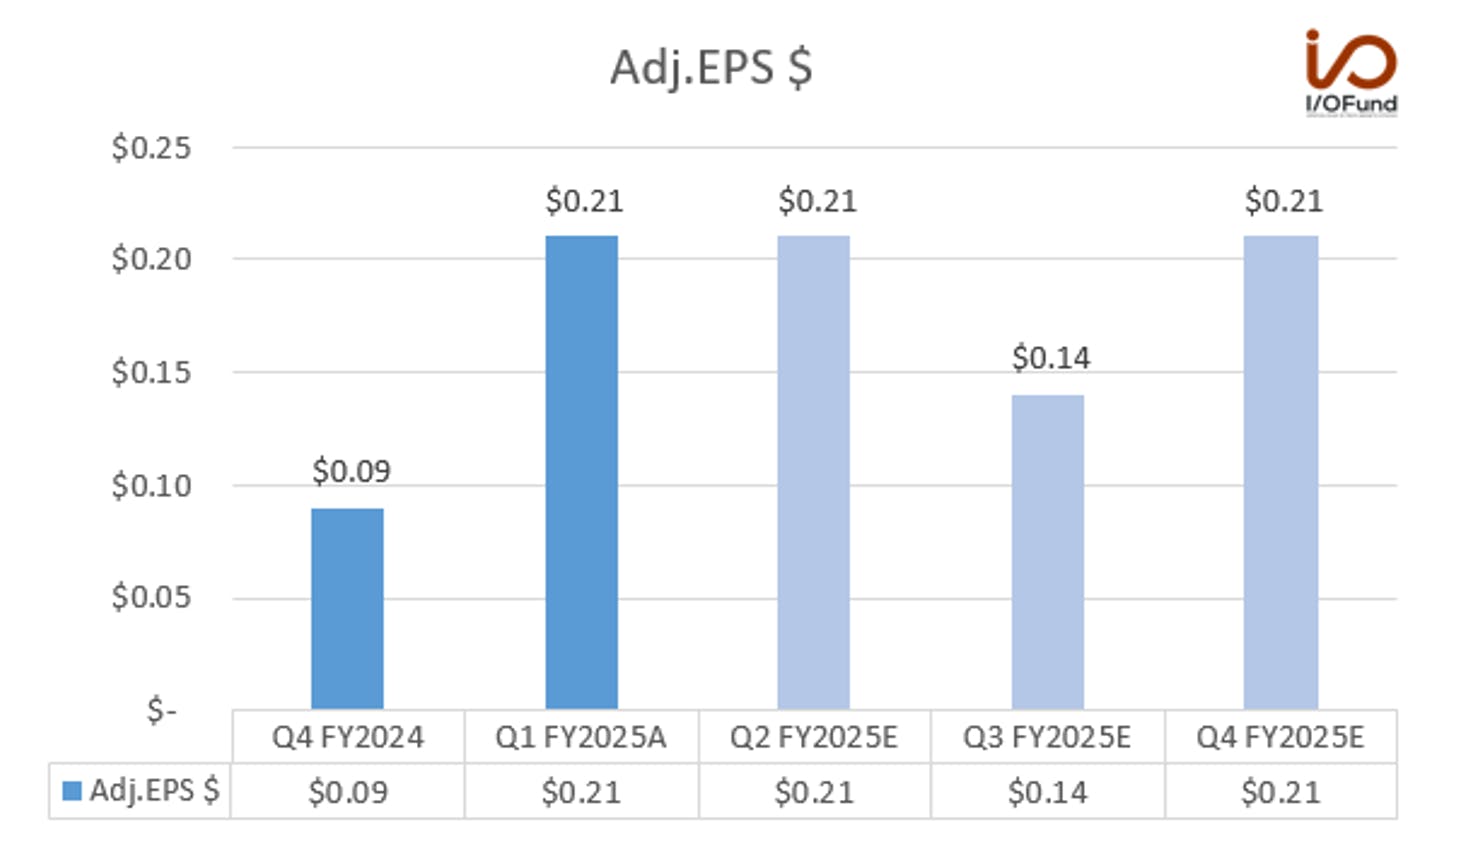
  • Adjusted EPS of $0.21 missed expectations by $0.01.
  • For Q2, analyst estimates were at $0.21 heading in to Q1’s report, but given the below-consensus revenue guide and forecast for margin contractions at the gross and operating level, it’s likely that Q2 adjusted EPS estimates will be revised downward in the coming days.
  • GAAP EPS of ($0.09) missed estimates of ($0.02).

Cash and Balance Sheet

Operating cash flow remained strong despite weaker margins, while cash on hand was relatively unchanged QoQ.

  • Operating cash flow was $11.0 million, down (20%) YoY but up 55% QoQ. OCF margin was 6.0%, down from 7.7% in Q1 FY2024 but up from 4.4% last quarter.
  • Free cash flow was ~$4.3 million, for a FCF margin of 2.4%, versus 0.7% in the year ago quarter and (0.1%) last quarter.
  • Cash and equivalents totaled $176.0 million.
  • Debt totaled $35.5 million.
  • Net inventory decreased by $10.8 million QoQ to ~$184.7 million.

Key Segments

Computing

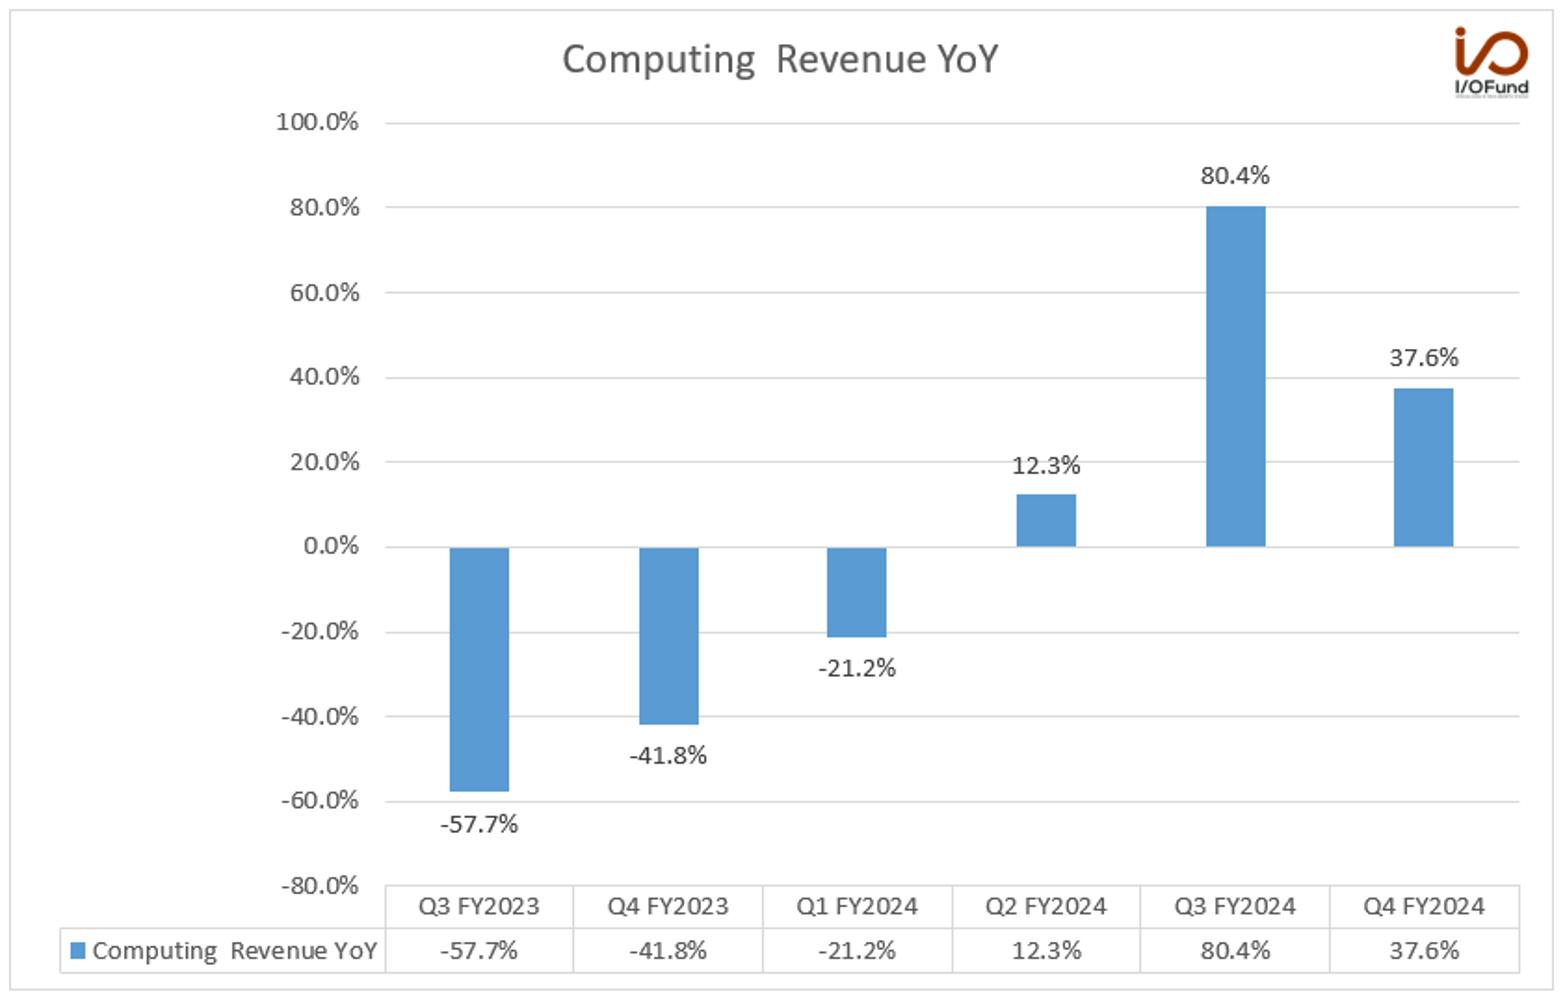
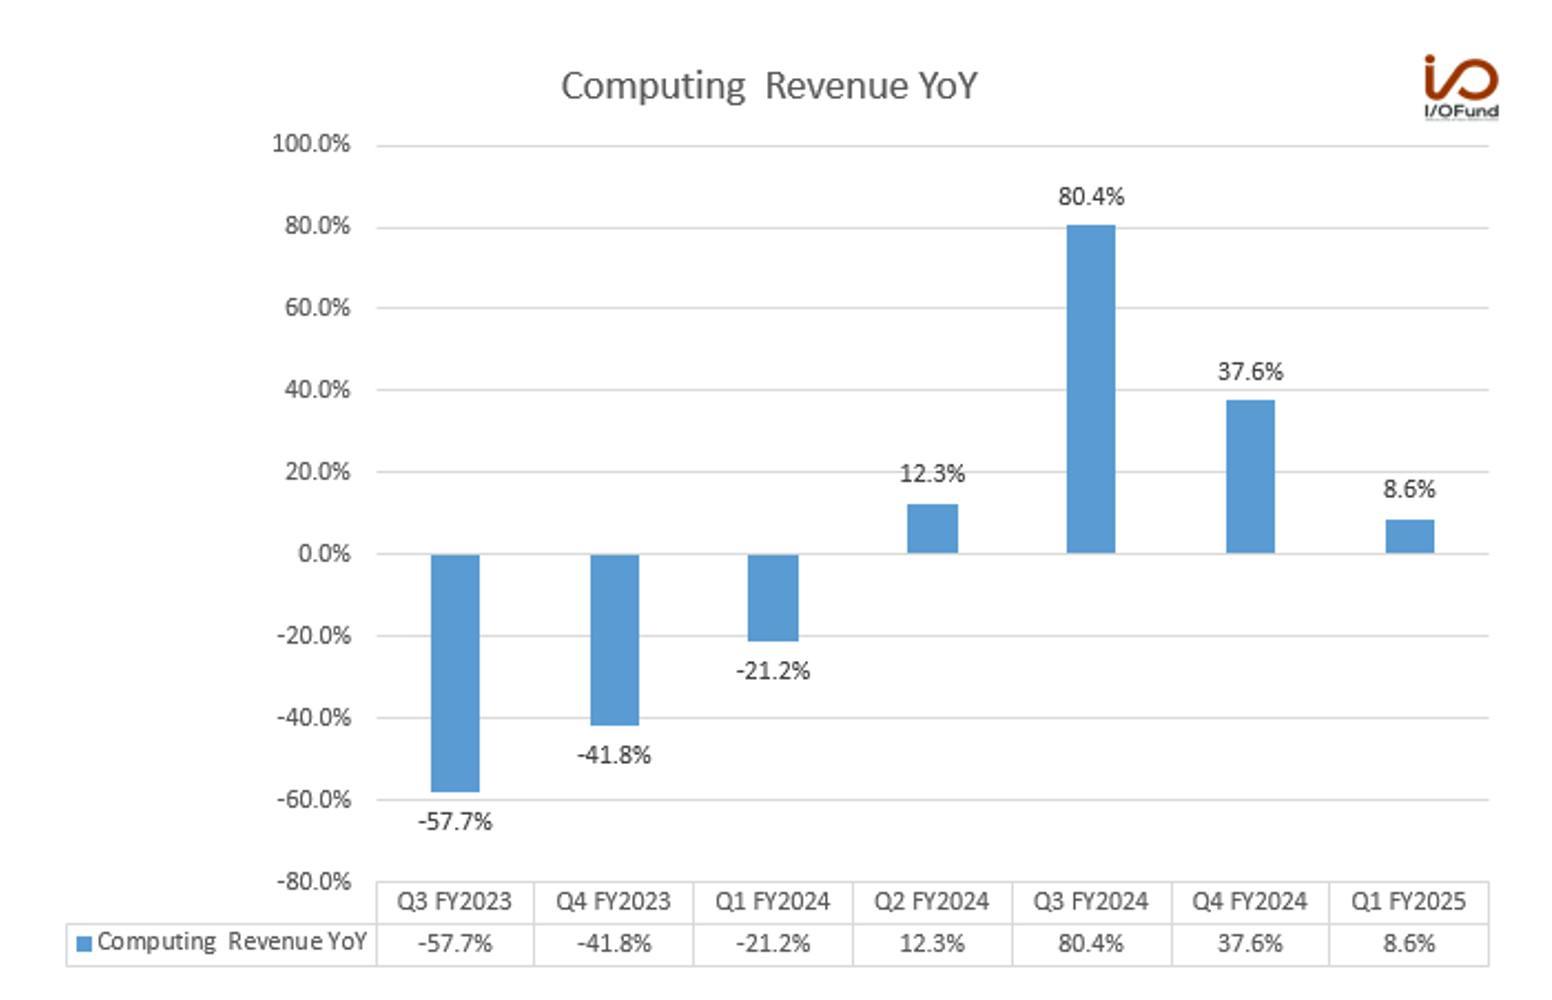
Computing revenue increased 8.6% YoY and 6.6% QoQ to ~$76.3 million. This marked a dramatic deceleration from 37.6% growth Q4, despite coming against a rather weak comp of (21.2%) YoY in Q1 FY2024.
Management said the company “saw relative strength from PC desktops, notebooks, and servers, which was offset by softer graphics and A.I.- accelerator cards due to a pause before the next platform transition.” Reading between the lines suggests that this is another reference to Nvidia’s Blackwell platform, ahead of its launch; however, it is a bit odd to see some softness given the channel checks we have imply very strong demand for Blackwell.

Management further added that their “backlog for both graphics cards and A.I. accelerator cards is now growing due to the new platform transition,” and they expect BOM (bill-of-material) content “to increase as more power stage ICs, paired with our controller, are being used to power the GPU.”

For the December quarter, AOSL guided to slight sequential growth due to “share gains in desktops, as well as strength in graphics cards and servers,” while seasonal slowdowns were expected in PCs, notebooks, and tablets.

Management also hinted at some larger announcements next quarter, saying “we are collaborating with customers on larger data center opportunities slated for 2025. We anticipate having more to talk about with these developments during our next earnings report.”

Consumer

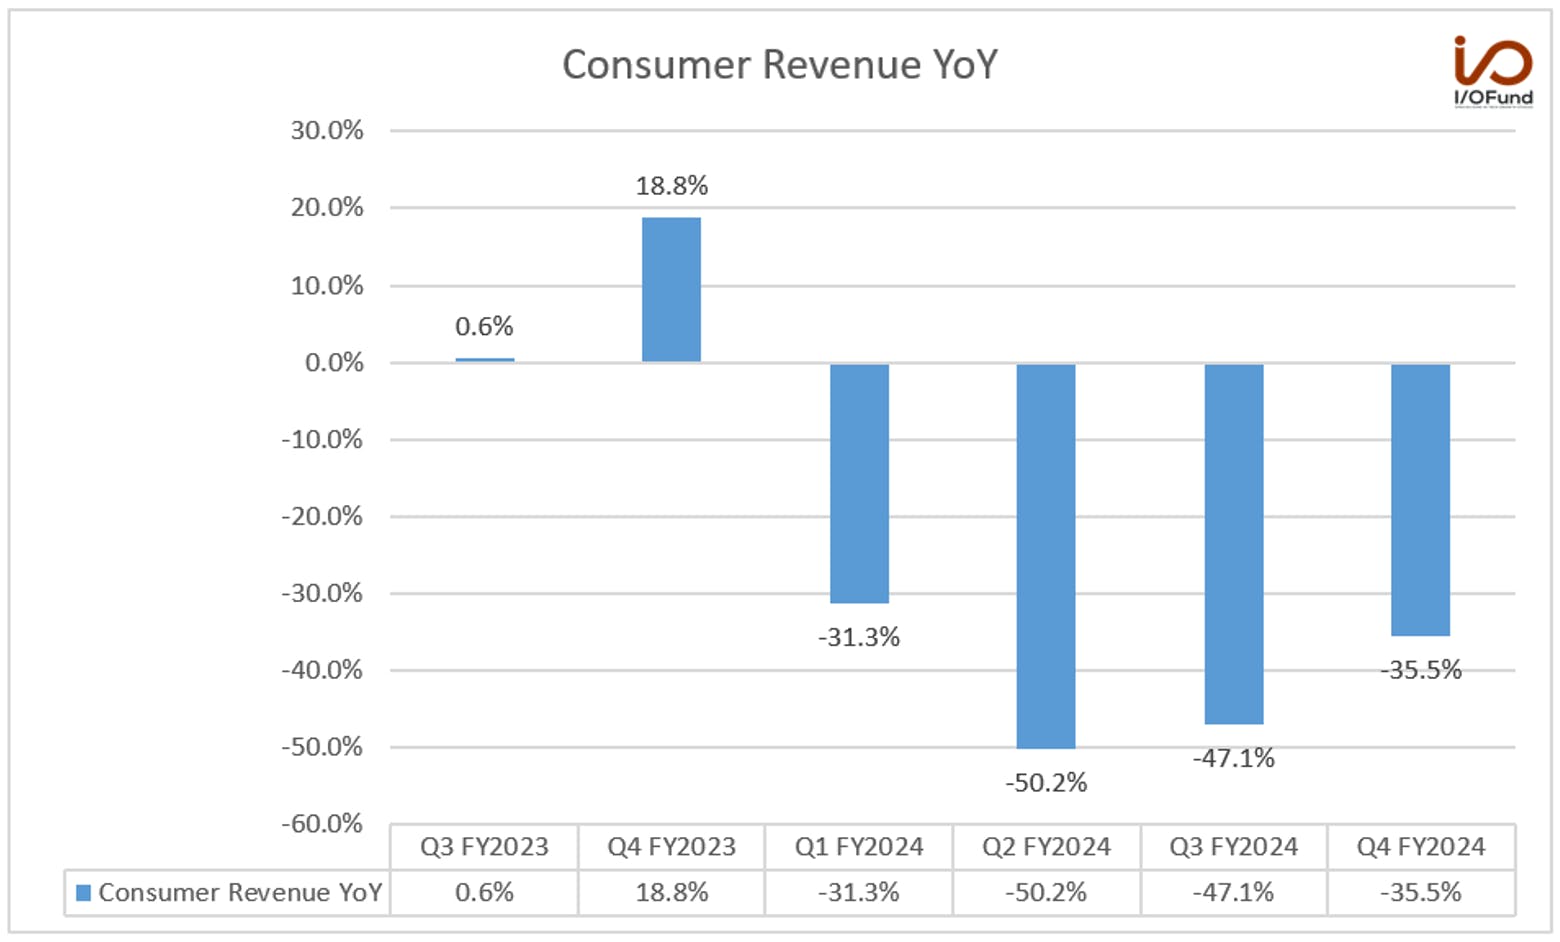
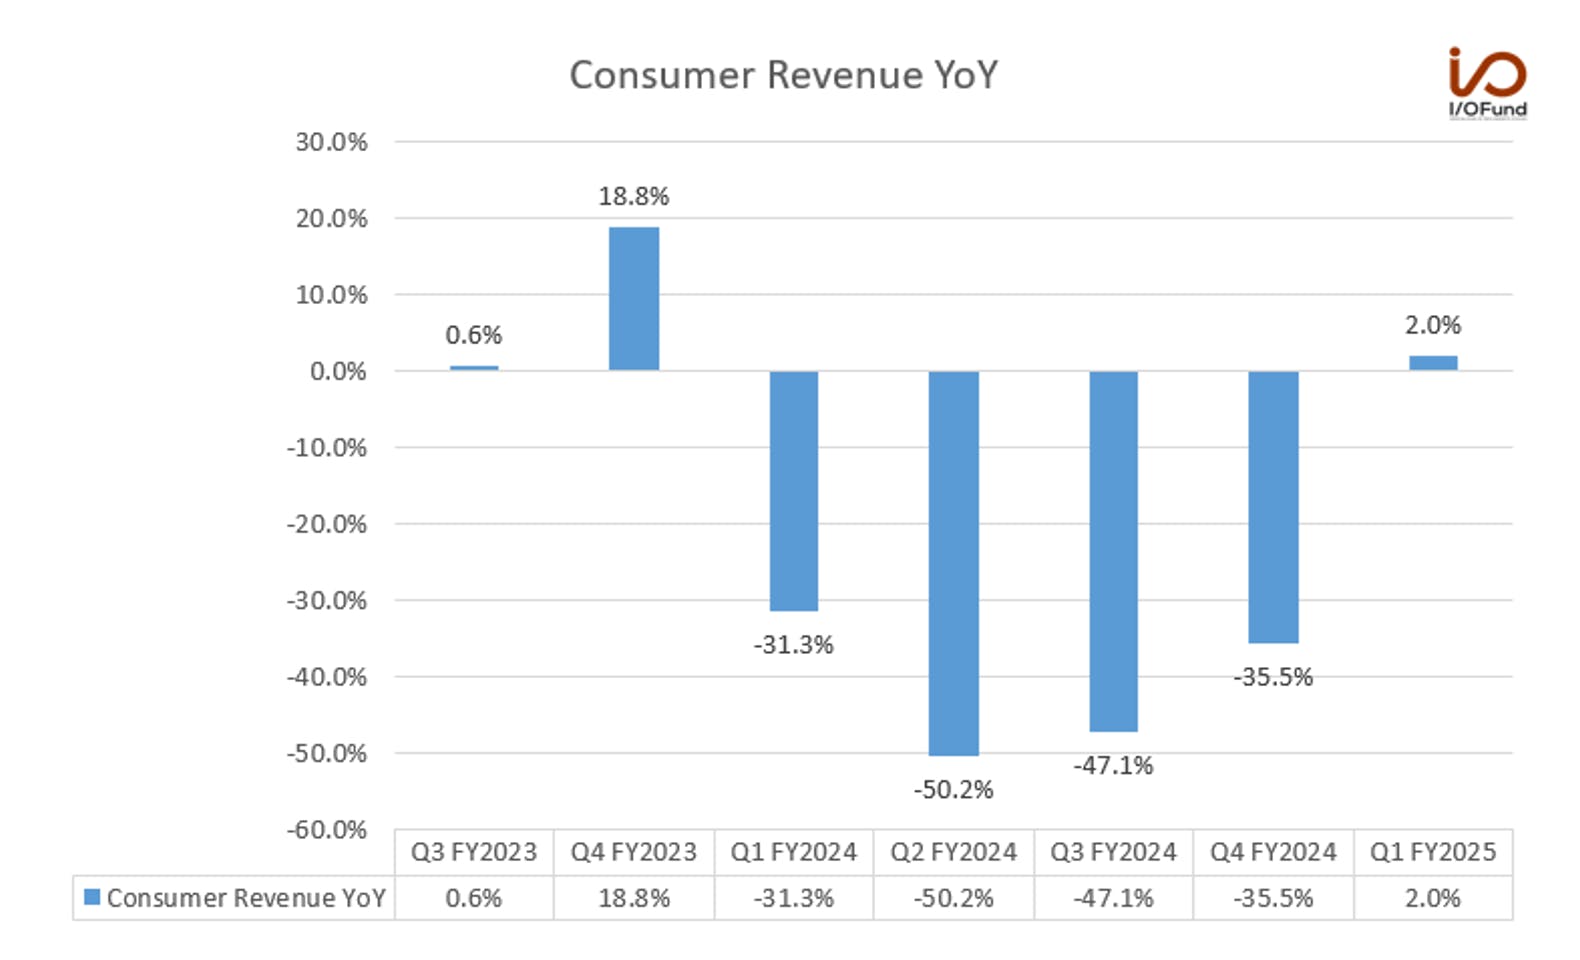
Consumer revenue increased 2.0% YoY and 12.4% QoQ to ~$31.7 million. While this marked a return to growth in the segment, it may be short lived, with management forecasting a near (30%) sequential decline in Q2.
For Q1, management said that the results “were in-line with our forecast for low double digit sequential growth and were primarily driven by gaming, wearables, and TVs, offset by a decline in home appliances.” Given the strength in gaming, management believes that the inventory correction has passed, but demand and “meaningful growth” may not arise until the next platform transition. Management also said wearables “were a notable standout” in Q1.

Looking ahead to the December quarter, as previously mentioned, management forecast a nearly (30%) QoQ decline due to seasonal gaming and TV declines, alongside softness in home appliances.

Communications

Communications revenue rose 14.2% YoY and 29.4% QoQ to ~$35.5 million, ahead of expectations for double-digit QoQ growth as its Tier-1 US smartphone customer geared up for a new product launch, alongside “strong sequential growth from China OEMs.”

For Q2, management expects “a low double-digit sequential decline in the December quarter due to seasonality and overall limited visibility on smartphone sell through heading into next year.”

Power Supply and Industrial

Power Supply and Industrial revenue declined (23.7%) YoY but rose 15.6% QoQ to ~$31.8 million, driven by “seasonal strength in AC-DC power supplies and quick chargers.”

Looking ahead, management expects the segment “to grow low single digits sequentially primarily driven by e-mobility and continued growth from quick chargers,” with more opportunities ahead in 2025 for quick chargers “due to increased BOM content driven by higher charging currents.”

Earnings Call:

AI Accelerator Card Opportunity

Given we may step aside from the position until roughly Q2 time frame, it’s important to reiterate the bigger picture for AOSL. When an analyst asked about the dollar content across its socket opportunities, the CEO answered the following:

“[…] In general, I think you've heard us talking more about selling total solutions and this is one evidence of that happening in the market now and we can sell both the controller as well as the power stages. And in this case, in terms of BOM content, it's going to grow from what used to be maybe around $5 to $6. It can — and then going to the next platform, it can range anywhere from $7 to $15 to maybe even over $20 a content, depending upon the number the power or the level of the GPU being paired with.”

Guiding Below Seasonality for Consumer:

Although management referred to the QoQ decline as seasonal in the Consumer segment, there was a question on the call that pointed toward it being steeper than seasonal. Last year, the September quarter matched this quarter at about $31 million in revenue, yet the QoQ decline into December is steeper for 2024 than it was for 2023. This year’s QoQ decline is expected to be (30%) compared to last year’s at (24.4%). This especially matters considering 2024 was largely expected to improve for Consumer facing semiconductors.

Here was the question on the call – since the puts and takes here are critical to the stock, I’m including the full excerpt:

David Williams

Great. Just wanted to ask too on the seasonality. It looks like you're guiding down just a bit more than seasonality. Is it fair to assume that, maybe we're back to a place that we can expect kind of seasonal trends here, or is there still enough volatility out there that you think is too early to call?

Stephen Chang

I think for the standout markets that we've been in Computing and Consumer, that seasonal pattern has returned. But at the same time, the full recovery, especially for PCs hasn't come yet. We're still waiting for PC shipments to grow, I guess, for the replenishment cycles to come back again. Therefore, at least for the last few years, after the inventory correction of the previous year, right now, we're just waiting for the PC shipments to be able to grow more.

That said, we are not standing still and even in those in the PC markets, we're seeking to gain more BOM content as we sell more of a total solution going into that application. We do think that seasonally, yes, it's going to go through that cycle, where the September quarter is typically the peak because of back-to-school and the holiday seasons.

And then going into the March quarter is probably more of a trough when it comes to the PC shipments, but that should come back up again and going into the following year. We're hoping that, to be able to layer that in especially with our advances in the graphics card and AI-accelerator card side that can help to fill in the gap and layer in on top of what we see as our base business.

Conclusion:

There was an anticipated Consumer rebound this year, that according to management teams, is not materializing. AOSL is one of quite a few in the Consumer-facing supply chain saying we can’t meet analyst expectations. Apple also missed its Q4 guide at the midpoint, guiding for “low to mid-single digits” which implies lower than the 7% YoY growth analysts expected.

As you know, the I/O Fund leans cautious for the moment with cash as our largest position, which is not to say we aren’t bullish in the medium-term — but rather, the risk/reward for an all-tech portfolio is not where it was a year ago. Apparently, having a large cash position is popular at the moment.

We’ve had a stop in place for AOSL at $31.50 and the stock is trading a penny below that price in the after-hours. If the stock remains below this level, expect us to trim or exit depending on the price action. In terms of timing on our re-entry, we foresee this matching when we resume buying Nvidia, AMD, Broadcom, TSM and some of the other AI bellwethers.

Recommended Reading:
AOSL Q1 FY2025 Pre-Earnings: Looking for Growth in December from Key Customers

Alpha & Omega Semiconductor will release its Q1 FY2025 results today. AOSL is expected to become a new GB200 supplier for Nvidia and to start shipments by the end of this year. Although AOSL does not call out Nvidia specifically on the earnings call, the announcement in June helps us infer that it’s likely Nvidia being spoken about on the call. The other catalyst is AOSL tie-ins to Intel’s Meteor Lake CPU and possible launch on its upcoming Panther Lake platform, as well as its position in development stages for AMD’s FP11 platform, positioning it for strong growth in this space.

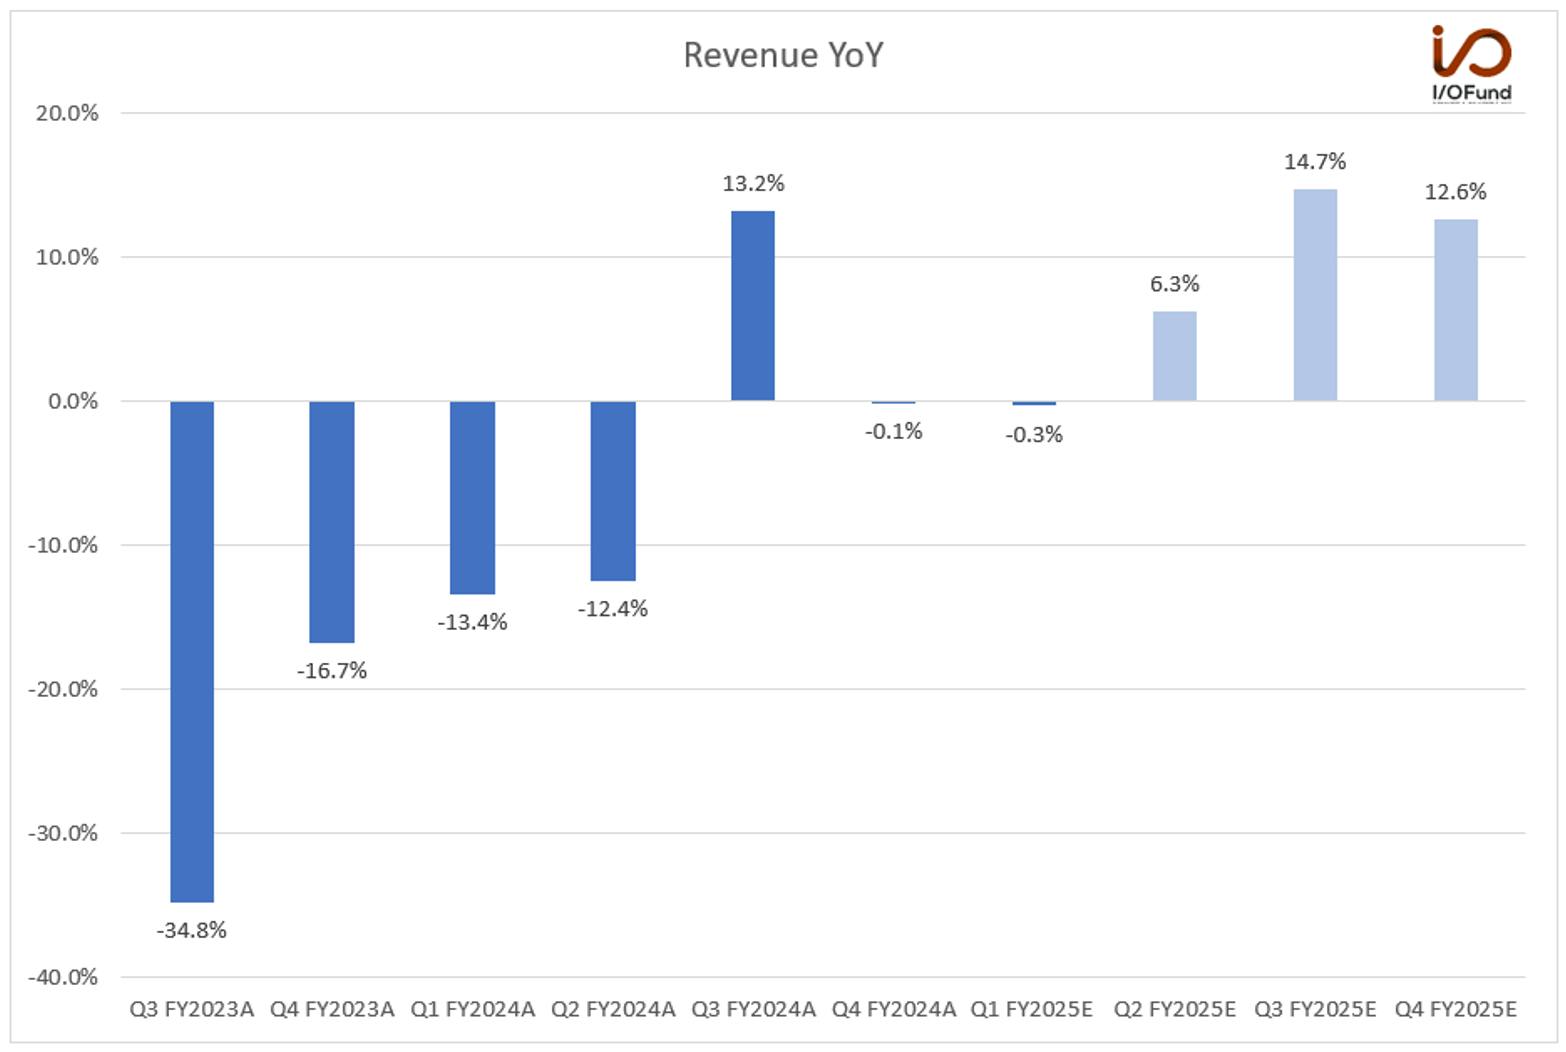
Analysts expect FQ1 revenue to decline (-0.3%) YoY to $180.07 million, before it accelerates to 6.3% YoY growth in the December quarter, and further accelerates to 14.7% in the March quarter. Alpha and Omega’s four key segments recorded sequential growth in FQ4, with management saying this “broad-based” rebound “confirmed the inventory correction is largely complete.” They noted that PCs are “taking longer to recover than originally expected,” though sequential growth is still expected in the September quarter due to seasonal strength. Management has guided sequential growth in the four key segments for FQ1.

Revenue

Positive revenue growth is likely from the December quarter as inventory corrections are largely resolved.

  • FQ4 revenue declined by (-0.1%) YoY to $161.3 million. However, it was up 7.5% sequentially, with key segments growing sequentially. Management said that in Q4, they “saw relative strength coming from gaming, tablets, e-mobility, A.I., and home appliances, while the PC segment is taking longer to recover.”
  • Analysts expect FQ1 revenue to decline (-0.3%) YoY to $180.07 million and accelerate to 6.3% YoY growth to $175.67 million in FQ2 and 14.7% to $172.13 million in FQ3.

Stephen Chang, CEO, said in the earnings call, “Looking into the September quarter, we expect PCs and servers to grow sequentially while tablets sustain the strong current run rate within Computing. The Consumer segment will likely see continued strength in gaming and a strong seasonal pick up from wearables, offset by slower home appliances. Smartphones will drive sequential growth in Communication, while AC-DC power supplies and quick chargers are relatively stronger in Industrial.”

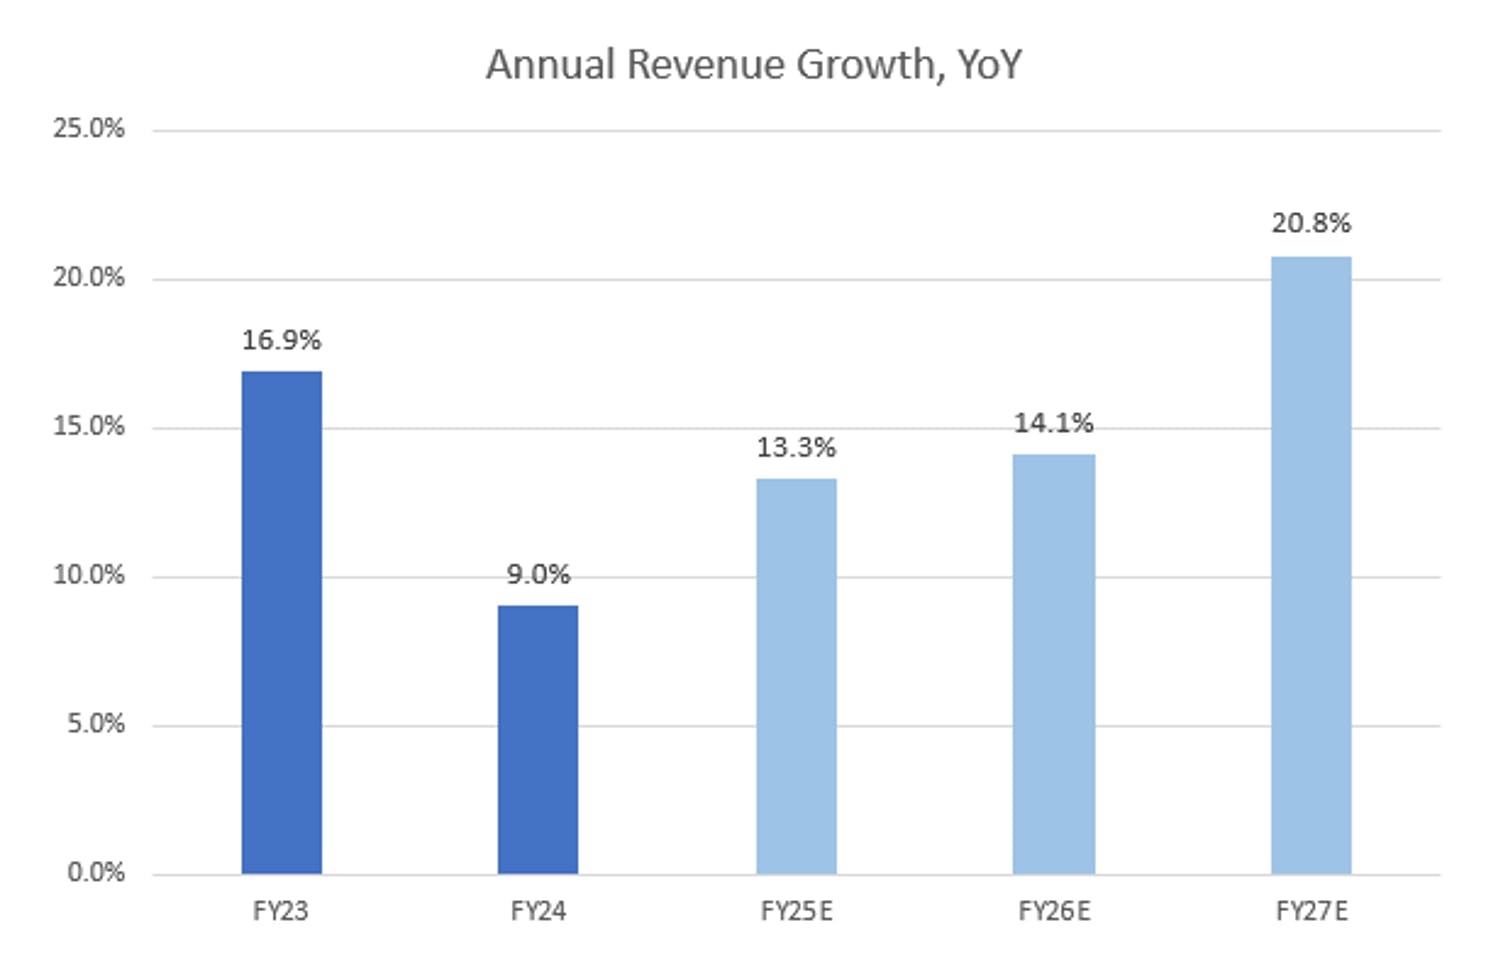
  • Analysts expect FY2025 revenue to grow 8% YoY to $709.53 million.
  • For FY2026, analysts expect revenue to grow 10.1% YoY to $781.33 million.

Margins

As FY2025 progresses, management expects margin improvement with higher revenue, better product mix, and higher factory utilization. Margins are contracting, and this is one reason we consider AOSL a momentum stock for now.

  • FQ4 gross margin was 25.7% compared to 27.6% in the same period last year and 23.7% in FQ3. Management guide for next quarter is 25%.
  • Adjusted gross margin was 26.4% compared to 28.5% in the same period last year and 25.2% in FQ3, the sequential improvement was primarily due to improved factory utilization. Management’s adjusted gross margin guide for next quarter is 26.4% compared to 28.8% in the same period last year.
  • FQ4’s operating margin was (-0.9%) compared to 1.6% in the same period last year. Management guide for the next quarter is (-1.1%).
  • Adjusted operating margin was 2% compared to 4.3% in the same period last year. Management guide for next quarter is 4.2% compared to 6.2% in the same period last year.

Yifan Liang, CFO said in the earnings call Q&A, “As you know, our September quarter's margin guidance, we guided a flattish than quarter-over-quarter. This is mainly because we expect similar quarter-over-quarter factory utilization and we plan to consume some inventories and reduce inventory balance in the September quarter. So other factors impacting the margin, like product mix and ASP erosion that we expect they're similar to the June quarter. So overall, we expect a flattish margin quarter-over-quarter for the September quarter.

So going forward, yes, I mean, I would expect and as we grow our revenue and then our product mix will continue to improve and then factory utilization will be higher. So those factors will be contributing to our margin improvement.”

  • Net loss was (-$2.7 million) or (-1.7%) of revenue compared to (-$1.1 million) or (-0.7%) of revenue in the same period last year. Adjusted net income was $2.6 million or 1.6% of revenue compared to $5.7 million or 3.5% of revenue in the same period last year.

EPS

The adjusted EPS estimates have been revised up from the estimates at the beginning of August, except for FY2026 adjusted EPS, which has been revised down from $1.51 to $1.28.

  • FQ4 adjusted EPS was $0.09 compared to $0.19 in the same period last year.
  • Analysts expect FQ1 adjusted EPS to be down (-33.3%) YoY to $0.22 and down (-13.9%) YoY to $0.21 in FQ2. However, these are higher than the estimates of $0.19 for FQ1 and $0.18 for FQ2 as of August 01st.
  • Analysts expect FY2025 ending June adjusted EPS to grow 24.7% YoY to $0.77.
  • For FY2026, they expect to grow 65.1% YoY to $1.28.

Cash Flow and Balance Sheet

The cash flow of this company (and most small caps) needs to be watched closely.

  • FQ4 operating cash flow was $7.1 million or 4.4% of revenue compared to (-17.5%) of revenue in the same period last year. Repayment of customer deposits was $4.5 million in FQ4, and management expects to refund about $8.4 million in FQ1.
  • Free cash outflow was (-$0.21 million) or (-0.1%) of revenue compared to (-29.3%) in the same period last year. Capex was $7.2 million in FQ4, and the management has guided $6 million to $8 million for FQ1.
  • Inventories were $195.8 million compared to $198.1 million in FQ3.
  • Cash was $175.1 million and debt of $38.36 million compared to $174.4 million and $41.2 million in FQ3. The company repaid $3.1 million of debt in FQ4.

Key Segments

Computing

Computing segment grew by 37.6% YoY and 4.4% QoQ to $71.6 million. Management said they saw “relative strength from tablets, A.I, and graphics cards in the quarter, offset by a slower PC market recovery. Notably, tablet revenue was a record high, and the contribution from A.I. and datacenter related applications continued to grow.” However, management said that the revenue was “slightly below our original expectation for mid-to-upper single digit growth,” primarily impacted by PCs.

Alpha and Omega expect FQ1 to see mid-single digit QoQ growth on a seasonal PC pickup, combined with strength from tablets, graphics cards, and AI accelerators. CEO Stephen Chang shed more light on some of the opportunities ahead: “We are working on multiple opportunities leveraging our existing relationship with a key graphics card maker, as well as our product portfolio including new multiphase Vcore controllers and power stage solutions for advanced computing. We are also seeing some ramp in September from a leading power supply maker that is a key supplier to the same A.I./graphics customer.”

Consumer

Consumer revenue declined (-35.5%) YoY but rebounded 19.7% QoQ to $28.2 million, as the segment looks to have marked a bottom in Q2. Management said it “is now clear that the inventory correction in gaming is behind us and a seasonal build is underway.”

Management guide: “For the September quarter, we forecast low double-digit sequential growth in the Consumer segment driven by strong seasonal pickup from wearables and continued strength in gaming, offset by slower home appliances.”

Communications

Communications segment revenue grew by 59% YoY and 2.1% QoQ to $27.4 million, driven by the “seasonal pick-up from a Tier 1 U.S. smartphone customer, offset by sequential declines from Korea and China OEMs.”

Management expects double-digit sequential growth in FQ1. “Looking ahead, we anticipate double-digit sequential growth in the September quarter on seasonal strength ahead of new smartphone launches in the U.S and increasing demand from China smartphone OEMs. We are benefitting from a mix shift to more premium phones and we anticipate rising growth in BOM content as phone makers increase battery charging currents.”

Power Supply and Industrial

Power Supply and Industrial revenue was down (-33.7%); however, it was up 11.3% sequentially to $27.6 million. The sequential growth was “driven by strength in the e-mobility segment for e-bikes and e-scooters and DC fans for applications in areas such as datacenters. The inventory correction in quick chargers appears complete as we also saw the beginnings of recovery in the June quarter.”

For FQ1, management expects the segment to grow sequentially 15-20% “primarily driven by a solid uptick from quick chargers, as well as strength from AC-DC power supplies tied to the seasonal build in PCs.”

Other Key Points to Watch

GB200 Supplier:

AOSL is expected to become a new GB200 supplier for Nvidia and to start shipments by the end of this year. Although AOSL does not call out Nvidia specifically on the earnings call, the announcement helps us infer that it’s likely Nvidia being spoken about on the calls. The only other option is that it’s AMD.

AOSL sells MOSFETs that go into bus converters for DC-to-DC power conversion. AOSL works with a leading power supply company that, in turn, supplies the unnamed AI/graphic customer, plus the company supplies the unnamed AI/graphic company directly. AOSL supplies the MOSFETs powering each GPU, and for the upcoming platform of this customer, AOSL will additionally sell the total solution controller and the multiphase controller. The number of MOSFETs is expected to triple from 9 to 16 up to 50 MOSFETs per GPU. We will be watching for new updates in the earnings call.

Margins

We want to see margins improve in the coming quarters. During the FQ4 earnings call Q&A, management reiterated its mid-term target of above 30% non-GAAP gross margin with a target revenue goal of $1 billion. The adjusted gross margin was 30.2% for the FY2023 ending June and dropped to 27.2% for the FY2024 due to the continued inventory correction. Management confirmed during the FQ4 results that the “inventory correction is largely complete.”

David Williams (Analyst)

“Okay. Yes, that's really a great color. If I could just ask one last thing, kind of just thinking about how margins are going to change as your business kind of picks up into this new realm, are we going to see normalization back to kind of like historic peaks at around 30-ish, or is this sort of the new normal now with 25 to 28 kind of extending forward?

Stephen Chang (Executive)

Yes, I mean, our overall midterm target model is still above 30% non-GAAP gross margin with a target revenue goal of $1 billion. So that model will still stay. So we believe in the — when we continue to grow, then incremental business, we expect we can bring in the better product mix. So that would help us improve the gross margin gradually. Also, those incremental business would help us increase our utilization at factories.”

Valuation

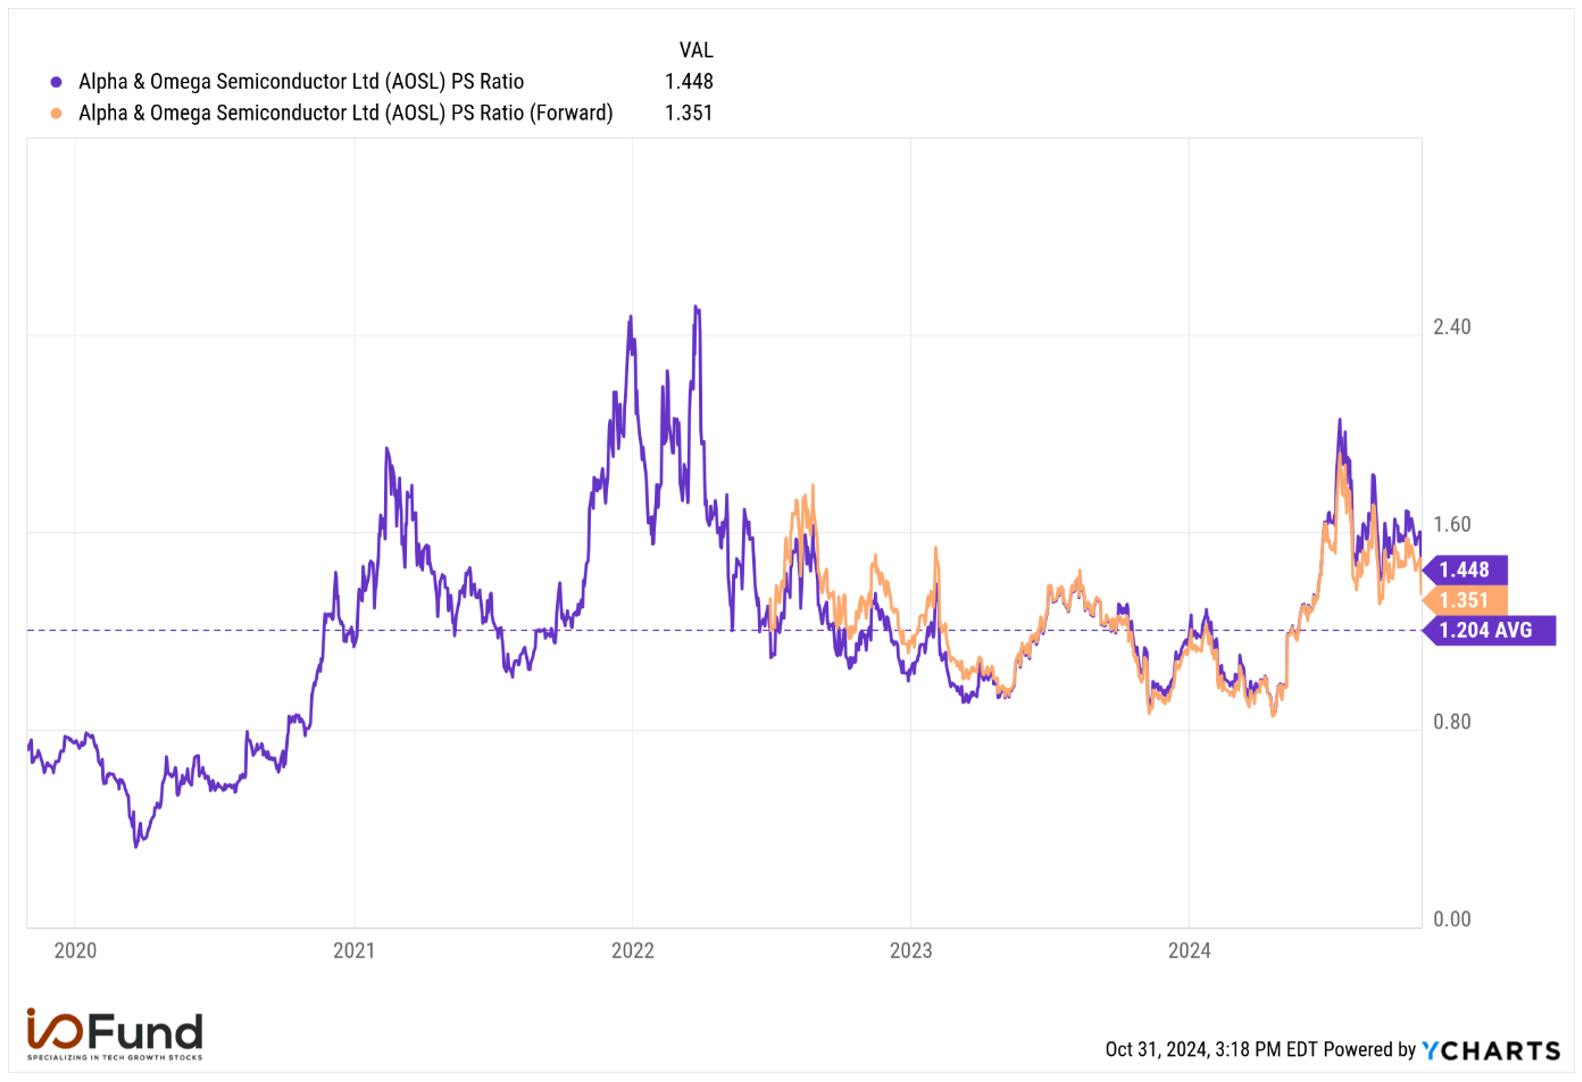
The company is trading at a forward P/E ratio of 42.8. The P/S ratio peaked in March 2022 when the quarterly revenue was close to $200 million, GAAP profitable, and before the PC inventory correction. The current P/S ratio is 1.45, and the forward P/S ratio is 1.35. It is trading above the five-year average P/S ratio of 1.2.

Conclusion

AOSL is a momentum stock in which we are using technical analysis to the fullest, and we plan to follow our stops. Our goal is to participate in opportunities where small-cap suppliers expand their serviceable addressable market (SAM) as AI systems increase in complexity. However, given the weakness we’ve seen in SMH, it could be a tall order for AOSL to overcome the selloff we’ve seen in the larger semis. But we also want to give AOSL an opportunity to report any progress from key customers. Therefore, anything is possible following the earnings call – we could close the position or add to it.

Royston Roche, Equity Analyst at the I/O Fund, contributed to this article.

Recommended Reading:

Bitcoin Bull Market Intact as Risk Increases

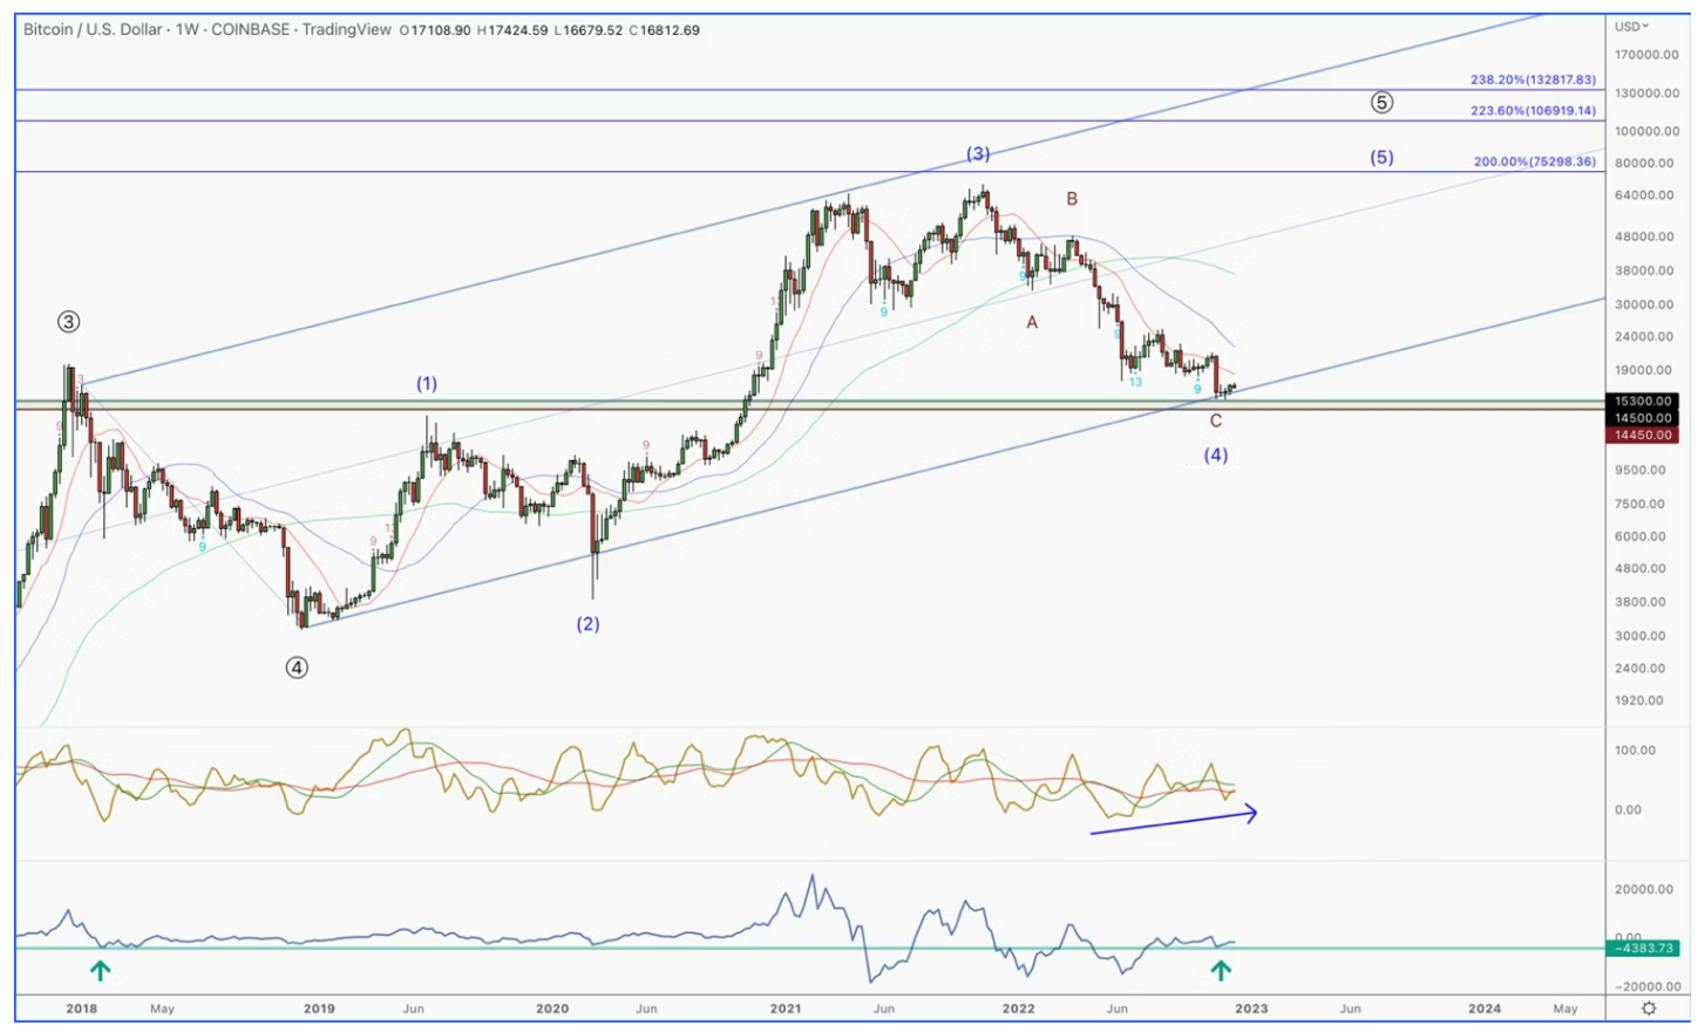
In December of 2022, when Bitcoin was trading around $17,000, we boldly stated that “Bitcoin is a buy.” At the time, we were beginning to position for a new Bitcoin bull cycle.  We even posted a chart in this report entitled “Bitcoin’s Upcoming Rally – What You Need to Know,” showing our targets for the coming bull market of $75,000 – $132,000, shown below.

A chart illustrating Bitcoin’s potential bull market price targets of $75,000 to $132,000, referencing a December 2022 statement that “Bitcoin is a buy” when it was trading around $17,000.

This was an unpopular report at the time, as Bitcoin was down nearly 80% from the 2021 highs, and was coming off the heels of a crypto panic following the FTX scandal. Over 1 year later in March of 2024, Bitcoin did indeed hit $73,757 — just shy of our lower target.

With tech stocks, we offer fundamental analysis to identify what to buy, and then we use technical analysis as a supplement for gauging sentiment and risk. However, with Bitcoin, there is no management team, earnings calls, and minimal news events. For this reason, we lean heavily into technical analysis and on-chain analysis to guide our position management.

These techniques are what we used to call the 2022 low as well as the accurate upper targets a year in advance. These same techniques were used when we increased our upper targets to $106,000 – $190,000 in our April of 2024 report.

We believe these targets are attainable, which is supported by the updated technical analysis as well as the on-chain analysis below. However, the correction that started in March of this year was simply too long in time, and has led to us adjusting our targets. We are also adjusting our game plan for the sake of risk management and will look to reduce our crypto exposure by ~50% on the next push to all-time highs (ATHs), locking in well-deserved gains. We will then revisit buying back once we get more information on the following consolidation.

Technical Analysis

Since 2019, we have repeatedly presented to our Premium Members that we are in a large degree uptrend that started in late 2018. This uptrend is taking the shape of a standard 5-wave pattern, which is one of the reasons we were calling for a low in 2022.

In our December 2022 report, we stated…

“As of now, since the 2018 low, we only have 4 waves in place, which implies that we have one more 5th wave push before the larger bull cycle is over.”

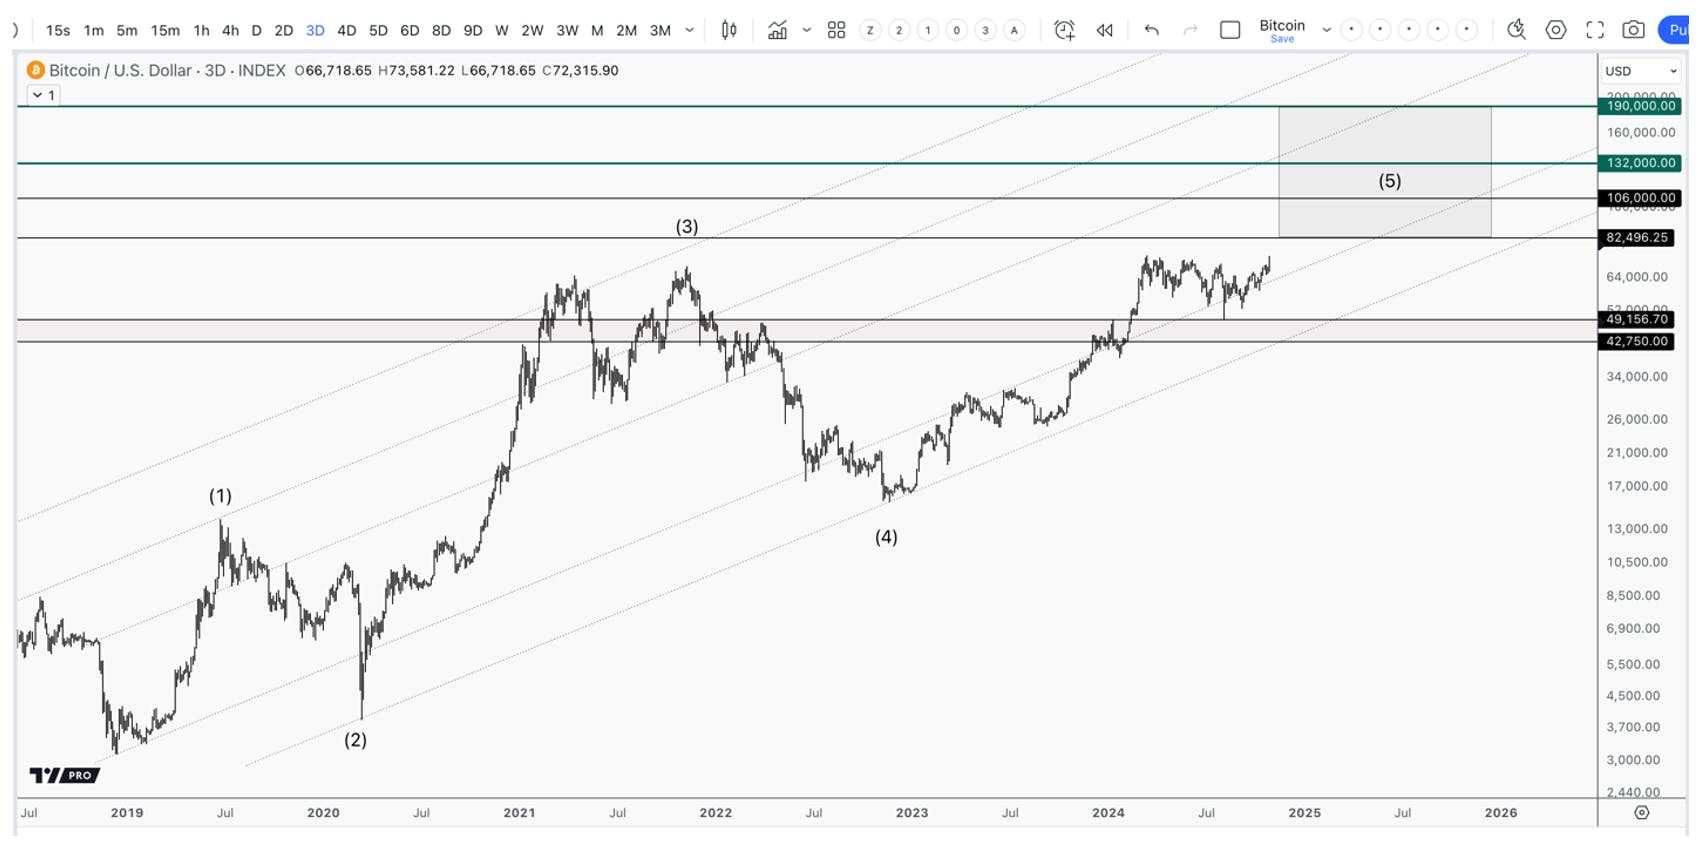
As bad as it felt, this made the recent bear market a correction within a larger uptrend. We simply did not have a full 5 waves in place, and until we saw a 5th wave push to new highs, the pattern remained incomplete.  We are currently in that final 5th wave of this nearly 7-year uptrend. That being said, we still see the potential for another +50% – 90% move higher in the coming months.

A chart depicting Bitcoin’s market trend, showing a correction within a larger uptrend and highlighting the current final 5th wave of a nearly 7-year uptrend.

Source: I/O Fund

The below is our price analysis on this final 5th wave that started in November of 2022. It is also unfolding as a standard 5-wave pattern, and is incomplete until we push to new all-time highs. We stated this in our April 2024 report, which we used to buy this dip.

“We are in a large 5 wave pattern, which is targeting well above $100,000. It is an incomplete pattern, and needs 2 more large swings higher to complete the full 5 waves. Like with all 5 wave patterns, we have bought on each dip, and continue to buy as long as we stay above critical support.”

As stated earlier, the correction this year was simply too long in time to not adjust our prior price targets. While we still believe Bitcoin can go well into the $100,000 region, we will take a more active stance going forward to protect our gains.

Updated Bitcoin Targets

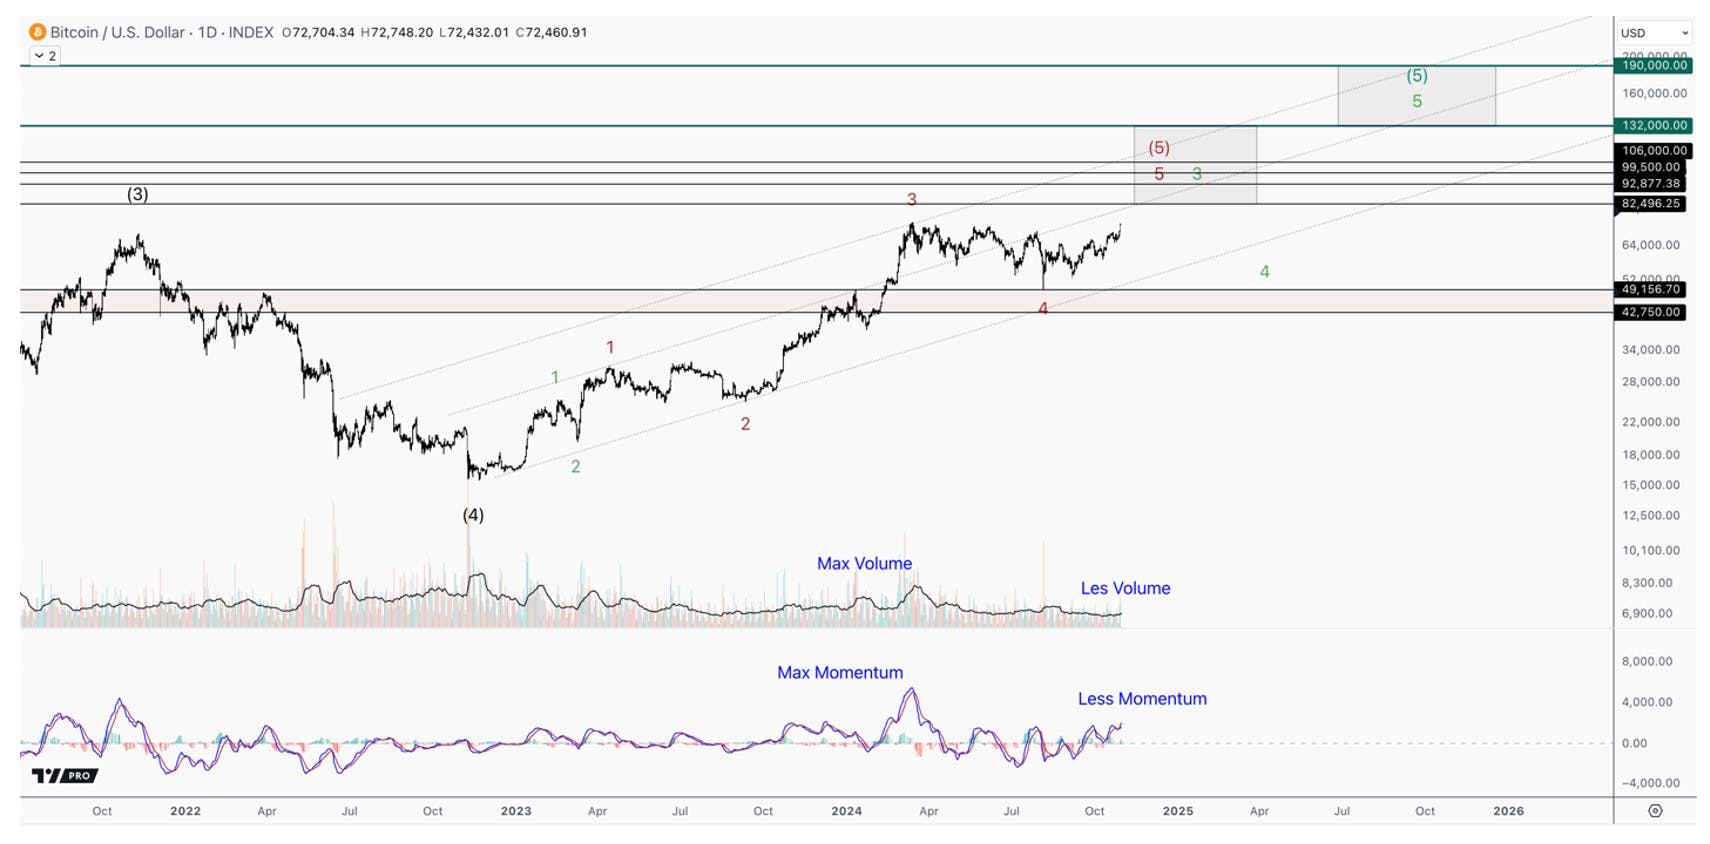
Our updated target for this next push higher is between $82,000 – $106,000. There are now two scenarios that we are tracking, which will determine our risk management:

  • Red – We push into the $82,000 – $106,000 region, completing the minimum number of waves required within this bull cycle. This will end the large degree bull market that started in 2018.
  • Green – After pushing into the $82,000 – $106,000 region, instead of topping in the 5th wave, we are topping in the 3rd wave. We then see another multi-week to multi-month correction that holds over $41,156 – $47,750, which eventually leads to the final 5th wave taking us well into the $132,000 – $190,000 region.
A chart analyzing Bitcoin’s final 5th wave, starting in November 2022, showing an incomplete 5-wave pattern targeting above $100,000 and emphasizing dip buying while maintaining critical support.

Source: I/O Fund

We do believe the next breakout will likely be limited, and that another correction will soon follow. To support this, note when price went vertical in February, which was met with max volume and max momentum. This is what 3rd waves look like. It is the part of the trend where everyone realizes, at once, the direction of the market. This leads to shorts covering, and longs buying more, putting everyone on the same side of the market.

The common characteristic of a 5th wave, which is the final swing in a trend, is that price makes one more high, but on less volume and lower momentum. From a sentiment perspective, the start of a 4th wave consolidation is when smart money exits. The 5th wave tends to happen when investors that are late, want to get exposure to what is believed to be a continuation of the trend. This explains why price goes higher with reduced buyers and weaker momentum.

Note these patterns in play in the chart above. We are clearly in a 5th wave, which will give way to more volatility when it completes.

Confirmation of 5th Wave Targets

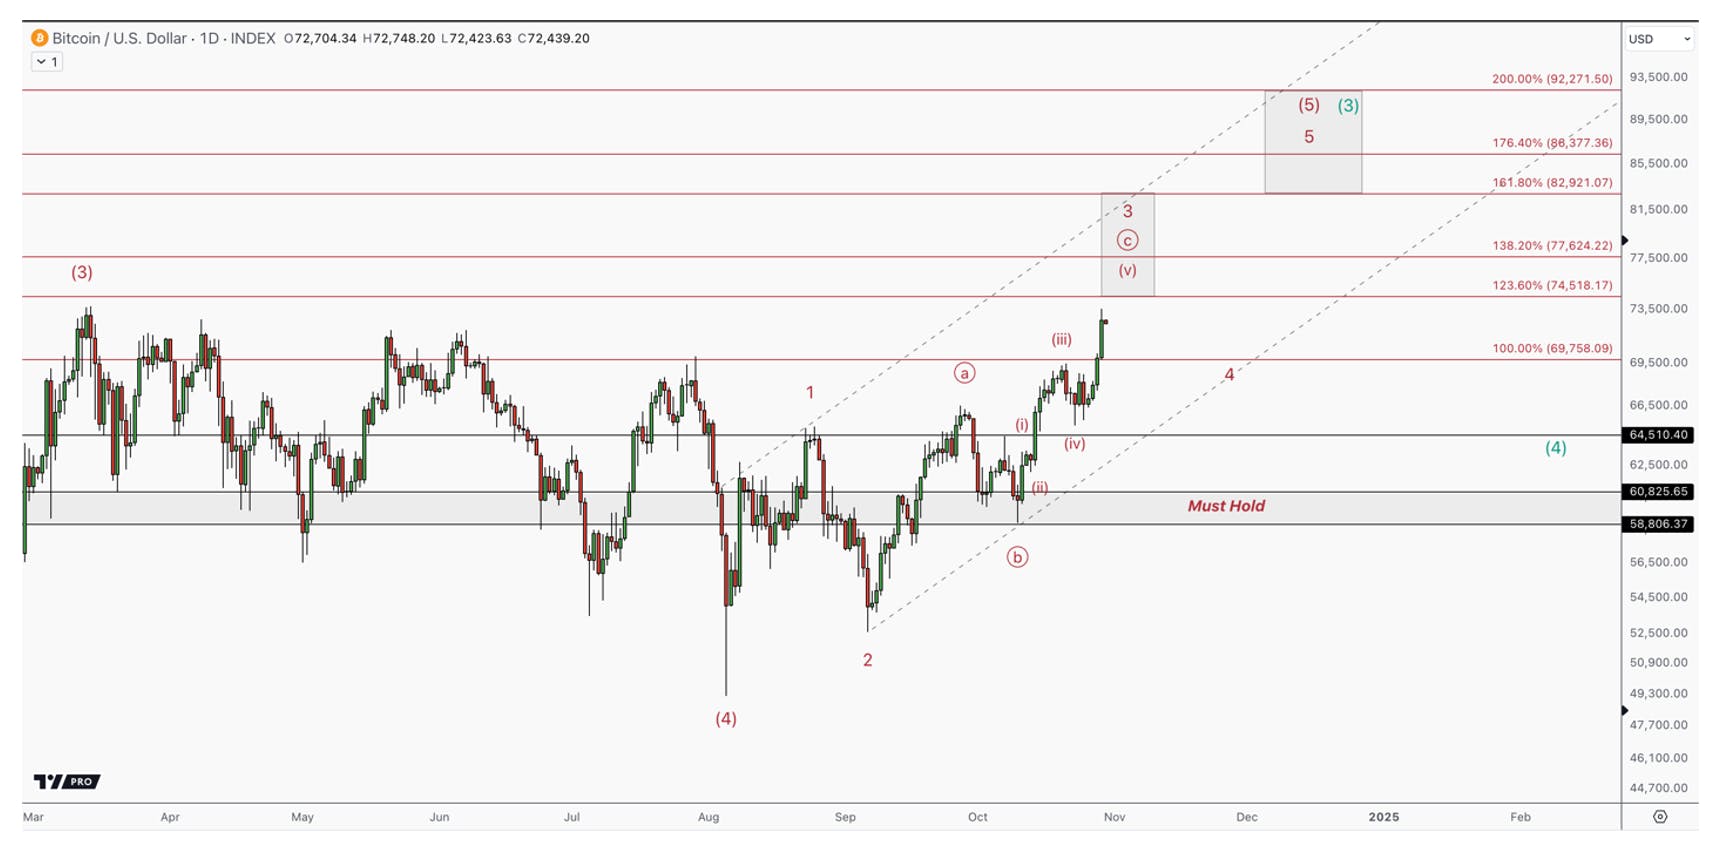
To further support our new targets, the pattern of this new swing is also pointing to the same region. If we zoom in on the current bounce we are in, it is taking the shape of an ending diagonal pattern. This pattern only shows up at the end of a move, which fits with us being in some type of a 5th wave.

An ending diagonal consists of 5 waves with large overlaps. The 3rd wave is targeting $74,000 – $82,000, and the final 5th wave is targeting the $82,000 – $106,000 region. As long as any volatility stays above $60,800 – $58,800, I expect us to push into these targets.

A chart of Bitcoin showing a potential breakout and correction, highlighting the final 5th wave’s lower volume and momentum, with an ending diagonal pattern targeting $74,000 - $106,000 if volatility stays above $60,800 - $58,800.

Source: I/O Fund

As of now, we have provided 13 buy alerts to our premium members at the $17,000, $26,000, $33,000, $40,000, $55,000 and $62,000 regions. These unrealized gains range from +300% to 15%, based on our buy alerts. Our game plan is to reduce risk, take well deserved gains on this next push higher. Once we approach these upper targets, we will enter distribution mode.  We will then analyze the next pullback to determine if the more bullish scenario in green is likely to play out. If so, we will add back at levels that are lower risk.

On-Chain Analysis

For those that are not familiar with on-chain data, it offers a unique type of fundamental analysis within crypto and is a relatively new field of study. We partnered with WealthUmbrella, a team of machine learning engineers and professors, to provide this level of analysis within the crypto space. The below was provided to us by Vincent Duchaine, the CEO of WeathUmbrella, and interestingly, they are arriving at the same general conclusions as our technical analysis.

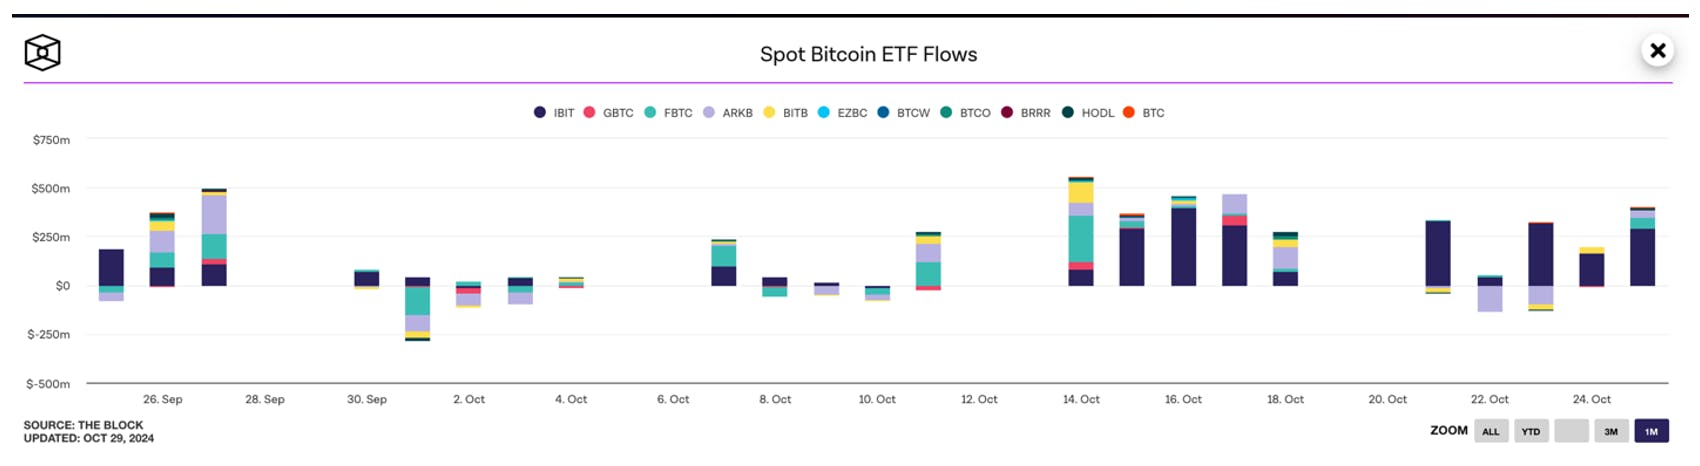
The current imbalance between supply and demand is favorable for a sustained uptrend. This was one of the thematic catalysts that we believed would propel Bitcoin over $100,000, and it is still playing out today. If you look at the ETF flows over the last several weeks, we are seeing buyers move back into the ETFs, creating positive flows.

An analysis of on-chain data showing a favorable supply-demand imbalance for Bitcoin, supported by Vincent Duchaine of WealthUmbrella, with positive ETF flows indicating a potential uptrend above $100,000.

Source: The Block

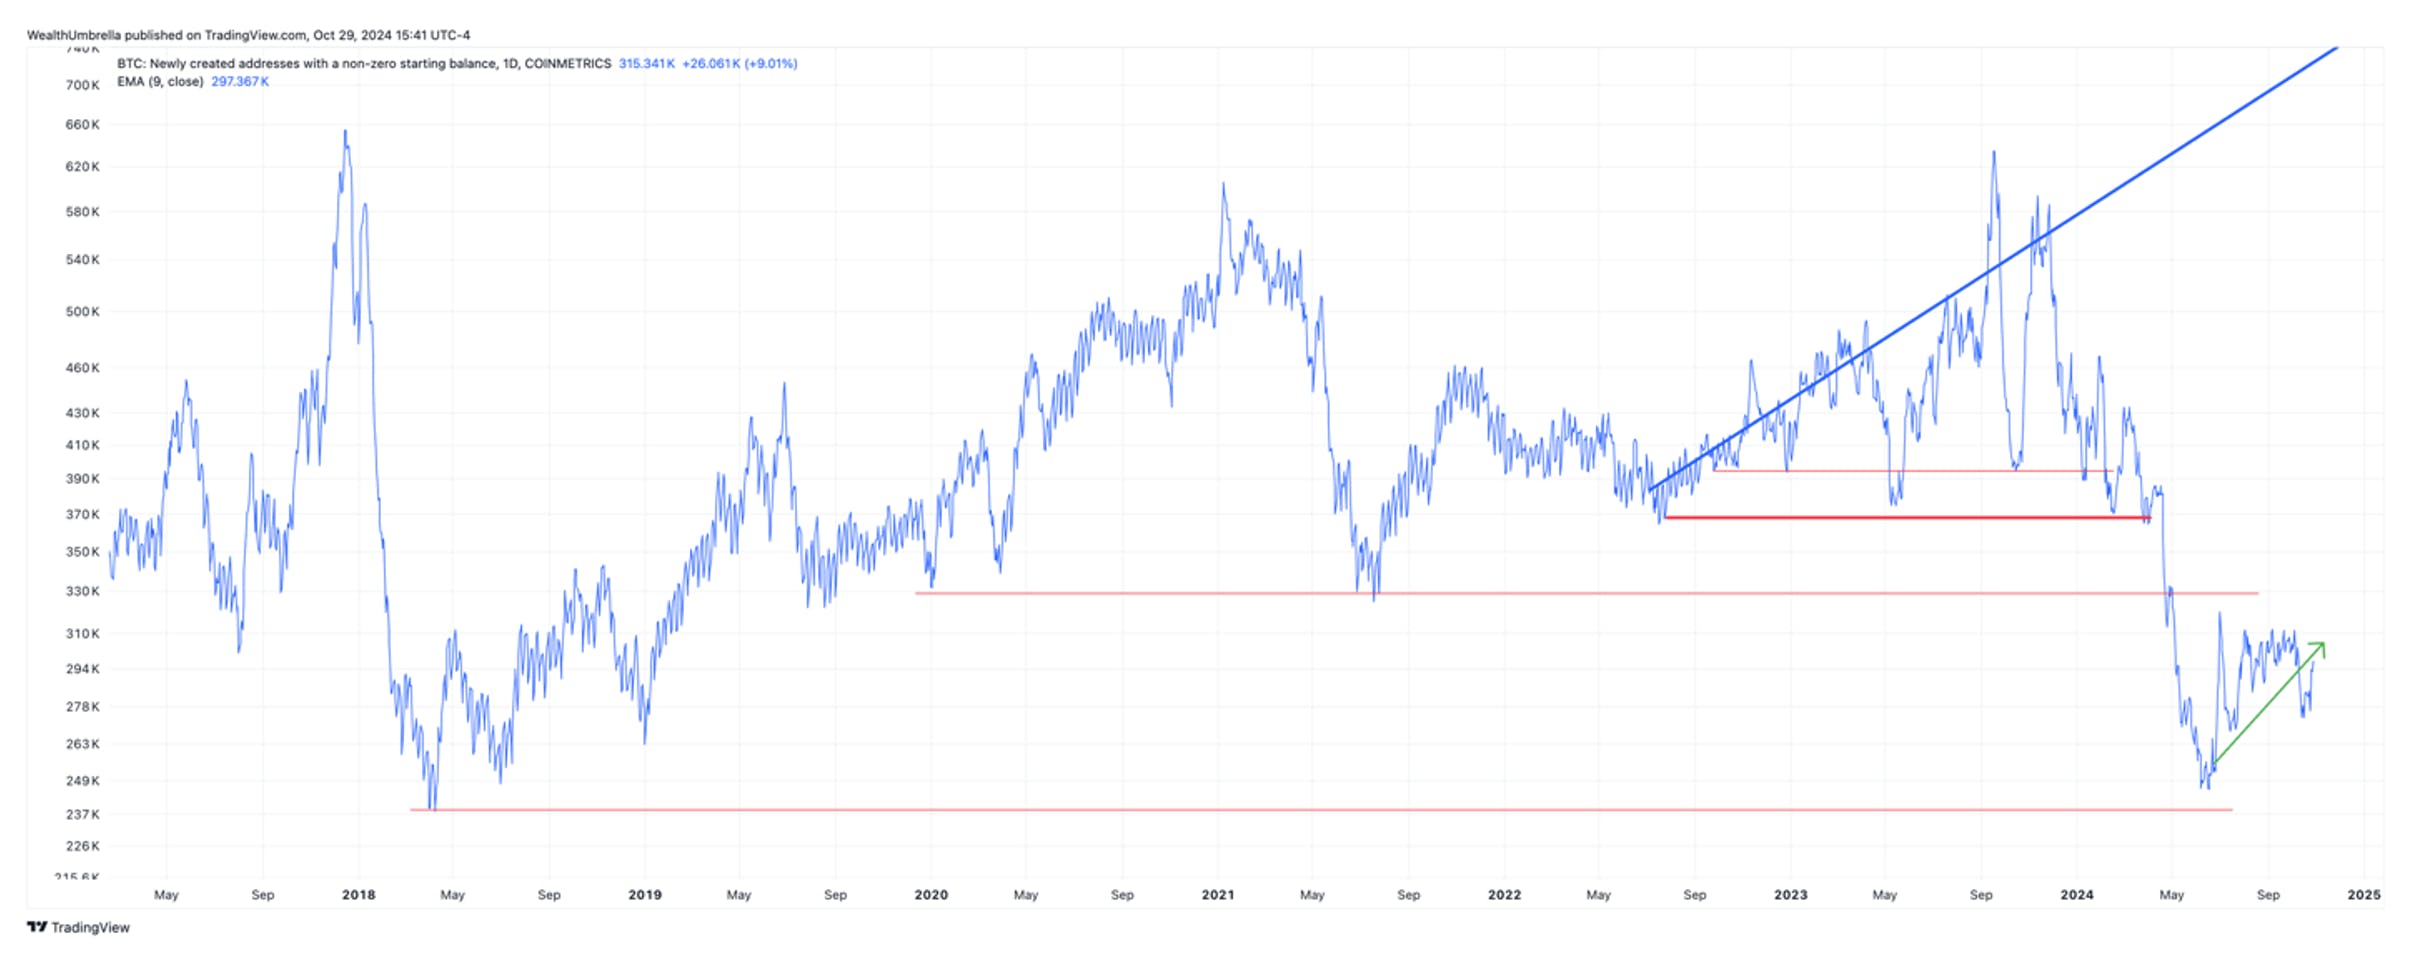
This is further backed up by the amount of newly created addresses on the blockchain with a non-zero starting balance. This metric has also been consistently on the rise over the last 2 months. It is suggesting that new investors are becoming interested in Bitcoin, which increases also demand.

A metric showing an increase in newly created blockchain addresses with non-zero balances, indicating rising interest from new Bitcoin investors and increased demand.

Source: WealthUmbrella

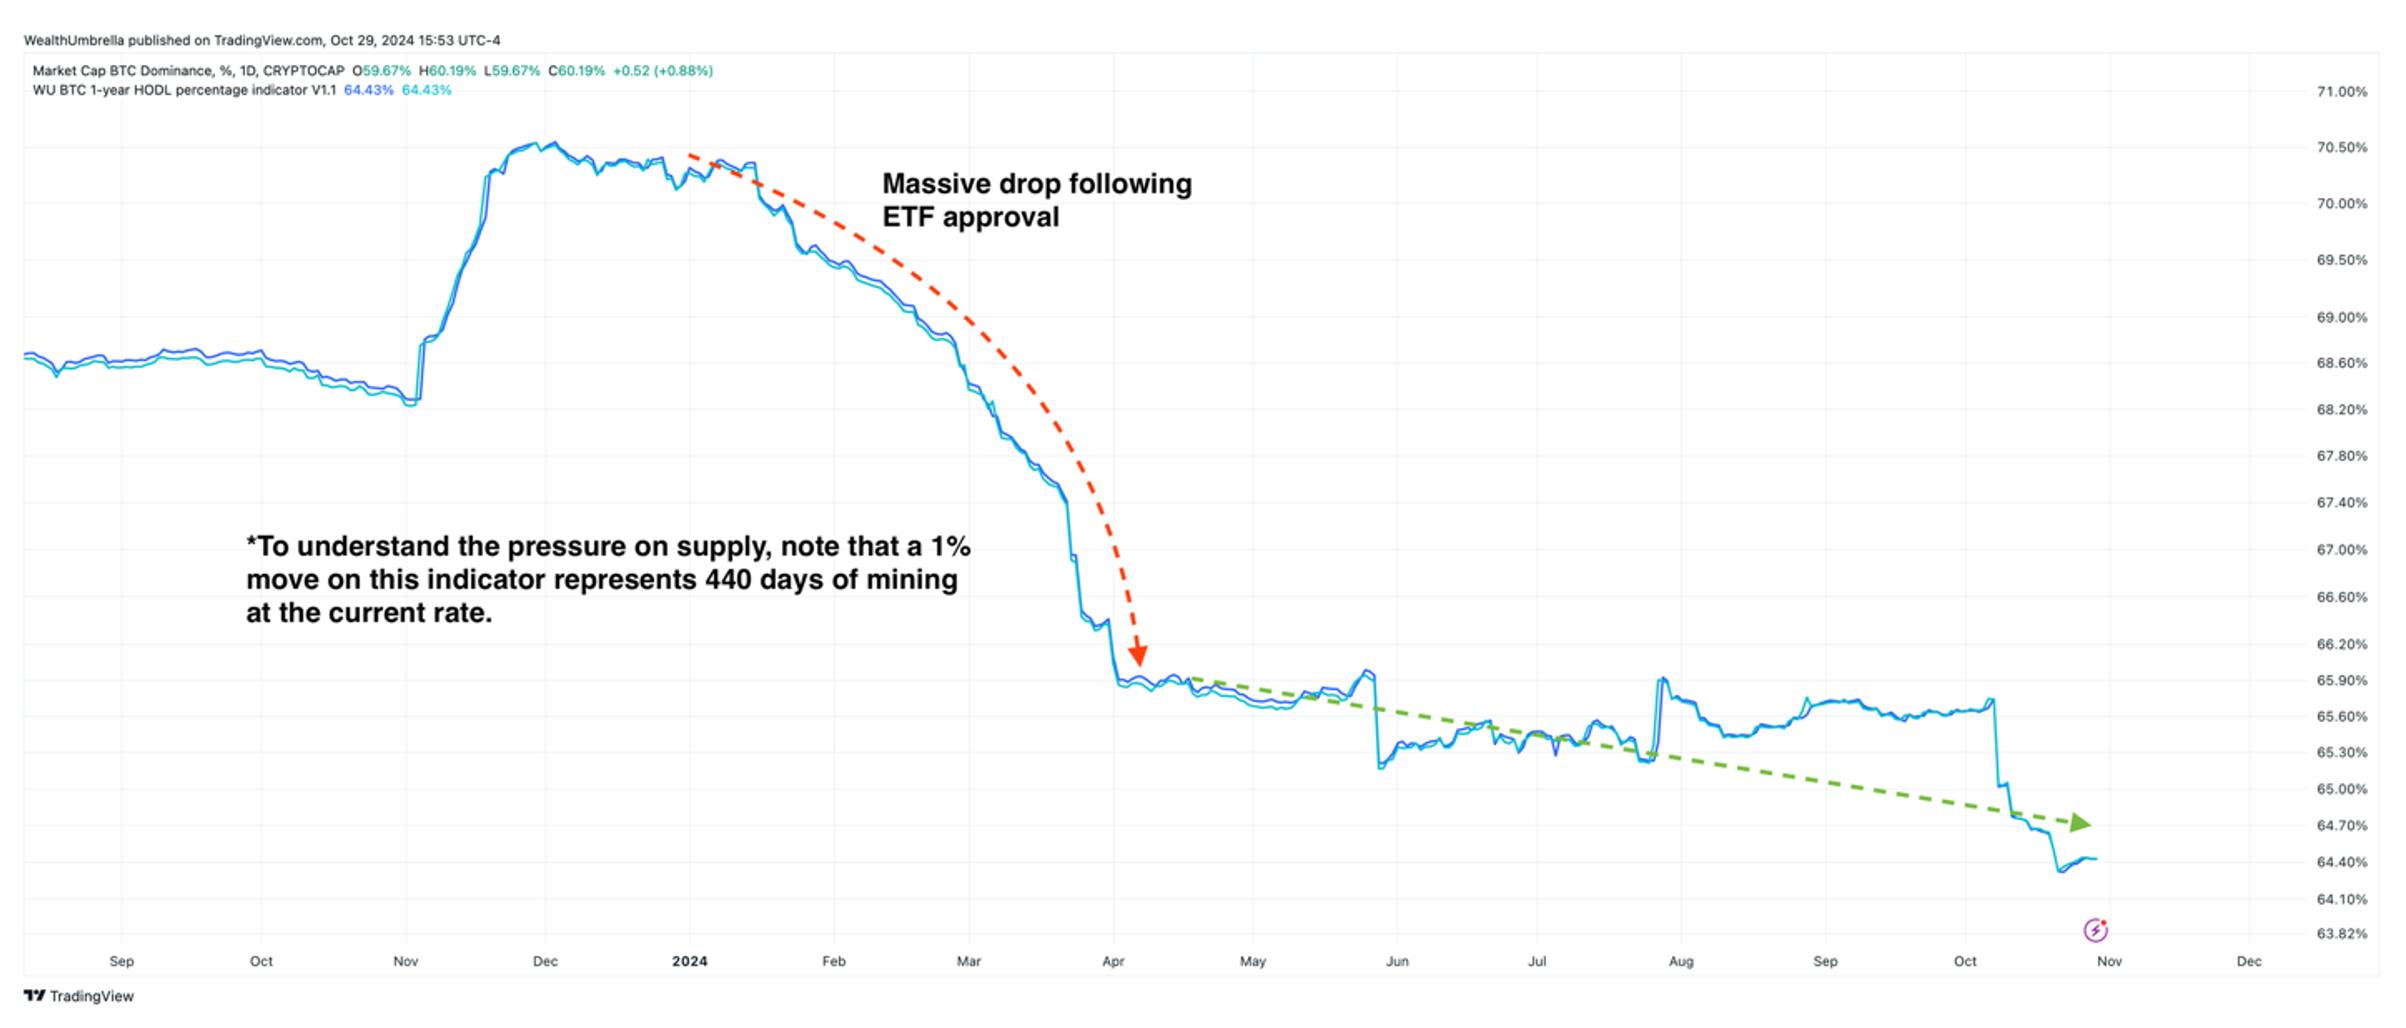
The above data supports a renewed interest in Bitcoin, as demand from new investors is back on the rise. What we like to see along with this pattern is the behavior of the long-term Bitcoin investors (hodlers). We can measure behavior by analyzing the percentage of Bitcoins that have not moved in over a year, which we call our 1-Year HODL percentage indicator.

A 1-Year HODL percentage indicator showing the proportion of Bitcoin that hasn’t moved in over a year, reflecting renewed interest from long-term investors.

Source: WealthUmbrella

As demand increases at a greater rate than the supply of Bitcoin, we expect price to continue to rise. The above trends should also continue as price increases, which is typically what we see at the onset of a fresh Bitcoin rally.

Regarding where we see this rally going, we first need to see a price candle close above the current all-time highs. The history of Bitcoin tells us that once we accomplish this, we typically see Bitcoin in price discovery mode for at least a few weeks before going into a consolidation or a pullback.

The March high was an exception. Even though we closed above all-time highs in March, this was accompanied with very rare overbought signals that tends to precede a correction. Today, all our metrics have been reset due to the length of the recent correction, which further supports a rally.

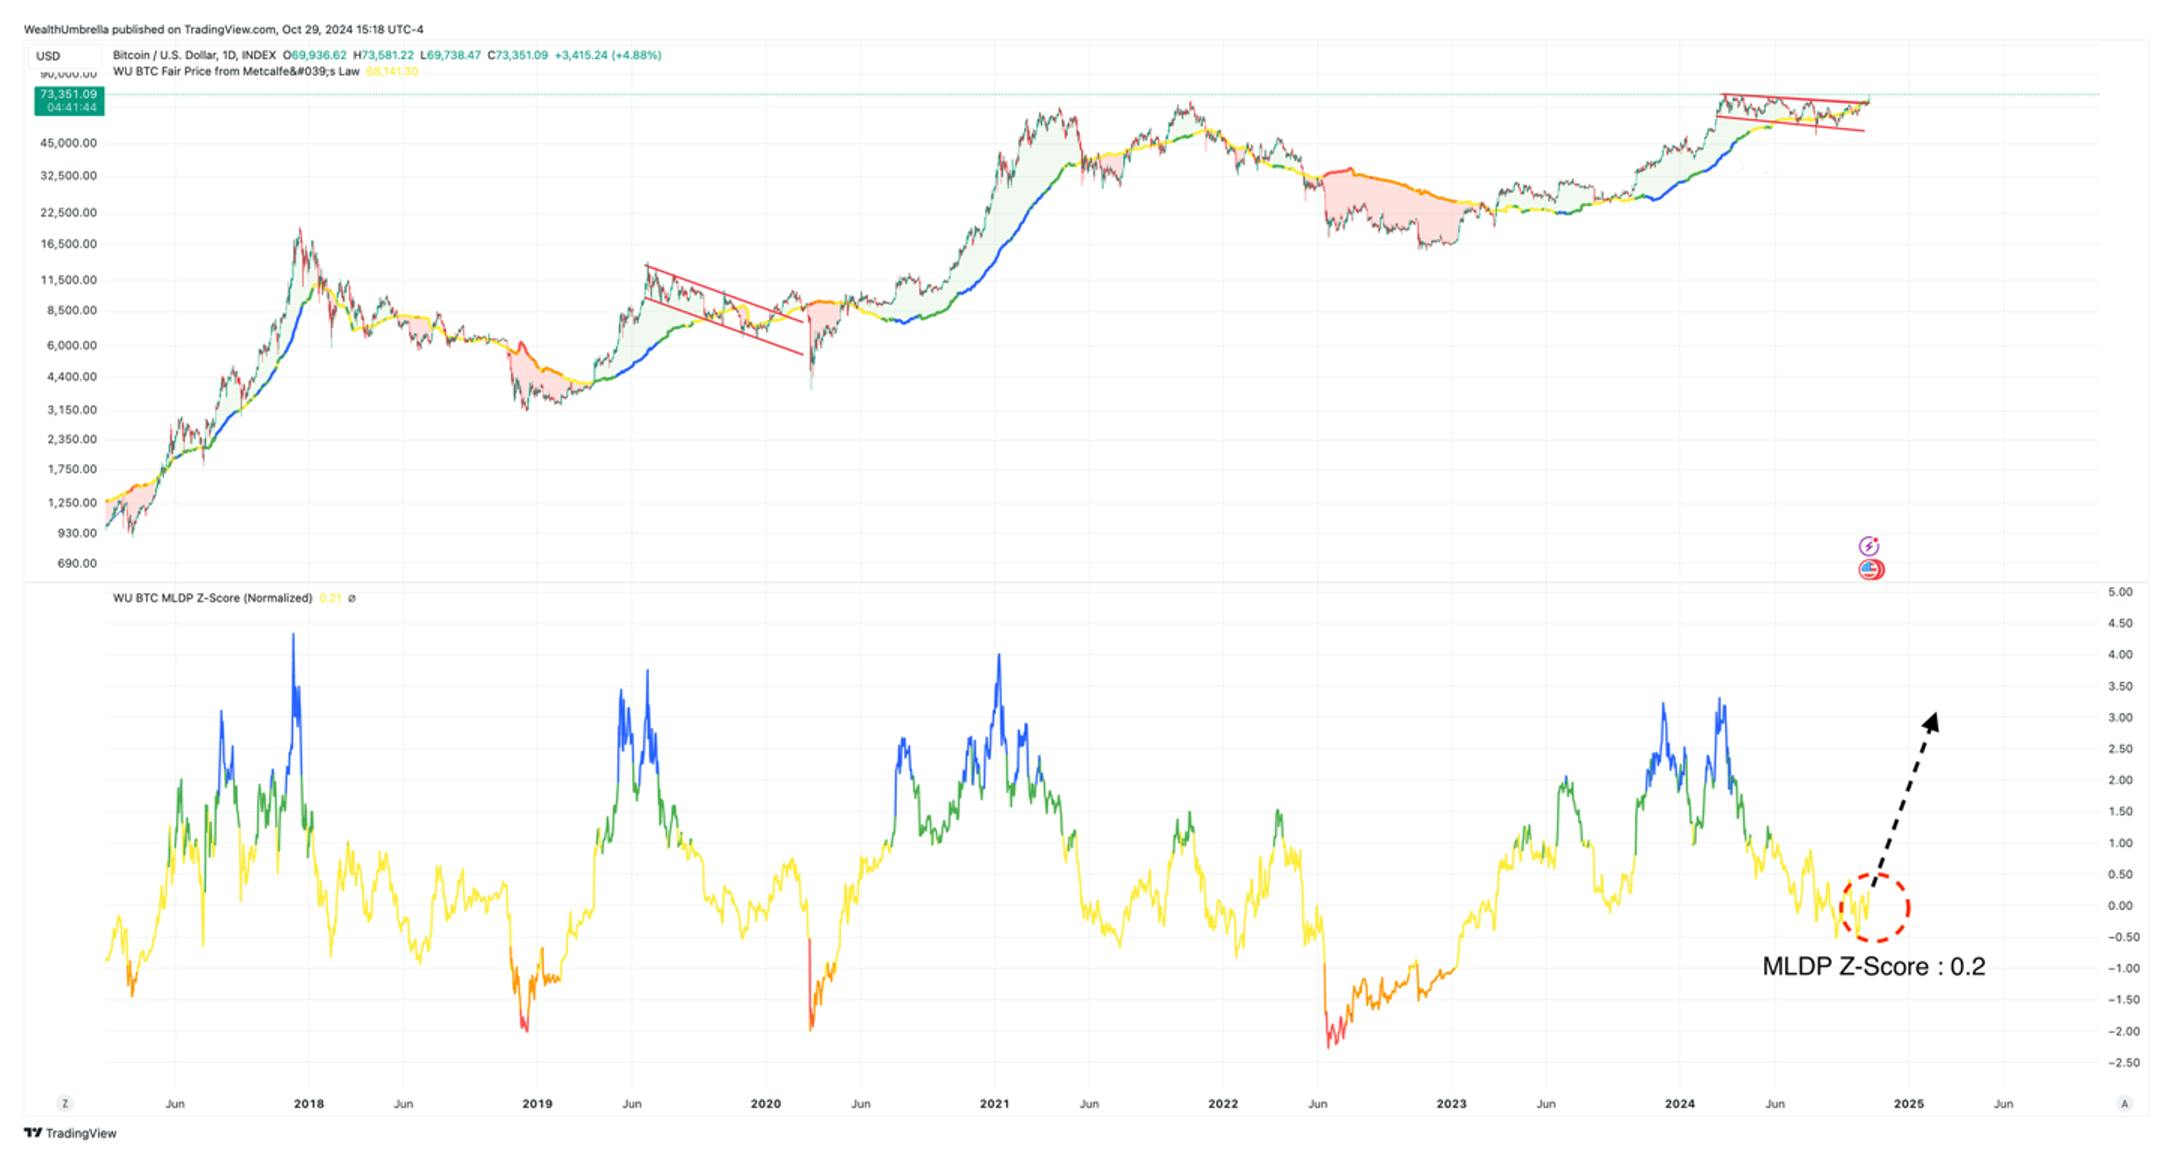
For example, one of our primary metrics for gauging cyclical tops/bottoms in Bitcoin, our Metcalfe's Law discount/premium model, was at 3.3 standard deviations around the ATH in March 2024.  This is a reading only seen at prior cyclical tops, and warranted caution. Today, this same model is at only 0.2 today, which is consistent with meaningful lows within on-going uptrends.

A chart comparing Bitcoin’s Metcalfe’s Law discount/premium model, highlighting a previous reading of 3.3 standard deviations at the March 2024 all-time high and the current reading of 0.2, suggesting a potential low in an uptrend.

Source: WealthUmbrella

For reference, the last time this indicator was at such a value was in October 2023 when Bitcoin was at $28K. This allowed Bitcoin to reach $45K, a 60% move, before consolidating.

As Bitcoin's market cap increases, investors should not expect the same % moves when it was much smaller. However, if we were to move higher in only the absolute value from the last time we saw this metric at a similar support, we would see a ~$16,000 increase in price, which would bring Bitcoin to around $80,000.

This doesn't mean that Bitcoin will stop at this conservative target, as the move to $45,000 last year was then followed by a move to $73,000 after some consolidation. If Bitcoin were to move by the same percentage, this would bring price to around $115,000, a price we believe Bitcoin will someday reach, but not necessarily as soon as the current rally.

This lines up with the technical analysis presented – a high probability rally that will likely fall below the $100,000 mark. If our on-chain analysis had to lean in one direction with what we are seeing now, it would support the green scenario outlined above. In other words, we should see another period of consolidation before pushing well into the $100,000 region.

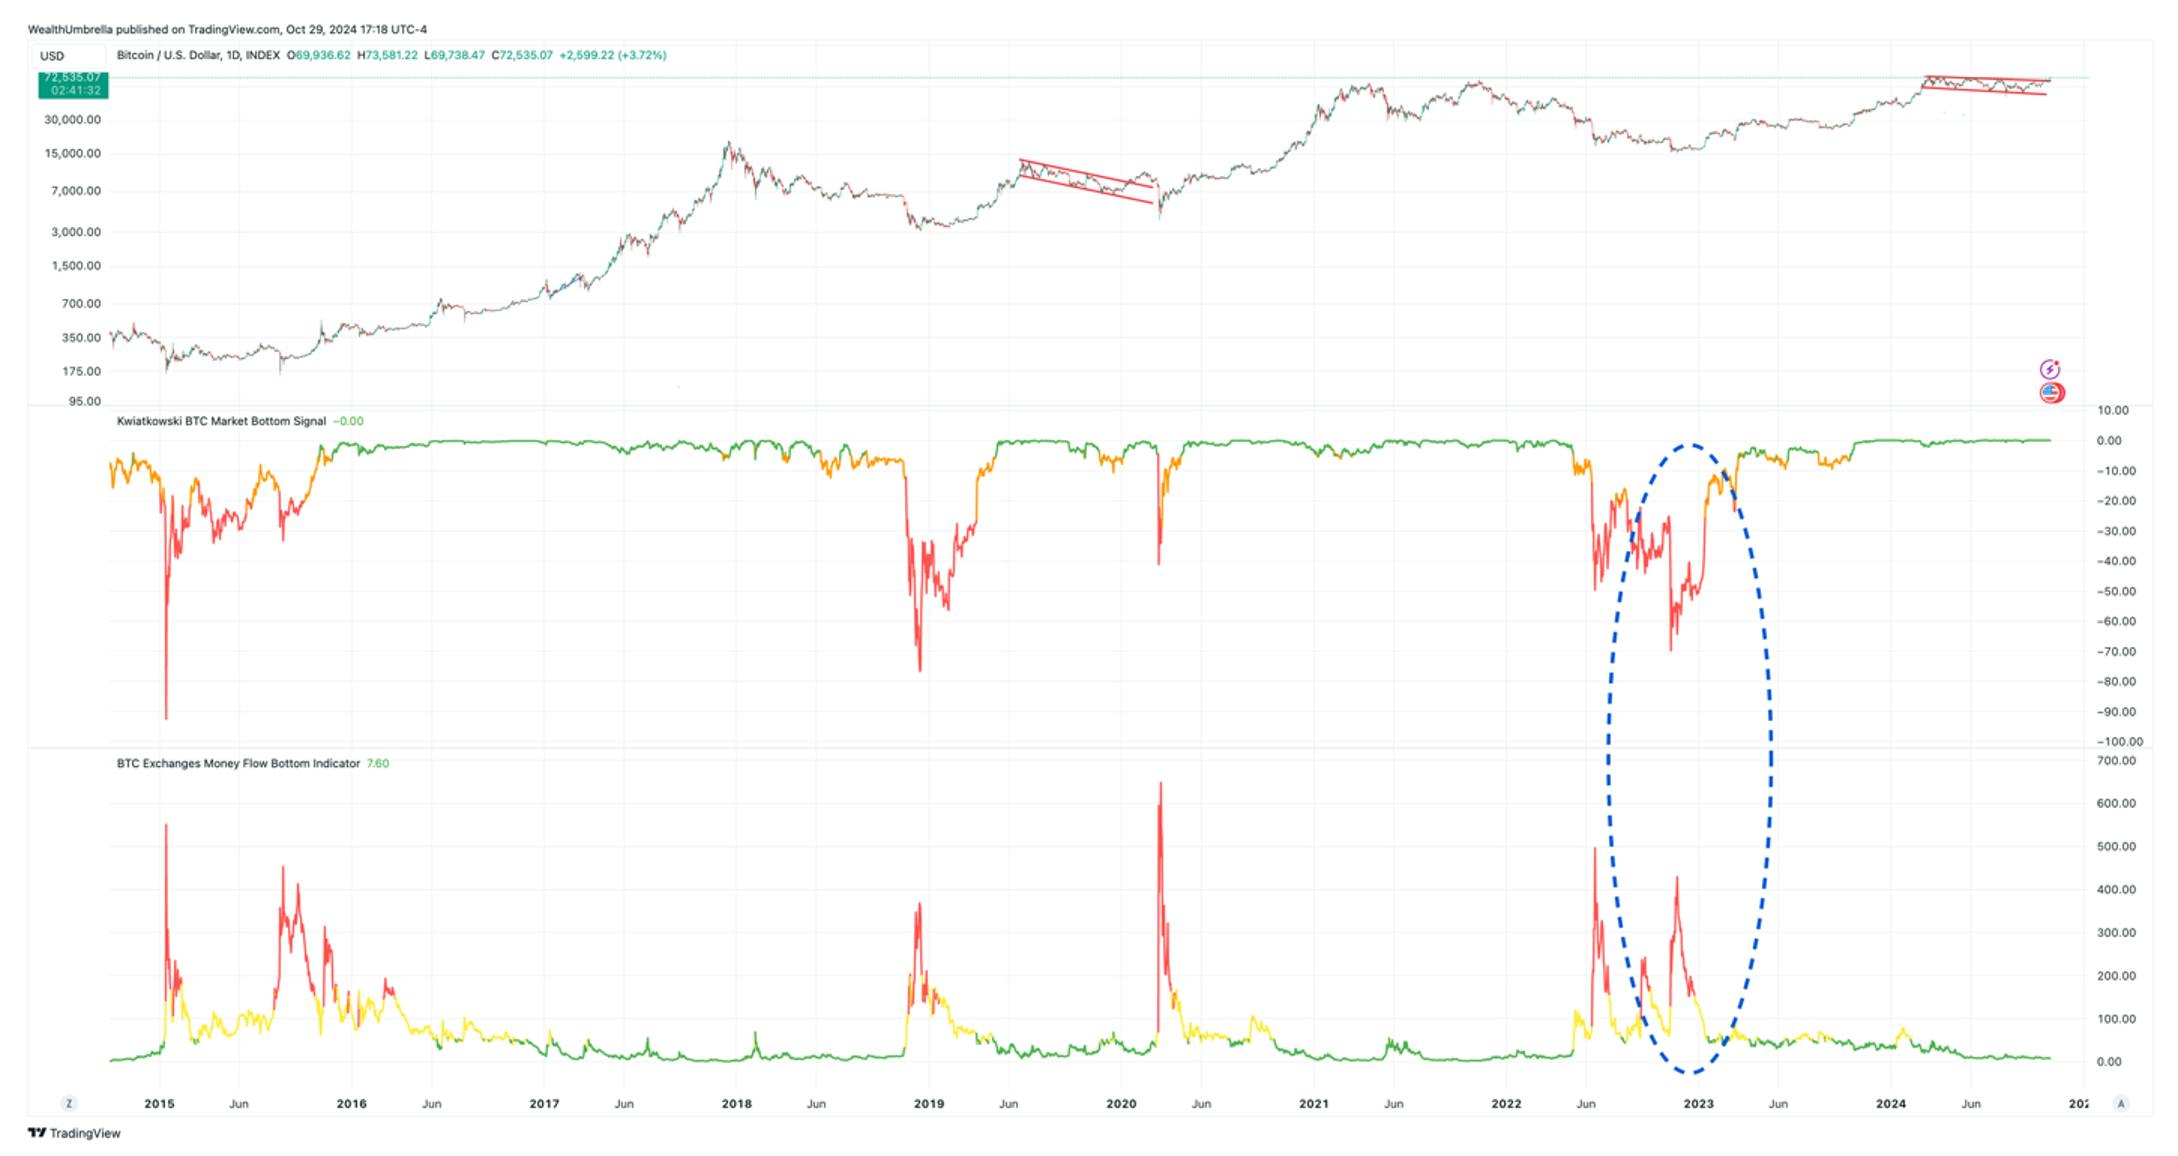
According to our Cyclical Top Indicator, we are still quite early this next leg higher. One of the projects we spent an enormous amount of time on was creating cyclical top and bottom indicators that will give a normalized reading across each cycle. Our bottom indicator has already proven to be quite accurate in calling the November 2022 bottom.

An overview of the Cyclical Top Indicator for Bitcoin, indicating that the market is still early in the next upward leg, with a note on the accuracy of the bottom indicator in identifying the November 2022 low.

Source: WealthUmbrella

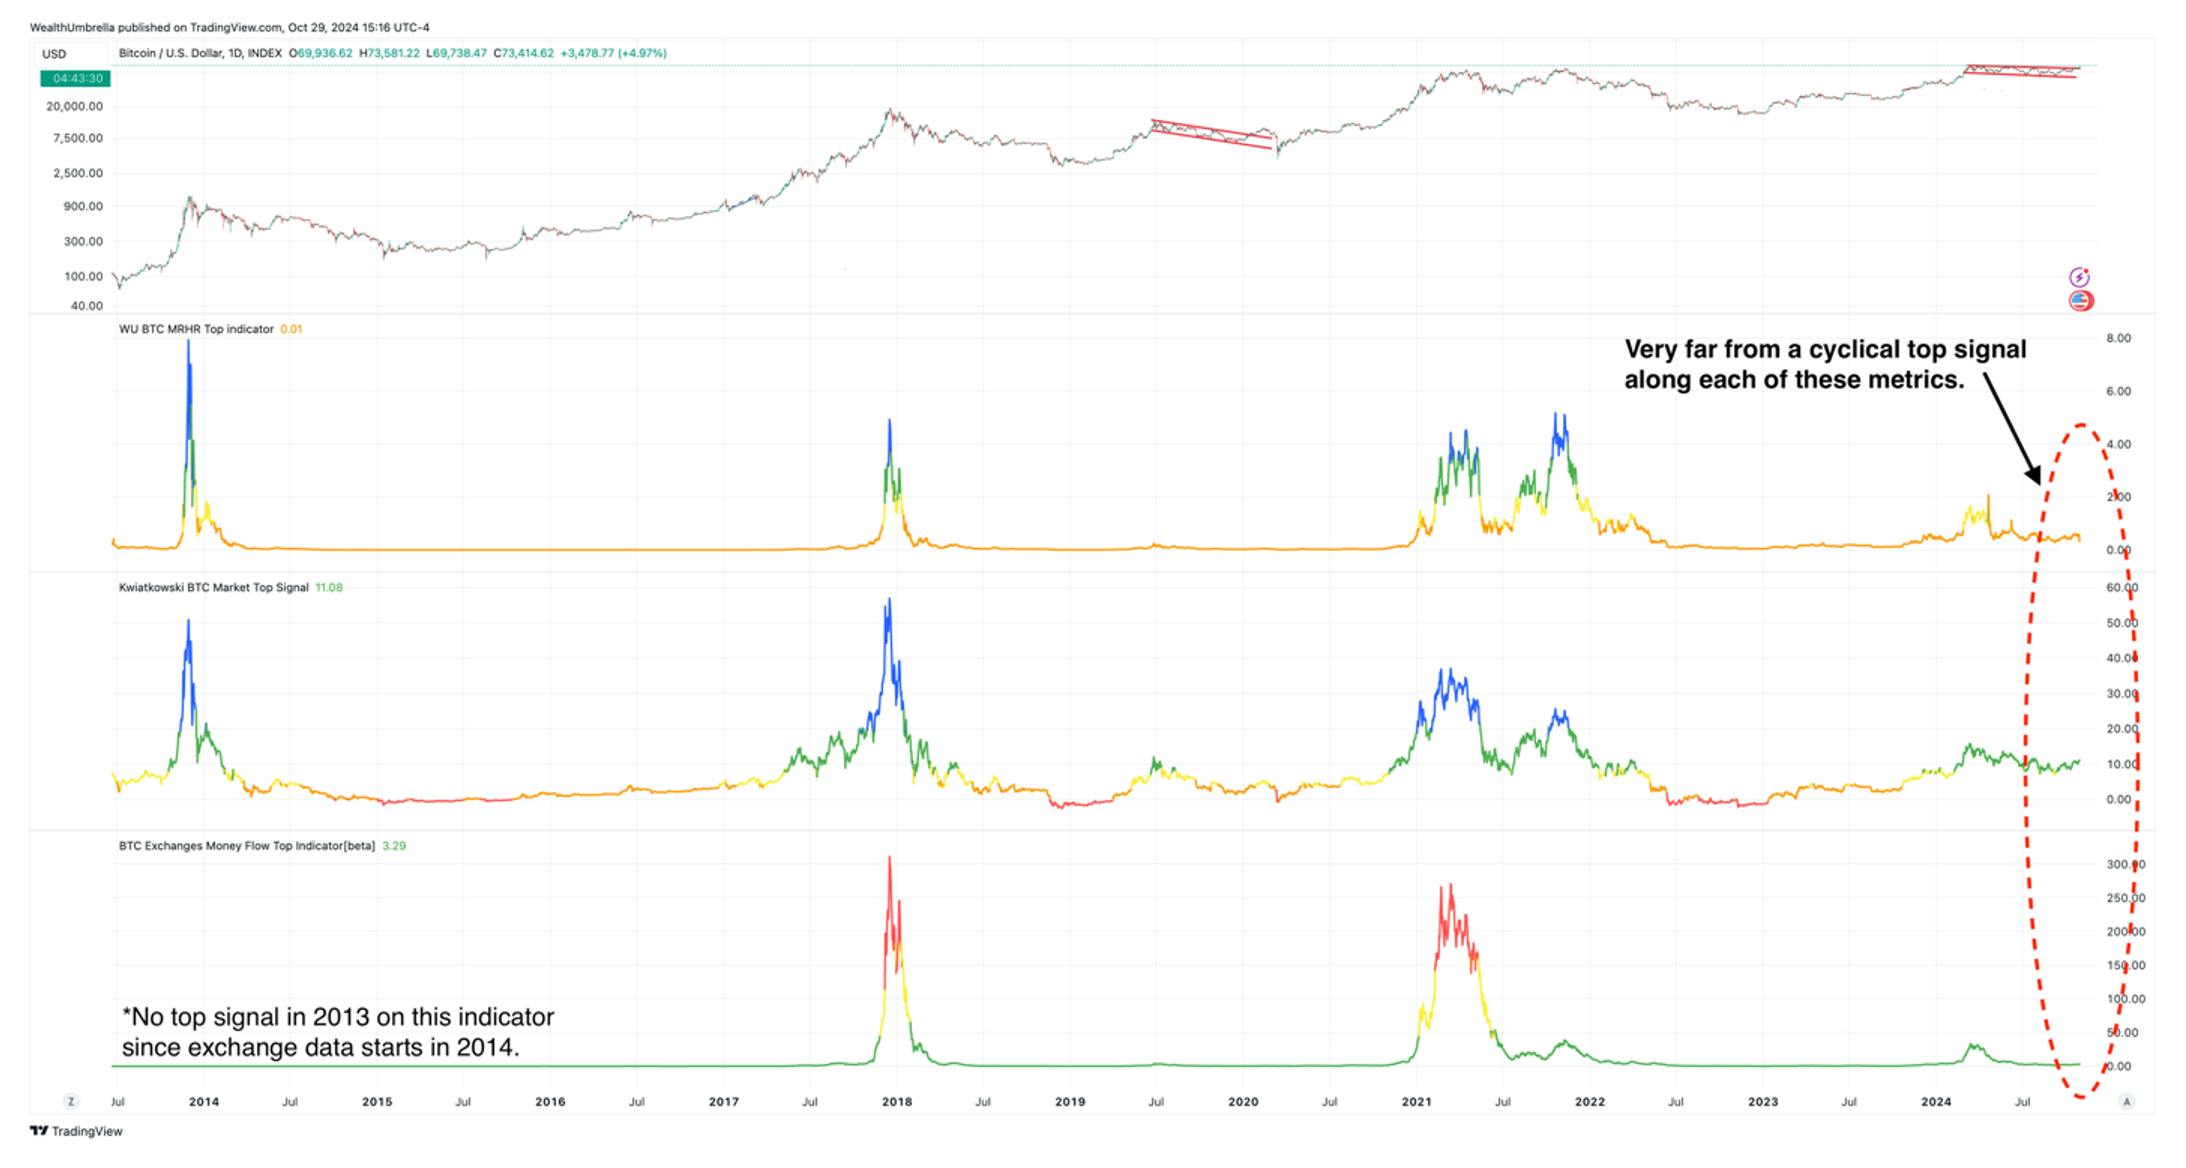
We expect the same with our Cyclical Top Indicator, which is shown below. At this moment, even though we are pushing toward new all-time highs, all our top indicators remain depressed. So, even with a push into the $80,000 – $100,000 range in the coming rally, this indicator will still leave ample room for a prolonged uptrend to continue.

A chart of the Cyclical Top Indicator for Bitcoin, showing that despite nearing new all-time highs, the indicator remains depressed, suggesting ample room for a prolonged uptrend even with a potential rally into the $80,000 - $100,000 range.

Source: WealthUmbrella

We anticipate that we will need at least one pullback or consolidation after the current push, followed by another push, before seeing them at a level that will start to enter the zone that could be consistent with a major top.

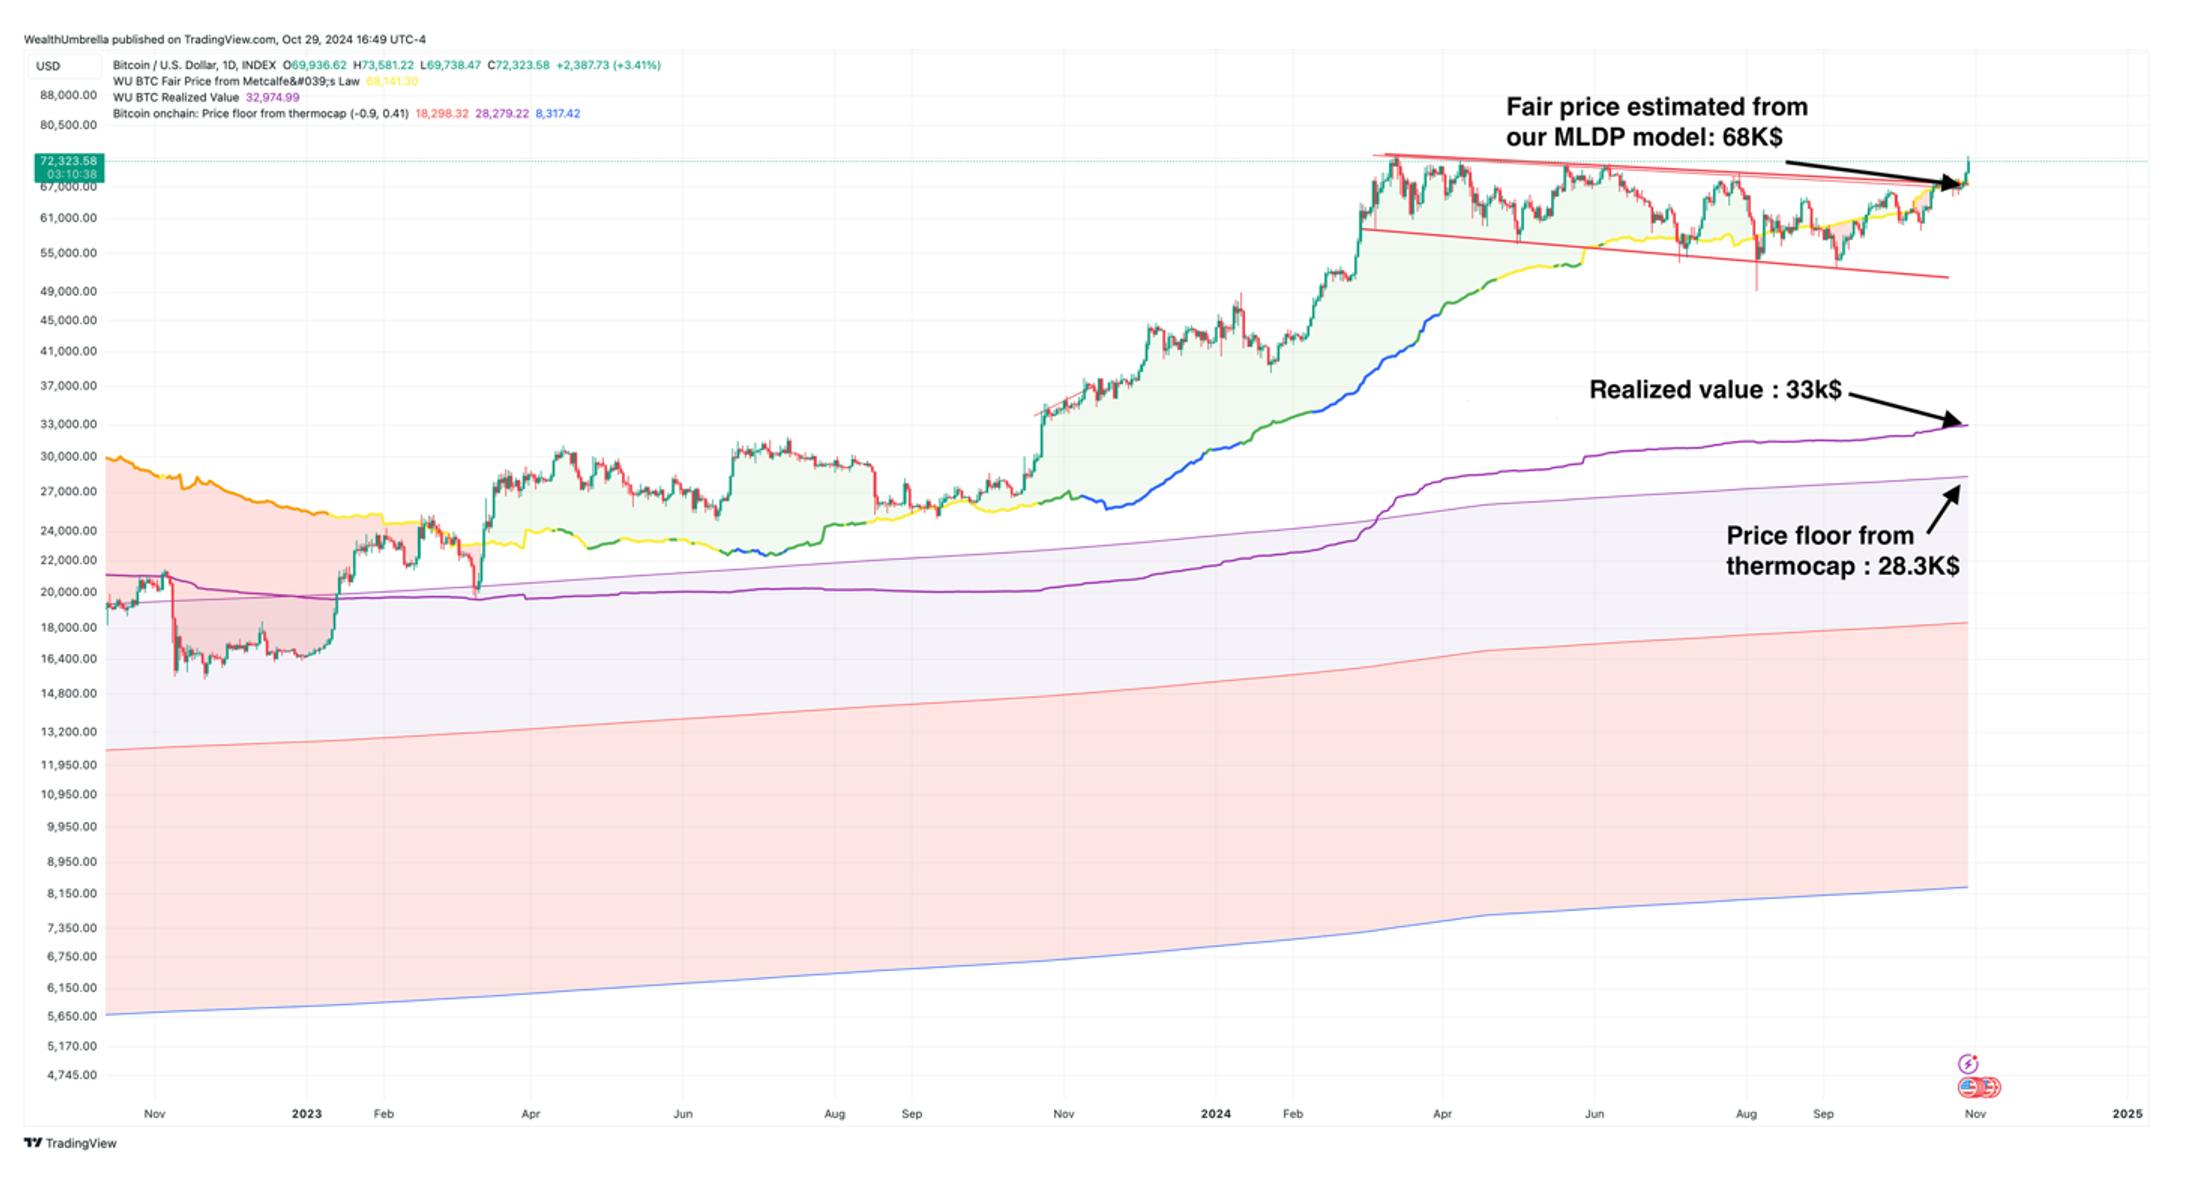
One final point worth mentioning is the considerable rise in the absolute floor for Bitcoin’s price. Bitcoin tends to not trade too far within this floor, which we can derive from Bitcoin's realized value (the average value at which every BTC last traded) and Bitcoin’s Thermocap history.

An analysis of Bitcoin indicating a needed pullback after the current push and highlighting a rising price floor based on realized value and Thermocap history.

Source: WealthUmbrella

While the realized value and price floor from Thermocap were around $24,000 in March 2024, these values are now $33,000 for the realized value and $28,300 for our price floor from Thermocap. These are very strong levels that tend to act as a floor at the height of a cyclical decline.

Although we don’t think we are going there, seeing them considerably increase while Bitcoin's price did nothing is, for us, a massive improvement that should pay off later. While this still represents considerable downside, what is important is knowing that at a cyclical top Bitcoin usually trades at 4-5X these values. The current downside appears limited and expectations for Bitcoin's price at a cyclical top become very interesting ($120K-$150K, which aligns with some targets we got in December 2023 by playing with some of our top indicators).

In conclusion, while we still believe the original price targets of $106,000 – $190,000 are attainable, we do believe risk has increased. As a result, we will likely reduce some risk on the next rally to all-time highs. Both the technical and on-chain analysis support a move the likely falls short of $100,000, followed by another correction. We will prudently take some gains in the hope of adding back when the technical picture and on-chain data support the outlined green scenario, which would take us well into the $100,000 region.

It is difficult to predict these targets, which we hold loosely as general guides for our risk management. However, there are two things we know for certain: 1) the uptrend pattern is incomplete, and will remain so until the breakout to new all-time highs; 2) several on-chain metrics have cooled off considerably over the past few months and now indicate a promising uptrend that could easily approach the $100,000.

If you own crypto or are interested in how to invest in crypto, we encourage you to attend our weekly webinar that we hold for premium members, held every Thursday at 4:30 EST. This week, we will outline our game plan for Bitcoin in real-time, as well as how we plan to manage the gains in three other altcoins that we currently own. If you would like a more automated risk-on/risk-off signal to help navigate your crypto positions, we encourage you to look at WealthUmrella’s hedge signal.

Please note: The I/O Fund conducts research and draws conclusions for the company’s portfolio. We then share that information with our readers and offer real-time trade notifications. This is not a guarantee of a stock’s performance and it is not financial advice. Please consult your personal financial advisor before buying any stock in the companies mentioned in this analysis. Beth Kindig and the I/O Fund own BTC at the time of writing and may own stocks pictured in the charts.

Recommended Reading:
Real Vision Video Interview: Will Nvidia Continue to Dominate AI?

I/O Fund CEO and Lead Tech Analyst Beth Kindig joins Ash Bennington, Senior Host & Crypto Editor of Real Vision, to discuss the explosive growth and future potential of Nvidia, the latest semiconductor developments, and much more. Beth explains why she remains bullish on Nvidia but is not a buyer now, how her $10 trillion market cap prediction is progressing, and how Nvidia’s CUDA platform has created an “unbreachable” moat.

Nvidia’s product roadmap is very strong, and companies focussing on custom silicon chips are having a hard time keeping up, especially with the introduction of the new Blackwell systems. The company has created an additional layer of moat with the move to release AI chips to a yearly cadence, so it’s even impossible for the Big Tech companies to catch up with Nvidia right now.

We are not buying Nvidia right now because SMH is not supporting its all-time high, and we would like to see that resolved before we resume buying Nvidia. The PC rebound is also slower than expected, so SMH has not been able to keep up with the three AI stocks, namely Nvidia, TSMC, and Broadcom.

Watch the full interview below:

https://www.realvision.com/1mjgit8yu3e

Timestamps:

00:05 Introduction

02:30 Cuda moat

06:14 Product roadmap

12:00 Perplexity AI

13:26 Nvidia valuation

17:15 SMH

21:20 AI Impact

24:10 Crypto

Coinbase Q3 24: Strong Cash and Adjusted EBITDA; Technicals Matter

Coinbase missed on the top and bottom line, with revenue of $1.205 billion missing estimates by 3.2% and adjusted EPS of $0.28 missing estimates of $0.42. Adjusted EBITDA was 37.1% or $449 million and is the bottom line number Coinbase tracks most closely to due to unrealized losses from owning crypto assets. The company has $8.2 billion on the balance sheet in cash and cash equivalents.

This quarter marked a QoQ decline in revenue of (16.9%) and a decline of (27%) QoQ in transaction revenue. Looking forward, October transaction revenue numbers were in line with Q3 at $190 million, or $570 million if we assume a similar trend continues. Q3’s transaction revenues were $572.5 million.

Broadly speaking, the crypto market was softer in Q3 than in Q2. Total crypto market capitalization flat QoQ while the average crypto market capitalization decreased 10% QoQ. Crypto asset volatility, a key driver of trading volume, was down 5% QoQ and the total trading volume for the United States spot market declined 18% QoQ. Trading volume for the US spot market is where the majority of Coinbase’s revenue is derived.

Our firm is working with Wealth Umbrella to put out a note on Bitcoin this week for the free newsletter with an outlined trading plan. It’s a must-read. There is also a similar trading plan for Coinbase, which if confirmed, the charts indicate would move in lock-step with the leading crypto asset. Knox will review this trading plan in the Oct 31st webinar. This stock has a leading allocation in our portfolio, and thus, we are watching the technicals closely as Coinbase is largely dependent on volatility and asset prices, and is not tied as much to the results of an earnings report. Should Bitcoin not extend, there is risk management plan for that, as well.

Revenue

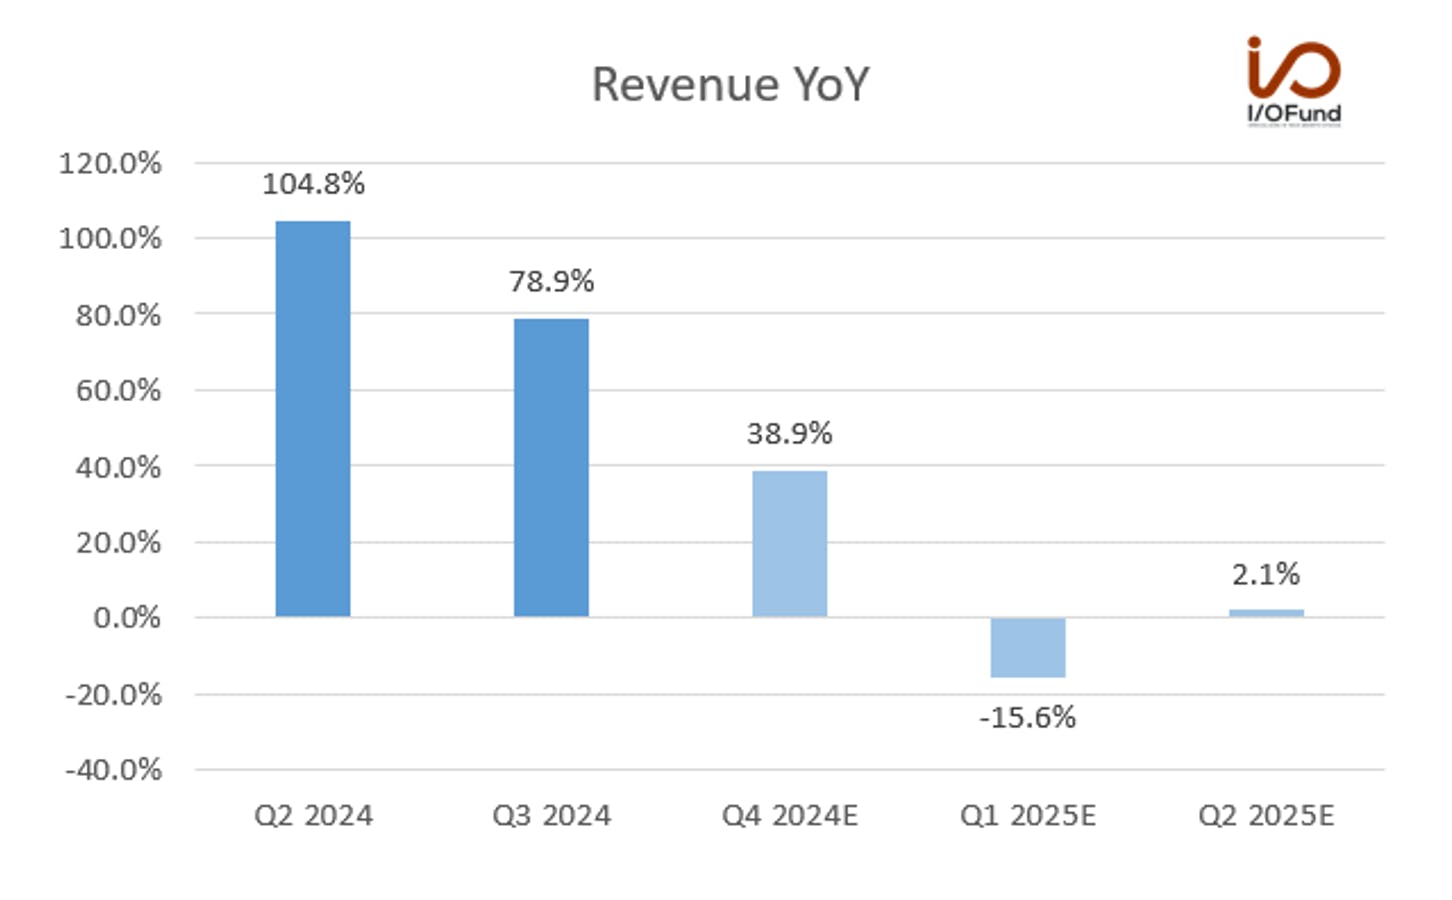
Coinbase reported revenue of $1.21 billion in Q3, for YoY growth of 78.9% and a QoQ decline of (16.9%), driven lower by a (27%) QoQ decline in transaction revenue. This marked a deceleration from the 104.8% YoY growth rate recorded in Q2, and also fell shy of the consensus estimate for $1.25 billion in revenue.

Coinbase said that “average crypto market capitalization decreased 10% Q/Q over the same period,” with lower average crypto prices, while “crypto asset volatility — a key driver of trading volume — declined approximately 5% when comparing the Q3 average with the Q2 average.” This drove an (18%) QoQ decline in both US spot trading volumes and Coinbase’s internal trading volumes in Q3.

Despite the more challenging market conditions for revenue generation and QoQ growth, Coinbase noted that it is working to drive revenue through diversification, including stable coins, derivatives, international expansion and custody solutions.

Moving forward, Coinbase’s quarterly revenue growth rates are expected to continue decelerating, with Q1 seeing a YoY decline of nearly (16%) as Coinbase begins to lap difficult comps. As stated in our deep dive last month, it’s nearly impossible to predict crypto prices and volatility this far in advance. Thus, Coinbase typically sees heavy revision activity on a 3M and 6M basis:

The bottom line is even more unpredictable:

Key Segments

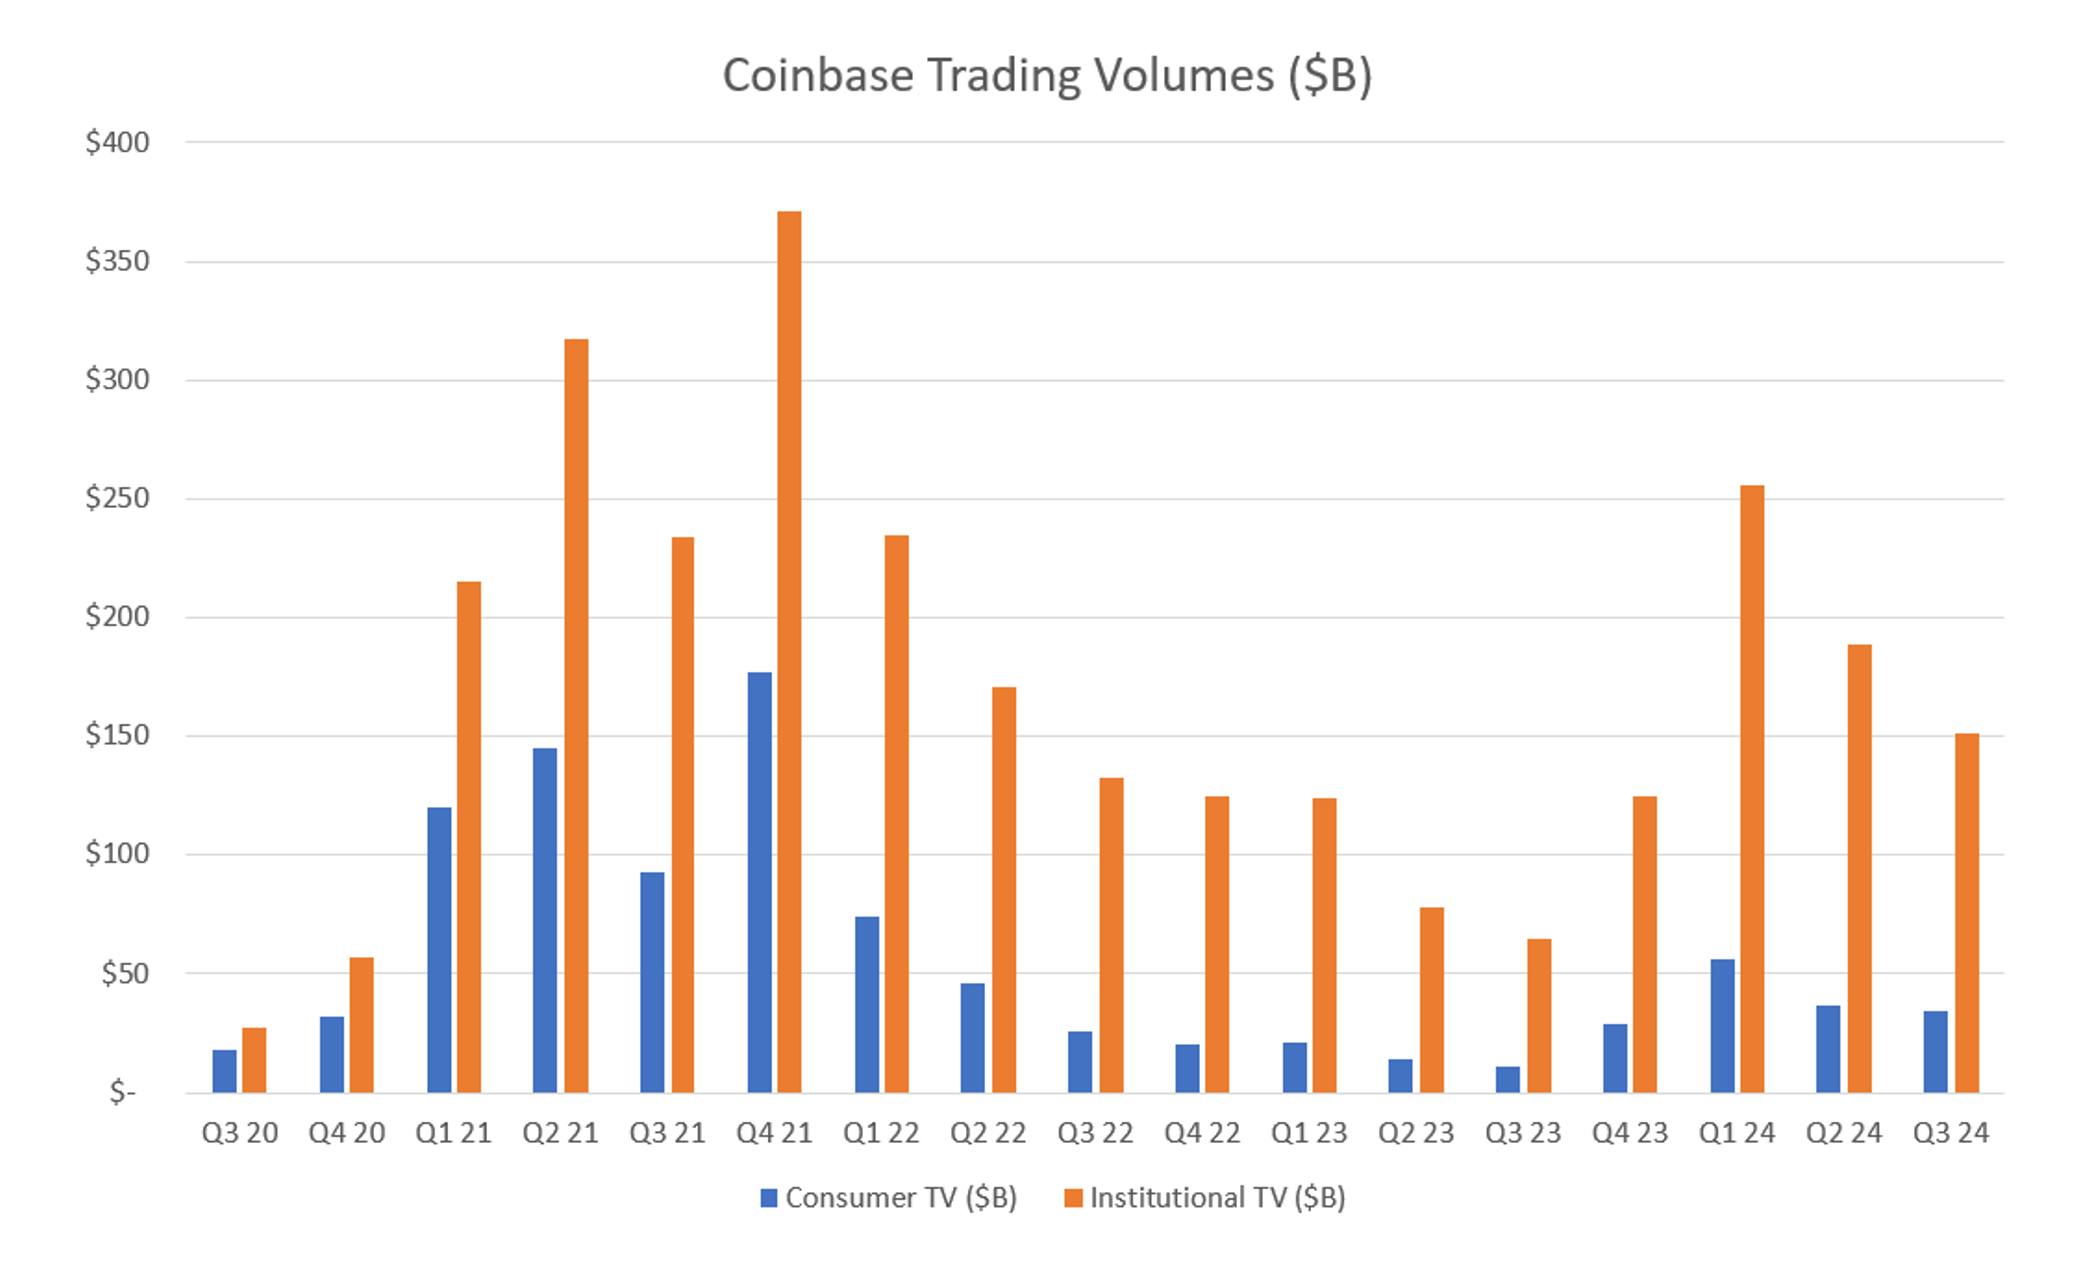
As previously mentioned, Coinbase’s trading volume was $185 billion in Q3, down (18%) QoQ but up 143% YoY on low comps from when Bitcoin and crypto traded at depressed prices in 2023.

Consumer trading volume moderated slightly in the quarter, coming in at $34 billion, down from $37 billion in Q2. Transaction revenue in Q3 was $572.5M, up 98.4% YoY and down (26.7%) QoQ.

What’s notable here is that despite a single digit decline in consumer trading volume on a QoQ basis, from $37 billion to $34 billion, consumer transaction revenue declined (27%) QoQ to $483 million. Coinbase gave three reasons for the outsized sequential decline in transaction revenues versus trading volumes:

  • Share of US fiat-crypto trading volume, which drives a majority of consumer transaction revenue, was “largely steady Q/Q.”
  • Stablecoin pair trading volume increased significantly QoQ, which carries little to no fees. Tether was 15% of trading volume.
  • Non-trading revenues decreased, including “decentralized trading through Coinbase Wallet and miner fees.”

The CFO further explained in the Q&A: “First is mix shift where we saw more stable pair trading. Second is we did not see as much revenue in Q3 from the nontrading transaction types. And so as those 2 drivers that led to change in the blended average fee quarter-over-quarter, but no underlying changes to the fees per product, mix and the nontrading revenue changes.”

However, institutional trading volume slipped further, falling to $151 billion, down (20%) QoQ and more than (41%) lower than Q1’s $256 billion. Institutional transaction revenue declined (13%) QoQ to $55 million, largely due to the decline in institutional trading volume.

Base revenue, reported in Other transaction revenue, was $34 million, down 35% QoQ due to lower Base fees – these lower fees drove a sharp uptick in Base transactions, which rose 55% QoQ. Coinbase expects adoption of Base to increase with lower fees.

Coinbase added that October transaction revenue was ~$190 million, which is in line with Q3’s monthly average; however, management cautioned against extrapolating this across the quarter as asset prices and volatility could rapidly change.

Subscription and Services Revenue

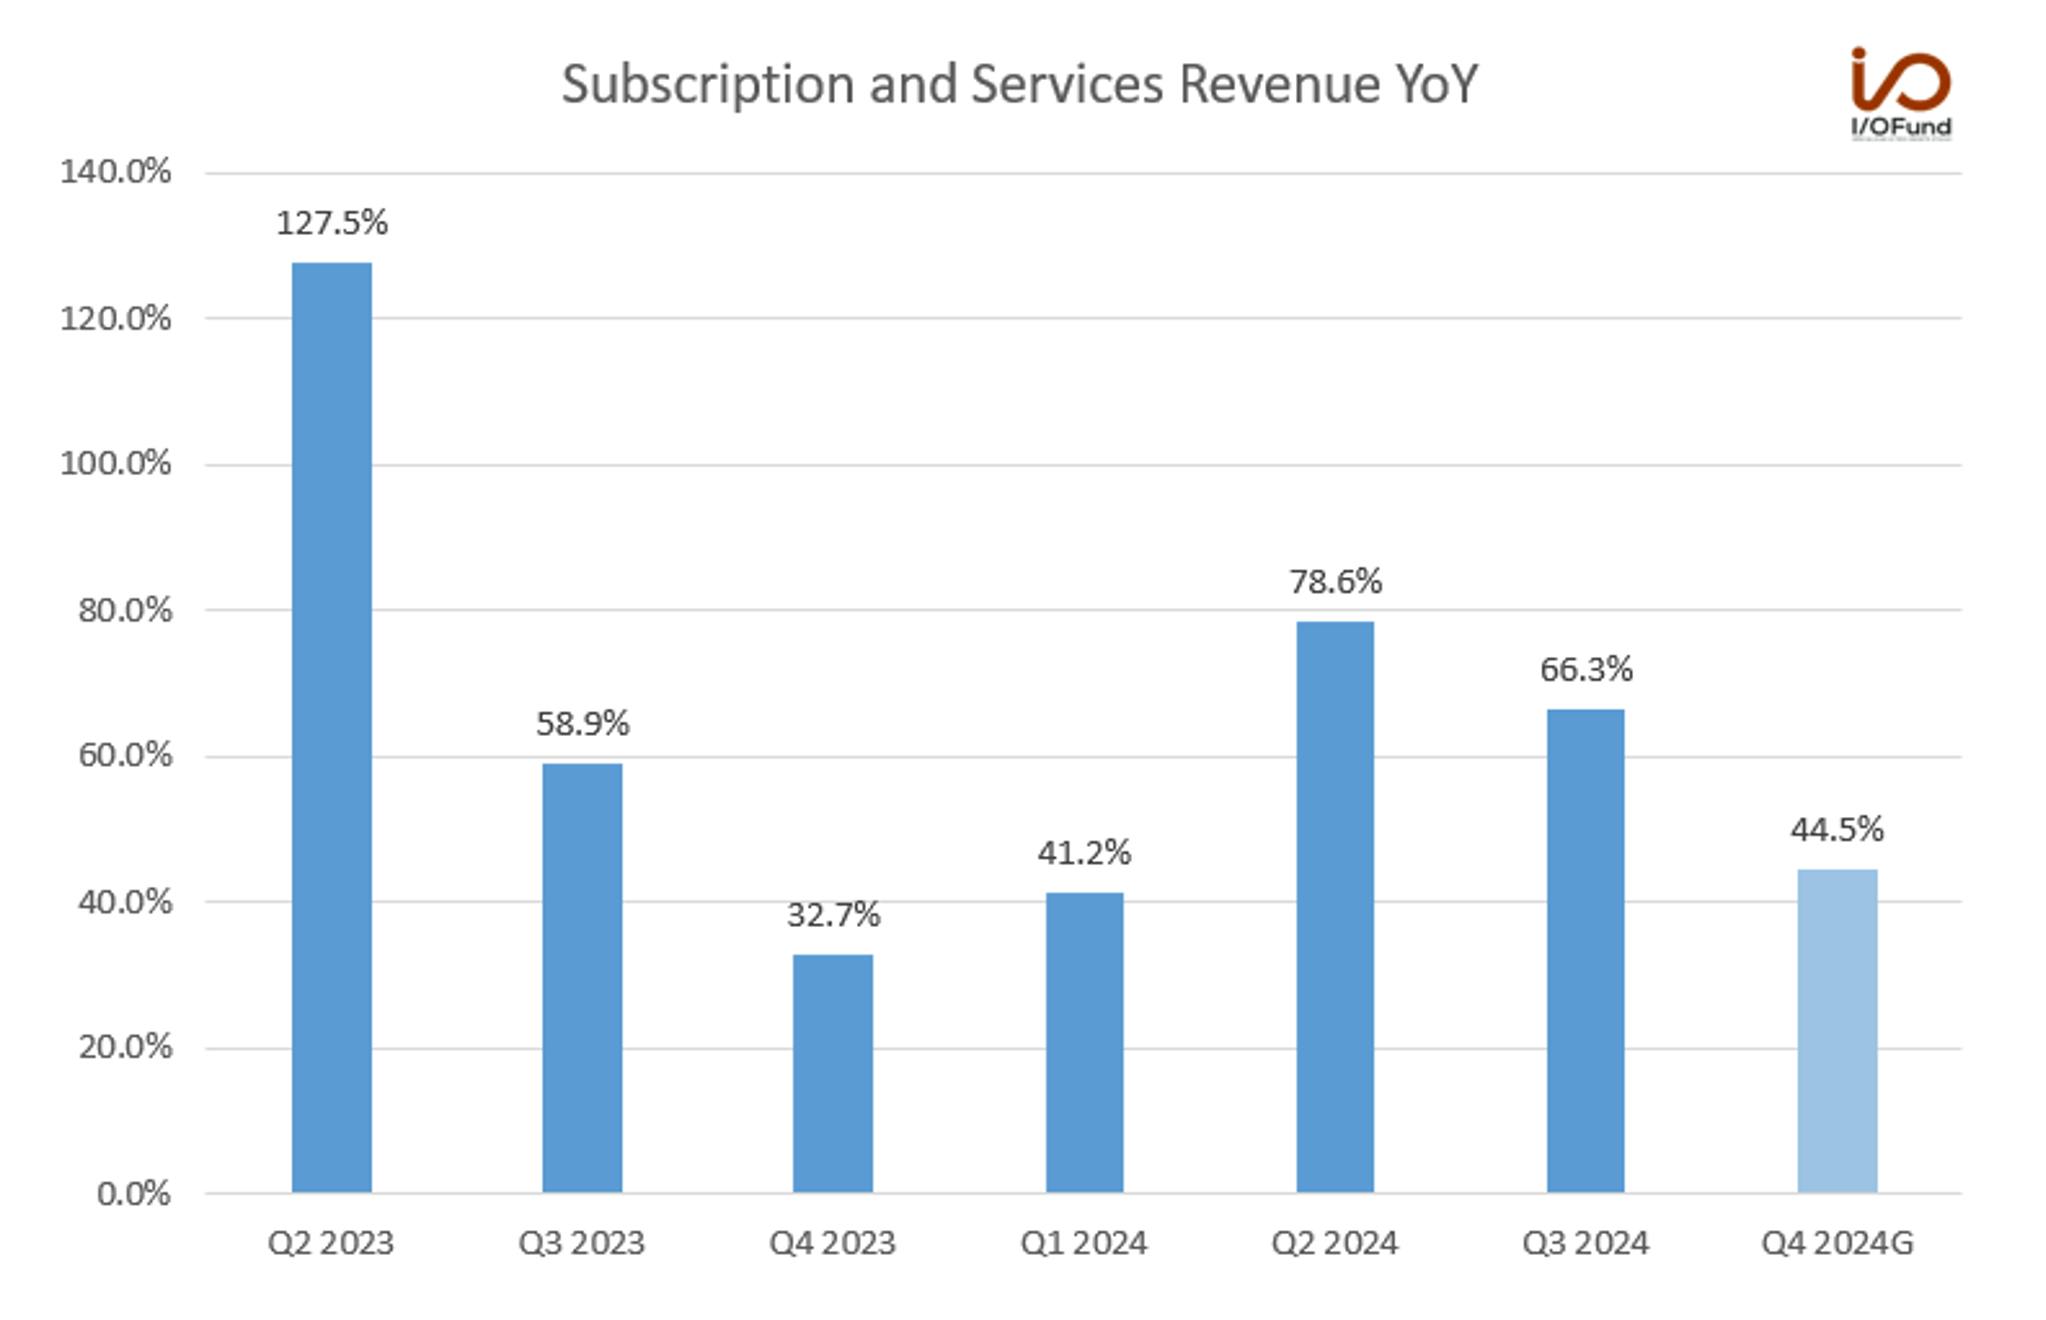
Coinbase’s subscription and services revenue came in at $556 million, on the lower end of its guided $530 – $600 million range, for YoY growth of 66.3% and a QoQ decline of (7%). Native units in staking and custody grew QoQ offsetting lower average crypto asset prices.

Management highlighted that this segment was $1.4 billion last year and is tracking $2 billion this year, for growth of 42.8%.

For Q4, Coinbase guided to a wide range of $505 – $580 million for subscription and services revenue, or 44.5% YoY growth at midpoint. This would mark a more than 20 percentage point QoQ deceleration for the segment.

Within subscription and services revenue:

  • Stablecoin revenue rose more than 43% YoY and nearly 3% QoQ to $246.9 million, driven primarily by “higher average USDC on-platform balances” and higher USDC market capitalization, offset by lower effective interest rates.
  • Blockchain rewards were $154.8 million, up nearly 108% YoY but down (16%) QoQ. Coinbase said that lower average crypto prices, primarily for Ethereum and Solana, drove the QoQ decline.
  • Interest and finance fee income was $64 million, up almost 51% YoY but down (8%) QoQ.
  • Custodial fee revenue was $31.7 million, up just over 100% YoY but down (8%) QoQ.
  • Other subscription and service revenue was $58.7 million, up 100% YoY.

Margins

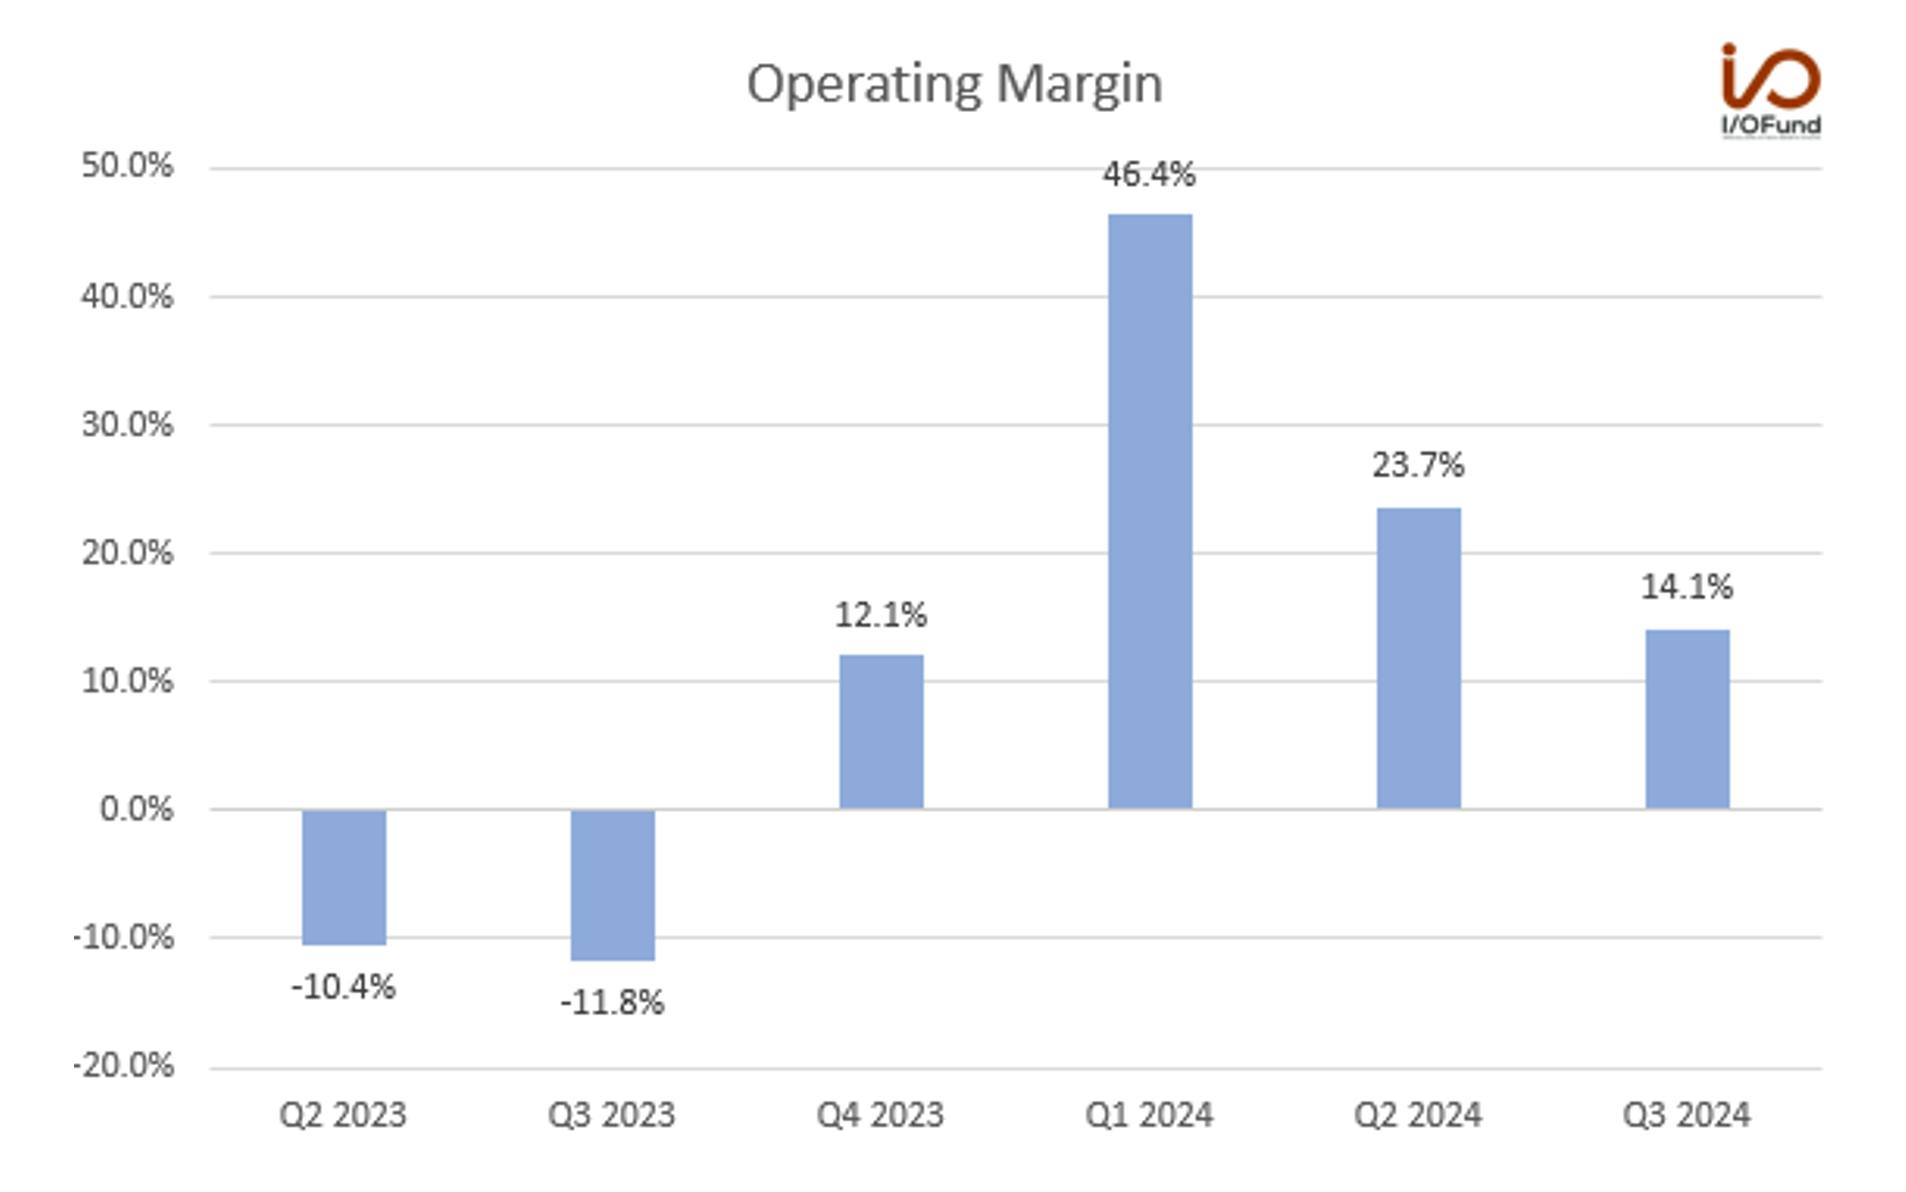
Operating margin shrunk again sequentially, with Coinbase reporting a 14.1% operating margin in Q3, down from 23.7% in Q2. However, this did mark a notable improvement from an (11.8%) margin in the year ago quarter.

Net margin improved sequentially to 6.3% in Q3, up from 2.5% in Q2, as Coinbase reported $75.5 million in net income, more than doubling the $36.1 million reported in Q2. Coinbase added that net income “included $121 million in pre-tax losses on our crypto asset investment portfolio — the vast majority of which were unrealized — as crypto prices were lower” at the end of Q3 relative to Q2. The losses were $92 million after reflecting the tax impact. Due to the company having 25% of their net cash in crypto assets, the company places emphasis on adjusted EBITDA.

Regarding crypto assets, per the CFO: “The fair market value of our crypto investments was about $1.3 billion at the end of the third quarter. You can see more detail in our filings, but we hold Bitcoin in addition to Ethereum and a mix of other crypto assets.”

Stock-based compensation remained elevated in the quarter, at $248 million, or 20.6% of revenue. For Q4, Coinbase said that they “expect a modest Q/Q decline in stock-based compensation, driven primarily by roll-off of non-recurring multi-year awards.”

Earnings and Adjusted EBITDA

Despite the sequential improvement in net income, Coinbase fell short of earnings estimates, reporting $0.28 in GAAP EPS, compared to the GAAP consensus of $0.38. For Q4, Coinbase is expected to report $0.67 in GAAP EPS, a strong sequential improvement but still down nearly (36%) YoY. Adjusted EPS of $0.28 also fell short of estimates for $0.42. This is due to the $121 million in pre-tax losses on crypto assets mentioned above, and the $92 million when including the tax impact.

Adjusted EBITDA was $449 million, or a margin of 37.1%. This compares to adjusted EBITDA of $595.6 million, or 41.1% of revenue, in Q2, and $178.3 million, or 26.5% of revenue in Q3 2023. This is the company’s 7th consecutive quarter of positive adjusted EBITDA.

Cash Flow and Balance Sheet

Operating cash flow remained exceptionally strong in Q3, with Coinbase reporting OCF of $696.5 million, or 57.8% of revenue. OCF more than doubled YoY from $313.9 million, or 21.4% of revenue.

Cash was $7.72 billion, up from $7.23 billion at the end of Q2, while debt remained flat at $4.23 billion. Given its strong cash flows and strong cash position, Coinbase’s management authorized a $1 billion share buyback in October.

Earnings Call:

More on Consumer Transaction Volume Decline:

When asked if the transaction volume decline was being driven by stablecoins or retail spot trading, the CFO clearly stated it was from the higher mix of stablecoins.

The CFO stated:

“We are not breaking out or quantifying specific volume. But what I'll say is that if you exclude stablecoin impact, the mix of advanced volume was slightly higher in Q3 versus Q2. And so we did not have any change in market share, as I mentioned earlier, was relatively steady in our fiat to crypto trading volume, which is like the core of our revenue engine in here in the U.S. And so backing out stables, a little bit more on the advanced side, but the stablecoin impact was the most material contributor to that change in rate this quarter.”

Altcoin Volume:

Notably, altcoin volume declined by about 10 points in Coinbase’s overall volume, with the CFO stating this was due to lower volatility and also an increase of focus on Bitcoin and Ethereum since the ETF launches. We had looked more closely at this in the September deep dive.

Growth Markets:

The CEO highlighted the following key growth markets on the call. These growth utilities have helped to double the number of stablecoin payments and transactions volume from $10 trillion last year to over $20 trillion already this year. The market cap of USDC stablecoin has grown from $25 billion at the start of 2024 to $36 billion today, for growth of 45% YTD.

  • Stablecoins, which are useful for period of high inflation. Stablecoins are also useful for moving money quickly and for cheap payments. USDC is the most popular stablecoin, yet EURC is a Euro backed Stablecoin that Coinbase now supports, extending stablecoins beyond the dollar to include Euros.
  • Smart wallets, which removes the need for complicated password keys. This reduces friction and fees. Users can onboard in 8 minutes compared to 2.5 hours in the past for traditional wallets.
  • Base Layer 2, which is scaling quickly and enabling 1 cent, 1 second transactions. We covered this in depth here. Base is now the #1 Layer 2 solution. It was stated that “The transactions increased 55% on Base quarter-over-quarter. It's a pretty incredible pace of growth right now.”

Legislation:

Coinbase is on the precipice of having more support in Washington. There are over 350 politicians with pro-crypto stances, causing Coinbase’s management to expect “the most pro-crypto congress ever” following the election. I’m making a note here to revisit this for our Members after the election and into 2025.

Conclusion:

For investors paying attention, Coinbase has many promising segments. However, its financials are lumpy and not for the faint of heart – but, neither is crypto. On the fundamentals side, COIN has staggering cash levels and an adjusted EBITDA margin that is quite strong. The revenue will track crypto prices, and thus, one has to consider that earnings reports lag real-time crypto asset prices and volatility.

Our strategy for this position is to use technicals. If you are interested in this stock, consider joining Knox on his webinar October 31st where he will discuss the upside setup we hope materializes, and the risk management we have in place if it does not. Also, keep an eye out for the free newsletter with an updated trade setup on Bitcoin hitting inboxes on Friday, to which Coinbase is closely correlated.

Recommended Reading:
Real Vision Video Interview: Will Nvidia Continue to Dominate AI?

I/O Fund CEO and Lead Tech Analyst Beth Kindig joins Ash Bennington, Senior Host & Crypto Editor of Real Vision, to discuss the explosive growth and future potential of Nvidia, the latest semiconductor developments, and much more. Beth explains why she remains bullish on Nvidia but is not a buyer now, how her $10 trillion market cap prediction is progressing, and how Nvidia’s CUDA platform has created an “unbreachable” moat.

Nvidia’s product roadmap is very strong, and companies focussing on custom silicon chips are having a hard time keeping up, especially with the introduction of the new Blackwell systems. The company has created an additional layer of moat with the move to release AI chips to a yearly cadence, so it’s even impossible for the Big Tech companies to catch up with Nvidia right now.

We are not buying Nvidia right now because SMH is not supporting its all-time high, and we would like to see that resolved before we resume buying Nvidia. The PC rebound is also slower than expected, so SMH has not been able to keep up with the three AI stocks, namely Nvidia, TSMC, and Broadcom.

Watch the full interview below:

https://www.realvision.com/1mjgit8yu3e

Timestamps:

00:05 Introduction

02:30 Cuda moat

06:14 Product roadmap

12:00 Perplexity AI

13:26 Nvidia valuation

17:15 SMH

21:20 AI Impact

24:10 Crypto

Coinbase Q3 24: Strong Cash and Adjusted EBITDA; Technicals Matter

Coinbase missed on the top and bottom line, with revenue of $1.205 billion missing estimates by 3.2% and adjusted EPS of $0.28 missing estimates of $0.42. Adjusted EBITDA was 37.1% or $449 million and is the bottom line number Coinbase tracks most closely to due to unrealized losses from owning crypto assets. The company has $8.2 billion on the balance sheet in cash and cash equivalents.

This quarter marked a QoQ decline in revenue of (16.9%) and a decline of (27%) QoQ in transaction revenue. Looking forward, October transaction revenue numbers were in line with Q3 at $190 million, or $570 million if we assume a similar trend continues. Q3’s transaction revenues were $572.5 million.

Broadly speaking, the crypto market was softer in Q3 than in Q2. Total crypto market capitalization flat QoQ while the average crypto market capitalization decreased 10% QoQ. Crypto asset volatility, a key driver of trading volume, was down 5% QoQ and the total trading volume for the United States spot market declined 18% QoQ. Trading volume for the US spot market is where the majority of Coinbase’s revenue is derived.

Our firm is working with Wealth Umbrella to put out a note on Bitcoin this week for the free newsletter with an outlined trading plan. It’s a must-read. There is also a similar trading plan for Coinbase, which if confirmed, the charts indicate would move in lock-step with the leading crypto asset. Knox will review this trading plan in the Oct 31st webinar. This stock has a leading allocation in our portfolio, and thus, we are watching the technicals closely as Coinbase is largely dependent on volatility and asset prices, and is not tied as much to the results of an earnings report. Should Bitcoin not extend, there is risk management plan for that, as well.

Revenue

Coinbase reported revenue of $1.21 billion in Q3, for YoY growth of 78.9% and a QoQ decline of (16.9%), driven lower by a (27%) QoQ decline in transaction revenue. This marked a deceleration from the 104.8% YoY growth rate recorded in Q2, and also fell shy of the consensus estimate for $1.25 billion in revenue.

Coinbase said that “average crypto market capitalization decreased 10% Q/Q over the same period,” with lower average crypto prices, while “crypto asset volatility — a key driver of trading volume — declined approximately 5% when comparing the Q3 average with the Q2 average.” This drove an (18%) QoQ decline in both US spot trading volumes and Coinbase’s internal trading volumes in Q3.

Despite the more challenging market conditions for revenue generation and QoQ growth, Coinbase noted that it is working to drive revenue through diversification, including stable coins, derivatives, international expansion and custody solutions.

Moving forward, Coinbase’s quarterly revenue growth rates are expected to continue decelerating, with Q1 seeing a YoY decline of nearly (16%) as Coinbase begins to lap difficult comps. As stated in our deep dive last month, it’s nearly impossible to predict crypto prices and volatility this far in advance. Thus, Coinbase typically sees heavy revision activity on a 3M and 6M basis:

The bottom line is even more unpredictable:

Key Segments

As previously mentioned, Coinbase’s trading volume was $185 billion in Q3, down (18%) QoQ but up 143% YoY on low comps from when Bitcoin and crypto traded at depressed prices in 2023.

Consumer trading volume moderated slightly in the quarter, coming in at $34 billion, down from $37 billion in Q2. Transaction revenue in Q3 was $572.5M, up 98.4% YoY and down (26.7%) QoQ.

What’s notable here is that despite a single digit decline in consumer trading volume on a QoQ basis, from $37 billion to $34 billion, consumer transaction revenue declined (27%) QoQ to $483 million. Coinbase gave three reasons for the outsized sequential decline in transaction revenues versus trading volumes:

  • Share of US fiat-crypto trading volume, which drives a majority of consumer transaction revenue, was “largely steady Q/Q.”
  • Stablecoin pair trading volume increased significantly QoQ, which carries little to no fees. Tether was 15% of trading volume.
  • Non-trading revenues decreased, including “decentralized trading through Coinbase Wallet and miner fees.”

The CFO further explained in the Q&A: “First is mix shift where we saw more stable pair trading. Second is we did not see as much revenue in Q3 from the nontrading transaction types. And so as those 2 drivers that led to change in the blended average fee quarter-over-quarter, but no underlying changes to the fees per product, mix and the nontrading revenue changes.”

However, institutional trading volume slipped further, falling to $151 billion, down (20%) QoQ and more than (41%) lower than Q1’s $256 billion. Institutional transaction revenue declined (13%) QoQ to $55 million, largely due to the decline in institutional trading volume.

Base revenue, reported in Other transaction revenue, was $34 million, down 35% QoQ due to lower Base fees – these lower fees drove a sharp uptick in Base transactions, which rose 55% QoQ. Coinbase expects adoption of Base to increase with lower fees.

Coinbase added that October transaction revenue was ~$190 million, which is in line with Q3’s monthly average; however, management cautioned against extrapolating this across the quarter as asset prices and volatility could rapidly change.

Subscription and Services Revenue

Coinbase’s subscription and services revenue came in at $556 million, on the lower end of its guided $530 – $600 million range, for YoY growth of 66.3% and a QoQ decline of (7%). Native units in staking and custody grew QoQ offsetting lower average crypto asset prices.

Management highlighted that this segment was $1.4 billion last year and is tracking $2 billion this year, for growth of 42.8%.

For Q4, Coinbase guided to a wide range of $505 – $580 million for subscription and services revenue, or 44.5% YoY growth at midpoint. This would mark a more than 20 percentage point QoQ deceleration for the segment.

Within subscription and services revenue:

  • Stablecoin revenue rose more than 43% YoY and nearly 3% QoQ to $246.9 million, driven primarily by “higher average USDC on-platform balances” and higher USDC market capitalization, offset by lower effective interest rates.
  • Blockchain rewards were $154.8 million, up nearly 108% YoY but down (16%) QoQ. Coinbase said that lower average crypto prices, primarily for Ethereum and Solana, drove the QoQ decline.
  • Interest and finance fee income was $64 million, up almost 51% YoY but down (8%) QoQ.
  • Custodial fee revenue was $31.7 million, up just over 100% YoY but down (8%) QoQ.
  • Other subscription and service revenue was $58.7 million, up 100% YoY.

Margins

Operating margin shrunk again sequentially, with Coinbase reporting a 14.1% operating margin in Q3, down from 23.7% in Q2. However, this did mark a notable improvement from an (11.8%) margin in the year ago quarter.

Net margin improved sequentially to 6.3% in Q3, up from 2.5% in Q2, as Coinbase reported $75.5 million in net income, more than doubling the $36.1 million reported in Q2. Coinbase added that net income “included $121 million in pre-tax losses on our crypto asset investment portfolio — the vast majority of which were unrealized — as crypto prices were lower” at the end of Q3 relative to Q2. The losses were $92 million after reflecting the tax impact. Due to the company having 25% of their net cash in crypto assets, the company places emphasis on adjusted EBITDA.

Regarding crypto assets, per the CFO: “The fair market value of our crypto investments was about $1.3 billion at the end of the third quarter. You can see more detail in our filings, but we hold Bitcoin in addition to Ethereum and a mix of other crypto assets.”

Stock-based compensation remained elevated in the quarter, at $248 million, or 20.6% of revenue. For Q4, Coinbase said that they “expect a modest Q/Q decline in stock-based compensation, driven primarily by roll-off of non-recurring multi-year awards.”

Earnings and Adjusted EBITDA

Despite the sequential improvement in net income, Coinbase fell short of earnings estimates, reporting $0.28 in GAAP EPS, compared to the GAAP consensus of $0.38. For Q4, Coinbase is expected to report $0.67 in GAAP EPS, a strong sequential improvement but still down nearly (36%) YoY. Adjusted EPS of $0.28 also fell short of estimates for $0.42. This is due to the $121 million in pre-tax losses on crypto assets mentioned above, and the $92 million when including the tax impact.

Adjusted EBITDA was $449 million, or a margin of 37.1%. This compares to adjusted EBITDA of $595.6 million, or 41.1% of revenue, in Q2, and $178.3 million, or 26.5% of revenue in Q3 2023. This is the company’s 7th consecutive quarter of positive adjusted EBITDA.

Cash Flow and Balance Sheet

Operating cash flow remained exceptionally strong in Q3, with Coinbase reporting OCF of $696.5 million, or 57.8% of revenue. OCF more than doubled YoY from $313.9 million, or 21.4% of revenue.

Cash was $7.72 billion, up from $7.23 billion at the end of Q2, while debt remained flat at $4.23 billion. Given its strong cash flows and strong cash position, Coinbase’s management authorized a $1 billion share buyback in October.

Earnings Call:

More on Consumer Transaction Volume Decline:

When asked if the transaction volume decline was being driven by stablecoins or retail spot trading, the CFO clearly stated it was from the higher mix of stablecoins.

The CFO stated:

“We are not breaking out or quantifying specific volume. But what I'll say is that if you exclude stablecoin impact, the mix of advanced volume was slightly higher in Q3 versus Q2. And so we did not have any change in market share, as I mentioned earlier, was relatively steady in our fiat to crypto trading volume, which is like the core of our revenue engine in here in the U.S. And so backing out stables, a little bit more on the advanced side, but the stablecoin impact was the most material contributor to that change in rate this quarter.”

Altcoin Volume:

Notably, altcoin volume declined by about 10 points in Coinbase’s overall volume, with the CFO stating this was due to lower volatility and also an increase of focus on Bitcoin and Ethereum since the ETF launches. We had looked more closely at this in the September deep dive.

Growth Markets:

The CEO highlighted the following key growth markets on the call. These growth utilities have helped to double the number of stablecoin payments and transactions volume from $10 trillion last year to over $20 trillion already this year. The market cap of USDC stablecoin has grown from $25 billion at the start of 2024 to $36 billion today, for growth of 45% YTD.

  • Stablecoins, which are useful for period of high inflation. Stablecoins are also useful for moving money quickly and for cheap payments. USDC is the most popular stablecoin, yet EURC is a Euro backed Stablecoin that Coinbase now supports, extending stablecoins beyond the dollar to include Euros.
  • Smart wallets, which removes the need for complicated password keys. This reduces friction and fees. Users can onboard in 8 minutes compared to 2.5 hours in the past for traditional wallets.
  • Base Layer 2, which is scaling quickly and enabling 1 cent, 1 second transactions. We covered this in depth here. Base is now the #1 Layer 2 solution. It was stated that “The transactions increased 55% on Base quarter-over-quarter. It's a pretty incredible pace of growth right now.”

Legislation:

Coinbase is on the precipice of having more support in Washington. There are over 350 politicians with pro-crypto stances, causing Coinbase’s management to expect “the most pro-crypto congress ever” following the election. I’m making a note here to revisit this for our Members after the election and into 2025.

Conclusion:

For investors paying attention, Coinbase has many promising segments. However, its financials are lumpy and not for the faint of heart – but, neither is crypto. On the fundamentals side, COIN has staggering cash levels and an adjusted EBITDA margin that is quite strong. The revenue will track crypto prices, and thus, one has to consider that earnings reports lag real-time crypto asset prices and volatility.

Our strategy for this position is to use technicals. If you are interested in this stock, consider joining Knox on his webinar October 31st where he will discuss the upside setup we hope materializes, and the risk management we have in place if it does not. Also, keep an eye out for the free newsletter with an updated trade setup on Bitcoin hitting inboxes on Friday, to which Coinbase is closely correlated.

Please note: The I/O Fund conducts research and draws conclusions for the Fund’s positions. We then share that information with our readers. This is not a guarantee of a stock’s performance. Please consult your personal financial advisor before buying any stock in the companies mentioned in this analysis.

Recommended Reading:
AMD Q3 2024: GPU Revenue at 22%, and AI PCs have a Leader

AMD beat estimates by $110 million on the top line and was in line on adjusted EPS expectations of $0.92. Despite the beat in Q3, AMD guided for Q4 revenue slightly below consensus estimates at midpoint.

AMD is a fundamentally strong company with data center revenue growth accelerating for many quarters now, client revenue rebounded sequentially, and margins are improving. As Jean Hsu stated toward the end of the Q&A: “But when you look at our Data Center segment performance, we more than doubled the revenue year-over-year, but we tripled the operating income year-over-year.”

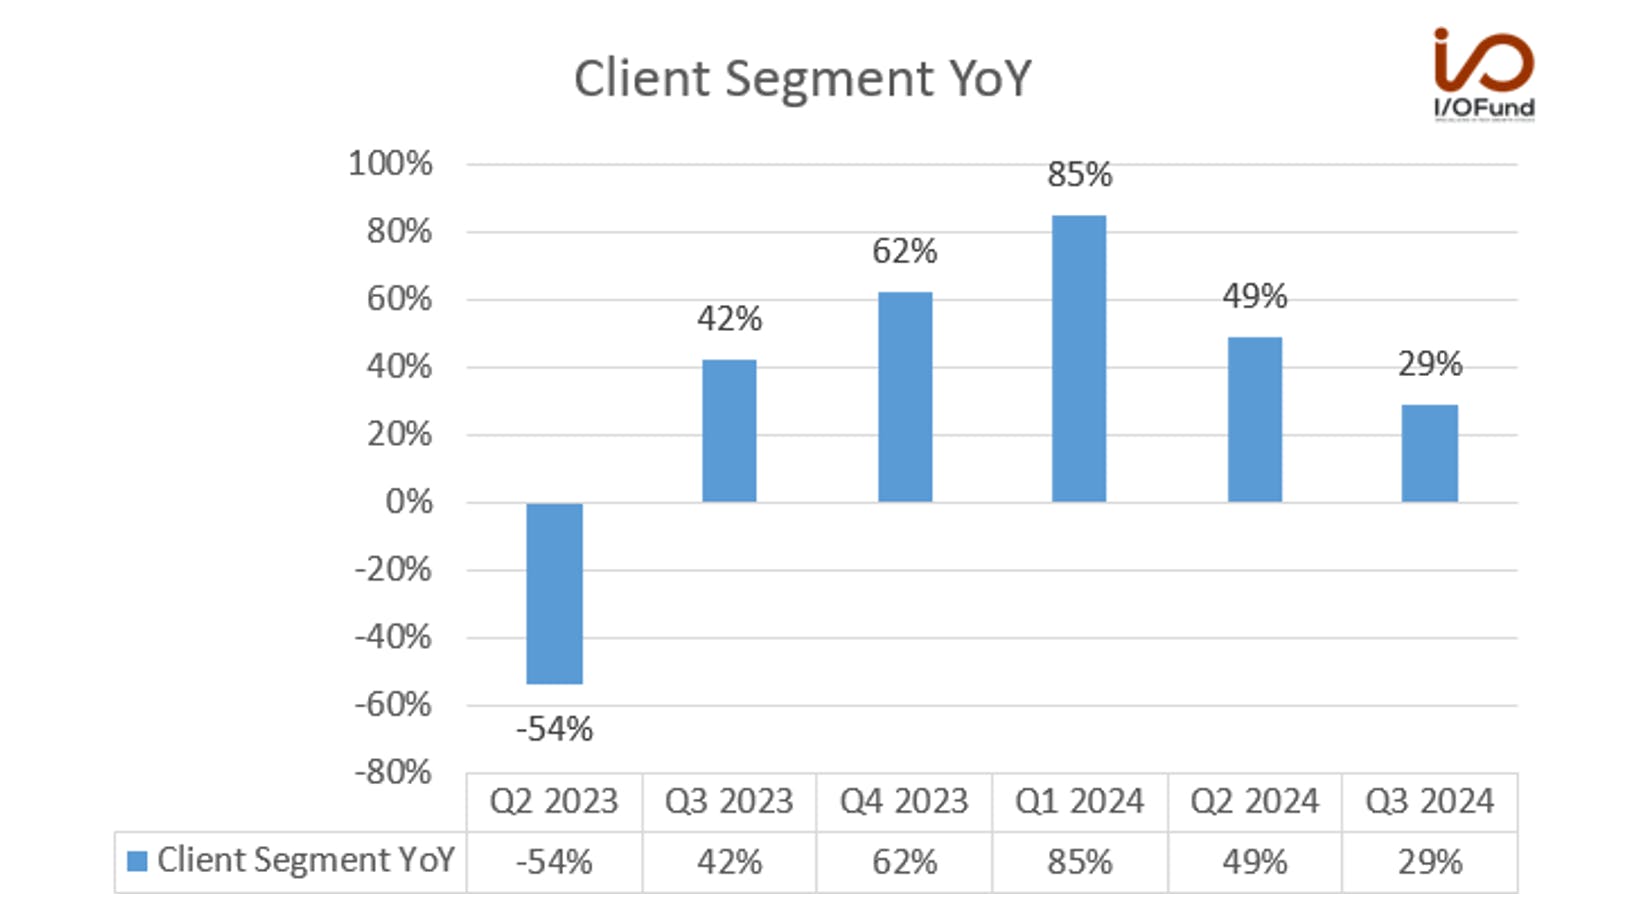
Regarding the Client segment, AMD and analysts acknowledged there may be consumer weakness in PCs from other companies, yet AMD stated they have the strongest PC line up in company history on the market today. This is evident considering Intel guided Q3 to be flat to down in their Client segment yet AMD’s growth was up 29% YoY and 26% QoQ to $1.88 billion.

The slight miss at the midpoint is likely due to Embedded, as Jean Hu, the CFO, stated next quarter would be: “driven by strong growth in our Data Center and Client segment, more than offset decline in the Gaming and Embedded segments.” It was further stated that embedded “demand continues recovering gradually, led by strength in test and emulation offset by ongoing softness in the industrial market.”

Revenue

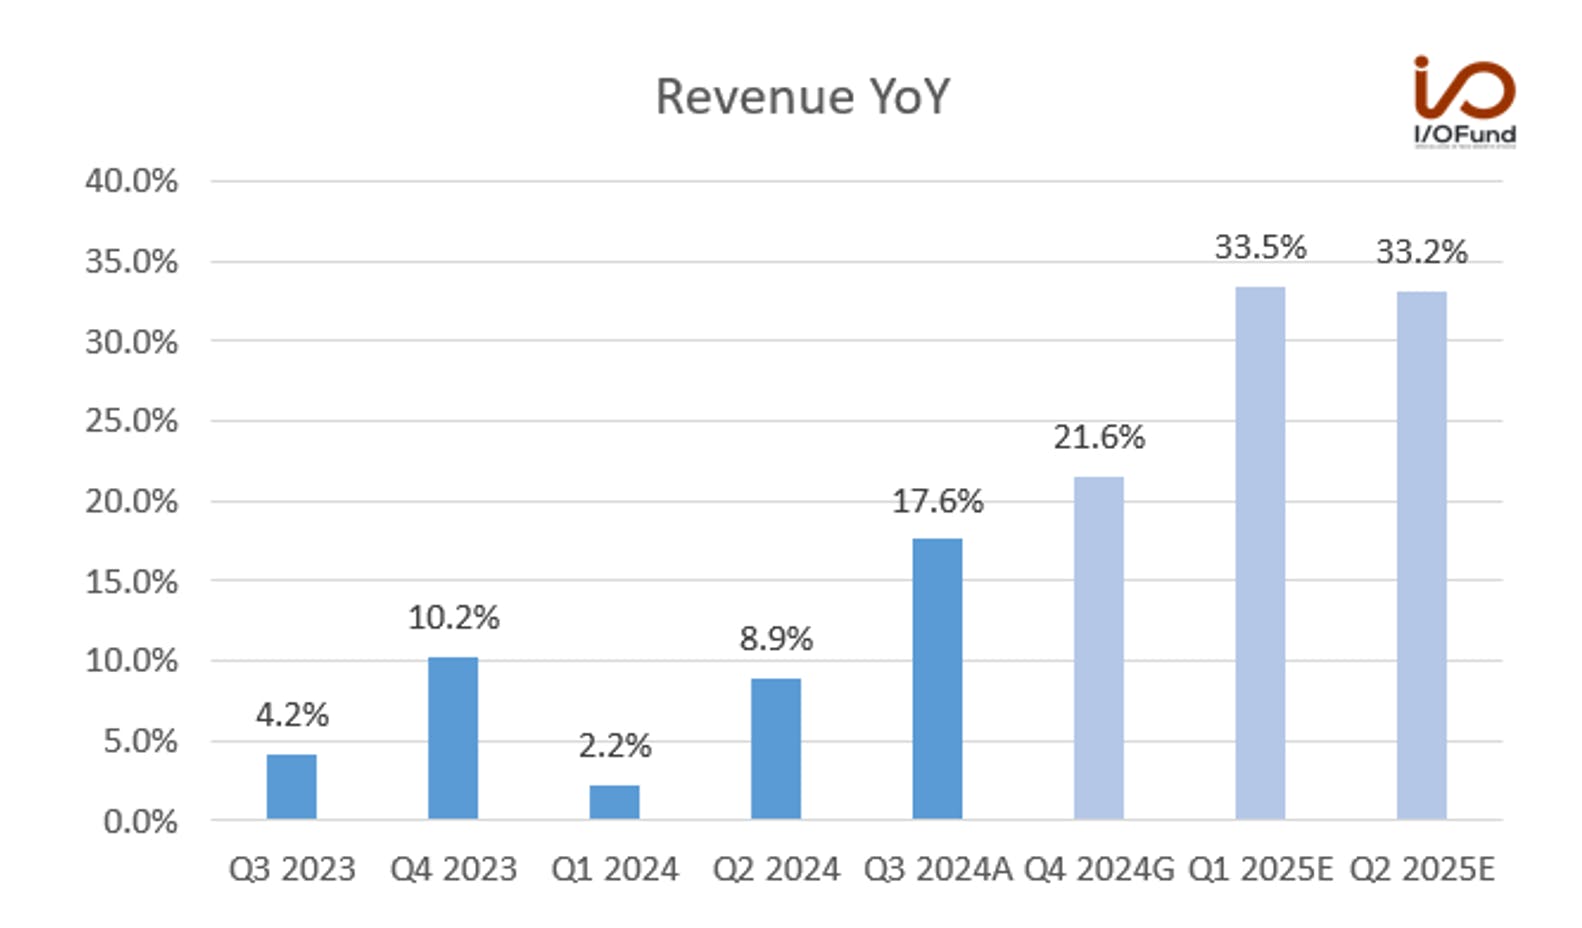
AMD reported revenue of $6.82 billion in the third quarter, for YoY growth of 17.6%, a ~770 bp sequential acceleration from 8.9% YoY growth in the prior quarter. Data center drove Q3’s growth, while Client revenue rebounded significantly, offsetting continued weakness in gaming and embedded.

CEO Lisa Su said that AMD delivered “record revenue led by higher sales of EPYC and Instinct data center products and robust demand for our Ryzen PC processors,” with “significant growth opportunities across our data center, client and embedded” moving forward.

Looking ahead, AMD guided for revenue of $7.5 billion, +/- $300 million, for Q4, correlating to YoY growth of ~21.6% at midpoint, or a 400 bp sequential acceleration. While this fell just shy of the consensus estimate for 22.3% YoY growth to $7.55 billion, revenue growth is still expected to accelerate to the low-30% range in the first half of fiscal 2025.

Margins

As noted in our pre-earnings report, AMD’s margins continue to benefit from the increasing mix of data center products, primarily from EPYC CPUs as GPUs are currently dilutive to margins but will eventually be accretive to margins over time.

  • Q3 gross margin was 50%, up from 49% last quarter and 47% in the year ago quarter. Adjusted gross margin was 54%, slightly ahead of the 53.5% guide, and increasing from 53% last quarter and 51% in the year ago quarter.
  • For Q4, management guided for adjusted gross margin of 54%, flat sequentially.
  • Q3 operating margin expanded to the double-digit range, at 11%, driven by increased data center mix – this compares to a 5% operating margin last quarter and a 4% margin in the year ago quarter.
  • Operating income surged sequentially, with Q3’s operating income of $724 million up ~169% QoQ from $269 million. This was driven primarily by data center growth and margin expansion (covered below in Segments).
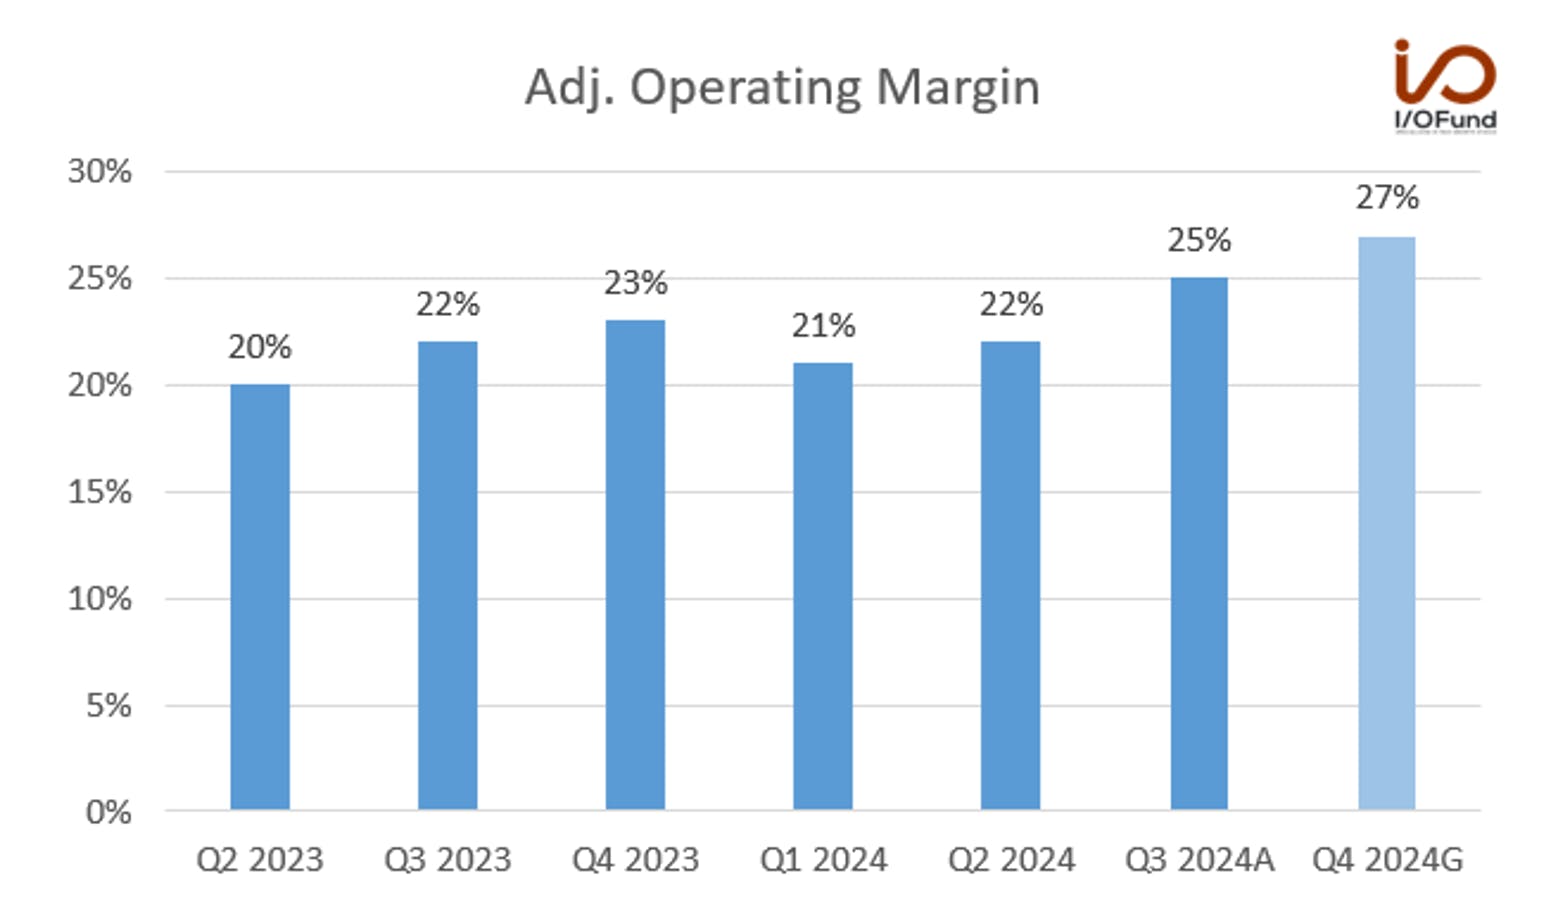
  • Adjusted operating margin came in at 25%, in line with expectations, while management’s guidance implies Q4’s adjusted operating margin rises to nearly 27%.
  • Q3 net income was $771 million, an increase of 191% QoQ and 158% YoY. Net margin was 11% in the quarter, up from 5% last quarter and last year. Adjusted net income was $1.50 billion, up 34% QoQ and 33% YoY, for a 22% margin.

EPS

GAAP EPS significantly improved in the quarter due to margin substantially improving, with operating and net margin both in the double digit range in the quarter.

  • GAAP EPS of $0.47 beat estimates for $0.41, and represented YoY growth of 161% and QoQ growth of 194%.
  • Adjusted EPS of $0.92 met estimates, and represented YoY growth of 31% and QoQ growth of 33%.

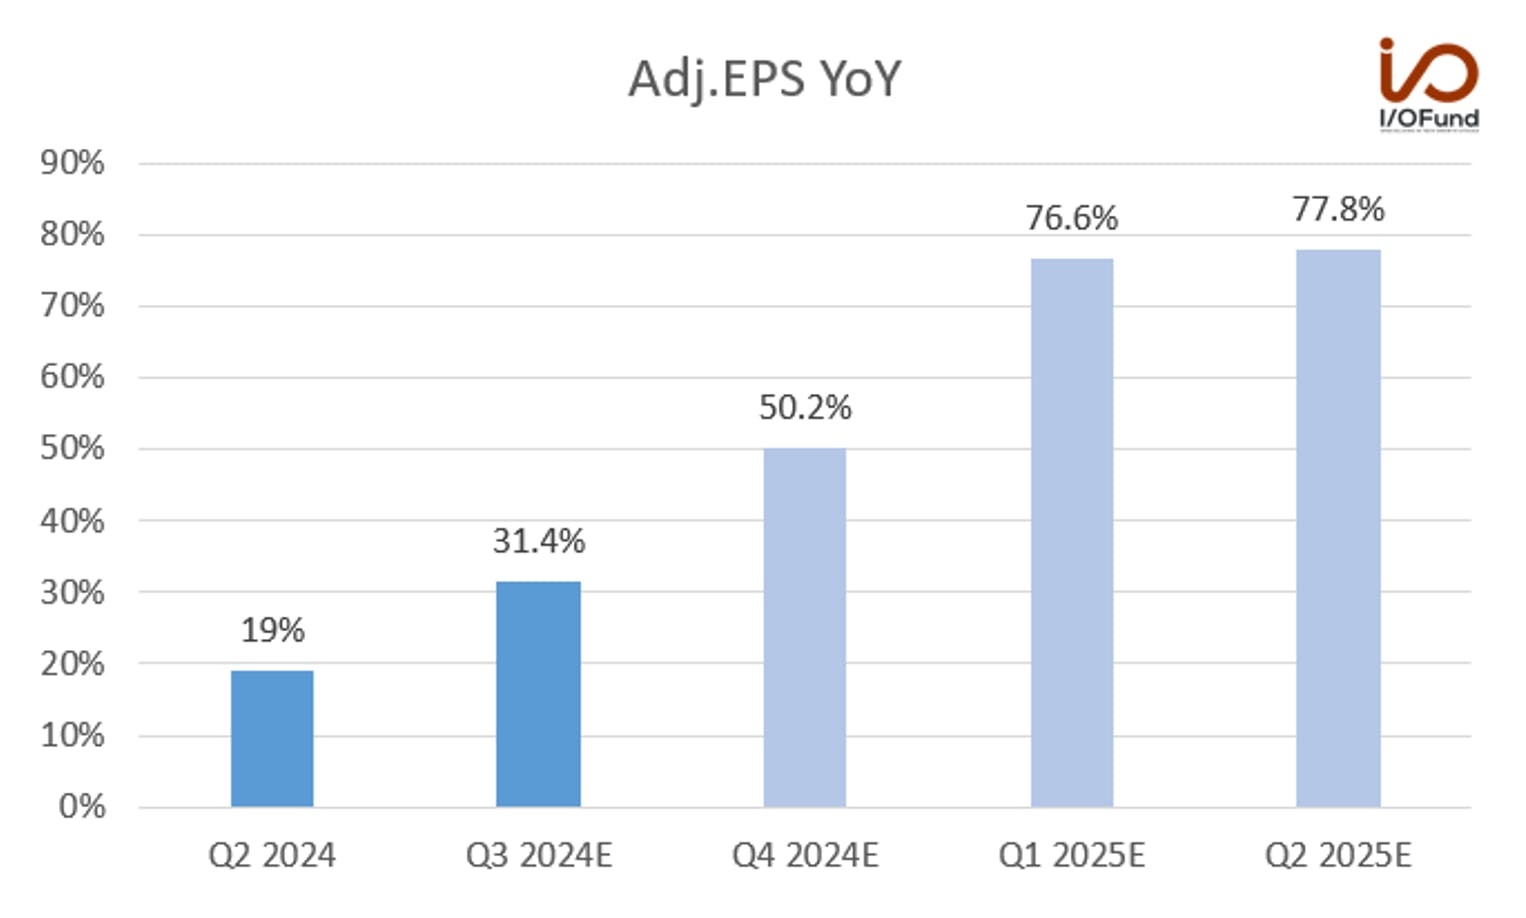
Given the revenue acceleration through Q4 and the first half of 2025 along with improved operating leverage from increased data center mix driving higher operating margins, adjusted EPS growth is expected to accelerate more than 40 percentage points to the mid- to high-70% range by Q2 2025.

Cash and Balance Sheet

Cash flows still have room to improve, as margins contracted in Q3, with AMD reporting operating and free cash flow margins falling by 100 bp QoQ. However, other line items, particularly accounts receivable and inventories, surged sequentially, hinting at potential strong growth ahead.

  • Operating cash flow was $628 million in Q3, or a 9% margin. This compares to a 10% margin in both Q1 and Q2.
  • Free cash flow was $496 million, or a 7% margin, versus an 8% margin in Q2.
  • Cash and equivalents totaled $4.54 billion, while debt totaled $1.72 billion.
  • Inventories totaled $5.37 billion, rising nearly 8% QoQ as AMD continues to ramp data center GPUs and move towards an annual release cadence.
  • Accounts receivable surged 26% QoQ to $7.24 billion, after hovering in the $5 billion range for the last four quarters.

Segments

Data Center

AMD’s data center segment once again drove growth in the quarter, with management boosting FY24’s AI revenue target once more, now seeing AI revenue exceeding $5 billion, versus a prior view for $4.5 billion-plus in AI revenue. Management stated AI revenue is at $1.5 billion per quarter, or 22% of revenue.

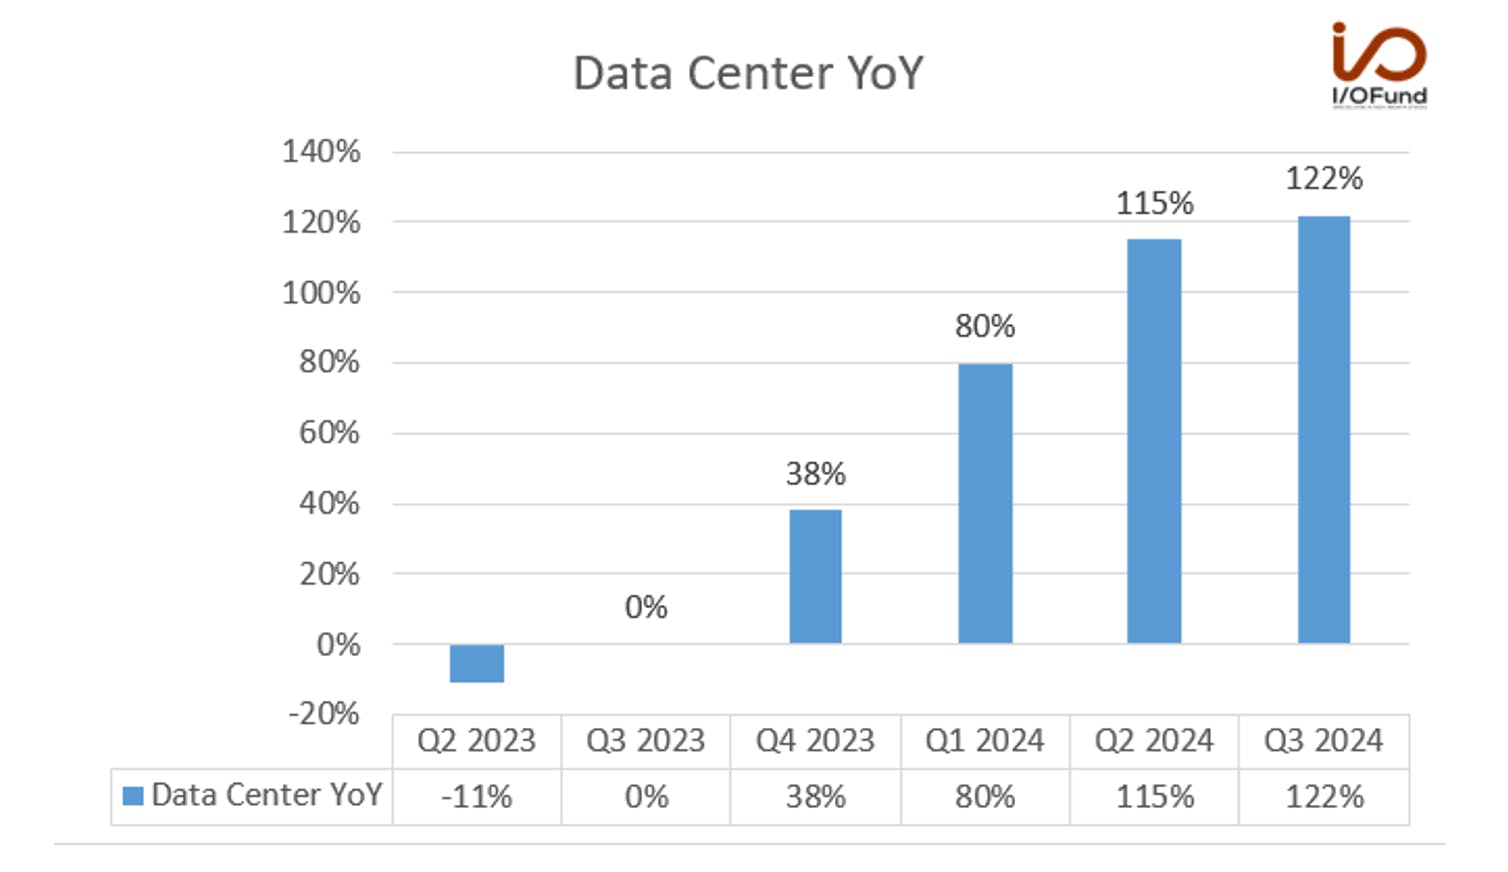
Data center revenue accelerated 7 percentage points to 122% YoY, with AMD reporting $3.55 billion in revenue in the segment. QoQ growth was 25%, accelerating from 21% QoQ in Q2. AMD once again witnessed strong demand for AMD Instinct GPUs and EPYC server CPUs.

Data center’s operating margin continues to expand, with segment operating income rising 240% YoY and 40% QoQ to $1.04 billion. This was an operating margin of 29%, expanding from 26% last quarter and 19% in the year ago quarter.

Zen 5 Turin launched this month and will help support data center sales next year. Regarding the AMD versus Intel battle, Lisa Su made it clear that AMD continues to take market share: “We believe we gained server CPU share in the quarter as enterprise wins accelerated. Cloud providers expanded their use of EPYC CPUs across their infrastructure, and we began the initial ramp of fifth-gen EPYC processors” and that “Meta alone has deployed more than 1.5 million EPYC CPUs across their global data center fleet to power their social media platforms.”

The MI325X launched earlier this month with increased memory capacity and bandwidth, with AMD stating it offers 20% higher inferencing than the H200. The MI325X is in production shipment this quarter and “interest for MI325X is high.” The MI350 will launch in H2 2025 and the MI400s with CDNA Next architecture will launch in 2026. We had stated in our pre-earnings writeup that CDNA 4 and also CDNA Next architecture should be a defining moment for AMD in terms of narrowing the product road map with Nvidia.

Regarding the MI300 AI accelerators, Meta and Microsoft are large customers due to TCO advantages (total cost of ownership). Management also offered statements around RocM’s progress, stating that foundational support is growing and performance gains are improving by 2.4X.

Client Segment:

Though there were some weaker data points around PCs, as stated in the pre-earnings writeup, AMD is less of a concern in that regard as the company’s lineup is loaded with stellar releases. The company recently released the Zen 5 architecture including the Ryzen AI 300 laptops with a neural processing unit (NPU) with 50 TOPS of AI performance, and the Ryzen 9000 series for desktops – making them the most powerful units on the market today. Lisa Su stated it “this is the strongest PC portfolio we’ve had in our history.”

AMD’s ‘Zen 5’ Ryzen processors were met with “strong demand,” driving Client revenue up 29% YoY and 26% QoQ to $1.88 billion.

Although it looks like quite a sharp deceleration over the past two quarters, Client revenue has reached the highest level since Q2 2022. Client operating income also increased, up 97% YoY and 210% QoQ to $276 million; this represents an operating margin of 15%, up from 6% last quarter and 10% in the year ago quarter.

Management stated that AMD has “very high” share in the desktop channel, and that AMD “saw some of our highest sell-through.”

Gaming

AMD has still not escaped the trough in gaming, with revenue declining (69%) YoY and (29%) QoQ to $427 million. AMD said that the weakness was due to a decline in semi-custom revenue. Operating income for the segment also dropped substantially, falling to just $12 million, or a 3% margin, compared to a 12% margin last quarter and a 14% margin last year.

Embedded

Embedded revenue has begun to recover, following management’s comments last quarter about order patterns improving. Revenue in the segment rebounded 8% QoQ but declined (25%) YoY to $927 million. Operating margin for the segment was 40%, flat QoQ and down from 49% last year.

Earnings Call:

AI Revenue:

There was a question on the call about how large AI revenue is on a quarterly basis, to which Lisa Su provided more information, stating it exceeds $1.5 billion. The comment that the GPU business is approaching the scale of the CPU business will be key for investors to put into perspective, as it’s a big statement as we move into 2025.

Timothy Arcuri   

I had a quick 1 and then a more intensive question. So the first one is I wanted to ask about the September actuals for Data Center GPU. It seems like it was in the $1.5 billion range. And that would put December in kind of the $2 billion range. Is that about right?

Lisa Su   

So it's a pretty granular question, Timothy. But maybe let me help you with this. We actually did better in the Data Center GPU business relative to our initial expectations. So you would imagine that the business was actually greater than $1.5 billion. I mean we're actually seeing now our GPU business really approaching the scale of our CPU business.

-End Quote

There was an analyst on the call attempting to clarify if AI revenue would be flat QoQ.

Stacy Rasgon:

[…] You said it was approaching the size of Your compute business which you put around what under $1.7 billion, maybe a little more. Is that right? And like if that is right, it implies that at $5 billion for the year, you'd actually be down in Q4. So I'd probably got to be $5.2 billion or $5.3 billion for the full year, just to be flat sequentially and more than that to get growth […]

Lisa Su:

Right, Stacy. So first, a couple of things. You have to remember that in our Data Center segment, we have some other revenue that is not CPUs and GPUs, right? We have some FPGAs and other things. But the question earlier was the revenue of $1.5 billion, and I said that it was greater than $1.5 billion. So take that as a fundamental. And then as — we talked about — we didn't guide an exact number for the data center GPU. We said exceed $5 billion.

-End Quote

Lisa Su also stated: “What I would say about 2025 is we feel very good about the growth opportunities I would say that it might be lumpy. In general, these are large customer acquisitions and it's not always predictable exactly which quarters you would expect the significant build out.”

My comment: Lumpy to the upside … sounds bullish for next year.

Here was another time that Lisa Su clarified that the lumpiness would be to the upside: “So these are large customers that drive deployments. Like for example, the third quarter was a bit higher than we expected. That was driven by some additional customer demand, and we may see that type of lumpiness.”

There was a pointed question about how AMD plans to catch up to Nvidia’s product road map, to which it was stated: “I think MI300, when we launched it was behind H100, H100 was in the market for a much longer time. And we have with our accelerated road map actually closed a good part of that gap. I think MI325 is a great product. It's going to compete very well with H200 and the MI350 series will compete very well with Blackwell.”

It was also insinuated that Blackwell’s AI systems, which are more complex, could be a tailwind for AMD. “In the overarching view of the world, frankly, the market continues to be constrained, particularly in the newer product generations. It takes a long time to go from, let's call it, shipping your first samples to actually ramping in volume production workloads. And I think one of the advantages that we have with the — with our portfolio is that from a data center retrofit standpoint, it's actually a much easier ramp, just the infrastructure is the same.”

If we read between the lines, Lisa Su is stating that AMD is positioned to answer the overflowing demand from Blackwell, and in a way the supply chain can handle, as it’s well-known that Blackwell is running into wafer capacity limits compounded by a larger die size.

Lisa Su also echoed my understanding of roughly when AMD should narrow the product road map with Nvidia: “We feel very good about the progress I think next year is going to be about expanding both customer set as well as workload. And as we get into the MI400 series, we think it's an exceptional product. So — all in all, the ramp is going well, and we will continue to earn and — earn the trust and the partnership of these large customers.” The MI400 is on the new CDNA architecture and is ramping in 2026.

Margins:

As stated in the pre-earnings writeup, margins are an area where AMD and Nvidia offer quite a contrast. AMD’s data center margin is 29% with a company operating margin of 11% compared to Nvidia’s 60%.  The guide is for flat margins next quarter. The CFO was encouraging in terms of what to expect for 2025: “When we scale the company next year, you can see we're going to benefit from economies of scale to continue to drive our operational efficiency to improve gross margin.”

Conclusion:

As we get more earnings reports this quarter, it should become evident that AMD’s Client growth is unusually strong and is truthfully a defining moment. Remember, we had pulled PC data that showed flat to negative PC growth YoY for Q3 industry wide. In the pre-earnings report, I had stated AMD is incrementally stronger and could go unscathed, but this is quite the growth in a quarter where unit sales were flat to declining industry wide. We will not lose sight of this incremental strength as we plan for 2025.

Regarding AMD’s GPU story … slowly but surely, AMD will show the market it should take the company seriously. These things take time. It was our understanding going into this report that the 2025 MI350s and 2026 MI400s is when the product release cycle will start to narrow with Nvidia, and this was echoed on the call.

On the AH price action, we had pointed out on the Q4 webinar that SMH was looking unusually weak. Whether it’s due to potential tariffs or potential consumer-facing weakness in the semiconductor industry, or a combination of both, I’m not sure. But the point is that I do not believe AMD is selling off for reasons that are specific to the stock. The earnings report was strong, and we will look to keep this as a leading position for next year.

Recommended Reading:

Tesla Stock: Margins Bounce Back For AI-Leader

This article was originally published on Forbes on Updated Oct 24, 2024, 09:01pm EDTForbesForbes on Updated Oct 24, 2024, 09:01pm EDT

Tesla is arguably one of the most advanced AI companies in the world, yet its stock is dictated by margins. Over the past three years, Tesla’s average gross profit per vehicle has declined by 60%, falling from more than $14,400 in Q3 2021 to less than $6,000 in Q2 2024, highlighting the difficulty Tesla has faced in a high-interest rate environment.

Higher interest rates have forced Tesla to place more emphasis on affordability, either via price cuts or promotional financing rates, pushing average selling prices lower and thus impacting margins. Q3’s report showed that margins may have bottomed, despite weakness in vehicle selling prices due to that focus on affordability.

Perhaps the long-term story is recurring software revenue from robotaxis and humanoid robotics, however, margins are driving the stock price for now.

Below, I look at the puts and takes of an AI front runner that is battling economic headwinds.

Deliveries Recover, But Revenue Doesn’t

Q3 saw Tesla report sequential growth for both production and deliveries after a weak Q1, where deliveries dropped below 400,000 for the first time since late 2022. Tesla reported deliveries of 462,890 EVs in the third quarter, a 6.4% increase from last year and a 4.3% increase from the second quarter.

Tesla Quarterly Production, Deliveries

Tesla reported deliveries of 462,890 EVs in the third quarter, a 6.4% increase from last year and a 4.3% increase from the second quarter.

Source: Tech Insider Network

For the third quarter, Tesla reported automotive revenue of $18.83 billion, up just 1.3% YoY and 1.6% QoQ, and short of the consensus estimate for $19.50 billion. As a result, Tesla’s overall revenue fell short of estimates, with Tesla reporting $25.18 billion in revenue, nearly half a billion below the consensus for $25.67 billion.

A quick look at the growth rates shows that automotive revenue growth lagged delivery growth by just over 5 percentage points, at 1.3% versus 6.4%. This tells investors that automotive selling prices declined once again, and to a large degree – Q3’s ASP fell below $42,000, down ~(1.7%) from Q2 and falling (5.6%) from nearly $44,500 last year.

Notably, there is risk the ASPs fall lower in Q4 as Tesla continues to cut some prices, with the Cybertruck seeing up to 20% cuts on different model variants in October. Musk mentioned that Tesla would be aiming for YoY growth, and with just Q4 left, that means Tesla would have to deliver more than 515,000 vehicles, a record high. This would also imply an acceleration to 11% QoQ growth, leaving the door open for more aggressive price cuts to spur demand, something management hinted at in the earnings call.

Tesla is aiming high for 2025, with Musk stating that the automaker is shooting for “20% to 30% vehicle growth next year,” or roughly at least 2.1 million vehicles assuming Tesla ends 2024 at around 1.75 million. Taneja added that Tesla’s “focus remains on growing unit volume, while avoiding a build-up of inventory. To support this strategy, we're continuing to offer extremely compelling vehicle financing options in every market.”

The Fed has forced Tesla to focus on financing and affordability, which in turn, has been a major driver of margin issues. I noted in July 2023 that the “comment on interest rates is the most important comment from the call as high interest rates mean Tesla must lower prices,” and that Tesla was “one of many tech stocks whose revenue growth and profitability is on borrowed time until the Fed instills a more dovish policy.”

Sign up for I/O Fund's free newsletter with gains of up to 2600% because of Nvidia's epic run – Click hereClick hereClick here

Tesla’s Profitability Improved on Cost Optimizations

Despite ASPs declining again sequentially, profitability improved and automotive margins recovered as Tesla captured some tailwinds from “lower raw material costs, freight and duties” and drove vehicle production costs to a record low.

Tesla headed into Q3’s report facing a tough test, as average selling prices were flat and vehicle production costs were rising. From Q4 2023 to Q2 2024, ASPs were relatively unchanged while production costs rose 3.7%, denting both automotive margins and impacting profitability. This had been hindering Tesla’s ability to revitalize automotive gross margins — as a result of those two changes, automotive gross margins took quite a large hit, falling from 17.2% to 14.6% in that two-quarter span.

Automotive Gross Margin

Q3 saw a sharp improvement in automotive gross margin, expanding ~240 bp QoQ and ~72 bp YoY, as Tesla drove production costs to a record low of ~$35,106.

Source: I/O Fund

Q3 saw a sharp improvement in automotive gross margin, expanding ~240 bp QoQ and ~72 bp YoY, as Tesla drove production costs to a record low of ~$35,106, dropping ~(4.6%) from $36,802 just last quarter.

Because of the large improvements in production costs, average gross profit per vehicle bounced back, increasing ~16.3% QoQ to reach ~$6,886, up from $5,921 last quarter. Essentially, Tesla manufactured and sold 14,000 more vehicles this quarter for ~$220 million cheaper than last quarter.

Tesla's Average Gross Profit Per Vehicle Recovers in Q3

Average gross profit per vehicle bounced back, increasing ~16.3% QoQ to reach ~$6,886, up from $5,921 last quarter.

Source: I/O Fund

Operating margin also rebounded significantly, expanding to 10.8% in Q3, up from 6.3% in Q2 and 5.5% in Q1. This newfound operating margin growth adds more confidence in the margin recovery story, which has been paramount for investors as share price declines have correlated quite closely with operating margin contraction.

Tesla Price and Operating Margin Charts

Tesla's share price declines since late 2021 have correlated quite closely with operating margin contraction.

Source: YCharts

Energy Storage was a bright spot in Q3 as even with a sequential decline in deployments and (21%) sequential decline in revenue, gross margin expanded from 24.5% to 30.5%. This aided company-wide gross margin expansion, with Tesla reporting a 19.8% gross margin in Q3, up from 18.0% in Q2.

Every Thursday at 4:30 pm Eastern, the I/O Fund team holds a webinar for premium members to discuss how to navigate the broad market, as well as various stock entries and exits. We offer trade alerts plus an automated hedging signal. The I/O Fund team is one of the only audited portfolios available to individual investors. Learn more hereLearn more hereLearn more here

Q4 Margins Will Be “Challenging” to Sustain

Q3’s profitability is a welcome sign, yet CFO Vaibhav Taneja cautioned that “sustaining these margins in Q4, however, will be challenging given the current economic environment,” due to vehicle affordability issues.

Investors may need to get comfortable with thinner margins moving forward on the automotive side. When the stock was at all-time highs in 2021 and early 2022, Tesla was reporting more than $14,000 in gross profit per vehicle, or automotive gross margins in the high-20% range, topping 30% once. Now, average gross profit per vehicle has fallen more than (52%) to $6,886 in Q3, with automotive gross margins back to 17%, though it has remained below 20% since the start of 2023.

This decline in gross profit per vehicle stems from weaker average selling prices, which have fallen quite dramatically since the start of 2023, and continue to fall. The reason margins were able to expand in Q3 was from reducing production costs, not vehicle pricing.

Tesla's Selling Prices, Vehicle Production Costs

Tesla's average selling prices, which have fallen quite dramatically since the start of 2023, continue to fall.

Source: I/O Fund

As long as Tesla continues to cut prices, margin gains will be primarily realized on the cost side. The path to higher margins will arise when Tesla can push production costs towards $30,000 and lower, and once the pressure on ASPs have resolved.

Musk said in Q3’s call that Tesla is “still on-track to deliver more affordable models starting in the first half of 2025,” which would require similar cost reductions to preserve margins. Musk also implied thin margins may be the norm for investors, as Tesla noted that affordable model production in the first half of 2025 “will result in achieving less cost reduction than previously expected.”

Robotaxis Still Not Here, Despite Numerous Timelines

While the robotaxi opportunity is promising for Tesla, it’s yet to provide tangible AI revenue. Tesla’s robotaxi reveal event earlier in the month was met with a lackluster response, sending shares down more than (8%) the day after, as the production timeline for its ‘robotaxi’ was pushed back once more, a familiar storyline for Tesla investors over the past few years.

At the unveiling of Tesla’s pedal and wheel-free purpose-built robotaxi, dubbed the Cybercab, CEO Elon Musk said that production may begin in 2026 or as late as 2027, saying that he “tend[s] to be optimistic about timeframes.” This is another years-long delay for Tesla’s most anticipated product, where in 2022, Musk had promised to reveal the robotaxi in 2023 and start production in 2024. This follows an initial promise from 2019 to have one million Tesla vehicles equipped with Level-5 autonomy in 2020. Years later, and Tesla has still not deployed the robotaxi, which places additional emphasis on the margins.

Musk reiterated Tesla’s goal to launch production of the Cybercab in 2026, adding that Tesla is “aiming for at least 2 million units a year of Cybercab.”

Following Q1’s earnings report in April 2024, I joined Bloomberg China to discuss the most pressing items for Tesla, saying that “as AI approaches, that’s the piece that Tesla has to execute on. So what we’re seeing is a moment where it’s a little too early for AI software…. we’re not in that cycle right now, and that’s what Tesla really truly needs for its stock to resume where it was before as a Wall Street darling [in 2021]. And that AI software cycle, if I were to give you my best estimate, it would be more of a 2026 discussion.”

Conclusion

Despite a mixed Q3 earnings report featuring a revenue miss and an EPS beat, Tesla’s report exceeded expectations in the one area that mattered most – margins. Automotive gross margin rebounded due to production cost improvements, even as selling prices fell, boosting operating margins back to the double-digit range.

While the AI story is one to watch, margins have been the behind-the-scenes driver for shares, and remain the data point to track until a credible, tangible revenue stream from robotaxis arises. I/O Fund Portfolio Manager Knox Ridley wrote in August 2023 as the I/O Fund cut our Tesla position for a 60% gain that the I/O Fund was “avoiding ‘Crocodile Jaw’ situations where the stock price is going up but fundamentals are decelerating.”

By closely following Tesla’s margins and fundamentals, the I/O Fund nailed Tesla's move off of 2022's lows and exited at a top in early 2023. The I/O Fund continues to track Tesla, but recently shared research with premium members on two AI beneficiaries in a lesser-known semiconductor space with standout EPS numbers. Learn more here.

Please note: The I/O Fund conducts research and draws conclusions for the Fund’s positions. We then share that information with our readers. This is not a guarantee of a stock’s performance. Please consult your personal financial advisor before buying any stock in the companies mentioned in this analysis.

Recommended Reading:

Fabrinet: Datacom, Nvidia Driving Optical Revenue Growth
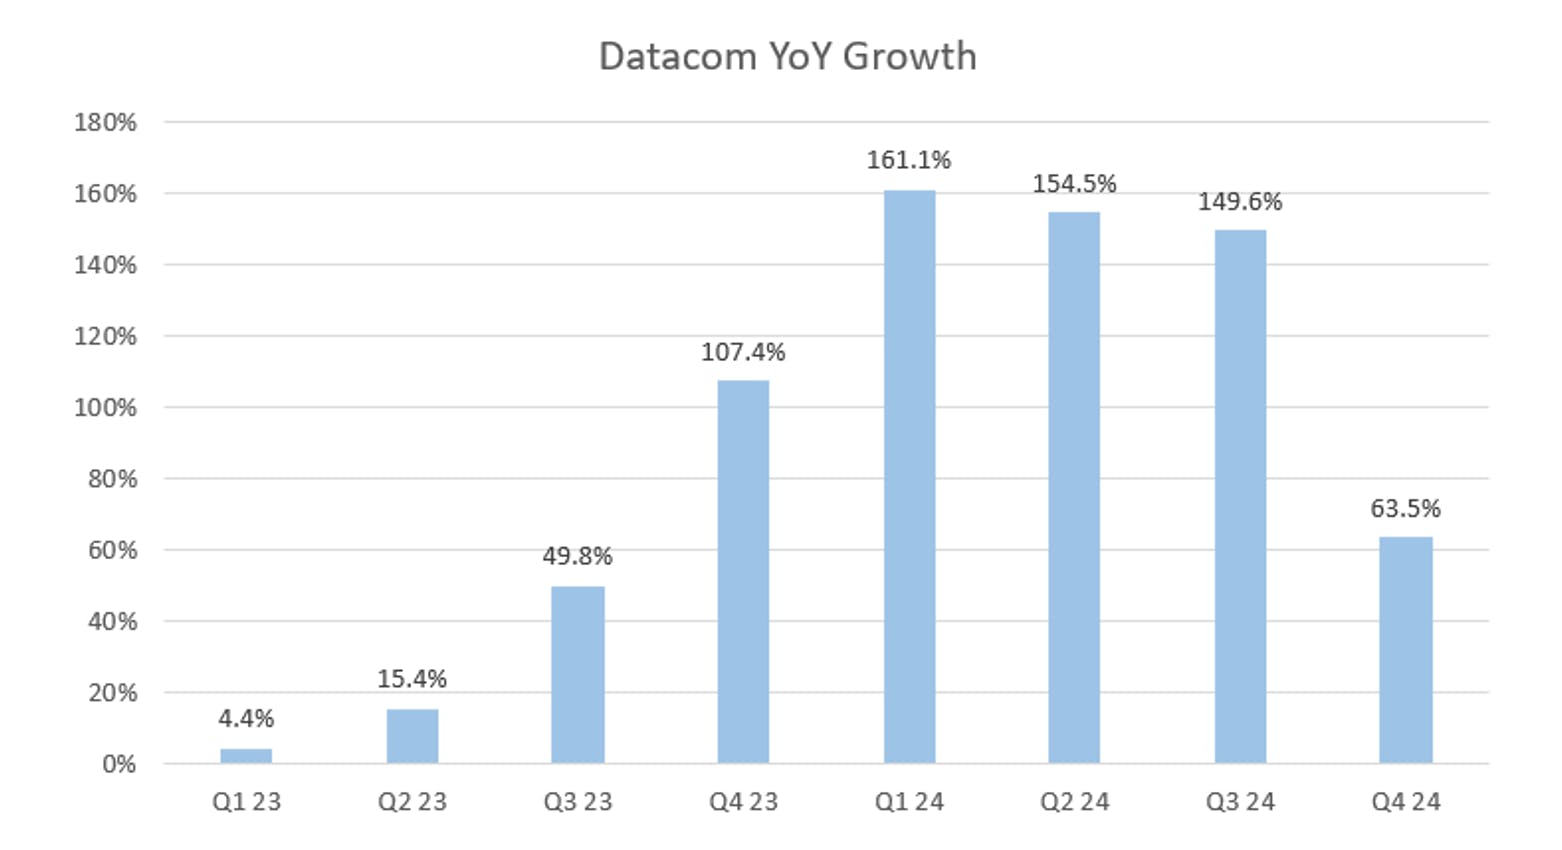
Last month, we covered the importance of optical interconnects in linking GPUs together in clusters in our thematic deep dive “Optical Interconnects Overview: Strong Growth Expected Ahead.” Optical transceivers address bandwidth, or the speed of data transfer in the data center. As hyperscalers work to expand capacity, it’s expected there will be a surge in optic connections.

Fabrinet provides advanced optical communications components for datacom and telecom end markets, customized optics and glass fabrication, and advanced laser and other electro-mechanical parts. Fabrinet has reported consecutive quarters of strong datacom growth, stemming from one of its flagship customers, Nvidia. Fundamentally, Fabrinet possesses stable margins and strong cash flow generation, as top and bottom line growth is expected to accelerate from the low-teens to the 20% range over the next few years.

Fabrinet is clearly a beneficiary of Nvidia’s surging growth in the AI GPU market, with Nvidia’s contribution nearly tripling from 12.5% to 35.1% over the past twelve months. We’ve covered how Blackwell brings an enormous revenue opportunity for Nvidia and its suppliers, and Fabrinet is expected to be a beneficiary of Nvidia’s upcoming superchip, with long-term growth opportunities for optics in the AI data center and in 800G+ data rates.

Fabrinet reports earnings on Nov 4th.

Revenue Growth Reaccelerated in 2024; 149% Q3 Datacom Growth

After a weak start to fiscal 2024 with low single digit revenue growth, Fabrinet finished its fiscal year with revenue growth reaccelerating in each quarter. Over the long-term, analysts currently estimate revenue growth to accelerate each year through fiscal 2027, as Fabrinet captures tailwinds from growth in optics.

Fabrinet reported 9% YoY growth to $2.88 billion in revenue in fiscal 2024, decelerating from 16.9% YoY growth in fiscal 2023. Much of this decline was weighted in the first half of fiscal 2024, as the broader optics industry suffered from a sharp inventory correction in the telecom industry.

Moving forward, analysts expect Fabrinet’s revenue growth to accelerate again on the back of strong datacom revenue growth, with estimates pointing to an acceleration through fiscal 2027. Fabrinet is currently estimated to report 13.4% growth in FY25 to $3.27 billion in revenue, a 5.4 percentage point acceleration, before rising to 14.1% growth in FY26 and 20.8% growth in FY27.

Here's what CEO Seamus Grady said about the long-term opportunity: “If your time horizon is much longer, I think we're in the very early stages of this. So, you can add or subtract as many various as you like, but I still think we're in the very, very early stages of this. And we're just beginning to see what this explosive growth in AI and the infrastructure that's required to power this network will do and what it will need in terms of optical interconnect.

I think it's because optical is the only way that you can get the speed and the bandwidth that you need to get the signals to move around. You just can't do it with traditional interconnect. So, I think there's a kind of a paradigm shift to optical interconnect becoming kind of almost mainstream. And you have to have optical for this. There's no other way to do it.”

On a quarterly basis, fiscal Q1 2024 was Fabrinet’s weakest quarter, with revenue growth of 4.6% YoY, decelerating 7 percentage points sequentially and 16 percentage points from the year ago quarter. This was both in part due to a quarter that was a week shorter (growth was 8% YoY when normalizing for weeks), as well as telecom revenue declining more than (28%) YoY, offsetting 161% YoY datacom growth.

Telecom headwinds continued to persist through Q2 and Q3, with declines of nearly (29%) YoY and (25%) YoY respectively. Datacom growth of 154% and 149% YoY in both quarters offset the lingering weakness in telecom, aiding revenue growth and pushing growth rates up to 10% YoY by Q3. Revenue growth accelerated nearly 5 percentage points QoQ to 14.9% in Q4, as telecom declines moderated as data center interconnect growth ticked up. Datacom remained strong in Q4, with 800G products leading growth, offset by the wind down of 100G products.

For Q1, Fabrinet expects revenue between $760 million and $780 million, for YoY growth of 12.3% at midpoint, with sequential growth in all product categories. This would represent a 2.6 percentage point deceleration at the midpoint, and a 1.1 percentage point decel at the high range to 13.8% growth. With 800G demand remaining strong, datacom is set to remain a primary driver for quarterly performance moving through 2025.

Surging Datacom Revenue Drives Optical Revenue Growth

Similar to what we discussed last month in our optics overview, Fabrinet’s management sees 800G data center transceivers as its largest growth tailwind, followed by 400 ZR and 400G transceivers as the next largest tailwinds. In just eight quarters, Fabrinet’s quarterly datacom revenue has grown nearly 3.5x, from $92.7 million in Q1 of fiscal 2023 to nearly $315 million in Q4 of fiscal 2024.

Taking a step back, growth visibly accelerated sharply in Q4 of fiscal 2023, or the June 2023 quarter, where datacom revenue surged to a record high at $192.5 million, more than doubling YoY and rising more than 50% QoQ. Management said that the “datacom growth was primarily driven by an 800-gig AI data center transceiver program for one of our customers.”

While not named, it’s likely that the customer being referenced is Nvidia, as this growth coincided with Nvidia’s breakout quarter (the July 2023 quarter) with Hopper driving more than 100% YoY and 88% QoQ revenue growth. Management explained that that AI data transceiver program “is ramping very fast, and has obviously become a meaningful contributor to our revenue and our growth rates and has really helped us to absorb the decline in the telecom business.”

They further clarified that they believe it is “very much in the early days of this [particular] program and this [broader] opportunity, very, very much in the early days. We're really just a couple of quarters into this of what we believe, as we understand, it will be a very long cycle and a very long trend.”

Four quarters later, in fiscal 2024 (June 2024 quarter, most recent reported), Fabrinet reported $314.7 million in datacom revenue, an increase of more than 63% YoY. Datacom now accounts for nearly 42% of total revenue, up from 29% a year ago.

However, Q4 saw the start of revenue deceleration in the segment as Fabrinet laps stronger comps with its ramp cycle. Datacom revenue accelerated extremely rapidly, rising from 4.4% YoY to 161.1% YoY in the span of four quarters, before hovering at ~150% YoY for three quarters in a row. While Fabrinet did not provide an exact guide for datacom revenue in Q1, it’s likely that there will be a slight deceleration sequentially as the company laps its peak growth quarter in Q1 2024.

Nvidia Jumps to 35% of Revenue

Despite passing peak growth, management remains optimistic about datacom’s opportunities, especially with core 800G customer Nvidia, which significantly boosted its purchases and relationship with Fabrinet to meet red-hot GPU demand.

Analysts pressed about the potential impacts of Nvidia’s once-rumored Blackwell delay, and if that would affect Q1’s guide, with Fabrinet CEO Seamus Grady saying that Nvidia “continue[s] to see strong demand for their products. And our understanding is that they will extend and expand production based on current GPUs to meet the demand that's there, and we're happy to continue to support them.”

Nvidia has rapidly become a core customer for Fabrinet through fiscal 2024, with its contribution to revenue nearly tripling from 2023. Nvidia was a non-significant customer through fiscal 2022, contributing anywhere from 0% to 9.99% of revenue, before contributing 12.5% of revenue in fiscal 2023 and now 35.1% in fiscal 2024 (June 2023 to June 2024).

Source: Fabrinet 10-K

In dollar terms, Nvidia’s revenue surged 206% YoY, from approximately $331 million in fiscal 2023 to $1.01 billion in fiscal 2024. Cisco remained Fabrinet’s second-largest customer, contributing 13.4% of revenue (~$386 million) in fiscal 2024, down from 15.6% in fiscal 2023 (~$413 million). Lumentum and Infinera had previously been major customers, accounting for more than 10% of revenue each in fiscal 2022 and 2023, but both fell below the 10% reporting threshold in fiscal 2024.

While Nvidia presents a strong growth opportunity, it’s also a risk, as the significant concentration in Nvidia opens up the door to a large chunk of lost revenue if Fabrinet lost Nvidia as a customer. However, management is working on additional opportunities outside of Nvidia in merchant transceivers and with hyperscalers, noting that they “really don't mind whether it's Ethernet or InfiniBand or anything else” supporting AI infrastructure buildouts, having the flexibility to work across different networking infrastructure.

Additionally, Fabrinet is one of a handful of suppliers to Nvidia, who is now expected to be expanding its supplier base in order to expand its GPU supply. Analysts from B. Riley stated earlier in October that its “latest checks indicate that Nvidia may have added another supplier for 1.6T, which it believes is Eoptolink. As such, Nvidia’s 1.6T allocations will be in question between incumbers Coherent, Innolight, Fabrinet and a newcomer in Eoptolink.”

Margins

Compared to other companies in the optics space that we covered in our prior update, Fabrinet has a much thinner gross margin profile in the 12% range, but stable and strong operating margins and a strong bottom-line.

Fabrinet has maintained its GAAP gross margin above 12% since Q1 of fiscal 2022, with some minor FX-impacted fluctuations. GAAP operating margin has steadily risen since 2020, rising from ~7% to the high 9% range in fiscal 2023 and 2024. Given the thin gross margins, this is a great example of Fabrinet’s operational leverage, to drive a 200 bp+ increase in operating margin on a <100 bp expansion in gross margin.

GAAP net margins reflect the strength of Fabrinet’s operating margin profile, with the company reporting a 10.3% GAAP net margin for fiscal 2024, expanding 70 bp from 9.6% in fiscal 2023. This is what gives Fabrinet a very strong bottom line: GAAP EPS was $8.10 in fiscal 2024, a 20.4% increase from $6.73 in fiscal 2023.

Looking ahead, GAAP earnings are expected to continue growing, with analyst estimates calling for 15.1% YoY growth to $9.32 in EPS in fiscal 2025 and 19.0% growth to $11.09 in fiscal 2026.

Balance Sheet and Cash Flows

Fabrinet also has a robust balance sheet alongside rapidly increasing cash flows.

  • Cash, equivalents and investments totaled $858.6 million at the end of fiscal 2024, up from $550.5 million at the end of fiscal 2023 due to strong operating cash flow growth.
  • Fabrinet reported zero debt at the end of fiscal 2024.
  • Operating cash flow was $83.1 million, or 11% of revenue, in Q4. For fiscal 2024, operating cash flow was $413.1 million, or 14.3% of revenue; this was an increase of nearly 94% YoY from $213.3 million, or 8.1% of revenue, in fiscal 2023. 
  • Free cash flow was $70.4 million, or 9.3% of revenue, in Q4. For fiscal 2024, free cash flow was $365.6 million, or 12.7% of revenue, increasing more than 140% YoY from $152.0 million, or 5.7% of revenue, in fiscal 2023.

Valuation

Despite its strong bottom line, Fabrinet is trading at elevated multiples relative to historic trends. This is important to track as well given the longer duration of both its top line and bottom line acceleration, with growth expected to accelerate to above 20% by FY27.

Fabrinet is trading slightly above 3x sales and 2.7x forward sales, both elevated relative to its prior highs in 2021 at ~2.2x sales and 2x forward sales. Fabrinet has also struggled to maintain multiples above 3x sales – in each of the last four times Fabrinet traded above 3x sales in 2024, it pulled back to below 2.75x to 2.25x within the next six weeks.

On the bottom line, Fabrinet is trading at a ~30x PE ratio and a 24x forward PE, both elevated compared to historical highs. Through much of 2021, Fabrinet failed to sustain a 27x PE ratio, with shares currently more than 10% above that level on a TTM basis. Fabrinet’s 5-year average PE is ~22.7x, with shares briefly trading below that level just once since AI tailwinds from Nvidia became visible in August 2023.

Conclusion

Fabrinet has caught our attention due to Nvidia’s rising revenue contribution, and ahead of Blackwell’s imminent launch this quarter. Fabrinet’s datacom revenue has been strong, and a primary driver of this recent quarterly revenue growth acceleration.

Despite management guiding for a slight sequential deceleration in fiscal Q1, Fabrinet’s revenue growth is expected to accelerate in fiscal 2025 and beyond, as the company captures tailwinds from high-data rate optics and tailwinds from Nvidia. Unlike Coherent, Lumentum, and Marvell that we previously covered in our prior optics overview, Fabrinet has a solid margin profile, a strong bottom line, and exceptional cash flow growth.

This analysis is a preview of what you can expect in our upcoming Discovery tier, which will provide additional analysis on new idea generation stocks that are not currently in the I/O Fund portfolio. We look forward to launching this tier November/December. There will be no changes to our current service tiers, rather I/O Fund Discovery is a service for those who want more new stock ideas beyond what our service currently provides. Stay tuned for more information!

Damien Robbins, Equity Analyst at I/O Fund, contributed to this analysis.

Please note: The I/O Fund conducts research and draws conclusions for the Fund’s positions. We then share that information with our readers. This is not a guarantee of a stock’s performance. Please consult your personal financial advisor before buying any stock in the companies mentioned in this analysis.

Recommended Reading: