Meta Platforms: Quietly the Strongest Mag 7 Stock with Meta AI App Launching Soon 

Meta is the strongest Mag 7 stock YTD with its peers down as much as 40%, Meta’s (13%) decline since the first of the year is strong on a relative basis and provides some important clues. 

It may be easy to lump the Mag 7 together, yet this cohort is different in key aspects that matter. For example, we’ve been cautioning on Tesla’s margins for years, Nvidia continues has an AI lead that appears insurmountable, while the others have open pocketbooks for AI chips without much visibility to offer in terms of how that capex will be paid back and when.  

It’s this last piece that Meta has a better handle on.  The company is not offering data center infrastructure for developers and R&D departments to create AI applications, who in turn, must find a path to monetization for a virtuous cycle of demand. With what we know today from earnings disclosures, Azure is leading with a $13 billion annual run rate in revenue among the cloud providers (Amazon, Google, Microsoft). Yet, consider that Meta has a new ad product driven by AI that is already on a $20 billion run rate, and this does not include incremental revenue AI is driving across their other ad products, evidenced by an inflection in Meta’s key metric on ad prices. 

There are other areas that Meta is quietly leading. The company is releasing a standalone AI app in Q2, powered by Llama 4, with projections for 1 billion monthly active users by year’s end. That’s up from 700 million users today on the embedded AI features it sees in its popular “family of apps” such as Facebook, Whatsapp and Instagram. To compare, Chat-GPT's standalone app has 500 million. While it remains to be seen if Meta AI will reach the company’s lofty goals, there’s certainly a viable path with 3.35 billion currently using its popular apps today. 

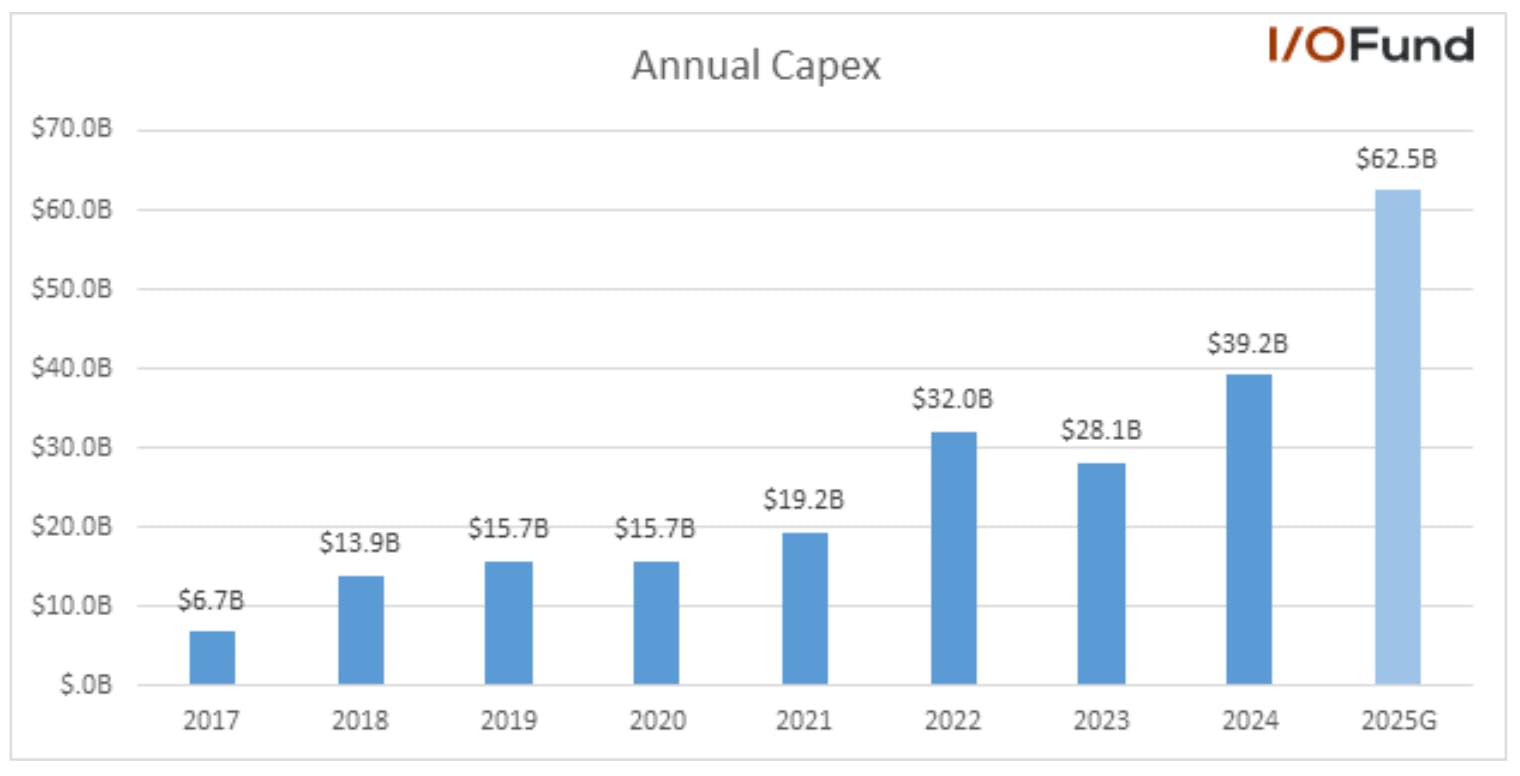
Lastly, whereas other big tech companies ramped capex 1-2 years ago, Meta is only now moving into large capex spending from $30B in 2023, to $40B last year to $62 billion this year, up 59.4% YoY. This past quarter, capex was up an astonishing 88% YoY. Meta is in the enviable position to increase this capex once they’ve found product market fit within their own platform rather than pre-emptively building for future AI development. I suspect this new trajectory in capex spending means Meta is ready to scale its AI tools on the ad platform side.  

Meta’s AI-Powered Ad Tools 

Meta is unique in that its customer base has an unusually high incentive to use AI tools. You could argue developers for cloud IaaS also have a high incentive, yet they must in turn monetize to drive scale for their AI apps. Meanwhile, advertisers see an immediate ROI using AI tools and are then incentivized to spend more.  

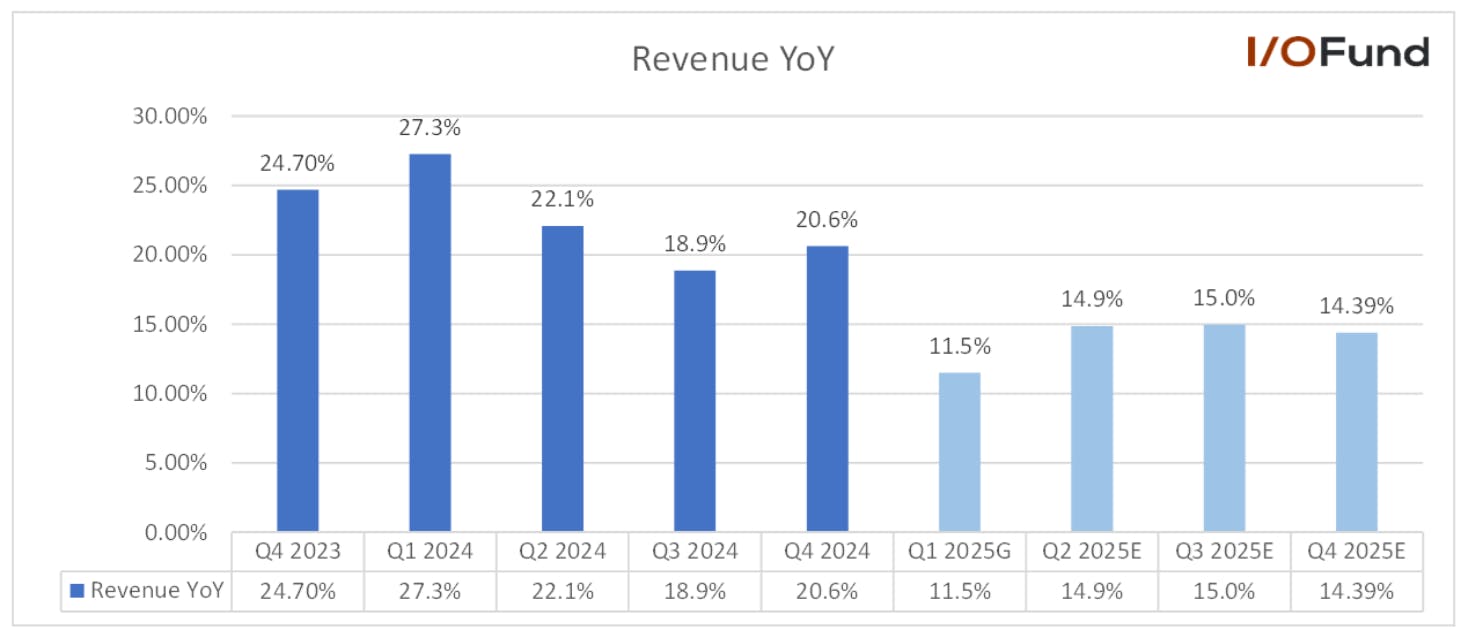
Evidence of this is visible in the stubbornly high ad revenue growth last quarter of 20.6%, which has sustained even as Meta recently lapped tough comp as the average ad price grew 14% YoY.  
Advantage+ has $20B Run Rate:

Advantage+ is an automation tool that uses machine learning to match customers to ads. Similar to Google’s Performance Max, the tool uses AI and machine learning to help with optimize bids/budgets, create and find audiences, and to produce ad creatives. Up to this point, Advantage+ has been used for ecommerce and manually turned on, yet Meta is now going to have the tool turned on automatically and roll it out to other verticals soon.  

“In this new setup, all campaigns optimizing for sales, app or lead objectives will have Advantage+ turned on from the beginning. This will allow more advertisers to take advantage of the performance Advantage+ offers, while still having the ability to further customize aspects of their campaigns when they need to. We plan to expand to more advertisers in the coming months before fully rolling it out later in the year.” 

According to the recent earnings report, over 1 million advertisers used Meta's gen AI tools to create 15 million ads in December 2024.  

  • Advantage+ shopping campaigns surpassed a $20 billion annual run rate, up 70% YoY.  
  • Advantage+ users are seeing a return on ad spend (ROAS) improvement of up to 22%. 
  • Advantage+ Creative is seeing over 4 million advertisers using at least 1 generative AI ad creative tool, up 1 million just six months ago.  

Andromeda has 10,000X increase in Model Capacity: 

In H2 2024, Meta revealed a new machine learning system built on Nvidia Hopper chips called Andromeda. Per the earnings call: “This more efficient system enabled a 10,000 times increase in the complexity of models we use for ads retrieval, which is the part of the ranking process where we narrow down a pool of tens of millions of ads to the few thousand we consider showing someone.” 

Consider that with AI, an advertiser can make 5,000 creatives rather than 5 creatives, changing the game in personalization. Andromeda is aimed at the new frontier of AI advertising, with an emphasis on retrieval as the first step. This first stage in the ad serving process is to retrieve the ads that are most personalized to a user, resulting in thousands of ads before the final ads are selected.  

Due to AI, these ads can now be chosen based on learned associations rather than categories or keywords. By offering a 10,0000X increase in model capacity, Andromeda processes large amounts of data to accurately predict which ads will resonate with which users. This leads to more relevance, which in turn, leads to higher conversions. The deep neural network is considered "hierarchal structured” to where it can handle a much larger volume of ads at a much higher accuracy, improving on the previous structure known as “two-tower.” 

Meta AI to See 1 Billion Users in 2025 

In a recent conference, Chief Product Officer Chris Cox, described Meta’s AI features as Search 2.0. Instead of visiting a search engine, users engage with Meta AI in-app and on the newsfeed. Meta’s standalone app is expected to be announced in late April at the developers conference.   

During the conference, Zuckerberg said, “Meta AI differentiates itself in this category by not just offering state-of-the-art AI models, but also unlimited access to those models for free, integrated easily into our different products and apps. So Meta AI is on track to being the most used AI assistant in the world by the end of this year. In fact, it’s probably already there. We’re almost at 500 million monthly actives, and we haven’t even launched in some of the bigger countries yet.” While this version was on Llama 3.2, the new rollout of its standalone Meta AI app will be using Llama 4.0 (detailed below).  

Since then, Meta AI has reported 700 million users on a monthly basis while Chat-GPT is at 500 million weekly active users. This is not comparable, however, since Meta AI is not a standalone app yet. The release will be closely watched as Meta will likely push hard on its large social media base to download the app. 

Chatbot to Aid in Personalization of Content and Ads: 

Meta’s chatbot will also help to aid in further personalization of ads. The data from its chatbot will be stored in memory to help target users. 

“We'll be able to remember certain details that people share in one-on-one chats, for example, and use those details to personalize its responses and then really increasing its ability to deliver great content recommendations and enhance really what makes Facebook and Instagram, so valuable for people today.” 

CFO Susan Li described the Meta AI roadmap in 2025 during the Q4 2024 conference call, stating something similar as to the strengths of Meta’s app over other AI chatbots in terms of personalization and a large context window: 

“And as we look forward to 2025 in our Meta AI road map, we are really focused on doing more to make it feel more personalized. So, I would say some of the most exciting features we're working on include improving sort of the memory dimension of the Meta AI experience. We'll be able to remember certain details that people share in one-on-one chats, for example, and use those details to personalize its responses and then really increase its ability to deliver great content recommendations and enhance what makes Facebook and Instagram so valuable for people today.” 

Notably, it’s unlikely Meta AI is monetized this year, although in future years there are plans for a premium tier similar to Chat-GPT. 

Llama 4 Models Released Last week 

Llama 4 Scout and Llama 4 Maverick were released last week, while Llama Behemoth at 2 trillion parameters is expected to be released soon. These multi-modal LLMs are trained on text, images and video with a mixture of experts (MoE) architecture. MoE distributes a computational load across “multiple experts” (or neural networks) and trains across thousands of GPUs using what is called model and pipeline parallelism. This enables more compute-efficient pretraining, yet the parameters still need to be loaded in RAM, so the memory requirements remain high. 

For Llama 4 Maverick, 400B parameters are stored in memory while only 17B parameters are activated during model deployment, which greatly improves inference efficiency by lowering costs and latency.  

This is similar to the breakthrough we saw with DeepSeek R1, which was a MoE model that was trained on 671 billion parameters stored in memory, yet when the model is served, only 37 billion parameters are active. The overall result is computational efficiency as only the most relevant parameters are activated for a specific task. 

  • Llama Maverick can be run on a single H100 DGX system (8 GPUs) or can be run distributed for inference purposes. The inference cost for Llama 4 Maverick is $0.19 to $0.49 per 1 million tokens compared to Chat-GPT4o at $4.38 per million tokens.  
  • Groq has verified the upper end of this inference cost estimate with Maverick at $0.53. The model leverages 128 experts. According to Meta, Maverick exceeds “comparable models like GPT-4o and Gemini 2.0 on coding, reasoning, multilingual, long-context, and image benchmarks, and it’s competitive with the much larger DeepSeek v3.1 on coding and reasoning.” 
  • Llama 4 Scout is cheap at $0.13 per million tokens according to Groq and can be deployed on a single H100 GPU, leveraging 16 experts. Scout can remember long threads and documents of up to 10 million tokens. This is the largest context window across LLMs available today. 
  • Llama 4 Behemoth is a teacher model that is still being trained with 288B active parameters and 2 trillion total parameters, leveraging 16 experts. Llama 4 Behemoth helped train Maverick and Scout and ranks high on internalinternal benchmarks such as MATH-500, MMLU Pro, GPQA Diamond, Multilingual MMU and image reasoning MMMU. According to MetaAccording to Meta, Chat-GPT 4.5 ranks lower on these benchmarks although this will not be officially verifiedwill not be officially verified until Behemoth is released. For reference, an engineer estimates Chat-GPT 4.5 has 5-7 trillion parameters and 600B active parameters. 

Recently, Chief Product Officer Chris Cox explained the goals for Llama 4 – it's a long quote but also important to hear what Meta is setting out to achieve with its newest models and also as an open-source leader in LLMs: 

“We've finished pretraining the smaller model. The main thing — first, just from an intelligence perspective, we're trying to pack basically, the intelligence of the large Llama 3 series down into really small models, which can then be used with low latency for low-cost on devices on a single host. So basically getting a lot of the intelligence down into the smaller form factor, that's one of the most important things we can do. 

The second is just the basis of what's expected in a new model today, which is reasoning. Agentic use cases, just meaning tool use, ability to use a browser, ability to use other tools. 

And then the third piece is an omni model. So basically, interacting with image and voice natively. So rather than translating voice into text and then text into LLMs getting text out, turning that back into speech, having speech be native. This is a big deal. I believe it's a huge deal for the interface, the product. The idea that you can talk to the internet and just ask it anything. I think we are still wrapping our heads around how powerful that is.” 

Meta Increases Capex 88% YoY in Q4, will increase 59.4% this Fiscal Year 

Q4 capex was $14.8 billion, driven by servers, data centers and network infrastructure investments. Meta raised its 2025 capex guidance to $60 billion to $65 billion, with a midpoint of $62.5 billion, up 59.4% YoY, driven by investments in AI infrastructure and its core business.  

Meta is also extending the lives of its servers and networking equipment. They will use non-AI and AI servers for longer periods of time before replacing them, which will be 5.5 years, resulting in annual capex savings and depreciation expenses, which is included in its guidance. 
In December 2024, Meta announced plans for its 23rd and largest data center in the United States, a 2GW+ AI data center “so large it would cover a significant part of Manhattan” in Richland Parish, Louisiana. The data center plans to outdo Elon Musk’s xAI’s Colossus supercluster of 1 million NVDA GPUs, with plans for 1.3 million GPUs used to train its Llama AI models.   

The 4 million square foot campus will be set on 2,250 acres on the former Franklin Farm site. They will build up to nine buildings and plan to bring 1 GW online by the end of 2025. The site will total over 2GW at full buildout as construction is scheduled to continue until 2030.    

Meta has a co-location deal with Entergy to develop a 1.5GW natural gas power plant located adjacent to its proposed $10 billion data center. Entergy is investing $6 billion in electric infrastructure, including a 10,000-acre solar farm, three combined-cycle combustion turbines (CCBT) split into two sites totaling 2.26GW and over 100 miles of new transmission lines. Co-location refers to deals where data centers are located next to power plants generating electricity to feed directly to the customer and usually bypassing the electric grid, which would be a back-of-the-meter arrangement.  

Meta is seeking approval from Louisiana OSC to begin construction within 10 months. Meta will be matching its electricity use with 100% clean and renewable energy and has pledged to build or acquire 1.5GW of solar power elsewhere in order to offset emissions from the gas plant. Meta will also contribute to a carbon capture and storage project at the Entergy Lake Charles 994MW gas plant. The gas plant is estimated to open between 2028 to 2029.  

Incidentally, a report by The Information claimed Meta is in talks to build a $200 billion data center. However, Meta has not confirmed the rumor. 

Meta Plans to Increase ASIC Usage 

Meta training and inference accelerator (MTIA) is Meta’s custom silicon and is primarily used for inference today for ads and organic content. The goal is to use MTIA for training next year. According to Tom’s Hardware, the “plan is to gradually increase usage if the chip meets performance and power targets."  

There have been delays in the past on Meta’s custom silicon program with MTIA originally launching in 2020, yet Meta had to halt the program to buy Nvidia’s GPUs over the past few years with MTIA v1 launching in 2023. This year, MTIA v2 was launched using RISC-V cores that lowers the overall cost as there are no licensing fees. You can read more about RISC-V, the open-source competitor to Arm in previous coverage here

Regarding DeepSeek, Meta confirmed "that doesn’t mean you need less compute,” going on to explain that a new trend is to apply more compute at inference in order generate a higher level of intelligence and higher quality. “I think that's generally an advantage that we're now going to be able to provide a higher quality of service than others, who don't necessarily have the business model to support it on a sustainable basis. 

Financials:

Average Price Per Ad is Inflecting 

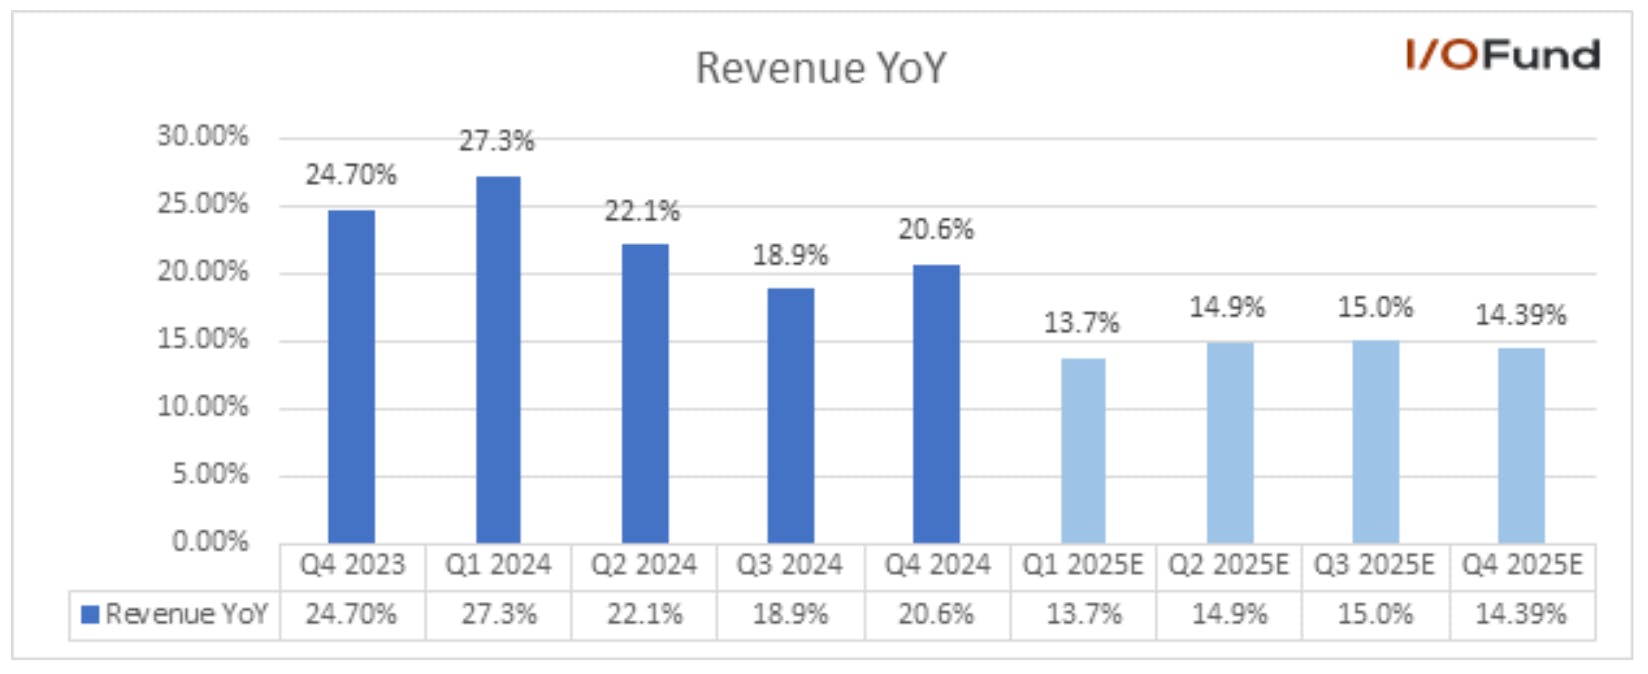
Q4 revenue rose 20.63% YoY to $48.39 billion, beating consensus analyst estimates of $46.99 billion by $1.39 billion or 2.96%. Full year 2024 revenue rose 22% YoY to $164.5 billion. 

Management guided Q1 2025 revenue of $39.5 billion to $41.8 billion, with a midpoint of $40.65 billion representing 11.5% YoY growth at the midpoint. This was in line on a constant currency basis, yet came in under $41.46 billion consensus analyst estimates due to 3% FX headwinds representing 13.72% YoY growth.
Revenue growth in the quarter was driven by 21% YoY revenue growth in its Family of Apps to $47.3 billion, of which ad revenue rose 21% YoY to $46.8 billion, comprising 97.57% of total revenue. Other revenue for its Family of Apps rose 55% to $519 million, driven primarily by WhatsApp Business Platform. 

The number of ad impressions served across its services rose 6% YoY, and the average price per ad rose 14% YoY. Ad revenue growth by geographies was led by the Rest of the World at 27%, Asia-Pacific at 23%, Europe at 22% and North America at 16%.    

The average price per ad was up 14% YoY – which is the most important metric to watch as pricing should increase with the AI advancements described above. Growth in average price per ad is already inflecting when you consider Q3 was 11% growth and Q4 of last year was only up 2%. 
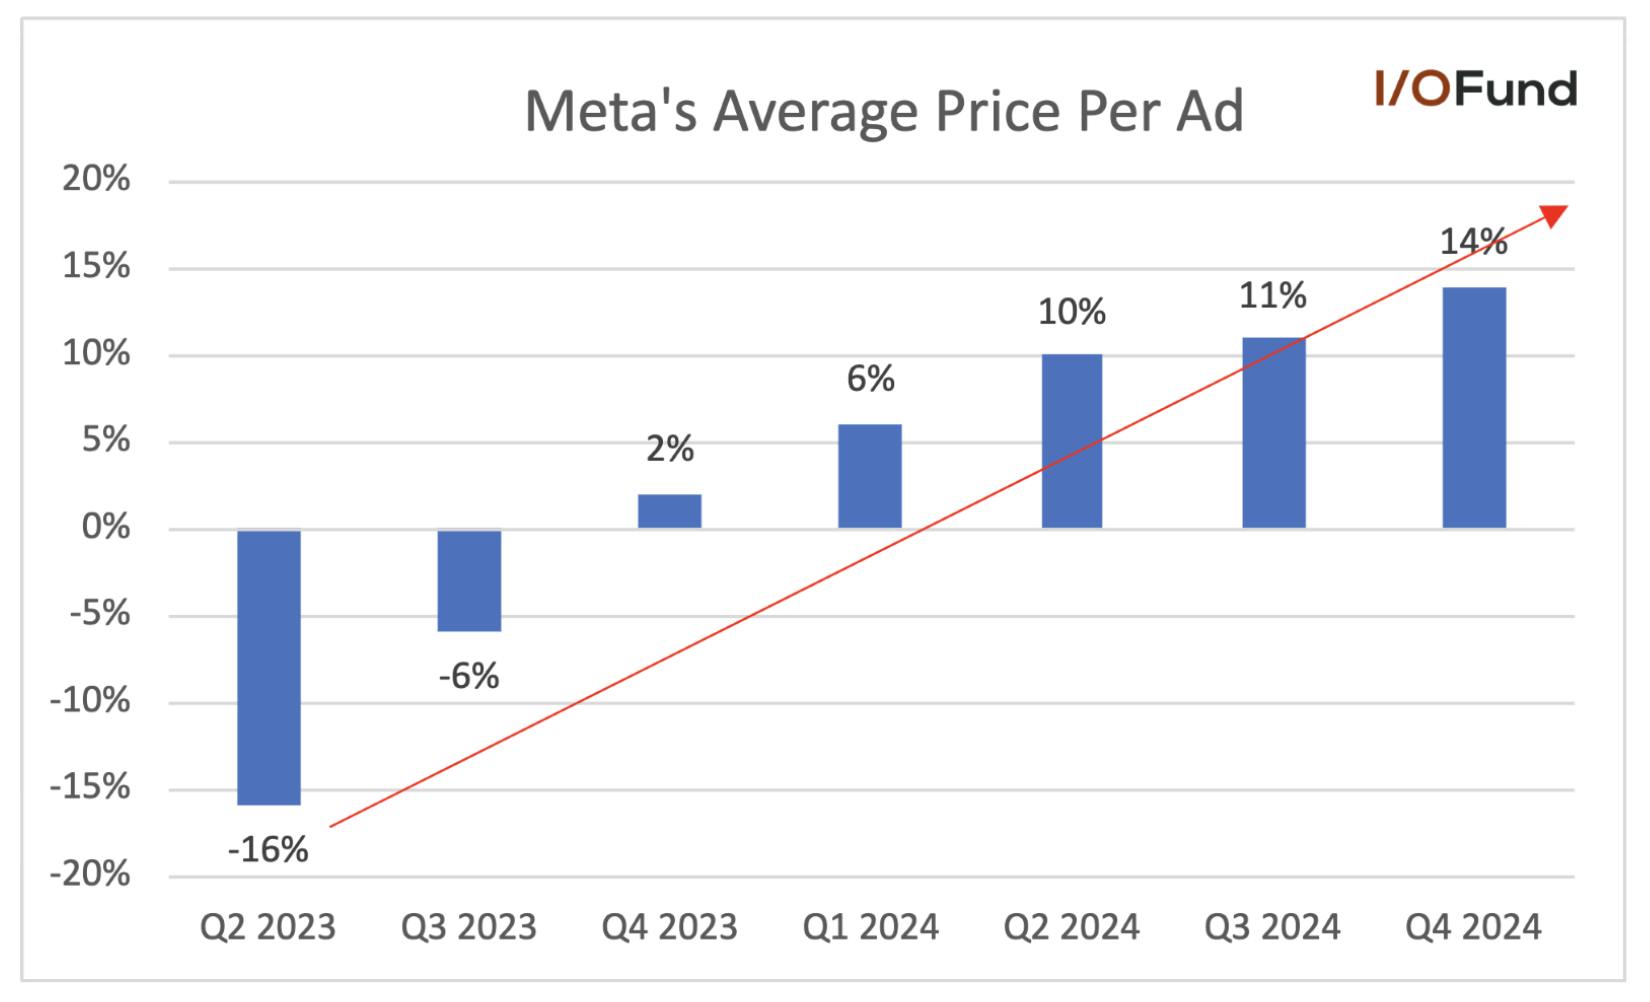
Regarding this inflection, the CFO hinted CPMs (cost per 1,000 impressions) may continue to grow: “Overall, we are seeing healthy cost per action trends for advertisers for whatever is the action that they are optimizing for. And we believe we'll continue to get better at driving conversions for advertisers. And when we do, that will have the effect of continuing to lift CPMs over time, because we're delivering more conversions per impression served, resulting in higher value impressions.” 
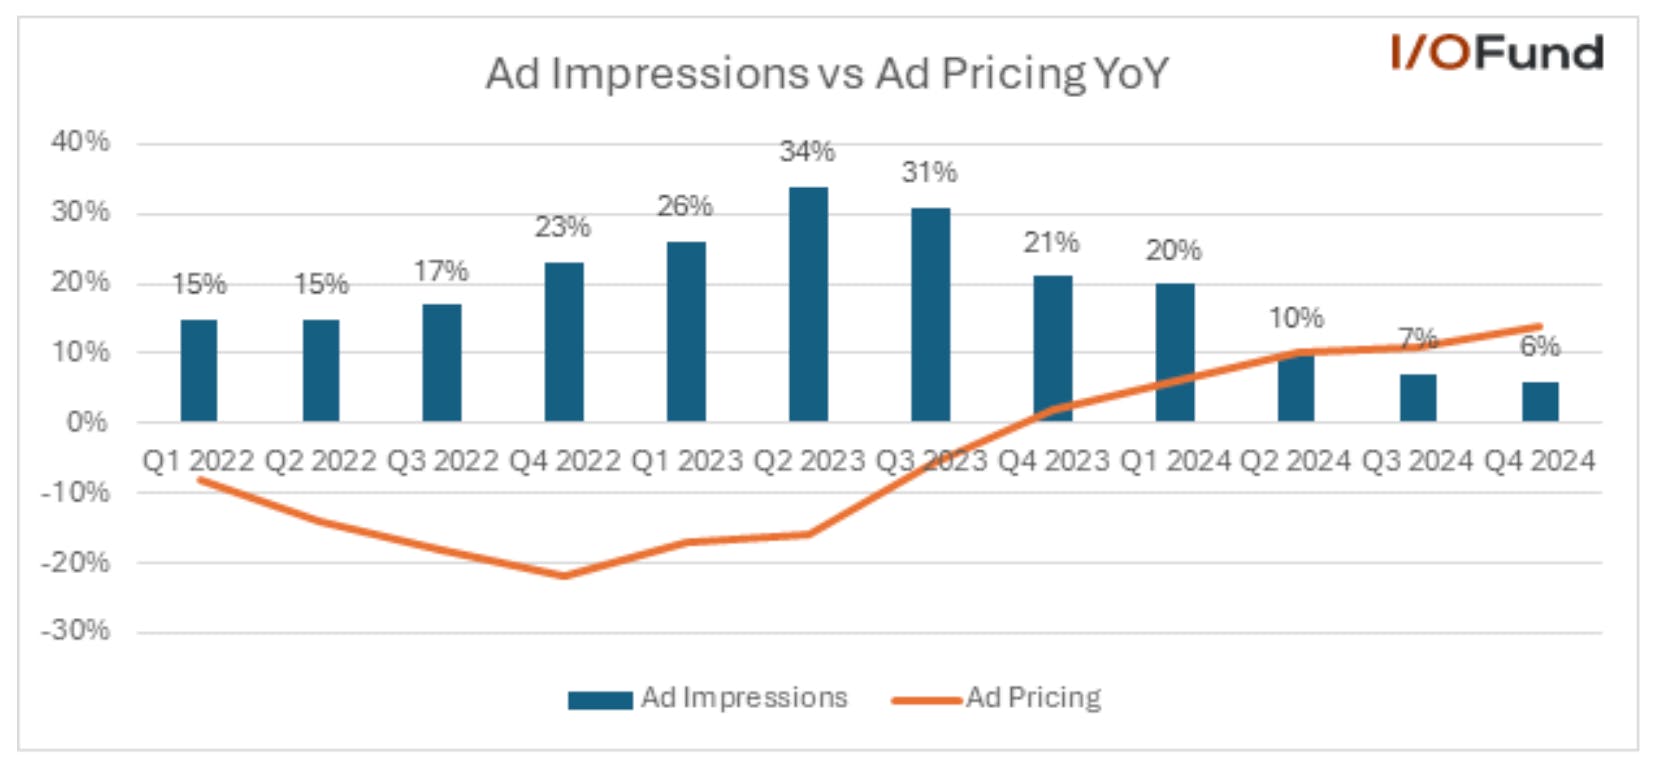
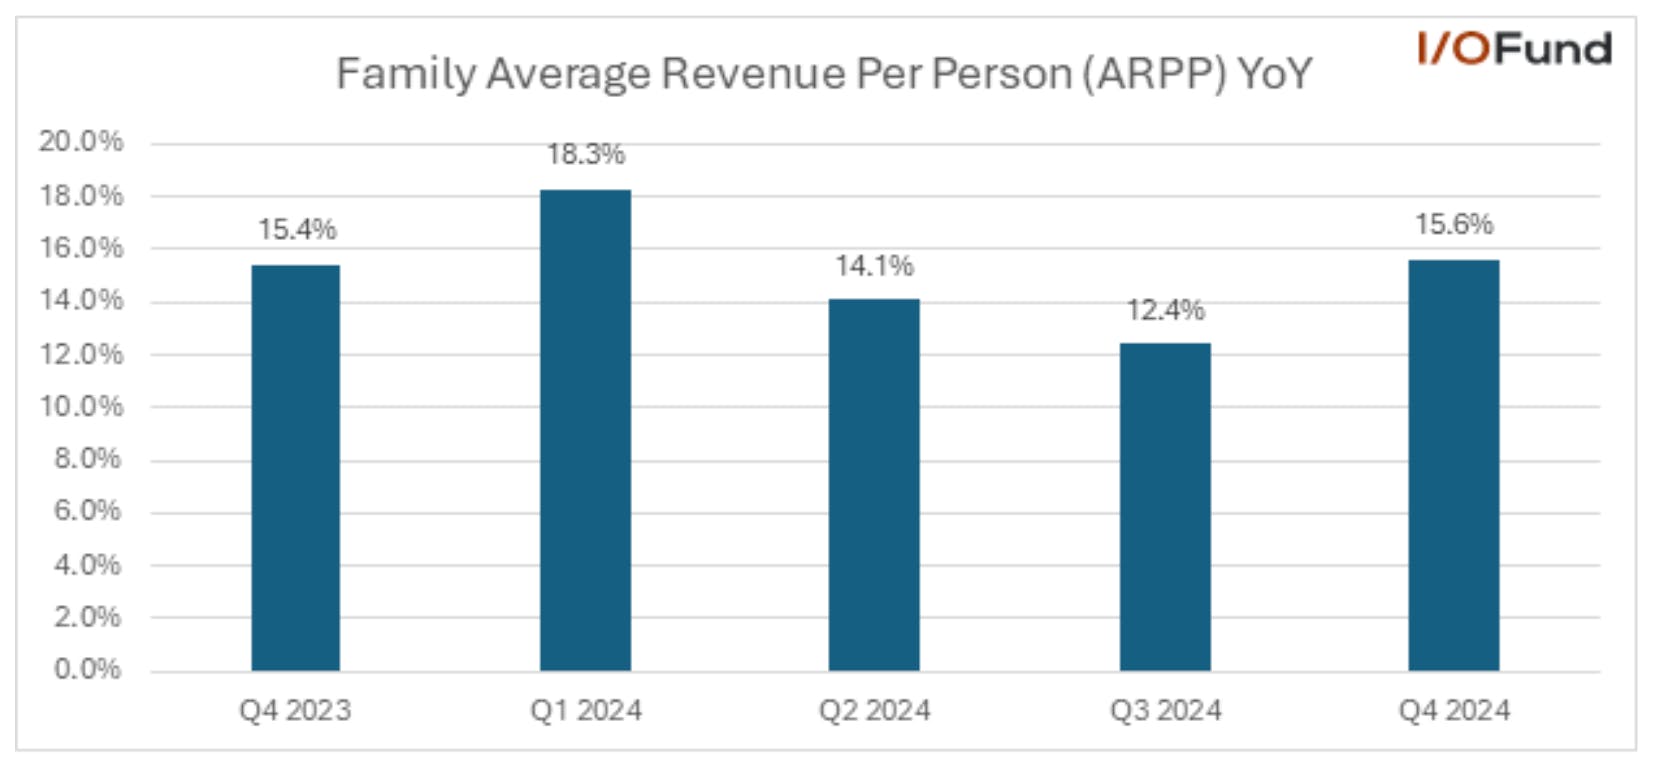
The Family of Apps average revenue per person (ARPP) rose 15.6% YoY to $14.25, which was a slight YoY improvement from Q4 ARPP growth of 15.4% — so again, consider this growth is being reported on tough comps

EPS Grows YoY and QoQ 

Q4 GAAP EPS rose 50.47% YoY to $8.02, beating consensus analyst estimates for $6.76 by $1.26 or 18.67%. This was a sequential improvement from Q3 GAAP EPS, which rose 37.34% YoY to $6.03, beating consensus analyst estimates of $5.29 by 13.99%.  

It’s no secret that AI agents can write excellent code, which can help drive efficiencies at companies by cutting back on the R&D department overhead. According to the earnings call, Meta expects AI to be as good as mid-level engineer, which will positively impact margins and the bottom line: 

“I also expect that 2025 will be the year when it becomes possible to build an AI engineering agent that has coding and problem-solving abilities of around a good mid-level engineer. And this is going to be a profound milestone and potentially one of the most important innovations in history, as well as over time, potentially a very large market. Whichever company builds this first I think is going to have a meaningful advantage in deploying it to advance their AI research and shape the field. So that's another reason why I think that this year is going to set the course for the future.” 

Margins: 

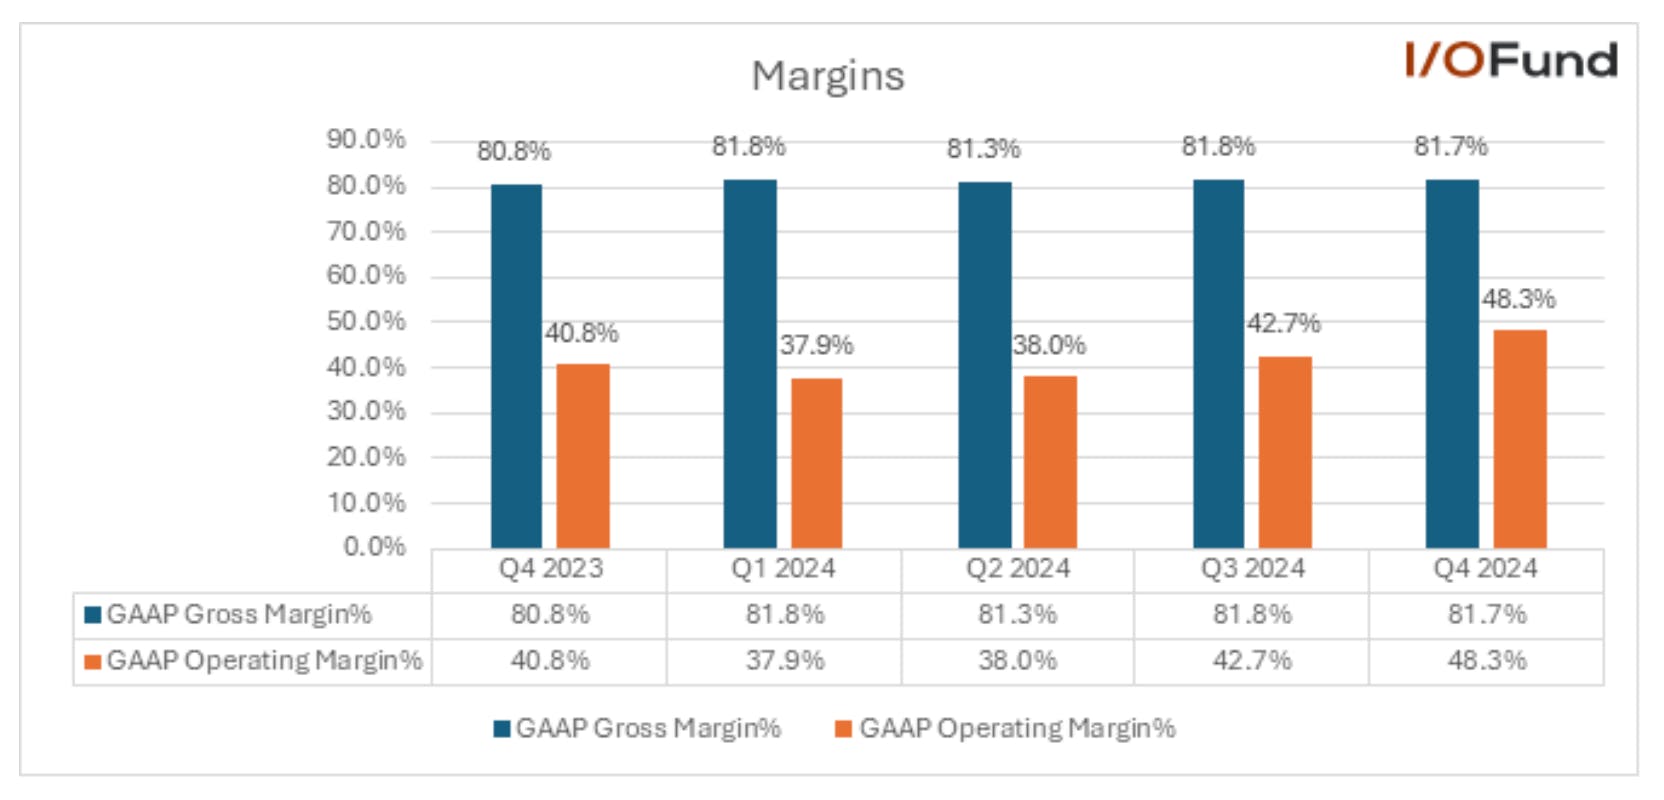
Meta’s margins and income are impressive at levels not seen since the company was the defacto Wall Street darling in 2017.  

  • Q4 gross margin was 81.7%, falling slightly from Q3 gross margin of 81.8%. 
  • Operating margin steadily climbed to one of its highest levels (ever) at 48.3%. Looking back, it was Q4 of 2017 when Meta last reported a higher operating margin. This is up from an OM of 41% last year. 
  • Net margin of 43.1% is similar – one of Meta’s highest on record, up from a margin of 35% last year. 
Cash and Debt Close 2024 at Their Highest Levels for the Year 

Q4 operating cash flow reached its highest level for 2024 at $27.99 billion with a margin of 58%. This is up from $19.4 billion for a margin of 48.4%.  

 Free cash flow fell sequentially to $13.15 billion compared to last year at $11.5 billion. The roughly $14B difference in OCF and FCF is from high capex spend. 

Q4 cash and cash equivalents rose 9.75% QoQ for $77.81 billion in cash. Debt was $28.82 billion.  

Conclusion: 

Clearly, AI is extremely nascent in terms of what it can do with non-stop development and progress coming from tech’s largest players as well as startups. However, also consider that very few companies have a 3B+ global user base to convert to an AI app.  

Meta is positioning itself to become a dominant player in the AI landscape led by its Llama 4 models and standalone Meta AI assistant app. AI has enhanced its core advertising business with ad pricing reaching an important inflection point. It’s also interesting to consider its AI tool Advantage+ has surpassed Azure in annual run rate at $20B compared to $13B. 

The market is rife with noise, it is hard to know what to pay attention to right now. You can expect us to build a strong pipeline of opportunities to seize when the timing is right.

Please note: The I/O Fund conducts research and draws conclusions for the Fund’s positions. We then share that information with our readers. This is not a guarantee of a stock’s performance. Please consult your personal financial advisor before buying any stock in the companies mentioned in this analysis.

Recommended Reading:
CoreWeave: AI Infrastructure Built for the Next Decade; Upside Down Business Model  

  • CoreWeave is an AI Hyperscaler offering access to over 250,000 NVIDIA GPUs throughout its 32 data centers for AI workloads and backed by NVIDIA, which owns 6%. 
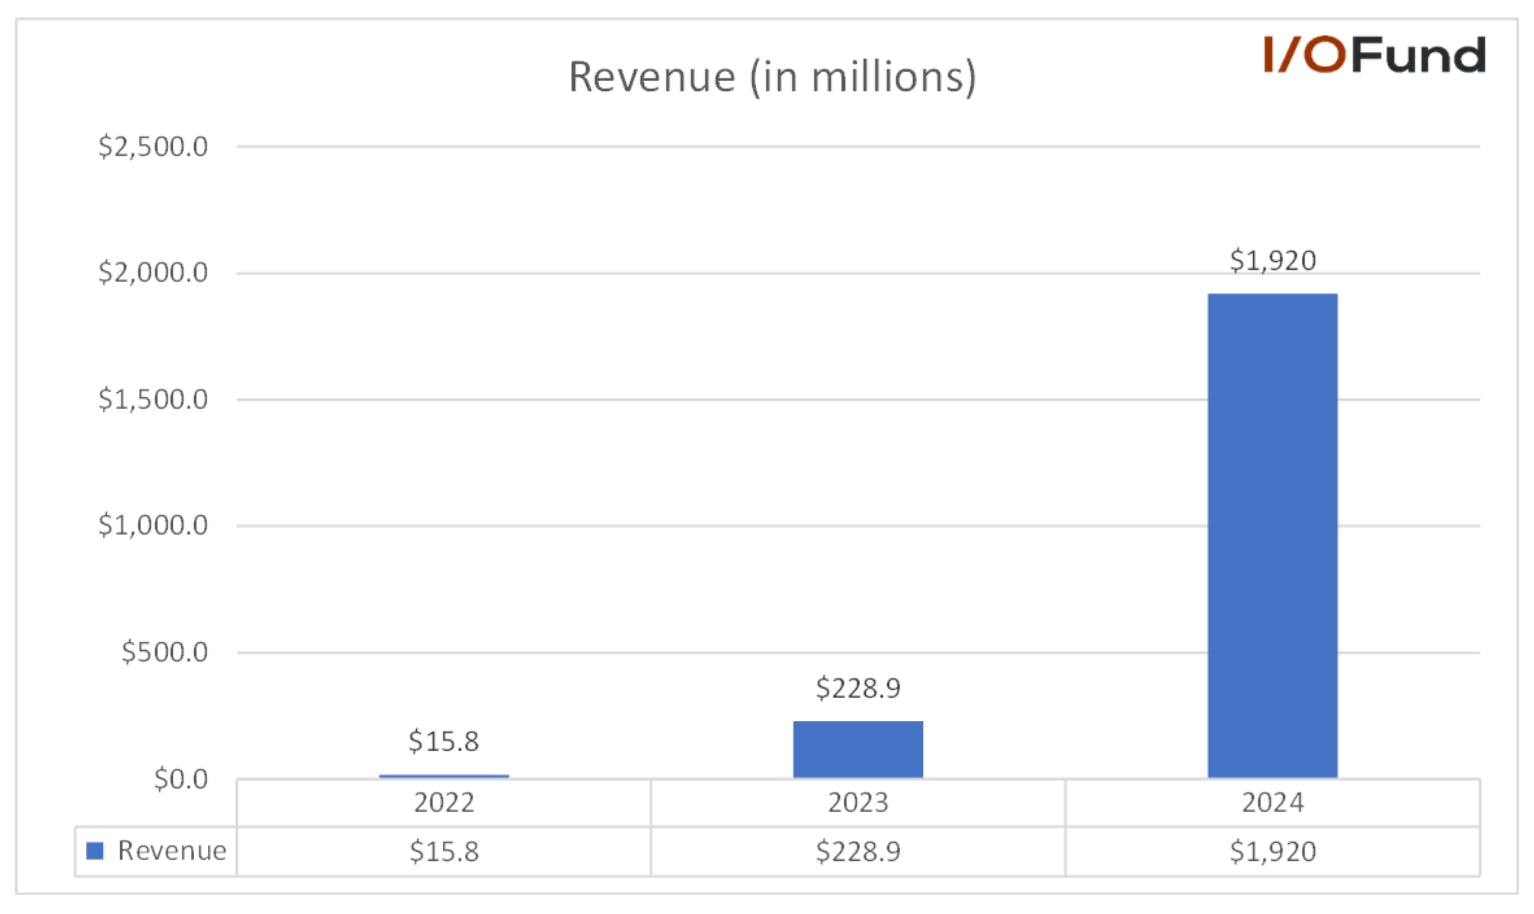
  • Revenues grew from $15.83 million in 2022 to $228.9 million in 2023 to $1.92 billion in 2024 for significant growth of 736% last year (on small revenue). 
  • 77% of revenue came from two customers, with Microsoft the largest at 62%.  
  • Most of the revenues come from long-term, fixed-rate deals that reserve capacity and require a 15% to 25% upfront prepayment, which is used to finance more compute capacity.  
  • Backlog grew 54% YoY to $15.1 billion, up from $9.9 billion in 2023. 
  • CoreWeave signed a five-year deal with OpenAI valued at up to $11.9 billion, who also became an investor with a $350 million stake.  
  • The company has two asset-backed draw-down term loans (DDTL) using its 250,000 NVIDIA GPUs as collateral for $9.9 billion in debt financing at a lofty 10.52% and 14.11% variable interest rates. The interest on these loans as well as depreciation of servers greatly impacts the bottom line to where this company is deep in the red. 

CoreWeave brands itself as the world’s first “AI hyperscaler” as they offer both infrastructure and a software platform for developing large language models and deploying them. Being dubbed an AI infrastructure player means CoreWeave must offer a compelling value proposition to attract business from arguably the largest competitors in the world – AWS, Microsoft Azure and Google Cloud. In its S-1 fling, the company points out it was built for AI workloads as opposed to the legacy cloud infrastructure-as-a-service providers that were primarily optimized for the cloud software era and e-commerce era. CoreWeave also asserts that outdated cloud infrastructure leads to lower utilization rates when you factor in usage. 

The company also offers proprietary software to help achieve higher total system performance and more favorable uptime relative to competitors. According to the S-1 filing, “by delivering more compute cycles to AI workloads and thereby reducing the time required to train models, our capabilities can significantly accelerate the time to solution for customers in the ongoing hyper-competitive race to build the next bleeding-edge AI models.” 

CoreWeave competes with Big 3 on Higher Usage Utilization Rates (MFUs) 

To further understand CoreWeave’s competitive advantage, it’s important to discuss the model FLOPs utilization gap. The “MFU gap” is a metric that describes the gap between compute capacity and usage, which today often ranges between 30% to 40%. Cloud providers are often at 100% GPU utilization, yet there is a much lower utilization rate for GPUs when factoring in maximum floating-point operations per second (FLOPs). Initially, when MFU was coined by Google’s PaLM Paper, model training was running at 20% MFUs.  

The MFU gap can become quite costly as it represents a more realistic way to measure the performance of GPUs — rather than only taking into account if a GPU is sitting idle or not. According to Trainy AI: “GPU Utilization is only measuring whether a kernel is executing at a given time. It has no indication of whether your kernel is using all cores available, or parallelizing the workload to the GPU’s maximum capability.” 

According to Google’s PaLM paper, they came up with the metric to better gauge a more realistic utilization rate: “Given these problems, we recognize that HFU (hardware FLOPs utilization) is not a consistent and meaningful metric for LLM training efficiency. We propose a new metric for efficiency that is implementation-independent and permits a cleaner comparison of system efficiency, called model FLOPs utilization (MFU).” 

When factoring in FLOPs, the best possible (realistic) MFU is in the range of 50% to 60%, as this translates to raw compute being the bottleneck. Lower MFUs indicate inefficiencies, which CoreWeave specializes in solving. This could involve optimizing memory bandwidth, improving communication between GPUs, clearing data input bottlenecks, and other ways in which to fix batch size, enable faster data loading, and/or better ways to balance the compute. 

Popular large language models do not publicly report their MFUs, but internally, this utilization rate is a dominant factor in competitiveness and time to market. R&D labs with a higher MFU rate have an important advantage as even an incremental increase in single digits to low double digits can result in a 25% to 50% increase in training speed and cost.  

Due to going public, CoreWeave has published its MFU rate of 35% to 45%, stating its 20% higher than competitors, which means other AI data centers have MFU rates more in the 30% range. As discussed in the section below, due to FLOPs performing an astronomical number of calculations, small percentages translate to an important advantage. 

To put it simply, efficiency equals money and time in large-scale AI projects — training huge models can cost millions of dollars and weeks of time, so even a few percentage points of MFU improvement can translate to a significant advantage. 

A Note on Floating-Point Operations Per Second (FLOPs) 

Floating-point calculations are at the heart of performance for large language models. High FLOPs result in higher calculations per second with an LLM like Chat-GPT4o requiring FLOPs into the septillion or 10^25 for total training time. High FLOPs are more commonly referred to as teraFLOPs for trillions per second or petaFLOPS for quadrillions per second. 

High FLOPs result in faster training and also better efficiency, which means an AI system can move onto the next task more quickly. GPUs help to handle these computations in parallel and in less time, and GPUs also offer mixed-precision calculations to significantly increase training speed while using less memory and speeding up data transfer operations. By optimizing infrastructure, Corewave optimizes the maximum utilization of floating-point operations per second (FLOPs) in order to offer a competitive advantage to its customers. 

How CoreWeave Optimizes Infrastructure and Utilization Rates:

AI supercomputers are incredibly expensive, and therefore, a primary goal is to prevent downtime. Beyond the cost of GPUs, companies must factor in specialized orchestration frameworks, engineering resources, component failures, and the need to constantly monitor for downtime. 

The S-1 filing points toward MLPerf Benchmarks that trained a model in 11 minutes, resulting in a record that was “29 times faster than the next best competitor at time of benchmark.” Notably, this was V3.0 of the benchmarks and others have outperformed since.  

Earlier this week, CoreWeave published V5.0 benchmarks, setting new records with the GB200s. 

CoreWeave offers the following infrastructure and software stack: 

  • Latest GPUs: Nvidia has a vested interest in CoreWeave, and thus, the company often gets the latest generation of GPUs first for commercial availability. For example, CW was the first to offer the GB200 NVL72s for commercial availability in February. This offers a distinct advantage given hardware supply is bottlenecked and is seeing outsized demand. 
  • Managed Software Solutions: CoreWeave Kubernetes Service (CKS) is an AI-optimized Kubernetes environment, plus a Virtual Private Cloud for a private network space.  
  • Application Software: 
  • SUNK: Slurm-based software is an open-source scheduler for distributed, batch-oriented workloads. CoreWeave’s SUNK software reduces the complexity of working with a job scheduler, as well as helping AI workloads run on a single cluster for efficiency while scaling.  
  • Tensorizer: Software that helps to loads a model from storage directly into GPU memory, reducing inference latency 
  • CoreWeave acquired Weights & Balances for a reported $1.7 billion, with the company valued at $1.3 billion in 2023. The software development platform helps developers build AI applications and AI models. 
  • Mission Control and Observability: Lifecycle management and observability software makes sure systems are setup correctly and issues are quickly identified across nodes and for system-level performance 

The overall problem that CoreWeave’s Cloud Platform solves is to help customers onboard quickly without having to manage infrastructure. Once onboarded, the platform alleviates the resources required for monitoring workloads, while offering software that speeds up time to market for large language models. 

Why Use CoreWeave over the Big 3? 

There’s no denying the Big 3 has a massive customer base to upgrade to their AI platforms. The large global footprint the Big 3 offers is also tough to compete with as CoreWeave is regional to North America and Europe with a much smaller footprint.  

However, it's worth mentioning a few advantages CoreWeave does have, especially as more AI native applications are built out in the coming years. Notably, OpenAI uses CoreWeave for AI infrastructure with an announcement as recent as this month for a five-year $11.9 billion agreement that includes OpenAI receiving $350 million in equity.  

  • Faster training Speed and Lower Latency Inference: As discussed in the sections above, CoreWeave’s primary advantage is to offer AI infrastructure optimizations that result in speed. The CEO states they were built to be a Lamborghini, not a minivan (referring to cloud competitors).  For example, CoreWeave benchmarked for 40% improvement from the H100s to the H200s on a 70B parameter model.  
  • Access to NVIDIA GPUs: Blackwell GPUs are sold out for the next 12 months, yet CoreWeave was the first to offer GB200 NVL72 instances to the public in February. The company states in the S-1 filing they can “provide the compute capacity to customers in as little as two weeks from receipt from our OEM partners such as Dell and Super Micro.” The company was also among the first to NVIDIA H100, H200, and GH200 clusters into production at AI scale, and this positioning is unlikely to change anytime soon with Nvidia owning 6% of CoreWeave with a recent mention of the IPO in Jensen Huang’s GTC keynote.
  • In a CNBC interview, the CEO stated the following on his relationship with Nvidia: "They depend upon us to be able to build and deliver the most performant configuration of their infrastructure in the world,” he said. “They depend upon us to build it faster than anyone else. They depend upon us to find the issues within the software, within the hardware, so that we can troubleshoot it, so that it can be deployed globally” 
  • Cost-Effective: CoreWeave claims it can deliver computing power that’s 80% less expensive than legacy cloud providers. Its customer NovelAI Eren Dogan posted his testimony, “CoreWeave’s deployment architecture enables us to scale up extremely fast when there is more demand. We are able to serve requests 3X faster after migrating to CoreWeave, leading to a much better user experience saving 75% in cloud costs.”

    Another example is that although Microsoft offers NVIDIA GPUs access in Azure cloud, they charge twice as much at $98.32 per hour versus $49.24 per hour for CoreWeave. 

  • Bare Metal Servers: Unlike traditional cloud providers, CoreWeave primarily offers GPU-dense bare metal servers providing full access to GPUs, CPUs and NVLink resources. CoreWeave runs Kubernetes directly on bare metal servers, bypassing traditional infrastructure overhead, which enables users to launch computing resources in a few seconds. This means workloads are directly run on physical hardware without a hypervisor layer. This ensures up to 35X faster training, like MLPerf GPT-3 training in 11 minutes on 3,584 H100s versus 34 days with a virtualized setup.   
  • Power Constraints: Power consumption will continue to rise at a rapid clip for AI accelerators with Nvidia’s Kyber rack design for the Rubin Ultra NVL576 expected to draw 600kW, a 5x increase from Blackwell. CoreWeave is working to secure power for the next few years, including contracted power with CoreScientific for 1.3GW. power. Although the Big 3 will also be seeking power solutions, this could become problematic due to the sheer size they require, leading to regulatory tensions

Financials:

Revenue:

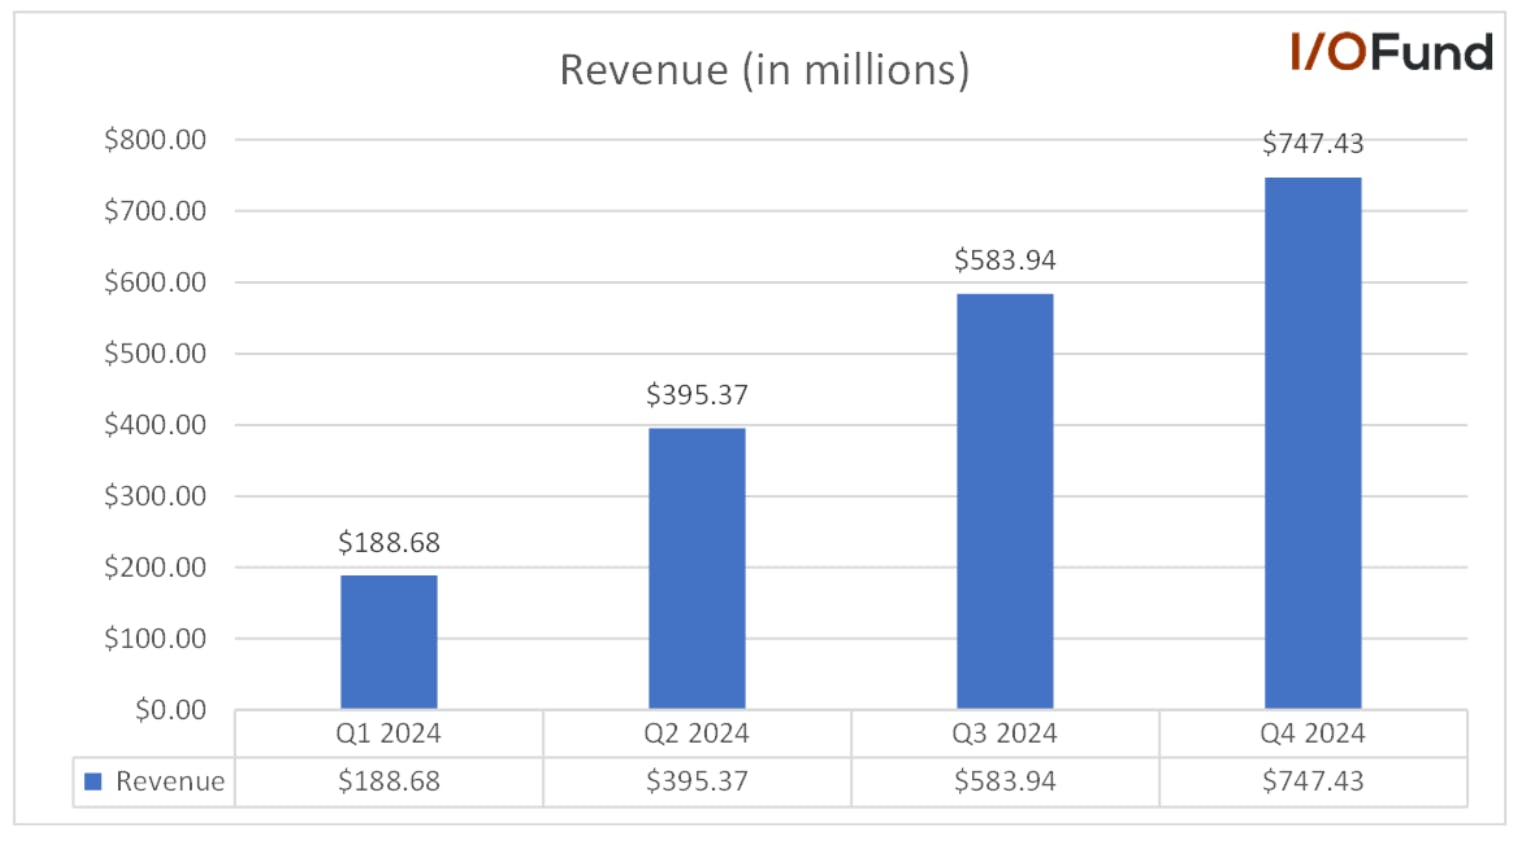
CoreWeave’s Q4 2024 revenue rose 28% QoQ to $747.43 million, driven by the increased pre-payments on its multi-year take-or-pay contracts from Microsoft, its largest customer.   

CoreWeave’s annual growth rate was 1,346% to $228.9 million in 2023 and 736.6% in 2024 to $1.92 billion.   

The company's GPU fleet has grown nearly 5x YoY, from 53,000 GPUs in 2023 to 250,000 GPUs in 2025. Active power has risen more than 35x over the past two years, from 10MW in 2022 to 360MW last year. According to Next Platform, the current price that CoreWeave charges for renting capacity for H100 GPUs could drive $13.49 billion in sales – suggesting that CW is running at 14.9% of peak capacity given its most recent revenue. 

Microsoft generated 62% or $1.48 billion of revenue in 2024. CoreWeave’s unnamed second top customer generated 15% or $288 million of revenues in 2024 revenues. The two customers generated 77% of CoreWeave’s total revenues in 2024. 

Margins: 

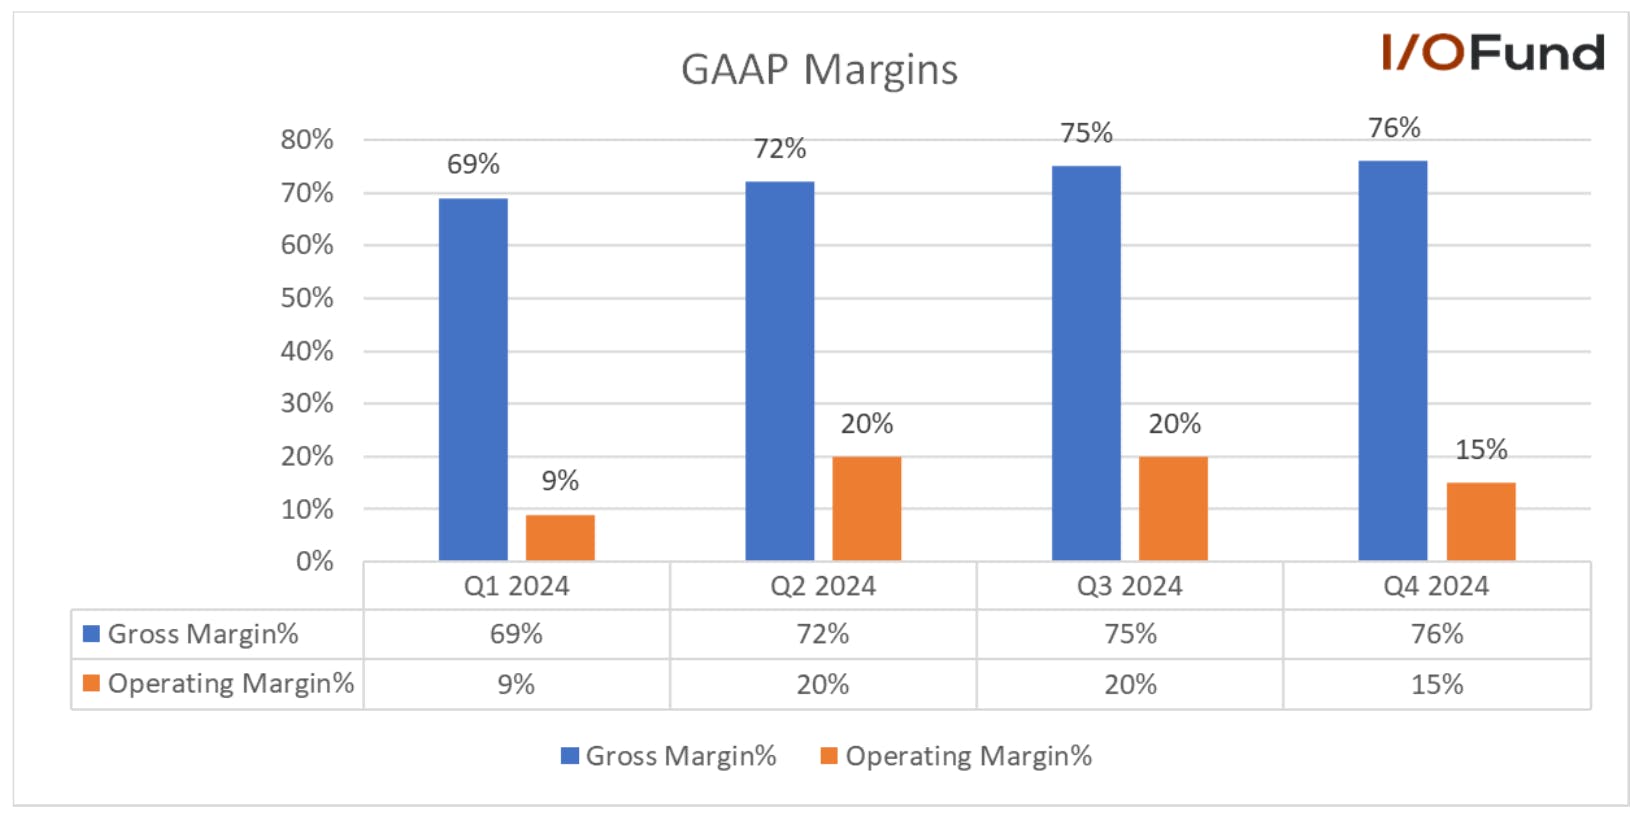
Gross margin rose to 76% in Q4 2024, improving steadily from 69% at the start of the year. Gross margin should improve as the GPUs become cash flow positive, usually in three years. Operating margin has been as low as 9% in the past four quarters and as high as 20% with a margin of 15% in the most recent quarter. 

Business Model Weighs on EPS  

The GAAP EPS was ($86.09) in 2024, while Non-GAAP EPS was ($5.96). This includes depreciation expenses of $843 million and interest expenses of $332 million.  

Notably, CoreWeave’s adjusted EBITDA margin was around 62–64% in 2024 – therefore there is operational efficiency, yet depreciation and interest have a severe impact on the bottom line. 

Business Model Weighs on Cash Flow  

Operating cash flow rose to $2.75 billion in 2024, as free cash flow fell ($5.95B), driven by infrastructure growth and compute capacity growth. Therefore, even though GPUs have grown 5X and revenue 14X, its cash flow losses have declined 3X this year and 5X the previous year. 

Digging Deeper into the Financials 

CoreWeave’s Business Model: 

CoreWeave’s business model is unique in that they offer a take-or-pay contract. Larger customers, such as Microsoft and OpenAI choose slong-term, locked-in contract where the customer pre-pays 15% to 25% of their contract value upfront. This helps to finance additional purchases of GPUs and helps to grow compute capacity. Take-or-pay contracts reserve capacity usually at a bulk price discount, up to 60% off for reserved capacity, yet for investor due diligence, they provide excellent visibility.   

Smaller customers can still opt for a pay-as-you go option. The pay-as-you-go pricing plans can range from $10.00 per hour for an 8-GPU NVIDIA L40 up to $49.24 per hour for an 8-GPU NVIDIA HGX H100 node. The Company also charges for storage on a monthly basis. 

As stated in its S-1: “The vast majority of our revenue today is from multi-year committed contracts, whereby a customer purchases access to our platform over the contract term on a take-or-pay basis. We also sell access to our platform on an on-demand basis through a pay-as-you-go model.” 

High Customer Concentration 

Customer concentration is a concern as CoreWeave collected 77% of its 2024 revenue ($1.92 billion) from two customers comprised of 62% from Microsoft ($1.25 billion) and potentially 15% from Meta Platforms ($288 million) as the second customer is not named. 

CoreWeave entered an agreement with Microsoft in 2023, of which $81 million was recognized in 2023 and $1.2 billion was recognized in 2024. However, there is risk to this stock should Microsoft continue to cancel leases or otherwise tailor its massive $80B buildout this year. For example, last month Microsoft opted not to buy an additional $12B in compute capacity – which OpenAI gladly accepted instead. However, it could be revealing a cooling off from Microsoft’s end in terms of taking all the compute capacity they can get. 

CoreWeave acknowledged this in the S-1, stating: "Any negative changes in demand from Microsoft, in Microsoft’s ability or willingness to perform under its contracts with us, in laws or regulations applicable to Microsoft or the regions in which it operates, or in our broader strategic relationship with Microsoft would adversely affect our business, operating results, financial condition, and future prospects.” 

Additionally, there have been rumors that Microsoft is canceling data center leases. Whether this is true, false, or immaterial to the bigger picture, it helps to show Wall Street’s mixed appetite for AI infrastructure as a long-term trend. In other words – it is our opinion at the I/O Fund that AI infrastructure builds have a long trajectory, whereas the Street is quite nervous about the longer-term outlook and reacts to daily/monthly data points. This must be factored in when considering CoreWeave.  

Google May Soon Become a Customer 

On April 2nd, CoreWeave saw a 16% jump on the news that Google may become a customer, which would further diversify revenue. As of now, Cohere, IBM, Meta, Microsoft, Mistral AI, and Nvidia are listed as customers.  (The stock was then down 10% due to high beta being out of favor from tariff scares – so expect immense volatility in this stock). 

CoreWeave Will Not Be Profitable for Years (if ever)

Where CoreWeave is a particularly challenging stock is the need to finance a large capex budget for its business model to continue to expand. In 2024, CoreWeave generated $1.92 billion in revenue, of which $1.48 billion came from just two customers. Its losses were ($863.45 million), a -45% net margin. 

Ultimately, undercutting hyperscalers on price will come at a cost – and is much easier to do on software than on high-priced GPUs. Unfortunately for CoreWeave, they will have to continually procure high-priced GPUs for their business model to have a competitive advantage as well as build out infrastructure and data centers.  

Cloudflare is also dubbed something similar as the “fourth hyperscaler” yet has a decades-long, successful software business to offset its capex bill. In addition, to further compare, Cloudflare has publicly discussed that they buy lower priced AMD GPUs to offset costs, whereas CoreWeave is tied to the premium prices of Nvidia.  

Useful Lifetime of AI Infrastructure a Predominant Risk 

CW has a risk around the useful lifetime of its infrastructure. Companies who own servers must depreciate these assets over a period of time. For CW, this was originally five years but is now six years: 

“Effective January 1, 2023, the Company changed its estimate of the useful life for its computing equipment utilized in data centers from five to six years, reflecting continuous advancements in hardware performance, software optimization, and data center design improvements.” 

Yet in contrast, Nvidia’s rapid product road map is making the previous generations quickly obsolete. Jensen Huang came under fire recently for saying “In a reasoning model, Blackwell is 40 times the performance of Hopper. Straight up. Pretty amazing. I said before that when Blackwell starts shipping in volume, you couldn’t give Hoppers away.” 

CNBC stated the impact would lead to H100s priced 65% lower per hour than Nvidia’s Blackwell GB200 NVL system with SemiAnalysis stating the H100 would have to rent at 98 cents per hour to match the price per output of a Blackwell rack system priced at $2.20 per hour per GPU. In 2023, H100s rented for as high as $8 but now rent for as little as $2. 

Therefore, the likelihood of the useful lifetime of the Hopper GPUs systems being six years is unrealistic (or even for five years for that matter). In fact, this is a predominant risk to many companies right now that have been stockpiling Hopper GPUs. The result across the board will be a shortened depreciation cycle, affecting the bottom line. Whereas Big Tech can take that hit on EPS, it would have a worsening effect on CW’s already-deep red bottom line. There are also additional implications to CW’s deb structure should equipment depreciate faster, as noted below. 

Digging into CoreWeave’s Debt Situation  

CoreWeave deploys an asset-backed debt financing strategy to finance the development of additional compute capacity and has raised total commitments of $12.9 billion in debt through December 31, 2024. The assets that it uses to “back” (collateral) the debt financing are NVIDIA GPUs. The Company leverages its more than 250,000 NVIDIA GPUs to secure debt financing (IE: $7.6 billion) from private equity firms like Blackstone and Magneter Capital. The debt funds more GPU acquisitions to bolster its compute capacity and scale up operations. CoreWeave ties debt to executed contracts to ensure funds match revenue-generating projects.  

However, servicing this debt comes at quite a high cost. The Company noted in its S-1 filing that it paid $941 million in principal ($588 million) and debt interest ($353 million) in 2024 and expects principal and interest payments of $3.5 billion in 2025. In fact, 32% of their cash flow is allocated to debt service.  

“For the year ended December 31, 2024, approximately 32% of our net cash provided by operating activities, before giving effect to the payment of interest, net of capitalized amounts, was dedicated to debt service, both principal and interest.”  

All of its Credit Facility's debt has variable interest rates, which could benefit if the Federal Reserve follows through with rate cuts, of which two are expected in 2025. However, CoreWeave doesn't disclose the individual interest rate across all its debt or what its loan-to-value (LTV) covenants are but does warn that its debt agreements and Credit Facilities impose restrictions and maintain specific financial covenant ratios and satisfy other financial condition tests under the credit agreements.  

Just-in-Time Funding With High Interest DDTLs   

Debt financing is performed through asset-backed delayed draw term loans (DDTLs) collateralized by CoreWeave’s GPUs. These loans are drawn upon as they build out infrastructure. The loans are repaid over time as contracted cash flows come in, which enables CoreWeave to scale rapidly without tying up excessive amounts of their own capital. They also use term loans, revolving credit facilities and equipment financing. DDTLs typically have higher interest rates (11% to 14%) than conventional bank loans to buffer the risk to lenders. However, the risk of quicker depreciation can result in potential higher debt financing to offset the shortfall.   

According to the S-1 filing, CoreWeave has two DDTLs, marked as DDTL 1.0 for $2.3 billion (fully drawn) at 14.11% secured in July 2023 and DDTL 2.0 for $7.6 billion ($3.8 billion drawn and $3.8 billion left) with a 10.53% interest rate in May 2024, along with a $650 million revolving credit facility and $1 billion loan facility and an aggregate amount of $1.3 billion in equipment financing as of December 31, 2024.  

While that covers the equipment, CoreWeave also has to pay for its data center leases and capex commitments, which include $2.2 billion in European data centers, $1.2 billion to convert a 280,000 sq foot New Jersey lab into a data center, a $5 billion joint venture with PowerHouse, Chirisa and Blue Owl to build AI/HPC data centers, $1.25 billion to launch and expand two data centers in the UK and $600 million a Virginia data center. Its largest commitment is with Core Scientific.   

As IO Fund pointed out in the Discovery article, “Core Scientific: Laying the Foundation for its Transition to AI/HPC Data Centers and 21X Growth Potential," CoreWeave committed to $3.5 billion of capex funding for its data center modifications with Core Scientific, "CoreWeave will put up the capital for the modifications and Core Scientific will credit them 50% of their hosting fees until it’s paid back fully.”   

CoreWeave signed 12-year leases with Core Scientific for up to $10.2 billion and 590 MW of critical load, which is expected to go fully online in 2027. They are also putting up the funding for the capex for the data centers and receiving 50% lease credits on most of the conversions and expansions.  

Covenants Limit Debt Financing  

The current demand and limited supply of NVIDIA GPUs are keeping resale values stable. However, that can change once supply builds up and NVIDIA moves to an annual schedule of upgrades. DDTL covenants commonly cap LTV around 70% to 80%, of which CoreWeave is likely at the 50% to 60% level. If GPUs start to depreciate faster and resale values drop, the risk is the LTV rising above the covenant caps. This would require CoreWeave to make larger payments (principal and interest) to lower the LTVs or keep them under the covenant caps, which would put more pressure on margins and cash flow.   

Existing covenants actually restrict raising additional debt, “Our existing debt agreements restrict our ability to incur additional indebtedness, including secured indebtedness, but if those restrictions are waived, or the facilities mature or are repaid, we may not be subject to such restrictions under the terms of any subsequent indebtedness.”   

Could CoreWeave be the ‘WeWork’ of AI Data Centers?

There have been rumblings about the similarity of business models for CoreWeave and WeWork when it comes to long-term lease commitments, sub-leasing, leverage and mounting losses. WeWork signed long-term office spaces for 10 to 15-year terms and then subleased them out in short-term leases to customers, funding it with $9 billion in debt and $4 billion in equity. CoreWeave similarly signed long-term 12-year leases with Core Scientific and then sub-leases the AI data center GPUs to its customers, with $12.8 billion in financing comprised of $9.9 billion in DDTL debt. Its debt crushed WeWork as its leases dried up, claiming $18.7 billion in liabilities when it filed Chapter 11 bankruptcy in November 2023.   

However, there are some very distinct differences. WeWork relied on tenants pre-committing to $15 billion of future lease obligations, but short-term leases caused cash flow to lag liabilities. CoreWeave collects 96% of its revenue from take-or-pay multi-year contracts, which will provide revenue visibility with $15.1 billion of remaining performance obligations (RPOs).  

WeWork was locked into $16 billion in lease liabilities that crashed its liquidity when the COVID-19 pandemic emerged, causing an office space glut. CoreWeave is a benefactor of the AI revolution and global GPU shortage for now. CoreWeave's take-or-pay contracts are locked in and guarantee cash flow, unlike WeWork's easy-to-cancel leases. CoreWeave owns assets, including over 250,000 GPUs; WeWork didn't own real estate, just the obligations.  

Founders Sold $500 Million of Stock Before the IPO

CoreWeave has an unusual history to where the company began as an Ethereum crypto mining venture called Atlantic Crypto. The “springboard” moment came from partnering with EleutherAI, who needed CoreWeave’s large inventory of GPUs to train models.  

According to the S-1 filing, CoreWeave's co-founders have already cashed out $500 million of Class A shares in a secondary in late 2024. They still retain 30% ownership. However, Class B shares 10X voting power means they still have 82% of the voting power. CEO and co-founder Michael Intrator has 38% of the total voting power. Its DDTL financier Magnetar is the largest shareholder with nearly 35% stake in the Company. Fidelity is the second largest shareholder with 8%. 

Conclusion:

CoreWeave is a high risk, high reward company. The swings this stock will see off incoming new customers or increased orders for GPU usage will cause the stock to surge, and subsequently, any broad market weakness or doubts within the AI narrative will cause the stock to disproportionately drop.  

CoreWeave’s business model is odd at best. Even if you can offer more optimized AI infrastructure, the economics may not work out in the long-term. This is evidenced by having to collaterize debt with GPUs, being in the bleeding red from a large capex budget that is causing outsized interest, etc. 

CRWV promises to be thrilling, although there are surely easier and higher-quality choices (assuming you are reading this as an investor and not a day trader). For example, as far as high-risk business models go, Core Scientific is a key enabler of CoreWeave’s expansion and is a stronger choice for our purposes.  

Regardless, CoreWeave is in the middle of the AI action and this company will dominate the headlines at times – so investors should be prepared to feel FOMO when the market stabilizes, and to decide in advance if this stock meets your risk profile or not.

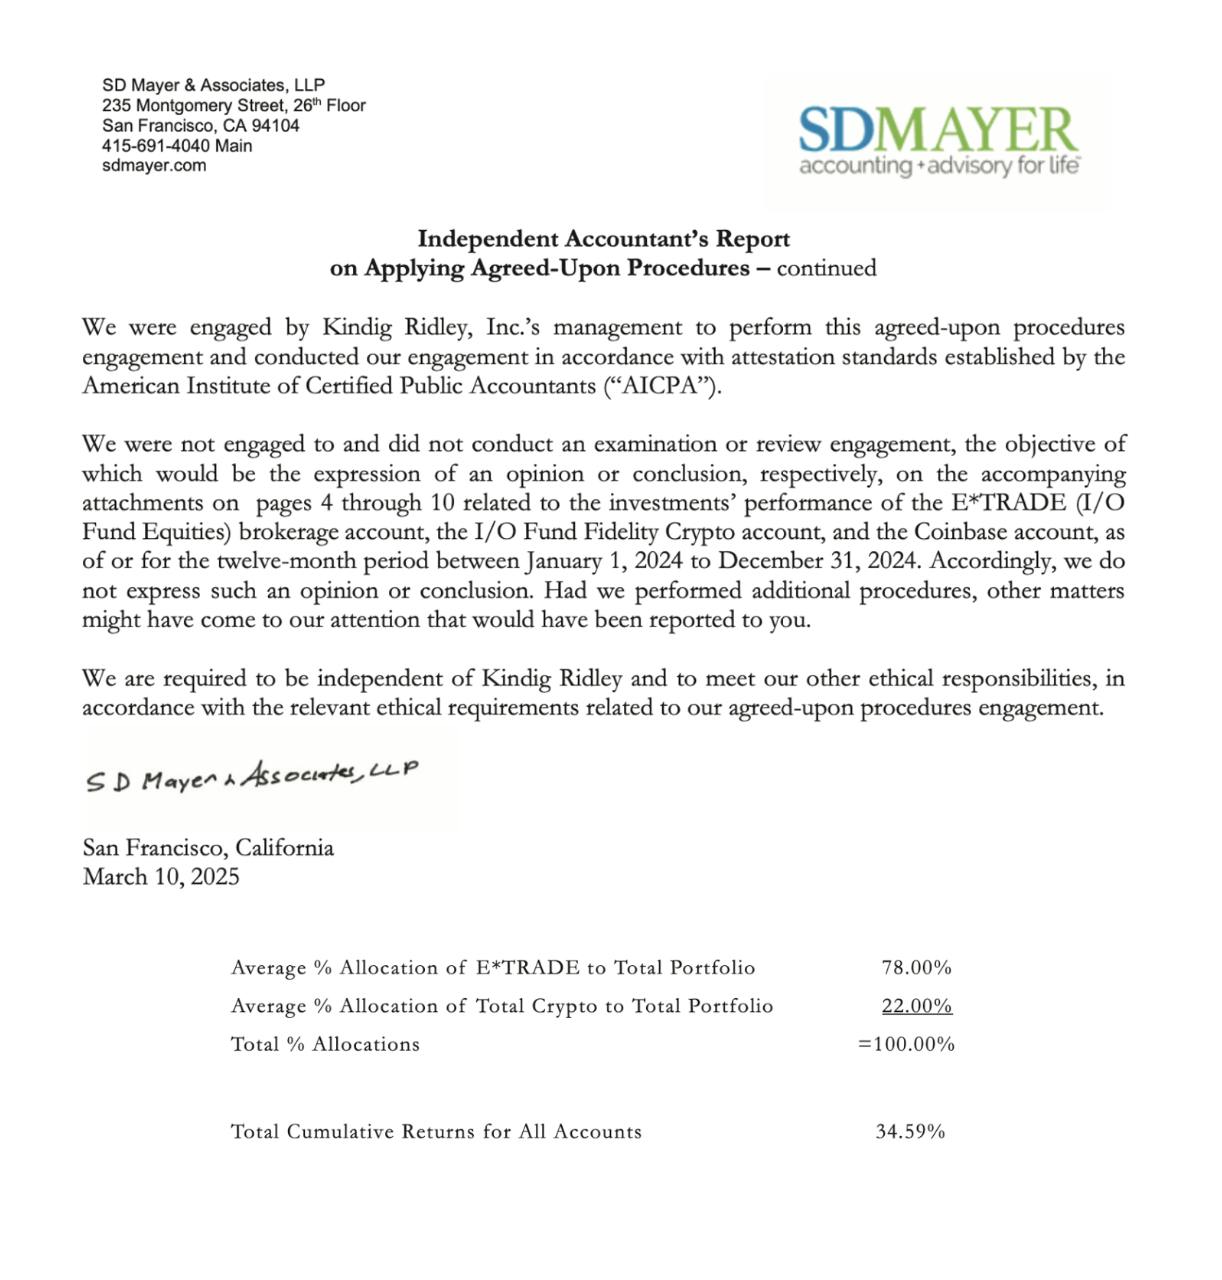
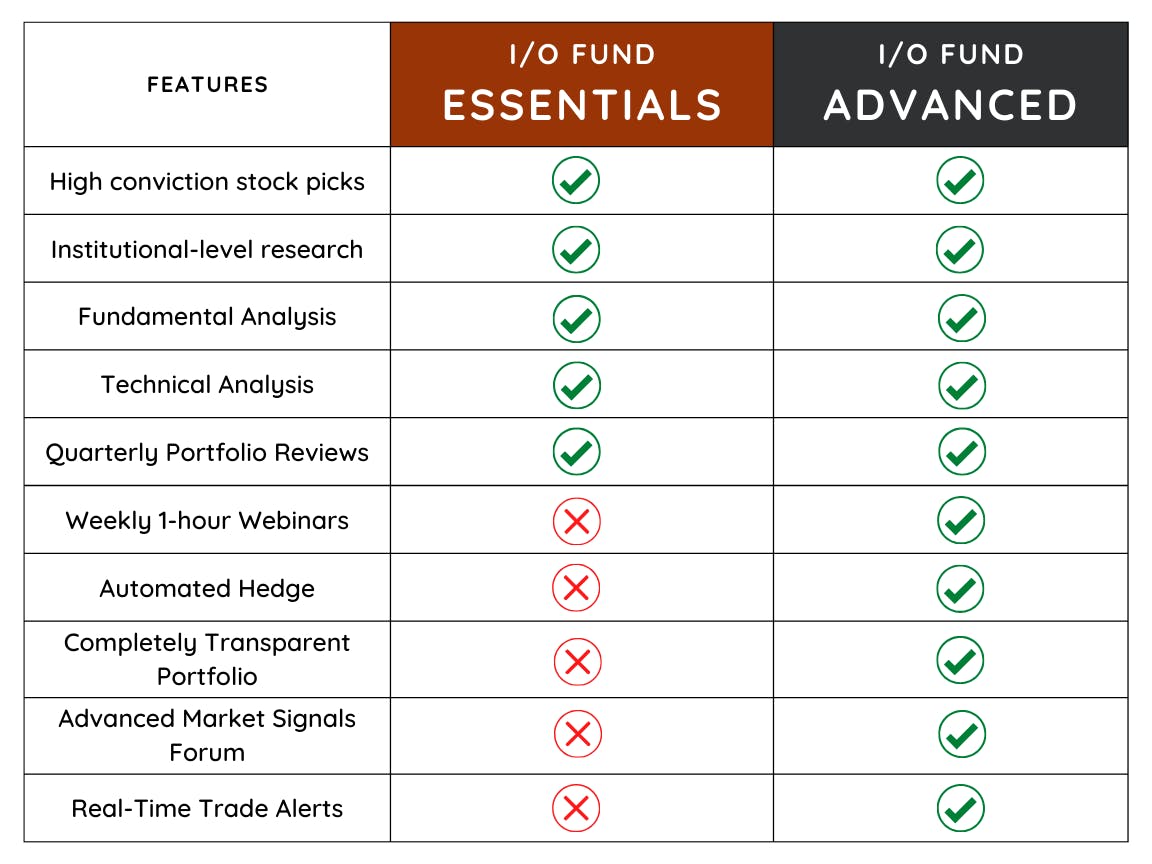
Every Thursday at 4:30 pm Eastern, the I/O Fund team holds a webinar for premium members to discuss how to navigate the broad market, as well as various stock and crypto entries and exits. Beth Kindig offers weekly deep dives including lesser-known cryptocurrencies and AI stocks, plus the team offers trade alerts. 📈 The I/O Fund team is one of the only audited portfolios available to individual investors. If you’d like to subscribe to the Advanced Market Signals plan, email us at premium@io-fund.com.

Please note: The I/O Fund conducts research and draws conclusions for the Fund’s positions. We then share that information with our readers. This is not a guarantee of a stock’s performance. Please consult your personal financial advisor before buying any stock in the companies mentioned in this analysis.

Recommended Reading:
Oracle Stock Outlook: Revenue Could Double by FY2029, yet Targets Seem Lofty

Late last year, Oracle outlined an ambitious plan to nearly double its revenue by fiscal 2029, forecasting sales of $104 billion that year. Oracle is aiming to capture growing enterprise AI spending in the cloud, separating itself from its hyperscale competitors with its ability to offer lower-cost AI compute via lower latency, multi-cloud AI flexibility, and AI vector search capabilities.

Additionally, Oracle is a key player in Stargate alongside OpenAI, SoftBank, and other partners, with its selection proving that, despite heightened competition from much larger cloud providers, Oracle Cloud has the capability to meet the large data, scale and performance demands for future AI workloads. Assuming high-single digit to low-double digit share of database and enterprise software spending, Stargate could represent tens of billions in revenue to Oracle with the project seeing a maximum investment of up to $500 billion over the next four years. The first phase is already underway with Oracle and OpenAI working to deploy 64,000 Nvidia GB200 GPUs at a large-scale facility in Texas.

However, Oracle is already on track to miss Cloud revenue targets for this fiscal year ending in May. Management also provided an optimistic forecast that would require Cloud revenue to nearly triple by FY29, and grow at almost a 30% CAGR, setting a high bar that includes execution risk with strong competition in AWS, Azure, and Google Cloud.

Unique AI Offerings Support Oracle’s AI Growth

Oracle’s ability to drive lower latency and high performance is one of the main reasons enterprises use Oracle for AI, as it allows enterprise customers to run demanding AI workloads faster and at a lower cost.

RDMA (Remote Direct Memory Access) is helping to drive Oracle’s AI story by enabling direct memory access between servers without utilizing CPUs, resulting in low-latency, high-bandwidth performance. Bypassing the CPU greatly accelerates data transfer rates, a necessity for large AI workloads requiring massive compute.

RDMA is integral to Oracle Cloud Infrastructure as the backbone of Oracle’s Gen2 Cloud and increasingly large Superclusters for AI training and inference, allowing ultrafast, near real-time performance. Oracle says that it can offer less than 10 microseconds of latency between nodes, improving efficiency.

With less overhead and fewer CPU cycles, RDMA helps Oracle offer its AI clusters at a lower cost: Oracle says it “consistently charges less than Amazon Web Services (AWS) for the equivalent compute capacity.”

Oracle offers the widest range of bare metal GPU instances among major cloud providers, and scalability at any size up to 65,536 Hopper GPU clusters and 131,072 B200 GPU clusters, which are expected to come online in 2025. Oracle also offers very flexible VM instances, letting customers pay for only the capacity they need as they need it for any size workload, rather than offering fixed instance sizes.

Chart showing Oracle's range of GPU clusters, from small-scale 3,840 GPU cluster to 131,072 GPU supercluster.

Oracle provides a wide range of AI clusters for small, medium and large-scale AI training. Source: OracleOracle

Oracle’s AI vector capabilities also stand out given Oracle’s database roots, offering native AI vector search capabilities with seamless integration to leading AI models from OpenAI, xAI, Meta, Cohere and more. AI vector search lets enterprises search both structured and unstructured data in a variety of manners, enabling intelligent, relevant and accurate AI responses utilizing their data. Oracle noted in Q3 that its Oracle Database 23ai can convert data into any vector format to be understood by an AI model of choice, facilitating AI training and inference on private data in Oracle Database.  

Oracle Bets Big on Future Revenue Growth; Yet Lacks History of Meeting Targets

Oracle’s executives exuded confidence in meeting ambitious long-term revenue targets, underscored by AI and multi-cloud momentum — yet analysts aren’t so sure, with consensus estimates that are considerably lower than guidance offered during the recent earnings call.

In fiscal Q3 2025 (Oracle’s most recent quarter), management reaffirmed that confidence in reaching the $66 billion target for FY 2026 was now “stronger than ever,” while they also guided for 20% YoY growth in revenue in FY 2027, faster than previously expected. This would imply revenue of approximately $79.2 billion.

This builds upon management’s comments from Q2 that they believe they “now have a clear light of sight to our future revenue growth,” with total cloud infrastructure (IaaS) revenue in FY25 expected to grow faster than the 50% reported in FY24 and accelerate further in FY26.

Putting this in perspective, Oracle is betting on a major revenue growth acceleration driven primarily by growth in AI and cloud.

Reaching management’s optimistic $104 billion target in FY29 would require revenue growth at a 14.45% CAGR from FY24’s $52.96 billion. This is more than double the 6.03% CAGR that Oracle reported from FY19’s $39.51 billion in revenue through FY24, relying on strong, consistent AI and cloud growth to achieve these targets.

Here’s an annual breakdown of the preliminary growth guided through FY27 and what level of growth would be needed to achieve FY29’s forecast:

Graph of Oracle stock's revenue growth from FY19 and projected to FY29 to reach management's $104 billion revenue target.

Oracle is targeting double-digit revenue growth from FY26 to FY29 to reach its $104 billion revenue target. Source: I/O Fund

Revenue growth would need to hit both the 15% growth and 20% growth targets in the next two fiscal years, and remain in the mid-to-high teens for FY28 and FY29 – such as 16.5% growth in FY28 and 13.3% growth in FY29.

Compare this to the prior comparable period from FY19 to FY24: Oracle reported only one year with revenue growth in the double-digit range, and just 6% in FY24 with less than 8% growth expected in FY25.

It would represent a rather unprecedented acceleration for Oracle and a monumental feat to drive a 12 point revenue acceleration in two years and maintain double-digit growth thereafter at a larger scale.

Analysts Remian Dubious of Oracle’s Growth Potential

Despite management’s confidence in achieving its growth targets in FY26 and FY27, analysts remain dubious over Oracle’s ability to hit these numbers successfully, considering the company has missed revenue estimates in both the last two quarters and in six out of the last seven.

Analysts are currently projecting Oracle to fall short of targets in FY26, FY27 and FY29, implying that they do not share the same level of confidence in future growth as management.

Graph of Oracle stock's revenue growth guidance for FY26 and FY27 and projections through FY29, versus analyst estimates.

Analysts are projecting Oracle’s revenue to fall short of management’s forecasts for FY26, FY27 and the long-term FY29 target. Source: I/O Fund

  • For FY26, analysts estimate Oracle will report 14.2% growth to $65.2 billion in revenue, falling short of both the stated 15% growth and $66 billion revenue target.
  • For FY27, analysts estimate Oracle will report 18.2% growth to $77.0 billion in revenue, which would be nearly 2 points and $2 billion shy of what management is forecasting.
  • By FY29, analysts estimate Oracle will report 13.3% growth to $100.5 billion in revenue, or about 3.4% shy of management’s long-term forecast.

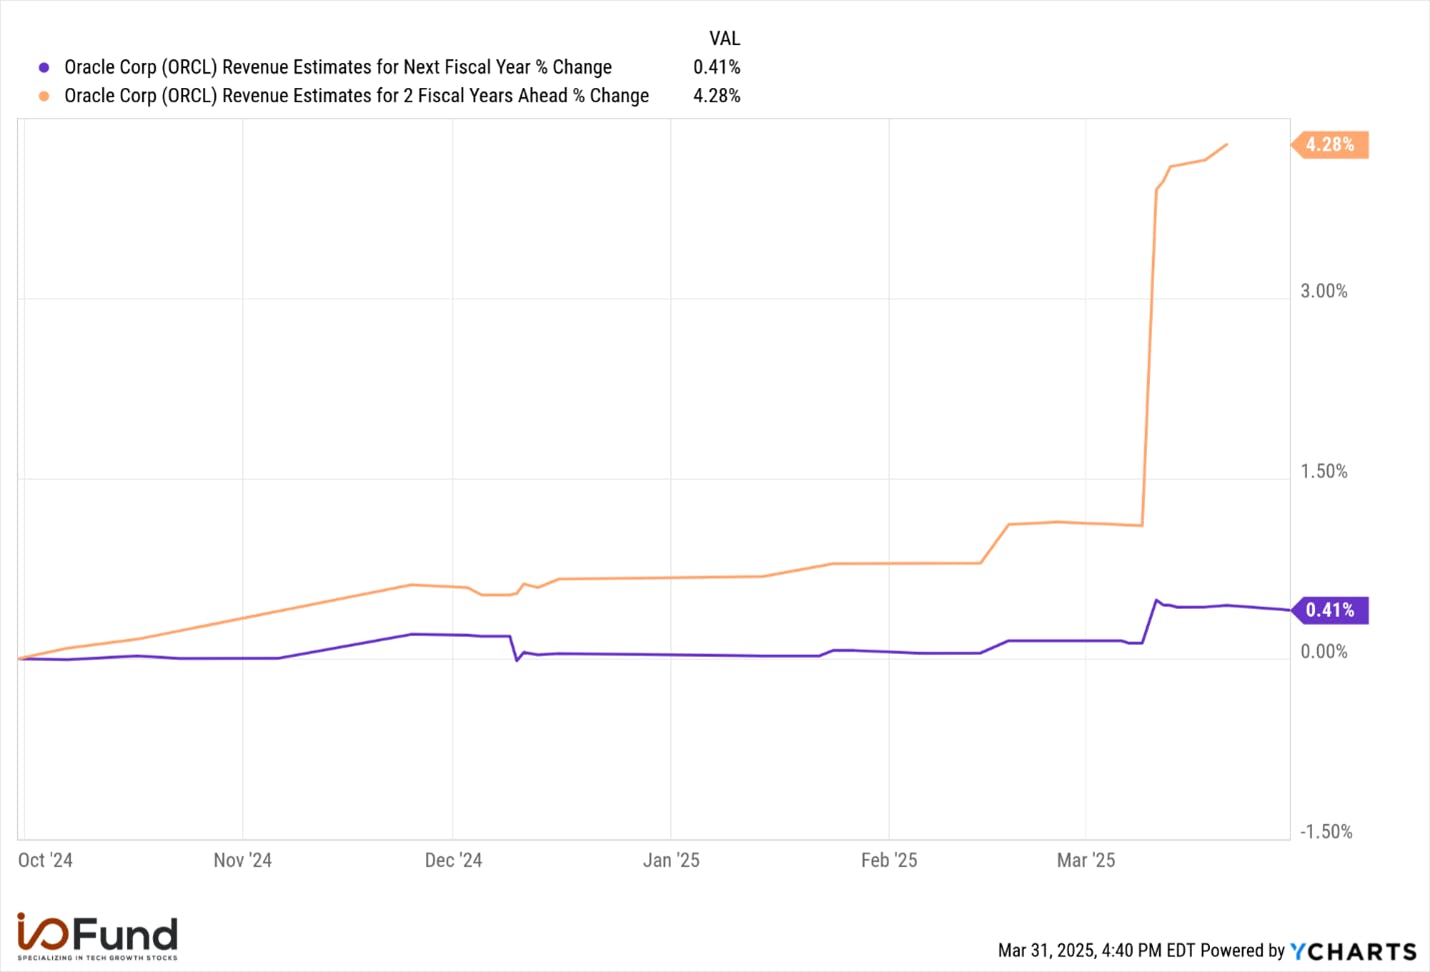
There has been little change in FY26’s revenue estimate over the past six months, being revised just 0.4% higher. However, FY27’s revenue estimate has been revised nearly 4.3% higher to that $77.0 billion, yet it still remains more than $2 billion below where Oracle’s 20% guidance implies.

Graph showing change in Oracle stock revenue estimates for FY26 and FY27

Analyst estimates for Oracle’s FY26 and FY27 revenue have been quite consistent over the past six months. Source: YChartsYCharts

This consistent shortfall for revenue growth and doubts over Oracle’s ability to reach its stated targets likely stems from Oracle’s inability to reach its near-term targets, including its $25 billion cloud revenue target for FY25.

The I/O Fund specializes in covering lesser-known AI stocks on our research site with trade alerts and weekly webinars. Learn more here.The I/O Fund specializes in covering lesser-known AI stocks on our research site with trade alerts and weekly webinars. Learn more here.

Oracle Falls Short of $25B Cloud Revenue Target for FY25

In fiscal Q2 2025, Oracle CEO Safra Catz said that Oracle was expecting its Cloud revenue to reach $25 billion for the full fiscal year. As of Q3, Oracle is firmly on track to miss that target.

Oracle reported $6.2 billion in Cloud revenue in Q3, up 25% YoY, bringing its YTD Cloud revenue up to approximately $17.7 billion. For Q4, Oracle guided for 26% to 28% YoY growth for Cloud revenue, implying revenue between $6.68 billion to $6.78 billion, or $6.73 billion at midpoint.

This would place FY25 Cloud revenue at $24.38 billion to $24.48 billion, or $520 million to $620 million short of its goal. Not only is Oracle at risk of missing this target, but it also is running close to falling short of its 50% growth goal for Cloud Infrastructure revenue.

However, Oracle is planning on having Nvidia GB200-based servers generally available in April 2025, and if there is high demand for the new upgraded system, it could serve as a tailwind for IaaS growth in fiscal Q4 as these were not available in Q3.

Oracle Aims for Cloud Infrastructure Growth Above 50%

Oracle’s Cloud Infrastructure (IaaS) business has been a strong driver for Cloud growth, outpacing Cloud revenue growth by at least 22 points for nine consecutive quarters, rapidly expanding its share of Cloud revenue to 44% from just 29% two years ago.

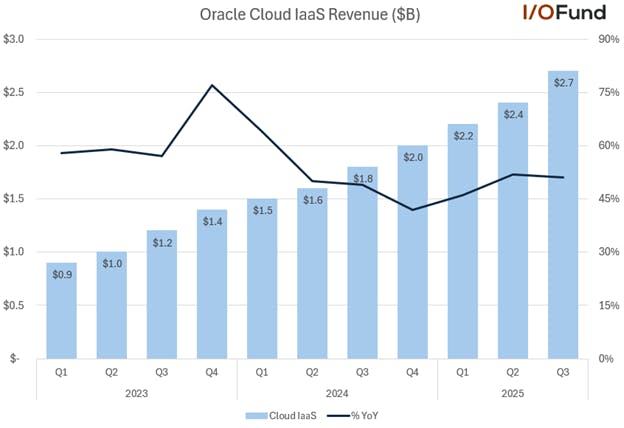
Cloud IaaS revenue also surpassed a $10 billion run rate in Q3, while growing at >50% the last two quarters. Cloud IaaS is an important element in Oracle’s $25 billion target, in that at least 40% of said revenue will be coming from Cloud IaaS.

Graph of Oracle's Cloud IaaS revenue showing consistent growth to surpass $10 billion run rate in Q3.

Oracle’s Cloud IaaS revenue has grown consistently over the past 2.5 years to surpass a $10 billion run rate in Q3. Source: I/O Fund

IaaS’ performance has been driven by the strength of Oracle’s AI offerings. Growth reaccelerated 6 points sequentially in Q2 to 52% YoY, driven by AI, though it dipped slightly to 51% YoY in Q3.

In Q3, Oracle noted that demand was at “record levels”, that GPU consumption for AI training had increased 244% in the last 12 months, and that the company was seeing “enormous demand” for AI inference. Chairman Larry Ellison added that “AI training and multi-cloud database are experiencing hyper growth.” This follows Q2’s 336% increase in GPU consumption for AI training and “record level AI demand.”

Despite these triple-digit points and strong growth commentary, Cloud IaaS revenue’s growth has been quite small sequentially. Q3 saw the highest sequential growth at ~$300 million QoQ, or ~12.5%.

To meet management’s “faster than 50%” growth target for FY25, Q4 would need to match that QoQ revenue increase of at least $300 million; this would place IaaS revenue at $10.3 billion, or up 51.5% YoY from $6.8 billion in FY24. Should the segment return to recent historical trends of rising $200 million sequentially, Oracle would be running extremely close to reporting growth below 50% for the full year.

While demand remains strong and “continues to outstrip supply”, as management puts it, component delays are likely a factor in seeing limited QoQ growth in FY25 despite these extraordinary AI growth figures, as these delays are not expected to ease until Q1 FY26 (likely due to Nvidia’s Blackwell system timing).

Oracle has stated that component delays have “slowed cloud capacity expansion this year,” and expects these to resolve in FY26, easing a primary bottleneck to IaaS growth.  The I/O Fund discussed how Nvidia suppliers were foreshadowing delays in the most recent earnings reports. With IaaS expected to accelerate further from >50% in FY25, the segment could grow to close to $16 billion, or at least $5.5 billion higher than FY25’s projected ~$10.3 billion.

Should IaaS account for ~50% of Cloud revenue for FY26, that would imply Cloud revenue of $32 billion, or an 8 point acceleration to 31% YoY growth from FY25’s Q4-guide-implied $24.4 billion. This is likely what Oracle would need to achieve its $66 billion target, assuming this growth means Cloud grows its revenue share by mid-single digits YoY.

63% Growth in Remaining Performance Obligations

While challenges remain for FY25 with Oracle at risk of missing its $25 billion Cloud revenue target, 2026 is more optimistic, with IaaS promising to add multiple billions in revenue and RPO suggesting the segment could see a strong acceleration.

RPO rose 63% YoY to $130 billion in Q3, compared to 50% YoY growth to $97.3 billion in Q3, a nearly $33 billion QoQ increase. This was driven by record deal activity with $48 billion in signed contracts. Chairman Larry Ellison chalked this up to Oracle’s ability to provide a more cost-effective AI solution to customers: “it really is a technology advantage we have over them. If you run faster and you pay by the hour, you cost less. So that technology advantage translates to an economic advantage, which allows us to win a lot of these huge deals.”

Additionally, Cloud RPO accelerated 10 points to 90% YoY, representing 80% of total RPO, up from 75% last quarter. This places Cloud RPO at around $104 billion, up from nearly $73 billion last quarter. Management said that while the growth in RPO is evidence that the AI training business continues to grow, AI inferencing and database demand also factored into the RPO growth.

RPO continuing to outpace Cloud and IaaS growth bodes well for Oracle’s forecasted revenue acceleration in FY26, and signals strong underlying demand trends with Cloud RPO nearly doubling. 31% of total RPO is expected to be recognized over the next twelve months, or ~$40.3 billion, up 7% from $37.6 billion at the start of FY25.

Oracle noted that this RPO figure did not include any contributions from Stargate yet, which promises a large potential opportunity given the initial commitment of $100 billion up to $500 billion total for the project. Management expects the “first large Stargate contract fairly soon,” though it’s hard to put an exact figure on what management defines as large.

Oracle Continues to Quickly Add Capacity

Oracle is quickly adding data center capacity due to this growth in RPO, with management commenting that they expect to double data center capacity this year to meet the high demand they see from this RPO and additional opportunities from Stargate. Capex is also on track to exit the year at a meaningfully higher rate than expected as Oracle accelerates build-outs.

Oracle noted in Q3 that they “expect fiscal year 2025 CapEx will be a little more than double what it was last year at around $16 billion.” A year ago in Q3 2024, management laid out preliminary capex of $10 billion, which at the time was expected to go towards 100 new data centers and expansions at 66 existing facilities.

This is quickly flowing to the data center, with CEO Safra Catz explaining that Oracle expects its “available power capacity will double this calendar year and triple by the end of next fiscal year” (by mid-2027). Catz added that Oracle’s “live data center count and power capacity is the leading indicator of the conversion of RPO to revenue,” suggesting that Oracle is working to significantly increase capex to quickly translate this surge in RPO to  reported revenue, to meet growth acceleration targets.

To note, this rapid acceleration in capex is negatively impacting cash flows. Oracle generated $11.8 billion in free cash flow in fiscal 2024, but reported negative free cash flow of ($2.66 billion) in Q4 and just $70 million in Q3. On a TTM basis, free cash flow was just $5.82 billion as of Q3, down (53%) YoY, as accelerated capex is far outweighing limited growth in operating cash flow.

Oracle Cloud at Smaller Scale than Peers

Oracle seemed to have taken a slight dig at Microsoft, Amazon and Google in Q3, its hyperscale partners and competitors, stating that Oracle Cloud IaaS revenue grew at “a much higher growth rate than any of our hyperscaler competitors.”

However, this growth is coming off a much smaller scale, considering that Oracle is using IaaS revenue as the comparison – to recap, that’s at a $10.6 billion annualized rate, or ~$2.65 billion in Q3.

Google Cloud, the smallest of the hyperscalers’ clouds, reported 30% YoY growth in revenue to $12.0 billion in Q4. For the full year, Google Cloud revenue grew nearly 31% YoY to $43.2 billion.

Microsoft’s Intelligent Cloud revenue increased 19% to $25.5 billion in its fiscal Q2, with Azure revenue growing 31% YoY. Microsoft’s AI run rate reached $13 billion, up 175% YoY, or 30% higher than Oracle’s entire IaaS segment and half of its entire Cloud segment.

AWS reported 19% growth to $28.8 billion in revenue in Q4, and 19% growth to $107.6 billion for 2024. Put this way, AWS is generating more revenue in one quarter than Oracle’s Cloud is in one year. AWS also generated more than 1.6x Oracle’s Cloud revenue in operating income.

Oracle is by no means operating at the same level as its customers, with Microsoft’s AI run rate dwarfing Oracle’s IaaS business while growing well into the triple-digits. Cloud to Cloud, Oracle is lagging Google’s growth, the smallest of the three hyperscalers, by 5 points in the most recent quarter while at half the scale.

Reaching FY29’s Target Likely Requires Prolonged Cloud Acceleration

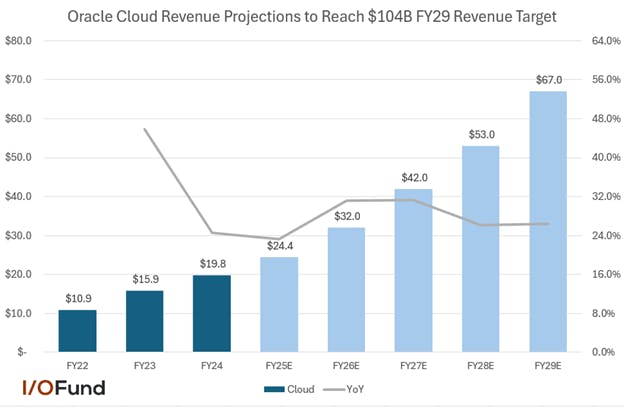
Outside of Cloud, Oracle’s other businesses – licensing, hardware, services – have seen minimal growth over the past few years, generating revenue of $31.5 billion in FY22 and $33.2 billion in FY24. Assuming growth at a 3% CAGR through FY29, ex-Cloud revenue would project to approximately $37 billion, meaning Oracle’s Cloud segment would need to reach $67 billion by FY29 to reach that $104 billion forecast.

This would equate to a nearly 29% CAGR from ~$24.4 billion in FY25 to reach $67 billion, or on an annual basis, 31% growth in FY26 and FY27, followed by 26% growth in both FY28 and FY29.

Here’s what this would look like:

Graph of Oracle stock's Cloud revenue growth needed to possibly reach $104 billion FY29 target.

Oracle’s Cloud segment would need to grow at a 29% CAGR from FY25 to hit $67 billion, a likely threshold for it to reach the $104 billion target. Source: I/O Fund

Conclusion

Projecting 30% growth for multiple years does not account for execution risk as AI is still quite early. While there are large competitors such as AWS, Azure and Google Cloud, there are also neocloud competitors, such as CoreWeave, that are shaking up the cloud IaaS market with GPU-as-a-service. These neoclouds are entirely optimized for AI, able to capture a higher rate FLOPs utilization (MFUs) — a metric that is quite important when considering time to market for AI models. My firm recently covered CoreWeave’s IPO for our premium members here.

Stargate will certainly provide a tailwind to Cloud revenue through FY29 should the maximum of $500 billion in investments materialize. Prior estimates from IDC place database and enterprise software spending at a high-single digit share of overall infrastructure spending. This could ultimately represent tens of billions in long-term revenue to Oracle that will complement existing growth in Cloud.

However, analysts do not share the same confidence in Oracle’s ability to meet its long-term targets, with consistent revenue misses in six of the past seven quarters; additionally, it is  already falling behind its $25 billion Cloud revenue target for FY25 after just one quarter.

The I/O Fund is ultimately passing on Oracle and we are instead accumulating small and mid-cap positions that are better poised to benefit from the ongoing AI spending war. Premium and Advanced members receive real-time trade alerts and technical setups in our weekly webinars. Learn more here.

Disclaimer: The I/O Fund conducts research and draws conclusions for the company’s portfolio. We then share that information with our readers and offer real-time trade notifications. This is not a guarantee of a stock’s performance and it is not financial advice. Please consult your personal financial advisor before buying any stock in the companies mentioned in this analysis.

Recommended Reading:
Core Scientific: Hypergrowth with 21X AI Segment Growth Potential

  • Core Scientific is a major Bitcoin miner leading the transition to high-performance compute (HPC) data centers with 1.3 GW of contracted powered infrastructure.
  • The Company signed 12-year hosting deals with AI Hyperscaler CoreWeave to provide 590 MW of HPC infrastructure valued at up to $10.2 billion.
  • CoreWeave will front the $750+ million in capex funds to modify Core Scientific’s data centers as an anchor client.
  • Core Scientific’s HPC hosting revenues could surge 21X per quarter when the full 590 MW of critical load go online in 2027.
  • ROTH MKM expects Core Scientific to reach a $1.58 billion run rate by 2027. 
  • The I/O Fund will be holding a very tight stop on any position we initiate, and the stock will be for Advanced Market Signals only, indicating it qualifies for more advanced investors who are comfortable trading daily/weekly.
  • This analysis originated as a Discovery idea, yet Knox sees a setup he may pursue in the coming weeks. Join his webinar this Thursday at 4:30 pm EST to learn more.

Core Scientific (NASDAQ: CORZ) is a digital infrastructure company that operates bitcoin mining and hosting services, and high-performance compute (HPC) hosting services through its nine purpose-built data centers. As one of the largest Bitcoin miners in North America, operating 171,000 mining rigs (164,000 owned), the Company is positioning itself for significant growth in the AI space.

Its strategic shift to high-performance computing (HPC) hosting is particularly compelling, allowing it to mitigate Bitcoin’s volatility while capitalizing on the surging demand for AI data centers. By securing high-margin HPC hosting contracts, the company is poised to tap into one of the most lucrative and rapidly growing markets in technology. While other Bitcoin miners are starting to catch on, attempting to transition to AI data centers, Core Scientific has a clear first mover advantage reinforced by lucrative multi-billion dollar 12-year contracts with upside revenue potential of $10.2 billion with AI hyperscaler CoreWeave with a trajectory aimed at generating 21X HPC hosting revenue growth in 2027.

Core Scientific’s Value Proposition for HPC Hosting Customers

Core Scientific provides many attractive value propositions to hyperscalers:

  • Specialized Power Infrastructure: HPC customers require more power than conventional data centers can offer. AI and HPC workloads require 6 to 10 times more electricity to operate. Traditional data centers are accustomed to single racks consuming 10 to 15 kW of power. Current AI racks push 80 KW as they will soon draw 120 kW to 150 kW in the next generations, with 200 kW within several years. Core Scientific has the existing infrastructure with nearly 900 MW of capacity for HPC hosting in addition to the 400 MW for Bitcoin mining capacity.
  • Scalable HPC Infrastructure: They are actively transitioning their facilities to cater specifically to AI workloads with infrastructure optimized for machine learning and deep learning applications. Its Denton, Texas, facility is undergoing a $6.1 billion expansion, boosting its MW capacity by 97 MW to 394 MW with 47 more acres to 78 acres to host one of North America's largest GPU supercomputers for AI computing. It's being converted entirely for HPC hosting.
  • Location: Core Scientific operates 9 Application Specific Data Centers strategically located near major internet hubs in Georgia, Kentucky, North Dakota, North Carolina, Oklahoma, Alabama and three in Texas. Its new leased (with an option to buy) site in Alabama offers 11 MW of critical IT load and is scalable up to 66 MW of critical IT load, which Core Scientific is in discussions with potential new clients to contract for HPC hosting. They are developing a state-of-the-art 100 MW data center in Muskogee, Oklahoma.
  • Maintenance and Repair: Offering 24/7 around-the-clock monitoring, support and maintenance, Core Scientific is one of the largest application-specific integrated chips (ASIC) repair centers in North America, servicing their own and customer’s fleet of 171,000 bitcoin mining rigs. Parlaying from ASICs, they plan on using their expertise and manpower to replicate it and expand their offering on the GPU side.

CoreWeave: An Early Believer in the Core Logic’s HPC Transition

CoreWeave is an NVIDIA-backed AI Hyperscaler, providing AI cloud services by offering GPU clusters for HPC and AI workloads. CoreWeave is a specialized cloud provider offering an optimized platform for GPU-intensive tasks. They build and operate their own data centers equipped with a massive scale of over 300,000 Nvidia GPUs. They currently have 28 operational data centers and plan to open 10 new data centers in 2025, leasing a significant portion of their capacity with Core Scientific.

On March 6, 2024, Core Scientific announced an initial long-term deal with anchor customer CoreWeave to provide up to 16 MW of data center infrastructure for their HPC and AI workloads at their tier 3 data center in Austin, Texas. This helps to substantiate the pivot from Bitcoin mining to offering AI/HPC infrastructure, stating a “strategy shift” to AI may be good for a temporary stock price spike, but actually signing up customers is another story.

CoreWeave was already a GPU hosting client from 2019 to 2022, hosting thousands of GPUs. Despite the potential value of the March 6 deal being worth up to $100 million, it didn’t move the needle much for the stock price, which still traded under $4.00, selling off to $2.95 the following week.

CoreWeave Ups the Ante and Fronts the Capex Funds in $3.5 Billion Deal

Core Scientific was successful in delivering 16 MW of capacity more than 30 days ahead of schedule at its Austin, Texas, data center. This prompted more deals. On June 3, 2024, CoreWeave signed several 12-year contract deals securing 200 MW of infrastructure to host CoreWeave’s NVDA GPUs. Additionally, CoreWeave will fully fund (not pay for) the capital investments (capex), estimated around $300 million, required to modify Core Scientific’s “existing infrastructure into cutting-edge application-specific data centers customized for dense HPC." CoreWeave will put up the capital for the modifications and Core Scientific will credit them 50% of their hosting fees until it’s paid back fully.

Regarding CoreWeave paying for the capex, here is what was stated on the call:

“Yes. Thanks, Brett. I mean really, the difference in the CoreWeave deal is 100% funding of the CapEx. They were able to significantly buy down their rates. And I think as we look forward, what we're seeing for 2025 is frankly rather unique. If you're able to deliver capacity in 2025 and 2026 right now — we're definitely seeing those lease rates be much higher than we expected, especially given that many of these folks are willing to cover some portion of the CapEx of the build-out. So we're excited about where lease rates are going, and we believe we'll be able to extract a significant amount of value from the demand that we're currently seeing over the next few years.”

CoreWeave Contracts a Total of 502 MW Generating $8.7 Billion Over 12 Years

Once the 200 MW of HPC is operational Core Scientific estimates they’ll receive around $290 million annually or more than $3.5 billion during the initial 12-years terms of the contracts. CoreWeave exercised its options and signed for an additional 70 MW on June 25, 2024, and $105 million of capex funding, equating to an additional $1.23 billion for Core Scientific during its 12-year term. In August 2024, CoreWeave signed another 112 MW contract beginning in 2026.

In October 2024, CoreWeave exercised the rest of its options and signed another 120 MW hosting contract for 12 years for a total of a full 502 MW of critical IT load with a total revenue potential of $8.7 billion over the 12-year terms of its contracts. The average annual run rate is $725 million. HPC hosting revenues are expected to start flowing in 2025 with 200 MW delivered by the end of 1H 2025, up to 270 MW delivered by the end of 2H 2025, up to 382 MW by the end of 1H 2026 and up to 500 MW by the end of 2H 2026. CoreWeave is expected to fund capex costs of $750 million, which Core Scientific will credit 50% of the hosting fees until fully repaid.

CoreWeave: Providing 250,000+ NVIDIA GPU-powered AI Infrastructure For Lease

As Core Scientific’s largest anchor customer, it’s important to take a look into this client. Core Scientific is a direct benefactor of CoreWeave’s success. What’s good for CoreWeave is also good for Core Scientific.

CoreWeave is an AI hyperscaler that has evolved from a crypto miner that leased space and power (NVIDIA GPUs) from Core Scientific to an AI hyperscaler powerhouse with a roster of high profile clients including Microsoft, Meta Platforms, IBM, Cohere, NVIDIA and OpenAI. CoreWeave is a specialized cloud provider focused on offering scalable AI cloud infrastructure including access to over 250,000 NVIDIA GPUs, low-latency networking and high-bandwidth storage optimized for the massive computational workloads of AI training and inference and ML. The company stands out, as NVIDIA stated, “… CoreWeave has launched NVIDIA GB200 NVL72-based instances, becoming the first cloud service provider to make the NVIDIA Blackwell platform generally available.”

CoreWeave builds infrastructure that can scale at a moment’s notice that can go from zero GPUS to 10,000 GPU working on the same job within a minute.

In 2024, Microsoft accounted for nearly 62% of CoreWeave’s revenue (with Meta accounting for 15% according to H.C. Wainwright), which surged 737% YoY from $229 million to $1.9 billion. Customer concentration concerns were eased a bit with the signing of a $11.9 billion deal with OpenAI, who will also become an investor owning $350 million of stock. NVIDIA holds a 5% minority stake in CoreWeave, which will be going public in 2025.

Core Scientific Gets a Game Changer Deal with CoreWeave

The revenue potential of CoreWeave’s contracts is $8.7 billion over their 12-year terms, equivalent to $725 million annually once fully online. That equates to $181.25 million of quarterly HPC revenue, up from $8.5 million in Q4 or 21X potential, by early 2027. When compared to overall revenue, this is 2X growth on a quarterly basis.

The 21X growth in HPC and 2X growth in overall revenue is before the additional 70 MW $1.2 billion expansion deal announced at its Denton, Texas facility in its Q4 earnings release, resulting in the cumulative revenue potential of over $10 billion from CoreWeave, with 75 to 80% cash gross profit margins according to the Company. The full 590MW contracted to CoreWeave is expected to come online in 2027. This would be up from 250 MW expected in 2025.

CoreWeave Announces $1.2 Billion Expansion at Denton, Texas Facility

On Feb 26, 2025, coinciding with its Q4 2024 earnings release, Core Scientific announced a $1.2 billion 70 MW expansion at the Denton, TX site, for CoreWeave. The 70 MW of additional contracted power at the Denton site increases the full critical IT load to approximately 260 MW. The agreement increases CoreWeave's total contracted HPC infrastructure with Core Scientific to approximately 590 MW across six sites.

Under the terms of our Agreement with CoreWeave with respect to this additional 70MW, Core Scientific is responsible for funding $104 million of the additional required capex ($1.5M per MW), with CoreWeave responsible for the additional capex associated with the expansion. The company also retains the option for two additional five-year renewal terms.

This additional 70 MW brings the total projected revenue to $10.2 billion from CoreWeave over 12-year contract terms and a total of 590 MW of critical IT load spread through six Core Scientific sites. Core Scientific expects all 590 MW to be online in early 2027 as stated by CEO Adam Sullivan during the Q4 2024 conference call on Feb 26, 2025. He said this.

“Looking ahead, we now expect to have delivered approximately 250 megawatts of HPC capacity to CoreWeave by the end of this year, with the full 590 megawatts coming online in early 2027. This represents a shift from our previous timeline and reflects both the size and complexity of the project, particularly the addition of an incremental 70 megawatts of critical IT load.“

Adam Sullivan also added this, “So from what we're seeing on CoreWeave's demand side is significantly stronger than what we saw in 2024. There's a lot of things going on in the market today that we're seeing that's actually driving continued demand and flow into CoreWeave. And so we're excited about continuing to expand with them at Denton. And Denton is going to be one of the largest supercomputers in the United States, and it's going to be a flagship asset for CoreWeave.“

One note of caution: Core Scientific has all the makings of a hypergrowth stock and this includes immense risk. The company is recently out of Chapter 11 Bankruptcy and has to raise cash to fund operations, which means taking on debt. The I/O Fund will be holding a very tight stop on any position we initiate, and the stock would be for Advanced Market Signals only, indicating it qualifies for more advanced investors who are comfortable trading daily/weekly.

Looking Beyond the Q4 2024 Headline Numbers   

Core Scientific reported disastrous-looking Q4 2024 earnings results based on headline numbers, with an EPS loss of ($0.60), missing consensus estimates for a loss of ($0.09) by ($0.51). Revenues fell 33.1% YoY to $94.93 million, missing consensus estimates by ($2.14 million). Yet, the stock gapped over 10% following its release.

The reason is that just beneath the surface, Core Scientific is setting up to solve one of the biggest issues the United States and the AI market face: power supply. The company is going through a transition period as it moves into the AI/HPC data center markets supported by AI hyperscaler CoreWeave, who just signed a five-year $11.9 billion deal with OpenAI.

$224.7 Million Mark-to-Market Adjustment Shouldn’t Spook Investors

The initial sting of the reported ($265.5 million) GAAP loss in Q4 2024 may sound like bad news, but $224.7 million of it is a non-cash mark-to-market adjustment on warrants; just accounting noise. The “actual” Q4 net loss was ($31.8 million), not ($265.5 million).

Core Scientific issued warrants, which are considered liabilities under GAAP accounting rules since the Company has to deliver stock at the exercise price. If the stock rises in value, the Company has to post a larger liability, but it doesn’t mean they are taking any actual losses. The Company issued two tranches of warrants at $6.81 x 98.3M shares for Tranche 1 (CORZW) exp. January 23, 2027, and $0.01 x 81.9M shares for Tranche 2 (CORZZ) exp. January 23, 2029, as part of its plan to emerge from Chapter 11 bankruptcy in January 2024.

The Company still receives the funds when the warrants convert as they issue the required shares. There are no real losses. In fact, it’s relatively good news since the higher the stock price rises, the deeper the “paper losses” appear until the warrants are all exercised or expired and taken off the books. However, that presents a dilution issue of an additional 180.2 million additional common shares.

The 116 Million Shares from Warrants Remaining Might Spook Investors

During 2024, Core Scientific received $4.4 million in proceeds from 646,109 shares of Tranche 1 warrants being exercised. On December 24, 2024, 60.9 million Tranche 2 warrants were exercised for $600,000. This leaves 116 million warrant-related shares remaining of potential dilution on the remaining warrants. Core Scientific has 294 million shares outstanding as of February 20, 2025.  

As of February 20, 2025, the pro forma diluted share count is 501 million shares. This includes the current 294 million shares outstanding along with 207 million additional unissued shares that include Tranche 1 and Tranche 2 warrants of 116 million remaining, convertible notes of 70 million shares and 21 million shares of restricted stock and reserve shares.

Revenues Sink as Company Converts Bitcoin Data Centers to HPC Data Centers

The company’s Q4 revenue fell by (33.1%) YoY and (0.44%) QoQ to $94.93 million, primarily due to the decline in self-mined Bitcoin to 974, down from 3,042 in the year ago period. The Company has been converting some of its Bitcoin mining data centers to HPC data centers and actively “sunsetting” Bitcoin hosting contracts as it transitions to HPC hosting. The Bitcoin halving event also occurred in April of Q2 2024, thereby causing Bitcoin revenue to shrink on a YoY basis further magnifying the deceleration. Revenue fell short of estimates by (2.2%).

  • Analyst expect revenue to fall (48.26%) YoY to $92.77 million in Q1 2025, and fall (30.03%) YoY to $98.73 million in Q2 2025.
  • Full-year 2024 revenues rose 1.6% to $510.7 million.
  • Analysts expect FY2025 revenue to fall (3.71%) YoY to $491.75 million.

Revenue Segments: Bitcoin Revenues Drop in Preparation for HPC Revenue Acceleration

As Core Scientific transitions from Bitcoin self-mining and hosting to HPC hosting, the revenue segments can be expected to drop in the Bitcoin segments and rise in the HPC hosting segment. The quarters may look predominantly worse until the Core Scientific HPC revenues start to ramp up as they go online. Based on analyst estimates, Q1 2025 may be the final “kitchen sink” quarter before revenues reaccelerate. 

Margins Consistently Expand Through 2024

  • Q4 gross margin was 5%, compared to 27.7% in the same period last year.
  • Q4 operating margin was (41.9%), compared to 2.8% in the same period last year. However, EPS is showing a rebound on the horizon as higher margin HPC hosting revenues increase.

GAAP EPS Trending Towards Positive After Mark-to-Market Adjustments on Warrants

Q4 GAAP EPS was ($0.60) compared to ($0.11) in the same period last year. The EPS miss was primarily due to the $244.7 million non-cash market-to-market (MTM) adjusted on the warrants.

  • Analysts expect GAAP Q1 2025 EPS to improve to ($0.10).
  • Analysts expect GAAP Q2 2025 EPS to improve to ($0.07).
  • Analysts expect GAAP Q3 2025 EPS to improve to ($0.05).
  • Analysts expect GAAP Q4 2025 EPS to improve to $0.01 as CoreWeave's data centers come online.

Full year 2024 GAAP EPS was ($4.39) compared to ($0.65) last year.

  • Analysts expect full year 2025 GAAP EPS to improve to ($0.24).
  • Analysts expect full year 2026 GAAP EPS to improve to $0.40 as more of CoreWeave’s data centers come online.

Cash Grows as Core Scientific Issues $1.09 Billion in Convertible Senior Notes

Core Scientific closed Q4 with $836.2 million in cash and $1.09 billion in debt. The debt is comprised of two convertible notes. In August 2024, The Company issued $460 million in convertible notes due 2029, which enabled the Company to refinance its debt from a 12% interest rate to 3% while increasing its cash position and removing covenants to allow the Company to accumulate Bitcoin. The conversion price is $11.00 at a rate of 90.9256 shares per $1,000 in principal, which brings a total 41.82 million shares issued upon conversion.

In December 2024, Core Scientific priced an upsized $625 million convertible senior notes offering due 2031. The conversion price is $22.49 at a rate of 44.4587 shares per $1,000 in principal. This brings a total of 71.61 million additional common shares upon full conversion.

The Implications of Not Being Investment Grade

Its worth noting that there are implications of not being investment grade especially when needing to raise cash. Considering Core Scientific emerged from Chapter 11 bankruptcy in January 2024, this status alone shapes their cash-raising strategy. Being non-investment grade tends to mean higher borrowing costs, but Core Scientific was able to cut their interest rate from 12% to 3% by swapping out the debt with convertible notes.

It’s worth noting that Core Scientific’s 3% interest rate is impressive for a company just out of bankruptcy implying the institution(s) are very confident in Core Scientific’s strategy. However, that route also comes with its potential share of dilution (41.82 million new shares) if shares are converted at $11.00 per share. Core Scientific has the option to redeem early if the stock trades 130% above the conversion price for 20-30 trading days ($14.30) after the initial non-call period August 2027.

The additional $625 million convertible also comes with dilution (27.79 million new shares) but at a higher conversion price of $22.49 and no interest rate. However, Core Scientific achieved this funding with 0% interest implying very high confidence that Core Scientific will either redeem the notes at maturity or that the shares will surge above the conversion price enabling them to convert shares for a profit before then. Both convertibles are senior unsecured obligations, therefore in the event of bankruptcy or default, unsecured creditors rank below secured lenders.

Valuation

 The Company trades at a forward P/E ratio of 12.27. The trailing twelve month (TTM) P/S ratio is 4.34 and forward P/S is 12.27. The five-year average P/S ratio is 5.08. The P/S ratio peaked at 9.3 in November 2024.

Q4 Earnings Call: CoreWeave Contracts Totals $10 Billion in Potential Revenue

Management highlighted their strategic pivot from Bitcoin mining to HPC hosting. The Company delivered 500MW of capacity through 12-year agreements worth $8.7 billion, expanding its HPC infrastructure to over 1.3GW of contracted power. Its key initiatives include accelerating capacity expansion and targeting significant new site acquisitions, including projects in Auburn, Alabama, and Denton, Texas.

In Q4, the Company secured approval to expand its gross capacity at its site in Denton, Texas, by nearly 100MW, which equates to nearly 70MW of critical IT load. Denton is on track to host one of the largest GPU supercomputers in North America. The Auburn, Alabama, site currently has 11MW of critical IT load, and the Company is actively working with Alabama Power to secure a much larger power agreement. They are deferring significant capital deployment until they finalize negotiations with prospective customers.

CEO Adam Sullivan said this.

“Today, we announced a significant expansion of our relationship with CoreWeave at our Denton facility, which will bring that site to full capacity. This new agreement adds approximately 70 megawatts of critical IT load and represents approximately $1.2 billion in additional contracted revenue over a 12-year term. With this latest expansion, our total contracted value with CoreWeave now exceeds $10 billion, an amount that includes our Austin, Texas agreement, and covers roughly 590 megawatts of critical IT load once fully online. Of that total, just over 570 megawatts reflect the capacity we're converting at existing sites to HPC, where we expect 75% to 80% cash gross profit margins.”

However, Core Scientific will put up the CapEx to receive full HPC rental payments rather than 50% payments, with the other 50% being a CapEx credit for the upfront CapEx spent by CoreWeave. Sullivan said this.

“Under this newest agreement for the additional 70 megawatts, we will fund $1.5 million in capital expenditures per megawatt, whereas in prior agreements, CoreWeave covered those costs. In return, we will benefit from full rental payments during the first two years of the contract because there will be no CapEx credit associated with this new agreement.”

It’s worth noting that analysts may be considering 2027 full delivery as too ambitious considering as evidenced by the lowering of revisions. There are execution risks that may be out of their hands including grid delays and securing power with utilities (IE: working with Alabama Power to secure more power to the Auburn site), funding capex or negative developments with CoreWeave.

Prioritizing Customer Diversification and CoreWeave Timeline to Come Online Fully

Diversifying its customer base is a key priority as it aims to reduce CoreWeave's share of revenues to under 50% of critical IT load by 2028. The Company is in active discussions and remains confident in its ability to diversify its HPC customer base. The Company exited the year with 15MW of critical IT load. New block ASIC chips are expected in 2H 2025, which will refresh some of its Bitcoin mining fleet. Otherwise, there are no plans for any further CapEx spending in 2025 for its Bitcoin mining business.

CEO Adam Sullivan reiterated their top priority of diversifying new customers.

“We are in active discussions with dozens of new customers, including the vast majority of hyperscale providers in several large enterprise companies. Demand remains strong, but we're seeing considerably more due diligence compared to the first half of 2024. This heightened scrutiny reflects the influx of new market entrants who make ambitious capacity promises yet lack the tangible power agreements to back them up, much like the recent situation where a hyperscaler canceled contracts with companies that overstated their available power.”

The Company expects to have nearly 250MW of HPC capacity to CoreWeave delivered by the end of 2025. The full 590MW is coming online in early 2027. Core Scientific believes they can add another 300MW of capacity across existing sites by the end of 2027.

Earnings Call Q&A:

The Goal of Reducing CoreWeave’s Concentration of Revenue under 50%

Core Scientific is actively trying to diversify their concentration of revenue from CoreWeave.

Jeffries analyst John Peterson:

“Okay. And then I appreciate the goal of wanting to bring CoreWeave down to less than 50% of revenue by the end of 2028. I think that would require you to procure a lot more power this year in addition to signing on additional customers. So maybe just talk through the milestones that you need to hit throughout this year to be on track to do that.”

Adam Sullivan:

“We talk about the ability to continue to expand at existing sites. And that's a competitive process because we are getting direction in terms of how much additional power we're going to be able to achieve at some of our existing sites and then some of our new sites as well. Very attractive locations. Our focus today is on building blue-chip assets. And we want to have those blue-chip assets with blue-chip clients. And so that's where our focus is today. And we're going to continue to execute and acquire more sites to bring more capacity online to secure more contracts and achieve our goal of getting them below 50% by 2028.”

At 75% to 80% margins, 590 MW would yield $637.5 to $680 million, with a midpoint of $658.75 million after 2027 (assuming all 590 MW comes online). If CoreWeave is 50% of critical load by 2028, total HPC capacity needs to double to 1,180 MW from producing more power and acquiring more sites. It would require Core Scientific to assume more hyperscalers sign under similar 12-year terms to CoreWeave. Sullivan stated how diversifying its customer base was a top priority, “Starting with diversifying our customer base, this is the top priority for the company this year, and the goal is to sign enough contracts so that CoreWeave represents less than 50% of critical IT load by the end of 2028.” Sullivan mentioned 700 MW was available.

Nick Giles:

“So, appreciate your target that CoreWeave represents less than 50% of critical IT, but that implies that you sign at least the same amount with other customers, but you do have 700 megawatts that you've outlined between existing and new sites by 2027. So, should we assume that the delta would be new customers as well, or could that kind of 130 be split between a new customer and maybe one more tranche with CoreWeave?”

Adam Sullivan:

“Yes. So, we've outlined the 300 and the 400 number that's critical IT load megawatts, so about 700 megawatts. As we look forward if we have 590 of CoreWeave contracts the 700 available to us is really where our focus is going to be on executing new clients. So that's part of our goal to get them below 50%, to have enough capacity available and saleable for us to be able to bring them down to that level.”

How the Deep Seek News Only Made People Want to Move Faster

The Deep Seek news was a head fake as actual demand increased, and it only made people want to move faster.

Adam Sullivan:

“We've seen much more specific requests around locations in terms of developments and where they would like to build. But overall, the Deep Seek news for hitting the public markets rather hard from everything that we've seen on the actual demand side, demand continues to increase, and those conversations continue to progress very well.”

Diversifying the Customer Base Beyond Hyperscalers

While Core Scientific makes headlines when deals are made with name-brand hyperscalers, enterprise customers could also fill in pieces of the void to improve diversification.

Greg Lewis:

“Could you talk a little bit about you mentioned enterprise customers potentially. It's something that seems to be we're hearing more about beyond just the hyperscalers. As maybe you broaden out the customer base beyond just the hyperscalers, which it seems that latency is a big issue for them. Maybe scalability is a big issue for them. As you kind of look at potential enterprise customers, does that open up sites maybe in your portfolio and elsewhere that maybe under hyperscaler footprint wouldn’t work but through enterprise it might?

Adam Sullivan:

“And so, we're looking at having hyperscale at the very least as anchor, potentially a single tenant. And if they're serving as an anchor, being able to fill out the rest of the capacity with enterprise clients as well. So, the demand, does it open up more sites with enterprise? Absolutely. But we're focused on blue chip assets with blue chip clients, which includes both of those groups.”

Delivery Times and Securing Power Agreements is a Competitive Advantage

Sullivan pointed out that many while demand remains strong, they are seeing considerably more due diligence compared to the first half of 2024 due to the influx of new market entrants that make “ambitious capacity promises” but actually lack the “tangible power agreements to back them up.” Sullivan referenced what may have been the rumored Microsoft cancellation of commitments with CoreWeave due to “delivery issues and missed deadlines.” Microsoft outright denied the cancellations.

Adam Sullivan:

“This heightened scrutiny reflects the influx of new market entrants who make ambitious capacity promises yet lack the tangible power agreements to back them up, much like the recent situation where a hyperscaler canceled contracts with companies that overstated their available power. Our proven track record and secured power agreements set us apart in this environment, and we won't be expanding our footprint unless we have a high degree of confidence in our ability to deliver for additional customers.”

When pressed about the rumor of Microsoft cancelling capacity with CoreWeave, Sullivan responded.

“I can't comment specifically on any relationship between CoreWeave and Microsoft other than what they've spoken about publicly. But, I mean, CoreWeave's continuing to expand. You're seeing it not only with Core Scientific, but really across the globe and internationally. So, from what we're seeing on CoreWeave's demand side is significantly stronger than what we saw in 2024. There's a lot of things going on in the market today that we're seeing that's actually driving continued demand and flow into CoreWeave. And so, we're excited about continuing to expand with them at Denton.”

Is Core Scientific in Discussions with Other Hyperscalers?

Needham analyst John Todaro inquired about discussions with other hyperscalers and CoreWeave. Sullivan noted they are in talks with a majority of hyperscalers in conversations with large enterprises. The customer conversations are continuing to evolve throughout the early part of 2025. Sullivan was asked if he saw any demand changes across inference and training workloads on the back of Deep Seek headlines.

Adam Sullivan:

Denton was a site that we were really slating for CoreWeave. We did have conversations with some other hyperscalers and other clients on those megawatts. As we talked about the 300 megawatts potential at other existing sites, we're in conversations today with other potential customers around that. There's really no guarantee that anything like that would go to CoreWeave, because what we do want to do now is really focus on continuing to diversify our client base, and our existing sites are great campuses for us to do that.”

Elaboration on the Delays

Sullivan mentioned there were some delays from changing some of the designs to fit for the equipment further impacted by the constrained supply chains going out into 2026.

Adam Sullivan:

“And one of the things that we wanted to ensure that we achieved was that we had the right equipment on the right schedules for the site plans that we had. And so, that required us to change some of the designs to fit for the equipment that was available to deliver on the timelines that we set forward. And so, there was just some incremental delays there. But overall, we have high confidence in where the delivery schedules that we've put forward today. And we believe we're going to be able to hit those timelines.”

Management now expects critical IT load to be 250 MW, including the 16.5 MW, down from 270 MW plus 16.5 MW.

Brett Knoblauch:

“Thanks, guys. Really appreciate it. Maybe just quickly on the delays, if you will, or the pushback in timing. Just want to make sure I heard you right. You're now expecting critical IT load this year to be 250 megawatts. Does that include the 16.5? And before, you guys were expecting, I think, 270 plus the 16.5.”

Adam Sullivan:

“Yes, thanks, Brett. Yes, that's correct. That's really a push out of just one 40-megawatt building out into early 2026. And you're absolutely right. That number does include the 16.5 megawatts.”

Core Scientific Implements a Utility First Process For Evaluating Expansion Sites

For data center site selection, there is a shift away from large remote training sites towards locations that are closer to major metropolitan areas. This has been driven by demand and the need for proximity as the Company expands into new markets, which include the East Coast. However, prioritization is based on reliable utility partnerships.

Rosemarie Sison:

“Just to follow up on that comment that you made, Adam, about proximity to major metro areas. Would that mean that you're potentially looking at expanding out of the markets that you're in right now possibly into the East Coast or the West Coast as those opportunities present themselves?”

Adam Sullivan:

“Yes, absolutely. Thank you for the question, Rosemarie. I mean, we are building one of the larger data centers on the East Coast right now. And so, we have a lot of confidence in our ability to continue to expand in new markets. This is something where we're going to be one of the larger providers in the Dallas market. We believe something similar in the Atlanta market as well. So, we're definitely looking at continuing to enter into new cities. But albeit that looks a little bit different because we might have less familiarity with the utilities in that location. A point on that is we currently operate with seven utilities. We're continuing to expand our relationships across that base. And so, we're taking a very diligent process, a utility-first process, when we're evaluating entering new locations to ensure that we have a strong partnership and relationship with that utility so that we know that we have that firm power available when we go take them to a client.”

Conclusion: Solid Gameplan, Execution is the Key

Other Bitcoin mining companies are adopting Core Scientific's pivot to HPC hosting. However, Core Scientific's game-changing contracts amounting to over $10 billion in revenues over 12-year terms with CoreWeave give them a first-to-market advantage fortified by $10.2 billion in revenue potential from an AI disruptor.

CoreWeave, backed by NVIDIA as an investor and customer, is likely the leading hyperscaler in the market, positioning itself as a first mover in the AI data center space.

Hyperscalers will likely follow in CoreWeave's footsteps. This dynamic reinforces the notion that Core Scientific's strategic pivot to HPC hosting could be bolstered by CoreWeave's leadership in the hyperscaler space, further underscoring that what’s good for CoreWeave is also good for Core Scientific.

CoreWeave was initially interested in acquiring Core Scientific for $1.02 billion or $5.75 per share in June 2024, but was rejected and they decided to back them as they expanded their data center footprint. The downside to this relationship is the very limited customer concentration, as CoreWeave is their largest HPC hosting client. Core Scientific’s near-term future lies with CoreWeave. CoreWeave is expected to generate $10 billion from Microsoft as a client by the end of the decade.

As a potential lottery ticket element for investors, CoreWeave could revisit another acquisition attempt for Core Scientific after its IPO, where it would have additional cash and stock to use as currency. The initial acquisition attempt in June 2024 was for $1.02 billion in cash or $5.75 per share, which Core Scientific rejected stating that the offer “significantly undervalues the Company.” With an estimated $35 billion valuation, CoreWeave could make a much more attractive acquisition offer for less than it would be paying Core Scientific over its 12-year term leases.

Core Scientific has a solid game plan to accelerate its quarterly HPC hosting revenue by at least 21X in two years. As with any great game plan, the flaw always lies in the execution. Analyst estimates forecast one more kitchen sink quarter to go before revenues turn back up as HPC hosting revenues start to ramp up. The potential for more than doubling the outstanding shares to 501 million shares upon full conversion and vesting of restricted stock is concern down the road, but for now the game plan looks solid; the execution is the key.

This is a sample of the I/O Fund’s new Discovery tier, where we cover a new stock idea on a weekly or bi-monthly basis. We are excited to bring you more coverage from the I/O Fund team geared toward new idea generation only. For existing members who wish to subscribe, please email Premium@io-fund.com or click here.Premium@io-fund.com or click here.

Jea Yu, Equity Analyst at the I/O Fund, contributed to this article.

Please note: The I/O Fund conducts research and draws conclusions for the Fund’s positions. We then share that information with our readers. This is not a guarantee of a stock’s performance. Please consult your personal financial advisor before buying any stock in the companies mentioned in this analysis.

Recommended Reading:
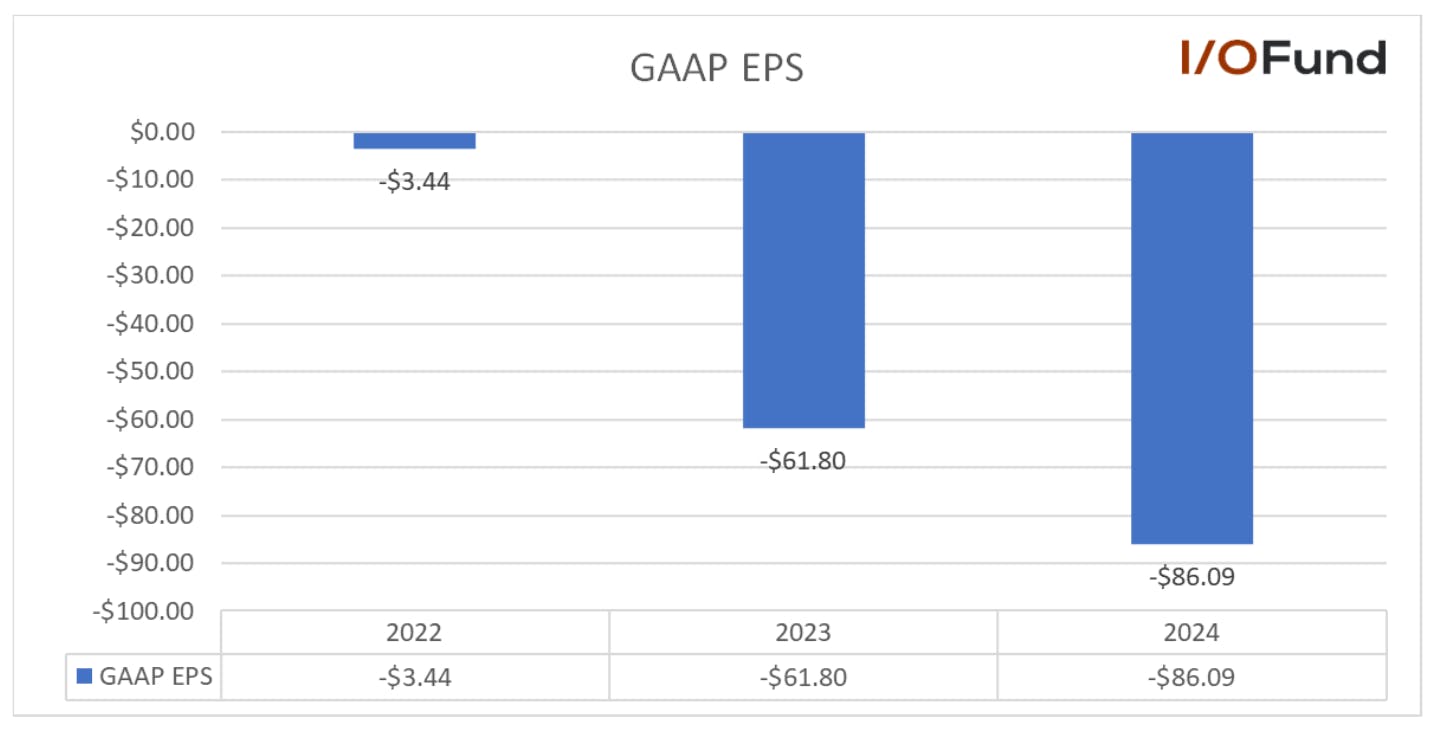
Essentials Report, March 2025 

Broad Market  

The I/O Fund uses many tools to manage risk in our all-tech portfolio. One of these methods is monitoring broad markets to gauge the health of a trend. For example, in early January and February, we kept beating the drum with our Advanced members that the S&P 500 is making a higher high without most of the Mag 7, the NASDAQ-100, Small Caps, and Semiconductors. Divergences like this tend to signal weakness ahead.  

We used this type of analysis to warn our Advanced members that we were raising high levels of cash, as well as hedging our portfolio at the first sign of volatility. This allowed us to mitigate the drawdown over the last month, while having cash on hand to buy some great AI stocks at beaten down levels. 

While we reserve regular broad market updates and webinars for the Advanced tier, we do at times open our broad market analysis to all tiers when we believe that we are at a potential inflection point.  

Regarding the broad market, we think that we are due for a bounce over the coming weeks for a few reasons. The primary reason is sentiment. The AAII is a weekly survey that dates to the 1970s. Every week they ask retail investors where they think the market will be in the future. It has a remarkable record of gauging sentiment as a contrarian indicator.  

Over the last 5 weeks, we have seen some of the most bearish consecutive readings in the survey’s history. The percentage of bearish readings were 100% or 99% for the first 4 weeks, with a 97% print this week. This level of consecutive, extreme bearish sentiment rivals the COVID lows, the 2022 lows and even the 2009 lows.  

Furthermore, short interest on US stocks has risen to the highest level since the COVID panic. Not only is sentiment abysmal right now, but it appears that investors are now loading onto the short side of the market. 

We are not making predications, only presenting sentiment extremes, which historically lead to an unwind. The market tends to move in the direction that will hurt the most people, and right now that level is up. This data supports higher level from here; however, we are also prepared in case this bounce does not materialize. 

Regarding the S&P 500, the line in the sand is 5400. If any further weakness holds this level, I think it is reasonable to expect 5800 – 6050 in SPX over the coming weeks. If this bounce can break above 6050, then the odds increase that we can see 6300 in the coming weeks. 

Our game plan is to continue to raise cash, and layer back into our hedges on any additional strength. Even if we see a push to 6300, we will follow this plan, as this will likely be the final swing before a relatively large bout of volatility is realized, if it hasn’t already started.  

If the market decides to break below 5400 in direct fashion without a bounce, I think it is reasonable to expect a more direct drop to 5200 – 4800. So, while contrarian sentiment readings support a short covering rally in coming weeks, this does not mean that this will manifest. Hopefully, the above levels can help you manage risk as the market chooses a direction.  

If you are interested in a day-by-day update on both broad market risk, and how the I/O Fund manages market volatility in real-time, please consider our Advanced Tier. We are offering a 30% discount to all Essentials Members – please contact support@io-fund.com for details.. We are offering a 30% discount to all Essentials Members – please contact support@io-fund.com for detailssupport@io-fund.com for details.

Nvidia (NVDA) 

The evidence continues to mount that NVDA could see a move to sub-$100 in the coming weeks. While the next move will likely be a bounce to $128 – $135, this appears to be a correction in a larger move lower. My final target for NVDA is $95 – $83, at which we will start accumulating again.  

For this to manifest, we need to see any further strength hold under $135 and then turn lower. If we are going to avoid a lower low, any further strength cannot exceed over $135. Over this level will start supporting a push to new highs in the coming months.  

Let’s say we do not see a bigger bounce from here. Then a sustained break below $110.90 suggests that we are heading directly to the targets zone from here.  

Taiwan Semiconductor (TSM) 

TSM ‘s drop has gone lower than I wanted to see. This does not mean that we can’t see a push to new highs from here, but it does increase the risk that the next bounce will be a lower high within a larger correction.  

Regarding the next bounce, note how TSM is making a new low with less volume and less momentum. This appears to be the final push in this leg of the correction. The coming bounce should get us into the $189 – $203 region. If we are going to break to new highs, we need to push over the $205 region.   

The pattern that has unfolded since the August 2024 low is quite weak and overlapping. Because of this, if we do see a push to new highs, it would likely be the final swing higher before a larger correction unfolds. So, any additional strength from here should be properly risk managed, considering.

Bitcoin (BTCUSD) 

We began accumulating Bitcoin in early 2023. Since then, we have offered 12 buy alerts ranging from $26,000 – $62,000. However, since November of last year, we announced that we are going to begin to take gains and sold more than half of our position between $80,500 – $104,000. We recently added some of this back to play the possible next swing higher. 

Bitcoin’s pattern appears to be incomplete and suggests that one more swing to the $120,000+ region is the most likely. The current bounce that we are seeing should take us to $96,000 – $101,000. Once we get to this region, we will need to be on guard for a reversal. If we do reverse from this zone, we could see a larger drop into the $60,000 region before finding a low. If we are going to push to new highs, we must take out $101,000 with expanding volume.

Please note: The I/O Fund conducts research and draws conclusions for the Fund’s positions. We then share that information with our readers. This is not a guarantee of a stock’s performance. Please consult your personal financial advisor before buying any stock in the companies mentioned in this analysis.

Recommended Reading:
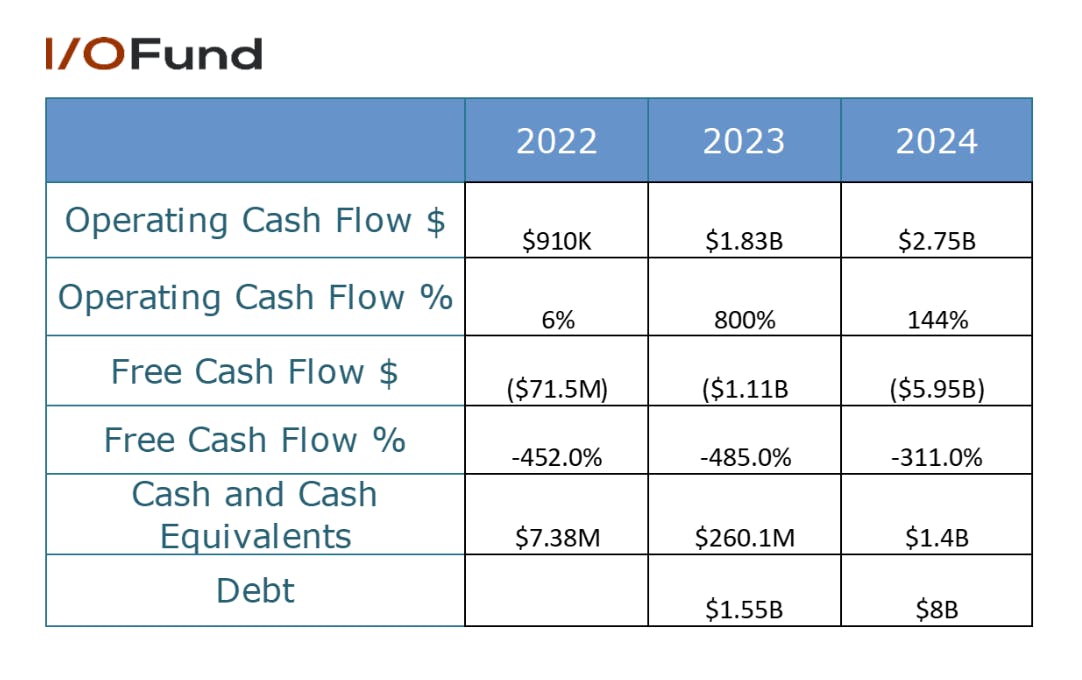
I/O Fund Reports 210% Cumulative Return — Ranking Above Wall Street’s Best

In 2024, I/O Fund posted a 35% return, significantly outperforming popular tech ETFs, which recorded an 8% return over the same period. On a cumulative basis, the results translate to a remarkable 219% outperformance compared to competing tech portfolios. 

  • The I/O Fund outperformed the S&P 500 by 109% and outperformed the Nasdaq-100 by 82%. 
  • In 2024, the I/O Fund returned 35%, outperforming the S&P 500 by 11% and the Nasdaq-100 by 10%. 
  • Since inception, the I/O Fund has maintained a lead of up to 219% over institutional technology portfolios.
Graph comparing I/O Fund’s cumulative returns of 210% since inception versus the Nasdaq-100, S&P 500 and other tech- focused funds.

If you had invested $10,000 with the I/O Fund's picks versus other all-tech portfolios at inception, the difference would be a portfolio value of $31,026 with IOF versus $9,737 with institutional tech-focused portfolios. The difference in value is 219%. 

I/O Fund Surpasses Wall Street’s Most Successful Firms 

The I/O Fund actively manages risk through hedging and raising cash, therefore, the closest comparison in terms of style would be hedge funds. Our current performance since inception places us as one of the top-performing actively managed portfolios in the world, with an annualized return of 27.6% since May of 2020. Our ranking would be #2 in the United States, ahead of famous fund managers such as Pershing Square, Tiger Global and Citadel.    

A table listing the top 10 performing hedge funds and their 5-year annualized returns.

Source: Levelfields and ChartartisanLevelfields and Chartartisan 

I/O Fund is a leading portfolio specializing in tech stocks – if we were a Hedge Fund, our performance would be ranked #2 in the US. We have consistently outperformed some of the biggest hedge funds like Pershing Square, Tiger Global Management, and Citadel.  

Even when considering leveraged ETFs, which tend to use future contracts to double the returns (and losses) of the underlying index, we would still place in the top 10 since our inception. This is remarkable considering SPX and the Nasdaq-100 had strong back-to-back annual performances.

Notably, leveraged ETFs are typically used as trading vehicles rather than as long investments. Considering they utilize future contracts, the longer they are held the more they deviate from their expected result. Therefore, Ark is the closest competitor to what we offer as an actively managed all-tech portfolio. As depicted in the chart above, our lead over Ark is 219%. 

A table listing the top 10 performing tech stocks ETFs and their 5-year cumulative returns.

I/O Fund’s cumulative returns of 210% notably outperformed some of the most popular tech stocks ETFs like XLK by 65%. Source: YCharts and InsiderMonkeyYCharts and InsiderMonkey 

Further, when we combine the entire universe of ETFs with Mutual Funds, which is another long option for investors yet are not exclusive to tech nor do they hedge, we would rank #8. 

A table listing the top 10 performing  ETFs Mutual Funds and their 5-year cumulative returns.

The above list shows that I/O Fund is a top-performing tech portfolio with only Fidelity ranking higher in cumulative returns among tech-focused ETFs and mutual funds. Source: YCharts and InsiderMonkeyamong tech-focused ETFs and mutual funds. Source: YCharts and InsiderMonkey 

When you consider these portfolios have billions of assets under managementbillions of assets under management and are managed by those considered to be the best investors in the worldthe best investors in the world, we feel what we offer is of immense value. 

2024 was the Year of Consistency: 

It has been a wild ride; yet we have strived for consistency. In 2024, we had ten positions outperform the Nasdaq-100 and S&P 500. This follows seven positions beating the broad indexes last year in 2023.   

Although we reserve the complete list for our paid members, below are a few highlights we can share with you: 

  • We held Nvidia as a top position and then trimmed ¼ of the position on June 13th with SMH topping in July. We further discussed our strategy to reduce exposure to AI semis in Q3 and Q4, spotting sector-wide weakness, which helped to minimize losses. 
  • We kept Bitcoin as a top 3 allocation while providing 7 buy alerts, all of which closed the year up 50%+.  
  • Our combined realized returns on an AI hypergrowth stocks was 243% while utilizing risk management to sidestep volatility.  
  • We also captured an outsized 87% return on cybersecurity stock, yet closed the position before the stock saw a volatile drawdown.  
  • We closed a crypto position for a quick 99% gain. 
  • Netflix outperformed the Nasdaq in 2024 and was closed for 164% realized gain in 2024

Nvidia +172% 

Leading up to the release of the Hopper GPUs, we were net buyers of Nvidia in 2021 through early 2023. On average, it was held as a 15% position throughout 2022 – 2023. As we moved into 2024, Nvidia was allowed to exceed this allocation to become our first ever 20% position. We began taking heavy gains in the $130 – $140 region. Today, we are waiting for better prices to begin accumulating again. 

a chart showing Nvidia stock price with buy and trim real-time trade alerts since 2021 to early 2025.

Bitcoin +121% 

We have been systematically accumulating Bitcoin since early 2023. In 2024, we issued seven buy alerts, all of which closed the year up more than 50%. We also began taking significant gains in our Bitcoin position between $80,000 – $106,000.

Bitcoin price chart with buy and trim trade alerts since 2023 to early 2025

Super Micro +243% 

Super Micro was a high conviction play in 2023, which we closed for a sizable gain around the 2024 top. We attempted to re-establish a small position in mid-2024, but decided to close that attempt for a loss due to the accounting issues SMCI was facing. 

SMCI stock chart with buy and closed trade alerts from 2023 to the 2024 top.

Netflix +164% 

NFLX was a high conviction stock that we began accumulating at the same moment that Wall Street’s best, such as Bill Ackman, were closing their positions. We felt the Street had this stock wrong. With multiple tactical buys, the average opening price to the average closing price came out to a 164% realized gain in less than 2 years.  The decision to close it was based on a combination of fundamental issues as well as technical targets being reached. 

Netflix stock chart with buy, trimmed, and closed trade alerts from 2022 to 2024.

Crypto Altcoin +99% 

While Bitcoin was clearly in a strong uptrend, we decided to play the momentum in a crypto altcoin. With an opening average cost basis and closing average cost basis in 2024, we logged a relatively quick 99% in less than a year.  

Altcoin price chart with buy, trimmed, and closed trade alerts in 2024 and early 2025.

Cybersecurity Stock +87% 

We opened a position in a cybersecurity stock in early 2023 and began taking gains in early 2024. We ended up closing the entire position for a realized gain of 87%, just before the stock fell 41% from a streak of bad news. We were early to exit due to the fundamentals team listening closely to the earnings call and sensing weakness. 

Cyber Security Stock price chart with buy, trimmed, and closed trade alerts in 2024.

📢 You can read our full press release here: “I/O Fund Dominates Tech Sector with a Staggering 210% Cumulative Return in Less than 5 Years” ou can read our full press release here: “I/O Fund Dominates Tech Sector with a Staggering 210% Cumulative Return in Less than 5 Years” /O Fund Dominates Tech Sector with a Staggering 210% Cumulative Return in Less than 5 Years”  📈 Read the Full Press Release

Key Points on How the I/O Fund is Different 

Real-time trade alerts are sent to our members the minute we decide to buy, sell, trim or add to a stock. For those who may not be aware, this is extremely challenging to do as it combines the two most advanced forms of portfolio management. 

  • One of the most advanced forms of portfolio management is real-time trade alerts. This places immense pressure on a portfolio manager as the stakes are high to record what you do every second in real-time. To voluntarily choose to have the highest level of accountability in retail is nearly unheard of, yet registered fund managers are required to do this and file their stock trades.  
  • Logging trades in real-time also places immense pressure on the analysts at the I/O Fund, as well, who are not allowed to simply choose a stock but must also determine the allocation for the stock. After recommending a stock, the analysts must help the portfolio manager actively manage the position, which can change at any time. 
  • Hedging up to 100% of a portfolio is also a large psychological hurdle, and traditionally a risky one. Markets spend the vast majority of their history in uptrends, for one. Secondly, the amount you can lose on a short is literally infinite, to where one’s downside risk is capped at 0 on the long side. Although hedging must be reviewed with each Member’s financial advisor, many of our members simply use the information as a critical risk-on and risk-off signal.  

These are rare offerings in stock investing research. However, since day one – we refused to publish reports without risk management.  

We recently published an article “The Harsh Truth: Retail Investors Take the Brunt of Wall Street Losses” to illustrate why retail investors should not accept a low standard when choosing a stock research site. 

There is a reason most services do not provide this level of transparency and activity. The more granularity that is offered, the more skill is required. The stakes are much higher when what you do is recorded the minute the action is taken, but overall, having the highest level of accountability possible has made the I/O Fund much sharper investors. 

Verified Returns 

In addition to a lack of risk management tools, I believe a lack of verified returns in the retail space contributes to the losses this investor type experiences. Smart money is careful about who they consider a good investor — they do not take someone’s word they are a good investor; they make the investors or firms they follow prove it. Every single hedge fund must report their returns, which reduces the chances of posturing. 

How the I/O Fund Sets a High Bar for Accountability 

Over the past few years, the I/O Fund has invested over $175,000 into accountability and transparency for our members. When we launched in July of 2019, for the first year or so, we used a forum hosted by Tribe for our trade alerts for a cost of about $10,000 per year, but by January of 2021, we had migrated to SMS and email tools that were the least likely to experience an outage for our real-time trade alerts (Twilio and Mailchimp). This costs us $30,000 to $40,000 per year, depending on our trading frequency.  

In addition to this, we use an auditor from a large firm in San Francisco to mathematically review and verify the performance of our I/O Fund portfolio trading account and crypto account. The process is quite extensive, and it takes up to four months to complete. This costs $4,500 per audit and we’ve completed six audits for a total of $27,000 spent on this process. Accountability is expensive but we feel it’s worth it. 

Conclusion: 

When I founded the I/O Fund in 2019, it began as an experiment — one that, candidly, I was unsure would succeed. Upon speaking to mentors and others in the field, I was urged to go to the institutional side and to "not bother with retail." This is because institutions pay a higher price for research and are not as emotional during drawdowns. But therein lies the pain point I was trying to solve — which is that retail is offered breadcrumbs — such as stock research that does not provide the most important part of a portfolio (trades or allocations), boastful claims of returns with no accountability plus an utter lack of risk management tools. To worsen the matter, popular tech ETFs greatly underperform the broader indexes — leaving little to no options for retail to participate in the highly rewarding tech sector.  

In sharp contrast to other research sites, the I/O Fund logs every trade in real-time, our portfolio is independently verified by an accounting firm in San Francisco, and our deep dive research is early and actionable — proven to identify some of the market's biggest winners years before the Street. In tech, the rubber meets the road with risk management, which our firm has championed since day one with technical analysis, weekly 1 hour webinars that focus entirely on risk management, and even hedging up to 100% of the portfolio to offer clear indications of whether the market is risk-on or risk-off. 

I am pleased to say the results have truly shattered my expectations.

📢 You can read our full press release here: “I/O Fund Dominates Tech Sector with a Staggering 210% Cumulative Return in Less than 5 Years” ou can read our full press release here: “I/O Fund Dominates Tech Sector with a Staggering 210% Cumulative Return in Less than 5 Years” /O Fund Dominates Tech Sector with a Staggering 210% Cumulative Return in Less than 5 Years”  📈

Please note: The I/O Fund conducts research and draws conclusions for the Fund’s positions. We then share that information with our readers. This is not a guarantee of a stock’s performance. Please consult your personal financial advisor before buying any stock in the companies mentioned in this analysis.

Recommended Reading:

2024 Full Year Audited Returns

It is with great pleasure that I present the I/O Fund’s 2024 audited returns of 34.6%, leading to a spectacular outperformance of 219% since inception when compared to popular tech ETFs. When compared to the broader indexes S&P 500 and Nasdaq-100, we outperform by 109% and 82% respectively, since our portfolio’s inception in May of 2020. 

These have been some of the most variable years on record when considering the immense volatility tech has seen, the market’s rotation out of cloud and into AI – which required meticulous analysis to capture, plus a strong two-year back-to-back performance from the S&P 500 and Nasdaq-100. This has made it particularly challenging for stock pickers to compete. Yet, the I/O Fund was able to defy the odds to deliver what is one of the highest 5-year cumulative performances on record. 

We issued a press release on Wednesday entitled “I/O Fund Dominates Tech Sector with a Staggering 210% Cumulative Return in Less than 5 Years

Graph comparing I/O Fund’s cumulative returns of 210% since inception versus the Nasdaq-100’s 128% and S&P 500. I/O Fund leads institutional technology portfolios by 219%, turning a $10,000 investment into $31,026. Performance verified by a 3rd party audit.

If you had invested $10,000 with the I/O Fund's picks versus other all-tech portfolios at inception, the difference would be a portfolio value of $31,026 with IOF versus $9,737 with institutional tech-focused portfolios. The difference in value is 219%. 

I/O Fund Offers a Staggering Lead in the Tech Sector 

The I/O Fund actively manages risk through hedging and raising cash, therefore, the closest comparison in terms of style would be hedge funds. Our current performance since inception places us as one of the top-performing actively managed portfolios in the world, with an annualized return of 27.6% since May of 2020. Our ranking would be #2 in the United States, ahead of famous fund managers such as Pershing Square, Tiger Global and Citadel.   

 *While our track record has been exemplary, past results are not a guarantee of future outcomes. Please read our terms and conditions here.terms and conditions here.

I/O Fund maintains a staggering lead in the tech sector, achieving a 27.6% annualized return since May 2020. As an actively managed portfolio utilizing risk management strategies, I/O Fund ranks #2 in the U.S., outperforming top hedge funds like Pershing Square, Tiger Global, and Citadel.

I/O Fund is a leading portfolio specializing in tech stocks – if we were a Hedge Fund, our performance would be ranked #2 in the US. We have consistently outperformed some of the biggest hedge funds like Pershing Square, Tiger Global Management, and Citadel. Source: Levelfields and ChartartisanLevelfields and Chartartisan 

Even when considering leveraged ETFs, which tend to use future contracts to double the returns (and losses) of the underlying index, we would still place in the top 10 since our inception. This is remarkable considering SPX and the Nasdaq-100 had strong back-to-back annual performances.  

Notably, leveraged ETFs are typically used as trading vehicles rather than as long investments. Considering they utilize future contracts, the longer they are held the more they deviate from their expected result. Therefore, Ark is the closest competitor to what we offer as an actively managed all-tech portfolio. As depicted in the chart above, our lead over Ark is 219%. 

I/O Fund’s cumulative returns of 210% notably outperformed some of the most popular tech stocks ETFs like XLK by 65%. Source: YCharts and InsiderMonkeyYCharts and InsiderMonkey 

Further, when we combine the entire universe of ETFs with Mutual Funds, which is another long option for investors yet are not exclusive to tech nor do they hedge, we would rank #8. 

The above list shows that I/O Fund is a top-performing tech portfolio with only Fidelity ranking higher in cumulative returns among tech-focused ETFs and mutual funds. Source: YCharts and InsiderMonkeyamong tech-focused ETFs and mutual funds. Source: YCharts and InsiderMonkey 

When you consider these portfolios have billions of assets under managementbillions of assets under management and are managed by those considered to be the best investors in the worldthe best investors in the world, we feel what we offer is of immense value.

2024 was the Year of Consistency: 

It has been a wild ride; yet we have strived for consistency. In 2024, we had ten positions outperform the Nasdaq-100 and S&P 500. This follows seven positions beating the broad indexes last year in 2023.   

The positions that beat the indexes this year include: NFLX, CRWD, NET, BTC, ETH, SOL, LINK, COIN, SMCI, NVDA.  

Highlights included holding Nvidia as a top position and then trimming ¼ of the position on June 13th with SMH topping in July. We further discussed our strategy to reduce exposure to AI semis in Q3 and Q4, spotting sector-wide weakness, which helped to minimize losses. 

We kept Bitcoin as a top 3 allocation while providing 7 buy alerts, all of which closed the year up 50%+. Our combined realized returns on Super Micro were 243% while utilizing risk management to sidestep volatility. CrowdStrike was similar, where we captured outsized 87%, yet closed the position before the stock saw a volatile drawdown. We also closed Solana for a 99% quick gain and Netflix for a 164% realized gain in 2024. You can find more highlights on our 2024 trading history in Knox’s section below. 

A Few More Important Stats About our Performance: 

  • The I/O Fund outperformed the S&P 500 by 109% and outperformed the Nasdaq-100 by 82%. 
  • In 2024, the I/O Fund returned 35%, outperforming the S&P 500 by 11% and both the Nasdaq-100 and Invesco QQQ ETF by 10%. 
  • Since inception, the I/O Fund has maintained a lead of up to 219% over institutional technology portfolios.  
  • In 2024, I/O Fund posted a 35% return, significantly outperforming popular tech ETFs, which recorded an 8% return over the same period. On a cumulative basis, the results translate to a remarkable 219% outperformance compared to competing tech portfolios. 

2024 Winning Positions Overview: 

By Knox Ridley 

We had 10 positions outperform the NASDAQ-100 in 2024. Half of these positions were held for the entire year, while some were tactically closed, which allowed us to log a realized gain that exceeded the NASDAQ-100.  

Positions that we held for the entirety of 2024 that exceeded the NASDAQ-100: 

  • NVDA +172%
  • Bitcoin +121% 
  • Ethereum +47% 
  • Chainlink +34% 
  • NET +32% 

Positions that we tactically opened and/or closed in 2024 for a realized gain that surpassed the NASDAQ-100's 2024 return: 

  • Super Micro: +243% 
  • Solana: +99% 
  • Coinbase +67% 
  • Netflix +164% 
  • CrowdStrike +87% 

*Calculations are based on the average opening price and the average closing price for each position.

Overview of 2024’s Biggest Winners 

Nvidia +172% 

Leading up to the release of the Hopper GPUs, we were net buyers of Nvidia in 2021 through early 2023. On average, it was held as a 15% position throughout 2022 – 2023. As we moved into 2024, Nvidia was allowed to exceed this allocation to become our first ever 20% position. We began taking heavy gains in the $130 – $140 region. Today, we are waiting for better prices to begin accumulating again. 

Bitcoin +121% 

We have been systematically accumulating Bitcoin since early 2023. In 2024, we issued seven buy alerts, all of which closed the year up more than 50%. We also began taking significant gains in our Bitcoin position between $80,000 – $106,000. 

Super Micro +243% 

Super Micro was a high conviction play in 2023, which we closed for a sizable gain around the 2024 top. We attempted to re-establish a small position in mid-2024, but decided to close that attempt for a loss due to the accounting issues SMCI was facing.

Netflix +164% 

NFLX was a high conviction stock that we began accumulating at the same moment that Wall Street’s best, such as Bill Ackman, were closing their positions. We felt the Street had this stock wrong. With multiple tactical buys, the average opening price to the average closing price came out to a 164% realized gain in less than 2 years.  The decision to close it was based on a combination of fundamental issues as well as technical targets being reached. 

Solana +99% 

While Bitcoin was clearly in a strong uptrend, we decided to play the momentum in crypto through Solana. With an opening average cost basis and closing average cost basis in 2024, we logged a relatively quick 99% in less than a year.  

CrowdStrike +87% 

We opened CrowdStrike in early 2023 and began taking gains in early 2024. We ended up closing the entire position for a realized gain of 87%, just before the vertical drop took CRWD down 41% from our final closing price. This was due to the fundamentals team listening closely to the earnings call and sensing weakness. 

Our Performance: 

Below is the engagement letter from the firm that reviews and verifies our performance. Our terms and conditions with the accounting firm state that this engagement letter is to only be shared with paying customers to avoid advertising another firm’s IP and services. For that reason, our performance letter resides behind our paywall.  

The I/O Fund owns the performance review and we do not authorize our customers or any person on our site to share a confidential engagement letter or performance review outside of our paywall. As the owner of the report, we will at times market our performance number outside of the paywall. 

With that said, any paying customer can access the engagement letter which is posted on io-fund.com for this purpose.

Key Points on How the I/O Fund is Different 

Real-time trade alerts are sent to our members the minute we decide to buy, sell, trim or add to a stock. For those who may not be aware, this is extremely challenging to do as it combines the two most advanced forms of portfolio management. 

  • One of the most advanced forms of portfolio management is real-time trade alerts. This places immense pressure on a portfolio manager as the stakes are high to record what you do every second in real-time. To voluntarily choose to have the highest level of accountability in retail is nearly unheard of, yet registered fund managers are required to do this and file their stock trades.  
  • Logging trades in real-time also places immense pressure on the analysts at the I/O Fund, as well, who are not allowed to simply choose a stock but must also determine the allocation for the stock. After recommending a stock, the analysts must help the portfolio manager actively manage the position, which can change at any time. 
  • Hedging up to 100% of a portfolio is also a large psychological hurdle, and traditionally a risky one. Markets spend the vast majority of their history in uptrends, for one. Secondly, the amount you can lose on a short is literally infinite, to where one’s downside risk is capped at 0 on the long side. Although hedging must be reviewed with each Member’s financial advisor, many of our members simply use the information as a critical risk-on and risk-off signal.  

These are rare offerings in stock investing research. However, since day one – we refused to publish reports without risk management.  

It’s only natural for stock investing research sites to want to ease the pressure of having to report in real-time – yet we do not think investors should accept a lower standard than professionals who must report their trades.  

There is a reason most services do not provide this level of transparency and activity. The more granularity that is offered, the more skill is required. The stakes are much higher when what you do is recorded the minute the action is taken, but overall, having the highest level of accountability possible has made the I/O Fund much sharper investors. 

Verified Returns 

In addition to a lack of risk management tools, I believe a lack of verified returns in the retail space contributes to the losses this investor type experiences. Smart money is careful about who they consider a good investor — they do not take someone’s word they are a good investor; they make the investors or firms they follow prove it. Every single hedge fund must report their returns, which reduces the chances of posturing. 

How the I/O Fund Sets a High Bar for Accountability 

Over the past few years, the I/O Fund has invested over $175,000 into accountability and transparency for our members. When we launched in July of 2019, for the first year or so, we used a forum hosted by Tribe for our trade alerts for a cost of about $10,000 per year, but by January of 2021, we had migrated to SMS and email tools that were the least likely to experience an outage for our real-time trade alerts (Twilio and Mailchimp). This costs us $30,000 to $40,000 per year, depending on our trading frequency.  

In addition to this, we use an auditor from a large firm in San Francisco to mathematically review and verify the performance of our I/O Fund portfolio trading account and crypto account. The process is quite extensive and it takes up to four months to complete. This costs $4,500 per audit and we’ve completed six audits for a total of $27,000 spent on this process. Accountability is expensive but we feel it’s worth it. 

Conclusion: 

We started with a cloud-focused portfolio in 2020 that captured the hypergrowth market during the pandemic, then we utilized risk management to stave off losses in 2021 and 2022, before pivoting to a high AI allocation of 45% entering 2023.  

This past year, in 2024, we’ve proven our consistency by offering ten positions that beat both the S&P 500 and the Nasdaq-100 compared to seven positions the previous year. We held large allocations in some of the market’s biggest winners in 2024 (Nvidia, Bitcoin, Super Micro in H1, Coinbase in H2, plus crypto). 

The Consistency of 2024 helped propel our cumulative return from 131% in less than four years to 210% in less than five years. Not only do we easily place in the 90th percentile but we are in the top 10 in nearly every category out of thousands of portfolio options. When looking at hedge funds, we would place as #2 with our annualized return of 27.6% — beating out some of Wall Street’s best investors.  

The I/O Fund's mission since inception has been to provide institutional-level research and tools to retail investors, and the results have shattered our expectations. What we have accomplished is no small feat, and our team reflects on these results with immense gratitude.  

Many of you supported us from early days and stuck with us through immense volatility –   we hope your unwavering commitment to us has been rewarded many times over. Others are newer to our site and have stumbled upon a more polished team than when we first started (or should I say, a more humbled team). If you are newer to the I/O Fund, then I can assure you that no team takes their role more seriously in terms of delivering our very best every single day. 

We want to thank you for your business and your vote of confidence in our abilities. We are honored to officially close out 2024 and to now turn our full attention to delivering for you in 2025 and beyond. 

Please note, past results are not a guarantee of future outcomes. Reference our terms and conditions here.terms and conditions here.

New Discovery Tier – Now Live: 

We are pleased to announce the launch of our new Discovery tier, an endeavor we have been diligently working toward for nearly a year. Our team is limited in the number of positions we can own with 10 positions at a minimum, and up to 20 positions maximum. We also may have a different risk profile than many of our members, which means that we have passed on some notable winners over the years. There are many strong-performing stocks in the market to consider and our new tier is designed to surface these ideas so our members can access a wider range of research that goes well beyond the I/O Fund’s portfolio. 

Here is some coverage we have published over the past month on the Discovery tier: 

  • A high beta stock with 21X growth potential from supplying power quickly to key AI hyperscalers 
  • Power management integrated circuits (PMICs) company with signals for strong growth in H2  
  • Nuclear and natural gas supplier for AI data centers 
  • Coming soon: Biggest incoming IPO in the AI sector  

Current members can get 50% off Discovery for just $199 through April 10th with code SAVE200DISC. Click the link to send a request to Customer Service to subscribe. Link

Please note: The I/O Fund conducts research and draws conclusions for the Fund’s positions. We then share that information with our readers. This is not a guarantee of a stock’s performance. Please consult your personal financial advisor before buying any stock in the companies mentioned in this analysis.

Recommended Reading:
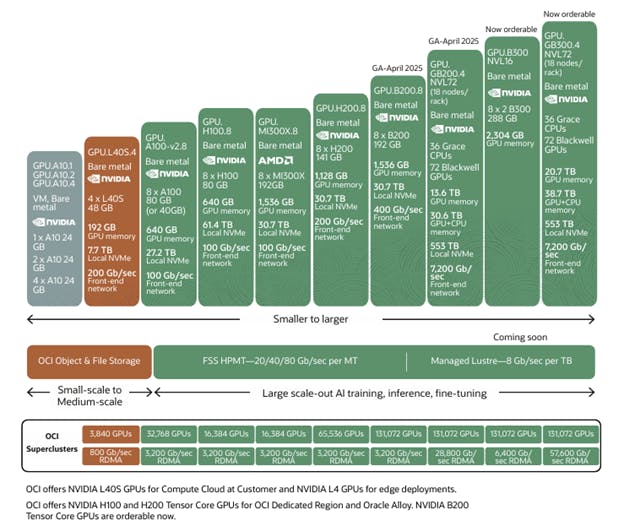
Micron FQ2 Results: Record $1 billion HBM revenue; Mixed Consumer Results

Micron beat analyst consensus estimates and offered better-than-expected guidance. The company expects strong growth to continue in the next quarter, driven by increased DRAM and NAND shipments. The management also highlighted strong AI data center demand and the ramp-up of HBM products. 

Management was quite optimistic about the opportunity in HBM, by increasing the TAM for calendar year 2025 from over $30 billion to over $35 billion. The management also reiterated that the company’s 2025 HBM production is fully allocated and is in discussion with customers for the calendar year 2026. 

In the past, Micron did not report the AI HBM revenue. Management highlighted that the company reported record data center revenue, with the HBM revenue growing more than 50% sequentially, to over $1 billion in their recent quarter. The HBM shipments were ahead of the company’s projections, demonstrating strong execution of the ongoing ramp. 

The management also highlighted that the company’s HBM3E 8-high is designed into NVIDIA's GB200 system, and the HBM3E 12-high is designed into the GB300. Micron also initiated volume shipments to the third large HBM3E customer in FQ2 and anticipates additional customers over time. At the recent GTC 2025 event, Micron showcased its complete AI memory and storage portfolio to support AI from the data center to the edge. The company’s High-performance Micron 9550 NVMe and Micron 7450 NVMe SSDs are included on the GB200 NVL72 recommended vendor list. They expect multibillion dollars in HBM revenue in FY2025. Micron’s HBM4 is expected to ramp in volume in calendar year 2026 and is 60% faster than HBM3E. 

This quarter, revenue grew by 38.3% YoY yet was down (-7.5%) QoQ to $8.05 billion, beating estimates by 2%. Adjusted EPS grew by 271.4% YoY to $1.56, beating estimates by 9.5%. However, the company’s gross margins were below the guidance due to a higher mix of consumer products and lower NAND prices. 

The FQ3 revenue guidance is $8.8 billion, representing YoY growth of 29.2% and 9.3% QoQ growth at the midpoint, beating estimates by 3.8%. Adjusted EPS guide is $1.57, representing YoY growth of 153.2%, beating estimates by 3.3%. 

Micron’s valuation remains low with a P/E ratio of 22.7 and a forward P/E ratio of 13.6. Its P/S ratio is 3.4 and a forward P/S ratio is 3. A few reasons that Micron’s valuation is lower than AI peers is likely due to memory being more cyclical and Micron seeing fierce competition with SK Hynix and Samsung, which leads to more commoditized pricing. There is China, as well, which represents 12% of revenue – although this is not likely to be a leading reason for the lower valuation. Micron's earnings power also fluctuates wildly at times due to the cyclical nature of the memory market. More recently, the increasing consumer revenue mix and lower NAND prices have also led to analysts reducing estimates, which have also led to lower valuations.  

What Micron will need to answer is if the cyclical nature of the memory market will smooth out as the dollar content of memory is rapidly increasing. AI training and inference rely heavily on high-bandwidth memory (HBM) for the massive memory bandwidth that complex models require. AI servers also use more DRAM and NAND than a traditional server. These are reasons that Micron’s cyclical fundamentals could become more secular as the AI economy is built out. 

Ultimately, we want to keep a close eye on companies that are at the forefront of AI yet have valuations that do not reflect this outsized growth. Below are notes that discuss the most recent earnings report as well as references to our previous coverage. 

Bullish HBM commentary

Management set out an optimistic tone about the opportunity in HBM and increased the TAM to over $35 billion for CY2025, up 17% from the previous estimate provided during FQ1 results. As previously noted, the company’s 2025 HBM production was fully allocated and are further seeing strong demand for the HBM supply in 2026 and are in discussions with the customers on agreements for their calendar 2026 HBM demand. 

“We see strong demand for HBM and have once again increased our HBM TAM estimate for calendar 2025 to over $35 billion. We remain on track to reach HBM share similar to our overall DRAM supply share on a run rate basis in calendar Q4 2025. As previously mentioned, Micron has sold out of our HBM output in calendar 2025. We are seeing strong demand for our HBM supply in 2026 and are in discussions with our customers on agreements for their calendar 2026 HBM demand.” 

They also highlighted that they have initiated volume shipments to the third large HBM3E customer. “We are making good progress on additional platform and customer qualifications with HBM. Micron's HBM3E 8-high is designed into NVIDIA's GB200 system, and our HBM3E 12-high is designed into the GB300. In fiscal Q2, we initiated volume shipments to our third large HBM3E customer and anticipate additional customers over time. We expect multibillion dollars in HBM revenue in fiscal 2025.” 

We covered this in the past when we stated in our December post-earnings update that “Management pointed out they are raising their view of server unit percentage growth for the current year and they anticipate server unit growth to continue in 2025. The CEO also stated that HBM has exceeded their plans due to solid execution on yield and capacity ramps.” We also stated that the next catalyst would be the availability of HBM4 in CY2026. 

Similarly, we highlighted during the September post-earning update that the company delivered strong results due to robust data center/HBM revenue. We informed our members in June 2024 that that HBM is sold out for calendar year 2025 with pricing already contracted for. 

Market Outlook 

Management increased the 2025 DRAM bit shipment forecast from mid-teens percentage range to mid-to high teens percentage range due to the growing adoption of AI in smartphone & PC devices and HBM is also a strong contributor to the bit demand growth.  

“Now turning to our market outlook. Calendar 2024 DRAM bit demand growth was in the high teens, consistent with our prior expectations. Calendar 2024 NAND bit demand growth was approximately 10%, slightly below our previous view of low double digits. We forecast calendar 2025 DRAM bit demand growth in the mid- to high teens percentage range and NAND in the low double-digit percentage range. Over the medium term, we expect industry bit demand growth of mid-teens CAGR for both DRAM and NAND.” 

HBM4E to consume higher silicon 

Management mentioned that HBM4E will consume 4x the amount of silicon compared to D5. “As noted before, HBM3E consumes 3x the amount of silicon compared to D5 to produce the same number of bits. Looking ahead, we expect the trade ratio to increase with HBM4 and then again with HBM4E when we expect it to exceed 4:1. The sustained and significant increase in silicon intensity for the foreseeable future contributes to tightness for industry leading-edge node supply and constraints capacity for non-HBM products.” 

Growth in the second half of CY2025 

Management mentioned that the transition from 8-high offering to 12-high offerings will increase revenue in the second half of the year due to premium pricing. Also, shipping to the third large customer will also lead to a revenue increase in the second half of the year. However, revenue growth rate has peaked for now and will decelerate in the year's second half. 

Q: CJ Muse (Analyst) 

“Very helpful. And a quick follow-up. You revised your HBM industry revenue outlook higher. Curious if there's a framework on how you're thinking about kind of first half versus second half for the industry? 

A: Sanjay Mehrotra (CEO) 

Of course, the revenue in the second half as you go from 8-high to 12-high continues to go up because 12-high will be carrying a certain premium over 8-high. So if we have projected more than $35 billion for calendar year 2025 and a bigger portion of that in second half of calendar '25 versus first half. And more than $35 billion, of course, is the industry TAM for HBM that we have referred to here. 

And I'll just point out that, of course, with respect to HBM, there is expansion of HBM customer base taking place. Micron itself, now we are shipping to a third large customer that we have begun shipping our products to. So that also is contributing to the growth in HBM revenue in the second half as the customer base expands.” 

Financials: 

Revenue growth momentum eases 

FQ2 revenue grew by 38.3% YoY and down (-7.5%) QoQ to $8.05 billion, beating estimates by 2%, driven by strong HBM revenue that grew more than 50% sequentially to over $1 billion.  

FQ2 DRAM revenue grew by 47% YoY to $6.1 billion, representing 76% of total revenue. DRAM revenue was down (- 4%) QoQ, with bit shipments decreasing in the high single-digit percentage range and prices increasing in the mid-single-digit percentage range because of improving portfolio mix. 

The company’s DRAM revenue was down sequentially due to the decrease in bit shipments. However, management expects bit shipment to increase in Q3, which will likely help with the DRAM revenue recovery.   

FQ2 NAND revenue grew by 18% YoY to $1.9 billion, representing 23% of total revenue. NAND revenue was down (-17%) QoQ, with bit shipments modestly higher and prices decreasing in the high-teens percentage range. FQ2 bit NAND bit shipments exceeded management expectations, driven by higher consumer-oriented shipments. Management anticipates growth in DRAM and NAND bit shipments in FQ3. 

  • The company expects strong growth to continue in the next quarter with revenue guidance of $8.8 billion, representing YoY growth of 29.2% and 9.3% QoQ growth at the midpoint, beating estimates by 3.8%. However, revenue growth rate has peaked for now and will decelerate in the calendar year's second half. 
  • Analysts expect revenue to grow 25.3% YoY to $9.71 billion in FQ4 and 23.8% growth in FQ1. 
  • For FY2025 ending August, analysts expect revenue to grow 39.1% YoY to $34.93 billion and 28.6% growth to $44.93 billion in FY2026. 

Strong YoY Margin Expansion, Yet Consumer Weighs on Margins

The company’s margins are improving on a YoY basis driven by operating leverage. However, margins are down sequentially, and the company’s gross margins were below guidance due to a higher mix of consumer products and lower NAND prices. This was partially offset by high-value DRAM portfolio mix. Management expects gross margins to be down sequentially in FQ3 due to higher consumer mix, NAND underutilization charges, and NAND pricing weakness. This was also highlighted by the management during the Wolfe Conference last month. It was further clarified during the earnings call Q&A that gross margins will improve in FQ4. 

Q: Harlan Sur (Analyst) 

"Back in mid-February at an investor conference, I know the team had walked us through the dynamics on a weaker gross margin profile during the May quarter. That's playing out, but you did anticipate an improved gross margin profile beyond this quarter, fiscal Q3. So is that still the case that we should see gross margin improvements maybe starting in fiscal Q4 and potentially beyond? And is that a possible data center and your consumer-related products? Is that across total DRAM and your NAND segments? Any color here would be great.

A: Mark Murphy (CFO) 

Sure, Harlan, this is Mark. I'll take that. So let me just make some comments about the third quarter. It is down sequentially, as we had indicated in the conference. And again, as we said in the conference down primarily due to higher mix of consumer-oriented volumes, lower CQ1 pricing on consumer-oriented markets and industry and can just generally, all that partially offset by higher HBM. We do see — while down, conditions have improved since those public comments. And the updated view is reflected in the guide today. 

Now we're not providing guidance on the fourth quarter. However, we do expect gross margin to be up somewhat. There's always tailwinds and headwinds. As you know, on tailwinds, we do expect market conditions to improve. We do expect HBM and other high-value products to grow and contribute to mix improvement…. So in short, we would expect fourth quarter margins to be up somewhat from third quarter.” 

  • FQ2 gross margin was 36.8% compared to 18.5% in the same period last year and 38.4% in the FQ1. It was lower than the guidance of 37.5% due to a higher consumer mix. Management guidance for the next quarter is 35.5%. 
  • FQ2 adjusted gross margin was 37.9% compared to 20% in the same period last year and 39.5% in the FQ1, missing guidance of 38.5%. Management guidance for next quarter is 36.5%. 
  • FQ2 operating margin was 22% compared to 3.3% in the same period last year and 25% in FQ1, driven by operating leverage. Management guide for the next quarter is 21.1%. 
  • FQ2 adjusted operating margin was 24.9% compared to 3.5% in the same period last year and 27.5% in the FQ1. Management guide for the next quarter is 23.7%. 
  • FQ2 net margin was 19.7% or $1.58 billion compared to 13.6% or $793 million in the same period last year. FQ2 adjusted net margin was 22.1% or $1.78 billion compared to $476 million or 8.2% of revenue in the same period last year.

Adj.EPS growth of 271% 

FQ2 GAAP EPS grew by 98.6% YoY to $1.41, beating estimates by 11.4%. Adjusted EPS grew by 271.4% YoY to $1.56, beating estimates by 9.5% driven by strong operating leverage.   

  • Management adjusted EPS guide is $1.57 for FQ3, representing a YoY growth of 153.2%, beating estimates by 3.3%. 
  • Analysts expect adjusted EPS to grow 73.7% YoY to $2.05 in FQ4 and 41.3% growth in FQ1. 
  • For the FY2025 ending August, analysts expect adjusted EPS to grow 419.6% YoY to $6.76 and 64.7% YoY growth to $11.12 in FY2026. However, due to a higher consumer revenue mix and lower NAND prices, analysts have reduced the estimates significantly for this FY2025 from 783% expected growth in June 2024 to the current expected growth of 420%, with some of the growth being pushed to the FY2026. 

Cash Flow and Balance Sheet 

The company’s cash flow improved, driven by higher profits.  

  • FQ2 operating cash flow margin was 49% or $3.94 billion compared to 20.9% or $1.22 billion in the same period last year. 
  • FQ2 adjusted free cash flow margin was 10.6% or $857 million compared to ($29 million) or (-0.5%) in the same period last year.  
  • FQ2 capex was $4.06 billion, up 193% YoY. The company received government subsidies of $963 million (23.7% of capex) in FQ2 compared to $149 million in the same period last year. Management expects the FQ3 capex to be over $3.0 billion and the FY2025 capex to be about $14 billion. Management mentioned in the earnings call that the majority of the FY2025 capex is to support the multiyear facility investments for DRAM and HBM manufacturing, including the Idaho fab, Singapore HBM advanced packaging facility, and Taiwan DRAM test facility.  
  • Earlier in December last year, the U.S. Department of Commerce finalized the $6.17 billion government subsidies under the Chips Act. It will disburse the funds based on Micron’s completion of project milestones. The $6.17 billion funding package, representing roughly 5% of the total estimated capital expenditure in New York and Idaho, will support the construction of two fabs in Clay, New York, and one in Boise, Idaho. This funding is part of Micron's $125 billion capex plan for both states over the next two decades. 
  • The company had cash and investments of $9.6 billion and debt of $14.36 billion compared to $8.74 billion and $13.8 billion in the previous quarter.  
  • During FQ2, Micron extended the debt maturities through a $1 billion 10-year senior note offering and a $1.7 billion term loan, with proceeds used to pay down notes maturing in 2026 and the previous term loan balance.  
  • The company’s inventory increased to $9.0 billion from $8.71 billion in FQ1 to support the strong AI-demand. Management mentioned that the inventory levels will normalize in a couple of quarters.  

Business Units

Compute and Networking (CNBU)Compute and Networking (CNBU) 

Compute and Networking revenue grew by 109% YoY and 4% QoQ to $4.56 billion. For the third consecutive quarter, CNBU revenue reached a new quarterly record, driven by a more than 50% sequential increase in HBM revenue to over $1 billion. However, the CNBU revenue growth decelerated from 153% and 152% growth in the last two quarters and is likely tied to the Blackwell delays.  

The company’s CEO Sanjay Mehrotra, highlighted in the earnings call, “Our HBM shipments were ahead of our plans, demonstrating strong execution of our ongoing ramp. The combination of our revenue from high-capacity DRAM modules and our industry-leading LPDRAM for the data center also exceeded the $1 billion milestone for the quarter.” 

Mobile (MBU)Mobile (MBU) 

FQ2 Mobile Business Unit revenue was down (-33%) YoY and (-30%) sequentially to $1.07 billion due to inventory corrections.  

Embedded (EBU)Embedded (EBU) 

FQ2 Embedded business unit revenue was down (-8%) YoY and (-3%) QoQ to $1.03 billion. It was lower due to inventory correction in the company’s automotive customers. The CEO highlighted in the earnings call that the customers are nearing the completion of inventory adjustments. “Automotive OEMs, industrial and consumer embedded customers are in the later stages of adjusting their inventory levels. In automotive, which comprises the largest portion of our EBU revenue, memory and storage content per car continues to increase as AI-enabled in-vehicle infotainment systems become more enriched and driver assistance functions become more capable.” 

Storage (SBU)Storage (SBU) 

Revenue for the Storage business unit was $1.4 billion, up 54% YoY and down (-20%) sequentially. The sequential decline in SBU revenue was driven primarily by lower storage investments from data center customers after several quarters of very strong growth and the overall NAND industry pricing. 

Earnings Call Notes:

AI PCs and Mobile

Management expects mid-single-digit unit PC growth in calendar 2025, with a stronger second half. AI PCs require increased DRAM, with a minimum of 16GB of DRAM compared to 12GB content last year. They expect smartphone unit volume growth in calendar 2025 to remain at low single-digit percentages and customer inventories are improving. AI smartphones require DRAM capacities of 12GB or higher compared to 8GB in last year’s models. 

“We expect the PC market to grow mid-single digits in unit terms in calendar 2025, with growth weighted to the second half of calendar 2025. The Windows 10 end of life in October 2025, combined with an aging installed base and the desire amongst customers to ensure that their PC hardware specs can support compelling AI applications in the future, are key catalysts that drive this growth. 

AI PCs required a minimum of 16 gigabytes of DRAM, with many models requiring even higher memory versus the average 12 gigabyte PC content last year. During the quarter, we sampled our 16-gigabit 1 gamma-based D5 products to PC clients. In NAND, we launched our Gen9 based 4600 performance SSDs, the fastest in the world for the client market, and completed qualifications of our 2650 mainstream SSDs at multiple PC OEMs. 

Turning to mobile. Our expectations for smartphone unit volume growth in calendar 2025 remain at low single-digit percentages. Smartphone customer inventory dynamics have played out as anticipated, leading to mobile DRAM and NAND bit shipment growth in our fiscal Q3. AI adoption continues to be a significant driver for increased mobile DRAM demand. 

AI-capable flagship phones increasingly feature DRAM capacities of 12 gigabyte or higher compared to the 8 gigabyte in last year's models. Smartphone OEMs are using Micron's industry-leading 9.6 gigabit per second LP5X DRAM to improve AI performance, delivering up to 20% more tokens per second than those using legacy speed grades on the same SoC.”

Tariffs 

Management mentioned that they plan to pass the costs of tariffs to the customers. China accounted for 12% of FY2024 revenue. “On tariffs, Micron serves as the U.S. importer of record for a very limited volume of products that would be subject to newly announced tariffs on Canada, Mexico and China. We continue to monitor the possibility of future tariffs and are prepared to work with our customers and suppliers to understand future tariff effects and supply chain options that may arise. Where tariffs do have an impact, we intend to pass those costs along to our customers.” 

Valuation:

The company is trading at a P/E ratio of 22.7 and a forward P/E ratio of 13.6. Micron’s P/S ratio is 3.4 and a forward P/S ratio is 3.0. It is trading below its five-year average P/S ratio of 3.7.  A few reasons for Micron’s low valuation are likely due to memory being more cyclical and Micron seeing fierce competition with SK Hynix and Samsung, which leads to more commoditized pricing. More recently, the increasing consumer revenue mix and lower NAND prices have also led to analysts reducing estimates, which have also led to lower valuations. 

Conclusion 

Micron beat the top-line and bottom-line analyst consensus estimates. However, the consumer revenue mix, NAND underutilization charges, and NAND pricing weakness weigh on the gross margins.  

This stock would be a breakout buy rather than a counter-trend entry as we’d like to see the market begin to recognize Micron as being more secular once the HBM-related revenue begins to rival the other more cyclical revenue segments. 

I/O Fund Equity Analyst Royston Roche contributed to this report.

Please note: The I/O Fund conducts research and draws conclusions for the Fund’s positions. We then share that information with our readers. This is not a guarantee of a stock’s performance. Please consult your personal financial advisor before buying any stock in the companies mentioned in this analysis.

Recommended Reading:
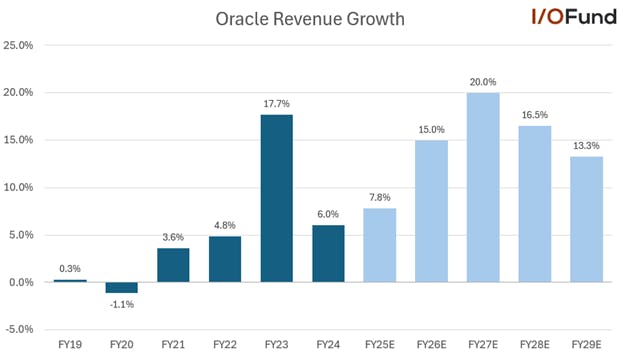
The Harsh Truth: Retail Investors Take the Brunt of Market Losses

Next week, the I/O Fund will be releasing our official 2024 returns, along with our updated cumulative and annualized returns. However, before we release our returns, we think it’s prudent to discuss the importance of verified returns for retail investors. 

Retail Investors Take the Brunt of Market Losses 

The unfortunate reality is that retail investors disproportionately suffer losses compared to institutional investors. According to a study by Dalbar Inc., the average retail investor underperformed the S&P 500 by 6.1% annually over a 20-year period with a 5.5% gap in 2023, which was higher than the gap in 2022 – showing that bull markets often do not reward retail investors in the way that it’s perceived. According to the report, this is because “investors tend to sell out of investments during downturns and miss out on rebounds." Additionally, Bloomberg found that 80% of day traders quit after the first two years.  

A University of Oxford professor explains this disparity: "Retail investors will always lose money because they lack the ‘education,’ whereas financial professionals are well-informed – that’s what they do."  

This is especially concerning given that retail investors now make up 25% of the market, a sharp increase from 10-15% before the pandemic, according to Bloomberg Intelligence (Bloomberg, 2023). With more individual investors participating, the need for risk management and verified returns has never been greater. 

The I/O Fund will officially release our 2024 returns and cumulative returns next week, with results that prove our firm has handily beat not only the indexes but also Wall Street’s best firms. Stay tuned to your inbox! 

The Role of Quant Machines in Extreme Volatility 

One of the primary culprits behind today’s extreme market swings is high-frequency trading (HFT) and algorithmic investing. While many newer investors picture a stock trading floor with market makers assisting trades, the reality is far different. Instead, the market is largely controlled by colocation data centers filled with high-speed servers executing trades in milliseconds.

a busy stock exchange trading floor with traders reacting to screens

Algorithms thrive on volatility, often triggering rapid selloffs that disproportionately hurt retail investors 

Research shows that HFT firms account for 50-60% of U.S. equity trading volume, making them dominant players in the market. These algorithms thrive on volatility, often triggering rapid selloffs that disproportionately hurt retail investors, who don’t have the same tools to react instantly. A study by the CFA Institute found that flash crashes, largely caused by algorithmic trading, wipe out billions in market value within minutes, often before retail investors can even process what’s happening. 

For example, during the May 6, 2010, flash crash, the Dow Jones Industrial Average plunged nearly 1,000 points in just 10 minutes, temporarily erasing nearly $1 trillion in market value—a drop largely attributed to high-frequency trading algorithms. Similarly, in December 2018, a wave of algorithm-driven selling caused the S&P 500 to drop nearly 20% in a matter of weeks, triggering widespread panic among retail investors.

Join thousands of investors who trust I/O Fund’s expert stock analysis on AI, semiconductors, cryptocurrency, and adtech — sign up for free! Click here!Join thousands of investors who trust I/O Fund’s expert stock analysis on AI, semiconductors, cryptocurrency, and adtech — sign up for free! Click here!

A report from the Bank for International Settlements (BIS) further found that high-frequency trading increases market fragility, as it can amplify both buying and selling pressure, creating price swings that disproportionately impact smaller traders. Per Ox Journal: “Although, all these benefits do come at a cost, derived also from the increase in liquidity that these algorithms provide; the cost is the increase in volatility. To be exact, Zhang finds that high-frequency trading increases short-term intraday volatility by 30%.”  

Without access to sophisticated trading tools, retail investors are left vulnerable to these rapid market fluctuations. 

Why Risk Management Tools Are Essential 

Unlike institutional investors, retail traders rarely have access to advanced risk management tools, leaving them vulnerable to market swings. This is where the I/O Fund bridges the gap. Our firm provides: 

  • Real-time trade alerts – Ensuring transparency and timely decision-making. 
  • Advanced portfolio strategies – Utilizing hedging techniques to mitigate downturns. 
  • Educational insights – Helping retail investors understand market dynamics. 
  • Portfolio allocation models – Guiding investors in constructing balanced, risk-adjusted portfolios. 

A study by Morningstar found that investors who utilized risk-managed portfolios had 30% less volatility in returns over a 10-year period compared to those without structured strategies.  

The Importance of Verified Returns 

One major factor contributing to retail investor losses is the lack of transparency in the financial space. Institutional investors do not take performance claims at face value—they demand verified proof. Every hedge fund is required to report returns, reducing the chances of misleading data.  

Over the past few years, the I/O Fund has invested over $175,000 into accountability and transparency for our members. When we launched in July of 2019, for the first year or so, we used a forum hosted by Tribe for our trade alerts for a cost of about $10,000 per year, but by January of 2021, we had migrated to SMS and email tools that were the least likely to experience an outage for our real-time trade alerts (Twilio and Mailchimp). This costs us $30,000 to $40,000 per year, depending on our trading frequency.  

In addition to this, we use an auditor from a large firm in San Francisco to mathematically review and verify the performance of our I/O Fund portfolio trading account and crypto account. The process is quite extensive and it takes up to four months to complete. This costs $4,500 per audit and we’ve completed six audits for a total of $27,000 spent on this process. Accountability is expensive but we feel it’s worth it.  

Raising the Standards for Retail Investors 

The I/O Fund was founded on the principle that retail investors deserve the same high standards that institutional investors insist upon. By demanding transparency, utilizing professional risk management strategies, and offering deep dive research, retail investors can position themselves for success rather than becoming caught up in market volatility. 

As we finalize our annual audit for 2024, we remain committed to providing the highest level of accountability in the industry. Our 2024 performance results will be published soon and we look forward to continuing to raise the bar for retail investors everywhere. 

To further extend our goal of providing exceptional quality research for retail investors, we are pleased to announce the launch of our new Discovery tier after diligently working on this endeavor for nearly a year. The new tier is designed to surface dozens of new ideas each year and give our members a wider range of research into AI hardware, software, crypto and other areas that extend well beyond the I/O Fund’s portfolio.  

Here is some coverage we have published over the past month on the Discovery tier: 

  • A high beta stock with 21X growth potential from supplying power quickly to key AI hyperscalers 
  • Power management integrated circuits (PMICs) company with signals for strong growth in H2  
  • Nuclear and natural gas supplier for AI data centers 
  • Coming soon: Biggest incoming IPO in the AI sector 

For a limited time, get a 25% discount on Discovery priced at $299 through April 10th using code SAVE100DISC Learn more here.

Please note: The I/O Fund conducts research and draws conclusions for the Fund’s positions. We then share that information with our readers. This is not a guarantee of a stock’s performance. Please consult your personal financial advisor before buying any stock in the companies mentioned in this analysis.

Recommended Reading:
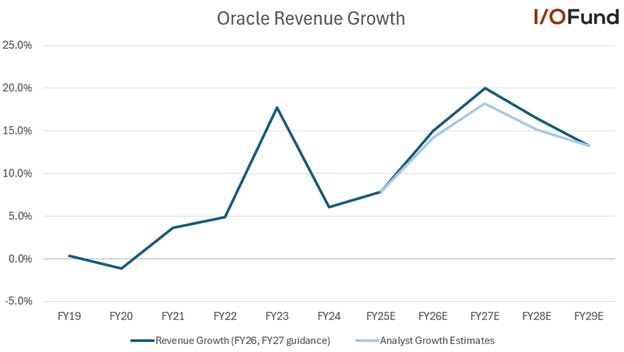
Thank you for joining I/O Fund Essentials!

We think you’ll find our service provides a competitive edge in technology, the world’s most valuable and rewarding industry.

The I/O Fund strives to offer high conviction analysis from one of the best tech analysts in the world, Beth Kindig, along with an actively managed portfolio with real-time trade alerts. Our audited performance proves that I/O Fund competes with and often beats Wall Street's highest-performing funds.

For just $99/year with I/O Fund Essentials you will receive:
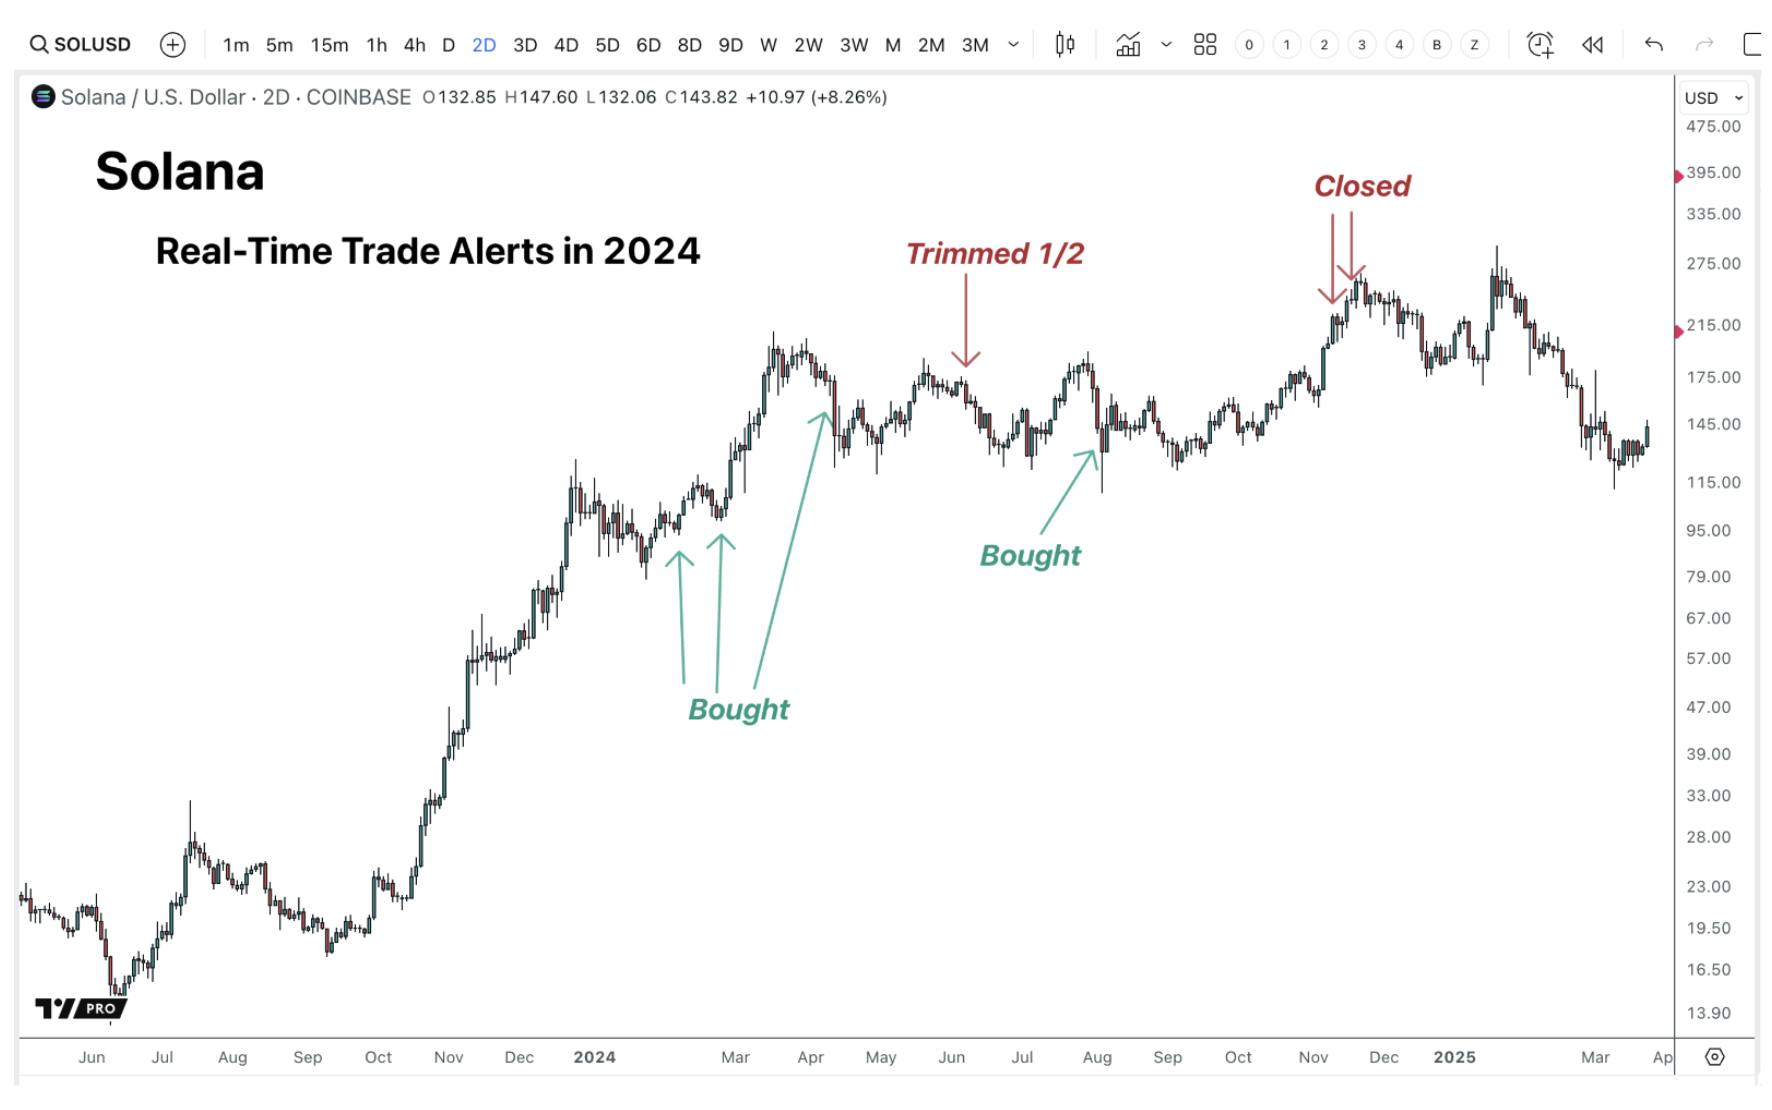
  • A fully managed, 3 stock portfolio of our highest conviction tech ideas. If we decide to add to the position or trim it, this information will be provided in real-time.
  • Two monthly reports, including (1) fundamental analysis from Lead Tech Analyst Beth Kindig and (1) technical analysis from our Portfolio Manager, Knox Ridley.

For the more advanced investor, our goal is simple – we want to own stocks like Google, Apple, and Amazon long before they become one of the most valuable companies in the world. Our premium memberships are designed to educate and manage risk in these high conviction stocks that we believe are early to major tech trends.

Upgrade at any time to receive a fully managed portfolio of 10-15 stocks including 3 cryptocurrencies, real-time trade notifications, and weekly deep dives. These plans start at $549 and $849. Email premium@io-fund.com for an Essentials Discount of $100 off either Pro or Advanced.premium@io-fund.com for an Essentials Discount of $100 off either Pro or Advanced.

Here’s a breakdown of what you get with each plan:

Notable wins from the I/O Fund team:

  • The I/O Fund has cumulative returns of 210% and a lead over institutional technology portfolios of as much as 219% since inception. 
  • In 2024, the I/O Fund returned 35%, outperforming the S&P 500 by 11% and both the Nasdaq-100 and Invesco QQQ ETF by 10%. 
  • We had 10 positions outperform the NASDAQ-100 in 2024. 
  • We also closed an altcoin for a 99% quick gain and Netflix for a 164% realized gain in 2024. 
  • Our combined realized returns on Super Micro were 243% while utilizing risk management to sidestep volatility. 
  • We opened CrowdStrike in early 2023 and began taking gains in early 2024. We ended up closing the entire position for a realized gain of 87%, just before the vertical drop took CRWD down 41% from our final closing price. 
  • We posted returns of 57% in 2023. If we were an ETF, mutual fund or hedge fund, our ranking would be #4 in the Wall Street Journal’s Winners’ Circle ranking of 1,191 funds. 
  • In 2023, we had five positions with returns over 100% and seven positions beat the Nasdaq. Many were held at high allocations. 
  • The I/O Fund had a 45% allocation to AI going into 2023, one of the highest on record. Today, the AI allocation is higher with many lesser-known names. 
  • Issued 9 trade alerts for Nvidia under $20. Provided over 25 analyses on Nvidia’s AI thesis before the market caught on. 
  • Nearly impeccable record on Bitcoin, buying between $7K to $10K, trimming at $58K, buying again $15K to $16K for the rally to $100K+. All entries and exits are sent as trade alerts. 
  • We were early to the cloud in 2019, then rotated into AI in 2022 with a 45% allocation in 2023. 
  • Released an automated hedge in 2022 to stave off losses during a historic selloff in the tech sector. 
  • Picked the leading sectors in 2021: semiconductors and blockchain. 
  • Picked the two top-performing cloud stocks in 2021 (DDOG and ASAN) 
  • Picked the best-performing asset with a large market cap in 2021 (ETH) 
  • Picked the best stock in the S&P 500 in 2019 (ROKU) 
  • Has beaten other tech-focused funds in every audit since the portfolio’s inception. 

What you can expect from the I/O Fund Essentials Plan:

Institutional-Level Research Monthly

You will receive original analysis by Beth Kindig, Knox Ridley, and Royston Roche monthly, along with an actively managed 3 stock portfolio. We are confident that nothing like the I/O Fund team’s research exists outside of institutions. Knox’s technical analysis perfectly complements Beth’s and Royston’s fundamental research, giving you the best research on the market.

High-quality, timely analysis and updates

As a member of I/O Fund Essentials, you’ll get an email notification as soon as our analysis is posted so you can stay up to date with the latest research from our team.

What you can expect from the I/O Fund Pro Plan:

  • Weekly Tech Stock Analysis, includes fundamental analysis from Lead Tech Analyst Beth Kindig.
  • Premium library of institutional-level research and analysis, including fundamental stock analysis, deep dive research into current tech trends and the companies we believe are setup to benefit from these trends.
  • Quarterly webinars to discuss our positions. We also identify trends/catalysts we are eyeing to fill our new idea pipeline.
  • A completely Transparent Portfolio made up of growth tech stocks and some cryptocurrencies.

What you can expect from the I/O Fund Advanced Plan:

  • Weekly Webinars on macro, the broad market, as well as buy/sell targets for each of our positions, plus quarterly portfolio reviews on the growth tech stocks we are interested in.
  • Technical Analysis on all I/O Fund stocks and Broad Markets, with charts on all major US markets, analysis of inflation and growth, as well as bonds, commodities, futures and more! We use these markets to help better understand the macro landscape, which guides our buys/sells. 
  • A Completely Transparent Portfolio made up of growth tech stocks PLUS crypto that is actively managed by one of the best growth Portfolio Managers in the business!
  • Trade Alerts are sent in real time directly to your phone via SMS and email.
  • NEW! Automated Hedge with advanced signals to help spot approaching risk in the markets, with a 72% win rate going back to 2003 with only 45 signals triggered.

Ready for more? Here’s what you're missing from I/O Fund Advanced:

1. Fully Transparent Portfolio

I/O Fund Advanced has full access to a live portfolio with approximately 15 long-term positions. This portfolio is the culmination of all analysis with a minimum time horizon of +5 years. Our highest convictions can be found listed by percentage of allocation. Similar to Wall Street funds, we vote on our convictions with real money and full transparency.

One unique benefit to our site is that we continually look for good entries into stocks we recommend, as well as places to trim when the broad market appears to be risky. We do not simply give blanket buy recommendations on stocks we covered years ago rather we transparently show you our risk management strategies in real-time.

2. Institutional-Level Research at your Fingertips

You will have full access to a library of research and original analysis by Beth Kindig, Knox Ridley, and Royston Roche on this site. We are confident that nothing like Beth and Knox’s research exists outside of institutions, and many institutions follow our research. Knox’s technical analysis perfectly complements Beth’s fundamental research, giving you the best research on the market.

3. Real-Time Trade Notifications and Advanced Market Signals

We raised the bar by offering real-time trade notifications in our Advanced Market Signals room and every time we enter and exit a position. Each buy or sell is discussed by our portfolio manager at the time of execution through forum posts and webinars. We offer the highest level of transparency possible so you will know if the I/O Fund team is buying, selling or if we feel the market requires no action at all. We are not licensed financial advisors, rather we offer the real-time trades we do on our portfolio to help our Members gauge the current market.

4. Markets Update

Markets are dynamic and fluid systems. They can and do go down on good news and up on bad news and act in seemingly irrational ways. Because of this, we offer regular market updates with key price levels, probable scenarios and likely outcomes based on our intermarket analysis. We also will offer periodic updates on current events, as well as pre-earnings analysis for all of our positions.

5. Webinars

I/O Fund Advanced offers webinars to go over key positions, any entries we are planning and/or exits plus 1-hour intensive deep dives, followed by a Q&A. You’ll get transparent information on the positions we plan to add to, the positions we plan to cut back on, and our thoughts on the market today.