Is Spotify a Bandwagon Stock? 8 Key Issues Famous Hedge Funds Are Ignoring

Bandwagons are easy to jump on but it can be hard to decide when it’s time to get off, especially considering Spotify stock has famous hedge funds like Soros Fund Management, Philippe Laffont of Coatue Management, and Louis Bacon’s Capital Management holding sizeable stakes. Since its IPO in April, Spotify has seen an $8 billion rally in market value for an all-time high market cap of $34 billion following Q2 earnings.

The bull storyline is that Spotify is the leader in streaming music with nearly 40% of market share in 2017 – which is double what Apple Music holds and 4x the number of Amazon music subscribers (source: Statista). There is a strong case for future earnings as 83 million monthly subscribers pay for Spotify’s premium service price at $9.99 per month to $14.99 for the premium plan.

Despite a healthy user base, I believe Spotify is reaching its peak due to hefty royalty payments, a miss in the razor-razor blade model, Apple’s recent acquisition of Shazam, and due to being a small fish in technological advancements such as AI and song services. The stock may have one or two good quarters left but investors should have a disciplined trailing stop. I expect that within 12-18 months Spotify stock will be in sell status with the potential to plummet in price on any single day in 2019 due to the following key issues:

8 Reasons Spotify Stock Will Be a Sell Recommendation by 2019:

Numbers Don’t Lie:

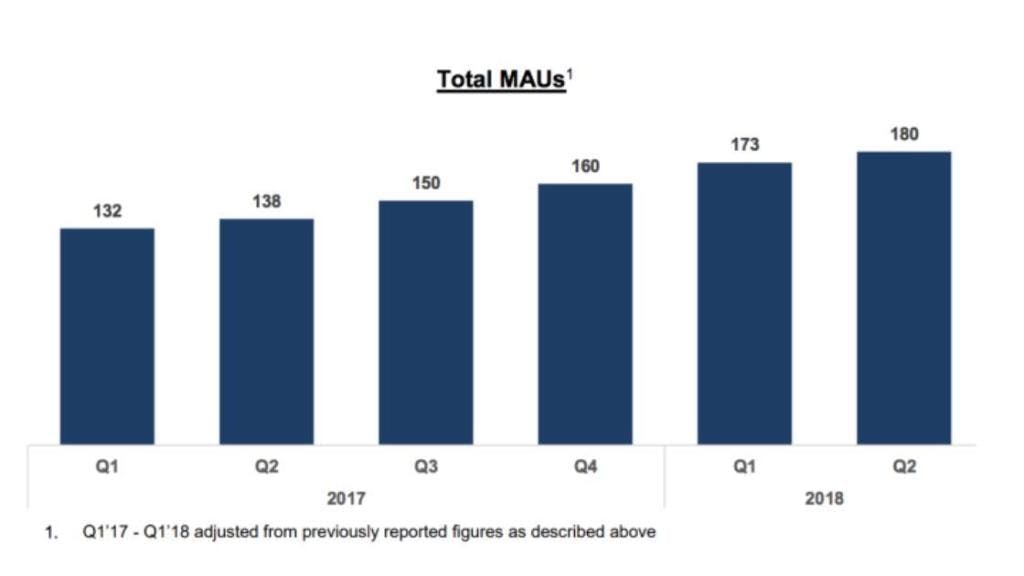
1. Numbers don’t lie  – as long as you know what to look for. When a company is a leader in a technology vertical such as music streaming, you can easily substantiate the company based on past performance. Yes, Spotify has 180 million users and reported 40 percent year-over-year growth in paid subscribers for $1.49 billion in revenue. However, Spotify missed big on EPS with a loss of -2.20 euro compared to estimates of -0.68 euro in Q2 due to the high cost of royalty payments to record labels and artists.

Investors should also watch user growth closely with Spotify as the company added fewer users this quarter compared to last quarter (13 million in Q1 compared to 7 million in Q2 or 5.9% QoQ). The estimates for Q3 call for 8 million users and meanwhile, the average revenue per user (ARPU) has dropped by 12%, which is likely due to bundled offers with Hulu and family plans.  The concern here is that user growth is hovering at 5-6% while ARPU is decreasing by 12%, thereby depleting the gains from user growth – meanwhile, competition continues to stiffen. In my opinion Spotify must reach at least 10% QoQ growth with ARPU increasing before I would invest in this application.
Apple Has Homefield Advantage:

2. Last month, Apple was cleared to complete the acquisition for UK-based music recognition app Shazam Entertainment for $400 million. The threat to Spotify and other competitors was enough for regulators in seven countries to contest the acquisition when first announced in December of 2017 but approval was granted to this potentially unstoppable push into enriched data and augmented reality features. To date, Shazam has had well over 1 billion downloads (last reported in 2016) and owns a wealth of information on what music is trending with over 20 million searches per day.

One thing about Apple, is that this company will not be beat on its home turf. Apple revolutionized digital music with the iPod and iTunes. With smartphone penetration, the Beats acquisition, its Homepod ecosystem and a huge push into connected car infotainment, Apple can surround Spotify in nearly every direction. Keep in mind, that 66% of the world’s paying app users are iPhone users who trend towards higher incomes (vs. only 34% on Android), so Apple users are supremely important for Spotify’s $9.99 subscriptions.

In fact, the turf war has already receded Spotify’s market share. Record industry sources state Apple is adding paying subscribers at a rate of 5 percent in the U.S. versus 2 percent for Spotify, and that Apple Music may have already taken over Spotify as the number one streaming service in the United States. Apple Music was launched only 2 years ago and has 40 million paying customers compared to Spotify’s 83 million paying customers which took 12 years to build.

My newsletter subscribers get this information first. Sign up here.My newsletter subscribers get this information first. Sign up here.here.

Razor-Razor Blade Model:

3. I like the Gillette analogy for tech companies and it’s one of the points I make as to why I’ve been long on Roku since its IPO. As the original set top box manufacturer, Roku players are the cheap razors that will deliver the razor blades of ad-supported content in the OTT market. (You can read more my analysis here on Roku). However, this is the same model that will ruin Spotify in the long run. At home assistants such as Alexa are designed and leveraged specifically for AI activated music services. Major record labels let Amazon offer a reduced Alexa version of the premium service at $3.99 per month and Apple is requiring users to sign in to Apple Music to power the HomePod – which completely shuts out devout Spotify. Car infotainment centers will be the next piece of real estate where Spotify is simply a guest (that will become increasingly unwelcome).

Lack of Technological Advancement:

4. Spotify states they have spent “years developing an intelligent music streaming platform that leverages proprietary artificial intelligence (AI) and machine learning (ML) tools” that tap into “datasets of over 200 petabytes.” It seems every app and platform in tech these days says they leverage AI and ML. Yet for Spotify, the evidence isn’t there in the functionality of the app. (For what it’s worth, I’m a Spotify Premium subscriber but this doesn’t mean I’ll buy their stock). Spotify is falling behind in voice-based computing with features such as asking for songs through verbal commands and voice-activated queries due to a lack of lyric recognition. The future for AI and ML, especially as it relates to music streaming, will be a world where you do not have to look at your phone to prompt the next playlist. As of last month (August 2018), even Pandora had search by lyrics with Google Assistant.

The second point here is the amount of data. Yes, Spotify has a lot of music specific data but, again, this is irrelevant when competing with Google, Amazon or Apple.

What About Spotify & Tencent?

5. As the earnings report states, “Spotify owns Tencent Music Entertainment (TME) shares and “a TME IPO would trigger a fair market value adjustment to the carrying value of our investment recognized in other comprehensive income. The gain could be significant.” This one-time, non-recurring event would generate a Net income for Spotify with a Net loss returning in the following quarters. Spotify stock holders should be aware that this one time wave may be worthwhile to hold on for, but that the long-term prospects of the company are still not proven.

6. Some speculators have suggested Spotify is a great acquisition target – which is correct. Google attempted to buy Spotify in 2014 and Tencent also tried to buy Spotify prior to the IPO sometime in 2017. Spotify was priced too high then and is most certainly priced too high now. It will have to demonstrate that it has staying power as a public company, which I believe is where Spotify will falter. Meanwhile, Spotify founders and investors can sell their shares any time as Spotify did not have a traditional lock-up period and this was cited as one of the risks to holding Spotify stock.

A Few More Points:

7. The music industry is not loyal to Spotify. Any catalog Spotify has is likely to be duplicated across all music streaming services, offering little differentiation across competitors for content. (Compare this to OTT streaming like Netflix which is highly differentiated through original content). If anything, artists dislike Spotify very much and are often bringing class action lawsuits against the company. And even though Spotify has paid over $10 billion since 2016 to artists, it’s still not a fair wage according to the musicians who see about $5,000 for every 1 million streams. In this case, Spotify is not pleasing the geese who lay the golden eggs, and this is a huge risk in their business model.

8. Pandora is a cautionary tale as it had a steady first year after its IPO until it dropped 40% in one day in October of 2015. The company reported a quarterly revenue increase of 30% year over year, which was within guidance, and advertising revenue had also grown 31% year over year. But there was a $90 million settlement related to royalties and Pandora’s active listeners only rose 2.1% year over year and declined quarter over quarter. I believe Spotify will share a similar fate in the near future.

Featured image by Gavin Whitner

Please note: The I/O Fund conducts research and draws conclusions for the Fund’s positions. We then share that information with our readers. This is not a guarantee of a stock’s performance. Please consult your personal financial advisor before buying any stock in the companies mentioned in this analysis.

Fast Growth in 4K Televisions and UHD Content Requires Premium Content Protection

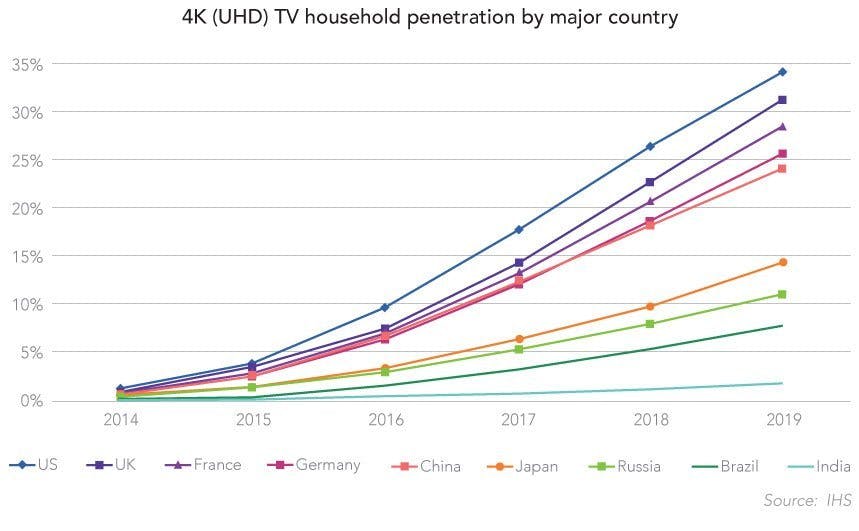
Ultra HD televisions are one of the fastest-growing segments in the history of consumer electronics. Within the first three years of shipments, 4K/UHD overshadowed HDTVs by nearly 4x with 16 million units shipped compared to 4.2 million units1. Since then, rapid penetration is occurring globally with 35 percent of all U.S. households forecast to have a UHD television by 2019, followed by the United Kingdom with 31 percent, 25 percent in the European Union, and 24 percent in China. Global units shipped reached 82 million in 2017 up from 53 million in 2016. .

The global 4K TV market is expected to reach 380.9 billion by 2025 due to enhanced graphics, the pressure for manufacturers to reduce prices and the popularity of ultra-high definition (UHD) content2.

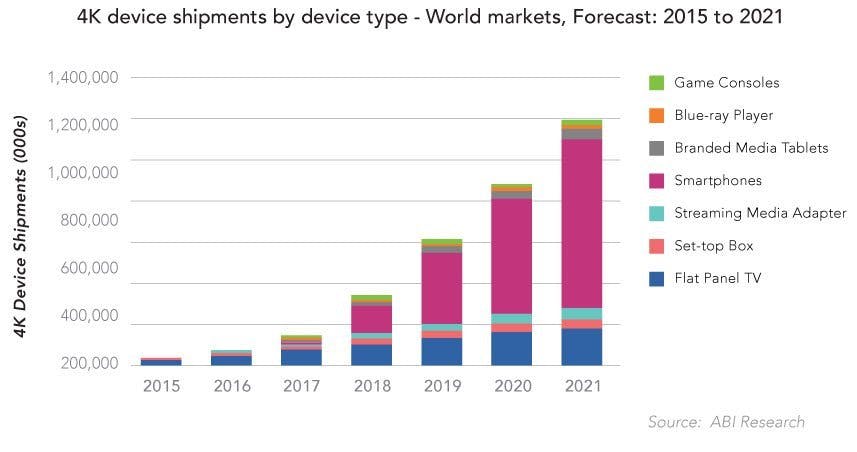
The rate of growth of 4k shipments is at 70% growing from 83 million 4K devices in 2016 to 1.2 billion in 20213. While flat panel TVs are the largest segment of devices in 4K format, streaming media adapters, set-top-boxes, mobile devices, Blu-ray players, and game consoles follow closely behind. Following the popularity of 4K devices, there has been a growth of 4K content. Initially, 4K UHD content was available for live sports and some video on demand. Today, 4K content is seen as a premium offering albeit an expensive one with a digital copy of a 4K movie costing US $30.

My newsletter subscribers get this information first. Sign up here.My newsletter subscribers get this information first. Sign up here.here.

Revenue from the display market will grow from $18 billion in 2015 to $52 billion in 20204.

BT Sport was a pioneer of 4K broadcasts, and Netflix and Amazon were also early to the market to deliver 4K/Ultra HD content with hits such as Stranger Things and House of Cards. Today, most major broadcasting companies and content providers have joined to provide 4K/UHD content. AT&T has a DirecTV dedicated 4K channel including the MLB network with 4K baseball broadcasts, PGA tournaments, and UFC fights. The Olympics, Warner Brothers, BBC’s Planet Earth, Hulu and YouTube also offer UHD and HDR content.

Movies and TV shows display four times the resolution with UHD as compared to HD content5, and therefore, it has become the studios’ most valuable content requiring robust content protection.

Set-top-box makers provide 4K UHD set-top-boxes (although OTT content does not require a set-top-box to stream 4K content). While better hardware continues to be made available, the 4K UHD content is a major driver. For streaming media adapters, 4K video quality as an added feature is becoming the differentiator among streaming media adapter vendors. Most major vendors across both streaming media device adapters and players have launched 4K products.

How to Secure Premium UHD Content

Today, there are two choices for content protection: (1) legacy satellite and cable TV content protection systems based on conditional access or (2) digital rights management, which serves the internet-based over-the-top (OTT) market. Due to the valuable nature of UHD content, very high security requirements must be met. This is one area where digital rights management protection has an advantage over conditional access. There is a premium placed on 4K/UHD content, and therefore, having the security mechanisms moved from the hardware to the network level to be protected through secret keys and the return path of the IP channel is essential.

The high resolution and image quality of 4K/UHD television content is on par with high quality digital cinema. This means that 4K/UHD television files are very valuable property and have to be protected accordingly. MovieLabs, a research and development organization focusing on movie and television technologies, has published Enhanced Content Protection specification (https://movielabs.com/solutions-specifications/enhanced-content-protection-ecp/) to provide a guideline for 4K/UHD content protection requirements.

The MovieLabs 4K/UHD content protection specifications require video playback device makers to support:

  • A TEE (trusted execution environment) that must take care of content decryption, and handling of any cryptographic material e.g., device keys, content keys etc. as well as other security processes.
  • A SVP (secure video path) where the decrypted buffer is securely transmitted to the rendering element of the device e.g. display
  • Hardware descrambler
  • HDCP 2.2 or higher
  • Watermarking

The SoC (System on Chip) platforms that power modern digital devices are advancing their security features to support these requirements. Intertrust’s DRM solution, ExpressPlayTM, takes advantage of SoC implemented security features such as TEE and SVP. ExpressPlay also supports watermarking to offer the highest level of content protection for premium content distribution.

I consult for financial firms. Inquire here

Here’s Why Roku Stock Will Surpass $100 In Next Two Years

Roku’s stock (ROKU) is getting a lot of attention after it reported stellar second-quarter results due to 57% year-over-year revenue growth to $156.8 million beating the analyst forecast of $141 million. Compare this to 37% year-over-year revenue growth in Q1. However, as I stated in my Q1 article, the platform revenue is where Roku will continue to see a majority of the gains. The video streaming platform revenue was up 96% during the period to $90.3 million with player revenue up 24% to $66.5 million.

Some of the analysis below is taken from an article I wrote last quarter on Seeking Alpha. The information has not changed, but the stock price is beginning to adjust to Roku’s product-market fit. I do expect some correction from today’s stock pop, but these fundamentals are why I’ve been long on Roku from the beginning (and beating out Amazon Fire Stick isn’t one of them). I do expect Roku to experience some volatility on its path to becoming a large cap stock, however, specific industry trends are supporting Roku stock, and ultimately, these trends will win out.

1. Blood In The Water:

Roku offers the most synonymous business model with cable and satellite TV providers and can capitalize long-term on this massive subscriber loss by leveraging its advertising, audience development, and content distribution services, which make up 89% of gross margins from the platform. In fact, if Roku was a traditional cable company, this quarter’s 22 million active subscriber base would rival Comcast (CMCSA) for the place of second largest distributor of content in the United States. Only AT&T (NYSE:T) has more with 47 million DirecTV subscribers.++

The peak for pay TV in the United States occurred in 2010/2011 when it began a predictable erosion. The number of pay TV subscribers fell by 8,000 in 2012 and accelerated to 164,000 subscriber losses in 2014. Last year, the erosion neared deterioration with the top 10 pay TV operators losing a staggering 3 million linear subscribers in 2017 according to Leichtman Research.

2. Vendor Agnostic:

Roku critics cite too much competition for this mid-cap stock to carry the growth needed for long-term gains, especially from Apple (AAPL), Google (GOOG) (GOOGL) and Amazon (NASDAQ:AMZN) who all have a play in the hardware market for OTT video streaming services. However, this weakness is actually Roku’s strength. The Roku operating system, Roku OS 8, is a robust, reliable option for OTT streaming and has attracted partnerships with 1 in 5 smart TVs in the United States.

Meanwhile, operating systems like Samsung’s (OTC:SSNLF) Tizen continue to be plagued with bugs. But by being vendor-agnostic, Roku has still been able to secure a partnership for their free ad-supported channel with competing OSs like Samsung/Tizen. In addition, by remaining agnostic, Roku has maintained a full menu of original programming while corporate spats between Google (YouTube) and Amazon Prime restrict content choices.

Roku has also built a formidable catalog of 5,000 channels that even Google has not even come close to rival. This is where the discussion as to Roku being a hardware company should curtail as the “player” revenue has been eclipsed by the platform revenue (platform revenue stood at 45% in Q4 2017 compared to 57% in Q2 2018). It’s the latter where the company is making its largest investments including OTT advertising measurement tools, launching the free Roku channel, growing licensing fees, and partnering for live TV. The launch of live news in mid-May and the World Cup in June also contributed to platform performance in Q2.

3. There’s More To OTT Than Highly Fragmented Subscriptions:

Previously, viewing data and ratings on SVOD (subscription video on demand) such as Netflix (NFLX), Hulu Plus, and Amazon Prime and other OTT content was not disclosed even by Nielsen (NLSN). However, in a recent interview, Nielsen COO Steve Hasker revealed four previously undisclosed statistics about SVOD such as 89.5% of SVOD content is primarily viewed on the television glass whereas 11.5% is viewed on smartphones and tablets.

Of this time, 80% is spent on catalog programming whereas 20% is spent on original content. Meanwhile, as competition increases, the costs for original programming are escalating with Netflix spending $8 billion in 2018 in order to remain competitive for a small piece of the pie (20% of how time is spent). Meanwhile, Roku has held firm on not creating original programming and the statistics support this. The costs for original programming are likely to escalate as HBO, Showtime, and now Apple will continue to compete for this space.

In addition, subscribers pay for quite a few premium $8+ subscription channels, which will eventually lead to subscription fatigue – not to mention mitigate the reason cord-cutters leave pay TV services – which is to lower costs. For a subscriber with YouTube TV ($40) and three premium channels ($24-26), they are paying $65+ per month. This pricing will meet resistance by cord cutters and ad-supported video on demand (AVOD) will be the answer.

Most importantly, original programming will consolidate or bundle (like it has on cable) and Roku is the perfect middleman to do this.

My newsletter subscribers get this information first. Sign up here.My newsletter subscribers get this information first. Sign up here.here.

4. Global Potential:

This point ties into the previous two points where agnosticism in hardware and operating system along with building out a free, ad-supported channel will help Roku crush global expansion – especially in the emerging markets. The low price point for both the hardware and free content is desirable for global adoption, plus the 5,000 channels that Roku offers caters to differences in cultural viewing preferences. Most recently, Roku has announced offering the Roku Channel on the web in the United States which will serve people who do not have a set top box or television. Don’t be surprised if their next move is to take this web channel global. For instance, while India has roughly 180 million television sets, the country has nearly 300 million smartphones which a global Roku Channel could potentially reach.

Bottom line is that Roku has shown competitive vigor by maintaining the lead as the top streaming media player in the United States claiming 37% of devices with nearly 40 million U.S. customers use Roku once per month. It’s only a matter of time until they take this success to the billions of people overseas who can’t afford pay TV or want to reduce pay TV costs.

5. Purely OTT Play:

In reference to the first point, there is an opportunity to capitalize due to massive pay TV subscriber losses such as last month when Charter (CHTR) lost 12% of market cap after reporting 112,000 subscriber losses and Comcast reported a loss of 98,000 in video users compared to a gain of 41,000 one year ago in Q1 2017.

This bloodbath from attrition will continue to accelerate through 2025 when even TV networks are expected to experience a 41% revenue loss. Roku is a very desirable purely OTT mid-cap choice with 22 million users and a $5.75 billion market cap that narrows in on this staggering market trend. Compare this to Charter Communications, which has a $69 billion market cap and only 16 million users.

Conclusion:

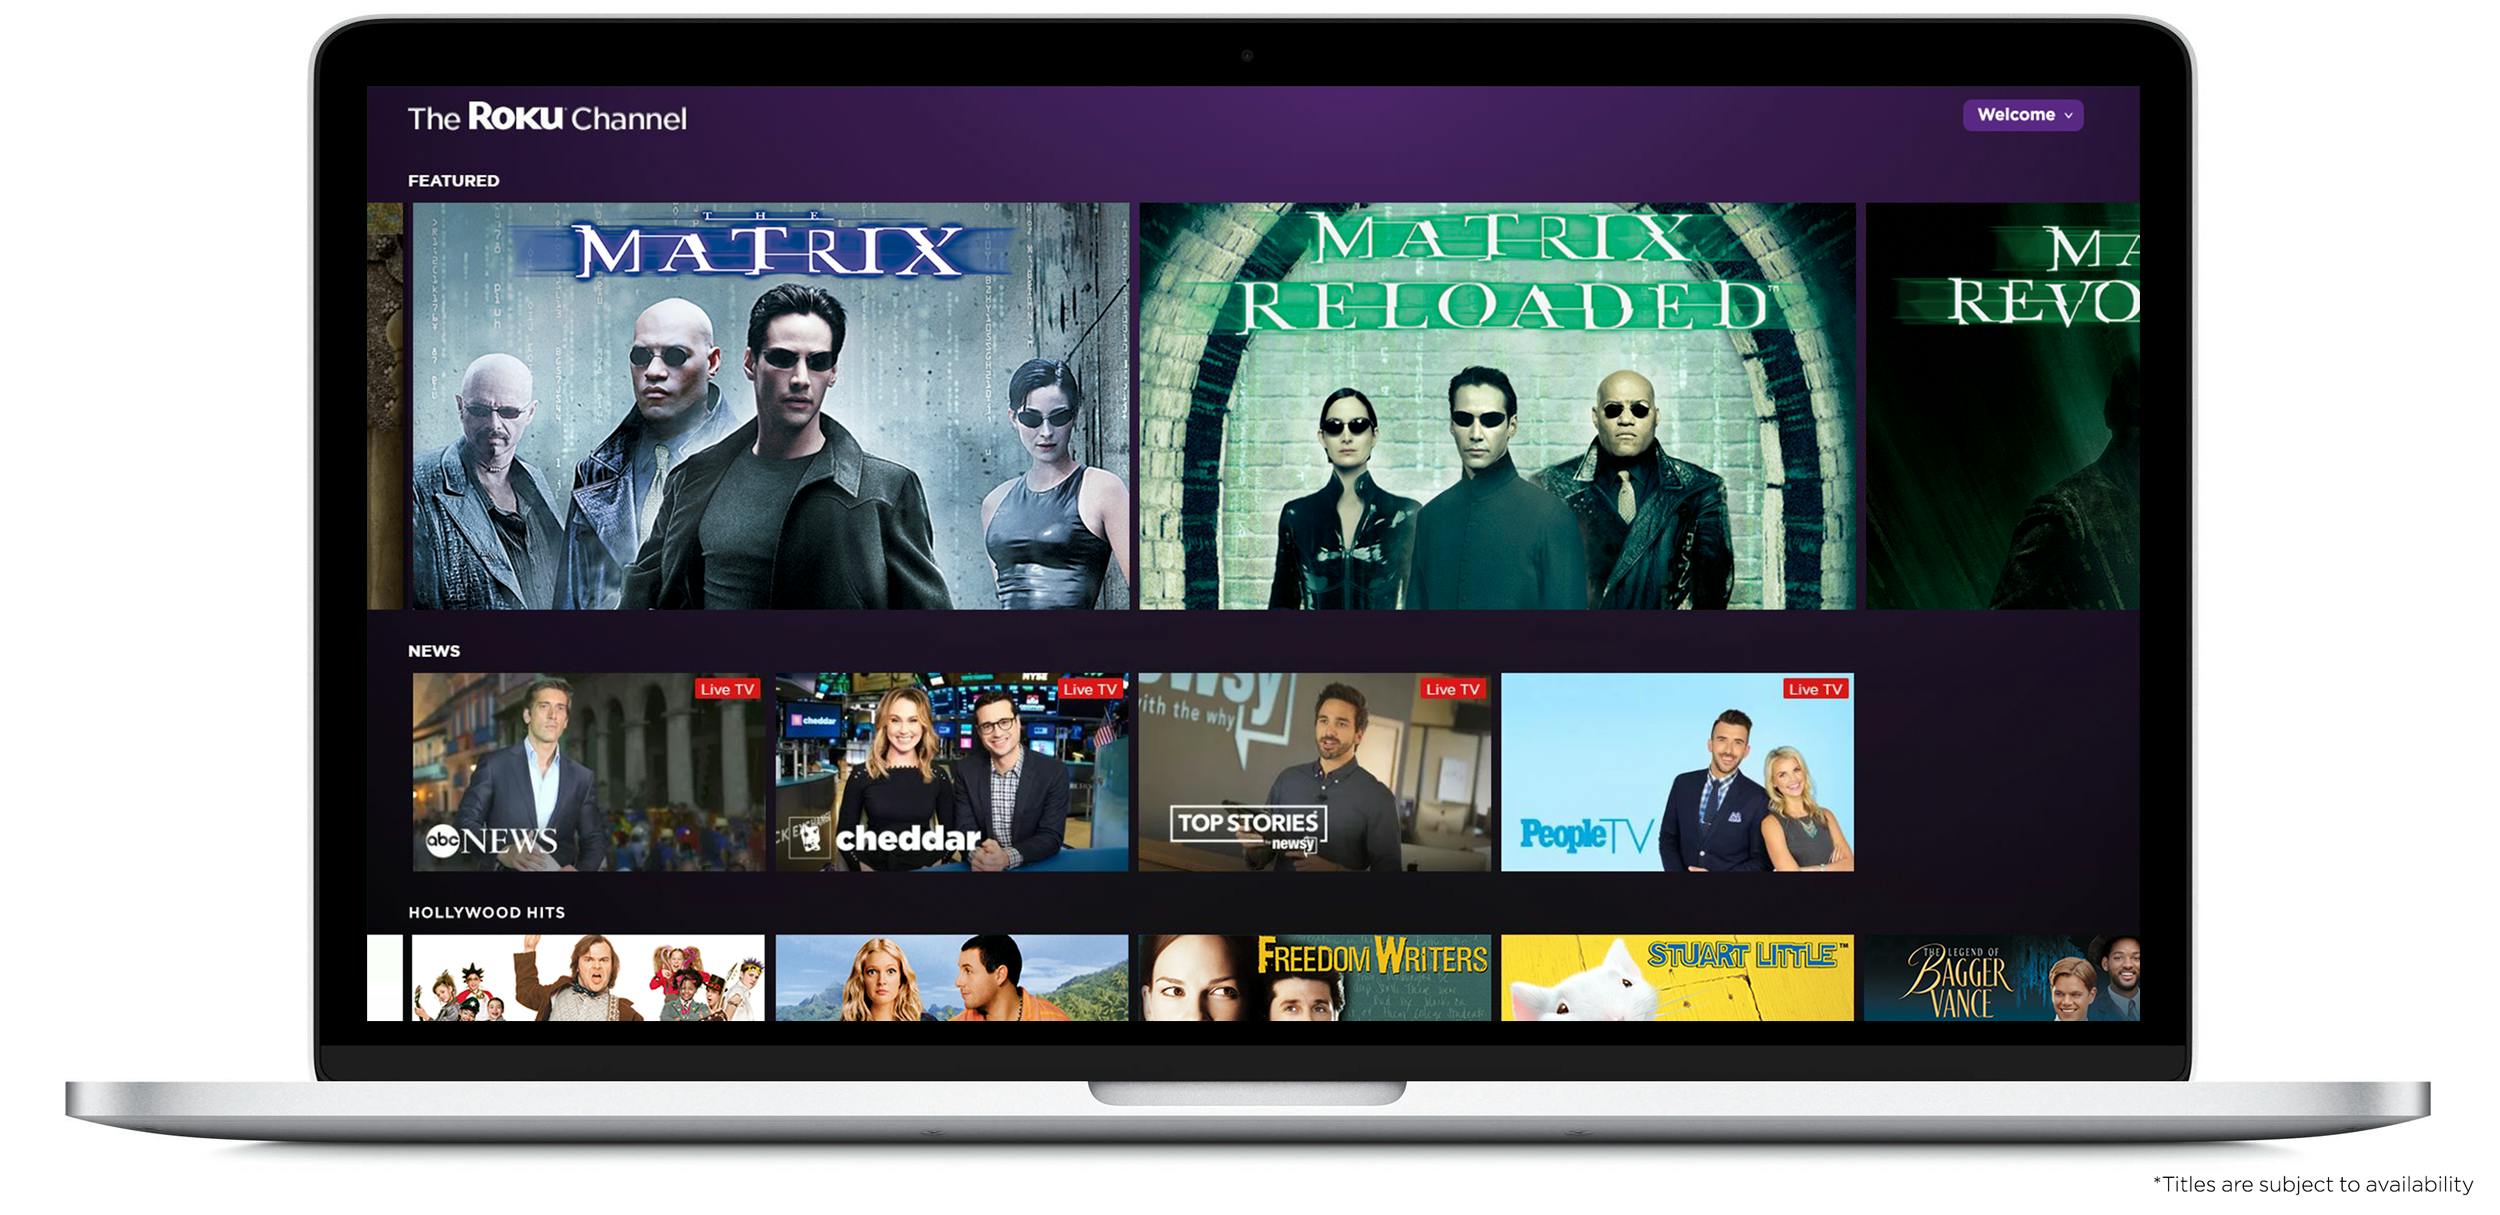
In the next 2-5 years, Roku stock will outpace competitors globally as it continues to be the cheapest, agnostic option with the most channels. Its executive team is experienced in OTT media and advertising, and the platform revenue will redefine how investors see this razor/razor blade opportunity (device player that locks in licensing fees and advertising). The free channel especially is attractive setting it apart from the overabundance of paid, subscription channels. In addition, live TV will be an attractive space for Roku with the company already recently partnered with ABC News, People TV, and Cheddar.

 Any information or analysis contained herein and published or referenced elsewhere should be appropriately credited to Beth Kindig of beth.technologybeth.technology

This article appeared on Seeking Alpha.

I Predicted Facebook Would Miss Q2 Earnings: Here’s What Investors Need To Know For Q3

This is a crucial time to point out to investors that my predictions were correct. Last April, I published an in-depth analysis on Seeking Alpha along with predictions for Facebook (FB) stock. The analysis urged readers to ignore post-Cambridge Analytica hype as Facebook’s quarterly earnings would miss as a result of GDPR. Specifically, I stated the culprit would be revenue and data sources outside of the Facebook “family of apps.” However, with this article, I’d like to explore this point even further and explain with granularity why the issues have only begun and what Facebook isn’t telling you (source for Facebook earnings report: NASDAQ).

Tech companies are complex, especially as it relates to data science, and it’s unlikely a financial analyst or hedge fund whose expertise is in finance understands what exactly Facebook does with data and how this impacts average revenue per user (ARPU) or future earnings.

There’s more to Facebook than a “family of apps” which is causing confusion in the markets.

Have you heard of Audience Network? As an investor, it’s essential that you know what this is. Facebook makes money off third-party websites and applications through a platform called Audience Network. This is an advertising network, which powers advertisements to 40% of the top 500 applications. This is indicative of Audience Network’s overall presence in the mobile app market of approximately 40%. While it is well known in the mobile industry as the most dominant ad network in the mobile market, don’t be surprised if you’ve never heard of it.

Facebook Inc. doesn’t like to talk about Audience Network. You’ll be hard pressed to find any mention of it in their SEC filings or on earnings calls. Even among advertisers, who pay billions of dollars into Audience Network, the ad platform is notorious for its lack of transparency and is known to be a black box.

And, it’s a very profitable black box. The last time Facebook reported Audience Network numbers, it served advertisements to over 1 billion people per month at the end of 2016. That’s more than Instagram today, and this incredible base should be more like 2 billion in 2018 assuming it followed the same trajectory of adding 1 billion users every 2 years (Audience Network was launched in 2014).

With Audience Network, advertisers see 16% more reach on average globally than on Facebook and Instagram alone, and a 12% increase in website conversions with Facebook and Audience Network combined.

What could possibly have more reach than Facebook or Instagram?possibly have more reach than Facebook or Instagram?

Whoa – higher reach than Facebook and Instagram? And higher conversions? And all of this to over 1 billion people outside of Facebook’s “family of apps”?

Why is Audience Network so widely used in the mobile industry? Because it’s augmented with proprietary data from Facebook’s social apps. In order to power ads across hundreds and thousands (maybe even millions) of applications at a higher conversion than the world’s best advertising platforms (Facebook and Instagram) would require using data in ways that you would never want your users to find out about.

My newsletter subscribers get this information first. Sign up here.My newsletter subscribers get this information first. Sign up here.here.

I mean, what Facebook user would want their private information brokered to hundreds of applications to power advertisements in websites and applications that they didn’t authorize or have relationships with? From the backlash we saw after Cambridge Analytica, I’m guessing not many would like this.

Let me stop because this is where a lot of confusion begins. I’ll give you an example as to how this works. Let’s say you buy items from the retailer Target (NYSE: TGT) every week. Maybe you buy toilet paper, dish soap and laundry soap. How would you feel if Target used that data in a partnership with Hulu or NBC or CBS to show you advertisements later on your television? That evening, Hulu or NBC or CBS would start to show you toilet paper ads and laundry soap ads based specifically off your private purchases and information shared at the cash register.

Target would make a lot of money if they brokered your private cash register data – but they don’t. Apple (NASDAQ:AAPL) has been very upfront about the billions of dollars they have opted to not make by keeping data private. This is what Tim Cook is referring to. Investors should know that it’s very, very rare for a company to risk the customer relationship in this way.

Meanwhile, Facebook is doing this across hundreds and thousands of applications using private data shared in what should be a privileged customer relationship. Not only that, but Facebook takes your private data from application partners (in this fake example, that would be Hulu, NBC or CBS) – so now they know what you were watching that night – but you never gave consent for any of this.

Data collected from the Audience Network software development kit (SDK) installed in iOS and Android applications continues to enrich Facebook proprietary data sets and drive up cost per impressions on advertising and average revenue per user. This business model of being a “data-broker-and-ad-network-without-consent-and-for-profit-beyond-social-media” is where some of the fallout from Cambridge Analytica began to occur. But this is miniscule compared to the data exchange (dare I say, data leakage?) through Audience Network.

Ethics aside, what investors need to know about Audience Network is that it violates some important regulations put into place by the GDPR as data is being used by both partners in ways that are explicitly without consent (Facebook users have NO IDEA how their private data is being used beyond the “family of apps.” On that note, investors don’t either because all Facebook ever talks about on earnings calls is the “family of apps” – never referring to Audience Network by its name).

The applications who share data with Facebook are at risk and Facebook who brokers proprietary data with partner applications are at risk if they continue this practice. In 2020, these regulations will also go into effect in the State of California. Facebook will have to slowly wean Audience Network out of existence or face major fines. As this weaning takes place, the revenue earned from 40% of the top 500 apps (plus more) will slowly dwindle.

How Much Are We Talkin’?

Quite a few people have asked me to estimate the value of Audience Network. I want to be clear that Facebook has provided very little information here. While the exact number of how much Audience Network is impossible to predict with pinpoint accuracy (insert: lol) the important thing to understand here is that the average revenue per user will drop on Facebook social because they will no longer store data and use that data from partner applications.

One reason there is limited information is that Facebook runs Audience Network ads through their Newsfeed feature, and therefore, uses this loop hole to count the revenue as Facebook revenue. This is very misleading to not provide transparency. Compare this to Alphabet which clearly discloses third-party websites and application revenue as a separate line item in their SEC Filing of roughly $17 billion per year.

Here’s one of the only statements issued by Facebook on Audience Network’s reach:

“We talk about reaching a billion people every month, and these are real people,” said Brian Boland, VP of publisher solutions at Facebook. “We’re not talking about cookies or browsers or devices or ID, where one person can look like six things. We’re talking about legitimately 1 billion people that can be reached on the audience network[2][2].”-Q4 2016

This means Audience Network is larger than Instagram today (Instagram has 800 million users). This also means Audience Network was 2 times larger than Whatsapp at the time of acquisition when Whatsapp had 484 million users – enough to claim the largest acquisition price tag in history of $19 billion.

This is how I estimated the net value at $5 billion minimum up to excess of $10 billion net to Facebook (after 70% revenue share with publishers).

  • Audience Network serves approximately 40% of the mobile apps on the market today which means Facebook likely monetizes every person with a smartphone (i.e. over 3 billion people rather than the 2.2 billion on Facebook social apps). Plus, they monetize this 3 billion many times over across unlimited inventory.
  • Google monetizes 2 million websites and 650,000 apps for $17 billion in third-party network revenue. Facebook Audience Network has a larger reach on mobile than Google’s ad network and the SDK could be in up to 2 million iOS and Android applications (figuring 40% of applications).
  • Facebook warned of ad load issues due to limited real estate in social network apps in earnings calls in 2016, however the exact opposite happened. Revenue skyrocketed and Facebook doubled the number of advertisers from 3 million to 6 million. This growth would have been supported by Audience Network as the ad network would eliminate ad load issues. Facebook added $23 billion in annual revenue since warnings of ad load. A large portion of this would have been supported by Audience Network alleviating ad load.

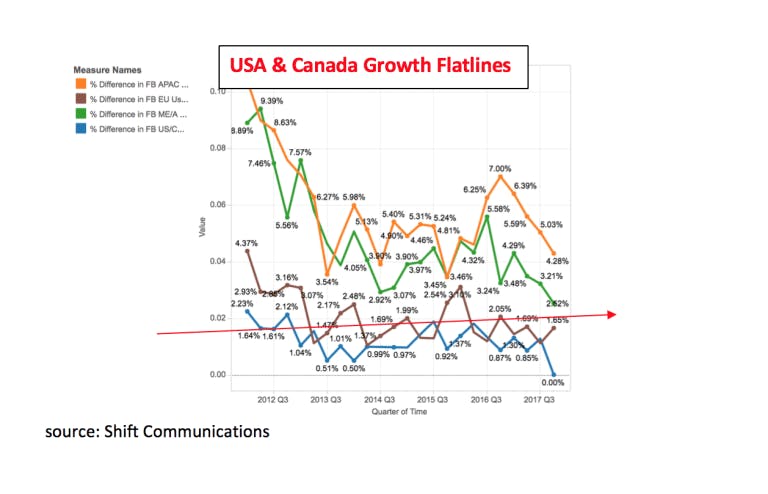
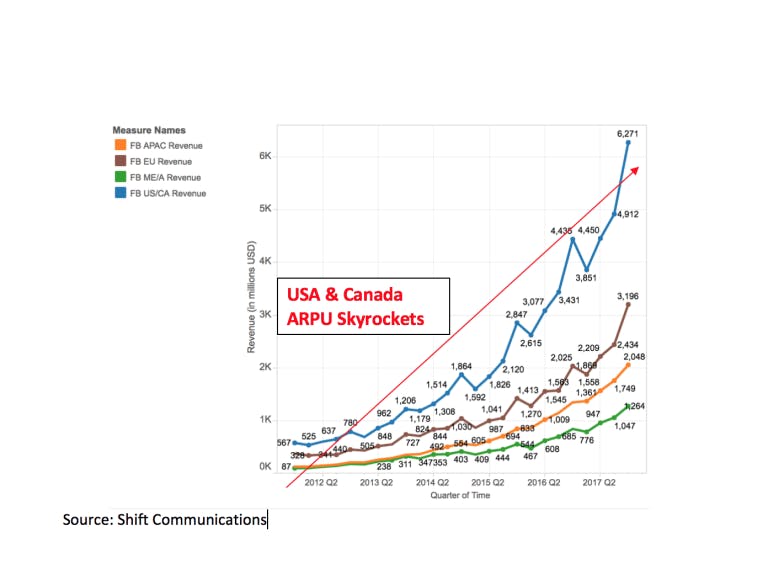
Most importantly, Facebook does not have to net anything off Audience Network in order to increase average revenue per user on its own social media apps. Growth in the United States and Canada flatlined a long time ago, meanwhile the ARPU (average revenue per user) skyrocketed. Data extracted from Audience Network would have substantially contributed to this ARPU growth. This is essential for investors to understand.This is essential for investors to understand.


Therefore, any ARPU made after the warning of ad load issues in 2016 and 2017 are questionable as the enriched data and targeting capabilities from Audience Network likely contributed to this ARPU growth.

Images from Shift Communications can be found here 

Additional Considerations for Facebook’s Q3 Earnings:

  1. User attrition and slowing user growth has been occurring for some time in the United States and Canada, yet earnings previously remained strong with ARPU climbing to $26 per user in these coveted markets. Therefore, a small user attrition of 1 million European Users from a base of 2.2 billion monthly active users is not why we are seeing the first revenue miss with Facebook executives warning of more decline to come. To believe the stock dropped because of infinitesimal decimal point user attrition is a dangerous theory propagated on earnings calls because your next thought will be whatever revenue lost from the Facebook user base could easily be made up by Instagram or one of the other “family of apps.” If you believe this storyline, then you will continue to hold onto this stock without having all of the information.
  2. The other Facebook domain properties such as Instagram, Whatsapp, and Oculus should be ignored for now. Yes, Instagram has potential but this is not what you are investing in when you buy Facebook stock. It is sheer speculation and if Instagram was a standalone company, you wouldn’t be paying these stock prices. You bought Facebook, Inc and to hype up Instagram as the central business model in 2018 is senseless.
  3. First-party data uploaded to Facebook by advertisers has weakened. The GDPR has a trickle-down effect by weakening the data advertisers upload to the Facebook newsfeed. This reduces the targeting power and the CPMs they can charge. I made this point in my Seeking Alpha article that “many brands will undergo the same regulations as to how they obtained their data.” In addition, Facebook is shutting down the self-serve tool that allows advertisers to import data from third-parties. This will also continue to erode earnings.

Conclusion:

Investors cannot expect transparency from Facebook executives. This company has better trained actors than Hollywood (sorry, but true). There are many instances in prior earnings calls where they purposely covered up revenue sources, such as Audience Network, in order to keep Wall Street confidence high leading up to these quarterly earnings (I’m working on a follow up article citing these specific omissions). They played down the impact of the GDPR and have omitted third-party mobile applications and websites revenue from SEC Filings. It is nearly impossible to evaluate the stock with what little information has been provided by Facebook, Inc.

But remember, this is a company that has misled the general public, Congress, and most importantly their users on important facts about their business model and revenue streams – especially that they use the data from Facebook across a huge network of applications and websites without authorization from their users. Quite simply, investors have been caught in the cross fire of Facebook’s attempts to cover up privacy issues with their users.

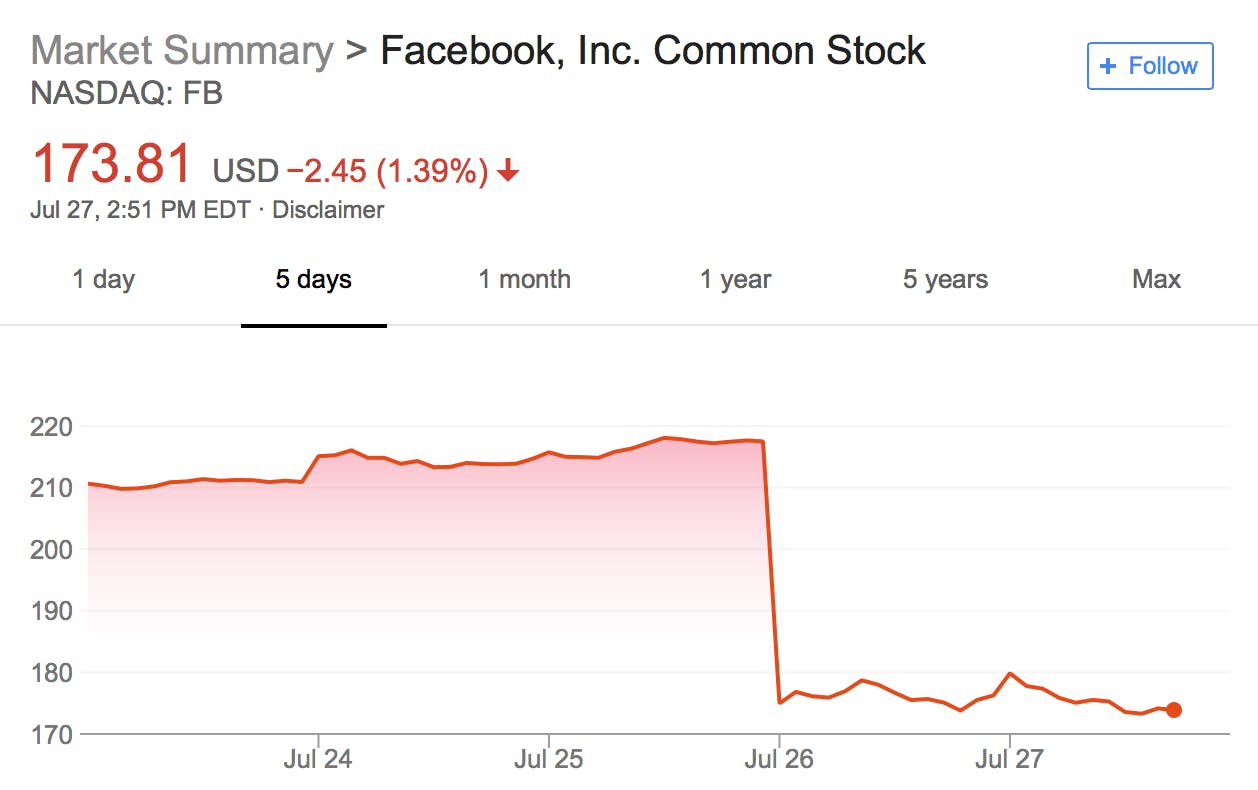
While the drop yesterday was “startling” for investors caught unaware, my readers on Seeking Alpha and beth.technology were fully informed with insider knowledge as to the underlying forces which are at play with Facebook, Inc and mobile advertising. You can subscribe to my newsletter here.

Any information or analysis contained herein and published or referenced elsewhere should be appropriately credited to Beth Kindig of beth.technologybeth.technology

This article appeared on Seeking Alpha.

The Good, the Bad and the Ugly About Google’s $5 Billion Antitrust Fine

To summarize, the $5 Billion Antitrust Fine on Google is due to the following issues:

  • Google has required manufacturers to pre-install the Google Search app and browser app (Chrome), as a condition for licensing Google’s app store (the Play Store);
  • Google made payments to certain large manufacturers and mobile network operators on condition that they exclusively pre-installed the Google Search app on their devices; and
  • Google has prevented manufacturers wishing to pre-install Google apps from selling even a single smart mobile device running on alternative versions of Android that were not approved by Google (so-called “Android forks”)  source: European Commission

New gadgets and the promise of AI have helped to successfully rebrand Google’s search and advertising business, however, it’s important to remember that Alphabet is still an old-fashioned advertising company with nearly 90% of Q1 2018 revenue, or $26.6 billion, coming from advertising and only 15%, or $4.6 billion, coming from these other ambitions.

Therefore, understanding the nuances of advertising especially as it relates to data collection is going to be key for Alphabet investors. Unfortunately, top-rated analysts struggle to understand Alphabet’s business model and CEO Sundar Pichai did not offer any answers. In the Q1 2018 earnings call, Mark Mahaney of RBC Capital Markets asked if the “GDPR or other regulation is likely to impact materially the targeting capabilities that advertisers have on Google?” The CEO replied:

“You know, above everything else as we are working through GDPR we are making sure we are focused on getting that user experience right for our users and our partners. But to clarify your question further, you know, first of all, it’s important to understand that most of our ad business is Search, where we rely on very limited information, essentially what is in the keywords to show a relevant ad or product.”

This answer was over-simplified at best. Yes, Search is a large driver of revenue but what are the other portions of the advertising machine which will be affected? And how much revenue do the higher risk methods currently contribute to earnings?

Data & the $5 Billion Antitrust Fine: The Good, The Bad and The Ugly


The Good: Search Doesn’t Need Data; Gmail, Chrome and Google Maps Have User Consent

Quite a few of Google’s data-driven applications and services such as Gmail, Chrome and Google Maps can easily obtain user permission in exchange for the services these applications and browser provides. In addition, Google AdWords, which is based off search intent, will provide a safe haven for Google’s advertising revenue as this does not require the company to harvest private data. However, even search is not immune as it’s been enriched with data such as location to enhance search results.

The Bad: Android OS Collects Surveillance-Level Data without User Consent through pre-installed applications

While pre-installed applications help cement Google’s search dominance, there is much more going on behind the motivation for risking antitrust violations. It’s hard to know where to start when looking at Google’s sprawl of potential data regulation and antitrust issues. We could start with the fact they have a deal with data brokers that gives them access to 70% of our purchases made with credit cards and debit cards (without consent). The company is literally in your bank account. This is for the purpose of letting advertisers know if you completed a sale following an ad seen on one of Google’s properties. Another place to start is implicit data for advertising purposes, which uses your search history to target ads to you outside of Google search. This is why when you privately email your friend about a trip to Rome, you mysteriously get advertisements for flights to Rome on other websites. In one study of 850,000 internet users last year, mainly in the U.S. and Europe, Google tracked 64% of all pages loaded by mobile and web browsers.

While online tracking and conversion tracking are both invasive, the Android operating system is a surveillance-level behemoth with over 2 billion devices in circulation while littered with millions of applications leaking data to Alphabet’s advantage. Exponentially speaking, Android is impossible to contain. One study by the French research organization Exodus Privacy and Yale University’s Privacy Lab found that more than three in four Android apps contain a third-party tracker which extracts personal information, including location and in-app behavior. The apps the trackers were discovered includes Uber, Twitter, Spotify, and Tinder. The Privacy Lab found the in-app trackers revealed “an extensive data mining market buried within the mobile app ecosystem” enabling physical surveillance including through the use of WiFi, Bluetooth and ultrasonic sound inaudible to the human ear to track geolocations in real time.

Takeaway (from my article dated May 31st): Android will be the most likely source for fines by the European Union as it will be challenging to partition device IDs by geographies. Some have conjectured Alphabet will risk fines before voluntarily reducing their cyber intelligence. The fines are 1.6% of annual global revenue, or $4.4 billion for Google.

Update: Antitrust is a much better approach to breaking up the monopoly Google has on data collection.

My newsletter subscribers get this information first. Sign up here.My newsletter subscribers get this information first. Sign up here.here.

The Ugly: Walking the Razor’s Edge Between Data Violations and Non-Personalized Ads

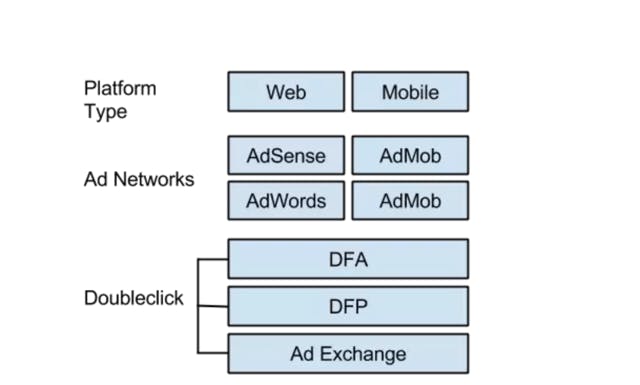
Data collected from the Android OS augments and enriches data science modeling for Alphabet to monetize the data elsewhere. That “elsewhere” is Adsense, AdX and AdMob. Google’s AdSense and AdX Networks enable non-Google websites to incorporate Google display advertising, and this is what current publishers are in an uproar about.

To summarize, Alphabet is attempting to become a co-controller for data in some instances and a processor in other instances. It’s unknown how the European Union will view data leaks from publishers to Alphabet.

Source: Quora

The level of involvement Google has as either a co-controller or processor is important for investors to understand as these regulations continue to play out. This may be hard to imagine today, but if data collection returns to property-owned data collection only, then the premium price advertisers pay for Google ad inventory may diminish as Google will struggle to differentiate itself from other advertising options from a campaign ROI standpoint if or when it fails to get the proper consent to collect the data and broker the ads.


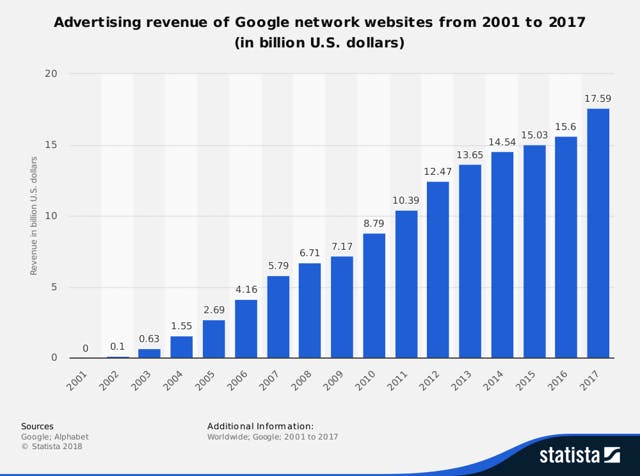
Source: Statista

The worst case scenario here is that Google has to display “non-personalized” ads where consent isn’t obtained — which Google is already prepared to do: “As previously announced, we’re also launching a Non-Personalized Ads solution (DFP/AdX, AdMob, AdSense) to enable publishers to present EEA users with a choice between personalized ads and non-personalized ads (or to choose to serve only non-personalized ads to users in the EEA).”

As mentioned above, this is where the premium price can potentially recede. By being forced to serve non-personalized ads, the competitive advantage Google has will diminish in this circumstance.

Bottom Line:

While Search is intact, there are many layers to data collection and ad targeting which will lower ROI campaign performance as the data Alphabet is allowed to collect continues to wane. In this article, we’ve discussed that the Android OS is leaky and the most likely part of Alphabet’s business to be fined. As far as revenue is concerned, non-personalized ads is the potential weakness especially on network sites as $17.59 billion was earned from network sites annually in 2017.

Oracle Hit From All Sides: Iaas Cloud and Programmatic

Summary: Infrastructure as a service (IaaS) is the fastest growing cloud segment and will continue to be with AI, machine learning and connected cars. Gartner, an authority in tech analysis, placed Oracle in the “niche player quadrant” (not the leader quadrant) for Infrastructure as a Service (IaaS) May 22. In addition to IaaS, Oracle’s Data as a Service business model will weaken as marketers fail to get proper consent for ad targeting.

Cloud infrastructure is hot right now and for good reason. The world increasingly relies on cloud data centers due to server virtualization, smartphones, movies and entertainment, chatbots, office productivity, software as a service, and social media, to name a few.

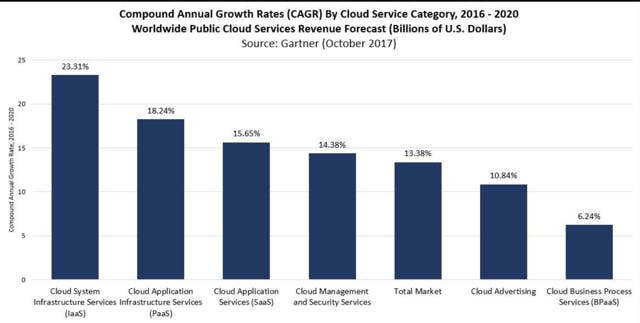
Gartner predicts the worldwide public cloud services market will grow to 21.4 percent in 2018 to $186.4 billion. The fastest growing segment is infrastructure as a service (IaaS) forecast to grow 35.9 percent in 2018. As we store more data in the cloud from AI and machine learning, this sector will continue to expand. For instance, fully automated cars will produce an estimated 25 Gigabytes of data per hour or 300 TB per year. Therefore, any savvy investor should place bets in this sector for 2021 and beyond.

No Medal for 4th Place in Cloud Infrastructure

Oracle (ORCL) is a long-time enterprise cloud powerhouse with billions invested in engineering and strategic acquisitions. On the quest to build and defend a range of cloud services, the company is expanding hybrid-cloud technologies, investing in customer-success programs, and benefiting from a less-than-expected decline in on-premise revenue. On the other hand, the transition to the cloud is taking longer than expected, according to Keybanc analysts, and is at risk for lagging behind Amazon (AMZN), Microsoft (MSFT) and Google (GOOG) in the Infrastructure as a Service category, the fastest growing category in public cloud services.

Last quarter, Oracle beat earnings estimates but came in slightly below expectations for revenue at $9.77 billion vs. $9.78 billion. The adjusted earnings of 83 cents beat the consensus estimate of 72 cents and was up 20% for its fiscal third quarter, which ended February 28. The better than expected earnings were not enough to convince investors in Q3 as the stock fell 4 percent after earnings were reported, then fell an additional 8 percent in pre-market trading. The stock is at $46.16 today compared to $52.90 before Q3 earnings.

One major concern is Oracle’s low share of cloud infrastructure and platform revenue, which came in at $415 million with 28 percent growth compared to Amazon at $5.11 billion revenue at 45 percent growth. It doesn’t help that Gartner, an authority for accurate tech analysis, placed Oracle in the “niche player quadrant” in the Magic Quadrant (not the leader quadrant) for Infrastructure as a Service (IaaS). Notably, financial analysts from JP Morgan and Murphy lowered Oracle targets yesterday, however, Gartner published this magic quadrant on May 22nd and it is likely what these analysts based their predictions on.

Meanwhile, in another category, cloud software (SaaS) revenue was up 33% last quarter for Oracle at $1.15 billion with notable competitors SAP and SalesForce. The remaining revenue is primarily on-premise revenue of $6.42 billion, and software license revenue of $1.39 billion.

While Oracle has maintained a name for itself in cloud services, it’s offerings are not strong enough to earn a medal as a front runner, which will spell trouble for earnings as Data as a Service (DaaS) undergoes regulations.

DaaS: Programmatic Will Crash

Oracle pursues many strategies and acquisitions for cloud services because it knows it has to be seen as a cloud company in order for Wall Street to invest in its future. However, one of Oracle’s main market positions is Data as a Service (DaaS). From 2012 to 2014, Oracle went on a tear of acquisitions to increase their marketing stack and to cement their position in the digital advertising space. In May of 2012, Oracle bought social marketing solutions provider Virtue for an estimated $300 million, the marketing automation firm Eloqua for $810 million in December of 2012, Responsys for $1.5 billion which is a business to consumer solution and the data management platform, BlueKai, for $400 million in 2014. This totaled an estimated $3 billion in collective marketing tech acquisitions to enhance DaaS.

Programmatic is the automatic trading of advertising which is augmented by data for superior digital advertising. Oracle’s DaaS is essentially a way for companies to upload their data and potentially enrich their data by anonymously sharing and matching data sets. Oracle calls this “making your data smarter.”

Notably, BlueKai was a private company that captured the data boom with 9,245% growth from 2009-2012 – although competitors in the market saw a whopping 21,337% revenue growth (Data Xu). BlueKai was originally a buyer and seller of consumer data and pivoted to become a seller of data analytics and management technologies. These acquisitions were designed to help Oracle enable private data sharing. This is where the marketing ecosystem ingests first-party data and brokers marketing communications (MarCom) and advertisements in a second- party data transaction. While the data is not being sold, the information is being shared to third-parties without consent for the purpose of more advertisements.

My newsletter subscribers get this information first. Sign up here.My newsletter subscribers get this information first. Sign up here.here.

As the Oracle BlueKai deck states, here are some examples:

  • Hotel chain sharing data with a bank to target customers who do not have bank rewards cards
  • Online broker sharing data with a social media site for audience based targeting
  • Social media site sharing data with a technology company

While Oracle Blue Kai may not come directly under regulation because they are the middleman, and not the company with a direct relationship to the user, their business model is likely to weaken due to the way the data is being used. Marketing platforms and data management platforms will increase a marketers liability if they choose to transfer and trade private, first-party data. For these marketers, under the GDPR, consent must be given for each processing operation need and cannot be bundled together. Therefore, there will be less advertising and Marcom data to process, lowering Oracle’s revenue.

My Prediction: Cloud infrastructure will continue to grow as data storage increasingly provides the infrastructure for technological advancement. Amazon, Microsoft and now Google have been upgraded while Oracle has been downgraded during a key growth stage for IaaS. In addition, Oracle acquired many companies in the DaaS space which will continue to wane as regulations increase on customers using Oracle for targeted data. Couple this with fierce competitors in the IaaS and SaaS space, and Oracle will see lower than expected earnings this year.

I consult for financial firms. Inquire here.

Measuring Mobile Ad Performance: Why We Need to Borrow a Metric from TV

This article originally appeared in VentureBeat.VentureBeat.

By all accounts, mobile advertising is the wave of the future. Mobile ad spend is projected to increase 430 percent between 2013 to 2016, when it’s expected to surpass $100 billion worldwide, according to eMarketer. By 2019, overall ad spend will go on to surge to an estimated $200 billion. This is record-breaking growth, and it’s no wonder we are seeing this level of investment considering we’ve seen mobile usage recently exceed desktop.

It’s exciting to be in mobile today. You couldn’t ask for more users, more eyeballs.

Yet  there are still a few unanswered issues. Those spending big dollars on mobile, namely advertisers, publishers driving installs, and also brands and agencies, have a few key indicators they want to meet, including a reasonable level of accuracy, optimization, reach, and of course, performance. The mission is to deliver the correct content at the right moment closely matched to the intention of the person viewing the ad.

But whether this happens or not is an absolute mystery on mobile today. We may know someone installed an app, but they may never open that app again. We can measure clicks, but this has led to fraud and has also prevented brands from feeling confident that a “click” is the result they want from a campaign.

To loosen the bottleneck, we need to look at the yardstick we are using. We need to measure accuracy. We need to measure optimization. We need to measure reach. And we need to measure performance. The common denominator across all KPIs is how to measure both the audience and the campaign performance.

There are three predominant methods for measuring mobile ad performance today and each has its limits.

CPI: Cost per Install. This measurement is unique to mobile and was initiated for mobile publishers who doubled as advertisers. These publishers needed installs on their mobile apps, therefore, user acquisition dictated a new form of campaign measurement. It’s also the easiest (and first) way of measuring effectiveness in mobile video, although it limits the number of advertisers to only those who want to drive app installs.

CPI is also a higher risk to the publisher because they only get paid when the install occurs. As a result, the user experience is often quite bad because the user sees the ad over and over again, with the ad exchange favoring whatever means necessary to procure the install.

Weaknesses: Not every advertiser wants to drive an app install. Plus, users are gravely affected by the repetition of ads.

CPC: Cost per click came from desktop and originated in search, where the main function of the ad was to lead the user to a website or product page to initiate the conversion funnel and close the purchase. On desktop, CPC works best when tied to targeted keywords, relying on search terms to narrow relevancy and qualify who is clicking on the ad. Display ads on desktop naturally became display on mobile, although the screen size and user no longer matches the desktop actions that display was originally intended for.

Weaknesses: Clicks have never been a good measure of media outside of search. Mobile amplifies this problem with many erroneous clicks being attributed to media performance. We’ve seen a rise in fraud from bots, especially among Open real-time bidding markets and other programmatic exchanges. Plus, CPC does not address video, where the mobile market is headed, with 12.8 percent of impressions currently equaling 55 percent of revenue.

CPCV: Cost per completed view. This measurement is more favorable for video, especially when used with hybrid mediation algorithms, because it measures according to the effectiveness of the ad per completed view. Therefore, the correct content, the right moment, and the intention of the person viewing the ad has been achieved, in theory, because the video ad has been completed.

Weaknesses: Factors such as whether the ad is skippable or non-skippable and rewarded or non-rewarded play into why it was completed. CPCV is also not equipped (yet) for cross-device measurement. There have been variations on this form, such as CPMV (cost per 1,000 views), however, this does not take into account if the video ad was completed or not.

Given the shortcomings of these common measurement methods, it’s no wonder we are seeing a push towards new forms of measurement. Interestingly enough, the most recent form of measurement to emerge for mobile isn’t new at all. It comes from an environment where advertisers have been consistently measuring audiences for quite awhile now: television.

GRP: Gross Rating Point is calculated by the percent of the target market reached multiplied by exposure frequency. There are innate benefits to using the GRP measurement: First, having originated from television, the strength of the GRP is in measuring elusive eyeballs on video-produced ads – comparing mobile video to television, you can see why CPI is not conducive (there’s nothing to install). Second, advertisers are comfortable with this measurement system. It makes sense to invite the majority share of ad spend (which is television, at 42 percent, in the United States) to the mobile conversation by speaking in familiar language as to how ads are measured. Last – but definitely not least – the gross rating point is ideal for cross-device measurement because it takes into account exposure frequency. This last point may be the clincher for why the aforementioned three metrics will lose effectiveness over the next few years.

Weaknesses: Because the GRP is a navigational metric, it’s a measurement of how you approach your audience and how the budget is spent rather than providing an analysis of whether your ad was viewed and what action (if any) was taken.

The next chapter in measurement will be driven by people-based metrics and behaviors. Who is watching these ads is what advertisers need to know; completion rate – including CPCV – is not enough information to determine performance. Meanwhile, installs are singular in purpose, excluding most brands, and clicks are troublesome at best. GRP may or may not be the correct answer; however, it is a move in the right direction for mobile video ads. Today, most targeting and optimization is at the app level, not the people level, and this has resulted in inefficient media spend.

Who is Responsible for the Data Security of 50 Billion IoT Connections?

This article originally appeared on IAPP.org, the International Association of Privacy Professionals.

“No matter what happens, don’t panic,” were the words used by hackers just before they hacked a 2014 Jeep Cherokee. It wasn’t your typical hack, where credit card information is stolen, or a denial of service attack is propagated, or a website is taken down. This incident involved disabling the transmission and brakes of a vehicle driving 70 mph. In other words, this is the kind of hack that could take someone’s life.

Car hacks make juicy headlines, but dating back as far as 2007, we saw researchers demonstrate how a generator could be destroyed. In 2014, hackers broke into a German steel mill and prevented a blast furnace from being shut down. As recent as last year, Norse and the SANS Institute released a study revealing 375 U.S. health care organizations were actively compromised between September 2012 and October 2013.

As the Electronic Frontier Foundation recently pointed out, the old security paradigm “felt that human beings were the problem and tech is the solution.” What the internet of things pushes forward is a reversal on the old paradigm that humans are the solution to the problem that technology creates.

If we look closer at the human supply chain and data security for IoT, there are three key players: manufacturers, developers and end users.

Here’s how they can advance the future with foresight (rather than the proverbial hindsight):

1)   Manufacturers

We are finding that many manufacturers can engineer connected parts but do not have the security staff or experience to protect the features. Automotive and medical device companies release embedded systems with no one on staff to respond to a vulnerability report.

The product cycle typically looks like this: The manufacturers have a limited budget, as with all product releases, their primary goal is user adoption – not security. As the researchers and hackers find security flaws, user adoption is increasing, and the manufacturer has to release a patch or issue a recall. By this time, cybercriminals have an open opportunity to exploit the embedded system or flawed IoT gateway.

Original equipment manufacturers should focus on security from the product design stage, which will involve additional in-house security professionals or dedicated partners. With an average of 25 vulnerabilities per device, interconnectivity demands rigorous protection. One approach to improve the R&D cycle is to generate more revenue from the IoT device in order to invest early in more security checkpoints. One medical device company saw 10 to 20 times the revenue when opting to give a device away for free and charge monthly, moving from charging for IoT products to IoT services. This move helps incentivize the manufacturer to keep the device or embedded system on the market.

Also, to lump all manufacturers together would be a mistake. Many large software companies who have always handled security well will continue to do so – no matter the number of connections or level of proliferation. Apple tends to be a front runner on how they handle security, however, manufacturers can learn to lean more on legacy-level security companies to help test, iterate or secure, post-production, the connections and systems they release. “Leave it to the experts” is as true now as ever.

2)   Developers

Nearly 40 percent of large companies, including Fortune 500 companies, are not taking proper precautions to secure the apps they build for customers. On average, large organizations spend $34 million on mobile app development, of which only 5.5 percent is allocated to ensure that mobile apps are secure. Much more attention and focus is given to design even as we see the number of cyber attacks grow. And if those numbers seem shocking, consider that 50 percent of the organizations devote zero dollars to mobile security.

The mobile hackers we see today are able to break into highly valuable data through the insecure app or public WiFi networks. The mobile app hacks of tomorrow are those of embedded automotive IoT systems, flying drones (weighing up to 50 lbs), medical devices and other high-risk devices. Fundamentally, the IoT is about core components such as sensors for measuring temperature or wind speed and actuators to initiate driving a car or injecting insulin. As more and more gateways and apps connect to these core components, especially those in motion such as vehicles and drones, we will have a sudden and urgent need for developers to consider security testing imperative.

The IoT gateway is a device in the field responsible for gathering data from sensors and communicating with actuators. These are installed in homes, control systems and automobiles. One solution is to create a security framework that uses public key cryptography to authenticate communication between remote devices and gateways. This will prevent both data access and also unauthorized signals. Another fix for developers, according to Luca Dazi, who presented at the JavaOne Conference in October 2015, is to employ a framework that uses public-key cryptography to certify new software updates before installation. Lastly, another security step is to generate unique passwords for each device to provide different variants that are combined to generate the master password.

Beyond individual efforts, open source communities also cannot be underestimated. The idea of inviting your peers to help you find the vulnerabilities in your software or app build is quite powerful, and an open source community may be the right antidote for a porous ecosystem of this magnitude.

3)   End Users

What responsibility does the end user have, if any?

It would be difficult to rely on end-user education, rather than a push for open standards, protocols and industry organizations playing the role in IoT privacy and security. For instance, when you buy a phone charger, you don’t expect to have to do your own testing to make sure it is safe, you just look for a Underwriter’s Laboratory code on it. The way this would translate into IoT security would be to bake the open standards and protocols into the products as a matter of course, and standard bodies would then make sure the devices comply with security.

As always, end-user trust will be a key differentiator in the IoT marketplace.

Top 5 Security Risks for Connected Cars

The global market for connected cars will grow by 270% by 2022 with 125 million passenger cars expected to ship worldwide between 2018 and 2022.1 By 2020, it’s estimated that UK, France and Germany will reach 100% connected car penetration. Growth in the European region is due to the eCall mandate which requires new cars to automatically dial the 112 emergency number in the event of a serious accident.2 While North America and Europe lead in the highest percentage of shipments, China accounts for 32% of shipments.

The list of connected features enjoyed by consumers that add more opportunities for security attacks include streaming radio, Wi-Fi access points and remote-control mobile phone applications. However, with these conveniences comes responsibility. The recent death of a woman in Arizona who was struck by an Uber in autonomous mode has put a spotlight on what can go wrong in connected vehicles as manufacturers seek to introduce more high-tech features to remain competitive to car buyers. Not surprisingly, 68% of Americans are fearful of cars with self-driving features.3

The increasing number of smart features built into cars opens door to a serious threat – hacker attacks. Because connected cars are linked with the Internet and its crucial parts are interconnected over a network, adversaries have the potential to remotely access and manipulate the data being exchanged leading to a number of problems, such as leaked personal information, overcoming vehicle’s security mechanisms, or even full remote control of the car.

Threats to the Connected Car

Innovative automakers, software developers, and tech companies are transforming the automotive industry. Drivers today enjoy enhanced entertainment, information options and connection with the outside world. As automobiles move towards more autonomous capabilities, the stakes will raise in regards to security. Even if cars are not entirely driverless, the functions will become increasingly dependent on applications, connectivity, and sensors. Vehicle-to-vehicle (V2V) and Vehicle-to-Infrastructure (V2I) allow the car to communicate with other cars and infrastructure such as traffic lights. Vehicle speed adjustments, telematics, and AI voice recognition and interfaces will become common features.

The rapid increase of these technologies inevitably creates the risk of hackers gaining access and control to the essential functions and features of those cars and utilizing information on drivers’ habits for commercial purposes without the drivers’ knowledge or consent.

Here are some of the risks for connected cars:

  • Stealing personally identifiable information(PII): Today, sensors generate 25 GB of data per hour and this is expected to double considering there will be 200 sensors installed in connected cars by 2020 up from 100 sensors in 2015. Once autonomous vehicles become mainstream, the 17,600 minutes Americans spend driving annually will equate to 300 TB of data per year.4 Financial information, personal trip information, location information and entertainment preferences are just some examples of PII that can potentially be stolen through a vehicle’s system.
  • Connection security: Like other connected devices, vendor implementation flaws are often exploited by researchers for proof-of-concept attacks. However, it is inevitable that these will be followed by real life attacks. The current poor state of security on connected cars creates a tempting target for cyber criminals.


  • Manipulating a vehicle’s operation: Catastrophic incidents resulting in personal injury and lawsuits may be in the near future. Well-known cybersecurity researchers Charlie Miller and Chris Valasek have demonstrated several proof-of-concept attacks where they were able to control the braking and steering of a car by accessing the adaptive cruise control system.5 Although costly and with a lower likelihood than data breaches and unauthorized entry, this sort of attack has now been proven possible to a global audience.


  • Unauthorized vehicle entry: Car thieves now have a new way to gain entry into locked vehicles. Many vehicle technologies have opted to replace physical ignition systems with keyless systems using mobile applications or wireless key fobs. These new access mechanisms mean that methods of obtaining illicit entry include intercepting the wireless communication between the vehicle and the mobile application or between the wireless fob and the vehicle to gain entry credentials, among other methods. The New York Times has documented methods such as wireless key emulation devices and “power amplifiers” that increase the range of the wireless signal looking for the entry credentials. If the owner is in a house or other location close to the car, criminals can then gain entry when their wireless fob responds.6


  • Mobile application security: As more automobile manufacturers release mobile applications that communicate with cars, mobile applications are quickly becoming a major target for malicious behavior. One example of a flaw in a mobile application happened when Nissan had to pull its NissanConnect EV application for the Nissan Leaf.7 The poor security of the application allowed security researchers to connect to the Leaf via the Internet and remotely turn on the car’s heated seating, heated steering wheel, fans and air conditioning. In an electric car, this meant the possibility a malicious actor could drain the battery of an unsuspecting owner. Mobile applications themselves can be vulnerable in a number of ways. According to Gartner, 75% of mobile applications would fail basic security tests.8 Mobile operating systems themselves are a source of concern—over the last four years, there has been a 188% increase in the number of Android vulnerabilities and a 262% increase in the number of iOS vulnerabilities.9

Is TV Advertising Dead? Ad Revenues Suggest Otherwise

Ideally, advertisers experience the same brand recall from TV combined with the audience-based targeting advertisers use in digital. By combining the best qualities of television with the addressability of digital, advertisers could have targeted, dynamic video ads in TV-quality streaming environments.

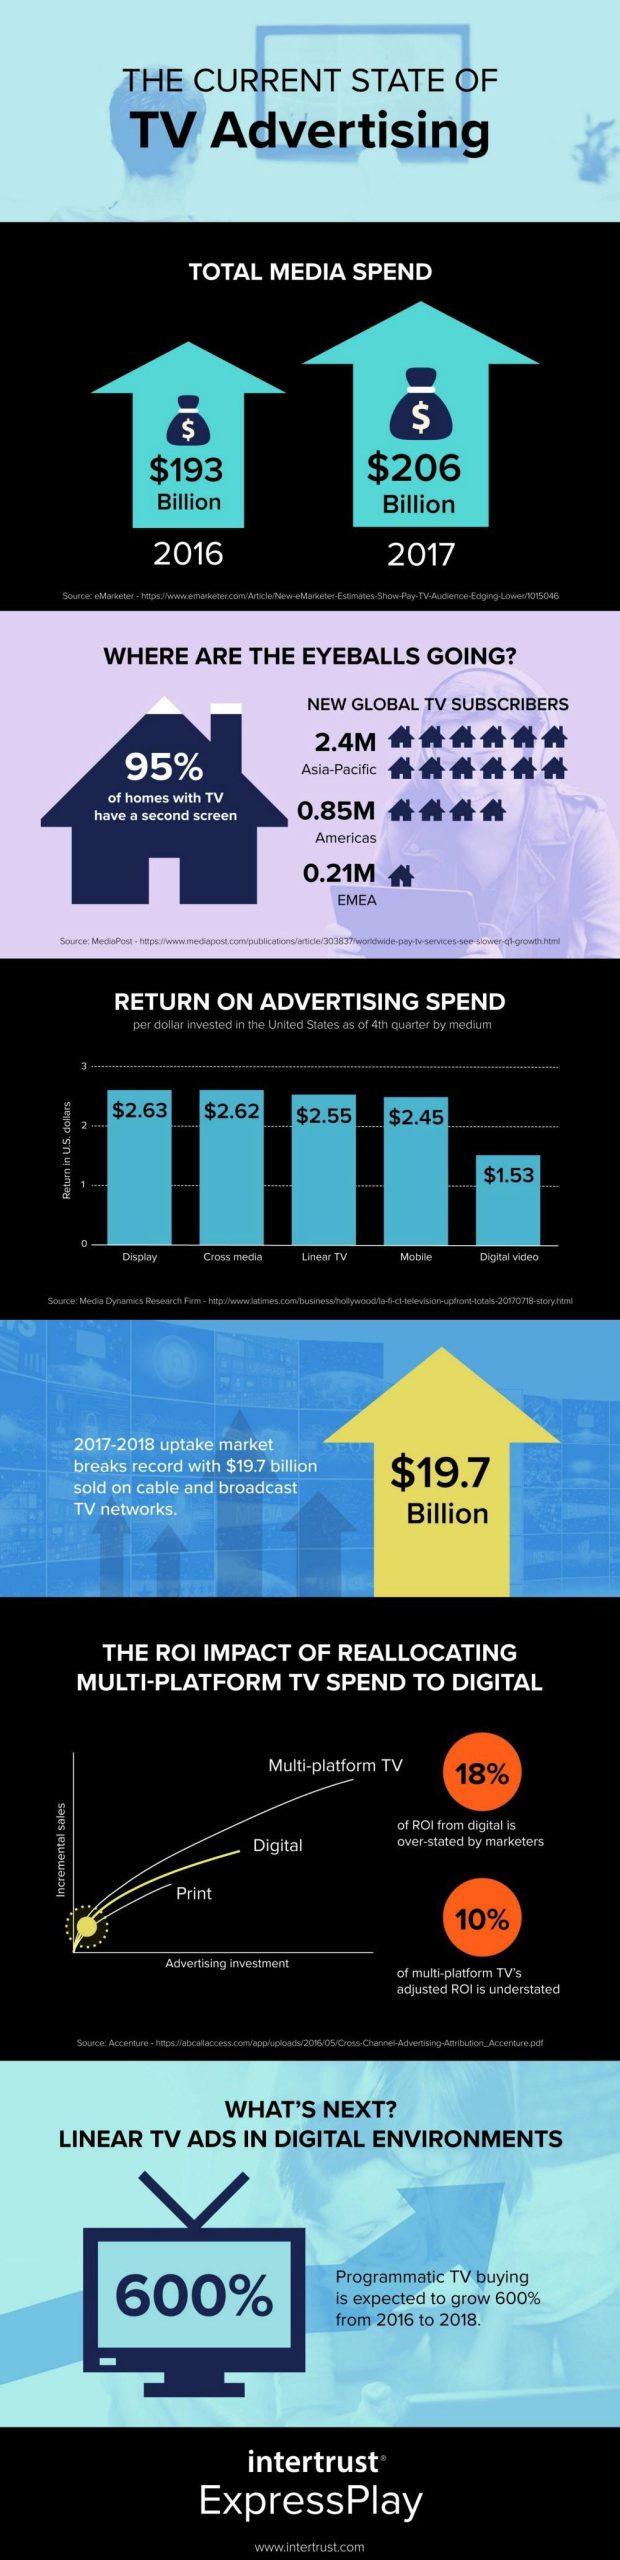
Cord cutters are getting a lot of attention these days. Perhaps justified considering 95% of homes with TV have access to services that can be viewed on another screen, contributing to the lowest growth rate ever for worldwide pay TV subscribers. Globally, Asia-Pacific saw the biggest gains adding 2.4 million homes compared to the Americas which added 850,000 homes and EMEA adding 210,000 homes[1].

However, while eyeballs may be shifting, many advertisers report TV ads delivering better ROI than digital. Coca-Cola’s global chief marketing officer famously declared to conference attendees they see $2.13 returned for every dollar spent on TV compared to $1.25 for dollars spent on digital.

A recent study by Accenture found that marketers over-state ROI from digital at almost 18% when seen as a standalone channel by failing to track and measure the halo effect from multi-platform television. Conversely, multi-platform TV’s adjusted ROI is understated by 10% according to the study by being mistakenly credited to single channels which analyzed $12 billion in anonymized marketing spend. In addition, while ROI from search, display and short-form video is high at initial spend levels, returns diminish as spend increases.

This infographic on The Current State of TV Advertising illustrates key points on the importance of TV Advertising today: