Alphabet Stock: Keep a Close Eye on Third-Party Ads

Data privacy will be affecting stocks into the near future and will likely catch Wall Street off guard as the minutiae is hard to sift through. Alphabet’s data machine has the longest tentacles of any company on the public market today, yet Facebook continues to carry the headlines. There are specific reasons that Alphabet has done a much better job at handling data, which in turn, creates a safer stock for investors. Even if some of the Google’s data collection policies are at odds with privacy advocates, Alphabet is being more transparent through SEC filings and offers a disclosure around revenue sources.

Last week, there was an important insider leak reported in Adweek that Google is “contemplating a number of changes to its consumer -and advertiser-facing tools.” Criteo’s stock dropped 30% when the news broke and TradeDesk saw a 15% drop while Alphabet’s stock showed the least impact at 5%. I believe this market reaction, which penalized Alphabet the least, is due to a misunderstanding around the implications of third-party revenue for Alphabet.

This analysis will break down why the intel leaked to the ad industry late last month is important for stock investors to pay attention to.

Overview:

The official list of companies who are in a grey area with how they collect and use data is Google, Facebook, Amazon, Twitter and Snap. You can add Spotify to that list too, although their data is minor compared to the bigger players. The reason these companies are at risk is because there is a conflict of interest in collecting first-party data with people you have a direct business relationship with and brokering this to third-party companies.

Let’s reframe this so it’s easier to picture. For instance, what if your credit card company brokered your data to run ads? They have more information on you than Facebook or Google because Mastercard and Visa knows your every purchase. They would make A LOT of money if they anonymized your data, assigned you an ID number, and let advertisers target you based on what you bought with your credit card. In fact, purchase history is the most valuable data to an advertiser and they would pay much higher amounts for this than social media data or search data. Mastercard and Visa don’t do this because it’s against regulations. This is what the online and mobile industries face who are brokering first-party data to third-party companies to target people and run ads.

Going back to Google. Of the companies listed above, Google is being the most proactive and has the least amount to lose (Amazon is a close second with the least amount to lose). This is because Google makes money from search engine inquiries, with advertisements based on your search criteria, and not targeted to who you are as a person. However, there’s a chance that Google could lose up to $5 billion per quarter if the insider information to AdWeek is accurate. One reason is because if Google prevents ad networks from running ads in the Chrome browser, they will risk anti-trust if they continue to do so themselves. There is also a conflict of interest for first-party data companies to run third-party ads through a demand-side ad platform, where advertisers go online to place ads using proprietary data.

Especially if Google wants to be a leader in artificial intelligence, which will require a privacy adherent company policy, it is my prediction that Google will part with the third-party ad revenue to win big on AI in the coming years.

Intel from the Ad Industry:

Here’s an excerpt from the Adweek article Google Mulls Third-Party Ad-Targeting RestrictionsGoogle Mulls Third-Party Ad-Targeting Restrictions: “According to sources, certain Google teams want to placate the growing zeitgeist around the protection of consumers’ data privacy, which has grown ever louder since the Cambridge Analytica scandal last year. These internal discussions also follow the implementation of third-party tracking restrictions on Apple’s web browser, Safari, and similar moves from Mozilla’s Firefox and Brave’s offering in recent months. Although the various businesses within Google advocate similar measures, the breadth of the company’s interests (i.e., the dominance of its Chrome browser and ad-tech stack) make its decision-making process more complex.”

What you need to know:

There are two issues here. As the article points out, Google will likely cut off third-party ad companies from brokering through the browser on Chrome similar to Safari and Firefox. The issue is that if Google continues to broker ads with first-party data while cutting off competition, there will be antitrust repercussions. Plus, this doesn’t address the grey area as to why Google is using first-party data to broker ads in the first place, as this is against regulations in the EU already and highly contested in the US (with Facebook taking a lot of the blame). This brokering of first-party data is what “ad-tech stack” refers to.

The leak was enough for Criteo to be downgraded from $32 to $24 by financial analysts and TradeDesk dropped from $213 to $185 the day the news broke. Alphabet stock remained relatively stable although I believe this was the market not fully understanding Alphabet’s tech stack.

Disclosure of Third-Party Revenue

In the introduction, I stated that “there are specific reasons that Alphabet has done a much better job at handling data, which in turn, creates a safer stock for investors.” The primary reason Alphabet makes a safer investment is that you can evaluate the stock for risk because the company discloses third-party revenue it makes from this grey area in their SEC filings. Facebook, and the others, do not disclose this as a separate line item, which makes it impossible to quantify the risks.
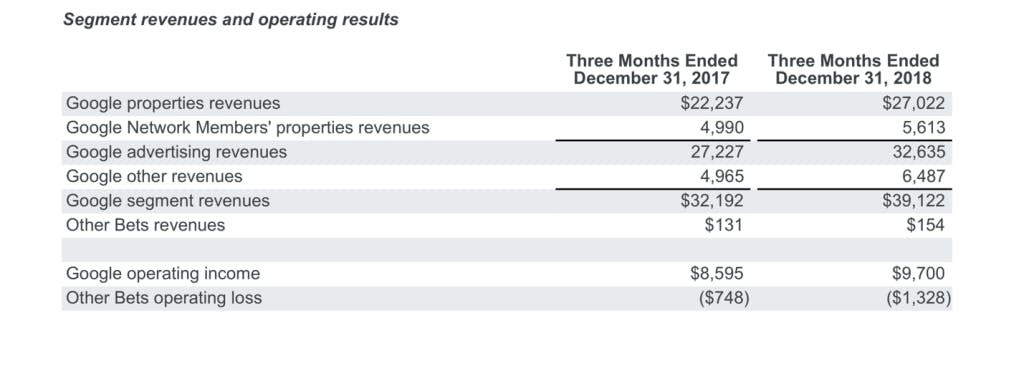
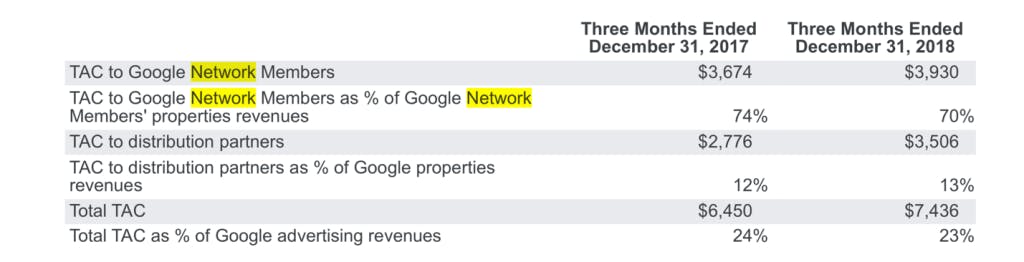
The line item that the leak refers to is “Google Network Members’ properties revenues,” which is $5.6 billion in revenue, or about 15% of quarterly revenue. The actual net income is much lower as Google pays out 70% to publishers, which is the Total Acquisition Cost, or “TAC to Google Network Members.” This leave the income for third-party sites at $1.7 billion per quarter.
Conclusions

On the Q1 2018 earnings call, analysts asked Sundar Pichai if the GDPR would affect the company. He stressed the importance of search engine revenue which is GDPR compliant, as it does not target people, rather it uses search inquiries. Although Waymo operates cars in the streets, and there have been many other speculative releases such as Google Glass, it’s important to remember that Alphabet’s revenue is 86% advertising.

Google Network Members’ revenue is at risk right now due to privacy regulations in the EU and ongoing scrutiny by regulators in the United States. It is my prediction changes will occur to Google’s third-party member sites revenue, and that the market misunderstood the impact it could have on Alphabet. Although there is no way to time exactly when this will occur, Adweek’s sources said they believe it will roll out by 4th quarter of this year.

Nvidia Versus Xilinx: Heavy Hitter AI Stocks

Nvidia fell off a cliff last October from a high of $290 to a low of $130. Meanwhile, the challenger Xilinx remained unharmed by the tech rout, and despite unfavorable macro conditions. Nvidia popularized GPUs in 1999 and Xilinx invented FPGAs in 1985, and both are chips that will define the computationally-intensive future.

GPUs originated from the advanced computations required in gaming and FPGAs originated from electronics engineering. There are strengths and weaknesses to both, however, these are the two that will power the artificial intelligence and machine learning-driven economy. The size of this AI and ML economy is expected to reach $15 trillion by 2030 up from $2 trillion this year.

Keep in mind, that long before technologies go public, they are incubating across the startup ecosystem. By the time AI and ML companies reach the public markets, the technology powering and developing this wave of companies was already decided in the years prior. We are in those critical years where startups must quickly design and develop AI if they want to have the first-mover advantage. This is creating a battle between FPGAs and GPUs.

Below, I break down the differences between Xilinx’s FPGAs and Nvidia’s GPUs before analyzing the financials and theories on how the two will perform in the future.

Note: Previously, I discussed how Nvidia stock has two impenetrable moats: the developer ecosystem and GPU-powered cloud. This previous analysis was written during the height of the panic sell-off, which I negated as being overly-pessimistic due to Nvidia’s strong fundamentals.Nvidia stock has two impenetrable moats: the developer ecosystem and GPU-powered cloud. This previous analysis was written during the height of the panic sell-off, which I negated as being overly-pessimistic due to Nvidia’s strong fundamentals.

AI and Machine Learning

On many technical levels, FPGAs (Xilinx) are considered superior to GPUs (Nvidia). They offer a higher amount of on-chip cache memory to help reduce the bottlenecks from external memory, and are flexible enough to be reconfigured for various data types, such as binary, ternary, and custom data types, whereas GPUs must be modified at the vendor level.

FPGAs are also known for power efficiency, and often test at 10x better in power consumption than GPUs and also 4x better than GPUs for general purpose compute[1]. Reconfigurability for FPGAs also helps provide this efficiency beyond deep learning for a large number of end applications and workloads. The architecture of FPGAs is very adaptable as the chips allow a user to address all of the needs of a workload with the resources provided by FPGAs, such as reconfiguring the data path during run time and with partial reconfiguration. Meanwhile, GPUs are restricted as the architecture is a Single Instruction Multiple Thread (SIMT), which provides an advantage over CPUs but can result in lower performance efficiency when enough parallels cannot be found while mapping the workload.

As pointed out in my previous analysis on Nvidia, software developers prefer GPUs as their frameworks are easier to develop on. Nvidia’s CUDA architecture, for instance, does not require an in-depth understanding of underlying hardware. FPGAs require knowledge of machine learning algorithms at the hardware level, in addition to the software development, and this has been a barrier to entry for FPGAs. FPGAs are a reconfigurable integrated circuit (hence the strengths on being easily reconfigured), which requires specifying a hardware circuit, whereas GPUs are configured via software[2].

“Nvidia, thanks to the CUDA software stack (which AMD cannot match), has a much more unassailable position than does Intel with Xeon CPUs (where an X86 application just runs on either a Xeon or an Epyc).”

– software developer on Reddit

Section takeaway: FPGAs result in faster and more efficient compute but are harder to program due to hardware circuit configurations when compared to GPUs for machine learning, which are more universal and require less engineering resources.

Financials

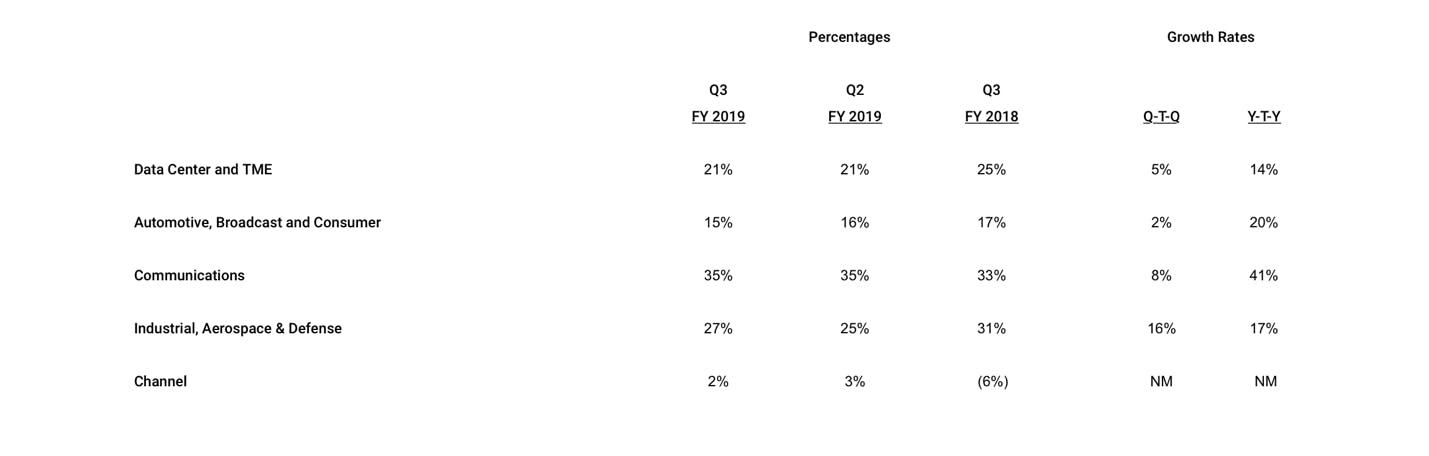
Nvidia and Xilinx power more than data centers, of course. Nvidia’s top revenue segment is gaming, the origin of GPUs, and this drives about $1 billion per quarter in revenue. Xilinx’s top segment is Communications with many investors using Xilinx as a global bet on 5G with communications revenue increasing 41% year-over-year as reported in the most recent quarter. Xilinx also was not as affected by crypto as the Broadcast, Consumer & Automotive category was 17% of revenue compared to 15% of revenue in the same quarter YoY. (Xilinx classifies crypto as consumer in this 10-K).

Xilinx has a direct competitor with Intel, who acquired Alterra for $16.7 billion. Intel is keen to solve the development uptake issues with FPGAs with the release of Stratix 10 hardware, which has a software layer to simplify development. Microsoft Azure is partnered with both Xilinx and Intel/Alterra on FPGAs although there is some indication that MS is leaning more towards Xilinx in the near future after announcing they will replace Intel chips with Xilinx in over half of their servers.

Developers  favor Xilinx over Intel as a brand, and Microsoft is doing quite a bit to court developers right now including the acquisition of Github – read more tech stock analysis here. Therefore, the shift towards Xilinx was not unexpected.tech stock analysis here. Therefore, the shift towards Xilinx was not unexpected.

Nvidia:

While Xilinx reported double digit increases, Nvidia reported double digit declines with revenue down 24 percent, earnings per share down 48 percent to $0.92 and operating income down a shocking 73 percent year-over-year in fiscal Q4. The annual numbers ended on a better note with revenue increasing 21 percent to $11.72 billion, and GAAP earnings per share increasing 38 percent to $6.63. Of Nvidia’s revenue segments, gaming was hit the hardest due to the crypto bust flooding the market with GPUs, which in turn, caused reduced unit shipments overall. In addition, the new Turing architecture and real-time ray tracing, while impressive from a graphics perspective, are ahead of their time and are seeing slow adoption (At release, I had originally put Q3 2019 for these to find early adopters and this timing still looks accurate or maybe Q4).

This upcoming quarter is not likely to be the comeback quarter for Nvidia with guidance of $2.20 billion, which is flat from last quarter and represents a 31 percent decline year-over-year. As you’ll see in the takeaway paragraph below, I am very bullish on Nvidia in the long term as crypto causing temporary GPU saturation offered an opportunity to enter the stock below its value.

Gaming is a foundation for Nvidia, but most certainly, this is not the growth story. The GPU-powered cloud is the future due to AI and ML. If you can get Nvidia below a $100 billion market cap, then my prediction is you will be resting easy by 2022 and 2023 with a stellar return as it’s understated presence across cloud data centers and AI applications should have a firm hold on the market.

Xilinx:

Xilinx’s revenue growth is at 34% year-over-year in Q3 2019, with 63% growth in operating income YoY in the same quarter, and 42% net income growth. It’s important to mention that Xilinx is a small fish in a big pond and this quarterly growth of 34% and 42% equals $200 million to the top line and less than $100 million to the bottom line. Meanwhile, Xilinx commands a PE ratio of 38, at time of writing.

Guidance for the upcoming quarter is revenue of $815 to $835 million compared to $800 million in the previous quarter. One reason Xilinx’s stock price continued to climb, while Nvidia fell off a cliff, is that the smaller fish did not have enough market share to reflect a big impact, whereas Nvidia’s crypto business alone exceeded Xilinx’s net income for the entire year (at around $500 million per quarter). In addition, one year ago Xilinx posted negative net income of $12 million but is now at a net income in the range of $200-$250 million the last two quarters.

In other words, Xilinx is more of a trout than a tuna, but is a pure play option that is likely to see very solid returns as the AI economy is built out. (This is why I don’t invest in Intel; I prefer pure plays when possible).

Snapshot of Xilinx Revenue segments:

Source: Xilinx

Takeaway:

Nvidia is one of my favorite companies from a fundamental standpoint, and it is worth repeating that I was not fair weathered during the crypto bust, rather encouraged readers to look at the developer moat and GPU-powered cloud as future drivers of growth. As I stated to a reader over email two days before the Mellanox acquisition: “Can Xilinx’s FPGA disrupt Nvidia GPU’s at 4x faster? My best guess (and it’s only a guess) is that Nvidia will continue to release the right chips that the market demands.” In this case, Nvidia is acquiring the right company that the market demands. You can read my analysis on Mellanox acquisition published on FATRADER here.

I want to point out that Xilinx will make a solid investment, as well. Xilinx is priced a minimum of 25-30% higher than Nvidia when looking at PE ratio, Price to Sales, and EPS. Quarter-over-quarter growth for Xilinx right now is in the single digits, and for this reason, I’d like to see Xilinx priced 20% cheaper before I build a position or I’d like to see more than single digit QoQ revenue growth in a highly competitive market for a 30+ PE ratio. Due to Nvidia’s upcoming flat quarter (per guidance), Nvidia is also likely to trade sideways for a quarter or two. I bought Nvidia in 2017 and cost averaged down to $160, and am comfortable here for the long term.

[1] https://www.aldec.com/en/company/blog/167–fpgas-vs-gpus-for-machine-learning-applications-which-one-is-better
[2] https://blog.esciencecenter.nl/why-use-an-fpga-instead-of-a-cpu-or-gpu-b234cd4f309c

Apple Stock: A New Era of Mobile Saturation

Debuting in 1980, Apple is nearing its 40th anniversary on the stock market. The company has undergone many pivots successfully from computers to improved operating systems, to iPods, iPhones, app stores and music services. Many of these pivots were executed beautifully, with the most recent one being Apple Music, which took a majority of market share in music streaming within 4 years in the United States.

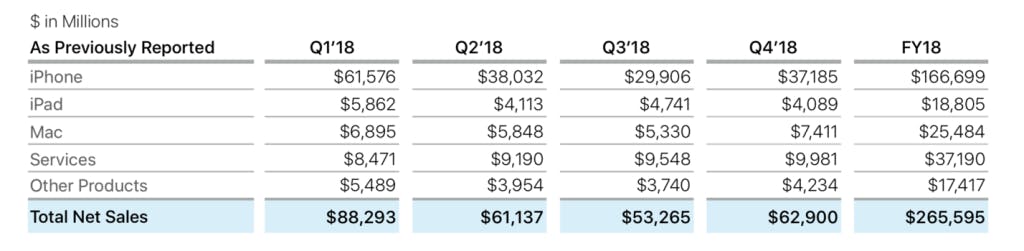
Of course, the iPhone is Apple’s force extender. One quick glimpse at the stock chart history and it’s easy to see something important happened in 2008. The invention has sold over 2.2 billion units with an average price tag of $793. The iPhone altered the United States economy, creating a thriving developer ecosystem while 87 percent of smartphone profits despite selling 18 percent of all smartphone units. With the iPhone’s release, Apple not only became one of the biggest companies in the world, but it also has more cash reserves than most countries’ GDP at $285 billion.

There are many positives to Apple’s story beyond the iPhone, with a wearables business up over 50%, cloud services up 40%, and Apple News readership at 85 million active monthly users. Apple Music is also now the number one streaming service in the United States over Spotify and closing the gap globally with 53M subscribers vs 83M subscribers. Most importantly, Apple has a media announcement planned for March 25th, which will add to the growing services revenue.

Earnings reported on January 29th, 2019 were more encouraging than anticipated following the lowered guidance. Apple beat earnings at $4.17 compared to last years $3.89. Total revenue was lower at $84 billion, down by 4.51% and beat guidance by $312 million. Future guidance expects revenue between $55 billion and $59 billion for this quarter to be reported at the end of April. Gross margins are expected between 37 percent and 38 percent. The company has a hoard of cash and the stock pays an increasing dividend.

Investors should exercise caution, however, as the broader mobile market is slowing down and is at the point of saturation. Mobile has been the de facto leader for tech growth during this historical bull market, and has provided consistent YoY returns that the dot-com bubble would be envious of. Investors should recognize mobile has reached its top as a primary driver across tech growth stocks, and I do not believe the mobile slowdown is over yet, or that the full effects have been completely reflected in earnings.

Apple can (and will) pivot. One day, the company will be known for health services, vehicle software, as a media titan, and more. However, But to expect one quarter of decreasing iPhone sales before the stock resumes previous heights would defy the laws of the tech hype cycle. Apple simply has not hit the iPhone bottom, and the effects of mobile saturation are not fully reflected yet in the company’s earnings.

The Fifth Factor: Mobile Saturation

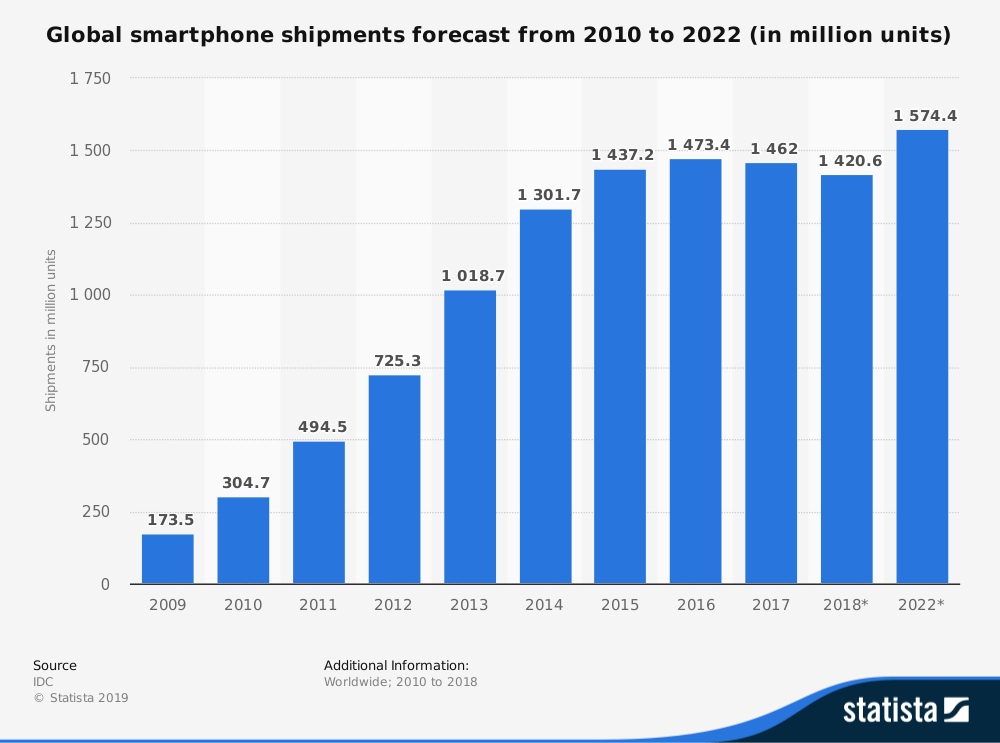
Apple noted four factors that impacted results when the company provided guidance in November: “different iPhone launch timing from a year ago, FX headwinds, supply constraints on certain products and macroeconomic conditions in emerging markets.” I would call this the 1,000 foot-view while the 30,000 foot-view tells us the fifth factor is mobile saturation.  Eventually, everyone has a television set and a laptop – and now, a smartphone. This will continue to be the reality that Apple contends with.source: https://www.statista.com/statistics/263441/global-smartphone-shipments-forecast/

The smartphone market contracted in 2017 to 1.462 billion units and in 2018 to 1.42 billion units, and is expected to return to minimal yet positive growth percentages at a CAGR of 2.5%. While 1.5 billion smartphones per year is substantial, the law of saturation is likely to drive prices down, with Android owning 85% of the market today, and we see decreasing iPhone penetration in China where lower-priced competitors gain market share.

IDC estimated Apple will sell 242 million smartphones by 2022 up from 221 million in 2018. The issue with these estimates is that IDC does not break down the percentage of potential decline between 2018 to 2022. The most up to date number available from IDC is an anticipated decline of 0.8% in worldwide smartphone sales in 2019, published on March 6th.

We saw China decline 10% last year in global shipments of smartphones. Taiwanese company, TSMC, is the sole supplier of iPhone core processor chips and told Nikkei Asian Review that the company is cautious about demand for high-end smart phones, which is a nod toward Apple from a main supplier. Samsung Electronic’s Vice President Lee Myung-jin told investors in late January that “demand for memory chips has declined in the fourth quarter as external circumstances worsened and customers adjusted their orders” and he believes the decline “will continue in the first quarter, as key customers keep adjusting their orders.”

Huawei eats market share in Asia and is currently the world’s fastest-growing smartphone seller. The company sold 200-million units in 2018, posting 30% growth from the 153 million units sold in 2017 and has seen a 66x increase from the 3 million units sold in 2010.

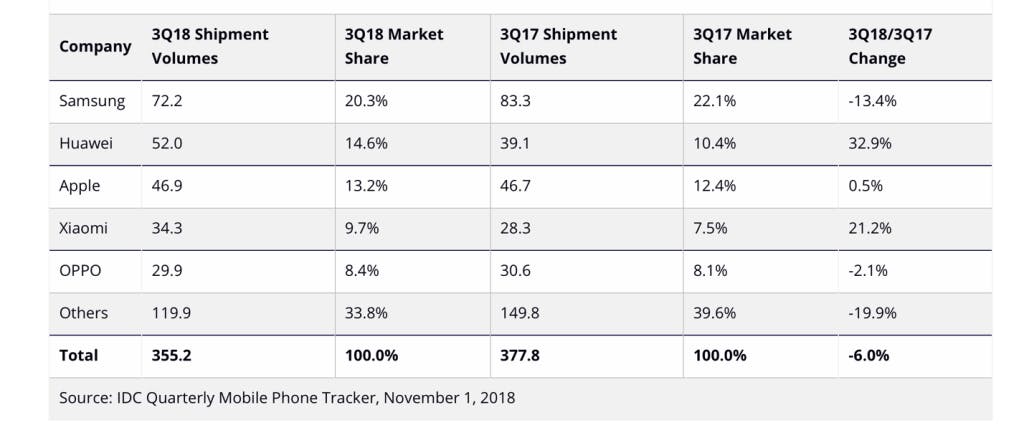
Huawei edged out Apple with 14.6% of the global smartphone market compared to Apple’s 13.2% share in Q3 2018. China’s Xiaomi also posted 21.2% growth. Therefore, a resolution to the trade war or other macro conditions may not actually revive iPhone sales as Chinese smartphone makers appear determined to gain domestic ground. In 2018, the iPhone had an average sales price (ASP) of $793 while Huawei’s ASP is $269 in China and about $380 in Europe. The ASP for Xiaomi is $138. Politics and trade war aside, one indication of saturation and post-euphoria consumer behavior is when consumers seek lower prices as a trend becomes more commonplace. Longer replacement cycles and lack of innovation on the device, such as new applications, also point towards a market at its peak.

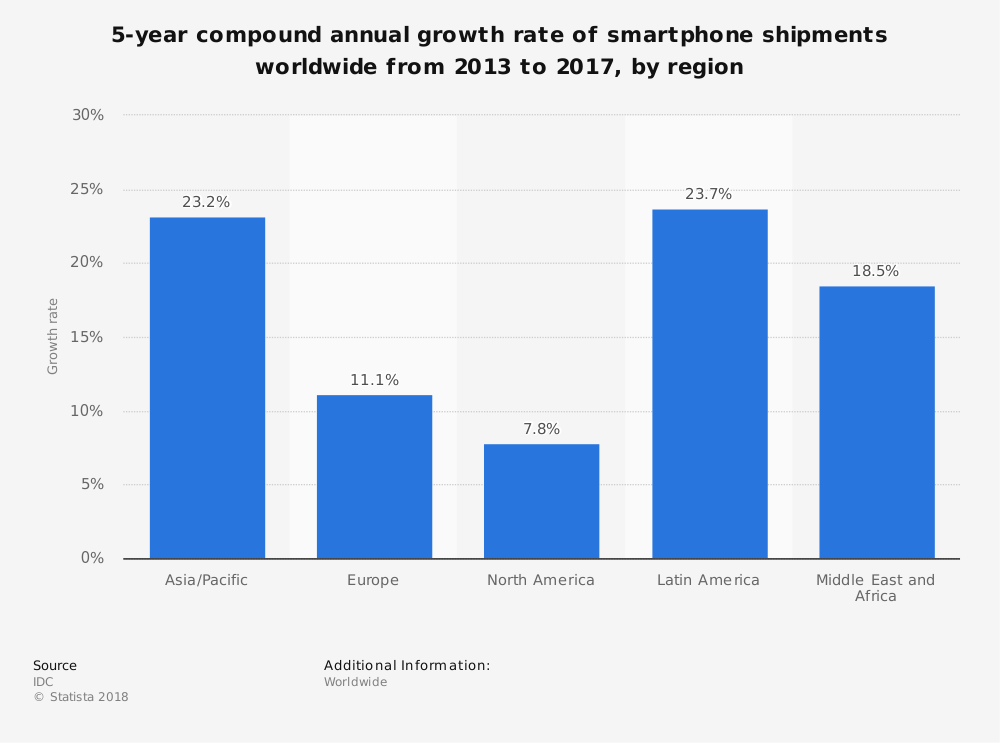
China represents roughly 1/3rd of smartphone penetration compared to the United States at 1/12th. We can see over the last few years that the United States had the lowest CAGR of any region globally. According to Pew Research, 77% of Americans own smartphones, a jump from 35% in 2011. If Apple is losing market share in China, this leaves Latin America, where the average sales price of the iPhone is prohibitive.

Apple’s Pivot to Services

There is no reason for investors to not be hopeful about the upcoming media announcement, although as Apple Music has shown, it may take up to 3 years before it adds significantly to the top line. Many investors may ignore the mobile saturation issues or believe the bulk of the iPhone decline is priced into the stock. If Apple is a core holding, the arrival of a new direction is likely to be welcomed. Today, services account for 18% of Apple’s overall quarterly revenue at $9.9 billion or $37 billion annually with handsome margins of 62.8%. Apple has executed Apple Music beautifully since 2015 and is now the top music streaming service in the United States, much to Spotify’s chagrin. To give you a comparison and a glimpse into the media services possibilities, it took Spotify twelve years to gain 80+ million subscribers while Apple reported over 50 million in three (brief) years. OTT media endeavors require a note of caution, however, especially for those companies creating original content. Historically speaking, Amazon had a content budget of $4.5 billion in 2017 for an audience of 27 million viewers. As Jeff Bezos told Hollywood Reporter at that time, “When people join Prime, they buy more of everything” and the losses on original content are recovered. Apple will also need to recover the losses on original content. Some anticipate that Apple will recoup the costs of original content with a 30% revenue split from the other channels they plan to aggregate on the platform.

While Apple may be able to pull off migrating users from their trusted favorites, such as Hulu, Prime, Netflix, Showtime and HBO, it will be interesting to see how quickly Apple can make back the investment of paying the likes of Oprah Winfrey, Jennifer Aniston and more big names for the original content they plan to offer. There’s also speculation Apple may bundle services like Spotify and Hulu do today, where the two services are offered for about a $3 discount at $17.99. Regardless the monetization strategy, Apple’s media announcement is likely to help the stock, despite the many warning signs of a distressed mobile market.

Takeaway:

Apple has a history of successful pivots, and services will add a projected $100 billion in revenue by 2023. However, I believe we haven’t found a bottom yet on mobile saturation. In 2017, Apple sold 19 percent of the smartphones purchased globally, yet captured 87 percent of the profits. My prediction is that those days of the peak mobile market are over. Even if earnings see-saw for a few quarters, there will be a downward trendline from this peak. Apple will make a better investment once mobile saturation has run its course. I believe the stock price we see today is overly optimistic in regards to the eventual slow down across the mobile industry.

Image credit: Apple

Lyft: Risky Valuation and No Intellectual Property

Who doesn’t love the ease of using a mobile application to order a ride rather than stand awkwardly on a street corner hailing a taxi? Once I downloaded Lyft and Uber, I said goodbye to the rejection of occupied taxis forever. Lyft and Uber represent free market evolution by offering a better service than the outdated competition. The apps shave off valuable time with door-side pickup, and the overall cost is cheaper than taxis too. In San Francisco, these apps have become ubiquitous, but these biases have to take a backseat to investment discipline.

There is a tinge of glam to the upcoming Lyft IPO road show, and the anticipated IPO from Uber in 2019. Silicon Valley produces a lot of winners; however, I believe investors should be careful with both of these IPOs due to exuberant valuations, accelerating net losses, and a lack of geographic expansion opportunities. Yet, another concern is the liquidity event the large cap IPO provides, and the level of PR that can be bought leading up to the IPO, which will likely focus on the growing sales. There is evidence the growing revenue has been subsidized, therefore, revenue is not a safe bet when evaluating these particular stocks, and the prospectus fails to outline a clear path to profitability.

1. Risky Valuation with Accelerating Net Losses

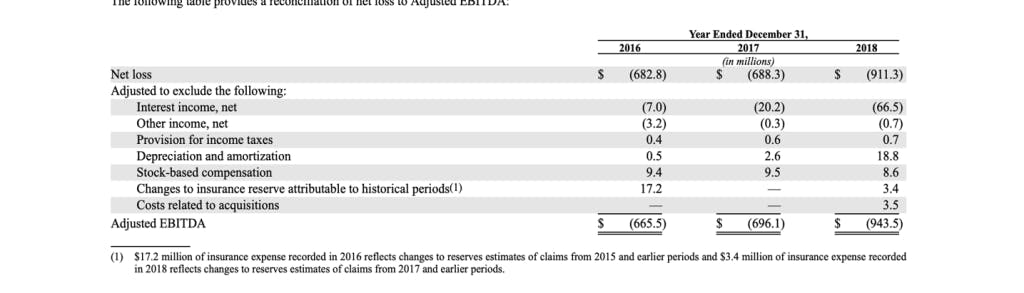
Lyft went from a $7 billion valuation in 2017 to a $15 billion valuation in 2018 and is now seeking a $20-$25 billion valuation on the public markets. The problem with this rising valuation is that losses are progressive with $2.6 billion in revenue in 2018 but a $911.3 million loss. Due to these losses, Lyft may need to borrow or raise more equity after its first year on the public market, which means debt or dilutive stock offerings.

Lyft’s sales, on the other hand, appear positive on the surface with incredible growth year-over-year from $343M in 2016 to $1.05 billion in 2017 and 100%+ growth in 2018 at $2.15 billion. The problem is that the losses are also accelerating.

Lyft’s filing also points to an important issue with growth marketing tactics for user acquisition (UA) and user retention. I’ll copy the paragraph here verbatim from the S-1 Filing and translate my understanding of how ridesharing apps subsidize UA.

“Ability to Cost-Effectively Attract and Retain Riders and Increase Our Share of Their Transportation Spend “Ability to Cost-Effectively Attract and Retain Riders and Increase Our Share of Their Transportation Spend 

We grow our business by attracting new riders to our platform and increasing their usage of our platform over time. To effectively attract riders, we focus on driving organic adoption in our rider base, and do so with investments in brand and growth marketing to increase consumer awareness. We also offer incentives for first time riders to try Lyft, as well as incentives for existing drivers and riders to refer new riders. Once riders start using Lyft, we provide a quality experience and a diverse offering of products to accommodate different transportation use cases, retain riders and encourage repeat usage. We often also provide incentives to existing riders to encourage them to expand their use of our platform. If we fail to continue to attract riders to our platform and grow our rider base, expand riders’ usage of our platform over time or increase our share of riders’ transportation spend, our results of operations would be harmed.”

The translation here is that Lyft and Uber pay incentives to acquire and retain users. In gaming, a company might spend $8 to acquire a user with a lifetime value of $15 per user for a profit of $7. The problem with ride-sharing apps is that the incentives offered do not cover the costs of the ride, and that is one reason we see strong sales growth mired by accelerating losses.

Reuters has some historic information on this dated back to 2015, when Uber passengers paid only 41 percent of the actual cost of their trips. At the time, Reuters reported that this creates an “artificial signal about the size of the market” with Uber releasing limited financial data that showed losses of $708 million per quarter.

Going back to Lyft, the takeaway is that these incentives are creating an artificial signal about revenue, which is ultimately overshadowed by net losses. The problem with subsidizing rides is that public market investors aren’t able to determine what will be required for profitability, how much the cost of the ride will have to increase, and if that will impede the demand to ride share.

2. “Human Resources” Business Model is Not Profitable

Lyft and Uber have scaled their companies but it comes with the variable cost of human labor. Ideally, you want fixed costs for R&D on platforms, software, hardware and other products to create the margins that technology is known for. Lyft and Uber are mobile applications, but the business model is more of a large-cap human resources department with many variables around wages, and potentially regulations due to independent contractor classifications. (There was a recent $20 million settlement due to the misclassification of drivers in California).

As you’ll see below, the mobile app holds very little intellectual property, with the primary value of the product resting in the mobilization of a massive work force of nearly 2 million people, per Lyft’s S-1 Filing. To some regard, Lyft and Uber are not technology companies, rather they are very large human resource departments run through an application.  Whenever you are involved with labor at this level, regulations and wages eat at profits.

3. Autonomous Vehicles 5-10 Years Out

This leads us to the only hope for ride-sharing to become profitable, which would be to remove the human driver through autonomous vehicles. Here’s some information from my autonomous vehicle analysis published in October on AV delays as it pertains to the timeline of when Lyft or Uber could potentially deploy driverless and how investors should exercise caution here:

“The regulation hurdles between Level 2 and Level 3 and delayed deployments will put immense pressure on stocks that are overvalued based on AV speculation. ABI Research, an advisory firm that reports on market-foresight trends, predicts 8 million consumer vehicles with Level 3 to Level 5 autonomy will ship in 2025. Compare this to the 94.5 million vehicles sold in 2017 which equates to 8.5% of sales. This is a small and fairly insignificant percentage of market share to be chasing 7-years ahead of deployment. Yet, investors are pouring cash into hyped up stocks- and the press plays a large role in this. Headlines are a continual churn of autonomous vehicle “moments” – every partnership, every mile driven, every make and model that adds another feature. To be clear, we’ve only gone from a Level 1 to Level 2. We are not able to release Level 3 AV right now – and yes, that includes Tesla.

Note: I was the first to write about the issues around autonomous vehicle deployment and how this will affect stocks (this prediction was before GM announced layoffs and before Tesla reported AV deployment issues, as well).

4. Total Addressable Market & Lack of Intellectual Property

I saved some of the best for last, as a paramount risk to both Uber and Lyft is total addressable market. Room for geographic expansion is limited beyond the United States, other than a few outlier countries like Saudi Arabia. Of course, the underlying issue with TAM is a lack of intellectual property with an easy-to-duplicate mobile application that leverages common app features such as GPS location and SMS/voice. Although it is common to discuss the ridesharing ecosystem as “Lyft Vs. Uber,” the fact is the global competitors in their respective geographies are a serious deterrent to future growth.

Here is a summary of the global ride-sharing market:

Asia: China’s Didi surpassed Uber as the world’s most valuable startup. Both Uber and Didi have something in common too; their investor is SoftBank. Grab is Singapore’s ridesharing service and bought Uber out of the market in Southeast Asia. (Uber was losing money here). India has a domestic ridesharing company named Ola, who can operate for as cheap as 8 cents per kilometer.

Europe: Taxify and MyTaxiApp: I went to MWC in Barcelona about two weeks ago and hailed about thirty rides in one week through a ride-sharing app called MyTaxi. One interesting feature behind the MyTaxiApp is that it leverages unionized cab drivers through the app rather than mobilizing independent contractors. The fares are cheaper than Uber, too, which is why Uber wasn’t able to capture Europe.

Middle East:  The Dubai-based ride-hailing app Careem serves the Middle East and Africa with 33 million users.

Latin America: Uber is doing well in Latin America with 25 million monthly active users, a presence in 200 million metro areas and is in 15 countries. Lyft is unlikely to compete with Uber here. China’s Didi is moving forward on competing in Latin America.

Japan: Japan could be a potential market although the overall sentiment is that Japan has major regulatory hurdles and the high-quality taxi system does not need much improvement.

Takeaway: Due to the reasons I’ve outlined, my concern is that the valuations and late-stage IPO is better for private market liquidity and not a sustained growth story for the public markets. The accelerating losses tell a different story than the 100%+ revenue, and if investors are subsidizing rides, then buying PR focused on sales is cheap. There is also no clear path to geographic expansion for near-term growth. Will Uber and Lyft be around in 5 years? Sure. Yelp, Snap and Zynga are still around …

“Algorithms are not biased; data is biased” – MWC 2019

Last week at MWC in Barcelona, the session panels focused on the hottest topics in mobile, such as 5G, artificial intelligence and blockchain. The more controversial panels discussed the bias found in data, and how that data goes onto inform algorithms, which results in unethical conclusions. Speakers and panelists pointed out the racial bias in prison sentencing, gender bias in mortgage loans, financial institutions, age-related bias that occurs during job recruitment, and pre-existing conditions in health care coverage.

Danny Guillory, the head of global diversity and inclusion at AutoDesk told Fortune Magazine that by running a search for a professional social network for social engineers, the results were primarily Caucasian men. Guillory pointed out that when you engage or ask for more results, the AI delivers candidates with similar attributes – more Caucasian men. Another example of AI bias is the notorious Microsoft’s Tay AI, when released on Twitter back in March of 2016, the AI quickly became misogynist and racist on social media within a staggering 24 hours.

AI may seem like an auxiliary technology to how we live our daily lives today, however, it will soon be the primary driver across the tech industry. PricewaterhouseCoopers estimates the world economy will reach an additional 15.7 trillion in value by 2030 due to artificial intelligence. To put this into perspective, the top 5 technology companies today have a combined value of about $4 trillion, which includes Apple, Amazon, Microsoft, Google and Facebook. The annual global technology spend is similar – about $3 trillion. Over the next decade, AI will drive a market 5x the size of tech’s current global spend.

Although this growth is exciting on many levels, the panelists at MWC 2019 voiced concerns about the handling of inherent biases that comes from data, as clearly discrimination by age, race, gender, education or other factors within audience segmentation is counterproductive to the advancement of society that AI promises.

My newsletter subscribers get this information first. Sign up here.My newsletter subscribers get this information first. Sign up here.here.

AI algorithms are responsible for making consequential decisions and are trained to find lookalikes or other markers to learn patterns. Some argue that the bias occurs when the computer system reflects the humans who designed it. Proven downsides to artificial intelligence have surfaced in recent years, for instance with fake news allegedly influenced the 2016 Presidential election. These accusations are proof that we have run out of time in addressing these concerns, especially as we near the precipice of a much larger, multi-trillion-dollar AI market.

Provided there is more diversity within the field of artificial intelligence, many of the panelists asked who should regulate the infractions of algorithmic bias – governments or markets? Many felt there should be an international community to establish guidelines for AI. But even then, will the lower classes be invited or what level of inclusivity will an international community realistically provide for, as the world’s most vulnerable and marginalized people are unlikely to be represented. In this way, AI could further the gap between lower class and upper class along socioeconomic lines, if it hasn’t done so already as AI is currently in use by the largest financial funds in capital markets.

The unanimous solution among the panelists and speakers was to broaden the conversation and not limit artificial intelligence jobs only to technical experts. “Requiring someone to know Python in order to work with AI is not democratizing AI,” one panelist pointed out. Along these lines, a more human centric approach is necessary.

MWC 2019: A Dose of Reality on 5G, Those Foldable Phones and Bitcoin Has a Serious Competitor

The GSMA Mobile World Congress (MWC) is the world’s largest exhibition for the mobile industry and combines influential companies from Asia, Europe and North America in the central location of Barcelona. The grandiose 20,000 square foot booths come with the largest names in mobile, like Samsung, Ericsson, Huawei, Google, Docomo, Telefonica, Orange, Verizon, AT&T, Qualcomm, Xiaomi, and other big names with big marketing budgets.

MCW 2019 Event

5G Loud and Clear

5G, 5G, and more 5G is basically the best way to sum up the news from the event. Every operator, network and manufacturer had some angle on the 5G rollout. However, hold your investment pennies for now on 5G stocks. The capex bill that comes with it may be one of the biggest the tech industry has ever faced. The GSMA trade group, a trade body that counts over 800 telecom and mobile corporate companies as members, stated that carriers will be spending $160 billion on an annual basis to roll out 5G networks. In addition to network costs, trillions will be required to install the infrastructure needed for the content, applications and emerging tech that will rely on the 5G networks (i.e. smart cities, autonomous vehicles, virtual reality, etc). Think 5G makes for a good long trade? Again, don’t count on it for now as the GSMA also stated only 15 percent of all mobile connections will be on 5G by 2025. (As I mentioned, the GSMA is a fairly reliable source as it counts 800 of the world’s top mobile companies as members).

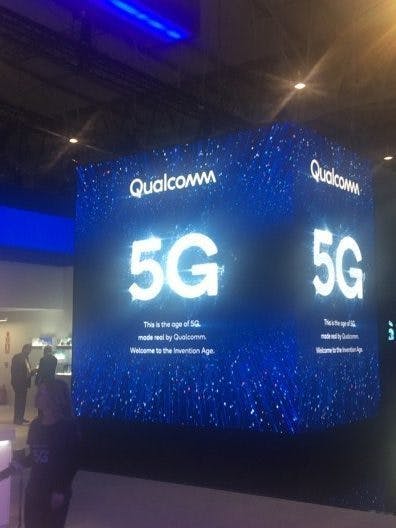
Qualcomm 5G

According to VentureBeat, the financing firm Greensill puts the total cost for 5G at $2.7 trillion through the end of 2020. The issue is that it’ll take a few years to see any returns, which will put networks in the red until applications catch up. This, of course, is the fine print to 5G that the lights, camera and action of the booths at MWC didn’t portray (view my Instagram posts here). In fact, there was a panel where Mike Fries, the CEO of Liberty Global, pointed out that carriers in Europe have not recouped costs on 4G yet. “You’ve had 10 straight years of declining mobile revenues in Europe with the biggest issue being price,’ he said.

Will Foldable Phones Drive Sales?

Foldable phones were the most talked about product at the event. Huawei’s Mate X and Samsung’s Galaxy Fold were both on display behind glass cases. The use-cases for the foldable phone include more productivity while on-the-go and new applications for cameras, such as seeing the photo before you take it due to the second screen. The price tag is high – over $2,000 is the anticipated number when the phone is released later this year. Following MWC, on February 28th, Apple Insider reported that Apple has filed a patent application for “Electronic Devices with Flexible Displays” with sensor and micro-heater technology to keep a foldable screens from becoming too brittle in cold temperatures. No doubt, mobile handsets have stagnated recently with iPhone revenue dropping in Apple’s earnings reports. Will foldable phones deliver enough ingenuity to revive sales? Time will tell, but it does seem like early adopters are taking a risk on the durability of the manufacturing as Samsung’s foldable phone is already reporting issues after being folded 10,000 times. According to Wired and ArsTechnica, the foldable phones from Samsung and Huawei are made of plastic polymers, which can scratch easily and cause the previously mentioned wear from folding the device. In the meantime, glass-maker Corning is “working on an ultrathin, bendable glass that’s 0.1 millimeters thick and can bend to a 5-millimeter radius” that may hit the market in about two years. (Wired’s article is less than obscure and is entitled “Want a Foldable Phone? Hold Out for Real Glass).

SoftBank Becomes Bitcoin Competitor

Blockchain was a more muted theme at MWC, one that was mainly talked about in sessions for Silver, Gold and Platinum pass holders. In one session, SoftBank had an interesting angle on how to transfer payments electronically in order to avoid the drawbacks of bitcoin. Their proposal is cross-carrier identification systems (CCIS) and payment systems (CCPS) technology that runs through telecom carriers. CCIS focuses on enabling identification and authentication, which reduces the need to have different usernames and passwords by using Zero Knowledge Proof cryptography and Distributed Ledger Technology (DLT) to issue, store and authorize for identification purposes without requiring detailed information. The goal is to prevent identify thefts while minimizing the current requirements needed to verify passwords by creating encrypted digital identities.

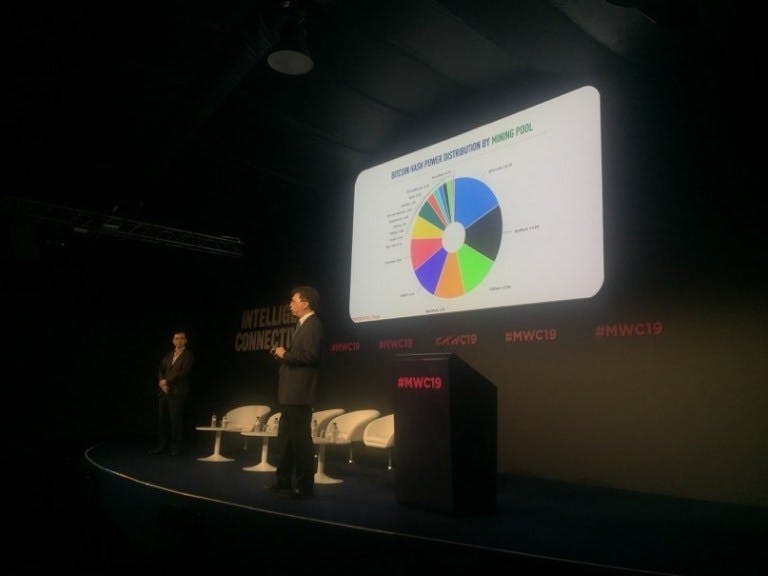
Presentation on MWC 2019

The second part to SoftBank’s partnership with TBCASoft is a blockchain-based platform for global or cross-border payments. For instance, a user can make purchases in Japan with U.S. dollars through mobile-based Rich Communications Services (RCS). The official press release was in September of 2018. Here is some more information on how it works:

“The PoC enables users to make a variety of in-store, mobile and digital purchases directly from their device. For example, a mobile customer based in Japan can travel to the U.S. and make a purchase supported by SoftBank and Synchronoss via RCS. In addition, the RCS global messaging standard can be used to send a payment, while the CCPS blockchain API enables the recipient to use an RCS-based messaging app or legacy messaging service to receive person-to-person (P2P) money transfers through the RCS wallet app.”

Facebook Stock: Too Good to Be True

Facebook has financial statements that Wall Street dreams are made of. Profit margins are at 40 percent, free cash flow outperforms due to low capex, and annual growth exceeds 20 percent year-over-year. In fact, FB posted 35 percent growth this past year with lots of runway to go. Meanwhile many of its FAANG peers struggle with high capex (Netflix) and diminishing growth (Apple).

To put it simply, Facebook’s cash flow and profit margins are not only some of the best in the S&P 500, but the best in the world. The ad dollar machine has incredible inertia and advertisers simply can’t turn away.  If you are looking at the income statements, then you have every reason to go all-in on this company.

The more insidious issue at hand is that Facebook is posting meteoric growth of 35% year-over-year in the middle of a tech slump, yet the stock price does not reflect the growth. The current earnings should have caused a rally, instead Facebook is at a PE ratio of 19 while posting better growth than Netflix with a PE ratio of 150, Google at 24 and Microsoft at 23.

In fact, Facebook is growing faster than 95% of the S&P 500 with margins higher than 90% of the S&P, but Facebook stock is hovering at post-Cambridge Analytics levels. If financials and free cash flow “never lie,” then this stock should be at $240 right now (well past the stock price it was when posting $40 billion annual revenue)

In April, I published “Facebook’s Challenges are Much Bigger than Cambridge Analytica.” You’d have to go back in a time machine to remember all of the stock investors insisting Cambridge Analytica was “priced into the stock” and Facebook would be the bull story everyone was betting on. Before the Q2 Facebook stock plunge, I insisted that the GDPR was a much bigger deal than investors realized and I broke down the various ways Facebook illegally (in the EU) takes data from users and non-users outside of Facebook. (Jeffrey Gundlach, the Bond God, may have stated the stock would be hurt by regulations, but he most certainly couldn’t explain why revenue would be affected or why investors should care. Likewise, Citron said Facebook was a long-term short, but has now reversed their recommendation to a buy with a fairly sensational report about Facebook being evil, which drove the price down making it a great opportunity – again, not explaining much in the way of the business model).

The goal of this article is to break down the risk of Facebook stock for any investor who wants to know. I realize a large majority of Facebook investors may not want to know, because, well, numbers don’t lie.

First-party data vs. Third-party data

Data extraction that is done inside the apps of FB, Instagram and Whatsapp is fair use and legal. You’ve given consent to use these apps, and how they use your data, within reason, is within the realm of a first-party relationship. This is very similar to how you engage with every company who you provide information to.

For the rest of this article, we are placing those applications aside. They are not at risk. What is at risk is that Facebook collects data from millions of applications and websites it does not own. This is called third-party data because you are not a party to the customer relationship in order to collect the data. As of May 25th, the European Union made this illegal in those geos.

Take a look at your smartphone right now. Facebook is collecting data from your applications through software called Audience Network. If you have 25 apps on your phone, Facebook’s software is tracking you inside 12 of those applications, for example. (Again, we are not talking about Facebook-owned apps – these are not apps owned by Facebook).

The GDPR is concerned with tracking that occurs outside of a first-party relationship, and Facebook’s revenue will be affected when third-party data collection is cut off.

Don’t believe me? You don’t have to. Facebook has stated they expect single digit losses and they list the GDPR and data regulation as a risk in their SEC filings. The window of opportunity here, if you like to bet against Facebook (like I did and will again), is that Facebook investors are walking towards a mirage of uninterrupted returns. They, again, think Facebook’s problems are in the rear view, and that these privacy issues are within Facebook’s domain, such as FB, Instagram and Whatsapp. Perhaps more concerning, is that investors don’t have a means of determining how third-party sites (that Facebook does not own) contributes to the $55 billion in revenue.

Germany is Hot on the Trail

Despite all of the investigations on privacy this past year, regulators and the press struggle to organize the issues into one clear thesis. Are we worried that Facebook is leaking data to profiling agencies like Cambridge Analytica? Is Facebook politically motivated and censoring posts or is this a free platform for people to express their ideas? Or what about the pixel we keep hearing about? Or that Facebook should censor what teenagers post? What was that thing about George Soros and Sheryl Sandberg? It’s a complete mess.

The FTC is unlikely to understand how a software development kit (SDK) works and what kind of device signals SDKs can extract, and why that threatens privacy[1]. The FTC is still reacting to fairly insignificant data leaks and the accusations of political brainwashing (this is what the FTC is likely to fine Facebook for). It clouds the actual practices that lie beneath, and it’s unintelligible as to why Facebook investors should care about any of this.

Not to fault the FTC. Since I wrote my article in April, hundreds of journalists have covered Facebook’s privacy issues, and not one reporter has clearly described how Facebook’s software extracts data across billions of users the company doesn’t have a relationship with, and why this is illegal in the EU as of May 25th, 2018.

My newsletter subscribers get this information first. Sign up here.My newsletter subscribers get this information first. Sign up here.here.

Germany, however, is hot on Facebook’s trail. Last month, I read an article that spelled out exactly how and why Facebook’s business models are at risk. If you’re an investor in Facebook, you’ll want to read it and follow what Germany is doing. As the article pointed out, Facebook is collecting data off-site from millions of applications and websites it doesn’t own, and Germany most certainly doesn’t want its citizens tracked by a company in the United States with this software.

Therefore, the approaching FTC fine for political issues or fake news is a red herring. The important regulations to watch are from the European Union as their concerns will have the greatest impact on Facebook’s revenue, which I believe is unsustainable in the current regulatory environment.

What is Audience Network and the Pixel Worth?

Hopefully, Facebook bulls have stopped reading the article by this point as they definitely will not want to hear the specifics on how much revenue is generated from the third-party data that Facebook doesn’t have consent to collect. (If bulls are still reading this article, I am sure to hear about it in the comments).

A few stats:

  • Facebook’s “third-party website and application” revenue is not in their SEC filing. Google clearly discloses this and the company makes $17 billion per year off third-party sites. (I think the fact FB didn’t break out this line item is a bit misleading, but that’s up to the SEC and anyone who experienced losses from Facebook stock to determine).
  • The official statistic I have in my research is that Facebook’s software is in approximately 40% of the mobile applications on the market. That exceeds Google’s third-party reach on mobile and would be about 2 million iOS and Android apps. If you look collectively at these 2 million applications, all of the 3-4 billion smartphones in the world today will have at least 1 of these 2 million applications installed.
  • Facebook Audience Network directly monetizes over 2 billion users (off-Facebook and off-Instagram) yet collects data on approximately 3-4 billion users. The value of this exceeds the value of Instagram (which has 1 billion users).
  • The data from the software informs the entire ad machine for higher average revenue per user. (Lookalike modeling is somewhat complicated but that’s the easiest way I can describe it within this article). I wrote about lookalike modeling a few years back. You can read about it here.
  • In 2016, Facebook executives warned of ad load issues. This means that the Facebook properties of FB and IG can only handle so many ads as there is finite inventory. The majority of the revenue made past this date would have relied on the Audience Network 2 million app-reach.

I put the value of Audience Network and third-party data at $20 billion in annual revenue. This is conservative considering Google makes $17 billion and when comparing apples to apples, mobile is worth much more than desktop (mobile can extract location, text/SMS and app activity across the device). You could probably add about $5 billion in brand reputation issues, as well, if/when third-party revenue is cut off. In addition, Facebook has added about $35 billion in revenue since the warning of ad load issues [2] in 2016, and at the time, Audience Network was stating massive user growth of over 1 billion users. Assuming half of this came from the new software with a reach 3-4 billion people is, again, conservative.

Is Facebook still a great stock at $30 billion annual revenue? Yes, in fact, I think it’s priced pretty close for a company with those financials. The adjusted expectations of the market could cause a shock for a year or two, but in the long-run, a $30 billion in annual revenue with low capex is still a solid business.

Takeaway: If you’re one of my readers who is invested in Facebook, keep a close eye on the EU and don’t get a false sense of confidence if the FTC clouds the press with fines for fake news or political ads while Germany and the EU pursues the software that collects third-party data.

The timing of this is probably 2020-2021, maybe even 2022 for all of the third-party data collection to be regulated. My prediction is that 2019 will be the year the European Union cuts off the third-party software and the United States may catch up during the election year or shortly thereafter. I’m watching the EU closely for a put option now. If they go forward, I’ll enter a short position again (as I did when the GDPR went into effect end of May 2018 and was rewarded for that courage).

[1] For reference purposes, an SDK has the capability to track every activity performed on the smartphone across ten device signals and sensors. They track everything you click, say or text inside the apps, and they can track your location whether you are inside the application with the SDK or not.

[2] Ad loads refer to the limited amount of ads social media feeds can show. For instance, one social media user may see a ratio of one ad per seven posts, which restricts the number of ads Facebook can serve within its own properties of Facebook and Instagram, creating finite limitations.

Best Bet for Tech Stocks in 2019? Secular IaaS.

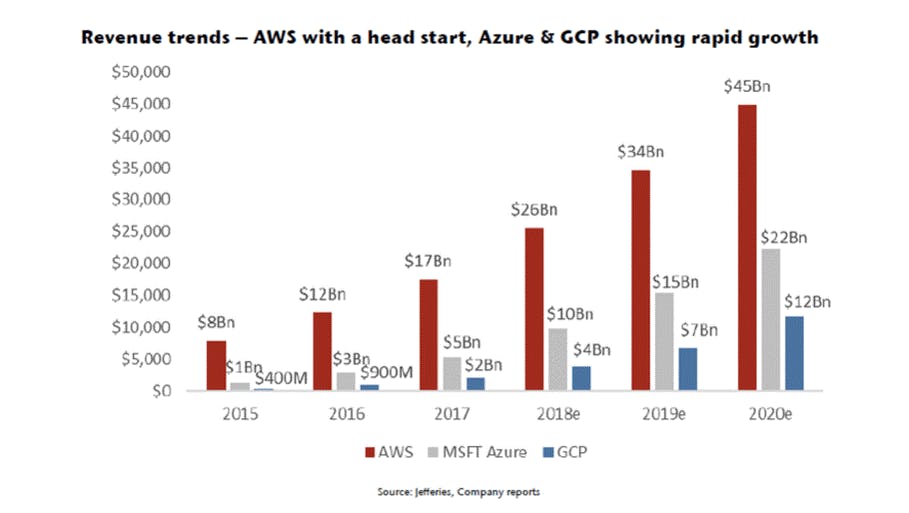
If ever there was a growth story in the next 2-3 years, especially during potential economic uncertainty, then infrastructure-as-a-service (IaaS) is it. This past week, Amazon’s IaaS offering, AWS, reported sales growth of 45% from $5.11 billion to $7.43 billion, with operating income increasing 61% to $2.18 billion up from $1.35 billion. Microsoft’s IaaS offering, Azure, was up 76 percent (same as last quarter) reaching $4 billion in revenue. Microsoft’s overall commercial cloud computing revenue which includes software grew 48 percent to $9 billion. If both companies continue on this trajectory in 2019, then Microsoft will narrow its gap from 3:1 to 2:1 with Amazon.

2018 CLOUD IAAS REVENUES
$26 billion AWS
$10 billion MS

UPDATED PROJECTED 2019 if growth continues at current rate
$16 billion MS
$30 billion AWS

Amazon, Microsoft and Google Revenue Trend Chart

Note: I’ve written quite a bit of analysis over the last few months about the duopoly between Microsoft and Amazon. To quickly summarize, my first analysis discussed the strategic acquisition of Github. My second analysis discussed the great efforts Microsoft has put into become a serious bidder for the Pentagon contract.my first analysis discussed the strategic acquisition of Github. My second analysis discussed the great efforts Microsoft has put into become a serious bidder for the Pentagon contract.

Truly, there is plenty of green field for both players. The investment window for the IaaS market is far from over as it took twelve years for the IaaS market to reach $40 billion and it will take only three years to double to $80 million – and this figure is on the low end of estimates.

My newsletter subscribers get this information first. Sign up here.My newsletter subscribers get this information first. Sign up here.here.

Here are a few of the projections for this space from various analysts:

  • Amazon’s Cloud Business could reach $71 billion by 2022 with a valuation of $350 Billion (source Jefferies – which tends to be more bullish on AWS than MS).
  • Microsoft’s Cloud Business Could Be Bigger Than Windows by 2021 with $26.4 billion in revenue in 2021 fiscal year vs. $20.3 billion from Windows (source: Keybanc – most estimates on MS are low, which is why there’s still a growth story here)
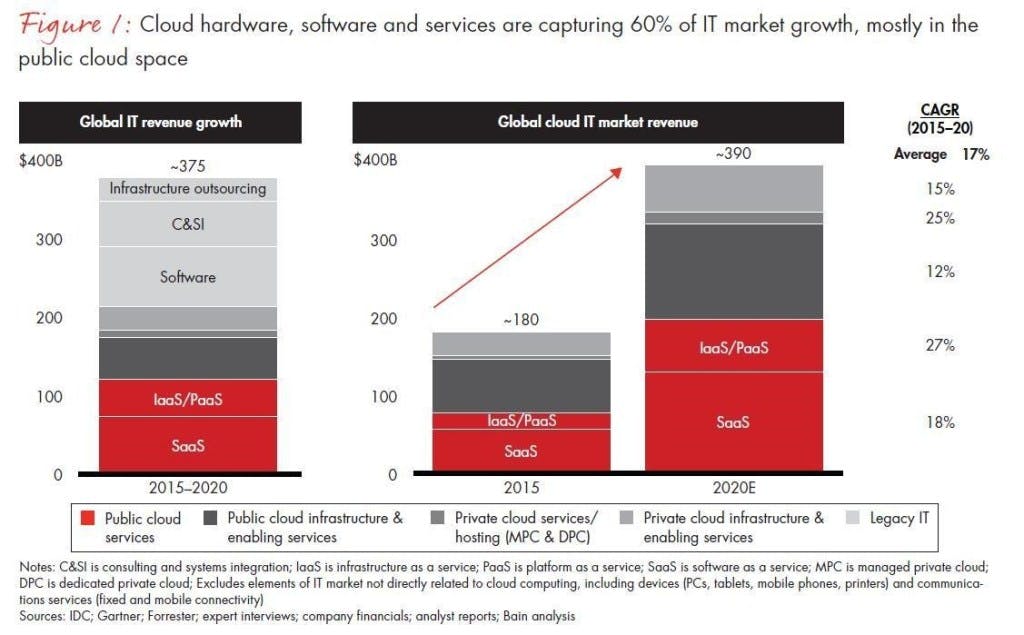
  • Global cloud IT market will triple between 2015 and 2020 with IaaS being the segment with the largest growth of 27% compared to SaaS growth of 18% (source: Bain and also SoftwareStrategistBlog.com)

Global IT Revenue Chart Growth source: Bain Analysis

IaaS Cloud is Secular

On a micro-level, the tech industry is in a state of transition. Mobile is hitting saturation, social media faces privacy regulations, chip makers are getting hurt in the trade war, and meanwhile, 5G, artificial intelligence, and autonomous vehicles are too nascent to see returns in the near term. This is one reason I continue to hammer on IaaS as a safe, secular bet. Companies are going through a major transition right now by transferring work loads into the cloud.

As these transitions take place, IaaS will be as essential to companies as food, gas and cigarettes are to consumers. The company that has transferred to the cloud cannot exist without budgeting for this operating expense. Meanwhile, the companies who have not transferred to the cloud risk losing on competitive advantages such as artificial intelligence, machine learning, and scaling quickly through server virtualization.

As it currently stands, IaaS is Amazon’s largest revenue segment and Microsoft’s fastest growing revenue segment – although there is plenty of addressable market left for both players. Amazon’s capex spending (which includes all capex; not AWS specific) was at $14 billion in 2018 while Microsoft reported capex of $12 billion. One major drawback is that these are not pure play IaaS stocks which introduces risk from other revenue segments. You can read my follow up analysis on 6 pure play cloud stocks here.6 pure play cloud stocks here.

Pure Play Tech Stocks to Benefit from IaaS Growth

This is the second article in a 2-part series. The first article “Best Bet for Growth Stocks in 2019? Secular IaaS.” can be accessed here.This is the second article in a 2-part series. The first article “Best Bet for Growth Stocks in 2019? Secular IaaS.” can be accessed here.here.

One reason for Microsoft’s success with growth rates of 76% in the last two quarters is the company’s hybrid approach. This approach helps customers keep their most sensitive data on their own servers while sending workloads that have advantages as  cloud apps, such as real-time data analytics, to Azure. This, in turn, has caused Amazon to chase Microsoft with recent efforts to improve its hybrid solutions.

The Department of Defense is a perfect example of an entity that would want to keep its most secure data with on-premise servers while leveraging the cloud for artificial intelligence and machine learning. Fortune 500 companies with substantial IP are another example of who would require on-premise security.

Understanding hybrid is key because it gives transparency into how companies with big budgets think and how they evaluate the cloud. Security is clearly a concern as on-premise servers continue to be in demand as a counterpart to the public and private cloud. Therefore, small to mid-cap companies which help to make the cloud more secure have room for near-term growth.

Additionally, the strengths and benefits of the public and private cloud include mining data more efficiently and improving accuracy and also productivity. Therefore, any small to mid-cap companies that assist with data insights or improved work flows will have room for near-term growth. For example, SalesForce is a major growth story that came from improving both the accuracy of sales targets and productivity of sales teams.

Below are a few of the more popular stocks in the cloud space. Although it is my belief some of these are overbought, and will have to prove themselves if we do go through a bear market, it most certainly doesn’t hurt to have them on the radar and to look for the right entry point.

  • Okta and Zscaler are both in cloud cybersecurity. Okta is in the identity and access management market which secures access to APIs, provides single sign-on, and prevents data breaches by protecting identity credentials through multi-factor authorization.

Zscaler is a “zero trust security architecture” that verifies identification and access. Currently, most companies use a virtual private network (VPN) as a security architecture and Zscaler improves on this by leveraging the cloud rather than physical or virtual appliances.

 Risks: One of the greatest risks to these companies is the ongoing competition in cybersecurity. Cybersecurity, in general, is a hard space to create a competitive moat.  In Okta’s case, the tech giants can duplicate the majority of these services. An acquisition, especially talent based, would be a good outcome for Okta. In Zscaler’s case, a competitor could come in and create a pricing war. I also noticed recently that insiders of Zscaler have been selling their stock – one at $2.1 million in stock and another at $4.5 million. 

  • Twilio is a common household name in the San Francisco and Silicon Valley area due to a well-run developer evangelism team. This company was heavily promoted at every developer conference over the last 10 years and you can bet that most of its revenue comes from a very loyal fan base. Twilio’s cloud products are voice-based and SMS/text messaging based, as well as other communication functions through APIs. The translation here is that you can essentially make phone calls and send text messages in the cloud, for instance, like when you call or text through Lyft’s ride share app. Developer-led technologies with strong adoption and loyalty are hard for competitors to shake. In fact, it’s one of the primary key metrics I look for when making tech stock buys.

Risk: There could be a point where artificial intelligence begins to eat into Twilio’s market share. Any manual requests by users or communication done through texting, for instance, will be replaced with highly accurate voice commands. We will speak what we want rather than type what we want. Google, Amazon and Apple are quickly building this out, and the accuracy will be nearly perfect. You can read more on my analysis about the rise of AI assistants here. Twilio has clearly had amazing returns of 335%, so if you got in early, you’re high-flying right now. 

My newsletter subscribers get this information first. Sign up here.My newsletter subscribers get this information first. Sign up here.here.

  • Slack is also a common household name in the San Francisco and Silicon Valley area, and the 8 million subscriber base in 2018 includes 50% global teams in Europe and Asia. Slack is a collaboration hub for work that lets you communicate across multiple team members without having to create long and confusing email threads. There are many productivity features such as sharing files, making calls in-app, and having separate work spaces and threads. Programmers were especially fond of Slack in the beginning and now it’s caught fire across all departments. In fact, I’m currently logged into Slack as I type this communicating with my team.

Risk: Slack filed for an IPO this week, actually. The company is choosing to do a direct listing which introduces risk as the founders and VCs don’t have to wait to cash out of the shares they sell. For obvious reasons, it’s better to have the founding team be in the same sink-or-swim boat as its stock investors (if you don’t believe your company will have returns over the next 6 months, why should I?). Direct listings for buzzy tech IPOs are relatively new, and I’m still a bit weary of them. That point aside, Slack does have serious potential for growth.

  • Veeva is disrupting the pharmaceutical and life sciences industries by assisting with sales and operations while meeting health industry regulations. Veeva has a history of being an outlier with no competition to speak of, and is one of the rare companies that was already profitable when it made its public offering in 2013. Today, Veeva is close to securing the fifth spot for a cloud software company to reach $1 billion in revenue. If Veeva does hit TAM, an exit strategy could be a solid acquisition for deep pocketed Walgreens, CVS or Amazon who has big ambitions to get into pharmaceuticals.

Risk: The major risk to Veeva is the current valuation and total addressable market as they are targeting a specific industry. With a PE ratio hovering around 100 and price to sales of 19, this stock is priced to perfection. Quite a few tech stocks that came of age during the bull streak (for Veeva this was 2013) may have an awakening ahead of them. If there is a good entry point, Veeva’s revenue growth will continue with analysts projecting revenue to “reach just over $2 billion by fiscal 2024.” As an individual investor, I have to make sure the first $1 billion in revenue is priced right with a fair valuation or the second billion in revenue (projected to be five years from now) won’t matter for my returns. 

  • Workday is a cloud platform that increases productivity across HR and finance. This is done through machine learning, analytics and real-time reporting through a cloud platform. Products include financial management and human capital management. Workday is a large cap company and is ranked as the 27th largest internet company by revenue and is one of the first five cloud software companies to achieve $1 billion in revenue.

Risks: Similar to Veeva, Workday came of age during a raging bull market in 2012 and its valuations reflect this. It saw an 83% increase the day of its public filing and went on a tear in 2017/2018. The 52-week low is $107 and its current price is $186. With a price to sales ratio of 15, and no P/E ratio to speak of, I think we will see a better entry point than where it currently stands.

Autonomous Vehicles: Fact vs. Fiction at CES 2019

Robot dogs from Continental prove that autonomous vehicle hype has gone too far. At CES 2019, Continental announced a way to automate last mile-delivery without requiring a human. This is where the robot dogs come in. The company’s official statement was, “With the help of robot delivery, Continental’s vision for seamless mobility can extend right to your doorstep. Our vision of cascaded robot delivery leverages a driverless vehicle to carry delivery robots, creating an efficient transport team.”

Virtual Representation of Autonomous Vehicles with AI Robots. Source: Continental

The problem with robot dogs, and many other AV gimmicks, is that the industry is not talking truthfully about what where we are with AV and what it will take to put an advanced AVs on the road. This is harmful to consumers who mistakenly believe autonomous vehicles are available for purchase and already on the road today. In fact, 71% of respondents around the world believe they can buy an AV – yet there is not one AV on the market. The top three brands that consumers mistakenly believe distribute self-driving cars include Tesla (40%), BMW (27%), and Audi (21%). It’s also harmful to investors who expect AV technologies to be profitable in the near term of two to three years.

CES is one of the world’s major marketing events where autonomous vehicles were first hyped. The main stage, the keynotes, the sessions, the booths, the competition between rival companies – all of it pushed for bigger and better car demos. Which is why CES is the perfect platform for the announcement of PAVE, which stands for The Partners for Automated Vehicle Education. PAVE is a new coalition that will help educate the public and policymakers about the potential of automated vehicles. Audi, Aurora, Cruise, GM, Mobileye, Nvidia, Toyota, Waymo and Zoox have joined the coalition, which has a central focus on education and safety – and also a focus on more credible information. As stated by Mark Del Rosso, President of Audi America, “Traditional automakers and newcomers are investing billions of dollars in the technology that will make automated vehicles possible. PAVE recognizes the need to invest in public information – in making sure consumers and policymakers understand what’s real, what’s possible, and what is rumor or speculation.”

Just the Facts: Level 2 Automation at CES 2019

Level 2 automation is a reference to the six levels of autonomous vehicles published by SAE International, and adopted as the industry standard for discussing the various stages and evolution of autonomous vehicles. Level 0 is no automation and Level 5 is full automation without a human driver and does not have brakes or a steering wheel. We are at Level 2 right now and the industry is experiencing notable delays in deploying Level 3.

(NOTE:NOTE:  I’ve published extensively on an autonomous vehicle bubble due to investors pouring money into AV technologies that won’t commercially deploy for many years. You can access the analysis on GM herethe analysis on Tesla here and the analysis on how autonomous vehicles are creating a bubble here).

Below are a couple of the more important (and realistic) announcements from CES that will deploy in the very near future.

Nvidia

Nvidia placed emphasis on gaming this year at its Sunday CES press conference with the announcement of the RTX 2060, whereas it has been Nvidia’s tradition to focus on autonomous vehicles (and data center technologies) at the CES press conference. One day later, on Monday at CES, Nvidia launched DRIVE AutoPilot, which will improve advanced driver assistance features, such as enabling lane changes, pedestrian and cyclist detection, parking assist, and personal mapping. This improved automation strengthens the Level 2 vehicles we see on the road today.

Intel

Intel had a showy display that included a Gotham City themed BMW X5 equipped with large screen TVs, projectors, sensors and haptic feedback. Visual distractions aside, the real news from Intel at CES is the company’s ongoing focus on China. Intel did not officially state they are redirecting their efforts from the United States to China, however, the announcements speak for themselves:

  • Mobileye, Beijing Public Transport Corp. and Beijing Beytai Collaborate to Bring Autonomy to China’s Public Transportation
  • 2019 CES: Great Wall Motors, Mobileye Join Forces to Deliver ADAS and Autonomous Driving Solutions in China and Beyond
  • Intel and Alibaba Team on New AI-Powered 3D Athlete Tracking Technology Aimed at the Olympic Games Tokyo 2020

My newsletter subscribers get this information first. Sign up here.My newsletter subscribers get this information first. Sign up here.here.

This is in addition to a hard-to-miss announcement back in July that Baidu was partnering with Mobileye on their Apollo vehicle. At CES 2019, Baidu had on display the successful implementation of Mobileye’s Responsibility Sensitivity Safety (RSS) in the simulation engine of Apollo (I personally tried out the simulator).

Baidu Spokesperson at CES discussing Data-Centric Innovation

It’s important to note that China is not immune to the issues the industry faces in advancing from Level 2 automation to Level 3 automation. China, too, is idling at Level 2 (apologies for the pun). For instance, Great Wall Motors released a statement at CES 2019 that “GWM hope to integrate Mobileye’s solutions into its vehicles. Starting with L0-L2+ within the next three to five years, the companies are also exploring opportunities for Mobileye’s Level 3 products.”

Baidu and Mobileye have both made promises to deliver Level 3 by 2019 and Level 4 autonomy by 2021. These dates were announced in 2017 but there has been no recent updates as to the estimated delivery for L3 – including at CES this year.

Mercedes Benz

The best AV investments over the next three to five years will come from companies who are taking baby steps towards a better and safer driving experience. Mercedes-Benz is one company making the most of Level 2 partial automation by announcing a new CLA class. The CLA class is a more tech-driven option with augmented reality for navigation, and an Interior Assistant that understands indirect voice commands and operational gestures. (Read my analysis on how we have reached a tipping point for AI-powered assistants here). An example of this is when a driver reaches over in the seat, and lights automatically illuminate the area. You can also set a command such as “navigate me home” or ask the voice assistant something complicated like “find child-friendly Asian restaurants nearby with 4-star rating which are neither Chinese nor Japanese,” which was one example given in the demo.

New Autonomous Vehicle Mercedes Benz CLA class. Source: TechCrunch

Takeaway:

Nvidia and Intel had a different tone at CES this year in regards to autonomous vehicles. Nvidia’s launch of DRIVE AutoPilot is a smart strategy to boost sales in the short term while the AV future of Level 3 or Level 4 sorts itself out. The Mercedes CLA class is another great example of a strong Level 2 automation strategy. Intel is clearly betting on China, especially Baidu, although China is not immune to the difficulties of how to get a machine to react like a human. Notably, there was no Level 3 follow up from Baidu at this year’s CES despite promises for arrival in 2019 (although the year is young).

Regardless of make or model, AVs are stuck at Level 2, and there are too high of expectations as to when advanced AV will turn a profit. Therefore, the AV market will struggle as the delivery of reliable and safe automation continues to see delays. Nvidia, Intel and Mercedes are a few companies preparing for the slow down, and I’m betting we will see others do the same this year.