Qualcomm has not reached its $100 stock price high since the late 90s. Since then, Qualcomm’s price action has been in a series of multi-year ranges, overlapping structures, and powerful uptrends that get sharply interrupted, which makes charting its structure not as straight forward as other stocks.
However, with 30 years of price action, I believe we will see a pullback, followed with a renewed uptrend that should take QCOM to all-time highs for the first time in 20 years.
Elliott Wave Count – Game Plan
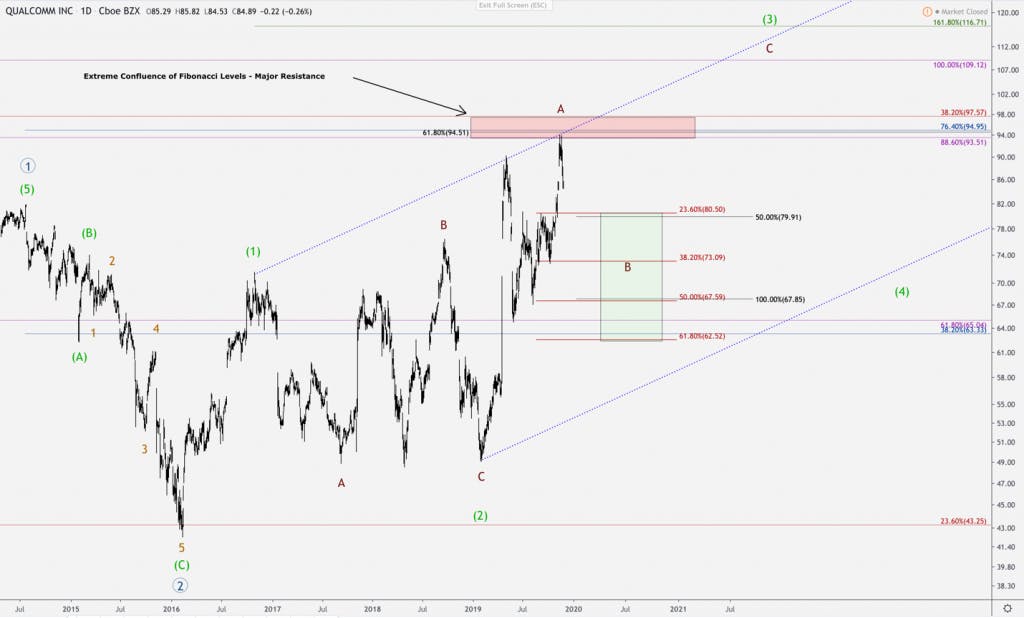
The above chart is a snapshot of Qualcomm’s price action trading from 2015 until now. We are currently in a larger degree, primary wave-3, which is highlighted in blue. This wave will take years to play out, and will see a number of corrections along the way.
Remember, each wave is comprised of its own internal waves and is part of a larger wave. So, if we go one degree lower in time, what’s evident is that the primary wave-3 in blue is unfolding in a leading diagonal pattern. We are currently on the 3rd wave of 5 within this leading diagonal, which is highlighted in green. The evidence supports that we should expect a B wave correction soon.
Recently, the price of Qualcomm was met with a very tight cluster of Fibonacci levels, which are derived from multiple timeframes, and instantly reversed. This would put us in the beginning stages of the B-wave retrace, and the likely targets are in the green box. These price levels are comprised of retrace levels that will act as likely support and reversals in the coming correction.
Based on how dislocated semiconductor valuations got from their price, I will be targeting the lower end of the green box, which has another confluence of Fibonacci price clusters.
Internals and Trendlines Support Correction
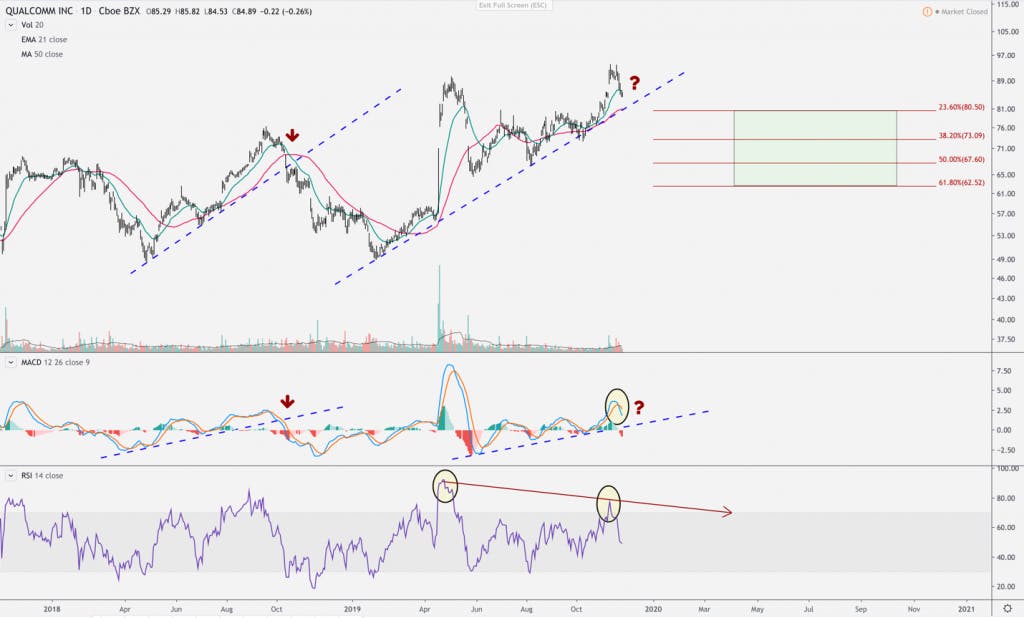
If we look at the trendlines and internals of Qualcomm, it supports the correction scenario outlined above. First off, the RSI is showing negative divergence – the RSI is making lower highs while the price of QCOM makes higher highs.
This is always a caution sign and signals a drawdown of some extent, but it’s also worth noting that QCOM is also in overbought levels, further supporting the need for a momentum reset.
Next, it’s worth noting the 2 uptrends, which are highlighted with the blue dashed lines. Below each uptrend, the MACD moves along its own trendline. When the MACD is trending along with the price, it’s the sign of a healthy uptrend.
The MACD uptrend can also act as a warning of a large drawdown as well. Notice when the MACD and the price both broke their trends and how much downside that followed. I’m not expecting a drawdown of the magnitude we saw in late 2018; but, I am expecting a healthy correction.
The MACD also rolled over and is heading back towards the trend line. Once these trendlines break, the green target box will be in play, and I will be looking to make a position. For anyone that does not want to time their entries and wants to buy today, a suggested stop would be at $61.
However, I believe we will see a pullback into the region between $80 on the shallow end – and $60 on the more severe end. There is a large number of price clusters around the mid to low $60, and I would be a buyer around this price region.
Semiconductors are going through an important divergence between earnings and stock price. Earnings are flat to negative YoY and QoQ, and yet stock prices are reaching 52-week highs. Although a rebound was forecast for 2020, semiconductors have blown past price targets, leaving little left to be desired in their valuation.
This is not a good time to initiate semiconductor positions purely based on 5G. My preference is to wait until forward earnings/guidance and valuations are more aligned, especially with the trade war risk, capex costs for cloud and 5G expansions that will affect some companies, and the slower recovery than current valuations suggest. For instance, only 12 of 30 semiconductor companies plan to return to growth next year. The majority are expected to report below 10% growth next year and will remain below 2017 sales levels.
Regarding semiconductors for 5G, it will be important to differentiate between consumer use cases and business use cases. The latter is 5G’s true growth opportunity yet is much further out from deploying. To illustrate, Bernstein Research, a renown sell-side analyst firm, believes 5G will be more of a replacement cycle for 4G, so the unit opportunity will not be as significant as previous generations in the consumer category.
Another challenge, which I will cover in a separate analysis, is the end-to-end 5G infrastructure. Gartner predicts that half of communication service providers (CSPs) will fail to monetize back-end infrastructure due to systems not fully meeting 5G use case requirements. A complete infrastructure will be built by the 2025-to-2030 time frame, with 5G radio deploying first, then core slicing and then edge computing.
Regarding the consumer 5G opportunity, Qualcomm predicts 200 million 5G smartphones to be sold next year and 450 million 5G smartphones in 2021. Currently, there are 1.5 billion smartphones shipped annually. The semiconductors below primarily benefit from consumer 5G.
The global 5G infrastructure market is currently valued at $371 million in 2017 and is projected to reach $58 billion by 2025, growing at a CAGR of 95.8% from 2018 to 2025. We will cover infrastructure and business/industrial 5G use cases in a future analysis.
5G Semiconductor Overview
Qualcomm is an interesting opportunity because they are dominating consumer 5G across many geographies and smartphone manufacturers while positioning themselves for business use cases in the future. This is unique compared to opportunities where you are confined to either consumer or business. I cover Qualcomm in length below.
Lam Research is being aggressive with buybacks with one analyst forecasting the company will return about $12 billion to shareholders from 2018-2023. This is about 30% of Lam’s market cap. The company stands to gain from the upgraded memory that will be required from 5G.
This analysis also covers Qorvo, a company that exceeded analyst expectations recently. The company has quite a bit of exposure to Huawei and China, where 5G is ramping up quickly yet carries very high risk. However, 35% of revenue is derived from Apple and may help to offset any trade war issues with 5G in the United States.
Broadcom had a peak year in 2018 with $20.8 billion in revenue and is expected to reach $16.97 in fiscal year
2019. According to current guidance, Broadcom will report $19.52 in fiscal year 2020 and $22.36 in fiscal year 2021. Like Qualcomm, Broadcom should make up to 50% more on chips from 5G than 4G (see Qualcomm for stats).
Qualcomm
Qualcomm is a company that has been working towards the 5G rollout more aggressively than almost any other company on the market today. Qualcomm was a first mover in 5G technologies, such as mobile mmWave, flexible frameworks, scalable OFDM numerology and reciprocity-based massive MIMO.
Basically, Qualcomm is well diversified and singularly focused on 5G. This market lead was demonstrated when Intel exited the 5G smartphone modem business last April and sold its offerings to Apple for $1 billion. This was around the time when Apple acquiesced and struck a deal with Qualcomm, their long-time nemesis. This supports Qualcomm’s assertion they have the best chip on the market as there had been rumors Apple was designing their own chip or would go with MediaTek.
Qualcomm’s market lead has also allowed the number one chip designer to be the provider of 5G modem chips for Xiaomi, LG Electronics and ZTE – plus Samsung although not exclusively. Qualcomm estimates their serviceable market to be $65 billion now and $100 billion in three years (always consider the source).
On that note, Qualcomm can charge more for 5G chips. Analysts estimate 5G smartphones will offer Qualcomm the opportunity to sell 50% more dollar chip content per device versus the prior 4G generation, due to the increasing complexity and higher pricing. Dollar chip content refers to the dollar value of chips that a device holds. (source: Barrons).
As stated in the intro, Bernstein Research, a renown sell-side analyst firm, believes 5G will be more of a replacement cycle for 4G, so the unit opportunity will not be as significant as previous generations. This is because 4G delivered mobile broadband with smartphones being the primary benefactor. The next generation will deliver the wireless edge with 5G New Radio (NR), with the main benefactor being new platforms of interconnected devices and M2M communication.
It helps that Qualcomm is diversified. The number of 5G-capable devices will rise from fewer than 5 million in 2019 to more than 50 million in 2020 due to phones, routers and hot spots.
Qualcomm is positioned for both consumer and business use cases through over-arching infrastructure. The global 5G infrastructure market was valued at $371 million in 2017 and is projected to reach $58 billion by 2025, growing at a CAGR of 95.8% from 2018 to 2025.
Here is the list of the suite of 5G related technologies offered by Qualcomm:
• Private networks
• 5G internet of things (IoT)
• 5G broadcast
• mmWave evolution and also Sub-6Hz spectrum
• XR Devices such as Augmented Reality and Virtual Reality
• Shared, unlicensed spectrum
• 5G NR C-V2X smart transportation (autonomous vehicles)
• Industrial IoT with eURLLC
Holistically speaking, 5G will enable fully-distributed artificial intelligence rather than cloud-centric AI. This goes beyond lower latency and customized/local value. Soon, AI will occur on-device for internal optimizations. This will create:
• On-premise control for factories and manufacturing robotics and machinery
• On-device intelligence assisted by the cloud; critical for autonomous vehicles to operate
• Distributed processing for XR devices.
• Cloud computing, storage and instant access
• Low-latency gaming
• Better AI voice assistant and AI user interfaces
For enterprises, Qualcomm offers 5G New Radio (NR) mmWave private networks. The most likely industry to adopt private networks is the industrial sector. Release 16 for 5G will occur in the H1 of 2020 and private networks will begin to scale in 2021. Private LTE provides a clear and committed upgrade path to 5G.
The term “private networks” refers to networks with radio core, and transmission resources dedicated to the enterprise. Most importantly, the private network is under the control of the enterprise.
Less industrial businesses are unlikely to upgrade to 5G until there is a clear cost-benefit ratio. There are also other options which leverage LTE and WiFi that are less expensive than 5G mmWave technology.
Cellular vehicle-to-everything (C-V2X) will be included in future 5G releases for autonomous driving. The enhanced network communication proposes vehicle-to-vehicle, and vehicle-to-infrastructure communication. For instance, not only will the vehicle you’re driving communicate with the vehicles around you to assist with braking and lane changes, but the vehicle will also communicate with street light infrastructure. This is a future technology and not a serious catalyst at this time.
Fundamentals
Qualcomm’s fundamentals reflect many of the risks involved with the stock. The first is the ongoing lawsuits Qualcomm is involved with, and the second is licensing fees, which Huawei is currently withholding. To put it plainly, most of Qualcomm’s partners do not like Qualcomm.
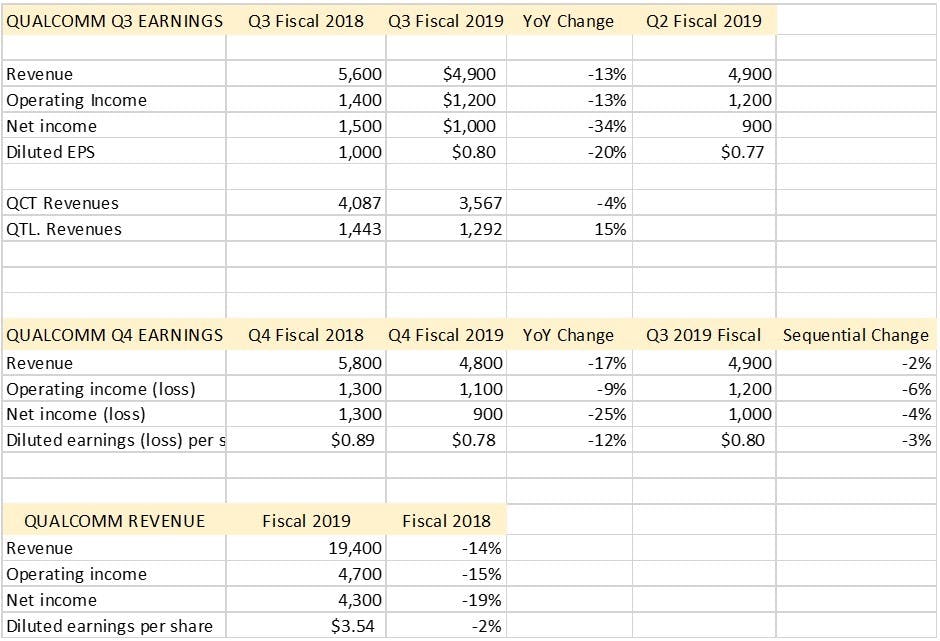
The current semiconductor rally would cause one to believe we have found a bottom for semiconductors. By my estimation, this is not true for Qualcomm. Next quarter, the company is forecasting $4.8 billion in sales and $0.85 EPS, which is relatively flat. Combined with the current stretched valuation for semiconductors, there should be a lower entry.
With that said, expected sales increase for Qualcomm for 2020 is 17%. For 2021, a sales increase of 21% is expected. This is substantially better than the previous three years, which posted negative sales growth.
Risks:
Qualcomm’s Snapdragon X50 5G modem is considered the industry’s most advanced offering. However, Huawei openly challenges this assessment. Last March, the CEO of Huawei stated that the Balong 5000 modem can download at double the speed of the Qualcomm X50.
Whether this is true is irrelevant. Huawei is essentially stating it has no plans of using Qualcomm, and China overall is likely to be less dependent on foreign chipmakers in the 5G era.
As of now, Huawei builds up to 60% of their Kirin mobile processors. Bernstein Research has stated they expect HiSilicon Technology to be Asia’s biggest chip designer by revenue in 2019. HiSilicon Technology has tripled its revenue from $2.4 billion in 2014 to $7.6 billion in 2018. MediaTek supplies Oppo, Vivo and Xiaomi. Samsung has developed its own 5G modem chip for high-end devices in markets, such as South Korea.
Therefore, it’s very possible that whatever United States mobile technologies gain from 5G will be offset in what these companies lose from China’s nationalist stance. Also, Qualcomm enjoyed 5G hegemony in fiscal 2019 with 230 5G design wins across 40 OEMs, and this will be challenged in 2020 and beyond.
Qorvo
Qorvo is a provider of radio frequency chips for mobile products (MP), and infrastructure and defense products (IDP). The mobile product is a radio frequency solution that performs various functions in the cellular radio front end section of smartphones and other cellular devices. The IDP segment supports global applications, including high-speed network connectivity to the cloud, data center communications, and internet connectivity.
Qorvo has beat quarterly estimates for the past four quarters. The company recently experienced a surge in stock price due to reporting Non-GAAP EPS of $1.52 versus $1.30 and also beat the revenue consensus by 7%. On a GAAP basis, Qorvo reported revenue of $807 million with gross margins of 40% and diluted EPS of $0.70. The company also announced $1 billion in buybacks.
Notably, despite beating earnings, the company has had relatively flat revenue growth of 4% in 2019 following negative growth in 2018, and continues to forecast for minimal growth of 2.3% growth in 2020. Compare this to 2015-2016, when Qorvo saw about 50% revenue growth YoY.
Earnings are expected to grow at 56.9% annual growth through 2022, which exceeds the industry average of 19.6% and the market’s 14%.
Qorvo is an Apple supplier with 35% of revenue derived from the iPhone. The Huawei ban is an important consideration for Qorvo. There continues to be extensions on the entity list that bans US suppliers from selling components to Huawei. The extensions on the ban have allowed chip companies to recover from May lows.
As of now, another reprieve will be needed when the extension expires in December. According to author KwanChen Ma on Seeking Alpha, a full Huawei ban knocks off 13% of Qorvo’s revenue.
Notably, according to Mayfield Recorder, institutions have taken gains on Qorvo recently with outflow exceeding inflow for the first time since Q2 2017.
Lam Research
Lam Research provides micro-processors, memory devices, various processing solutions and fabrication equipment for semiconductor companies. Front-end wafer processing solutions from Lam Research help to create chips and applications for nearly every edge device on the market. Wafer processing create transistors, capacitors and wiring for semiconductors.
Lam Research has a potential growth opportunity due to the increase in demand for memory from artificial intelligence, IoT devices, and 5G mobile communication. Down the line, memory will also be needed for autonomous vehicles. Memory manufacturers need wafer fabrication equipment.
Despite negative year-over-year growth and only 5% growth forecast for 2020, Lam Research has rallied. The stock is trading 116% higher from December lows. One catalyst is Lam’s buyback program. The company is returning 50% of its free cash flow to shareholders through dividends and buybacks with plans of returning a total of $12 billion to shareholders by 2023. This will lead to a 11.5% decline in shares.
One argument for Lam Research is that the company is protected from supply and demand in memory as memory manufacturers will continue to buy from Lam even during a low point in the cycle. This was proven during 2015 when Lam did not feel the effects of the memory trough. Secondly, Lam spans across Micron, Samsung and Intel, and therefore, is more diversified.
As recent as last July, Lam Research’s profits were nearly 50% less than the year-ago quarter at $541.8 million compared to $1.02 billion a year ago. Sales were $2.36 billion compared to $3.13 billion in the year-ago quarter. In current quarter, Lam reported -8% year-over-year sales. As stated, the company is forecasting only 5% growth next year.
Although Lam is situated nicely for memory growth, the numbers are not reflective of the opportunity. It’s likely we see a lower entry for this stock.
Broadcom
Broadcom is one of the rare semiconductor companies that is expected to post increasing revenue and EPS this year. Next year, the company is expected to grow 4-5% across the top line and bottom line. Historically, Broadcom has been on a nice trajectory compared to many semiconductor peers, with 50%+ increases in annual revenue and some years posting triple digits (2015-2016). This growth has clearly slowed down yet earnings are forecast to grow from $16.97 in fiscal year 2019 to $19.52 in fiscal year 2020 and $22.36 in fiscal year 2021.
The only drawback to Broadcom is the 5G push will be consumer oriented only. The company sells a variety of chips that enable wireless capabilities in smartphones, such as Wi-Fi, Bluetooth, and cellular. Apple makes up over 60% of Broadcom’s overall wireless revenue. Similar to Qualcomm, Broadcom will make more from 5G chips than from previous generations.
It has been a difficult quarter for many top momentum stocks like Slack (WORK), Veeva Systems (VEEV), Alteryx (AYX) and Zoom Communications (ZM). The companies have continued to execute well but their stock prices have declined. These companies reported better-than-expected third quarter earnings, impressive growth, and boosted their forward guidance.
In an analysis in MarketWatch this week, I reviewed why Momentum stocks are down and I look beyond the assumption it’s due to a “value rotation.” Instead, as I point out, there is a lot of volume that suggests institutional selling directly after earnings reports. This volume in momentum stocks exceeds what we saw during the Q4 sell-off.
Overview of Momentum Stocks Following Q3 Earnings:
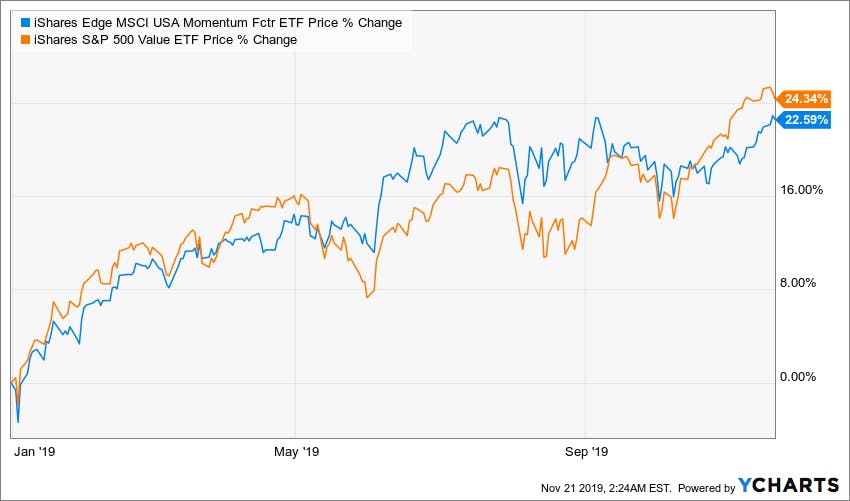
Many YTD gains have been erased as investors rush to value stocks. Indeed, value stocks, as gauged by the iShares S&P 500 Value ETF (IVE) have started to outperform momentum stocks as gauged by the iShares Edge MSCI USA Momentum ETF (MTUM). While it is true that some investors have moved to value stocks like Caterpillar (CAT) and Target (TGT), the real concern is that many investors are rotating to cash.
In January this year, WSJ reported that investors were increasing their cash holdings at the fastest pace in a decade. In July this year, CNBC reported that the wealthy were moving to cash. Just recently, a report by DataTrek showed that this trend was continuing. The report found that there was $3.4 trillion in US money market fund in October 2. This was 14% higher than in January this year.
Narratives Driving the Momentum Market
A common narrative is that the best momentum stocks and companies are overvalued. When you look at price-to-sales and price-to-earnings, it is true they are at record highs. However, as I had pointed out in a separate analysis on MarketWatch, cloud software has also been reporting record high revenue growth. There is not a divergence between valuations and revenue that you typically see in bubbles; they’ve been aligned.
Most certainly, if the market decides to reward profitability over growth, we will see lower price-to-sales across cloud software.
Another narrative is that these companies will be affected by the soft spending on IT. In reality, IT spending in the United States and internationally has been increasing as evidenced by the increasing sales reported by AWS, Azure, and other IT-related companies (although percentages have declined due to the law of large numbers). A report by Gartner has said that IT spending will rebound by 3.7%, driven by increased spending in enterprise software spending. IDC has also forecasted that IT spending will continue to increase.
Alteryx: Momentum Stock
Many momentum companies have continued to see impressive growth. A good example of this is Alteryx (AYX), a company that offers data science solutions to companies. The company’s stock has declined by more than 21% in the past three months. Yet, Alteryx is a rare company. It is a fast-growing company, a market-leader, and one often has positive EPS.
In the most recent quarter, the company’s revenue grew by 90%. Net income grew to $16 million. The company also boosted its forward-guidance. It now expects to make between $389 million to $392 million this year. This is an annual growth rate of between 53% to 55%, but on the other hand, AYX management tends to be conservative.
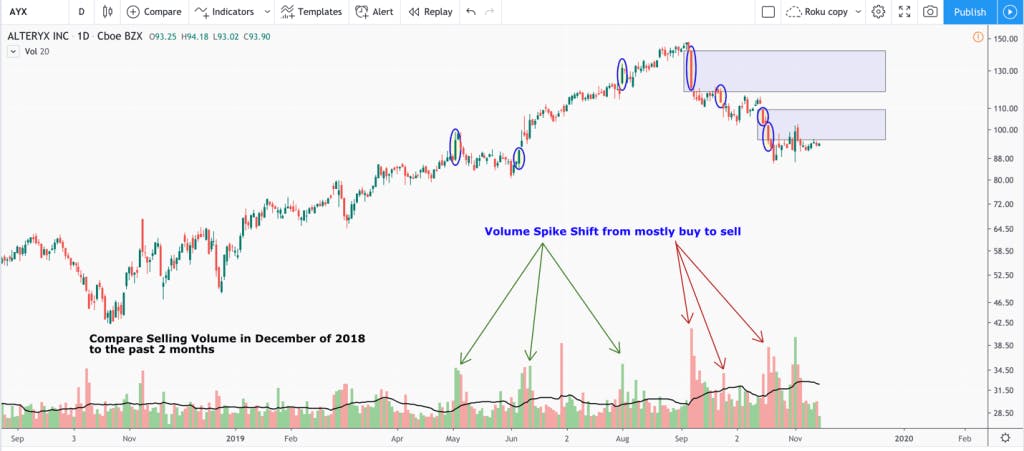
In the above chart, the large volume spikes coupled with noticeable price movements suggests institutional positioning. We see sell-off volume (red spikes) is much higher over the last two months than during the Q4 selloff.
Alteryx’s shares were down in the days after the strong earnings report.
Roku
Roku (ROKU) is another company that saw some irrational sell-off. Revenue of $360 million rose by more than 50% and the company raised its outlook for the year. It expects its revenue to grow to about $1.106 billion, or 46% YoY. This is impressive growth for a company that has a strong runway for growth as I wrote before. Although Roku recovered, there was still high volume after the earnings report.
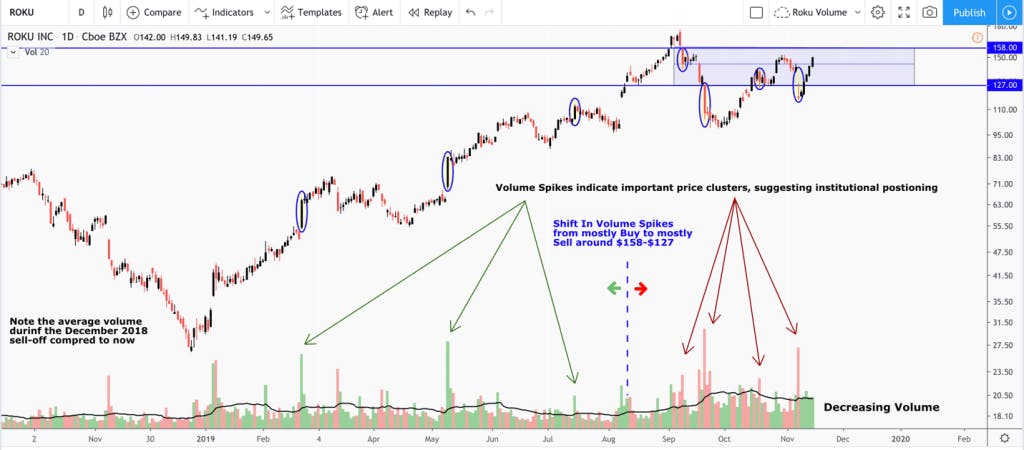
The above chart also shows large volume, suggesting institutional positions. We see the sell-off volume is much higher than during the Q4 selloff.
Zoom Video (ZM) is another example. The company’s stock tanked and is now trading 30% below its all-time high. You would think that ZM had a very bad quarter. In reality, the company reported that revenue grew by 96% to $146 million. The company’s clients with at least 10 employees grew by 76%. Also, the company increased its Q3 guidance to between $155 million and $156 million.
I also covered Veeva in the MarketWatch analysis. Veeva Systems’ operating margins have expanded from 17% in 2016 to 27% in the most recent quarter. Veeva beat on earnings with 55 cents per share compared to estimates of 48 cents per share. Company full year guidance also exceeded analyst estimates. Veeva is also strong on cash flow, increasing from $40 million in 2014 to almost $400 million in the most recent quarter. The company has $1.4 billion in cash reserves and no debt. Despite this, Veeva’s stock price has dropped 12% from its 3-month high of $168.42 and was immediately down 3% after earnings in late August.
Pinterest, too, had a minimal miss and lost $3 billion in market cap.
While these momentum stocks have been hammered, investors have cheered slow-growing companies like Apple (AAPL) and Intel (INTC) due to buybacks. Apple’s stock price has risen by 25% in the past three months and is now near its all-time high. The company had revenue growth of negative 2% year-over-year.
Way Forward for Momentum Stocks
In a previous analysis on MarketWatch, I had cautioned investors to know their winnersknow their winners as the market clearly did not have a method for differentiating beyond traditional valuation metrics. The safest way to trade tech stocks is to align investments with an overall macro technology trend in addition to fundamental analysis (the macro trend will prevail), and to have an exit strategy, such as a trailing stop, for risk management.
We’ve seen some stocks quickly recover, such as Roku, and others that haven’t rebounded, such as Veeva and Alteryx. Even the more solid recoveries suggest they are boosted by momentum and swing traders as they remain between support and resistance, as well as retail investors, as implied by lower volume.
The true test will be the upcoming cloud-software earnings reports to determine if the pattern will continue.
Roku’s stock price is up by almost 500% over the past two years. Compare this to the S&P 500, which is up less than 25%. That’s 20X more returns than the average stock.
The upward trend has not been on a straight line. Roku’s stock price has had four major drawdowns that average about 52%. Two of these drawdowns were greater than 60%. Being long a volatile company like Roku since its IPO is not easy, and it especially takes increased conviction to stay long Roku as we approach the end of the current cycle. However, for those that were insightful enough to see that Roku is not a hardware play, nor a content generating OTT play, but instead a Connected TV Advertisement play from inception, have been able to hold Roku through the drawdowns despite market noise.
In this report, I will look at the fundamental case for buying Roku stock. I will also perform a technical analysis of the company’s stock price as entry and exit is crucial for high-growth stocks. This technical analysis reflects the choppy reaction to the company’s third-quarter earnings report.
Roku’s Fundamental Background
Roku is one of the most misunderstood names in technology. A common argument against Roku is that it is a small company with no moat in the streaming industry. They also argue that competition from cash gushing companies like Apple, Google, and Amazon will threaten its lead. In reality, the opposite is true. Roku may be small in comparison, yet it still leads with 39% market share in OTT hardware in the United States compared to Amazon in second place at 30%.
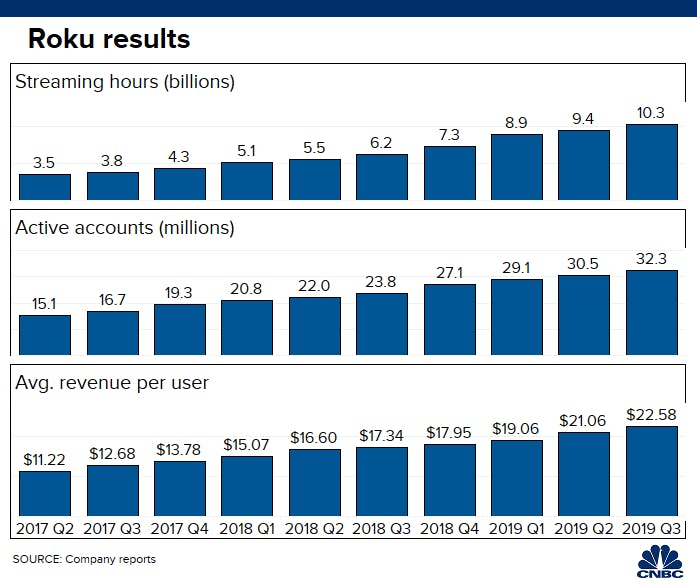
In the most recent quarterly release, the company announced that its users had grown to more than 32.3 million. This is nearly double what the company had in Q2 2017 with 15 million users. The average revenue per user has grown from $11.22 in Q2’17 to more than $22.
The ad platform segment of Roku’s business is the fastest growing and most important. It is also a high-margin business. In the 2017 financial year, the segment had more than $225 million in revenue. This revenue rose to $416 million in 2018. In the most recent quarter, the platform segment grew by 79% to more than $179 million.
Another misconception about Roku is that Roku is in competition with the likes of Disney+, Netflix, and HBO Go because of the subscription service it offers. In reality, the company does not compete directly with these companies, even with its SVOD platform. This is because Roku is mostly in the business of serving adverts and using its data to provide a better ad experience. My partner, Beth Kindig, covers this in more detail in her fundamental analysis (here, here, here) .
The closest competitors to Roku are Amazon and Hulu. Comcast’s Peacock, which will be an ad-supported streaming platform, will also be a competitor, but only domestically. This is because these companies compete for connected TV ad dollars.
Roku has an added advantage because of the vast data it has on its consumers due to owning the hardware. Also, the agnostic nature of Roku’s business makes it favorable for smart TV manufacturers. This is because it does not compete with them on the level that Google or Amazon does.
One final not on Roku, valuation is a constant issue that bears have talked about. It is true that the company appears to be overvalued. The company is valued at more than $15 billion. This is a premium for a loss-making company that is expected to make more than $1.1 billion this year. The company has a forward P/S ratio of 9.9, which is a significant premium. Consider that companies like Amazon, Netflix, and Spotify have a forward PS ratio of less than 6.
Technical Outlook for Roku’s Stock Price
Roku Volume Report
The volume activity in Roku tells us a lot about the current environment we are in, as well as what institutions are thinking. “Smart money,” or institutions, have teams of analysts and professional traders moving large amounts of cash. This typically shows up as massive volume spikes, coupled with noticeable changes in the stock price. The price at which they decide to buy in bulk, or sell in bulk, typically acts as new support/resistance that the price must push through.
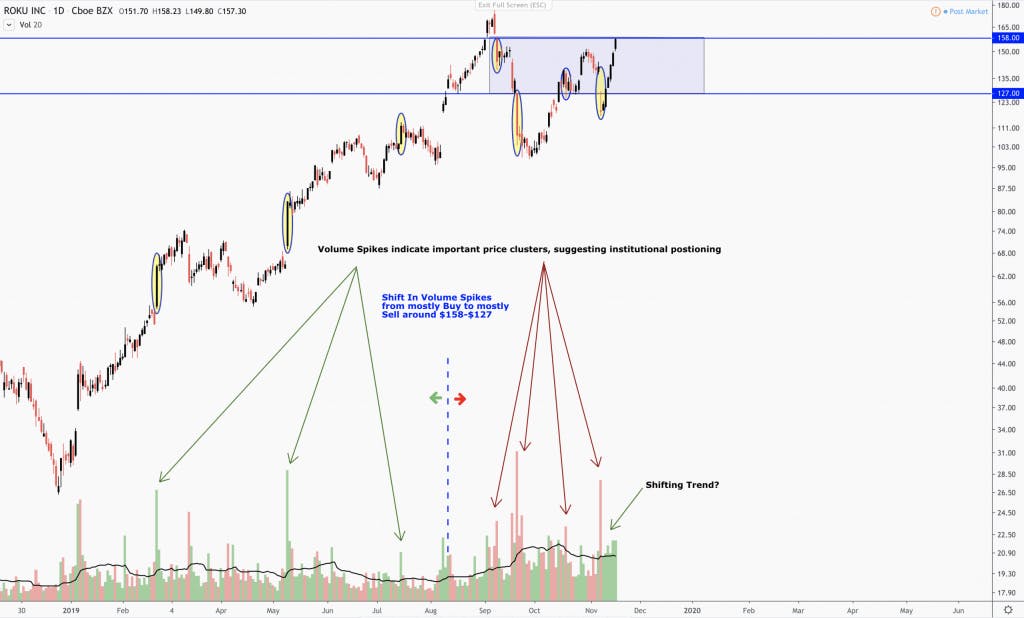
What’s noticeable is that around the $127 region, we went from seeing predominantly green volume spikes, to predominantly red volume spikes. The zones in which we are seeing these large liquidations is between the $158-$127 region.
This will be a lot of liquidity to make up, and we usually will see a shift in momentum when the reverse occurs, – i.e., large green volume spikes coinciding with a noticeable shift in price. Until I see us break through the $158-$163 region, with new increased volume spikes, I would be cautious of the current retracement back to new highs.
However, it’s worth noting that this shift could be starting to occur with rising green bars suggesting a renewed interest. I’d like to see institutions take out large positions at current levels before getting excited. So far, the only large volume spikes in this region has been to the downside.
Insider Activity
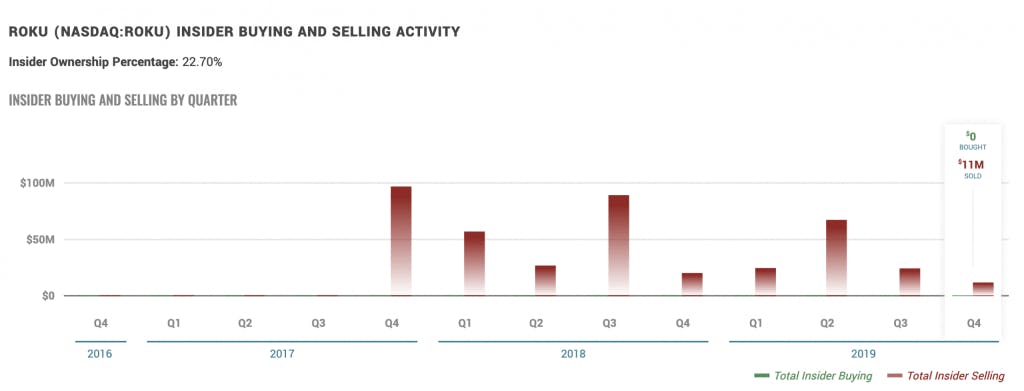
Insider buying is significantly more notable than insider selling. This is especially true when dealing with a high growth company that just went public; also, there could be numerous personal reasons why insiders are selling. But, it’s worth noting that all the insider activity in Roku since its IPO has been selling with zero buying. Nobody knows this business better than the insiders, and what they do, or do not do, can give insight to where they see growth vs market valuation. It’s worth noting that no insiders are buying their shares at current prices, which I’d agree makes sense if you are a buy and hold investor with a long time frame. However, in the short-term, there could be plenty of momentum left in Roku.
Internal Strength of Roku’s Stock Price
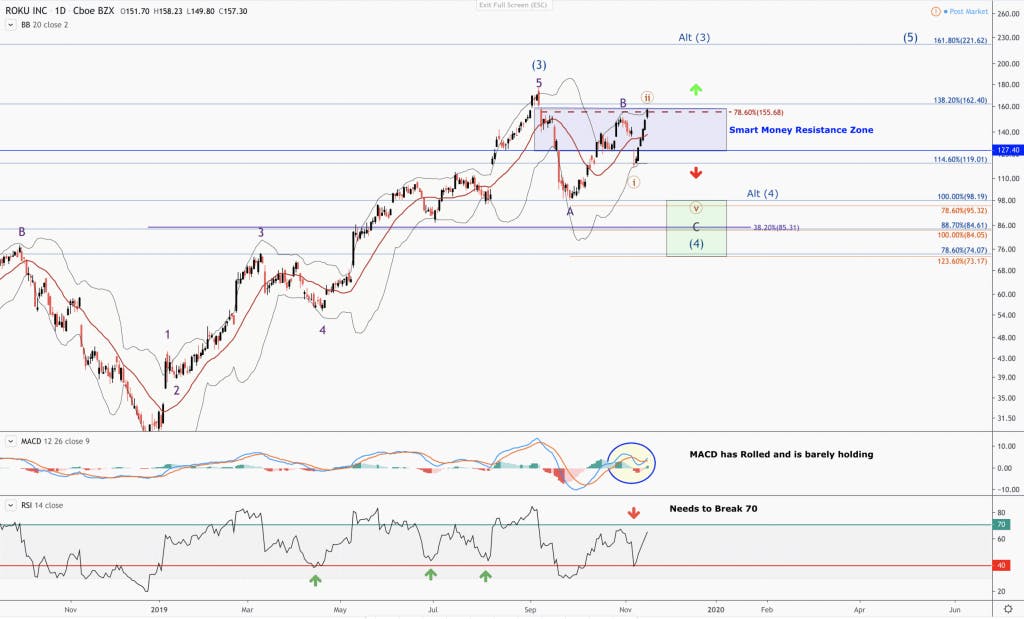
Going into earnings, we had cautioned our readers that $131-$127 was support and resistance was at the $156-$158 region. Any trades in this region on this stock were higher risk. We were correct, as the stock dropped to $119 but quickly bounced back. It has now been climbing and has even posted some marginal gains since prior earnings drop, and we are approaching a critical price cluster.
Simply put, if the stock price breaks $163 and closes well above this price, then I’ll be targeting the above the $200 region before any major drawdown occurs. However, this will require a broader macro bull market. I think it is more likely Roku remains choppy with lower entries available than where it is priced right now.
The internals support this position as well, as of now. In the above chart, the MACD has rolled over, and just recently flipped back up, suggesting strong short-term momentum. Until it breaks above the most recent high on the MACD, this could be a fake-out. The RSI is confirming caution as well. Until we can break the 70 line, which has historically indicated a bullish posture, I’d be cautious on the current uptrend as Roku continues to trade between support and resistance. We are currently oscillating between the 40 line, which has been bullish support and the 70 line, which has been bullish resistance.
Many investors are playing momentum with Roku right now, and we believe this is the correct strategy at current prices. Going long Roku today should be done with stops in place or a systematic exit strategy to protect any gains. Therefore, Elliott Wave is the preferred method for increasing the probability for successful entries on long positions for a momentum trade, as well as set ideal targets for a more long-term time frame.
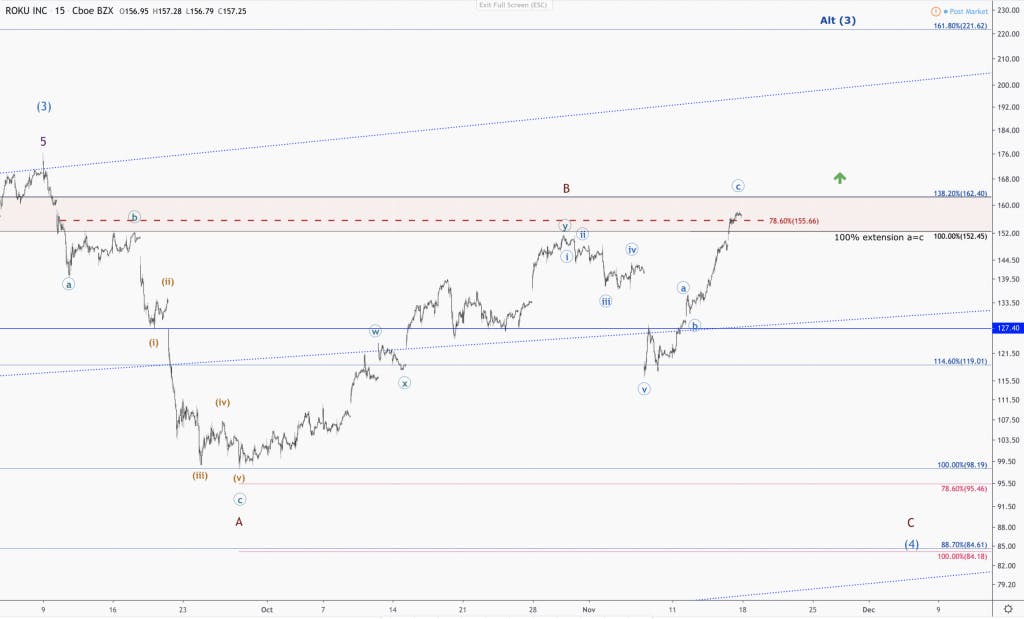
Above is the 30-minute chart of Roku going back from it’s all time high. My Primary Elliott Wave count has Roku’s stock price completing its larger degree Wave 3 push just above the 138.2% extension at its all-time highs. This is historically a lower top for a typical target for a 3rd Wave, which usually targets the 161.8% extension.
If Roku can break back above the 78.6% retrace and then take back the 138.2% extension around $163, we will likely see a push to the 168.2% extension before any significant drawdown that would constitute a 4th Wave correction (this is shown as an “alt (3)” and “alt (4)” on the chart). As of now, the evidence supports that Roku is in its 4th Wave correction, and as long as it stays below to current resistance, there will be chances for lower entries on a more long-term basis. However, if we close above $163, I will likely add to my current position with tight stops to play renewed momentum as Roku powers to new highs.
Alibaba’s application to list on the Hong Kong Stock Exchange has been approved and will be an offering of up to $15 billion worth of shares, which will be the 3rd largest listing on the exchange. Alibaba will begin a roadshow soon. The new shares will then go live November 25th.
This listing will allow Chinese investors to buy shares of Alibaba, a beloved company, for the first time. This coupled with China’s recent propensity to buy new tech listings, should be a positive for the stock.
Keep in mind, Hong Kong is going through a period of political unrest. We can see from BABA’s trading action that investors are unsure of how the IPO will affect the stock price in the United States. One scenario is there is an arbitrage situation, where the higher price on the Hong Kong exchange increases the attractiveness for our market.
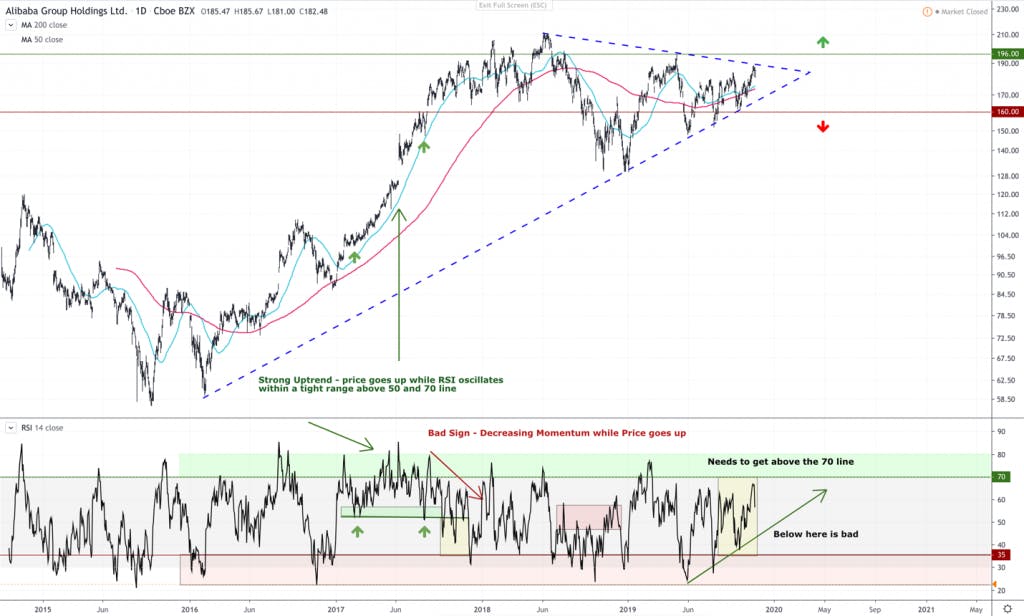
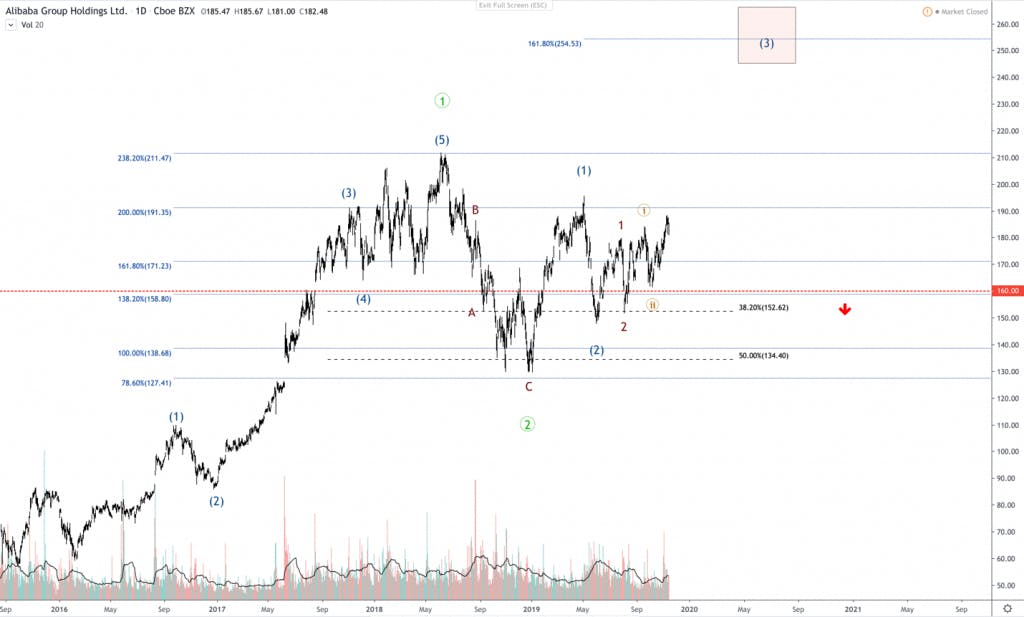
The above chart is the daily price action of BABA going back to its IPO in 2015. Since bottoming in in late 2015, Baba has been in a strong uptrend, which is highlighted by the blue dashed line moving up. When looking at the health of an uptrend, the RSI can tell you if it’s healthy, or fading. The green arrows indicate a healthy uptrend.
Notice the RSI oscillated above the 70 line and rebounds at the 50 line. This coupled with upward price, suggests more gains are potentially ahead.
Now, notice the RSI in late 2017. The red arrow is indicating that the RSI begins to trend down while the price keeps going up. This is the indication of an unhealthy uptrend.
Since bottoming in December 2018, Baba has recovered to an extent. Notice how the price is being squeezed by the triangle pattern, which is highlighted by the 2 blue dashed lines.
The RSI, though making higher lows, which is a great sign for building momentum, still has not breached the 70 line, which is a warning to bulls. I will want to see the RSI break through this level while price breaks through the upward triangle channel before I can confidently go in for the next leg up, while also raising my stops to protect any gains. Adversely, if the RSI breaks the upward trend, which is highlighted by the green arrow going up just below the RSI, that will be an indication the trend is breaking to the downside.
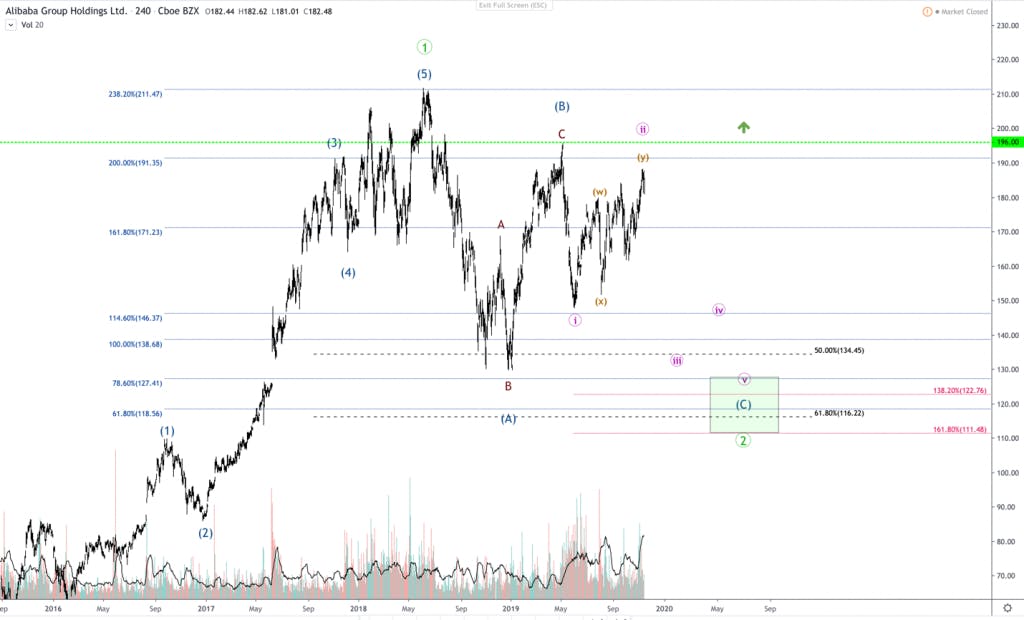
The Bull Case varies based on the state of the larger degree Wave 2 in green. It basically has us ending the Wave 2 drawdown in December 2018. That would put us already within the Wave 3 uptrend, which I have us topping out around $250 region, simply based on where we generally see 3rd Waves topping out.
The only problem that I have with this count is that the it took around 3 years for the first wave to form, and only 3 months for the second wave. This isn’t normal, but I’ve seen stranger things when analyzing the structure of a trend. So, if Baba decides to break resistance with the RSI in tow, I will happily go long with a stop just under $160.
For a buy and hold, Baba below $160 is a good target for any long only investor. Some of the Fibonacci counts have us with a retrace to at least $130.
Volume Report
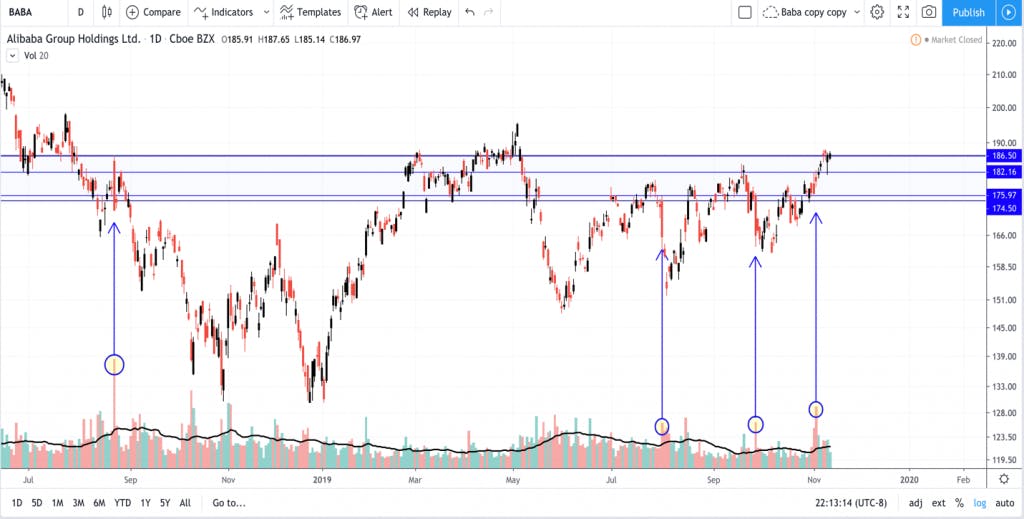
The above chart is a snap shot of the daily price action of Baba going back to the beginning of the most recent bear market in China, coupled with the daily volume below the price.
Fundamentally, price is simply a battle between buyers and seller. If you think of it as a scale, if the weight of buyers increases, the price will increase, and vice versa. So, when institutions – i.e., the “smart money” – make a position, it will do so in large volume, which will move the price of the stock.
I look for two things: (1) larger than normal volume spikes, that do not coincide with earnings reports; (2) Large spikes in volume that coincide with large moves in price.
That being said, the blue lines above indicate prices at which we see institutions deciding to sell. The above chart shows four instances of heavy selling with significant price moves within this range.
Notice how difficult it has been for Baba to break out of this range to the upside and hold. I’d like to see the volume spikes shift to the green around this price level before getting more confident in the upward direction of Baba.
Conclusion:
We are long on Alibaba, and believe it is undervalued based on current prices. Our cost basis is currently below $160, so we are holding it without stops. If it breaks the $160 price zone, we will likely add more to our position for the long haul.
If you are more cautious and do not yet have a position in Baba, I’d place a stop just under $157 to protect from a larger degree drawdown. And, if you’d like to wait for more confirmation, you can wait for Baba to confirm both in RSI and in price through the triangle pattern with a much tighter stop.
As Apple’s stock price powers to new highs, returning over 60% YTD and touting the highest market cap in history, now might be a good time for investors to reflect as Apple trades at resistance. With upwards of $260 billion in revenue, a profit margin of 22%, Apple is a cash-generating machine. It produces around $50-$60 billion in free cash flow annually, with reserves of over $100 billion. It is extremely kind to shareholders, with one of the largest buyback programs on the Street. In fact, Apple has spent around $120 billion in stock buybacks since the beginning of 2018, and kicks out a dividend. Apple is, without question, one of the greatest businesses the world has ever seen.
However, there are times where great businesses do not always make great stocks at times. If we look at the current valuations, Apple’s stock price is trading with a P/S of 4.5, a P/E ratio of around 25 and a price to free cash flow of 20, as of the writing of this report. While these valuations are relatively mild compared to some of the valuations being shopped around in the tech industry, for a company with a market cap of $1.3 Trillion, these valuations suggest future growth in order to justify current prices. It is here, with their future growth prospects that I see caution.
Apple’s Stock Price is Up While Revenue is Down
In 2019, the company had revenue of $260 billion, down from $265 billion in the previous year. Analysts originally expected the company’s revenue to grow to $274 billion, or 5.3% this fiscal year, and around $294 billion or 7% in the following fiscal year. This will be slightly below the 7.2% growth that is expected among information technology stocks.
In the latest quarter, its growth rate was just 1.8%, significantly lower than what other FAANG companies reported. Facebook revenue grew by 28% while Amazon rose by 23%. Netflix and Google had revenue growth of 31% and 20%, respectively. Even Cisco grew by almost 5%. And for further comparison, the US economy expanded by 1.9%.
Apple’s poor growth would have tanked any technology stock, yet Apple’s stock price is up 60%. Though I believe Apple has the cash as well as the capability to pull numerous pivots in its future, the loss in revenue will likely accelerate before these pivots can manifest, which will compress margins, and thus affect current valuations.
iPhone Saturation – Will it Affect Stock Price?
If we dig deeper into their latest revenue report, we discover that smartphone sales declined YoY by 15%. Saturation is an inevitable phenomenon for revolutionary inventions. For example, Utilities and wireless phone coverage were once considered hyper growth sectors at one point in time, but the inevitable saturation took hold, leading these companies to now be considered defensive value plays. Saturation appears to be taking hold in the smartphone market, which is why we are seeing a deceleration in smartphone sales YoY; with an expected 2% fewer sales per year going forward.
Furthermore, with saturation, we see manufacturers start to slash prices to capture fewer units sold. This quarter, Apple reported that iPhone sales declined by 9% since the previous year and that they are also reducing the price of their new iPhone 11. Both news items point to the reality of market saturation.
The iPhone is arguably the greatest tech driver in history, as well as Apple’s primary source of revenue. So, Apple will have to cover the losses with their other products to make up the difference. This is where I see the inconsistency between the stock’s valuations and their current offerings.
Services
Apple’s services generate revenue through various subscription fees. These fees come from several well-known Apple services, including iCloud, iTunes, Apple Music and various types of apps.
Although these services grew by 18% this last quarter, the total revenue generated was only 37% the size of iPhone sales. This level of growth is simply not enough to cover decreasing revenues from Apple’s iPhone sales.
Furthermore, there are also concerns in the service sector. The problem is that the services that Apple offers have relatively lower margins than the iPhone. A good example of this is Apple Music. Apple doesn’t disclose Apple Music’s gross margins, but going by Spotify’s own margins, we have every reason to believe that Apple is similar. Spotify’s gross margin is just 26%, which is smaller than Apple’s iPhone net profit margin. It’s important to note that the services segment of Apple is tied to the iPhone and may experience slower growth as the smartphone market continues to saturate.
Apple +
There’s also a lot of hype around Apple TV+’s potential at filling the growth gap. According to the Wall Street Journal, Apple is spending more than $6 billion on new content, and it’s only likely to go up as the streaming war continues.
At current prices for the service, it’s impossible for Apple to make a profit even with a hundred million subscribers. Apple can still be a contender in this crowded space, but it will likely take time, and be more of a cash drain than a generator in the short-term. Meanwhile, smartphone saturation is only going to continue, which means that Apple TV+ will not be able to solve Apple’s current revenue problems.
Apple Pay
Apple Pay is another service that Tim Cook talks about repeatedly. During the latest earnings call, he revealed that the service had surpassed PayPal in terms of volume of transactions. The service is also expanding into various markets. Additionally, Cook also praised Apple Card, a new product developed in collaboration with Goldman Sachs that promises to expand Apple’s revenue.
Apple Pay has the potential to generate a large cash flow, but there are questions about how big it can get. In the trailing twelve months, PayPal had a gross revenue of $17 billion and a net income of $2.53 billion. Visa and Mastercard had a combined revenue of $38 billion and a net income of $17 billion. So even if Apple were to dominate this market, its consolidated net income will not be sufficient to cover the loss in iphone sales. And, more importantly, it will take time to take market share, which will not solve the revenue issues Apple currently faces.
Apple Wearables
Another area that’s worth looking at are Apple wearables. In the last quarter, revenue from wearables, home and accessories rose by 54% to $6.5 billion. This growth was driven by the success of various Apple products, particularly Apple Watch, Airpods, and BIS products.
These wearables are great products that do have higher margins, just like the iPhone. The big question, however, is if they can grow fast enough to offset losses in iPhone sales. Despite its great performance, Apple’s wearables, home and accessories business is still behind the Mac division, which earned $6.9 billion during the fiscal fourth quarter.
Meanwhile, Apple’s iPhones generated $33.36 billion in revenue this final fiscal quarter, despite a 9% decrease year on year. So the important point in all this is that, despite their tremendous growth, Apple wearables and accessories are just not in the same league as iPhones.
Buybacks and Apple’s Stock Price
Any other tech company with decelerating revenue, and the likelihood of continued deceleration in the near term, while facing an end of cycle environment that will eventually affect the consumer, would not see their share price increase to such valuations. So, it’s worth noting the importance of one of Apple’s key components in their current strategy, which is not a permanent solution.
Apple has turned to buybacks to boost its stock and spend its cash hoard. Since January last year, the company has spent more than $120 billion on buybacks. The question, though, is how effective these buybacks are to retail investors.
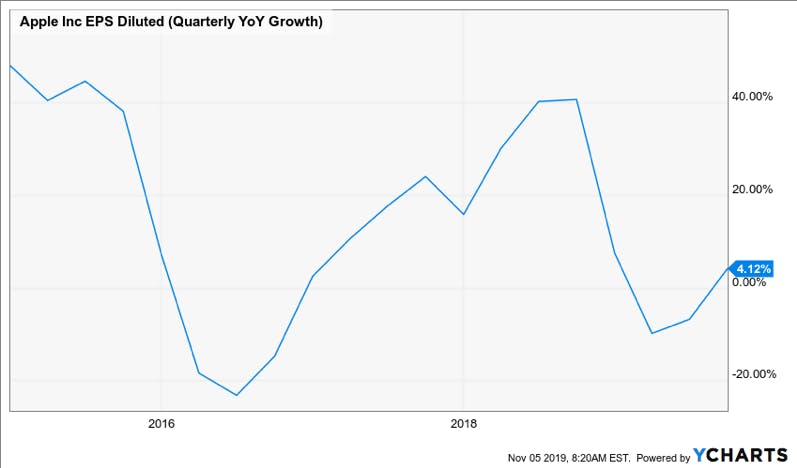
Large companies with growth problems have used buyback programs as short-term solutions for sluggish performance. In the short-term, share repurchases can help boost a stock price. However, in the long-term, Apple’s share price growth will depend on the performance of certain specific segments. The chart below shows Apple’s diluted EPS growth in the past five years.
Source: Ycharts
Technical Outlook for Apple’s Stock Price:
Structure
As a technical analyst, I do not go against the trend until I see either a rewarding risk/return set-up at key levels, or a noticeable shift in trend emerges. Apple is currently in an incredibly strong uptrend since bottoming in December of 2018; however, Apple’s stock price is at a significant level.
It’s worth noting that it’s 2019 uptrend appears to be in a corrective fashion – a series of 3 waves up, which is always point of caution. Typically, when I see this, it points to a correction in a larger degree prevailing trend.
Furthermore, if we take the length of the first wave up off the December low to its peak in May of 2019, it went up 51.63%. After bottoming out in July of 2019, Apple’s stock price began the current wave up. You’ll notice that Apple’s share price is at the symmetrical percentage growth of the first wave – 51.63%, which coincides with the 100% extension.
In technical analysis, the market tends to move in symmetry, especially in corrections, and the $258-$262 range will act as major resistance for Apple’s continued charge up. This is exactly what we have seen as well, as Apple’s stock price has been hovering around this level for many trading days. If it can close above the $262 range and hold on to that region, I believe there is a strong possibility that it will trade up to the 250% extension of the 30-year cycle uptrend of around $300.
However, if Apple cannot break above the $260 range, it could retest the $222 price range. If it falls below this range then the yellow target box will be in play, thus confirming that the uptrend from the December low was merely a powerful correction in a much larger decline.
If we look at Apple’s internals, a few points jump out. For one, the volume is decreasing as the stock price is increasing, suggesting there’s not broad participation in this uptrend, and that may be the result of weak buying volume on top of even weaker selling pressure. If this is the case, as soon as buyers get exhausted, we could see a sharp decline.
The MACD is currently at its highest point in Apple’s history, the second highest was in September of 2018. An elevated MACD is a bullish sign, but when we hit extremes, it becomes a point of caution. The RSI is in a current uptrend along with price. If this uptrend breaks along with the price, we could be in for a retest of important support zones. I will be watching the RSI for a clue to a change in momentum.
Knox Ridley runs a premium site alongside Beth Kindig. You can check out her fundamental analysis on Apple on this site.
Roku is a company that has proven nearly every bearish prediction wrong with consistent revenue growth despite being surrounded by steep competition and tech heavyweights in over-the-top media.
Roku investors that have been long since its IPO have lived through three fifty-percent drawdowns. Therefore, the reaction to earnings this quarter was unlikely to phase anyone who has followed this stock for any length of time.
I encouraged my readers to not be phased by market reactions when Roku was priced at $30, when it was priced at $60, and when it was priced again at $30. During that sell-off, I said the company would become a tech darling and reach $100 in stock price in two years, which was bold to predict 200% returns. Of course, the company went on to reach 350% returns in a short time span of about one year.
The market received Roku earnings report on Wednesday after the market closed. Streaming hours passed 10 billion hours in the third quarter, while active accounts increased to more than 32.3 million. The most impressive number in the Roku quarterly earnings was the average revenue per user, which increased to $22.58. This number has more than doubled since the second quarter of 2017.
The Roku earnings report showed that quarterly revenue increased to more than $261 million. Platform revenue grew by 79% while ad revenue more than doubled. This was a 50% YoY growth and was above the consensus estimates of $256.9 million. The company lost 22 cents a share, which was 6 cents above the consensus estimates of 28 cents a share.
Overall, the company beat the consensus estimates, raised guidance, reported strong user growth, and increased ARPU.
However, Roku has double-digit negative EPS and will for some time. Roku financial statements show that EPS is declining QoQ. Its consensus EPS forecast of -$0.28 compared to -$0.09 in the year ago quarter. Annual EPS won’t improve either, per analyst consensus, with -$0.50 ending in fiscal year December 2019 and -$0.43 ending in fiscal December 2020.
We’ve already seen a few companies get crushed by the market if they have a small miss, which is the paradox for growing tech companies who are often penalized by the market by foregoing earnings to capture peak growth, which in turn, becomes rewarded by the market once it materializes into earnings. In other words, if Roku misses anytime in the next couple of years, it’ll be with EPS rather than revenue. The market, which is confused by the many OTT streaming services and hardware players, will penalize Roku. This most certainly will not be the last time the stock sees double-digit pullbacks.
I also foresee the market abandoning Roku and many other solid tech stocks that aren’t profitable yet during the inevitable value rotations. Keep in mind, investors also did this with Netflix, Google, Apple, Microsoft and Amazon during 2009.
Misunderstood Competition is an Edge
As is always the case, the market has a record of underestimating small companies that are battling with other big companies like Apple, Disney, Google, and Comcast. This is why Roku still remains one of the most volatile stocks in the market. This also proves the affinity investors have towards brands rather than technology. Yet, it is the latter that drives growth in new markets.
The nuances in strategy and technology are terribly important to understand in the crowded OTT space as it helps to have conviction when a stock drops 50% or more, yet then goes on to be the best performing stock of the 712 stocks with a market capitalization over $10 billion in 2019.
Let’s break down what I mean by Roku having very little direct competition.
SVOD vs. Connected TV Ads
Roku does not compete with Disney+, Netflix, or HBO Go because these are subscription services. Subscription video on demand (SVOD) is in a category of its own as the opportunity Roku is capitalizing on is Connected TV ads (CTV Ads). Advertisers are paying a premium for CTV ads, which is Roku’s market. The distinction between markets is important, and one that Wall Street missed when discounting Roku as a long-term opportunity by labeling it a hardware company for its first couple of years on the market.
Roku directly competes with Amazon and Hulu, as they compete for Connected TV ad dollars. However, as the market is well aware, data is king as it allows for better targeting. Hulu has to barter data as it’s a single application without a platform or hardware (i.e., it shares and connects third-party data, including with Facebook). Third-party data is always weaker targeting than first-party data and could be subject to privacy issues.
Razor-Razor Blade Model
Discounting the hardware and taking a loss is an excellent strategy to maintain a moat on data for advertising. Both Amazon and Roku own the hardware, and at current prices, the hardware likely causes negative or very thin margins. This is similar to the razor-razor blade model, where you discount the razor to sell the razor blades for life.
This positions Amazon and Roku for first-party data across OTT applications. Anything data related is subject to privacy issues and anti-trust issues. This is at the core of the controversy with Facebook and Google.
Roku is again set apart here, as the company only does OTT. The company does not share the data beyond the OTT player it owns. Amazon, however, is collecting data in a way that could come under anti-trust scrutiny as they take e-commerce data and broker this on the OTT player, which is anti-competitive with other ad exchanges.
Amazon is well aware of this, and is being proactive rather than reactive by opening up its demand-side platform to other DSPs, such as The Trade Desk, which was announced in July of this year. On a side note, Facebook learn from Amazon’s playbook as reputational damage is hard to shake.
Roku, however, does not need to worry about this as data never leaves the OTT hardware that they own, where they have a first-party relationship.
Valuation:
Connected TV ads are ballooning because they combine audience data with the viewability and completion rates of linear television. Roku’s valuation at 14 price-to-sales seems high at first, yet the one-year forward price-to-sales is trading at 9.3 due to the forward growth opportunity in Connected TV ads. Roku earnings estimates for 2020 and 2021 are $-0.29 and $0.6178 respectively. Therefore, the market may still be lukewarm with knee jerk reactions throughout 2020.
For example, last November, video-first SSP Beachfront reported that ad requests for CTV had increased 1,640% from November of 2017. While this is only one company’s growth in a single segment, the opportunity is so ripe, it’s hard to quantify. More astonishing is that Connected TV ads surpassed mobile last year for capturing the largest number of impressions and video completion rates.
Roku’s revenue growth will be exciting; however, the company is not likely to be profitable until 2021. In the third quarter Roku income statement report showed that revenue grew by almost 60%. This was almost double that of Netflix and triple that of Google.
Traditional metrics show that Roku is not a cheap company to own. Its forward EV to EBITDA ratio of 393, which reflects the lack of profitability. It’s not surprising the stock is trading in the range of $127-$131 following earnings, which was former support.
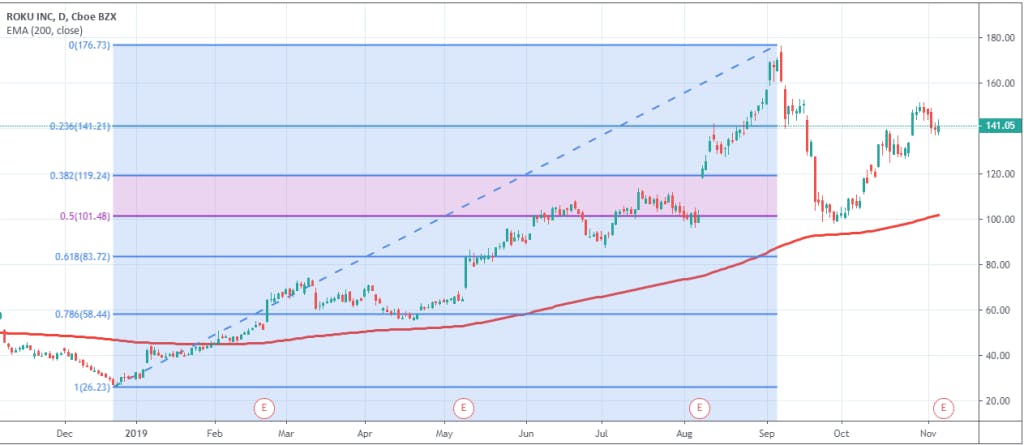
Depending on macro trends, we could see Roku trade around $100 again as this is an important psychological level, as shown below. It is also along the 50% Fibonacci Retracement level and along the 200-day exponential moving average. Long-term, I see Roku as one of the most promising tech stocks on the market and have provided projections to my premium subscribers.
Knox Ridley, technical analyst, will be covering Roku in-depth with technicals next week. He has guided many successful entries on this stock for our premium members, including entries lower than $100.our premium members, including entries lower than $100.
A version of this analysis appeared in MarketWatch prior to earnings on November 6th, 2019.A version of this analysis appeared in MarketWatch prior to earnings on November MarketWatch prior to earnings on November 6th, 2019. It has been updated and lengthened post-earnings.
We want to make sure you’re aware that Uber’s lockup period expires on Wednesday. According to CNBC and MarketWatch, this will cause 763 million shares to become available on 1.7 billion total shares, or roughly $22 billion in shares … that’s a lot of liquidity required for a company that has troubled fundamentals.
I’ve covered Uber extensively since its IPO. I won’t repeat all of the points here but you can find links to the past analysis below.
We’ve seen solid companies like Zoom experience drops after the lockup period. We’ve also seen IPO hype companies like Beyond Meat drop 22%.
We believe Uber will be hit from all sides. Employees are not happy with Uber. There’s been layoffs since the IPO and a change in management, including controversy around the former CEO. Early investors are likely worried about their returns, especially with the heat on WeWork, another one of Softbank’s big bets. The company is at a thresh-hold where early investors can still make a decent gain.
I’m not too concerned with an “earnings beat” as we don’t believe the company will withstand the liquidity on Wednesday. Lyft had an earnings beat and the stock declined the next day (on that note, I’m sure Lyft will be affected by the lockup expiration too).
FactSet analyst estimates are at a loss of 70 cents per share on revenue of $3.63 billion.
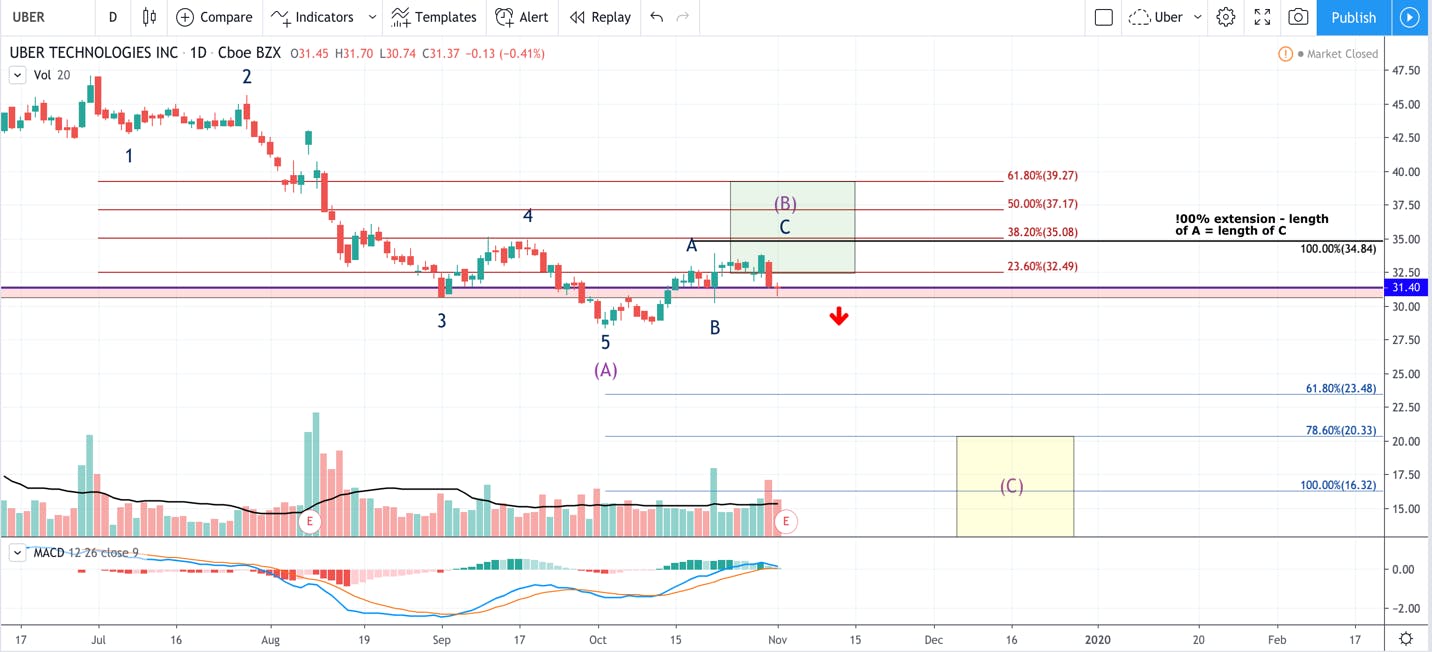
Uber’s price action is not much different from our market update last week. In short, Uber appears to be in a larger degree, 3 move correction – outlined by the purple (A), (B), (C) in the chart. The (A) wave down unfolded in a 5-wave pattern, bottomed in October, and is now correcting upwards in a 3-wave fashion, which is the (B) wave. The micro structure of Uber in its (B) wave does not offer confidence that this is the beginning of a new uptrend, but instead just a short pause.
The red lines indicate the retrace levels of the (A) wave. Uber just barely broke the 23.6% retrace level before turning back towards support. We typically see 3 wave corrective moves operate with symmetry on the larger degree and smaller degree. This will be heavy support, and is also the likely target for the corrective (B) wave just before the final leg down begins. If Uber cannot touch this level, and instead turns down from current levels, I will move my final target down lower.
The red bar across the screen indicates a strong support region for Uber around $31.40-$30.50 This region was defined by 4 daily major volume spikes, indicating institutional money is likely allocating a position, which implies that these levels will be strong zones of support/resistance. The current level is major for Uber, and if it breaks through, expect new lows for Uber and for the final (C) wave down to be in progress.
Our stop for the short position will be at $40.25. The reason for this stop is twofold: (1) it’s just above the 61.8% retrace level indicating strong momentum; (2) it’s just above the $40 price cluster.
This price level marks two of the largest volume spikes in Uber’s daily trading. In other words, it’s likely that “smart” money as well as many other investors got trapped at these levels. If Uber can break through the level of selling that should occur at these levels, it’s a sign of more upside to come.
We have been shorting Uber since its IPO, and are pursuing this set-up.
If you want to wait for confirmation, wait for Uber to break support at $30.50, and place a stop at $31.50. This is a more conservative short. Long-dated puts with a strike price of $30 can also act as conservative insurance for a possible market downturn.
We weren’t expecting the market reaction we saw today with Pinterest and are now trying to determine if this was an over-reaction connected to the eBay and Etsy earnings, or if it’s indicative of a long-term trend in sentiment towards Pinterest, specifically. Etsy was down 15% today.
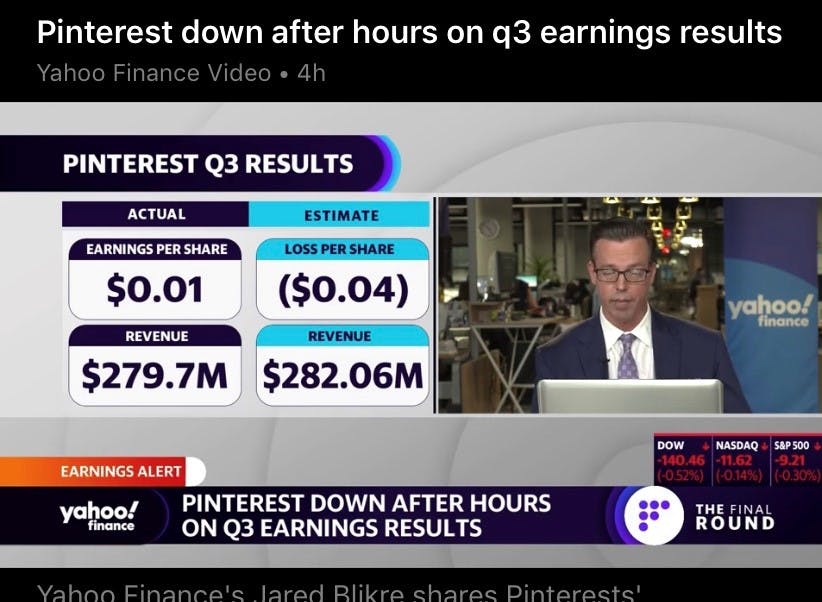
There was some misinformation circulating on the revenue miss, which is frustrating. Yahoo Finance! reported a miss of $2.5 million whereas the actual miss was $900,000. The lower number is confirmed by both CNBC and Reuters. Barlcays said on the call that Pinterest came in above their estimates. I put more info on Yahoo’s mistake below.
Other metrics:
Company beat on earnings per share of 1 cent vs. expected 4-cent loss
Beat on monthly active users of 322 million vs expected 311.8 million
Miss by 1 cent on average revenue per user of 90 cents vs 91 cents, per FactSet
Company guided for improved 2019 adjusted loss of -$10M to -$30M compared to previous estimates of -$25M to -$50M
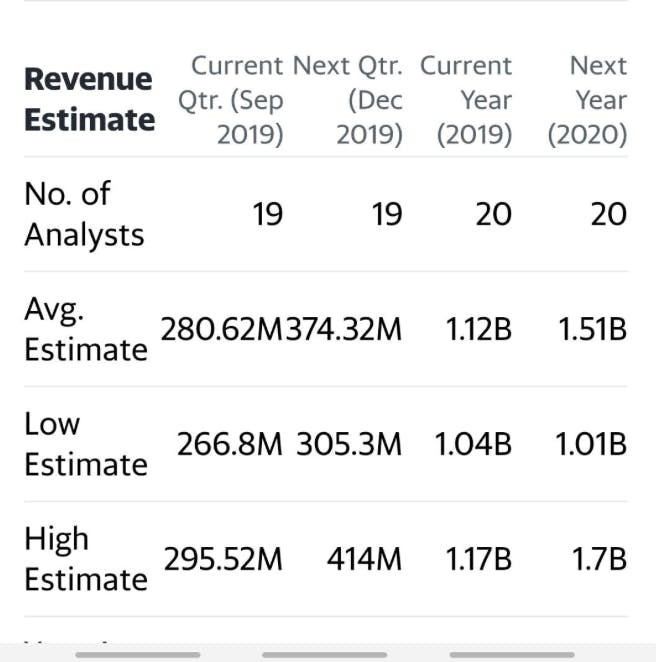
Company slightly improved the guidance on the low end to $1.1 billion to $1.115 billion. According to Refinitiv, analysts were expecting sales of $1.2 billion although this does not match company guidance.
I’m torn as the international ARPU is weighing on the company, as I spelled out in great detail in the PDF, yet the growth is also decent for a company of this size and I see a path to profitability here. If Pinterest can crack international ARPU, it will make an excellent stock and has the potential for surprising upside. Notably, Pinterest discussed a partnership with Shopify on the earnings call.
As I stated in the PDF, social media buy-and-hold positions should be done at valuations below 10 P/S, therefore, I do not have a buy-and-hold position. For my current momentum play, I am going to wait to see if Pinterest holds $19 at tomorrow’s close that Knox outlines below.
I think the sell-off today was irrational but that’s never stopped the market before, therefore, I’ll give it another chance tomorrow while holding firm to the $19 stop. If it closes below $19, we’ll close our position and regroup.
Technical Analysis:
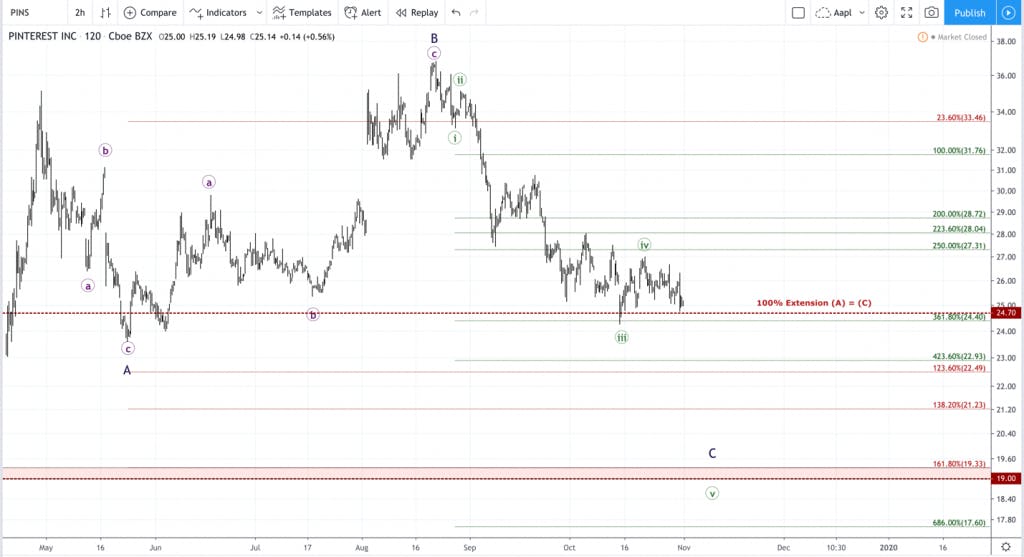
The symmetrical move of PINS recent decline that started in July compared to the first decline in May (A)=(C), coupled with the RSI positive divergence shown in the last report, technically speaking, are indicators that lead to high probability trades. However, the market’s shift in sentiment towards high beta tech stocks is unpredictable, and PINS, even with reporting a miss of $900K in revenue yet with a few upside surprises like monthly active users and adjusted EPS, was a steeper decline than anticipated.
The original analysis provided stop suggestions at $24.50 or $22, depending on your risk tolerance. We have blown through both after hours, and look to be opening just above the 161.8% extension around $19.30, creating a massive gap, and all new lows.
One thing about the market is that it hates gaps, and more times than not, eventually will fill them in. We believe the earnings report may have been an over-reaction. We are personally going to see if the price closes above the 161.80% retrace at $19 before closing the position.
Yahoo! Finance Error ..
Not sure how many people pay attention to Yahoo! Finance but they made an error and reported a miss of nearly 250% higher than the actual miss ($900K vs. $2.5M). May have not had any material impact but I thought it was important to look deeper into this.
This was confirmed inaccurate after checking Yahoo’s website more closely. i.e. it was not a different reporting source for analyst estimates, rather was a misprint.
I grew critical of Apple earlier this year when it became clear the company would decline in revenue year-over-year, yet investors and analysts alike continued to pump the stock. With yesterday’s earnings report, we have further confirmation that Apple is not a growth company anymore although it continues to trade at growth valuations.
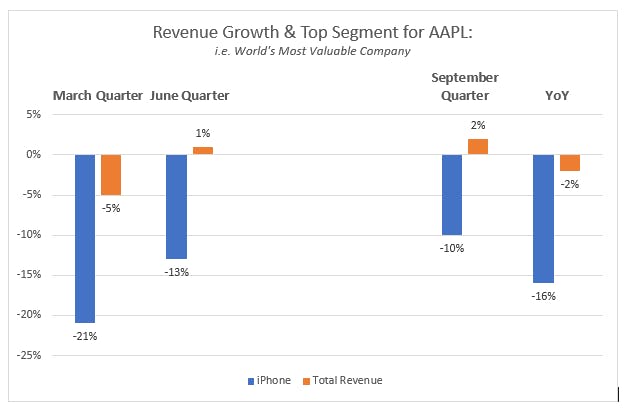
While many celebrated yesterday’s earnings report, there were notable signs of erosion. To start, Apple has lost $5 billion in revenue year-over-year, from $265 billion to $260 billion. This is despite having the “best fourth quarter ever,” according to Tim Cook. The truth is that the EPS was higher due to buybacks.
My analysis in MarketWatch published prior to earnings, pointed out that the iPhone was exposed to macro smartphone saturation. Those numbers showed a deeper decline than overall revenue with a $22 billion decline reported year-over-year.
Although Apple has ceased reporting smartphone unit sales, the numbers reveal there are fewer smartphone units being sold. Moving forward, with the recent release of the iPhone, Apple will contend with a lower average sales price. This is bound to affect smartphone device revenue moving forward, which declined at a rate of 15% year-over-year.
Overview of Mobile Saturation:
The smartphone market contracted to 1.462 billion units in 2017 and to 1.420 billion units last year. While almost 1.5 billion smartphones sales a year globally is substantial, the law of saturation drives down prices. I wrote about the price effects of mobile saturation in March, prior to Apple lowering prices for the first time with the iPhone 11.
China represents about one-third of smartphone penetration compared with the U.S., at one-12th. Pricing wars are evident in Asia, where China’s Huawei has grabbed market share to become the world’s fastest-growing smartphone seller. The company has seen a 66-fold increase from 3 million units sold in 2010.
Samsung may be the true bellwether for mobile, as the company is in first position for total smartphones shipped and is the world’s largest manufacturer of memory chips. In the first quarter, the company reported a 60% drop in operating profits, followed by a 56% decline in the second quarter. Analysts expect another decrease in the third quarter. Smartphone units have been making lower highs and lower lows over the past two years.
Notably, IDC forecasts the pricing wars will continue with 5G handsets in Asia, as low-cost models are expected to hit the market next year. In the U.S., Latin America and Japan, the average selling price (ASP) of a 5G handset will be around $1,000, while it will be $600 in China.
Don’t Believe the Earnings Beat:
The fiscal Q4 earnings beat is at odds with overall performance. Although profit topped expectations, this is the first time since Tim Cook took over in 2011 that Apple declined in profit in all four quarters of a fiscal year.
The media touts the services revenue as the answer to the iPhone decline. As we saw this year, double digit declines on the segment responsible for $165 billion in revenue (iPhone) is not easily staved off by a revenue segment posting $40 billion per year (services).
If one did not look closer at the numbers, it would easy to think services was a major growth segment. We see the growth was at 18%, which is below the 20% traditional benchmark that defines growth. As of now, this doesn’t appear to be the answer to the gaping iPhone decline. This is proven by the annual decline in overall revenue.
Wearables growth of 55% to $24 billion in revenue is decent. However, again, the iPhone decline was steep enough at $22 billion to wipe out the entire Wearables category.
I had pointed out in a Fox Business News interview prior to earnings that its unlikely lightning strikes twice with the iPhone as it’s not only one of Apple’s best growth drivers historically, but it’s also one of the best growth drivers we’ve seen across the tech industry. This is evident in last year’s smartphone revenue of $165 billion, which I also pointed out will be Apple’s peak year in mobile.
Note: although I provide an entry price for Apple on Fox Business News, this is something Knox Ridley specializes in and covers as a contributing analyst to our premium site Tech Insider Research. You can catch his detailed technical analysis published on Seeking Alpha next week.Knox Ridley specializes in and covers as a contributing analyst to our premium site Tech Insider Research. You can catch his detailed technical analysis published on Seeking Alpha next week.
Here is a snapshot of Apple’s performance over the past year. If the stock ticker was not attached to the graph, it would be hard to guess this is the world’s most valuable company.
As most investors know, Apple has plenty of cash. It produces about $50 billion-$60 billion a year in free cash flow and has over $100 billion in cumulative reserves to fund new projects. While analysts are optimistic about many new pivots, these will weigh on margins. This is especially true for Apple TV+, which comes with a high content bill and low subscription revenue, as the OTT streaming service will be bundled for free or priced at $5.
Keep in mind, Apple’s cash reserves are seeing the effects of the buybacks, and Alphabet has now surpassed Apple in cash reserves. Apple has $102 billion compared to Alphabet’s $117 billion. This is due to Apple spending $122 billion on stock buybacks since the beginning of 2018. Alphabet is growing, as well, at a rate of 20% year-over-year.
Analysts who are raising Apple’s price target based on fiscal 2020 cite Apple TV+ revenue as a primary reason with little discussion of the forecast for Apple’s main growth driver. Apple TV+, which will compete with Amazon Prime Video, Netflix and other TV-streaming services, is more likely to cause bottom-line losses in the short term as Verizon is offering the subscription for free while requiring costly original content from headliners such as Oprah. (She doesn’t come cheap.)
In my opinion, these new price targets seem more like an attempt to cover current positions, as the majority of institutions are holding this stock at lower entry points.
Many Apple proponents will use the stock as an income stock, yet the company trades at growth valuations. The buybacks Apple is doing on a consistent basis is alarming for a tech company, who should be innovating with cash reserves rather than propping up the stock price to beat earnings per share.
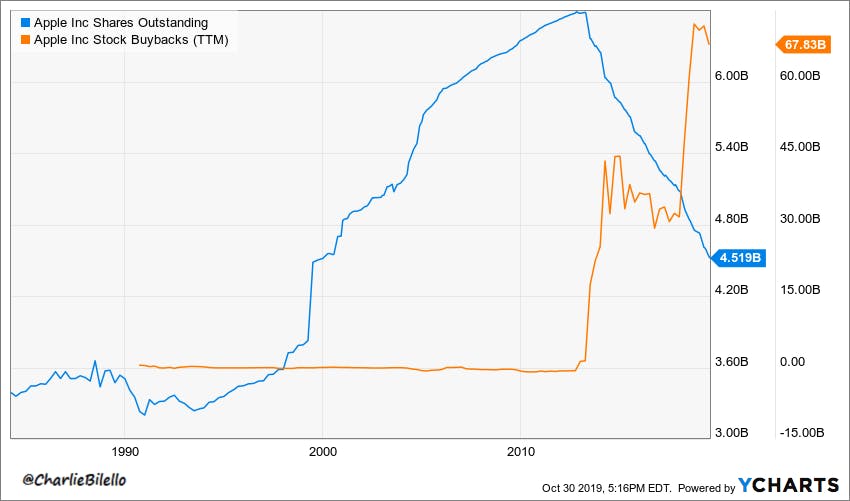
In the most recent quarter, Apple disclosed it had spent $17.9 billion to buy back 92.6 million shares during the fiscal fourth quarter. During the three prior quarters in the fiscal year, Apple had spent $49.2 billion. There is $78.9 billion remaining in its stock buyback program. The reduced share count this year has helped Apple beat earnings per share of $2.91 with $3.03 reported with fewer outstanding shares as a result of the buyback.
Apple has bought a total of 2 billion shares over the past six years, which brings the shares outstanding to their lowest level since 1999, according to Charlie Bilello, who is also a Seeking Alpha contributor.
Conclusion:
Apple will be particularly exposed to lower consumer confidence when this occurs. Mobile saturation is already showing its effects with a $22 billion loss in iPhone revenue year-over-year. In fact, the saturation of the iPhone could prove to be one of Apple’s biggest challenges to date, as the company attempts to make many pivots, all of which will add noise to the big picture that mobile’s golden days are behind it. This will not be resolved by a single quarter’s earnings “beat,” nor will it be absorbed by services revenue until at least 2023.
If your investment thesis is to focus on primarily cash reserves and cash flow, while ignoring growth and the leverage of buybacks to boost EPS, then Apple is likely in your portfolio. As a tech analyst, who look towards future growth for the highest gains, this is a company where I am personally on the sidelines and is not a company I can recommend long-term.
A version of this analysis appeared in MarketWatch on October 29th, 2019. It has been updated and lengthened post-earnings.A version of this analysis appeared in MarketWatch on October 29th, 2019. It has been updated and lengthened post-earnings.MarketWatch on October 29th, 2019. It has been updated and lengthened post-earnings.