We want to extend a warm appreciation to our subscribers this past year. Since launching in July, the site has completely exceeded our expectations. We are keenly aware of the contributions all of you have made in helping this site become possible.
When we first set out, our goal was to take a stock picker who has analyzed technology and products for nearly a decade and combine this skillset with a calculated, technical trader. We think we’ve done a decent job of delivering bullish ideas this year with a wide range of analysis.
You can check out Knox’s 2019 track record trading off my analysis here.
What to Expect in 2020
We are both dedicated to improving the site in 2020. For starters, we have been working on algorithmic safety nets to keep us in long positions longer and to help exit losing positions faster. We’ve been working on this system for months and it will become a premium benefit for subscribers that Knox will help to spearhead. Once we have this in place, we will begin to launch portfolios on various categories.
Please keep in mind that we write for both styles: buy and hold, as well as some active trading. When we recommend stops, we are simply making sure to provide the exit plans we use ourselves if there is an unforeseen market event. This ensures we lose no more than 10-30% while letting our winners run.
Stock Lists
Recently, we published a 2020 cloud software list followed by a few PDFs. We think cloud software has more room in 2020 than the market currently has priced in, and this is one reason we’ve been focused on this category.
We plan to publish similar lists for future technologies, such as 5G, artificial intelligence, and blockchain. We will also publish more lists for common categories, such as semiconductors, finance tech (fintech), and a high conviction list (a conviction ranking has been requested a few times by our readers). We will start with the lists we think are most time sensitive.
These lists achieve a few things:
Creates a master index of stocks in a category
Organizes companies the market is most likely to reward based on financial strength
Organizes which companies are most likely to surprise the market based on product strength
Helps to track which companies are breaking out
Short-lists the best companies if a trend breaks out
Help to keep companies on our radar even if we haven’t been able to cover them with a full-length analysis just yet
We Appreciate Your Referrals
Paraphrasing on forums or social media about any wins you’ve had from our service is encouraged and much appreciated. We greatly appreciate all of the referrals you’ve sent us. We couldn’t do this without you.
Analysis can be a competitive field. We only provide original analysis, which requires domain technology experience and is incredibly time consuming. For this reason, please do not share the links to the lists or PDFs (i.e. the verbatim analysis).
We honor the premium site far and above our free analysis. In fact, I’d say my free analysis has suffered a bit since launching the premium site as I am giving my best ideas to the premium members. You will see me publishing more on Forbes this year, as well as MarketWatch, but my best work goes to the premium site.
Thanks Again …
Our mission is to help you make as much money as possible in the tech sector – and to provide value that goes above and beyond your subscription.
Our plan is to far exceed what we did in 2019 with in-depth tech analysis on companies you won’t find elsewhere and to combine this with smarter and sharper entries.
Thank you again for your vote of confidence and subscribership.
This past week, I wrote about how Silicon Valley is losing some of its entrepreneurial spirit as venture capitalists shifted their attention to later stage deals with higher valuations. In the analysis, I pointed out that 2019 was the most lucrative year for exits in more than a decade, with $200 billion in exits generated from venture-backed IPOs.
For context, I went back to the golden years of Silicon Valley – 2006 to 2014. During this period, venture capital that was invested in deals below $5 million grew by 290%.
However, things changed in 2015, when early stage deals from below $1 million to under $100 million began to decline at a rate of 20% to 36% per year. Early stage software companies suffered most from the reallocation during this period, while early stage deals declined from 388 in 2018 to around 279 in 2019.
So how did this happen?
I identified two culprits behind the trend – Silicon Valley’s declining entrepreneurial culture and the increasing attractiveness of late stage investments.
Startup pitches and dynamic innovation have been replaced by a relatively closed circle of investors who are only targeting high valuations. In fact, we are seeing an aggregate all-time high for 180 private companies with $1 billion-plus valuations, and they have undermined the attractiveness of seed and Series A round companies.
Moreover, the IPO window is shifting from a range of six to eight years to ten to twelve years, which drove several startups to go public at valuations of over $10 billion this year. Consequently, this has made late stage investments more attractive due to their longer duration and higher valuations. The downside is that it has suppressed early stage investments (defined as deals below $5 million), which only further hampered Silicon Valley’s entrepreneurial culture.
Exciting early stage entrepreneurial stories have become rarer over the past few years, and many of the start-up tech events that I go to have either a noticeable lull or have moved overseas. The sad reality is that Silicon Valley’s entrepreneurial culture has faded, and entrepreneurs have a better chance at attracting capital from strangers on Kickstarter than from Silicon Valley angels and VCs.
The Elastic stack includes Elasticsearch, Logstash, Beats and Kibana.
Elastic has partnered with cloud infrastructure companies, such as Microsoft Azure, Amazon AWS, Google Cloud and Alibaba Cloud. The Elastic Stack works well with Kubernetes, which is the machine learning powerhouse for containerized applications.
Elasticsearch:
Elasticsearch is the core product and search engine that allows for storing, searching and analyzing data.
Google search is built for users to query hundreds of thousands of terabytes of HTML data (or about 20 petabytes per day). In contrast, Elasticsearch is built for developers who need to design more complex application searches. For instance, Elasticsearch can forecast data center storage capacity with queries or can search customer sentiment that is determined by natural language processing.
To further illustrate, here are some examples of how Elasticsearch is used today:
Business-to-consumer:
• Pairing a passenger with an Uber driver with search
• Recommending grocery items on Instacart
• Matching online dating profiles for Tinder dates
• Processing billions of log events for Sprint to monitor outages
• Processing billions of log events for Fitbit, which has a rate of 250,000 logs per second, to enhance data discovery and validate failures
Business-to-business:
• E-trade uses Elasticsearch to identify trading anomalies across 115 terabytes of data
• Adobe uses Elasticsearch to search across both textual and non-textual formats, such as images, videos, 3D templates. This helps assist computer vision, which trains computers with ML to have a high-level understanding of non-textual items. This is done at a rate of 600 queries per second and an ingestion rate of 25,000 per second.
• Blizzard uses Elasticsearch to make sure their games are running at peak performance
• Cox Communications and TV2 use Elasticsearch to analyze billions of content delivery logs
• John Deere uses Elasticsearch to handle 18 billion documents and 11 terabytes of data storage, running 20,000 events every second. This helps to support remote management, variable rate application and field and water management.
Products such as Elastic Cloud Enterprise allows companies to run the entire stack in the cloud with a SaaS offering. The Elastic Stack is also available on-premise, or a hybrid of both. Elastic Cloud Kubernetes extends the Elastic Stack for use on cloud native technologies and containerized architectures.
Logstash and Beats:
Logstash and Beats are ingestion tools that can be put on thousands of applications to query external systems. From the examples above, John Deere is ingesting data from thousands of external sensors in the field, for instance. This helps complete the stack for the optimal use of Elasticsearch.
Ingestion can become quite technical. For instance, eBay uses Beats to break down the silos from containerized machine learning platforms, such as Docker and Kubernetes. This helps to automate application deployment and keep up with fast-evolving application lifecycles. The Beat product also has an auto-discovery feature to ingest newly discovered workloads, to collect and enrich data, and to send to the internal monitoring system.
In eBay’s case, the company built a way to tag the metadata from Beats auto-discovery so that users could access the information with familiar labels. A real-life example of this might be analyzing data from website logs, call centers and competitor website scans with the end result being a system that can the difference between skis named SALOMON QST 92 17/18, Salomon QST 92 2017-18 and Salomon QST 92 Skis 2018 – and also measure rising popularity perhaps with social media.
Kibana:
Kibana is a free, open source tool that integrates tightly with Elasticsearch.
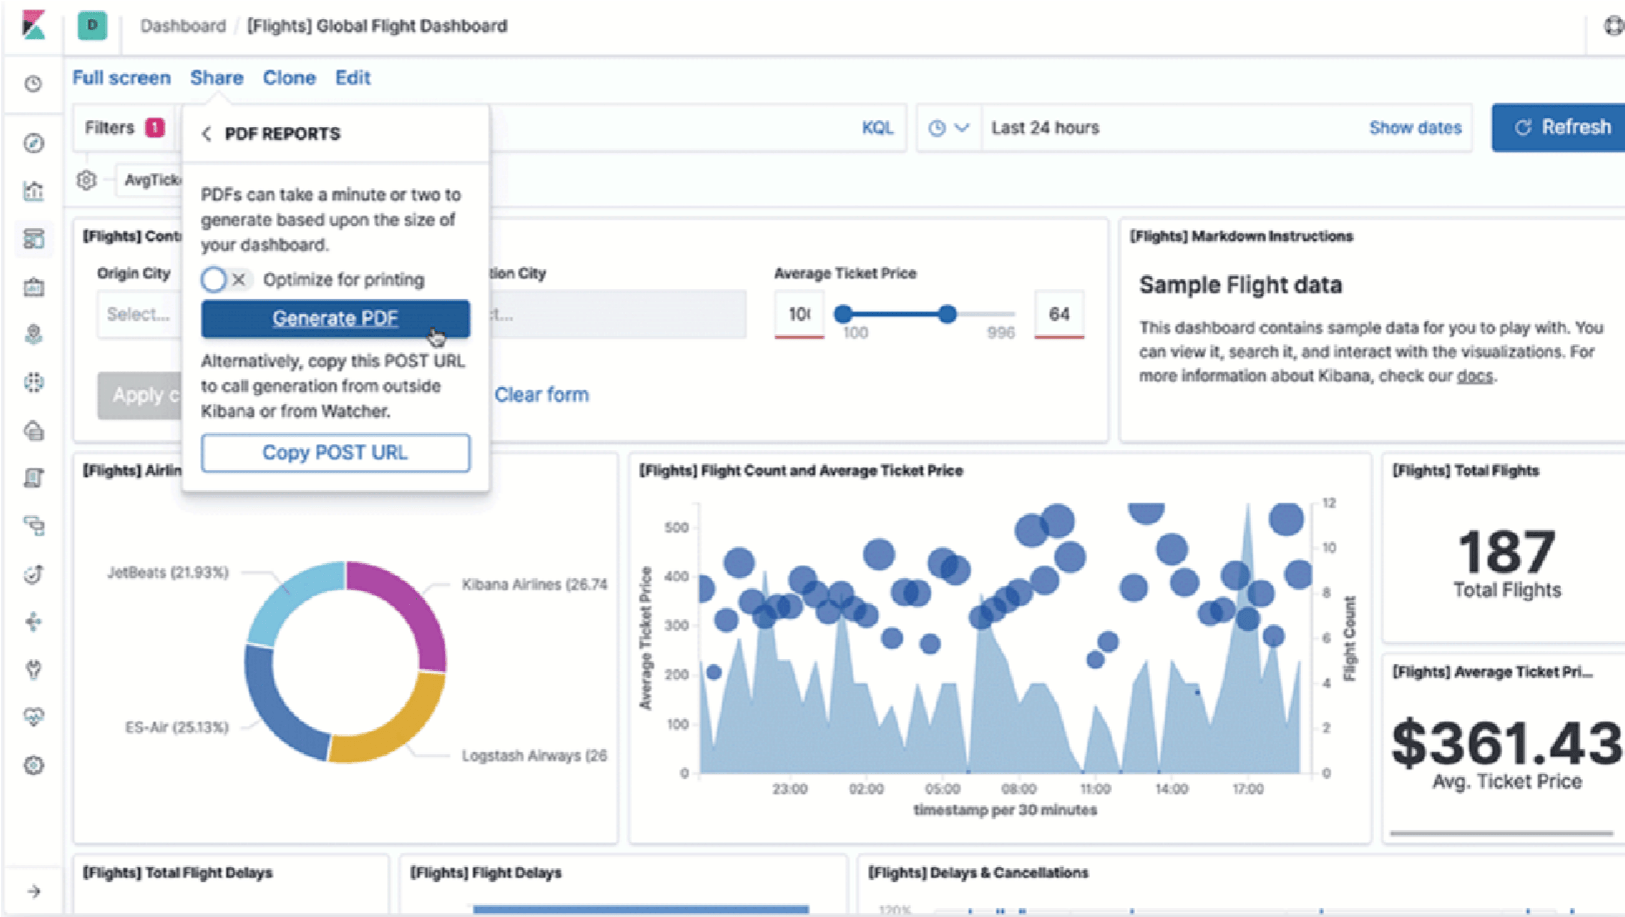
The visualization and exploration tools include interactive charts, mapping support, pre-built aggregations and filters, plus easily accessible dashboards. Elastic allows enterprises to pull more data in for visualization purposes with products such as Elastic Cloud Enterprise or Elastic Cloud on Kubernetes.
SECTION 2: Elastic Fundamentals
A major fundamental risk for Elastic is that revenue growth may not be rewarded in 2020 as we’ve seen plenty of evidence that investors’ appetites are turning more towards profitability, which Elastic is far from reaching.
The market was not kind to Elastic in 2019. Tech growth companies with negative earnings that did not have a perfect earnings report were penalized last year. Elastic was no exception.
Analysts are projecting EPS estimate of negative -$1.35 in fiscal year 2021 compared to negative -$1.22 in fiscal year 2020 ending in April. Revenue in fiscal year 2020 ending in April is estimated at $416 million and fiscal year 2021 at $567 million. The company has $307 million in cash and $42 million in debt.
The stock has a 52-week high of $104 in July and hit a new 52-week low of $61 a month ago on December 5th. The most recent earnings report revealed a slowdown in annual billings from 53% in the year-ago quarter to 45% in the most recent quarter. The company beat on all other estimates, including revenue, EPS and net expansion rate – which is phenomenal at 130. Despite this, the billing slowdown was enough to cause a 20% drawdown on stock price following the earnings report, from $78 to $61.
The recent drawdown has resulted in Elastic trading at one of its lowest valuations yet as a public company. The stock is currently trading at 12 Forward EV/Revenue with an enterprise value of $5.03 billion. When considering revenue growth, this is an attractive valuation as Elastic is reporting 59% YoY revenue growth. Notably, revenue has decelerated from 79% YoY in early 2018 — yet has remained stable at 59% for the past three quarters.
So, the question that remains, will Elastic have an earnings surprise, which is the purpose of this report. There is an important catalyst to consider, which I’ve outlined below. I believe it’s highly probable that Elastic’s fundamentals improve in the coming year due to its entry into endpoint security.
Market Size & Competitors
Determining the market size for Elastic is challenging for a few reasons. The first is that the company does not neatly fit into a specific category. In fact, the company is absent from Gartner’s magic quadrant for Insight Engines, although Elastic is mentioned as the brains behind two products on the quadrant: Intrafind and Lucidworks. Here is what Gartner says about Elastic:
“Of the vendors most often shortlisted by the reference customers we surveyed, Elastic (Elasticsearch) appears in the top five, and Apache (Solr) in the top 10. Neither Elasticsearch nor Solr are considered insight engines — extensive development is required for them to meet the market definition. However, they do provide highly effective search engines for those seeking only search capability or wishing to undertake development. Consequently, they form a foundational layer in the stacks of a number of commercial insight engines, including two in this Magic Quadrant: Lucidworks and IntraFind.” Of the vendors most often shortlisted by the reference customers we surveyed, Elastic (Elasticsearch) appears in the top five, and Apache (Solr) in the top 10. Neither Elasticsearch nor Solr are considered insight engines — extensive development is required for them to meet the market definition. However, they do provide highly effective search engines for those seeking only search capability or wishing to undertake development. Consequently, they form a foundational layer in the stacks of a number of commercial insight engines, including two in this Magic Quadrant: Lucidworks and IntraFind.”
According to Jefferies’ analyst John DiFucci, Elastic’s addressable market is around $40 billion and could double to $71 billion by 2022. He cites the technology is only limited by the “creativity of the customers.” I agree that the limitations for Elastic’s growth will eventually lift as we are in the early stages of machine learning (ML), computer vision and natural language processing (NLP).
ML and NLP are two markets that will grow rapidly over the next decade, with Elastic a recipient. NLP will grow from $3 billion in 2017 to $43 billion in 2025 (source: Statista). Research on Global Markets estimates ML will reach $19.4 billion by 2023, at a CAGR of 48.3%. Big data analytics is quite large at $168 billion in 2018 and forecast to grow at a CAGR of 13.2% to $274 billion by 2022. Elastic sits somewhere between these three markets.
The companies listed on the Insight Engines magic quadrant are not direct competitors. Rather, I would consider Splunk the biggest competitor as their customer value proposition of providing log analytics most closely overlaps. Elastic Stack and Splunk frequently compete for customers. According to developers who work with the products, Splunk is more mature while Elastic is more flexible due to its roots in open source. Other competitors include Sumo Logic on the enterprise side and Greylog on the open source side. The Elasticsearch open source tools are also available through Amazon without the need for enterprises to upgrade through Elastic (although the more optimal experience is with Elastic Stack).
SECTION 3: Endpoint Security
The log management and analytics dashboard offered by both Splunk and Elastic has evolved into an important secondary offering for Security Information and Events Management (SIEM). In other words, because these companies monitor so many endpoints for data ingestion, the platforms are also useful for security monitoring.
By using Search Processing Language (SPL), log management systems are able to perform high-order security analysis and assessments regarding the collective state of these systems from a single interface. For instance, Elastic has been used for threat protection by organizations such as the University of Indiana to monitor hundreds of thousands of devices across students, faculty, and staff.
In October of 2019, Elastic closed the acquisition for Endgame, a leader in endpoint security for $234 million. This followed Elastic launching a Security Information and Events Management (SIEM) product in June. Endgame has enough credibility to be used by the U.S. Navy and the U.S. Air Force.
To raise the stakes, Elastic will be the first to charge for endpoint security by the amount of the data stored rather than by machine. This will allow companies to scale endpoint security more efficiently and will help Elastic compete with Splunk.
Splunk was ranked number one in SIEM by market share in 2018. The SEIM market was worth $5.3 billion in 2018 and is expected to grow at a 19.7% annual rate to reach $12.9 billion by 2023. Elastic should be able to compete very closely with Splunk due to Elastic Stack having similar capabilities of ingesting data from endpoints. Even claiming a small portion of this market should help boost Elastic’s $500 million in annual revenue.
We believe Elastic’s market entry into endpoint security along with competitive pricing will be an important catalyst for the company in the near future.
SECTION 4: Basic Technical Analysis and Closing the Gap
By Knox Ridley
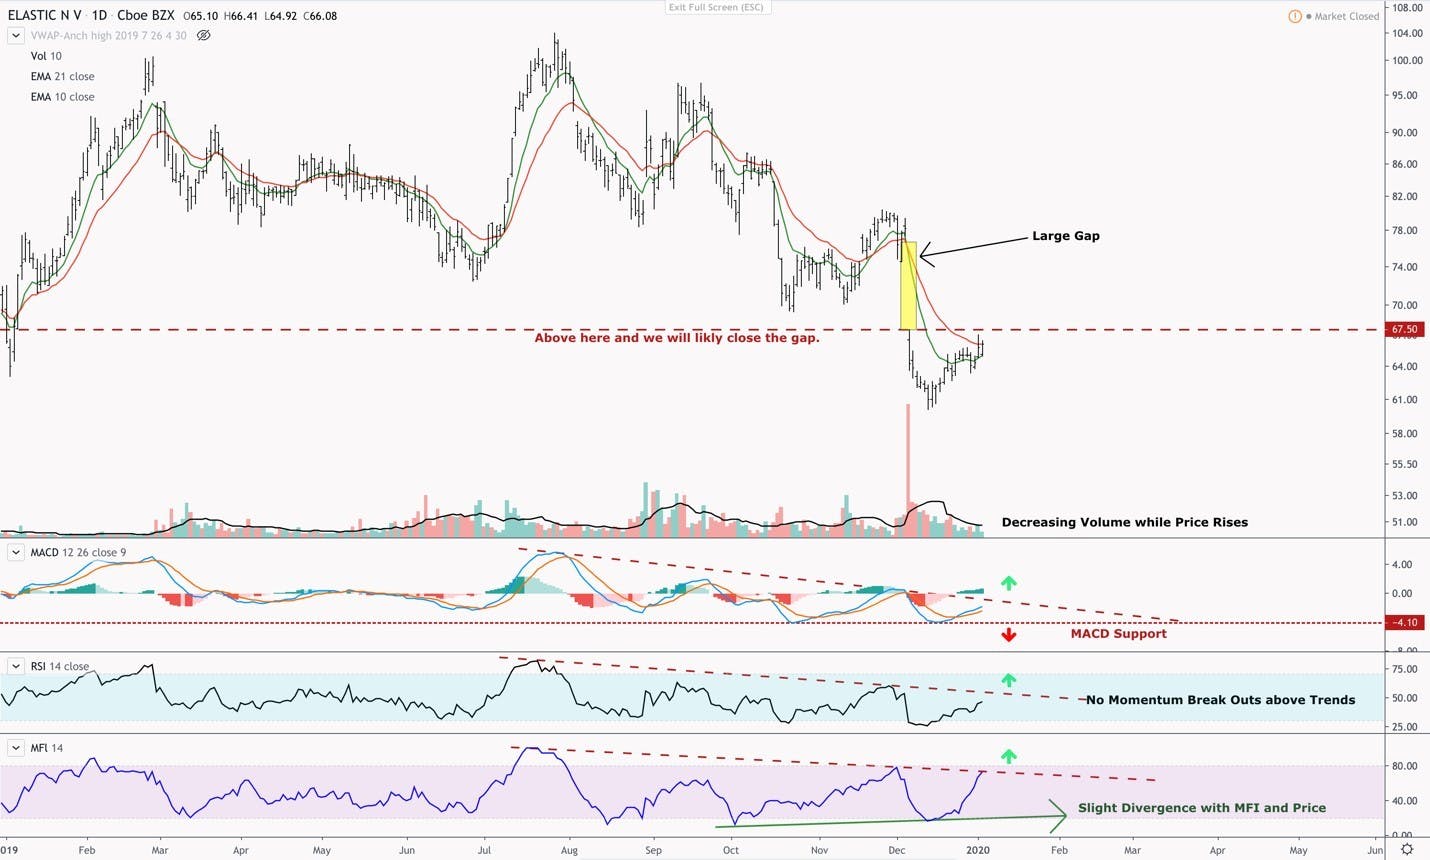
Elastic (ESTC) is in a clear downtrend. After testing the all-time lows at $60.10, Elastic is bouncing back towards an important resistance price region at $67.50, highlighted with a red dotted line in the chart. If Elastic can close above this price, we will likely see a closing of the gap around $77.50, which is highlighted in yellow. This move would be about a 14% move from current prices (and about 24% from its recent bottom).
Furthermore, it’s worth noting that Elastic has taken back its 10-day Exponential Moving Average (EMA) and closed just below the 21-day EMA. The volume of this bounce is on very light volume, which is descending as the price is ascending. This means that the market is not buying this beyond just a bear market bounce, and should be factored into any buying plan.
Internals (MACD, RSI, MFI)
Looking at the internal strength of Elastic (ESTC), the MACD, Relative Strength Index (RSI), and Money Flow Index (MFI) are all telling an interesting story. First off, they are all in well-defined downtrends, which is highlighted by the dashed red lines.
The RSI and MACD are also bouncing against support while trending down, and doing so at lower levels, which looks to be coiling for a move up. We will want to see these indicators break this downtrend in unison with the price of ESTC breaking out as well to indicate a possible change in trend.
The MFI, which is basically the RSI with volume factored in, is showing a positive divergence. In other words, as the price is making lower lows, the MFI is making higher lows. This is always a great indication of fading selling, and usually indicates a shift in sentiment.
Closing above the start of this gap with high volume, and internals that are breaking out would be a key pivot that would further identify that Elastic is in a new uptrend, and not just a bear market correction.
Price Symmetry
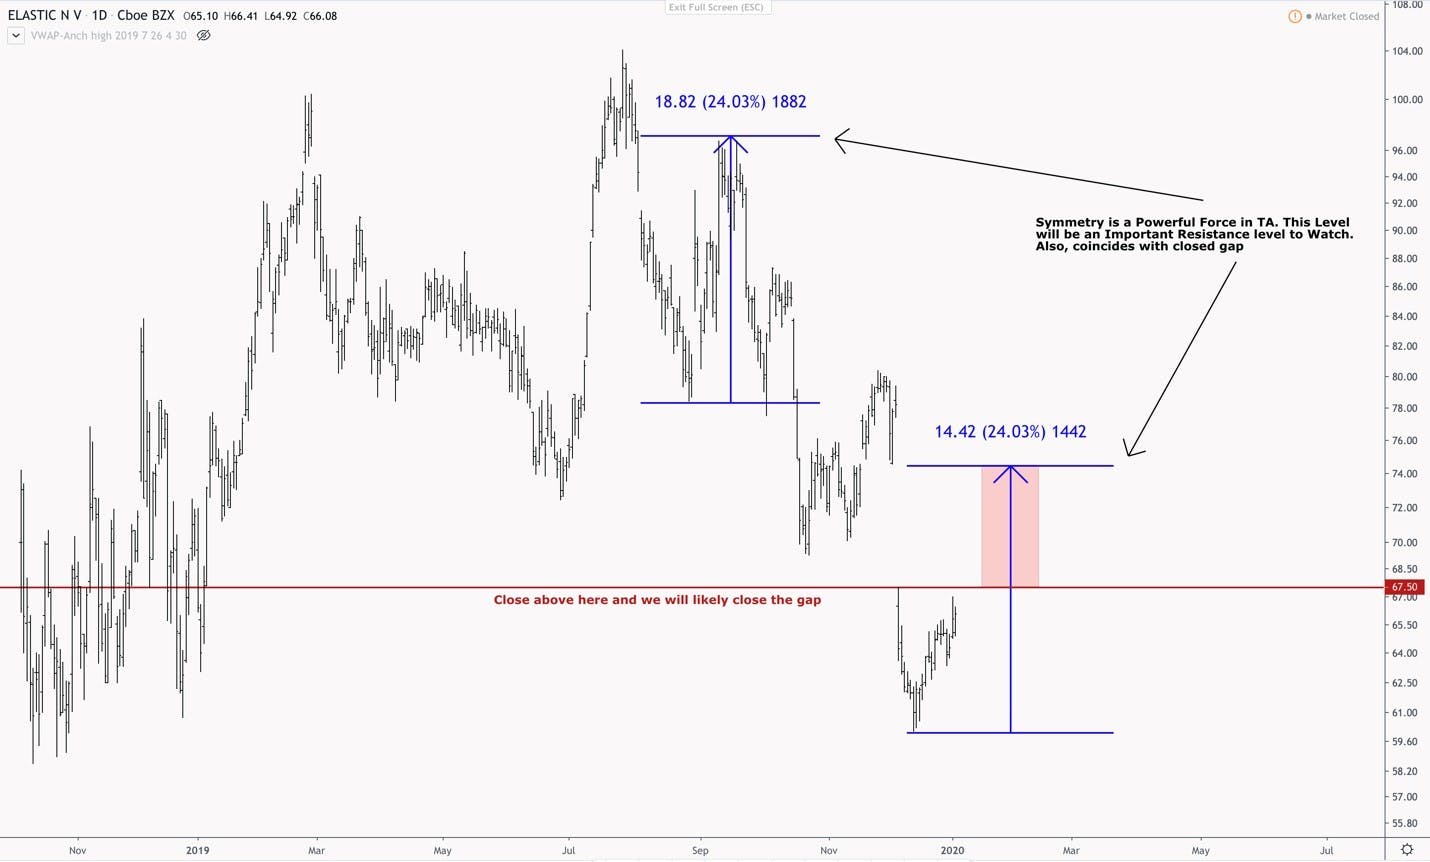
Symmetry is a very powerful force in technical analysis. When a move in a certain direction reaches the length of prior moves, we usually see this resistance zone terminate the short-term, corrective move, and signal the continuation of the bigger trend. On the other hand, if the price can break through, it’s a strong indication that the larger trend has possibly changed.
The above chart shows the length of the last correction in the current downtrend. The price increased by about 24% before continuing the larger trend to new lows. After bottoming recently, a 24% move up from the low would coincide with closing the gap just discussed. There is a lot of overhead resistance above Elastic, and until we see ESTC break above this region with heavy volume, we can only assume that this move is a correction in a larger downtrend trend.
Elliott Wave Count
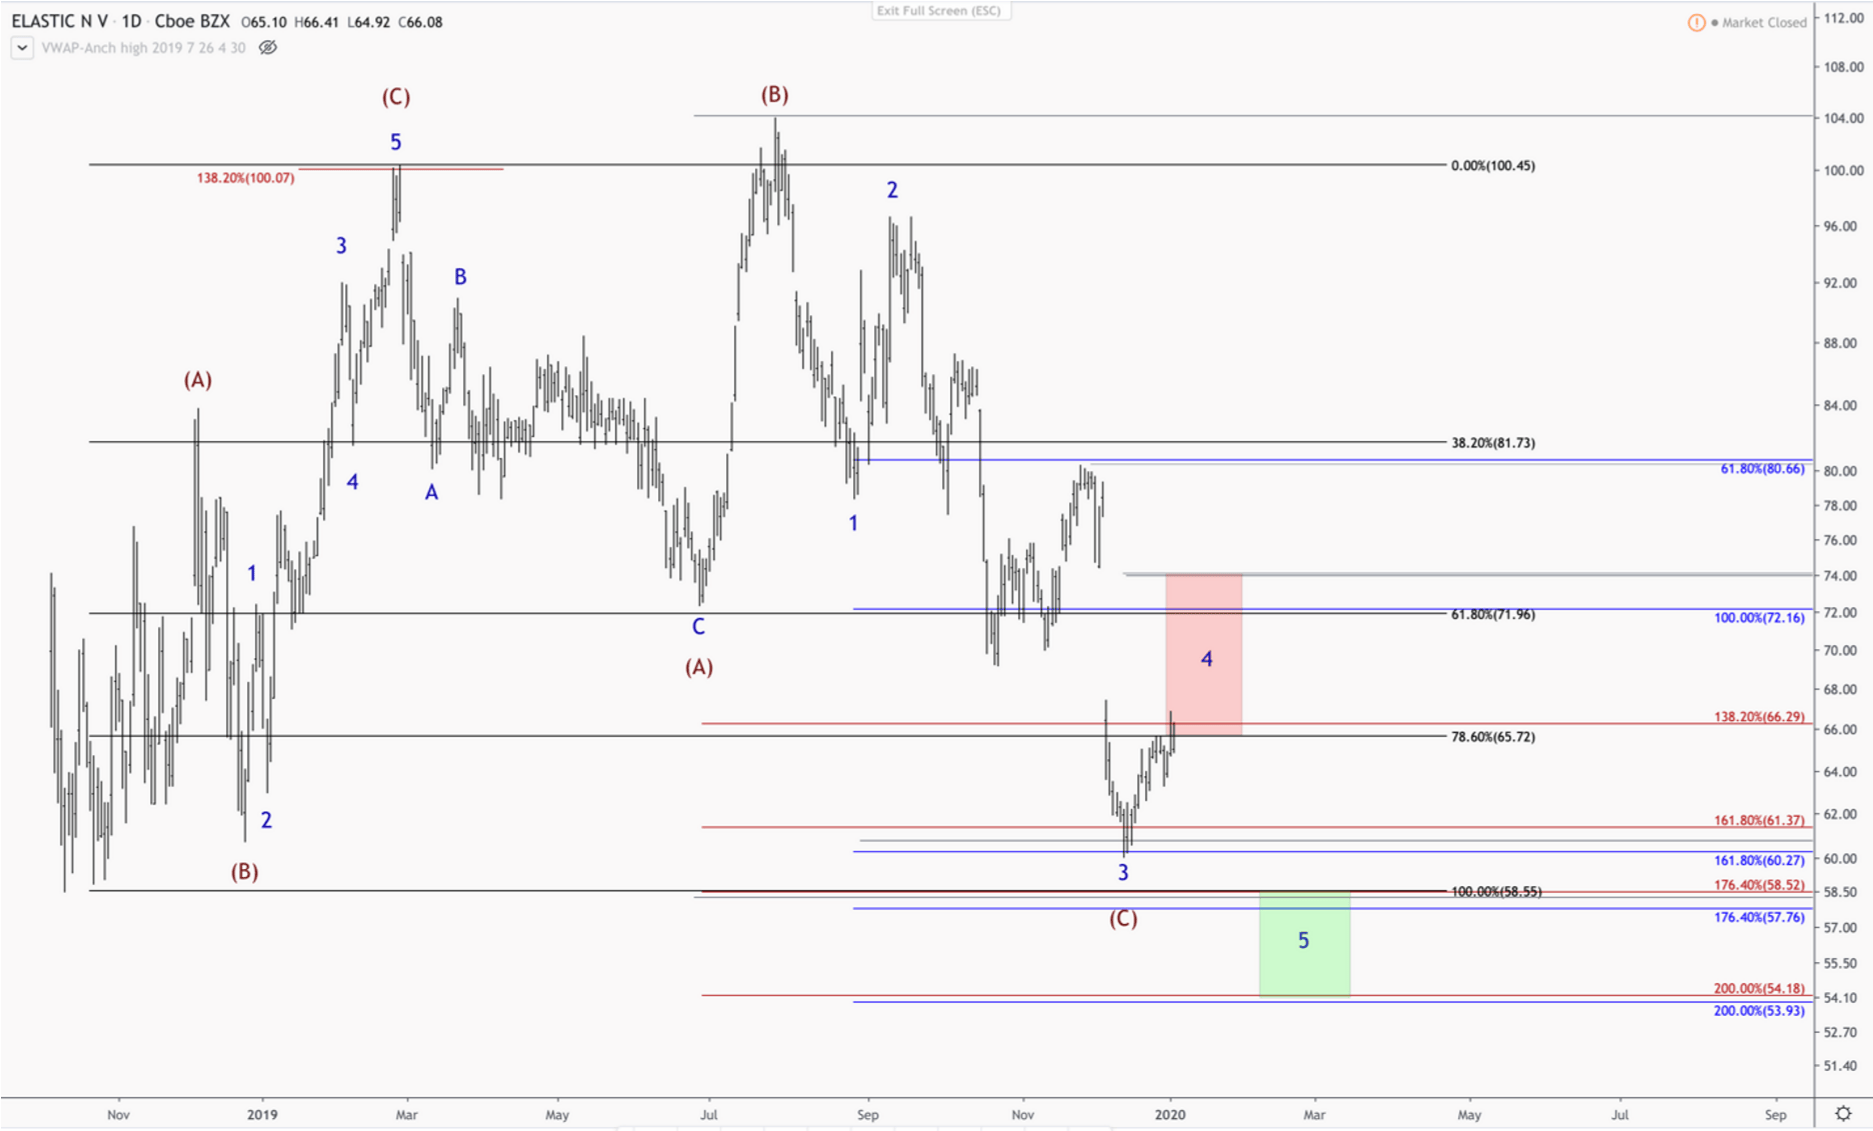
Elastic’s price structure, since its IPO, has been a series of overlapping structures. An overlapping structure, where the price retreats most of the previous move, indicates the uncertainty in the market.
The above count shows Elastic is completing a corrective, 3-wave move up, which is highlighted by the red (A), (B), (C), and then began a new, corrective 3-wave move back down. In both 3-wave trends, the C wave unfolded in a 5-wave move, which is highlighted in blue and also common in 3-wave corrections. My best count has us in the final 4th wave of the C wave, which would suggest newer lows ahead.
The alternative count has us as completing the 5th wave down, which would suggest we are in the very early stages of a renewed uptrend. I have a problem with this count due to Elliott Wave rules; however, if Elastic can close the above gap on heavy volume and close above the 100% extension, I will take that as evidence that this alternative count is in play.
How to Trade
Elastic is a high conviction idea, that may take some time to play out. The market obviously hasn’t seen the value in Elastic over the past month, hence the current trend. We do not think this will last, but how early we are is the real question. Depending on your investment style, we have 3 suggestions:
Buy now and Forget: If you want to buy your position today and hold it, a good stop would be just under $53. Below here and we are entering uncharted territory with all-time lows.
Layering in: If you prefer to layer in, the same stop above would hold. Then, if Elastic hits lower, you can layer in more in the green target region on the chart, between $58.50-$53.50. if ESTC decides to continue higher from current prices, if it closes above $74.50 on heavy volume, with the internals breaking the current downtrend, then you can put the remainder of your position in with a 25% trailing stop.
We plan to trade with the layering in approach.
Wait and See: If you prefer to wait and see, I’d target the green box in the chart between $58.50-$53.50
On Thursday, The Rubicon Project and Telaria announced plans for an all-stock merger. The combined companies state this will be the largest independent supply-side platform (SSP). Rubicon shareholders will own 52.9% and Rubicon CEO Michael Barret will become CEO of the new company with a stock ticker $RUBI. The deal is expected to close in the first half of 2020.
Aggregate revenue for the combined company grew 32% to $217 million for the year ending September 30, 2019. The combined company will also have $150 million in cash and no debt. Both companies had market caps around $350 million prior to the merger. The merger is expected to reduce costs by $15-$20 million with 600 employees.
The main benefit to this merger is that Rubicon will now be truly omni-channel (i.e. desktop, mobile, connected TV, video, etcetera) without having to build a connected TV platform, which can take two to four years.
In turn, Telaria is now able to attract larger media companies who want to work with fewer partners across various types of inventory. The combined company is a full-service SSP that will require advertisers and publishers to work with fewer vendors.
The company expects Connected TV ads to make up mid-to-high teens as a percentage of business. Previously, Telaria’s CTV ad business accounted for 44% of the most recent quarter’s total revenue.
Strengths and Weaknesses
Strengths
Supply-side is typically the better side of the deal when compared to the demand side.
On a high-level overview, this is because publishers (the supply side) own the content and the data, and therefore, they control the relationship. Advertisers are fickle and will quickly switch who they are working with according to the best pricing at the time.
Please note: there is a full-length report on the differences between SSPs (Telaria/Rubicon) and DSPs (The Trade Desk) in the Telaria PDF.in the Telaria PDF.
Telaria and The Rubicon Project onboard publishers. This provides a slight advantage to onboarding advertisers. Nearly every major success in advertising is on the publisher side. Facebook and Google own the content and the data. Gaming exceeds Hollywood and music more than 15X on revenue due to owning content and data with free-to-play alone/ad-supported exceeding Hollywood’s revenue alone. The Superbowl charges record-high prices by owning the content and the viewer data. Therefore, having a larger SSP in the Connected TV ad space is intriguing to say the least.
The most important strength and catalyst for the merger is Connected TV ads, of course. There are many statistics provided in the Telaria PDF and Roku/TTD PDF to support my conviction on CTV ads.
Read the Roku/TTD PDF here covering Connected TV ads.Roku/TTD PDF here covering Connected TV ads.
Weaknesses
Rubicon has some weaknesses around growth that are important to discuss. Although revenue was up 27% year-over-year, the revenue was flat at essentially 0% quarter-over-quarter at $37.64 in Q3 compared to $37.87 in Q2 2019. In Q4, Rubicon is guiding for year-over-year growth of 15-16% at $47 million-$48.5 million. The EV/revenue reflects the lackluster growth at 2.17 compared to The Trade Desk’s EV/Revenue of 19 and Telaria at 4.7.
According to the most recent earnings call, the CEO stated, “we got dinged by [new transparency methods] slightly.” Basically, what happened is some app publishers have not converted to the new standards (likely due to development constraints) and this is affecting demand (advertisers are starting to require the new transparency methods). The new transparency methods are app.ads.txt, which reduces app ad fraud by requiring app publishers to provide text files that list the ad networks authorized to sell their inventory.
Another issue affecting Rubicon is supply-path optimization, or sellers.json. In many instances, Rubicon is a reseller rather than the SSP with the direct relationship with the publisher. Advertisers are pushing back on resellers as more middlemen can increase costs in the real-time bidding process and create opportunities for fraud.
With that said, the aggregate company with Telaria and Rubicon combined has year-over-year growth of 32% for Q3 compared to The Trade Desk’s at 38%. It’s the lack of revenue in the most recent quarter and the upcoming quarter for Rubicon that is concerning (not the TTM).
Regarding weaknesses, I can’t stress enough that the advertising market is incredibly tough as there is not much intellectual property to stave off competitors. For SSPs and DSPs, it is a relationship-based business and a pricing war. I would personally not go long on any ad platform (that does not own the content) without a stop in mind. At the very least, a wide stop should be considered.
About Walled Gardens & CCPA
As Telaria CEO Mark Zagorski stated, this is “an opportunity for someone to create really The Trade Desk of the sell-side — a real alternative to those walled gardens.”
The walled gardens he is referring to are Google and Facebook. They provide little transparency to advertisers and publishers. Meanwhile, they lock publishers into their ecosystems, and advertisers with precise data targeting.
These two companies essentially wiped out the ad industry around 2014-2016 and both Rubicon and Telaria come from the wreckage of those years (Telaria’s path was covered in the PDF). This should be behind us now as what Google and Facebook did is increasingly seen as anti-competitive due to leveraging private data as a means of shutting down ad competitors.
One nod towards the end of the anti-competitive behavior was Amazon opening up its Connected TV ad platform. I am fairly confident this was to thwart any future legal issues and is a healthy sign that the days of iron-clad walled gardens may be behind us.
With that said, there will need to be some finesse from ad platforms on the privacy side. California has passed the California Consumer Privacy Act (CCPA) that will take effect very soon on January 1st. The law is a bit vague as to how to define the selling of consumer data, which Facebook is already preparing to fight.
The reason this is applicable to The Trade Desk or Rubicon/Telaria is these companies typically have various tracking code for omni-channel campaigns, such as TTD’s Universal Ad ID. Interesting enough, Telaria’s CTV ad platform could be protected as they are partnered with Nielson for data, an industry staple for nearly 100 years. Nielson typically collects data on viewing habits rather than on private individuals, so Telaria could actually have an edge if privacy laws prevent the tracking of individuals.
The above paragraph is not something to worry about right now, but I will be keeping an eye on it to make our readers aware if the CCPA extends to omni-channel tracking methods.
Conclusion
The ad industry is often messy and convoluted, which we are seeing with Rubicon’s most recent quarter. They’ve made it clear their intention is to compete with The Trade Desk. While TTD is the first mover, this merger can offer better data for targeting purposes due to being a supply-side platform.
Twilio’s most recent earnings report saw a severe 17% drawdown due to lower-than expected guidance. The company guided for $0.01 to $0.02 EPS versus analysts expecting $0.07 per share. Meanwhile, the company beat on earnings at 3 cents per share compared to an expected 1 cent per share, according to Refinitiv. Revenue came in at $295.1 million compared to $287.8 million expected by analysts.
The company missed estimates for the net-dollar retention rate, which came in at 132% compared to 138% expected. This was an oversight by analysts, as the 132% is quite healthy for a company of Twilio’s size. The median net-dollar retention rate for cloud software is at 104%. Twilio cites the miss as running up against the law of large numbers, which is a fair assessment.
Although I do not foresee rapid, hockey stick growth in Twilio’s future due to mobile maturation, there are some fundamental strengths to Twilio that the market will likely respond positively to.
For instance, Twilio’s revenue is growing at 75% year-over-year, the company has crossed a $1 billion run rate, and the company has positive EPS with a consensus expectation of 92% EPS growth next year. Current fiscal EPS is $0.13 EPS for the year ending December 2019 and consensus is annual EPS of $0.26 EPS ending December 2020.
Current fiscal revenue is expected in the $1.16 billion range with fiscal 2020 revenue in the $1.46 range for 31.45% growth.
PRODUCT
Twilio enables communications for mobile applications, such as voice or text. When you text or make a call inside of a mobile application, you are likely using Twilio’s APIs. The company works with over 1,000 mobile carriers in over 150 countries for voice and text/SMS services.
A few examples:
• Customer service calls on Zendesk are made through Twilio
• Powers Facebook’s Whatsapp for availability inside of other apps
• Messaging home owners inside the AirBnB app
• Using the Uber or Lyft app to call your driver
• When Netflix notifies you of new programming that meets your profile, they are using a Twilio product
• Messaging businesses or receiving notifications about a dinner reservation inside the Yelp application
Twilio has high switching costs and is one of the only solid VoIP/CaaS options for native mobile applications available. It’s very challenging for their existing customers to go with another VoIP/CSaaS service due to the required time to develop new features and test these features. This is a major plus.
The company caters to developers and this is another reason Twilio has done well, as developers decide the APIs for applications (i.e. not the CEO or a CTO). Twilio states they have 5 million developers as customers, which is about 20% of the 26 million developers in the world today.
Competitors include Bandwidth, a company that is also a network carrier. As a network carrier, Bandwidth is able to undercut Twilio on pricing with cheaper outgoing and incoming calls plus free incoming SMS. Twilio costs $1 for a dedicated number while Bandwidth costs $0.35 per dedicated number. Bandwidth is the network provider for Google and Skype, however, it’s uncertain how many developers use the service for native mobile applications.
Another competitor is Nexmo, who was acquired by Vonage, and is second to Twilio for global presence with coverage in over 90 countries. Nexmo has attempted to undercut pricing by charging per second rather than per minute, yet is more expensive than Bandwidth. It is more likely that United States developers would choose Twilio over Nexmo.
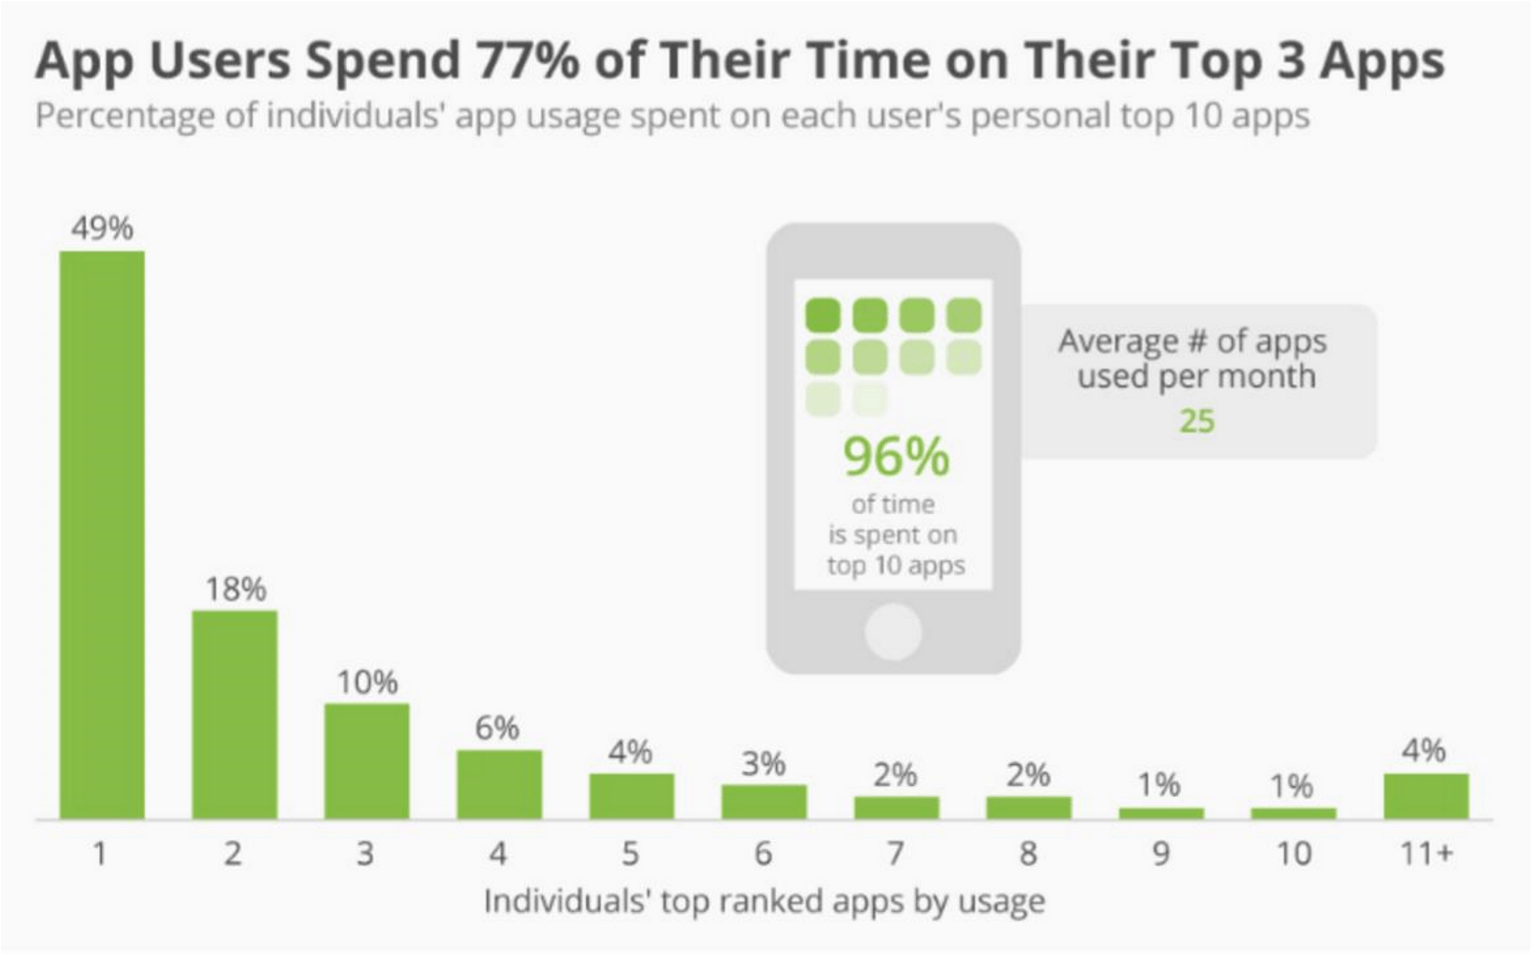
I am less concerned with the competitors and more concerned with the risks associated with mobile saturation. It can be challenging to quantify the impact of a burgeoning technology that begins to plateau. For instance, on one hand, the trajectory of mobile app revenue is expected to nearly double between 2020 and 2023, from $581 billion to $935 billion. But on the other hand, 77% of app usage is spent inside of three applications and 96% of app usage is spent on the top 10 applications.
The issue is what will happen to the other 1.8 million apps on the App Store, and 2.4 million apps on the Google Play store, who are fighting for the remaining 4% of app usage time? That’s where saturation comes in as consumers consolidate their time across fewer apps and become harder to convert to new services or applications (the thrill is gone, essentially).
Twilio is a stable choice that should clear fundamental benchmarks that Wall Street rewards, which is why we are covering the company. Twilio may not be the biggest breakout story of 2020, but is a stable growth story. There should be a noticeable boost for Twilio when 5G is more widespread, however, it requires new applications to be developed for 5G for Twilio to benefit.
Twilio is Pivoting Beyond Mobile Applications …
Twilio has strong leadership that has been with the company since inception and is well ingrained in the mobile developer community. There was a time, in 2009-2010, when Twilio had the largest presence at mobile conferences and was everywhere (no exaggeration). Today, the company is much quieter and working on how to expand beyond mobile.
SendGrid Acquisition
Twilio completed the SendGrid acquisition in February of this year, a company that allows developers to create email messaging and marketing strategies through APIs. The acquisition will help Twilio to become an omni-channel offering for companies to communicate with their customers.
Based on the closing price around the time of the acquisition, the all-stock deal was valued at $3 billion, up from the $2 billion amount at the time the acquisition was announced due to the strength of cloud stocks in end of January/early February of this year.
Twilio paid 18 EV/sales for SendGrid if calculated on the last full annual revenue reported in 2017, or 13-14 EV/sales if based on the annualized 2018 revenue.
According to Morningstar, the acquisition is value-neutral. Twilio and SendGrid have both stated they aim to be accretive on revenue while re-investing any savings on expenses to grow the business. Twilio had stated the annualized 2018 income would be $734 million, compared to Twilio’s $650.1 million. The company also stated on a conference call that the gross margins would be 59%, up from Twilio’s gross margin of 47.5%.
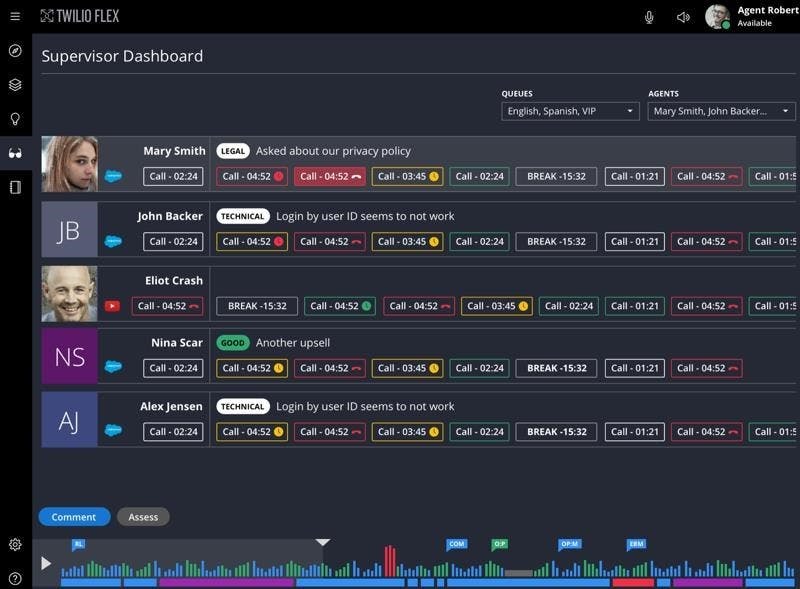
Twilio Flex
Twilio launched Flex a year ago, a cloud-based platform for routing calls and engaging with hundreds or thousands of customers. This is a move towards enterprise companies who require a user interface (or dashboard) and a full stack contact center they can customize.
Conclusion:
As stated above, Twilio is a stable choice that should clear fundamental benchmarks. The company is priced at current EV/sales of 11.87 and forward EV/sales of 10.71. This is currently one of the lowest valuations in the category while forward EPS consensus is one of the highest in the category.
Technical Analysis
The technical structure of most cloud stocks is lining up with the fundamental outlook. In other words, while the cloud complex is clearly in a sentiment driven correction, the growth in cloud is just getting started. Next year, it’s estimated that software-as-a-service will grow by 17%, which, once this correction plays out, should lead to a new uptrend to all new highs.
Digging a little deeper, most of these stocks are clearly in a second wave, showing an overlapping corrective structure. Twilio and Alteryx are not exceptions (we are releasing a PDF on AYX shortly). Typically, second waves flush any remaining optimistic sentiment, causing investors to feel like the initial move up was false, and the current downtrend is here to stay.
However, what follows the 2nd wave is a more important 3rd wave, which is what we want to participate in. The standard target for the 3rd wave’s completion is around 161.8% the length of the first wave, so this move to all new highs will be notable. With Twilio’s revenue growing from $1.16B to $1.46B and analyst consensus of 92% EPS growth, as long as we avoid a larger macro pullback/recession, our goal is to add to cloud positions for this 3rd wave.
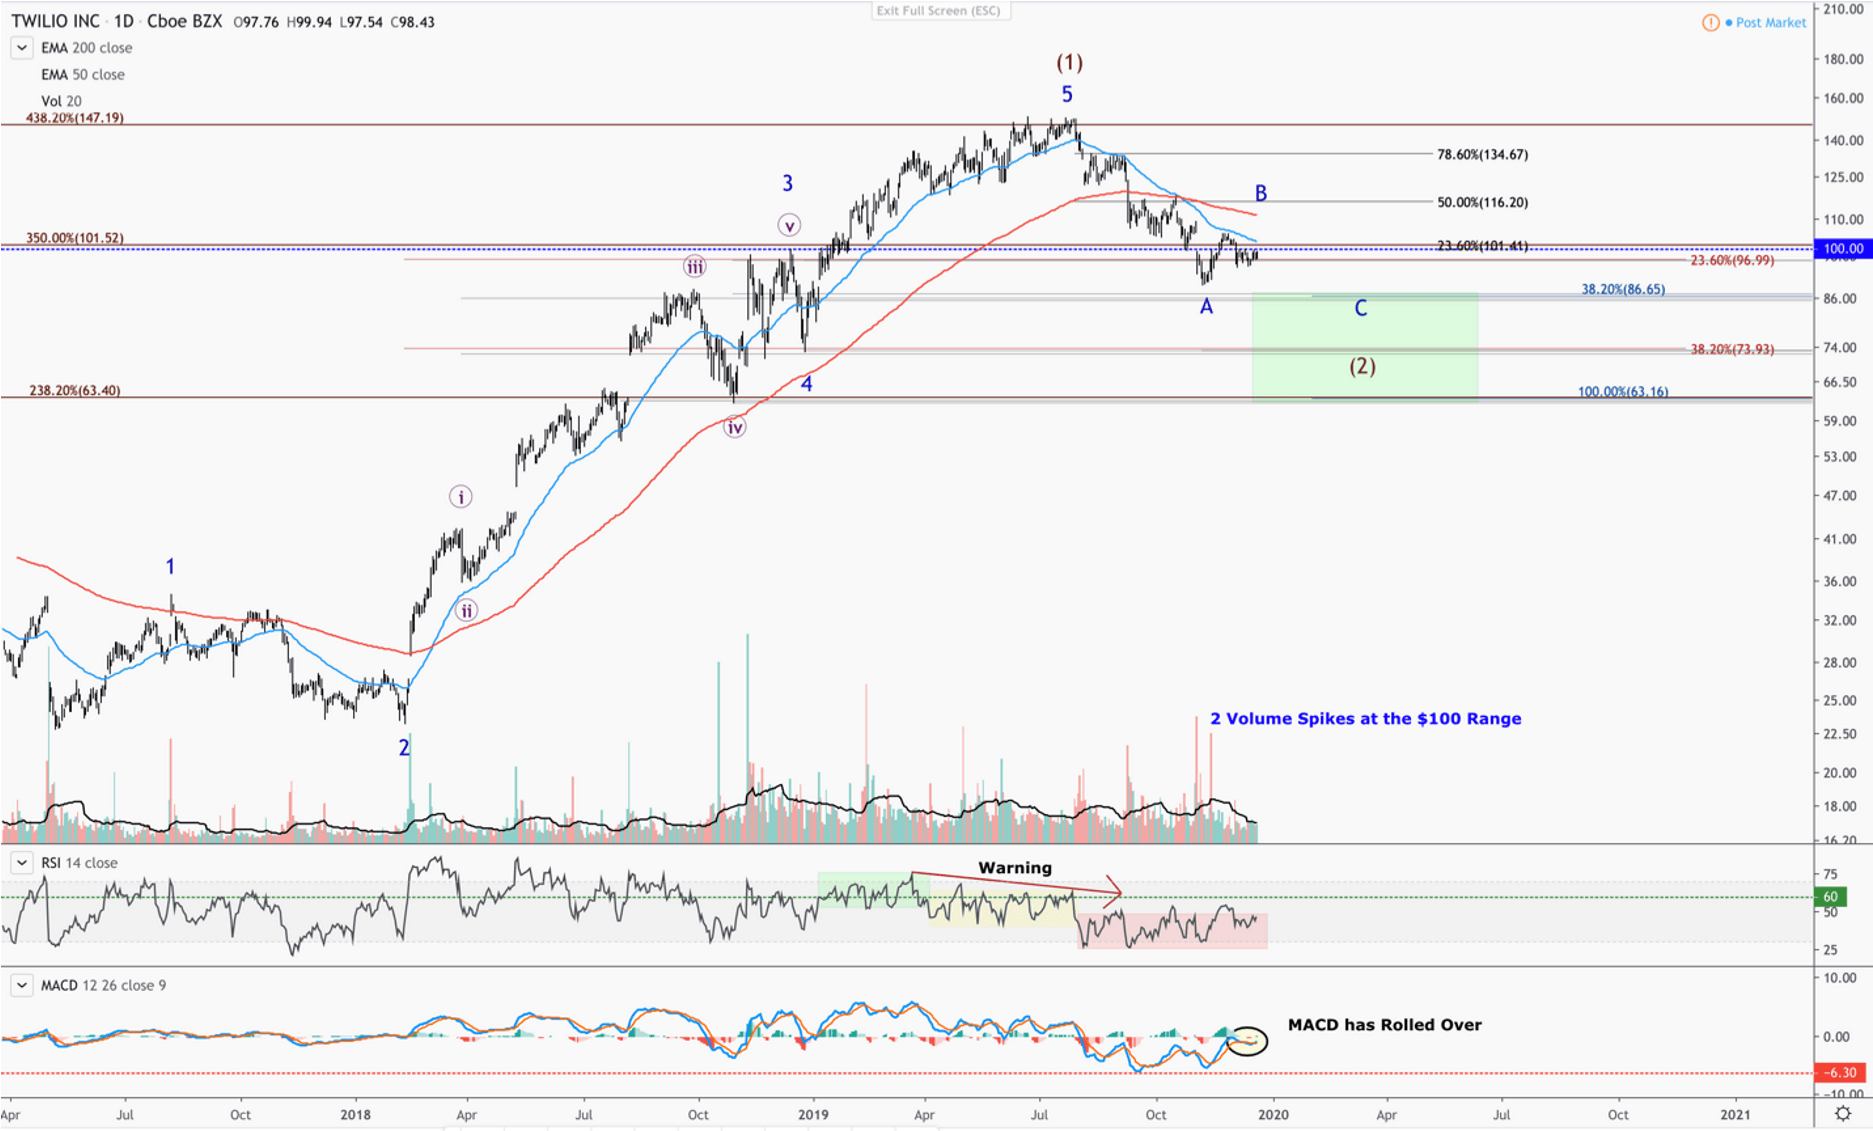
The red Fibonacci lines on the right indicate the retrace levels from the entire uptrend, which started in May of 2017. The Blue lines indicate the extension of the first leg down (A wave), assuming the first leg has bottomed and we are in a corrective retrace (B wave). The cluster gray lines indicate Fibonacci price levels taken from various swing lows based on Twilio’s price action, which is meant to reveal clusters of important price regions. When these regions line up, it signals a potential bottom, and trend reversal.
My count has Twilio completing it larger degree 1st wave in red, and is currently in its 2nd wave retrace. The charts suggest that Twilio, like most cloud stocks, has not completed the retrace. Cloud stocks, and Twilio, will likely continue another leg lower, which is when I will consider this a buying opportunity. It will be in this correction that the sentiment towards cloud stocks will likely hit bottom, and be ripe for a reversal.
There is a high level of Fibonacci clusters around the $86, $73, $63 price region. These levels will be my targets for a potential counter trend position, and I will be looking for signs of a bottom as the price approaches these levels.
Twilio is currently finding resistance just under the 23.6% retrace level at the $97-$103 price region. Furthermore, this level coincides with two huge volume spikes, both of which were initiated at the $100 level. This level will be difficult for Twilio to overcome, not only because it’s a key Fibonacci resistance level, but also because large amounts of money exited the stock at this level.
The internals of Twilio also suggest more downside. The RSI has clearly broken into bearish internals, finding it difficult to break the 50 line, let alone the 60 line. I will want to see the RSI break the 60 line, and shift into a more bullish posture before considering the correction to be over.
Furthermore, the MACD has begun to roll over again, suggesting that the downside is not over just yet.
My primary game plan is to initiate a position at lower levels. However, I will abandon this thesis, and assume the bottom is in if: TWLO can break through the 50 and 200-day MA; then break through the 61.8% retrace level with heavy volume, and do so with a 5-wave structure.
In conclusion, the first leg of the downturn appears to have ended, and we have retraced to heavy resistance at the $97-$103 price region. If Twilio cannot breakout here, expect the next leg of this downturn to flush out the remaining sentiment, while price finds support within the price zones listed above. The first support zone will be around $86, then $73, followed by $63. I will look to layer in my position as Twilio makes its next leg lower.
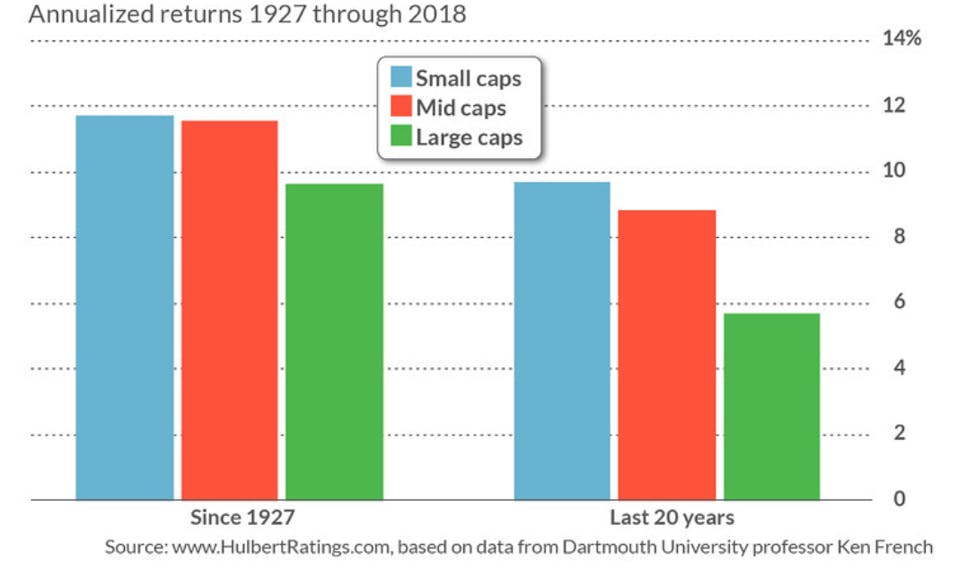
There are many reasons to have an allocation to small caps in a portfolio. For one, they offer further diversification with a lower correlation to the broad market. However, the primary reason is that, over time, history has shown small caps tend to outperform the more popular large caps. According to Ibbotson Data, this outperformance, on average, is 2.2% per year.
The Set-Up
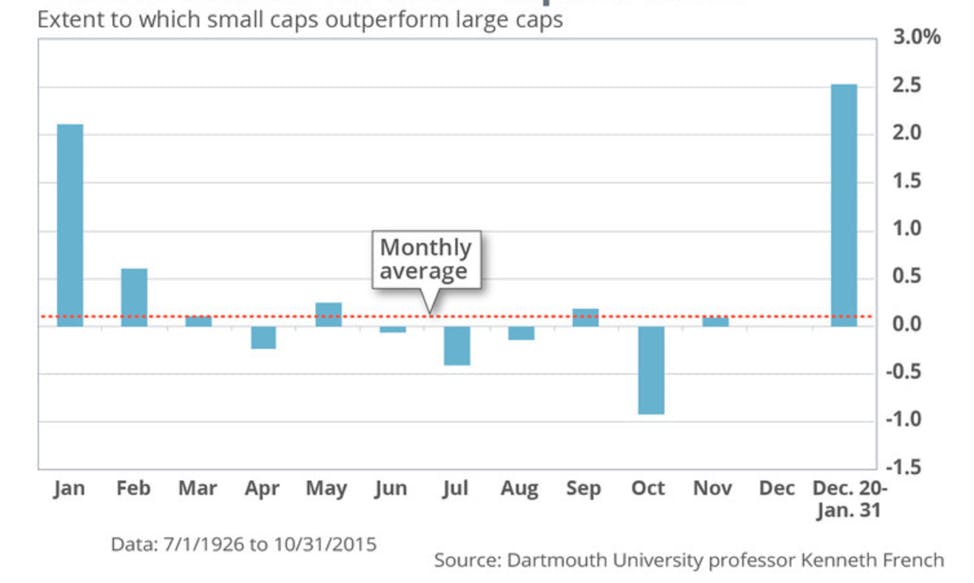
Ken French, the professor from Dartmouth who compiled the data in the graph above, discovered there is a seasonality for small caps when you average out all of the data we have going back to the 1920s.
From February through December, the average small cap stock tends to underperform. However, from Dec 20 – Jan 31, the average small cap stock tends to outperform by a noticeable amount
This data is showing that over the December 20 -January 31st time frame, the average relative performance of small caps over large caps is about 2.5%. This may not seem like a lot, however, keep in mind this is sourced from 89 years worth of data, which is statistically significant.
Today, we are seeing an important anomaly in the small cap region that we haven’t revisted in about 20 years.
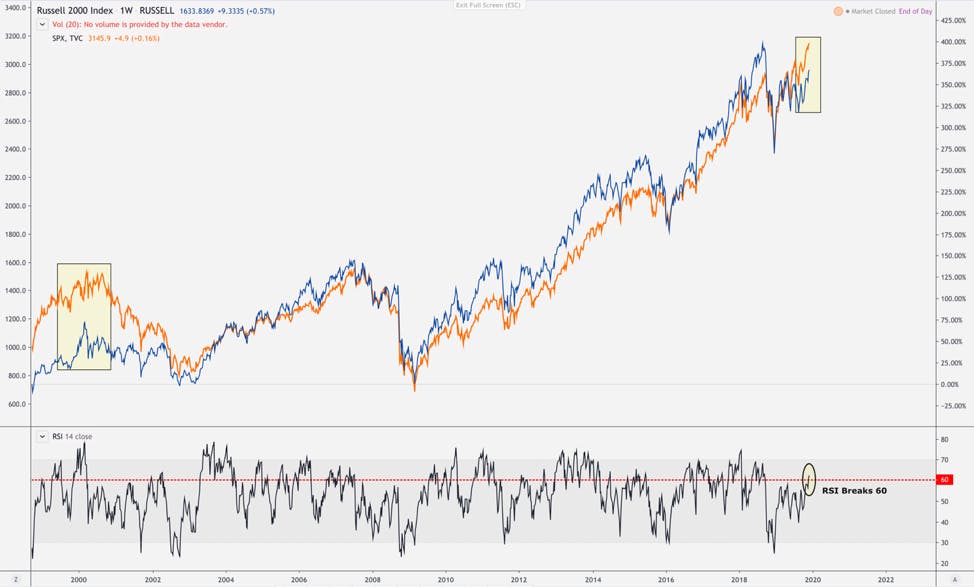
The above chart shows that small caps, in blue, tend to do better during an uptrend, just like Ken French outlined, and also tend towards sharp reversals in downtrends. With more returns, typically comes more volatility. However, today we are witnessing a relative outperformance of large caps that we haven’t seen since the late 90s.
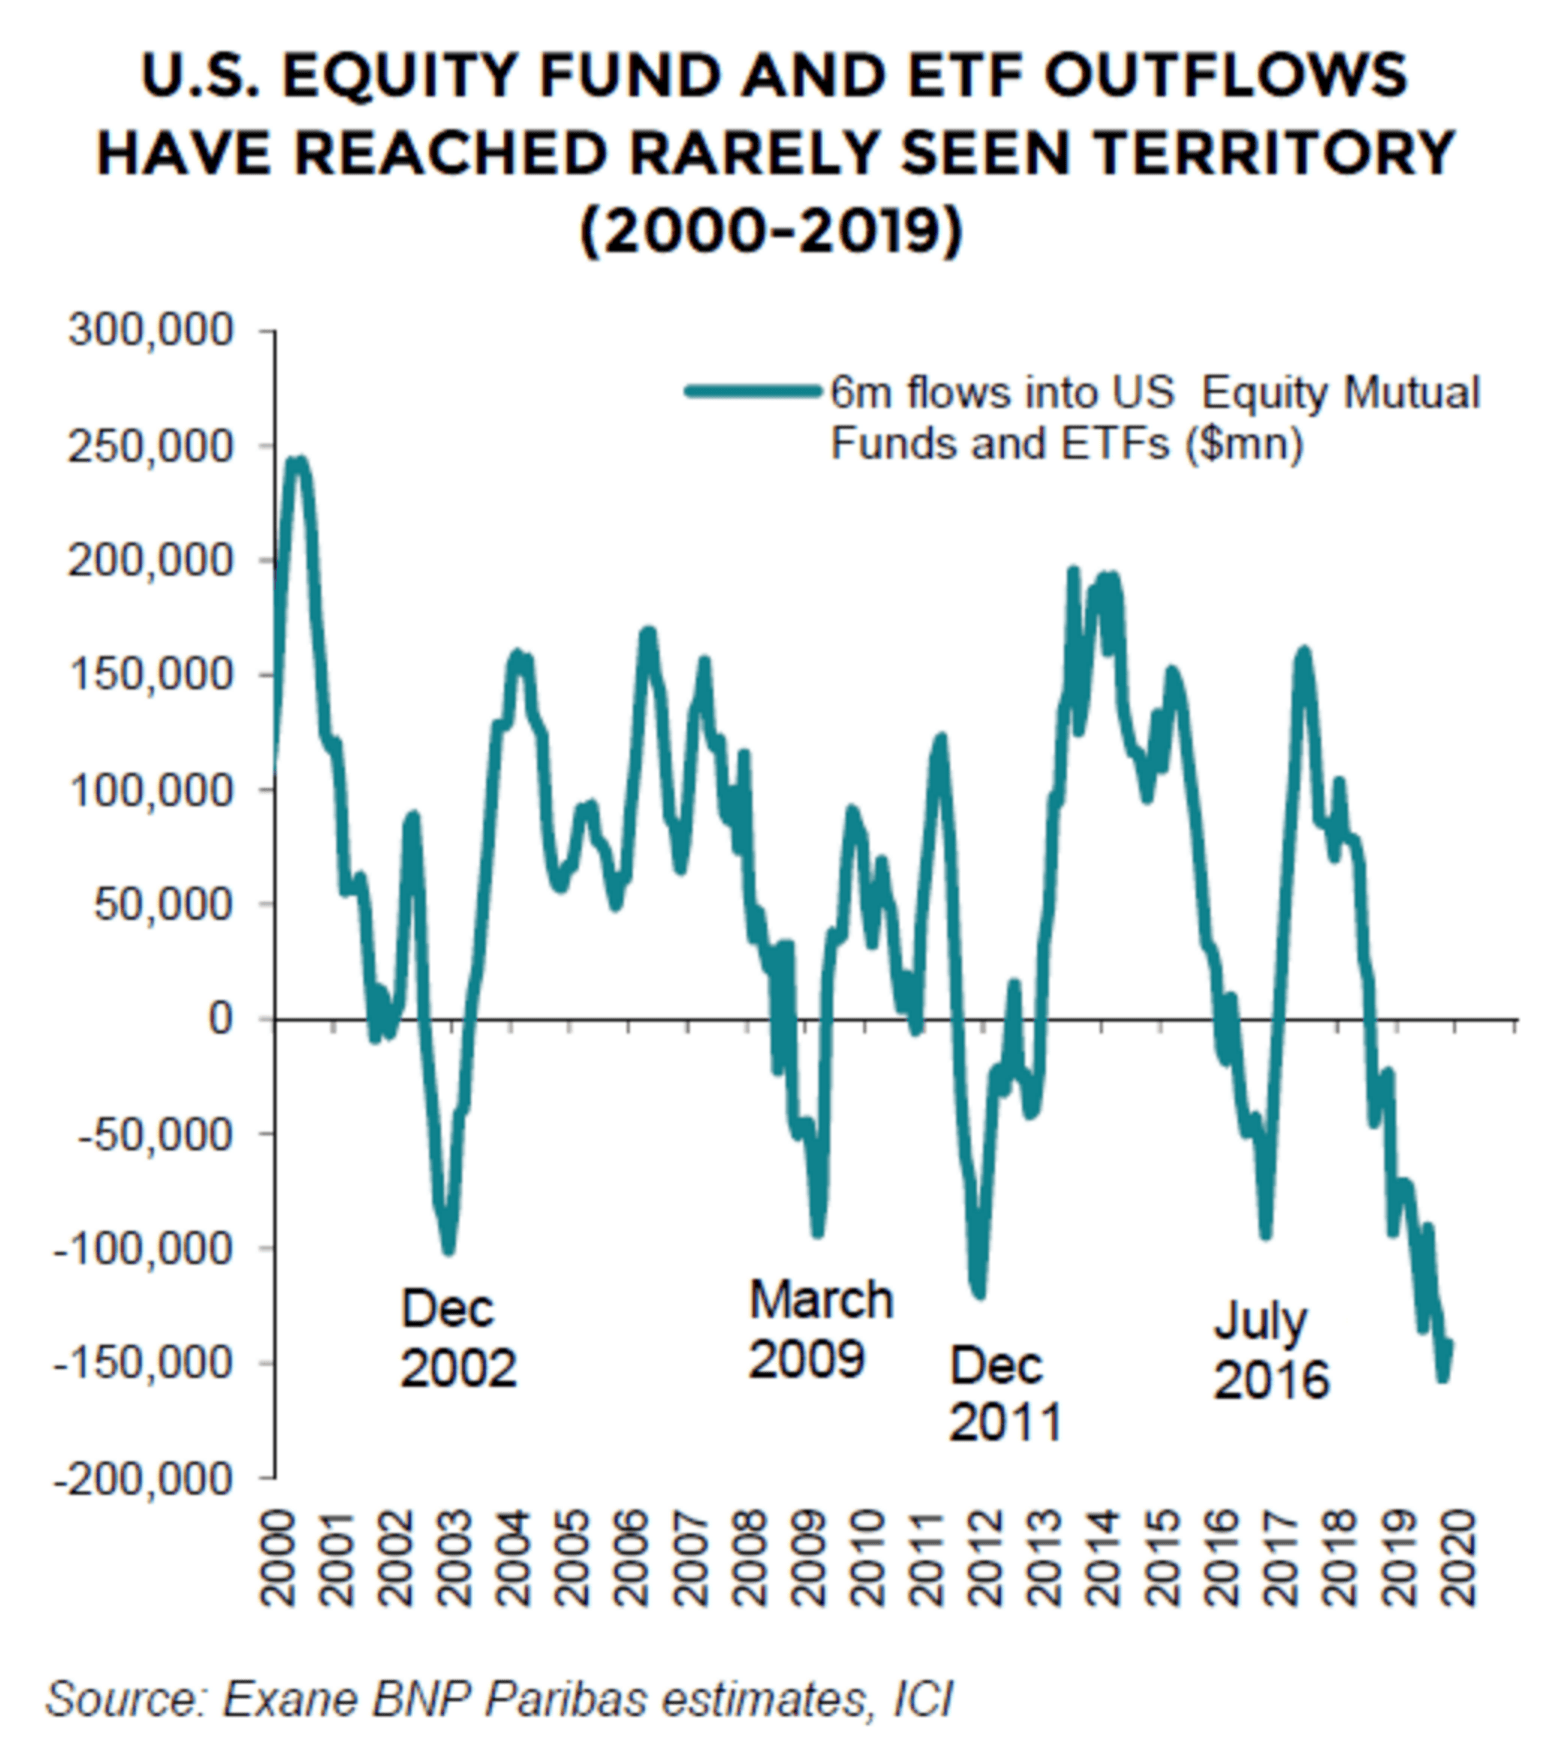
Euphoric emotion disconnected these two markets during the late 90s, while pessimistic emotions disconnected the markets today. The fear of a recession has taken the current market to levels we also haven’t seen since 2008. Mutual Fund/ETF equity outflows are at historic levels, and short interest has run above the historic average. The risk-on trades have been penalized, small caps being one of them.
Today, we are not only entering the season for small caps,but we’re doing so with small caps showing significant under performance relative to the broad market. If the fear of a recession was overblown, then small caps have some catch-up in order to revert to the mean.
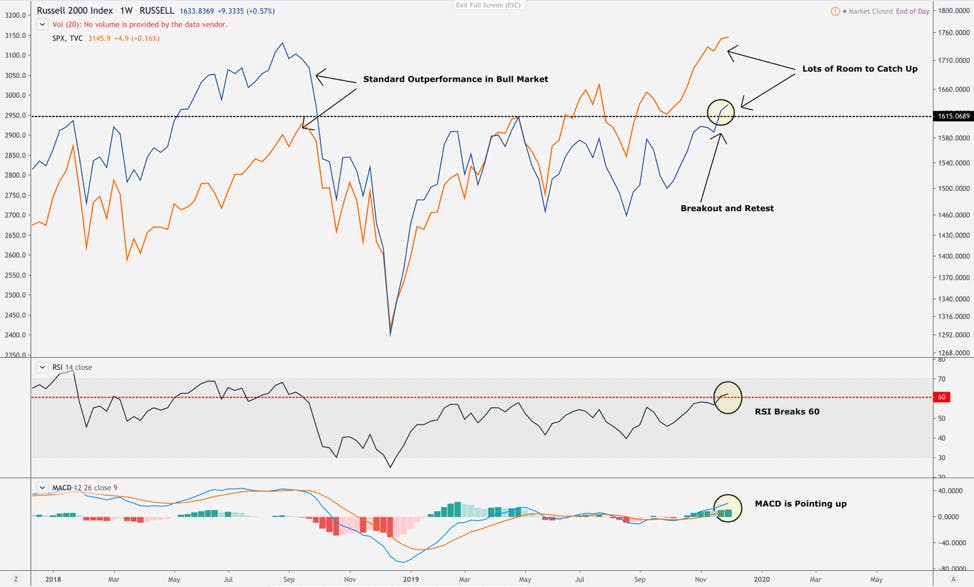
To further build the case, the weekly chart above is showing that the RSI is breaking 60. This is a great sign for building momentum for small caps. In a healthy uptrend, we want to see the RSI above 60 and oscillating above 30 – the higher the oscillation, the healthier.
If we zoom in to highlight the last year, the weekly chart above is showing that small caps are starting to show signs of life. They are breaking above the 60 line on the RSI, the MACD is pointing up, and small caps have broken through their downtrend and closed above the resistance we’ve seen this year. Also, it’s worth noting that small caps are less than 10% away from all time highs.
Review of Our Small Caps (TLRA and WIFI)
Fundamental coverage can be found in PDF form by searching for the stock name.
Boingo Wireless (WIFI)
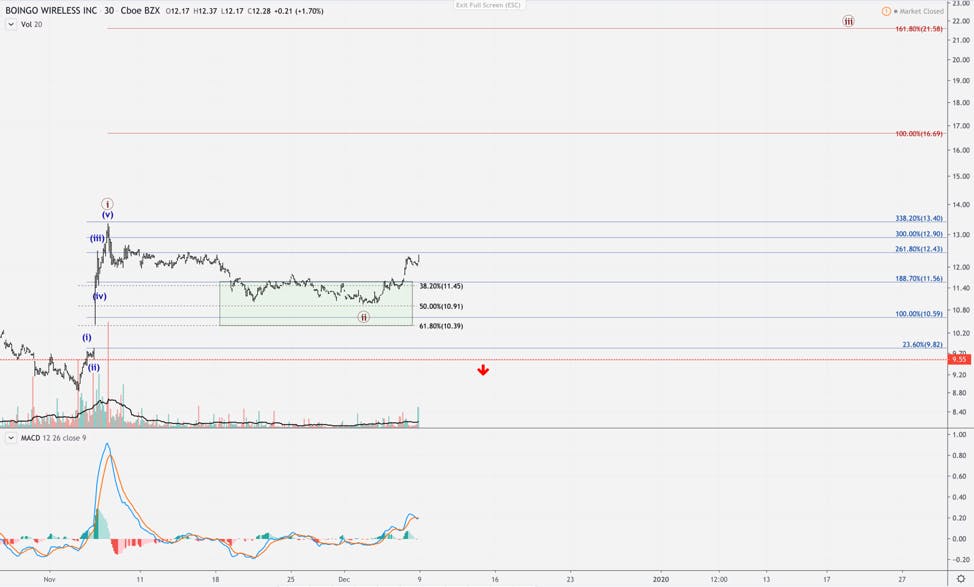
Boingo (WIFI) appears to have bottomed at the 50% retrace, which is ideal for a wave-2 bottom. We have gotten 5-waves off that low, which is also encouraging. It still has some work to do to confirm this uptrend, but so far, the structure is providing us with a 1-2 set-up pointing up. If it is valid, the 3rdwave is typically targeted around the 161.8% of wave-1, which puts us in a much higher region above the blue lines beginning around $13.50 with the potential to climb higher with a breakout.
If you want to go in on WIFI, I’d put a hard stop just under $9.55. Below this level invalidates the set-up and opens the door for more downside before a new uptrend can commence.
Telaria (TLRA)
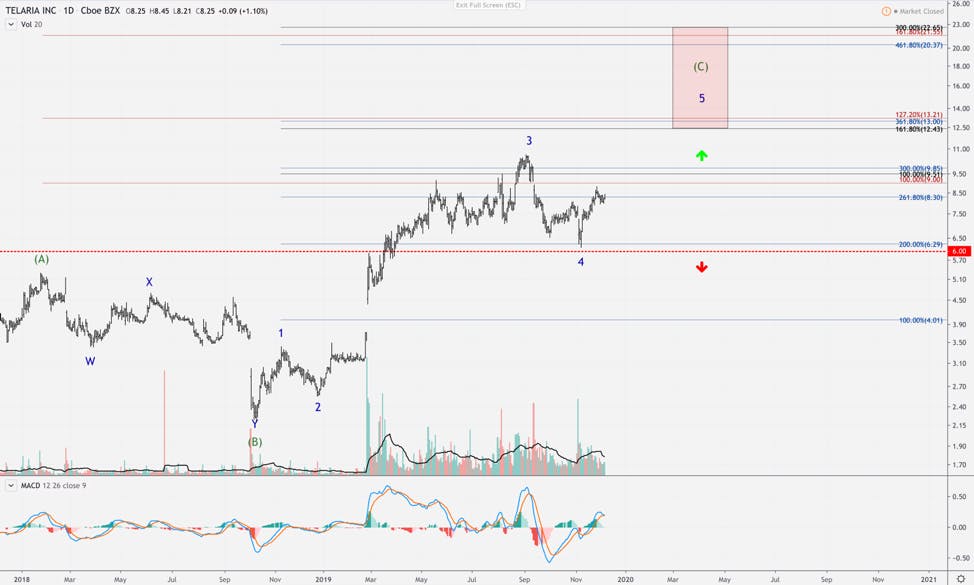
Since we covered Telaria (TLRA), the stock is up about 12%. However, the structure is more ambiguous than WIFI, which is why I’m suggesting a tighter stop. I am leaning toward the more bullish set-up, which has us tagging the range in the red box above. However, we also have a potential 1-2 set-up pointing down. If TLRA closes below $6, this will invalidate the uptrend and suggest further downside.
KEEP IN MIND …
We have been leaning cautiously so far, and are due for a correction. Stocks are stretched as they are, and a correction would be healthy for further gains.
However, with the seasonality of small cap relative strength approaching in December/January, coupled with them breaking out right now, it’s worth acknowledging current set-ups are in place for two of our favorite small cap plays.
The S&P 500 is currently on pace to have one of its best years since 2013 with a return north of 25%. The question on investors’ minds is – will the good times continue, or are we trading at the top? While many are hoping for a melt up or Santa Claus rally, we also saw the market approaching a bottom this time last year with fears of an economic slowdown.
The purpose of this update is to look at both sides of the argument on a deeper level and to provide indicators that we think are notable. First, we’ll explore the bear case, outlining the data points from both the economy and sentiment, which should be factored into any investor’s current game plan. Then we’ll look at the bull case, and finish up with a position update.
SECTION 1: Macro Outlook: Economic Inflection Point
Since the current business cycle began in 2009, we’ve currently had the longest expansion in U.S. history. However, within this expansion, we have had 3 mini-cycles that lasted between three to four years.
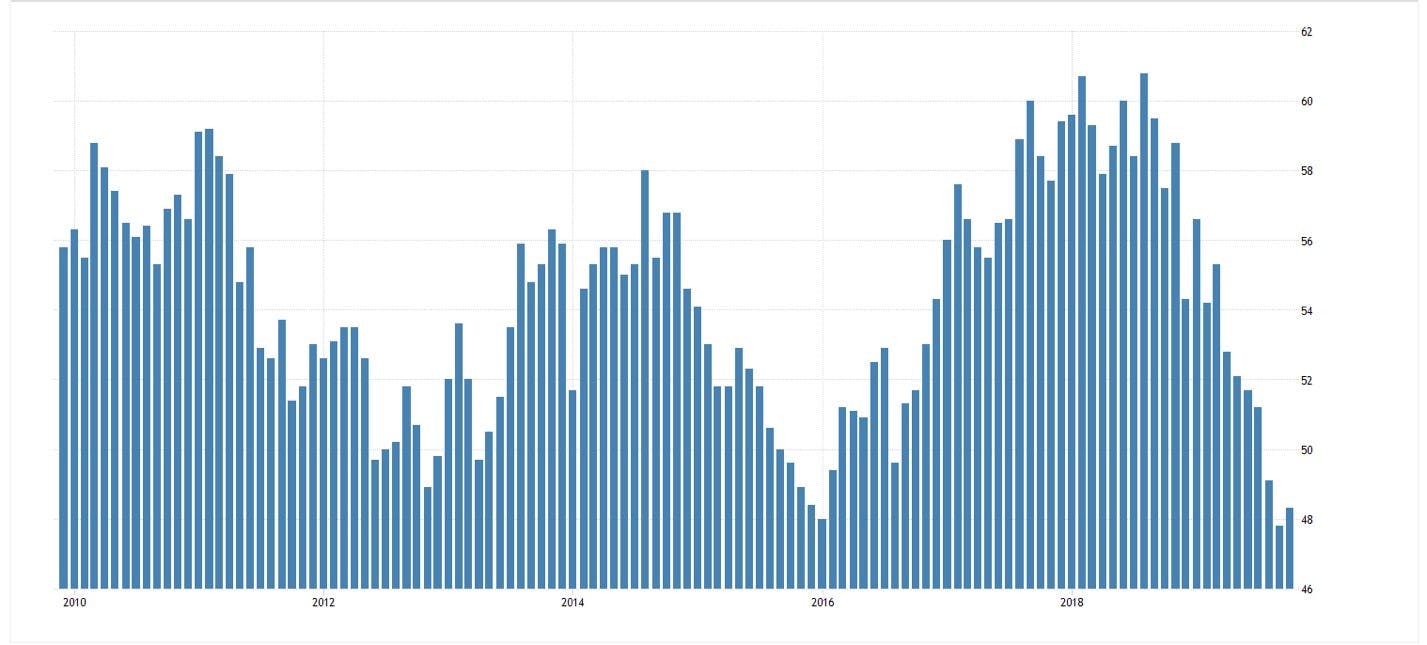
There are a number of ways to show these mini-cycles; however, the PMI over the prior 10 years provides a great visual.
The first cycle started in 2009, was derailed by the European Debt Crisis, and bottomed in 2013. The second cycle began in 2013, was stopped by the crude oil collapse and Brexit, and it bottomed in 2016. The current cycle began in late 2016 and was halted by the trade war, and the Fed’s tightening cycle.
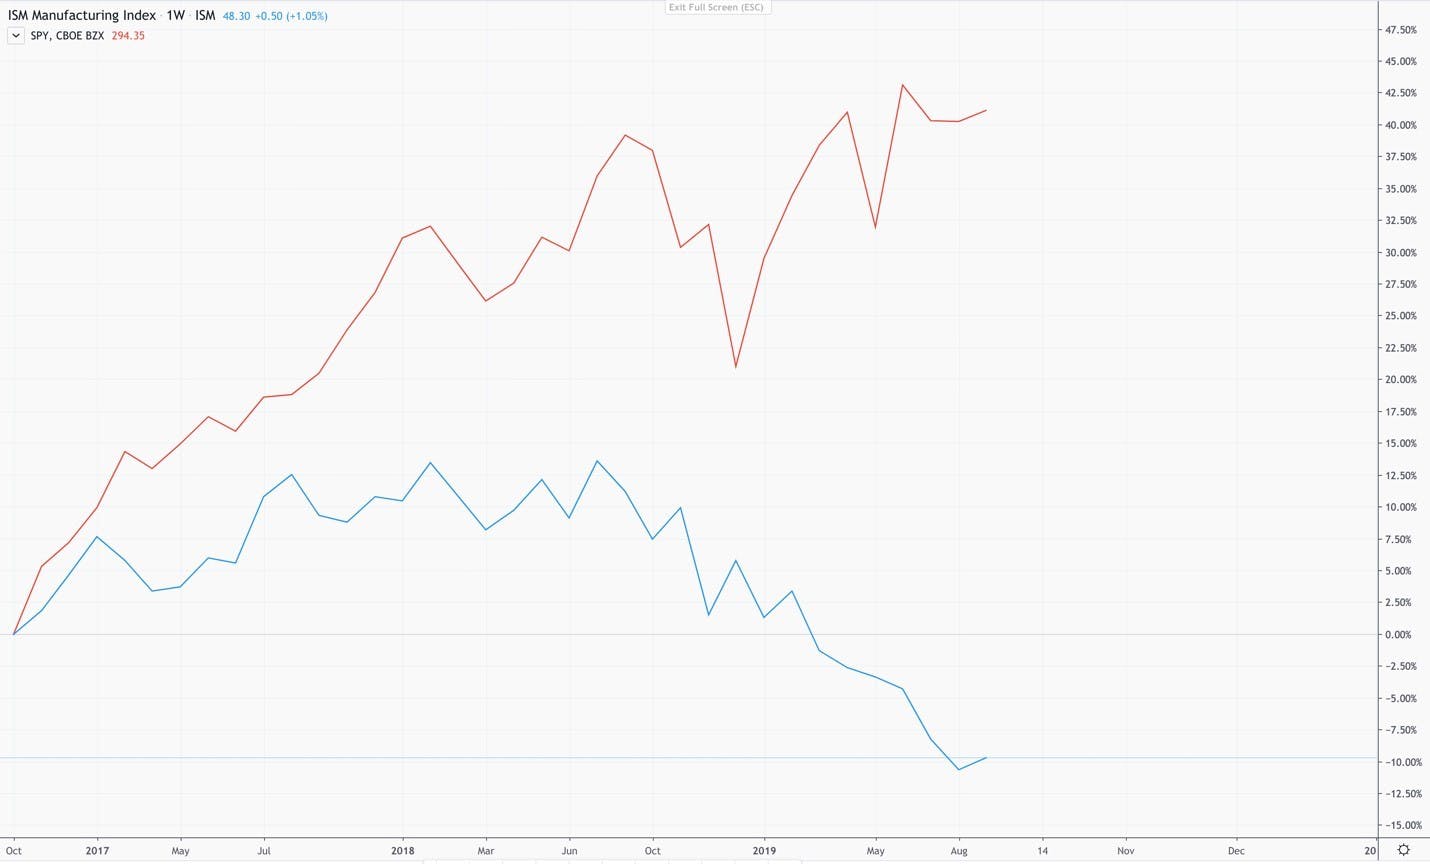
The market is assuming a rebound in economic activity. Equities are always a leading indicator to economic activity, and the market’s answer to the above question is a resounding affirmation for a new mini cycle. The below chart shows the divergence between the ISM Manufacturing Index and the S&P 500.
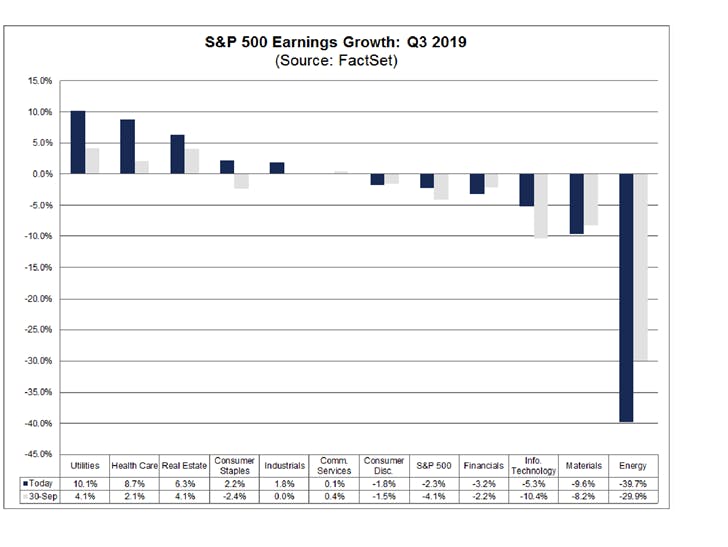
According to FactSet, 75% of the S&P 500 have reported a positive EPS surprise, which is above the five-year average. Total number of companies with sales above estimates is at 60% and is also above the five-year average. This can be misleading as the blended earnings decline is negative 2.3% and is the first time the index has reported three straight quarters of yearover-year declines since Q4 2015 through Q2 2016. It also marks the largest year-over-year decline in earnings since Q2 2016 at negative 3.2%.
FactSet also states that analysts are expecting a decline in earnings in the fourth quarter followed by 5-6% earnings growth for Q1 2020 and Q2 2020. The forward 12-month P/E ratio is 17.5, which is above the five-year average and above the 10 year average.
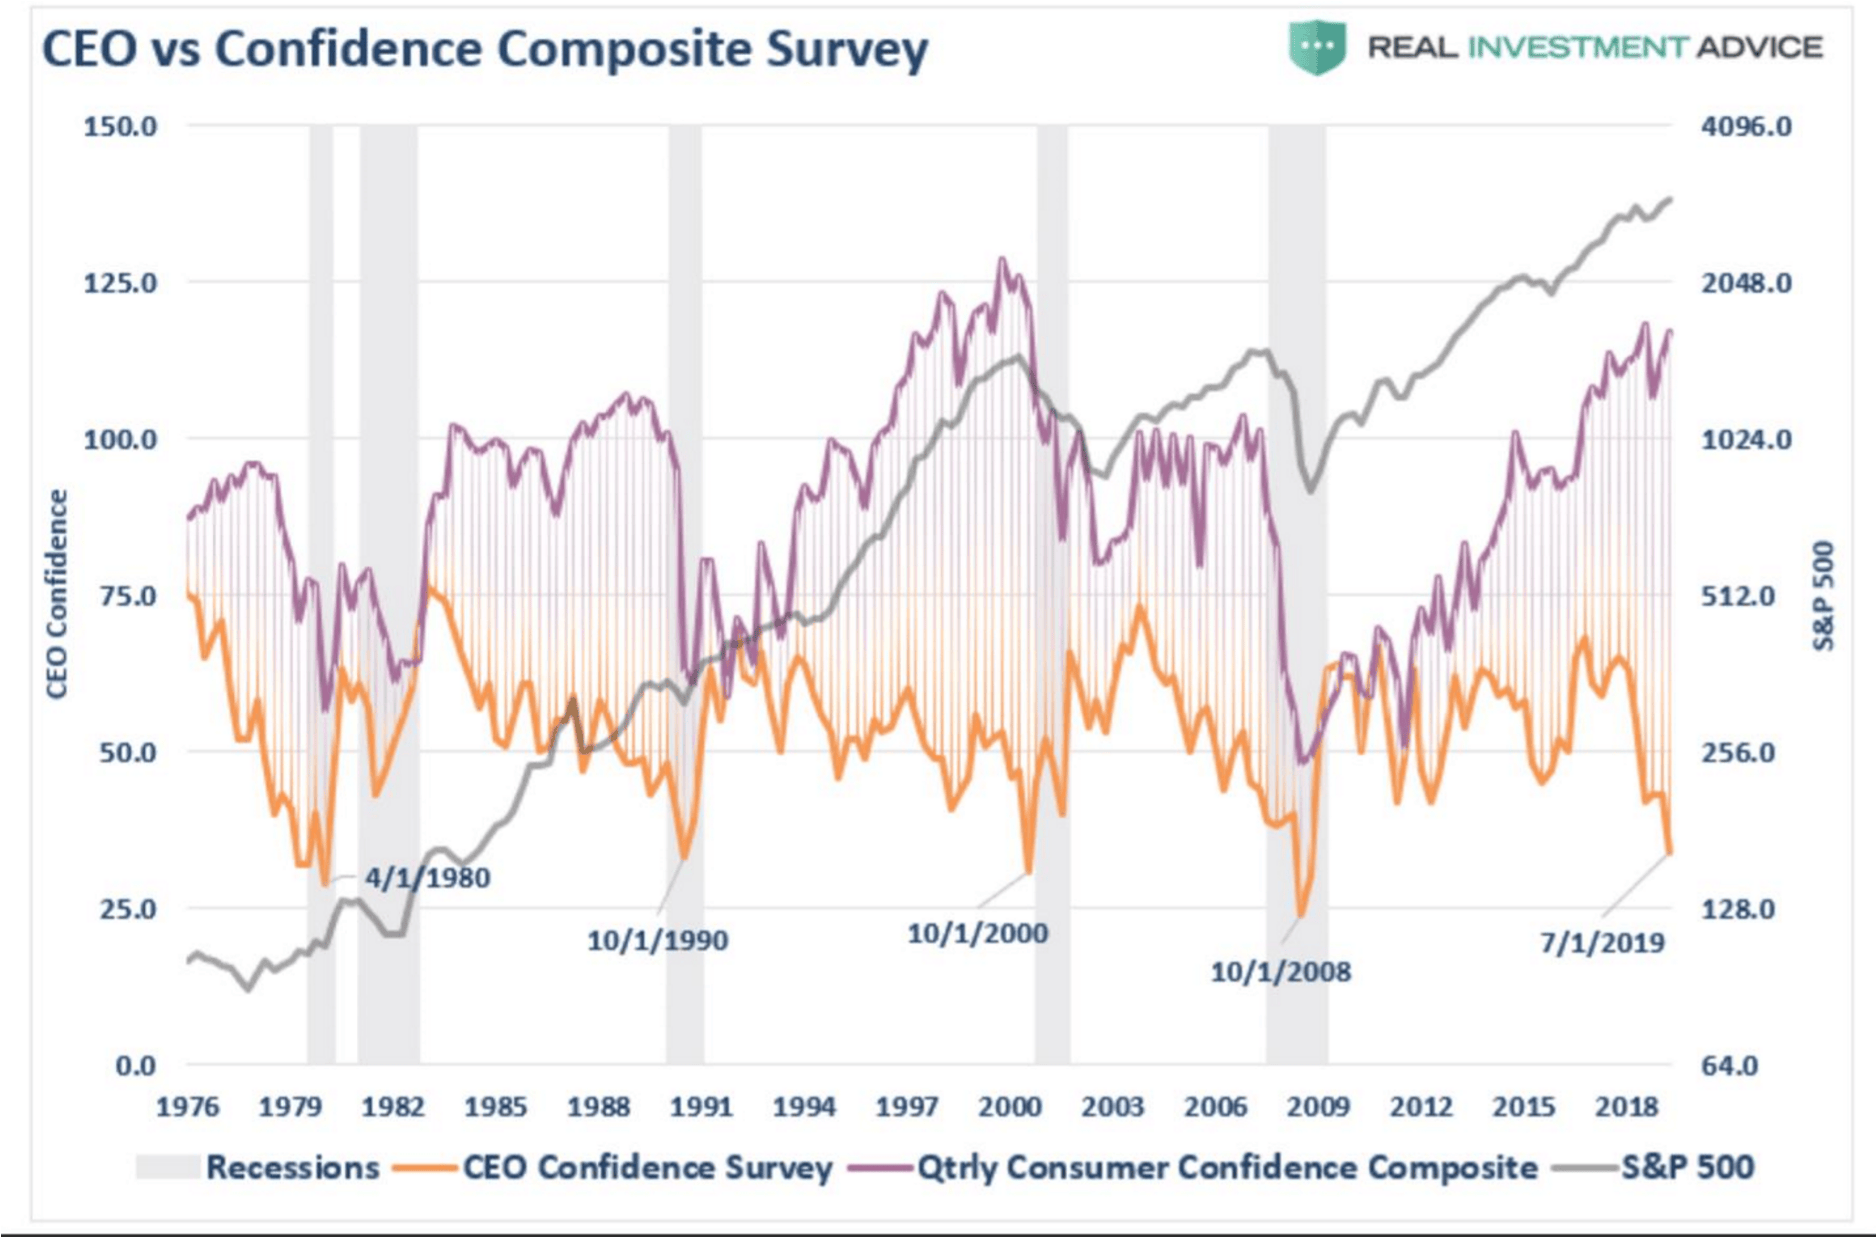
The above graph is important to consider. The orange line represents a collective of CEO confidence about the state and future prospects of the economy. The purple line represents how the average consumer feels about the state of the economy and its future. The grey line is the return of the S&P 500. The shaded gray bars represent recessions.
What’s notable is that the orange line consistently diverges downward long before the consumer realizes what is happening. Meanwhile, CEOs are paid very large salaries to forecast business revenue. CEOs are also experts in their sector of the economy, so it would make sense that CEO sentiment would precede economic slowdowns rather than consumer sentiment (which would react). They are our best insiders to the health of financials.
It’s also worth noting that consumer confidence peaks just before a recession, indicating exuberance for the economy before it reverses sharply. Today, there is a sharp divergence between CEO and consumer confidence. This divergence has historically taken years to unwind, but it’s worth monitoring that consumer confidence is at a cyclical high while CEO confidence is at a cyclical low.
SECTION 4: Technical Warnings – breadth signals
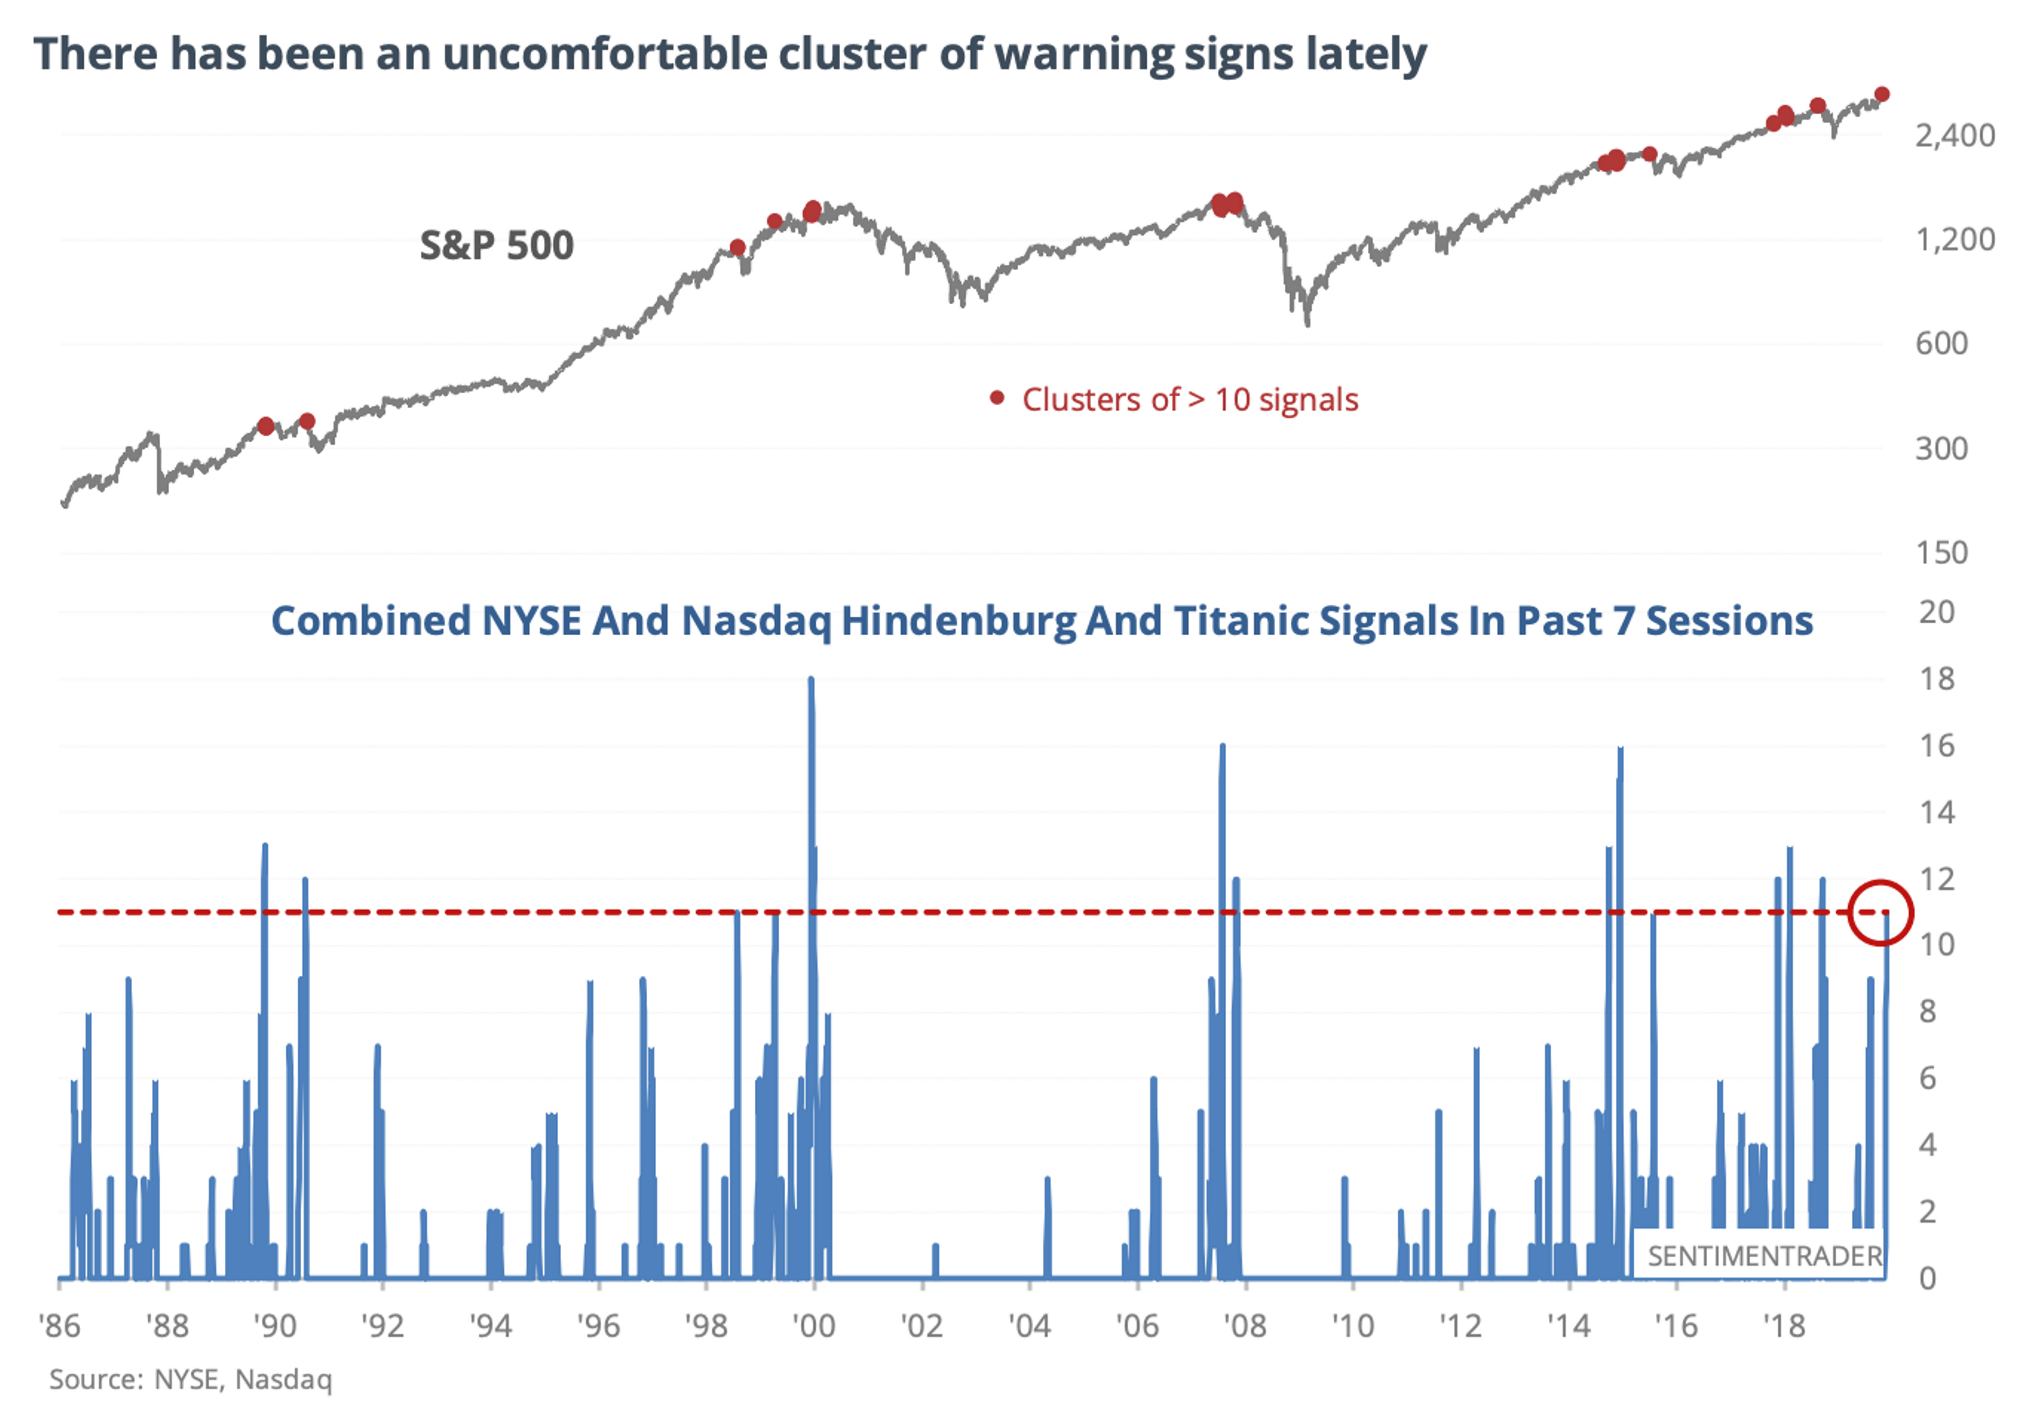
Over the last couple of weeks, we’ve had an unusual number of breadth warnings, which basically monitor the number of stocks participating in the rally.
There are 2 popular signals that have been good harbingers of, at minimum, a large correction in the past – the Hindenburg Omen and Titanic Syndrome. We have seen a cluster of such signals trigger ranging over the NYSE and NASDAQ. In fact, we had an extremely rare occurrence where seven Hindenburg Omens triggered in a row on the NASDAQ recently.
The below chart was comprised by Jason Goepfert of Sentiment Trader, and it shows the instances going back 30 years where we had a combined 10 signals over 7 sessions between the NYSE and NASDAQ. The red dots show when these occurrences happened.
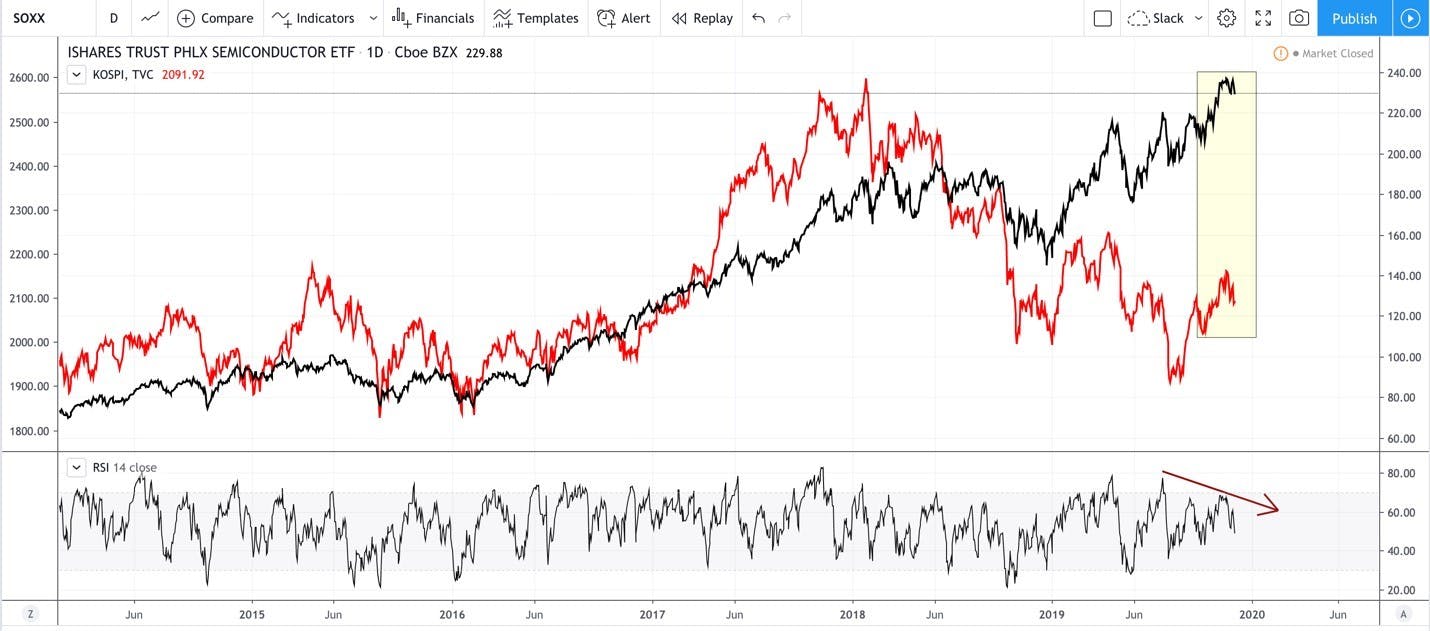
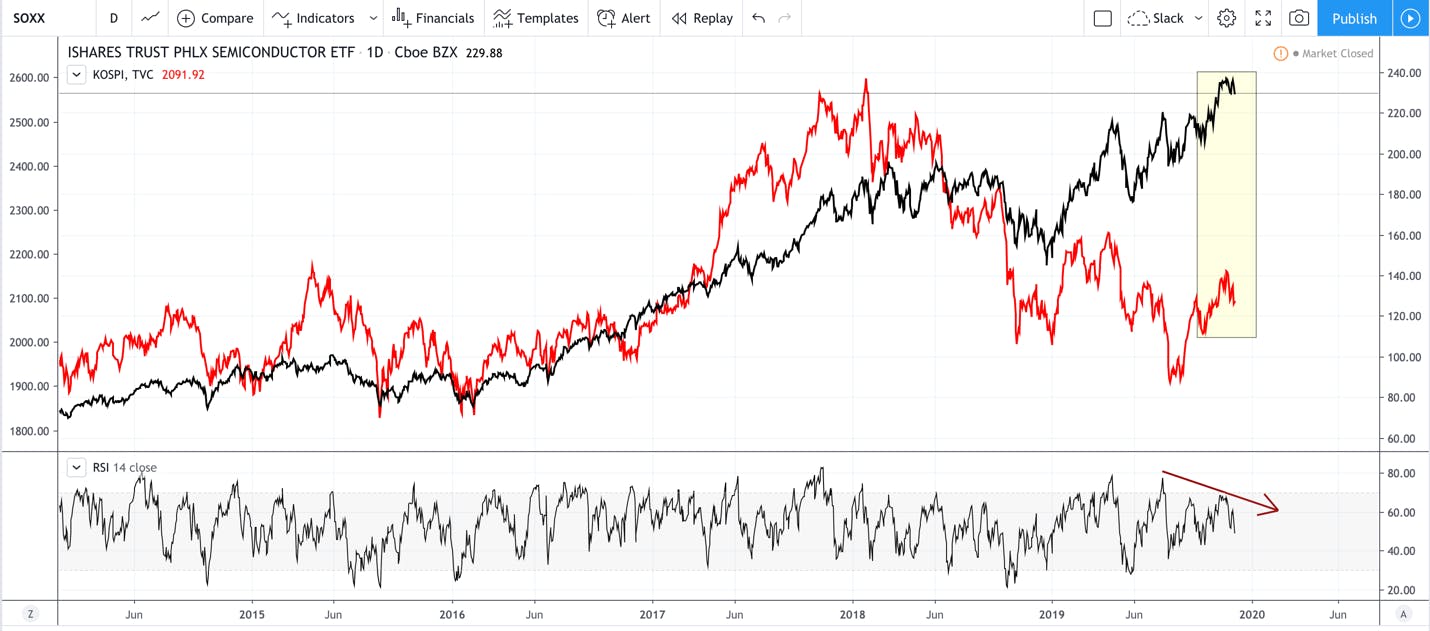
The above chart is showing the Philadelphia Semiconductor Index (SOXX) compared to the South Korean Kospi Index. South Korea is an economy that is fueled by some of the world’s largest semi-conductor companies, as well as many mid-level players. Companies such as Samsung, and SK Hynix supplied over 60% of the components used in memory chips sold globally in 2018. So, the KOSPI can provide more information about the global health of semiconductors.
As you can see, these indexes are typically correlated. Today, we are seeing the widest divergence between the U.S. semiconductor index and the Kospi. This suggests that one of these indexes will need to correct, and a divergence like this amongst highly correlated stocks rarely lasts.
SECTION 6: Macro Outlook: Risk-on Assets are Breaking Out
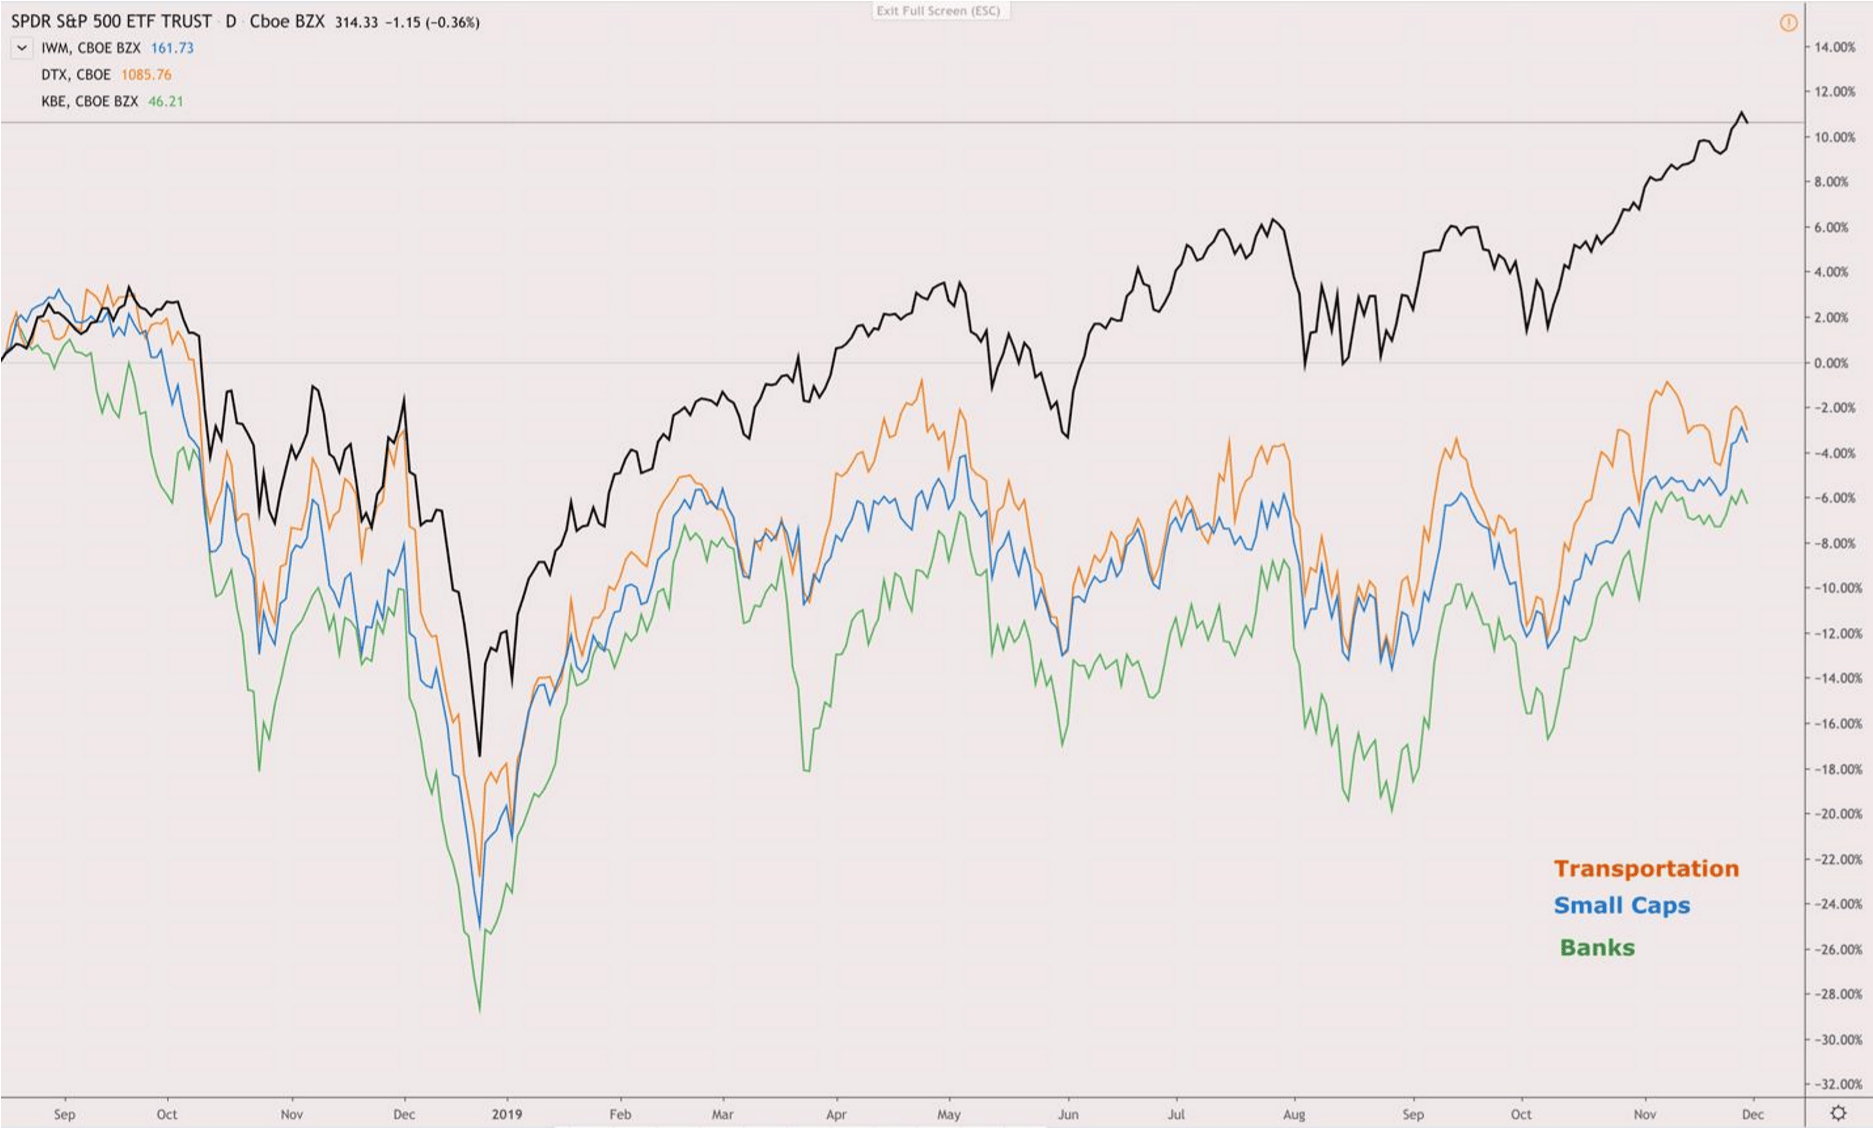
On a more positive note, looking back through the most recent market rebound starting in late December of 2018, there has been a number of divergences between risk on assets and the market. In other words, we saw classic risk off assets like gold and treasuries going up with the market.
Also, transportation stocks, small caps and financials were not participating in the recovery. This is important because these sectors indicate a growing economy, which is necessary for a continued market breakout.
Recently, small caps and financial broke out to all new highs. This is important, because it’s showing that economically sensitive segments of the economy are beginning to participate. Transportation stocks are still lagging, trending up and are not far from new highs.
SECTION 7: Housing
On another positive note, due to lower rates and easy money, housing has rebounded and doing quite well. We simply do not typically see housing report numbers like we are seeing today when a recession is on the horizon.
For example, New Home Sales are up +733,000 – best since 2007. Existing Home Sales Prices are up 6.2%. Building permits are up 5%, which is the best we’ve seen in 12 years. The Case-Shiller tracks 20 cities, and only San Francisco saw a year-overyear decline.
SECTION 8: Federal Reserve Policy
On October 8th, the Fed indeed announced they would begin expanding their balance sheet by buying $60 billion in treasury bills per month starting on October 15th and extending until at least mid-2020. They have injected hundreds of billions of excess capital into the system through a new on-going operation that they insist is not QE, but looks exactly like it. The reason for the actions is not as important as the results, which are higher asset prices for the time being.
This marks the end of the balance sheet shrinking. Over the past several weeks, the balance sheet increased by $324 billion, now exceeds $4 trillion and growing, which is four times higher than pre-crisis levels. At this pace, by mid-2020, we will likely be at new highs for the balance sheet.
We are currently seeing record outflows from equity mutual funds and ETFs. This may seem counterintuitive with prices at all-time highs; however, this chart isn’t showing an exit from equities, just the mutual fund and ETF flows, which are predominantly the results of average investors and historically reflects the herd sentiment.
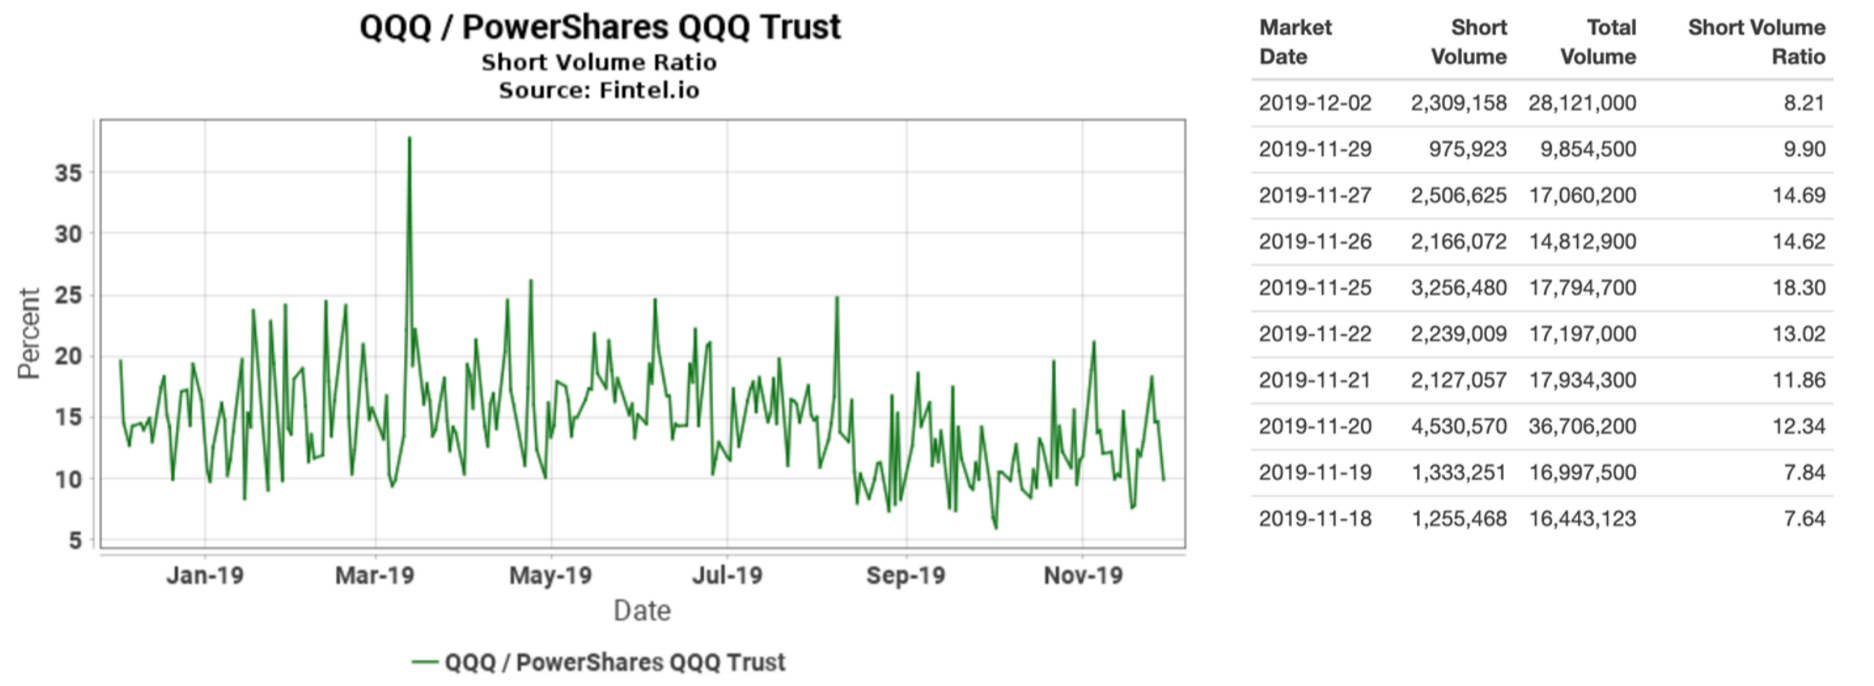
Furthermore, we are seeing very high short ratios in the NASDAQ (QQQ), which is also playing out across other major indexes.
The above chart shows that last week, between 12%-18% of all shares traded in the QQQ ETF, which tracks the NASDAQ, were short positions. This is an unusually high level of short interest, and this trend can be seen across the NYSE and S&P500 as well. The graph further shows that this trend has continued for most of 2019.
It may seem counterintuitive that high levels of short interest can be a bullish sign, but if the index fails to breakdown, this will cause the shorts to cover their positions, in turn, pushing the index up. Short covering can move stocks and an index in meaningful ways.
When we see a high level of short positions being taken across major indexes coupled with record level outflows in mutual funds and ETFs, it’s a contrarian indicator that stocks may have more upside in the near future.
In conclusion, these data points show that the case for the bulls and bears is equally strong today. Be careful of confirmation bias. If the market continues to move up, we will look to participate with tighter stops than we would normally do in a market with fewer warning signs.
SECTION 10: PORTFOLIO UPDATES
You can access the PDFs for these stocks that cover the fundamentals in-depth by clicking on the headlines below.
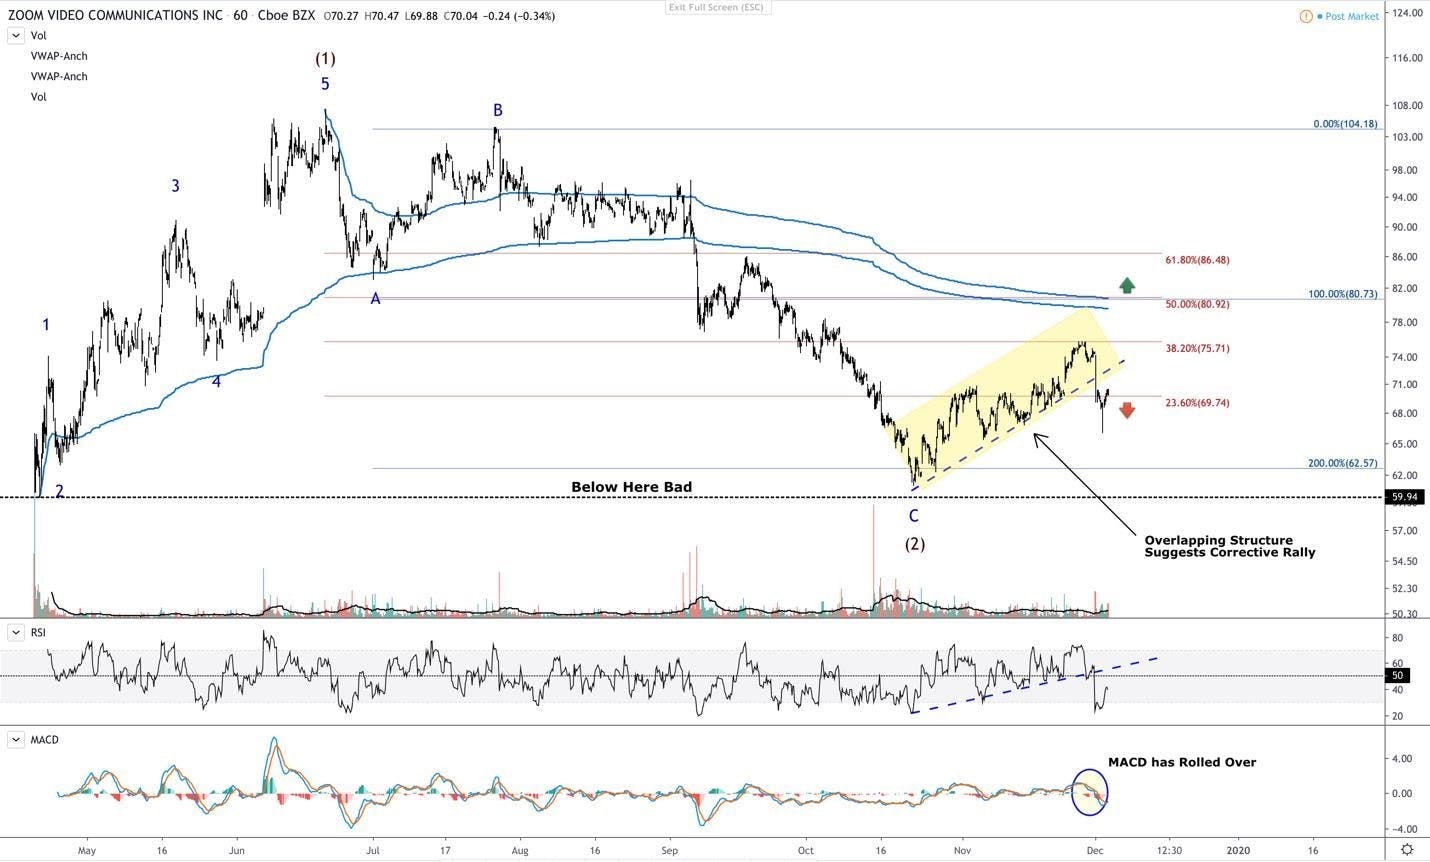
Zoom retraced to its initial IPO price. It held and is now in an uptrend. The uptrend is overlapping, so it’s hard to get excited just yet. Also, it broke its new trend line to the downside on both price and RSI, confirming that the recent uptrend was corrective. I’m expecting more downside from ZM, will look to add in the mid to low $60s with a stop just below $59.90.
Zoom is also below its VWAPS, anchored at the all-time high and low, indicating that the bears are still in control. If ZM can break above the 50% retrace and its VWAPS, it’s a strong indication that ZM could see new highs. If you do want to play the long side today, I’d hold a stop just below its all-time low around $59.90.
Please keep in mind, Beth likes the fundamentals of Zoom as it’s growing 78% year-over-year from $330 million in annual revenue to an estimated $587 million-$590 million with gross profit margins in the 70-80% range. The company is profitable, which is rare among its SaaS peers. The business model has a viral mechanism, which helps drive adoption and retention. The valuation is high, as Zoom has the highest enterprise value to sales of any company over $500 million, and this is the company’s primary weakness.
Microsoft
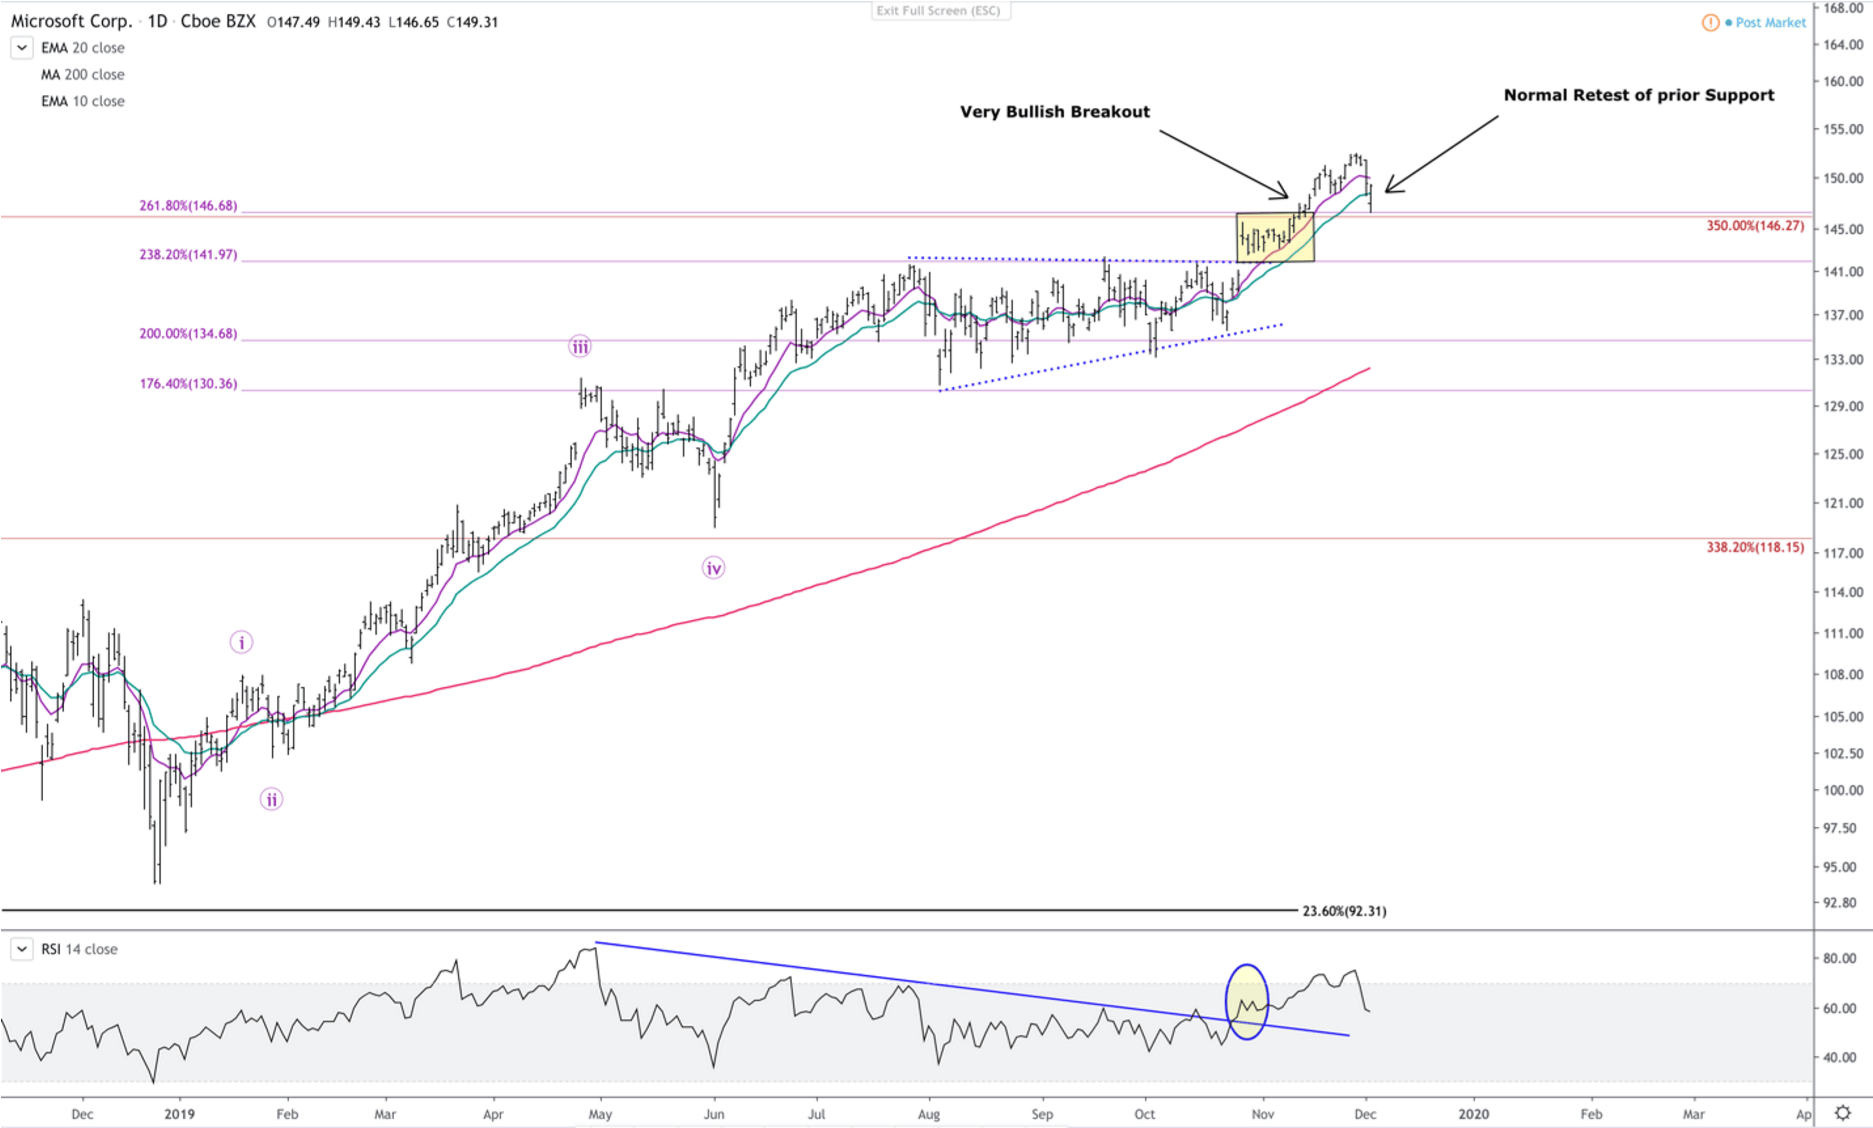
MSFT was stuck in a multi-month consolidation range, while its cloud counterparts saw drawdowns. The RSI exhibited a coiling pattern while price elevated, indicating that it was preparing to make the next leg up. We then had a clear break out with both price and the RSI. It has commenced on the next leg up, trading above its 10-day EMA. A breakout like we see above is usually an indication of more upside.
We’re seeing a retest of prior support levels, which are currently holding. My current stop for this position is at $128.50.
As Beth has covered extensively, the market is underestimating the importance of hybrid cloud, which is where Microsoft concentrated their efforts and why the company won the Pentagon contract. These distinctions are important as cloud infrastructure is expected to grow from $73 billion in 2019 to $166 billion in 2024.
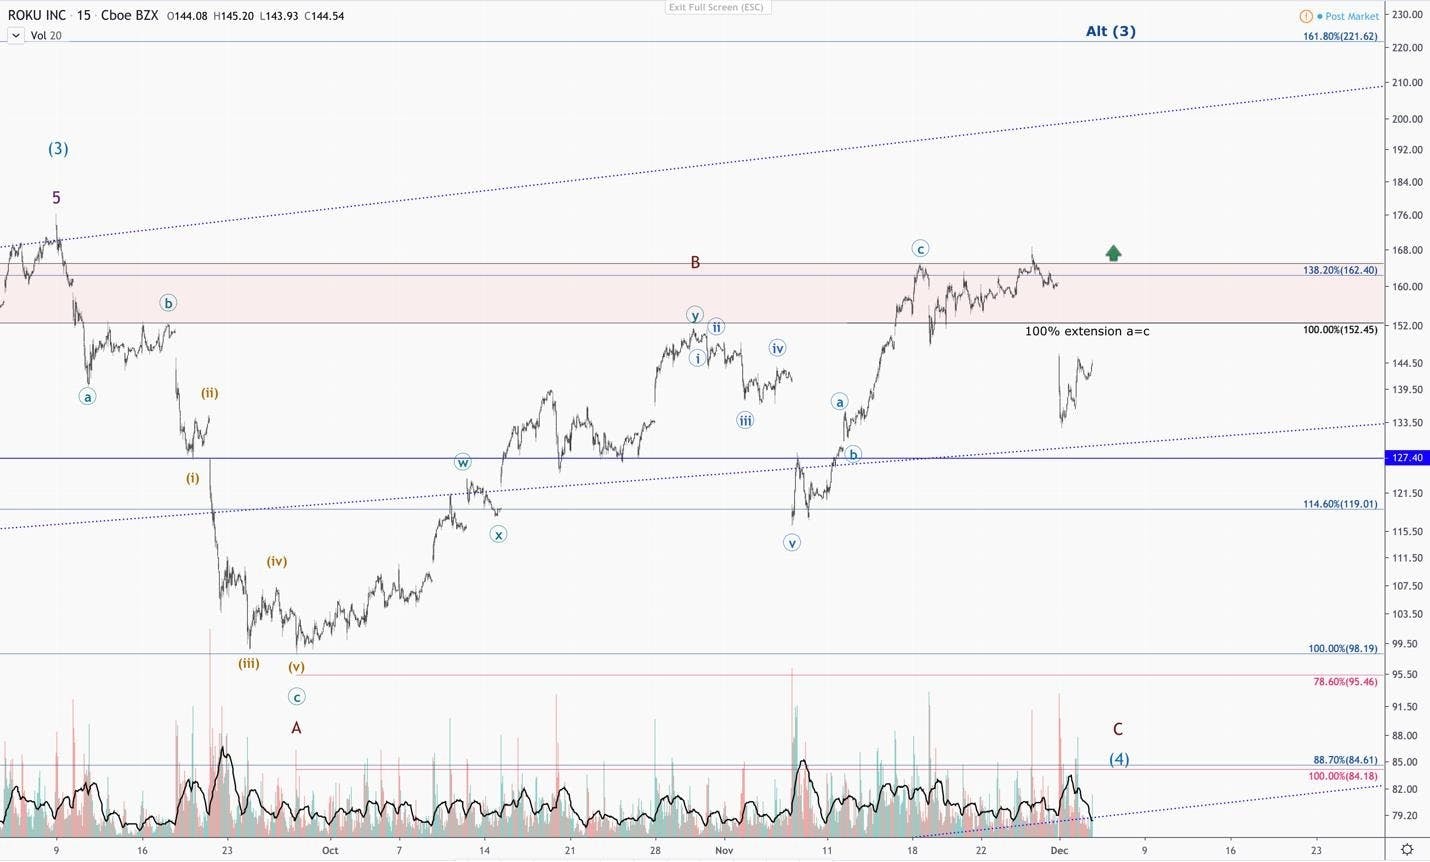
The $162-$165 region has been problematic for Roku in the past, and we saw evidence of this again this week. My primary count still has Roku seeing more downside, but I will scrap that for the alt count if Roku can push above the current region. If it can break above this region with heavy volume, my next target is in the $220 region. Roku is a classic momentum play until we have a larger market correction, so tight stops that move up with the gains will be crucial.
Buying Roku between $120 to $162 has proven to be a gamble, and something we cautioned against in previous analysis. Buy-and-holds should look under $120 with the $100 mark being a steal.
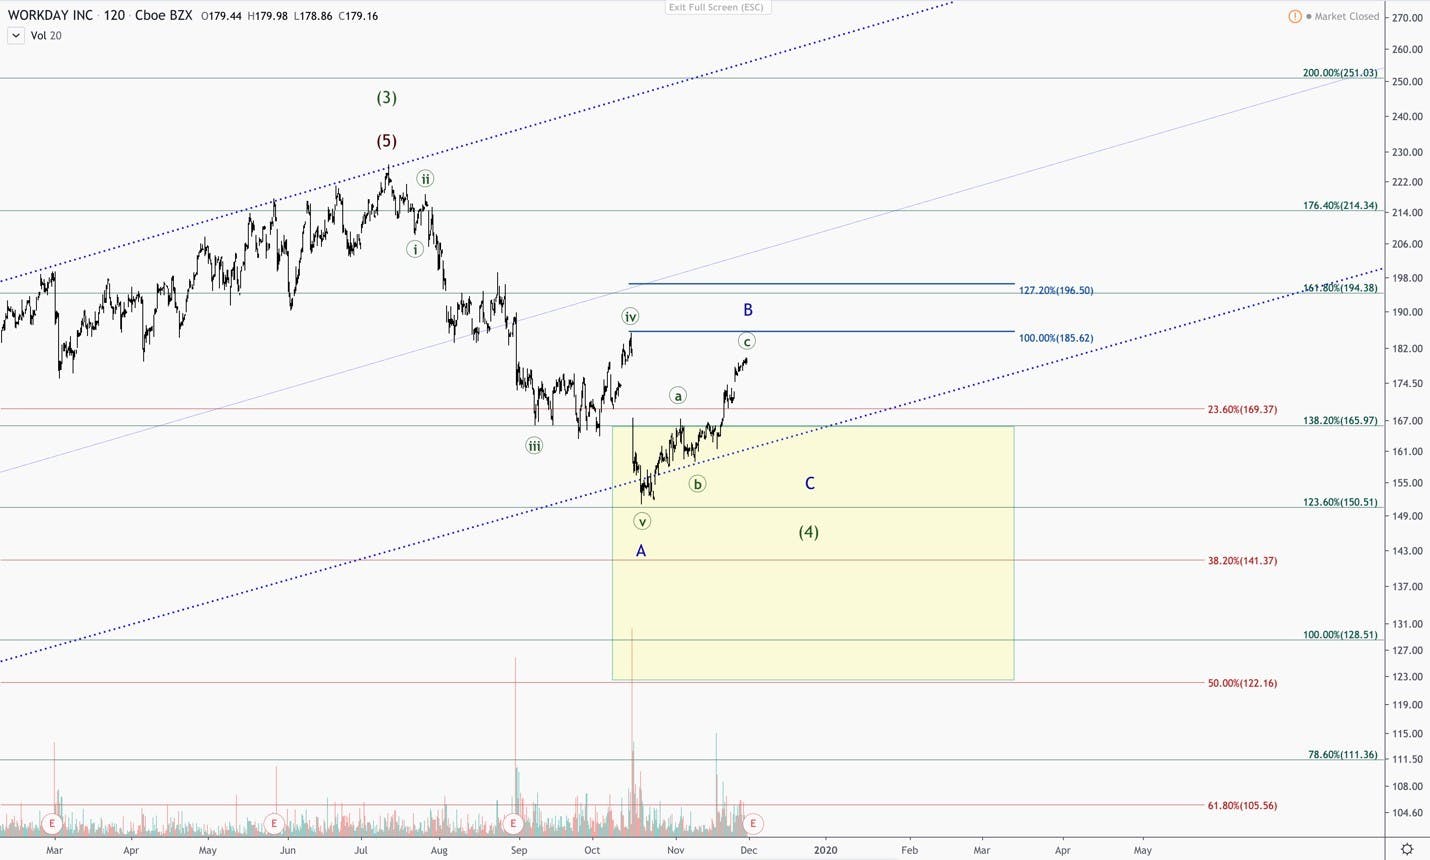
After hitting our stop, Workday then hit the upper mid our target zone for Wave 4, and the structure off the bottom is promising. It’s approaching heavy resistance, with fading volume and momentum. I favor more downside, before a breakout and have started layering in some longs. I will look to add on the next pullback, or if it breaks out, signaling a renewed uptrend.
Fundamental snapshot: Workday has beaten analyst estimates for twelve quarters in a row, and did again today. The company has not missed sales expectations since early 2014, according to FactSet. After adjusting for stock-based compensation, the company reported earnings of 53 cents per share, up from 31 cents per share in the same-quarter last year. Analysts had expected 37 cents per share on sales of $921 million, according to FactSet.
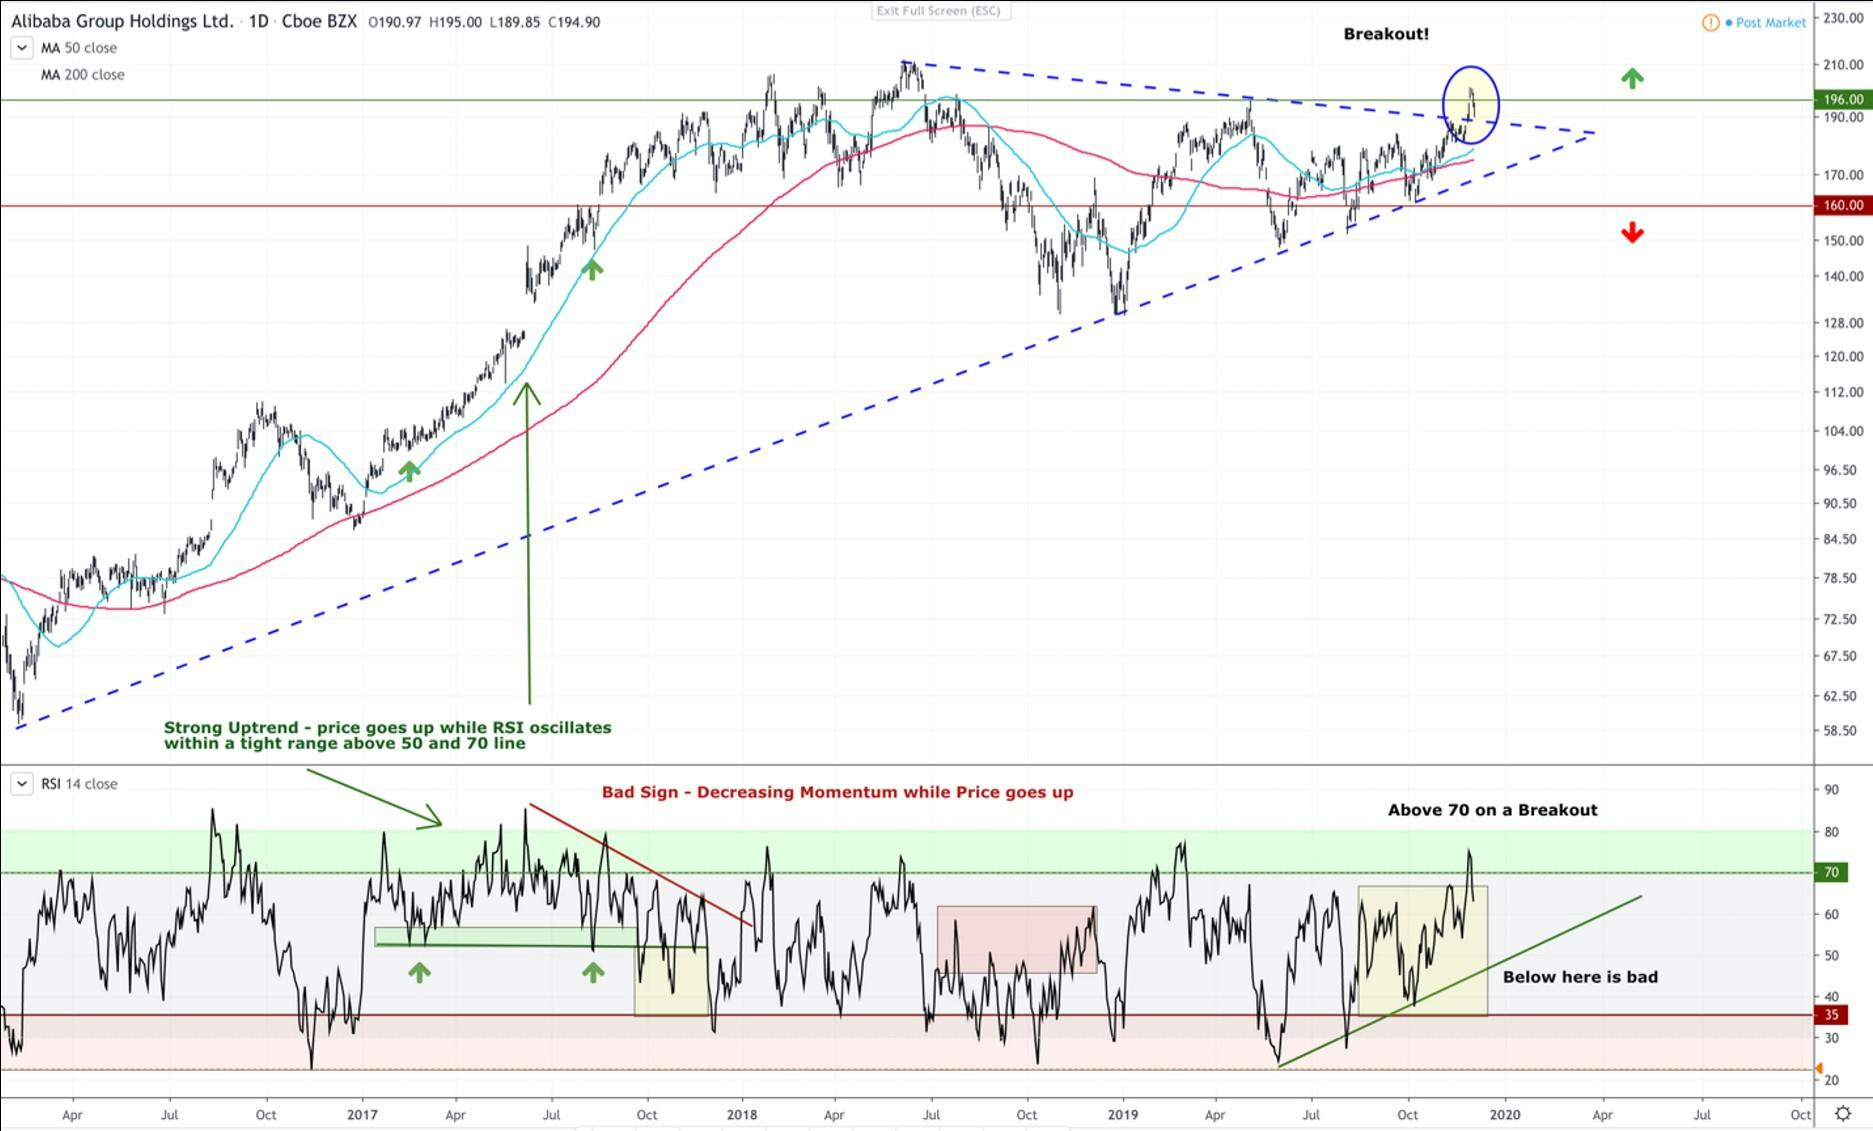
Alibaba finally broke out of its year-long triangle pattern that we outlined twice over the months. The RSI broke into new bullish levels as Alibaba closed above $200. This is what we were hoping for when we wrote our analysis on the stock.
Today we are seeing a retest of the upper wedge range with a close above the support. I will be adding to my position in any market weakness. For the new shares that were added, hold a stop just under $160 or close out for 13-15% gains.
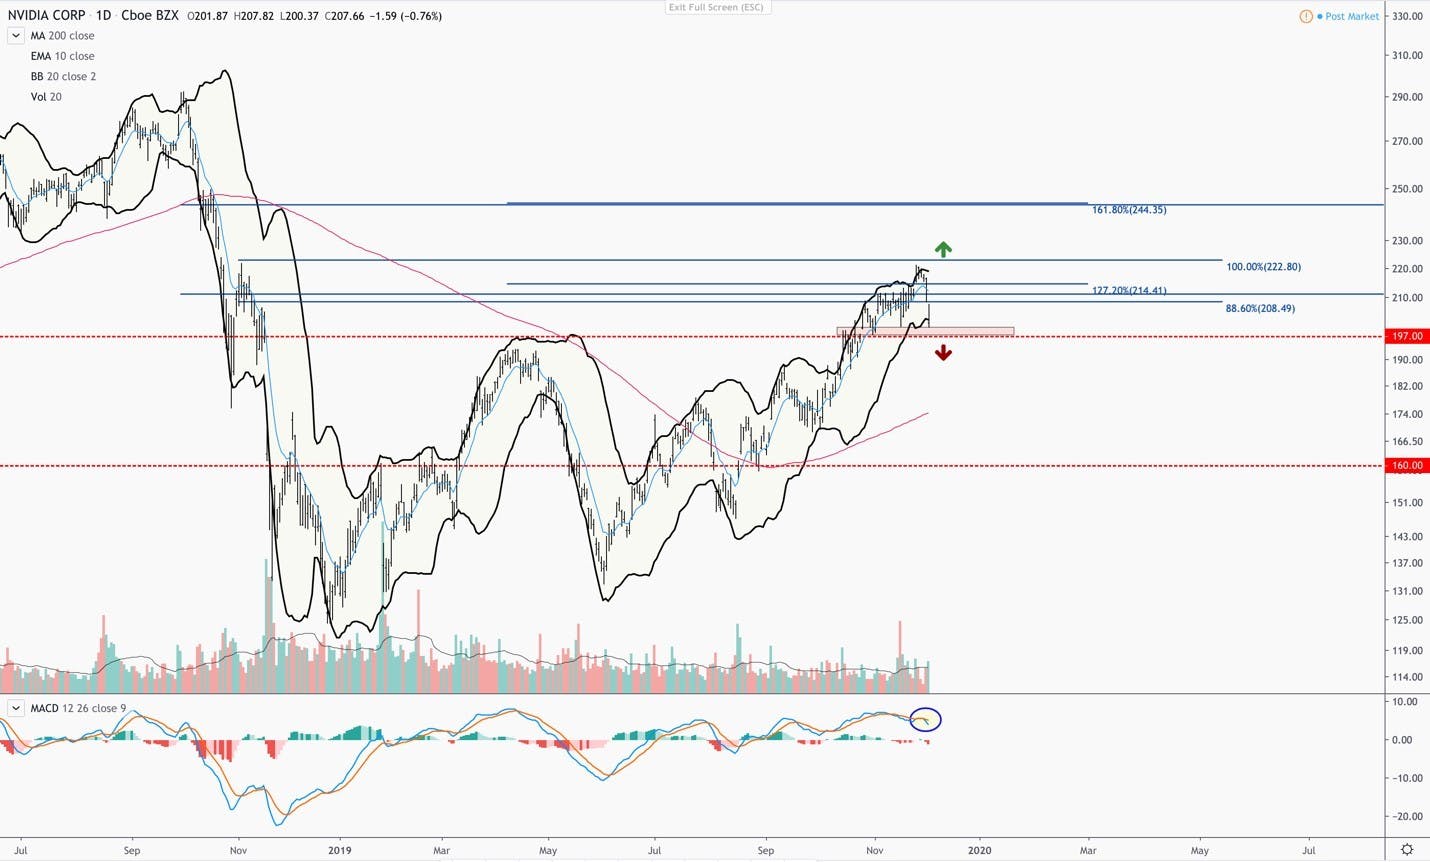
Nvidia has been in a strong uptrend ever since breaking the $190-$200 resistance region we outlined in the prior report. It has broken through $200 with heavy volume, which favors the bullish scenario outlined.
The above chart shows Fibonacci price regions that will act as resistance for Nvidia to break. The $222 region has been important for Nvidia in the past, and it appears to have failed just under this level with a sharp reversal that broke through the base of its Bollinger Band. It found support at $200, with heavy volume coming into support this price. In short, we are range bound until one of these levels breaks. Below $197 and we could see a retest of the 200-day. My current stop for new positions is at $160. Anything close to this region should be considered a buy for long term investors.
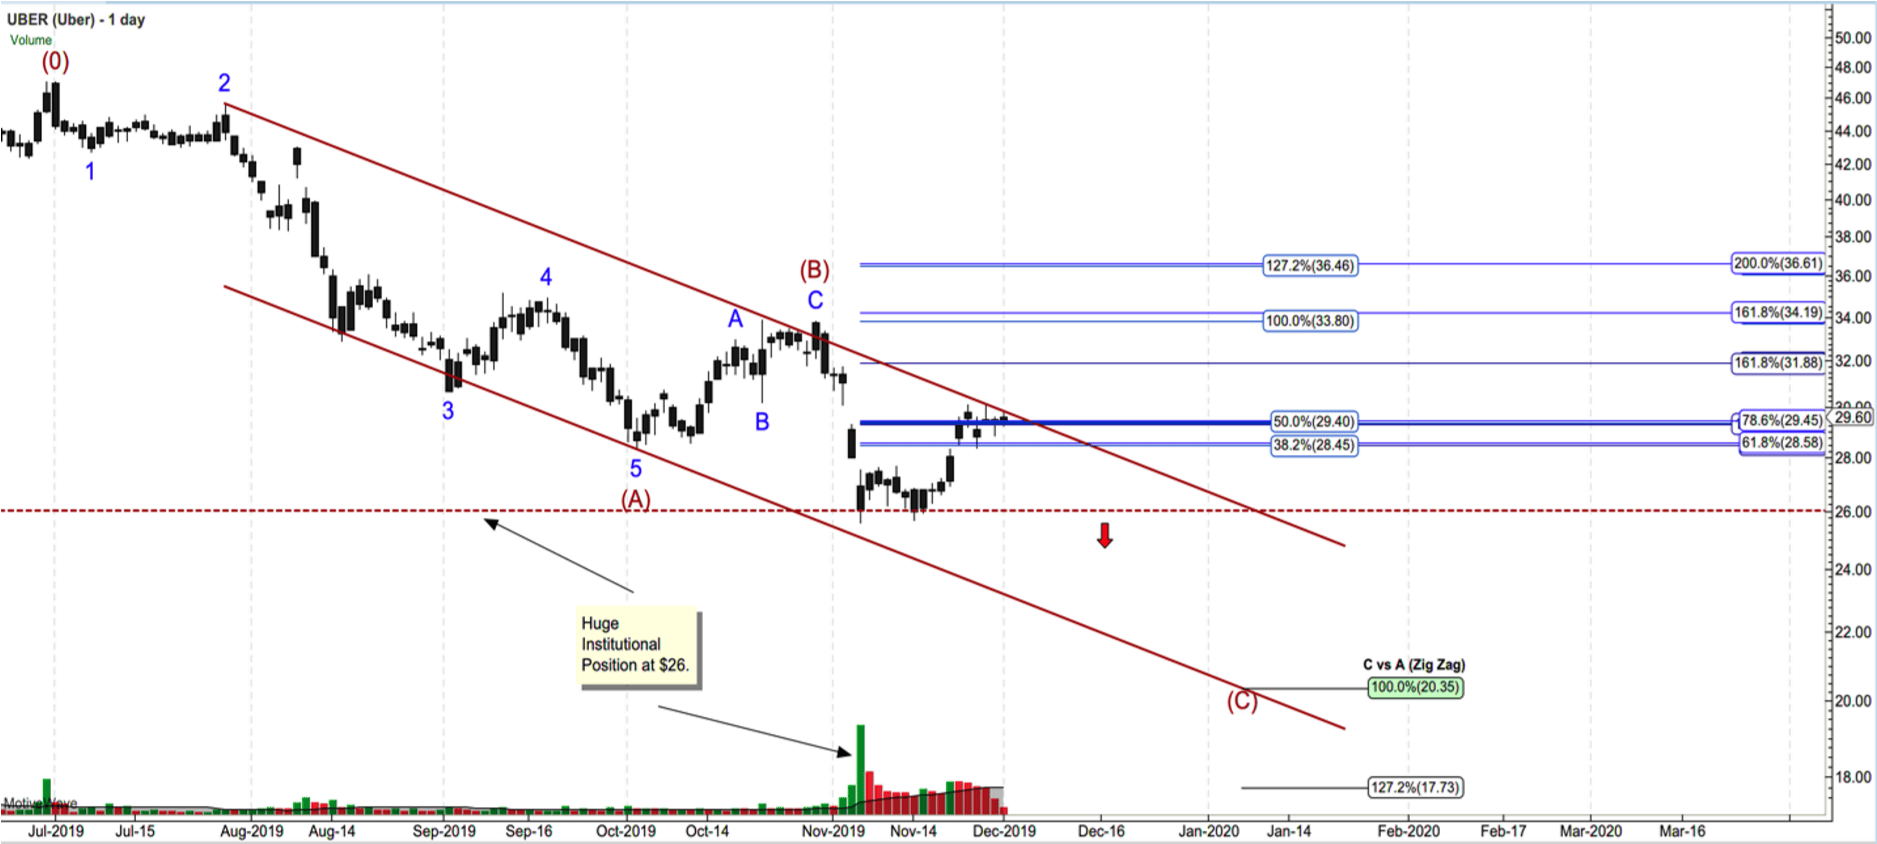
Uber is currently at major resistance and struggling to break out. The blue lines indicate a price cluster of Fibonacci relationships, which also coincides with the red trend line. If Uber does break above this region, we will take the final gains in our current short, and look to re-enter at one of the above blue zones on the chart.
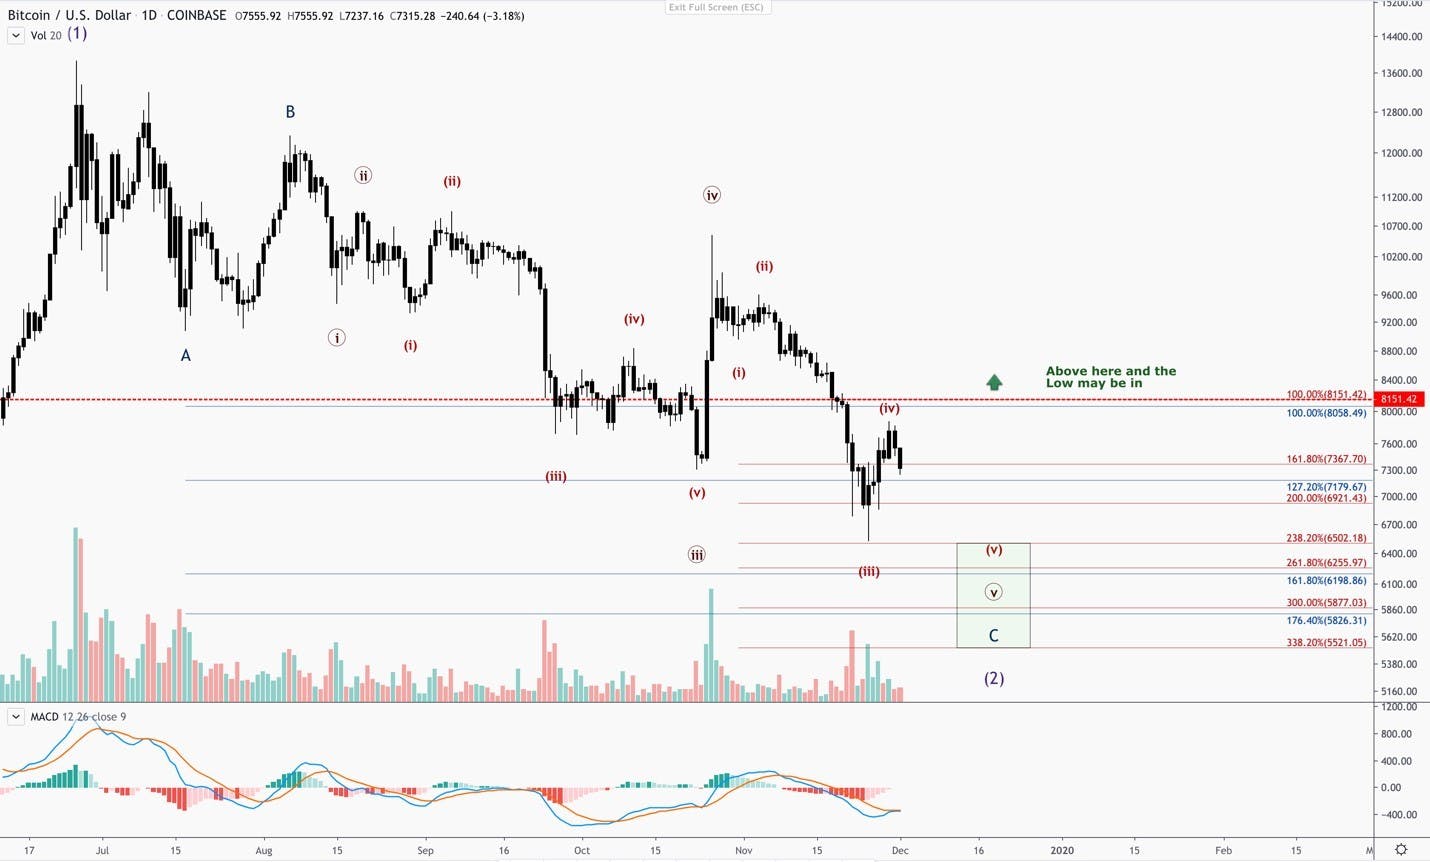
Bitcoin had a strong bounce from our primary target in the high $7,000 range, breaking above $9,000 and then giving us a head fake. My updated structure is above, and it appears that BTC may have one more leg down before a bottom. There were heavy sellers at the $8150 range and heavy buyers at the $6500 range. I would hold a hard stop at $4300 for any longterm longs.
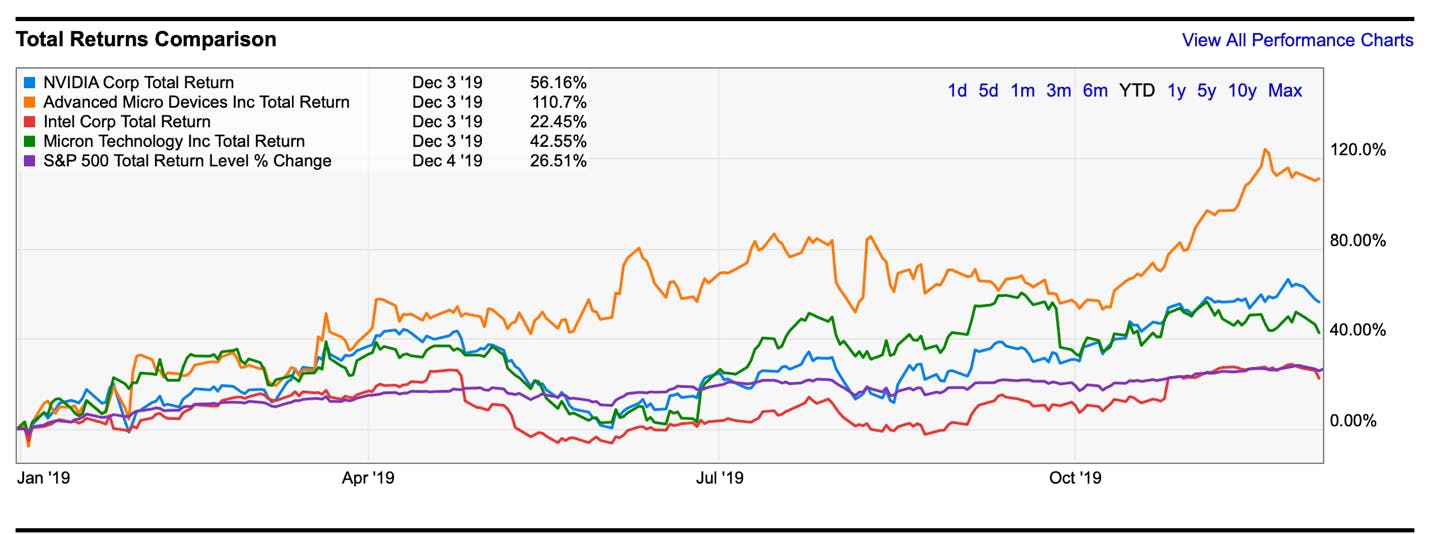
Advanced Micro Devices (AMD)’s stock price is up by 108% this year, making it the best-performing company in the S&P 500 this year. Its closest peer has been Nvidia, whose stock has climbed by 56%. Other peers like Intel, Broadcom, and Taiwan Semiconductor have gained by 22%, 24%, and 48% respectively year-to-date. As a result, AMD has helped power the Fidelity Select Semiconductors (FSELX), which has risen 48% this year, and the PHLX Semiconductor Sector Index (SOX), up 46% this year.
The main justification for the surge in AMD’s stock price is that the company is successfully taking market share from Intel – and to some extent, Nvidia. Since 2017, Intel has lost 10% of its PC CPU market share and 5% server market share to AMD.
Higher PC and graphics chips helped drive the most recent quarter’s performance, yet AMD’s strategy in the CPU-powered cloud-data center segment as the company takes on juggernaut-Intel is especially promising.
In the most-recent quarter, AMD reported revenue of $1.8 billion, which is the company’s highest quarterly sales in more than a decade. Revenue missed by $1 million on an expected $1.81 billion while the company met EPS forecasts of $0.18 EPS. Management guided fourth-quarter revenue of $2.05 billion to $2.15 billion, while analysts had forecast revenue of $2.15 billion. Factoring the past three quarters means that the company will likely generate $6.4 to $6.7 billion in revenue this year. This will be slightly flat from the $6.47 billion that was generated a year ago.
The issue is that the recent AMD share price surge and subsequent valuation multiples see it as a growth company. It has a one-year forward PE ratio of 36, compared to Nvidia’s 30, Taiwan Semiconductor at 20, and Broadcom at 12. Historically, the S&P 500 has an average forward PE ratio of 15. The current PE ratio for the AMD is 206, nearly 5x higher than Broadcom at 45, nearly 4x higher than Nvidia’s at 55 and an astonishing 8x higher than Taiwan’s current PE ratio at 25.
Meanwhile, AMD’s YoY revenue growth same quarter is at 8.95% and will be 52% growth YoY same-quarter Q4, if the company comes in at the $2.15 billion. (Hence the popularity of the stock and cyclical nature of semiconductors). YTD growth is around 20%, which is similar to Broadcom.
AMD’s fundamental story lies within the company’s margins, which historically, have been very low, and are impacted by average sales price (ASP), cost per unit and volume. The company’s trailing EBITDA margin of 8.35% is below that of peers mentioned above. However, over this past year, AMD’s non-GAAP margins have expanded even as revenue declined.
Intel, on the other hand, saw non-GAAP margins fall YoY. This helps support the bull case that AMD’s earnings are growing even while experiencing flattened revenue, and the company has forward-looking potential.
The main challenge with AMD’s current share price is market exuberance over the company’s rebound from the lowered guidance in July. In the technical analysis below, we attempt to reveal just how stretched AMD is, to make the case that now might be the time to take profits, or wait for confirmation if you are looking for an entry.
AMD’s Stock Price: Technical Analysis
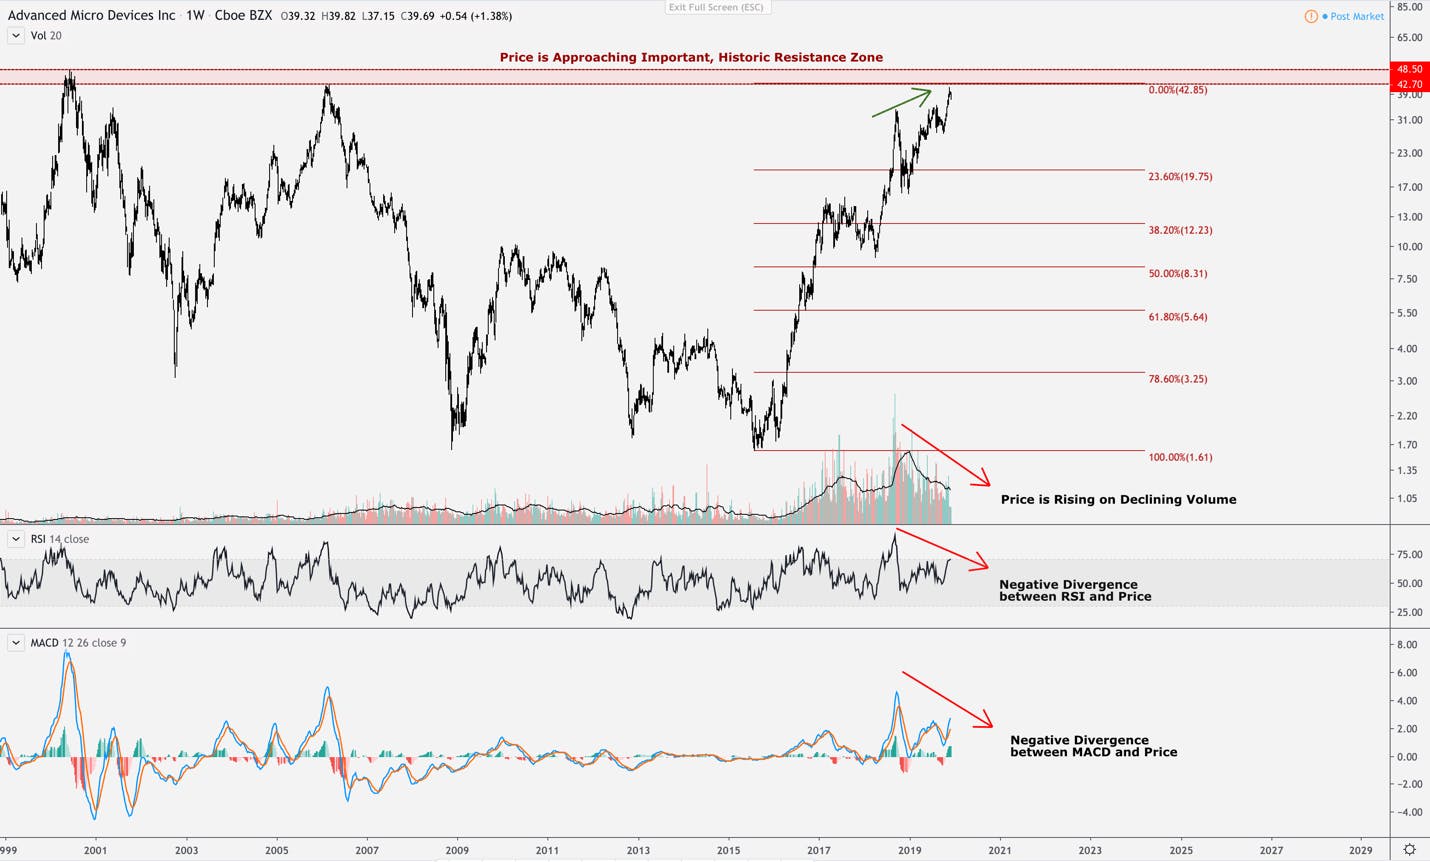
Price is approaching a resistance zone that AMD has failed to break through twice over the prior 2 decades – once in the year 2000 and then again in 2006.
Regarding resistance and supports, the longer the region has held the more important it becomes. Also, the severity of the correction from the price region usually dictates the importance of the region as well. In other words, AMD has failed to breakthrough twice over a 20-year period at this region, and what followed these failed breakouts was two drawdowns greater than 90%. Therefore, this price zone is important for AMD to break through.
Notably, the short interest in AMD is currently around 11%, which is high. So, if AMD can break through this region, it will force shorts to cover, accelerating the price even higher. However, if AMD cannot breakthrough this zone, a healthy correction should be expected. History doesn’t always repeat, but it can rhyme, and a mere retrace to the 23.6% Fibonacci retrace level, a mild correction compared to the uptrend we’ve seen in AMD since 2016, would constitute around a 50% drawdown.
There is negative divergence between the RSI and MACD making lower highs while the price of AMD is making higher highs. The price is thus moving up while the buying pressure is fading. This is typically a sign of a fading rally and suggests a pullback is on the horizon. Furthermore, the price is rising on decreasing volume as well, suggesting that not many investors are buying at current prices.
This divergence is not only happening in AMD’s price, but across the Semis that are trading in the U.S.
The above chart is showing the Philadelphia Semiconductor Index (SOXX) compared to the South Korean Kospi Index. South Korea is an economy that is fueled by some of the world’s largest semi-conductor companies, as well as many mid-level players. Companies such as Samsung, and SK Hynix supplied over 60% of the components used in memory chips sold globally in 2018.
Therefore, the KOSPI provides important information about the global health of semiconductors. As you can see, these indexes are historically closely correlated. Today, we are seeing a very wide divergence between the U.S. semiconductor index and the KOSPI, which is unusual. This suggests that either the PHLX or the KOSPI will need to make a move to realign. My best guess based on the evidence is the U.S. semiconductors will point downward soon.
Regarding AMD, the volume suggests buyers are drying up at current prices, which makes sense considering the overhead resistance, fundamental outlook and global slow down. If I were long, I’d be looking to take profits at current prices, or at minimum buy insurance through a put.
Slack currently has negative sentiment surrounding the company and the stock. We’ve seen a few instances where Slack is lumped in with the IPO unicorns this year, such as Uber, Lyft and WeWork. We believe this is unwarranted, but regardless, this is the information being reported. Meanwhile, we see companies with more positive sentiment experiencing deep sell-offs around the earnings report.
Keep in mind, Slack’s growth has been slowing – from 82% last year to 47-52% growth year-over-year over the past couple of quarters. Revenue came in at $145 million compared to $140.7 million expected by analysts with reported EPS negative 14 cents compared to expected EPS of negative eighteen cents. The stock dropped 16% following its last earnings report.
Slack is guiding for third-quarter revenue of $154 million to $156 million. Judging by the reactions to previous earnings reports this quarter, Slack’s report has to be perfect to not accompany a sell-off.
Could Slack have a surprise earnings report? Yes, it could, but right now it’s a coin toss. It’s a gamble to own Slack right now based the stock trading at the bottom for slightly more returns. The other option is to wait for a breakout confirmation for slightly less returns. There has been institutional interest on both the long and short side of Slack, which has established the current trading range as well as important price targets for breakouts (more on this below).
Many analysts are focused on Microsoft Teams, which is a mistake for a few reasons. Microsoft has dominated business communications for thirty years with an estimated 400 million users on Microsoft Outlook. I assume Microsoft Teams will leverage this user base and sign-up many more users than the 20 million that Teams currently has. Slack’s addressable market is primarily the non-Outlook users (although many users have both Outlook and Slack). The addressable market is hard to exactly quantify but there are 100 million Mac users and 70 million G-suite users. Slack’s addressable market should be somewhere in this range of alternative OSs and productivity tools.
Workplace chat applications are very early but will replace other enterprise and small-to-medium business communications moving forward. This is an important trend to watch as Slack’s engagement is unheard of, with the application open 9 hours per day and boasts engagement of 90 minutes per day – compared to Facebook at 58 minutes, Instagram at 53 minutes and YouTube at 40 minutes per day. These social companies monetize through advertising, but in time, Slack should be able to charge companies for the usage once the trend breaks out.
We know from Microsoft’s user base of only 20 million, or 5% of their addressable market, that we are dealing with a very early trend. Slack will continue to be on our watchlist regardless of what the earnings come in at.
Technical Analysis
By Knox Ridley
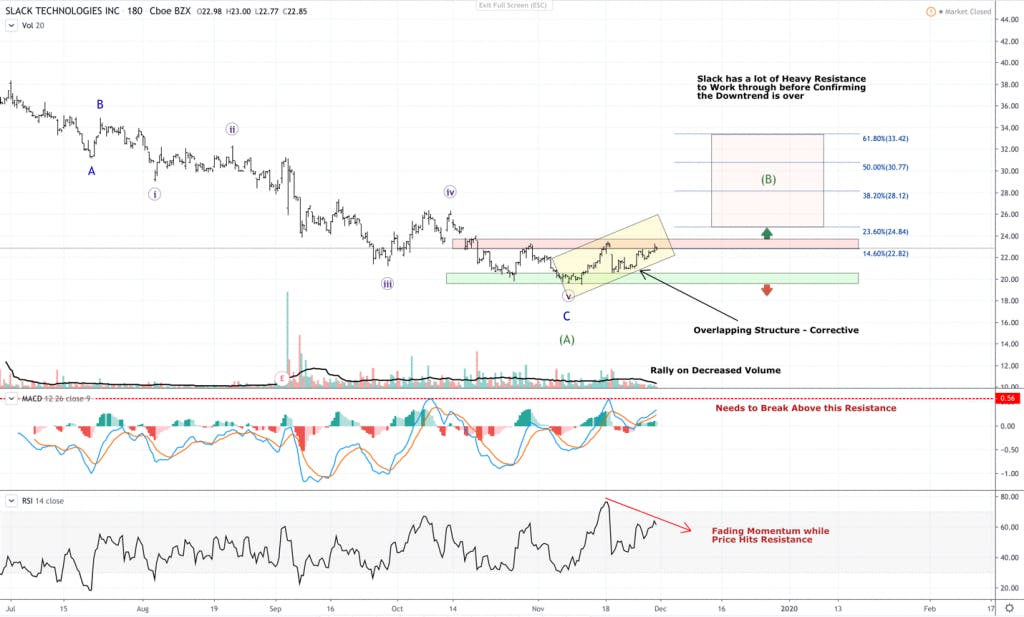
Slack’s downtrend does not seem to be over just yet. It bottomed at $19.54 and has been range bound between the $20 and $23 range. There are heavy buyers at both regions, so it will probably take an earnings surprise to break the range.
Based on the current structure of the most recent uptrend, it is obviously corrective in that it overlaps. We do not have a clear 5 waves up, and until I see that, I would be cautious of any bottom.
Furthermore, the MACD is approaching its own resistance, which it will need to break through to further confirm a new uptrend. The RSI is making lower highs while price is hitting the $23 resistance zone, indicating that the momentum is fading as well. And, the volume is fading as we approach the $23 region.
All of these factors are pointing towards another retest of the $20 support region. Even if we do get a much deserved breakout, until Slack shows a clear impulsive 5-waves up off the bottom, and clears through the above retracements with heavy volume, I’d be cautious and expect one more leg lower before we finally get a real buying opportunity for the long haul.
Please note: The I/O Fund conducts research and draws conclusions for the Fund’s positions. We then share that information with our readers. This is not a guarantee of a stock’s performance. Please consult your personal financial advisor before buying any stock in the companies mentioned in this analysis.
Marvell’s sales are flat year-over year – reflecting the status of many semiconductors with exposure to Huawei. The company reported quarterly revenue of $657 million in fiscal Q2 2019 ending in July with GAAP net loss of $57 million or -$0.09 diluted EPS. The company reports on December 3rd and has guided for $660 million in the mid-range with diluted EPS of -$0.09 and -$0.05 and non-GAAP EPS of $0.15 to $0.19 EPS.
Marvell’s revenue peaked in the quarter ending October of 2018 at $851 million, and in the quarter ending January 2019 at $744 million.
The company has guided for ongoing impact from the Huawei ban, yet stated it would be offset by a “stabilizing storage business and the earlier than expected first production shipments of our 5G solutions.” As many investors are aware, Huawei is building base stations without components made in the United States and this impacts Marvell as Huawei is the current leader in 5G infrastructure. The storage business was down 1% sequentially at $275 million due to the export restrictions on Huawei.
Samsung is increasing their orders, which helps Marvell. Nokia also uses Marvell’s chips. There was an important announcement from Microsoft in regards to using Marvell’s ThunderX in Azure for advanced programming. Lastly, Marvell has recently acquired a former-IBM ASIC chip company for $650 million (plus an additional $90 million when conditions are met), which will help its aim in 5G infrastructure as ASICs are becoming the go-to chip for customized, specific functions.
Beyond the Huawei risk, Marvell also took on quite a bit of debt in 2017 totaling $1.879 billion with a current balance of $1.685 billion in the most recent quarter. This can be problematic as the company is not currently profitable (although did achieve profitability between in 2018, 2017 and for many years prior to 2016). Cash flow from operations in the second quarter was $73 million.
In July of 2018, Marvell completed the acquisition of Cavium for $6 billion, a developer of ARM and MIPS-based SoCs. This helped broaden Marvell across the storage, networking and connectivity solutions markets and doubled the addressable market from $8 billion to $16 billion. The long term debt Marvell secured was due to this acquisition.
Marvell has a forward PE ratio of 23 and a forward price-to-sales of 5.7. Historically, the forward PE ratio is lower than years past because Marvell is forecast to have 13% growth next year. The trailing EV to EBITDA is 54, which is very high. Marvell had a EV to EBITDA of 17 during 2017 and 2018, and this doubled to 30-38 during the first half of 2019.
Although it’s good to be forward looking, to some extent, Marvell’s valuation does not leave room for the risks. This matches my opinion of nearly all semiconductors, as it’s better to buy on trade war pessimism for the long haul rather than all-time highs and trade war optimism.
5G
In the 5G premium analysis, I had outlined key technologies for 5G infrastructure including Massive Multiple Input and Multiple Output (MIMO). MIMO sends data through multiple streams, increasing throughput, and helps to avoid lost signals. Marvell’s fusion processors assemble antennas to help multiply the capacity of the network. Marvell’s Fusion processor also helps high capacity data throughput and reduce power consumption. The comprehensive 5G platform delivers baseband, transport, switching and front-haul and MIMO at base station OEMs.
Marvell supplies components for 5G base stations and both Nokia and Samsung are customers. In turn, Samsung works with Verizon, AT&T, SK Telecom, and KT. Samsung has been able to capture business that Huawei has lost, and the level of this future growth is an important catalyst.
According to Gary Mobley of Wells Fargo, Marvell can generate $600 million in incremental revenue from 5G base station customers compared to the $2.9 billion over the past four quarters (20%) of revenue. Marvell management confirmed they expect $600 million per year from 5G revenue on the last earnings call. The speed of this growth depends on Samsung and Nokia’s market share.
Marvell stated on the most recent earnings call that 5G macro-base station penetration will grow “from about 10% this year to 38% next year, and then onto 55% in calendar year 2021.” According to the executive vice president of China Mobile, Zhengmao Li, 5G will require three times more base stations than LTE and will cost four times more than LTE. IDC states that
5G-related spending will grow at a compound annual growth rate of 118% through 2022. Therefore, there is plenty of green field.
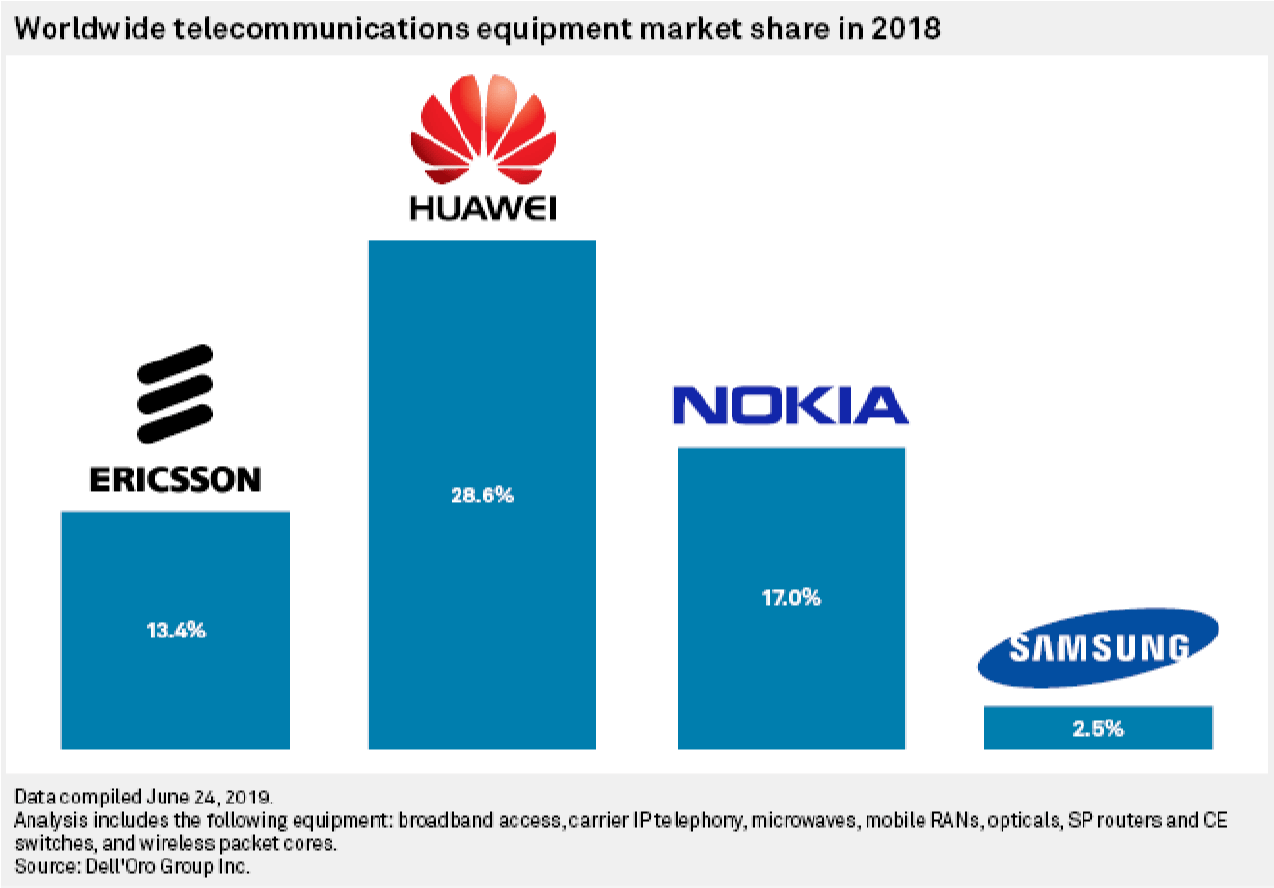
As stated in the intro, one of the primary headwinds is the Huawei entity ban. In 2018, Huawei controlled nearly 30% of the 5G market compared to Nokia at 17% and Ericsson at 13.4%. Samsung had only 2-3% of the market.
Most developed countries today face a tough decision: move forward with Huawei’s radio access networks and core equipment or delay the 5G roll-out. According to Mobile UK, a partial to full restriction of Huawei could delay a full 5G launch by 18 to 24 months. This is due to many of the current 4G base systems containing Huawei’s core equipment. Non-standalone 5G systems leverage existing 4G for the roll-outs anticipated next year. In the future, new stand-alone systems will be built with new architecture and many Western countries are unlikely to choose Huawei for the rebuild. In the meantime, Europe, for instance, may be stuck with Huawei for the first roll-out.
Marvell’s 5G potential is based on the likelihood that developed countries will delay roll-outs to minimize security risks. If this does not occur, and countries deploy non-stand-alone 5G based on current 4G base systems (under the assumption the 4G systems were also a security risk), then Marvell’s growth potential relative to 5G will be delayed until stand-alone systems are built.
According to 2018 numbers, Samsung is not a lead competitor – but this could change. Newly available 2019 data tells a different story. Samsung reportedly took first position in global sales in Q1 2019 this year with 36% of sales compared to Huawei’s 28% and Nokia’s 14%. Notably, Samsung and Huawei are the only end to end providers of 5G infrastructure. Wins for Samsung and Nokia are wins for Marvell. Nokia announced 42 commercial 5G contracts in June of this year with 22 major customers such as T-Mobile, Telia Company and SoftBank.
ASICs
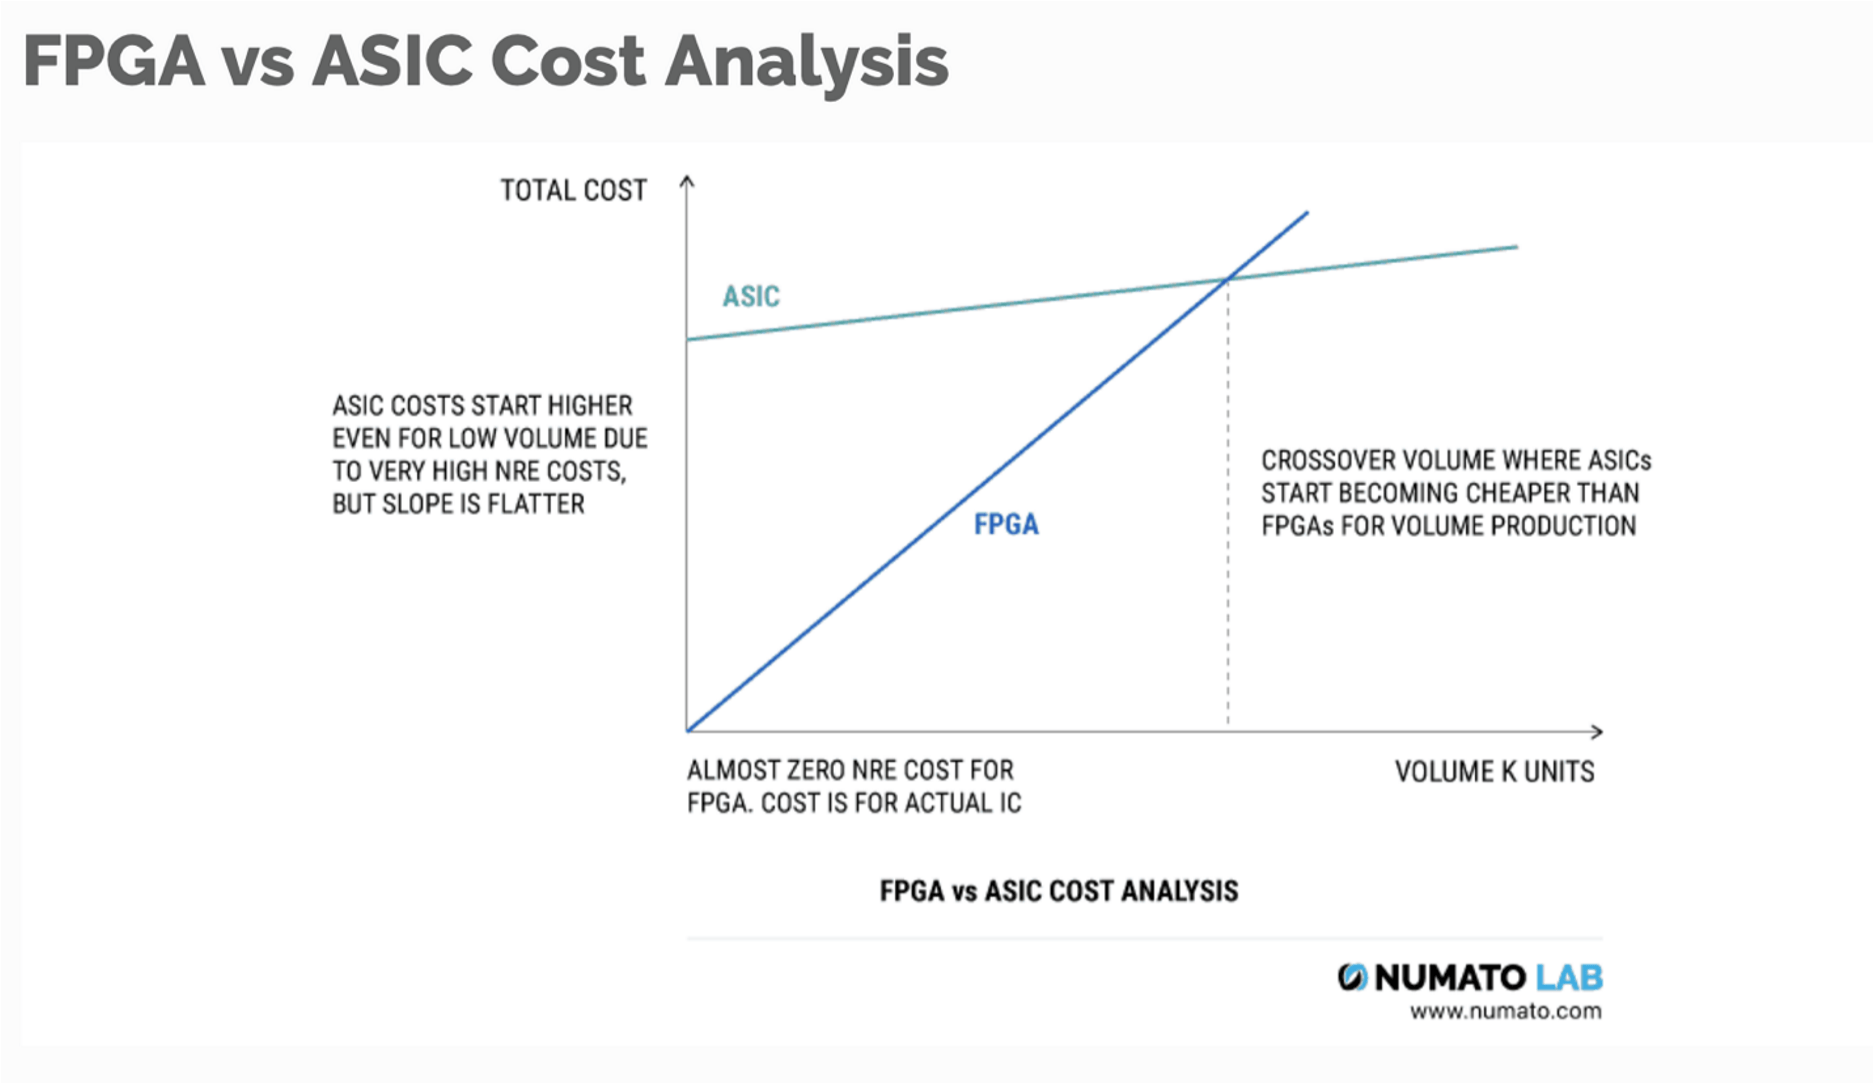
In May, Marvell announced plans to acquire Avera Semiconductor for $650 million in cash plus $90 million if the business does well within the next 15 months. The deal is expected to close at the end of fiscal year 2020. Avera is a player in the ASIC market, which will help diversify Marvell as 5G has begun to favor ASICs over FPGAs due to costs and power consumption. ASICs, which stands for application-specific integrated circuit, are customized to perform one very specific function repeatedly rather than general-purpose chips – hence the “application specific.” Broadcom could potentially be challenged by this acquisition. Avera will add $300 million per year to Marvell’s top line.
In contrast to ASICs, the traditional FPGA chips are high in cost and power consumption, according to critics. Marvell is attempting to offer end-to-end network infrastructure with baseband DSPs, Arm multi-core SoCs (system on chips), purposebuilt hardware accelerators, Ethernet connectivity engines and system-level security solutions. Although Marvell aims to offer specific-use ASICs and semi-custom ASICs, the 5G platform that Marvell offers will be adaptable for many use cases to expand on any ASIC limitations.
The primary SoC competitor is Broadcom. NXP Semiconductors and Qualcomm also compete with Marvell. Xilinx is a competitor on FPGAs.
It’s important to note that Marvell is also a supplier for cloud infrastructure and data center storage solutions. On November 12th, 2019, Marvell announced that Microsoft Azure is deploying production-level servers with Marvell’s Thunder X2 Armbased processors.
Thunder X2 is the second generation of the Armv8-based server and is based on the computational performance of an Arm server along with balanced IO connectivity, memory bandwidth and capacity.
Following this announcement, Nvidia announced a collaboration with Marvell’s ThunderX to port its CUDA-X AI and high performance computing libraries and tools to the platform. This will help Marvell secure an entry into the AI and ML market through the Arm architecture. ThunderX has over 100 partners across commercial, open source and industry standard engagements. The Nvidia partnership will open up more than 600 HPC applications and AI frameworks.
If you’d like some history on ThunderX during the then-pending Cavium acquisition, this article on Forbes is a good resource.
Conclusion:
Marvell is certainly a lesser known name at $17 billion market cap compared to the $100 billion market cap competitors. Typically, investors overestimate the ability of the larger competitors and don’t give enough attention to the fast-moving innovators. The reason I wrote this analysis is because Marvell is doing all of the right things across its product line to overcome the current challenges.
Huawei is overshadowing their product strength and with some luck, this can subside and the Fusion processor can find real growth again. On one hand, you have the very real possibility that Samsung picks up market share and Nokia maintains market share, especially among Western regions.
ASICs are also a strategic play as they are becoming favored over FPGAs. Lastly, there is the ThunderX platform that delivers acceleration in the cloud, which will need time to be adopted, yet is an area of product-market fit that I am tracking.
At the right price, Marvell is worth the risk as any turn in one of these events can make an impact on the company’s fundamentals. Knox will follow up with some technical analysis shortly.