Shopify Q4 2021 Update:

In the discussion below, we provide an overview of our thesis on Shopify and an update on the company’s most recent earnings. We continue to believe that our thesis remains in play and that Shopify will continue to take share in eCommerce, a massive, long-term secular trend. However, temporary trends such as tough comps and rising costs have introduced near term uncertainty that has momentarily pressured Shopify's valuation. If we decide to trim our position, expect us to reenter fully allocated by Q2.

Here are our recent write-ups on Shopify that outline our thesis in more detail:

Shopify 2019 Analysis

Shopify Premium Analysis for 2021

Shopify Q3 Review and 2022 Outlook

Important to our thesis is Shopify’s ability to scale, now that the company has achieved product-market fit. There is no better stock to hold than those that are in this stage as risk is low compared to reward.

Here is what Beth said in the 2019 analysis:

“Shopify has made it clear they are in the product-market fit stage and will scale between 2021-2023, as referenced in a recent investor presentation. Product-market fit is an exploratory stage where profits are not prioritized. Once product-market fit is achieved, the growth trajectory can move very quickly […]

The reason to stay long on Shopify, is that industries get disrupted and e-commerce is overdue for disruption. Amazon’s pay structure is not fair to merchants at 26%. eBay is stagnant in revenue growth for nearly 10 years (fluctuating between $8B to $10B).

Shopify is already the third largest online retailer in the United States and is doing one thing very well that the others neglect: emphasizing the merchant (whereas Amazon’s focus is the customer). I believe this piece to the product-market fit will carry Shopify through the hurdles of taking market share from one of Wall Street’s favorite darlings (Amazon).”

Here is the chart Shopify’s management provided in 2019:
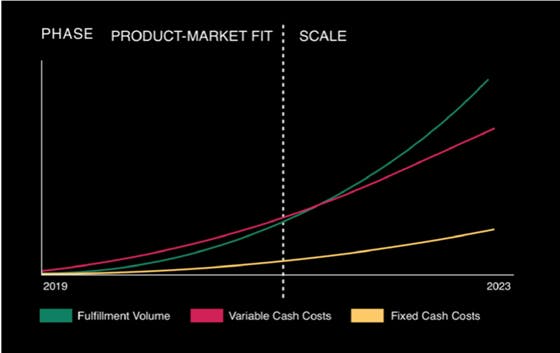
Sales have rapidly scaled since 2019. For instance, 2021 sales were up 192% relative to 2019 levels, nearly tripling in two years. This is above the 2Y growth rate in 2019, which increased 134% relative to 2017. The acceleration in the 2Y growth rate exemplifies Shopify’s product-market fit and its ability to scale.

While there is near-term uncertainty related to forward growth, rising costs, and supply chain issues, we believe that our long-term thesis remains in play: that Shopify will compete with Amazon in eCommerce.
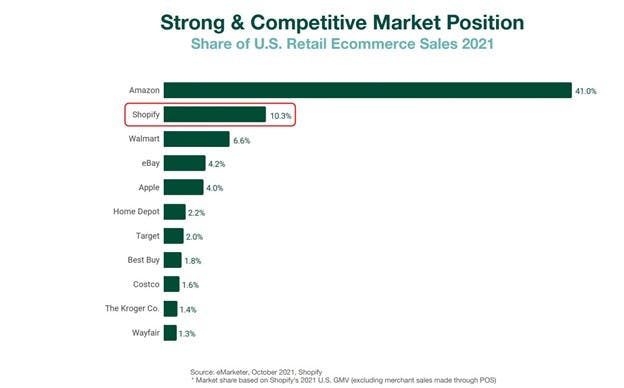
As long-term investors in Shopify, we are prepared to weather the near-term volatility because we believe that the company will be a juggernaut in eCommerce, a $5.5 trillion global market in 2022, which is expected to grow to $7 trillion by 2025.

In the article below, I discuss the near-term uncertainty that may have spooked investors, and also revisit Shopify’s fundamental outlook. I also review the company’s financials and conclude with a discussion about the company’s valuation.

Near term uncertainty is only temporary

Shopify is heading into a quarter with the toughest comps in its history, and gave the market an opaque guide, creating uncertainty. Furthermore, expenses have been rising, and Shopify’s high-margin subscription business is expected to grow slower than its merchant solutions segment. This reduced EPS expectations, which has pressured the company’s valuation. Importantly, these trends are temporary, which we discuss in more detail below.

Shopify reported results that beat market expectations, as both Q4 sales and earnings beat estimates. However, the company once again provided a qualitative guide that did not quantify its top or bottom-line expectations. This is the second year in a row that Shopify provided only a qualitative guide, which has increased uncertainty around near-term growth. While investors likely understood Shopify’s rationale for the qualitative guide heading into 2021 given the unpredictable dynamics around COVID-19 and vaccine rates, the market’s sentiment towards this has changed and the company is being penalized for this uncertainty.

With Q2 2021 representing the toughest comps in Shopify’s history (Q1 2021 sales grew 110% YoY, a record high), investors may be concerned that near term growth will slow. Unfortunately, Shopify did little to ease these concerns with its opaque qualitative guide during the quarter. Specifically, Shopify disclosed that its 2022 outlook “anticipates revenue growth for the full year 2022 that is lower than the 57% revenue growth achieved in 2021, but still rapid and outpacing the growth of eCommerce”.  The company added that growth will be lower in H1 but improve in Q4. This opaque, back-end weighted guide likely led institutions to step aside due to the uncertainty heading into tough comps.

Taking a step back from the opaque guide, the company is still forecasting growth, albeit below its 2021 (and 2020) growth rate. Furthermore, the company expects to outpace the overall growth in eCommerce, implying that the company still expects to capture market share.

EMarketer expects global eCommerce sales to grow 13% YoY in 2022, down from the 17% growth rate in 2021 but only slightly below the 14% growth rate in 2019. More importantly, U.S retail eCommerce growth is expected to ramp in 2022 to 13% YoY growth, up from the 6% YoY growth in 2021 and above the 11% growth rate in 2019. The U.S. retail eCommerce market is Shopify’s biggest market.

Considering Shopify grew sales 47% YoY in 2019, the company’s 2022 growth rate may come in around that level (albeit slightly slower) if eCommerce growth is similar and Shopify continues to capture a similar level of eCommerce volume share.  

Ultimately, capturing market share remains the most bullish aspect of Shopify’s story and management’s comments that they expect to outpace eCommerce growth is important to our long-term thesis.  

Looking forward, the Street anticipates Q1 sales to grow 26% YoY to $1.24 billion. This would represent the slowest pace of YoY growth in at least the last five years, and is well below the five-year quarterly average of 66%.

In FY2022, sales are expected to grow 31% YoY to $6 billion, as sales are expected to ramp in the back half of the year. Assuming that U.S. retail eCommerce sales rise 13% YoY to ~$950 billion (as expected) and that sales as a percentage of GMV (excluding POS sales) remain constant YoY, the Street expects Shopify’s market share of U.S. retail eCommerce volumes to increase 170 bps YoY to 12%. This is equal to the 170 bps YoY expansion in its market share in 2021 but below its 270 bps expansion in 2020.

We think that the forward estimates may be conservative, and note that there is upside in its ability to capture market share, driven by the expansion of its fulfillment centers, key partnerships and investments in its growth.

In order for Shopify to continue to scale and take on Amazon, the company has ramped its investments in its fulfillment centers, with the goal of providing two-day shipping to 90% of the US population. However, this expansion will front-load costs and management stated that they do not expect to recognize the benefits of scale until ~2024.

Furthermore, management explained on the Q4 call that they expect 100% of their gross profit in 2022 to be reinvested into growth initiatives over the next few years, signaling that OpEx and CapEx will equal gross profit, which will limit earnings growth. Shopify also stated that it expects to hire more engineers than in 2021, “despite an exceptionally competitive market for top talent”.  The expectations for a rise in expenses in the near term, during an inflationary environment, may have spooked investors during the quarter.

Moreover, management left analysts in the dark when questioned about the ROI and payback of its Shopify Fulfillment network (SFN) investments. Specifically, CFO Amy Shapiro responded to an analyst question about SFN payback by stating that “we're not going to get into the details of how we view payback ROI [for SFN]. But what we can assure you is, we've always been strong allocators of capital to the right opportunities to grow the various parts of the business at the right time, and this is no different”. As stated above, the market does not like uncertainty and the lack of commentary about the cadence of ROI on its SFN investments may have led some investors to step aside from Shopify in the near term, pressuring its valuation.

Despite the lack of commentary on the SFN ROI, we remain confident in management’s ability to deliver value to its merchants (and shareholders). In order to effectively compete with Amazon, Shopify needs to improve the convenience of shopping in its network, which starts with two-day delivery and its fulfillment network.

Furthermore, management has been prudent with their fulfillment network investments. In 2019, Shopify first announced its SFN, and in 2020 COO Harley Finklestein explained that the focus for SFN will be product market fit and added that “we want to ensure that the foundation of the fulfillment network is strong and the merchants’ experience is outstanding before we enter sort of the scale phase” (Q3 2020 call).

In the most recent Q4 call, CFO Shapiro added that Shopify is now entering the scale phase for the fulfillment center. She explained that “we are moving into a new phase in 2022 for building simple and fast fulfillment for our merchants. Over the next 3 years through 2024, our planned investments expand the merchant value proposition even more, including increasing 1-day delivery coverage in the U.S. and increasingly enhanced returns functionality. And we are planning to be able to handle progressively larger merchants with a broader set of needs as we build through 2024. When we launched Shopify Fulfillment Network in mid-2019, we said that we expected to spend $1 billion over 5 years. Through 2021, about halfway through the original asset-light plan, we spent $117 million, which includes funding cash operating losses and a small amount of CapEx.”.

Looking forward, Shopify will ramp CapEx related to Shopify Fulfillment Network, with $1 billion in capex over 2023 and 2024 for self operated warehouses. While the rise in capex transitions Shopify from a mostly asset-light business model to a moderately more capital intensive one, the costs have been well telegraphed to the market since 2019.

Furthermore, the investments in SFN should help improve Shopify’s ability to capture market share, potentially providing upside to future growth estimates.

We suspect that Shopify has been punished by the market due to its opaque guide and expectations of rising costs in an inflationary environment. However, we note that Shopify is expected to continue to capture market share in a massive $5 trillion global eCommerce market, and has a long runway of growth ahead of it. We believe that these are just temporary issues and that Shopify has proven it has product market fit. Forward estimates appear conservative and there is upside to growth expectations, considering Shopify’s commitment to improving its merchant network.

Another potential driver of topline growth will be the global expansion of Shopify’s reach. Shopify has partnered with JD.com, which allows its merchants to reach Chinese shoppers. The partnership with JD.com opens up the opportunity to expand into the biggest e-commerce market in the world. China has a population of 1.4 billion and 52% of all retail sales in China in 2021 were transacted on eCommerce platforms.

Notably, we had stated in our 2021 analysis that partnerships like these are key for Shopify to take market share from Amazon when we cited international growth as a key strategy: “Globally, Shopify has a better chance of penetrating various regions as the merchants (and lack of walled garden) localizes the content and offerings. There is also stigmatism towards Big Tech globally and Shopify works quietly in the background while letting the merchants remain in the spotlight. This will be popular globally […] we see global as an important piece to our thesis as merchants who want to reach global audiences will likely choose Shopify over Amazon. We think this is an important competitive edge.”

According to Shopify President Harley Finkelstein, “China's eCommerce market is estimated to be worth $3.3 trillion by 2025. That is 5x larger than the U.S. market. This channel integration opens up the China market to our merchants who can now reach JD's 550 million active users … This integration removes barriers to one of the most important e-commerce markets and is a major step in solving cross-border commerce for our merchants

According to the press release, Shopify merchants in the US will be able to begin selling in China in three to four weeks, well below the 12 months typically required for foreign brands to begin selling in China.

The JD.com partnership follows numerous other partnerships, such as  Alipay, social media companies such as TikTok, Facebook and Spotify and CTV leader Roku. In this way, Shopify is using Amazon’s weakness against company, which is that it’s too large and too dominant to make an attractive partner. Amazon also competes with many of these platforms in various ways due to its broad reach, while Shopify has instead focused on partnering with other platforms and is intently focused on eCommerce.

These partnerships represent a value-add for merchants and prospective merchants, giving Shopify an advantage over competitors. At this point, an entrepreneur looking to sell products online is likely to choose Shopify for the reach the company offers, as well as the tools Shopify is frequently releasing (such as SFN, Shop Pay, etc).

We also believe this adds to the flood gates of distribution plus more strength on being omnichannel. We wrote about this here

While there may be near term headwinds from an uncertain guide, rising costs from SFN and supply chain issues, we believe that Shopify’s product market fit in a massive market and its relatively low penetration rate position the company to outperform in the long run. In the next section, I discuss the company’s most recent results and its valuation.

Shopify’s Q4 results and valuation

In 2021, Shopify’s growth remained strong, driven by the 46% YoY growth in Gross Merchandise Volume (GMV). GMV is an indicator of the success of Shopify’s merchants and the overall strength of its platform, and Shopify’s sales are directionally correlated with growth in GMV. Shopify is also a platform with high margins, however margins were a bit thin in this earnings report as the company has ramped investments in the near term to sustain its growth. Importantly, we believe that these headwinds are only temporary and that Shopify’s margins will improve as the company continues to scale its platform. Furthermore, due to Shopify’s product strength, we believe that GMV growth will continue to be robust going forward. I discuss this below.

Shopify’s Q4 sales beat estimates by 3% and increased 41% YoY to $1.4 billion, after increasing 94% YoY in the year-ago quarter.  Q4 Sales were driven by merchant sales, which increased 47% YoY to $1 billion. Q4 GMV increased 31% YoY to $54 billion and was $175 billion for the year, up 47% YoY from $120 billion in 2020. As mentioned above, Shopify has captured about 10% of U.S. eCommerce retail sale volumes and has leverage to continue to capture more share as it scales.

Subscription sales increased 26% YoY to $351 million during the quarter, which was the slowest rate of growth in the last five-years. The deacceleration in subscription sales was driven in part by a change in accounting treatment as app and theme sales recognition were changed from being recognized on a gross basis to a net basis, which lowered Q4 subscription sales by ~2%. Subscription sales were also impacted by a tough comparable base period, as subscription sales accelerated to 53% YoY growth in Q4 2020. Monthly recurring revenue grew 23% YoY to $102 million, representing a CAGR of 41% since Q4 2016 and highlighting the long-term strength in Shopify’s subscription sales.

Gross margin declined 140 bps YoY to 50%, which was below the five-year average of 55% and was driven by the outsized growth in merchant solutions, which is lower margin. On a segment basis, subscription gross margin declined 32 bps YoY to 78% and Merchant solution gross margin fell 16 bps YoY to 41%.

Operating margin was 1%, marking the 7th consecutive quarter of positive operating profits while adjusted operating income was $130 million in Q4, down from the $200 million in the year-ago quarter. Management explained during the Q4 call that the decline in profitability was driven by an acceleration in investments and hiring trends. Non-GAAP EPS was $1.36, down YoY from $1.58 but bested estimates by 4%.

The balance sheet remains in good shape with over $8 billion in cash and $1 billion in long-term debt as of December 2021. Merchant advances increased from $244 million in Q4 2020 to $471 million in Q4 2021. These advances help merchants scale, but also introduce risks of impairment.

While there are risks with these advancements, impairments have been low to date and Shopify has advanced over $3 billion since 2016. This program illustrates Shopify’s commitments to merchants, helping them scale and compete with larger brands. Shopify also introduced an ERP program in 2021 to help high-volume merchants further scale their operations. Shopify’s focus on the merchant is different than Amazon’s approach of being focused on the customer. We believe that this differentiated focus helps Shopify compete with Amazon and allows the company to expand globally while operating largely in the background.

As mentioned above, management provided an opaque guide and stated that sales will continue to grow rapidly in 2022, but will be below the 57% YoY growth rate in 2021. Merchant Solutions revenue is expected to grow twice as fast as Subscription sales driven by a higher attach rate as merchants use more of Shopify’s solutions, such as SFN and new features such as Shopify Markets. Management also explained that a change in its revenue share agreement on the first $1 million in app and theme sales will be a headwind to H1 subscription sales.

For the year, FY2022 sales are expected to rise 31% YoY to $6 billion, which we estimate implies a 170 bps expansion in its U.S. eCommerce retail market share. However, there is upside to estimates with the company’s buildout of SFN, its global partnerships and investments in growth initiatives which should help the company continue to capture more market share.  

Shopify currently trades at a 17x P/S ratio, which is 32% below its five-year median of 25x and 59% below its three-year median of 42x. Looking forward, Shopify trades 14x 2022 sales, which appears cheap for a company that has averaged 66% topline growth for 20 quarters and has 50%+ gross margins. Relative to other cloud platforms, Shopify appears to trade in-line with peers. For example, HubSpot and Shopify both trade at a 14x forward P/S multiple and grew sales 40%+ YoY, while Adobe trades at a 12x forward P/S multiple but is growing at half the rate as Shopify.

Notably, Shopify is a cloud platform with high margins, so the company has been awarded a premium multiple by the market. We believe that Shopify has clearly demonstrated its product-market fit, and is best positioned to compete with Amazon in the long run, which warrants a premium valuation in our opinion.

Moreover, Shopify’s total market cap is $85 billion, and it operates in a massive $5 trillion eCommerce market. Shopify has captured just 10% of the U.S retail eCommerce market, with plans to continue to expand globally, highlighting the long runway in front of the company.

Moreover, management’s decision to reinvest all of its gross profit back into the business over the next few years is a sign that the company also believes that there is a large opportunity in front of it. As Shopify continues to scale, it has numerous levers to pull to ramp sales and earnings growth in the future. While there may be near term uncertainty embedded in Shopify’s valuation, we expect the company to continue to outperform in the long-run and capture market share. As a result, expect us to remain allocated in Shopify through the volatility.
 

Upstart Q4 2021 Analysis: Pros and Cons

We recently purchased Upstart as part of the momentum portfolio, and we plan to hold it into strength. The company is well known and had a breakout year in 2021. I provide a brief summary of the company’s business model, what we like about the business and key risks.

What does Upstart do?

Upstart is an artificial intelligence (AI) cloud platform that is used to facilitate loan originations. The company uses over 1500 variables in its AI models, which allows its platform to underwrite superior loans with higher approval rates, lower interest rates and lower default rates for consumers compared to legacy lending approaches.

Upstart was founded in 2012 by a Google technologist, Dave Girouard, who worked at Google in 2004, when the company was quickly scaling. Upstart originated its first loan in 2014 and its AI platform more accurately prices risk for unsecured consumer loans, and has now expanded into auto loans. In 2021, 69% of its loan were fully automated, which helps facilitate more loan volumes.  Increasing loan volumes strengthen the company’s AI models, improving its competitive moat and giving it a larger lead relative to competitors. Being the first mover in tech is often the most important aspect of the story, and Upstart has a large advantage with its relatively long history of repayment data that will be difficult for competitors to replicate.  

Lending is critical to the US economy, and between 2014 through 2021, commercial banks lent out over $16.5 trillion in loans. However, the pricing of these loans has largely relied on legacy methods invented before the emergence of cloud computing and modern data science. A study by Upstart found that four out of five Americans have never defaulted on a loan, yet less than half of them would qualify for the low rates that banks offer. Furthermore, there are enormous amounts of data points available for lending decisions, such as payment data, banking transactions, employment history and educational background. It is a natural progression for cloud computing, AI and machine learning to be applied to lending, given its massive scale and legacy approach.

Revenue model and opportunity

Upstart is a platform for loan originations, its not a bank. Furthermore, the company partners with banks, it does not compete with them like other Fintech companies. The company’s revenues come from fees from originating loans on its platforms that are paid by its banking partners. These fees accounted for 91% of revenues in 2021. Importantly, Upstart’s revenues are low risk and 94% of its sales have no exposure to credit risk.

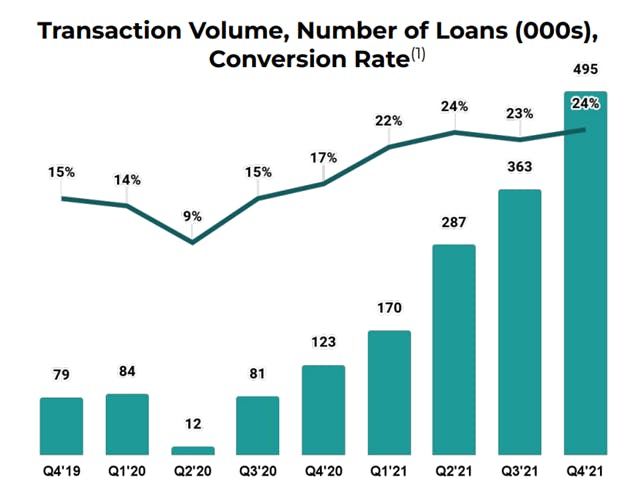
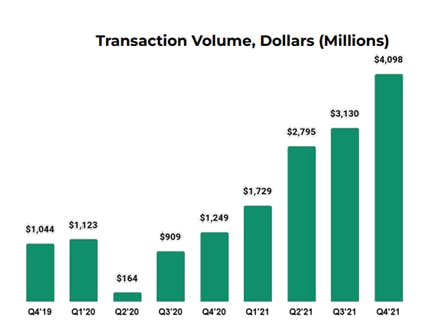
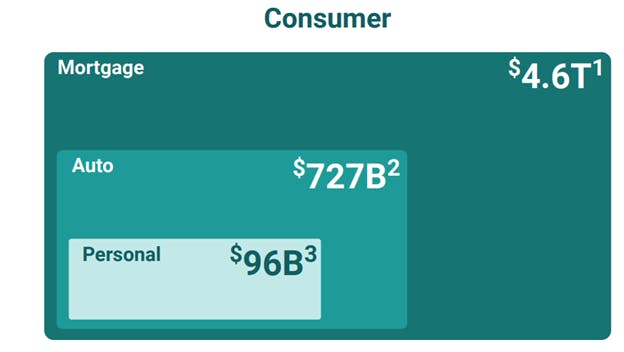
Revenues are primarily usage-based, and rising loan volumes contribute to rising revenues. As shown below, 2021 was a breakout year for loan volumes, which increased to over $4 billion in Q4 2021. Volumes have primarily been from personal loans that are used to refinance high interest credit card debt for consumers. For example, in Q4, Upstart originated 495,000 loans for $4.1 billion, or $8,300 per loan, and the personal loan market is large, estimated at nearly $100 billion.

The company has fully scaled into personal loans and has now expanded into new markets, such as auto loans. In Q2, the company purchased Prodigy, which expanded its addressable market in auto loans. Management expects auto loans to grow through 2022, which will weigh on its contribution margin in the near term until the company reaches scale, which it expects to do faster than it did with personal loans since it now “has the playbook down”. Beyond auto loans, the company expects to expand into Mortgages in 2023, a massive market at nearly $5 trillion.

What we like about Upstart:

There are a few key aspects of Upstarts model that we find attractive:

–          Flywheel effect: Upstart has first-mover advantage, which has allowed it to amass more repayment data and improve its AI models. Its models benefit from a flywheel effect as repayment data leads to improved accuracy of risk pricing, which results in higher approval rates and lower interest rates, which leads to increased volumes and more repayment data. Upstart’s conversion rate, or the number of loans improved per inquiry, increased to 24% in 2021, up from 15% and 13% in 2020 and 2019, respectively. As its AI models improve, its conversion rate should also ramp, increasing volumes and giving the company a significant data advantage.

–          94% of sales have no credit exposure: Upstart is a platform for banks, the company is not a bank, nor does it compete with banks. It offers a marketplace for loans and charges a platform fee and generally does not own the loans. Even if it's 6% of credit exposure defaults, Upstart's high margin earnings can absorb it. The loans it carries are for R&D purposes (discussed below), meaning that its credit exposure should decline going forward.

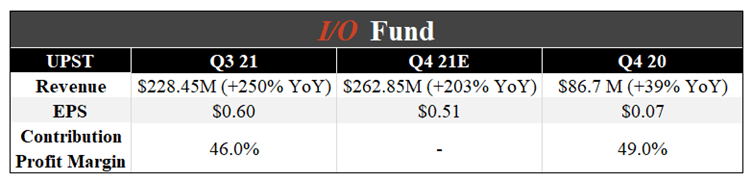
–          Upstart is highly profitable at scale: Loan volumes soared 338% YoY to 1.3 million and total sales increased 264% YoY to $849 million. Contribution margin increased 400 bps YoY to 50%, adjusted EBITDA increased YoY from 13% to 27% and GAAP EPS soared to $1.73. Cash flows from operations increased to $168 million and co-founder-CEO Dave Girouard explained on the Q4 that “We generated more cash in 2021 than we burned in our entire eight-plus years as a private company”. CFO Sanjay Datta added that “the natural profitability of [our] overall model will trend to its equilibrium direction, which we believe is higher than where it is today”

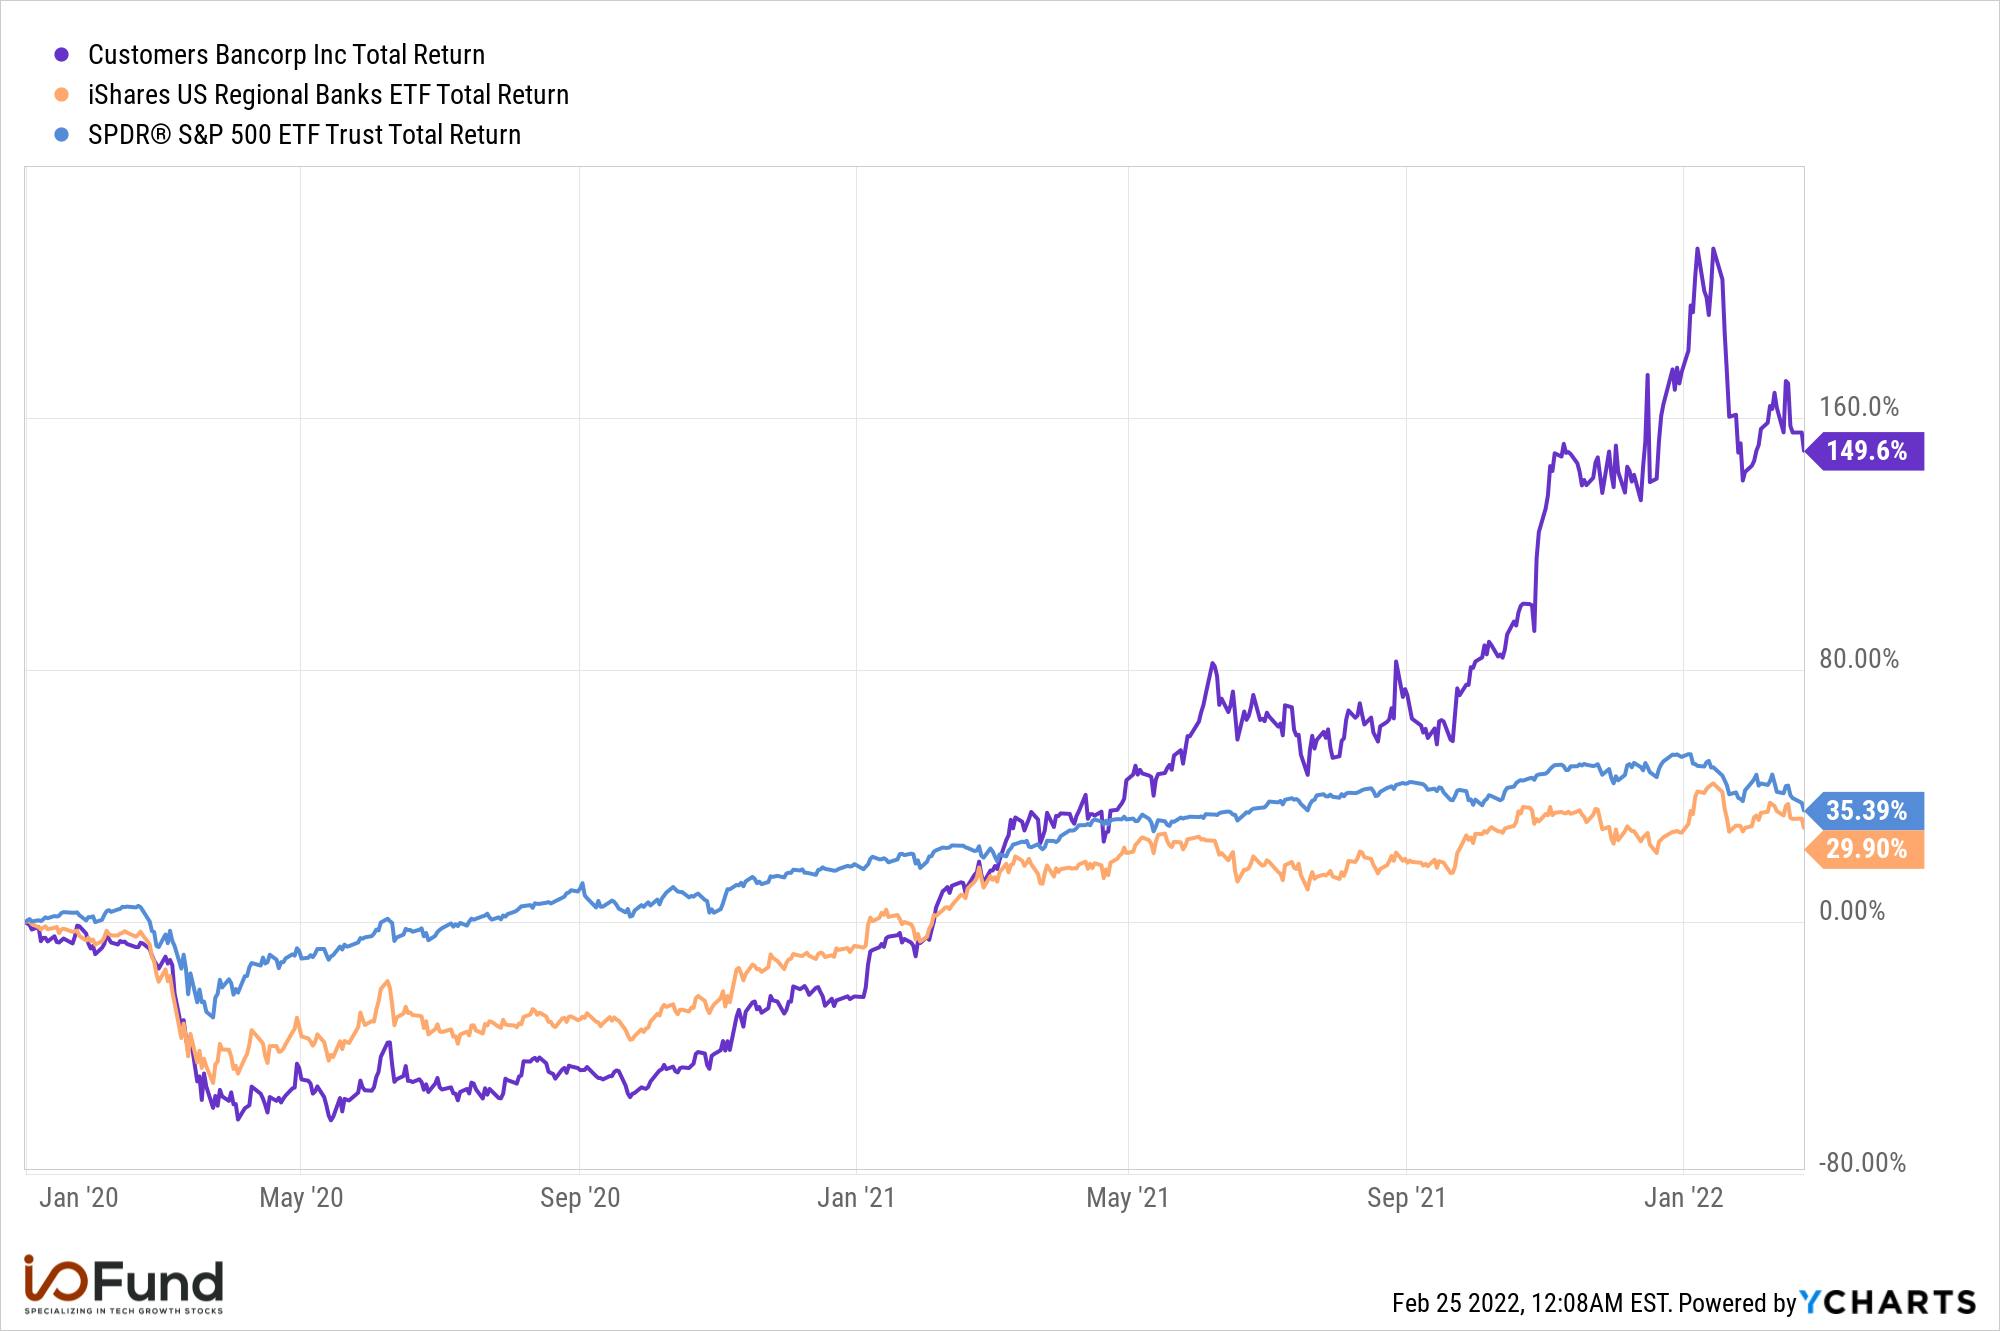
–          Upstart’s customers, banks, are outperforming: Upstart's partner banks are doing really well. For example, Customers Bancorp was its first bank partner and Customers' funding form landing page includes a URL link to upstart.com (https://customersbank.upstart.com/funding_formupstart.com/funding_form).  Customers Bank was the 2nd largest PPP lender, despite being a relatively small bank, and is a strong lender in personal loans. The company’s partnership with Upstart has likely allowed the company to outperform. Furthermore, high levels of deposits and liquidity levels following the COVID relief programs has created a unique environment for bank lending, and loan demand has been increasing.

–          Market opportunity is wide open: Upstart is currently in personal and auto loans. It can expand into the following credit markets: credit cards, mortgages, student loans, small business loans, point-of-sale loans and HELOC. Lending is one of the largest markets ($16T loans since 2014) and is still primarily based on legacy models developed before the cloud era.

–          Room for continued improvement: Conversion rates are still relatively low at 24%. As AI models improve from increased repayment data, the conversion rate will rise, leading to more volumes. Also room for continued improvement in fully automated approvals, which were at 69% of total loans.

–          Outperformed during COVID: Upstart disclosed in its 10k that during the peak of the COVID pandemic, 5.6% of Upstart’s borrowers had enrolled in a hardship program, less than half of the rate of online industry benchmarks. Furthermore, 95% of these borrowers exited the hardship program and resumed repayments. The COVID-19 pandemic provided valuable data for Upstart, further improving its models and likely also improving the confidence lenders have with its AI powered models. Prior to COVID, Upstart’s models had not been tested during market turmoil, so it was unclear if its AI models were superior. The pandemic may have been an inflection point for the company that proved that its models worked.

Risks:

–          Significant customer concentration: Two customers accounted for 83% of total revenues. High exposure to two customers naturally increases the risk of an investment. Furthermore, customer concentration from these two banks increased YoY from 81% of sales in 2020 to 83%. Upstart's largest customer is Cross River Bank, which originated 55% of 2021 loans for the company and also accounted for 56% of fee revenue. Cross River Bank is a partner to many fintech companies and is a conduit between Upstart and institutional investors that will ultimately buy its loans. As a result, the high customer concentration is not as concerning since its actual customer base is much broader. Furthermore, Upstart's reliance on Cross River Bank has been reduced and its second largest customer increased from 18% of 2020 sales to 27% of 2021 sales.

–          Cyclical market: Lending is inherently a cyclical market that is impacted by economic strength. If lending stalls, Upstart’s growth will also stall. However, the company is a technology company and while it may be impacted by short term cyclical trends, it is a long-term secular change to the entire industry that should outperform over time.

–          Credit exposure to sales has increased from 3% of Q2 sales to 6% of Q4 sales: Upstart is not in the business of collecting interest income, but a portion of its sales come from holding credit risk (loans). Loans carried on its balance sheet increased YoY from $78 million to $252 million in Q4 2021. Management explained on the Q4 call that the large increase in loans was for R&D purposes, as it expands into auto lending. CFO Datta explained that “Most notably, auto lending has been funded since inception entirely from our own balance sheet. This is, as always, a temporary incubation period until we reach the point where the loans can be directed to our bank partners and institutional investors at reasonable scale, which we anticipate will begin to happen next quarter”. However, in the company’s 10K, it disclosed that only $50 million of its $252 million in loans were auto loans; it is unclear why the company holds an additional $200 million in loans on its balance sheet. We will want to see Upstart’s loan balance decline going forward. Luckily, loans >90 days past due are low at just $287,000, so credit impairment risk is low.

Disclaimer: the I/O Fund owns a beneficial ownership in Upstart. The I/O Fund did not receive compensation for authoring this article from any of the discussed companies,

Confluent Update and Q4 Earnings

Below, we do another overview of Confluent’s product and an update following the Q4 earnings report. Here are two resources we recommend reading from our premium site for more information on the company.

Confluent Product Overview and Q3 Earnings

Big Data, Analytics and the Importance of ML

We believe open source with enterprise-grade features will become a key market moving forward as it solves for the downside of open source such as a lack of technical support. In Kafka’s case, the downside are things like a lack of data verification and having to manually connect to various data warehouses and other platforms to import/export data. Confluent also makes the argument that multi-cloud and hybrid cloud architectures are best served with a supported enterprise version for multi-tenancy security and data residency.

Notably, from my perspective, we are not betting on Confluent being used over the open-source version of Kafka in a direct competition, rather we are betting that Kafka will increase in importance. In this case, if Kafka continues to grow,  Confluent will take a percentage of this market share should more enterprises prefer a managed version of Kafka. 70% of the Fortune 500 use Kafka and 80% of the Fortune 100. According to this site it has a 12.5% market share.

Kafka is popular because of its high-performance real-time data streaming capabilities for mission critical applications. It is distributed and fault-tolerant, which means if one component fails, the system will still work. It can also scale to hundreds of clusters and billions of messages.

As discussed in our original write-up, Kafka was developed at LinkedIN to process the large number of messages per second the social media company handles. The framework enables event streaming, which helps messaging and data integration. There is high scalability with a publish/subscribe model that allows applications to share and create data in a serverless and microservices architecture. What Kafka solves for is the ingestion of events data in real-time with low latency with continuous read/write. If data remains at rest and/or in a mainframe environment, then companies cannot be truly data-driven. Kafka on the other hand can scale from a billion messages per day to a trillion messages per day.

Machine Learning and Kafka

Confluent opens up the amount of data that can integrated. The thesis is the increase in the number of companies that will need real-time data processing and real-time data analytics due to the increase in software driven architectures. The idea is that “data in motion” will replace data at rest, or batch data processing from traditional databases. This is also important for the real-time data streams that machine learning requires.

Kafka is more than a messaging system as discussed in this article and is used for business applications, streaming ETL middleware, real-time analytics and edge/hybrid use cases for the framework.

Here are some examples of how Kafka can be used outside of messaging systems:

  • Fraud detection through a machine learning pipeline for Paypal’s billions of messages
  • Data correlation in real-time for Lyft for matching maps, estimated time of arrival and cost calculations
  • Unity uses Confluent to be internally data-driven across R&D and cloud-services, plus to help drive the monetization network by rewarding players for watching ads and incorporating banner ads
  • Continuous calculations for betting platforms 
  • Drug discovery that is automated and scalable

Machine learning requires model training from historic data and also model deployment for scoring and predictions. Training can be done with batch yet scoring is partial towards real-time data. ML-powered applications run inferences on large volumes of data to return predictions very quickly (milliseconds). Rather than use Remote Procedure Calls (RPC) and frameworks like gRPC, some companies use a Kafka streaming model.

Here is how the company states the problem that Confluent seeks to solve:

“By becoming more software driven, more businesses will rely on real-time data. Confluent believes that data in rest is not able to meet the current and future demands of software-driven businesses. Daily batch processing and static real-time queries or “point-in-time” queries with stored data lead to an unnecessarily large and tangled architecture that is not capable of data flow between applications.”

Enterprise-grade Features

As with Spark and other open-source projects, there is a marketplace for making the frameworks easier to use. Confluent Kafka opens up the amount of data that can be integrated, for example, to combine transactional data (orders, inventory) with sentiment-driven data (likes, page clicks). This helps with predictive analytics and also machine learning because the “data flow” allows for algorithms to work as they are intended to.

In order for data to be in motion, Confluent’s platform connects data from many different sources. The company has over 50 fully managed connecters with Big Data and Analytics from Azure, Amazon/AWS, Google and Databricks. Without these connectors offered by Confluent, integrations between systems on an open-source framework can take months and also require intensive resources to manage.

Confluent is attempting to stave off competitors through “completeness of product” which touches on our multi-cloud and hybrid cloud discussion. We’ve discussed hybrid for a few years, yet our most recent write-up was here and here on Datadog. The recent write-up is worth a read if you want to know exactly why agnostic, best-of-breed products are sometimes outpacing Big Tech when it comes to cloud services and products. Datadog is the best example of a product where customers are avoiding vendor lock-in.

The completeness of product goes beyond multi-cloud and hybrid as Confluent is attempting to hold off competitors through data security and data governance, as well. Because data is often an organization’s most prized asset, it often has internal processes for compliance. There is often external, geographic compliance required by governments and industry agencies, as well, for global companies.

In order for completeness of product to work, Confluent needs to have a large geographic footprint. The company has added eight more regions for Confluent Cloud with an emphasis on APAC. There is also a new partnership with Alibaba Cloud. This can help offer differentiation for multinationals who have operations in China.

Competitors:

Regarding direct competitors, one example is Amazon MSK which offers a competing managed streaming service. This competitor is a good option for developers provisioning a Kafka cluster and a new streaming platform may not be needed in this case.

Rather than re-architect Kafka to be cloud-native, Amazon MSK cloud-enabled it as provisioned infrastructure. This means Confluent is stronger than MSK with scaling elastically by offering elastic quotas, which eliminates the need to size clusters for spikes. It’s also stronger on multi-tenancy security. Amazon MSK also does not offer Kafka Connect or Kafka Streams.

For more enterprise uses where Kafka Connect or Kafka Streams is required, then Confluent is more likely to be used to save development time and learning curve in writing Kafka Connects sinks and source.

Blockchain and Metaverse Potential

We’ve written at length about Confluent’s core use. However, there is a blockchain potential with Confluent with one case study right now with Dapper Labs.

“These are steps that attracted Dapper Labs. They're one of the most innovative NFT companies delivering fun and games on the blockchain. They have a number of decentralized apps, but one that's risen dramatically in popularity is called NBA Top Shot. To date, there have been over 10 million digital collectible transactions and Confluent is at the center of their data streaming architecture to facilitate these purchases. Dapper chose us to run their mission critical workloads because of the scalability and security of our cloud solution.”

There’s also a case for 5G networks needing data in motion. Here’s what was said about Dish on the call:

“A significant customer for both AWS and us is DISH Network. With their new 5G smart network, DISH is transforming how people and enterprises leverage data. They deployed Confluent Cloud over AWS to connect their network systems and customers with real-time data. This means that Confluent is a key part of their network's data backbone, starting with fault management and network resiliency functions to ensure network availability, and our enhanced collaboration with AWS is making it easier for customers like DISH to unlock data in motion everywhere.”

Confluent Q4 Overview

Confluent has been accelerating in revenue for four consecutive quarters and also across other key metrics.

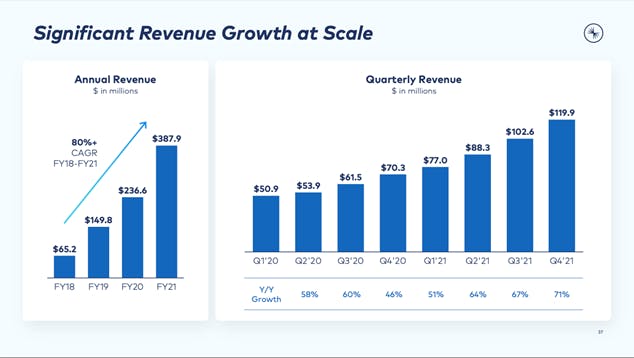
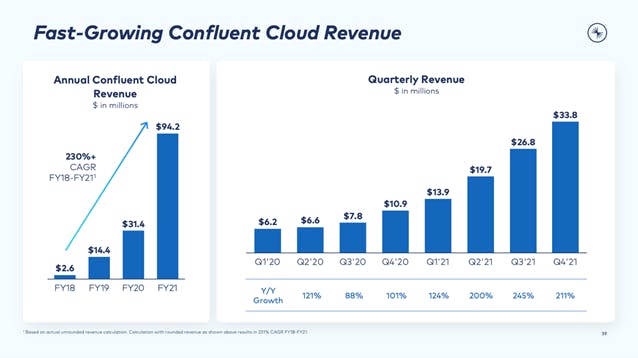
The company reported fiscal year 2020 revenue growth of 58% year-over-year and fiscal year 2021 revenue growth of 64% year-over-year. Confluent Cloud revenue growth for fiscal year 2020 was 117% compared to FY2021 revenue growth of 200% year-over-year.

If we look at Q4, total revenue is outpacing the fiscal year growth for 2021 and also outpaced Q3. Revenue growth for Q4 was at 71% — the highest growth rate from publicly available information which dates back two years to Q1 2020.

Cloud revenue did decelerate on a sequential basis, however, the company stated Q4 is often seasonal due to engineers being out of the office and on vacations. We will see if this picks back up in Q1. Regardless, on an annual basis there was a significant improvement. Notably, if we look at 2020 cloud revenue, we can see it’s lumpy at times with Q3 2020 being the weakest and Q2 2020 being the strongest.

In regards to “sandbagging” which is essentially the company guiding low and blowing out the guidance, which has happened a few times now, the company has a lot of moving pieces in terms of business model and likely wants to win trust with institutions. We are not opposed to this even if it means the price action was somewhat severe after the earnings report due to the guidance. What we are more concerned with is that Confluent continues to raise and beat, and that the underlying key metrics help us to substantiate the company’s longer-term strength.

Bradley stated the following in our last write-up and got pretty close to the revenue growth that Confluent actually reported:

Looking forward, management guided that Q4 revenue will rise 55% YoY $109 million, which would mark a deacceleration from the most recent growth rate of 67% YoY growth. However, this estimate is likely conservative, as management guided that Q3 sales would grow 46% YoY to $90 million and actual Q3 sales grew 67% YoY to $103 million. If we assume that Confluent beats it guide by a similar amount in Q4 as it did in Q3 ($13 million), then Q4 sales growth will accelerate to 73% YoY (this is merely an observation – no guarantees).If we assume that Confluent beats it guide by a similar amount in Q4 as it did in Q3 ($13 million), then Q4 sales growth will accelerate to 73% YoY (this is merely an observation – no guarantees).

Most notably, the company is reporting high remaining performance obligations growth of 91% year-over-year. This is higher than the 75% year-over-year we saw in Q3.  

Bradley discussed this in our last write-up:

Confluent also states that RPO is an important metric to monitor in order to measure the health of the sales pipeline. In Confluent’s first conference call as a public company (Q2), CFO Steffan Tomlinson explained that:

“Given the various revenue components and billing terms in our model, remaining performance obligations or RPO and current RPO rather than billings, are important metrics to measure the health of the business. RPO provides insight into the organic momentum of our business as it represents contractually committed revenue to be recognized in the future regardless of billing terms and variability in cloud consumption pattern”. RPO provides insight into the organic momentum of our business as it represents contractually committed revenue to be recognized in the future regardless of billing terms and variability in cloud consumption pattern

Financials Deep Dive

By Bradley Cipriano

A slight blemish during the quarter was Confluent’s customer growth, which lagged the growth in sales. Customers increased 65% YoY to 3,470, which lagged the 71% YoY growth in total sales. This drove subscription revenue per customer up 4% YoY to $31,000/customer, implying the recent acceleration in sales was driven by higher spending rather than customer growth.

 Generally, growth from new customers is more sustainable and higher quality relative to growth from increased spending. However, DBNRR remained robust at over 130%, signaling that customers are increasing their spend over time.

It is odd that customer spending increased but cloud growth deaccelerated during the quarter. Since cloud is a usage-based revenue model, increased spending should have driven cloud outperformance. However, cloud spending slowed from 245% YoY growth in Q3 to 211% in Q4. On the Q4 call, management explained that cloud was impacted by seasonality due to relatively lower spending over the holidays which lead to slightly slower rates of usage. While this may be true, it doesn’t explain the YoY deacceleration, as this trend would have existed in the year-ago quarter. Nevertheless, there is inherent variability in a usage-based model so investors should not expect an acceleration in sales every quarter.

Given the slowdown in customer growth and slight deceleration in cloud sales, the Street may be concerned that Confluent’s growth may be somewhat cannibalistic. This would explain the sell-off in its stock following otherwise strong results which reported a beat and raise. Investors may be wondering if cloud growth is coming at the expense of platform growth, or vice versa?

CEO-Founder Jay Kreps discussed this concern on the call and stated that the company is growing both in the cloud and in hybrid environments. He said that “we don't really view this as kind of a transition where we're just shifting from platform to cloud and just kind of swapping out customers from one product to the other. Effectively, we have to have kind of an outpost in each environment a customer is in. So, we expect to continue to see growth in Confluent Platform throughout this, and we think that's not a bad thing. That's a good thing.” CFO Steffan Tomlinson added that “what our customers are telling us is, by and large, they're running hybrid environments”.

A common issue with ramping cloud sales is that sales in other parts of the business stagnant, but we do not believe this is the case. For example, Confluent’s financial results remain high quality which suggests that cloud/platform sales are not cannibalistic.

For example, net deferred revenue (deferred revenue less accounts receivables) increased 105% YoY to $109 million, or 31% of TTM subscription sales. This was an improvement from the 26% and 23% level in Q4 2020 and Q4 2019, respectively. The rise in net deferred revenue relative to subscription sales signals that the company is receiving relatively more cash upfront, improving the quality of topline growth. If sales were cannibalistic, we would have likely seen a reduction in cash receipts and/or a deacceleration in growth. Instead, cash improved and sales accelerated. 

Furthermore, RPO also increased 91% YoY to $501 million, an acceleration from the 75% and 72% YoY growth rates in Q3 and Q2, respectively. While we need the 10K to fully assess the quality of RPO, total RPO represents 92% of management’s NTM guide, up from 81% in Q3. This improves the quality of forward sales and suggests that there is conservatism in management’s forward guide.

However, we do note that cash support for RPO declined slightly during the quarter. Total deferred revenue-to-RPO fell from 52% in Q3 to 49% in Q4. This trend is likely driven by the rise of cloud bookings, since cloud is a usage-based model and new cloud customers are typically on pay-as-you-go plans, which are billed in arrears.  On the Q4 call, CEO-Founder Jay Kreps explained that cloud accounted for 50% of ACV bookings in Q4, highlighting how cloud will be the majority of revenues going forward. As customers become more familiar with Confluent’s products, they will likely increase their commitments and convert from pay-as-you-go customers to larger customers that pay upfront. As a result, we view the slight decline in upfront cash receipts as a natural progression for the firm and not a major concern at this time.

Cash Levels and Stock Based Compensation

Confluent recently raised nearly $1 billion in cash following a convertible debt offering in December.  Following this raise, the company has over $2 billion in cash, which is well above its current cash burn of ~$108 million (based on TTM free cash flow). The company is focused on growth, so investors should be prepared for continued losses and cash outflows. On the Q4 call, management highlighted that their near-term priorities are to continue to invest in innovation and to expand its geographic footprint, signaling that growth is being prioritized over near-term profitability.

Nevertheless, given Confluent’s relatively large cash balance, we likely should not expect an equity raise in the near term. However, the company will still be dependent on capital markets until it is sustainably cash flow positive. Looking forward, the Street expects EBITDA (a proxy for cash flows) to remain negative through at least FY2023, suggesting that Confluent will remain reliant on capital markets for the next few years. Importantly, there are signs of improvement, as free cash flow margin improved from -30% in the prior year to -22% in the current quarter.

Furthermore, Confluent has relatively high levels of stock-based compensation (SBC), which subsidizes cash used for working capital but dilutes shareholders. Stock-based compensation has trended near 48% of quarterly sales for the last two quarters and was 40% of TTM sales. This is relatively high and ranks in the top 10 for cloud (shown below), but is a function of Confluent recently going public (which frontloads SBC). We expect SBC to decline as a percentage of sale going forward as it laps the IPO and topline growth outpaces expenses.

Nvidia Stock: How to Value the Metaverse

Nvidia On How The Metaverse Can Overtake The Current Economy

This article was originally published on Forbes on Feb 18, 2022, 12:57pm ESTForbes on Feb 18, 2022, 12:57pm EST

I had the opportunity to talk with Richard Kerris, vice president of the Omniverse development platform at NVIDIA. In the interview, I asked Kerris questions that are on every investor’s mind, including pointed questions about where realreal revenue growth will come from, how large is the addressable market exactly, plus what CEO Jensen Huang meant when said that the “Omniverse or the Metaverse is going to be a new economy that is larger than our current economy.”

The Metaverse is particularly challenging for investors as the opportunity is enormous yet getting the timing right and also choosing which companies will participate in the futuristic yet burgeoning virtual economy will not be easy.

Here are the main points we discuss in the video:

  1. Why the Metaverse Can Exceed Our Current Economy
  2. How Universal Scene Description provides the portal to the Metaverse
  3. The Importance of Ray-Tracing and the RTX Platform
  4. Industrial Virtual Worlds

Watch the Nvidia Omniverse interview with Beth Kindig and Richard Kerris:

Candid Interview with Nvidia: Can the Metaverse Drive Real Revenue Growth

Last year, Nvidia CEO Jensen Huang said, “Omniverse or the Metaverse is going to be a new economy that is larger than our current economy.” Many investors look for large addressable markets, so to hear a CEO state that a technology could surpass the size of our current economy is a statement to pay close attention to. In the interview, I asked Kerris what Huang meant, and Kerris’ answer was quite simple: the Metaverse will exceed our current economy because it will be many times larger than the internet.

Here is a direct quote:

“[The Metaverse] is going to be many times bigger than the web because of what a virtual world can do for business, for education, for medical, for all sorts of things including entertainment; we’ve just begun to scratch the surface of these possibilities […] You’ve probably heard the term digital twin. One example is what it’s going to do to revolutionize the industrial market, design and manufacturing. Well, a digital twin is a true-to-reality twin in synthetic worlds of what happens in the physical world. We are seeing this transform these things because when you can make decisions in that synthetic world before you commit to it in the physical world, you have a lot of cost savings.” –Richard Kerris

According to Kerris, in simple terms, the Metaverse is virtual worlds. Rather than being a Ready Player One type experience where you are strapped down with heavy equipment, the Metaverse will instead offer more 3D experiences or environments that replace our current digital experiences.

The Real Value of 3D Virtual Worlds

Industrial 3D environments are especially ramping up as 3D virtual worlds result in cost savings, are safer for employees and allow for more iteration on designs. For example, BMW manufactures 2.5 million cars per year, and the company has made a digital twin of its factory to reduce any downtime when the company has to change its process for a new model. In the physical world, a new model affected production whereas now the company can change its process in a synthetic world to eliminate errors and downtime. The new approach helps BWM view their entire factory in simulation mode with photorealistic detail. Another advantage is that data is available immediately and any changes can be made in the planning stage itself, which saves time and money.

Another example as to the value of virtual worlds is route planning. Factories can perform route planning in a virtual warehouse in Nvidia’s Omniverse that allows orders to be optimized for automated order picking scenarios. Essentially, warehouses are able to reoptimize factory floor operations as new orders come in or as robots go offline. This optimization training can also save quite a bit of money.

Universal Scene Description (USD) Provides the Portal to the Metaverse

The portal to the Metaverse is Pixar’s Universal Scene Description. USD is hailed as one of the most important tools for building the Metaverse as it allows for a persistent experience to where the Metaverse is more connective and has consistency. Metaverse experts tend to reference the internet as a baseline for how the Metaverse will become widely adopted. In this Web 3.0 reference, Pixar’s USD functions like the connective HTML of 3D worlds.

In the early days [of the web], once we started connecting things, we didn’t realize just how big it could be … one of the things that happened at that time was HTML. HTML allowed for a consistent plumbing or consistent connective tissue between the websites so you didn’t have to have a specific browser or a specific extension installed. Now, we go from one website to another and the videos play the same, the text is great, the images, etcetera. Much of the same kind of thing is going to happen with these virtual worlds because once you can teleport from one virtual world to another virtual world, and the experience of the worlds is about the content instead of the lighting and the materials, we will see a tremendous opportunity take place.” –Richard Kerris, on Universal Scene Description (USD)

Sign up for I/O Fund's free newsletter with gains of up to 1100% – Click here
USD)

Sign up for I/O Fund's free newsletter with gains of up to 1100% – Click here
Click here

With persistent experience, the Metaverse can rival Web 1.0 and Web 2.0, as it allows for virtual worlds to break out of siloed experiences. The USD open-source framework allows for the exchange of 3D data and has become a universally supported plugin for developers and creators to use as a baseline.

Nvidia’s Omniverse supports the USD plugin as a portal to access Nvidia’s rendering and graphics products. Apple, Autodesk, and many other companies are also using the framework to create a persistent experience for developers and creators. For example, the iPhone’s LiDAR scanner allows you to scan objects in USD. The scanned images are saved in a USDZ compressed file to be used across other platforms.

How Real-Time Ray Tracing Catalyzed Virtual Worlds

Nvidia was originally a hardware company that transitioned to also become a software company, which uniquely positioned the company to deliver ray-tracing to the Metaverse market. Ray-tracing allows for the simulation of light and physics to render graphics, resulting in a much more realistic and complex virtual world. After commercially releasing real-time ray tracing on a chip, Nvidia was then able to leverage RTX GPUs and ray tracing extensions for the renderer in their software simulation platform Omniverse.

“There was the big boom moment that took place for all of these things to happen. The first part of that was RTX, which is real-time ray tracing on a chip. It was really a milestone that will be forever remembered. Ray-tracing allows for photorealistic rendering to happen in real time. That means that the worlds we are talking about look more and more indistinguishable from the real world […] It was such a moment at Nvidia when that happened. I remember the enthusiasm of the computer graphics community. For those of us who have been in [the industry] for awhile, we dreamed of this 30 years ago. We knew it was that impactful of a moment.” -Richard Kerris

Ray-tracing renders 3D models through the physics of light. Through the physical simulation of light, subsurface scattering and light diffusion helps computer vision see things similar to how a human retina works.

Companies like Pixar have been able to do 3D rendering and computer-generated imaging for some time in films, television and gaming, however, Nvidia improves this process by adding the real-time capabilities to ray tracing through the RTX platform. Formally, it could take weeks to render animation that is only a few seconds long whereas the RTX platform reduces this time by offering more real-life retina vision. The RTX platform also offers better path tracing and denoising, which was first used for gaming, and now lends itself well to the virtual worlds of the metaverse.

More on the RTX Platform

The RTX platform provides APIs and SDKs running on Turing GPU architecture for applications to be built with ray tracing and AI-enhanced graphics. More than 200 games and applications use RTX including Minecraft, Fortnite and Cyberpunk. According to Nvidia’s previous earnings call, an estimated 25% of the installed base had adopted RTX GPUs. This is due to an overhaul on GPU gaming architecture as Nvidia has combined Turing RTX GPUs with Ampere RTX GPUs. This allows for AI rendering called Deep Learning Super Sampling (DLSS) to be combined with ray tracing. The success in gaming will only help the proficiency of real-time ray tracing and AI enabled super resolution capabilities for the Metaverse and 3D virtual worlds.

Industrial Virtual Worlds

Autonomous driving is one of the more compelling use cases for the Metaverse given the number of times autonomous vehicle systems were deployed on the roads and yet were pulled from the market due to accidents. Meanwhile, attempting to train models in the physical world (or analog world as Kerris puts it) can take a very long time.

“If we go back to the concept of a digital twin, a digital twin doesn’t have to be a factory, it can be a city. We have companies like Ericson who have built digital twins of cities for antenna propagation for the 5G network […] we’ve been using digital twins in that environment to have a synthetic world that these cars can be trained on that is indistinguishable from the real world, it’s exactly the way things are laid out, but you can have many cars being trained in that world at the same time. What’s most important is you can throw all kinds of predicaments at it so that it learns [..] that those cars in the analog world may never have encountered [..] there’s a much higher degree of confidence in how a [synthetically trained vehicle] will respond.”

The Isaac Sim toolkit is a robotics simulation and synthetic data generation tool that helps increase accuracy for robots. It supports a SDK and robotics operating system frameworks package to develop robotics AI and navigation applications. This helps to improve AI-based computer vision by improving the data sets, which in turn are used to train robots for increased understanding of their surroundings. The end result is fewer accidents and less human intervention.

Conclusion

It’s understandable if investors are skeptical of the Metaverse as the technology is essentially in the early adopter stage. My conversation with Nvidia helps to break down these walls around the virtual economy and how big it can get, which is partly because the internet as we know it is ready for disruption if we are to enable a new depth of digital connection.

Additionally, industries are able to reduce errors and increase productivity by using synthetic virtual worlds for training models and robots. Digital twins for factories, cities and other virtual assets can be used to get a product right the first time it is deployed.

Nvidia is a company that is not standing still. Last August, I had predicted Nvidia would surpass Apple to become the world’s most valuable company. The Omniverse is one of many reasons I believe this prediction is still on track to come true.

The I/O Fund is a team of analysts who share their research publicly as they build a portfolio of 20 stocks. Our team has record results for a retail Fund and we also have four-digit gains on some of our free newsletter coverage. You can learn more about our premium service by clicking here or sign up for our free newsletter here.by clicking here or sign up for our free newsletter here.

Disclaimer: This is not financial advice. Please consult with your financial advisor in regards to any stocks you buy.

Bill.com: Transformational M&A leads to accelerating growth

Bill.com is a fast-growing company that is benefitting from a strong cohort of customers: small-medium businesses (SMB). The company has also completed a couple of transformational M&A transactions in recent quarters which have led to successful cross-selling of solutions, inflecting growth at the core company and the acquired businesses. We believe that the company’s large asset of B2B payment data gives them an advantage in understanding their end market and allows them to efficiently grow. Furthermore, network effects should sustain topline growth going forward. I discuss the company’s fundamentals in more detail below, followed by a discussion of Bill.com’s recent financial results and risks to our thesis.

Bill.com’s Market Position and hidden assets

Bill.com is a back-end accounting software platform that was built to facilitate transactions for small-medium businesses (SMB). The company’s niche is facilitating accounts receivables (AR) and accounts payable transactions (AP), which is the most common business transaction. Every AR transaction involves an AP transaction, and Bill.com has positioned itself to be between this essential business function.

The company’s platform includes accounts payable automation which streamlines the entire process: from bill receipt, to approval, to payment and then entry into an accounting system such as QuickBooks. Bill.com provides a portal that allows customers and suppliers to link their bank accounts and to make electronic payments, improving payment times. If the invoice is mailed, customers can scan the invoice and Bill.com’s AI-enabled software can automatically input the key details. Furthermore, all invoices are stored and searchable which helps settle outstanding AP issues.

The AP automation also allows for bill approval, which Bill.com states is one of the top three uses of its software. Inherent in the approval process is the separation of duties, which assigns roles such as payor, approver, clerk or accountant. This ensures the checks and balances of a back office and helps reduce fraud and provides an audit trail for auditors.

The AR automation solution provides a template to create an invoice and sync with accounting systems. Furthermore, if both parties of the transaction are on Bill.com’s network, then customers can see if the invoice has been viewed and if it has been authorized. Simply put, the AP and AR solutions allow for easier payments and trackability.

Being positioned between AP and AR transactions gives Bill.com two significant assets: a data asset and a network. The data set includes payment data from over 130,000 customers, 3.2 million network members and millions of transaction details. Having access to B2B payment data is a significant advantage in today’s AI/ML-enabled world, and Bill.com is able to leverage this data to find insights that fuel topline growth. In fact, payment data was estimated at a total value of $58 billion in 2020. Bill.com disclosed that data is key to its success. It stated in its 10-K that:

“We recognize and understand patterns that our customers may not, because we see the aggregate – millions of accounts payable and accounts receivable transactions per month. We use what we learn to continuously improve the platform and the customer experience.”because we see the aggregate – millions of accounts payable and accounts receivable transactions per month. We use what we learn to continuously improve the platform and the customer experience.”

Furthermore, this data is not an asset shown on the balance sheet, nor does it directly impact the income statement. However, access to this data allows Bill.com to better understand its customer’s needs, leading to outsized growth over time.

Another asset that isn’t shown on the balance sheet is Bill.com’s network. When a customer signs onto the platform, they also add on their clients and suppliers as the other side of the AR/AP transaction. This increases the network beyond customers, and Bill.com has built a B2B payment directory of over 3.2 million network members. These network members are all potential customers, leading to a low-cost customer acquisition strategy. As more customers sign up, they add clients and suppliers as AP/AR transactions, further increasing the network and providing more payment data. This network effect can lead to robust, high margin growth in the future as the business scales.

Catalysts for future growth

Bill.com has reported a series of quarters with accelerating growth, highlighting both the success of its cloud-based solutions and the strength of its main customer cohort: SMB.

If economic activity picks up, especially among SMB, then AP and AR transactions will also grow, benefitting Bill.com’s usage-based business model (discussed in more detail below). SMBs appear well-positioned to succeed in the digital economy. This is because major corporations are providing tools that help SMB better compete with legacy enterprises.

For instance, SMBs can quickly build a working e-commerce website on Shopify without hiring and employing an army of web developers. An SMB can also rent server capacity from AWS without investing large amounts of upfront capital to run its operations at scale.

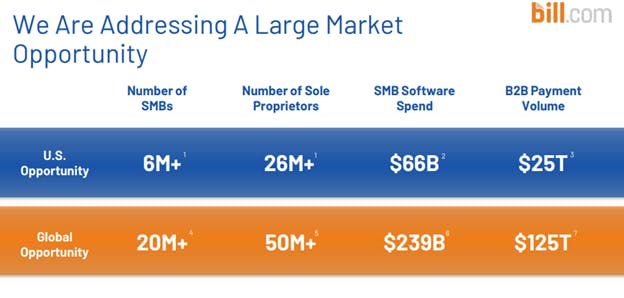
The SMB market opportunity in front of Bill.com is large. There are over 6 million SMB in the US and 20 million globally. As of the latest quarter (Q2 FY2022), Bill.com has captured just over 2% of this market. With an annualized core revenue run rate of $2,000 per customer, Bill.com’s total addressable market is around $70 billion.  

Furthermore, the Small Business Administration (SBA) has prioritized increasing capital to small business owners in the U.S. The SBA disclosed that in 2021, they had provided $45 billion in loans through more than 61,000 individual loans, this was up from $28 billion in the prior year. This also excludes the over $500 billion in PPP loans provided to SMB during 2020. Clearly, SMBs are flush with capital, which should lead to increased business activity for this cohort in the near term.

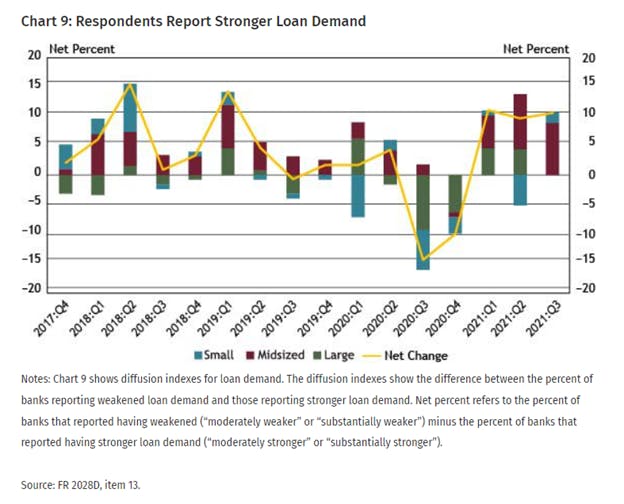
Data from the Kansas City Fed showed that SMB loan demand remained robust in 2021 (excluding PPP loans). The chart below shows that net change in loan demand for small businesses, and “about 10 percent of respondents indicated stronger loan demand in the third quarter, which is the third consecutive quarter of net increases in loan demand”. More recent data from the New York Fed showed that credit card balances increased $52 billion in Q4, the largest increase in the 22-year history of the data. However, credit card debt remained $71 billion below 2019 levels, suggesting continued room for growth. The rise in credit card balances may be a sign that SMB activity was robust in Q4, as credit cards are often a short-term funding tool used by small businesses. Bill.com also has exposure to this with its corporate card product, discussed below.

Moreover, Bill.com has made a couple of transformational acquisitions in 2021 that allow it to cross-sell solutions. The company acquired corporate card issuer Divvy in June 2021 for $2 billion. When Divvy was acquired, sales were growing over 100% with annualized revenue of around $100 million. Bill.com’s CEO-Founder explained on during the Q4 2021 call that the Divvy acquisition allows for a “sizable cross-sell opportunity that we will aggressively pursue”. He added that the Divvy acquisition “more than doubled” the company’s domestic addressable market.

We can see signs that there has been significant cross-selling between platforms. For instance, Divvy customers have increased from 7,500 in March 2021 to 15,500 customers as of December 2021. At the same time, Bill.com reported that Q4 customer count had increased 8,100 QoQ in the December quarter to 135,000, which was well above trend of ~5,000-6,000 quarterly additions. The robust customer metrics between the two segments suggest that Bill.com has been successful in cross-selling both solutions. Further highlighting this trend, Divvy’s sales increased 188% and 187% in Q2 and Q1 FY2022, respectively, an acceleration from its growth rate of 100% before it was acquired. Likewise, Bill.com’s organic sales have accelerated for five consecutive quarters.

Another recent acquisition was Invoice2go, which was acquired in September 2021 for $674 million, which added 220,000 customers to the platform and $25 billion in annual invoice volumes. On the Q2 FY2022 call, CEO Lacerte explained that the acquisition was driven by management’s intention to cross-sell payable solutions to Invoice2go customers, and vice versa. Highlighting the momentum in Bill.com’s ability to cross-sell solutions, management recently raised their full-year sales guide for Invoice2go from $24 million to $34 million, an increase of 42%.

However, it should be noted that customer count declined QoQ at Invoice2go and deaccelerated for Divvy in the most recent quarter. Management stated this was due to higher credit standards and onboarding criteria after being acquired. I discuss this risk and others in more detail further below.

Financials

As mentioned above, Bill.com has reported five consecutive quarters of accelerating topline growth. Organic sales most recently grew 85% YoY to $97 million, an acceleration from the 78%, 73%, 45%, and 38% YoY growth rates in the prior four quarters. The continued acceleration in core sales has been driven by its ability to cross-sell solutions and strength with its SMB cohort.

Total sales increased 190% YoY to $156 million in the latest quarter. Sales were driven by subscription fees (31% of Q2 FY2022 sales) and transaction fees (68%). Subscriptions are fixed payments while transaction fees are based on usage and include interchange fees on a fixed or variable rate per transaction. Bill.com also earns interest on funds held for clients, which was 1% of total sales.

Subscription sales increased 85% YoY to $49 million, or 31% of Q2 FY2022 sales. The increase was driven by a 24% YoY rise in core customer count, which increased to 135,000 customers and a rise in ARPU. Bill.com also adopted a new accounting standard which added $4 million to subscription revenues and signed a new partnership agreement with Bank of America that added ~$6 million in subscription sales. Absent these one-time items, organic subscription sales increased 51% YoY, which still represented an acceleration from the 43% YoY growth rate in the prior quarter.

Accounting for the majority of Bill.com’s recent topline outperformance was growth in transaction fees, which increased 314% YoY to $106 million, or 68% of Q2 sales. Transactions fees followed a 62% YoY rise in total purchase volumes (TPV), which increased to $56.4 billion. TPV per customer also increased 31% YoY to $418,000, highlighting the company’s ability to successfully cross-sell solutions from recently acquired companies.

Further fueling Bill.com’s transaction fees was an increase in the take rate, which rose 3 bps YoY to 10 bps, following a shift to variable-priced products. Payment volumes on Bill.com’s core platform increased 36% YoY to 9.8 million and revenue per transaction also increased 62%, following the higher take rate. On the Q2 call, CFO John Rettig explained that transaction revenue was driven by “strong TPV growth, increased adoption of our ad valorem products and increased usage of our spend management card solution”. On an organic basis, transaction revenue increased 121% YoY.

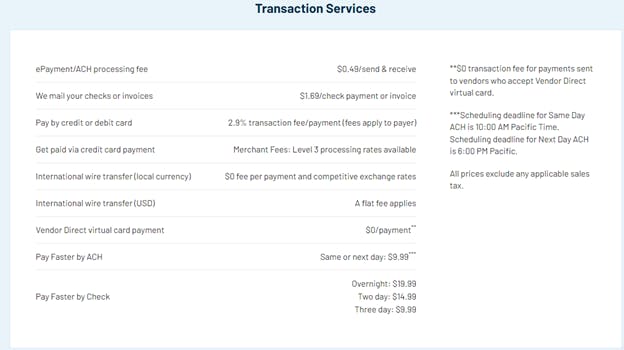
The growth in transaction fees has been a key driver of Bill.com’s success, and there is room for continued improvement since new customers typically ramp spending over time. According to Bill.com’s pricing schedule, credit and debit card fees are variable, suggesting that there has been a material rise in credit card usage in recent quarters. This ties back to the fundamental data discussed above, as the New York Fed stated that credit card usage grew at the fastest pace in Q4, dating back 22 years. However, credit card balances still remain below 2019 levels, suggesting that there may be room for continued growth.

Adjusted operating profit was $3.4 million and non-GAAP EPS broke even at $0.00, which beat estimates by $0.17. The market tends to award companies that report consistent profitability and Bill.com is likely nearing that threshold. Bill.com had $2.8 billion of cash on balance as of Q2, allowing the company to continue to scale its business. Furthermore, Bill.com held $3.4 billion of customer funds, up 39% QoQ driven by the ramp in TPV discussed above. If interest rates rise, Bill.com’s float could be a material contributor to its topline. CFO Rettig explained that if the federal funds rate rose 100 bps, its annual float revenue would rise to ~$35 million, or 9% of TTM sales.

Looking forward, management expects sales to be $158 million, up 164% YoY and besting estimates that expected growth of 146%. Q3 sales are expected to be driven by 67% organic growth while Divvy is expected to increase 132% YoY. Non-GAAP EPS is expected to be a loss of -$0.16, which was better than the initial -$0.22 loss expected by the Street. Management also raised their full-year 2022 topline estimate to $600 million. Organic growth expectations were increased from 55% to 69% and Divvy sales growth was raised from 115% to 132% growth. Invoice2go sales are expected to be $34 million for the year, up from the initial guide of $24 million.

Valuation and risks

Bill.com is performing strongly, likely as a result of its large data asset of B2B payment data that gives it insights into what its customer’s needs are. Bill.com has leveraged this data and has made some transformational acquisitions that have increased cross-selling opportunities, leading to accelerating growth at the core platform and the newly acquired companies. Following this success, the company trades at a premium.

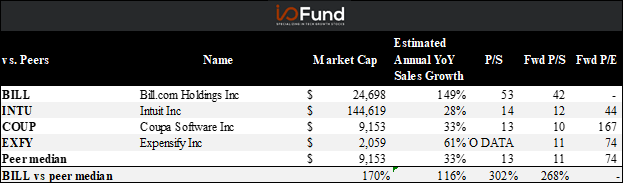
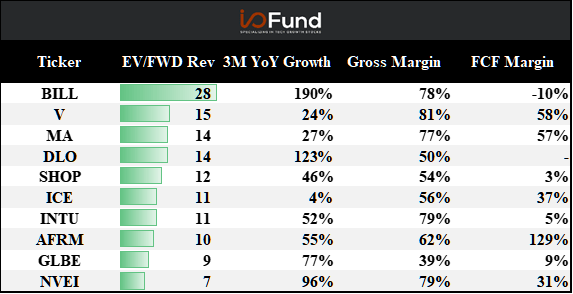
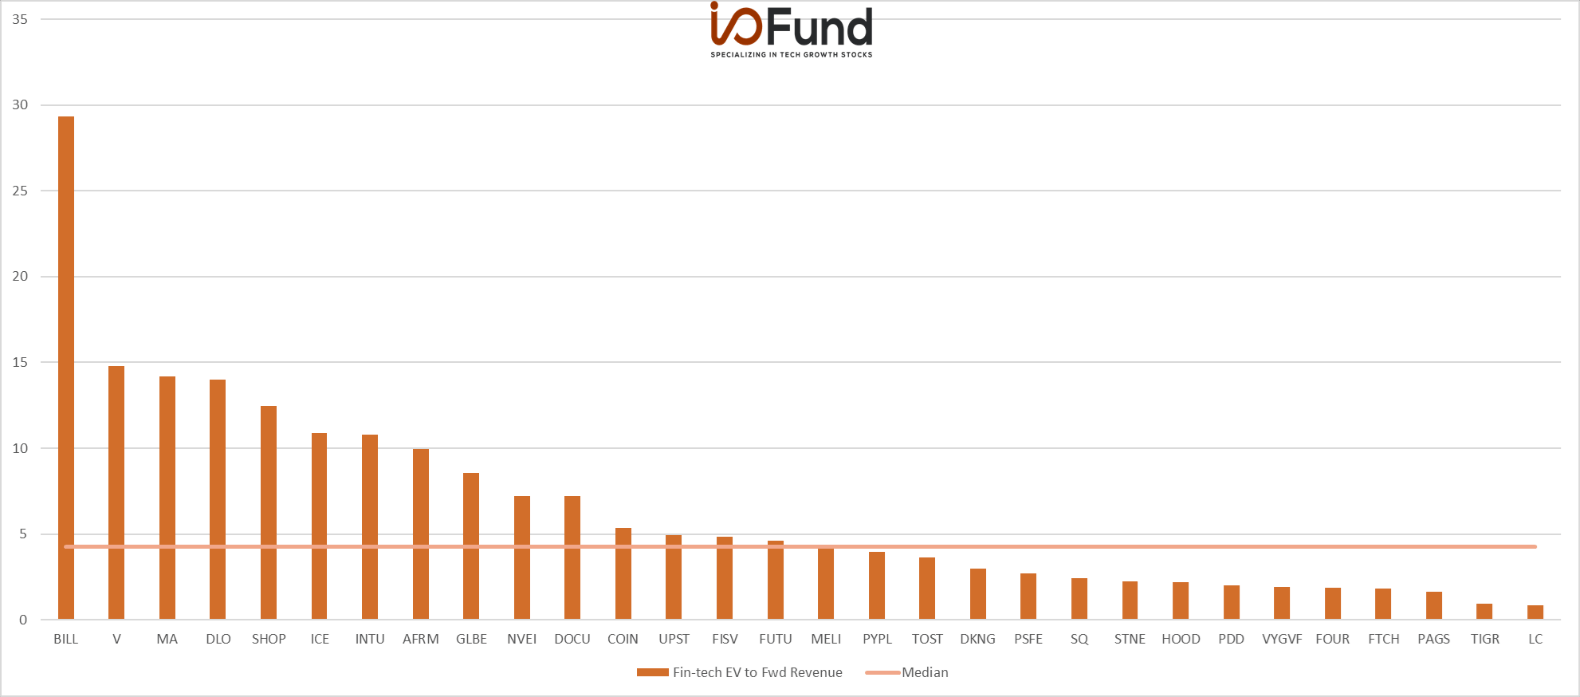
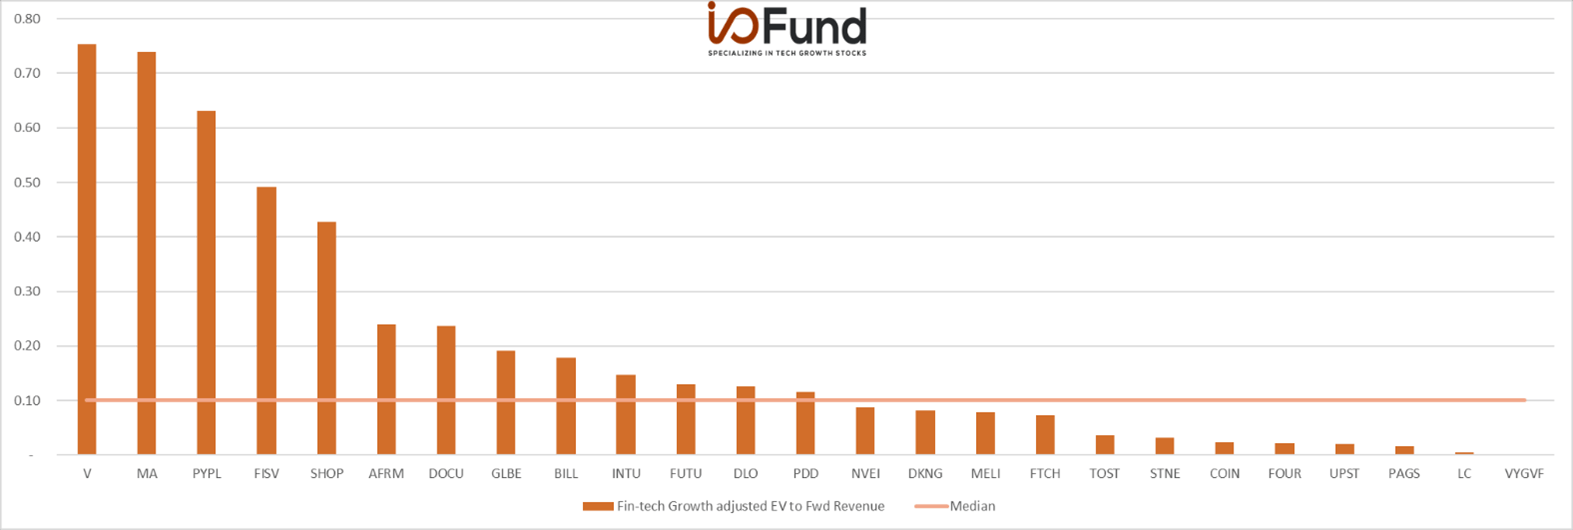
As shown below, Bill.com has outsized growth relative to peers, which has contributed to a premium multiple. The company trades at a 42x 1-year forward P/S multiple, which is well above peers. However, Bill.com has a largely untapped market in front of it, and has captured just 2% of its market opportunity, suggesting that there is a long runway of growth ahead of the company. The company’s data asset of B2B payment data and network effects from signing on new customers also support a premium multiple. Moreover, considering the nearly $70 billion software opportunity in front of it, coupled with the uncapped usage-based revenue, there is a significant opportunity for growth.

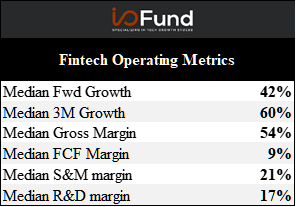
While Bill.com trades at a premium, this is due to its outsized growth rate. Viewed differently, if Bill.com's growth slows down to the per median rate of 33% and its multiple compresses to the peer median of 11x, then Bill.com will grow into its valuation in less than five years. However, we expect Bill.com to grow faster than peers given its unique data advantage, network effects, and untapped market opportunity.

Other near-term risks include a slight slow down in customer growth at Bill.com’s recently acquired companies. While there are clear signs of cross-selling, ultimately customer growth needs to be sustained to support Bill.com’s multiple. However, management explained that the slowdown was driven by higher credit standards onboarding new clients, which we view as a positive.

The company has also taken on relatively higher levels of risk by entering the credit card market. This has led to higher variable fees, which has led to outsized growth, but also introduces the possibility of fraud and liability. However, fraud losses have been low and the increase in credit standards discussed above should limit this risk. Furthermore, a decline in credit card usage would pressure Bill.com's grow rate.

Bill.com is also beholden to having a strong relationship with its partners, especially Intuit. Bill.com’s platform is integrated into Intuit’s QuickBooks product, and the company has an agreement with Inuit that extends until June 2023. The agreement enables continued support of Bill.com with QuickBooks. While this is a risk, the longer the two platforms are integrated, the greater the lock-in, which likely results in a symbiotic relationship between the two platforms.

In conclusion, Bill.com is positioned between AP and AR transactions which allow the company to capture valuable B2B payment data. The company’s main cohort of customers, SMB, appear well funded and have the tools to compete in the digital economy. Bill.com has also completed a transformational acquisition with Divvy, which has led to accelerating growth at both companies and increased cross-selling opportunities. While there are risks, such as its partnership with Inuit and expansion into credit cards, we believe that Bill.com will continue to perform well given its unique position that benefits from increased SMB business activity and network effects.  

Knox Ridley on Why Meta Platforms (FB) Tumbled After Earnings

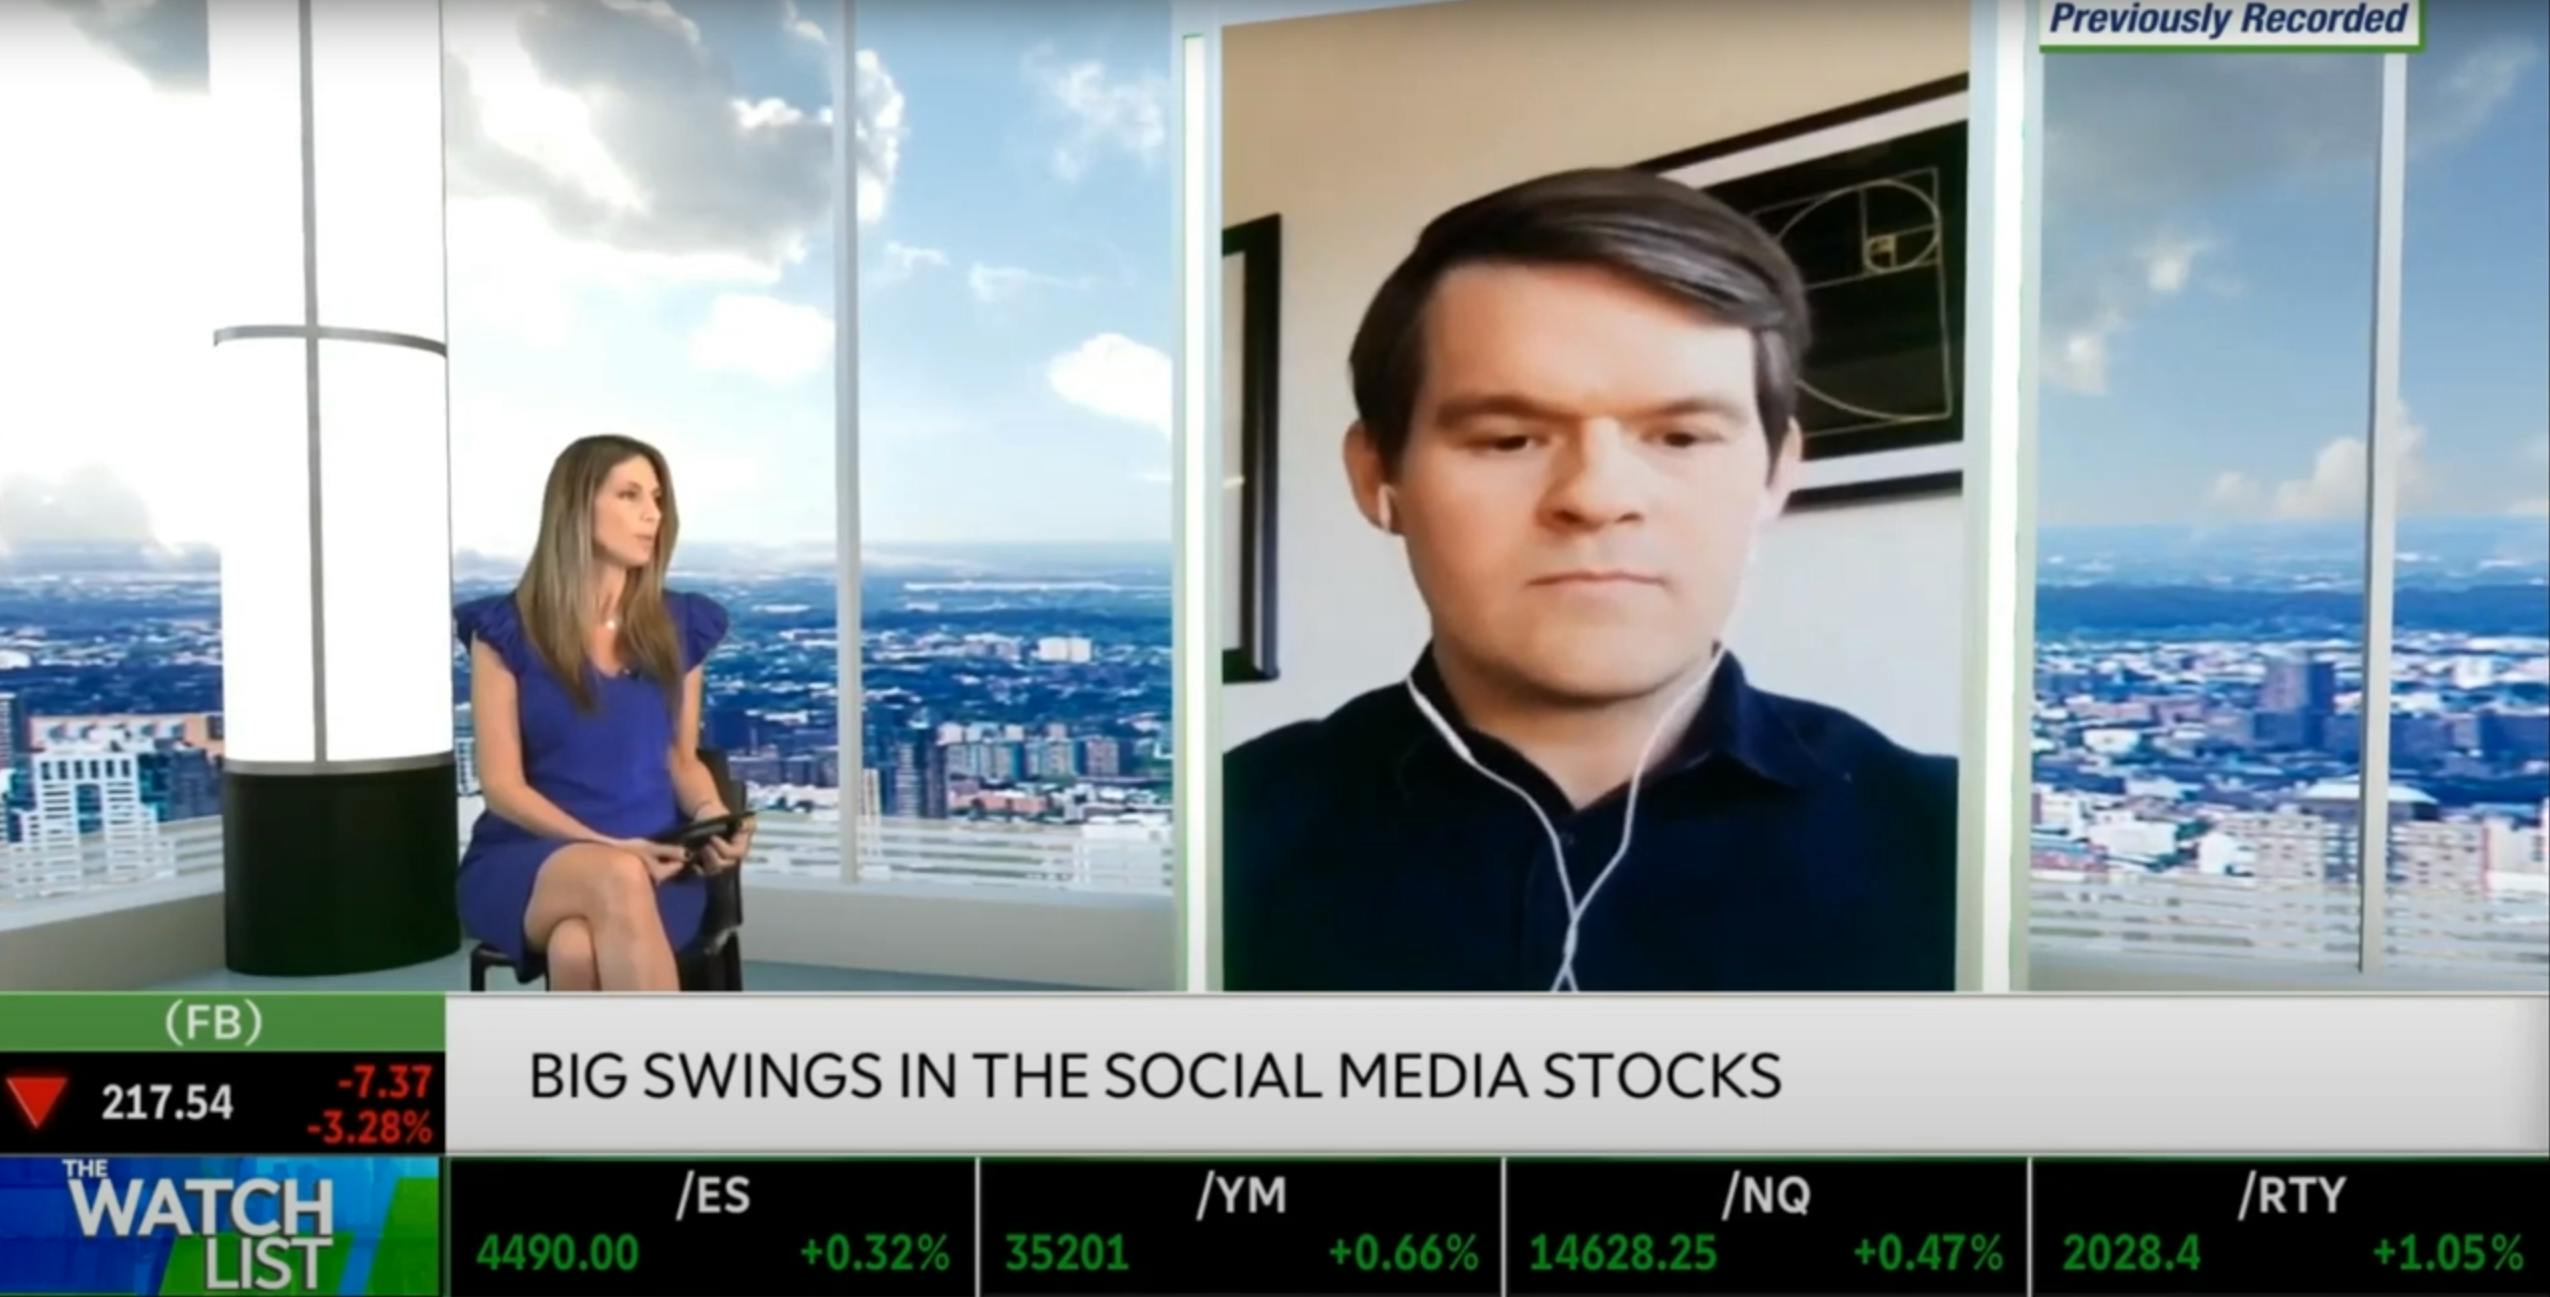
I/O Fund’s Portfolio Manager Knox Ridley spoke to Nicole Petallides from the TD Ameritrade Network. He rightly predicted that Meta Platforms (Facebook) would be under significant pressure and Snap would be a winner. Here’s an overview of the discussion.

Why did Meta Platforms shares fall?

I/O Fund has followed Facebook’s business model for the past 3-4 years. We had warned our readers that the company’s business depends on Apple. Most people think that Facebook is an ad company with about 2 billion daily active users (DAUs). They monetize that data and do ads which is accurate. However, most people do not realize that the growth that has made them the powerhouse was because of the third-party data from Apple. Our stance is that Apple owns the real estate on iOS, and everyone else is renting.

“The reality is that Apple built the ecosystem and it’s theirs to monetize as they see fit. In this equation, consumers matter too, and data should not have been collected without permission in the first place.”

Apple changed the landscape by altering IDFA, a unique id within your iPhone that allows advertisers to track your behavior. So, Facebook combined this data and their data and sold the most valuable consumer data. We knew that Apple would take away this data and the Wall Street Analysts ignored this critical risk. I/O Fund's research process, which gives importance to the company's technical aspects like the products, is the clear winner in the long term.

Will you buy Meta stock?

The story of Facebook has materially changed. Everyone likes to focus on the financials like the cash flow and the balance sheet. However, to identify the winners in tech investing, you need to understand the product very well.

In the case of Facebook, the product that has helped to get the cash has been changed materially. They have mentioned in their earnings call that the impact of the iOS changes will be around $10 billion. This is a significant chunk of revenue. Few investors are buying the dip due to the Metaverse. We believe that it will take a few years before Metaverse can be effectively monetized and also Facebook’s history of entering new businesses is not that great. So, we will not be buying the dip.

Often, Wall Street Analysts find it difficult to differentiate companies that will outperform as they don’t have the technical knowledge to understand the products. This distinguishes our company from the competitors as we successfully manage a tech-focused portfolio.

Sign up for I/O Fund's free newsletter with gains of up to 1100% – Click hereSign up for I/O Fund's free newsletter with gains of up to 1100% – Click hereClick here

Will Snap be a winner?

We started to cover Snap on our premium website in July 2019. We noticed the strong app sessions for Snap and the company's plans to monetize the millennials' data that was less known to the broader market, particularly the launch of Audience Networks in 2019. We had also pointed out that Snap is the best platform for Millennials and Gen Z audiences.

We believe that Snap will become one of our bigger positions. What differentiates the company from Facebook is that they don’t monetize third-party data. So they will not be affected much by IDFA. When Facebook got hit, we tried to determine if the problem was with the company or the Ad-Tech industry. We tried to study various earnings reports like Google and Microsoft and then we realized that it was the Facebook problem. The market mispriced Snap. It has an affluent customer base of Millennials and Gen Z that the company can easily monetize in the long term. They also reiterated that the company could grow by 50% year-over-year going forward.

To conclude, Wall Street’s confusion over the tech that runs each company, primarily Facebook and Snap, led to a buying opportunity for I/O Fund members as Portfolio Manager Knox Ridley issued a buy alert on Thursday, February 3rd at $24.95, leading to a 58% gain in one day.

The I/O Fund can make big calls in the face of market confusion for two reasons. The first is our lead tech analyst Beth Kindig’s direct experience in tech unrivaled in the markets. She can confidently make calls the market disagrees with because she understands the tech driving the revenue. Secondly, I/O Fund Portfolio Manager, Knox Ridley, is one of the best portfolio managers in a tech-focused fund, who guides the entry and exits, and previous audits prove this.

The I/O Fund is a team of analysts who share their research publicly as they build a portfolio of 20 stocks. Our team has record results for a retail Fund and we also have four-digit gains on some of our free newsletter coverage. You can learn more about our premium service by clicking here or sign up for our free newsletter here.by clicking here or sign up for our free newsletter here.

Disclaimer: This is not financial advice. Please consult with your financial advisor in regards to any stocks you buy.

Unity Software Q4 Earnings: Contextual and Non-Gaming

Unity has been shuffled around between LTBH and the Momentum portfolio. We’ve felt at times the valuation was a risk considering the majority of its revenue right now comes from ads and ad-tech trades at a lower valuation than cloud. Meanwhile, we were very early to cover the AR/VR story for Unity with pre-IPO coverage and we certainly have a positive and bullish outlook on the company long-term.

Similar to Path, Unity has immense potential and a future spot in LTBH. However, the public markets are being offered innovation in earlier stages and we think Unity could need more time for its real thesis to materialize. We could be wrong on the timing which is why the company is in the Momentum category. We feel our Members can benefit from our early and often unwavering conviction in a thesis like Unity regardless of the exact positions that the I/O Fund holds.

Please note, we are often covering earnings or other key reports on the forum, such as my update on Fubo, Bradley’s update on Magnite and also Snap post-earnings analysis from me, and also analysis from Bradley.

Unity’s Staggering Penetration

Central to the Unity thesis is the company’s staggering penetration. As discussed in our original write-up, Unity has been installed more than 33 billion times over the course of 12 months in 2019. The real-time development platform reached 3 billion devices. The company has 1.5 million developers and is used to build 50% of the games on the market. Of the top 1,000 games, 53% use Unity and 93% of the top 100 game development studios by global revenue in 2019 were Unity customers. At the time, we had stated: “This kind of penetration can create a defensive position against competitors due to universal training and skills as learning a new platform is time consuming and less effective for recruitment and also lengthens time to market. To be clear, Unity does not have a moat but does occupy substantial space in a duopoly with Epic’s Unreal. As of 2018, Unity had 45% of the market and Unreal had 17% of the market.”

Part of Unity’s substantial presence is the free tools it offers game developers who earn less than $100,000 annually, and for the most part they capture any developer between the indie (small) stage and up to AAA studios although many of these studios prefer to use their own in-house game engine. The company has especially found its stride on mobile. 

Create Solutions is where games are built and Operate Solutions is how games are monetized through ads and in-app purchases. There are also analytics offered through DeltaDNA, which collects information on end-user engagement and behavior.

The Create Solutions is what can be leveraged now for other industrial purposes while Operate may have a bigger role for the Metaverse in the future. In other words, growth in the Create category will help us gauge where we are in terms of the Metaverse generating real revenue while Operate could have a sizable catalyst in the future (not near-term).

Where Unity could do quite well with Create is that the groundwork has already been laid to help developers assemble graphics, sounds and animation in the development environment (IDE) and creators are able to direct assets from the code. Unity’s IDE saves steps by allowing drag and drop code scripts to the object/character and also the ability to drag game objects onto the character. There is an Asset Store with 50,000 pre-designed assets available including 3D models, 2D/3D animal renders, tutorials and how-to’s.

Developing games on Unity is low code and sometimes no code, which is ideal for 3D creators who are not necessarily developers. This lends itself well to the creator community that is most likely to drive forward the Metaverse, or Web3, and also the various industries that can benefit from 3D or AR/VR right now. The Create Solutions and tools are also great for prototyping, which speeds up the time to deployment. Unity is frequently acquiring tools and plugins to lower the barrier of entry for developers and creators. For example, Bolt2 helps developers implement logic without knowing how to code.

Last year, Unity developed a new architecture that provides native APIs to third-party providers and offers a high-level managed API to Unity developers. The new architecture fundamentally improves how Unity delivers and manages SDKs for XR platform integrations.  

The main thing to know about Unity’s products is they offer 3D creation for everyone, i.e., democratizes the process. This was initially intended for the gaming industry yet there is natural affinity for gaming tools, IDEs, chips, etcetera, to be used for virtual worlds and the Metaverse.

When I think of Unity, the word “authentic” comes to mind as they’ve been in the trenches of game development for a long time (2004). I liked this statement from the company in the earnings call to help distinguish Unity’s positioning: “So headline number one is, my expectation is the use of real-time 3D interactive technology is going to expand many fold. I’ve said this dozens of times from prior to our IPO to now. It’s — some people call it a metaverse.” What I like about that statement is the company is essentially saying – we are just doing what we do – and some people are now calling what we do the Metaverse. Similar to Nvidia’s professional visualization segment, we can track Unity’s progress through the Create segment growth. Unity is also rare in that it’s a public company participating in Web3 right now with NFT-centric games being built on its engine.

What’s key for investors to understand as Unity is not launching a big marketing campaign or drastically changing its vision and operations to capture a trend. When we first covered Unity, the word Metaverse hadn’t been introduced yet to the market and headlines. Unity calls this 3D although AR/VR or XR are other terms that are interchangeable. What has changed is not the technology rather the marketing around the technology. I think that’s a key point to determining what is authentic and what is hype – and there is a lot of hypea lot of hype right now.

Unity: Key Things (Bullish) to Watch For

Catalyst: Non-gaming business

I think there are a few reasons the market is excited about Unity’s most recent earnings report. The first is the non-gaming business grew 70% year-over-year in 2021, which could mark the start of the Metaverse driving real revenue. Note: we need to see a bit more before we can proclaim the Metaverse moment has begun. There could be a few anomalous revenue segments such as Unity’s Create and Nvidia’s professional visualization. Will update as we go along.

The variety of industries the company now serves helps us envision a time when Unity software will no longer be known as only a gaming company.

For example, the game engine deploys games across Windows, Mac, iOS, Android and other consoles, and this is leveraged to also deploy industrial, non-gaming projects across many platforms. With Unity Pro, real-time 3D, AR and VR content can also be deployed on HoloLens and Oculus. The Unity Pixyz Plugin works with manufacturing software like AutoDesk to further industrial uses, such as automotive. Additionally, Unity does not compete with creators and is royalty-free.

“Our non-gaming business is growing even faster [than our gaming business]. As we add customers across multiple industries. We believe there is significant upside as we have embedded structural advantages. With unity, creators develop once and deploy to many platforms and other — unlike other companies, we don’t compete with our customers.”“Our non-gaming business is growing even faster [than our gaming business]. As we add customers across multiple industries. We believe there is significant upside as we have embedded structural advantages. With unity, creators develop once and deploy to many platforms and other — unlike other companies, we don’t compete with our customers.”

Regarding Unity’s gaming penetration, in our original write-up, we had stated the following in terms of future catalysts nearly 16 months ago before the company went public: “Because Unity is nearly ubiquitous and has a strong reputation for dominating the game development industry, it could be hard to see areas for future growth if not for VR/AR application development. I can’t think of any other platform best suited to own this market and I see this as the primary reason to keep Unity on our radar.”

We then published some statistics that support our understanding of Unity’s future markets, including “the AR and VR market growing substantially when you extend the outlook to 2025 and include global automotive with some reports estimating the market to grow from $213 million in 2017 to $673 billion in 2025.” Perhaps most compelling of all is the 175%+ CAGR we cited for AR/VR in our original report for onsite assembly/safety and industrial maintenance.

According to comments on the recent earnings call, Unity sees the largest opportunities in real-time 3D coming from games, film, animation and advertising. In terms of serving other industries outside of gaming, here is what Unity said in the S-1 filing a year ago:

“The dramatic growth of end-user demand for interactive content is driving industries beyond gaming to embrace the advantages of real-time 3D content. Creators are leveraging our platform to provide faster content creation and efficient deployment across formats and use cases. Today, Fortune and Global 500 companies in industries such as architecture, engineering, construction, automotive, transportation, manufacturing, film, television and retail are using Unity across many new use cases, including automobile and building design, online and augmented reality product configurators, autonomous driving simulation, and augmented reality workplace safety training.:Today, Fortune and Global 500 companies in industries such as architecture, engineering, construction, automotive, transportation, manufacturing, film, television and retail are using Unity across many new use cases, including automobile and building design, online and augmented reality product configurators, autonomous driving simulation, and augmented reality workplace safety training.:

Unity also recently launched Unity Forma, an automotive and retail solution tool for the creation and delivery of custom real-time 3D marketing content. Shortly after the Unity Forma launch, Unity acquired RestAR to power real-time 3D product capture.  

Core Business: Contextual Ads

The second reason to be excited about Unity is the contextual ads that Unity serves, which insulates the company from IDFA issues. Contextual means that instead of behavioral targeting, advertisers find enough value in the audience segment being “gamers” to use that category as the primary means for targeting. An example would be if you’re reading about Apple’s earnings and you see an advertisement for a Fidelity product, then Fidelity likely targeted you based on your interest in the category of finance or stocks. It is by the context of the content you are consuming that advertisers purchase the ad spot.

This approach has been around for ages, it’s how magazine ads or the Superbowl ads garners high revenue. If you watch the Super Bowl, contextually you are likely to drink beer and so Budweiser buys the spot. If you’re reading Vogue, then a makeup brand like Loreal will target you by context. The same applies to Unity Ads where advertisers know they want to target gamers first and foremost. Things like age and average in-app spend is also available to help further narrow down an audience segment.  

It's important Unity investors understand the contextual ads piece because it does separate Unity from other ad-tech players.

Here is what we said previously:

On a contrarian note, because Unity has a very specific content type (gaming), there’s a chance the company is very resilient through the iOS 14 changes as targeting can occur through content type (i.e. Gaming, Financial News, Beauty & Health, etcetera). Previously, Unity Ads have been known to be more effective because the audience type and interests are narrow. There’s also a possibility that Unity is stronger with the IDFA changes as they own the game engine whereas their competitors are using third-party data only for targeting. These competitors include Vungle, AdColony, Facebook’s Audience Network, MoPub, Leadbolt, TapJoy, etcetera.Unity has a very specific content type (gaming), there’s a chance the company is very resilient through the iOS 14 changes as targeting can occur through content type (i.e. Gaming, Financial News, Beauty & Health, etcetera). Previously, Unity Ads have been known to be more effective because the audience type and interests are narrow. There’s also a possibility that Unity is stronger with the IDFA changes as they own the game engine whereas their competitors are using third-party data only for targeting. These competitors include Vungle, AdColony, Facebook’s Audience Network, MoPub, Leadbolt, TapJoy, etcetera.

So, why did I close Unity going into the IDFA changes? I simply wanted to take risk off the table and I felt Unity’s core thesis of Industrial 3D Development was a ways off to where I could re-enter if needed. There was no perfect decision here other than to have a longer mindset than one earnings result. I still believe the changes to the IDFA is one of the biggest shifts to ad dollars that the public markets have had to grapple with. In other words, the effects are not done yet. The other big shift was when the walled garden went up. If you got that shift right, you made a lot of money as it led to the sustained rise of Google and Facebook.

Here is what Unity said on the call regarding contextual:

“So, our contextual approach provides numerous advantages. Even the largest game companies out there have a few 100 millions to use or so. We reach more than 3 billion devices. And unlike any other ad tech companies, the majority of mobile games out there are made with Unity, using our engine and our game services. That’s not quite the same as an ad tech company claiming a 3 billion reach. So let’s quickly address first-party data. Let’s assume we’re talking about first-party games data. First-party data is not bulletproof. First games are a hit driven business and even the best of games have a decay curve. So you really have two choices, if you’re in that business, either you create the next hit game, which we all know it’s pretty hard to do or you spend by studios that are producing them and that’s hard to sustain. The second thing is being end-to-end with first-party in this ecosystem is nearly impossible. So no matter how many companies anyone acquires, contextual data scales in a much more unlimited way. Well, first-party is limited to users only coming to your own and operated game.”Even the largest game companies out there have a few 100 millions to use or so. We reach more than 3 billion devices. And unlike any other ad tech companies, the majority of mobile games out there are made with Unity, using our engine and our game services. That’s not quite the same as an ad tech company claiming a 3 billion reach. So let’s quickly address first-party data. Let’s assume we’re talking about first-party games data. First-party data is not bulletproof. First games are a hit driven business and even the best of games have a decay curve. So you really have two choices, if you’re in that business, either you create the next hit game, which we all know it’s pretty hard to do or you spend by studios that are producing them and that’s hard to sustain. The second thing is being end-to-end with first-party in this ecosystem is nearly impossible. So no matter how many companies anyone acquires, contextual data scales in a much more unlimited way. Well, first-party is limited to users only coming to your own and operated game.”

Unity is stating they have a material advantage over supply side platforms as the games are developed on their engine with analytics, which is unique to Unity.

Acquisitions

In previous write-ups, we focused on Unity’s acquisition spree and high R&D spending that we believe will help to solidify Unity’s place as a picks and shovels provider for Web3 and the Metaverse. Unity agreed to buy Weta Digital VFX for $1.62 billion in exchange for the design tools, assets and data platform that drove film creations such as Lord of the Rings, Avengers, Avatar and Game of Thrones. The goal is to bring the magic of film assets to the individual creator on Unity’s platform.

The Weta Digital acquisition helps Unity remain defensive against Epic’s Unreal Engine, which was used on virtual sets, such as Star Wars The Mandalorian. It also helps Unity build a Metaverse asset library, such as stadium scenes, character movements, large crowds, fantastical characters and backgrounds, etcetera, which can help the workflow for content creation for the metaverse. With that said, the more near-term opportunity for these acquisitions is for Unity to turn Hollywood into a customer.

Here's what they said on the call – ILM being Industrial, Light & Magic, a motion picture visual effects company founded by LucasFilm:

“We just liberated one of the coolest assets that existed all of art and all of technology and all of content creation, the [Weta] tool set. The number of companies that are knocking on my door to say, we want to be your pilot customer, because we want out those tools. It is pretty substantial. And so it’s — I can’t really overstate how much interest there is an engaging now that the tools aren’t captive of a single company that’s got, if you will, ILM does not want to use tools from Weta they compete. ILM now wants to use tools from Unity.ILM does not want to use tools from Weta they compete. ILM now wants to use tools from Unity. Now, I’m using ILM as an example. I’m not going to point to them. So let me take that last part about the naming of them. But the notion of it is pretty clear.”

Unity also acquired Ziva Dynamics, which is film software for creating digital humans in Marvel movies, Hellblade, Jumanji and Godzilla vs King Kong. Similar to the Weta Digital acquisition, the tools for anatomical simulation will be democratized for individual creators on Unity’s platform.Similar to the Weta Digital acquisition, the tools for anatomical simulation will be democratized for individual creators on Unity’s platform. According to a statement from the company, “One of the most fundamentally revolutionary changes that Ziva brings is it allows a huge improvement in how creators can achieve believable, life-like character creation.”

Even if we don’t see millions of creators begin to work with Metaverse assets immediately, Unity is paving the way for when this happens.

Regarding Industrial, Pixyz Studio is the company that created a plugin for AutoDesk and other manufacturing software providers. The company specializes in optimizing 3D data and helps developers import the data into Unity, and its also used for industries such as the manufacturing of cars, appliances and buildings. The plugins and software products work with Nvidia, Microsoft, Autodesk and across the auto industry, to name a few.

Financials

By Bradley Cipriano

Unity is a leading ad-tech for those that have reported Q4 with 41% growth excluding Weta FX’s licensing fees. Revenue for the full year was $1.1 billion, for an increase of 44% compared to the initial guidance of 23% to 26%.

The company is guiding for growth of 35% at the midpoint for the current Q1 quarter, for revenue of $315 million to $320 million. For the full year 2022, Unity is guiding for $1.495 billion at the midpoint for growth of 35% year-over-year. One of the more important statements in the call was Unity’s assurance that they are providing a conservative forward outlook, and in the event that more tailwinds materialize, this outlook will move upward. The company has provided 6 consecutive beats on their guidance on both the top line and bottom line, so confidence in the management team is quite high. Guiding correctly during IDFA likely increased the confidence the Street has with this management team.

Here is what the company is guiding for long-term: “So what can you expect from Unity going forward? So in terms of revenue growth, now, as we just said, you can expect us to grow between 34% and 36% in 2022 and then at least 30% thereafter. So we will continue to drive that this driver which is critical for us.”So what can you expect from Unity going forward? So in terms of revenue growth, now, as we just said, you can expect us to grow between 34% and 36% in 2022 and then at least 30% thereafter. So we will continue to drive that this driver which is critical for us.”

Operate Q4 sales grew 45% year-over-year to $195 million and increased 51% YoY to $709 million for the full year. As stated above, Operate is the advertising business and there were quite a few questions on the earnings call about the health of this business, particularly its contextual advertising strength.

The net retention rate continues to be a feather in Unity’s cap. The DBNRR was at 140% compared to 138% in the year-ago quarter. Enterprise-level customers are helping the DBNRR metric with 85% of revenue coming from the >$100,000 segment compared to 80% last year. This trend correlates with DBNRR and highlights that customers are increasingly spending more with the company. Furthermore, >$100,000 customers increased 34% YoY to 1,052 customers, and customer growth has expanded beyond gaming. As mentioned above, the addition of Weta FX expands Unity into Hollywood, and the company has also been strong with industrial customers, leading to 70% year-over-year growth in non-gaming revenues.

Continuing down the income statement, Q4 gross margin improved 200 bps YoY to 80% and adjusted loss from operations was $12 million, or -4% of quarterly sales. For the year, gross margin was up 100 bps YoY to 80%, and adjusted operating loss was $51 million, or -5% of annual sales. Looking forward, Unity guided for an improvement in its operating margin and expects to report an adjusted operating loss of $40 million for the upcoming year, or -3% of sales (at the midpoint). However, expenses will be frontloaded to the beginning of the year as Unity expects Q1 2022 adjusted operating losses to be $23 million, or 7% of quarterly sales. The company stated they expect to break even sometime in 2023.

For the year, free cash flow was an outflow of -$153 million, down from -$20 million in 2020. Free cash flow included a one-time charge of $50 million to terminate its lease in San Francisco. Going forward, the margin improvements are expected to flow to free cash flow. CFO Luis Visoso stated on the Q4 call that “I would expect free cash flow to follow very much in line with our non-GAAP operating margin improvements”. He added that in FY2022, Unity’s free cash flow will be positive, which includes a lump-sum payment for four years of license fees from the recent Weta FX acquisition. We should expect Unity to be sustainably free cash positive post 2023, when they break even on operating margins.

I/O Fund’s Fintech Q4 2021 Earnings Overview

Fintech companies aim to disrupt traditional finance and with our worlds increasingly going digital, it makes sense that traditional finance is also moving online. There are multiple different innovations that have taken place, from digital payments to using A.I. to better price credit risk.

We are in the middle of the Q4 fintech earnings period, and there have been a handful of fintech companies that have reported already, most notably PayPal. PayPal disappointed when its guide came in below expectations. The company cited weakness in lower income cohorts, and explained on its Q4 conference call that while spending was strong during the Q4 holiday season, it has since stagnated in 2022. This led the company to reduce its guide that it had originally issued in November.

This negative commentary was offset by Bill.com, which reported strong Q4 results, driven by strength in small and medium businesses. Bill.com reported its fourth consecutive quarter of accelerating topline growth, which suggests that SMB are performing strongly.

In the discussion that follows, I give an overview of the fintech space and outline key metrics that investors should be aware of heading into Q4 earnings.

Fintech: Top 10 EV/FWD Revenue Multiples

Below we ranked fintech stocks based on their EV/NTM sales multiples. Bill.com (BILL) ranks the highest, as the company has reported a series of strong results in recent quarters. For instance, sales have accelerated for four consecutive quarters, even after adjusting for acquisitions. As mentioned above, the company has done well with its primary cohort of small-medium businesses, suggesting that business activity continues to be robust beyond enterprises.

Global payment processors Visa (V) and Mastercard (MA) also sport premium multiples, likely due to their payment duopoly. However, it is noteworthy that Visa and Mastercard underperformed in 2021, as investors may be wary that the pair will be able to keep their relatively high fees. For example, Amazon has stopped accepting Visa credit cards in the U.K. over a dispute over payment fees. Amazon controls over 40% of e-commerce, so the ecommerce giant may be able to pressure the duopoly to reduce fees. 

Fintech: Top 10 Three-month Forward YoY Growth Rates

Below is a chart of fintech stocks that are expected to grow sales the fastest in the upcoming quarter. Looking forward, Upstart (UPST) is expected to grow sales 203% YoY in Q4, which is well above peers but slightly slower than its Q3 growth rate of 262%.  Upstart’s growth has benefitted from bank partnerships, which utilize Upstart’s AI-driven lending platform to originate loans. The company primarily originates personal and auto loans, which have seen strong growth in recent months. The New York Federal Reserve recently released its quarterly report on household debt and credit, which highlighted that Auto loans and personal loans were both up $15 billion sequentially and that delinquencies had also declined across the different loan categories, highlighting the favorable macro environment for Upstart.

Sign up for I/O Fund's free newsletter with gains of up to 1100% – Click hereSign up for I/O Fund's free newsletter with gains of up to 1100% – Click hereClick here

Coinbase (COIN) is also expected to grow over 200% in the upcoming quarter, as trading volume on the cryptocurrency exchange has exploded this year, with trading volumes up over 600% YoY to $327 billion in Q3 2021. Management guided for higher trading volumes in Q4 relative to Q3, driven by higher levels of volatility. Also noteworthy is Voyager (VYGVF), a cryptocurrency trading platform that is expected to grow sales over 3,000% YoY in the upcoming quarter. Voyager was excluded in the below chart for presentation reasons, because sales are growing off of a low base. However, sales are expected to grow 50% sequentially, highlighting the overall strength in cryptocurrency demand.
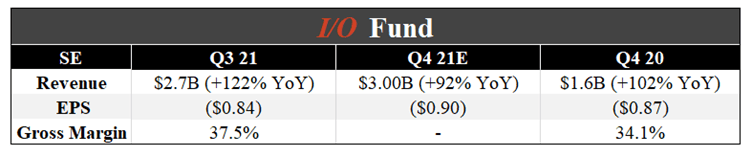
Top 10 Weekly Share Price Movements

Below is a table of the weekly change in share price for our universe of fintech stocks (as of 2/08). As mentioned above, Bill.com recently reported results and organic sales accelerated for the fourth consecutive quarter, leading to a rebound in its share price. However, Bill.com’s share price is still down year to date. In fact, most fintech stocks are down YTD, with the exception of Visa and Mastercard. Investors likely sold fast growing fintech companies in favor of ‘safer’ blue chip fintech stocks such as Visa and Mastercard. Nonetheless, fintech has started to rebound over the last week and Q4 earnings may be a further catalyst for a rebound in valuations.

Top 10 Changes in sales growth estimates – last 90 days

The table below ranks fintech stocks by their topline revisions over the last 90 days. An increase in topline revisions signals that the Street believes that the company will grow faster than initially believed, which can result in outperformance. Block Inc. (SQ) has had large revisions, in part due to its recent acquisition of BNPL platform Afterpay. Bill.com’s (BILL) guidance came in above expectations, leading to a higher sales estimate. It is noteworthy that Bill.com’s peer, Intuit (INTU), has also had its topline estimate increased by 5% over the last three-months. The QuickBooks software provider is likely benefitting from similar tailwinds as Bill.com, as SMB have performed well over the last few quarters.

Update on EV/Fwd revenue multiples:

Overall stats:

  • Overall fintech forward median:                4x
  • Top 5 fintech forward median:                   15x
  • Overall fintech forward average:               6x

EV/FWD SALES:

As shown below, the median and average fintech EV/NTM sales multiple had been relatively static throughout 2021 but has since compressed meaningful in 2022. Valuations are now below levels they were in 2020. The market may be fearing that consumer spending will decline due to a lack of stimulus and a slowing economy. With Q4 earnings on the horizon, new information could lead to a “risk-on” environment in fintech and a rebound in valuations.  

Top 5 EV/FWD SALES:

In the chart below, we can more clearly see the large dispersion in fintech valuations, as the top 5 premium valued fintech stocks have had their EV/Fwd sales multiples trend up throughout 2021 with a peak in October, followed by a general sell-off heading into 2022. Both the top 5 valued fintech stocks and the median sold off, which suggests that the sell-off was broad based and related to changing sentiment.

 EV TO FWD Sales Growth Buckets:

We can further dissect the change in fintech valuations by breaking up the group into high growth (>30%), mid growth (>15% and <30%) and low growth (<15%). The below chart shows the historical valuations for stocks in various growth buckets. Each growth bucket has had their valuations compress since November; however, the high-growth and low-growth buckets have underperformed the mid-growth bucket. The market is likely fleeing to ‘blue-chip’ fintech stocks until it receives more information on the general health of the consumer.  

Top EV TO FWD SALES:

The below chart provides a more holistic view of fintech valuations heading into Q4 earnings, sorted by EV to NTM revenue multiples. There is a wide disparity in valuations, with companies grouped closer to the tails rather than the median. As mentioned above, Bill.com (BILL) has a premium valuation and has already reported Q4 results, which surprised to the upside. PayPal (PYPL) has fallen below the median fintech valuation based on NTM sales after its Q4 results disappointed, as management explained that spending on its platform had slowed after the holiday shopping season. 

Growth adjusted EV/Fwd Revenue (EV/Fwd Rev/Fwd Growth)

The last chart is based on EV to FWD sales but also takes into account forward growth expectations. By scaling valuation relative to forward growth, we can more clearly see which companies are cheapest relative to forward growth. Companies with negative growth expectations are excluded from the below chart. A low value in the below chart means that a company is cheap relative to growth. It is interesting to note that PayPal (PYPL) rises to a relative premium valuation after considering its forward growth. On the other hand, DLocal (DLO) falls closer to the median valuation once we consider its 112% expected growth rate heading into Q4 earnings.

Finally, the last table we will be discussing includes aggregate fintech operating metrics. The below table illustrates the median topline growth, margins and FCF generation for the fintech industry. The median growth rate was 60%, and the market expects the median fintech stock to grow sales by 42% YoY next quarter. Median gross margins were 54% and the median free cash flow margin was 9%.

As shown above, the overall fintech space appears to be healthy, with high growth rates and strong margins. This provides support for a rebound in valuations heading into Q4 earnings. The I/O fund will be watching this industry closely heading into Q4 earnings. Find out what the Street is saying about fintech stocks headed into Q4 earnings in our I/O Fund’s preview of 7 Fintech stocks for Q4 Earnings.

The I/O Fund is a team of analysts that share their research publicly as they build a portfolio of 30 stocks. Our team has record results for a retail Fund and we also have four-digit gains on some of our free newsletter coverage. You can learn more about our premium service by clicking here or sign up for our free newsletter here.by clicking here or sign up for our free newsletter here.

Disclaimer: This is not financial advice. Please consult with your financial advisor in regards to any stocks you buy.

I/O Fund’s preview of 7 Fintech stocks for Q4 Earnings

Fintech companies are disrupting the global economy with their innovative products. The global growth is expected to continue despite medium-term challenges like higher interest rates and Covid-19. We believe that the recent sell-off once again provides opportunities to pick stocks for the long term.

PayPal released its results earlier this month. Q4 revenue grew by 13% to $6.9 billion and beat estimates marginally by $30 million. The soft revenue guidance of 6% growth in Q1 disappointed investors. On the other hand, Dutch payment processor Adyen reported strong results as its 2H revenue grew by 47% to €556.5 million and EBITDA (Earnings before Interest, Tax, Depreciation, and Amortization) grew by 51% to €357.3 million.

In this earnings preview, we cover Upstart, Block, Coinbase, Sea Limited, MercadoLibre, Remitly, and DLocal. To understand valuations across the Fintech companies and how the sector is positioned moving into earnings, please refer to our analysis, “I/O Fund’s Fintech Q4 Earnings Overview.

Upstart – Earnings on February 15th

Source: YCharts, Earnings Reports, and I/O Fund

The company’s revenue grew by 250% in Q3 and the analysts estimate revenue to grow 203% YoY to $262.85 million. Upstart has gained popularity due to its Artificial Intelligence lending platform, which saves time in loan processing. The management believes that the auto lending market is at least six times the personal loan market size and that customers pay higher interest rates for car loans. Last year, it bought Prodigy Software, an automotive retail software provider, which further helped the company focus on the auto loan market.

Atlantic analyst Simon Clinch has a price target of $170. He has an overweight rating on the stock as he believes that there is upside potential to EBITDA from the auto segment.

Piper Sandler analyst Arvind Ramnani has lowered the price target for the company to $223 from $300. He reset the price target in the vertical software and fintech stocks following the correction in the tech sector.             

Block (Square) Inc – Earnings on February 24th

Source: YCharts, Earnings Reports, and I/O Fund

The company’s revenue grew 27% YoY to $3.84 billion. Analysts expect revenue to grow 28% to $4.05 billion. The company missed analysts’ revenue estimates by 14% and adjusted EPS by 3% in the last quarter.

It has completed the acquisition of Afterpay recently and has integrated Afterpay’s Buy Now Pay Later (BNPL) functionality to Square Online sellers in the U.S. and Australia. According to Grand View Research, the BNPL market is expected to reach $20.4 billion by 2028, growing at a compound annual growth rate of 22% from 2021 to 2028.

J.P. Morgan analyst Tien-tsin-Huang is optimistic about the deal and expects it to boost its gross profits. He also believes, "positive catalysts de-risking the hard/soft landing concern for stand-alone Cash App growth deceleration near-term."

Barclays analyst Ramsey El-Assal has lowered the firm's price target to $205 from $300. He has kept an Overweight rating on the shares. In his view, “While app download and usage data point to continued strength at Cash App and Square, the company continues to lap very tough COVID-related comps.” He also expects investor focus to be on the reacceleration of Cash App, the Afterpay acquisition, and Block's crypto initiatives.

Please note that the I/O Fund may or may not agree with the above financial analysts, yet we objectively report what the Street is saying. You may view our previous analysis of the company below:

Our lead analyst Beth Kindig had discussed two years back about the company’s high charges that would come under pressure from the blockchain in the long-term. Recently, she also discussed that the company’s name change from Square to Block was a defensive move rather than coming out of its strength.

Coinbase Global Inc – Earnings on February 24th

Source: YCharts, Earnings Reports, and I/O Fund

The company’s revenue grew by 316% to $1.31 billion in Q3. For Q4, analysts expect revenue to grow 235% to $1.96 billion. Due to better trading activity in October, the management believes that the retail Monthly Transacting Users (MTUs) will be higher in Q4 than Q3. For the month of October, it was 11.7 million.

Bank of America analyst Jason Kupferberg has upgraded the company from a neutral to buy rating. He is optimistic about the company launching the NFT trading platform, as it was diversifying its revenue sources to rely less on cryptocurrency trading.

Sign up for I/O Fund's free newsletter with gains of up to 1100% – Click hereSign up for I/O Fund's free newsletter with gains of up to 1100% – Click hereClick here

Mizuho analyst Dan Dolev believes that the zero-commission business model adopted by Robinhood is better than the fee-based model adopted by Coinbase. In his words, "If you think about three years from now, everything that's fee-based right now, like crypto trading, is going to be free."

You may view our previous analysis of the company below. We had also discussed Coinbase reporting lower revenue in Q3.

Crypto Trading Apps Coinbase and Robinhood Will Decline in Q3 — but by How Much?

Why We’re Skipping Coinbase and Prefer Voyager Digital: Overview of Crypto Trading

Sea Limited – Tentative Earnings Date is 25th February

Source: Seeking Alpha, Earnings Reports, and I/O Fund

Sea Limited operates in three segments: digital entertainment, e-commerce, and digital payments & financial services. The company's revenue grew 122% in Q3 and the analysts expect revenue to grow 92% to $3.0 billion in Q4. The company derives its significant revenue from South East Asia, and more recently, it has been focussing on Latin America.

Barclays analyst Jiong Shao lowered the firm's price target to $218 from $427 and has kept an Overweight rating. He believes, “The post-COVID economic reopening is having a negative impact on both the company's gaming and e-commerce business as consumers spend less time online.”

Goldman Sachs analyst Miang Chuen Koh has removed the stock from the Goldman’s Conviction List. "While Sea (SE) remains on a growth path, with an expanding ecommerce footprint and its multiple studios finalizing games to be released in the next few quarters," the analyst cautions that the slower economic growth will limit the growth of its three business lines.

You may view our previous analysis of the company below.

Q1 Earnings Analysis for Etsy, Square, and Palantir

Momentum List: September 2020

MercadoLibre Inc – Tentative Earnings Date is March 01st

Source: YCharts, Earnings Reports, and I/O Fund

The company’s revenues grew 67% in Q3 and the analysts expect Q4 revenue to grow 53% to $2.03 billion. MercadoLibre has been popularly known as the Amazon of Latin America. The company is benefitting from the region’s strong e-commerce and fintech growth. The stock rose about 450% in the past five years. MELI’s quarterly active users showed strong growth in Q3, growing 50% YoY to 78.7 million and unique Fintech users grew by 13% to 31.6 million.

Source: YCharts

Stifel analyst Scott Devitt lowered the price target on the company to $1,600 from $2,200 and has kept the Buy rating. He forecast GMV growth of 26% to $7.71 billion and revenue estimate of $2.09 billion for the next quarter, slightly ahead of consensus. However, as the comparable valuation multiples of the company's publicly traded peers have declined, he has lowered his price target.

Jefferies analyst John Colantuoni has downgraded the company to Hold from Buy with a price target of $1,250, down from $2,000. He makes a note that the heightened macro uncertainty in Brazil, which represents 60% of the company's revenue, could hold back MercadoLibre's near-term valuation. He believes that the company is in an ideal position to benefit over the long-term from attractive secular shifts in e-commerce and payments across Latin America and expects the stock to trade at the low end of its historical trading range until macro uncertainty subsides.

Remitly Global Inc – Earnings Date not released yet

Source: YCharts, Earnings Report, and I/O Fund

Global remittance provider Remitly’s Q3 revenue grew by 69%. It was the first earnings report since it became a public company in September 2021. The full lock-up expiry is expected next month. Active customers were up 51% and the average revenue per active customer was up 12% YoY to $47.34. Adjusted EBITDA came at $0.3 million compared to $0.6 million in the same period last year. The analysts expect revenue to grow 57% to $125.36 million in Q4. The management expects full-year revenue to grow about 74% YoY in the range of $445 million to $450 million.

JMP Securities analyst David Scharf has lowered the company’s price target to $40 from $52 and has kept the Outperform rating. The analyst remains positive on Remitly’s leadership position as a mobile-first, all-digital network serving a large and expanding total addressable market and believes that its secular tailwinds will continue. However, he cautions that the shares might be volatile in the near term due to the negative market sentiment.

DLocal Ltd – Tentative Earnings Date is February 28th

Source: YCharts, Earnings Report, and I/O Fund

The company’s revenue grew by 123% in Q3 and the analysts expect revenue to grow 115% to $74.52 million. The total payment value (TPV) increased by 217% in Q3 to $1.8 billion. The net revenue retention rate was 185%. The management expects NRR in the range of 150% to 160% in the medium term and to come down to about 120% to 130% in the long term.

Goldman Sachs analyst Tito Labarta has upgraded the company to Buy from Neutral and has a price target of $55. He believes that “The company should experience relatively minor impacts from higher interest rates considering that it has no debt on its balance sheet and does not focus on the pre-payment of receivables.”

The I/O Fund is a team of analysts who share their research publicly as they build a portfolio of 20 stocks. Our team has record results for a retail Fund and we also have four-digit gains on some of our free newsletter coverage. You can learn more about our premium service by clicking here or sign up for our free newsletter here.by clicking here or sign up for our free newsletter here.

Disclaimer: This is not financial advice. Please consult with your financial advisor in regards to any stocks you buy.

I/O Fund’s Ad-tech Q4 2021 Earnings Overview

Ad-tech is a cash efficient industry with a healthy rebound when economic activity recovers. Ad-tech earnings will be critical for the broader tech landscape, and major players such as Google, Facebook and Snap Inc. have reported this week. Google was the first to report, and sales grew 32% during the quarter, which “reflected broad-based strength in advertiser spend and strong consumer online activity” according to Google CFO Ruth Porat. Google’s strong results suggest that ad-tech could show resilience with individual companies despite sector wide headwinds.

However, Meta Platforms (Facebook) reported notably weaker results than Google, driven by changes in Apple’s iOS related to mobile tracking and privacy. The company guided for weak growth in the first half of 2022 and expects sales to rise just 3% to 10% YoY in Q1 2022. Furthermore, management estimated that changes in iOS will be a $10 billion headwind during the year. While changes to iOS will impact most mobile advertising companies, we suspect that Facebook will be most impacted due to its heavy reliance on mobile tracking via its Audience Network. Furthermore, some companies may actually experience a net benefit from the changes.

Snap Inc. reported on February 3rd and results came in relatively stronger than Meta’s.  Snap guided for sales to grow 36% YoY next quarter, well above Meta’s guide for 7% YoY growth at the mid-point. The large disparity between Snap and Meta’s forward guide highlights that Apple’s changes to iOS will have varying degrees of impacts on companies in the ad-tech space.

In the analysis that follows, I give a brief overview of the ad-tech industry and discuss key metrics that investors should be aware of heading into Q4 earnings.

Ad-tech: Top 10 EV/FWD Revenue Multiples

Below we ranked ad-tech stocks based on their EV/NTM sales multiples. The Trade Desk (TTD) has the highest multiple in the ad-tech sector, as the ad platform reported that sales increased 39% YoY in Q3 coupled with a robust 41% adjusted EBITDA margin. The Trade Desk also has strong partnerships, and Founder-CEO Jeff Green explained on the company’s Q3 call that “the world's leading advertisers are standardizing on our platform”, a trend that is likely contributing to its premium multiple.

Unity also sports a premium multiple, driven by the company’s dominate position in mobile gaming ads. Over 70% of the world’s mobile games are built in Unity, and the company also has exposure to other growth markets such as 3D modeling and augmented/virtual reality. Unity’s software tools are also useful for many applications beyond gaming, such as Industrial Applications and A.I. and machine learning.   
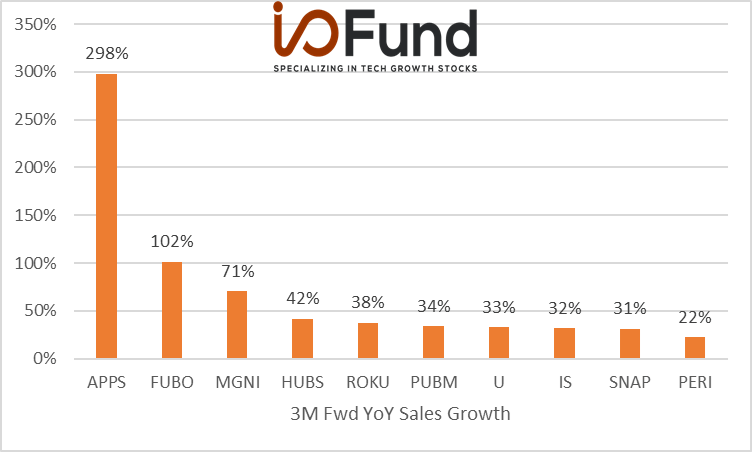
It is noteworthy that ad-tech valuations have compressed in 2022 following the heightened volatility in financial markets. Nonetheless, ad-tech is a very cash efficient industry, evident by the robust free cashflow (FCF) margins shown below. We expect that ad-tech will see a rebound before or around H2 2022 as supply shortages are expected to ease, which can lead to an increased demand for advertising.

Ad-tech: Top 10 Three-month Forward YoY Growth Rates

Below is a chart of ad-tech stocks that are expected to grow sales the fastest in the upcoming quarter. Looking forward, Digital Turbine (APPS) is expected to grow the fastest, mostly due to its recent acquisition of AdColony and Fyber. Magnite’s (MGNI) growth rate is also skewed due to its acquisition of SpotX.

FuboTV (FUBO) is expected to grow sales YoY by triple digits in Q4, driven by a ramp in subscriber growth. The company had preannounced Q4 revenue and subscriber growth, which came in above its initial guide. Specifically, subscribers increased 100% YoY to 1.1 million and Q4 sales are expected to rise by 107% YoY to $217 million at the mid-point. The preannouncement of results was ahead of a Needham Conference, where FUBO CEO David Gandler highlighted that “[in 2022] we're going to be heavily focused on ad-tech, because we want to unlock a lot of that value that's going to drive margins”.

As mentioned above, ad-tech is a highly cash efficient industry and FuboTv’s rapid expansion of ad sales will help drive margin improvements at the firm.

Top 10 Weekly Share Price Movements

Below is a table of the weekly change in share price for our universe of ad-tech stocks (week ended 01/28). Markets have been volatile recently, however there are signs that ad-tech is beginning to bubble under the surface.

Sign up for I/O Fund's free newsletter with gains of up to 1100% – Click hereSign up for I/O Fund's free newsletter with gains of up to 1100% – Click hereClick here

For example, ironSource (IS) staged a double-digit rally last week as its share increased 11%, while The Trade Desk (TTD) and HubSpot (HUBS) increased 7% last week. ironSource reported strong results in Q3, as sales increased 60% YoY and its dollar based net expansion ratio was robust at 170% during the quarter. On the Q3 call, CEO Tomer Zeev stated that Apple’s recent iOS IDFA changes will be a net positive for the company. It is also noteworthy that over the last three-months, The Trade Desk has outperformed most ad-tech stocks. This trend, coupled with its premium multiple outlined above, likely signals that the market believes that The Trade Desk is one of the leading ad-tech platforms heading into Q4 earnings.
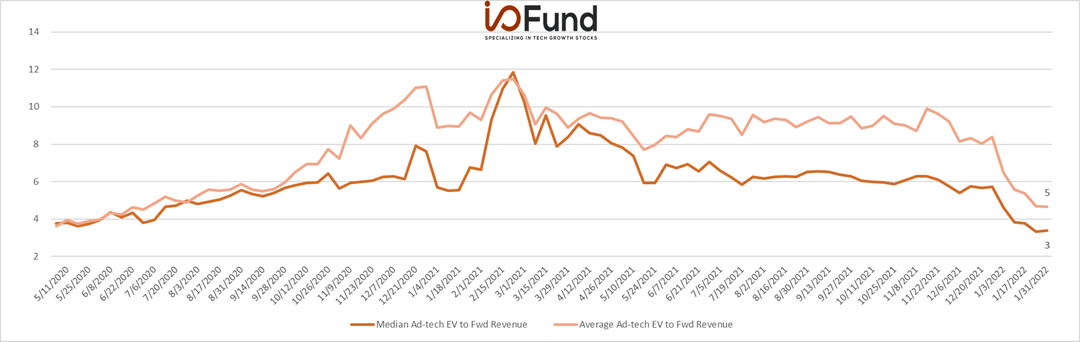
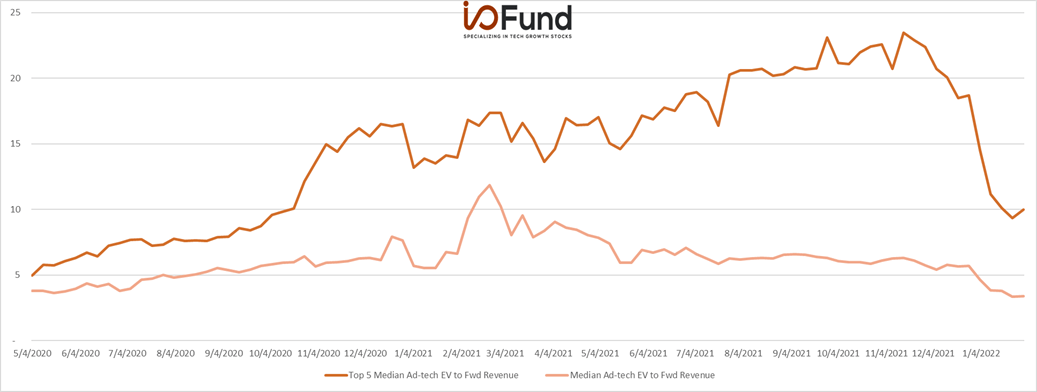
Top 10 Changes in sales growth estimates – last 90 days

The table below ranks ad-tech stocks by their topline revisions over the last 90 days. An increase in topline revisions signals that the Street believes that the company will grow faster than initially believed, which can result in outperformance. As mentioned above, FuboTv (FUBO) preannounced Q4 topline results, which came in ahead of its initial guidance and contributed to the rise in sales estimates recently. PubMatic (PUBM) had beaten its Q3 topline guide by 12% and also raised its FY2021 guide by 11%, which contributed to the higher sales estimate for the company. During its Q3 call, PubMatic’s Founder-CEO Rajeev Goel explained that the company has limited exposure to IDFA and added that demand for the company’s solutions will grow as third-party cookies and IDFA are phased out.

Update on EV/Fwd revenue multiples:

Overall stats:     

  • Overall ad-tech forward median:               3x
  • Top 5 ad-tech forward median:                 10x
  • Overall ad-tech forward average:              5x

EV/FWD SALES:

As shown below, the median and average ad-tech EV/NTM sales multiple had been relatively static throughout 2021 and has since compressed meaningful in 2022.  Given ad-tech’s reliance on a strong economy, the market may be pricing in slowing growth, which has led to a reduction in ad-tech valuations. Furthermore, Apple’s changes to IDFA and third-party tracking have introduced uncertainty into the market, which has likely had a near term impact on valuations. However, if sentiment and the outlook for economic growth improves, then ad-tech valuations could quickly recover.

Top 5 EV/FWD SALES:

In the chart below, we can more clearly see the large dispersion in ad-tech valuations, as the top 5 premium valued ad-tech stocks have had their EV/Fwd sales multiples rapidly expand since 2020. However, the top 5 valued ad-tech stocks have had their valuations materially compress since November, falling from a median of 23x in early November to a low of 10x as of January. The median ad-tech stock has also experienced a multiple compression in recent weeks, falling from a multiple of 6x to a median multiple of 3x over the same time period.

EV TO FWD Sales Growth Buckets:

We can further dissect the change in ad-tech valuations by breaking up the group into high growth (>30%), mid growth (>15% and <30%) and low growth (<15%). The below chart shows the historical valuations for stocks in various growth buckets. Each growth bucket has had their valuations compress since November, with the high growth bucket experiencing the steepest decline and falling slightly beneath the mid growth median valuation.

The market likely expects growth to decline in the near term and has adjusted valuations accordingly. However, there are signs that advertising growth is stable within specific earnings reports. For instance, Microsoft stated during its most recent Conference Call (01/25/22) that search and advertising revenues increased 32% YoY, which were better than expected and benefitted “from a strong advertising market”.

Top EV TO FWD SALES:

The below chart provides a more holistic view of the ad-tech landscape heading into Q4 earnings, sorted by EV to NTM revenue multiples. As mentioned above, The Trade Desk (TTD) sports a premium multiple and has outperformed the majority of its peers during the recent market sell-off. Unity (U) and HubSpot (HUBS) are closely behind, and are expected to grow faster than The Trade Desk in the near term.

Growth adjusted EV/Fwd Revenue (EV/Fwd Rev/Fwd Growth)

The last chart is based on EV to FWD sales but also takes into account forward growth expectations. By scaling valuation relative to forward growth, we can more clearly see which companies are cheapest relative to forward growth. A low value in the below chart means that a company is cheap relative to growth.

Note that some names may be skewed due to acquisitions such as Digital Turbine (APPS). Both HubSpot and ironSource look relatively cheaper after accounting for their relatively stronger growth rates. The Trade Desk looks relatively more expensive after considering its topline growth rate, as it is expected to grow slower than the median ad-tech company.

Finally, the last table we will be discussing includes aggregate ad-tech operating metrics. The below table illustrates the median topline growth, margins and FCF generation for the ad-tech industry. The median growth rate was 47%, and the market expects the median ad-tech stock to grow sales by 22% YoY in Q4. Gross margins remained robust at 64% and cashflows were strong at 18% of three-month sales for the median ad-tech company.

Ad-tech is a highly cash efficient industry that is dependent on a strong economy. If economic growth is sustained, then ad-tech valuations will likely quickly rebound. The I/O fund will be watching this industry closely heading into Q4 earnings. Find out what the Street is saying about ad-tech stocks headed into Q4 earnings in our I/O Fund’s preview of 7 Ad-Tech stocks for Q4 Earnings.

The I/O Fund is a team of analysts that share their research publicly as they build a portfolio of 30 stocks. Our team has record results for a retail Fund and we also have four-digit gains on some of our free newsletter coverage. You can learn more about our premium service by clicking here or sign up for our free newsletter here.by clicking here or sign up for our free newsletter here.

Disclaimer: This is not financial advice. Please consult with your financial advisor in regards to any stocks you buy.