Dell Sees AI Servers Doubling to $50B in 2026 

Dell reported some of the strongest AI revenue numbers in the industry last quarter with AI server revenue up 342% YoY to $9.0 billion, orders up 1,906% YoY to a record $34.1 billion and backlog up 177% QoQ to a record $43 billion. This strong AI momentum in Q4 is underpinning Dell’s FY27 guidance for AI server revenue to more than double to $50 billion, which management believes they can achieve while maintaining margins in the mid-single digits.  

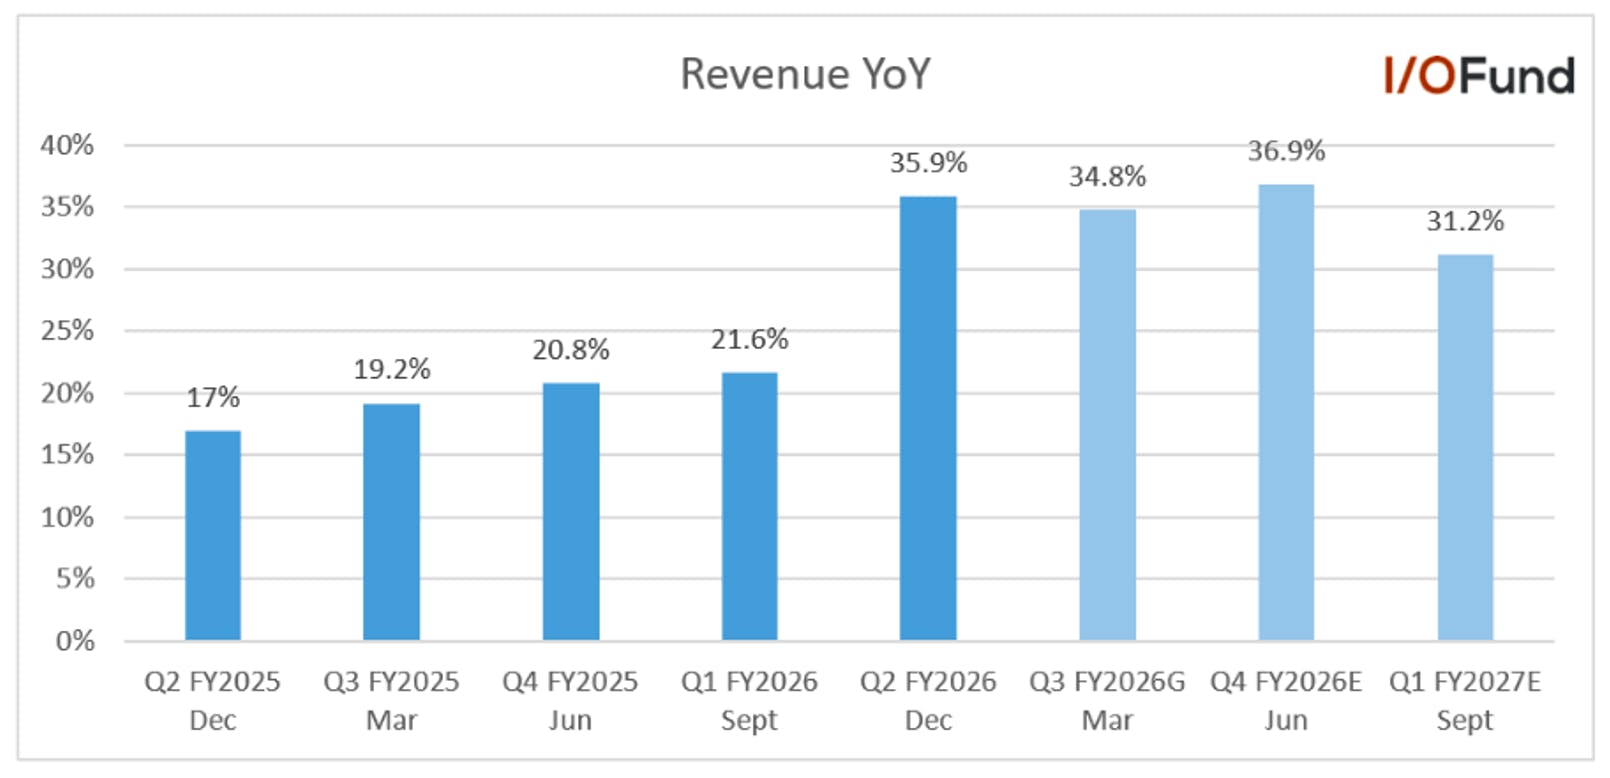
Driven by this AI strength, Dell guided for revenue to accelerate nearly five points to 23.3% YoY to $140 billion, emphasizing that they have the supply to achieve this guide in full for the entire year, despite supply constraints facing the industry, notably in memory. Dell also noted that the demand picture remains robust, and more supply would leave potential for more growth.   

Below, we look into Dell’s AI server metrics, key risks ahead for growth and margins, and potential headwinds on the PC side. 

Robust AI Server Growth, Backlog up 949% YoY 

It’s hard to deny that Dell’s AI server guidance and key metrics were the strongest parts of its Q4 report, with the company guiding for just over 100% growth to $50 billion in AI server revenue this year and both orders and backlog up well over 100% QoQ. However, the predominant question for Dell’s stock is server margins, which Dell stated will be in the mid-single digits. 

Starting with backlog and orders, perhaps the top two metrics this quarter, it’s hard to understate the strength of demand that Dell is seeing. Orders rose 1,906% YoY and 177% QoQ to a record $34.1 billion in the quarter, driving backlog up 949% YoY and 134% QoQ to a record $43 billion.  

Dell clarified that the majority of the backlog consists of Grace Blackwell servers, while Vera Rubin is taking a larger share in its five-quarter pipeline but is not yet appearing in orders, likely due to the system timing in the second half of the year along with potential rumors of slight delays. Management also expects a smoother transition from Blackwell to Rubin, letting them ramp “with more velocity and speed” into calendar 2027. Here is what was stated: “So on the $43 billion backlog, Samik, it is predominantly overwhelmingly Grace Blackwell. There is no Vera Rubin [indiscernible] pipeline. The largest percentage of our 5-quarter pipeline is a combination of Grace Blackwell and Blackwell where we're seeing a rise in x86 Blackwell in the 5-quarter pipeline, driven primarily by enterprise deployment, air being the #1 consideration.” 

Importantly, Dell noted that the dollar value of their five-quarter AI server pipeline has never been larger, despite the robust order activity and $34 billion in orders received, highlighting the breadth of demand from enterprises, CSPs and sovereigns.  
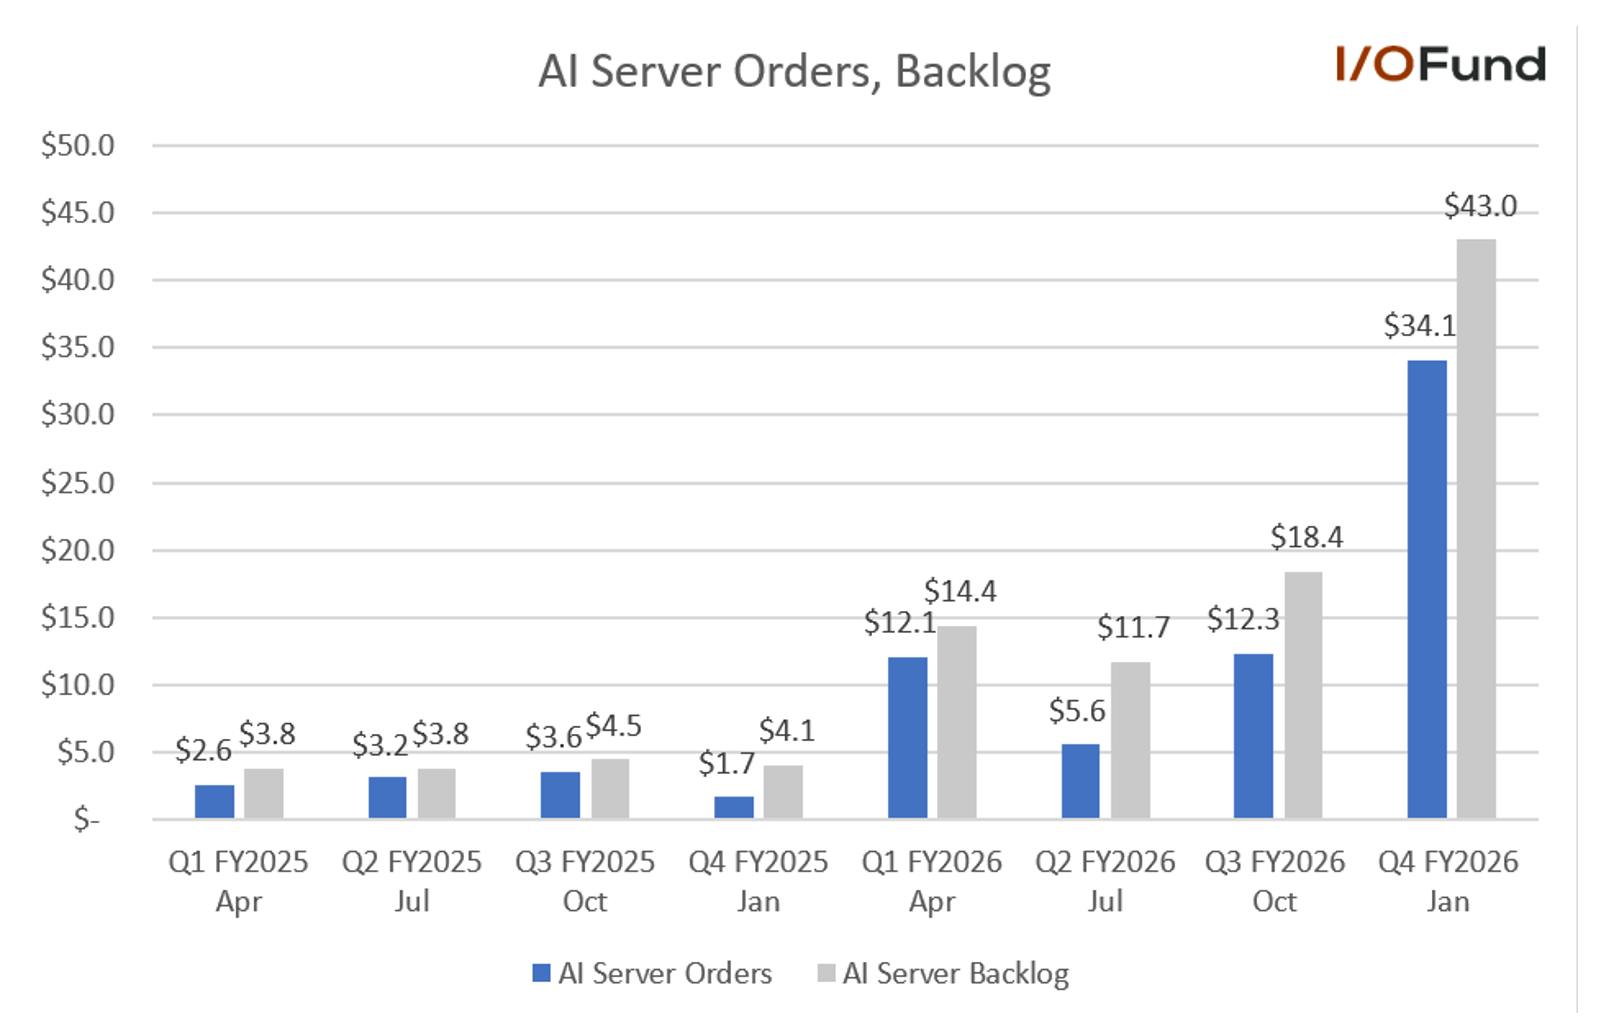
While these both add a large layer of confidence in Dell’s $50 billion AI server revenue guidance for FY27, up 103% YoY, the question moving forward is, what does this mean for growth?   

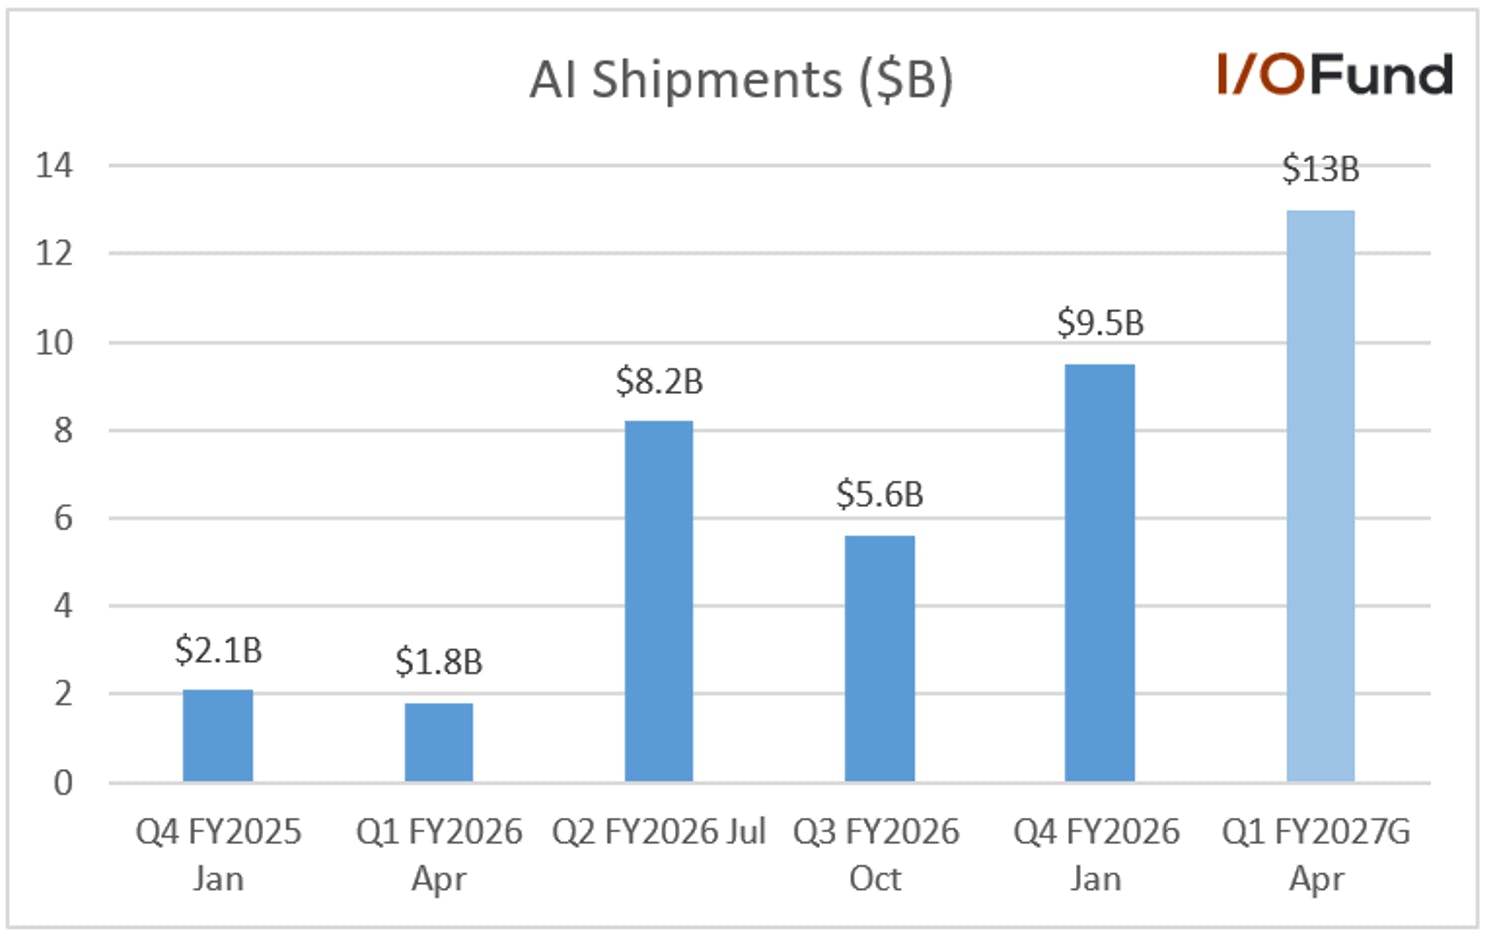
While Dell did guide for Q1’s AI server revenue to be $13 billion, up 620% YoY and 45% QoQ (some of the strongest growth across AI at the moment), its full year guide says this will be its max quarterly run rate. Management had explained at Morgan Stanley’s TMT Conference after earnings that they have “committed to $13 billion of Q1, which is effectively $1 billion a week of shipments going out the door.” Annualizing that gives $52 billion, which suggests there will be minimal QoQ growth moving forward as the max run rate, or that they will be some degree of lumpiness, potentially tied to the upcoming transition from Blackwell to Rubin.  

There is also potential for orders to normalize lower moving through FY27 – Dell is likely quite capable of handling a high degree of orders, yet its backlog exiting Q4 already represents more than 85% of its AI server revenue guide, meaning continuous orders at this level ($10-30B) each quarter could cause its backlog to grow faster than it can get servers out the door. 

Dell also has made clear that there isn’t enough supply to meet the level of demand they see: “If we were to look at some of the demand asks that we would see from customers today and replicate that for a full 12 months, there isn't enough supply to fulfill that.” While Dell emphasized that it has the supply to satisfy its entire guidance for the year (not just Q1), some of the constraints that we see on the memory side in particular may make it increasingly difficult to ramp server revenue much higher. 

It’s Not Only About the AI Server Margins, but Also Storage 

As mentioned above, Dell’s story mainly circulates around AI server margins, which the company is aiming to maintain in the mid-single digit range. Regardless of where mid-single digit is for Dell (whether it’s 5% or 7%), the fact is that AI servers lag its broader ISG segment on operating margins and could present a larger headwind as its share of revenue increases. However, Dell is offsetting this server drag via storage, its highest margin business where growth has been strong and attach rates are rising.  

COO Jeff Clarke explained that Dell has “operated throughout the quarter and over the course of the year in that mid-single-digit operating income [for AI servers]. With what we see in front of us, there's no reason to change that. That is our guidance of where we can operate this business, and we're going to continue to grow it.”  Clarke emphasized again in a later question that Dell believes it can maintain mid-single digit margins while transitioning from Blackwell to Rubin, noting that the current $43 billion backlog “will ship at mid-single digits” as well.  

Looking more acutely at margins, Dell’s ISG segment operating margin was 14.8%, down 3.3 points YoY, with AI servers accounting for nearly 46% revenue share in the segment, up from less than 18% a year ago; Dell said pricing efforts allowed server margins to stabilize despite higher input costs.  

For the entire fiscal year, ISG operating margin was 11.7%, down 1.1 points, with AI servers accounting for 41% of revenue, up from 21%. Based on management’s guide for $50 billion in AI server revenue and ISG growth of mid-40%, AI servers could exit the year at ~57% of ISG revenue, potentially creating a larger margin overhang by next Q4; quick back-of-napkin math assuming a 6% AI server margin roughly projects ISG operating margin dropping as low as 9.7% in FY27 all else unchanged.   

Another challenge with maintaining margins is that Dell faces intense AI server competition, not only from Super Micro, guiding to a similar $40 billion in revenue with operating margins currently at 3.7%, but also from Taiwanese ODMs. Dell faced a question on the latter at Morgan Stanley’s TMT

Erik Woodring, Morgan StanleyErik Woodring, Morgan Stanley 

How do you make sure that you protect yourselves against some of the lower-priced Taiwanese ODMs, making sure that you can defend what you've done and stay with the customers that you have and grow with them? 

David Kennedy, Dell CFODavid Kennedy, Dell CFO 

“Back to your second part of the question, look, again, our value as we look at the production cycle here from the L11 scale and beyond, those engineering standards, those activities, I'm sure we might touch on OpEx in our P&L later. But within our OpEx framework, we are making sure we're investing, investing in our go-to-market teams. So as AI opportunities expand in the enterprise, we're building out the right pod structures and the right capacity to go execute that. But also two, giving Arthur Lewis and his team, the engineering capability, the labs and the investment. So they're not working just on, let's say, Vera Rubin, but the next gen beyond that and beyond that. We're ahead of the game right now. Our job is to stay ahead. So we maintain the value that we can find in our P&L.” 

Dell’s answer here is incomplete without one other quote from management at BofA’s conference, where they explained that they “can deliver hundreds of these racks in a given week like clockwork and have them show up and within 24 to 36 hours, they're up and running and they're generating money for the customer,” where “competitors don't seem to be able to do that reliably.” 

This speed and reliability is key as the Taiwanese ODMs may beat out Dell when it comes to cost at scale, yet Dell’s advantage lies in delivering full rack-scale systems that can almost immediately be monetized by customers. It is also a key advantage in serving the enterprise customer pipeline, now extending to 4,000 customers in its installed base, up from 3,300 in Q3. This also may play a key role in helping Dell mitigate AI server margin erosion moving forward while serving enterprise customers, as competitive pressures on the cost side and potential undercutting to gain share are unlikely to let Dell drive margins higher at the time being.  

However, Dell is leaning on storage to help preserve ISG operating margins in the face of this growing AI-related margin pressure. Dell’s storage IP portfolio, including its PowerMax, PowerScale and PowerFlex, “is the biggest lever as to why we say our core margins, excluding AI, can show a bit of expansion” with ISG operating margin up 2.4 points sequentially to 14.8%. This was driven by storage revenue up 20% QoQ in its seasonally strongest quarter (a slight improvement versus the 18% QoQ last Q4) and 2% YoY, outperforming the market.  

Looking ahead, Dell expects storage to be a primary lever in helping keep margins strong in the face of headwinds from increased AI server share and rising memory costs. This is because Dell is seeing stronger storage attach rates for AI servers in enterprise customers, and strong demand for storage products as inference expands. Management also sees its IP portfolio growing mid-single digit YoY in FY27 and taking a larger mix this year:  

Benjamin Reitzes, Melius ResearchBenjamin Reitzes, Melius Research 

Nice execution here, guys. I'll echo that. My question is on storage. It sounds like it's turning a little bit. You beat the Street by a little bit, 2%. And then you said, I believe that it will grow in the mid-singles for the year, and it looks like it may outgrow servers in the back half of the year. So can you just talk about what's really going on with storage, your highest margin business? Is it really turning? Is it going to be a contributor to mix in the upcoming year that allows you to keep gross margins pretty flat for the year in a tough component environment? 

Jeffrey Clarke, Dell COO Jeffrey Clarke, Dell COO  

Sure, Ben. Look, we're excited about our storage business. Again, we're reporting that on an orders basis, our Dell IP portfolio grew double digits. That's the entire portfolio. PowerMax, PowerStore, PowerScale, ObjectScale and our data domain platforms all grew double-digit demand. Our all-flash grew double-digit demand. It grew in all regions, and we acquired new customers. PowerStore grew its 8th consecutive quarter, 7 of those — the last 7, double digit. 

Half of those new customers that we are winning are new to PowerStore and nearly 30% are new to Dell buying storage. We saw tremendous demand for our unstructured products as AI inference and AI continues to grow, grow, grow. Our Dell IP portfolio is now a greater percentage of the mix year-over-year. We expect it to grow FY '27 over '26, it will be a greater percentage of mix next year than this year. That's part of the profit contribution that David has outlined in our guidance. 

Memory Costs, PC Demand and Pull Ahead Dynamics 

We touched upon some of memory headwinds and potential significant PC unit volume shrinkage the market faces this year in our Silicon Motion analysis, Silicon Motion: Strong Consumer SSD Demand, Trying to Move into AI Enterprise Markets for 2027-2028, with Dell’s management similarly pessimistic on PC growth. 

Management explained that they foresee PC units declining in the range of (11%) to (12%) this year, at odds with the refresh cycle underway, though emphasized that they do “expect the back half of the year to be deeper, probably high teen double-digit negative growth.” To note, this is slightly more pessimistic than estimates from IDC and Gartner calling for (11.3%) and (10.4%) decline in unit volumes this year. Dell also outlined a bit of a pull ahead dynamic, with customers are beginning to understand that quotes tomorrow or next quarter are likely to be higher than price quotes today, spurring some purchasing activity.  

This challenging demand environment has the potential to weigh on CSG growth especially in 2H, though Dell expects its pricing activities to allow them to hit their CSG revenue guidance of 1% YoY even if price increase take unit growth even lower.  

Management pointed out that their price quotes “are valid for the shortest period of time they've ever been. And we're reducing promotions and all sorts of special pricing going forward. … In PCs, we purposely delayed implementing that price move to stay in the hunt to take share and to drive growth, which will serve us for the long run. And then when we made the change on January 6, it wasn't 90 days later, it was that day we stabilized margins.” Management had also clarified that CSG’s higher deal volumes means its repricing efforts take longer to flow through, meaning it will not have as immediate an impact as servers on growth.  

Dell shared a bit on memory costs, noting that Q2 is estimated to rise 20% to 50%, Q3 up 5% to 15%, and Q4 up 5% to 10% for combined DRAM and NAND. Management expects these industry estimates to be in the ballpark, explaining that they have LTAs and capacity agreements in place and that they have experience budgeting prices as needed. However, current forecasts point to conventional DRAM up 58-63% QoQ and NAND up 70-75% QoQ, far ahead of management’s expectations and suggesting that memory prices may still remain a tougher constraint through the summer and beyond. Even if Dell does have the ability within LTAs to avoid some of these increases, broader demand destruction may still occur and impact growth.  

Financials 

Revenue Growth Accelerates to 39.5% in Q4 

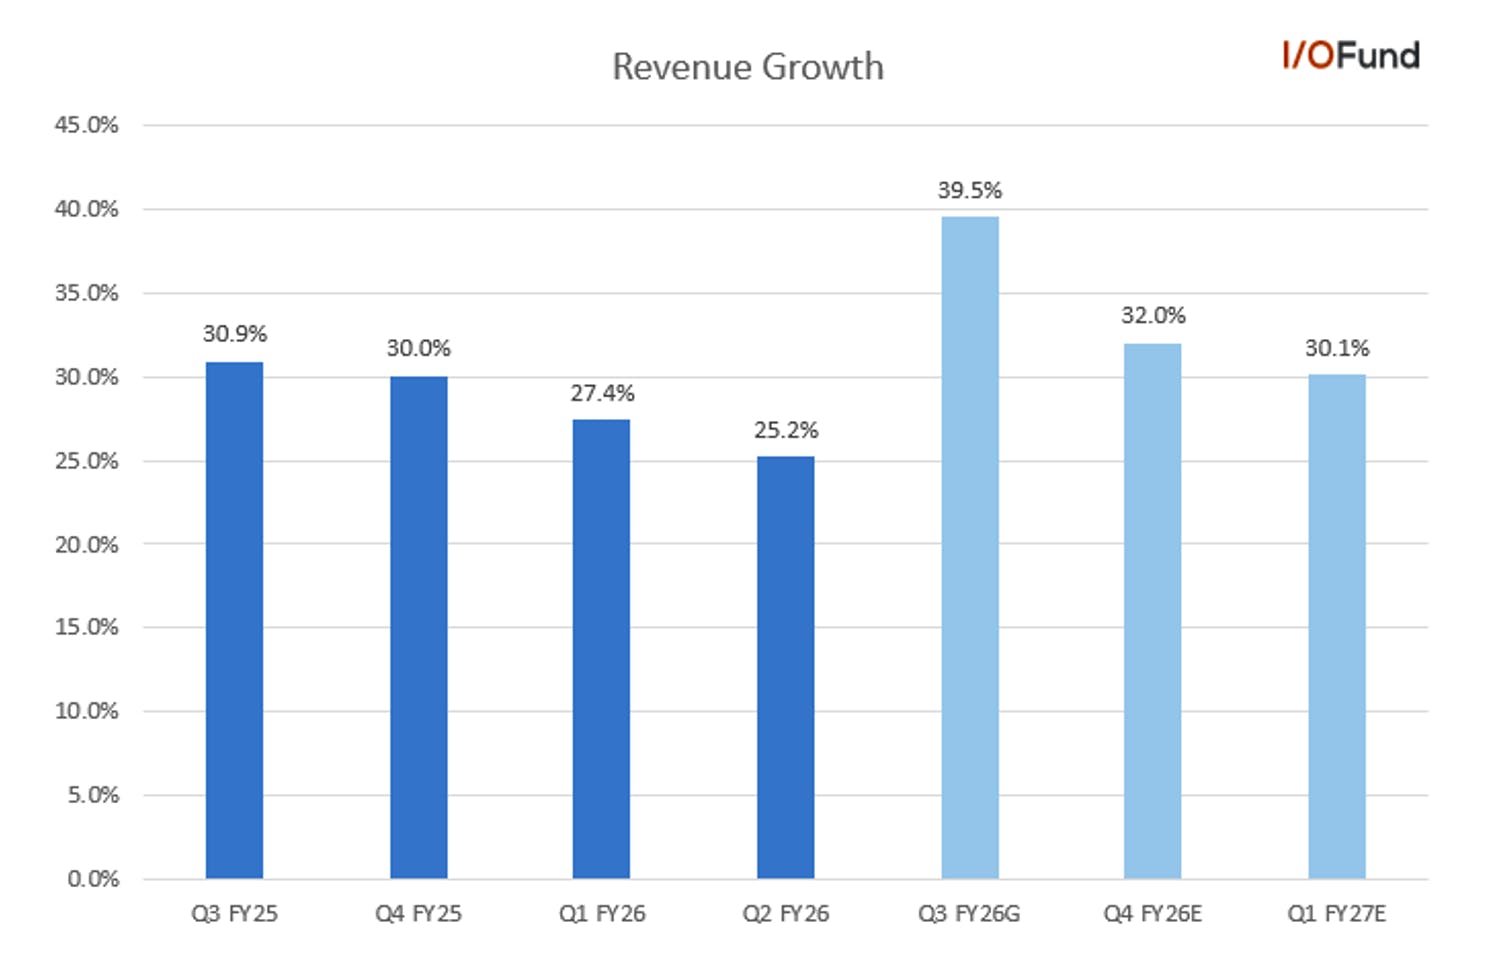
Dell’s Q4 revenue grew by 39.5% YoY and 23.6% QoQ to $33.4 billion driven primarily by outperformance in AI servers. Revenue growth accelerated by 28.7 percentage points from 10.8% YoY growth in the previous quarter and significant improvement from the (9.3%) QoQ decline in the previous quarter.  

Management also provided strong Q1 guidance of $34.7 billion to $35.7 billion, implying YoY growth of 50.6% and 5.5% QoQ at the midpoint. Analysts currently expect Q1 revenue to grow by 51.8% YoY to $35.5 billion and will moderate to 17.6% and 26.6% growth in the next two quarters.  
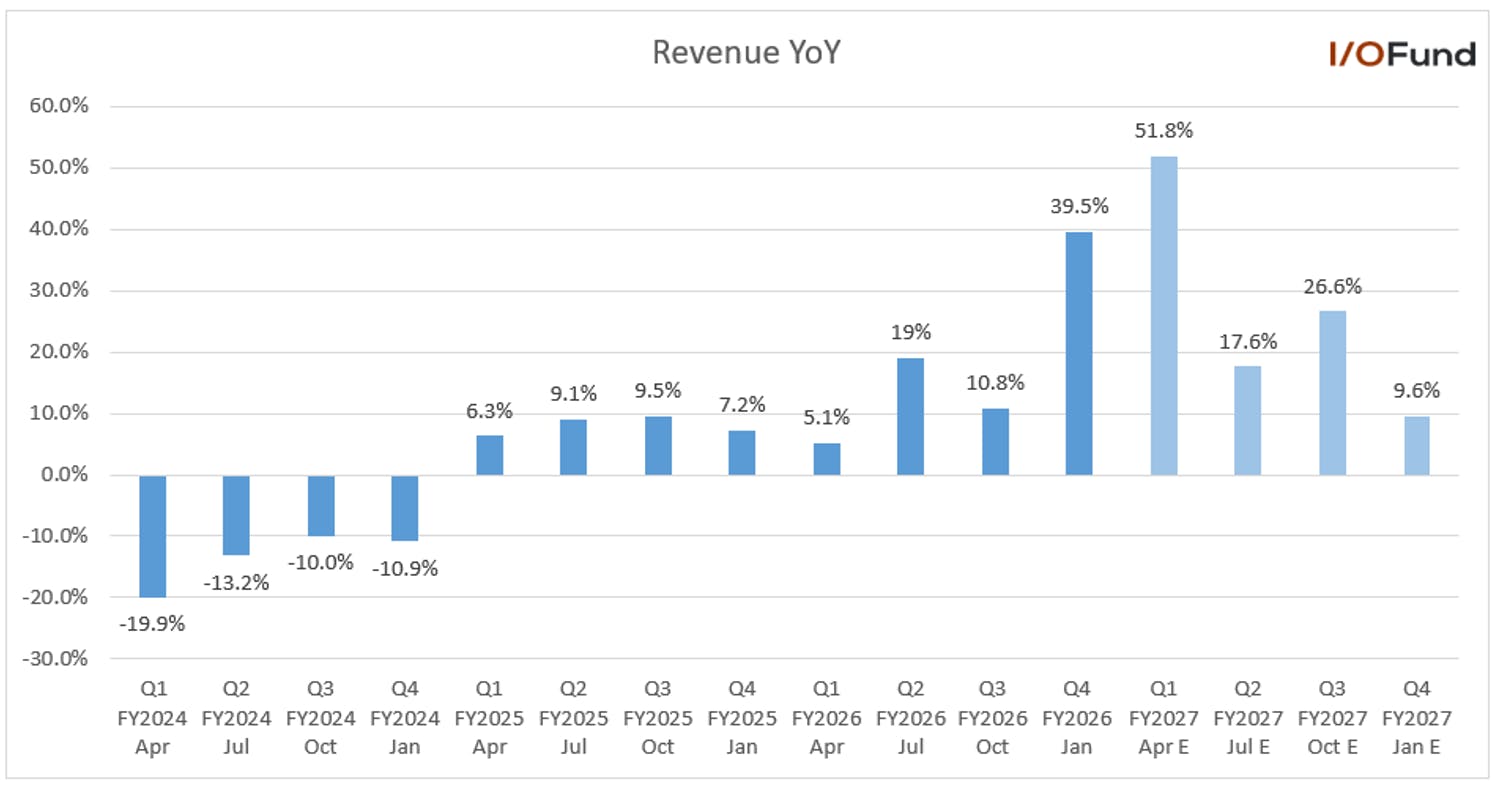
FY2026 revenue ending January grew by 18.8% YoY to $113.5 billion. Management provided a strong FY2027 guidance of $138 billion to $142 billion, implying YoY growth of 23.3%, with one analyst pointing out that Dell is “adding $30 billion more on top line with very little incremental OpEx.” Analysts currently expect FY2027 revenue to grow by 24.8% YoY to $141.7 billion and will decelerate to 6.9% and 4.5% growth in the next two years.  

Key Segments 

ISG Revenue Grew by 73%  

Infrastructure Solutions Group (ISG) Q4 revenue grew by 73% YoY and 39% QoQ to $19.6 billion primarily driven by very strong AI server revenue growth. It marked the eight consecutive quarter of double-digit revenue growth for the ISG segment. ISG revenue is expected to grow over 100% in Q1, primarily driven by strong AI server revenue. 
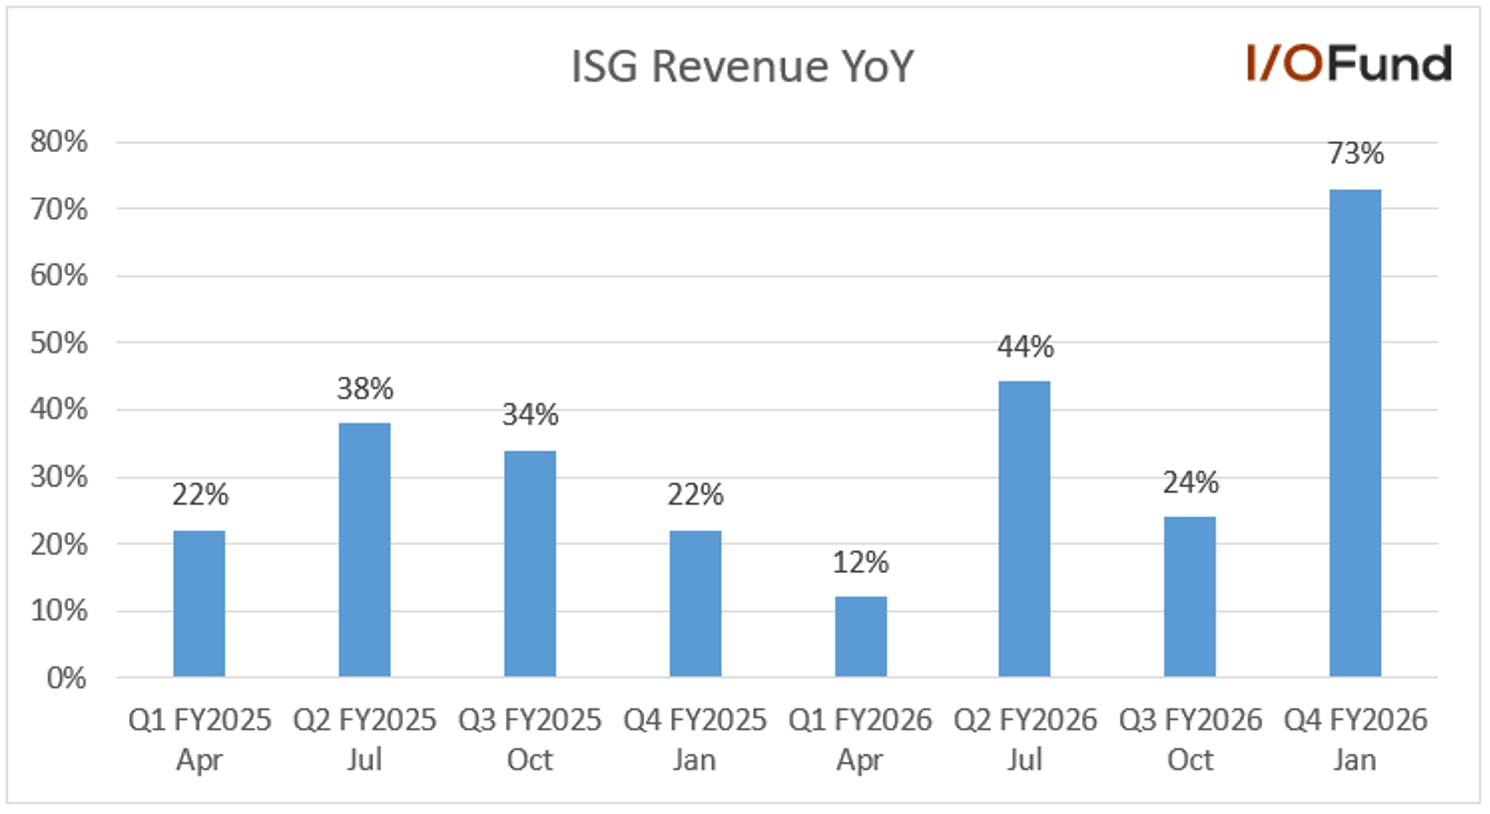
From Q4, the company has started to bifurcate servers and networking revenue into AI optimized server revenue and traditional servers & networking revenue. Q4 AI revenue grew by 342% YoY and 60% QoQ to $9.0 billion. While the traditional servers & networking revenue grew by 27% YoY to $5.85 billion and storage revenue grew by 2% YoY and 20% QoQ in its seasonally strongest quarter to $4.8 billion.  

Management expects Q1 AI revenue to be $13 billion, implying a YoY growth of about 620% and 45% QoQ. FY2026 AI revenue grew by 166% to $24.68 billion, and management expects AI revenue to grow 103% YoY to about $50 billion in FY2027.  

AI orders grew by 1906% YoY and 177% QoQ to a record $34.1 billion in Q4. While AI shipments grew by 352% YoY and 70% QoQ to $9.5 billion. The company’s AI server backlog grew by 949% YoY and 134% QoQ to a record $43 billion. 
CSG Revenue grew by 14% 

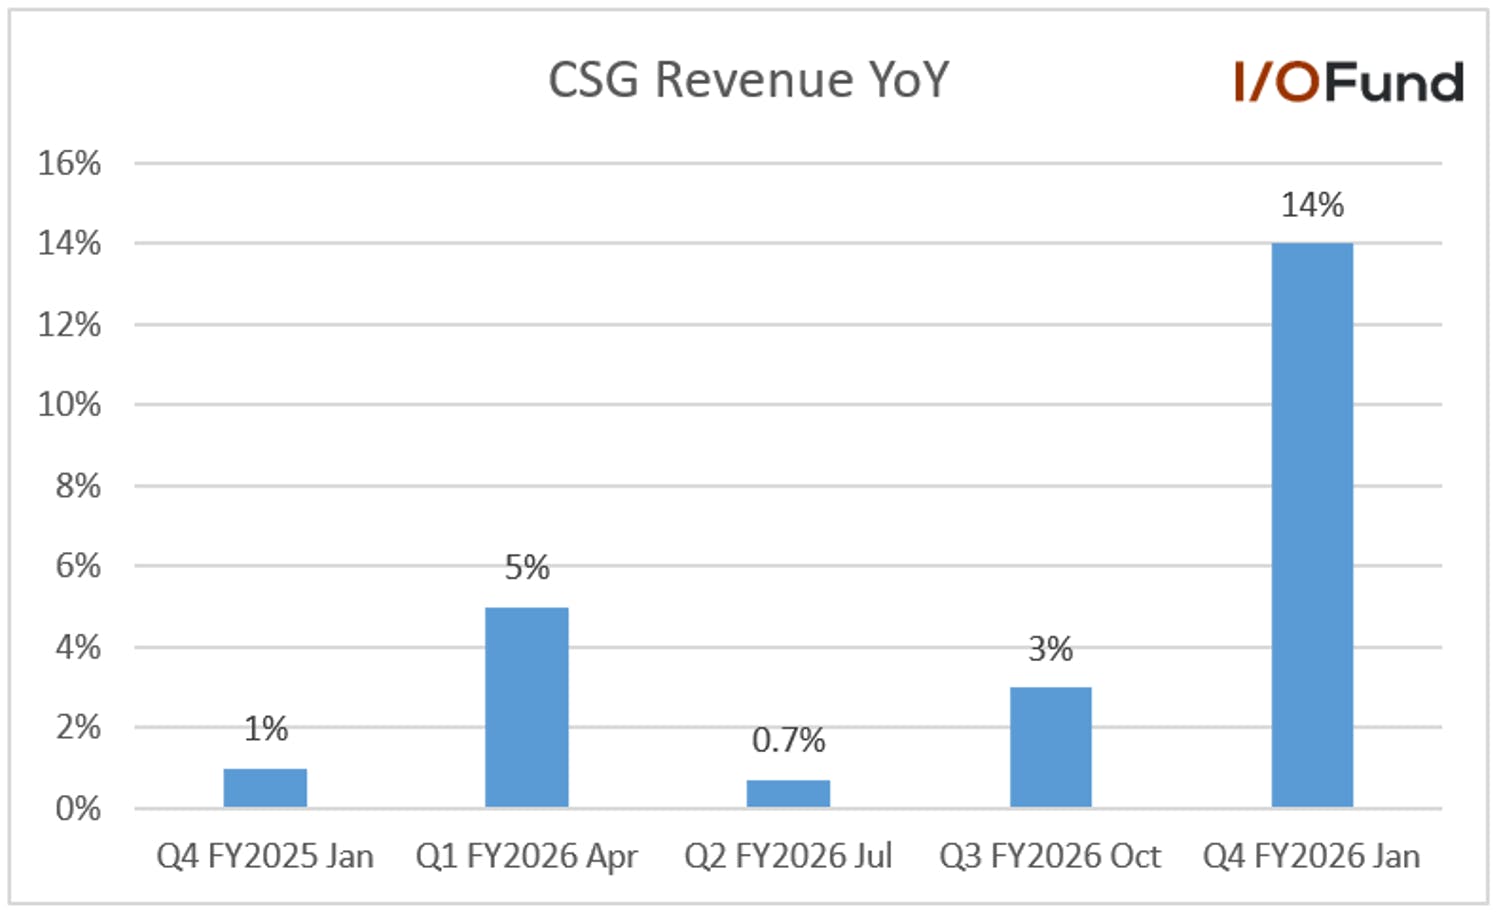
Client Solutions Group (CSG) Q4 revenue grew by 14% YoY and 8% QoQ to $13.5 billion. Commercial revenue grew by 16% YoY and 9% QoQ to $11.6 billion. It was the sixth consecutive quarter of growth and demand up for the eighth quarter. The company is witnessing growth across geographies, with strong large enterprise demand and traction in the lower end of commercial markets. Consumer revenue was flat YoY and up 1% QoQ to $1.88 billion with demand up for the second consecutive quarter, supported by strength in gaming. Management expects CSG revenue to be up roughly 2% YoY in the next quarter. 
Margins 

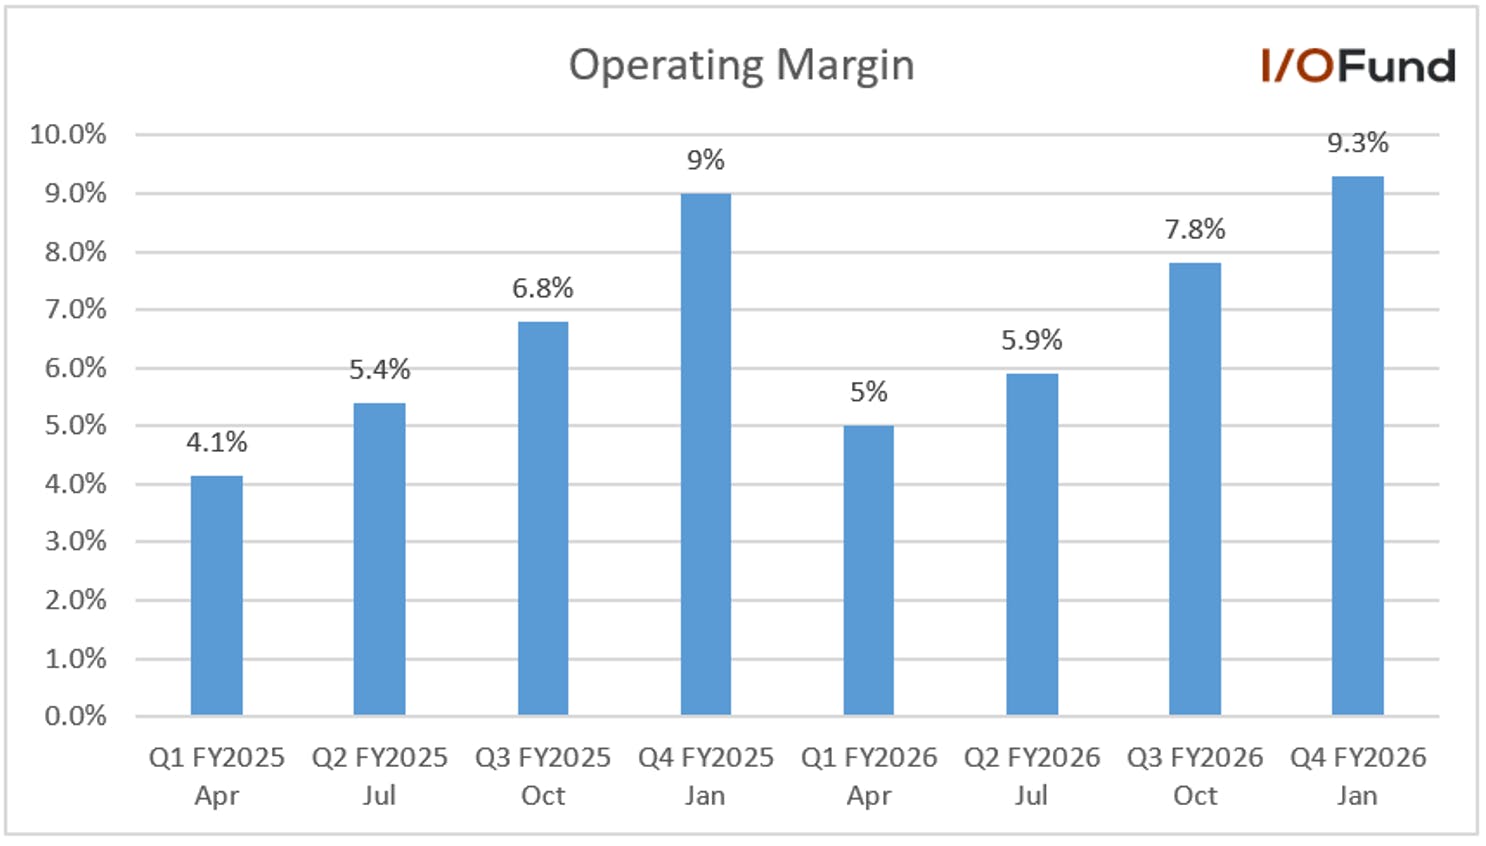
The market was growing concerned that rapidly rising memory costs would squeeze on Dell’s margins (“you're supposed to miss numbers, by the way, when memory prices go up”), yet Dell’s margins are among the highest they’ve been since we began tracking the stock. This is quite impressive given the AI server and memory headwinds, with storage being a key piece of this margin strength despite being a much smaller portion of revenue at $4.8 billion this quarter.  

  • Q4 gross profits were $6.7 billion or 20.2% of revenue compared to $5.7 billion or 23.7% in the same period last year. The lower margins reflect higher proportion of AI revenue mix.  
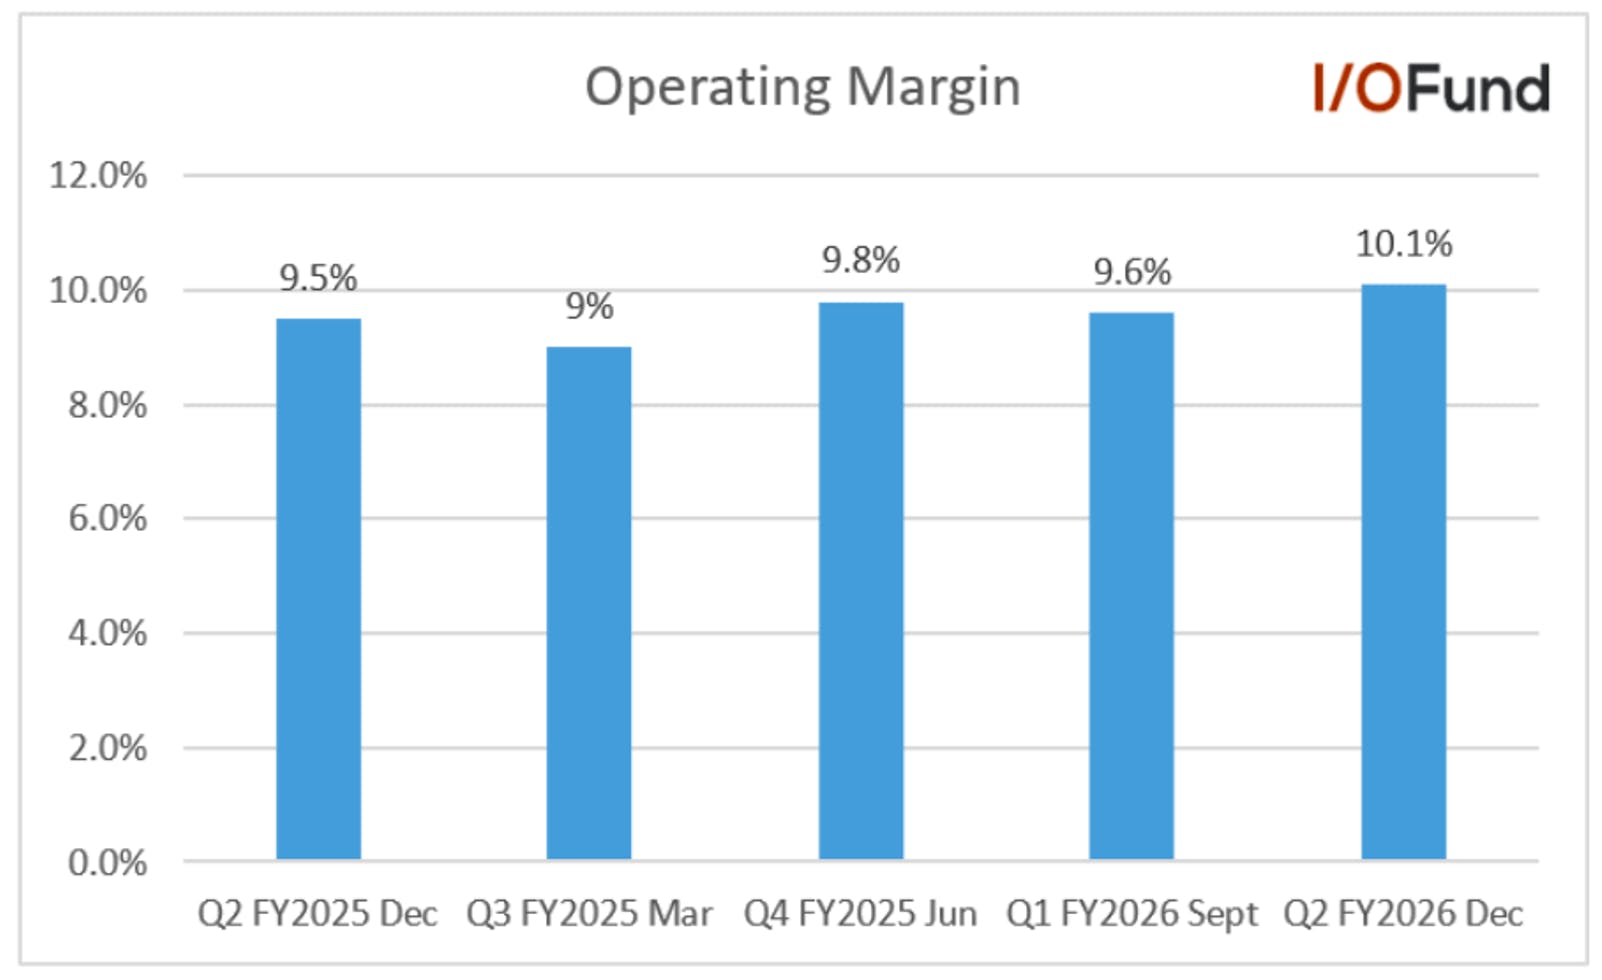
  • Q4 operating income grew by 43.2% YoY to $3.1 billion primarily driven by operating leverage. Operating margin was 9.3% compared to 9% in the same period last year.   
  • Q4 net income was $2.3 billion or 6.8% of revenue compared to $1.5 billion or 6.4% of revenue in the same period last year.  
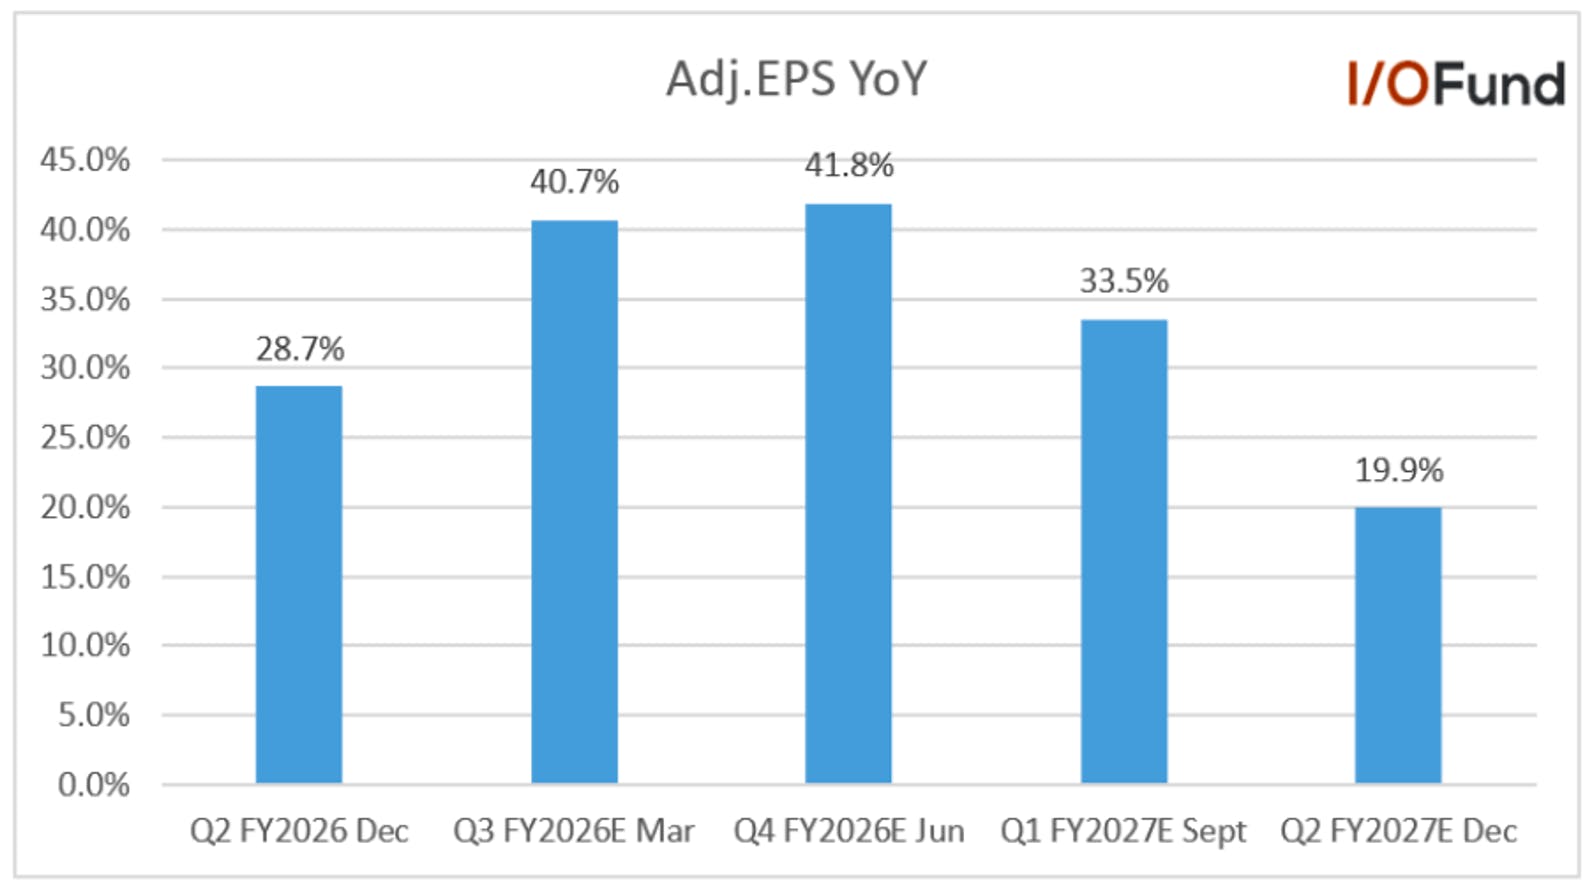
Q4 Adjusted EPS grew by 45.1% 

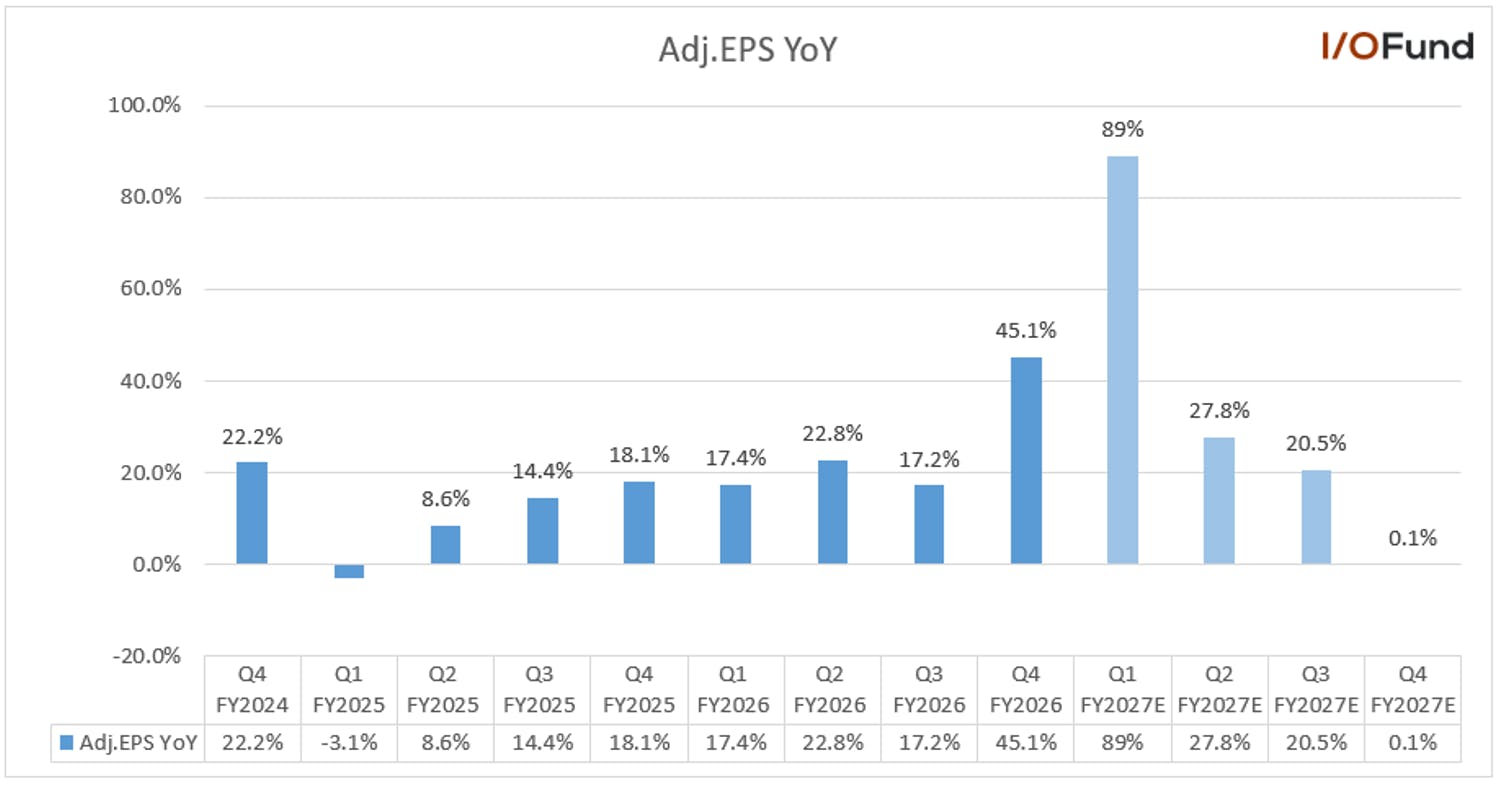
The company’s Q4 adjusted EPS grew by 45.1% YoY to $3.89 primarily driven by operating leverage. Analysts expect Q1 adjusted EPS to grow by 89% YoY to $2.93 and will decelerate to 27.8% and 20.5% in the next two quarters.  

Looking ahead, FY2027 adjusted EPS is expected to grow by 24.5% YoY to $12.82 and 13.8% in FY2028. 
Cash Flow and Balance Sheet

Similar to margins, Dell’s cash flows were equally as strong, with operating cash flow margin expanding by double digits and free cash flow following. Cash flow margins were also around the highest they’ve been over the last three years. 

  • Q4 operating cash flow was $4.7 billion or 14% of revenue compared to $585 million or 2.4% of revenue in the same period last year.  
  • Q4 adjusted free cash flow was $5.1 billion or 15.2% of revenue compared to $474 million or 2% of revenue in the same period last year. 
  • The company had a high debt of $31.5 billion and cash & investments of $13.3 billion at the end of Q4. The company repurchased shares worth $1.85 billion and paid dividends of $346 million in Q4. 
  • The company’s inventories rose 50.2% QoQ to $10.4 billion in Q4 primarily to support the strong AI demand.  

Conclusion 

Dell’s Q4 saw some of the strongest AI revenue growth across the AI industry with AI server revenue up 342% YoY to $9 billion, while orders surged 1,906% YoY to a record $34.1 billion. This order momentum drove Dell’s AI server backlog to a record $43 billion, with it consisting primarily of Grace Blackwell systems, which could be quite helpful if the upcoming Vera Rubin generation sees a delay. Importantly, Dell also has supply secured to satisfy its guidance in full for the entire year, a key advantage considering the memory and component shortages persisting across the industry. 

Moving down the line, Dell’s margins and cash flows stand out as they both approached the highest levels over the last three years, despite AI server margin headwinds and rising memory costs, with Dell leveraging its IP storage portfolio growth to keep margins strong. Growing storage attach rates through FY27 provides a large lever to keep margins strong through the rest of this year even with AI servers guided to grow >100%.

Damien Robbins, Equity Analyst at I/O Fund contributed to this analysis.

Please note: The I/O Fund conducts research and draws conclusions for the Fund’s positions. We then share that information with our readers. This is not a guarantee of a stock’s performance. Please consult your personal financial advisor before buying any stock in the companies mentioned in this analysis.

Recommended Reading:
Silicon Motion: Strong Consumer SSD Demand, Trying to Move into AI Enterprise Markets for 2027-2028 

Leading SSD controller supplier Silicon Motion (SIMO) is forecasting record revenue in 2026, yet the growth story still appears driven primarily by its more established markets across mobile, PC and automotive rather than by a major breakout in AI or data center.  

In the near-term, SIMO is guiding sequential revenue growth throughout the year, primarily driven by the mobile revenue segment with management stating: “We expect continued strength across nearly all our product segments with a particular emphasis on mobile where we expect significant outperformance due to continued market share gains.” 

That said, management has made it clear execution is dependent in part on securing NAND supply on a stable basis, with higher input costs passed through to customers.  

SIMO has a handful of notable customer wins, aside from working with the leading NAND flash and SSD suppliers. The company is supplying controllers for Nvidia’s BlueField DPUs in the second half of the year, along with several NVLink and Ethernet switch solutions. Analysts also implied that the company has won a role in Google’s ASICs project although management did not directly confirm the customer name. 

Today, SIMO appears to be more adjacent to the action around NAND prices surging rather than being in the center of it. While NAND suppliers that own the flash content are seeing the benefits of higher average sales price per gigabyte and higher bit shipments, instead, SIMO sells the controller silicon and firmware that manages the NAND which does not benefit directly from pricing upside. 

Over time, that could change with key products such as enterprise boot drive storage, MonTitan enterprise SSD controllers and PCIe6 MonTitan controllers. Below, we discuss key products that could help SIMO pivot toward the lucrative and highly supply-constrained AI memory market. 

Brief Product Overview 

Silicon Motion supplies a range of high-performance NAND flash controllers, and is the leading global supplier of PCIe Gen4 and Gen5 SSD controllers used in PCs, client devices, and enterprise/data center applications, along with eMMC and UFS controllers for smartphones and IoT devices. The company’s controller chips and firmware help manage how data is stored and accessed across these devices.  

SIMO is heavily exposed to the consumer/client markets, with eMMC/UFS controllers driving 40-45% of revenue in fiscal 2025, with likely a large portion of SSD controller revenue (45-50% of revenue) coming from the two end markets.  

However, Silicon Motion is looking to make solid inroads into the data center heading into 2027, serving merchant GPUs with Nvidia’s new BlueField DPU on its Vera Rubin generation with boot-storage, which helps to start and manage the system. Although this is not nearly as critical (or as valuable) as SSD like what SanDisk offers, which is the main data storage, supplying the boot-storage marks a shift for SIMO as their products will now be in AI servers.  

There are also some other AI-driven tailwinds within compute and enterprise SSDs, being served by its MonTitan platforms in the second half of 2026 for QLC and TLC NAND for AI storage applications. These SSD controllers will help to solve the data storage challenges that AI servers face by helping them feed data and access data efficiently.  

The company supplies the leading flash manufacturers including Kioxia, Micron, SK Hynix/Solidigm, Samsung, SanDisk, and China’s YMTC. Outside of memory suppliers, Amazon is a key customer and Nvidia.  

Moving into Data Center with MonTitan and Enterprise SSDs for AI Servers 

For its AI-oriented product portfolio, SIMO offers a handful of high-performance enterprise SSD controllers in 8-channel and 16-channel configurations, as well as its MonTitan PCIe Gen5 SSD development platform. MonTitan targets data center and enterprise boot drive storage needs, featuring an SSD controller ASIC, reference design kits and enterprise firmware, allowing customers to optimize designs to meet their performance needs.  

SIMO began qualification of high-performance TLC compute SSDs on MonTitan at multiple customers in Q4, with qualification expected to progress through the first half of calendar 2026 and commercial ramp occurring in 2H. Additionally, SIMO expects to begin qualifications with multiple customers this year for QLC storage SSDs. 

MonTitan is expected to be a core growth driver for SIMO once the ramp begins in 2H, with management already guiding for the platform to reach 5-10% of revenue exiting 2026, or ~$60 to $120 million run rate based on current estimates for $1.27 billion annual and $335 million revenue in Q4.  

SIMO is also planning to tape out its first 4nm PCI Gen6 version of MonTitan (as current controllers are 6nm) this year, targeting hyperscalers, NAND flash manufacturers, storage system providers and CSPs. The new 4nm solution is expected to drive growth in 2027 and 2028, with management noting they already have secured a design win expecting to ramp significantly in 2028. 

Ramping for Vera Rubin’s BlueField DPU in 2H 2026 

Silicon Motion is expecting to see tailwinds from merchant GPUs arise in the second half of 2026, from its involvement within Nvidia’s Vera Rubin on DPU boot drives, as well as its NVLink/Ethernet switch roadmap. Management discussed they were involved with other potential customers for enterprise boot drive solutions including a leading search engine firm, with analyst commentary implying that Google may have already been won as a customer, though this was not confirmed. However, SIMO faces two main headwinds at present that could push this growth story to the back burner – timing of the ramp and PC/mobile headwinds, and challenges procuring NAND.  

SIMO explained in Q4’s call that they kicked off volume shipments to Nvidia in the quarter for its current DPU generation, adding that they are also working with the GPU leader “to qualify the next-generation version of their DPU as well as for several NVLink and Ethernet switches of their new GPU/CPU platform that are expected to launch in the second half of 2026.” Management added that the next-gen DPU and switch both require higher capacities, with much higher unit volumes and ASPs, unlocking a new growth opportunity in the back half of the year through 2027. 

This likely corresponds to Nvidia’s upcoming BlueField4 and BlueField4 STX platform announced at GTC, as well as its Spectrum-6 switch family. The STX rack in particular underpins Nvidia’s in-house ‘Inference Context Memory Storage’ platform, an Ethernet-attached flash SSD tier optimized for KV cache at the pod level to accelerate large-context inference. For more on the ICMS platform, refer to our SanDisk analysis here: SanDisk: Shares Up 559% In 2025 On NAND Flash, Enterprise SSD Tailwinds.SanDisk: Shares Up 559% In 2025 On NAND Flash, Enterprise SSD Tailwinds

SIMO provided a brief view on the products it is supplying for Nvidia and their role at GTC: MonTitan SSDs for the ICMS platform and KV cache extension, as well as for near-GPU high performance storage; enterprise SSD controllers for compute-optimized, nearline SSD and warm data storage with TLC and QLC SSD support; and PCIe NVMe boot drives and boot drive controllers.  

Given the new nature of this growth opportunity, analysts questioned about the revenue opportunities from BlueField DPUs/boot drives, and how it will play out this year and into next. Management explained that they expect the DPU/boot drive volume to be “very meaningful in 2026” with revenue around $50 million, but next year to be “much higher” as the NVLink and Ethernet switches see “more volume in 2027.”  

This would imply DPU revenue contribution remaining around <5% of revenue in 2026, based on current estimates for $1.27 billion in annual revenue, though commentary for much higher growth with product ramps weighted next year suggests management has already has solid visibility into the business potentially becoming a much more meaningful topline driver by the end of next year.  

However, the discussions also shed light on some primary headwinds SIMO faces. First, the main challenge comes down to timing, with the ramp more weighted in the back half of 2026 and into 2027, whereas SIMO must currently navigate challenging PC and mobile markets. Second, growth depends on NAND procurement which must be bought at market prices, margins must be passed through to customers, and it is not the sole controller supplier for DPUs.  

Headwind #1: Timing 

SIMO did set the stage for a strong year, expecting record revenue and sequential growth in each quarter with Q1 being the lowest for the year, a strong statement considering growth headwinds facing the mobile and PC markets from rising memory costs, with volumes expected to decline YoY in both end markets.  

This is why timing may be the most challenging aspect to SIMO’s thesis, as it is working to ramp its presence in the data center, yet these initial contributions may not be material enough to overcome PC and mobile challenges as the year progresses.  

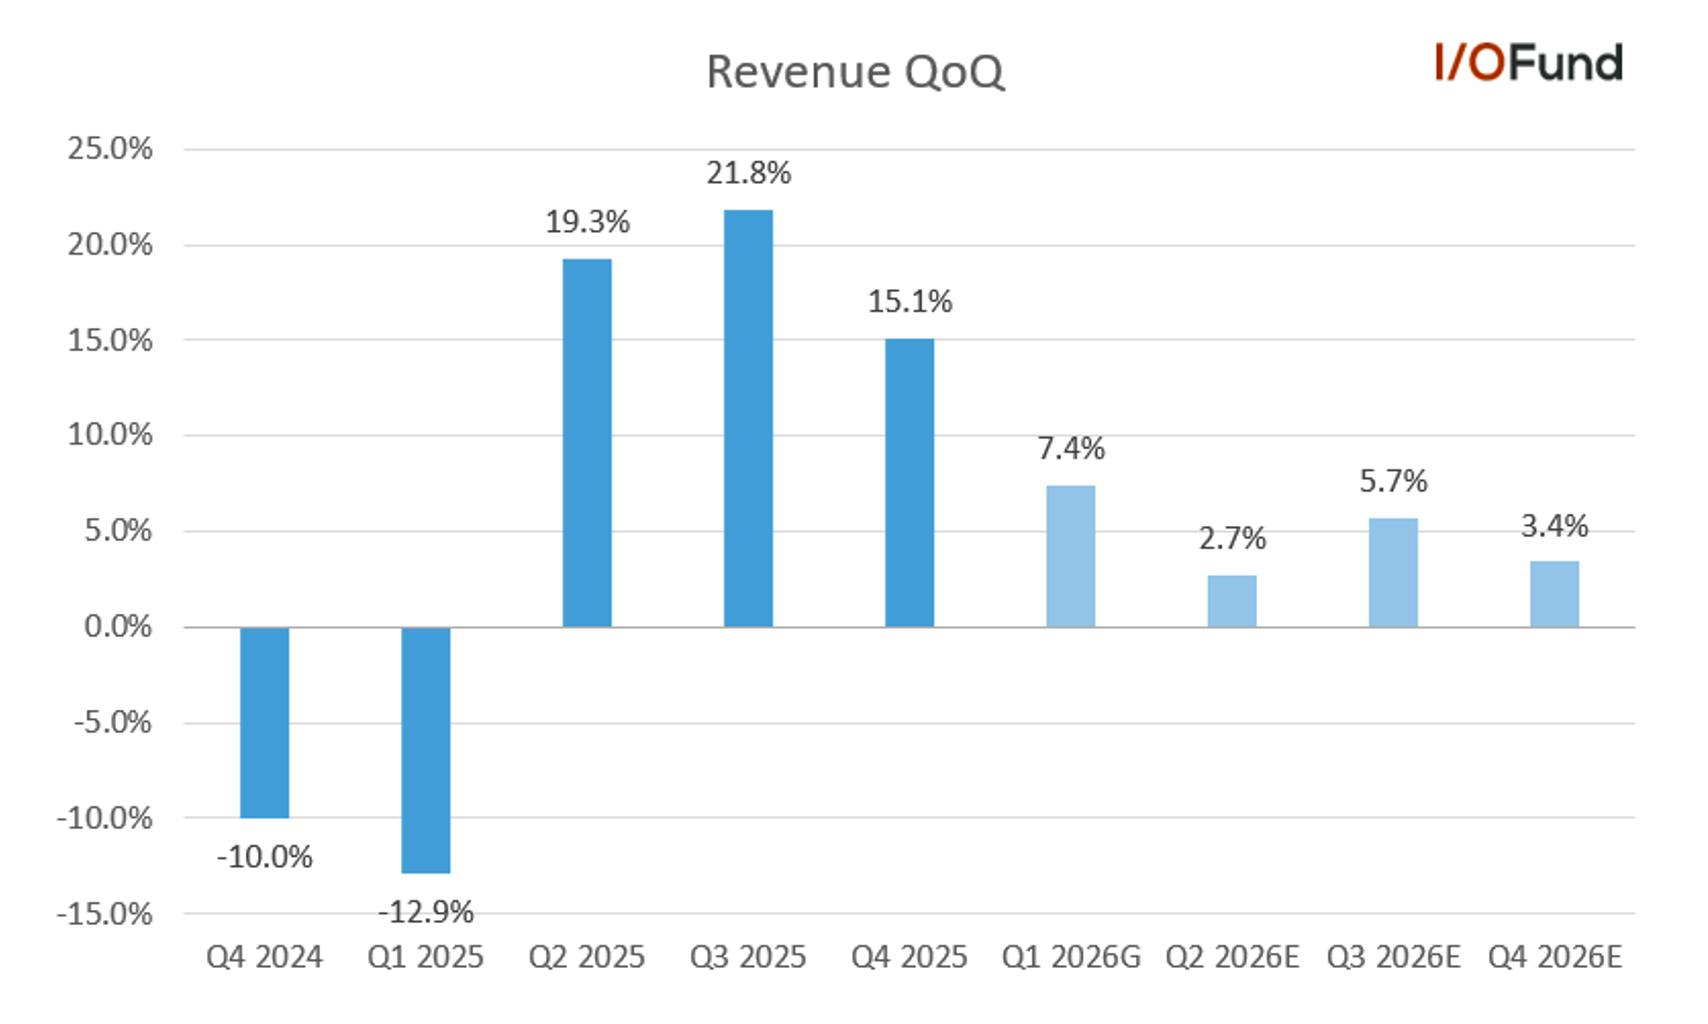
As noted above, SIMO is forecasting Q1 to be the lowest quarter of the year, primarily impacted by typical seasonal weakness in client SSDs with mobile expected to significantly outperform. Guidance was $292 million to $306 million, or $299 million at midpoint for roughly 7.4% QoQ growth, counter to typical seasonality but decelerating from 15.1% QoQ in Q4.  

Current estimates point to SIMO’s sequential growth decelerating further to 2.7% in Q2 and remaining in the low/mid-single digit range through year-end, overall marking a high teens deceleration from Q3’s peak on current estimates.  

A key factor behind the soft forward QoQ growth is likely the PC/mobile headwinds given the significance of eMMC/UFS controller and client SSDs in terms of dollar growth and revenue contribution.  

Recent projections from Gartner and IDC point to a worsening environment for PCs. IDC had originally forecast an (8.9%) decline in shipments in 2026 in its pessimistic scenario from December 2025, yet it now projects an (11.3%) decrease in shipments this year as rising memory costs force price hikes that bite into demand. Gartner sees a similarly woeful year for PCs, forecasting a (10.4%) decline, with analysts there saying this would represent the “steepest contraction in device shipments witnessed in over a decade.” 

For smartphones, both of the two groups forecast a similarly challenging year. IDC is forecasting a (12.9%) decline in the smartphone market in 2026, a rather substantial revision lower from its December projection for just a (5.2%) decline. For comparison, Gartner projects an (8.4%) decline. This follows low-single digit growth in 2025. 

SIMO does expect to outperform both markets and deliver growth as it benefits from market share gains and improved ASPs, explaining that they will “get the benefit of both higher share and higher ASPs this year in spite of any sort of macro issues around PC unit volumes.” 

However, it is still worth pointing out that there is no guarantee that it will be able to flawlessly navigate what could shape up to be some of the worst growth in PCs more than a decade and potential double-digit unit declines. If these supply chain difficulties persist and cause inventory buildups at OEMs, consumer/client NAND demand could be impacted, and SIMO’s limited data center opportunities (where NAND demand is likely to remain relatively well insulated from rising storage demand) may not be enough to offset growth and margin headwinds.   

Headwind #2: NAND Procurement 

While the PC and mobile headwinds are two challenging external headwinds, perhaps the most challenging internal headwind SIMO will face comes down to NAND supply. This is because the company has to procure NAND itself at market price, and then work to pass the costs on to customers, without benefitting from some of the end-unit pricing power that its customers are seeing: 

“We need to procure the NAND and NAND price at the market price. So we have to work out with the customer, we can pass through the cost increase to the end customer. So it is challenging but ongoing process quarter-by-quarter. It definitely will impact some of our gross margin but we manage the margin pass-through. So I think because even the customers, they have at least 2 to 3 supplier, so they're based on the price and based on the supply and depends the percentage.” 

The challenge here is that NAND prices reportedly rose ~90% QoQ in Q1, and were estimated to increase ~20% QoQ in Q2 in early February, yet the latest data suggests prices could rise 70-75% QoQ in Q2. Recent reports from Korea also suggest Samsung is doubling prices sequentially in the second quarter, implying that pricing is not yet slowing down. Simply put, when input costs rise 70% or 90%, prices must follow at a similar or faster rate in order to preserve margins.  

Considering the boot drive solution is a new product line with minimal revenue contribution until 2H, outsized pricing headwinds this early in its ramp phase could weigh substantially on gross and operating margins, which are already quite thin in the mid-40% and 13% range. This compares to its customers like Micron who are pushing above 80% and 76% next quarter as major beneficiaries of the price increases. 

Management also flagged that growth will be dependent on its ability to secure NAND supply ‘stably’, another major challenge considering SIMO has two NAND suppliers – stated as Kioxia and WDC (though likely to now be SanDisk). Management explained that one of these suppliers is secure, yet the other is not, which could impact their ability to secure stable supply at favorable prices, especially if the second prioritizes allocations to the highest bidder. To note, Kioxia announced in January that its NAND output for 2026 was essentially fully sold out. 

Financials  

Revenue Growth Accelerates to 45.7% in Q4 2025  

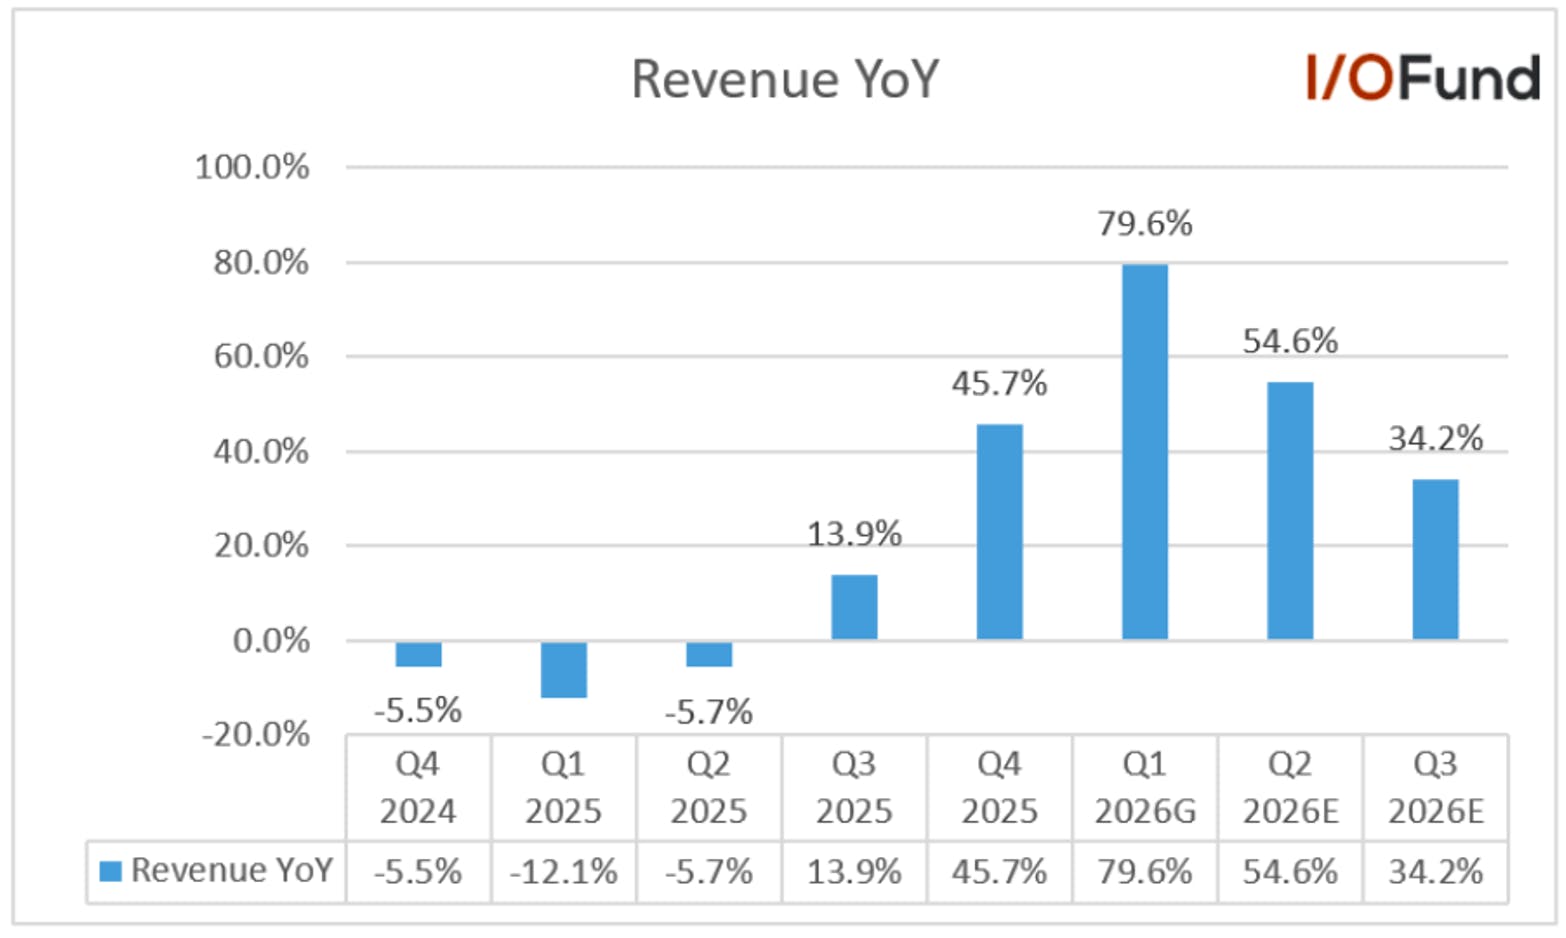
Silicon Motion’s Q4 2025 revenue grew by 45.7% YoY and 15.1% QoQ to $278.5 million. Revenue also beat estimates by 6.7%, reflecting the continued strength in mobile business and strong growth in the PCIe 5 SSD business. Revenue growth accelerated by 31.8 percentage points from 13.9% YoY in Q3 2025. Though sequential growth slowed from 21.8% in Q3, it was better than the decline of (10%) in the same period last year.   

Management also provided a strong Q1 revenue guide of $292 million to $306 million, implying a YoY growth of 79.6% and 7.4% QoQ at the midpoint. Management expects continued strength across its products with a particular emphasis on mobile end markets, where it expects significant outperformance driven by continued market share gains.

2025 revenue grew by 10.2% YoY to $885.6 million. Analysts expect revenue growth to accelerate to 43.1% YoY to $1.27 billion in 2026. Management expects 2026 to be a record year, with revenue growing each quarter sequentially, supported by first-half momentum in eMMC and UFS products. To briefly recap, MonTitan enterprise SSD products are expected to scale in the second half of 2026 and contribute 5% to 10% of revenue by the end of the year, with strong growth anticipated in the years ahead. 

Key Segments  

SSD Controllers  

SSD Controller sales increased by 25% to 30% QoQ and 35% to 40% YoY in Q4 2025, compared to an increase of 20% to 25% QoQ and a decrease of 0% to 5% YoY in Q3. Management expects client SSD controllers to ramp throughout the year, though the first quarter is seasonally weaker. They expect the new DRAM-less 4-channel PCIe 5 controller that was introduced last quarter to ramp significantly throughout 2026 and the MonTitan controller ramp is expected in the second half of 2026.  

For the full year 2025, SSD Controllers accounted for 45% to 50% of revenue and revenue declined by 0% to 5% YoY.  

eMMC + UFS Controllers  

The company’s eMMC (Embedded Multimedia Card) + Universal Flash Storage (UFS) controller sales increased by 0% to 5% QoQ and 50% to 55% YoY in Q4 2025, compared to an increase of 20% to 25% QoQ and 35% to 40% YoY in Q3 2025.  

For 2025, eMMC + UFS Controllers accounted for 40% to 45% of revenue and revenue increased by 20% to 25% YoY. Given the current backlog and customer outlook for 2026, management expects to significantly outpace the market and deliver another strong year of growth of the eMMC and UFS business despite the difficult market environment, with the two accounting for 35% to 40% of revenue in 2026. 

SSD Solutions  

SSD Solutions revenue increased by 125% to 130% QoQ and 110% to 115% YoY in Q4 2025 compared to an increase of 15% to 20% QoQ and decrease of 40% to 45% YoY in Q3 2025. For 2025, SSD Solutions accounted for only 5 to 10% of revenue and declined by 10% to 15% YoY.  

The company’s boot drives are part of  its  SSD solutions, and this segment is currently growing rapidly due to the strong AI demand.  

Margins  

The company’s margins are improving; however, management expects slight pressure in Q1 primarily due to product mix, with improvement anticipated as the year progresses.  They expect gross margins to return to the target range of 48% to 50% as the year progresses, as the mix of newer products increases, including the PCIe 5 controllers and enterprise SSD solutions.  

  • Q4 gross profits grew by 56.2% YoY to $136.8 million with a gross profit margin of 49.1%. The adjusted gross margin improved by 320 basis points YoY and 50 basis points QoQ to 49.2%. The improvement in gross margin was primarily driven by the successful ramp of new products and a favorable product mix shift toward client PC products.   
  • The adjusted operating margin came at 19.3%, up 380 basis points YoY and 350 basis points QoQ. Management expects full year 2026 adjusted operating margin to improve despite the higher expenses this year, primarily driven by operating leverage. 
  • Q4 net income came at $47.7 million or 17.1% of revenue compared to $21.6 million or 11.3% of revenue in the same period last year. The company benefited from the realized/unrealized gain on investments of $24.2 million in Q4 2025 compared to $0.1 million in Q4 2024.  

Q4 Adjusted EPS grew by 45%  

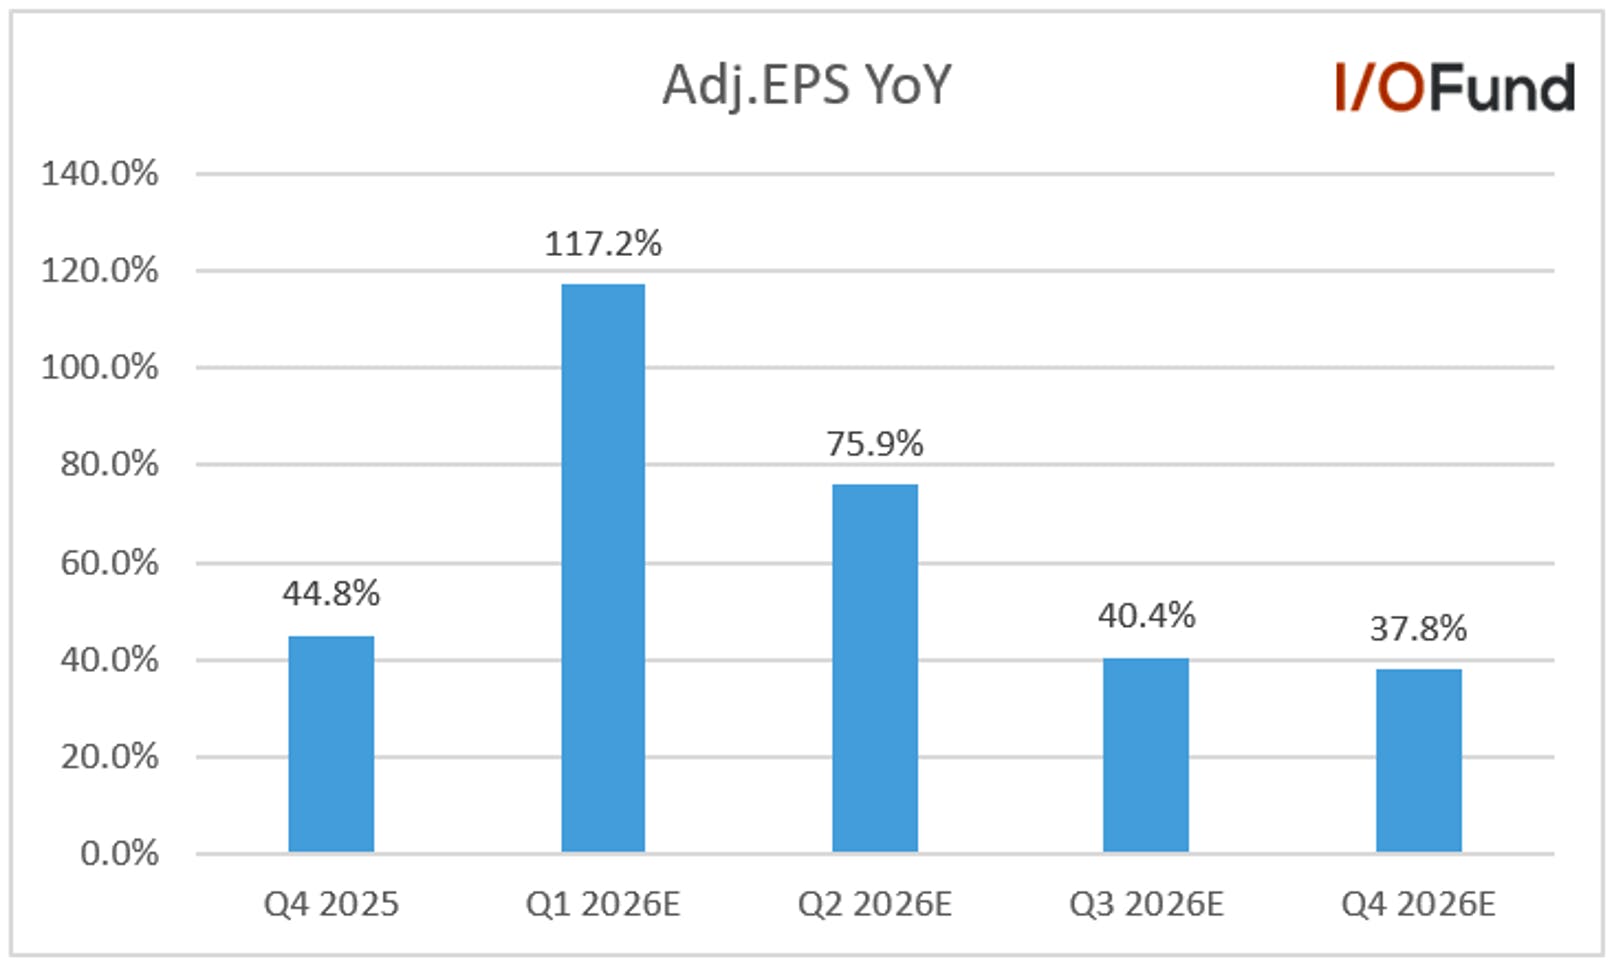
The company’s  Q4 adjusted EPS grew by 44.8% YoY to $1.26. Analysts expect strong growth to continue and expect Q1 adjusted EPS to grow by 117.2% YoY and 75.9% in Q2 2026. Looking forward, adjusted EPS is expected to grow by 59.4% YoY in 2026 and 21.9% in 2027.  

Cash Flow and Balance Sheet  

The company’s cash flows have been lumpy, and the increase in inventory to support strong future growth has put pressure on cash flows.    

  • Q4 operating cash flow was $1.6 million or 0.6% of revenue compared to an operating cash outflow of ($6.2 million) or (3.2%) of revenue in the same period last year.   
  • Q4 free cash outflow was ($6.3 million) or (2.2%) of revenue compared to ($17 million) or (8.9%) of revenue in the same period last year.   
  • The company had cash of $201.8 million and no debt at the end of Q4 2025 compared to $198.6 million in cash and no debt at the end of the previous quarter.  
  • Inventories increased by 24.8% QoQ to $421.8 million to support the strong future growth.  

 Conclusion 

 SIMO is guiding for record breaking revenue in fiscal 2026 despite growing headwinds in the PC and smartphone markets from rising memory costs. Q1 is expected to the lowest quarter of the year for revenue with client SSDs seeing typical seasonal weakness, with sequential growth in each quarter thereafter.  The company’s AI opportunities around Nvidia’s BlueField DPUs are expected to arise in the second half of the year and contribute roughly $50 million with a larger impact in 2027, while MonTitan is expected to quickly ramp in 2H to 5-10% of revenue. 

Revenue growth will also hinge on SIMO’s ability to stably procure NAND supply to meet its end market demand, making increasing memory costs a point to navigate for growth.  

An analyst on the call threw out 2027-2028 as potential timing for when the enterprise segment could get interesting. Our analysis points toward something similar, which is that 2026 may be a solid growth year for mobile and also PC yet is unlikely to be the year SIMO breaks out as a major enterprise AI story.  

Given the growth we are seeing in NAND, we felt it was worth our time to look at this stock more closely, yet will put SIMO on the shelf for further review until end of 2026 to see if a few of these green shoots materialize in the AI market.

Damien Robbins, Equity Analyst at I/O Fund contributed to this analysis.

Please note: The I/O Fund conducts research and draws conclusions for the Fund’s positions. We then share that information with our readers. This is not a guarantee of a stock’s performance. Please consult your personal financial advisor before buying any stock in the companies mentioned in this analysis.

Recommended Reading:
Aehr’s Bookings Surge as Expected in Q3, Book-to-Bill of 3.5X 

While revenue missed estimates this quarter, and both margins and cash flows remained pressured, Aehr delivered where it mattered most – bookings and backlog. Q3 bookings rose 500% sequentially to $37.2 million, which Aehr says puts it on track to reach the upper end of its $60 to $80 million forecast for 2H. Aehr is continuing to see solid momentum in Q4 with $12.2 million in bookings to date, taking its effective backlog above $50 million and supporting the revenue inflection now becoming more visible in Q4.  

Additionally, Aehr is continuing to expand capacity, tapping into contract manufacturers to support an additional 20 Sonoma systems per month. This comes on top of the capacity expansion we outlined last week in our analysis Aehr Sees 2H Bookings up 4X vs 1H, Supporting Strong FY27 where Aehr explained it could support 20 of both its wafer-level and package-level systems each month if needed. Importantly, Aehr noted this new capacity could be almost immediately available for shipments.  

Aehr had broken out prior to earnings, and using technicals we entered the stock. The same will be true for when we exit the stock. This is not a stock we want to be early to enter or late to exit. Knox will cover more in his upcoming webinar. 

Bookings up 500% QoQ, Book-to-Bill of 3.5X 

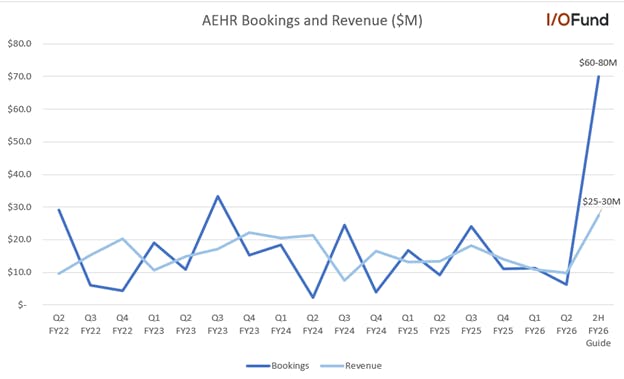
As we had covered just last week prior to Q3’s report, Aehr unofficially guided for bookings to rise roughly 4X to $60 to $80 million in 2H FY26, with the company already off to a strong start to potentially exceeding that forecast.  

Bookings rose 500% QoQ in fiscal Q3 to $37.2 million, a fresh quarterly record for the company, and driven by the flurry of orders we covered last week, including the $14 million order from its lead AI processor customer placed one day before quarter-end on February 26. Aehr also offered a look at its book-to-bill ratio, noting it exceeded 3.5X in the quarter, reflecting the strong demand it has been seeing recently across AI processors, ASICs and silicon photonics; while this is not typically a metric provided by the company, combined with the bookings and backlog strength, it reinforces the durability of demand and revenue acceleration in FY26. 

Aehr also pointed out that in the first five weeks of fiscal Q4, it received an additional $12.2 million in bookings, with this related to its two orders announced in March, including the new major SiPho customer. Aehr also stated that on April 6, it received an order from a brand-new customer for Sonoma for reliability qualification of a new AI processor, though no other details were given. This brings Aehr’s effective backlog to $50.9 million (from Q3’s ending backlog of $38.7 million, up 113% YoY and 228% QoQ), a new record for the company and offering strong visibility into Q4 and early FY27 revenue.  

To circle back to the chart we provided last week for bookings and revenue, there are a few new takeaways. Based on management’s commentary to be on the high end of the $60-80 million bookings forecast, or reasonably assumed at $75 million, Aehr’s Q4 bookings would be estimated at $37.8 million, up less than 2% QoQ. Given that Q3 had seen $12.2 million in bookings in five weeks, there will need to be some acceleration through the end of May, or a few larger orders coming in.  

Additionally, we do also see the first sign of revenue inflecting in Q4, with Aehr’s maintenance of 2H revenue guidance of $25 to $30 million implying $17.2 million at midpoint. This still leaves a >$20 million difference between estimated bookings and revenue to flow through to backlog, setting the stage for a strong acceleration into the first half of FY27 as this backlog ships. Further supporting this was commentary we detailed last week on some of the recent orders shipping in FQ1/second half of CY2026, with the AI ASIC customer forecasting “substantial expansion of Sonoma systems purchases beginning in the second half of calendar 2026 and continuing into '27.” 

Brief Customer Update 

While there have been no major new updates since last week, aside from the limited details on the April 6 order noted above, there were a couple of comments from management around AI and SiC that differed a bit from last quarter’s call. 

Aehr said it is actively engaged with multiple additional AI processor companies on benchmarking, and expects “meaningful progress” to be made, though with no clear timeline. Management also said that they have several companies ranging from AI accelerators, edge processors, and CPUs that are providing roadmaps on devices and asking about WLBI capabilities, suggesting there could be some new future engagements or potential orders down the road. Aehr also noted that the benchmark evaluation with a top-tier AI processor supplier is making good progress, but taking longer than expected. 

On memory, Aehr said they are in discussions with key HBM suppliers, and “seeing the added potential for HBM insertions with our FOX multi-wafer test and burn-in system road map that extends to flash, high-bandwidth flash, DRAM and HBM memories,” with these opportunities expected to drive orders in FY27 that ramp in FY28. 

For ASICs, CEO Gayn Erickson said he was “surprised” at how many “ASIC suppliers don't do production burn-in yet or are talking about doing it,” estimating it could be only 5% or 20% that actually get burnt-in. These comments imply that the ASICs opportunity could be increasingly large if burn-in adoption accelerates, as Aehr’s ASICs customer is one of the key anchors to its strong bookings and FY27 growth forecast. 

On SiC, Aehr noted this quarter that they are seeing an uptick in activity and customer forecasts, particularly from Japanese and German OEMs for upcoming EV launches. Management said that while they are “not yet counting on significant revenue from this segment to return yet,” they believe SiC “could still be a very good performing segment for us next year.” 

Aehr Taking Capacity Another Level Higher via Contract Manufacturing 

Aehr’s comments on capacity were some of the most important from last quarter, notably that management highlighted they had the capabilities to ship 20 systems a month at either wafer or package-level and could extend that to 20 of each per month as needed. Commentary from Q3 implied that Aehr’s Fremont facility is capable of supporting that itself, with Aehr now moving to contract manufacturing for an additional leg higher in capacity. 

This quarter, CEO Gayn Erickson explained that “in addition to our Fremont expansion, this quarter, we'll begin shipping Sonoma systems from one of our current contract manufacturers, adding capacity of more than 20 additional Sonoma systems per month. This meaningfully increases our ability to support future growth.”  Erickson further clarified that Aehr the contract facility would support larger volume orders of Sonoma SKUs, while Fremont would still manufacture both Sonoma and FOX products. 

Simply put, turning to these two contract manufacturers for additional production will move Sonoma’s monthly production curve up to 40 per month. One reason for this is that packaged-part engagemetns are implied to be easier to secure, and also can be as large or larger than wafer-level: “the ASP of a production order set in wafer-level burn-in can be $10 million to $20 million in an order, let's say, okay? Package-level can be that big or bigger, too, okay? So when they come in, it looks like, oh, right now, we see demand on both significant. Now the engagement and the work to get a wafer-level burn-in is definitely harder than package level.” This is key as Aehr could now secure and support more large-scale Sonoma deals with a faster shipping cadence, quickly supporting revenue upside.  

While Aehr does not publicly disclose pricing, the $5.5 million order from last quarter for multiple systems implies a reasonable range could be around $1 million for a rough estimate of what this capacity could support; at that estimate, this would be around $40 million per month or $480 million annually. This also does not include the potential wafer-level revenue opportunity that we estimated last week to be as high as $960 million to $1.2 billion at full scale each month.  

Most importantly, Aehr expects this uplift in Sonoma capacity to immediately be available, with the first products ready to ship to customers this quarter (aka May), with management wanting the contract manufacturers to be ready to ship in full volume by the summer when Sonoma is expected to ramp. 

Quick TAM Note 

It’s important to share some of Aehr’s brief discussions on its TAM and growth opportunities from more powerful chips, as it was again hinted that Aehr could potentially vault to hundreds of millions in revenue in the future.  

As we have covered in detail in our power analysis, Why Power is Critical for Data Centers and their Hyperscaler Customers, GPU generations are getting increasingly more powerful with each cycle. Aehr says that this trend, including the upcoming chips on Nvidia’s roadmap, “break the current tools, and so there's a continuous road map” for Aehr’s solutions, such as Sonoma, which is continuously adapting to support higher power and higher current.  

CEO Gayn Erickson also believes there is a natural progression for Aehr offering both wafer and package level, as this versatility “becomes particularly valuable when you have like a package that has multiple processors in it and all the HBM memory, right? So in those particular ones, I mean, the CoWoS substrate is more expensive than the silicon itself or the processor … So I think there's a progression over time where people will move towards wafer-level on the things they can default to package-level where they can't.” 

Overall, Aehr believe that package-level burn in supports a multi-hundred million dollar TAM, while wafer-level is higher. Erickson specifically highlighted memory spend for fabs through 2031 and percentage allocated to test budgets, noting the burn-in allocation could be as high as “multiple billions of dollars per year in the next couple of years on an annual basis.” Given this trend and answering his own question about why Aehr is not at $500 million in revenue , Erickson hinted that Aehr has a “very good opportunity to significantly grow our package-level and wafer-level business across the biggest segments that are driving burn-in,” and why they are increasing capacity to this degree.  

Financials 

Revenue Growth to Accelerate from FQ4

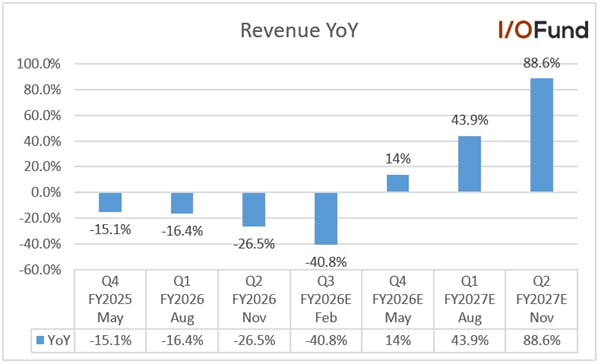
Aehr’s FQ3 revenue ending February was down (43.7%) YoY and up 4.3% QoQ to $10.3 million, missing estimates by (4.9%). The decline was primarily driven by lower shipments of FOX systems and WaferPaks for wafer-level burn-in business, partially offset by stronger demand for the Sonoma systems and burn-in modules from the company’s hyperscaler customer. Systems revenue was down (46%) YoY and up 16% QoQ to $5.8 million. Contactors revenues, which include WaferPak contactors, were down (49%) YoY and (13%) QoQ to $3.0 million. Aehr added that its consumables/WaferPak business “will consistently be at 30% or more of our total revenue, and our margins will increase as sales of these value-add consumables grow.” 

Management reiterated the 2H FY2026 revenue guidance of $25 million to $30 million given during FQ2 results and now expects to be on the high side of the range. The FQ4 revenue estimates have been revised higher by 7.3% since the announcement of results. Analysts expect FQ4 revenue to grow by 22.3% YoY and 67.1% QoQ to $17.2 million. Revenue growth is further expected to accelerate to 44.6% YoY in FQ1, then to 97.8% and 134.4% in the next two quarters.  

Looking ahead, due to the strong AI-related demand, the company’s FY2027 revenue is expected to ramp significantly and accelerate to 71.7% YoY to $83.2 million from an expected decline of (17.9%) for FY2026 ending May. While there will be slight changes to these estimates as the management announced during the earnings call that they will change the fiscal year from the last Friday of May to the last Friday of June effective after the fiscal year ends on May 29, 2026.  

The company’s new FY2027 will begin on June 27, 2026, and end on June 25, 2027. As a result, there will be one month of financial results from May 30, 2026, to June 26, 2026, which will be reported as a transition period when the company files the 10-Q report in the FQ1 ending September 2026. 

Margins 

The company’s margins are under pressure due to the lower revenue and unfavourable product mix. 

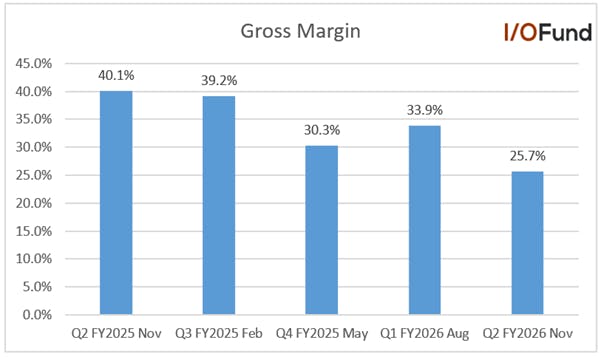
  • FQ3 gross profits were $3.4 million or 32.7% of revenue compared to $7.3 million or 39.2% of revenue in the same period last year. The adjusted gross margin was 36.5% compared to 42.7% in the same period last year. The decline was due to lower revenue and a less favorable product mix as last year's quarter included a higher proportion of higher-margin WaferPak revenue. 
  • FQ3 adjusted operating loss was ($2.5 million) or (24.7%) of revenue compared to an adjusted operating income of $1.5 million or 8.2% of revenue in the same period last year. The decrease in margins was primarily due to lower revenue. 
  • FQ3 adjusted net loss was ($1.5 million) or (14.8%) of revenue compared to an adjusted net income of $1.98 million or 10.8% of revenue in the same period last year. Management expects to return to profitability on a non-GAAP basis in FQ4. 

Adjusted EPS beat of 28.6% 

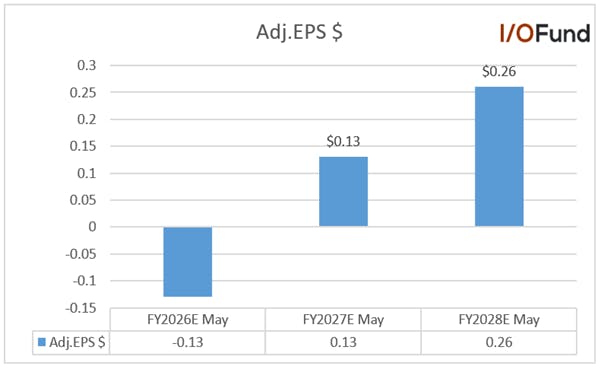
The company’s FQ3 adjusted EPS came at ($0.05) compared to $0.07 in the same period last year and beat estimates by 28.6%. Analysts expect adjusted EPS to be ($0.04) for FQ4, though Aehr expects to return to profitability on an adjusted basis in the quarter. 

Looking forward, analysts expect adjusted EPS to be ($0.11) for the FY2026 ending May and improve significantly to $0.13 in FY2027 and $0.26 in FY2028. 

Cash Flow and Balance Sheet 

The company’s cash flows have been weak due to current losses. However, it should improve in the coming quarters as the revenue is expected to ramp significantly in FY2027. 

  • FQ3 operating cash outflow was ($3.7 million) or (35.8%) of revenue compared to ($1.6 million) or (8.8%) of revenue in the same period last year. 
  • FQ3 free cash outflow was ($3.8 million) or (36.5%) of revenue compared to ($3.3 million) or (17.8%) of revenue in the same period last year. 
  • The company had cash of $36.9 million and no debt at the end of the quarter. During FQ3 the company raised $10.5 million in gross proceeds through the sale of 269,000 shares. Since the end of FQ3, they raised another $19.5 million gross proceeds through the sale of 477,000 shares and thereby increasing the cash to $56.4 million.  
  • On April 8, the company entered into an equity distribution agreement with William Blair and Craig-Hallum Capital Group, in connection with the offer and sale of up to $60 million of the company’s stock through an at-the-market offering program. 
  • Inventories were down (3.7%) QoQ to $41.2 million. 

Conclusion 

Q3’s fundamentals did not improve, yet the signs and signals are flashing for Q4 to be the long-awaited turnaround for Aehr with revenue expected to accelerate sharply to 22.3% YoY and non-GAAP profitability to return.  

Bookings surged 500% QoQ to $37.2 million, with Aehr reporting a book-to-bill ratio of 3.5X in the quarter, underscoring the strength of demand. Q4’s bookings to date of $12.2 million take Aehr’s effective backlog to $50.9 million, and combined with the >$20 million gap between implied bookings and revenue in Q4, Aehr is offering strong visibility into the upcoming revenue acceleration into the first part of fiscal 2027. Capacity expansion further supports this with additional capacity of 20 Sonoma systems per month coming online almost immediately. 

As stated, we will use technicals to guide or entries or exits with this stock reserved for the Advanced tier, which requires strong risk management discipline.

Damien Robbins, Equity Analyst at I/O Fund contributed to this analysis.

Please note: The I/O Fund conducts research and draws conclusions for the Fund’s positions. We then share that information with our readers. This is not a guarantee of a stock’s performance. Please consult your personal financial advisor before buying any stock in the companies mentioned in this analysis.

Recommended Reading:
Silicon Motion: Strong Consumer SSD Demand, Trying to Move into AI Enterprise Markets for 2027-2028 

Leading SSD controller supplier Silicon Motion (SIMO) is forecasting record revenue in 2026, yet the growth story still appears driven primarily by its more established markets across mobile, PC and automotive rather than by a major breakout in AI or data center.  

In the near-term, SIMO is guiding sequential revenue growth throughout the year, primarily driven by the mobile revenue segment with management stating: “We expect continued strength across nearly all our product segments with a particular emphasis on mobile where we expect significant outperformance due to continued market share gains.” 

That said, management has made it clear execution is dependent in part on securing NAND supply on a stable basis, with higher input costs passed through to customers.  

SIMO has a handful of notable customer wins, aside from working with the leading NAND flash and SSD suppliers. The company is supplying controllers for Nvidia’s BlueField DPUs in the second half of the year, along with several NVLink and Ethernet switch solutions. Analysts also implied that the company has won a role in Google’s ASICs project although management did not directly confirm the customer name. 

Today, SIMO appears to be more adjacent to the action around NAND prices surging rather than being in the center of it. While NAND suppliers that own the flash content are seeing the benefits of higher average sales price per gigabyte and higher bit shipments, instead, SIMO sells the controller silicon and firmware that manages the NAND which does not benefit directly from pricing upside. 

Over time, that could change with key products such as enterprise boot drive storage, MonTitan enterprise SSD controllers and PCIe6 MonTitan controllers. Below, we discuss key products that could help SIMO pivot toward the lucrative and highly supply-constrained AI memory market. 

Brief Product Overview 

Silicon Motion supplies a range of high-performance NAND flash controllers, and is the leading global supplier of PCIe Gen4 and Gen5 SSD controllers used in PCs, client devices, and enterprise/data center applications, along with eMMC and UFS controllers for smartphones and IoT devices. The company’s controller chips and firmware help manage how data is stored and accessed across these devices.  

SIMO is heavily exposed to the consumer/client markets, with eMMC/UFS controllers driving 40-45% of revenue in fiscal 2025, with likely a large portion of SSD controller revenue (45-50% of revenue) coming from the two end markets.  

However, Silicon Motion is looking to make solid inroads into the data center heading into 2027, serving merchant GPUs with Nvidia’s new BlueField DPU on its Vera Rubin generation with boot-storage, which helps to start and manage the system. Although this is not nearly as critical (or as valuable) as SSD like what SanDisk offers, which is the main data storage, supplying the boot-storage marks a shift for SIMO as their products will now be in AI servers.  

There are also some other AI-driven tailwinds within compute and enterprise SSDs, being served by its MonTitan platforms in the second half of 2026 for QLC and TLC NAND for AI storage applications. These SSD controllers will help to solve the data storage challenges that AI servers face by helping them feed data and access data efficiently.  

The company supplies the leading flash manufacturers including Kioxia, Micron, SK Hynix/Solidigm, Samsung, SanDisk, and China’s YMTC. Outside of memory suppliers, Amazon is a key customer and Nvidia.  

Moving into Data Center with MonTitan and Enterprise SSDs for AI Servers 

For its AI-oriented product portfolio, SIMO offers a handful of high-performance enterprise SSD controllers in 8-channel and 16-channel configurations, as well as its MonTitan PCIe Gen5 SSD development platform. MonTitan targets data center and enterprise boot drive storage needs, featuring an SSD controller ASIC, reference design kits and enterprise firmware, allowing customers to optimize designs to meet their performance needs.  

SIMO began qualification of high-performance TLC compute SSDs on MonTitan at multiple customers in Q4, with qualification expected to progress through the first half of calendar 2026 and commercial ramp occurring in 2H. Additionally, SIMO expects to begin qualifications with multiple customers this year for QLC storage SSDs. 

MonTitan is expected to be a core growth driver for SIMO once the ramp begins in 2H, with management already guiding for the platform to reach 5-10% of revenue exiting 2026, or ~$60 to $120 million run rate based on current estimates for $1.27 billion annual and $335 million revenue in Q4.  

SIMO is also planning to tape out its first 4nm PCI Gen6 version of MonTitan (as current controllers are 6nm) this year, targeting hyperscalers, NAND flash manufacturers, storage system providers and CSPs. The new 4nm solution is expected to drive growth in 2027 and 2028, with management noting they already have secured a design win expecting to ramp significantly in 2028. 

Ramping for Vera Rubin’s BlueField DPU in 2H 2026 

Silicon Motion is expecting to see tailwinds from merchant GPUs arise in the second half of 2026, from its involvement within Nvidia’s Vera Rubin on DPU boot drives, as well as its NVLink/Ethernet switch roadmap. Management discussed they were involved with other potential customers for enterprise boot drive solutions including a leading search engine firm, with analyst commentary implying that Google may have already been won as a customer, though this was not confirmed. However, SIMO faces two main headwinds at present that could push this growth story to the back burner – timing of the ramp and PC/mobile headwinds, and challenges procuring NAND.  

SIMO explained in Q4’s call that they kicked off volume shipments to Nvidia in the quarter for its current DPU generation, adding that they are also working with the GPU leader “to qualify the next-generation version of their DPU as well as for several NVLink and Ethernet switches of their new GPU/CPU platform that are expected to launch in the second half of 2026.” Management added that the next-gen DPU and switch both require higher capacities, with much higher unit volumes and ASPs, unlocking a new growth opportunity in the back half of the year through 2027. 

This likely corresponds to Nvidia’s upcoming BlueField4 and BlueField4 STX platform announced at GTC, as well as its Spectrum-6 switch family. The STX rack in particular underpins Nvidia’s in-house ‘Inference Context Memory Storage’ platform, an Ethernet-attached flash SSD tier optimized for KV cache at the pod level to accelerate large-context inference. For more on the ICMS platform, refer to our SanDisk analysis here: SanDisk: Shares Up 559% In 2025 On NAND Flash, Enterprise SSD Tailwinds.SanDisk: Shares Up 559% In 2025 On NAND Flash, Enterprise SSD Tailwinds

SIMO provided a brief view on the products it is supplying for Nvidia and their role at GTC: MonTitan SSDs for the ICMS platform and KV cache extension, as well as for near-GPU high performance storage; enterprise SSD controllers for compute-optimized, nearline SSD and warm data storage with TLC and QLC SSD support; and PCIe NVMe boot drives and boot drive controllers.  

Given the new nature of this growth opportunity, analysts questioned about the revenue opportunities from BlueField DPUs/boot drives, and how it will play out this year and into next. Management explained that they expect the DPU/boot drive volume to be “very meaningful in 2026” with revenue around $50 million, but next year to be “much higher” as the NVLink and Ethernet switches see “more volume in 2027.”  

This would imply DPU revenue contribution remaining around <5% of revenue in 2026, based on current estimates for $1.27 billion in annual revenue, though commentary for much higher growth with product ramps weighted next year suggests management has already has solid visibility into the business potentially becoming a much more meaningful topline driver by the end of next year.  

However, the discussions also shed light on some primary headwinds SIMO faces. First, the main challenge comes down to timing, with the ramp more weighted in the back half of 2026 and into 2027, whereas SIMO must currently navigate challenging PC and mobile markets. Second, growth depends on NAND procurement which must be bought at market prices, margins must be passed through to customers, and it is not the sole controller supplier for DPUs.  

Headwind #1: Timing 

SIMO did set the stage for a strong year, expecting record revenue and sequential growth in each quarter with Q1 being the lowest for the year, a strong statement considering growth headwinds facing the mobile and PC markets from rising memory costs, with volumes expected to decline YoY in both end markets.  

This is why timing may be the most challenging aspect to SIMO’s thesis, as it is working to ramp its presence in the data center, yet these initial contributions may not be material enough to overcome PC and mobile challenges as the year progresses.  

As noted above, SIMO is forecasting Q1 to be the lowest quarter of the year, primarily impacted by typical seasonal weakness in client SSDs with mobile expected to significantly outperform. Guidance was $292 million to $306 million, or $299 million at midpoint for roughly 7.4% QoQ growth, counter to typical seasonality but decelerating from 15.1% QoQ in Q4.  

Current estimates point to SIMO’s sequential growth decelerating further to 2.7% in Q2 and remaining in the low/mid-single digit range through year-end, overall marking a high teens deceleration from Q3’s peak on current estimates.  

A key factor behind the soft forward QoQ growth is likely the PC/mobile headwinds given the significance of eMMC/UFS controller and client SSDs in terms of dollar growth and revenue contribution.  

Recent projections from Gartner and IDC point to a worsening environment for PCs. IDC had originally forecast an (8.9%) decline in shipments in 2026 in its pessimistic scenario from December 2025, yet it now projects an (11.3%) decrease in shipments this year as rising memory costs force price hikes that bite into demand. Gartner sees a similarly woeful year for PCs, forecasting a (10.4%) decline, with analysts there saying this would represent the “steepest contraction in device shipments witnessed in over a decade.” 

For smartphones, both of the two groups forecast a similarly challenging year. IDC is forecasting a (12.9%) decline in the smartphone market in 2026, a rather substantial revision lower from its December projection for just a (5.2%) decline. For comparison, Gartner projects an (8.4%) decline. This follows low-single digit growth in 2025. 

SIMO does expect to outperform both markets and deliver growth as it benefits from market share gains and improved ASPs, explaining that they will “get the benefit of both higher share and higher ASPs this year in spite of any sort of macro issues around PC unit volumes.” 

However, it is still worth pointing out that there is no guarantee that it will be able to flawlessly navigate what could shape up to be some of the worst growth in PCs more than a decade and potential double-digit unit declines. If these supply chain difficulties persist and cause inventory buildups at OEMs, consumer/client NAND demand could be impacted, and SIMO’s limited data center opportunities (where NAND demand is likely to remain relatively well insulated from rising storage demand) may not be enough to offset growth and margin headwinds.   

Headwind #2: NAND Procurement 

While the PC and mobile headwinds are two challenging external headwinds, perhaps the most challenging internal headwind SIMO will face comes down to NAND supply. This is because the company has to procure NAND itself at market price, and then work to pass the costs on to customers, without benefitting from some of the end-unit pricing power that its customers are seeing: 

“We need to procure the NAND and NAND price at the market price. So we have to work out with the customer, we can pass through the cost increase to the end customer. So it is challenging but ongoing process quarter-by-quarter. It definitely will impact some of our gross margin but we manage the margin pass-through. So I think because even the customers, they have at least 2 to 3 supplier, so they're based on the price and based on the supply and depends the percentage.” 

The challenge here is that NAND prices reportedly rose ~90% QoQ in Q1, and were estimated to increase ~20% QoQ in Q2 in early February, yet the latest data suggests prices could rise 70-75% QoQ in Q2. Recent reports from Korea also suggest Samsung is doubling prices sequentially in the second quarter, implying that pricing is not yet slowing down. Simply put, when input costs rise 70% or 90%, prices must follow at a similar or faster rate in order to preserve margins.  

Considering the boot drive solution is a new product line with minimal revenue contribution until 2H, outsized pricing headwinds this early in its ramp phase could weigh substantially on gross and operating margins, which are already quite thin in the mid-40% and 13% range. This compares to its customers like Micron who are pushing above 80% and 76% next quarter as major beneficiaries of the price increases. 

Management also flagged that growth will be dependent on its ability to secure NAND supply ‘stably’, another major challenge considering SIMO has two NAND suppliers – stated as Kioxia and WDC (though likely to now be SanDisk). Management explained that one of these suppliers is secure, yet the other is not, which could impact their ability to secure stable supply at favorable prices, especially if the second prioritizes allocations to the highest bidder. To note, Kioxia announced in January that its NAND output for 2026 was essentially fully sold out. 

Financials  

Revenue Growth Accelerates to 45.7% in Q4 2025  

Silicon Motion’s Q4 2025 revenue grew by 45.7% YoY and 15.1% QoQ to $278.5 million. Revenue also beat estimates by 6.7%, reflecting the continued strength in mobile business and strong growth in the PCIe 5 SSD business. Revenue growth accelerated by 31.8 percentage points from 13.9% YoY in Q3 2025. Though sequential growth slowed from 21.8% in Q3, it was better than the decline of (10%) in the same period last year.   

Management also provided a strong Q1 revenue guide of $292 million to $306 million, implying a YoY growth of 79.6% and 7.4% QoQ at the midpoint. Management expects continued strength across its products with a particular emphasis on mobile end markets, where it expects significant outperformance driven by continued market share gains.

2025 revenue grew by 10.2% YoY to $885.6 million. Analysts expect revenue growth to accelerate to 43.1% YoY to $1.27 billion in 2026. Management expects 2026 to be a record year, with revenue growing each quarter sequentially, supported by first-half momentum in eMMC and UFS products. To briefly recap, MonTitan enterprise SSD products are expected to scale in the second half of 2026 and contribute 5% to 10% of revenue by the end of the year, with strong growth anticipated in the years ahead. 

Key Segments  

SSD Controllers  

SSD Controller sales increased by 25% to 30% QoQ and 35% to 40% YoY in Q4 2025, compared to an increase of 20% to 25% QoQ and a decrease of 0% to 5% YoY in Q3. Management expects client SSD controllers to ramp throughout the year, though the first quarter is seasonally weaker. They expect the new DRAM-less 4-channel PCIe 5 controller that was introduced last quarter to ramp significantly throughout 2026 and the MonTitan controller ramp is expected in the second half of 2026.  

For the full year 2025, SSD Controllers accounted for 45% to 50% of revenue and revenue declined by 0% to 5% YoY.  

eMMC + UFS Controllers  

The company’s eMMC (Embedded Multimedia Card) + Universal Flash Storage (UFS) controller sales increased by 0% to 5% QoQ and 50% to 55% YoY in Q4 2025, compared to an increase of 20% to 25% QoQ and 35% to 40% YoY in Q3 2025.  

For 2025, eMMC + UFS Controllers accounted for 40% to 45% of revenue and revenue increased by 20% to 25% YoY. Given the current backlog and customer outlook for 2026, management expects to significantly outpace the market and deliver another strong year of growth of the eMMC and UFS business despite the difficult market environment, with the two accounting for 35% to 40% of revenue in 2026. 

SSD Solutions  

SSD Solutions revenue increased by 125% to 130% QoQ and 110% to 115% YoY in Q4 2025 compared to an increase of 15% to 20% QoQ and decrease of 40% to 45% YoY in Q3 2025. For 2025, SSD Solutions accounted for only 5 to 10% of revenue and declined by 10% to 15% YoY.  

The company’s boot drives are part of  its  SSD solutions, and this segment is currently growing rapidly due to the strong AI demand.  

Margins  

The company’s margins are improving; however, management expects slight pressure in Q1 primarily due to product mix, with improvement anticipated as the year progresses.  They expect gross margins to return to the target range of 48% to 50% as the year progresses, as the mix of newer products increases, including the PCIe 5 controllers and enterprise SSD solutions.  

  • Q4 gross profits grew by 56.2% YoY to $136.8 million with a gross profit margin of 49.1%. The adjusted gross margin improved by 320 basis points YoY and 50 basis points QoQ to 49.2%. The improvement in gross margin was primarily driven by the successful ramp of new products and a favorable product mix shift toward client PC products.   
  • The adjusted operating margin came at 19.3%, up 380 basis points YoY and 350 basis points QoQ. Management expects full year 2026 adjusted operating margin to improve despite the higher expenses this year, primarily driven by operating leverage. 
  • Q4 net income came at $47.7 million or 17.1% of revenue compared to $21.6 million or 11.3% of revenue in the same period last year. The company benefited from the realized/unrealized gain on investments of $24.2 million in Q4 2025 compared to $0.1 million in Q4 2024.  

Q4 Adjusted EPS grew by 45%  

The company’s  Q4 adjusted EPS grew by 44.8% YoY to $1.26. Analysts expect strong growth to continue and expect Q1 adjusted EPS to grow by 117.2% YoY and 75.9% in Q2 2026. Looking forward, adjusted EPS is expected to grow by 59.4% YoY in 2026 and 21.9% in 2027.  

Cash Flow and Balance Sheet  

The company’s cash flows have been lumpy, and the increase in inventory to support strong future growth has put pressure on cash flows.    

  • Q4 operating cash flow was $1.6 million or 0.6% of revenue compared to an operating cash outflow of ($6.2 million) or (3.2%) of revenue in the same period last year.   
  • Q4 free cash outflow was ($6.3 million) or (2.2%) of revenue compared to ($17 million) or (8.9%) of revenue in the same period last year.   
  • The company had cash of $201.8 million and no debt at the end of Q4 2025 compared to $198.6 million in cash and no debt at the end of the previous quarter.  
  • Inventories increased by 24.8% QoQ to $421.8 million to support the strong future growth.  

 Conclusion 

 SIMO is guiding for record breaking revenue in fiscal 2026 despite growing headwinds in the PC and smartphone markets from rising memory costs. Q1 is expected to the lowest quarter of the year for revenue with client SSDs seeing typical seasonal weakness, with sequential growth in each quarter thereafter.  The company’s AI opportunities around Nvidia’s BlueField DPUs are expected to arise in the second half of the year and contribute roughly $50 million with a larger impact in 2027, while MonTitan is expected to quickly ramp in 2H to 5-10% of revenue. 

Revenue growth will also hinge on SIMO’s ability to stably procure NAND supply to meet its end market demand, making increasing memory costs a point to navigate for growth.  

An analyst on the call threw out 2027-2028 as potential timing for when the enterprise segment could get interesting. Our analysis points toward something similar, which is that 2026 may be a solid growth year for mobile and also PC yet is unlikely to be the year SIMO breaks out as a major enterprise AI story.  

Given the growth we are seeing in NAND, we felt it was worth our time to look at this stock more closely, yet will put SIMO on the shelf for further review until end of 2026 to see if a few of these green shoots materialize in the AI market.

Please note: The I/O Fund conducts research and draws conclusions for the Fund’s positions. We then share that information with our readers. This is not a guarantee of a stock’s performance. Please consult your personal financial advisor before buying any stock in the companies mentioned in this analysis.

Damien Robbins, Equity Analyst at I/O Fund contributed to this analysis.

Recommended Reading:

2026 Stock Market Outlook: Cycle Convergence & What’s Next

In our last broad market update, the S&P 500 was trading near 6,850, grinding through its fifth consecutive month of going nowhere. I drew a clear line in the sand at the 6,780 level. This was where the bulls needed to hold to keep the broader uptrend intact heading into 2026. 

This level (SPX6780) remains of utmost importance for the bulls. If it breaks, then the period of volatility has already begun as we head toward 6500 – 6300 in the coming weeks. This will likely complete the first leg in a larger correction, as we mount a bounce that makes a lower high into later 2026.  

That level clearly broke, dropping the broad market over 400 points, and finally bottoming at 6,316 on March 30th. We are now staging a bounce, which our analysis suggests will likely fail to make new highs, as the period of volatility that we have been flagging since November takes accelerates. 

This should not be new to our readers. In our February 2026 report we pointed widening divergences across the Magnificent 7, deteriorating price action in non-tech sectors, and historically elevated bullish sentiment supported by record high margin debt. Each of these warning signs precedes periods of volatility, and all were present well before the index peaked on February 25th, 2026. 

Since then, the evidence has continued to build. The dominant cycles that best correlate with 2026 are all pointing lower, which is being confirmed by a growing number of markets and sectors breaking critical support globally. The current bounce will likely draw investors back in, while the weight of evidence suggests a more cautious stance. 

Our commitment is not to a single outcome; it is to follow the evidence wherever it leads. As of now, we are seeing the evidence suggest a multi-quarter topping process is finally starting to break lower, which should set up an excellent buying opportunity for those prepared. 

Why Broad Market Deterioration Points to Extended Volatility in 2026 

In our February report, we flagged that the S&P 500's push to new highs was not being confirmed by key markets beneath the surface. Most notably, the Magnificent 7, which collectively account for roughly 30% of the S&P 500's weighting, had already begun rolling over. This was substantiated by every single Mag 7 stock putting in a top between July and February, even as the index pushed to one final high on Feb 25th. 

This kind of divergence, where the index makes a new high while its most dominant components quietly deteriorate, is a classic warning sign of a market in the late stages of a bull run. 

Chart showing the S&P 500 index alongside Magnificent 7 stocks breaking down earlier, highlighting bearish divergences leading into the 2026 market correction.

Chart showing the S&P 500 index alongside Magnificent 7 stocks breaking down earlier, highlighting bearish divergences leading into the 2026 market correction. 

The weakness, however, was not confined to technology. Financials (big banks) had also put in a notable top in early January, completing a full 5-wave advance off the April 2025 low, and subsequently making their first series of lower lows since that uptrend began. This suggested that weakness that started in tech in July of 2025 was spreading.  

Daily chart of the Financial Select Sector SPDR ETF (XLF) showing a completed five‑wave advance, breakdown below key support, and early corrective structure heading into 2026

Daily chart of the Financial Select Sector SPDR ETF (XLF) showing a completed five‑wave advance, breakdown below key support, and early corrective structure heading into 2026. 

Since that report, the list of confirmed tops has only grown. Across multiple sectors and markets, we are seeing the same technical signature: a completed 5-wave advance off the 2025 lows, with the final 5th wave pushing to new highs on deteriorating volume and weakening momentum, followed by the first meaningful lower low since the uptrend began.  

Small caps tell the same story. The IWM completed its advance off the April 2025 low with a final push on fading volume and momentum. It has since printed its first lower low since the bull run began, a meaningful structural shift for a segment of the market that typically leads both up and down. 

Daily chart of the Russell 2000 ETF (IWM) showing a completed advance, failed breakout near resistance, and early corrective structure forming in 2026. 

Daily chart of the Russell 2000 ETF (IWM) showing a completed advance, failed breakout near resistance, and early corrective structure forming in 2026. 

Industrials have been a leading sector since the 2025 bottom. As you can see below, based on the above criteria, it is also confirming a period of weakness has likely begun. 

Daily chart of the Industrial Select Sector SPDR ETF (XLI) showing a completed five‑wave rally, rejection near Fibonacci resistance, and early corrective structure in 2026.

Daily chart of the Industrial Select Sector SPDR ETF (XLI) showing a completed five‑wave rally, rejection near Fibonacci resistance, and early corrective structure in 2026. 

What makes this picture more concerning is that this topping process is not a uniquely United States phenomenon, it is playing out globally. To name a few, The German DAX completed a 5-wave advance off its April 2025 low and has since recorded two consecutive lower lows.  

Daily chart of the German DAX Index showing a completed multi‑leg advance, break below support near 23,400, and early corrective structure forming in 2026.

Daily chart of the German DAX Index showing a completed multi‑leg advance, break below support near 23,400, and early corrective structure forming in 2026. 

The Canadian TSX traced the same pattern – a full 5-wave advance accompanied by weakening momentum, followed by a decisive shift in trend structure and its first lower low on elevated volume. 

Weekly chart of the S&P/TSX Composite Index showing a completed multi‑year advance, rejection near Fibonacci extension resistance, and early corrective structure forming in 2026.

Weekly chart of the S&P/TSX Composite Index showing a completed multi‑year advance, rejection near Fibonacci extension resistance, and early corrective structure forming in 2026. 

Taken together, the weight of this evidence points to two unsettling conclusions. First, the volatility we are currently experiencing is likely in its early stages, not a brief interruption of the bull market, but the beginning of a more sustained and complex corrective period.  

Second, and perhaps more importantly, this is a globally synchronized topping process. When markets around the world begin rolling over in unison, each completing the same technical structure, each showing the same deterioration in breadth and momentum, it signals that the forces driving the correction are not localized.  

This raises an important question: if this is the beginning of something larger, what is driving it, and how long could it last? 

To answer that, we turn to cycles. 

2026 Market Cycle Analysis: Gann’s 60-Year Great Cycle Meets the Presidential Cycle 

As we move into April, we now have a full quarter of price action to analyze. The pattern that has emerged is relatively unique, which helps narrow down which cycles best correlate with 2026's market behavior, so far.  

This year saw a top form within the first few weeks of the year, followed by a controlled yet choppy downtrend that bottomed into late March. The market is now staging a bounce. 

When we overlay this specific price pattern against historical cycles, two important time periods stand out as the strongest matches converging simultaneously in 2026: the 60-year cycle, which Gann himself called the Great Cycle and considered the most powerful of all his time periods, and the 4-year cycle, widely known as the Presidential Cycle.  

mid

The fact that both cycles are converging in the same window is not something that happens often. In Gann's framework, the more cycles that align simultaneously, the more powerful and significant the resulting turning point. This confluence adds meaningful weight to our view that 2026 is setting up to be a challenging year, but also that the low forming this year may ultimately represent another incredible buying opportunity. 

The 60-Year Cycle Great Cycle 

W.D. Gann is widely considered the master of market cycles. His work was largely built on the rhythmic repetition of the 60-year Great Cycle. He observed that markets, economies, and even geopolitical events tend to generally rhyme across 60-year intervals. His view was that human nature, collective psychology, and the underlying forces driving economic expansion and contraction repeat themselves on this grand cycle, making it one of the more reliable long-term roadmaps available. 

As you can see below, when we overlay the S&P 500's price trend from 60 years ago onto the current secular bull market, it shows a strong correlation to the general trend, and at times, a near-perfect correlation to specific price movements. 

Monthly chart of the S&P 500 overlaid with Gann’s 60‑year market cycle, illustrating historical cycle alignment and heightened volatility risk approaching 2026.

Monthly chart of the S&P 500 overlaid with Gann’s 60‑year market cycle, illustrating historical cycle alignment and heightened volatility risk approaching 2026. 

According to the 60-year cycle above, we should now be entering a period of heightened volatility. If we zoom into how this year is lining up with the 60-year cycle, we are seeing stark similarities, already.  

Daily S&P 500 chart comparing the 1966 market cycle with 2026, highlighting similarities under Gann’s 60‑year Great Cycle and key volatility windows.

Daily S&P 500 chart comparing the 1966 market cycle with 2026, highlighting similarities under Gann’s 60‑year Great Cycle and key volatility windows. 

The 4-Year Presidential Cycle 

Markets also tend to follow a well-documented 4-year rhythm driven by the political and economic policy cycle of a US president's term. What the data consistently shows is that the 2nd year of this cycle is the weakest of the four, characterized by policy uncertainty, elevated volatility, and below-average returns. 

Bar chart showing average S&P 500 returns by year of the four‑year U.S. Presidential Cycle from 1950 to the present, with Year Two delivering the weakest performance.

Bar chart showing average S&P 500 returns by year of the four‑year U.S. Presidential Cycle from 1950 to the present, with Year Two delivering the weakest performance. 

Within each 4-year cycle, there is always a significant low that tends to launch a multi-year uptrend. This low consistently falls within year 2. Since 1950, the 2nd year of a president's term has produced the cycle low 56% of the time — 9 out of 16 election cycles. The market only posts a positive return in year 2 about 53% of the time, making it the riskiest year for investors within the four year cycle.  

When we overlay the 4-year Presidential Cycle onto 2026's price action, the correlation to what we have seen so far is striking — a top in the early weeks of the year, followed by a controlled and choppy decline into late March, now setting up for a bounce into late April through early May. 

Daily S&P 500 chart comparing the 2026 market with the 2022 cycle under the four‑year Presidential Cycle, highlighting similar drawdown phases and volatility windows.

Daily S&P 500 chart comparing the 2026 market with the 2022 cycle under the four‑year Presidential Cycle, highlighting similar drawdown phases and volatility windows. 

The Composite Cycle Roadmap for 2026 Markets 

If we combine both dominant cycles into a composite, we get a general roadmap for the general trend in 2026.  

Daily S&P 500 chart illustrating the convergence of the 60‑year Gann cycle and the 4‑year Presidential Cycle in 2026, highlighting key volatility and timing windows.

Daily S&P 500 chart illustrating the convergence of the 60‑year Gann cycle and the 4‑year Presidential Cycle in 2026, highlighting key volatility and timing windows. 

What stands out is how closely the price behavior we have observed so far – a controlled, overlapping decline into late March, now transitioning into a bounce – mirrors what both cycles would have predicted. If accurate, this bounce will likely draw many investors back in, and it is the kind of move that tends to create false confidence before the next leg of volatility resumes. 

What makes 2026 particularly significant is that the 4-year Presidential Cycle low and Gann's 60-year Great Cycle are lining up at the same moment in time. In Gann's own words, it is at the simultaneous convergence of cycles, not any single one in isolation, where the most powerful and lasting market turning points are made.

Three Market Scenarios for 2026 — And What Would Trigger a Bullish Pivot 

The famous economist, John Maynard Keynes stated, “It is better to be roughly right, than precisely wrong.”  It is a sentiment that has been echoed by the world's great money managers across generations – the conviction to take a clear position, paired with the discipline to abandon it when the evidence demands otherwise. 

That principle guides the thesis presented in this report. The weight of evidence, from completed topping patterns across diverse global markets and multiple U.S. sectors, to the convergence of dominant market cycles, points to the volatility we are currently experiencing as the beginning of a more sustained corrective period, not the end of one. 

That said, markets do not always follow the most probable path. If the divergences we are tracking reverse and start making new highs, and/or if the cycles we are monitoring break their historical rhythm, we will update our analysis and pivot our stance accordingly.  

How this can translate into a clear pivot can be found in the NASDAQ-100 (QQQ). If this index breaks out to new high and closes the week over these highs, this will be a clear signal that the market is shrugging off these warnings and likely mounting a push higher.   

The NASDAQ-100, led by the Mag 7, have been leading this market down. It has been the weakest major index since the topping process began in late October. For this reason, if it can confirm a new high, and close over this high on a weekly basis, this will be the line in the sand that will warrant a pivot away from our defensive posturing. 

Intraday chart of the Invesco QQQ Trust showing a corrective decline, rebound attempt toward a critical pivot zone, and risk of a lower‑high failure in 2026.

Intraday chart of the Invesco QQQ Trust showing a corrective decline, rebound attempt toward a critical pivot zone, and risk of a lower‑high failure in 2026. 

When the facts change, we will change our mind. Until they do, we will continue to follow the evidence.  Right now, the evidence points clearly to a multi-quarter topping process finally breaking lower, which for the patient and prepared, should set up one of the better buying opportunities this cycle has to offer. 

How this looks on a larger time frame can be viewed below. Based on the price structure of the bull market off the 2022 low, two scenarios present themselves as the most probable paths forward. 

  • Scenario 1 (Blue) — Wave 4 Correction 

The current decline represents the early stages of a larger 4th wave correction. Under this scenario, the NASDAQ-100 finds its low in the $500 – $445 range, setting up a meaningful buying opportunity for a final 5th wave advance to new all-time highs in the coming year. This remains the primary count. 

  • Scenario 2 (Red) — Wave 5 Top 

What cannot be ignored is that all the necessary waves are already in place to complete the bull market pattern off the 2022 low. The overlapping swings and deep corrections throughout this advance are consistent with an ending diagonal pattern. Unfortunately, because the NASDAQ-100 is tracing an ending diagonal pattern, this determination cannot be made until we see a sizable drop and mount some type of bounce.  

  • Scenario 3 (Green) – One More Swing into the Fall 

Based on the weight of evidence, this is not my primary perspective. However, as stated above, the QQQs can close the week at all-time highs, this will become the primary perspective that we track. Here, the broad market will trend to new highs, likely on decelerating volume and momentum, completing a final 5th wave sometime into the Fall of 2026. 

Weekly chart of the Invesco QQQ Trust showing a completed multi‑year advance, potential Wave 4 correction, and key Fibonacci support levels into 2026.

Weekly chart of the Invesco QQQ Trust showing a completed multi‑year advance, potential Wave 4 correction, and key Fibonacci support levels into 2026. 

In conclusion, the evidence presented in this report did not emerge overnight. It accumulated gradually, across months and several markets, in the way that meaningful trend changes always do. From the Magnificent 7 rolling over well before the February peak, which has now spread to Financials, Industrials and Small Caps, to the synchronized topping patterns spreading across global markets, to the rare convergence of Gann's 60-year Great Cycle and the Presidential Cycle, the weight of evidence has been pointing in the same direction for some time.  

That does not mean the path forward will be a straight line lower. Markets rarely are. The current bounce was anticipated, and it will likely do what bounces in corrective markets are designed to do — restore confidence, draw investors back in, and set the stage for the next leg of volatility. That is the nature of the environment we are navigating. 

Our posture remains patient and defensive. Not because we are committed to a bearish outcome, but because the evidence has not yet given us reason to be otherwise. The line in the sand is clear. A weekly close at new all-time highs in the NASDAQ-100 changes the conversation. Until that signal arrives, the most probable path continues to favor a defensive posture.

Since our inception in May 2020, I/O Fund has delivered a cumulative return of 326%— if we were a hedge fund, we’d rank #1 and if we were a tech ETF or Mutual Fund, we’d rank #3 in the United States.     326%— if we were a hedge fund, we’d rank #1 and if we were a tech ETF or Mutual Fund, we’d rank #3 in the United States.    

Combining broad market analysis to buy at the lows has helped us achieve these results, including 20 entries in April of 2025 that saw up to 400% returns in one stock. To get our Top 15 AI stocks, real-time trade alerts, weekly webinars and deep-dive research from a proven team in AI and tech stocks, Sign up now.Top 15 AI stocks, real-time trade alerts, weekly webinars and deep-dive research from a proven team in AI and tech stocks, Sign up now.

Please note: The I/O Fund conducts research and draws conclusions for the Fund’s positions. We then share that information with our readers. This is not a guarantee of a stock’s performance. Please consult your personal financial advisor before buying any stock in the companies mentioned in this analysis.

Recommended Reading:
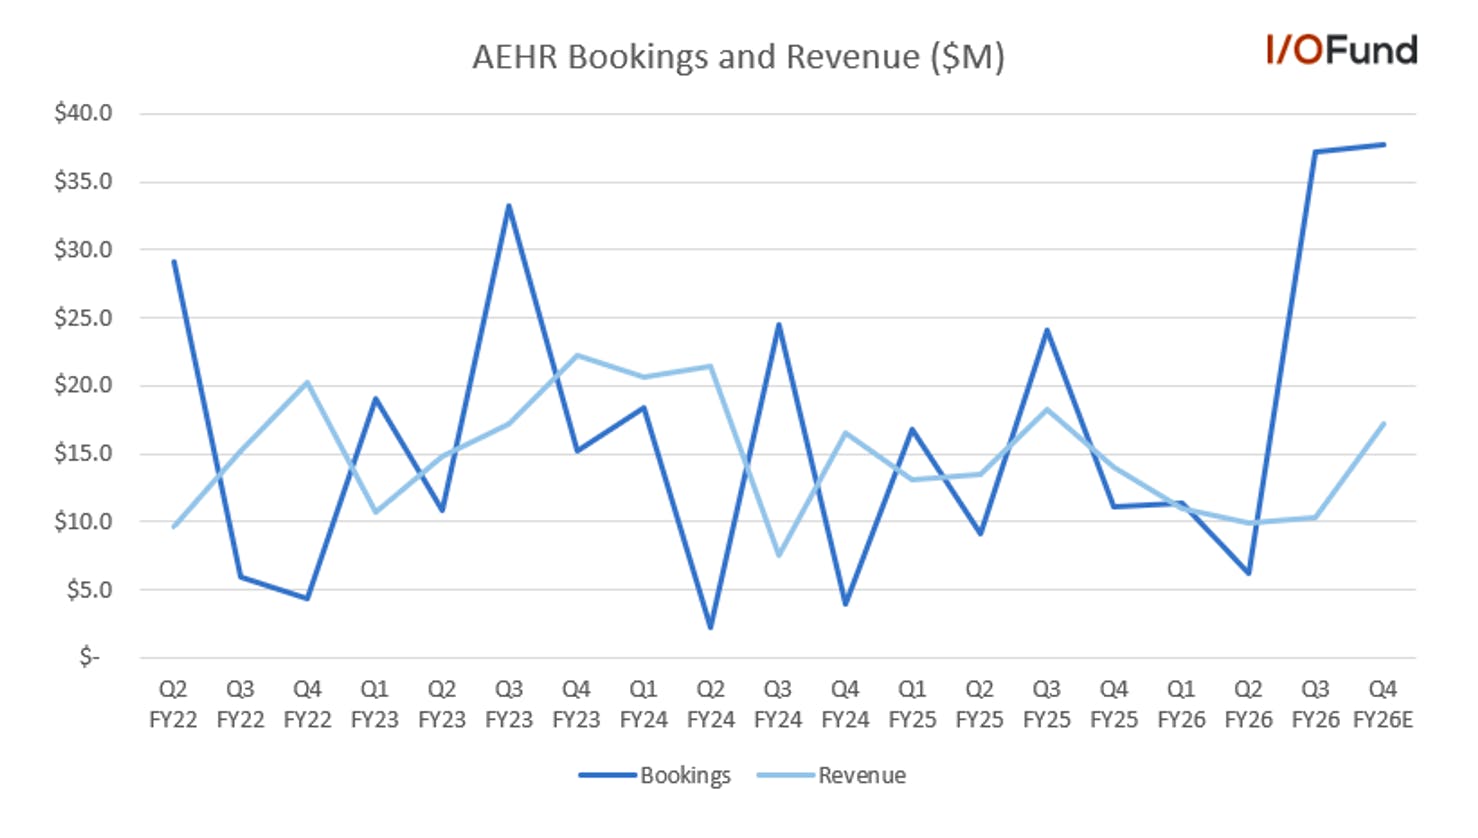
Fabrinet: EML Constraints Easing, Capacity Expansion Adding >$2.6 Billion Revenue Potential

Fabrinet is a key player in the optical supply chain, providing advanced and high-precision optical manufacturing services as a contract manufacturer to OEMs, hyperscalers and Nvidia. The company has multiple growth outlets ahead, including its HPC platform ramp with Amazon, the ‘big growth’ with Nvidia on 1.6T and 800G transceivers, along with new product ramps with Ciena and Cisco, its second largest customer behind Nvidia. 

There are a handful of puts and takes to Fabrinet’s story, primarily that its positioning as a contract manufacturer lends to thin margins with limited ability to expand in that regard. Growth in key outlets such as transceivers remains supply constrained and showing minimal sequential growth, though with the expectation that those soon ease. Q3 was also guided to see low single-digit QoQ growth, likely weighed down once again by transceiver constraints on the EML side. 

Looking further ahead, strong demand in 800G and 1.6T transceivers as well as within DCI provide a solid backdrop for continued growth, and the expansion of its HPC program with Amazon or with hyperscalers could represent substantial new revenue streams. Fabrinet also leads in CPO with early revenue now appearing, with the company expected to serve as the primary CPO module manufacturer for Nvidia, while other optical solutions like optical circuit switching could soon layer in. 

Capacity will also not be a problem in future growth, with Fabrinet’s new Building 10 and Pinehurst expansion in Thailand unlocking more than $2.6 billion in revenue potential, or nearly 50% higher than next year’s estimated revenue.  

Brief Product Overview 

Fabrinet provides advanced optical packaging, high-precision optical and electro-optical manufacturing services to OEMs; as management put it: “We're a pure contract manufacturer. We don't have any of our own products. And that's actually a positive for many of our customers. They don't want us to have our own products.” This neutral model with no proprietary products means Fabrinet does not compete with its customers, regardless of where they are positioned in the optical stack. 

Fabrinet also serves as a key optical partner for Nvidia (who generated 27.6% of its FY25 revenue, or ~$944 million), with some of its main contributions said to be for short-reach active optical cables and 800G transceivers for Nvidia’s InfiniBand platforms, as well as optical engine packaging. Fabrinet was also stated as key partner for Nvidia’s upcoming silicon photonics CPO switch platforms during GTC 2025.   

Fabrinet’s manufacturing primarily spans three main component lines: optical communications devices, industrial lasers, and sensors.  

Fabrinet’s optical communication (OC) services include selective switching products such as reconfigurable optical add-drop multiplexers (ROADMs), optical amplifies and modulators for fiber optics. OC also includes transceivers and tunable lasers, active optical cables for high-speed data center interconnect (DCI), and InfiniBand, Ethernet, fiber channel and optical backplane connectivity.  

OC is the core focus of this analysis as we delve deeper into the optics supply chain, as the shift to Nvidia’s Rubin generation and push to bring optics closer to the networking switch are expected to see silicon photonics silicon photonics capture incremental value, even though copper remains relevant and intact at the shortest distances.   

OC is also the core revenue driver for Fabrinet, generating nearly three-quarters of revenue; sensors for automotive is the second-largest product line at roughly 10% of revenue, while industrial lasers are a much smaller contributor at ~4%. 

HPC Segment Ramping for AWS 

Fabrinet’s new ‘HPC’ segment relates to its manufacturing of high-complexity electronic assemblies for hyperscale AI accelerator platforms, and though it is only in its second quarter post-introduction, there are clues showing that HPC could be quite lucrative for long-term growth. Though HPC is currently limited to one customer, AWS, the program is expected to scale to more than $600 million annually, or north of 10% of annual revenue, implying future HPC program wins or expansion can easily and quickly add substantial growth to the top-line.  

Fiscal Q2 marked the second quarter of Fabrinet ramping its HPC program for AWS, which is understood to be for high-complexity printed circuit board assembly (PCBA) likely for Trainium3, with management hinting at a goal of expanding into optical interconnects and other products in the future. Fabrinet also issued warrants allowing Amazon to purchase up to 381,922 shares at $208.48 vesting on certain purchase requirements, though it did not state the duration or scope of the agreement with Amazon.  

Although the program is only in its second quarter of ramping, growth was very strong in Q2, up 455.8% QoQ to $85.6 million. Fabrinet remains confident that the program will continue to experience rapid growth and will be fully ramped over the next two quarters. Management clarified that the program is a “little bit more than halfway” ramped and has a second production line qualified, and we're in the process of qualifying additional lines.” Once these lines ramp, Fabrinet stated that it will be on its way to achieve its full run rate of above $150 million per quarter, to be achieved over the next couple of quarters. 

While management guided for strong sequential growth in the near term as the second and third lines get qualified, they also cautioned not to take Q2’s sequential growth and extrapolate forward linearly: 

“HPC growth, it's not in a straight line because we are dealing with some new products that don't always grow. The growth is a little bit lumpy, I would say. So HPC won't necessarily grow in a straight line. It looks like a nice straight line. But really, we only have 2 data points, 2 quarters of revenue.  

So HPC, we had a nice bump of about $70 million sequentially last quarter. So that's not going to grow in that space. But we do anticipate double-digit growth in that area.” 

Assuming Fabrinet still reaches the full run rate within two quarters but sees a softer Q3, say to the $100 million revenue region (or high-teens QoQ), this would imply a sharper ~50% QoQ increase in Q4. At the full run rate, the program will be a key growth driver, with the roughly $600 million annual run rate representing ~13% of FY26’s estimated revenue and ~11% of FY27’s estimated revenue.  

This is especially important when taking into account all of the facts around the Amazon deal – Fabrinet is not the sole supplier or even the primary, but rather the secondary supplier, with future growth opportunities hinging on its ability to execute and deliver excellent quality and delivery at ‘competitive costs’ (ie, not guaranteed). 

If this first deal is any indication of what initial engagements with new customers could look like, HPC could shape up to be a much larger contributor down the road. However, the main downside is that Fabrinet has said engagement timelines for HPC are long, meaning it may be multiple quarters before new growth arises. 

Transceivers Remain Supply Constrained, but EMLs Easing 

Optical component supply constraints have been impacting Fabrinet’s datacom revenue, which has been essentially flat for the last three quarters, after having peaked at nearly $330 million in Q1 FY25. Revenue in FQ2 was up just 2% QoQ but down (7%) YoY to $278.1 million, primarily due to these shortages, as management noted that demand is very robust and that they are shipping everything they can, including significant volumes to its main customer, understood to be Nvidia.  

Easing shortages should open the doorway for Datacom revenue to begin accelerating through 2026, considering the signals that we are seeing across the optics supply chain pointing to strong demand for 800G and 1.6T transceivers. Fabrinet also sees that as the case, explaining that the “the big growth with NVIDIA is really in front of us on 1.6T and 800G,” meaning quickly resolving EML constraints are a key factor in its ability to reaccelerate Datacom revenue growth. 

Fabrinet had revealed last quarter that they believed they would face another quarter to two of tight supply before constraints start to ease, and commentary this quarter suggests they might soon be seeing the end of the tunnel. Notably, Fabrinet explicitly called out EMLs as the main cause of supply constraints and implied that Nvidia qualified a second supplier during the quarter, meaning its main constraint will likely ease over the coming quarters.  

There was another interesting tidbit from the call that is worth some attention – management explained that they are indifferent to product mix, whether it favors 800G over 1.6T or vice versa. This is important because as a contract manufacturer, Fabrinet benefits from volume, not ASPs, meaning that it will benefit from increasing volume as either 800G or 1.6T are selected. Fabrinet’s growth will remain largely insulated from nuances within the upgrade cycle, such as if some customers take a slower ramp on 1.6T, whereas transceiver suppliers are hammering on 1.6T for revenue and margin uplifts, where a slower ramp will more acutely impact growth.  

Fabrinet also mentioned some future transceiver opportunities, such as building transceivers for merchant vendors and producing directly for hyperscalers, noting that these opportunities would be “quarters away rather than years away” in terms of becoming a meaningful revenue stream. 

DCI to See Faster Growth in Q3  

DCI revenue (now provided as a separate breakout within Telecom) has been steadily increasing over the prior two years, having scaled from a ~$70 million quarterly run rate to $100 million in mid to late fiscal 2025, and now moving higher to the $140 million range.  

Growth was moderate in Q2 at 42% YoY and 2% QoQ with DCI module revenue up 59% YoY, slowing from the 92% YoY and 29% QoQ growth in Q1 as this quarter faced a tougher comp. Although Q3 guidance was somewhat vague, management stated that they expect DCI to “grow faster than we have seen in the past quarters.” Regardless of whether this faster growth comment is applied to YoY or QoQ, or a return to either >90% YoY or >30% QoQ, it could imply DCI revenue approaching around $190 million next quarter. This is likely to be driven by EML capacity coming online, or strong demand for 400ZR products as the 800ZR ramp approaches.   

Looking ahead, management expects demand to be durable as the ramp of 800ZR products approaches, similar to how Ciena noted that 800ZR is ramping later this year; however, management cautioned that growth will not always be in a straight line as challenges may arise from time to time with leading-edge products.  

For a quick note on Ciena, Fabrinet clarified that they started to ramp Ciena’s new system program in Q2, and this was a key driver of Telecom’s strong growth of nearly $81 million of 17% QoQ: “Telecom revenue growth was particularly strong as we started to ramp Ciena's new system program, as well as other new program wins that we're particularly excited about.”  

While Fabrinet did not clarify if Ciena was included in the DCI breakout, Rosenblatt’s Michael Genovese commented that “if you counted that Ciena business where that stuff was going in DCI, you'd find the vast majority of your telecom growth was driven by DCI and then you had a huge sequential DCI quarter. But that's just like kind of a segmenting thing. Any thoughts on that?” 

Seamus Grady, CEO 

“Yes, I think that's pretty accurate. DCI has been very, very strong for us. The growth is not just DCI, but it's predominantly DCI. It's been very good, and it continues to grow and the demand looks to be very, very durable, and it's not just Ciena, it's across multiple customers.” 

Fabrinet Already Seeing CPO Revenue, Multiple Customers Engaged 

Fabrinet was quite bullish on the upcoming opportunities around CPO, with management essentially revealing that they are the leader in CPO, far ahead of competitors and already shipping small amounts. Additionally, Fabrinet is working on separate CPO programs with three different customers, not only Nvidia, though analysts from Rosenblatt believe Fabrinet is well positioned to benefit as “Nvidia's primary transceiver and co-packaged optics module manufacturer.” 

Fabrinet CEO Seamus Grady explained that Fabrinet is “already seeing some CPO revenue, although the amounts are relatively small right now. We're working on co-packaged optics programs with 3 different customers. It's not just 1 customer, Samik, it's actually 3 different customers. And the specific timings on when the revenue would become more material, depends on our customers' road maps and schedules, but we're very excited about CPO. Again, we don't really want to speak on our customers' behalf, but rest assured, we're quite excited and we have several products that we're working on our projects with our customers.”  

For brief clarification on the revenue timing part, Fabrinet will see revenue impacts in line with, or slightly ahead of customer production timelines, meaning that Nvidia’s move for initial production of its Spectrum-X Ethernet switches supporting CPO in late 2026 may be appearing now through the next two quarters, while strong growth is likely to appear in 2027 as CPO volume ramps. Other industry commentary around CPO, such as from Lumentum, points to CPO seeing stronger contributions in 2027 with scale-out shipments beginning, implying CPO could see a strong ramp for Fabrinet into year end and next year from its positioning a few quarters.    

For OCS, details were a bit limited, though Grady noted that Fabrinet is engaged on multiple fronts and reemphasized that growth would depend on customer ramp schedules. Again, Lumentum recently pointed to larger contributions for them from OCS this year, raising revenue forecasts from $100 million to $400 million, implying this could also quickly turn into a key revenue stream for Fabrinet later this year.   

Capacity Expansion Underway, “Building 10” Fully Ready by 2027 and Adding $2.5B in Revenue Potential 

Fabrinet is accelerating its capacity expansion plans, pulling ahead the first portion of its Building 10 in Chonburi, Thailand by six to eight months, while expanding at its Pinehurst facility in Pathum Thani, Thailand to help meet strong demand. Combined, the two facilities add substantial revenue generation capacity of >$2.65 billion annually. Fabrinet also sees very minimal margin headwinds even in the event of a slower ramp stemming from its capex-lean construction abilities.  

Management provided some color on the completion timelines for the new building, with the first 250K square foot portion expected to be ready by June, six to eight months ahead of schedule, and the full factory ready by early 2027.  

Fabrinet revealed at Barclays’ Global Tech Conference in December that Building 10 can add $2.5 billion in revenue at full scale, with estimated capex of around $130 million for the building — simply put, Building 10 has the ability to generate nearly 20X of capex as revenue at full scale. Additionally, Fabrinet sees minimal headwinds from the factory if the ramp is slower than expected, at just 0.15 points to gross margin if it sits completely idle.  

With management also adding in Q2’s call that Pinehurst can support $150 million revenue, dependent on mix, both buildings add $2.65 billion in annual revenue potential. Compared to Fabrinet’s current footprint having room to support up to $4.8 billion in revenue (slightly above its current $4.5 billion run rate), the two buildings offer >50% upside in revenue capacity, implying that Fabrinet could support approximately $7.3 billion once is finished, or multiple years of runway. Additionally, the extensive capacity in Thailand serves as a key-value add to customers, as Fabrinet benefits from lower labor costs, thus giving them an ability pass margins on to key customers such as Nvidia and AWS. 

Financials  

FQ2 Revenue Grew by 36%  

Fabrinet’s Q2 FY2026 revenue ending December grew by 35.9% YoY and 15.8% QoQ  to a record $1.13 billion, beating estimates by 5.2%. Revenue growth accelerated by 14.3 percentage points from 21.6% YoY and 7.5% QoQ growth in the previous quarter. It was the fastest YoY growth since the company’s public listing in 2010 and was primarily driven by the strong growth in the Telecom and High-Performance Computing (HPC) revenue.   

Management has guided FQ3 revenue in the range of $1.15 billion to $1.20 billion, implying a YoY growth of 34.8% and 3.7% QoQ. For some detail on where growth is coming from, management explained that “within telecom, we anticipate that DCI is going to grow faster than we have seen in the past quarters. So that strength continues into our third quarter, and we also anticipate datacom to growth. So that's the color that we can provide at this stage. And automotive will probably be down in a similar way as it has been in the prior quarter.” 

Analysts expect strong growth to continue and FQ4 revenue is expected to grow by 36.9% YoY to $1.24 billion. 

The company’s FY2026 revenue ending June is expected to grow by 32.7% YoY to $4.54 billion and will then moderate to 18% YoY growth to $5.35 billion for FY2027 and 14.5% YoY to $6.13 billion for FY2028.  

Revenue by Product Category  

Optical Communications Revenue Grew by 29%  

Fabrinet’s FQ2 Optical Communications revenue grew by 29% YoY and 11% QoQ to $832.6 million. Revenue growth accelerated by 10 percentage points from 19% YoY and 8% QoQ growth in the previous quarter. 

Within optical communications, telecom FQ2 revenue grew by 59% YoY and 17% QoQ to a record $554.4 million. The telecom revenue was up 59% YoY and 15% QoQ in the previous quarter. The strong telecom revenue growth was primarily due to early ramp of Ciena’s systems program and other new program wins. Management expects telecom revenue to grow sequentially in the next quarter.  

Within telecom, Data Center Interconnect (DCI) revenue grew by 42% YoY and 3% QoQ to $142.2 million. Revenue growth decelerated from 92% YoY and 29% QoQ growth in the previous quarter.  

Datacom FQ2 revenue was down (7%) YoY and up 2% QoQ to $278.1 million compared to a decline of (17%) YoY and (1%) QoQ in the previous quarter. Management expects sequential revenue growth in the next quarter, while Q2 growth was impacted due to component shortages.  

Non-Optical Communications Revenue Grew by 61%  

Fabrinet’s FQ2 Non-Optical Communications revenue grew by 61% YoY and 30% QoQ to $300.3 million. Revenue growth accelerated by 31 percentage points from 30% YoY and 5% QoQ growth in the previous quarter. 

The strong growth was primarily driven by high-performance computing (HPC) products. HPC revenue in FQ2 came at $85.6 million and was up 456% QoQ from $15.4 million in the previous quarter. FQ1 was the first quarter in which the company broke out this category. 

FQ2 automotive revenue grew by 12% YoY and down (4%) QoQ to $117 million. Management expects another modest sequential decline in automotive revenue in the next quarter.  

Industrial Laser FQ2 revenue grew by 10% YoY and 4% QoQ to $41.4 million compared to 12% YoY and flat QoQ in the previous quarter.  

The other revenue grew by 26% YoY to $56.4 million compared to 36% YoY in the previous quarter.  

Margins  

The company’s gross margins and operating margins improved in FQ2 despite the foreign exchange headwinds.  

  • FQ2 gross profits grew by 36.5% YoY to $137.68 million. Gross profit margin showed an improvement of 10 basis points YoY and 30 basis points QoQ to 12.2% despite the foreign exchange headwinds. Adjusted gross profit margin was flat YoY and up 10 basis points QoQ to 12.4%.  
  • FQ2 operating income grew by 43.7% YoY to $114.4 million. Operating margin improved 60 basis points YoY and 50 basis points QoQ to 10.1% primarily driven by operating leverage. Adjusted operating margin improved by 30 basis points YoY and QoQ to 10.9%.  
  • FQ2 net income was $112.6 million or 9.9% of revenue compared to $86.6 million or 10.4% of revenue in the same period last year. The company reported a foreign exchange loss of $3.2 million compared to a gain of $4.0 million in the same period last year. Adjusted net income was $121.6 million or 10.7% of revenue compared to $95.1 million or 11.4% of revenue in the same period last year. 

FQ2 Adjusted EPS Grew by 29%  

The company’s FQ2 GAAP EPS grew by 30.7% YoY to $3.11, beating estimates by 3.7%. The adjusted EPS grew by 28.7% YoY to $3.36, beating estimates by 3.4%.  

Analysts expect strong growth to continue and expect adjusted EPS to grow by 40.7% YoY to $3.55 for FQ3 and 41.8% YoY to $3.76 for FQ4. The company’s FY2026 ending June adjusted EPS is expected to grow 33.5% YoY to $13.58 and FY2027 adjusted EPS is expected to grow 20% YoY to $16.29. 

Cash Flow and Balance Sheet  

The company’s cash flows have been weak in FQ2 due to higher working capital and increase in capex.  

  • FQ2 operating cash flow was $46.26 million or 4.1% of revenue compared to $115.9 million or 13.9% of revenue in the same period last year. It was lower due to higher working capital.  
  • FQ2 free cash outflow was ($5.3 million) or (0.5%) of revenue compared to $94 million or 11.3% of revenue in the same period last year. It was down due to lower operating cash flows and the increase in capex. The capex increased by 135.7% YoY to $51.6 million due to the expansion of capacity to support the future growth.   
  • Cash and short-term investments were $960.8 million and no debt at the end of the December quarter compared to $968.8 million and no debt at the end of the previous quarter.   
  • Inventories grew by 63.3% YoY and 10.6% QoQ to $798.9 million to support the future growth.   

Conclusion 

Fabrinet sees multiple different outlets to growth from 800G and 1.6T transceivers with Nvidia, the continued ramp at Amazon, the upcoming ramp of 800ZR modules for data center interconnect and new platforms with Ciena and Cisco. Fabrinet is also leading in CPO and shipping small amounts now, with analysts expecting the company to be a key beneficiary as Nvidia’s main CPO module manufacturer, with two other customers engaged as well.  

Revenue growth is expected to remain around 35% to 37% in fiscal Q3 and Q4, before decelerating to the low 30% range in early 2027. The company’s new Building 10 will unlock significant revenue generation potential and open the door for growth to remain strong, as long as demand does. However, as a pure-play contract manufacturer with no original products, Fabrinet fundamentally sees thinner margins and soft cash flows, with little power to materially increase either of those two fundamental aspects. Despite this, the bottom line remains rather defensible with earnings expected to grow nearly 34% to $13.58 this year.

Damien Robbins, Equity Analyst at I/O Fund contributed to this analysis.

Every Thursday at 4:30 pm Eastern, the I/O Fund team holds a webinar for premium members to discuss how to navigate the broad market, as well as various stock and crypto entries and exits. Beth Kindig offers weekly deep dives including lesser-known cryptocurrencies and AI stocks, plus the team offers trade alerts. The I/O Fund team is one of the only audited portfolios available to individual investors. If you’d like to subscribe to the Advanced Market Signals plan, email us at premium@io-fund.com. broad market, as well as various stock and crypto entries and exits. Beth Kindig offers weekly deep dives including lesser-known cryptocurrencies and AI stocks, plus the team offers trade alerts. The I/O Fund team is one of the only audited portfolios available to individual investors. If you’d like to subscribe to the Advanced Market Signals plan, email us at premium@io-fund.compremium@io-fund.com.

Please note: The I/O Fund conducts research and draws conclusions for the Fund’s positions. We then share that information with our readers. This is not a guarantee of a stock’s performance. Please consult your personal financial advisor before buying any stock in the companies mentioned in this analysis.

Recommended Reading:
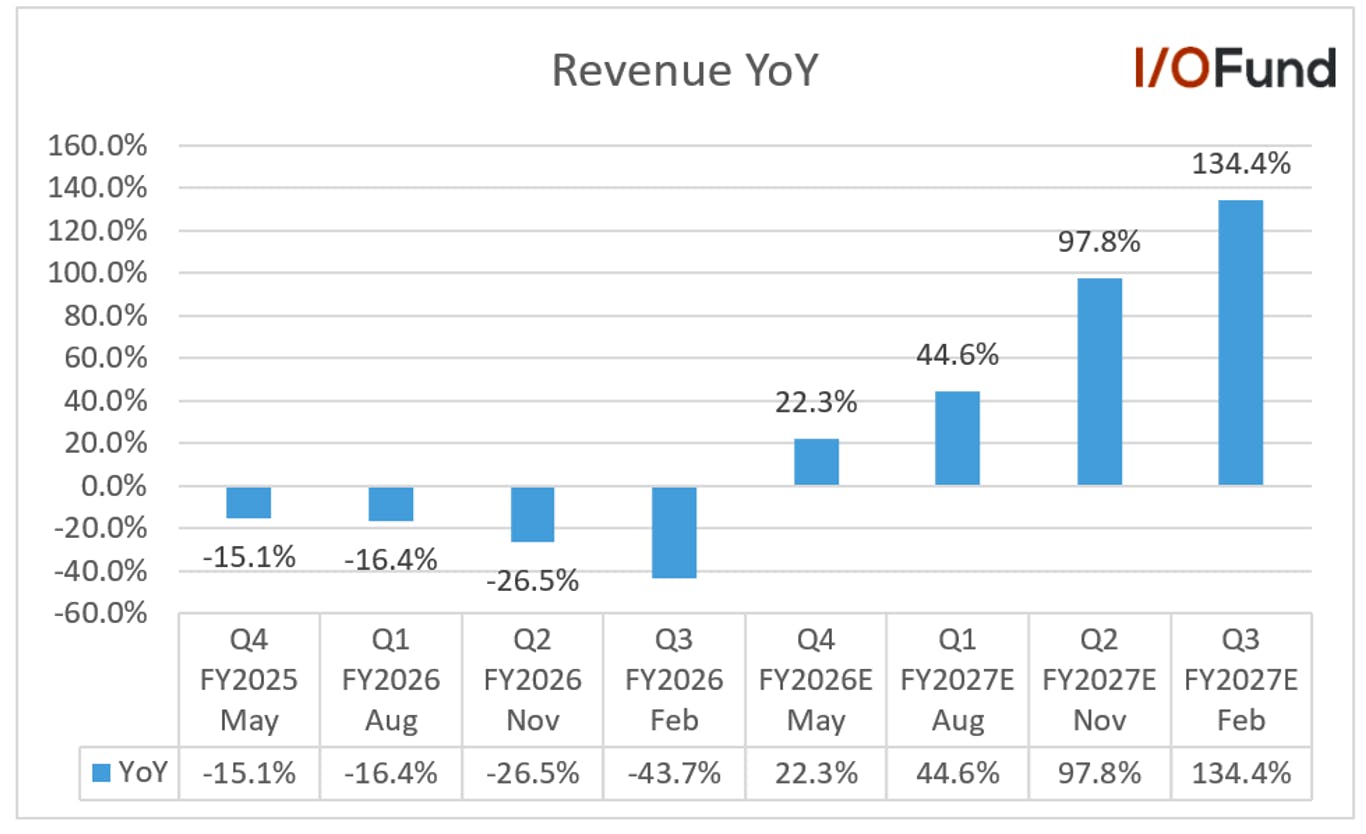
Aehr Sees 2H Bookings up 4X vs 1H, Supporting Strong FY27

Fundamentally, Aehr’s current revenue growth, margin and cash flow profile is among the weakest of the names we track across the AI sector, yet the company’s recent order momentum and broadening presence within the AI stack, from GPUs to ASICs to silicon photonics, deserves a deeper look.

Notably, Aehr is pointing for bookings to surge in the second half of its fiscal 2026, or November through May, with management unofficially guiding for $60 to $80 million during this period. This would represent roughly 4X growth from the first half’s $17.6 million in bookings, and supports a strong revenue ramp into 2027 with a flurry of recent orders seeing shipment timelines heavily weighted towards FY27.

Below, we take a look at the bookings growth, plus important comments from management regarding the revenue opportunities in AI and potential for ‘hundreds of millions’ in revenue, what capacity ultimately can support, and the risk of cannibalization.

As those who have been with the I/O Fund for a few years know, AEHR require a more active stance. The stock treated us well in 2022 only because we actively managed the stock, and would only enter again with tight stops and price targets.

Brief Background on AEHR, Main Products

The primary market where Aehr saw former success was with silicon carbide (SiC) in electric vehicles (EVs), but as you can imagine, Aehr's stock has struggled over the past two years as EV sales have declined, causing companies like ON Semi (who supplies Tesla) to cut their orders with the company.  

However, Aehr’s stock has seen a resurgence as of late based on its burn-in solutions for AI processors. Similar to EVs, by stress testing the chips at elevated temperatures and voltages (‘burn in’) at the wafer-level, Aehr can lower costs from failures happening at the package or system level. Overall, Aehr’s value proposition is to make sure expensive AI chips don’t fail when placed under high stress. 

Testing at the wafer level is attractive due to the complexities of AI hardware, as advanced packages combine multiple GPU or ASIC dies (including dual-die setups) with 8- to 12-high HBM stacks—often totaling dozens of memory dies, all assembled via technologies such as CoWoS. Per Aehr’s CEO: “Even a 0.1% increase in yield by shifting the burn-in of devices from the system or heterogeneous package level to wafer level is very significant.”  

Aehr’s main products include its FOX platform for single, multi-wafer and die level burn-in and reliability testing for logic, memory, photonic, and power semiconductors, as well as its Sonoma and Tahoe systems for packaged-part burn-in and high-temp operating life testing. Aehr’s Sonoma system targets leading-edge AI processors/GPUs and networking chips up to 2,000 watts, and allows testing of 22 devices per system.

Combined, Aehr is now the only company that can offer wafer-level and package part burn-in for qualification and production of AI processers with direct, side-by-side comparisons on testing costs, output, operational costs, and impact on yields.

Our coverage on AEHR dates back to 2021 in a deep dive plus further reports in 2022 that discuss the importance of silicon carbide and gallium nitride for lowering power loss in EV batteries.dates back to 2021 in a deep dive plus further reports in 2022 that discuss the importance of silicon carbide and gallium nitride for lowering power loss in EV batteries.

For more on Aehr’s background, acquisition of Incal and the Sonoma systems, refer to our September analysis here: Aehr Test Systems: Optimism Driven by Sonoma Follow-on Orders Despite Soft FY25.Aehr Test Systems: Optimism Driven by Sonoma Follow-on Orders Despite Soft FY25.

Aehr Outlines $60-80M Bookings Target for 2H, up ~4X from 1H

Bookings were rather soft in fiscal Q2, down (33%) YoY and (46%) QoQ to $6.2 million, taking 1H bookings to a total of just $17.6 million.

Management explained that while they are not providing formal bookings guidance, they expect bookings in the second half of FY26 (November through May 2026) to be between $60 million to $80 million, based on the strength of recent customer forecasts provided to them. AI is expected to drive a majority of bookings, with packaged-part burn-in the biggest contributor followed by wafer-level, with some contribution from silicon photonics and a tiny portion from SiC.

This would represent roughly 4X of 1H’s bookings at the $70 million midpoint, and 2-3X its 2H revenue guidance of $25-30 million. Aehr had revealed in Q2’s call in early January that during the first six weeks of Q3, they had received an additional $6.5 million in bookings, already surpassing Q2’s total.

This bookings guidance should not be overlooked in the slightest, should it materialize, as it would represent record bookings by nearly 2X on the low end versus Q3 FY23’s record of $33.3 million. Additionally, looking at the lens of bookings to revenue supports management’s view that this guide should translate into a “very strong” FY27 (starting end of May).

Although bookings have been quite lumpy over the last few years, with a handful of large QoQ fluctuations, the broader trends is fairly clear, in that revenue typically lags bookings by one to two quarters, directionally speaking. An important note on the chart below – the near-vertical move reflects 2H’s guidance, including both Q3 and Q4, so growth will be spread across both quarters rather than hitting all at once.

Line graph showing Aehr's bookings forecast for sharp increase to $60 to $80 million, and revenue guidance for $25 to $30 million in 2H.

At a quick glance, Aehr’s current FY27 revenue estimate sits at $82.1 million, up 72% YoY, with the company likely exiting FY26 with strong visibility into a majority of next year’s revenue, adding a layer of confidence in next year’s growth panning out.

Strong Order Momentum in 2026

Underpinning this unofficial bookings forecast (and implying it has a strong chance of coming to fruition) is strong order momentum across the AI stack, from leading AI ASICs customers to silicon photonics players and further upstream to testing and assembly firms. Below offers a brief recap of the recent orders that Aehr has announced as well as commentary from Q2’s call on additional other customer opportunities.

  • Aehr announced on March 31 that it had received an initial order from a major new silicon photonics customer, spanning FOX-XP wafer-level burn-in, a fully integrated WaferPak Auto Aligner, and multiple sets of FOX WaferPak full-wafer contactors, with shipments in Q4 (likely May based on Q2’s commentary). Follow-on orders could potentially arrive later in calendar 2026 as this customer’s capacity ramps.
  • Aehr announced on March 3 that it had received a follow-on order from its lead silicon photonics customer for one new FOX-XP platform and an upgrade of an existing FOX-XP platform to the new fully automated configuration, shipping in the second half of calendar 2026.
  • Aehr announced on February 26 that it had received a $14 million order from its lead AI processor customer for multiple new fully automated FOX-XP systems, a set of FOX WaferPak full-wafer contactors and a fully integrated FOX WaferPak Auto Aligner. Aehr said the systems would ship in the next six months.
  • Aehr announced on February 11 that it had received an initial production purchase order from its lead packaged-part burn-in customer for its next-gen AI ASIC chip. This order includes multiple Sonoma systems, fully turnkey burn-in modules (BIMs) and device-specific sockets. This customer is also “forecasting a very large expansion of Sonoma system purchases for that device in the second half of calendar 2026 and continuing into 2027,” per Aehr. To note, this is the customer Aehr was referencing in Q2’s call regarding the ‘substantial forecast’ it had provided for ASIC production capacity with requested Sonoma delivery starting in Q1 FY27 (May-July), supporting its “record bookings” and strong revenue growth outlook for FY27.
  • Aehr announced on January 8 that it had received orders from multiple customers for its Sonoma systems, totaling $5.5 million, with management noting that this already is outpacing Q2’s Sonoma volumes.

Other Customer, Product Opportunities

There were a handful of other customer engagements and future opportunities discussed last quarter, though these are either small in nature or with contributions more than a year in the future.

Aehr disclosed that they have two other AI processor firms planning wafer-level benchmark evaluations, which typically take six months, with “meaningful progress” beginning in FQ3.

Management also noted that they proposed a next-gen solution for testing high-bandwidth flash (HBF) leveraging FOX-XP, WaferPaks and auto-aligners, though development of this solution will take more than one year.

Aehr also said that it is installing additional FOX-CP systems at a major HDD supplier for special component burn-in, with additional purchases later in calendar 2026, but added that the “overall revenue opportunity remains modest due to short stress times and the massive parallelism achieved on our FOX-CP system. and proprietary high-power WaferPak wafer contactors.”

For a quick note on SiC, management said demand is weighted toward the end of FY26, and while customers remain optimistic about capacity needs, Aehr is taking a more conservative stance of “show us the orders before we believe them.” Management added that their lead SiC customer is “seeing additional needs for WaferPaks this year, but additional capacity for systems appears to be a year out”

Single AI Processor Could Drive up to $150M Revenue Opportunity

Considering the strength of demand Aehr is seeing recently across the AI ecosystem and strong order momentum for shipments to support AI processors extending through this year into next, Aehr’s commentary on the broader revenue opportunity that AI chips offer is quite important. Management explained this quarter that they are still figuring out just how large this opportunity could be, but revealed that a single AI processor engagement could be worth as much as $150 million.

CEO Gayn Erickson explained that Aehr is “still trying to get our arms around how big it is. What we get is visibility of a specific GPU or CPU or network processor or an ASIC. And then we hear these things from the customer and then we look externally and what are they telling the Street and try and correlate to those lookups. And I'd say pretty consistently, we hear bigger numbers from the customer than the Street. … But a single processor for some of these big guys at wafer-level burn-in is 20, 30 systems or so. And these are $4 million, $5 million machines. So you get a feel for the size of what that looks like.”

Though there is a bit of a range here, Aehr is essentially saying that the largest AI processor companies, such as Nvidia and Broadcom, are driving wafer-level burn-in demand of $80 to $150 million per a single processor. Aehr noted that AI spend in testing between test and burn-in is estimated to be between “$8 billion, $10 billion to maybe $15 billion or so,” meaning these opportunities are roughly just 1% of the broader market size.

Erickson added, “So can the AI business be measured in hundreds of millions of dollars for Aehr Test a few years out? Yes. for sure.” While it is not simply so straightforward to assume that Aehr will ramp to hundreds of millions in revenue over the next few years, it reinforces the company’s value proposition in serving both packaged-part and wafer-level burn-in, improving yield and reducing defects of leading AI chips.

Aehr Hints that Capacity Could Support Much Higher Revenue

While the bookings forecast certainly is a bright spot considering the fundamental picture has been quite challenged, almost more important was management’s commentary on capacity, as it supports the long-term potential to reach hundreds of millions in revenue.

When asked directly about annual manufacturing capacity for wafer-level systems, CEO Gayn Erickson responded that Aehr has discussed with customers “about capacities exceeding 20 systems a month at either package or wafer level. If we had to, we could ship 20 systems a month of each during this calendar year. Now that's bigger than our forecast by a lot. But you know what, when people are saying, could you do something like this and intercept something, it's like if they gave you an order for 50 or 100 Sonomas, like how long is it going to take you to build them?”about capacities exceeding 20 systems a month at either package or wafer level. If we had to, we could ship 20 systems a month of each during this calendar year. Now that's bigger than our forecast by a lot. But you know what, when people are saying, could you do something like this and intercept something, it's like if they gave you an order for 50 or 100 Sonomas, like how long is it going to take you to build them?”

Putting this into context offers a handful of key takeaways, notably that shipping at full capacity each and every month would imply revenue likely 10X higher than what it is today. Aehr had explained that wafer-level burn-in systems such as FOX do carry higher ASPs, and based on the $4-5 million/system comment from above, 20 systems monthly implies maximum annual revenue of $960 million to $1.2 billion. Adding in Aehr’s packaged-part testing systems, which are implied to carry lower ASPs, could still unlock hundreds of millions in annual revenue on top of that.

On the other hand, reading in between the lines of Erickson’s answer for either wafer or package level implies Aehr’s current manufacturing footprint is only supporting 20 systems in total per month, while a step up to 20 of each per month would likely incur higher operating expenses and potential margin impacts. This was hinted at in a later answer, with Erickson saying Aehr is “not happy with these revenue levels, right? We're not making money at these levels. But we would be making more money. We're spending money. We got our foot on the gas. And in fact, it's our expectation that we'll increase the R&D spend particularly in the AI wafer-level burn-in, a little bit in the package because we spent a lot of money on that in just this last year for package, getting this new product out, and then the memory system which will be a blade in our FOX system basically.”

Cannibalization of Wafer-Level Burn-in and Packaged-Part Burn-In

While there was plentiful discussion on some of the challenges that Aehr and its customers are facing when it comes to evaluating wafer-level burn-in systems (such as not being fully aligned on parameters when benchmarking, thus causing some delays), the main takeaway on the product side from last quarter’s Q&A was that there will be cannibalization between FOX and Sonoma.

William Blair’s Jonathan Dorsheimer questioned about the potential for cannibalization, noting that the AI processor customer is moving forward with wafer-level testing, yet the ASIC customer is on packaged-part, and if future deployments would remain like this or both shift to wafer-level.

As AI chip design now shifts to more advanced packages combining multiple GPU or ASIC dies (including dual-die setups) with 8- to 12-high HBM stacks, often totaling dozens of memory dies, assembled via technologies such as CoWoS, Erickson pointed out that most qualification is done on the full package. He added that some customers now “would like to be able to qual the processor inside when it's still in wafer form [because] from a production perspective, the value proposition is you're burning in these devices and when they fail, you take out the other compute chip and all the memory plus the CoWos substrate” to avoid scrapping expensive, supply-constrained components during the development process.

However, the key takeaways is that if customers “could move it to wafer level, [they] don't need to do it a package anymore,” which Erickson says will “for sure” mean there is cannibalization between FOX and Sonoma. However, he believes that the “the world is going to be both for a long time, and we're in a great position to do both.” While it remains to be seen if/when cannibalization occurs at its lead customers, it’s a risk to be aware of.

Financials

Revenue Growth to Accelerate from FQ4

Aehr’s FQ2 revenue ending November was down by (26.5%) YoY and (9.9%) QoQ to $9.9 million. The decline was primarily driven by lower WaferPak shipments, partially offset by stronger demand for the Sonoma systems. Management pointed out that they experienced some GaN semiconductor headwinds, delaying ~$2 million in WaferPak shipments from Q2 to Q3.

Systems revenue grew by 46% YoY and down (26%) QoQ to $5.0 million. Contactor revenues, which include WaferPak contactors, were down (60%) YoY and up 32% QoQ to $3.44 million due to the ongoing softness in demand for electric vehicles and partially offset by the increase in package-level burn-in systems revenue, driven by increased demand from customers in AI-related applications.

Aehr will report its Q3 FY2026 ending February results on April 07th. Revenue is expected to be down (40.8%) YoY to $10.9 million. This is the last quarter of negative YoY growth as the company has diversified from silicon carbide for electric vehicles to fast growing AI and data center infrastructure markets.

Management highlighted during the earnings call that this year they are making significant progress expanding into additional key markets for the semiconductor test and burn-in solutions, including AI processors, gallium nitride power semiconductors, data storage devices, silicon photonics integrated circuits and flash memory, which will help the company to grow its revenues and profits.

Analysts expect strong revenue growth in the coming quarters. Revenue is expected to accelerate to 14% YoY in FQ4, then to 43.9% and 88.6% in the next two quarters.

Bar chart showing Aehr's quarterly revenue growth and estimates pointing to strong acceleration by Q2 FY2027.

Looking ahead, due to the strong AI-related demand, the company’s FY2027 revenue ending May is expected to ramp significantly and accelerate to 72% YoY to $82.1 million from an expected decline of (19%) for FY2026.

Margins

The company’s margins are under pressure due to the lower revenue and unfavourable product mix.

  • FQ2 gross profits were $2.6 million or 25.7% of revenue compared to $5.4 million or 40.1% in the same period last year. The adjusted gross margin was 29.8% compared to 45.3% a year ago. The decline was due to lower revenue and a less favorable product mix as last year's quarter included a higher proportion of higher-margin WaferPak revenue.
  • FQ2 adjusted operating loss was ($2.7 million) or (27.6%) of revenue compared to adjusted operating income of $0.2 million or 1.5% of revenue in the same period last year. The decrease in margins was primarily due to lower revenue.
  • FQ2 adjusted net loss was ($1.3 million) or (13.1%) of revenue compared to adjusted net income of $0.70 million or 5.1% of revenue in the same period last year.
Bar chart showing Aehr's quarterly gross margins declining from 40.1% in Q2 FY2025 to 25.7% in Q2 FY2026.

Positive Adjusted EPS Expected in FY2027

Analysts expect adjusted EPS of ($0.07) for Q3 FY2026 and expect to improve in the coming quarters. Adjusted EPS is expected to be ($0.13) for the FY2026 ending May and to improve significantly to $0.13 in FY2027 and $0.26 in FY2028.

Bar chart showing Aehr's annual adjusted EPS estimates turning positive in FY2027.

Cash Flow and Balance Sheet

The company’s cash flows have been weak due to current losses. However, it should improve in the coming quarters as the revenue is expected to ramp significantly in FY2027.

  • FQ2 operating cash outflow was ($1.17 million) or (11.9%) of revenue compared to ($5.9 million) or (43.7%) of revenue in the same period last year. Cash outflows were higher last year due to higher supplier payments.
  • FQ2 free cash outflow was ($1.64) million or (16.6%) of revenue compared to ($6.2 million) or (46%) of revenue in the same period last year.
  • The company had cash of $30.8 million and no debt at the end of FQ2 compared to $22.7 million and no debt at the end of the previous quarter. Cash increased as the company raised $10 million in gross proceeds through the sale of about 384,000 shares.
  • Inventory increased slightly by 2.2% QoQ to $42.7 million.

Conclusion

Aehr’s fundamentals are challenged, no doubt, but the company’s accelerating order momentum and expectations for bookings to surge through the end of May support a strong revenue ramp into 2027, currently estimated at 72% YoY to $82.1 million. Aehr’s value proposition of offering both wafer-level and packaged-part burn-in testing across the hardware stack, helping improve yield and ensuring highly-complex, expensive AI chips do not fail under high stress, is a key driver of this strong product demand. 

Given the weak fundamentals at the moment, we will treat Aehr as a momentum trade for the time being as we await further confirmation with material evidence in earnings reports that bookings and revenue growth are materializing as expected.

Please note: The I/O Fund conducts research and draws conclusions for the Fund’s positions. We then share that information with our readers. This is not a guarantee of a stock’s performance. Please consult your personal financial advisor before buying any stock in the companies mentioned in this analysis.

Damien Robbins and Royston Roche, Equity Analysts at the I/O Fund, contributed to this analysis.

Recommended Reading:

Arm Stock Could Win as Agentic AI Shifts the Bottleneck to CPUs

Earlier this month, Arm unveiled an AGI CPU to address one of AI’s biggest bottlenecks, which is orchestration. During the chatbot craze of 2023-2025, GPUs did most of the heavy lifting while CPUs had become an afterthought. Yet with agentic workloads, which is perhaps the single largest catalyst on the horizon for the AI trade in 2026 and beyond, the importance of CPUs is set to increase.

In agentic workflows, the GPU still handles inference, but between each inference call, the CPU is doing the orchestration – which are best described as handling tool calls, API requests and memory tasks. AI agents are surfacing this new constraint, which is how to prevent latency and underutilized GPUs following the exponential growth of orchestration needs.

For investors, what matters is that CPUs account for 50% to 90% of total latency in workflows, which means the CPU-to-GPU ratio in AI clusters will need to increase. Earlier this year, both AMD and Intel saw analyst upgrades based on the outstripped supply of CPUs leading to higher average sales prices of roughly 10% to 15%. Reuters also reported that Intel’s unfulfilled orders are reaching longer than six months while AMD delivery times are believed to be eight to 10 weeks.

Regarding how Arm fits in, the company’s expertise in lowering power requirements could matter more than the market expects. After years of supplying the architecture IP behind other companies’ CPUs, Arm is preparing to directly compete with its customers and x86 CPU competitors by transitioning to a chip designer themselves. This comes during a time when CPU cores are expected to go up 4X from 30 million CPU cores per gigawatt to 120 million CPU cores per GW.

Brief History of Arm

We covered Arm two years ago in our free newsletter, Arm Stock: AI Chip Favorite Is Overpriced, and how its mobile background and power-efficient focus positioned it well for increased AI adoption.

Arm offers the most popular CPU architecture in the world with more than 350 billion chips shipped since its inception, with the company essentially building a monopoly in the mobile CPU market with 99% market share stemming from its ‘heterogenous compute’ design and RISC architecture.

This design helped facilitate lower power requirements as the architecture allows different CPU parts to work together for improved efficiency, with workloads to be allocated across both high-performance and low-performance CPU cores to lower energy by balancing performance.

Arm is translating this expertise in power efficient chips to the data center, powering both Nvidia’s Grace and Vera CPUs, as well as custom CPUs from Amazon, Google and Microsoft. For example, Google says its Axion CPUs can offer up to 65% better price-performance and 60% better energy efficiency versus x86 alternatives, while Microsoft’s Cobalt 100 and Amazon’s Graviton4 CPU both have shown significant performance and price-performance advantages over competing x86 products.

The Role of CPUs in Agentic AI and the Coming 4X Increase in CPU Cores

Agentic AI represents a natural evolution from the query-and-response based nature of chatbots, to a more complex system capable of running dozens of different tasks and tools autonomously to reason through a problem and provide a response.

As a result, CPUs will play a more integral role in agentic and multi-agent systems to help solve how the system will schedule dozens of concurrent API requests and tool calls across independent agents, as quickly as possible with minimal delay. This is the orchestration constraint: how dozens of agents can make hundreds of concurrent requests needed to complete their independent workflows without causing significant latency or GPU underutilization.

Multi-agent systems are also expected to drive an exponential increase in token generation, which Arm estimated at up to a 15X increase in tokens per user, due to the increase in tool calls and API requests associated with each agent. This is expected to drive CPU core demand much higher, at a time where key x86 suppliers AMD and Intel battle growing supply constraints.

Arm CEO Rene Haas detailed at the company’s latest ‘Arm Everywhere’ event that a typical AI data center of today will feature around 30 million CPU cores per GW. Solving the flow bottlenecks of agentic inference will require “CPUs near the head node, CPUs next to the accelerator rack, more CPU racks inside the data center,” driving CPU core demand as much as 4X higher to 120 million cores per GW, per Haas.

CPU-Centric AI Systems

We are seeing evidence of how agentic AI and the importance of CPUs are beginning to affect incoming architecture designs. If you did not catch last week’s free stock newsletter, Nvidia Stock Prediction: The Path to a $20 Trillion Market Cap is Strengthening, I want to relay the importance of one sentence: “The goal is no longer to simply sell faster and more powerful chips, but to deliver superior economic value at the system level relative to custom silicon (in other words, let the battle begin).” 

Think of the Groq LPX racks that cost Nvidia a record-breaking $20 billion that it is soon deploying, addressing the memory-intensive decode phase of inference to significantly accelerate token throughput. This system-level focus is now moving to CPUs, with Nvidia pivoting to deploy its Grace and Vera CPUs as standalone racks. Nvidia says that when “paired with Rubin GPUs as a host CPU, or deployed as a standalone platform for agentic processing, Vera enables higher sustained utilization by removing CPU-side bottlenecks that emerge in training and inferencing environments."

Arm’s big announcement was not just that it was launching its first in-house silicon and CPU rack platform, but that it will now be directly competing on the standalone CPU system side. Arm’s foray into the standalone rack market offers a new choice for hyperscalers and data center operators to seamlessly deploy CPU-centric racks alongside GPUs, customize the CPU-to-GPU ratio to optimize for agentic orchestration and enable power-efficient AI inference at scale from start to finish. It will also provide another outlet to avoid vendor-lock in to Nvidia’s ecosystem with both air-cooled and liquid-cooled CPU racks.

Key Advantages of Arm’s ‘AGI CPU’ for Agentic AI Workloads

Arm also marked its long-awaited foray into physical chip development with its ‘AGI CPU’, launched at its Arm Everywhere event last week. The company’s pivot into physical CPU and rack development is one the AI industry will watch with great anticipation given Arm’s history of owning significant IP in the mobile space combined with the company setting out to solve agentic AI’s orchestration challenges.

Leveraging Arm’s history of delivering high performance with low power requirements for mobile devices, the new AGI CPU is designed to offer a similar balance between high performance and low power consumption.

The AGI CPU was co-developed with key partner Meta, the chip’s first customer, who revealed they turned to Arm almost two-and-a-half years ago to see if there was a CPU option that fit Meta’s needs: “put in a lot more cores per watt, but we do not want to compromise on the performance piece.” Meta had only been finding options satisfying one of the two criteria: meeting the performance but with too much power, or meeting the power but with too little performance.

2X Performance of x86 and Record CPU Rack Density

The new CPU features up to 136 of Arm’s highest-performing Neoverse V3 cores, drawing just 300W of power in a single-unit (1U) dual-node server (blade) featuring two chips. This compares to x86 chips, such as AMD’s fifth-gen EPYC CPUs, which deliver 128 to 192 cores per chip but at 390W to 500W in a two-unit (2U) rack.

In an air-cooled rack, Arm can pack 30 blades (or 60 CPUs) for a total of 8,160 cores in a 36kW power envelope, saying this configuration can deliver up to 2X the performance per rack versus x86 chips based on its internal estimates. Arm says this 30-blade design is “setting records for air cooled” racks that is not feasible with other systems, as power consumption is too high.

Bar chart comparing Arm AGI CPU versus x86 CPUs, showing higher sustained performance per thread, per rack, and per watt.

Comparison of sustained AI workload performance shows Arm’s AGI CPU outperforming x86 CPUs (with and without SMT) in performance per thread, total threads per rack, and performance per watt — highlighting Arm’s efficiency advantage for agentic AI orchestration. Source: ArmArm

Arm is taking this a step further with a fully-liquid cooled, 200kW open-standard rack in partnership with Super Micro, packing 168 blades, or 336 CPUs, delivering a total of up to 45,696 cores. Arm EVP of Cloud AI Mohamed Awad stated that while it is a “200-kilowatt rack. We actually will consume about half that much power. We ran out of space. That’s why we couldn’t put more cores in there.”

This is one of the key advantages – it is not just about offering 2X the performance of x86 chips, but providing that performance boost while freeing up power for more compute or for more networking:

“So if you have a CPU that can draw less power, it could be just as performant, but use less power, it means you have more leftover for everything else that you want to do. That means more inference and more compute. That means more intelligence.”

mid

One Petabyte of Memory and Low-Latency Chip Design

However, Arm architected the new chip with other key optimizations in mind, notably on the memory side. The AGI CPU features 96 PCI Gen6 lanes with CXL 3.0 connectivity, which Arm says allows the new CPU to be attached to any accelerator of choice, allowing flexibility of deployments with Nvidia or AMD GPUs or custom chips.

The chip also features up to 6TB of memory, providing more than 1 petabyte (PB) of low-latency memory in the liquid-cooled 200kW rack. Arm is achieving this extreme low latency of <100 nanoseconds from memory via a dual chiplet design, with each chiplet having both the memory and I/O directly onboard to avoid multiple links across the silicon.

Arm says the new chip’s performance advantage over x86 could enable “up to $10B in capex savings per GW of AI data center capacity,” making it a compelling option for current and future agentic AI-optimized deployments to save money, save power and avoid Nvidia-lock in from its accelerator-agnostic nature.

Looking beyond AMD and Intel, Arm’s in-house design may also outperform Nvidia’s design based on Arm’s IP as the AGI CPU offers a step up in core count and memory at the rack level versus Nvidia’s Vera CPU, despite Vera running on custom Arm ‘Olympus’ cores.

Nvidia says the Vera CPU rack features 256 CPUs, each packing 88 cores for a total of 22,528 cores across the rack; this offers 45,056 threads with multi-threading. Vera racks will also offer up to 400 TB of memory capacity with 315 TB/s of memory bandwidth with PCIe Gen 6 lanes and CXL 3.1 connectivity, whereas Arm offers 2.5X the capacity though just ~274 TB/s of bandwidth at 6GB/s per core.

Quantifying the Impact of CPU-Optimized Agentic AI

Arm’s executives provided some initial commentary about long-term growth projections, seeing the new CPU as a rather lucrative revenue opportunity by the turn of the decade.

Arm expects the AGI CPU to generate $1 billion in revenue in fiscal 2027 and 2028 (June 2026 to March 2028), with the first generation of the AGI CPU now available and ramping further in 2H.

Arm outlined a second generation of the chip tentatively on deck for 2027, likely contributing to some of the revenue generation in 2028 and beyond. On a broader long-term view, Arm estimates the AGI CPU line could generate $15 billion in revenue in 2031, or ~60% of its 2031 revenue target of $25 billion, with a third generation potentially launching before then, though Arm provided no timeline for that chip.

This represents around a 15% share of what Arm believes will be a $100 billion TAM for data center CPU. This is a higher TAM than what Nvidia CEO Jensen Huang discussed at GTC, saying: “I'm not expecting CPUs to be that much and call it because CPUs just don't add up to much, okay. And so you could say CPU is another 5%” – or around a $50 billion TAM on $1 trillion.

The challenge in scaling from a fresh launch to $15 billion in revenue in a matter years is definitely doable, considering the current pace of capex growth and tens of billions in AI accelerator revenue flowing to Nvidia, AMD and Broadcom each quarter. However, the path ahead is not free of challenges, as Arm must still compete against Nvidia’s new standalone deployments, as well as the custom Arm-based CPUs hyperscalers have already built – Amazon’s Graviton, Google’s Axion, and Microsoft’s Cobalt.

Financials

Arm’s Financials Offer Superior Gross Margins

Arm has a profitable business model that constitutes licensing revenue and royalty revenue. The company reported a strong gross margin of 97.6% in Q3 FY2026 ending December.

Bar chart showing Arm’s gross margin holding around 97% to 98% from Q3 FY2025 through Q3 FY2026.

Arm’s gross margin has remained consistently near 98% over the past five fiscal quarters, underscoring the strength and durability of its high‑margin licensing and royalty business model. Source: Company IR

Arm reported a GAAP operating margin of 14.9% and an adjusted operating margin of 40.7% in the recent quarter. The difference between adjusted operating margin and GAAP operating margin is that the company is a recent IPO and has high stock-based compensation of $285 million or 23% of revenue.

ACV Grew by 28%

The company’s licensing and other revenue grew by 25% YoY and down (2%) QoQ to $505 million in FQ3. The revenue growth decelerated from 56% YoY and 10% QoQ growth in the previous quarter. Licensing revenue has been lumpy, and management mentioned on the earnings call that it varies quarter to quarter due to the timing and size of high-value deals. So, annualized contract value or ACV is considered a key indicator of the underlying licensing trend. ACV grew by 28% YoY and 1% QoQ to $1.62 billion in FQ3. ACV grew by 28% in the past three quarters.

Bar chart showing Arm’s annual contract value growing to 28% year over year by Q3 FY2026.

Arm’s annual contract value growth accelerated from single‑digit levels in FY2025 to a sustained 28% year‑over‑year pace through FY2026, signaling strengthening demand and improved visibility in its core licensing business. Source: Company IR

AGI CPU Could Become a $15 Billion Revenue Line by FY2031

Arm is launching its own chip which will help the company grow revenues and profits. The company expects more than $1 billion in revenue from this business over the next two years with the majority of revenue to be recognized in FY2028 ending March.

Arm expects an exponential ramp to $15 billion in revenue in FY2031. The strong growth is primarily driven by solid demand and the increasing complexity of chips will lead to a significant rise in average selling prices. Gross margins are expected to be at least 50% and the adjusted operating margin of over 30% for the chip business.

The company’s licensing and royalty revenue is expected to be $10 billion in FY2031 ending March, with a gross profit margin of 99% and over 65% adjusted operating margin. Management increased this long-term adjusted operating margin guidance by 500 basis points.

The company’s total revenue in FY2031 is expected to be $25 billion and adjusted EPS is expected to be over 9. The current consensus revenue estimates for FY2031 of $21.18 billion and adjusted EPS of $8.39 are lower by 18% and 7.3%, respectively.

Table showing Arm revenue estimates rising from $4.9B in FY2026 to $21.2B in FY2031 with accelerating year‑over‑year growth.

Consensus revenue estimates project Arm’s revenue to grow from $4.9 billion in FY2026 to $21.2 billion by FY2031, with year‑over‑year growth accelerating sharply in the later years, reflecting expanding licensing, royalty, and AGI CPU contributions. Source: Seeking AlphaSeeking Alpha

Royalty Revenue Is Entering a Sustained 20% CAGR Phase

The company’s royalty revenue has grown at about a 14% CAGR in the past five years. It has accelerated to over 20% in the past two years as Armv9 and Compute Subsystems (CSS) have started to ramp. Looking forward, management expects that the royalty revenue Compound Annual Growth Rate (CAGR) will be 20% over the next five years. The company’s royalty rates have doubled from Armv8 to Armv9 architecture, and again to CSS.

Valuation

Arm is currently trading at a P/S ratio of 36.3 and a forward P/S ratio of 28.6. The company is trading significantly higher than its other semiconductor peers like Broadcom’s forward P/S ratio of 14.4 and Nvidia’s forward P/S ratio of 11.6.

The company’s revenue growth is expected to accelerate in the next five years compared to the previous period. The company’s revenue CAGR has been 19.3% from FY2021 to FY2026E. Analysts expect revenue to grow at a CAGR of 34% from FY2026E to FY2031E and will be even higher at 38.5% if we use the $25 billion management guidance. However, when looking at the AI segment of many semiconductor peers, the growth rate does not stand out, per se, to justify the high valuation. Rather, the consistency of licensing and royalties' revenue does stand out, and this recurring revenue will create a nice baseline when you combine higher growth from their merchant CPUs.

Line chart showing Arm’s forward P/S ratio of 28.6x.

Arm’s forward price‑to‑sales multiple has remained elevated over the past year, with the forward P/S above 30x, reflecting strong expected future revenue growth. Source: YChartsYCharts

Cash Flows

The company’s cash flows have been lumpy due to high working capital and high capex to support the long-term growth. However, with the expected strong future profit growth, the cash flows should improve. The company also has a strong balance sheet with cash & short-term investments of $3.54 billion and no debt.

Conclusion:

Arm may be a right place-right time stock, to where the years where Arm sat uneventful compared to peers could payoff as they are more prepared to aggressively compete in the AI market. The valuation is an unknown, and an important aspect given merchant CPU revenue will take time to scale.

To offset this, Arm offers consistent (and rare) recurring revenue, strong margins and far less speculation than, say, an AI software stock that must invest heavily to remain competitive and prove they can build user traction. Instead, Arm offers decades of IP excellence, a 99% penetration in mobile, all while its x86 competitors like AMD and Intel struggle to keep up with their growing backlogs.

The AI trade has been in question lately, yet when the market regains confidence in AI again, Arm will undoubtedly be part of a select, core AI semiconductor pack positioned to deliver for the long haul. 

Since our inception in May 2020, I/O Fund has delivered a cumulative return of 326%— if we were a hedge fund, we’d rank #1 and if we were a tech ETF or Mutual Fund, we’d rank #3 in the United States. To get our Top 15 AI stocks, real-time trade alerts, and weekly 1-hour webinars from a proven team in AI and tech stocks, sign up now.sign up now.

Please note: The I/O Fund conducts research and draws conclusions for the company’s portfolio. We then share that information with our readers and offer real-time trade notifications. This is not a guarantee of a stock’s performance and it is not financial advice. Please consult your personal financial advisor before buying any stock in the companies mentioned in this analysis.

Recommended Reading:
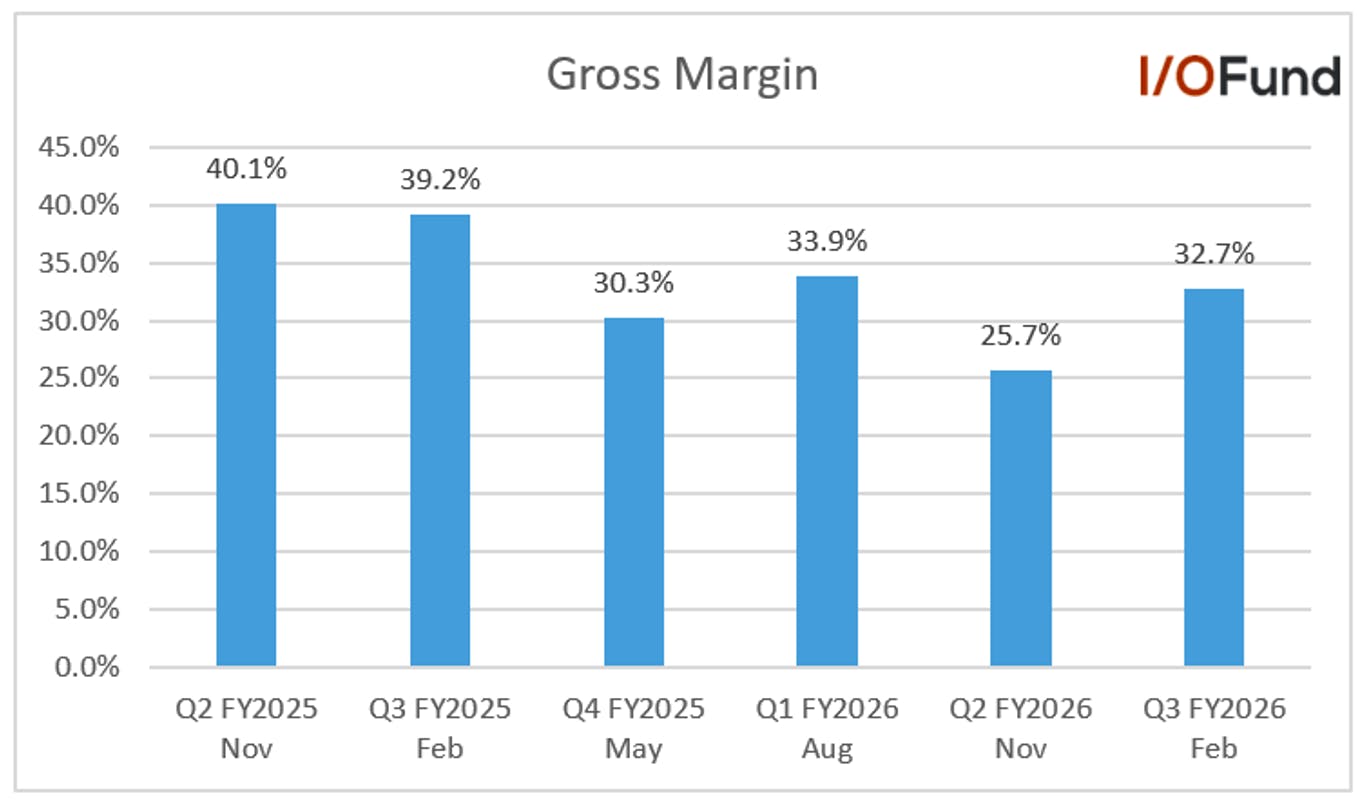
Western Digital: Visibility Extends Through 2028, Catching up to Seagate on Density 

Data is the fuel for training and inference as it enables stronger models and better inference results. As more data is generated and the value of data increases, the demand for storing data is also increasing quickly.  

There are a few ways that Western Digital can awaken an age-old industry to meet the demands of hyperscalers. The first is to increase areal density from 32TB to eventually 100TB as we end the decade. By packing more capacity into the same footprint, Western Digital delivers improved economics to alleviate surging capex. The company’s UltraSMR-enabled JBOD platforms offer TB per drive, lower cost per TB and lower power (and space) per TB, delivering not only increased capacity but also lower total cost of ownership.  

The company seeks to work with a larger customer base beyond hyperscalers by not just saying “go figure out SMR” on your own to enterprises. SMR stands for shingled magnetic recording (more on this below). There are barriers to adoption for SMR as it’s complex to integrate and can have unpredictable performance at times. Western Digital is planning for when AI broadens beyond hyperscalers by offering a validated JBOD platform that tests and tunes UltraSMR, offers predictability through controlled reference architecture, and that is also quick to deploy.  

When translating UltraSMR’s benefits in investor terms, management states it offers a 20% capacity lift over CMR (conventional magnetic recording) and a 10% capacity uplift over industry standard SMR. The UltraSMR solution is software-based, thus it’s “very accretive” from a margin standpoint. Last quarter, there was a 50% mix on UltraSMR with expectations this will increase as the company’s top three customers are onboard with UltraSMR drives today and another two to three are moving toward adopting UltraSMR. 

Looking beyond the recording format, HAMR is an important catalyst for Western Digital as it’s a new write technology that uses a tiny laser to briefly heat the disk surface to write onto higher-stability media at much higher densities. This means WDC can pack more data onto the same drive size to deliver higher capacity. The step-function upgrade to increase capacity is a key element to Western Digital’s future product road map. Overall, HAMR is a primary capacity lever that will lead to 100TB hard drives along with combining higher bits-per-platter and higher platter count.  

The analysis below is dense at times, yet a necessary step to discussing a stock that has seen returns of 591% over the past year.  

Brief Product Overview  

Multimodal datasets are among the largest drivers of incremental storage demand. As inference and physical AI scale, the low-cost and high-density of HDD economics are hard to beat. Video is a data hog that and even modest growth here from multimodal AI can create what’s called “data exhaust.”  

As you'll see below, HDD is the lowest cost per TB for bulk storage. As inference requires more exabytes to be stored, HDDs offer an advantage in that storage tier. In fact, Western Digital’s management team foresees a CAGR of 25%+ over the next 5 years with HDD representing “80% of the storage media that deployed within a hyperscale environment.” 

UltraSMR and ePMR   

To answer this incoming demand, Western Digital’s ePMR tech (energy-assisted Perpendicular MR) tech adds electrical currents to the write head to improve density and write smaller bits. This increase in areal density allows more data to be stored in smaller spaces, helping drive down costs per TB and improve TCO for customers. ePMR is a tried-and-true tech, with WDC noting that it has been the ‘workhorse of the industry’ for the last decade.  

WDC is currently shipping its ePMR-based drives in 26TB CMR (conventional magnetic recording) and 32TB UltraSMR (ultra shingled magnetic recording) configurations. It is also scaling to the world’s first 40TB UltraSMR later this year, a new product addition to its portfolio and a capacity that was previously thought to be impossible to reach with ePMR.  

UltraSMR also features technological and read channel optimizations that boost HDD capacity by up to 18% versus traditional CMR drives. A key enabler is Western Digital’s OptiNAND architecture, which integrates embedded NAND devices, enabling multiple active write zones and increasing track density per disk. WDC says its UltraSMR drives offer among the highest capacities per drive for data-intensive workloads, and consume as little as 5.5 watts of power when ideal, driving TCO lower. The UltraSMR drivers are also available in WDC’s JBOD hybrid storage platforms, integrating 60 to 102 drivers to offer up to 3.26PB of storage capacity. 

HAMR 

WDC is also moving into heat-assisted magnetic recording (HAMR) to scale to higher capacity drives, as ePMR tech is reaching its physical limits in areal density. This refers to how many bits can be packed onto each square inch of disk platter (where data is stored).  

Thus, future capacity gains must come from shrinking bit sizes further, which can be achieved via HAMR. HAMR uses a laser diode to heat a microscopic spot on the disk, enabling polarity of a single bit to be flipped to allow data to be written. This allows for substantial areal density gains, moving from <3 TB per platter under the current UltraSMR drives to up to  ~10TB per platter by the end of the decade.  

WDC acknowledges that its ePMR roadmap can extend up to 60TB, but after that, the shift to HAMR is all but inevitable in order to progress towards 100TB capacities and beyond.

Source: WDC 

WDC is harnessing its patented laser technology to not only reach 100TB drives over the next few years, but scale even further by adding more platters to drives:  

So for the last 6 years, we've been working on our own patented laser technology. It solves for those 3 problems. By emitting more light, harnessing more of that light into the recording technology, we will increase the aerial density of the HAMR platters from 4 terabytes all the way to 10 terabytes by 2028 per platter. We have 11 platters. It's one of the reasons I'm confident about 100 terabyte HAMR drives by 2029. This technology is not theoretical. It's actually already in the labs. 

We've watched it do in the recording. The other part of it, as you can see from the micrograph, they're shorter. So it allows us to add yet more capacity per drive by packing up to 14 platters into the same 3.5-inch form factor. 10 terabytes, 14 platters, that sounds like 140 terabytes.” 

Accelerating ePMR and HAMR Roadmap 

WDC is accelerating its ePMR and HAMR roadmaps, noting that ePMR shipments are growing double-digits sequentially next quarter. HAMR qualification timelines are also accelerating by six months. 

Management explained in fiscal Q2’s call that ePMR shipments reached more than 3.5 million units, while starting qualification of both its upcoming HAMR and next-gen ePMR drives at two different hyperscaler customers. ePMR shipments were guided to reach closer to 4 million in fiscal Q3, or growth of more than 14% QoQ.  

On HAMR, WDC stated that they pulled forward qualification and started in February with one hyperscaler, with another expected to be initiated relatively soon. Management emphasized at its Investor Day in February that they are “so confident in our road map for HAMR. From last year, we said back in the '27 for the ramp, we pulled it in by 6 months. So it's ramping in the first half of 2027.”  

Inference as an HDD Driver 

We recently covered discussions over the role of SSDs in ‘warm’ storage and Nvidia’s upcoming Inference Context Memory Storage platform in our SanDisk analysis in detail. Simply put, Nvidia is essentially proposing SSDs to take a more central role in the ‘warm’ tier where HDDs sits – what Western Digital and competitor Seagate consider ‘nearline’, where data does not have to be accessed instantaneously but must remain readily available.  

We covered Seagate’s response to this proposal in our analysis, with executives believing there ultimately will not be much change to storage architectures with HDDs remaining critical from a TCO perspective to handle the massive volume of data generated by AI applications. Western Digital mirrored this view, explaining that Nvidia’s new initiative will likely at its core accelerate the growth of volume generated, which means HDDs will remain critical for AI storage requirements – management expects HDDs to still account for 80% of storage solutions deployed by hyperscalers over the next five years. 

However, management also pushed back on the economics of utilizing quad-level cell (QLC) SSDs for AI storage workloads, emphasizing that QLCs offer 10% of performance of HDDs for 10X the cost: 

This performance has led some customers to think about using QLC flash to provide that performance in addition to hard drives. It's very attractive because — but QLC has a problem when the data is constantly moving as it does in the AI workloads and in the cloud workloads. QLC wears out. And that means you have to make a lot of changes in your software, so it doesn't wear out.  

Otherwise, you end up with silent data corruption. And that is just as scary as it sounds. Hard drives, on the other hand, just don't. They don't wear out. They'll operate for years without wear out and customers like that and it simplifies their code. The other reason to consider QLC flash is that the headline performance of a QLC drive is 6 gigabytes per second. That's way more than the 200 to 250 megabytes per second of a hard drive. But that's a headline number. It's only true when that drive, that QLC drive is attached directly to the GPU with a great big bus. In the real world, in object stores deployed in massive scale, that's not how it's done. Hard drives and QLC drives are connected to the network via a thing called the SAE interface.  

It's a thin pipe that takes data from the drive to the network. It can only support 530 megabytes per second. So customers would get less than 10% of the performance of QLC for 10x the cost of a hard drive. Do you think that's a good deal? I don't now or as a customer.” 

WDC also commented on more specific inference-based HDD demand drivers, such as multi-modal models requiring significantly large data sets to store queries and prompts, video generation, as well as autonomous vehicles and robotics needing extensive data sets to function in real-world situations. All summed up, WDC believes that inference and these upcoming AI applications will drive storage exabyte demand at a >25% CAGR over the next five years, providing a solid foundation for long-term revenue growth as HAMR unlocks a path to higher capacity drives.  

There is one risk with this, in that there will still likely be use cases and applications where customers use a higher mix of SSDs. HDDs offer the lowest-cost per terabyte, ideal for “big data” storage, backups and large AI datasets. However, solid state drives (SSDs), which store data on flash memory chips, are far faster and lower-latency but at a higher cost per terabyte. This means leveraging a mix of HDDs and SSDs is a popular choice, and some AI workloads prioritizing latency may take a higher mix of SSDs.  

High Bandwidth HDD Design and Power-Optimized HDDs 

At its recent Innovation Day, Western Digital shared more information on its product roadmap and technological innovations driving its path to 100TB capacity. WDC is not seeking just capacity gains but also performance gains with high-bandwidth HDD design. This is especially important as throughput (data transfer speeds) must continue to scale alongside capacity to prevent performance bottlenecks. 

This has not been the case over the last several years. WDC explains that since 2017, CMR HDD capacities have increased by 116%, from its 12TB Ultrastar to 26TB, yet maximum sequential throughput only increased 18%, from 255MB/s to 302MB/s. This is critical as a lack of throughput gains will make HDDs less suitable for bandwidth-intensive AI workloads despite strong capacity gains.  

WDC is aiming to boost performance and throughput via two innovations, High Bandwidth Drive (HBDT) and Dual Pivot design technologies. Put simply, WDC is working towards delivering NAND flash-similar performance and throughput but with HDD cost and TCO economics.  

WDC says that its HBDT will enable simultaneous read and write from multiple heads on multiple tracks, which up until now has been done on a single track at a time. Currently, HBDT is able to access two tracks simultaneously, though WDC believes it can ultimately scale to four and eight tracks simultaneously. Under two tracks, WDC says sequential throughput will double and will scale further as HBDT innovation progresses towards eight tracks at once. Importantly, HBDT is already in validation with customers. 

Dual Pivot tech (DPT) unlocks further performance gains by adding a second independent actuator on a separate pivot. Similar to how read and write were previously done on a single track at a time, HDDs have been limited by having one single actuator containing the read-write heads. With DPT, a second actuator is added on the opposite end of the drive, allowing for independent seeking between the two heads.  

This is the main difference between DPT and previous dual actuator drives. Previous drives had to remove on disk to make space for the second actuator to boost performance, sacrificing capacity, whereas with DPT and the placement of the second actuator, WDC can reduce spacing between disks, and boost capacity and performance at the same time. DPT remains in the lab for testing and is expected to be available in 2028. 

Combining both technologies is expected to drive significant performance and throughput gains while on the path to >100TB capacity. WDC states that “two-track HBDT plus dual pivot is projected to increase throughput from today’s 300MB/s to approximately 1.2GB/s, a 4x increase.” This would mean that a 100TB drive would have similar throughput and performance as the currently-available 26TB drives, preserving HDD performance and cost economics. WDC adds that eight-track HBDT and DPT could theoretically increase throughput to 4.8GB/s, another 4x increase from two-track and 16x versus today.   

Here’s how management explained this increase in performance, and this quote provides some perspective as to why demand may be high for drives integrating these technologies, as it can seamlessly integrate into existing infrastructure: 

The thing [customers] really love about this is that we can go to 4, 6 and 8x the performance. It is scalable. By the time we get to 100 terabytes, we could be 8x the performance of today's drives. We already have the technology to do it, and we're developing it, so we're ready for when customers are ready for it. We'll introduce this capability at the 50-terabyte mark to meet the customers' demand so that they are ready for us to consume and take advantage of all this performance. … 

This design will fit in an existing customer chassis with that change. It can be made on the same manufacturing lines. And they just see more performance. So customers are really excited by this. double the transactions smoothly for customers. … Dual-pivot technology helps customers focus their software effort on improving more performance for AI versus having to deal with how the hard drives are working. And we'll introduce this at the 60-terabyte mark. … 

My biggest problem is finding them enough material so they can start testing. Dual pivot technology will be in their hands in late '27 and '28. So all the performance that the customer's hardware can support their existing boxes, their existing software, their existing networks without having — can be delivered from these drives with the capacity that we are building without having to use QLC. We deliver performance 10x cheaper than QLC can.” 

Management also shed more light on software optimizations and how this will also accelerate deployment timelines for upcoming tech. WDC explained that the “shortcut is a simple, open API that allows customers to integrate that API to their existing file system, their existing object store,” that will be available on flash and extending to all HDDs scaling to 100TB. This will provide faster qualification and faster time to production, with this becoming available in 2027. 

WDC is also working on power-optimized HDDs, aiming to lower power consumption by up to 20% and boost capacity with minimal trade-offs on performance. The lower power consumption not only will offer a lower TCO, but also make these HDDs more attractive from a hyperscaler perspective by saving more power that can be allocated towards more GPUs.  

WDC says that by spinning the drive slower, “we can reduce the power by 20%, but we only trade 5% to 10% of the sequential I/O [input output operations], not something that the customers have seen before or even thought was possible.” This also will add ~10% more capacity, or 10TB for a 100TB drive, or increasing capacity inside the same 3.5 inch form factor without changing the drive’s power profile. WDC adds that this lower power consumption is optimal for cold data, or data that needs to be accessed within seconds for AI inference, helping enable AI data storage at scale. 

Multiple Margin Levers to Pull 

WDC outlined multiple different margin levers at its disposal, from strong yields with its ePMR products to increasing mix of UltraSMR drivers and soon the HAMR ramp. WDC has seen strong margin expansion, with Q2 gross margins up nearly 8 points YoY and operating margin following suit with a nearly 7 point YoY expansion. Perhaps most importantly, WDC expects to drive further gross margin expansion over the next couple of quarters and beyond, due to these levers.  

Management explained that yields for ePMR products are in the low-90% range, noting that “as we get yields up, cost continues to decline. As the UltraSMR mix goes up within those new products as well, that's also going to be a driver of cost down as well.” For context, UltraSMR drives now account for 50% mix in its nearline portfolio, with WDC’s top three customers onboarded with two to three other major customers likely moving to adopt the drives soon. This is expected to drive an increase in UltraSMR mix over the coming quarters and provide solid gross margin tailwinds. HAMR will be another margin lever in play once these drives begin to ramp, as WDC expects its HAMR products to be neutral or accretive to gross margins. 

Touching on the cost front, WDC explained that costs per terabyte were down around (10%) YoY in the quarter, which, combined with a 2-3% increase in ASP, provides room for solid margin expansion. This also pertains to higher capacity drives, which management explained have a cost benefit as well, which likely see lower unit costs, similar to Seagate.  

Analysts questioned about incremental gross margins considering the combined levers WDC has, with management explaining that they are currently running at a 75% incremental margin: 

On the gross margin line, the guidance that you're giving for 47% to 48%, I guess the back of the envelope math would suggest that you're maintaining what looks to be like a 70%, maybe 75% incremental margin flow-through. So, I guess, my question is, how do you think about the durability of that incremental margin? 

EVP and CFO, Kris SennesaelEVP and CFO, Kris Sennesael 

We delivered 46.1% gross margin, up 220 basis points quarter-over-quarter, up 770 basis points year-over-year. And we are guiding to 47%, 48%, so 47.5% at the midpoint, which is up 740 basis points on a year-over-year basis. And, Aaron, I think your math is working. The incremental gross margin is on or about 75%, depending on how you look at it on a year-over-year basis or a quarter-over-quarter basis. So I've stated before, I'm very comfortable with an incremental gross margin higher than 50% and definitely 75% is higher than 50%. 

I mean in gross margins, there's two sides to the equation. On one hand, you have pricing environment. On the other hand, you have the cost environment. In pricing, I've talked about that before. We see a stable pricing environment with prices on a price per terabyte, kind of, flattish to slightly up. Actually, last quarter, it was up 2%, 3% on an ASP per terabyte basis. So that clearly demonstrate the value that we continue to deliver to our customers. 

And on the cost front, the teams continue to execute really well. We continue to upshift our customers to higher capacity drives, which gives us a cost benefit. And then there is great execution as well on driving down the cost in our manufacturing assets as well as throughout the supply chain. And when you look at it last quarter, the cost per terabyte was coming down on or about 10% on a year-over-year basis. And so when you put this all together, we continue to drive further gross margin expansion. And we believe in the next couple of quarters and beyond, we will continue to be able to do that.” 

What the incremental margin means is that for every dollar of revenue that WDC adds compared to the prior quarter, 75% of that flows through to gross margin – WDC delivered a $199 million QoQ increase in revenue this quarter, with $153 million of that flowing to gross profit. Looking ahead, if WDC can maintain this and deliver >$200 million QoQ growth throughout CY26 (as current estimates suggest), it could exit the year with margins above 50%. 

Visibility through 2027-2028 at Top Customers, Pricing is Stable 

WDC has already signed firm orders through calendar 2026 with its top seven customers, though it has visibility into demand extending out into 2028. Management explained that they have ‘robust’ agreements with three of its top five customers, with two of these covering calendar 2028 and one extending through calendar 2028, with these LTAs including both volume and price conditions.  

Analysts asked questions about WDC’s long-term agreements and what the economics of these new orders would look like. WDC revealed that they do contain conditions for volume and pricing, but added quite an important caveat at its Investor Day – hyperscalers want ‘predictable’ pricing, in sharp contrast to rapidly rising (and fluctuating) SSD prices. This means that upcoming contracts will likely have set price escalators so hyperscalers do not get exposed to rapidly changing memory cost structures: 

Irving, just given the tightness of the HDD market and kind of the significant inflation that NAND is going through right now, can you maybe just talk about maybe your patience in being able to sign purchase orders further into calendar '27 to extract better economics just relative to maybe how you were approaching signing POs last year? Is that making any difference in the economics you're able to extract?  

CEO Irving Tan 

As we highlighted, we're pretty much sold out for calendar year '26. We have firm [purchase orders] with our top 7 customers. And we've also established LTAs with two of them for calendar year '27 and one of them for calendar year '28. Obviously, these LTAs have a combination of volume of exabytes and price. And in relation to pricing, I think first, it's important to recognize [that] there's actually a structural shift in the value that we deliver to them, especially in the impact that we have to their total cost of ownership as the business moves more and more towards inference where monetization is happening.  

So, in this case, the pricing that we've provided there reflects the value that we're delivering to them. And so as Kris mentioned, we continue to see going forward a stable pricing environment that gives us an opportunity to continue to extract more value as we deliver both better TCO value to our customers and to better support their supply-demand needs as well through higher capacity drives. 

This ties in to comments from Investor Day, where management confirmed that they want to ensure there is a fair value exchange between capacity/performance and pricing, noting that the goal is to deliver “predictable pricing” as hyperscalers are concerned about “high volatility of some tiers of the storage space,” referring to the strong QoQ growth in enterprise SSD prices. 

Management also offered some more insights onto pricing trends through 2026, noting that FQ2 had seen stable prices with ASP per terabyte up 2-3%, while projecting mid-to-high single digit YoY ASP growth through the year and remaining stable into 2027: 

If I look at calendar year 2026, 4 quarters of calendar year '26, I do expect ASP per terabyte to go up mid- to high single digits year-over-year for all 4 quarters, mid- to high single digits year-over-year for '26. And then beyond '26, I expect us to continue to operate in what I call a stable pricing environment, of course, from the higher level that we established in '26.” 

Battling Head to Head with Seagate on HAMR, but Expects to Lead 

It’s safe to say that WDC faces fierce competition with Seagate in the HDD space on both exabyte shipments and on the tech front. WDC exhibits a fair lead in exabytes, shipping 192 nearline exabytes in the quarter versus Seagate’s 165 exabytes. However, Seagate current is ahead when it comes to ramping HAMR drives. 

For an apple-to-apple comparison to Seagate, WDC’s first HAMR products are expected to launch with capacities from 40-44TB, which aligns with Seagate’s Mozaic4+ platform also offering up to 44TB, as both feature 4TB capacity per platter. The key difference is that Seagate’s Mozaic4+ is now shipping to two hyperscalers and ramping through the rest of the year, representing a three quarter head start over WDC in the first half of 2027. 

However, Western Digital expects to quickly take the lead in HAMR-drive capacity, with management confident in achieving 100TB+ products as early as 2029. This goes back to our discussion on the HAMr under the product overview, with WDC aiming to reach 10 TB per platter by 2028 to enable shipping 100TB HAMR drives by 2029.  

One reason that WDC is able to move so fast at scaling capacity is that it begins qualification processes at hyperscalers when introducing new hardware into the labs, cutting ramp timelines by months: “Together with our customers, we started to introduce the hardware into our labs and the qualification of the hyperscaler software so that we can start the qualification process while we're still developing the drive.  

That cuts out months from a qualification process. So by the time we're ready for volume manufacturing, the drive is ready to ramp. As Irving said earlier, we've ramped up our latest generation of drives very quickly. That's one of the reasons. The other part with rapid generation of more capacity points, customers will have a lot of qualifications. So instead of qualifying every single capacity point, they qualify one set of capacity point, let's say, 36 to 41 terabytes, and we will just ship them more capacity as we make it available. One qualification, many capacity points.  

And the next one is going to be at 42 to 56 and so on. So that innovation, not just in the drive design, but also in the processes we do gets us faster time to capacity in customers' hands in their fleets where they need it the most. So putting it all together, our HAMR capacity goes from 40 terabytes to 100 terabytes by 2029.” 

On the flip side, Seagate has that capacity penciled in for the early part of next decade, noting in Q2’s call that its Mozaic3+ and Mozaic4+ “developments align with our long-term areal density road map that extends to 10 terabytes per disk, which we expect to deliver early in the next decade.” This shift will be key to watch, as it suggest that Seagate could soon lag WDC’s capacity roadmap by several years.  

In plain terms, WDC could have a significant capacity and TCO advantage by 2029 if it can realize these density targets, making it a more attractive solution for AI data storage needs 

Financials 

Revenue Growth Accelerating to 40%, Potentially Peak Growth 

WDC delivered fiscal Q2 revenue of $3.02 billion, up 25% YoY and 7% QoQ, although this marked a deceleration from 27% YoY and 8% QoQ in Q1. Management said this was driven by strong demand for its higher capacity nearline drives.  

Exabyte shipments rose 22% YoY and 5% QoQ to 215 EB, including 103 EB from its ePMR product line on 3.5 million shipments. Revenues are closely correlated with EB shipments with pricing contributing only a 2-3 points of upside.  

Looking ahead to FQ3, WDC guided for revenue of $3.2 billion at midpoint, representing an acceleration to 40% YoY growth, up 15 points, while QoQ growth would tick slightly higher to 6.1%. Current estimates suggest WDC will close out the fiscal year with $3.44 billion in revenue in Q4, up 32% YoY and another 7.5% QoQ. At present, this would suggest that fiscal Q3’s YoY acceleration to 40% would be the company’s peak growth quarter moving through calendar 2026. 

For FY26 ending in June, revenue is expected to increase 31% to $12.47 billion, while an initial look at FY27 points to 25.6% growth to $15.66 billion in revenue. This is above WDC’s long-term revenue growth model for >20% growth CAGR over the next three to five years.  

Key Segments 

Similar to Seagate, WDC sees the large majority of its revenue go to Cloud customers, with minimal exposure to Client and Consumer end markets. 

Cloud revenue was $2.67 billion in Q2, up 27.5% YoY and 6.5% QoQ, decelerating from 31.5% YoY and 7.8% QoQ in Q1. Management noted that they are seeing strong demand from hyperscaler customers. Cloud accounted for 89% of revenue in the quarter.  

Assuming similar Cloud mix at 89% in fiscal Q3, though there is potential for slight mix gains on seasonality in its other two end markets, Cloud revenue would be implied at roughly ~$2.85 billion, up 6.5% QoQ and 41.9% YoY. 

WDC’s Client segment represented 6% of revenue at $176 million, up 26% YoY, while Consumer accounted for 5% of revenue at $168 million, declining (3%) YoY. 

Strong Margin Expansion 

As discussed above, WDC is seeing strong gross margin expansion with multiple levers available, and this margin expansion is flowing down the line.  

GAAP gross margin was 45.7% in Q2, up 8 points YoY and 2.2 points QOQ, while adjusted gross margin was 46.1%, up 7.7 points YoY and 2.2 points QoQ. For Q3, adjusted gross margin is expected to be 47.5% at midpoint, up 7.4 points YoY and 1.4 points QoQ.  

GAAP operating margin was 30.1%, up 6.9 points YoY and 2 points QoQ, while adjusted operating margin was 33.8%, up 9.3 points YoY and 3.4 points QoQ. Adjusted operating margin is implied to be 35.5% in Q3, up 9.5 points YoY and 1.7 points QoQ, showing a slight degree of operating leverage.  

GAAP net margin was 59.7% as WDC benefited from a more than $1 billion gain on its 7.5 million share stake in SanDisk, which it has now sold for nearly $3.2 billion to help reduce debt. Adjusted net margin was 26.7%, up 9.3 points YoY and 3.5 points QoQ. 

For a quick view on how current margins stack up to WDC’s long-term model, it expects adjusted gross and operating margins to surpass 50%/40% over the next three to five years, or roughly three to five points of expansion.  

EPS Growth Robust but Decelerating 

Driven by the margin expansion, WDC is seeing strong EPS growth, though growth is expected to largely decelerate moving through the year. 

GAAP EPS was $4.73, up 54% QoQ and 272% YoY, again driven by the gain on its SanDisk stake. Adjusted EPS was $2.13, up 78% YoY and 20% QoQ, beating estimates for $1.98. 

For Q3, adjusted EPS was guided to be $2.30, +/- $0.15, up 69% YoY and 8% QoQ at midpoint. Adjusted EPS growth is expected to decelerate further to 61% YoY in FQ4, and slow to 50% by the end of FY27. 

For FY26, WDC is expected to report adjusted EPS growth of nearly 80% YoY to $8.85, with another 52% to $13.46; despite the deceleration on the quarterly view, it should be noted that this EPS growth rate is still quite strong compared to the base it is growing from. Under the long-term model, management expects EPS to surpass $20. 

Cash and Balance Sheet 

Cash flow margins also showed strong expansion, and while debt does look inflated, WDC’s sale of its SanDisk stake is meaningfully improving its debt profile. Management explained at Innovation Day that “if you look at the revenue growth that we've delivered over the last 12 months, the margin appreciation, ultimately, what is done is to translate into very strong free cash flow. And in the last 2 quarters, we returned 100% of the free cash flow that we've generated. And we also were able to bring our net leverage well below the 1 to 1.5x that we laid out last year.” 

Operating cash flow was $745 million in Q2 for a 24.7% margin, up from 16.9% a year ago and 23.8% in Q1. Free cash flow was $653 million for a 21.6% margin, up from 13.9% a year ago and 21.3% in Q3. 

As of Q2, WDC reported cash of $1.98 billion and debt of $4.65 billion, though it already has redeemed $1 billion in its 2029 and 2032 senior notes following the stake sale. 

Inventories were $1.35 billion, down marginally from $1.39 billion in Q1. 

Conclusion 

Western Digital has emerged as one of the top AI winners over the past year with a 591% return, with the company getting added to the NASDAQ-100 index in December of 2025.  

Looking ahead to 2026, Western Digital is already sold out of capacity with set price and volume commitments, with visibility from key hyperscaler customers extending into 2027 and 2028. WDC also has been excelling at driving strong margin expansion with a handful of key levers at its disposal.  

Over the next few years, WDC is leveraging its technological expertise and several new innovations such as HBDT and DPT to drive significant performance gains on the path to 100TB capacity. WDC is also expecting to quickly take the lead in higher-capacity HAMR drives versus key competitor Seagate, potentially giving it a key advantage by the turn of the decade in meeting AI-driven data storage demand.

Damien Robbins, Equity Analyst at I/O Fund contributed to this analysis.

Please note: The I/O Fund conducts research and draws conclusions for the Fund’s positions. We then share that information with our readers. This is not a guarantee of a stock’s performance. Please consult your personal financial advisor before buying any stock in the companies mentioned in this analysis.

Recommended Reading:
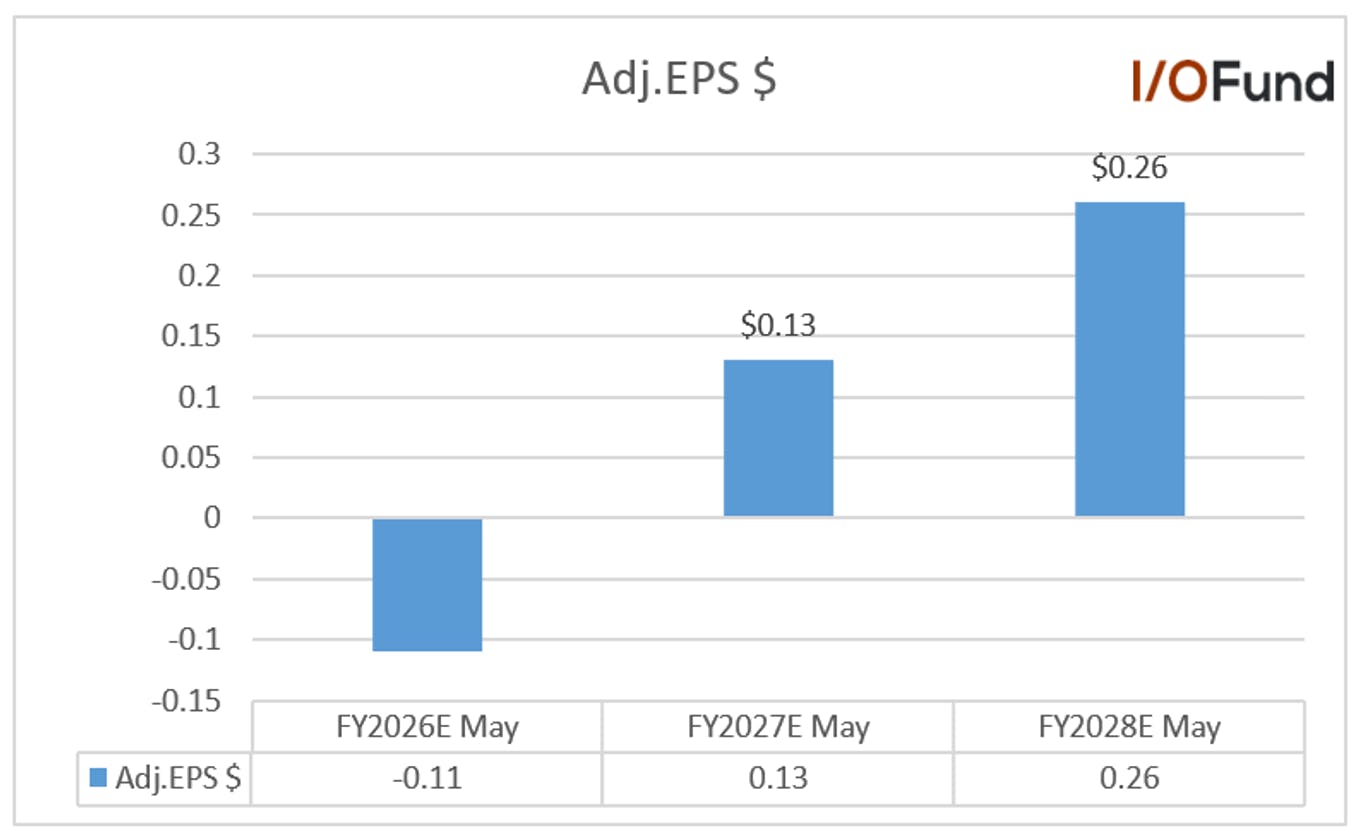
Nvidia Stock Prediction: The Path to a $20 Trillion Market Cap is Strengthening

Last week at GTC, Jensen Huang stated that Nvidia has a path to $1 trillion in cumulative sales across the Blackwell and Rubin generations from 2025 through 2027. If you follow Nvidia’s stock closely, this isn’t new information; rather it’s roughly aligned with what analyst forecasts already had baked in. 

The distinction is crucial for investors as separating what’s already priced in from what can make a meaningful difference in stock returns. The latter typically offers alpha, while the other potentially sets up an investor for losses (hence the saying: “buy the rumor, sell the news”buy the rumor, sell the news”). 
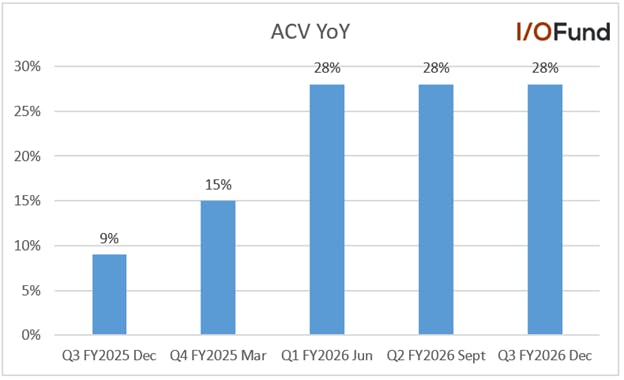
The math for Nvidia to see $1 Trillion in Revenue was already there. 

We must go back to October to more fully understand why the statement that Nvidia has visibility to $1 trillion in revenue through 2027 is anti-climactic.  

Last October, Huang stated that the combined revenue from Blackwell and Rubin was an estimated $500 billion through the end of 2026. Our firm modeled something similar nearly two years earlier, when my original Nvidia $10 trillion market cap thesis was published, stating we would see a $320 billion data center segment in 2026 (FY2027).  

Beth Kindig of the I/O Fund first laid out the case for Nvidia reaching a $10 trillion market cap in June 2024 — a view Jensen Huang later expressed publicly in March 2026 nearly two years later. 

Blackwell revenue was $184 billion in 2025 when you combine compute and networking, along with the $320 billion expected in 2026, comes out to the $500 billion quoted at GTC in October. This means our model proved correct roughly 16 months before the CEO confirmed it. When I first made the $320 billion data center prediction in June 2024, it resulted in 56% upside, versus a 15% decline by the time the CEO effectively confirmed the thesis in October 2025.  

Being early can pay off at many points along a stock’s trajectory. Of course, this is modest compared to the I/O Fund getting ahead of the Street on Nvidia in 2018–2019, which led to returns of more than 4,000%. But each milestone still matters when you’re talking about one of the world’s most valuable companies, as generating outsized returns becomes far more difficult at this stage. 

Now consider the trajectory to $1 trillion laid out by Huang. Bridging from $500 billion (approximately $184 billion in 2025 and $320 billion in 2026) to $1 trillion implies about $500 billion in CY2027, or about 54% year-over-year growth for about $125B a quarter.  

The Street had largely modeled this in, with FY28 (CY27) quarters at $114B, $119B, $125.5B, and $132B for a total of $490.5B for the fiscal year ending in January.  

In other words, there was not much alpha in the comment, which helps explain why the stock didn’t move much from the “blockbuster” $1 trillion comment. 

Table of Nvidia’s projected revenue from FY2027 to FY2036 with YoY growth and 1‑, 3‑, and 6‑month analyst trend revisions, rising from $369B to $1.22T.

Chart showing Nvidia’s long‑term revenue forecast for FY2027–FY2031, including annual estimates, year‑over‑year growth, and multi‑period trend revisions that highlight consistently rising analyst expectations.

On the heels of the $1 trillion cumulative revenue comment, Huang publicly stated this week on a podcast that he sees a path to a $10 trillion market cap for Nvidia.  

This is the exact thesis I first published in June of 2024 in the article “Here’s Why Nvidia Stock Will Reach $10 Trillion Market Cap by 2030,

“Nvidia has a market cap of $3 trillion today. We believe Nvidia will reach a $10 trillion market cap by 2030 or sooner through a rapid product road map, it’s impenetrable moat from the CUDA software platform, and due to being an AI systems company that provides components well beyond GPUs, including networking and software platforms.” 

Admittedly, 16 months later, that is no longer a contrarian call. Once the CEO goes on record with a number like that, it’s a sign the $10 trillion market cap narrative is transitioning from offering alpha to becoming increasingly priced in.

mid

Which is exactly why I pushed the thesis further out, publishing a new article last November that Nvidia has a path to end the decade with a $20 trillion market cap. 

How Nvidia Gets to $20 Trillion. 

The $20 trillion market cap will not come from GPU unit growth alone, though unit growth remains very important. Rather, the value proposition will increasingly focus on economic output. This marks a tremendous shift for how Nvidia is evaluated. 

As the AI market shifts toward inference, Nvidia’s product cycles will be optimized around token economics such as throughput, latency, power efficiency and cost per token. The goal is no longer to simply sell faster and more powerful chips, but to deliver superior economic value at the system level relative to custom silicon (in other words, let the battle begin).  

Leading up to this, Nvidia was competing on performance metrics, and MLPerf benchmarks still matter of course. But going forward, workload economics and system-level efficiency will play a much larger role in how their systems are evaluated. 

Historical Mispricing — How Analysts Missed Nvidia by 4X 

Nvidia’s stock price is highly dependent on upward revisions – more so than any company that I can recall. To put it plainly, Wall Street’s estimates have consistently underestimated this company, and this gap is critical for where investors can continue to find an edge. 

Three quarters after Nvidia’s breakout earnings report in May of 2023, analysts had eight months to price in the AI trade. Consensus for the fiscal year ending in 2028 was set at $138.3 billion. Today, that same estimate stands at $480 billion.  

Further out, the error widens with Jan 2031 estimates of $208 billion versus where they are today at $757.6 billion or nearly 4X higher. 

Line chart showing Nvidia stock long‑term revenue estimate revisions rising sharply from 2018 to 2026.

Chart showing Nvidia’s consensus revenue revision trend from 2018 to 2026, highlighting steady upward revisions for FY2027–2032. Key estimates—such as $369.42B for FY2027, $479.97B for FY2028, and $757.63B for FY2031—have climbed sharply, reflecting rising expectations for Nvidia’s AI, data center, and accelerator demand. The sustained increase in long‑term forecasts reinforces bullish sentiment around Nvidia stock and its multi‑trillion‑dollar market cap outlook. and its multi‑trillion‑dollar market cap outlook.

Only One Year Ago, Nvidia Revenue Estimates Were Far Too Low 

If we repeat this exercise and look back exactly a year ago, we will see that analysts continue to miss the target. Just one year ago, the fiscal year ending January 2028 was expected to see revenue of $294 billion. Today, consensus is at $480 billion. All else equal; those revisions could potentially represent alpha of 63%.  

If you look at FY2031, estimates were $343.5 billion compared to $757.6 billion – meaning analyst estimates were off by 2X from where they are today. 

Line chart showing Nvidia stock revenue estimate revisions rising from 2018 to 2026 for FY2027–2032.

Chart showing Nvidia stock revenue revision trends from 2018–2026, highlighting steadily rising analyst estimates for FY2027 through FY2032 as expectations for Nvidia’s AI and data center growth continue to increase.

How This Ties into Nvidia Reaching a $20 Trillion Market Cap by 2030 

My $20 trillion market cap thesis for Nvidia is grounded in certain assumptions, primarily that Nvidia reaches $930 billion in data center revenue in a single year prior to the close of the decade combined with a price-to-sales ratio of 22X – a few points below the stock’s 3-year median P/S of 28X.  

Right now, analyst estimates sit at $757 billion for the fiscal year ending January 2031. However, given the estimates have doubled in the past year alone, the 23% difference in estimates compared to my firm’s base case of $1 trillion seems achievable. 

As I recently emphasized in an interview with Bloomberg Asia, analysts revising estimates intra-quarter is one of the most important catalysts for this stock. 

What’s Pressuring Nvidia’s Valuation in 2026 

Despite odds favoring Nvidia ending the decade at $930 billion or more in annual revenue, the more pressing issue is valuation. The stock has been trading at a significant discount to its historical valuation, yet buyers are not stepping in. Meanwhile, Broadcom is trading right well above its 3-year median and AMD is two points above its 3-year median. 

Chart comparing P/S ratios and 3‑year median P/S ratios for Nvidia, AMD, and Broadcom from 2023 to 2026.

Chart comparing Nvidia, AMD, and Broadcom P/S ratios and 3‑year median P/S ratios from 2023–2026, showing Nvidia trading below its historical valuation while Broadcom and AMD remain closer to their 3‑year medians.

Source: YCharts 

I’ve heard some outlandish theories about this disconnect, but I believe the reason Nvidia is seeing a weaker valuation is fairly straightforward: the inference market offers immense opportunity for Nvidia yet is expected to lower Nvidia’s overall percentage of the AI accelerator market. Yes, this means Nvidia’s near-monopoly is set to end. 

I’ve covered this dynamic in detail in my Broadcom stock analysis here and and AMD stock analysis here.Broadcom stock analysis here and and AMD stock analysis here. 

According to TrendForce, custom silicon represents 20.9% of the market in 2025 yet is expected to expand to 27.8% of the market in 2026. Adding to the competitive pressure, AMD is expected to release Helios MI400s in the second half of 2026, which could further eat into Nvidia’s GPU market share, adding to the pressure of custom chips gaining 7 points with architectures like Google’s TPUs. 

Stacked bar chart showing global AI server shipment share by accelerator type—GPU, FPGA, and custom silicon—from 2023 to 2026.

Chart showing global AI server shipment share by accelerator type from 2023 to 2026, based on TrendForce data. GPUs remain dominant, while custom silicon grows from 20.9% of the market in 2025 to a projected 27.8% in 2026, highlighting accelerating adoption of ASIC‑based AI infrastructure.

Nvidia Versus Custom Silicon is Overly Simplistic 

The assumption that losing AI accelerator market share should result in a lower valuation is overly simplistic for four reasons. 

Capex Growth Expands the Entire AI Accelerator Market: The first reason is that capex is the primary multiplier. Because capex continues to grow the overall pie, the market will expand faster than any single architecture can absorb. Compute demand is compounding; a shrinking slice of a rapidly growing pie can still mean explosive revenue growth. 

GPUs Remain the Most Flexible Architecture for New Workloads: The second reason is that GPUs remain the default when workloads change. The versatility of GPUs is a competitive advantage as Big Tech does not always know what next quarter or next year will bring. Consider too that custom silicon is not only inflexible yet takes years to design. When a new model architecture emerges or workloads shift, GPUs step up in ways that custom silicon can’t. For example, during the reasoning model era, architectural breakthroughs such as OpenAI releasing o1 and DeepSeek releasing R1 required significantly more compute at inference. Custom silicon is a better choice when workloads are stable versus rapidly evolving like we saw with reasoning models and inference-time scaling.

Nvidia Monetizes at the System‑Level: Nvidia is monetizing the system rather than just the chips, evidenced by the explosive networking growth of 263% this past quarter. On that note, speaking of Broadcom, Nvidia’s management team stated that Nvidia is now the world’s largest Ethernet company, overtaking former Ethernet giant Broadcom, and this was accomplished in just a few years’ time.  

Fourth – and most importantly, the value of what Nvidia offers is rapidly shifting from raw compute to token economics. If Nvidia continues to lead in performance per watt and performance per rack, its premium valuation can persist. Big Tech will prioritize unit economics, which means if Nvidia’s systems cost 2-3X more, the goal will be to produce more tokens per watt than the alternative to offset the premium. 

This point is critical for how Nvidia plans to defend its positioning over the next few years.  When token volume scales 10X, 100X or even 1000X, Nvidia’s ability to sell more units increases, along with the platform of more networking, more software and more tooling. 

In that framework, it will be less about which systems cost $40,000 versus $15,000 and more about which platform delivers better economics at scale. 

The Market Is Not Pricing in Nvidia’s Inference Opportunity 

Last week, in the article “Nvidia Stock to See New Growth Catalyst; 35X Faster AI with Groq 3 LPX, I argued that the $1 trillion revenue comment through 2027 wasn’t the headline. The real development was the new Groq 3 LPX racks delivering up to 35X higher throughput per megawatt. 

Why the Groq 3 LPX Integration Is a Major Catalyst 

The 256-chip LPX rack introduces Groq’s unique SRAM‑based architecture that allows Nvidia to offload decode‑phase workloads and massively increase token throughput. This primarily targets trillion‑parameter LLMs, million-token context, and multi‑agent systems, which are bottlenecked less by compute and more by how efficiently a system can move data and generate tokens. Paired with the new Vera Rubin GPUs, Nvidia claims this architecture can deliver up to 35X higher throughput per megawatt, with seamless integration into Vera Rubin deployments.   

The Groq acquisition is aimed to solve the limiter of inference throughput per watt, where memory bandwidth can become the gating factor to token output and cost. Nvidia is preparing to position its GPUs to be among the best inference options available, utilizing Groq’s unique SRAM-based architecture to significantly turbocharge token throughput and accelerate inference performance.   

Nvidia expects Groq will help drive up to a 15X increase in tokens per second, directly translating into higher tokens per megawatt, which is already scaling by a factor of 10X between Blackwell and Rubin. If these claims hold true, then cheaper inference will unlock more usage, and more usage should lead to higher revenue and higher profits as the AI monetization wave plays out. 

Nvidia is positioning its new Groq 3 LPX racks as a ‘token accelerator’ functioning in tandem with Vera Rubin GPUs to significantly boost token throughput and address the upcoming multi-agent future. The Groq LPUs are not meant to replace GPUs in inference workloads, but rather compliment them by optimizing for memory-intensive decode.   

Off the bat, Nvidia expects that combining Rubin GPUs and Groq racks will drive a substantial increase in token throughput, with Nvidia VP Ian Buck claiming the combination “moves us from a world where 100 tokens per second is a reasonable throughput to one of 1500 TPS or more for AI agent intercommunication.”   

To visualize this, anything over 100 TPS feels near-instantaneous, such as for chatbot users; in other terms, this would represent 1,500 words per second, or ~275X the average human reading speed. This distinction and shift from 100 TPS to 1,500+ TPS is more important than it might appear, as 100 TPS is optimized for human consumption, such as chatbot outputs, while 1,500 TPS is optimal for machine consumption, such as multi-agent communication, autonomous long-form reasoning and real-time AI systems that all require continuous, low-latency token generation.  

Rubin + Groq Racks and the $300B Annual Revenue Opportunity 

The introduction of the Groq LPUs as the seventh chip in Rubin’s co-design also represents a natural shift in Nvidia’s rack scale strategy that may help deepen its moat, where it disaggregates compute and bandwidth via different specialized architectures to optimize inference at the rack and system rather than chip level. Nvidia is moving quickly with the new combined infrastructure, with Groq chips in volume production at Samsung and CEO Jensen Huang saying they would be shipping around the Q3 timeframe.  

 Nvidia foresees a rather large opportunity from this new integration, with CEO Jensen Huang explaining at GTC that he believes the Groq racks could account for up to 25% of a data center footprint to extend the performance and value of Vera Rubin, as well as future chips. Overall, Huang added that combining Vera Rubin with the Groq LPX racks could unlock a $300 billion annual revenue opportunity for customers.   

While some analysts had cautioned that reaching the upper end of this would depend on buyer appetite and ‘ultra-premium’ tiers such as up to $150 per million tokens (nearly ~10X of GPT 5.4’s cost), the scale of the opportunity reflects Nvidia's belief that inference-optimized rack-level systems will become a key part of future AI infrastructure buildouts. 

Read more about the importance of the Groq 3 LPX racks and why the acquisition represents an important catalyst for the Nvidia’s stock. an important catalyst for the Nvidia’s stock.  

Nvidia Stock Broke Minor Support at $176 

Quick note on pricing: 
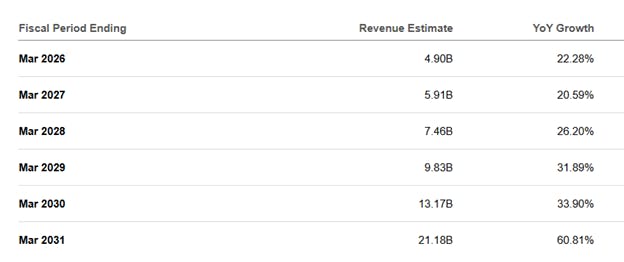
Nvidia topped in late October 2025, which was one of several occurrences that signaled growing weakness in the broader market. Since then, we have seen numerous large block trades hit Nvidia’s price while in this consolidation zone. This implies larger institutions are either accumulating a big move higher or distributing before another bout of volatility hits. 

Nvidia daily stock chart showing support levels, Fibonacci targets, and wave counts.

Chart showing Nvidia’s daily price action with key support near $170, Fibonacci extension targets, and Elliott Wave counts highlighting potential breakout and downside levels.

Nvidia is barely holding the lower end of this consolidation zone, and even broke minor support at $176. This is not ideal; however, final support is $170. Below this zone, and we would likely see Nvidia move toward the $155 – $135 region. If Nvidia can instead break over $200, then it would strongly suggest that it is setting up for the next leg higher.  

Conclusion: 
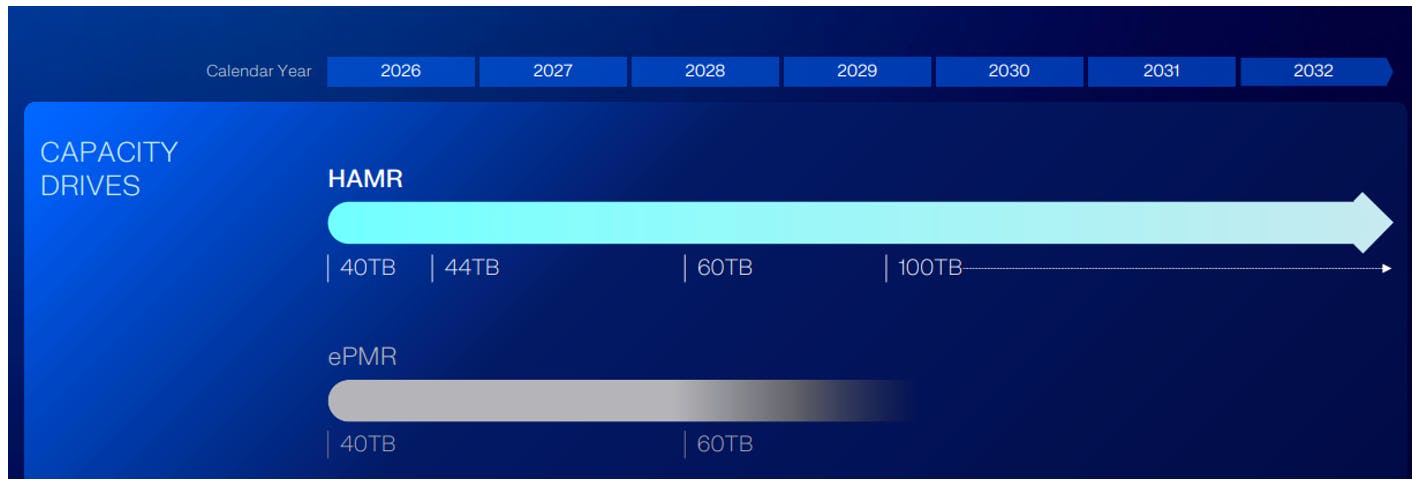
As discussed, analysts had difficulty pricing in the training market while it was in motion despite a clear product roadmap of the incoming GPU generations. Based on the history of analyst estimates being up to 4X too low 5-years out and 2X too low 1-year out for the training market opportunity, the chances that Nvidia’s inference opportunity is correctly priced in is fairly low in my opinion. This is especially true at this moment in time because inference has not made a dent yet on the return on capital for Big Tech companies. Furthermore, Groq is a recent acquisition and its impact on Nvidia’s revenue trajectory is not fully modeled yet.  

That is not to say that current estimates are 4X too low, but rather that the 23% gap between current estimates of $757 billion and the $930 billion gets closed is a reasonable assumption. It’s also reasonable that if Nvidia can prove strong execution in the inference market, the company will make a case for its premium valuation again. 

The I/O Fund’s portfolio is on fire this year with a lesser-known AI semiconductor stock up 170%+ YTD and another lesser-known AI semiconductor stock up 90%+ YTD. We are the team that predicted Nvidia would become the world’s most valuable company in 2019 – years before Street consensus, and we have dominated the AI trade in recent years.170%+ YTD and another lesser-known AI semiconductor stock up 90%+ YTD. We are the team that predicted Nvidia would become the world’s most valuable company in 2019 – years before Street consensus, and we have dominated the AI trade in recent years. 

In fact, our high-performing tech portfolio with cumulative returns of 326%, which would place us as #1 if we were a hedge fund and #3 if we were a tech ETF or mutual fund. To get a 60-page analysis on our Top 15 AI Stocks, sign up now.326%, which would place us as #1 if we were a hedge fund and #3 if we were a tech ETF or mutual fund. To get a 60-page analysis on our Top 15 AI Stocks, sign up now.

Please note: The I/O Fund conducts research and draws conclusions for the company’s portfolio. We then share that information with our readers and offer real-time trade notifications. This is not a guarantee of a stock’s performance and it is not financial advice. Please consult your personal financial advisor before buying any stock in the companies mentioned in this analysis. Beth Kindig and the I/O Fund own shares in NVDA at the time of writing and may own stocks pictured in the charts.

Recommended Reading: