The video below was originally recorded on August 8th 2022. You can view the full clip here.view the full clip here.
Last August, Nvidia had a $2.5 billion revenue miss due to gaming and crypto mining related weakness. This caused the stock to selloff (8%) in one day. Many pundits were questioning if Nvidia could overcome the gaming segment weakness given Ethereum’s Merge to Proof of Stake would permanently reduce demand for gaming GPUs.
Charles Payne of Fox Business News asks Beth Kindig of I/O Fund if she still plans to hold the stock given the crypto mining surprise.
Her answer is fairly simple: “It’s a tough day for Nvidia investors but in the long run it’s not going to matter. We hold the stock for its lead in artificial intelligence. Anything outside of that thesis is not important to us. To be contrarian, data center is going to be up 61%, so for AI investors such as myself, we are right on track.”
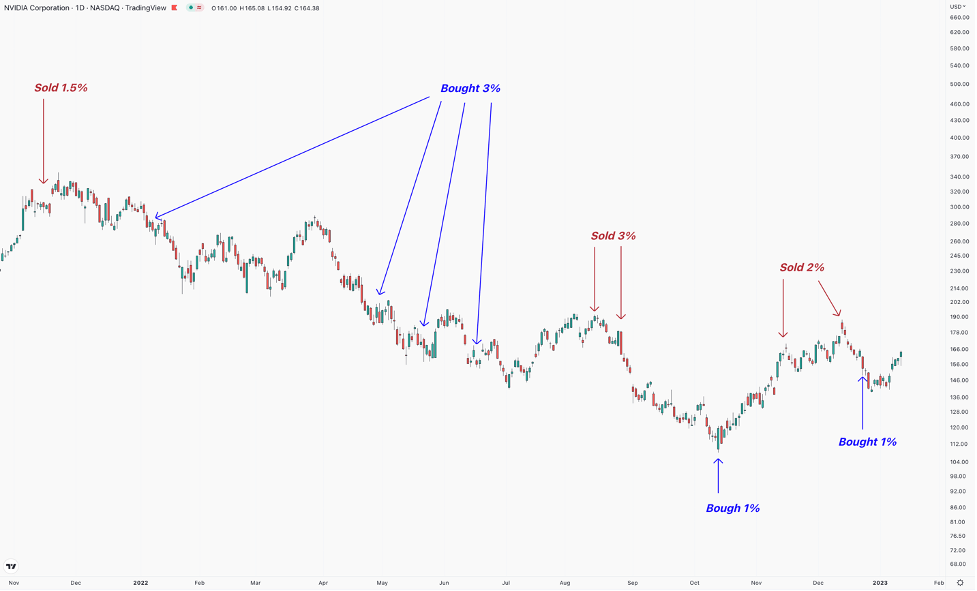
Below is the I/O Fund trading history on Nvidia which shows why it’s important to have conviction in tech stocks. Due to having this conviction, the I/O Fund bought Nvidia at the low in October at exactly $108 with a real-time trade alert sent to their research customers.
This article was originally published on Forbes on Feb 17, 2023,01:18am ESTForbes on Feb 17, 2023,01:18am EST
Earlier this month, Google’s stock (Alphabet) tumbled 7% when chatbot Bard was unable to complete a search with 100% accuracy. During a demonstration, Bard returned incorrect information about which telescope was the first to take pictures of a planet outside the Earth’s solar system. This was a minor mistake given how far large language models and generative AI has come, rather it was the timing that was a bit flawed as OpenAI’s ChatGPT, the chatbot powering competitor Microsoft Bing, had been dominating headlines since its November 30th launch.
Microsoft, being an opportunist, took it a step further and announced Bing would now be powered by a faster and more accurate version of GPT-3.5 one day after Bard’s failed demonstration: “We’re excited to announce the new Bing is running on a new, next-generation OpenAI large language model that is more powerful than ChatGPT and customized specifically for search. It takes key learnings and advancements from ChatGPT and GPT-3.5 – and it is even faster, more accurate and more capable.”
Both companies have been preparing for this moment for many years. Microsoft invested $1 billion into OpenAI a few years ago with a new $10 billion round announced last month. Meanwhile, Google acquired DeepMind in 2014. Google also previously developed conversational neural language models such as LaMDA, which is used by Google’s Bard for its conversational AI technology.
As much fun as the media has had lately poking fun of Bard, there have been similar, compelling reports of ChatGPT-powered Bing also having accuracy issues.
Point being, both are in the early stages and mistakes are being blown out of proportion. Which brings up more important questions for investors – given that technology can require many iterations, what’s the right timing for generative AI and chatbots to drive real advertising revenue?
Investors can get burned by being too early. For example, autonomous vehicles (AVs) were promised in 2019, and the Metaverse has not driven any real gains despite a large media push in early 2021. How does AI compare in terms of time to market?
Secondly, Alphabet has a lot of turf to defend. It won’t only be Bing, but also browsers like Opera that will incorporate ChatGPT into its sidebar. From there, it’s easy to imagine other competitors may crop up over time, some replacing search engines entirely with conversational AI applications powered by speech recognition, which are otherwise unimaginable today.
We look at these key points below for a 360-degree view on Google’s stock given search is on the precipice of its first major shift in over two decades.
Background on AI-Powered Search
“AI is the most profound technology we are working on today. Our talented researchers, infrastructure and technology make us extremely well positioned, as AI reaches an inflection point.” -Sundar Pichai, Alphabet’s Q4 earnings call.Q4 earnings call.
Despite the mishap with Bard, it would be a human-generated mistake to think Alphabet does not command a place of leadership right now in generative AI. Alphabet was one of the first tech companies to focus and invest on AI and natural language processing (NLP). We pointed out to our premium research members in July of 2022 that ChatGPT is based on transformer architecture that Google initially introduced in 2017 when we saidpremium research members in July of 2022 that ChatGPT is based on transformer architecture that Google initially introduced in 2017 when we said:
“Transformers are becoming one of the most popular neural-network models by applying self-attention to detect how data elements in a series influence and depend on one another.
Sequential text, images and video data are used for self-supervised learning and pattern recognition, which results in more data being used to create better models. Prior to transformer models, labeled datasets had to be used to train neural networks.
Transformer models eliminate this need by finding patterns between elements mathematically, which substantially opens up what datasets can be used and how quickly.
Google first introduced transformer models in 2017 and transformers are used in Google and Bing Search. Transformers also led to BERT models, which stands for Bidirectional Encoder Representations from Transformers, and is commonly used for text sequences. Transformers are also used in GPT-3 (it’s the T in GPT) which improved from 1.5 billion parameters to 175 billion parameters. GPT-3 has the ability to report on queries it has not been specifically trained on.”
Earlier this month, Google’s CEO, Sundar Pichai, gently reminded the AI community of how cutting edge Google’s research is when he stated, “Transformer research project and our field-defining paper in 2017, as well as our important advances in diffusion models, are now the basis of many of the generative AI applications you're starting to see today.”
BERT was designed to help Google better understand search intent, as despite billions of searches every day, about 15% of those searches are for brand new terms. This prompted Google engineers to develop a model that could self-learn.
The result is that searches results are more accurate by taking into consideration the nuances of language.
Sign up for I/O Fund's free newsletter with gains of up to 221% -Click hereSign up for I/O Fund's free newsletter with gains of up to 221% -Click hereClick here
Multitask Unified Models (MUMs) are 1,000X More Powerful than BERT
Multitask Unified Models (MUM) were introduced in 2021 to further address conversational nuances and is 1,000 times more powerful than BERT. MUMs will have a large impact for search users as it decreases the amount of effort put into seeking the desired information. It’s not only addressing the 15% of search based on new terms, rather it’s a powerful iteration that returns search results that more closely resemble how humans interact.
According to Google, it takes an average of eight queries to answer a complex question. With MUM, this is reduced to one query. You can theoretically ask “should I travel to Hawaii or California this Fall?” and MUM will be able to compare travel rates and weather patterns to answer this question with more depth. Similar to if you ask your friend this question, they might answer “Hawaii is more expensive to travel to but California is prone to wildfires in the Fall, so I would go to Hawaii.” To search for this answer would take many queries, but with MUM, succinct, human-like responses are provided in only one interaction.
Large language models have been helping to improve search results for many years. Therein, Google presents its moat; which is not only a deeply engrained behaviour pattern where search users automatically turn to the multi-decade leader out of pure habit, but that Google search truly presents the highest quality search results today.
Google’s commanding lead on search is not a legacy metric, by any means, rather it symbolizes the lead Google has on data for training large language models.
Bard’s demonstration may have been problematic compared to Chat-GPTs more favorable reviews, however, it’s nothing more than that for now —- which is a mix of bad reviews and good reviews by a limited number of beta users.
TPUs:
This brings us to Google’s TPUs, which are essentially ASICs (application specific integrated circuit) on the efficiency/flexibility spectrum. I first covered the differences between TPUs and GPUs nearly four years ago in 2019 for our premium members when I said:first covered the differences between TPUs and GPUs nearly four years ago in 2019 for our premium members when I said:
“TensorFlow is rising in popularity as a machine learning framework and TPUs primarily run TensorFlow models. This is one of Google’s more successful experiments. They are cheaper and use less power than GPUs and are specifically focused on machine learning.
TPUs train and run machine learning models and power Google Translate, Photos, Search, Assistant and Gmail – i.e., image recognition, language translation, speech recognition and image generation.”
Although there are ongoing debates between TPUs and GPUs, the primary difference is that TPUs are application specific and have been optimized for Google’s AI tools. Meanwhile, Nvidia was the first to break ground in deep learning due to the ease of programming GPUs and the relative speed in which parallel computing can train networks. Nvidia also offers its customers an aggressive product road map.
An example of this is the H100 DGX SuperPods, which we covered for our premium members in July when we said:
“Nvidia and Microsoft recently worked on a Mega transformer model with 530 billion parameters and the future for AI engineers is trillion-parameter transformers and applications. The H100 is already prepping for this. According to Nvidia, the training needs for transformer models will increase 275-fold every two years compared to 8-fold for other models. The H100 GPU with its Transformer Engine supports the FP8 format to speed up training to support trillion-parameter models. This leads to transformer models that go from taking 5 days to train to becoming 6X faster to only taking 19 hours to train.”
As of today, TPUs do not necessarily provide Google an advantage over Microsoft’s partnership with Nvidia. When TPUs were first launched, it was expected that it would provide Google an important lead in launches such as Bard. However, Nvidia has proven to be a more difficult competitor than originally expected, and I imagine Microsoft will not stray from this partnership as the company will instead focus on other areas, such as taking more market share with Bing.
Introduction of Bard powered by LaMDA
LaMDA is a conversational language model that powers Bard. Two years ago, Google launched LaMDA to better mimic open-ended conversations by training the language model on dialogue. The result was a more human-like chatbot that personally knows you well enough to recommend movies or books, is sensitive enough to change an uncomfortable conversation, can discuss its own “death” by being turned off, —- and also has machine vision to where it can look at a picture and discuss the picture intelligibly.
Bard was released this month for beta testers and will be available to the public “in the coming weeks.” As mentioned in the introduction, Bard answers questions with real-time data whereas ChatGPT is trained on data from 2021 or earlier (note: the new Bing version is rumoured to use real-time data, see below).
Bard is also free, and given Google’s search revenue, the company may have incentives to undercut competitors that charge paid plans for conversational AI.
Other ChatGPT alternatives
Anthropic is building a 52-billion-parameter pretrained model called Claude, which is a potential rival to ChatGPT. Google invested $300 million into Anthropic last year, with a similar arrangement as Microsoft and OpenAI, which includes a stake in the R&D of the startup. Anthropic was founded by former employees of OpenAI. Whether Claude can actually exceed Google’s own language systems is yet to be determined, or perhaps Google is simply spreading its bets and wanting access to its competitors’ former talent. Despite being in closed beta, there’s an excellent write-up here about the differences between ChatGPT and Claude.
DeepMind is also not to be underestimated. Google’s sister company is behind many of Google’s AI product integrations to-date. In September of 2022, DeepMind introduced Sparrow which is trained with human feedback, similar to ChatGPT, but will use up-to-date information from a Google-powered internet. DeepMind’s previous release, Chinchilla, was competitive with ChatGPT 3.0 before the more advanced ChatGPT 3.5 was released.
There are many other large language models, such as Google’s PaLM and Microsoft’s Megatron, in the 530 to 540 billion parameters size and also based on Transformer architecture.
Notably, this is not meant to be a comprehensive list rather a sample of the level of innovation occuring in this space.
The I/O Fund has launched a new $99/year Premium Newsletter called "Essentials" — this newsletter delivers premium samples for our readers who want more actionable analysis for their tech portfolios. This month, we released a stock pick that we believe will be a leader in 2023 plus a video with the buy plan.$99/year Premium Newsletter$99/year Premium Newsletter called "Essentials" — this newsletter delivers premium samples for our readers who want more actionable analysis for their tech portfolios. This month, we released a stock pick that we believe will be a leader in 2023 plus a video with the buy planbuy plan.
AI to Drive Advertising Revenues
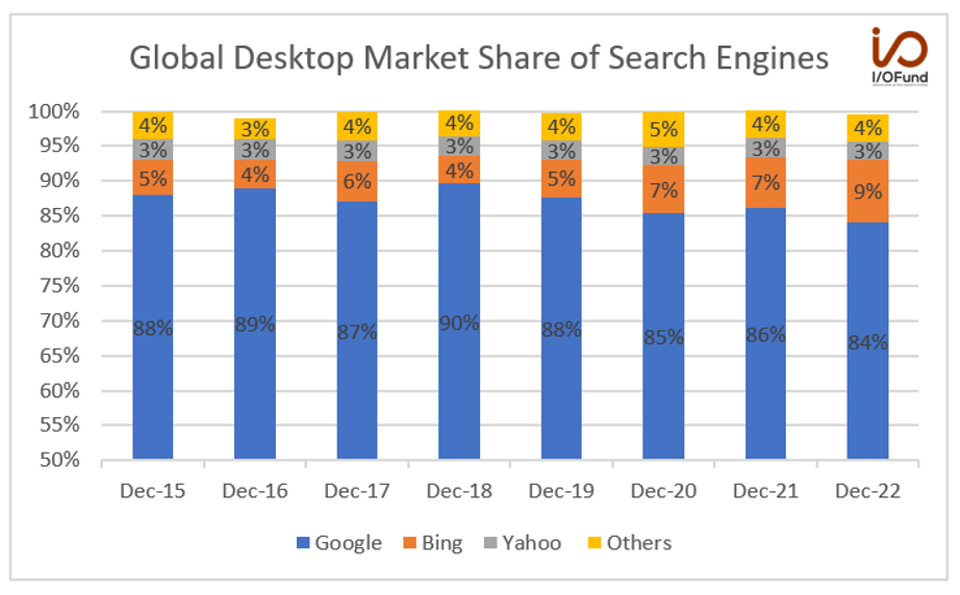
The strength in Search highlights the advantage that having first-party data provides. The company had global desktop market share of 84% in online Search at the end of December 2022, according to data from Statista. Desktop share dropped slightly from 88% at the end of December 2015 to 84% at the end of December 2022. Meanwhile, Microsoft’s Bing share increased from 5% to 9% during this period.
Source: Statista
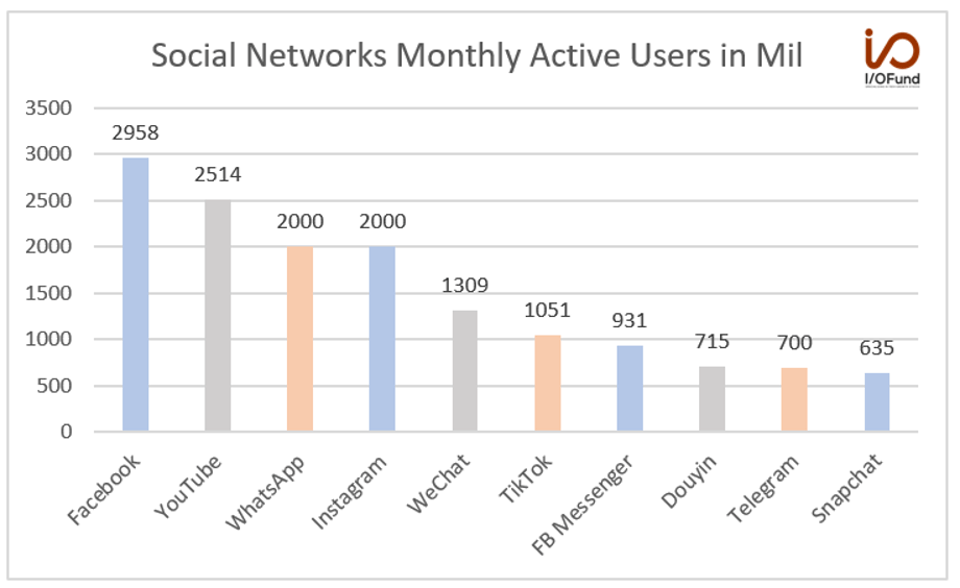
According to data from Statista, YouTube has 2.5 billion monthly active users. It ranks second behind Facebook which has 2.96 billion monthly active users.
Source: Statista
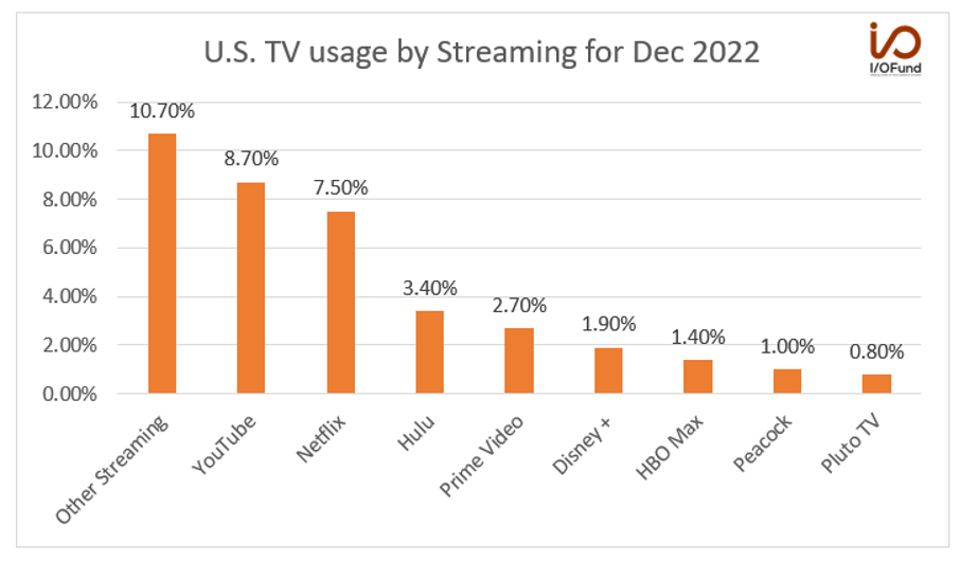
According to the data from Nielsen, the company also has a leadership position in streaming in the U.S. For the month of December 2022, YouTube (including YouTube TV) accounted for 8.7% of TV usage, followed by Netflix with 7.5% and Hulu with 3.4%. With AI, the company is helping advertisers address pain points like frequency and measurement.
Source: Nielsen
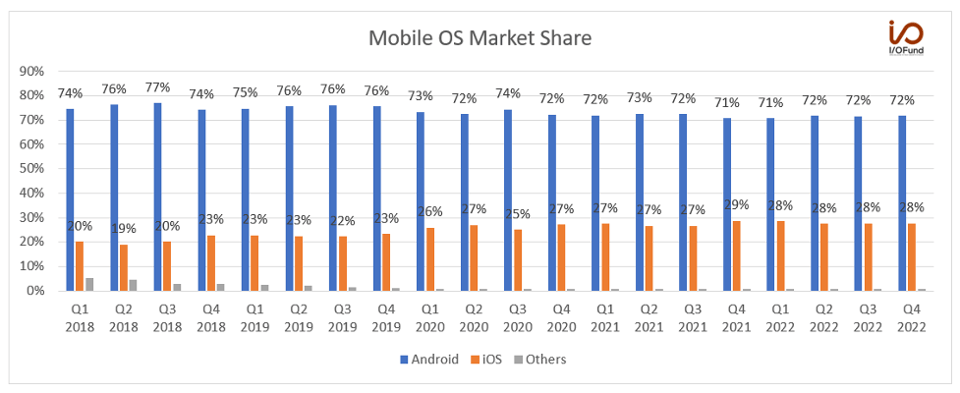
Android has a dominant market share in Mobile Operating Systems. As per the datafrom Statcounter, Android accounted for 71.8% share compared to 27.6% for Apple iOS at the end of Q4 2022. The share for Android has come down marginally from 74.5% in Q1 2018.
Source: STATCOUNTER
This vast amount of first-party data from Chrome and Android can be efficiently used to train complex AI models. A few years ago, I accurately predicted Apple’s IDFA changes would cause problems for advertising companies in an editorial for Forbes:
This is a problem for the ad industry because it goes well beyond personal sentiments and niceties around privacy and slow-moving government regulations and pits tech giant against tech giant in the black box world of ad software, user tracking and engineered loop holes. There is little question who will win as Apple goes up against Google, Facebook and many others. After all, it’s Apple’s device, Apple’s operating system and Apple’s app store. The only question is why this hasn’t happened sooner.
Similarly, Google is a large real estate owner with arguably more data than any other tech company in the world. This advantage cannot be overstated when it comes to training large language models (LLMs). In addition to having a strategic advantage for future development of LLMs with data, Google can offer advertisers instant ROI.
Philipp Schindler, Senior Vice President and Chief Business Officer said in the earnings call, “Going forward, we are focused on growing revenues on top of this higher base through AI-driven innovation.”
This will be accomplished with AI campaigns, such as Performance Max and Smart Bidding. Smart Bidding uses machine learning tools to optimize the bid of the advertisers. ML tools can analyze millions of data signals and can better predict future ad conversions. The further advancement in AI helped to improve the bidding performance in 2022.
Performance Max will replace Smart Shopping Campaigns. Performance Max allows advertisers to access all Google ad channels from a single campaign and uses Smart Bidding to optimize performance by efficiently matching the conversion goals of the advertisers. Advertisers saw a 12% increase in conversion value with Performance Max when compared to Smart Shopping Campaigns. This is a drop in the bucket in terms of what’s likely to follow over the next few years in terms of better ad tools.
Financials
Alphabet’s current revenue growth is one of the lowest in its public history. Last quarter, revenue grew by 1% to $76.05 billion and on constant currency basis grew by 7%. Next quarter, analysts expect revenue to grow 1.1% to $68.78 billion in Q1 2023. From there, the revenue growth is expected to gradually increase.
Google Search revenue was negative (1.6%) YoY to $42.6 billion and YouTube ads revenue was negative (7.8%) YoY on the back of the tough macro environment. Per the earnings call, “In YouTube, we are prioritizing continued growth in Shorts engagement and monetization, while also working on other initiatives across our ad-supported products.”
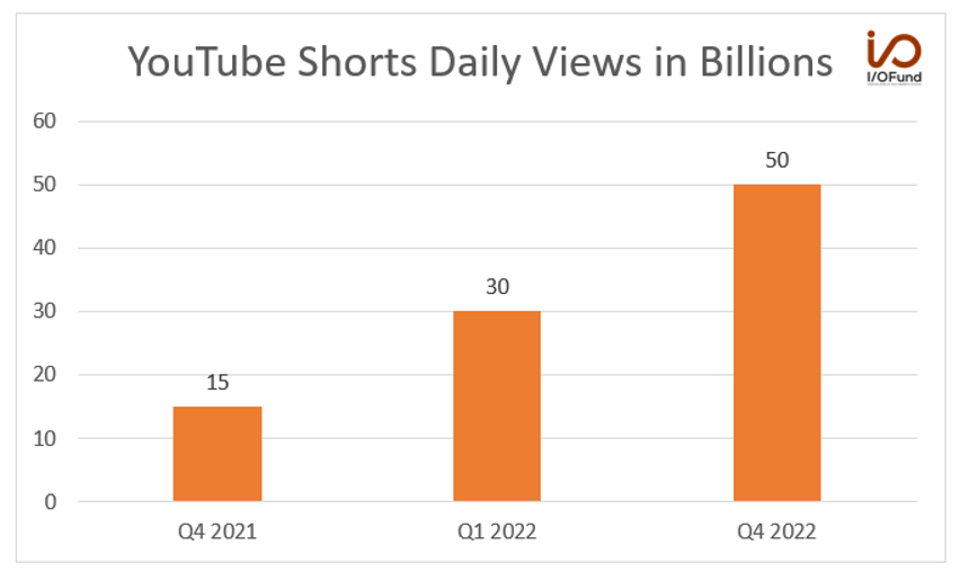
The number of YouTube creators is at an all-time high. This can create a flywheel opportunity as content increases with more creators, which leads to an increase in viewership, which in turn is expected to drive more revenues. In order to reward creators, the company has started revenue sharing with YouTube Shorts, which now averages 50 billion daily views. This is up from 30 billion daily views in Q1 2022.
Google Cloud revenues was up 32% YoY to $7.3 billion. The company is seeing strong momentum from enterprises and governments for digital transformation. Management mentioned in the earnings call, “Google Cloud is making our technological leadership in AI available to customers via our Cloud AI platform, including infrastructure and tools for developers and data scientists like Vertex AI.”
Source: Company IR
In light of the soft revenue, net income declined to $13.6 billion compared to $20.6 billion in the same period last year. EPS was $1.05 and missed estimates by 11.9%. The company also recently announced a reduction of about 12,000 employees to improve long-term profitability
Risks to consider
Microsoft’s investment in OpenAI is an obvious risk with quite a bit of awareness. Google has not faced a similar threat for many decades. Microsoft also recently announced a new version of Bing which is yet to be available to the public. A student named Owen Yin previewed the new Bing before it was shut down. The new version is expected to replace the search bar with a chatbox.
However, you can also search the traditional way by toggling between chat and search in the toolbar. The new Bing is also expected to have access to the real-time data, unlike ChatGPT, which is trained on the data collected through 2021. The new version is expected to provide detailed answers rather than just links to websites. Similarly, the users will be able to chat with the bot regarding their queries and develop a conversation. It is also expected to perform more creative tasks, such as writing an email or a poem.
Opera also plans to integrate ChatGPT with a Shorten button feature, which will provide summaries in the side bar.
Conclusion:
I would not be surprised if we exit 2023 with a reimagined way to use Search Engines. The iteration cycle here is likely to move quickly compared to AVs or the Metaverse, as there are real-world applications where AI can be applied without safety issues (AVs) or friction in terms of user adoption (Metaverse/VR headsets). Instead, the scale has already been built with Search being a viral, daily activity used by nearly every human on earth. AI advancements will simply improve what is already in place.
Cutting-edge chatbots can be quickly deployed on the search engines that already exist, and this is a substantial difference from other overhyped, early-stage technologies. Their accuracy may still need time, but they're probably not too far off from being deemed “reliable enough.”
Investors should expect that AI will become a winner(s)-take-all market. In time, the difference in how search and other applications operate in terms of user experience plus ROI for advertisers will help carve a larger lead.
Secondly, investors should not forget the best innovation comes from the private markets, and even if stock-driven media focuses on Google Versus Microsoft, there will be a few David-versus-Goliaths where the smaller team comes seemingly out of nowhere to win the hearts and minds of consumers with a viral entry on the market. However, back to point number one, look for the Goliaths to court the smaller teams and bring them into the fold rather than compete head-on.
It may be clear that there are some puts and takes with Alphabet, such as search being on the precipice of a multi-decade shift, yet the reality is that ad revenue for the company is flat to declining. Our firm uses a blend of broad market analysis, technicals and fundamentals to time entries, such as when we bought Nvidia at its lowest trading point in October 13th for $108 with a real-time trade alert provided to our Members. Our process helps to reduce risk around stocks and find strong entries. Nvidia is up 100% from that recent entry. Our firm will do something similar with Alphabet, as we believe there is a further drawdown in its future. We hold weekly webinars on Thursdays at market close to go over the exact levels we plan to enter stocks. You can learn more here.
Royston Roche, Equity Analyst at the I/O Fund, contributed to this article.
Please note: The I/O Fund conducts research and draws conclusions for the Fund’s positions. We then share that information with our readers. This is not a guarantee of a stock’s performance. Please consult your personal financial advisor before buying any stock in the companies mentioned in this analysis.
For reference to terminology used, please look at technical analysis under our resources section here. Regarding the charts below, the vertical tan shades represent time factors. These are inflection points where we have high odds of something significant happening. More times than not, (3/4 of the time), they mark a turning point in the trend. So, what matters is the direction we are trending into these periods. Regarding the vertical lines, black lines represent strong support/resistance, while dark red lines mark very strong support/resistance.here. Regarding the charts below, the vertical tan shades represent time factors. These are inflection points where we have high odds of something significant happening. More times than not, (3/4 of the time), they mark a turning point in the trend. So, what matters is the direction we are trending into these periods. Regarding the vertical lines, black lines represent strong support/resistance, while dark red lines mark very strong support/resistance.
Elliott Wave count are meant to provide context. There is a pattern unfolding in real-time, one of which will play out. By monitoring price levels that are held/broken, it will help us figure out which one is in play
Broad MarketBroad Market
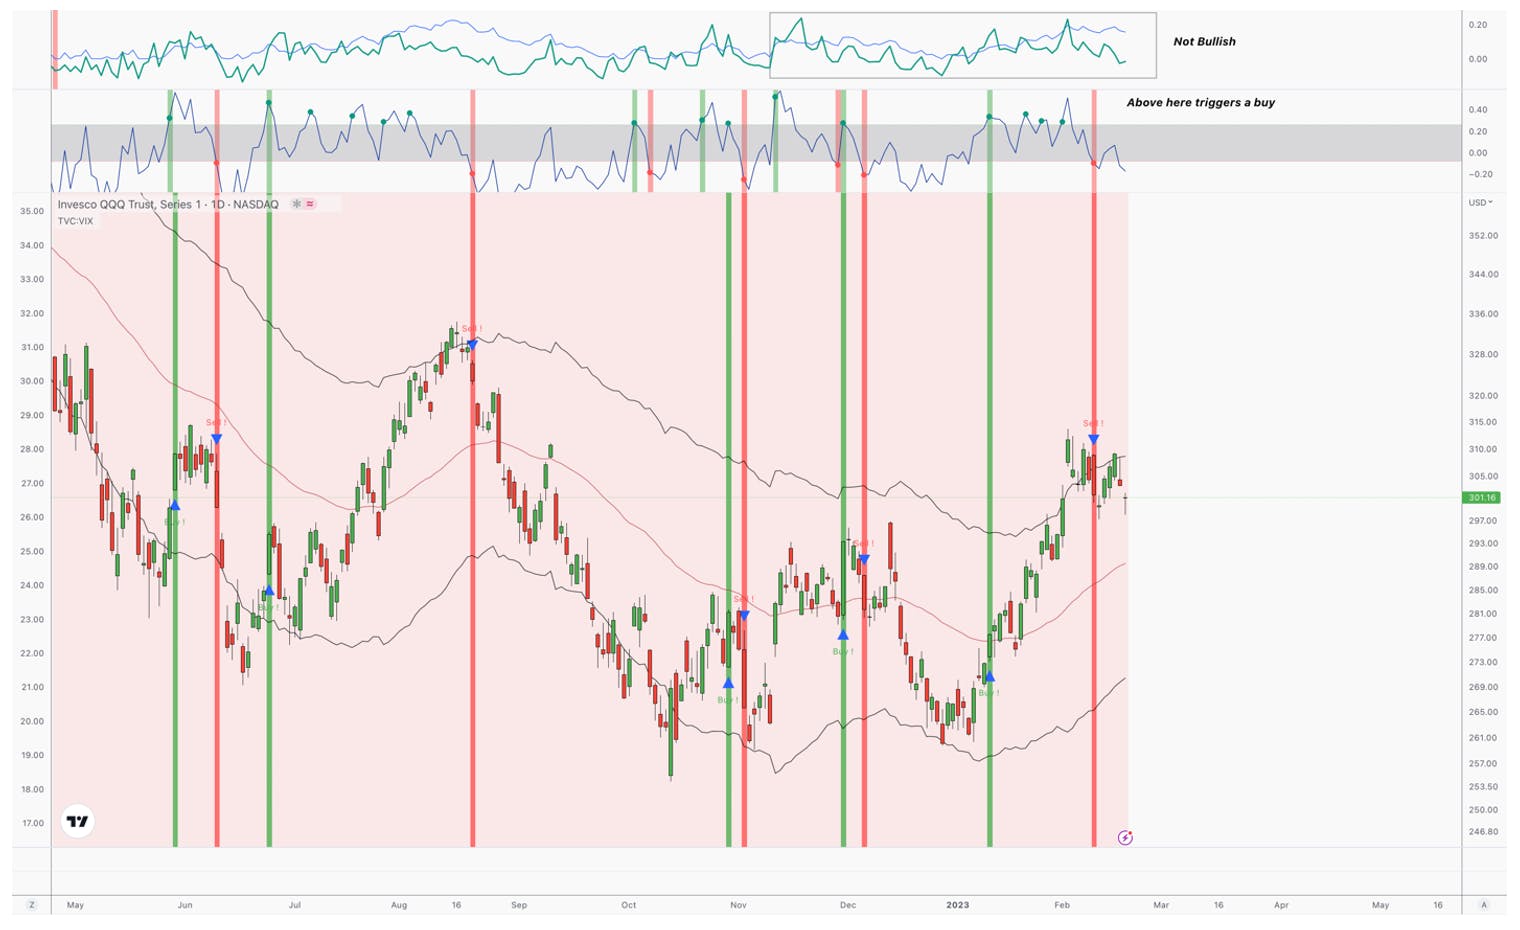
I am updating the current counts to fit the most likely interpretation of the price action of the 2022 bear market. The blue count is the same, and I consider to be a low probability, while the red count is favored for several reasons. For those that have not seen my most recent webinar, I encourage you to listen, as I go into detail why the macro and technical information that we have supports this thesis. You can listen here for I/O Premium, and here for Seeking Alpha.
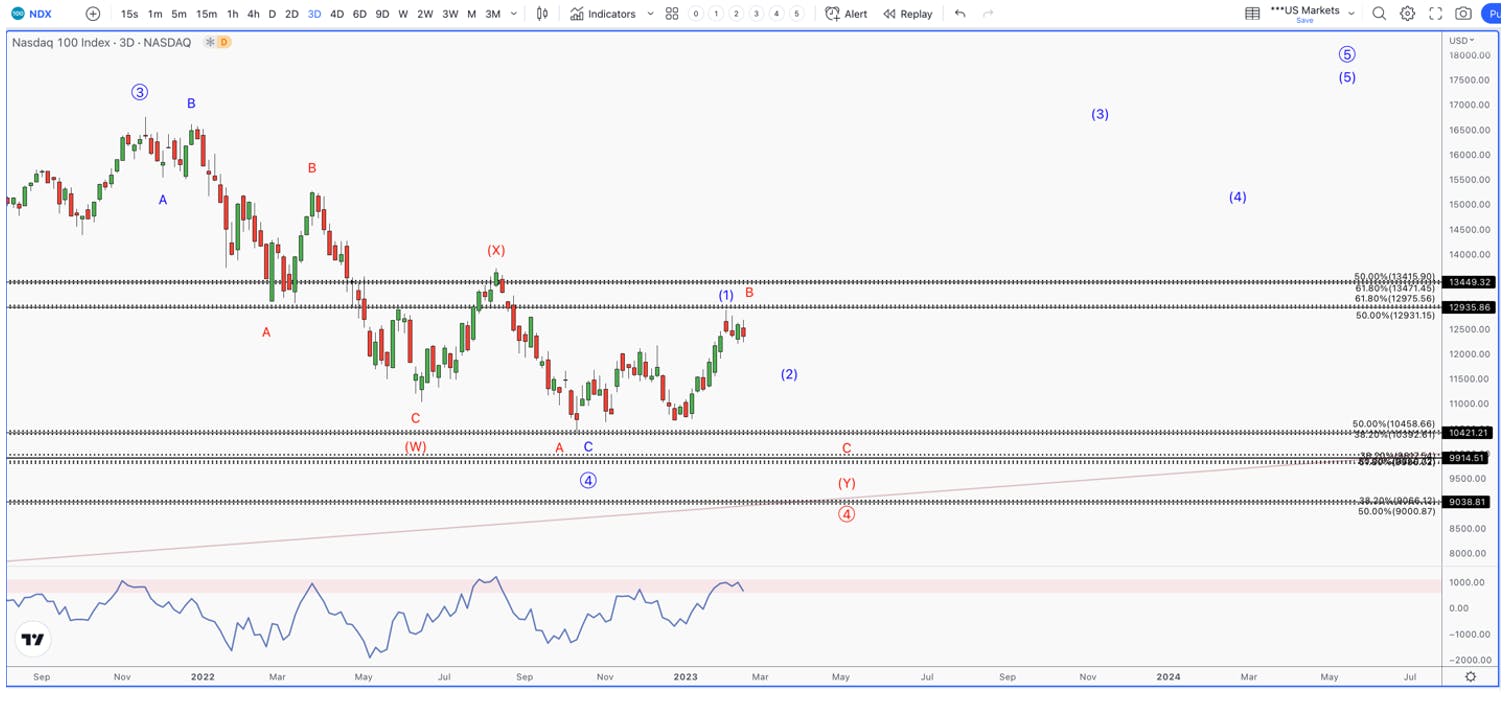
The NASDAQ-100 (NDX) offers the most pronounced version of this structure in red below. In fact, it was the only structure that accounts for the price data, while the blue count feels forced.
Red – The reason I’m moving away from the standard A,B,C structure is because the current 3 wave bounce would have to be the B wave. B waves tend to retrace the majority of the first leg down. This would mean that we make a run to new highs well above 4400 SPX. This is simply not true in this case. The B wave is making a lower high in price, while extending longer in time than prior attempts at a bounce.
The only structure that accounts for this type of behavior is a complex corrective pattern called a W,X,Y pattern. This is characterized by downward trending 3 wave patterns in all directions (sound familiar?), where the structure gets more extended towards the end. If true, we should drop in a 5 wave pattern into the 9000 NDX region to complete the bear market. This level would be around 3000 SPX.
Blue – this scenario has us bottoming in a rather exotic structure. The C wave plays out as a very extended diagonal pattern, while the A and B waves are rather short. It fits, but is more rare to see a correction unfold with such disproportionate waves than a W,X,Y pattern. To make this scenario more improbable, the fact that we only have a 3 wave bounce off the October low means that if this is a new bull market, it would have to unfold as a diagonal pattern. More times than not, 3 waves tends to be a correction than the start of a new trend.
Daily Chart SPX
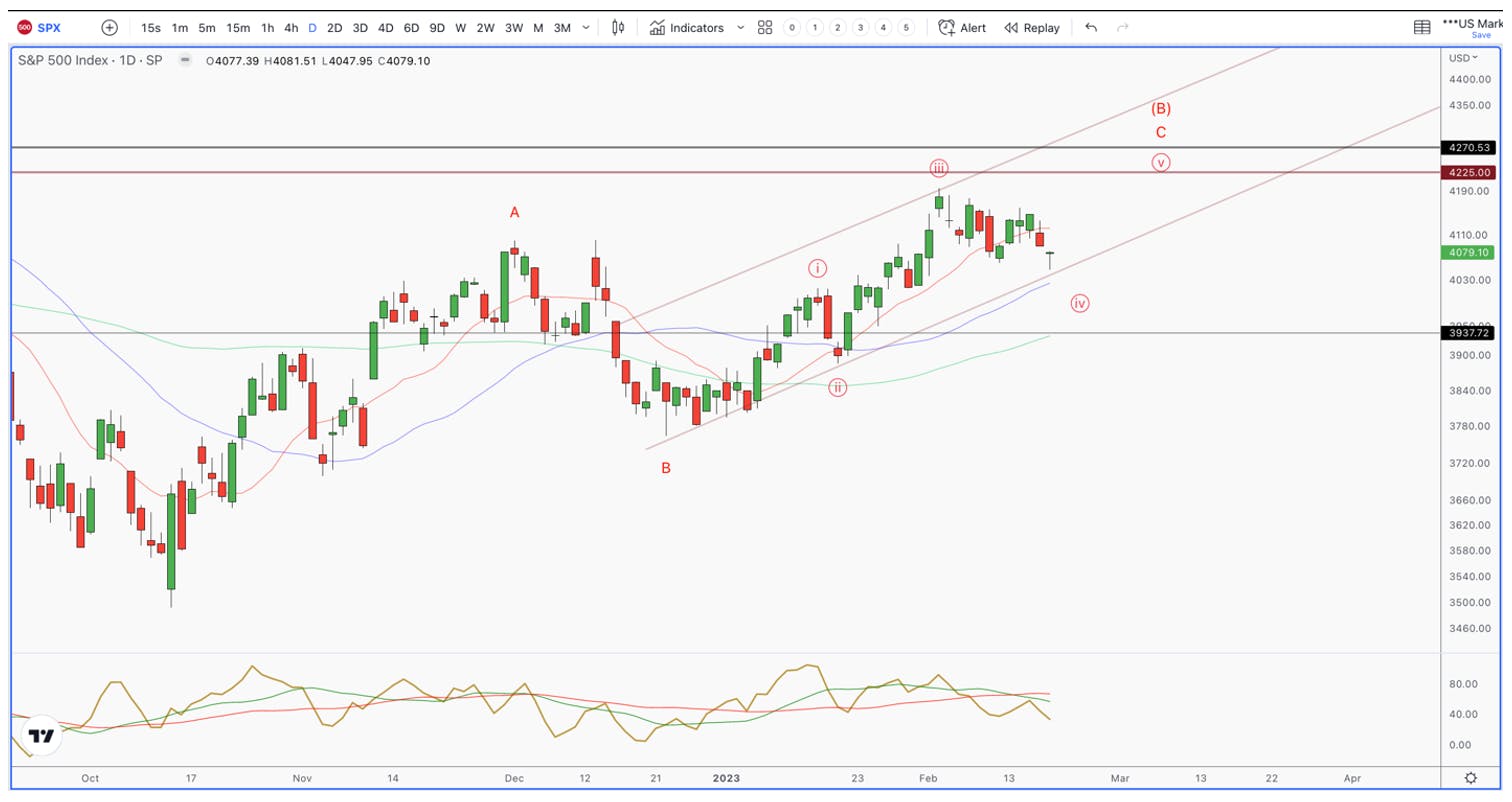
Shifting back to SPX, which has the same W,X,Y pattern unfolding, if we analyze the 3 wave bounce off the October low, it appear to be incomplete. C waves are always 5 wave patterns, and this one only appears to have 4 waves in place. This would imply a run to new highs in the coming weeks, which will target 4225 – 4275.
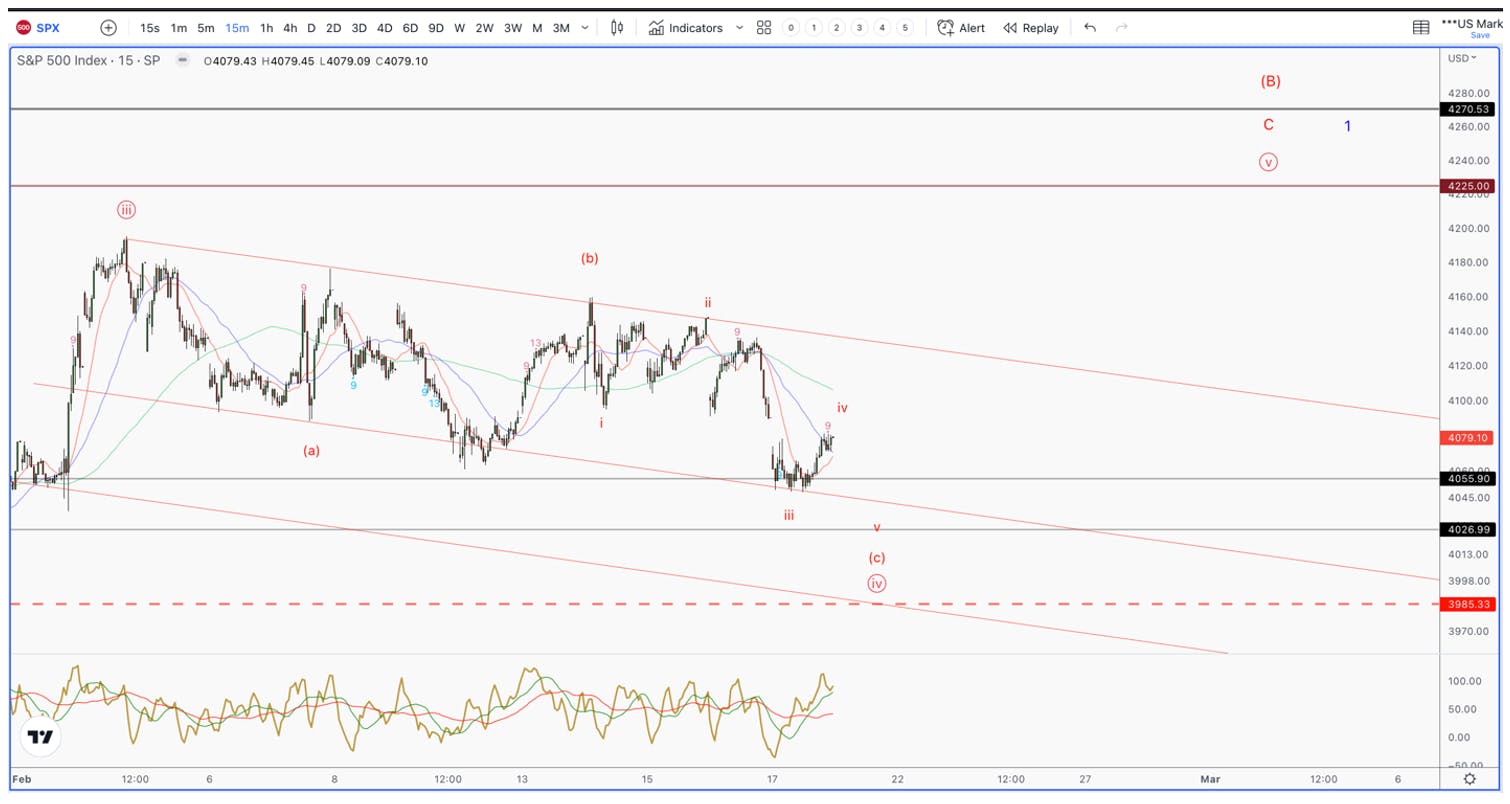
15 Minute Chart15 Minute Chart
If we zoom in on the ongoing 4th wave of the larger C wave, it also appears to be incomplete. I suspect we will see early weakness into this week, which would be a buyable low for anyone trying to play the ~200 point bounce that the coming 5th wave implies.
The lower support region is 4025 SPX and must hold 3985. We will likely remove half of our hedge and go net long to play this move. The R/R levels are quite attractive – stop below 3985 with a target of 4225. However, please keep in mind, the odds favor that we will be picking up quarters in front of a steamroller, so being nimble is crucial. For this reason, if we break back below 3985 and sustain below this region, any hedge that we log a gain on, will be put back on.
MacroMacro
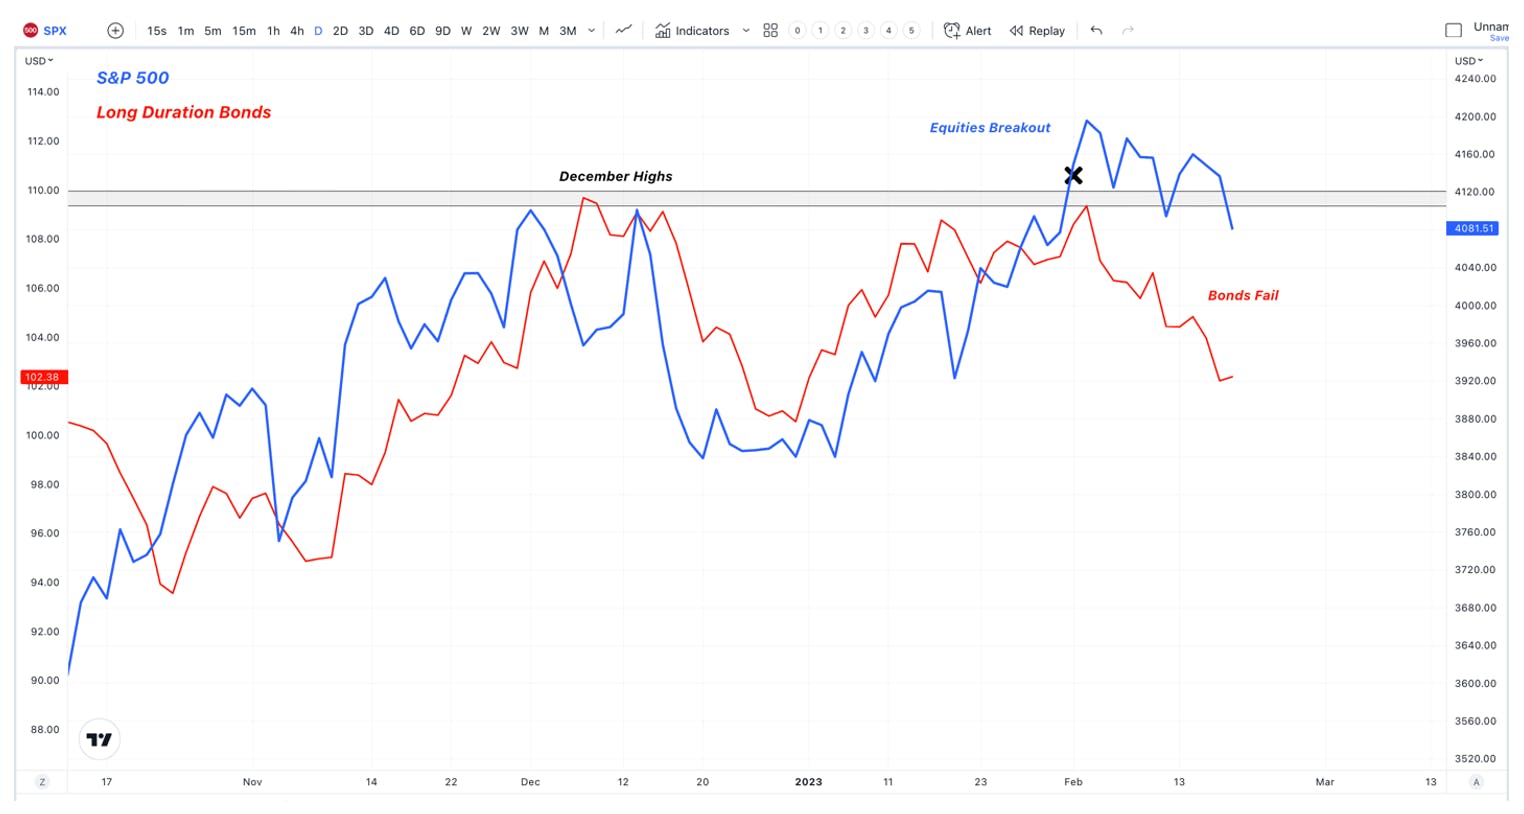
The blue count would imply a soft landing is more than possible, as the FED maintains a terminal rate of around 5%. The February FOMC meeting had a tone that implied this was possible, and that after a few more hikes, we would hold ~5% Fed Funds rate into 2024. Though cautious, the market seemed to agree that peak inflation was behind us and that the actions taken by the FED are working. The problem with this narrative is that equities bought it and bonds did not. In fact, the February FOMC meeting marked the high in bonds, as the downtrend continues into this week.
What the bond market is likely picking up on is that the economy is quite durable, and declaring victory over inflation is not a probable outcome at this point. The recent CPI and PPI readings confirmed that inflation is re-accelerating, proving that the battle against inflation is not over. Peak inflation is likely behind us, but the real battle will be getting it back to the 2% target. Considering the extraordinary actions taken to quell inflation, it is concerning that we are starting to see inflation re-accelerate, even slightly.
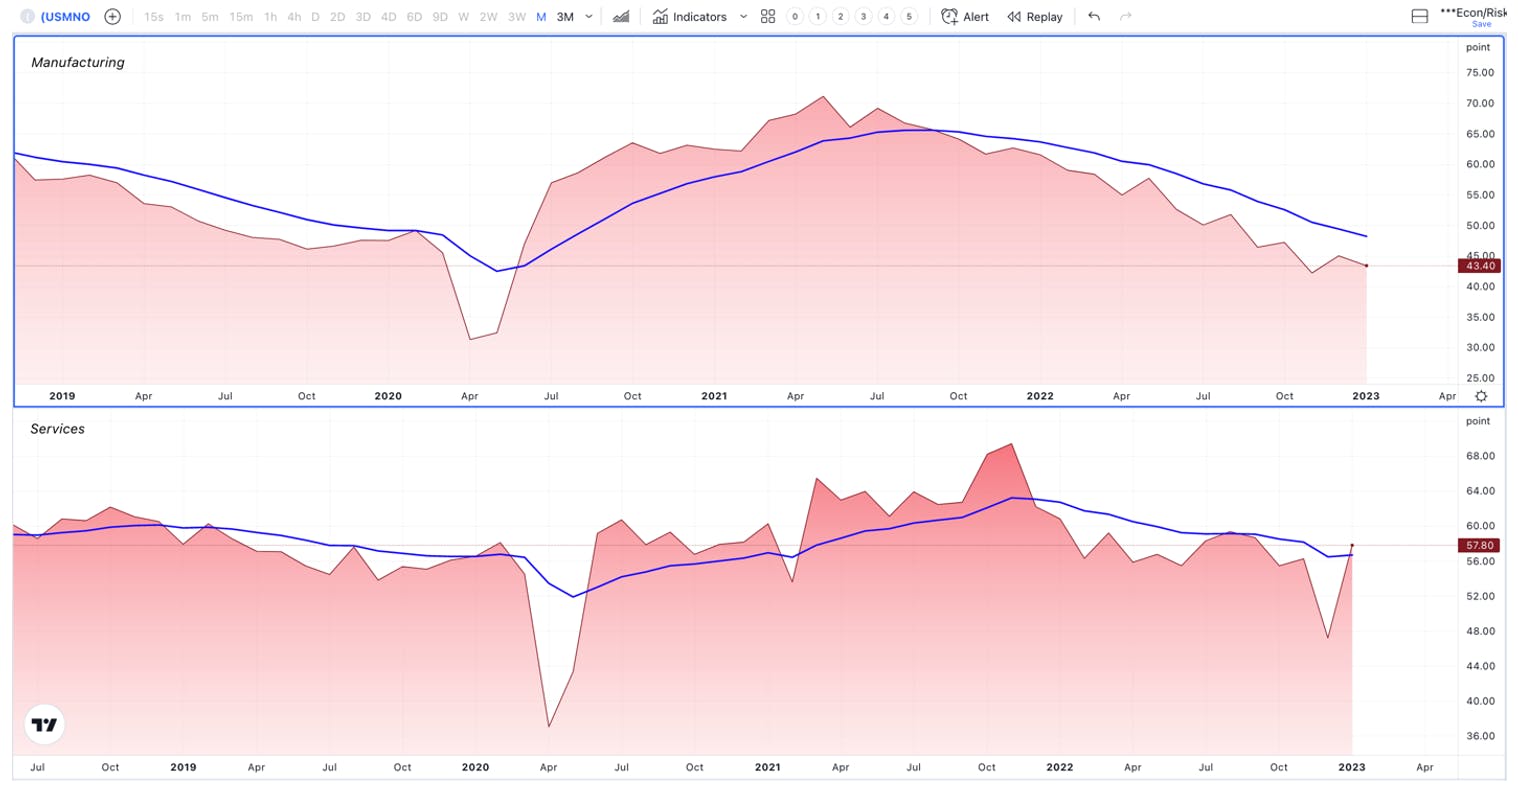
This is further shown in the recent PMIs. Regarding the PMI readings, anything above 50 indicates an expansion, while below 50 indicates a contraction.
For one, manufacturing is currently at lower levels than just before the February high in 2020. This is a notable reading, as prices are much higher than in the 2019 downturn. Manufacturing is in a recession, and due to its sensitivity to interest rates, it is always a leading indicator of a slowing economy. However, if you look at services PMIs, which accounts for about 86% of the GDP in the U.S., it has re-accelerated into expansion territory.
This is ultimately what a soft landing looks like in the US, where manufacturing contracts while services stays resilient. We saw similar soft landings in the mid-80s, mid-90s and most recently in the 2014-2016 slowdown. So, it seems plausible that this could be playing out again, and all the recession talk is overblown.
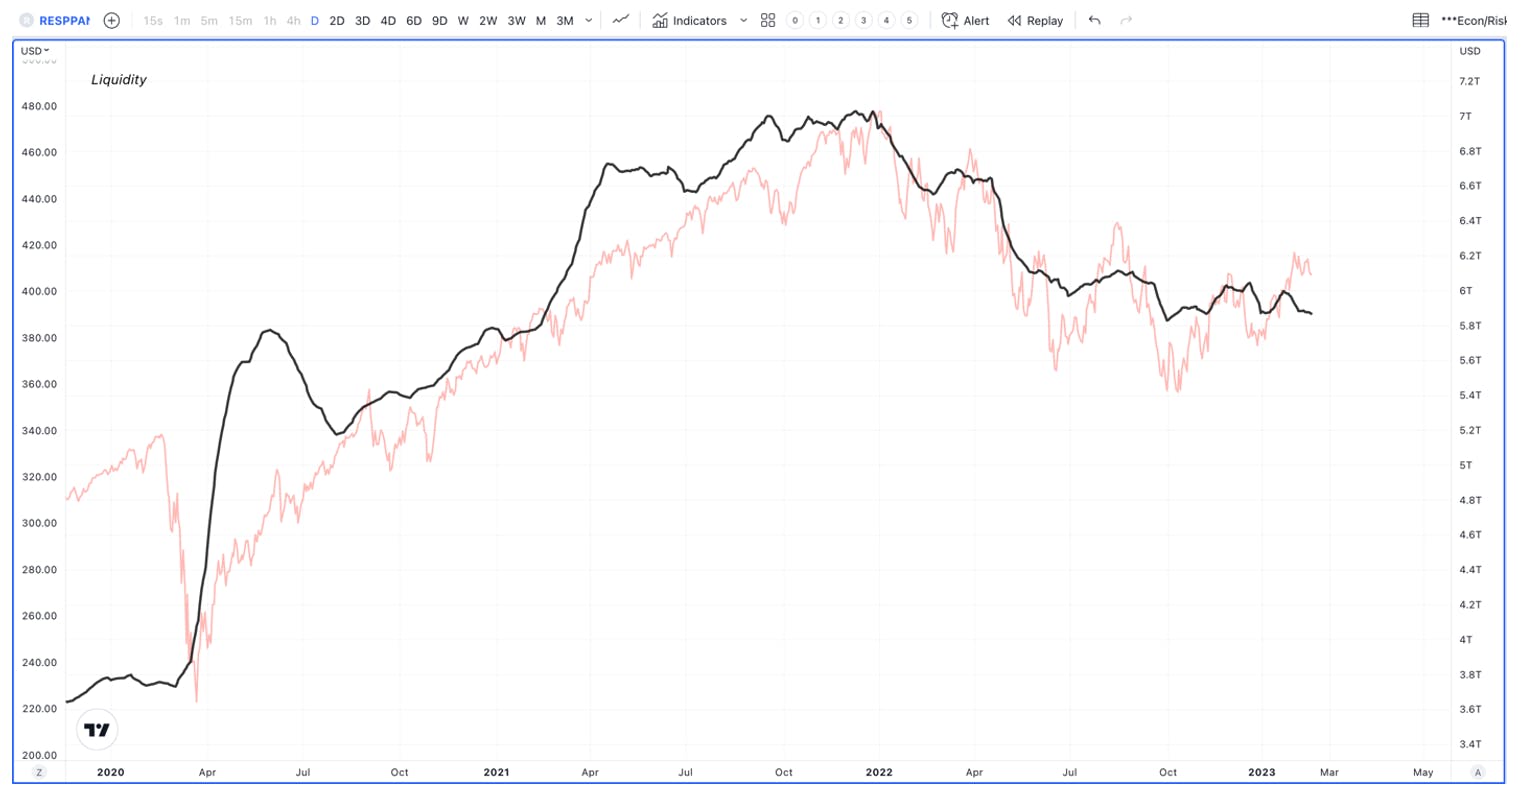
The one common thread between all the prior soft landings was the liquidity cycle. The FED was either still in the expansion part of a liquidity cycle, or started up a new one, which diverted services from following manufacturing into a contraction. The current liquidity cycle is below in black and put up against the S&P 500 for reference.
There is a stark divergence between liquidity continuing to trend down and equities trying to recover. The bet that the bulls have to make, which would bolster the trend in equities (blue count), is that the FOMC is about to start a new liquidity cycle, or at the very least, stop QT and allow liquidity to stay flat to trending slightly up based on other metrics. So, the question one has to ask is – with the current new data in CPI and PPI, with pockets of strength in non-manufacturing and employment, is the FED more likely to start a new liquidity cycle, which would push asset prices higher, along with wealth and discretionary spending power? The bond market has answered with a resounding no. In fact, for the first time in this cycle, the bond market as well as institutional analysts are projecting a higher terminal rate than the FED, which is concerning.
Bail Out LevelsBail Out Levels
I have stated before, and will continue to state that my bearish outlook has an expiration. If TLT and the DOW can break back above their December highs, I will abandon our bearish thesis and flip back into the bull camp. I will also want to see DXY (the US Dollar) commence its downtrend. Short of this, I consider the current rally in equities to be running on fumes.
Hedge SignalHedge Signal
We will continue to lean into our hedge signal to tell us when to hedge/not hedge. Our cash raises are determined by our tech/macro outlook. As of now, the hedge signal is not close to flipping back into a risk-on mode. We are in bear market mode, which uses 3 data points to capture bear market bounces (compared to the normal signal that uses ~ 7 data points).
I/O Fund PositionsI/O Fund Positions
NVDA
NFLX
MSFT
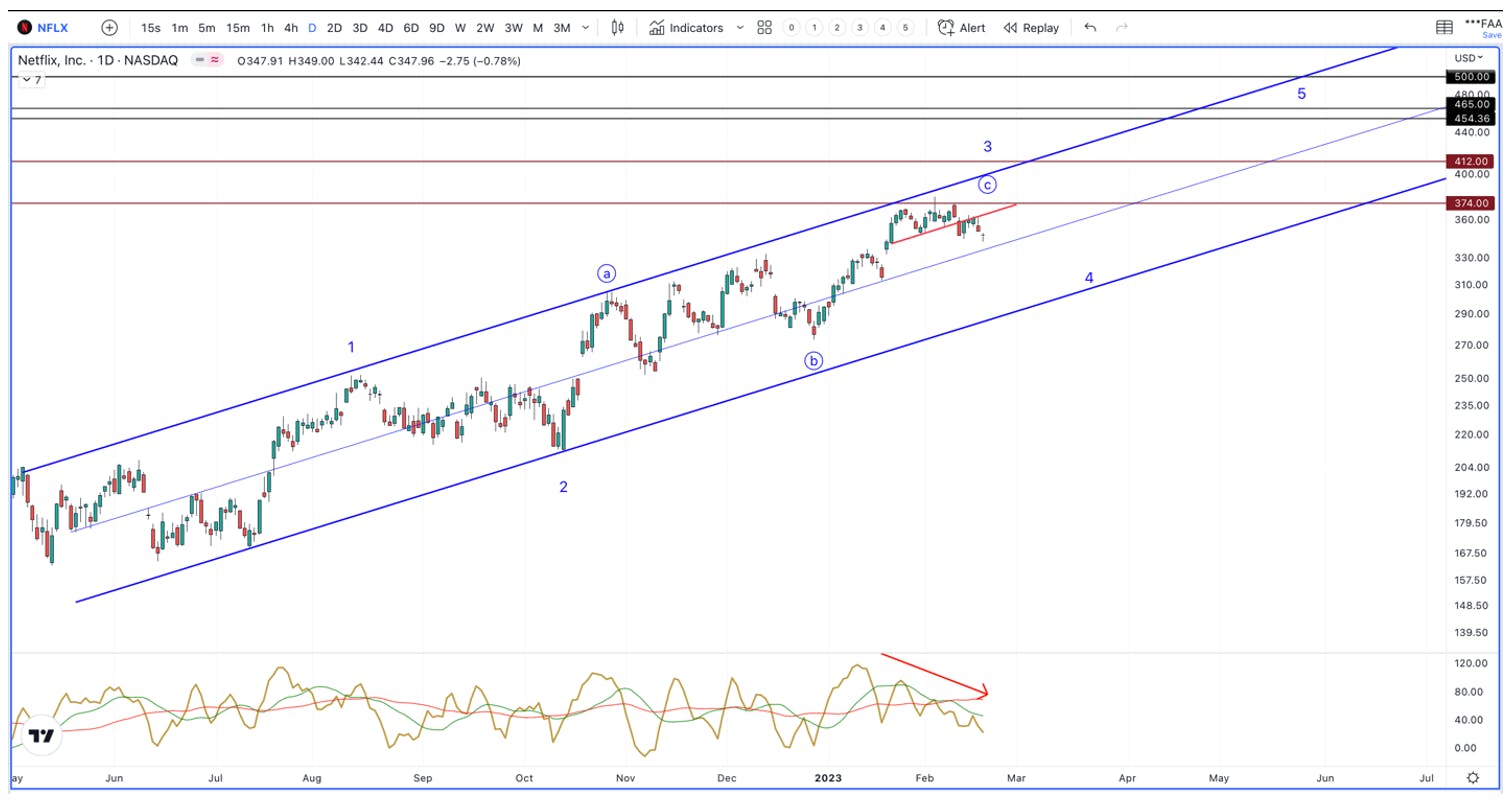
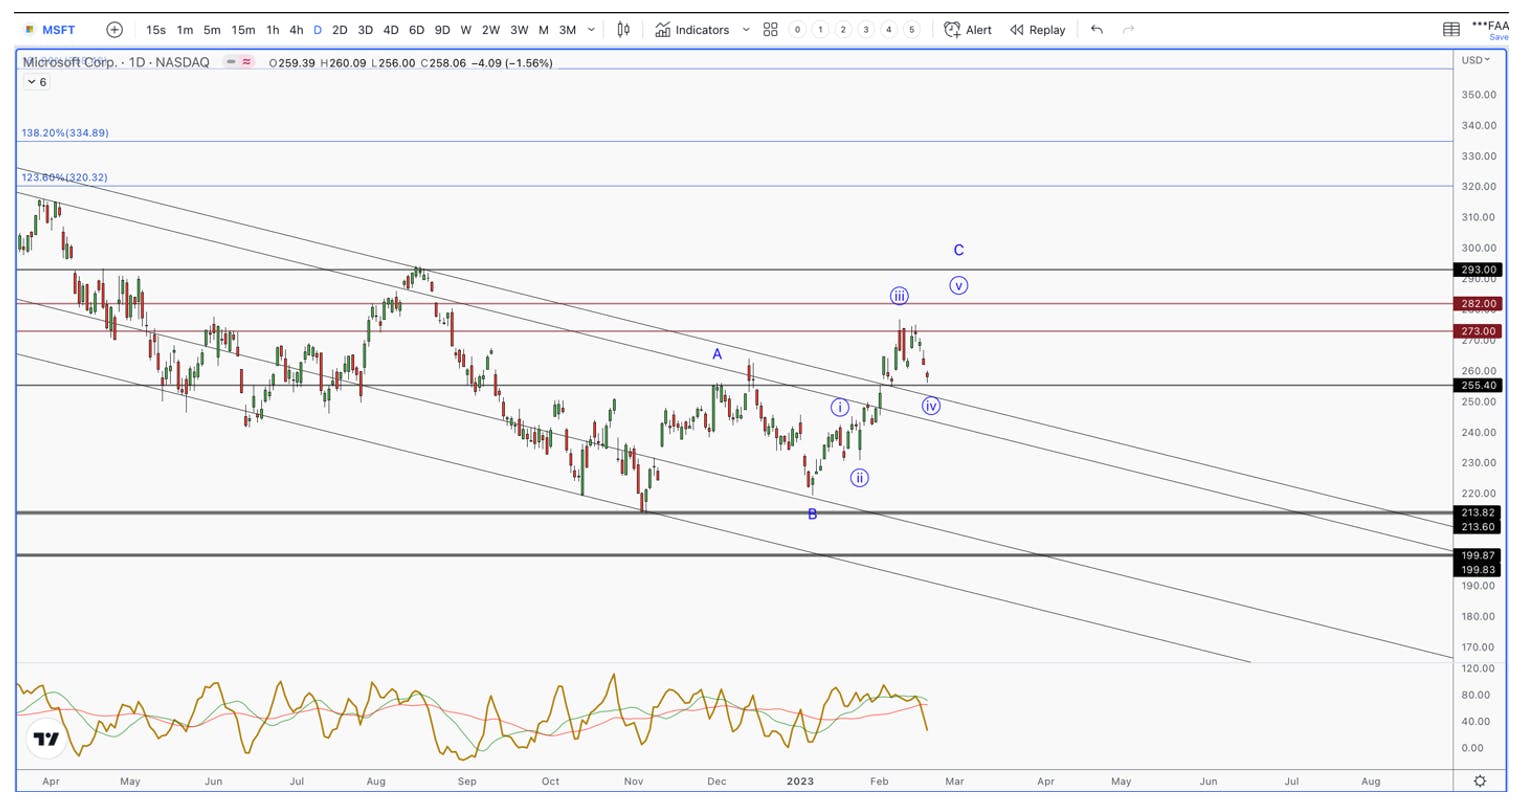
MSFT is pennies away from closing the 3rd wave gap. Below $255.40 and it gets closed, as does the hopes of another 5th wave run higher. MSFT has clearly only given us 3 waves up off the low, and this wave, maybe, has one more high in it. As of now, NFLX, AMZN, GOOGL have likely topped. MSFT looks to be next.
TSLA
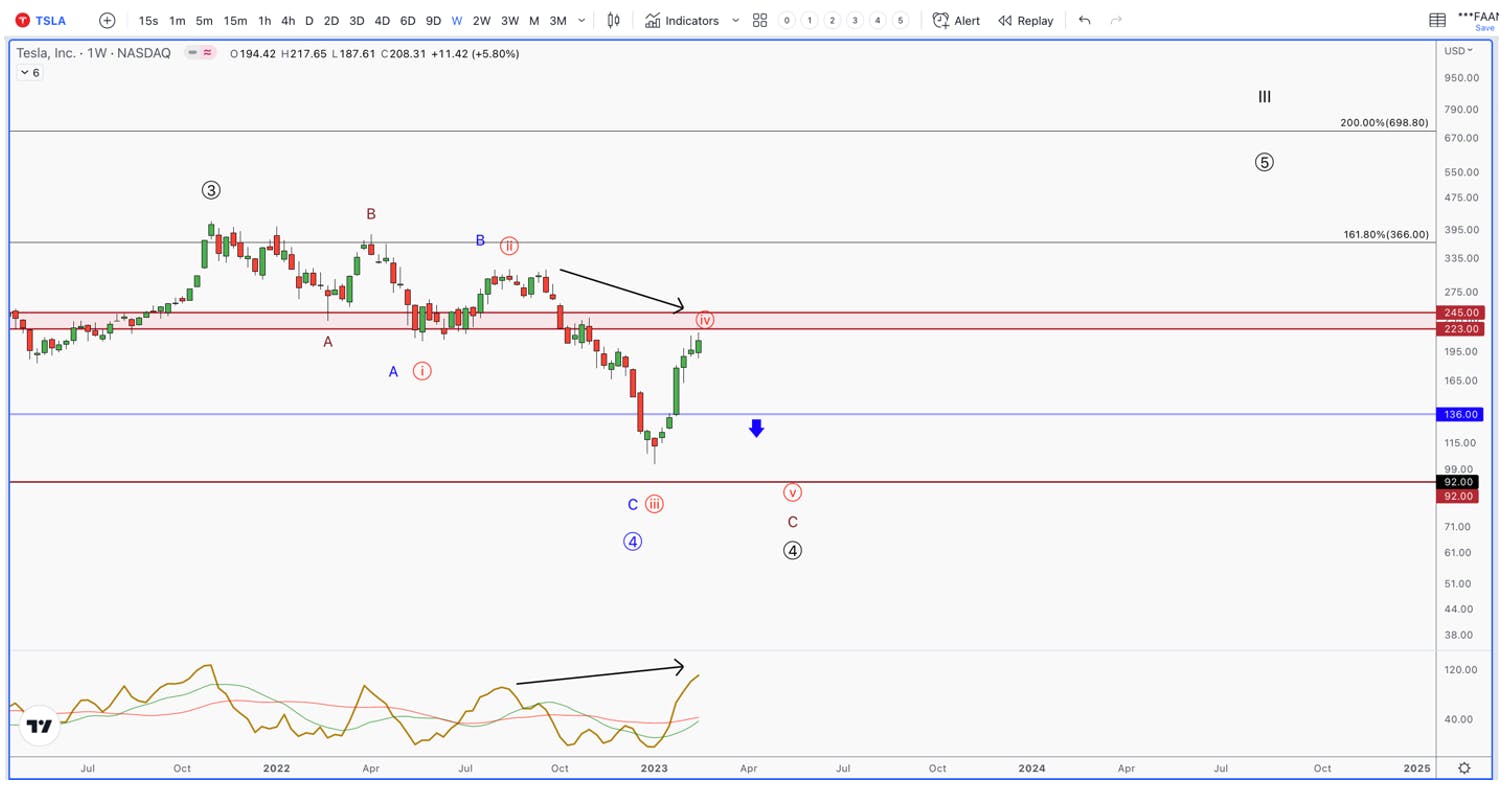
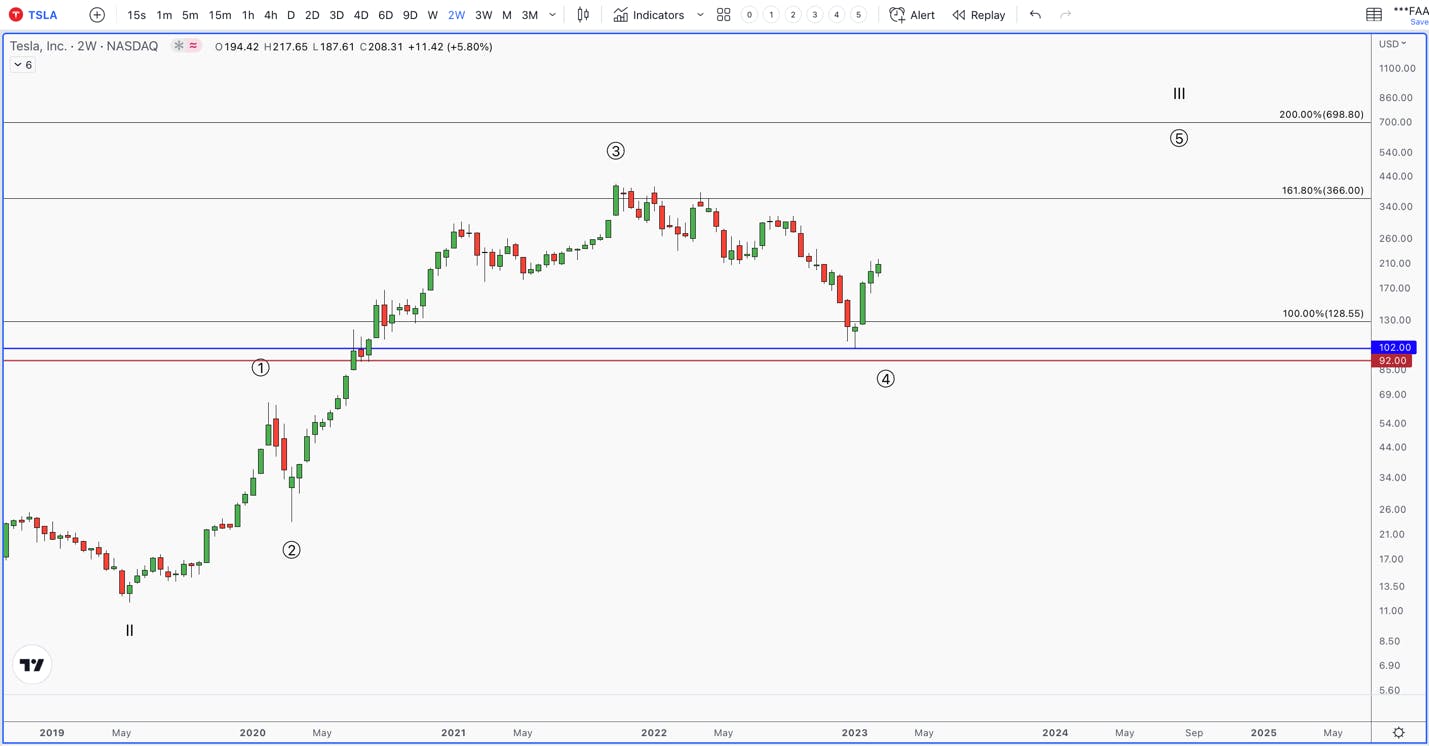
Here’s a big picture view of TSLA. Technically, it appears to have an incomplete correction. One more wave towards $92 would set up a phenomenal buying opportunity. However, if we get there, the fear surrounding that move would make one not want to buy. The coming pullback needs to hold $138 or this becomes the likely scenario. We will likely buy assuming both scenarios are playing out, and buy in layers.
AMD
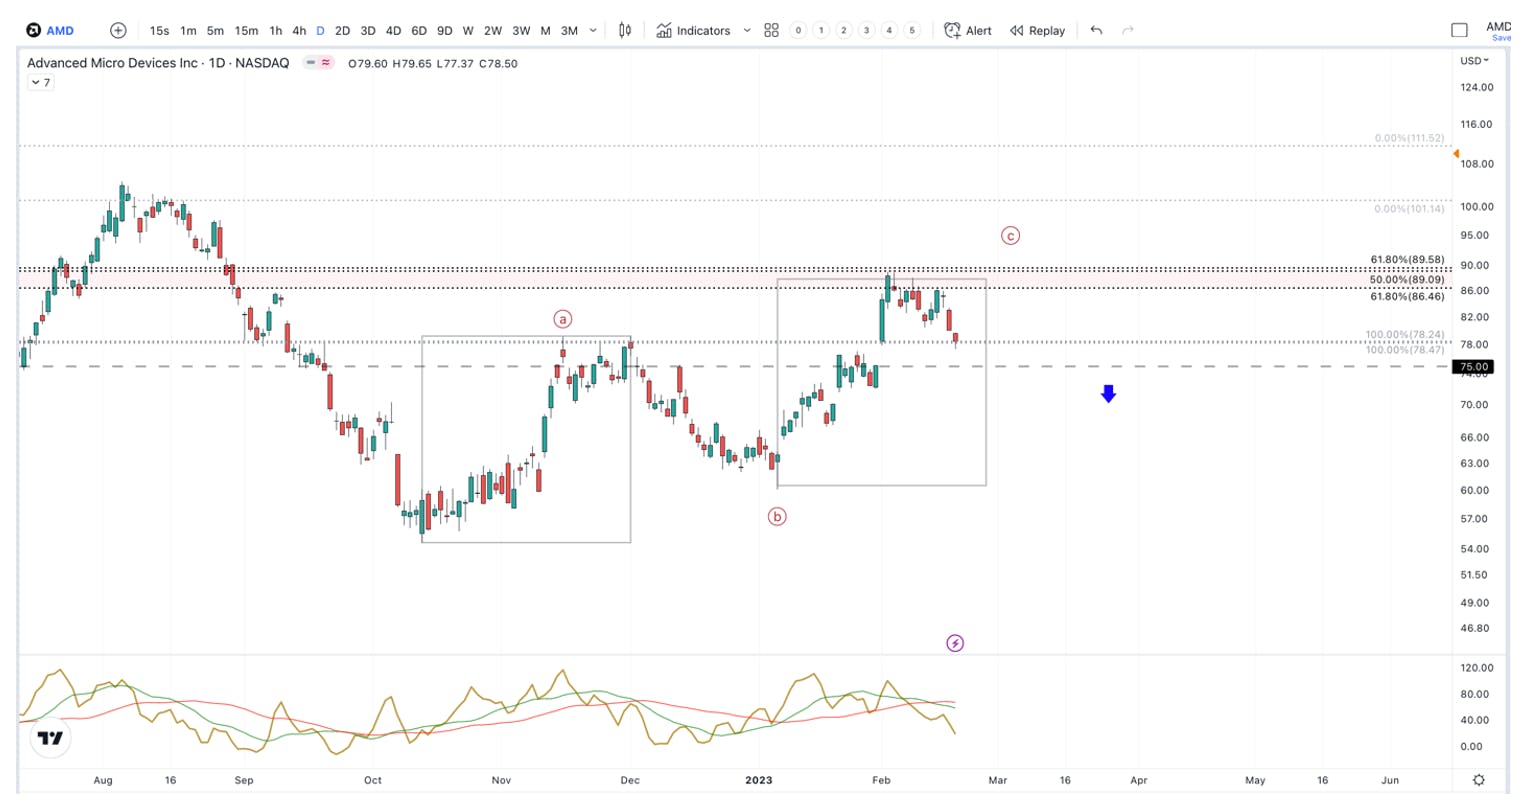
My guess is that AMD has one more run to new highs in it. However, this drop needs to reverse soon. Below $75 and the odds start shifting towards the top being in.
TSM
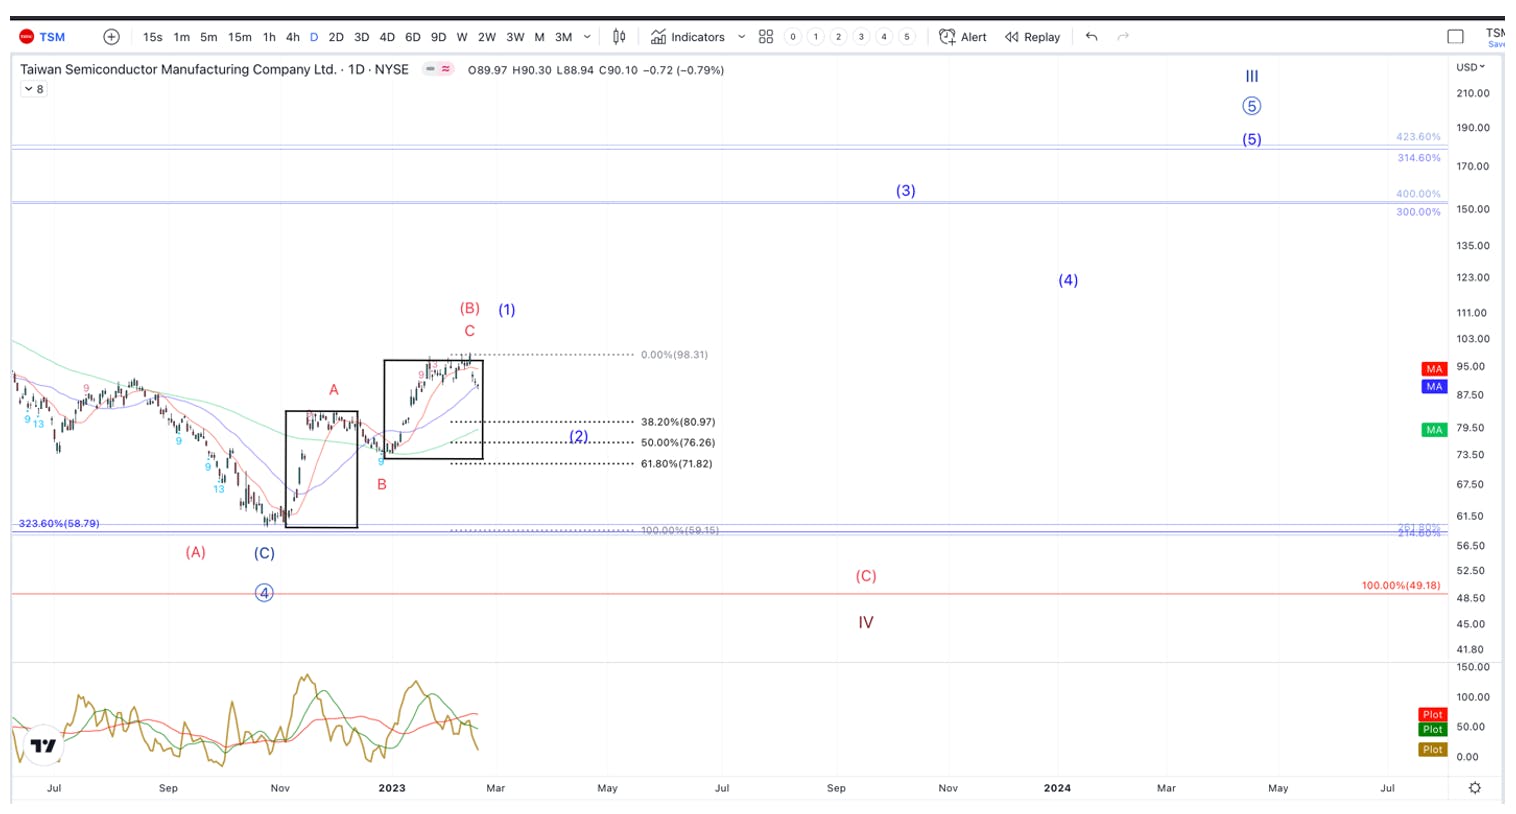
Only 3 waves up, and right at the symmetrical price level (A=C). This type of pattern is usually bearish. The coming pullback needs to hold $70, or we could be in for new lows.
AEHR
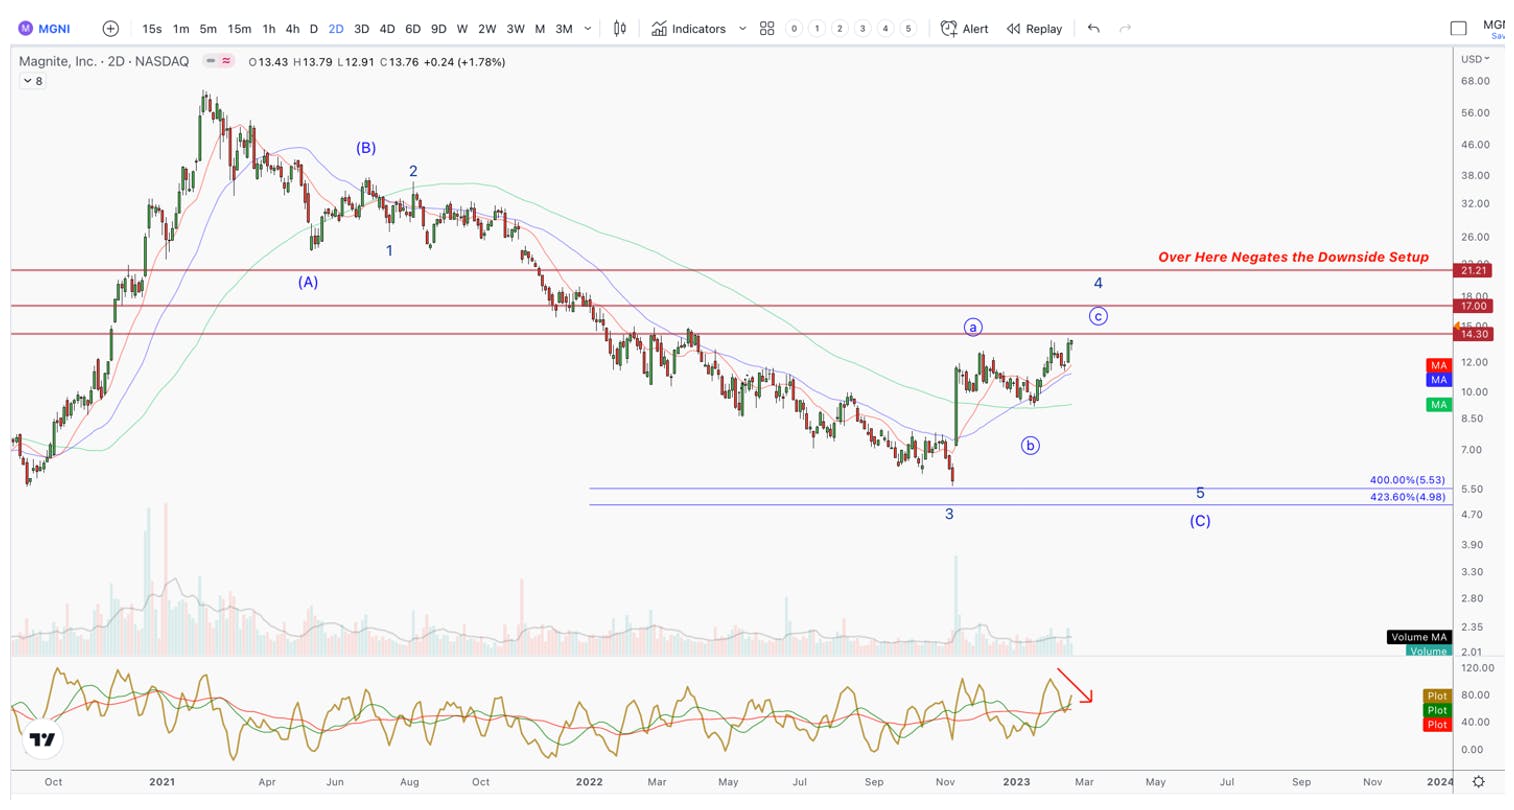
MGNI
ENPH
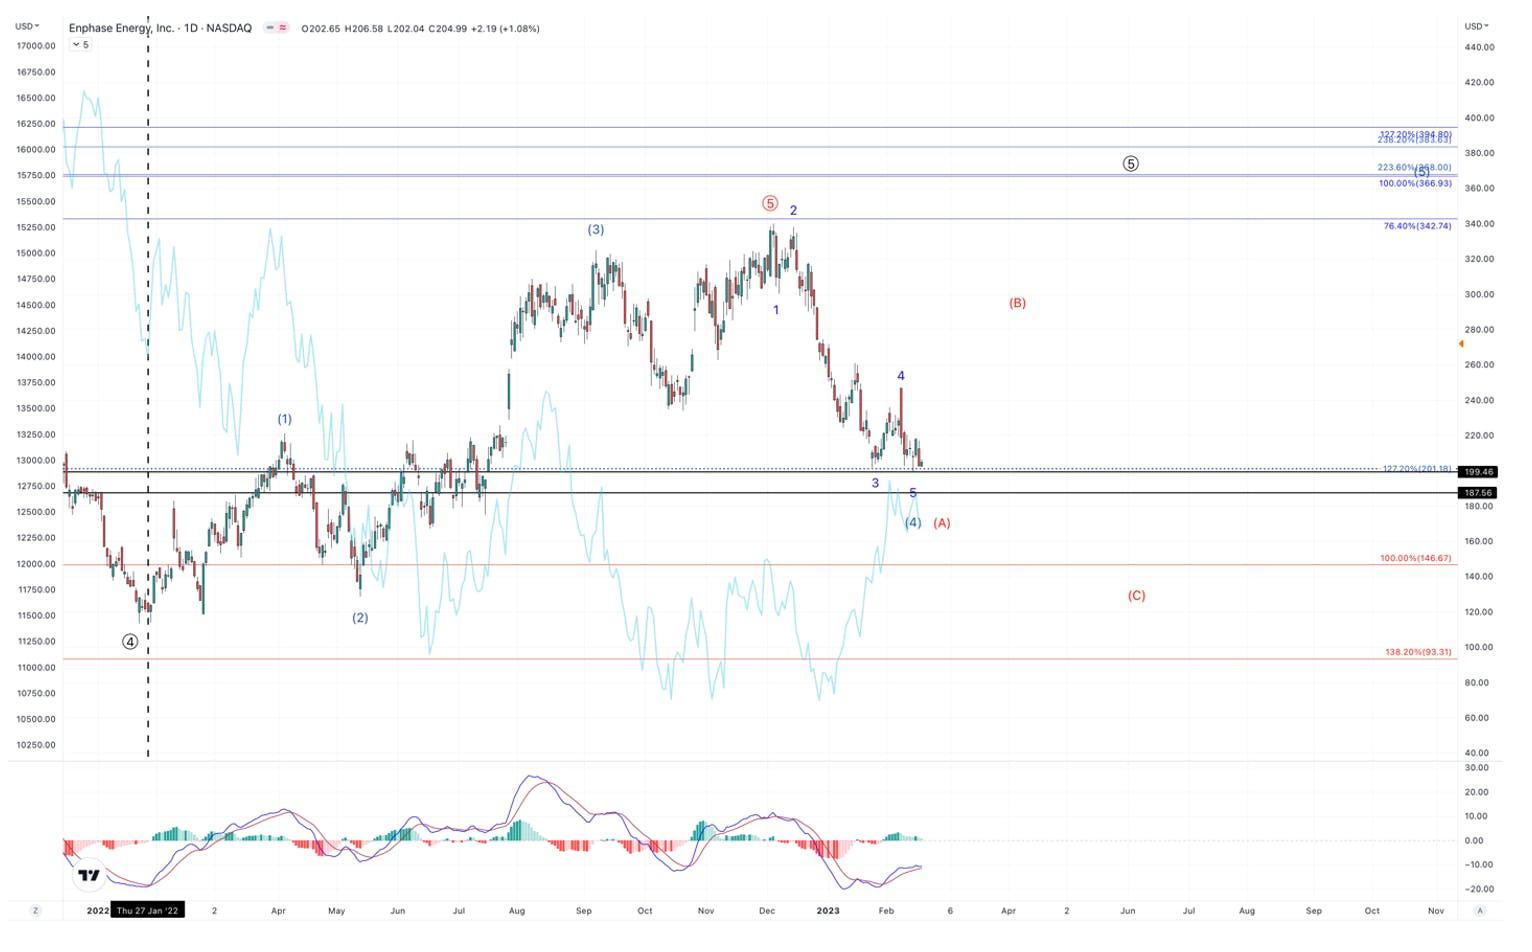
I continue to signs of bottoming while NDX shows signs of topping. We’ll take a shot with some of our cash that the best ER of the year is holding its inverse correlation to NDX.
Crypto
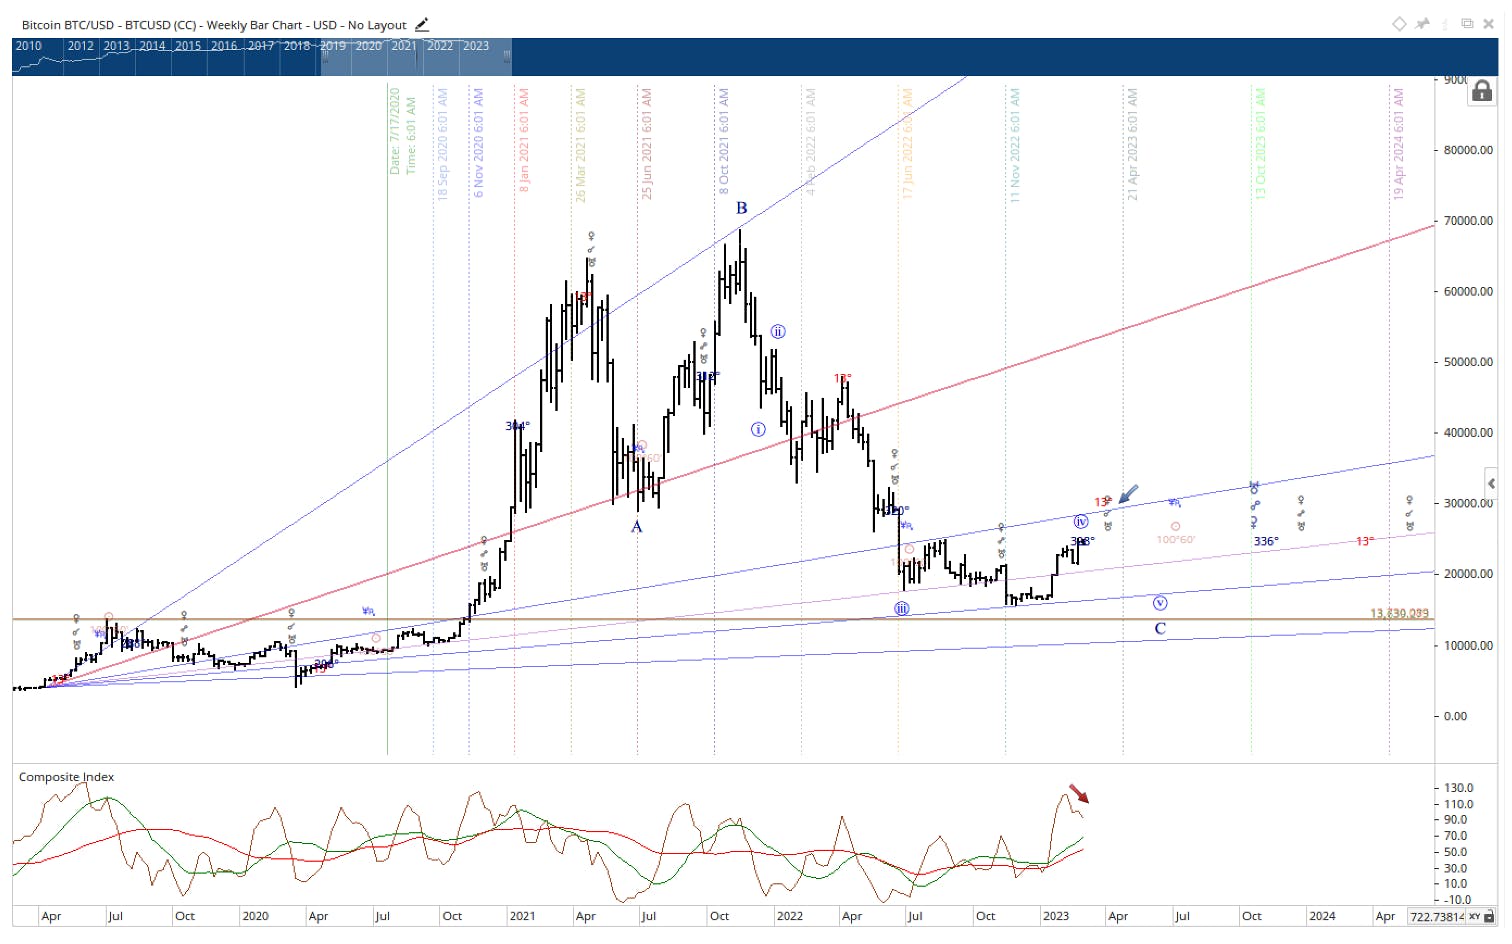
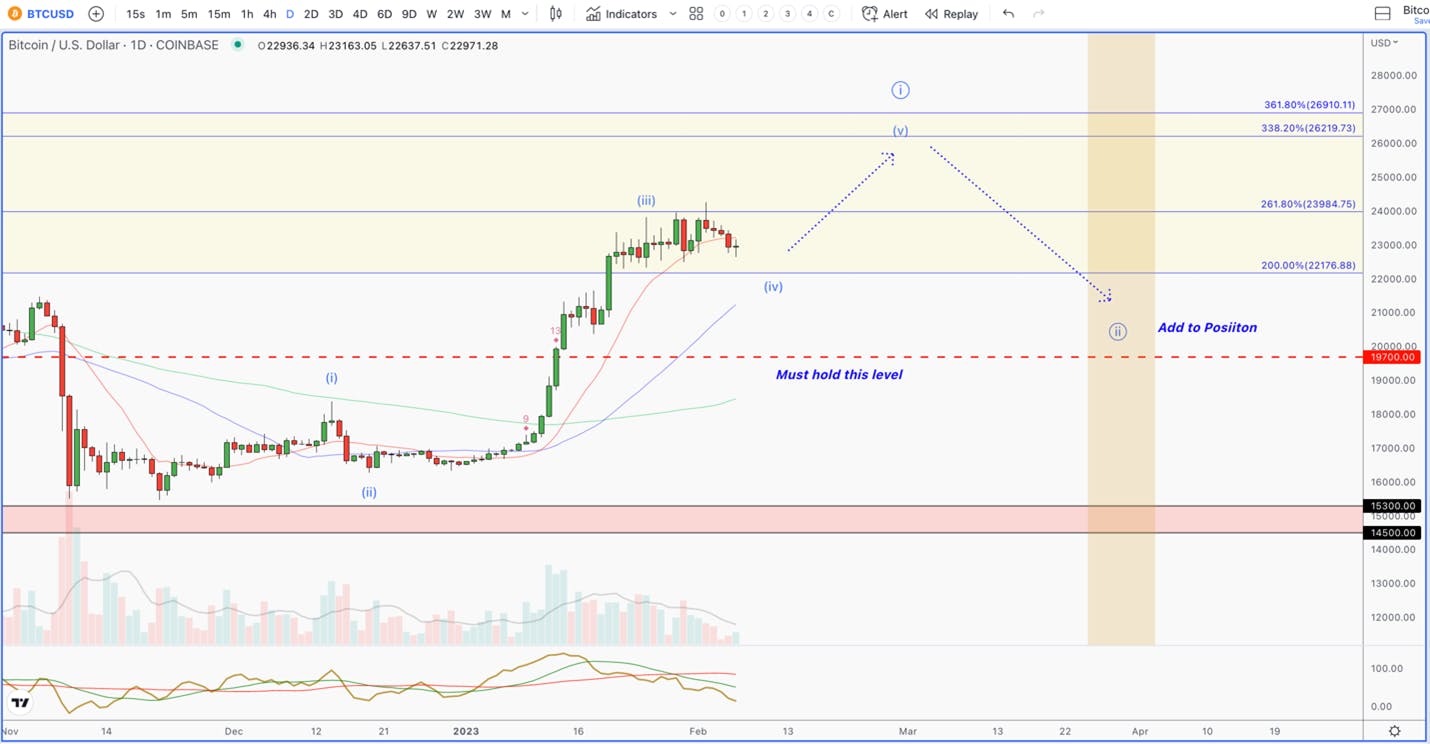
Be open to this count. Bitcoin is completing 5 waves up off the low. How can it continue higher while risk assets push lower? Either the red count thesis is wrong above (we are very open to this), or Bitcoin is tracing a 4th wave. that would mean we are in a nasty, expanded flat correction with $13K on deck. Like with every position, the coming pullback will tell us everything.
Time AnalysisTime Analysis
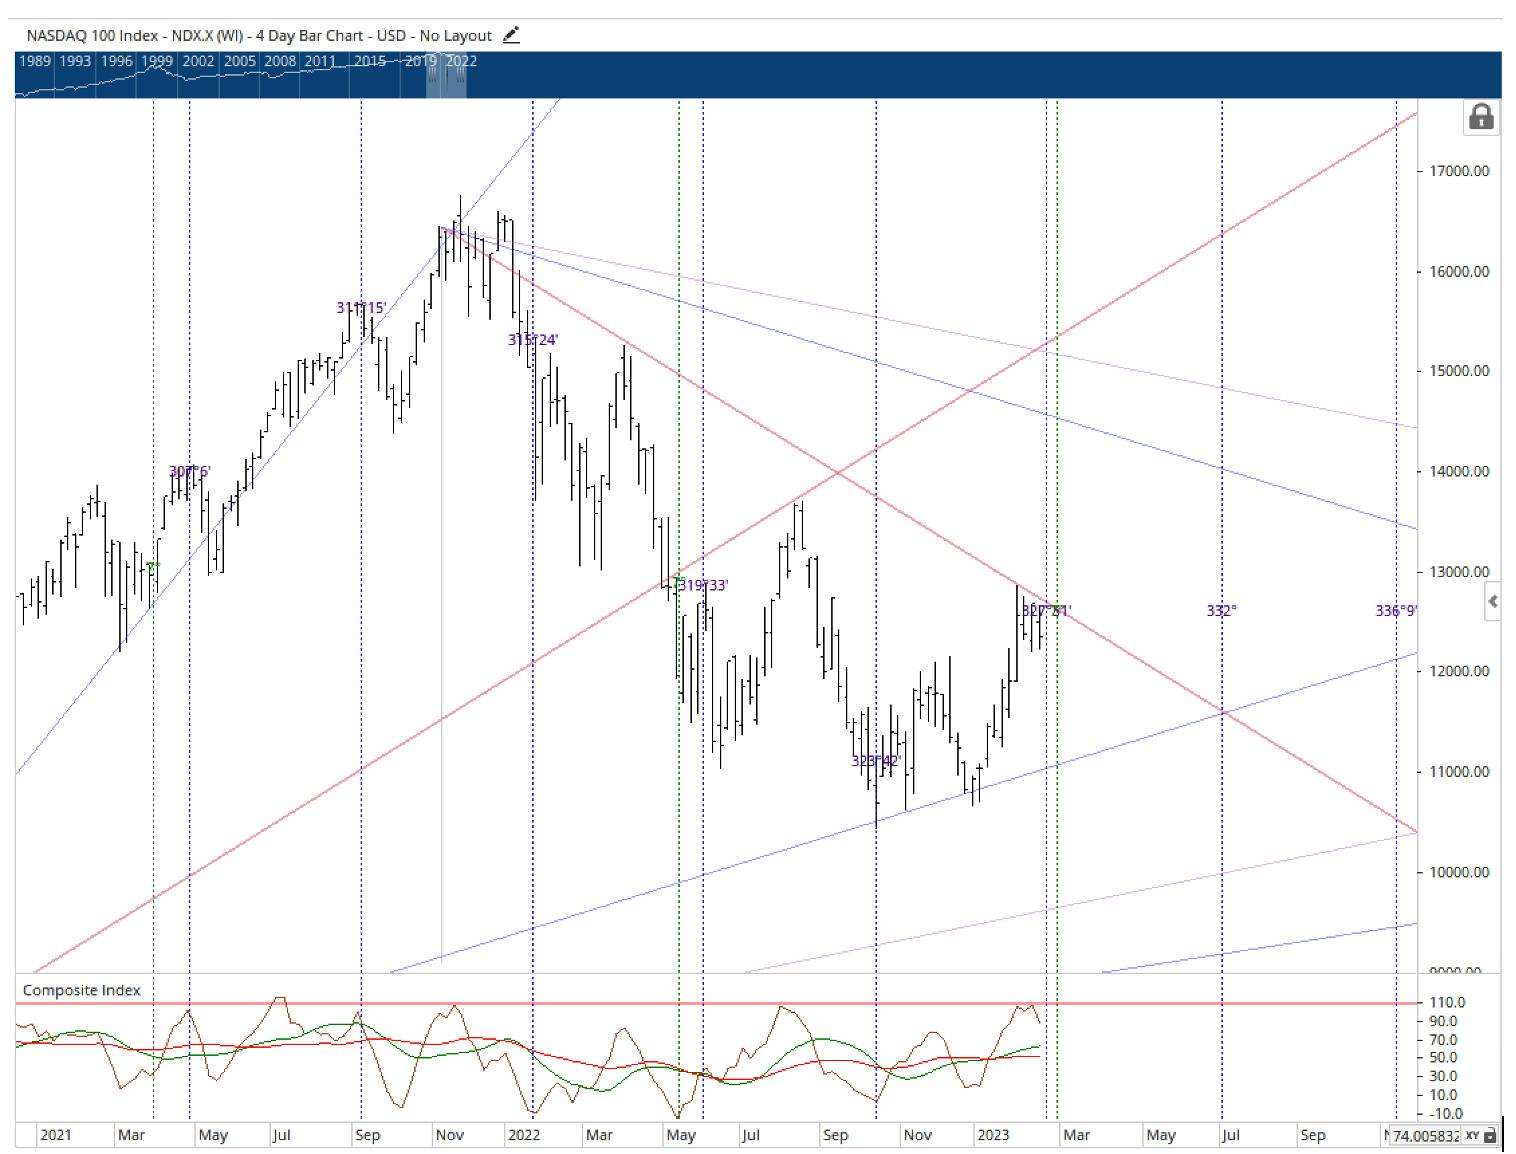
We have many stocks and indexes showing a time factor coming up this week/next (Feb 20 – March 2). As always, depending on how we trend into it will be the most important piece of information. The NDX shows 2 cycles coming together in the chart below (20th-28th). If we see a sharp drop and reversal early in the week, it could signal the 4th wave low. If we see a move back towards 4200+ by next week, it will be a big warning.
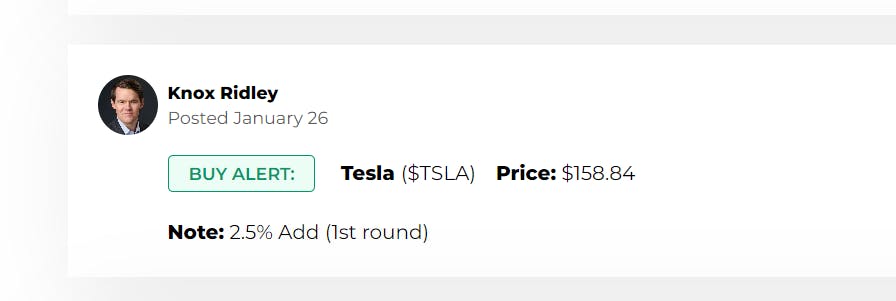
On 1/26/23, we sent out a trade alert notifying our readers that we purchased shares of TSLA after the release of its 1/25/23 Q422 earnings release. Based on the 2/17/23 closing price of $208.31, TSLA is up 31%. Since that Q4 report, we thought it be worthwhile to update our readers on our thoughts both fundamentally and technically on what we’re watching for in the upcoming weeks.
Right now, our technical analysis is at odds with our fundamental analysis, which is often good news, as it means we will be afforded a lower entry on a stock position we plan to build.
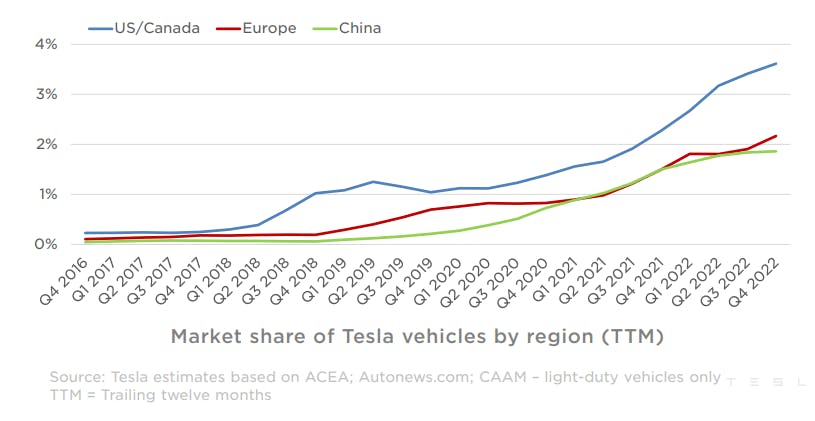
The technicals are telling us a lower entry is on the horizon. However, what will make or break Tesla stock in 2023 is the margins. As most Tesla investors are aware, the company has lowered its price on its vehicles. Coupled with the $7500 EV credit, Tesla's vehicles are more affordable in Q1 than ever before, with some price points below $50,000 for the Model Y SUV when combining the price cut with the EV Credit.
This has led to Model Y selling out in Q1, per a Reuters report on February 15th. Considering a Model Y is now priced at $52,990, down from $65,900, this means a 30% price reduction is possible with the additional $7500 EV credit with the total cost of $45,490.
With these incentives, most investors can see a path to Tesla meeting its delivery goal this year, however, the impending issue is if Tesla can do so while maintaining healthy margins.
The stakes are high for Tesla's stock because if the margins remain healthy, the stock will do quite well. However, if the margins contract, then the bears will be in control. This is a big moment for Tesla, as high average sales price has been a contentious issue for meeting its addressable market. Wall Street will want to see it's possible to do both — serve a wider total addressable market (TAM) with more affordable prices while maintaining a healthy bottom line.
Our in-depth analysis below discusses why the I/O Fund Analyst Team is forecasting that the margins will, indeed, overcome a lower average sales price to sustain operating leverage. Once we discuss the margins in-depth, which to reiterate, we believe is the most important piece to Tesla's 2023 story, we then go into how we plan to build this position while respecting the fact the broad market is in the driver's seat for growth stocks.
Tesla Stock: What to Look for in 2023
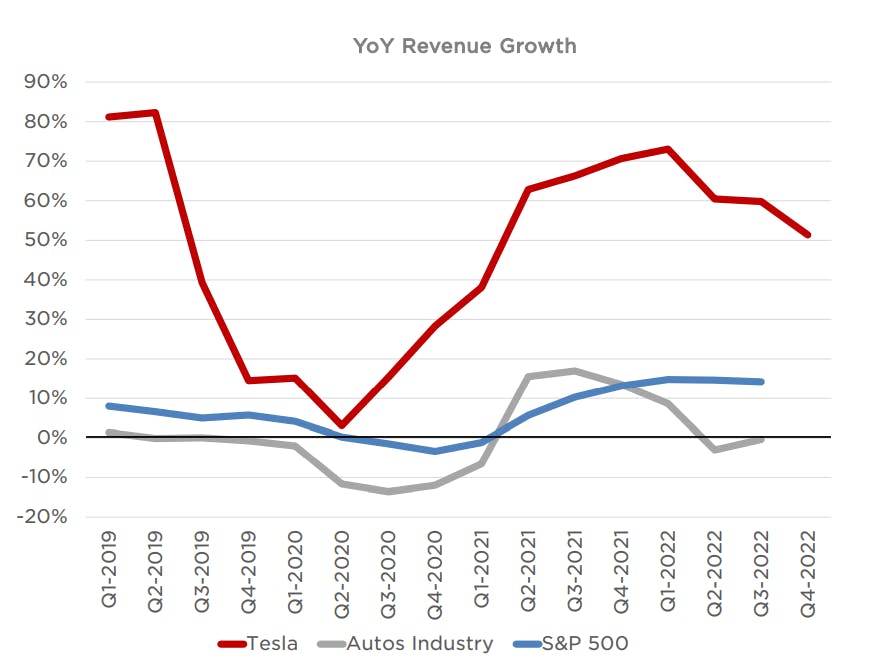
First, let’s take a quick look at Tesla through a few graphs. If you were presented with the following company, would you find this an attractive business?
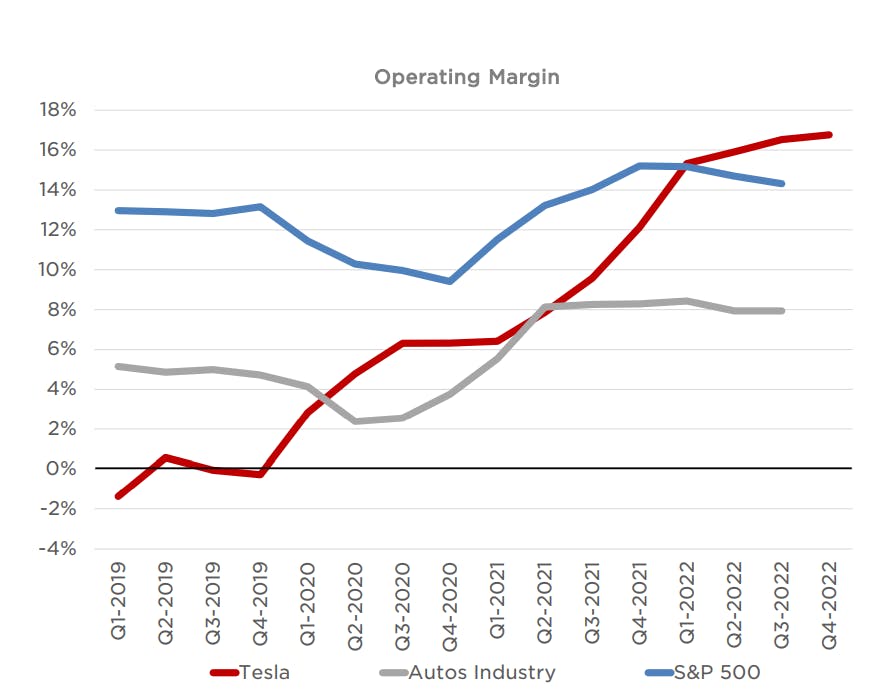
A company with steadily increasing operating margins vastly superior to its competitors and greater that those in the S&P 500.
It’s these attributes that have drawn us to Tesla as an attractive business. However, as investors in the equity, there are several key factors we are monitoring that may drive the stock.
Sign up for I/O Fund's free newsletter with gains of up to 221% -Click hereSign up for I/O Fund's free newsletter with gains of up to 221% -Click hereClick here
Profitability: Gross margins (GM) vs Operating profit margins (OPM)
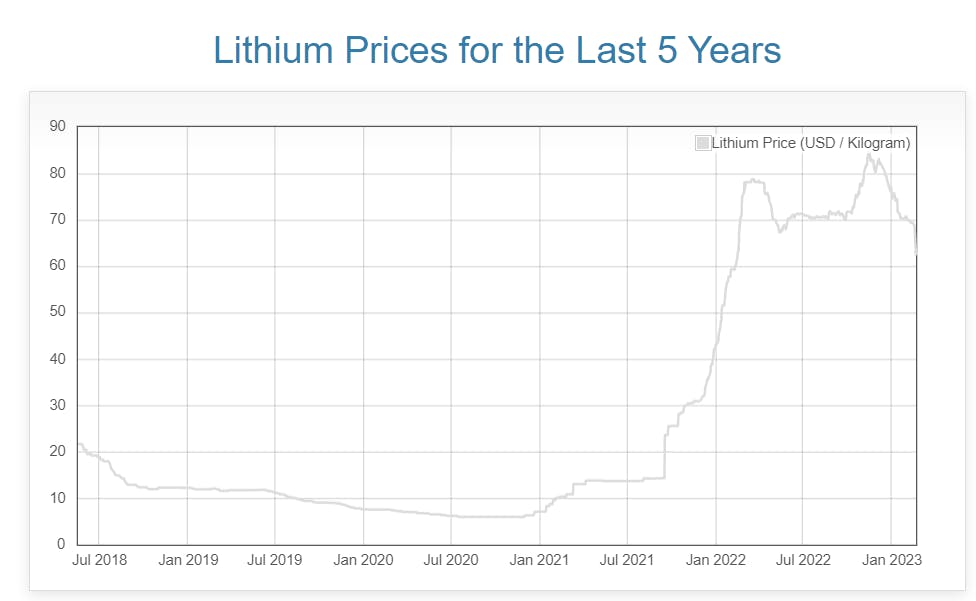
Both are impacted by different variables. For GM, the main drivers are the ASPs Tesla charges for their cars and number of cars sold less costs of goods sold such as raw materials costs, particularly lithium used in batteries. For reference, here's the 5-yr price chart of lithium ($/kg). Tesla does not break out this cost but they did refer to lithium battery demand as "quasi-infinite" and a "significant cost." It won't impact their production targets but it continues to be an unpredictable cost headwind. It also explains while there has been renewed speculation that Tesla is interested in purchasing lithium mining assets.
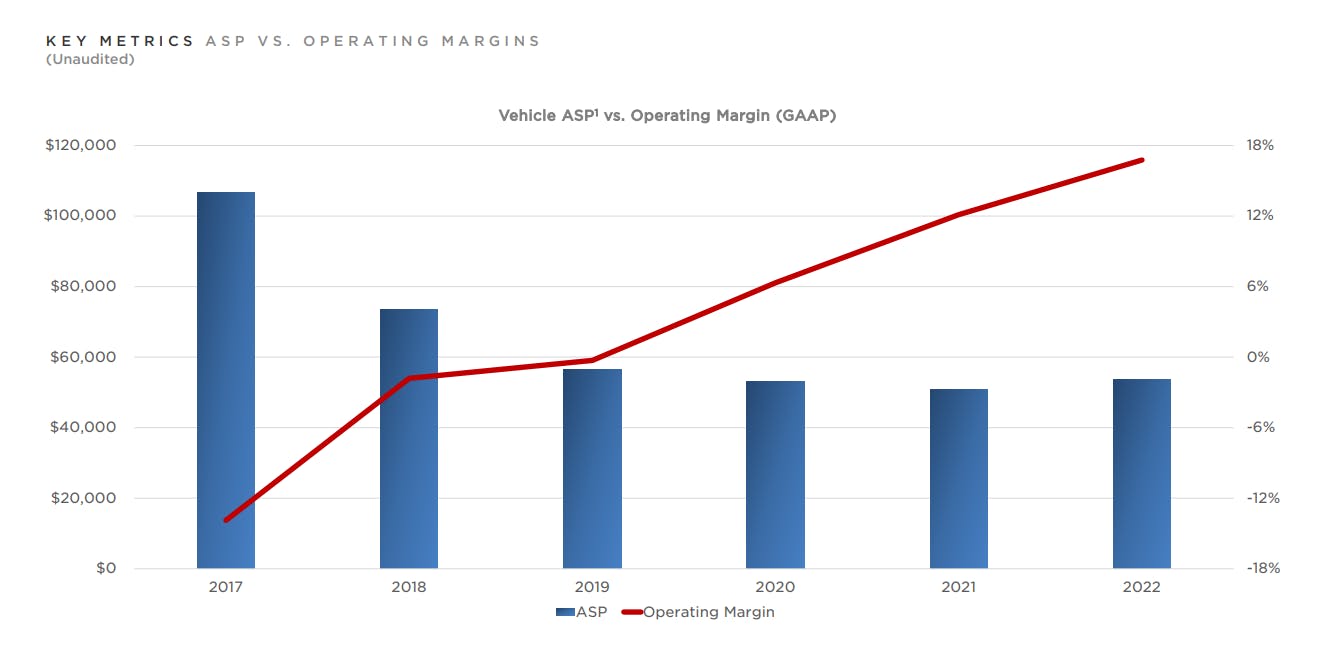
For OPM, it’s mainly related to R&D and factory ramp-up costs. Here’s a snapshot (2017 – 2022) of Tesla’s ASPs in relation to its GAAP operating margins. It’s grown from negative 14% to almost positive 17%.
The chart above demonstrates that while ASPs have come down about 40% from a little over $100k to $47k, OPM has expanded. A reflection of the immense impact manufacturing efficiency has on operating leverage from higher utilization as the number of cars produced and sold increased.
In the most recent Q4 call, Tesla discussed how their future focus would be on increasing operating margins over time. A sign of the evolution of its mindset from that of a technology company needing to invest and sacrifice short term profitability to one with a large industrials-like manufacturing footprint and supply chain focusing on costs and efficiencies. A focus that long-term investors should find appealing.
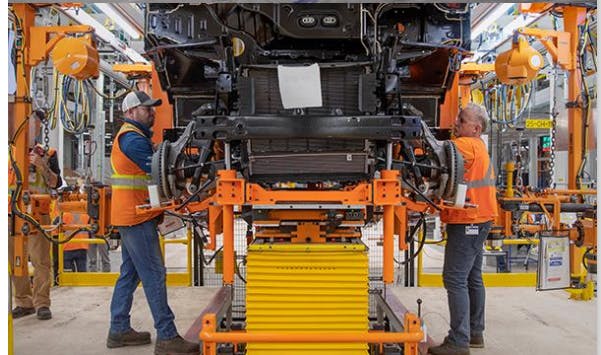
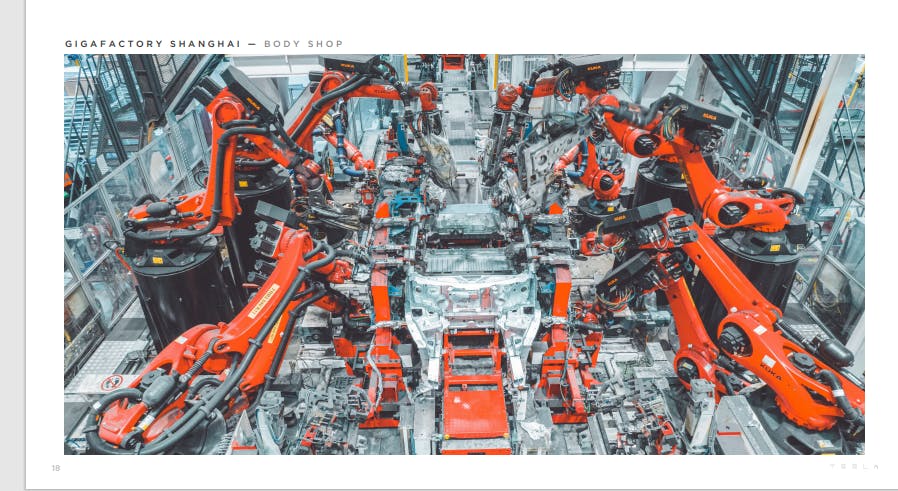
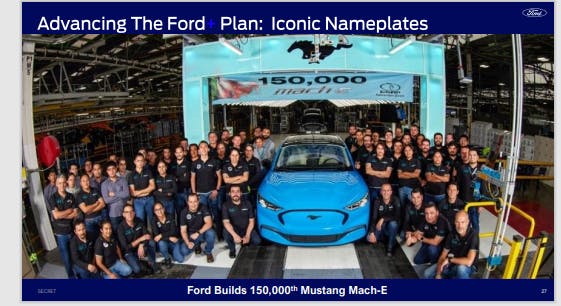
Perhaps a simple picture provides insight on how Tesla thinks about manufacturing efficiencies versus its peers. If you compare the Q422 investor presentation of Tesla to GM and Ford. There's not one picture of a human. Rather, you see high precision Kuka German robots. There's not a single robot in GM or Ford's presentation. Tesla's Q4 opm were 16% compared to GM at 8.8% (adj) and Ford at 5.8% (adj).
The I/O Fund has launched a new $99/year Premium Newsletter called "Essentials" — this newsletter delivers premium samples for our readers who want more actionable analysis for their tech portfolios. This month, we released a stock pick that we believe will be a leader in 2023 plus a video with the buy plan.$99/year Premium Newsletter$99/year Premium Newsletter called "Essentials" — this newsletter delivers premium samples for our readers who want more actionable analysis for their tech portfolios. This month, we released a stock pick that we believe will be a leader in 2023 plus a video with the buy planbuy plan.
That said, at the moment, the investment community is understandably focusing on the automotive gross margins given the recent price reductions A positive takeaway from the call was that Tesla expects ASPs to stay above $47,000 and automotive gross margin to go above 20%. Indications that automotive gross margins have bottomed. This message contributed to the stock rally (emphasis added below).
“The next question from investors is, after recent price cuts, analyst released expectations that Tesla automotive gross margin, excluding leasing and credits, will drop below 20% and average selling price around $47,000 across all models. Where do you see average selling price and gross margins after the price cuts?Tesla automotive gross margin, excluding leasing and credits, will drop below 20% and average selling price around $47,000 across all models. Where do you see average selling price and gross margins after the price cuts?
Zachary Kirkhorn, CFO:Zachary Kirkhorn, CFO:
So there is certainly a lot of uncertainty about how the year will unfold, but I'll share what's in our current forecast for a moment. So based upon these metrics here, we believe that we'll be above both of the metrics that are stated in the question, so 20% automotive gross margin, excluding leases and rent credits and then $47,000 ASP across all models.we believe that we'll be above both of the metrics that are stated in the question, so 20% automotive gross margin, excluding leases and rent credits and then $47,000 ASP across all models.
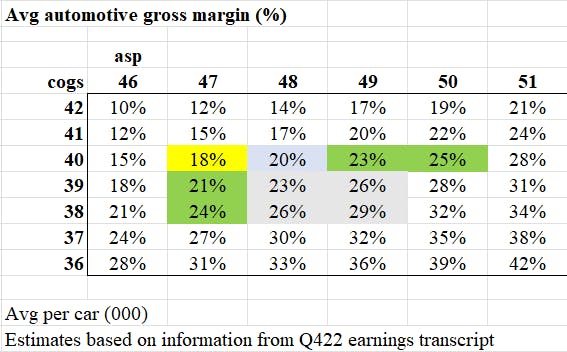
An analyst pointed out that the avg COGS per car has gone from $36,000 in mid-2021, peaking at $42,000 back to almost $40,000 currently. Estimates that management did not refute. So a very simple back of the envelope calculation comes to about 18% auto gross margins currently ($(47,000-40,000)/($40,000)). The key takeaway is that pricing and costs efficiencies will both have an impact in getting margins above 20%. For example, using the prior calculation just a $1000 increase in ASPs or $1000 decrease in COGS alone will lead to 20% auto gross margin. If both happen at the same time, that's about a 23% auto gross margin.
There was a follow-up if COGS could go back down to $36,000. This exchange provided further insight.
Excellent. Zach, actually, I'd like to follow up on the data point you just gave on cost. If I look back at the COGS per car, you guys bottom close to $36,000 in the middle of 2021. And then the number went up as you had to face with inflation in input costs and the ramp of Berlin and Texas. And this quarter, I think we are close to $40,000 and we peaked maybe close to $42,000 at some point last year.
And so my question from here is, how much time do you think it takes you to get back to this kind of $36,000, which would mean Berlin and Texas and those input costs, all that stuff is normalizing, is that like — and that would be like a kind of like a 10% decline in the COGS per car? Is that something we can hope to see this year or is that too optimistic?
Zachary Kirkhorn, CFOZachary Kirkhorn, CFO
The Austin and Berlin ramp inefficiencies in 4680 will make a substantial amount of progress on that over the course of the year, and that's within Tesla's control. We're doing a lot of work on cost reduction outside of that. And we talked about supply chain costs, expedite, logistics, attacking everything.
On the raw materials and inflation side, where lithium is the large driver there and this was a meaningful source of cost increase for us, we'll have to see where lithium prices go. And we're not fully exposed to lithium prices, but I think in general, is what we've seen from our forecast here, cost per car of lithium in 2023 will be higher than 2022. So that's a headwind that would have to be overcome to return back to those levels. So, I don't think we'll get there this year, but I think we'll make progress. And we'll continue to find ways to offset these raw material costs that we don't have control over. [Indiscernible] is there anything on that?
Furthermore, to the extent the Fed’s actions have lowered non-lithium prices, there will be a lag.
Roshan Thomas, VP of Supply Chain, added the following.
“.. on the non-cells raw material, we begin to capture benefits of indexes tapering out, but due to the length of various supply chains, it does take time before this is reflected in our financials. And while alumina is down like 20% year-over-year, steel is about 30% down year-over-year, the global non-cells raw materials market continues to be influenced by geopolitical situations in Europe, high production cost due to labor cost increases and energy spikes and disruptions due to natural disasters like typhoon in Korea four months ago, pandemic lockdowns.
So, we believe that meaningful price corrections will ultimately come, but it remains uncertain exactly when. In the meantime, we continue to redesign supply chain to make it more efficient and work with our supplier partners to find more efficiencies, streamline logistics and transportation to reduce costs.”
Below, is a simple sensitivity analysis of the impact that changes in asp and cogs per car have on automotive gross margin per car. It excludes leasing and credits. The numbers are estimates only and the primary purpose is to illustrate the magnitude these changes have on automotive gross margins. The yellow highlight is where they are estimated to be currently, blue is the minimum level Tesla has guided, green is potential upside depending on the change only in price or cogs and gray is if both change. At the moment, a change in price will likely be the main driver in automotive gross margin improvement. So, an increase in asp to 49k or 50k results in an automotive gross of 23% and 25%, respectively.
Gross Margins and Operating Margins for 2023
We outlined the variables that impact both. We will look for continued signs of stabilization in the Q123 report and further confirmation that we have seen the bottom in both.
In Q122, Tesla reported operating margins of 19.2% and ended Q422 with 16%. For 2022 it was 16.8% vs. 12.1% in 2021. If the operating margin stabilizes at a level similar to or greater than Q4, then a recovery in 2H23 is reasonable, if not sooner in Q2.
Tesla will have an investor's day on March 1st, this may provide further insight.
Long-term OPM Potential:
Tesla has not provided any medium to long-term OPM targets, but if they did, this would lead to a re-rating of the stock. The auto industry is still cyclical so that may be wishful thinking. At the moment, Tesla's OPM dwarfs its auto competition. Perhaps, we are getting closer to the point where the best comp will be other industrial companies with best in-class margins. A topic we will look at in the future.
This is what Musk had to say.
“As we mentioned many times before, we want to be the best manufacturer. But really, manufacturing technology will be our most important long-term strength. And we'll talk more about our upcoming plans at the March 1st Investor Day.”
For a point of reference, Mercedes Benz and BMW have about 13% group operating margins while Ferrari has 23%. Of course, they have different product mixes, price points and client bases but they are useful comparables to parameterize the margin potential.
In Q122, Tesla reported 19.2% operating margins. So, is a medium-term 20%+ operating margin realistic?
Another potential source of upside to margins is if Tesla acquires a lithium mining asset so that they will have better control over their lithium input costs.
Earnings Outlook
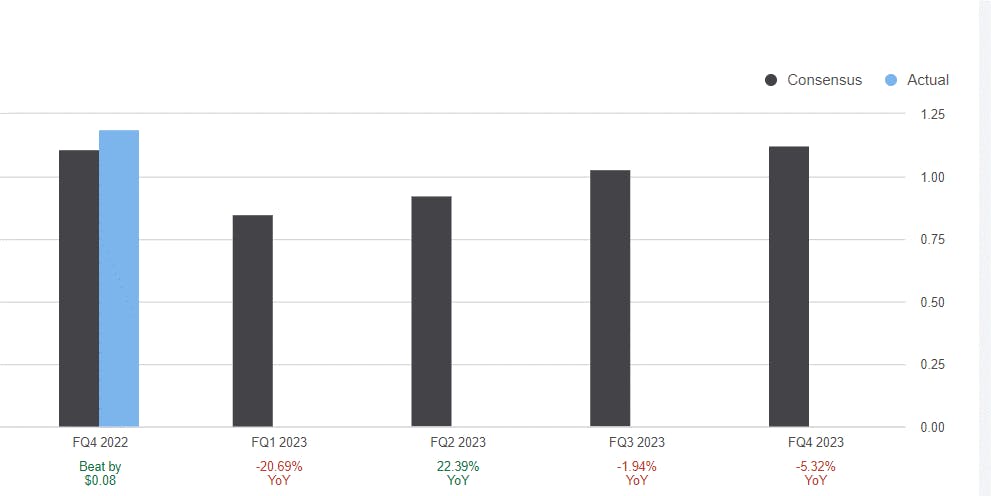
Fundamentally, analysts have reduced their adjusted 2023 EPS estimates to $3.97, compared to 2022 $4.07 EPS (actual) mainly due to a decrease in Q1 estimates. Reflecting management's guidance of operating margins similar to q422 due to recent pricing initiatives and raw materials costs but then stabilization and improvement over the course of the year. Upside to these estimates will likely come from higher ASP assumptions.
The Current Demand Outlook
One factor that contributed to the stock rally was management's comments that January orders were 2x that of production (emphasis added).
The most common question we've been getting from investors is about demand. Thus far — so I want to put that concern to rest. Thus far in January, we've seen the strongest orders year-to-date than ever in our history. We currently are seeing orders at almost twice the rate of production. So it’s hard to say that will continue twice the rate of production, but the orders are high. And we've actually raised the Model Y price a little bit in response to that.”Thus far in January, we've seen the strongest orders year-to-date than ever in our history. We currently are seeing orders at almost twice the rate of production. So it’s hard to say that will continue twice the rate of production, but the orders are high. And we've actually raised the Model Y price a little bit in response to that.”
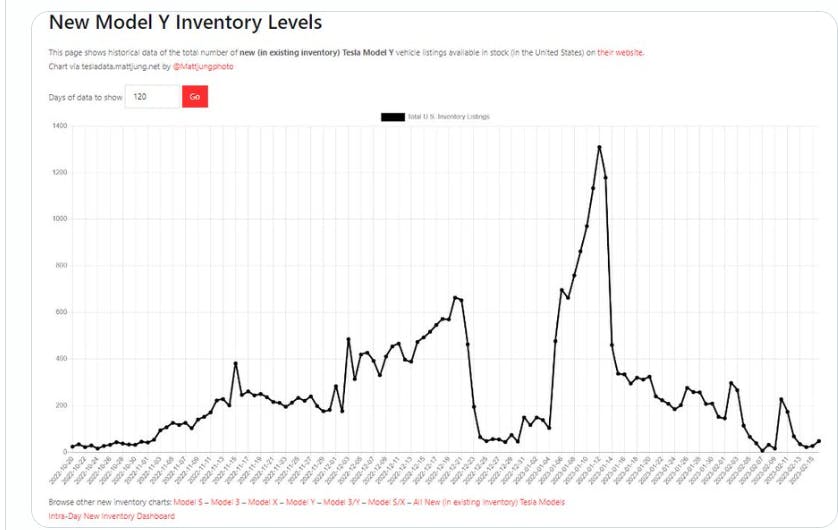
There are signs that demand has remained strong and that the combination of Tesla price cuts and changes to incentives from the U.S. government have been positive for demand. According to Electrek, the Model Y is sold out for Q1. There are no more production slots for a Y order in Q1. Estimated delivery now is April to June. Model Y levels are estimated to be low.
Demand indicators that are supportive of higher pricing and moving automotive gross margin above 20%. Recall, that a $1000 asp increase alone will get to 20%.
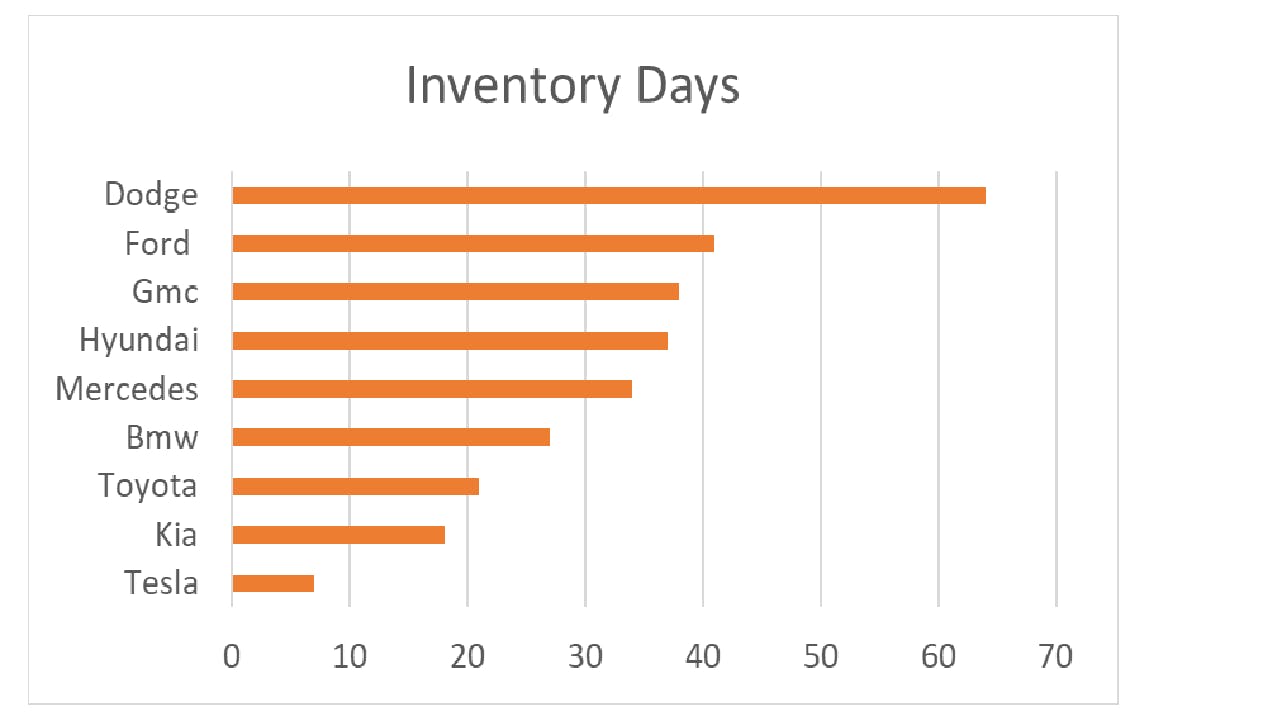
We had recently written that the decline in FCF, mainly due to an inventory build in Q4, was worth monitoring. From Q2 of last year to Q3 to Q4, it increased from 4 to 8 to 13 days of inventory. Although higher, these levels are much lower than peers. According to Statista, as of 2022 one of the highest was Dodge at 64 days. Ford had 41, GMC at 38, Hyundai at 37, BMW at 27, Toyota at 21 and Kia at 18.5 days. Here's a snapshot on how Tesla compares to its peers.
A glass half-full perspective would be that Tesla's lower inventory vs its peers is a product of their leading manufacturing capabilities. And that the recent inventory "build" (relative to its historic levels) was a reflection of their effective inventory management and anticipation of future demand in 2023.
Given the recent demand trends, we are less concerned and will check inventory levels at the end of Q1. These initial concerns were tempered by the large $20b cash balance that would allow Tesla to execute necessary investments if cash flow was tied up in inventory.
One factor that impacted Q4 cash flow that we are still looking into is the $4.4b spent on investments. Given the recent lithium asset acquisition speculation, could they be related?
More on FSD:
From a gross margin perspective, this is how Elon described (emphasis added) the impact of a customer paying for the FSD software.
Elon Musk
Yes. Something that I think some of these smart retail investors understand, but I think a lot of others maybe don't is that the — every time we sell a car, it has the ability, just from uploading software to have full self-driving enabled and full self-driving is obviously getting better very rapidly.
So that's actually a tremendous upside potential because all of those cars, with a few exceptions — I mean, only a small percentage of cars don't have Hardware 3. So that means that there's millions of cars were full self-driving can be sold at essentially 100% gross margin. And the value of it grows as the autonomous capability grows. And then when it becomes fully autonomous, that is a value increase in the fleet. That might be the biggest asset value increase of anything in history. Yeah. So that means that there's millions of cars were full self-driving can be sold at essentially 100% gross margin. And the value of it grows as the autonomous capability grows. And then when it becomes fully autonomous, that is a value increase in the fleet. That might be the biggest asset value increase of anything in history. Yeah
But it’s still a work in progress
There was recent headlines on 2/17/23 regarding concerns over the software. Tesla recalled about 300k cars and will update the software. The stock finished up over 3% for the day so the market does not seem to be concerned. But we will monitor it.
Conclusion
The recent data points have given us reasons to give more credence to Tesla’s Q4 constructive commentary around auto gross margins and company operating margins for 2023.
The next catalyst will be the March Investor Day.
Things we will be updating our premium members at I/O Fund on:
Further evidence of a stabilization in automotive gross margins and group operating margins
Demand vs. production trends through January and February
Pricing trends
Manufacturing initiatives to increase cost inefficiencies
Efforts to secure lithium assets
Recent FSD concerns
How to position now and going into Tesla’s Investor’s Day on March 1st
The 2022 bear market appears to be a large degree correction within an even larger uptrend. Like some FAANGs, this implies that when the current macro cycle ends, and a new growth cycles begins, it has a probable chance of making new all-time highs. This cannot be said about all tech.
The question the next few weeks will answer is: Has TSLA bottomed at $102, or Does TSLA have one more low around $92 before bottoming?
If we look at the structure of the 2022 decline, it appears to be incomplete. In other words, the final drop only has 4 waves in place, and implies a 5th wave drop is soon to follow. Considering that strength of Tesla's recent earnings report, this decline, if it were to unfold, would be the result of a continuation of macro forces. This cannot be ruled out.
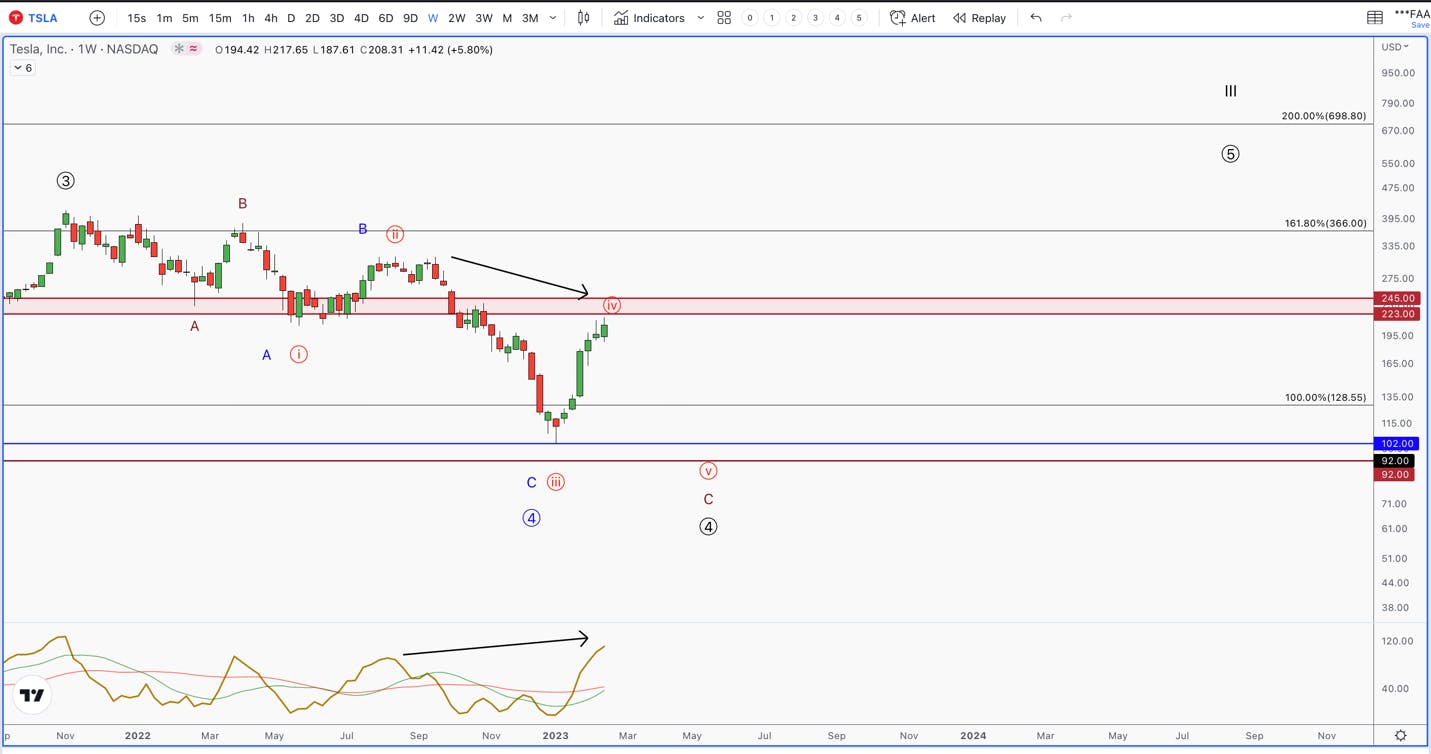
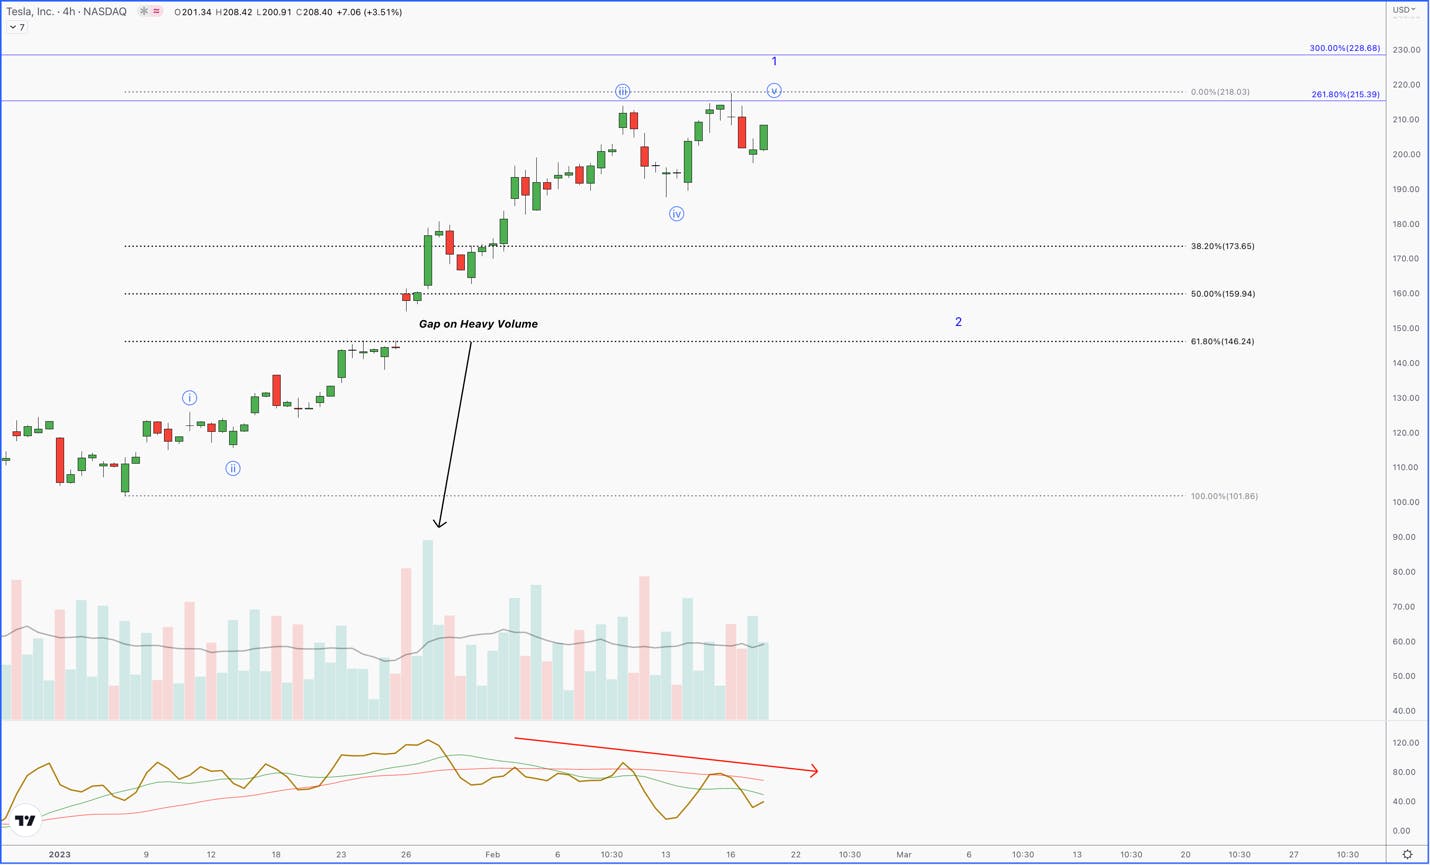
The below chart has two scenarios to address, one of which outlines this possibility. The blue count implies that TSLA bottomed at $102 and will need to make a higher low in the coming weeks/months that holds $138 and turns back up. The red scenario breaks below $138, and continues to make a slight new low into the $92 region, which would complete the large degree drawdown off the 2022 high.
In the above chart, you can see how the weekly momentum indicator is making a higher high while price makes a lower high. This is typically bearish, and a warning to anyone looking to buy TSLA at these levels.
If we zoom-in on the bounce, we have a what appears to be a bullish structure. Note the gap in the middle of the uptrend on heavy volume. This gap stayed open, and price continued higher. These gaps tend to occur in the middle of the move, which has proven to play out. We are now in the final moves of this bounce as momentum and volume continues to fade at these price levels.
If our blue scenario is in play, the coming pullback needs to hold $138. If we break below $138, the odds start to shift that the scenario in red is in play. Regardless of what plays out, we believe Tesla, Inc. is about to set up a great buying opportunity for years to come.
We issue real-time trade alerts to our research members when we enter, exit, add or trim to a stock. Our portfolio is actively managed with allocations that correlate to a stock's current technical strength or weakness, as well as the underlying fundamentals.
What's next
This Thursday at 4:30 pm Eastern, I will be holding a webinar for premium I/O Fund members to discuss how I plan to navigate the broad market, as well as various tech entries including Tesla. We offer trade alerts plus an automated hedging signal. In addition, we are holding an annual webinar on March 14th that discusses "How to Build a Defensible Tech Portfolio" Follow me on Seeking Alpha for more details.
The I/O Fund Analyst Team contributed to this article
Tech growth is a certain style of investing; it’s a mix of grand slams but more strikeouts. Value investing is a mix of singles, doubles and even bunts, but with fewer strikeouts. Investing style and risk appetite runs a large spectrum from high risk/high reward to low risk/low reward.
Similarly, there are different management styles. Datadog falls firmly in the candid, conservative style of management. They are the best-of-breed team that is least likely to overpromise and under-deliver, hence the perfect record on beating on the top line and bottom line.
Both the CEO and CFO will tell investors exactly like it is, even it’s hard to hear. This is very different from other management teams that will take risks on guidance, with the hope of meeting the numbers somehow, and will smooth over anything negative so as not to raise alarm bells.
Datadog’s guide does not necessarily foreshadow lower growth than other cloud companies that have reported, especially as we can assign a high level of probability the actual report will come in higher than the guide. Rather, it was the tone on the call that was very different. Ultimately, as we covered in our Q1 Earnings Prep Webinar, there is a lot of built-up anticipation for a H2 rebound. The rebound may or may not happen; I imagine next earnings season will be a real line in the sand given it takes place four to five months into the year.
The rebound comes from analyst estimates, so of course, analysts are keen to make sure their estimates are correct with the bulk of questions aimed at what 2023 will look like. Datadog told analysts on the call they do not see evidence of a rebound yet, and with what they know today, their guide assumes optimization will continue throughout the year. They do believe eventually optimizations will slowdown, and that cloud migration will again become a tailwind. They are unwilling to provide guidance on when this will happen.
Management specifically called out a bigger slowdown in December on usage than what they saw in October and November. So far, 2023 has more closely resembled December. They also specifically called out larger customers as the primary cohort optimizing and lowering usage and/or spend, while smaller customers are seeing little to no change. Large customers have more to gain from lowering costs, and face more uncertainty.
Datadog’s financials are similar to what we posted on the forum, which is a slowdown from this time last year (to be fair, all cloud has slowed on a YoY basis from Q1 2022 to Q1 2023E). RPO was flat but Billings were down QoQ. Datadog still has a top position for bottom line strength in best-of-breed, although notably, the bottom line has softened.
Financials:
Datadog beat estimates in the current revenue, yet guided below analyst consensus for Q1 and FY2023.
In the current quarter, revenue of $469.4 million represents growth of 44% year-over-year. This beat previous management guidance and analyst consensus of $449M, for a beat of +6% on the top line. This led to a beat on FY2022 revenue at 63% growth compared to 60.8% expected.
Guidance for Q1 is for $460 to $470 million, for growth of 28%. Due to being conservative, as discussed in the intro, the fiscal year guidance is lower than Q1 at 23.8% for $2.08 billion.
You can reasonably assume these estimates will be beaten with a 5% to 10% beat, if we rely on previous earnings surprises, but there’s no guarantees, of course.
Adjusted EPS of $0.26 comfortably beat estimates of $0.19. GAAP EPS came in at ($0.09).
Q1, Datadog management provided a guide in line at $0.22 to $0.24 compared to estimates of $0.24. For FY2023, there was a miss with guidance of $1.02 to $1.09 compared to analyst estimates of $1.13.
Cash flow was up sequentially due to seasonality yet was down on a year-over-year basis. Despite Datadog decelerating, it still ranks high on FCF margins for cloud best-of-breed. Operating cash flow margin was at 24.3% and free cash flow margin of 20.50% equaling $96.4 million in cash flow.
Let’s say we have a deeper recession than expected. Datadog is likely to survive this, but at what valuation is the question. There’s a solid chance cloud remains range bound at these valuations until there’s a return to growth, which means fluctuations up in price/down in price that ultimately provide little movement or gains. I don’t think Datadog is going to be the company that has an unpleasant surprise from an unexpected miss in their earnings report, which is my preference certainly for management style. Rather, they will take the hit up front, like we saw today.
The company has cash and marketable securities of $1.9 billion on the balance sheet with fairly high stock based compensation of $112 million.
Margins:
· Datadog has a high gross margin of 79.3%.
· GAAP operating margin beat at (7%) actual compared to (10%) guide. This is a deceleration from 3% in the year ago quarter.
· Adjusted operating margin was 18% compared to 22% in the year ago quarter.
· GAAP net margin of (6%) compares to 2% net margin
Key Metrics:
· Datadog reported RPO of 30% YoY which was flat from the previous quarter. Notably, the Q4 to Q1 quarter tends to be flat for Datadog with more variability in Q2.
· Billings softened to 31% growth YoY compared to 86% in the year ago quarter. This was a deceleration from Q3 with billings of 51%.
· Customers with ARR of > $100K grew 38% compared to 64% last year
· Customers with ARR > $1 million grew 46.7%. This is a newer metric for Datadog with no year-over-year comp available
· DBNRR is above 130 but management stated on the call they expect this to dip below 130.
Earnings Call:
In the opening remarks, the company stated the following about large customers in Q4:
“Now moving on to this quarter's business drivers. Overall, we observed slower usage growth with existing customers while continuing to scale our new logo acquisition and new product cross-sells. Starting with usage. Usage growth of existing customers in Q4 was overall slightly lower than what we observed in Q2 and Q3, which we attribute first to a continuation of cloud cost optimization by our larger spending customers; and second, to a seasonal annual slowdown in the second half of December that was more pronounced than in previous years.
As in Q2 and Q3, we continue to see more optimization from customers as a larger cloud footprint, while our smaller spending customers are exhibiting higher growth.”
The CFO later provided more color in his opening remarks:
“Next, similar to Q2 and Q3, we saw larger-spending customers grow slower than smaller spending customers. As with Q2 and Q3, we saw relatively more deceleration in the consumer discretionary vertical, particularly in e-commerce and food delivery. Geographically, we saw solid and relatively similar growth across all regions.”
And the CFO also stated this:
“We are incorporating an expectation for seasonally weaker growth in the first quarter due to the subdued growth in the month of December that creates a lower growth trajectory to start the first quarter. While our customers are continuing to expand with us, we are assuming in our guidance that cloud optimization continues to affect our expansion rate in 2023.”
In regards to Datadog’s specific business, they essentially believe they are the next in line on optimization following cloud hyperscalers. In other words, companies are optimizing with the hyperscalers now and working their way through the stack with Datadog second in line, in terms of what order makes the most sense:
“What we see, though, is that customers save money where it matters, which tends to be the very large line items, which for customers that are fairly far along into the cloud, is going to be, first, their cloud provider deals that are, again, one or two others are larger than their observability bills.
And then we're going to be affected by that and maybe with some optimization more specific to observability as well. So that's what we see there.”
Also, management clarified with analysts the slowdown (for Datadog) is not related to headcount, given the many layoffs announced, rather it’s more usage based and related to reducing budgets.
In regards to the larger trend of cloud migrations, Datadog said the following:
“So that's where we're going. I think you're right, though, that the underlying wave that is — has been a tailwind throughout the of the company was cloud migration and digital transformation. I think that we might be a bit more of a headwind over the next few quarters. But we strongly believe that it will become a tailwind again in the future.”
Conclusion:
Datadog is a company we will watch closely and return to in the future. Knowing that I can’t control macro, it feels like 2023 should be used as an opportunity to build tech generals in the belly of a recession rather than guess on companies that are reporting tapering growth (although formally were very high growth). Please note, many companies are reporting tapering growth despite the market rewarding the companies with earnings pops. This is entirely based on expectations for future growth which may or may not materialize.
It’s our preference to take advantage of the lower prices by focusing more on key tech generals for now while allowing time for smaller companies to prove their ability to withstand macro pressure. This strategy can be a win-win, because if we see a deeper recession than normal, the risk of picking the wrong company is much lower than if we bet on decelerating growth from less defensible companies. However, if we see a soft landing, then we are still positioned to participate in growth.
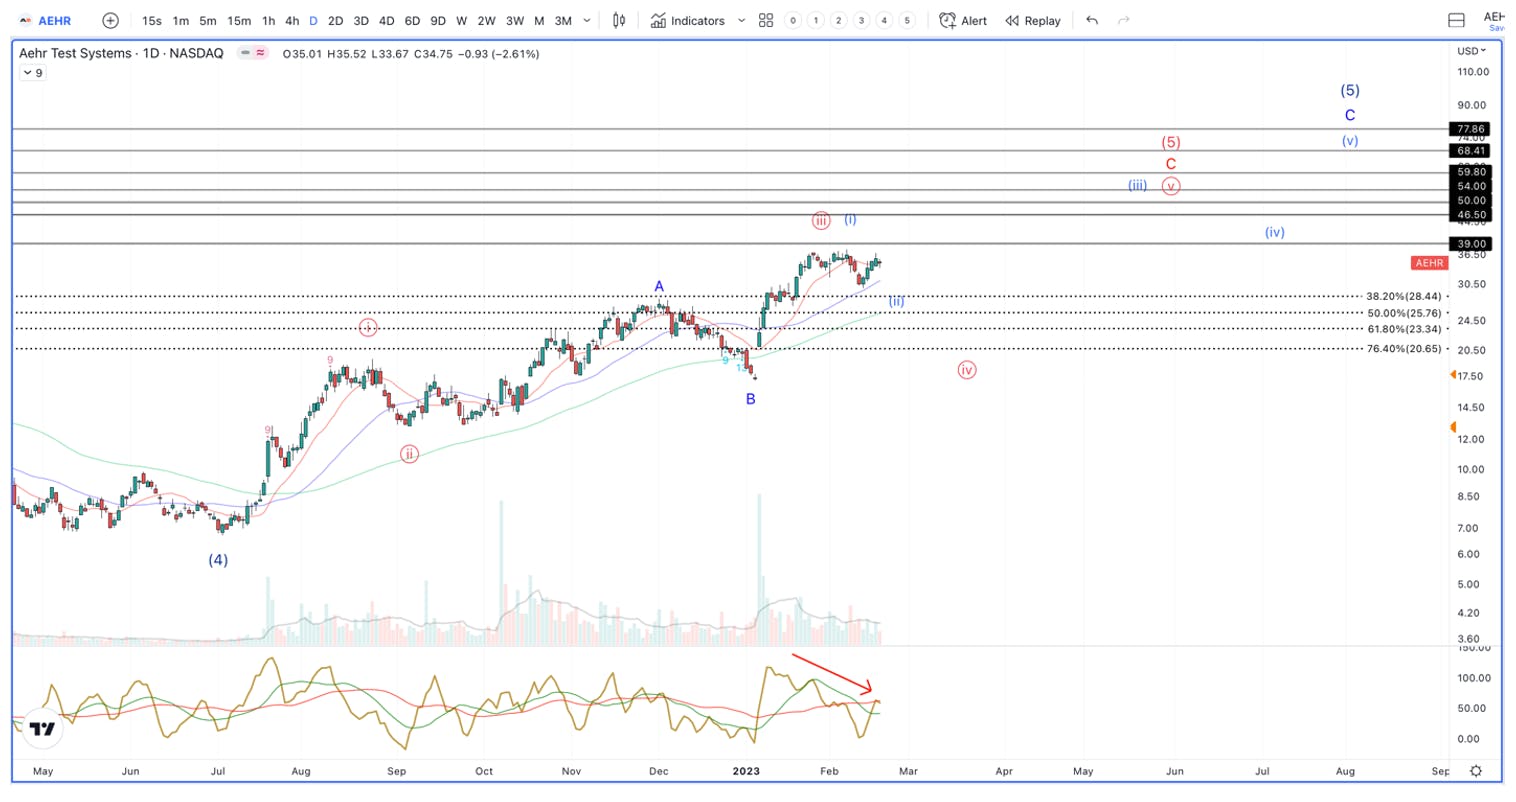
We will continue to identify outliers, such as AEHR, with a heavy focus on this in March and early April. Look forward to new coverage and deep dives coming soon as we wrap up the last of our portfolio’s earnings season next week.
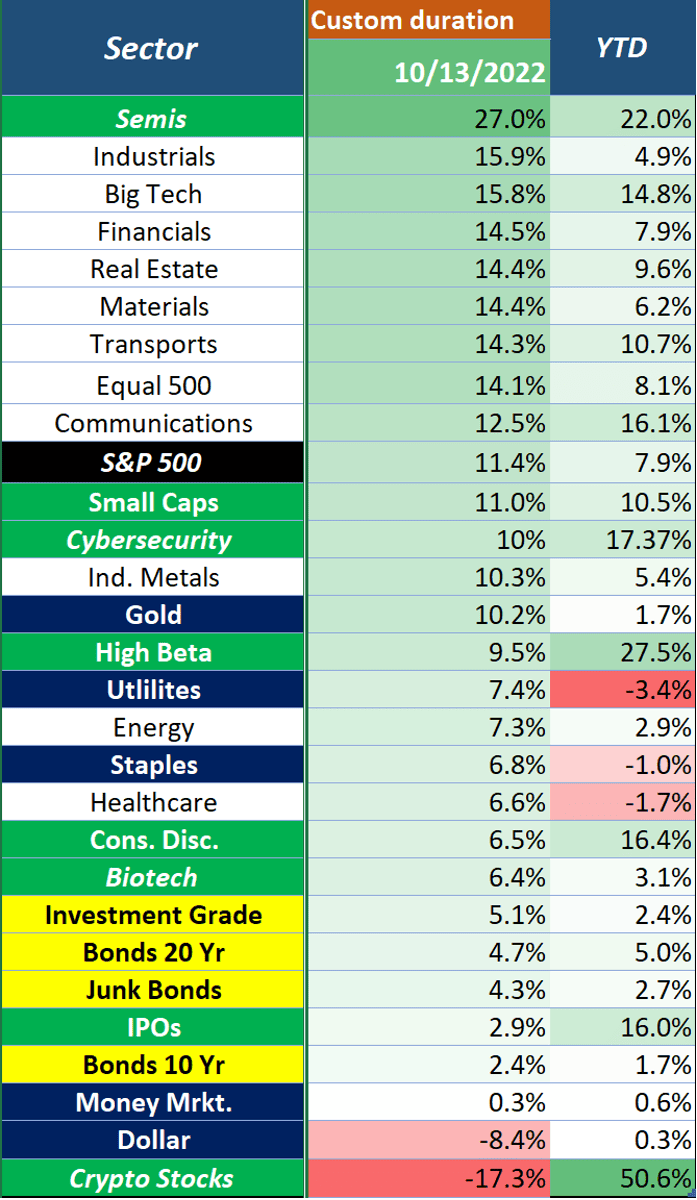
From the October 13th low, one of the best performing sectors has been semiconductors. This is a theme that we introduced in the I/O Fund Essentials video “Semiconductor Stocks Continue to Outperform Value” where we stated:
“With a rotation into value names underway, it would be easy to discard all of tech and move towards the sectors that are working. However, as we discussed last week, one specific tech sector is currently outperforming most value names – semiconductors.
This week, we provide a brief video taken from our weekly webinar where we offer a more macro context around why we like semiconductors going forward. Some markets appear to be closer to new highs than lows, and we believe that semiconductor stocks are signaling that they are ready to resume their leadership role going into 2023.
Since releasing this for our Essentials Members at the end of December, semiconductors have continued to shine. The chart below shows semis are the number one performing sector in tech.
Once of the leading stocks within this sector is Nvidia, a stock that has been a top holding in our portfolio since 2018. Notably, focusing on building Nvidia and closely managing this allocation is as relevant as ever.
We covered this last week in our February stock tip when we stated:
“Simply put, as Big Tech continues to build out hyperscale scale data centers and AI based technology, they will require specialized semiconductor chips – AI accelerator chips – to provide the necessary computing power required. At the moment, the AI chip market is a duopoly with Nvidia and AMD. However, Nvidia’s position is much larger than AMD and a “better” GPU. So as Big Tech continues these AI related investments, Nvidia is the first place Big Tech will go to buy them – namely Nvidia’s H100 GPU chip.”
Nvidia: Technical Analysis
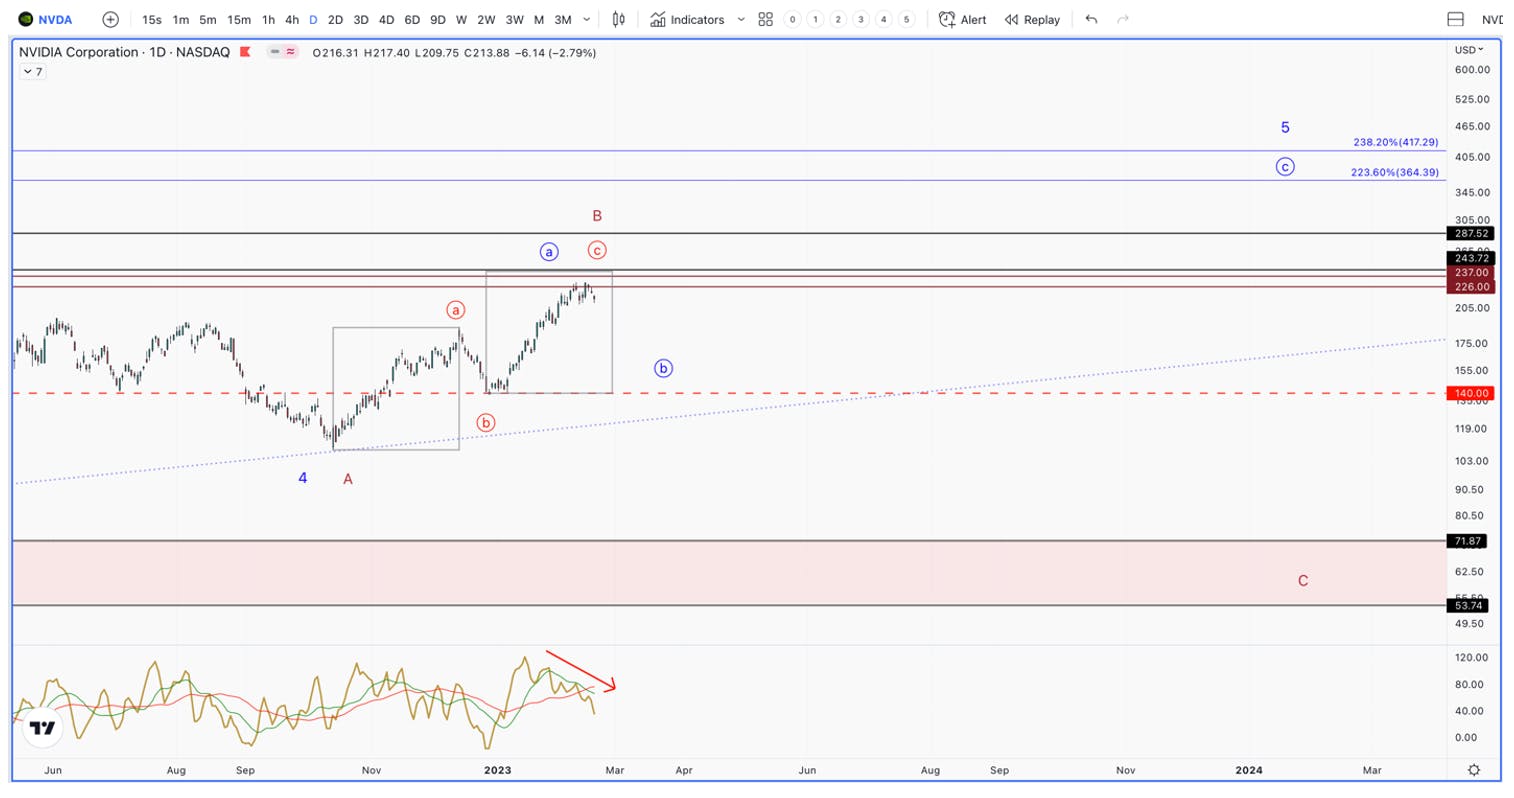
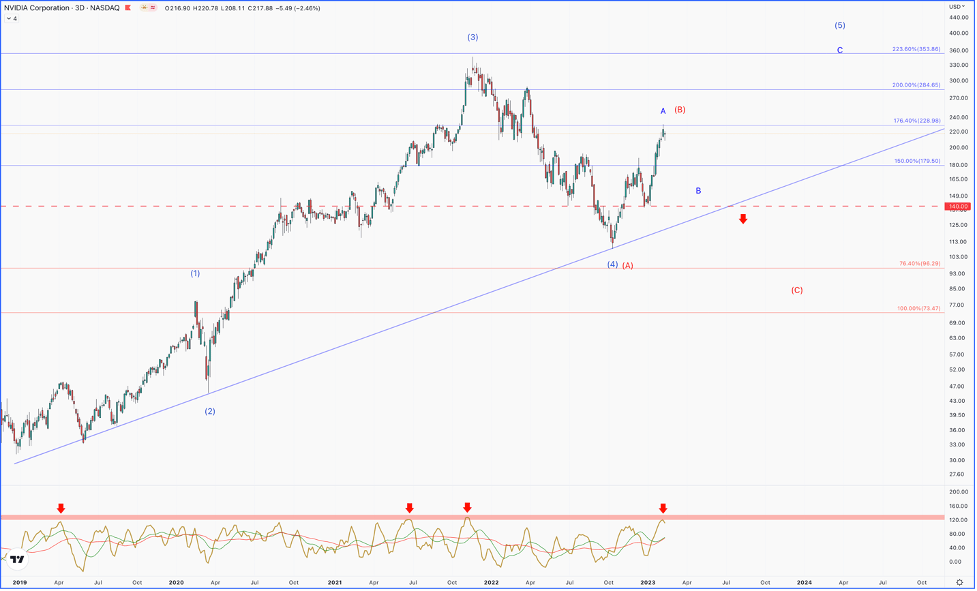
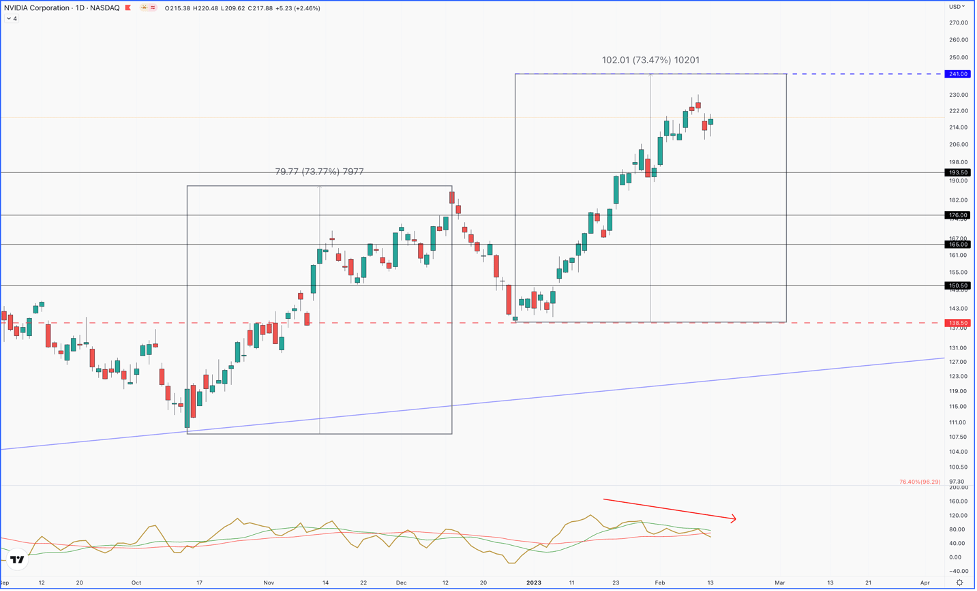
Unlike most tech names, NVDA has a probable path to new highs. The long-term technical path from the 2018 low is listed below in blue, with my alternative path in red.
The market is stretched and setting up for a pullback. This is evident with NVDA’s momentum indicator below the chart. Every time internal momentum reached these heights, and pullback soon followed. As long as the coming pullback holds the $140-$138 region, then the blue path remains valid. This path has the 2022 bear market as a pullback in a larger uptrend, targeting $355+ in the coming months. If we do break below the $140-$138 region, then the odds of this path to new highs becomes diminished, and it opens the door to the $90 region.
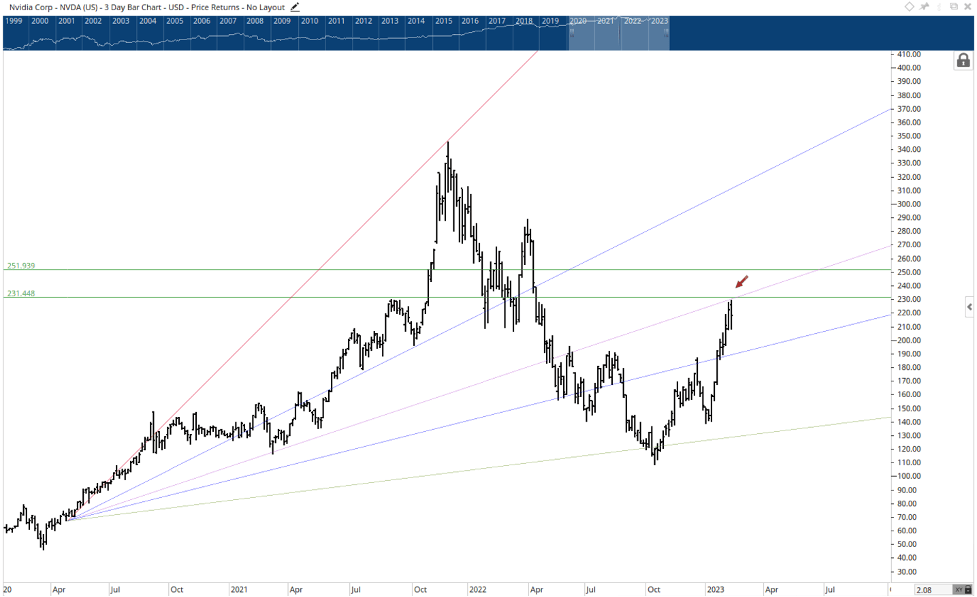
The pressing question is how much farther can NVDA run in this bounce off the October lows? The $230 region is strong resistance. There is a confluence of key angles in this region.
If we do see a breakout above the $230 region, this is not a breakout we would buy. If we zoom in on the bounce off the October lows, it is quite clear that the structure of the uptrend is only 3 waves.
A three wave move (in either direction) tends to be symmetrical, and leads to large corrective moves. In terms of symmetrical, what I mean is that the length of the 2nd move higher tends to be the length of the first move higher.
So, if NVDA does see one more high into the $241 region, this would be the exact symmetrical move where most 3 wave bounces tend to end. When you factor in that each move higher is happening with less momentum, the risk is quite elevated above $241.
Conclusion:
We see the odds of NVDA retracing back to the $170-$150 region as a high probability. We will likely look to slowly layer in around these levels. However, NVDA holding the $140-$138 region will be crucial. If this region breaks, it will open the door to the $90 region. This would coincide with the macro environment beginning to drive equities once again. As long-term investors, our plan is to keep NVDA as a high allocation in our portfolio. Our goal is to further accumulate on the coming drawdown, and we will slowly layer into this stock at key levels.
We favor buying in small layers of 1% or 2% at key levels, which we described above. This mitigates our risk if we do reach the $90 region. For example, we bought at the Nvidia low in October at $108. No matter how high our conviction may be in a specific name, macro is the primary force on stocks right now, which is why adding in small layers is even more important in 2023 than in previous years, such as 2020-2021.
Knox Ridley holds a premium webinar every Thursday where he reviews key positions, including NVDA. We cover macro charts as well as various stocks to get a clear understanding of where the market may be going and how to position for it. Learn more about Advanced Market Signals here.Advanced Market Signals here.
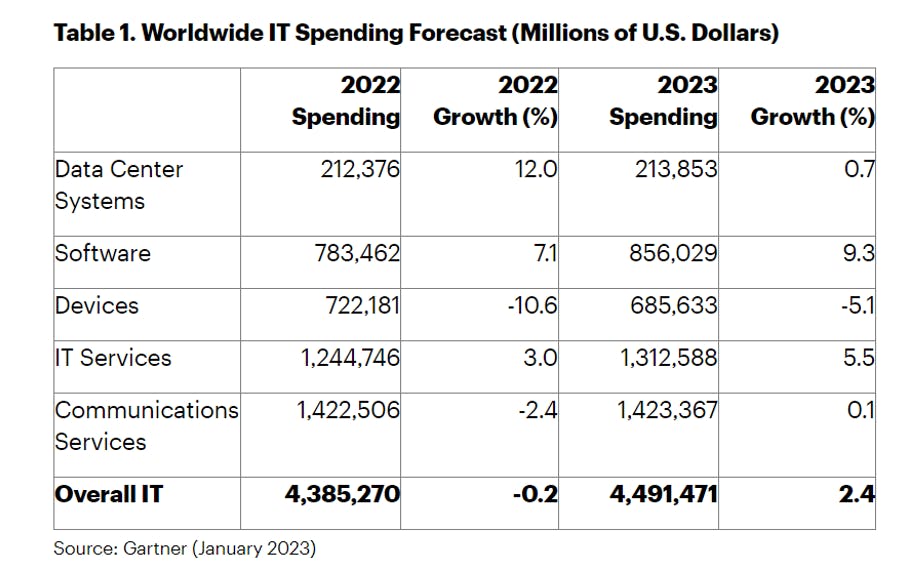
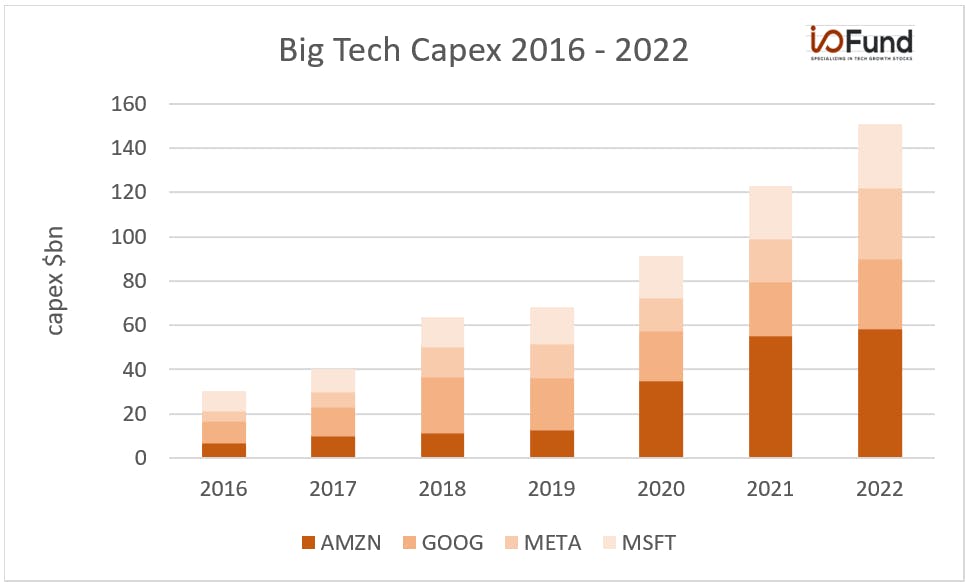
Recently, we wrote about the 2023 outlook and trends for overall IT spending and Big Tech capex. In summary, both are expected to be flat to slightly down. Here is what we said on the premium site:
“Overall, Big Tech has forecasted capex to be flat to slightly down y/y. However, an important theme was a shift toward higher ROI capex such as technical infrastructure and reduction in lower ROI capex, such as office facilities. After embarking on an aggressive capex program in 2021 and 2022, Big Tech has taken a pause to reassess their cost base and to reprioritize capex in light of the current macro environment.
Put another way, the size of the capex pie isn’t expected to grow in 2023 compared to 2022, but the slice spent on technical infrastructure (i.e. Cloud and AI), will grow at the expense of labor, office facilities etc. A change in capex mix that we believe is supportive in the medium-term of NVDA and AMD.”
There is a collective shift from higher return capex at the expense of lower return capex. From an investing perspective, the key takeaway is to identify markets where demand continues to be driven by secular demand and avoid those facing cyclical demand headwinds. For example, there is continued demand for Hyperscale Data Centers and AI related investments while the memory sector is grappling with weaker consumer related demand exacerbated by excess inventory.
The key theme from Big Tech Q422 commentary was the strategic importance and focus on AI investments to enhance their competitive positioning. Here at I/O Fund, we have continually looked for opportunities to invest in this secular theme and identify companies with strong market positions and competitive product offerings led by focused management teams with an identifiable investment catalyst.
With that in mind, we thought it would be worthwhile for our readers to revisit our positive investment thesis on Nvidia. It’s one of our largest core positions.
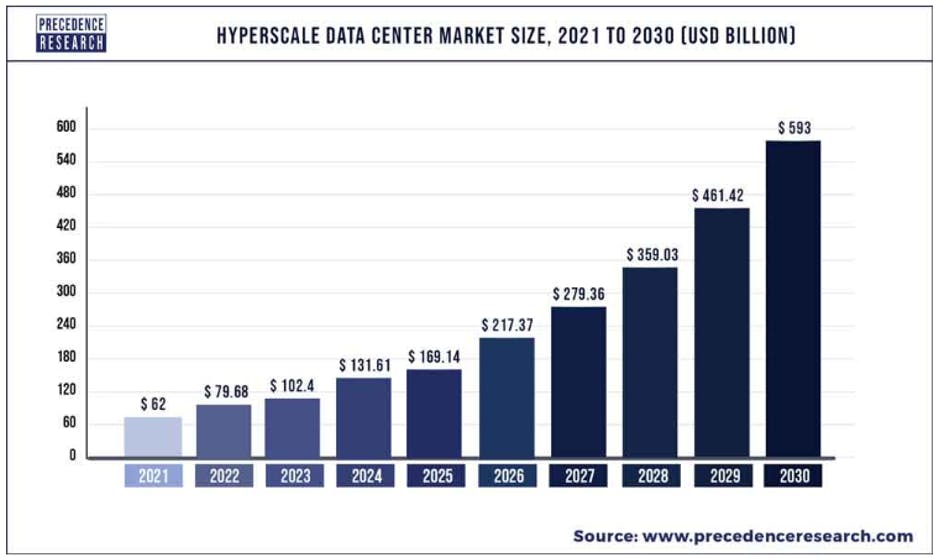
Simply put, as Big Tech continues to build out hyperscale scale data centers and AI based technology, they will require specialized semiconductor chips – AI accelerator chips – to provide the necessary computing power required. At the moment, the AI chip market is a duopoly with Nvidia and AMD. However, Nvidia’s position is much larger than AMD and a “better” GPU. So as Big Tech continues these AI related investments, Nvidia is the first place Big Tech will go to buy them – namely Nvidia’s H100 GPU chip. (Note: Later in the year, AMD will release a GPU to rival Nvidia and we will cover this for you including correct timing as the I/O Fund has predicted every twist and turn AMD has taken in its enormous comeback against Intel – for now, Nvidia has a near monopoly on GPUs for AI acceleration.)
Given the market dynamics outlined above, here is how Nvidia’s CEO Jensen Huang described the AI market opportunity in response to a question by Vivek Arya around the overall capex outlook. Huang’s comments focused on Nvidia driving growth from AI acceleration, rather than general purpose computing. This implies that capex can be flat while Nvidia will be serving the most valuable piece in the stack. AI acceleration, according to the CEO, will not be flat or down. A similarly positive tone echoed by Big Tech.
“And then, Jensen, the question for you. A lot of concerns about large hyperscalers cutting their spending and pointing to a slowdown. So if, let’s say, U.S. cloud capex is flat or slightly down next year, do you think your business can still grow in the data center and why?”
“Vivek, our data center business is indexed to two fundamental dynamics. The first has to do with general purpose computing no longer scaling. And so, acceleration is necessary to achieve the necessary level of cost efficiency scale and energy efficiency scale, so that we can continue to increase workloads while saving money and saving power. Accelerated computing is recognized generally as the path forward as general purpose computing slows. The second dynamic is AI. And we’re seeing surging demand in some very important sectors of AIs and important breakthroughs in AI.”
“And so, you could see that our company is indexed to two things, both of which are more important than ever, which is power efficiency, cost efficiency and then, of course, productivity. And these things are more important than ever. And my expectation is that we’re seeing all the strong demand and surging demand for AI and for these reasons.”
In light of Big Tech’s focus on higher return capex, Jenson’s comment was very informative on how Nvidia stands to benefit from Big Tech’s change in capex mix. As Big Tech continues to invest in AI infrastructure, they will need chips that provide the highest computing power and productivity with the most efficiency. At the moment, Nvidia’s H100 is the best AI chip to fulfill these requirements.
How will Nvidia benefit?
The key investment catalyst for Nvidia is the adoption and implementation of the H100 GPU by its customers.
So without getting too technical, here is an outline of the medium and long term investment thesis.
Nvidia’s March 2022 introduction of the Hopper H100 GPU with 80bn transistors – 48% more than Nvidia’s A100 with 54 billion – is a game-changer. Simply put, more transistors means faster speeds and increased computing power
H100 is 6x faster and its performance is 2-3x better than Nvidia’s prior A100 GPU. H100 has 50% more memory and interface bandwidths. Higher bandwidth will create more demand for their software in the future. The ability for the GPU to connect directly to the network will avoid CPU bottlenecks
The A100 has led company gains since Q22020, now the H100 will lead the next leg of growth. In the most recent Q322 investor call, management indicated H100 will quickly overtake A100
H100 will power AI based and high performance computing systems. There are four layers to Nvidia’s full stack accelerated computing: hardware (AI accelerators), system software, platform software and applications. Overtime, this position will enable Nvidia to monetize more of the software stack due to vendor lock-in effects. In the Q322 call, management indicated this is effectively starting “now” at the enterprise level
Over the long term, Nvidia will combine its hardware offering with software component primarily targeting the auto industry
Nvidia is taking a play out of Apple’s playbook that helped it’S market cap grow to 2 trillion. Nvidia’s goal is to leverage their dominate position in hardware to capture the lion’s share of the software. That’s exactly what Apple did with mobile devices and software related apps and services.
Most importantly, and not covered at the level it deserves (or at all by the media), Nvidia is going to be an AI software leader. This marks a monumental shift for a company that is traditionally hardware-only. We have written about this long-term opportunity for our premium subscribers here.
This transformation has not yet been appreciated by Wall Street nor reflected in the stock price. Nvidia’s 2022 Investors presentation identified a $300B Market opportunity.
To use a baseball analogy, Nvidia has just begun the first inning of this transformative process.
Upcoming catalysts
Nvidia is up about 52% ytd and is due to report earnings on 2/22/23. We will be looking for continued signs that gaming has bottomed, adoption trends of H100 and whether management expects a 2H23 bounce similar to what their peers guided for. We’ll touch upon these topics after the company report earnings.
It is important to note that Gaming is still an important business for Nvidia for its earnings contribution. Gaming’s exposure to consumer-related hardware products like PCs and gaming consoles has historically been the source of cyclical growth concerns and stock volatility around earnings releases. Future growth will not come from gaming, where Nvidia is already a mature, market leader. Nvidia’s 2022 Investor’s Presentation provided future estimates which detail how consumer exposure should become less of a concern to investors. Overtime, Nvidia will transform from a gaming to an AI software focused company.
There were signs that gaming weakness had bottomed in Q322 and the market may still be focused on that in Q422. Our main focus will be on H100. If the nascent signs of H100 adoption seen in Q3 continue to grow, this will increase our conviction on Nvidia and it will begin to get attention from Wall Street it deserves as 2023 unfolds.
Why 2023 May be a Strong Year for Nvidia:
Big Tech is not immune to the weaker macroeconomy nor consumer. This has been evident in their earnings releases. For Big Tech’s next capex act, their commentary focused on shifting capex to higher ROI investments with a focus on cost efficiency. These comments have increased our conviction that investments in AI are a key strategic priority and will continue.
From an investing perspective, it supports our investment thesis in Nvidia and AMD. Nvidia’s new H100 GPU chip has positioned it to benefit from the buildout in AI related and hyperscale data center infrastructure. Critically, given their dominant market position in AI chips, this will enable Nvidia to then monetize and gain a greater share in the software stack. In addition, AMD plans to commercially release its MI300 GPU this year.
Per the most recent AMD earnings call:
“MI300 will be the industry's first data center chip that combines a CPU, GPU and memory into a single integrated design, delivering 8x more performance and 5x better efficiency for HPC and AI workloads, compared to our MI250 accelerator currently powering the world's fastest supercomputer. MI300 is on track to begin sampling to lead customers later this quarter and launch in the second half of 2023.”
In the most recent earnings report, Nvidia management commented that the H100 adoption rate and software monetization at the enterprise level is happening faster than expected.
This month, keep an eye out for technical analysis from Knox Ridley, where he will go over how he plans to manage the Nvidia position in the portfolio. On a side note, he nailed Nvidia’s bottom with an entry of $108.51 on October 13th with a real-time trade alert. You will get his very best technical analysis on a leading position in the portfolio that the analyst team believes will fundamentally stand apart this year. Stay tuned for this!
In addition, Essentials Members will receive an earnings update on Nvidia following the earnings report to better gauge 2023 timing and entries.
We can’t urge you enough to take your time with each stock as too many research services pump out content for content’s sake. We are a real, live portfolio that is audited, and we show you the exact process we follow to make smart investing decisions. For the February stock pick, we want to drill down deep so our readers get top notch coverage of one of our highest conviction holdings. Don’t be surprised if you get more Nvidia coverage this month rather than moving on quickly to another name. Institutions take months to research a stock, and this level of depth is exactly what we bring to retail investors.
Have a wonderful weekend and we will see you next week!
In the past, we have written about the importance of Big Tech’s capex programs and its impact on demand for semiconductors. Particularly in 2021 and 2022, where there was a significant increase in data center and cloud computing related capex. It has been our position that Big Tech capex – which includes Google, Meta, Amazon and Microsoft – is a leading indicator for AI semiconductor companies and has been a secular tailwind for our holdings such as Nvidia and AMD. Now that Big Tech have reported their fiscal 2022 earnings, we thought it’d be a good time to review the 2023 capital expenditure outlook for the IT market and Big Tech.
2023 IT Market Spending Forecasts
In January 2023, Gartner released their 2023 forecasts for overall IT spending. Gartner forecasts growth of $4.5 trillion, an increase of 2.2% from 2022. Looking at the breakdown, Software and IT services continue to see meaningful y/y growth. Meanwhile, after exhibiting healthy 12% growth in 2022, Data Centers is forecasted to be almost flat at 0.7% in 2023. Devices continues to be negatively impacted by inflationary pressures impacting consumer demand.
In contrast to Gartner’s 2023 forecast of flat growth in overall Data Center spending. The growth in Hyperscale Data Centers is forecasted to grow at levels that vastly outpaces Data Centers. Hyperscale Data Centers are large data centers operated by Amazon, Microsoft and Google.
According to Precedence Research, The global hyperscale data center market size was estimated at USD 62 billion in 2021 and is expected to hit around USD 593 billion by 2030, a forecasted growth rate (CAGR) of 28.52% during the forecast period 2022 to 2030.
This growth is also reflected in forecasts for the Artificial Intelligence Chip market. In December 2022, Allied Market Research forecasts that the global artificial intelligence chip market will grow from $11.2 billion in 2021 to reach $263.6 billion by 2031, growing at a CAGR of 37.1% from 2022 to 2031. AI chips – supplied by Nvidia and AMD – will provide the computing power necessary to drive these hyperscale data centers.
Big Tech FY2023 Earnings Commentary
How did the recent Big Tech commentary on 2023 capex align with these market forecasts? Overall, Big Tech has forecasted capex to be flat to slightly down y/y. However, an important theme was a shift toward higher ROI capex such as technical infrastructure and reduction in lower ROI capex, such as office facilities. After embarking on an aggressive capex program in 2021 and 2022, Big Tech has taken a pause to reassess their cost base and to reprioritize capex in light of the current macro environment.
Put another way, the size of the capex pie isn’t expected to grow in 2023 compared to 2022, but the slice spent on technical infrastructure (i.e. Cloud and AI), will grow at the expense of labor, office facilities etc. A change in capex mix that we believe is supportive in the medium-term of NVDA and AMD.
In 2016, Big Tech in total spent $30b in capex, in 2022 they spent $150b, a five-fold increase. Big Tech commentary indicates 2023 capex will be flat to slightly lower than 2022.
What did FAAMG say about 2023?
Alphabet:
Google spent $31.5b on capex in 2022 compared to $24.6b in 2021 and forecasted 2023 to be at a similar level to 2022. Although the forecasted growth rate in capex is lower than historical levels. Management commentary around capex was very telling on where the priorities lay. On the Q422 call, management referenced AI a total of 56 times in relation to its importance to the future growth of the company. Here are a few snippets that stood out with an emphasis on AI being Google’s #1 priority.
Sundar Pichai, CEO
I'll focus on two major things today in a bit more detail, and then I'll give a shorter-than-usual quarterly snapshot from across our business. First, how we unlock the incredible opportunities AI enables for consumers, our partners and for our business; and second, how we focus our investments and make necessary decisions as a company to get there … the AI opportunity ahead. AI is the most profound technology we are working on today. Our talented researchers, infrastructure and technology make us extremely well positioned, as AI reaches an inflection point.
Our AI is a powerful enabler for businesses and organizations of all sizes and we have much more to come here. There's a few flavors of this. Google Cloud is making our technological leadership in AI available to customers via our Cloud AI platform, including infrastructure and tools for developers and data scientists like Vertex AI.
AI also continues to improve Google's other products dramatically
On the AI side, it is a really exciting time. I think we've been investing for a while, and it's clear that the market is ready. Consumers are interested in trying out new experiences. I think I feel comfortable with all the investments we have made in making sure we can develop AI responsibly.
Philip Schindler, CMO
Going forward, we are focused on growing revenues on top of this higher base through AI-driven innovation. Sundar highlighted the incredible opportunities underway with AI and the transformative impact it will have on businesses. Already, breakthroughs in everything from natural language understanding to generative AI are fueling our ability to deliver results that drive meaningful performance for advertisers and are useful to users.
Ruth Porat, CFO
And as I indicated in opening comments, when we look at capex for 2023, we do expect it's going to be generally in line with 2022 with an important mix shift. We're increasing our investments in technical infrastructure. And that's not just for AI. That's to support investments across Alphabet, in particular in Cloud as well. And at the same time, we're meaningfully decreasing our capex for office facilities.
With AI, this is obviously an Alphabet strategic priority, and we see huge opportunity ahead
Meta:
For Meta, capital expenditures, including principal payments on finance leases, was $32b billion for 2022 compared to $19.3b in 2021. 2022 capex was driven by investments in servers, data centers and network infrastructure. Meta forecasted 2023 capex to be between $30-33b down from their prior guidance of $34-37b. Similar to Google, management commentary around AI and capex was very telling on where the priorities lay.
Mark Zuckerberg, CEO
Now before getting into our product priorities, I want to discuss my management theme for 2023, which is the Year of Efficiency. We closed last year with some difficult layoffs and restructuring some teams. And when we did this, I said clearly that this was the beginning of our focus on efficiency and not the end. And since then, we have taken some additional steps, like working with our infrastructure team on how to deliver our roadmap while spending less on capex
And next, I want to give some updates on our priority areas. Our priorities haven’t changed since last year. The two major technological waves driving our roadmap are AI today and over the longer term, the metaverse.
AI, it’s the foundation of our discovery engine and our ads business. And we also think that it’s going to enable many new products and additional transformations in our apps. Generative AI is an extremely exciting new area with so many different applications. And one of my goals for Meta is to build on our research to become a leader in generative AI in addition to our leading work in recommendation AI.
Yes, I can start with generative AI. Yes, I think this is a really exciting area. And I mean, I’d say the two biggest themes that focused on for this year and one is efficiency and then the kind of the new product area is going to be the generative AI work.
A lot of the trends that we are seeing here is, we are using larger models, which require more computation. We have shifted the models from being more CPU-based to being GPU-based
There is a positive readthrough on Zuckerberg’s comment on the shift from CPU to GPU models. This could potentially benefit Nvidia and their H100 GPU.
Susan Li, CFO
Turning now to the capex outlook for 2023, we expect capital expenditures to be in the range of $30 billion to $33 billion, lowered from our prior estimate of $34 billion to $37 billion. The reduced outlook reflects our updated plans for lower data center construction spend in 2023 as we shift to a new data center architecture that is more cost efficient and can support both AI and non-AI workloads
So we’re shifting our data centers to a new architecture that can more efficiently support both AI and non-AI workloads. And that’s going to give us more optionality as we better understand our demand for AI over time. Additionally, we’re expecting that the new design will be cheaper and faster to build than previous data center architecture. Along with the new data center architecture, we’re going to optimize our approach to building data centers. So we have a new phased approach that allows us to build base plans with less initial capacity and less initial capital outlay, but then flex up future capacity quickly if needed. We’re still planning to grow AI capacity significantly, and that connects
The current surge in capex is really due to the building out of AI infrastructure, which we really began last year and are continuing into this year. We will be measuring the ROI of these AI investments, and their returns will continue to inform our future spend. Our intention is still to bring capex as a percent of revenue down, but capital intensity in the nearest term is really going to depend, in part, on the revenue outlook and our needs to further build AI capacity for future demand
Javier Olivan, COO
I think if you look at the strategy on ads, we really have two parts, which is continue investing in AI and that’s where we are seeing a lot of the improvement in ads relevance.
Microsoft:
For Microsoft FY 2022 capex, including assets acquired under financial leases, was $29.2 and compared $24.2 to FY 2021. For FY 2023, Microsoft has stated “… we expect a sequential decrease on a dollar basis with normal quarterly spend variability in the timing of our cloud infrastructure buildout.”
Satya Nadella – Chairman and Chief Executive Officer
The age of AI is upon us and Microsoft is powering it. We are witnessing non-linear improvements in capability of foundation models, which we are making available as platforms. And as customers select their cloud providers and invest in new workloads, we are well positioned to capture that opportunity as a leader in AI. We have the most powerful AI supercomputing infrastructure in the cloud. It’s being used by customers and partners like OpenAI to train state-of-the-art models and services, including ChatGPT.
Amazon:
For Amazon, capex including equipment financial leases, was $58.3b in 2022 compared to $55b in 2021. These expenditures primarily reflect investments in technology infrastructure. In the past, management has indicated that about 50% of total capex has gone toward infrastructure. Management gave no guidance for 2023 other that these investments will continue.
Conclusions
Big Tech is not immune to the weaker macroeconomy nor consumer. This has been evident in their earnings releases. For Big Tech’s next capex act, their commentary focused on shifting capex to higher ROI investments with a focus on cost efficiency. These comments have increased our conviction that investments in AI are a key strategic priority and will continue.
From an investing perspective, it supports our investment thesis in Nvidia and AMD. Nvidia’s new H100 GPU chip has positioned it to benefit from the buildout in AI related and hyperscale data center infrastructure. Critically, given their dominant market position in AI chips, this will enable Nvidia to then monetize and gain a greater share in the software stack. In addition, AMD plans to commercially release its MI300 GPU this year.
Per the most recent AMD earnings call:
“MI300 will be the industry's first data center chip that combines a CPU, GPU and memory into a single integrated design, delivering 8x more performance and 5x better efficiency for HPC and AI workloads, compared to our MI250 accelerator currently powering the world's fastest supercomputer. MI300 is on track to begin sampling to lead customers later this quarter and launch in the second half of 2023.”
In the most recent earnings report, Nvidia management commented that the H100 adoption rate and software monetization at the enterprise level is happening faster than expected. We will further outline how Nvidia is well positioned to benefit from this spending in AI and what to look for in Nvidia’s upcoming earnings report. We’ve recently covered AMD here.
Please note: the Product Road Map and Earnings Call information was updated on Wednesday, Feb 8th with the transcript.
I recently wrote there would be very few perfect earnings reports this quarter when we covered Tesla. Fast forward two weeks, and Enphase gave us a perfect earnings report this evening. The company beat on the top line, the bottom line, and expanded its margins.
When analysts tried to poke holes into a potentially weaker Q2, management said they were “cautiously optimistic” about Q2 with quite a bit of time dedicated to reasons California NEM 3.0 may not weigh on the results as much as anticipated. The reasons 2023 may be stronger than anticipated include United States manufacturing that results in IRA credits, Europe and Latin America growth, and California’s NEM 3.0 pushing residential toward batteries, which is a strength for Enphase.
Financials
The earnings report provided by Enphase is rare in this macro environment. The company beat and raised with expanding margins. Not only was it a beat and raise, but revenue growth is accelerating on a YoY basis (at least for now).
Revenue came in at $724.6 million for growth of 75.5% compared to 70% growth expected. For next quarter, the company is guiding to $700 to $740 million, above the $680 million analysts were expecting. At the midpoint, this will be 63.1% growth, which is nearly 10% higher growth than consensus of 54% for Q1.
On a year-over-year basis, this marks an acceleration from 2021 Q4’s growth rate of 55.8% and 2022 Q1’s growth rate of 46%. It’s quite a feat in the current market to accomplish this while growing the bottom line.
Notably, FY2022 revenue growth came in at 68.8% compared to revenue growth of 35.3% expected for FY2023. I’m sure we will see the FY2023 consensus updated soon to reflect the Q1 raise.
EPS beat with $1.51 reported compared to $1.26 expected. Margins were strong this quarter and are looking strong next quarter, per management guidance.
What remains in question is Q2 and there were many questions about this on the earnings call, which I will detail below when the transcript comes out. I do want to say there’s plenty on the product road map to offset a potential slowdown in United States residential. Yet, it’s prudent to weigh both sides and to be prepared if Q2 is “less strong” than Enphase investors are accustomed to.
Margins:
On a year-over-year basis, the margins are expanding. In some cases, the margins nearly doubled year-over-year.
GAAP Gross Margin of 42.9% compares to 39.5% in the year ago quarter. Adjusted gross margin also expanded by 350 basis points (bps).
GAAP Operating Margin of 21.6% compares to 14% in the year ago quarter. The adjusted operating margin expanded by 700 bps.
GAAP Net Margin of 21.2% compares to 12.7% in the year ago quarter. The adjusted net margin expanded by 440 bps.
Cash Flow:
Cash flow margins also increased both year-over-year and sequentially. Notably, Q4 is a stronger quarter seasonally than Q3.
Operating cash flow of $253.7 million for a margin of 35% up from 23.5% in the year ago quarter. This is also 650 bps higher than Q3.
Free cash flow of $237.3 million for a FCF margin of 32.7% up from 20.3% a year ago. This is also 450 bps higher than Q3.
The company has $1.61 billion in cash and $1.29 billion in debt. The company paid $77 million in stock based compensation.
Product Road Map:
· The third-generation battery will be released in North America and Australia in the second quarter. This is the battery that management is saying will support a softer landing from NEM 3.0 when analysts about California-related concerns. The battery has 5KW modularity and 2X the power of the existing battery. Due to this, management has stated “we expect our battery business to perform well in the second half of the year”
· EV chargers were discussed in the comments on the forum here. The IQ smart EV chargers will ship in the United States in Q2. There is also a new bidirectional charger on the product road map for early 2024. These bidirectional chargers can receive power from a residence or grid and also send power back to a residence or grid. Read more here. The battery storage also helps to keep vehicles powered in the event of an outage. The full roll-out for bi-directional is expected in January 2024.
· The much-anticipated IQ9 will be released in 2024. This release incorporates gallium nitride (GaN) for better thermal properties (resulting in higher power) and also a higher frequency.
· However, the 480 watt IQ8P will be released for the United States market in H2 2023. This will be warm-up for the IQ9 with more emphasis on IQ9.
· Manufacturing at Romania will start in Q1 2023 and will increase capacity to 6 million microinverters and then United States manufacturing will primarily increase the capacity to 10 million.
· Look for increased battery sales in Europe as the company is rolling this out now with limited battery availability in Europe prior to 2023 (mainly microinverters in Europe until now).
Earnings Call:
There were quite a few questions about the upcoming Q2 quarter, and any potential weakness from NEM 3.0 and also the United States residential solar market. We outlined what the initial concerns were in our last earnings write-up found here.
Also, please note, the CEO can be a bit long winded at times, and this leads to the longest earnings calls that I personally cover. I’ll try to take out the most pertinent excerpts. To read full responses, please reference the transcript here.
California is 20% of Revenue
The United States makes up 71% of Enphase's revenue. Certainly, it's important to pay attention to any U.S. slowdown. However, outside of California's potential Q2 pull forward, Enphase has been able to beat and raise in light of analyst notes predicting the slowdown would impact growth in Q1.
The information below is important if we do see a slowdown from NEM 3.0. The question that remains is if battery sales will pick up to help offset any impact, if Europe will pick up and/or carry the growth should there be any impact (this region is carrying the growth for Q1 to the point of a 10% raise on revenue), and when the market will begin to price in a better bottom line from IRA credits. NEM 3.0 seems to be the main obstacle in Enphase’s path so I want to start here.
“Ameet Thakkar
Great. Thanks for that. And then I think this time last year when we had this call, and certainly a battery kind of uptake in California will increase, and that might change things. But I think you guys said that like California was roughly 20% of total revenues post the initial NEM 3.0 proposal. I was just wondering if you could kind of give us kind of a refresh on where ‘22 ended up in terms of California as a percent of total revenues.
Badri Kothandaraman
Those numbers are right. Yes. California, the revenue is approximately 20% of our total revenue. That’s correct.
Ameet Thakkar
And it’s still 20% in ‘22?”
Cautiously Optimistic About Q2 and Discussions on Why NEM 3.0 Will Encourage More Batteries:
This is what the CEO said about Q2 in the opening remarks:
“There are a couple of interesting observations I thought I will share with you. Even with the pronounced seasonality and sell-through in January, we would like to point out that our activations are holding up. The second point to also note is that in conversations with our installers and distributor partners, they have started to see originations pickup in January when compared to December. Although the data we have is limited, these two points make us cautiously optimistic about Q2. We have also seen some analyst reports about a possible shift from loans to PPA due to the high prevailing interest rates. We work with thousands of installers every quarter […]. Any shift from one type of financing to another only has a minor impact to our business, almost negligible.”
Here was one of the questions:
Brian Lee:
“Hey, guys. Good afternoon. Thanks for taking the questions. Kudos on the solid execution. First question I had was just around NEM 3.0. I think there is different implications of that policy uncertainty near term and medium term from what we’re hearing. So maybe just wanted to get your thoughts near-term, some views out there that maybe there is a pull forward on demand in California would be curious what you’re seeing with respect to that? And then kind of in the medium term, we’re hearing the industry is still maybe trying to figure out how to navigate this.
So curious how you specifically are thinking about the second half of 2023 in the U.S. you kind of base case in California to be down significantly? And then how do you see yourself navigating that, if that’s the case? Are you driving more product to other states, focusing more in Europe? Just curious just how you’d be thinking about planning into that period of higher policy uncertainty in the back half? And then I had a follow-up.”
Badri Kothandaraman
Yes. On NEM 3.0, we aren’t really seeing any pull forward right now. But in talks with few installers in California, both big and small, like what I said, the originations are up strongly. They are all quite optimistic. And maybe we will see something soon that’s why I talked about an optimistic Q2. But so far, we haven’t seen any pull forward demand yet.
Now on talking about NEM 3.0 in general. NEM 3.0 is going to be incredibly positive for us […] With NEM 3.0, it matters when you export these electrons. So you have 24 hours a day, 365 days a year. So basically, 8,760 data points, and there is an export rate for each of those data points. Each of those hours, there is an export rate. And – but what it works out to be is if you are interested in a pure solar system, your payback dropped understandably from, let’s say, 5 years, it increases actually to something like 7 or 7.5 years with the pure solar system. But the moment you add batteries, you can add batteries in steps of 5-kilowatt hour, 10-kilowatt hour, 15-kilowatt hour, the moment you add batteries, that payback comes right back in to that 5 to 6-year time, to that 5 to 6-year period. That is the stock difference with NEM 2.0. With NEM 2.0, the grid was the battery. Batteries didn’t have an ROI because batteries were primarily for resilience only. With NEM 3.0, batteries are going to be financially attractive. […] We got the right batteries for it with the third-generation battery. We got the modularity, which I think will start becoming popular. Grid tied may become popular, but we will be ready to do either grid tied or off grid, on grid with backup.”
The Comment About the United States Slowdown:
Here was the comment about the United States slowdown:
“Normally, we have 6-month order visibility and that has been – that is now somewhat reduced as they watch their spending. And then I also talked about the fact that our sell-through, which is what the distributors sell to the installers. Our sell-through was quite strong in December, while we saw a little bit more seasonality than normal in the month of January.”
Here is a longer discussion, which points toward Enphase not counting on the U.S driving the growth, rather it was stated and discussed a few times, growth will come from Europe and a bit from LatAm.
“Badri Kothandaraman
Yes. I mean, look, seasonality has always existed in the solar industry from Q4 to Q1. And historically, I would say that, that seasonality is a 15% number. That means, in general, the sell-through in Q1 is usually 15% down compared to the sell-through in Q4. Now right now, and I’m giving you a lot of data from January, and that’s the data we have. Our Q4 was very strong, including December. January, we start to experience a little more than 15%. That’s why I said more pronounced seasonality. And of course, we think it is due to the macroeconomic environment, but what we saw interestingly was the activations remain the same. I mean approximately and they were a little bit down they didn’t have that much of a seasonality. So that basically was somewhat good because the customer demand at least whatever we saw was – I mean, did not get that much affected. But having said that, I think the installers are quite cautious. Therefore, they basically are only buying what they need from their distributors, which is a stark difference from 2022, where they were focused on supply. They were focused on maximizing what they had in their warehouse. Now is that they are worried about their spending, they are worried about their OpEx, they are worried about their cash flow. Therefore, they are going to make sure they do exactly what is required. So that’s why I think – and I don’t have a crystal ball. I cannot be sure. That’s why I think we are seeing some customers who used to book 6, 9 months ahead, now will not book so much ahead. They will be a little more conservative.
And regarding your question on more – that the originations, whether they are improving or not, this is the data. We work with thousands of installers. We have a very strong sample set. We talked to a lot of distributors. Some of our distributors service hundreds of long tail installers. So we don’t see originations ourselves. We only – what I reported to you is anecdotal information. But we hear that originations and especially originations in California are back to being strong in January. That’s what we hear. And I think that is – that’s why I said that – plus the fact that we are not seeing that much of a link in activation points me to cautiously optimistic Q2 versus Q1.”
Europe is a Primary Growth Driver:
As discussed on the call, the United States is expected to decline between Q4 to Q1.
“Let’s now cover the U.S. We expect our U.S. business to be slightly down in Q1 compared to Q4, primarily driven by seasonality and the macroeconomic environment. We are seeing that our distributor and installer partners are a little more cautious in booking orders. We normally have a 6-month order visibility and that has been somewhat reduced as our partners watch their spending closely. On the sell-through of our microinverters, while December was quite strong for us we saw a more pronounced seasonality in January than normal.”
For Europe, the company is expecting: “As for Q1, we expect healthy growth compared to Q4, consistent with the overall growth in the European market.” This will be driven by expanding to more countries for the IQ8 microinverters and increased battery sales.
Additional Quotes on the Europe’s Geo Strength:
“Well, as you said, we do not guide something annually, but European market is growing. At least our internal reports talk about served available solar market of about 13 gigawatts in 2023. The markets to really – the markets that are really driving are Netherlands, Germany, Spain, France, Italy, and even actually Austria, Poland, etcetera. They are all becoming quite significant markets. In addition, attach – battery attach is also growing. Like what I have stated in the prior question – answering the prior question, the attach rate on batteries in Germany is 80%. So, solar plus storage is growing healthily. And the geopolitical situation accelerated it last year, and that’s continuing what do – that’s what our position is […]”
Jeff Osborne
Hi. Good afternoon Badri. I have two quick ones. You touched a lot on Europe, but I was wondering if you can specifically drill down on the visibility you have there in terms of Q1 and Q2.
Badri Kothandaraman
Yes. Europe is actually the opposite. We do have good visibility. We do have these strong orders. Partners, our installer partners, distributor partners, they rely on us for supply. A few of them even come to our headquarters quite routinely, that’s something that we are starting to see. And we also visit them quite a bit. So, I think we do have decent visibility there.
Perhaps Most Importantly, Europe was hinted as the primary driver for reaching the 90% IQ8 Microinverter mix:
“Ameet Thakkar
Good afternoon Badri. Thanks for squeezing me in. Just I guess a follow-up on that last line of questioning. But I think you guys have targeted to get to 90% in terms of IQ8 mix by the end of the second quarter, I think you just said 60% is kind of what’s baked in for the first quarter. Are you guys running a little bit behind on that?
Badri Kothandaraman
We are running a little behind, I would say. I would – I am going to – or rather we are going to introduce IQ8 into several countries in Europe in the near-term. So, in Q2, we will probably be at maybe a little lower than 80%. And I think in Q3, we should probably catch up to that 90%.”
Manufacturing Capacity & IRA Credits:
In the opening remarks, this is what was stated about manufacturing in the United States:
“We plan to begin U.S. manufacturing of our microinverters in the second quarter of 2023 with a new contract manufacturing partner and in the second half of 2023 with our two existing contract manufacturing partners. We plan to open 6 manufacturing lines by the end of this year adding a quarterly capacity of 4.5 million microinverters, bringing our total quarterly capacity to more than 10 million microinverters as we exit 2023.We continue to await the details of IRA implementation from the U.S. Department of Treasury.”
In regards to the benefit from IRA, the company is expecting the following:
“Badri Kothandaraman
Yes. I mean net-net, we expect a net benefit of between $20 and $30 a unit. I am giving you a wide range right now because we do have some puts and takes, and we will refine it as we go.”
Back of the napkin math puts this at a $500 million net benefit to Enphase once the credits roll-out. They do say it’ll take time, but that’ll help an already strong bottom line while other companies struggle to maintain profitable during a macro slowdown.
Conclusion:
Articles like this one aren’t very meaningful considering Enphase raised Q1 guidance by 10% in light of a United States slowdown. This is being achieved through international sales, such as Europe and Latin America.
My takeaway was that even with a “less than perfect” Q2, the manufacturing credits coming from IRA, as well as the product road map, will offset this by year end. The CEO did state “they are fully booked for Q1” and “bullish about 2023.” This leads me to believe a softer United States market is being accounted for in the Q1 guide – and I hope the same will happen come Q2 or soon after – which is that the U.S. market isn’t the thesis right now anyways except for the IRA credits.
I believe the IRA credits shouldn’t be underestimated in terms of impact, and we are comfortable riding the wave of Q2 given the company’s ability to overcome many macro obstacles, thus far. We are looking for strong bottom lines and resiliency in a tough macro, and Enphase ticks those boxes.
Additional Analyst Commentary:
I’m starting with the bearish comments first, but per usual, it seems the bearish analysts were on a different earnings call than the bullish analysts as they are taking exact opposite positions on the same information. As you know, I’m in the bullish camp for three main reasons:
1. The resiliency of this company in 2022 and going into Q1 2023 is rare, and I suspect they have what it takes to continue on this path. No major flags although there’s a question mark on 20% of revenue and how a decrease in microinverters will impact the company compared to an increase in storage.
2. The European segment is clearly carrying the company and seems poised to continue doing so per the sequential decline in the United States, yet raise on revenue growth (we have +10% at the midpoint, analyst below has +7% — analyst below likely referring to their estimate)
3. Strong product road map, a few catalysts and any one of them can absorb a limited impact to 20% of revenue. Strong bottom line with clear information on this improving with or without a recession.
“Barclays analyst Christine Cho raised the firm's price target on Enphase Energy to $257 from $251 and keeps an Equal Weight rating on the shares following the "solid" quarter. While Enphase ended 2022 on a high note, microinverter shipments will slow as installers remain cautious in a tougher macro tape with inventory channels already at healthy levels, the analyst tells investors in a research note.”
“Susquehanna analyst Biju Perincheril lowered the firm's price target on Enphase Energy to $275 from $365 and keeps a Neutral rating on the shares. The analyst said they beat on the top and bottom line but demand within the US is becoming more uncertain as macroeconomic concerns are causing installers to purchase only what they need right now rather than to secure future supply.”
“Cowen analyst Jeffrey Osborne raised the firm's price target on Enphase Energy to $341 from $335 and keeps an Outperform rating on the shares. The analyst said its Q4 EPS upside was driven by gross margin strength attributed to IQ8 penetration. Q1 revenue guidance is 7% above consensus at the midpoint with the U.S. expected to decline QoQ on seasonality with management optimistic U.S. will rebound in 2Q23.”
“Oppenheimer analyst Colin Rusch raised the firm's price target on Enphase Energy to $328 from $323 and keeps an Outperform rating on the shares. With Enphase beating Q4 expectations and guiding ahead of the Street, the firm believes bearish investors will focus on slower battery sales in Q1 2023 and risk to the CA demand post NEM 3.0, but notes both set Enphase up for accelerating growth through 2023. Oppenheimer continues to see U.S. residential solar demand as more resilient than feared and believes Enphase is making sound changes to its battery and commercial rooftop products while being poised to enjoy 500-800bps-plus margin improvement from U.S. manufacturing credits.”
“Craig-Hallum analyst Eric Stine lowered the firm's price target on Enphase Energy to $315 from $323 and keeps a Buy rating on the shares. The firm notes Enphase reported a beat across the board in Q4 and guided Q1 2023 above the Street, with it fully booked and Europe a primary driver. While the Q1 guide does call for revenues down modestly quarter-over-quarter at the midpoint, Craig-Hallum thinks that Enphase's plan to more than double its capacity by the end of 2023 shows the true growth path and outlook, and with the majority of this expansion in the U.S., it also means substantial incremental EBITDA from the 45-times Advanced Manufacturing Tax Credit.”
Two months ago, we announced that we are buying Bitcoin in the analysis: “Bitcoin is Going to Rally Again, Here’s What you Need to Know.
Here is what we said on December 9th:
“Though we are in the 4th bear cycle in Bitcoin's history, the prior 3 cycles suggest where we are is a rare buying opportunity. There is ample evidence to support the $15,500 level is either a major low or very close to a major low. Both the technical and on-chain analysis support this.”
Due to technical analysis coupled with the on-chain analysis provided by WealthUmbrella, it became evident that we were at a major low and we alerted our followers to this important moment. Since then, Bitcoin is up 40%, and we view the next correction as potentially another moment when we may add to our position. When we add to our positions, we issue real-time trade alerts plus position sizing for our research members. Our firm is known to navigate Bitcoin’s volatility particularly well even in challenging markets.
Below, we update the new developments in Bitcoin’s price patterns as well as the on-chain metrics that we tend to see around historic lows. We will also take a look at the fundamental thesis surrounding Bitcoin’s utility, and why a globally indebted economy coupled with structural inflation will only benefit from Bitcoin.
Our first sign of this problem happened when the Bank of England abandoned its fight against inflation to support its currency. This was recently followed when we saw signs that the Bank of Japan could potentially lose control of its bond market, as they started bending to inflationary pressures. It appears that central banks are being boxed into a winless corner where they have to choose between fighting inflation or causing a fiscal spiral in their economies. As these problems grow, Bitcoin’s alternative to centralized fiat system will become more attractive, which I believe is showing up in the price action.
The Bank of Japan, Inflation and Bitcoin
Last month, the Bank of Japan (BoJ) surprised markets by widening their 10-year treasury bond from 0.25% to 0.50%. This may seem small, but this move roiled markets and sent ripple effects across asset classes globally, The reason the change in bond yields had a strong effect is because Japan has excessive public debt, and the concern is it will cost more for Japan to now service this debt.
Most countries are dealing with high levels of debt due to a decade of negative to zero rates. However, Japan’s debt is one of the worst globally with a debt-to-GDP ratio of 262.5%. Like most central banks coming out of the Great Financial Crisis, The Bank of Japan embarked on a series of programs to combat deflationary forces. Unlike most economies, Japan’s rapidly declining population, amongst other factors, had their central banks combating deflationary forces that most of the world did not have to address.
As a result, Japan decided to take central bank engineering one step farther. They set a goal of reaching a 2% CPI at any cost. So, they announced a new Yield Curve Control (YCC) policy. In order to maintain a yield below where the market would naturally price it, the BoJ had to sacrifice their balance sheet to achieve this goal. In brief, any bond that traded over their target, they bought.
One of the by-products of artificially low rates in countries that issued public debt in their own currency was a very high public debt-to-GDP ratio. With rates at a persistently low level, governments were encouraged to borrow under the assumption that inflation will likely always be under control.
What this means is that Japan, as well as other countries with high Debt-to-GDP ratios, cannot tolerate higher yields. The higher the yields, the more it will cost the Japanese government to service these debts. If they go too high, then the Japanese government runs the risk of defaulting on their loans.
This is not a problem as long as inflation is subdued. However, like the rest of the world, Japan is now dealing with a high CPI around 3.7%, which is much higher than their target.
So now, they appear to be approaching the end-game scenario. They have to combat inflation by raising rates, but if they raise too high, the bond market will lose confidence in Japanese debt. This is what happened in England last year when the new administration announced a sweeping spending bill coupled with tax credits in the face of a growing energy problem. In short, the bond market stopped playing ball. As debt got sold and yields climbed, this left the Bank of England no choice but to once again become the buyer of last resort, while having to deal with high inflation at the same time.
If the 3rd largest economy in the world, and second most important currency loses control of its bond market, the Bank of Japan could become one of the biggest stories in 2023. How does this tie into Bitcoin? Bitcoin is viewed as an alternative to the centralized fiat money system. Because it is not centralized, it is not prone to the results of monetary manipulation and corruption. Bitcoin is an easy and secure way out of a country’s fiat system, for better or worse.
Sign up for I/O Fund's free newsletter with gains of up to 221% – Click hereSign up for I/O Fund's free newsletter with gains of up to 221% – Click hereClick here
Whether one agrees or not is irrelevant. The perception that Bitcoin is an alternative is what matters, just as the perception that gold is an alternative is important, as well. The more problems that unfold with the inevitable crumbling of the global fiat money system in light of systemic inflation, the more a country will likely adopt it.
We see a definite correlation between corruption and crypto adoption. This is a correlation that has persisted for years.
The reason for this correlation is because with systemic corruption comes economic hardship, heightened inflation, and in some instances, hyper-inflation. Prior to Bitcoin, citizens have historically had no convenient way out of their country’s currency, so they have been trapped.
Not all economic hardship is the result of corruption. We’ve seen global central banks embark on the greatest monetary experiment in human history, marked with countless policy errors and questionable decisions. In the U.S., we see a clear correlation between the strength of the U.S. Dollar and Bitcoin.
When the dollar is weak, or we see the FOMC flinch in light of needing to tighten, Bitcoin catches a bid. So, clear correlations and utilities are being developed with Bitcoin that lines up with the monetary issues unfolding. We only expect this relationship to strengthen into 2023 and beyond. Structural inflation is likely here to stay, which means that global central banks will inevitably follow Japan in Yield Curve Control programs to prevent a fiscal spiral. There is simply too much debt in the system, and not enough buyers of new issues. This will only improve Bitcoin’s attractiveness.
On-Chain Analysis
Bitcoin does not have earnings reports. You cannot do classic fundamental analysis on this asset to help determine underlying strength. For this reason, crypto has been leaning on technical analysis predominantly, until recently. Some researchers have uncovered that Bitcoin offers its own unique form of fundamental data found on the public blockchain. This data, called on-chain data, allows us to track several patterns that can provide clues to major turning points. The following data was provided by Vincent Duchaine of WealthUmbrella, whose company has developed an automated algoriths to help retail investors navigate risk-on and risk-off environments.
In the previous article, we noted that various on-chain indicators indicated that a bottom was likely.
“Overall, most on-chain metrics from any layers of the Bitcoin ecosystem is providing rare readings that tend to flash around major bottoms.”
Specifically, the indicators tracking money flow into and out of exchanges saw a peak in June 2022, which was the third highest recorded in bitcoin history. Despite the FTX incident in November, this indicator was forming a lower high, which suggested that fear was fading.
Additionally, Bitcoin’s price was within a range that we rarely see, and has historically marked major lows. What the below range is measuring is the relationship between Bitcoin’s market cap (price x the number of coins in existence) and its thermos cap (price of each coin when it was last purchased x the number of coins in existence). Bitcoin’s price was in the middle of our “value-zone” that has marked larger turning points in the past.
Further evidence that a new bull cycle is developing can be seen with the Spent Output Profit Ratio (SOPR). This is calculated by examining all daily transactions on the Bitcoin blockchain and determining if the coins were exchanged at a profit or loss based on the price at the last time they moved. A ratio of 1 indicates that all bitcoins moved on a given day were sold at the same price as they were bought. A ratio over 1 means that on average people sold at a profit, and under 1 means at a loss.
Sign up for I/O Fund's free newsletter with gains of up to 221% – Click hereSign up for I/O Fund's free newsletter with gains of up to 221% – Click hereClick here
The SOPR signal can be noisy on a day-to-day basis, but when filtered correctly, it can be a good indicator of the current market phase. It can prematurely signal a top and may lag in signaling a new uptrend. As of last week, this signal flipped positive, and it is worth noting that it has not given any false signals throughout the history of bitcoin, despite sometimes being late in calling an event.
The above analysis is only a handful of metrics used to improve our odds at catching a new bull cycle. The final piece of evidence will come from the developing price pattern from the 2022 low. As of now, we only have 3 waves up off the recent low. We need this to get to one more high to complete the much anticipated 5 wave pattern that tends to mark a bigger trend reversal. If we do get that last push higher, the following pullback will be where we add to our position.
In conclusion, our multifaceted analysis into Bitcoin is supporting the likelihood of a larger trend reversal. This is not confirmed from our end until we see price make that last high in the coming weeks towards the $25,600 region. Interestingly, this new bull cycle is coinciding with a weakening US Dollar. Also, it is accompanied with more central banks being boxed into inescapable corners. Structural inflation is likely here to stay, and it will not be easy for indebted country’s to control this.
This will only lend support to Bitcoin’s original thesis that there is no need for the trusted middle man within a peer-to-peer transaction. Centralizing our monetary system allows for corruption, and policy mistakes that can, and do, lead to 2008-style events. The deeper we go into the Central Bank monetary experiment, the more apparent it is this idea has become 15 years later.
This Thursday, 2/9/23, at 4:30 pm EST we will host our weekly webinar where we go through various broad market charts, as well as individual tech stocks we are targeting for entry and exits. We also provide a weekly update into Bitcoin that will help our premium members better manage risk. An example of this is when we put out an alert to sell Bitcoin when it topped last March (behind paywall) with some discussion on social media leading up to this trade alert. I/O Fund provides real-time trade alerts and an audited, actively managed portfolio. Learn more here.