Supermicro Fiscal Q1: “Conservative” Guide

Supermicro beat this quarter and raised for next quarter. The fiscal year was raised, as well. Overall, the quarter was strong with the only blemish a vague comment that AI revenue was “over 50%.” Management did not give an exact number, and there are reasons to believe that due to a low quarter seasonally, that AI revenue was below the 52% it was last quarter.

There was not an exact confirmation on the number, but I lay reasons below as to why it’s likely it was between 50% to 52% (lower than last quarter). The most obvious one is that revenue decelerated QoQ, and at half of the company’s revenue, it’s likely AI-related revenue tracks total revenue and also decelerated QoQ. Semiconductor companies are lumpy. For example, next quarter SMCI will grow 32.1% QoQ. Therefore, by my estimation, this is not a concern within the scope of a seasonally low quarter, and it should resume growth along with total revenue for the December quarter.

The gross margin and operating margin declined both QoQ and YoY, yet it’s the expectation these will improve over time. Given the strong earnings, this is less of a concern as the company is certainly GAAP profitable. Management indicated that gross margin will improve as AI continues to ramp, and as they expand facilities in Malaysia and Taiwan. Cash came in strong, which is what we wanted to see.

By far, the most important question on the call was if management was being conservative in their fiscal year guide OR are there challenges ahead for the March and June quarter? Management provided a straightforward answer that Q4 and the fiscal year guides are conservative, implying that we have chance for a beat again in the near-term. I’ve included this part of the transcript below.

Revenue and EPS:

Revenue of $2.12 billion for growth of 14% YoY came in above expectations of $2.06 billion for 11.4% growth.

For the next quarter, the company guided $2.80B at the midpoint, for growth of 55.6% compared to expectations of $2.52B for growth of 40%.

The combined beat and raise were for $340 million in revenue. Meanwhile, management raised guidance for the fiscal year by $500 million. The previous guide was for $10B at the midpoint, and is now at $10.5B at the midpoint.

Adjusted EPS of $3.43 beat expectations of $3.25 and beat management guidance of $3.13 at the midpoint. GAAP EPS of $2.75 also beat management guidance for $2.41, at the midpoint.

For the next quarter, management came in above consensus with guidance of $4.64 EPS at the midpoint compared to $4.11 EPS expected. You can easily see why a gross margin and operating margin that is a bit lower is less of a problem with this kind of earnings strength.

Margins:

There are some puts and takes with the margins. Gross margin was down by 30 basis points QoQ and down YoY by 210 basis points.

Adjusted operating margin was in line at 10.8%, however, the GAAP operating margin was lower QoQ by 230 basis points at 8.1%. Both were down YoY – adjusted OM was down 170 basis points and GAAP OM was down 380 basis points. Stock based compensation increased to $57.38 million, up from $11 million in the year ago quarter. This is at 2.7% of revenue compared to 0.59% in the year ago quarter.

The net margin of 7.4% was in line for GAAP profits of $157M, and as stated, EPS was strong.

Cash Flow:

Operating cash flow was strong at $270.5 million for a margin of 12.7%. This is a seasonally strong quarter for free cash flow with $268 million and $3 million in capex. This is low capex compared to what we can expect the rest of the year. Next quarter, capex is expected to increase to $22 million, at the midpoint, and will be at $110 million for the fiscal year, at the midpoint.

Key Segments:

  • The OEM appliance and large data center revenue of $1.17B was up 26% YoY and was flat QoQ.
  • Enterprise and channel vertical reported $917M for 43% of revenue, down (-6%) QoQ by 200 basis points, and was up 10% YoY due to seasonally lower enterprise spending
  • 5G, Telco and Edge/IoT reported $31M and was 2% of total revenue

These flat to negative QoQ growth in these segments helps illustrate why management may have declined to give an exact number for AI-related revenue until the seasonally low quarter is behind them.

The exact statement was this: "AI/GPU and rack-scale solutions again represented over 50% of our total revenues this quarter with AI/GPU revenues in both the enterprise/channel and the OEM appliance and large data center verticals."

The United States region was up 25% YoY yet was down 3% QoQ. Another hint that AI revenue may have been down QoQ is that all regions declined QoQ except Rest of World, which was up 38%. It’s likely AI revenue is coming from more developed regions, such as United States, Europe and APAC. 

Server and storage systems are 93% of revenue while subsystems are 7% of revenue.

Inventory increased to 91 days, up from 75 days. Per management: “we built inventory for a seasonally strong Q2.”

Earnings Call & Additional Notes:

The headline of my post-ER write-up last quarter was Half of Revenue is from AI with a focus on the 52% AI-related revenue that was posted last quarter. Therefore, I immediately noticed the “AI, GPU and rack-scale solutions again represented over 50% of our total revenues this quarter” was a change from providing a precise number.

As stated under the Key Metrics section, the September quarter is seasonally soft, as it was down (-3%) QoQ. Therefore, this number may have not improved due to seasonal reasons and they didn’t want to spook the market given the outsized pressure on AI mentions. In this case, the number may have been between 50.1% and 51.9% and they felt it wasn’t necessary to highlight this considering it will improve quickly next quarter and beyond. Needless to say, we are monitoring this closely. 

It was asked about on the call but to no avail: 

“Nehal Choski

Okay. And can you give a little bit more precise number as far as what the exposure was in the September quarter other than greater than 50%?

David Weigand

That’s — we are giving that approximate figure and that’s our guide.”

By far, the most important question on the call was about the Q4 guide and fiscal year guide and whether management consider it to be conservative. Here is what was stated:

“Ananda Baruah

That’s actually really helpful context. I appreciate it. And then, I guess, sort of dovetailing from that, Charles. So the midpoint of the implied guide for the fiscal year, the raised guide, $10.5 billion, implies that the March quarter and June quarter would also be about $2.8 billion, which is the midpoint of your December quarter guide. And then you also, though, made mention of growth accelerating. And so — and that — and it seems like supply is getting better. You also have co-op capacity coming on, going into the year. So I guess the question is, is there conservatism built in into even the implied fiscal year guide that’s been raised or is there some pull-forward in December quarter that you think might be challenging to duplicate in the March and June quarter? It seems like conservatism, but just wanted to check that? Thanks. 

Charles Liang

Yeah. Thank you. Again, we continue to gain lots of design win. So our back order has been growing faster than what we forecast in reality. So at this moment, $2.7 billion to $2.9 billion for December should be a very conservative number. And for our whole fiscal year, $10 billion to $11 billion, again, should be a conservative number. So I feel very optimistic to continue to grow quickly and that’s why we continue to grow our rack-scale, including a difficulty rack-scale rather than production capacity. Likewise, just, before we have 4,000 rack per month capacity and now pretty much we will grow to 5,000 rack per month capacity very soon. So we are very optimistic for the future growth.”

Conclusion:

This was a straight forward report, and we are not concerned with the 100 or 200 basis points that may be in question for AI revenue given the 300 basis point decline QoQ in total revenue. Next quarter will quickly resolve the issue with 32.1% QoQ total revenue growth. Management stating they are being conservative was a nice bonus to the raise and beat. This report helps us firm up SMCI as a 2024 position.

 Recommended Reading:
AMD Q3 Earnings: $2B in GPU Revenue for 2024

Initially, AMD sold off (-5%) based on the missed Q4 revenue guide. After hours, the stock recouped and ended up flat once management clarified the miss is not from the data center segment. Rather, it was confirmed the Q4 data center will grow 50% QoQ, and perhaps most importantly, management guided for $2B in GPU sales in 2024 from AI rather than supercomputing. This was the moment the price action reversed, and is a positive as it translates to broader hyperscaler customers driving the $2B rather than the Department of Energy’s supercomputer El Capitan.

We had stated in our pre-earnings write-up: “[The 50% revenue growth in Q4] is exciting, yet the market will want to see more balanced, commercial demand beyond the government-owned supercomputer.” AMD’s management went out of their way to provide additional color on hyperscalers driving the 2024 revenue, and I’ve included that part of the transcript below.

Roughly speaking, the data center is a $6 billion segment for AMD after 10 years of Lisa Su being the CEO (she became CEO in 2014). This means within one or two quarters of the GPUs shipping; sales will be the equivalent to 30% of today’s data center revenue right out the gate. Lisa Su stated the MI300 will be the fastest product they’ve had reach $1 billion in sales – which is saying a lot because the EPYC CPUs are popular.

Per the opening comments: “Based on the rapid progress we are making with our AI road map execution and purchase commitments from cloud customers, we now expect Data Center GPU revenue to be approximately $400 million in the fourth quarter and exceed $2 billion in 2024 as revenue ramps throughout the year. This growth would make MI300 the fastest product to ramp to $1 billion in sales in AMD history.”

Notably, it’s out of character for this management team to discuss forward revenue beyond one quarter. I find this break in style interesting, and I also take this to mean the $2 billion is a baseline. We will see, but that’s how I interpret a very early guide that would normally come in February. 

What is a bit unfortunate is that the gaming segment and embedded is weak, and these two segments overshadow AMD continuing to take market share on the CPU data center, and the company’s highly anticipated answer to Nvidia’s H100s. Per the CFO’s opening remarks: “In the fourth quarter, we expect to benefit from strong Data Center and Client momentum, driven by MI300 AI accelerated ramp and the strength of our high-performance leadership Zen 4 family of products despite lower sales in the Gaming segment and additional softening of demand in the embedded market.”

What is quite fortunate, however, is that some of AMD’s AI story is undercover, which is the PC and mobile market. There’s a bonus waiting for AMD investors as the AI story plays out, and while data center GPUs take up all of the attention, there is another powerful AI trend that is silently building strength in the background. I mentioned this in a previous write-up: “When discussing AMD’s AI opportunity, it is vitally important that we not lose sight of the opportunity AMD will have to expand its AI portfolio to the Client Segment.” This has already begun with the Ryzen AI on-chip accelerator contributing to the rebound in the client segment this quarter.

Revenue and EPS:

Revenue and EPS for Q3 came in a tad higher than expected at 4% growth for revenue of $5.8 billion. The company reported EPS of $0.70 versus $0.68 expected.

The guide for next quarter was problematic as it was a miss with management guiding for $6.1B in revenue versus $6.39B expected. However, the miss is not coming from the data center, and the market is digesting whether AMD is a “buy” given two of its segments are quite weak (gaming and embedded).

Margins:

Overall, the company came in as expected on margins. Gross margin came in at 47% which is a positive. On the call, it was mentioned that as the GPUs ramp, the revenue will be accretive to gross margin.

  • Adjusted gross margin of 51% was in line with management guidance for adjusted gross profits of $2.963B
  • Operating margin of 4% for operating profit of $224M is an improvement over the past few quarters of single digit negative GAAP operating margin. Per the CFO during those quarters, GAAP OM would improve with the Client segment recovery.
  • Adjusted OM came in as expected at 22% for Adj operating profits of $1.27B
  • GAAP net income was $299M with a margin of 5%

The CFO said the following about continued margin expansion:

“And in Q3, we saw very significant improvement with our client segment gross margin. I think going forward, the pace of Client segment improvement will moderate, but it will continue to drive incremental gross margin improvement in Client segment […] I think going forward, it's really mix, primarily mix, is driving our gross margin, but we feel pretty good about second half next year when we can expand the Data Center significantly and especially Embedded segment start to recover, we should be able to drive more meaningful gross margin improvement in second half.”

Cash Flow:

Operating cash flow has improved from last quarter although is still quite a bit lower than AMD’s peak in 2022. Operating cash flow of $421M is up from $379M last quarter, but is down from $965M in the year ago quarter. This should continue to improve with the Client segment bottoming.

Free cash flow of $297M is similar – an improvement from last quarter at $254M yet down from $842M in the year ago quarter.

The company has $5.8 billion in cash and short-term investments with $2.467B in debt. The company repurchased $511 million in shares.

Revenue Segments:

Data Center:

Data center came in as expected for Q3 at $1.6 billion in revenue, driven by the 4th Gen EPYC CPUs which offset a decline in adaptive SoC products. Per the opening remarks: “EPYC CPU revenue grew by a strong double-digit percentage sequentially” and also “we gained server CPU revenue share in the quarter as fourth-gen EPYC CPU revenue grew more than 50% sequentially, crossing over to represent a majority of our server processor revenue and unit shipments.”

Management has confirmed Q4 will be 50% sequential growth, or $2.4 billion in revenue. Of this, $400 million is from GPUs.

Client Segment:

The Client segment looks to have bottomed in a big way. Revenue of $1.5B was up 42% year-over-year and was up 46% QoQ. A full recovery would be in the $2.5B range. AMD released the Ryzen 7000 Series, which has helped CPU sales. Management also indicated that their partnership with Microsoft is a catalyst on the horizon as the Ryzen 7000 Series will power the biggest advancement in Windows in over 20 years.

Per management’s opening remarks: “Looking forward, we are executing on a multiyear Ryzen AI road map to deliver leadership compute capabilities built on top of Microsoft's Windows software ecosystem to enable the new generation of AI PCs that will fundamentally redefine the computing experience over the coming years.”

The Client Segment is expected to be strong next quarter, as well.

Gaming:

Gaming revenue of $1.5B was down (-8%) YoY due to a decline in semi-custom revenue but was offset by AMD Radeon GPUs. This segment is expected to decline next quarter due to a steep console cycle.

Embedded:

This segment is weighing on AMD as it’s lapping very high comps. As stated in our Pre-ER writeup, embedded is lapping a quarter with 1868% growth. Per the opening remarks: “Looking ahead, based on our current visibility, we expect Embedded segment revenue to decline sequentially as customers continue working through elevated inventory levels through the first half of 2024.”

The weakness in the gaming and embedded segments is expected to last (and perhaps worsen) through at least Q1. Per the CEO:

“And then from an Embedded and Gaming standpoint, we would say Embedded, think about it down similar levels sort of in the teens compared to sort of Q3 was down in the teens and Q4 will be down in the teens. And then Gaming, from a console standpoint, we do expect that to be down a bit more than that. And then as we go into Q1, again without being — there are lots of things that need to happen. We would expect that both gaming and embedded would be down into Q1 as well and sort of the other comments would be more around seasonality.”

Earnings Call:

It was key that management provide color on this call regarding the MI300 demand. The first question was centered the hyperscalers and how the MI300 is being used:

Toshiya Hari:

[…] My first one is on the Data Center GPU business. You talked about '24 revenue potentially exceeding $2 billion. I was hoping you could provide a little bit more color. What percentage of this is AI versus supercomputing or other applications?

Lisa Su:

Your question as to how the revenue evolves, so the way to think about it is, in the fourth quarter, we said revenue would be approximately $400 million, and that's mostly HPC with some — the start of our AI ramp. And then as we go into the first quarter, we actually expect revenue to be approximately similar in that $400 million range. And that will be mostly AI so with a very small piece being HPC. And as we go through 2024, we would expect revenue to continue to ramp quarterly, and again, it will be mostly AI.

The second question is when the stock price recovered after hours because this is when management made it clear the Q4 miss was not data center related. AMD had previously guided for 50% sequential data center growth (we covered this in great detail here) and this was reiterated:

Aaron Rakers:

[…] And how has that $400 million evolved underneath that? Has that — was it $300 million now going to $400 million? Just how has that changed over the course of the last quarter just to level set that Data Center expectation?

Jean Hu:

Yeah. So, I think for the second half, we said we expect Data Center business to grow approximately 50% versus first half. But right now, based on what we are seeing, we continue to see in that similar range of that 50%. So, we are very happy and pleased about the strong momentum of our Data Center business. On the GPU side, Lisa mentioned about $400 million, around $400 million […]”

The CEO let a comment slip that it would be “greater than $2 billion” for next year, and given how careful this management team is, I do think it’s important to note here:

Lisa Su:

Sure, Aaron. So, we've been planning the supply chain for the last year and we're always planning for success. So, certainly, for the current forecast of greater than $2 billion, we have adequate supply. But we have also planned for a supply chain forecast that could be significantly higher than that, and we would continue to work with customers to build that out.

For our purposes, as far as where this can go, the management team goes back to quoting 50% CAGR in this segment over the next few years: “So, I think we are big believers in the strength of the market. We previously said we believe that the compound annual growth rate could be 50% over the next three or four years.”

The March quarter is expected to be lumpy due to seasonality with the Client segment, Gaming, Embedded and then moving from El Capitan’s $400M in GPU revenue to $400M in Q1 from AI-driven GPU revenue (hyperscalers).

In regards to AMD’s AI-driven Client segment, here is a comment that helps solidify some of what our earlier analysis this year has discussed. From the CEO today: “What I'm most excited about in PCs is actually the AI PC. I think the AI PC opportunity is an opportunity to redefine what PCs are in terms of productivity tool and really sort of operating on sort of user data. And so, I think we're at the beginning of a wave there. We're investing heavily in Ryzen AI and the opportunity to really broaden sort of the AI capabilities of PCs going forward.”

Conclusion:

Gaming and Embedded will overshadow 4th Gen EPYC and also GPU sales in the near-term. However, we will be looking exclusively at the acceleration in the data center (EPYC and Instinct) and client segment (Ryzen AI) as the thesis. The market wanted to sell this report, yet AMD’s management team stood firm on their data center guide. For our purposes, some important hurdles were cleared – Q4 will come in as expected on the MI300s, Q1 will be the start of hyperscaler GPU sales, the margins will get better over time, and the Client segment is rebounding while also having its own AI story. Most importantly, we wanted to see AMD gain traction with hyperscalers, and that was confirmed this quarter for Q1.

Technically speaking, this report was stronger than Nvidia’s was this time last year despite the GPUs shipping at the same time seasonally – NVDA had 1% QoQ growth for data center revenue in the October quarter and then declined (-6%) QoQ in the Q4 January quarter. To jog your memory, it was the guide provided in May (for the July quarter) when Nvidia had its blowout quarter.

I don’t think AMD will take the exact path as Nvidia’s near-monopoly, rather, as was stated in the pre-earnings writeup, our goal is to see how this unfolds.

 Recommended Readings:

Super Micro Fiscal Q1 Pre-Earnings: AI Marches Onward

Second only to Nvidia, Super Micro is a stock that is reporting real AI revenue. As a percentage of revenue, SMCI is reporting 52% in AI revenue compared to Nvidia’s 76% as a percentage of total revenue (data center segment).

Super Micro is sandwiched in the AI trend between hyperscalers and major chip design companies. The company is a server maker that started off by making motherboards and other components before it began making complete systems. The company is unique in that it sits between being an equipment manufacturer (Dell, HP) and being a design manufacturer (Foxconn). Part of the company’s success is due to liquid cooling, which is a popular alternative to air cooling to sustain maximum performance with the added benefit of driving down costs for supercomputers. Liquid cooling is expected to grow from 10% of supercomputers to the “vast majority” due to improving data center power usage effectiveness (PUE) and total cost of ownership (TCO) “by over 40% on power costs.” Please reference our Super Micro overview here.

The AI and GPU rack-scale revenue accounted for 52% of the recent Q4 FY2023 revenue. It was up from 29% in Q3 FY2023 – so nearly doubling in the span of a quarter (!)

For Super Micro, AI-related revenue is expected to march onward with Barclays analyst George Wang expecting it to rise to 70% of revenue in FY2024 and further rise to 80% in FY2025. The management FY2024 revenue guidance of $10 billion at the mid-point was significantly higher than the estimates of $8.61 billion and represents a YoY growth of 40.45%, up from 37.1% in FY2023.

What could cause Super Micro to miss is supply constraints for components. This was outlined in the last earnings write-up when we stated “Supply is the primary headwind; not demand.” With that said, management seems to be confident in the current guide, with supply more of a factor as to whether they raise revenue guidance in the future. Anything can happen, but that was our interpretation in the last earnings write-up.

Here's a quote from management: “However, given the record high backlog, we see fiscal year 2024 revenue between $9.5 billion to $10.5 billion with room to deliver more depending on availability of supply.”

Revenue and EPS

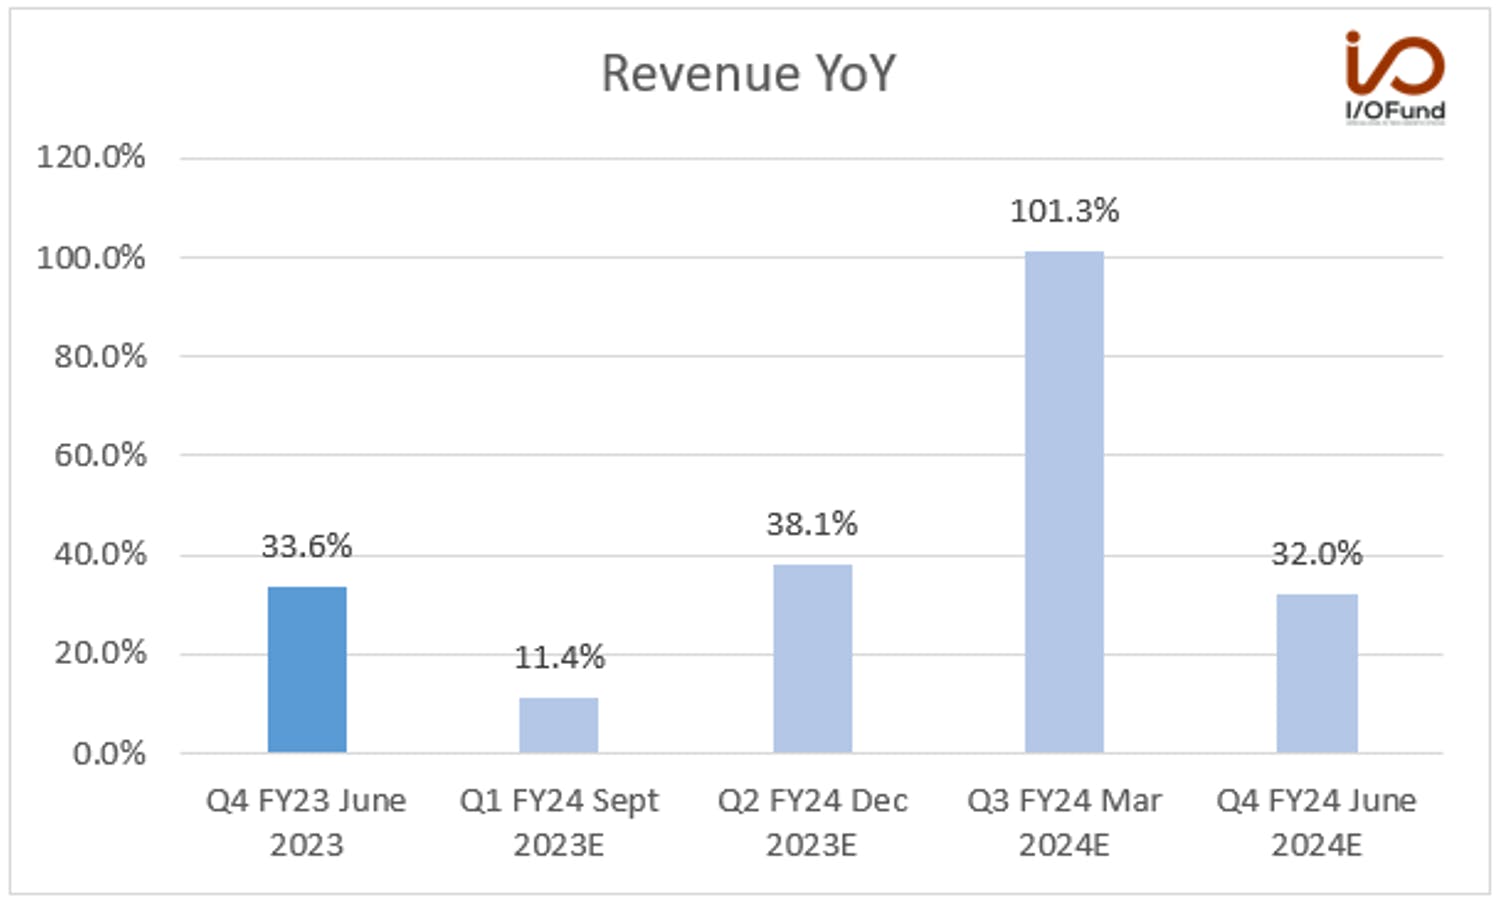
The company’s Q4 FY2023 revenue grew by 33.6% YoY to $2.18 billion. The management Q1 guidance is in the range of $1.9 billion to $2.2 billion, representing YoY growth of 10.8% at the mid-point. The consensus analysts’ estimate is $2.06 billion, representing a YoY growth of 11.4%. The guidance was lower due to the key component supply shortages, and strong growth is expected for the remaining quarters of the fiscal year.

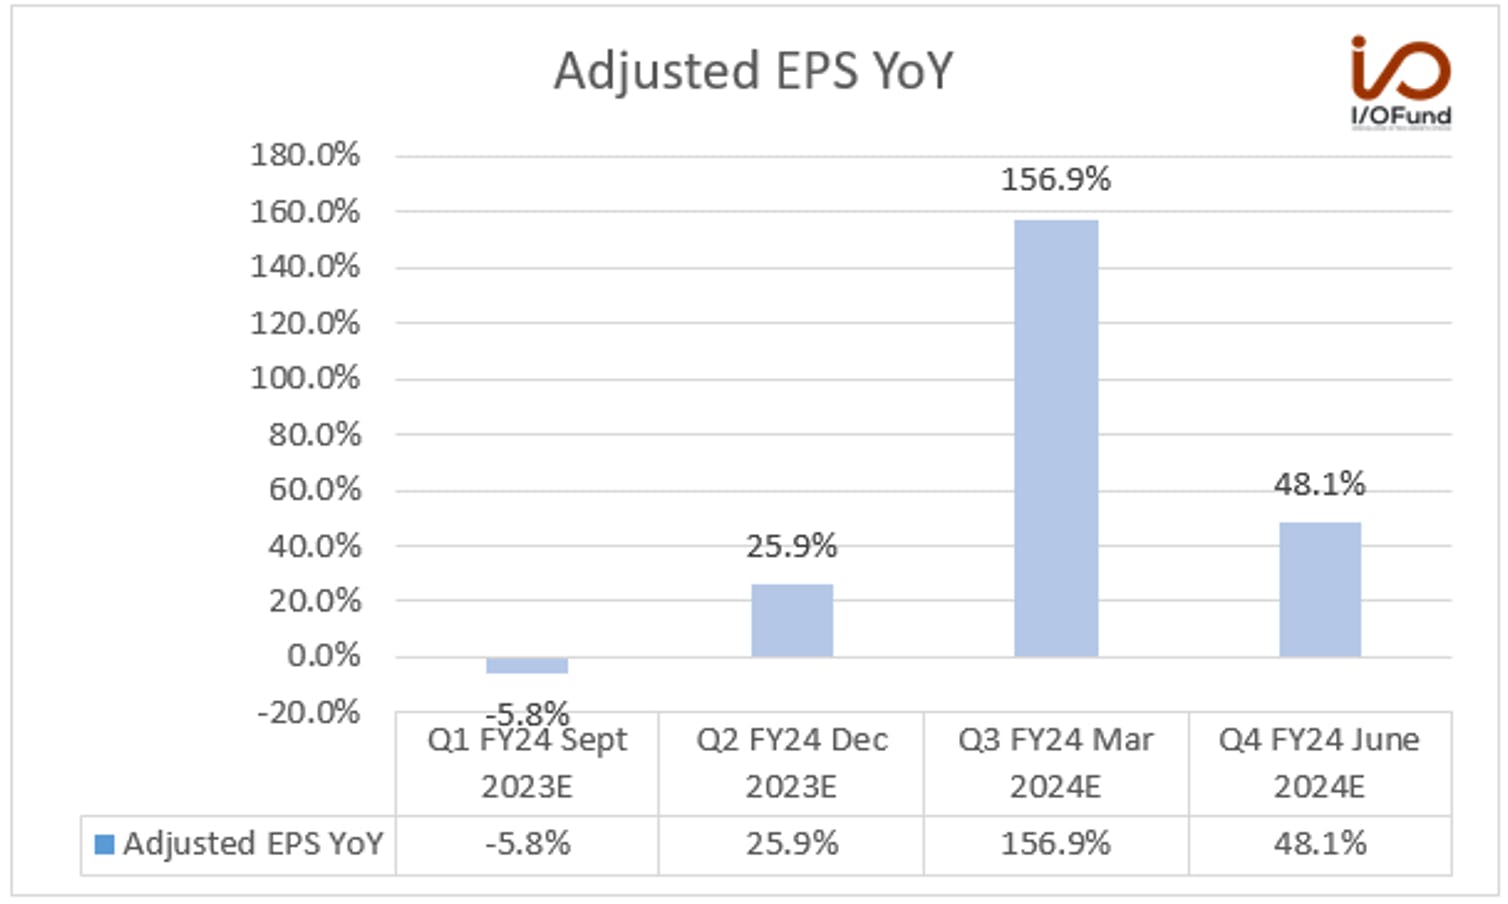
The management Q1 GAAP EPS guidance is $2.02 to $2.80 and adjusted EPS guidance is $2.75 to $3.50. The consensus adjusted EPS estimate is $3.22, representing a YoY decline of (-5.8%). The EPS also follows a similar trend of solid growth like revenue for the remaining quarters of the fiscal year.

Margins

The adjusted gross margin was 17.1% compared to 17.7% in Q3 and 17.6% in the same period last year. The gross margin was lower as the company focused on market share gains. The management expects the September quarter adjusted gross margin to be similar to Q4.

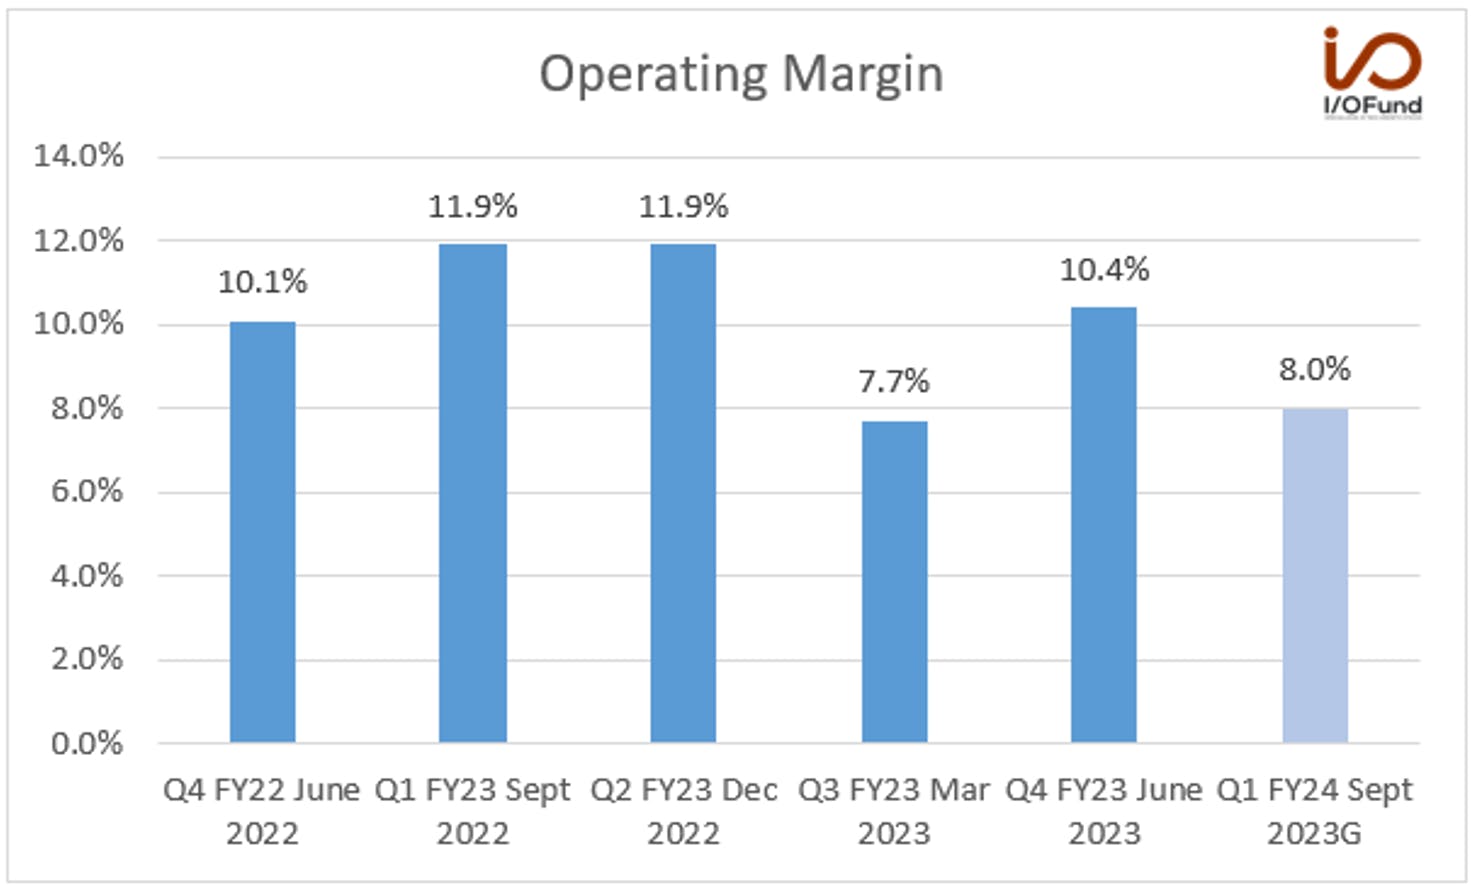
The operating margin improved 30 basis points YoY to 10.4%. The adjusted operating margin improved 30 basis points YoY and 230 basis points QoQ to 11%. The strong QoQ improvement in margins was due to higher revenues that outpaced increases in operating expenses.

The operating margin guide for the next quarter is 8% and adjusted operating margin is 10.4%. The lower operating margin is due to higher operating expenses from a continued increase in R&D expenses and higher personnel costs.

The net margin improved 30 basis points YoY to 8.9%.

Overall, these margins are slim and this is always a focus in the earnings calls. The 10%+ OM is strong enough to be acceptable on a GAAP basis, yet is also thin enough to have to monitor quarterly.

Cash Flow and Balance Sheet

Operating cash outflow in Q4 FY23 was (-$9 million) compared to cash flow of $198 million in Q3 and cash outflow of (-$25 million) in the same quarter last year. The drop in cash flow was mainly due to higher accounts receivable. We will look for improved cash flow in the upcoming quarter.

The free cash flow outflow was (-$17 million) compared to free cash flow of $190 million in Q3 and free cash outflow of (-$36 million) in the same quarter last year. Lumpy is okay as long as fiscal year is positive. For FY2022, the company reported negative cash flow of (-$485 million). For FY2023 ending in June, the company reported positive cash flow of $626.8 million. 

The company has cash of $440 million and debt of $290 million. It has a net cash position of $150 million, down from a net cash position of $176 million in the previous quarter. Per management: “we utilized our bank lines of credit to support higher revenues and accounts receivable as we ramped up production of new AI/GPU design wins.”

Key Metrics:

The AI and GPU rack-scale revenue accounted for 52% of the recent Q4 FY2023 revenue. It was up from 29% in Q3 FY2023. Barclays initiated coverage on the company with an overweight rating citing company’s exposure to AI. "Against the backdrop of AI investment trends, we believe SMCI is well positioned to capture the rising AI server opportunity with more share gains ahead driven by its superior design capability and strong AI partnerships." with more share gains ahead driven by its superior design capability and strong AI partnerships." The analyst also believes that AI-related revenue will increase to 70% in FY2024 and further to 80% in FY2025.

The OEM appliance and large data center revenue of $1.17 billion grew 59% year-over-year and 94% QoQ. The boom in AI-related data center sales helped to push this segment to over 100% growth in FY2023.

The Enterprise and channel vertical, which also includes AI/ML revenue, was up 19% year-over-year and 51% QoQ to $976 million.

What to look for in the earnings report:

1) Visibility on Supply:

Charles Liang, Founder and CEO of the company, said in the last earnings call, “Due to the current key components supply shortages, we forecast revenue in the range of $1.9 billion to $2.2 billion for the September quarter. However, given the record high backlog, we see fiscal year 2024 revenue between $9.5 billion to $10.5 billion with room to deliver more depending on availability of supply.” “Due to the current key components supply shortages, we forecast revenue in the range of $1.9 billion to $2.2 billion for the September quarter. However, given the record high backlog, we see fiscal year 2024 revenue between $9.5 billion to $10.5 billion with room to deliver more depending on availability of supply.”

Regarding the possibility high revenue (all dependent on supply), this was what was discussed on the call – with the CEO making it abundantly clear the revenue will follow the supply outlook.

Ananda Baruah:

“[…] And so I guess the first question is, is what's the opportunity do you see to maybe even do teach stronger than the fiscal '24 guidance. I guess, what would be the puts and takes there? And, if you were to be able to exceed the 2024 guidance, what would be some of the things you think would need to occur?”

Charles Liang

“[..] And for sure, they need 10 times 20 time more system. And we just cannot ship at this moment, because of supply chain […] So I mean, we are on the right track, yes expecting supply chain can improve so that we can grow our revenue.

2) Nvidia Relationship:

You can expect Supermicro to continue to play up its relationship with Nvidia in the upcoming earnings call.

The company recently announced the shipment of Nvidia GH200 Grace Hopper Superchip-based servers. So, there could be more updates in the earnings call regarding the company’s capabilities in AI. In the last earnings call, Charles Liang said, “Couple of months ago, I was honored to have my close friend, NVIDIA CEO Jensen Huang, join me on stage at Computex to highlight our optimized new generation GPU solutions for this AI era. We are deploying not just systems, but complete rack-scale total solutions to large generative AI innovators.”

3) Cash flow and Margins need to be decent.

Cash flow was negative in the recent quarter due to high accounts receivable. However, we will keep an eye on cash flow in the upcoming quarter. There was a question in the earnings call about working capital needs and whether they can generate positive cash flow going forward. Per management: “Yes, John. We see the business generating good cash flows, as it has historically. And we think that the — especially in this constrained supply market, where we could deliver more if we had more supply. But we're so really, the constrained supply ends up moderating the working capital. And so we grew our business last quarter quite a bit and grew our ARR. So that utilized a lot of working capital, but we have no concerns about working capital.”

As stated, operating margins are always a point of focus for SMCI on the earnings calls.

Conclusion:

Investing is a sum of calculated bets. AI will continue to be a powerful trend into the foreseeable future and our plan is to position for this. Supermicro is the #2 company for AI-related revenue (as a percentage of revenue), and this is not an easy achievement given the other companies that are gunning for AI-related revenue are juggernauts with billions in cash. However, we are no stranger to the ups/downs of sentiment in the tech sector. Strong companies with perfect earnings reports will selloff, sometimes drastically, and then often power higher. You can expect us to use all the technical analysis tools at our disposal to manage this position: setting stops, hedging at times, layering in more, trimming at the top. We think SMCI is well worth the effort.

Notably with SMCI and all of our positions, what would get us to change our mind is a material change to the margins and cash flow. We respect the FED, we don’t fight the FED. You can look for our post-ER write-up Wed night!

Read our deep-dive analysis on the company here and our past coverage here and here.

Royston Roche Equity Analyst at the I/O Fund contributed to this analysis

Recommended Reading:

AMD Q3 Pre-Earnings: With Bated Breath for Q4 Commentary

Nvidia’s dominance and AMD’s potential are both massive, which is why the battle between these two companies is far more exciting than the Mag 7 combined. Where else can you find the most powerful trend we’ve seen in decades come head-to-head between two companies? The MI300 will ramp in Q4 with El Capitan, but it’s the additional color management provides in terms of Q4 data center commentary that the market will be looking for. It may come in Q4 or the management team may force investors to wait for additional color until early 2024. Regardless, this is a highly anticipated earnings report, not only for the I/O Fund but I suspect many will be watching this report with interest given the catalyst that AMD is sitting on — and most crucially, must execute on.

Revenue and EPS:

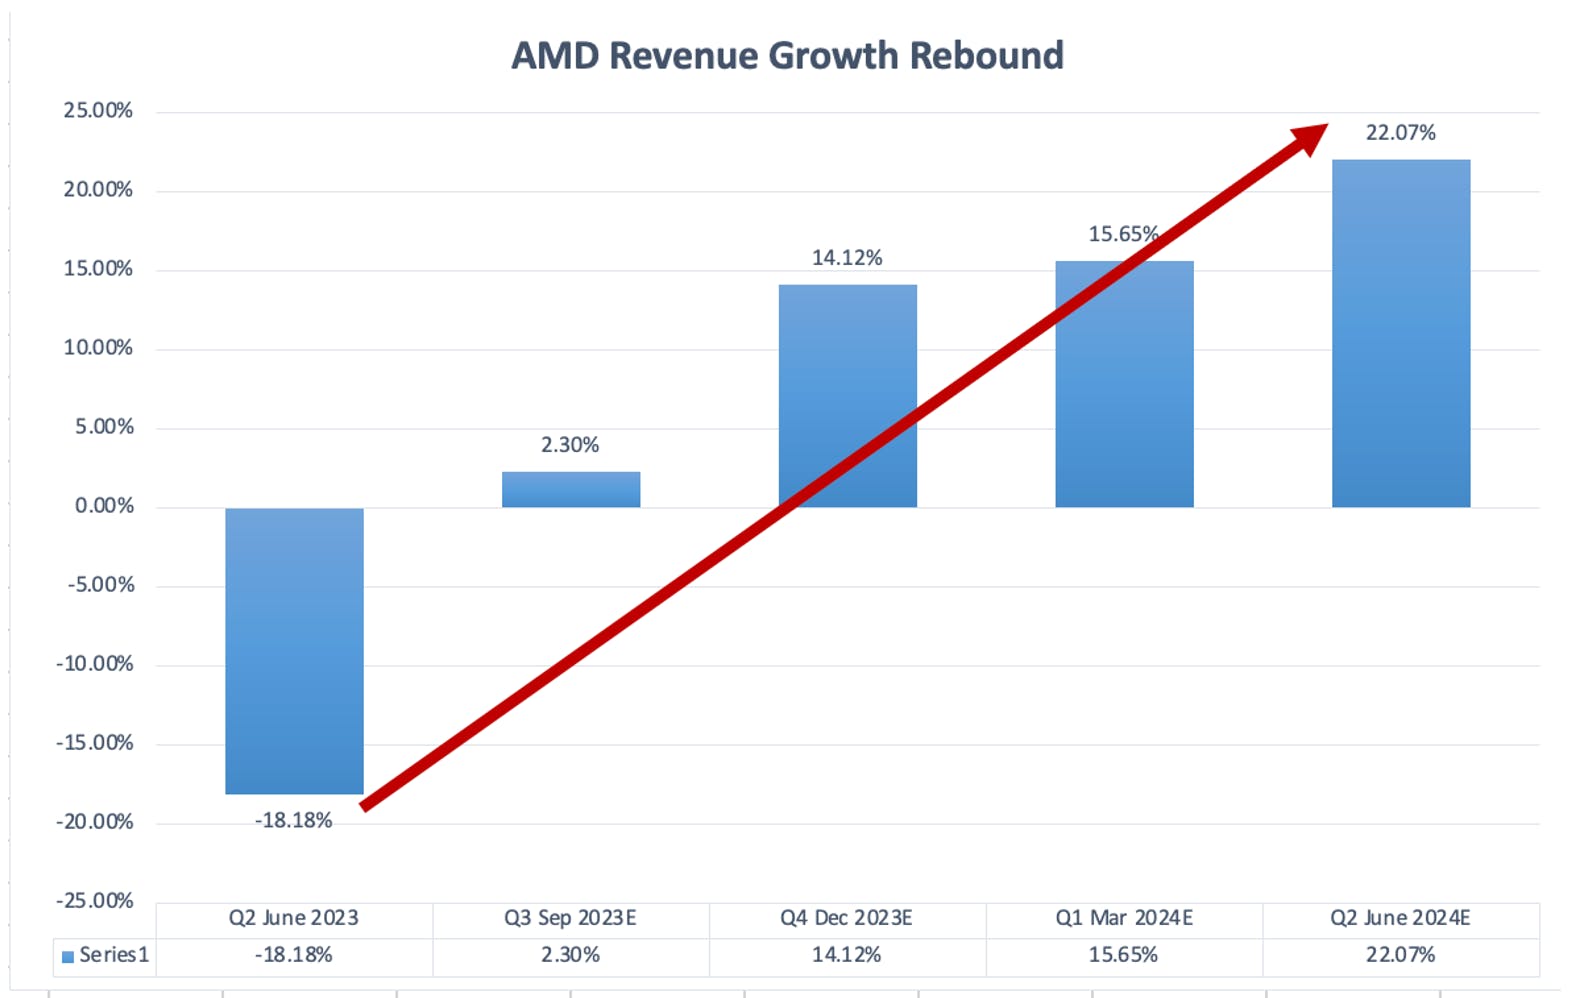
Revenue for this quarter is expected to be $5.7 billion, per both management guidance and analyst consensus. This represents growth of 2.3%. This should be the bottom for AMD with revenue consensus at 14% next quarter and accelerating for the next four quarters through September of 2024. When there’s a catalyst on the horizon, I tend to see analyst estimates as a baseline.

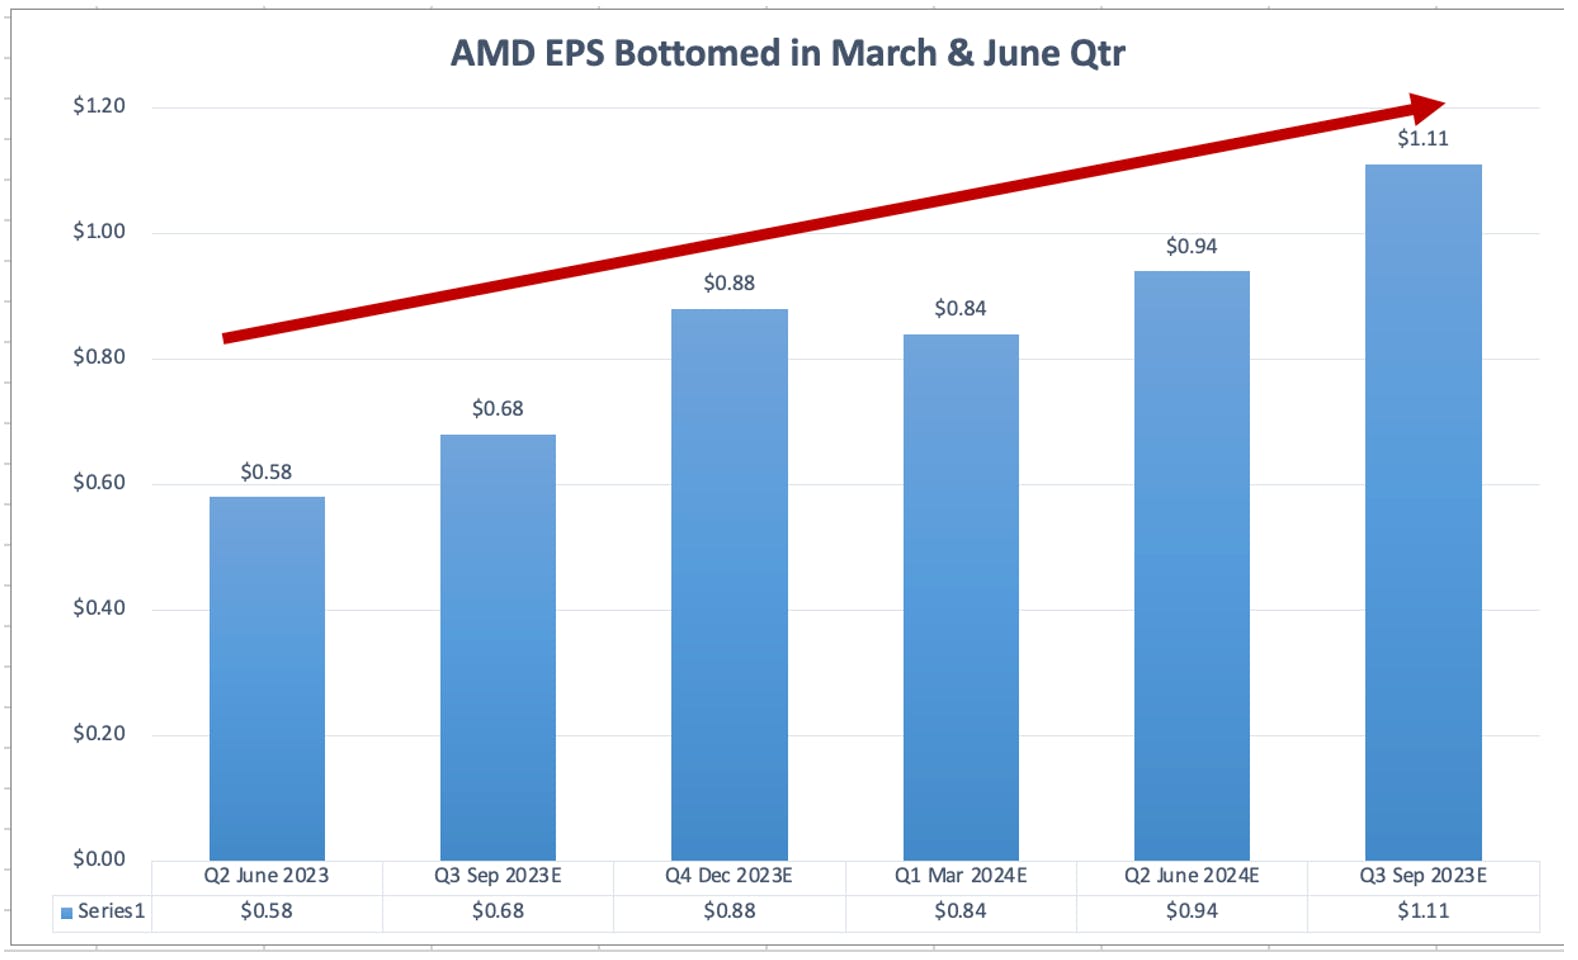
EPS also rebounds from here with $0.60 EPS expected this quarter, yet EPS will reach $1.11 EPS by September 2024.

Margins:

GAAP gross margin was 46% last quarter. The last few quarters, GAAP GM was affected by the Xilinx acquisition. Typical range is GM of 45% in 2022 and 48% in 2021. 

AMD’s guidance for Q3 is adjusted gross margin of 51%. This represents 100 basis points improvement from the previous quarter.

The operating margin was 0% last quarter. The CFO has been clear that it will recover when client sales of PCs recover. According to most industry analysts who track PC sales, we have bottomed in Q3 or will bottom in Q4 (see below). The GAAP OM was 5% in 2022 and 25% in 2021.

Adjusted operating margin was 20% last quarter for adjusted operating profit of $1.06 billion.

Net margin was 0% while adjusted net margin was 17.5%.

Cash Flow:

AMD reported operating cash flow of $379 million last quarter. This is low for the company as the last two fiscal years have been $3.6B and $3.5B, respectively.

Free cash flow was $254 million in the most recent quarter, for a margin of 4.70%. This compares to a FCF margin of 13% last year and a FCF margin of 20% in 2021. The company has $6.3 billion on its balance sheet with $2.46 billion in debt.

Key Segments:

Data Center:

The data center segment has been reporting negative growth due to tough comps. Last quarter growth was (-11%) compared to 83% in the year ago quarter.

Investors should expect revenue growth to be flat YoY for Q3 yet is expected to report double digit growth QoQ. For Q4, DC is expected to report 50% sequential growth as there will be sizable revenue from MI300s powering the El Capitan supercomputer that launches in November. We covered this here following the last earnings report. For a deep dive on AMD’s MI300 GPUs and how they compare to Nvidia’s H100 GPUs, reference this analysis here.

According to the earnings call Q&A, the acceleration in the data center between Q3 and Q4 will be about 50% growth. This is exciting, yet the market will want to see more balanced, commercial demand beyond the government-owned supercomputer. I’ve included the transcript that references the 50% growth below as this is what most of the near-term price action will be based on.

In terms of when AMD will show up with broader MI300 GPU sales, it took Nvidia six months from initial shipments in October through the April quarter to see a more obvious impact. That’s a general idea of what to expect. It could be a bit sooner or a bit later.

Per our write-up last quarter, management stated: “In the datacenter market, we see a mixed environment as AI deployments are expanding. However, cloud customers continue optimizing their datacenter compute and enterprise customers remain cautious with new deployments. Against this backdrop, we expect strong growth driven by higher fourth gen EPYC and Ryzen 7000 processor sales and initial shipments of our Instinct MI300 accelerators in the fourth quarter.”

Regarding fourth gen EPYC, this is an important series to help AMD resume strength in the data center. Last quarter 4th Gen EPYCs carried the segment as CPU revenue nearly doubled while 3rd Gen inventory levels were high. In September, the company released 4th Gen workload-specific CPUs for edge computing and telcos. This needs to be monitored closely as we want to see 4th Gen strength overtake 3rd Gen weakness. 

Here is the transcript on the discussion around Q4’s 50% revenue impact from El Capitan:

Matt Ramsay:

“Last quarter, you had given us some metrics around potentially being able to grow your datacenter business by 50% in the second-half of the year versus the first-half. And maybe you could give us a little bit of an update on how you're thinking about that milestone and the drivers of growth across CPU and accelerator for the back-half? Thanks.”

Lisa Su:

“And we are still looking at a zip code of, let's call it, 50% plus or minus second-half to first-half. So, it's a big ramp, but when we look at all the components, I think that the customer pull is certainly there. And it's exciting to be in this part of the industry.”

When asked whether the company has the supply to meet the demand, the CFO stated: 

“We feel that we have ample supply for an aggressive ramp in the fourth quarter and into 2024. But this is certainly one of the areas that we spent quite a bit of time to ensure that we do have that confidence.” 

Per management, El Capitan will contribute “several hundred million” in revenue for Q4. Of the obstacles that AMD must overcome, our analysis made it quite clear it was the software part of the equation that AMD must solve.

Per management: “There is a sort of large, call it, lumpy supercomputer win, so our El Capitan win will be in the fourth quarter primarily, with a little bit in the first quarter” and later it was stated by management: “You can assume that the El Capitan is several hundred million” of the Q4 data center revenue. 

Ideally, AMD announces commercial customers soon. I’m sure Meta will be one of the first customers, considering the company has been ordering Bergamo from AMD, was on stage at AMD’s conference recently in June, and PyTorch is optimizing its framework for AMD’s software stack RocM. It’s just a guess at this point, but that’s a lot of collaboration.

ONE MORE COMMENT ON THE 50% QoQ RAMP in Q4:

Aaron Rakers

[…] I think, last quarter, you had alluded to, for the full-year, the expectation is still growing 10% or double digits, I should say, for the full-year the Datacenter business, just confirming that. And what I'm really trying to ask is, given the guidance of flat year-over-year growth in Datacenter in 3Q, it would seem, if my math is correct, you're implying a 50% or so increase sequentially into 4Q. I'm just trying to frame exactly how you're thinking about the cadence of what 4Q looks like, underpinning that expectation?

Jean Hu

Hi, Aaron. Thanks for the question. I think as Lisa just mentioned earlier, it's a very dynamic market. There are puts and takes. We have a tremendously strong momentum with our product portfolio, but there is continued softness in enterprise market, and also call it, the optimization is still ongoing. So, overall on balance, we think year-over-year it's probably more like a high single-digit. It's really strong ramp, not only in Q3, right, sequentially earnings double-digit — strong double-digit. And the Q4, of course we're going to see continued sequential strong ramp.”

Last year, in FY2022, the data center segment reported $6.043B in revenue. This means at high single-digit, or 9% growth, FY2023 DC segment will report $6.586B. This leaves $3.986B for the next two quarters given $2.6B has already been reported in Q1 and Q2 this year.

The CFO is implying $1.6B for this upcoming quarter per the “flat YoY” comment. This also matches the “double digit” QoQ growth. This leaves $2.386B revenue for Q4. These are the approximate numbers to watch in the upcoming quarter.

Client Segment/PCs:

Although data center is where the focus tends to gravitate, the Client Segment is going to be critical in the upcoming report. Last quarter the Client / PC segment was up 35% QoQ yet was down (-54%) YoY. The March quarter should have marked the bottom at $739M in revenue, with the June quarter showing some improvement at $998M in revenue.

Per management in the last earnings call:  client segment will grow in the seasonally stronger second half of the year” including a launch of a dedicated AI engine for the mobile 7040 Ryzen CPUs.

Industry analysts at Gartner are targeting Q4 as the rebound quarter for PCs. The CFO of AMD likely has a good idea as to their unique levels of demand, therefore, we are looking for Q3 to be the rebound given the CFO’s comments. Whether it happens in Q3 or Q4, it’s a good supportive segment to the data center ramp that El Capitan will provide, at minimum.

Gartner’s most recent report on PC sales:

  • Worldwide PC shipments totaled 64.3M units in the third quarter of 2023, a 9% decrease from the third quarter of 2022, according to preliminary results by Gartner. 
  • While the third quarter's results mark the eighth consecutive quarter of decline for the global PC market, Gartner is expecting to see growth again starting in the fourth quarter of this year. "There is evidence that the PC market's decline has finally bottomed out.”
  • The good news for PC vendors is that that the worst could be over by the end of 2023,” said Kitagawa. “The business PC market is ready for the next replacement cycle, driven by the Windows 11 upgrades. Consumer PC demand should also begin to recover as PCs purchased during the pandemic are entering the early stages of a refresh cycle.”
  • Gartner is projecting 4.9% growth for the worldwide PC market for 2024, with growth expected in both the business and consumer segments.

An analyst from Citi has September as the rebound, per an analyst note: “Christopher Danely notes that notebook shipments were up 7% month-over-month in September, which was well above the firm's expectation of down 2% month-over-month, driven by stronger seasonal demand and pull-in from Q4. As a result, Q3 notebook shipments were up 6% quarter-over-quarter, which is above the firm's prior expectation of up 3% quarter-over-quarter.”

Gaming:

Gaming is expected to decline again this quarter. We will look for comments on when this segment will bottom. The Radeon 7000 series built on RDNA 3 architecture is still ramping, but the company has been facing tough comps. Last quarter, the segment reported (-4%) YoY revenue of $1.6B.

Embedded:

The embedded segment will be weaker than usual over the next two quarters. Per management: “Embedded segment revenue to decline in the back-half of the year as lead times normalize and some customers reduce their inventory levels.” Embedded has been reporting very high and unusual growth due to the Xilinx acquisition with triple digit growth and even four-digit growth (it was up 1,868% in the Dec quarter). Look for embedded to normalize.

A Note on the Software Platform RocM:

In the deep dive on AMD entitled AMD is Ready to Rival on AI Acceleration, the analysis broke down the differences between CUDA and RocM. There is where Nvidia has the largest lead over AMD. As the two competitors face off, there will be many new developments to track, most recently AMD’s recent acquisition of Nod.ai to (quickly) expand its open AI software capabilities. I imagine analysts will be asking about this acquisition on the call, and our post-ER write-up will cover any Q&A on AMD’s plans with this acquisition.

Conclusion:

AMD is the top earnings report for our firm to watch over the next few quarters. We are not looking for a H100 moment, rather we are looking for a MI300 moment. For AMD, this is characterized by undercutting the competitor on price while bringing the heat on performance. If the performance is there (to be determined by benchmark tests) than AMD will fare well with the hyperscalers. Let’s see how this unfolds.  

Recommended Reading:
Five Stocks (Not Seven) Can Lead to New Highs

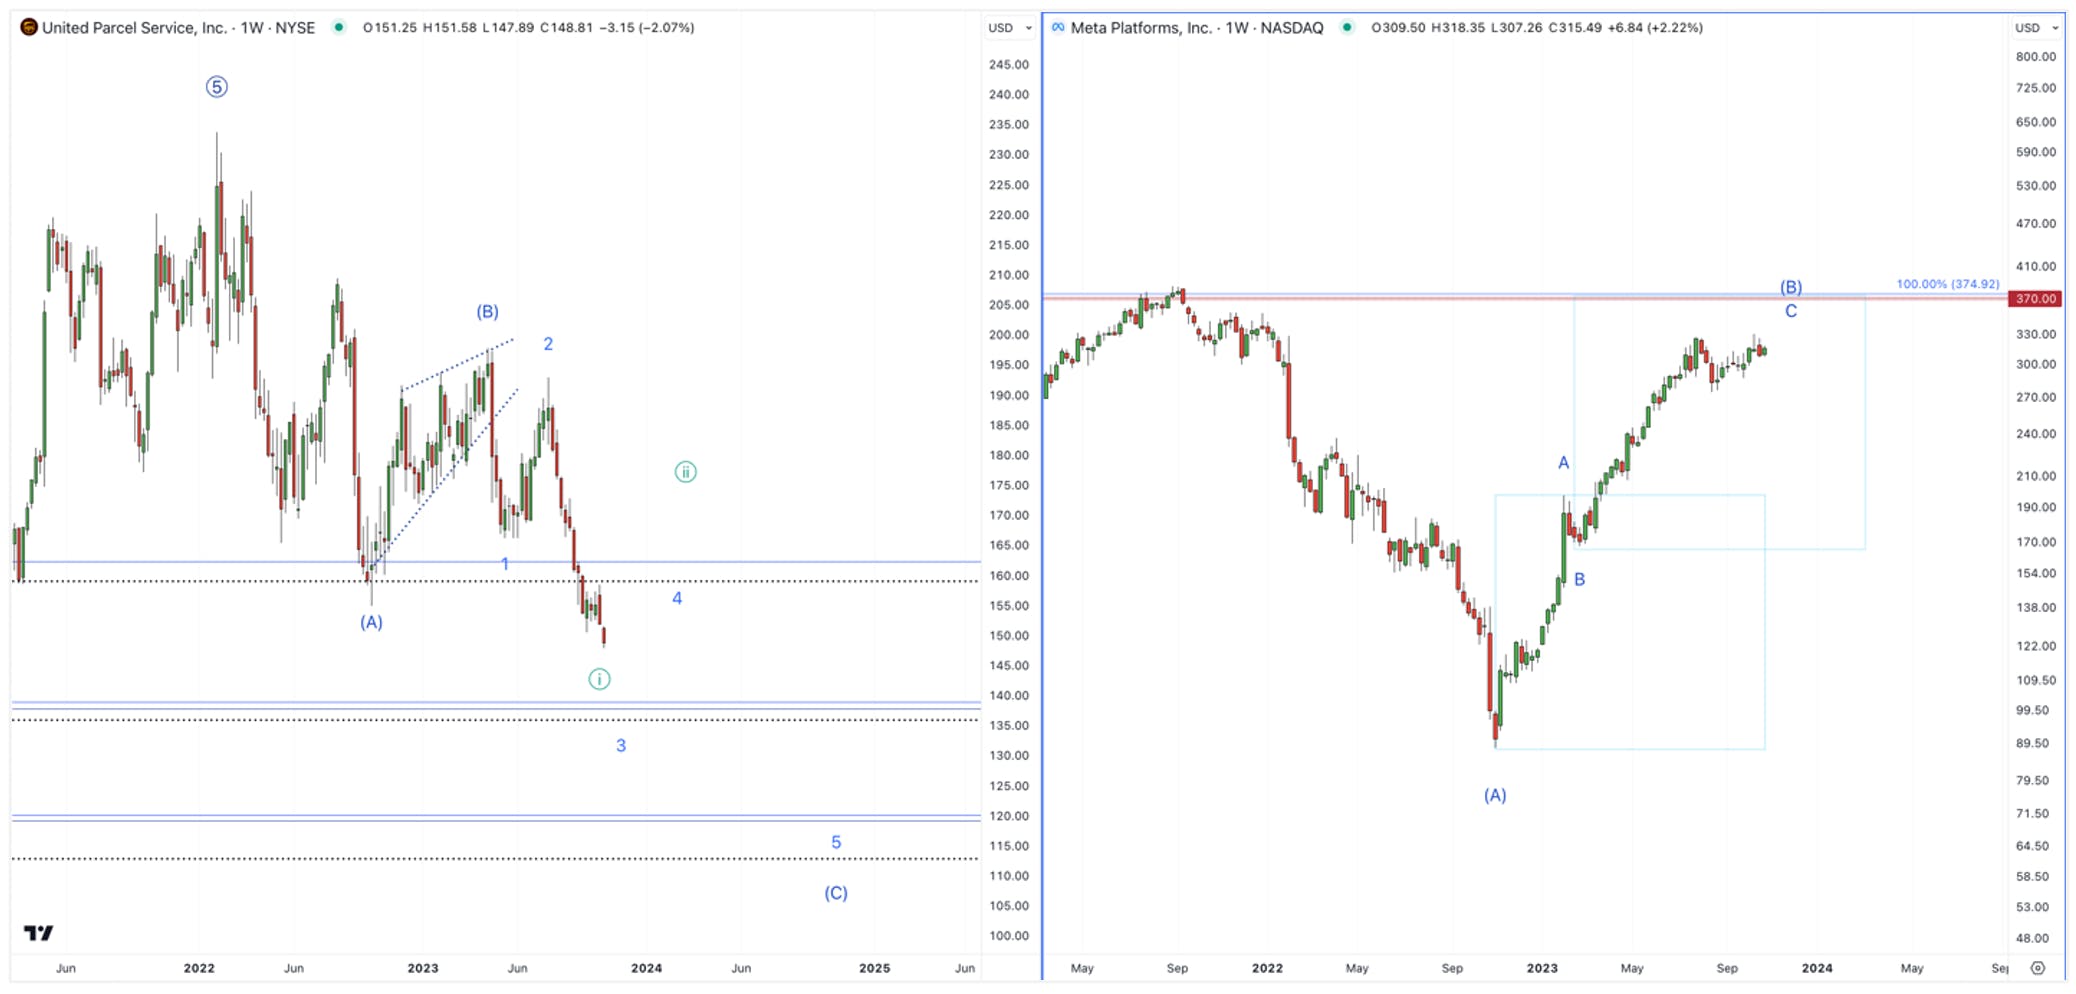
This is a complicated market, and there is really no better image to prove this point than comparing the transportation juggernaut, UPS, to the big tech juggernaut, META. While UPS has broken below its October 2022 lows and is currently in free fall, META’s uptrend is incomplete, and needs one more push higher to at least the $370 level before completing.

united parcel service stock chart

The majority of other sectors are confirming a continuation of the 2022 bear market, meanwhile, a handful of big tech names, with outsized weighting in the major indexes, suggest that they want to go higher. Though this pattern of narrow leadership where the market is held up by 7 stocks is unsustainable and a warning of an unhealthy market, it can continue, and likely will, at least into late 2023/early 2024. 

With markets continuing a nearly 3-month correction, the consensus is now confirming what we have been saying since July.

We do not believe a recession is priced into equities, and that it is inevitable. However, this doesn’t mean that we can’t see higher levels from here, before a recession hits.

In other words, bearish sentiment is now accompanied with the mainstream news is calling for an imminent market crash. This is after flooding the market with non-stop narratives about a soft landing.non-stop narratives about a soft landing.

stock market crash warning

However, unlike the consensus, we believe this final swing higher in the markets has one more run in it before the secular bear market that started in 2022 commences again.

Five Stocks (Not Seven) Can Lead to New Highs

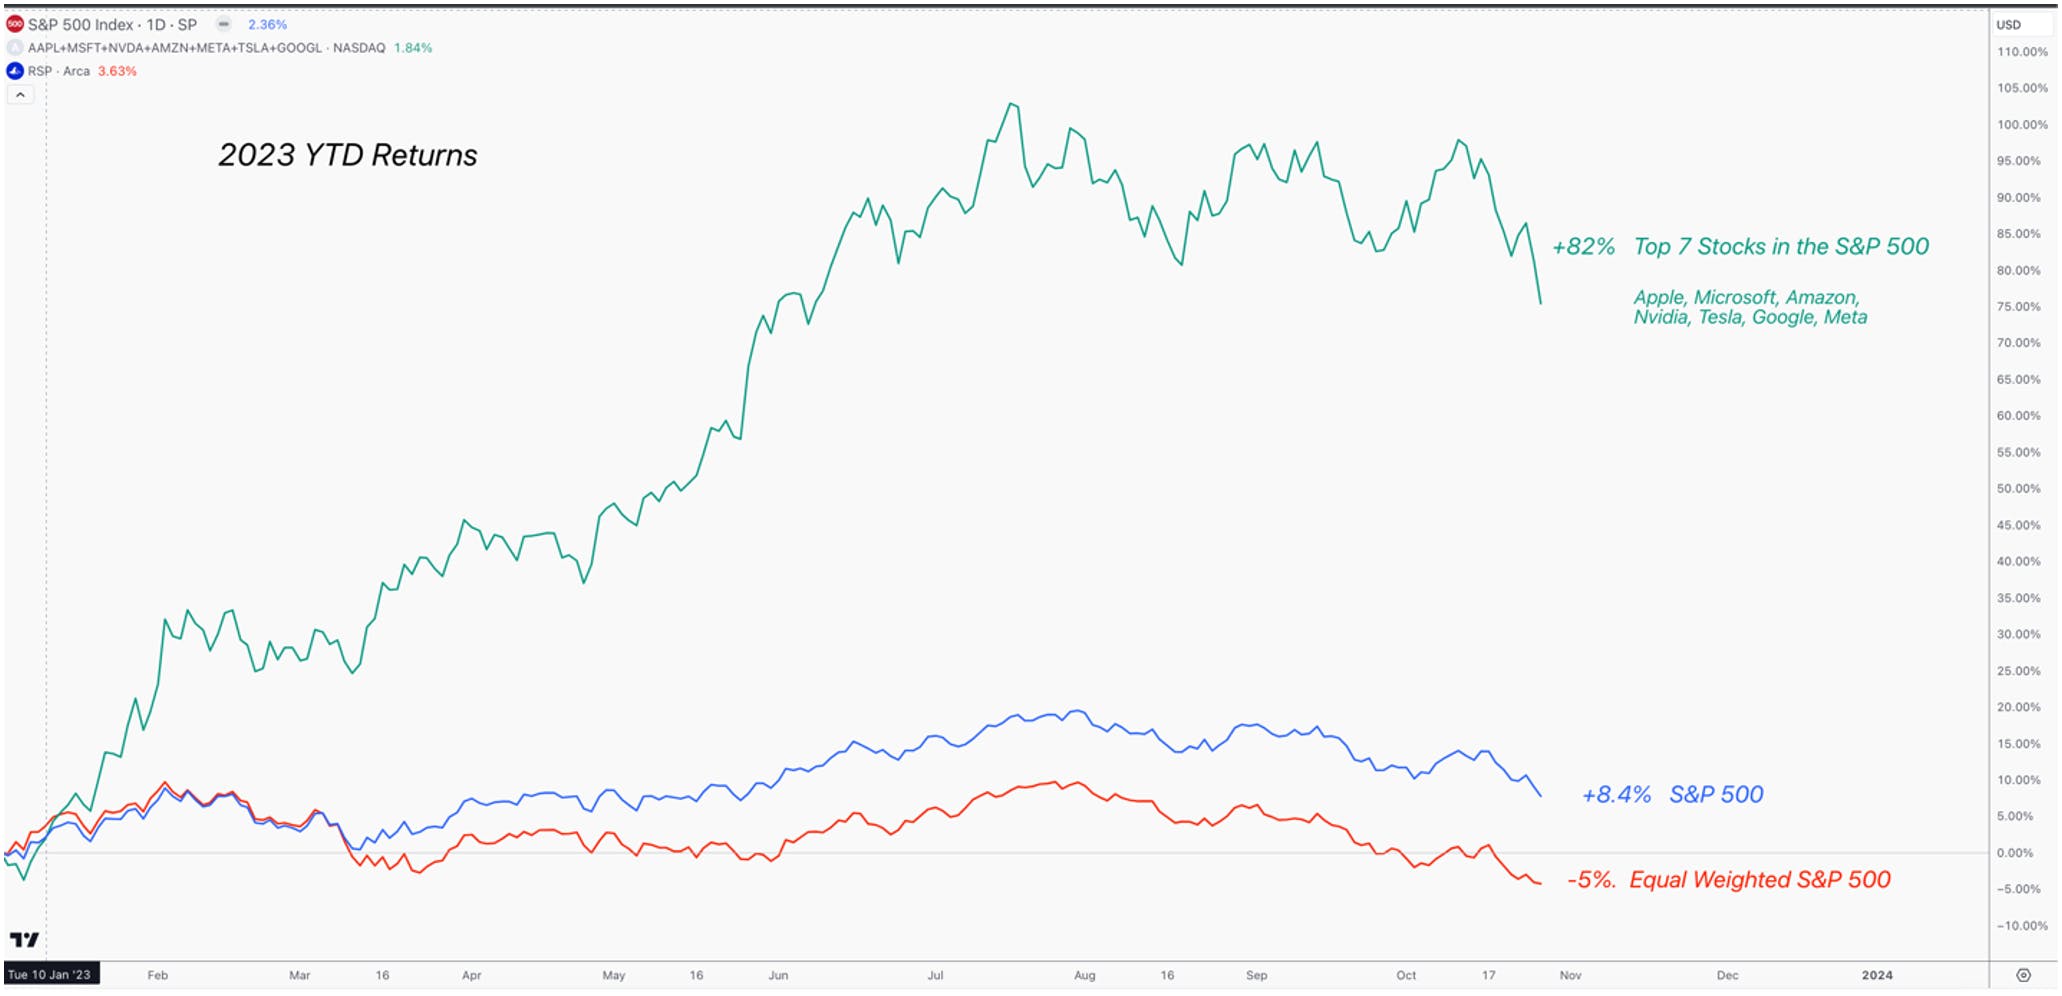
Nasdaq had the best first 6 months in the index’s history, and this rally was propped up by seven stocks known as the Magnificent 7: Apple, Amazon, Meta, Tesla, Nvidia, Microsoft and Alphabet. Meanwhile, the rest of the market is struggling. Many argue otherwise, but the picture below is worth a thousand words in terms of illustrating the narrow leadership of this market.

sp500 stock chart

What is most concerning is that the equal weighted S&P 500 (RSP), which gives the same weighting to all 500 stocks in the index, is actually negative for the year. This matters because in a healthy economy, all sectors tend to participate, while mid-caps tend to outperform large caps. So, when the equal weighted S&P 500 is outperforming on a relative basis, it tends to be a good sign for the foundation of a new bull market.

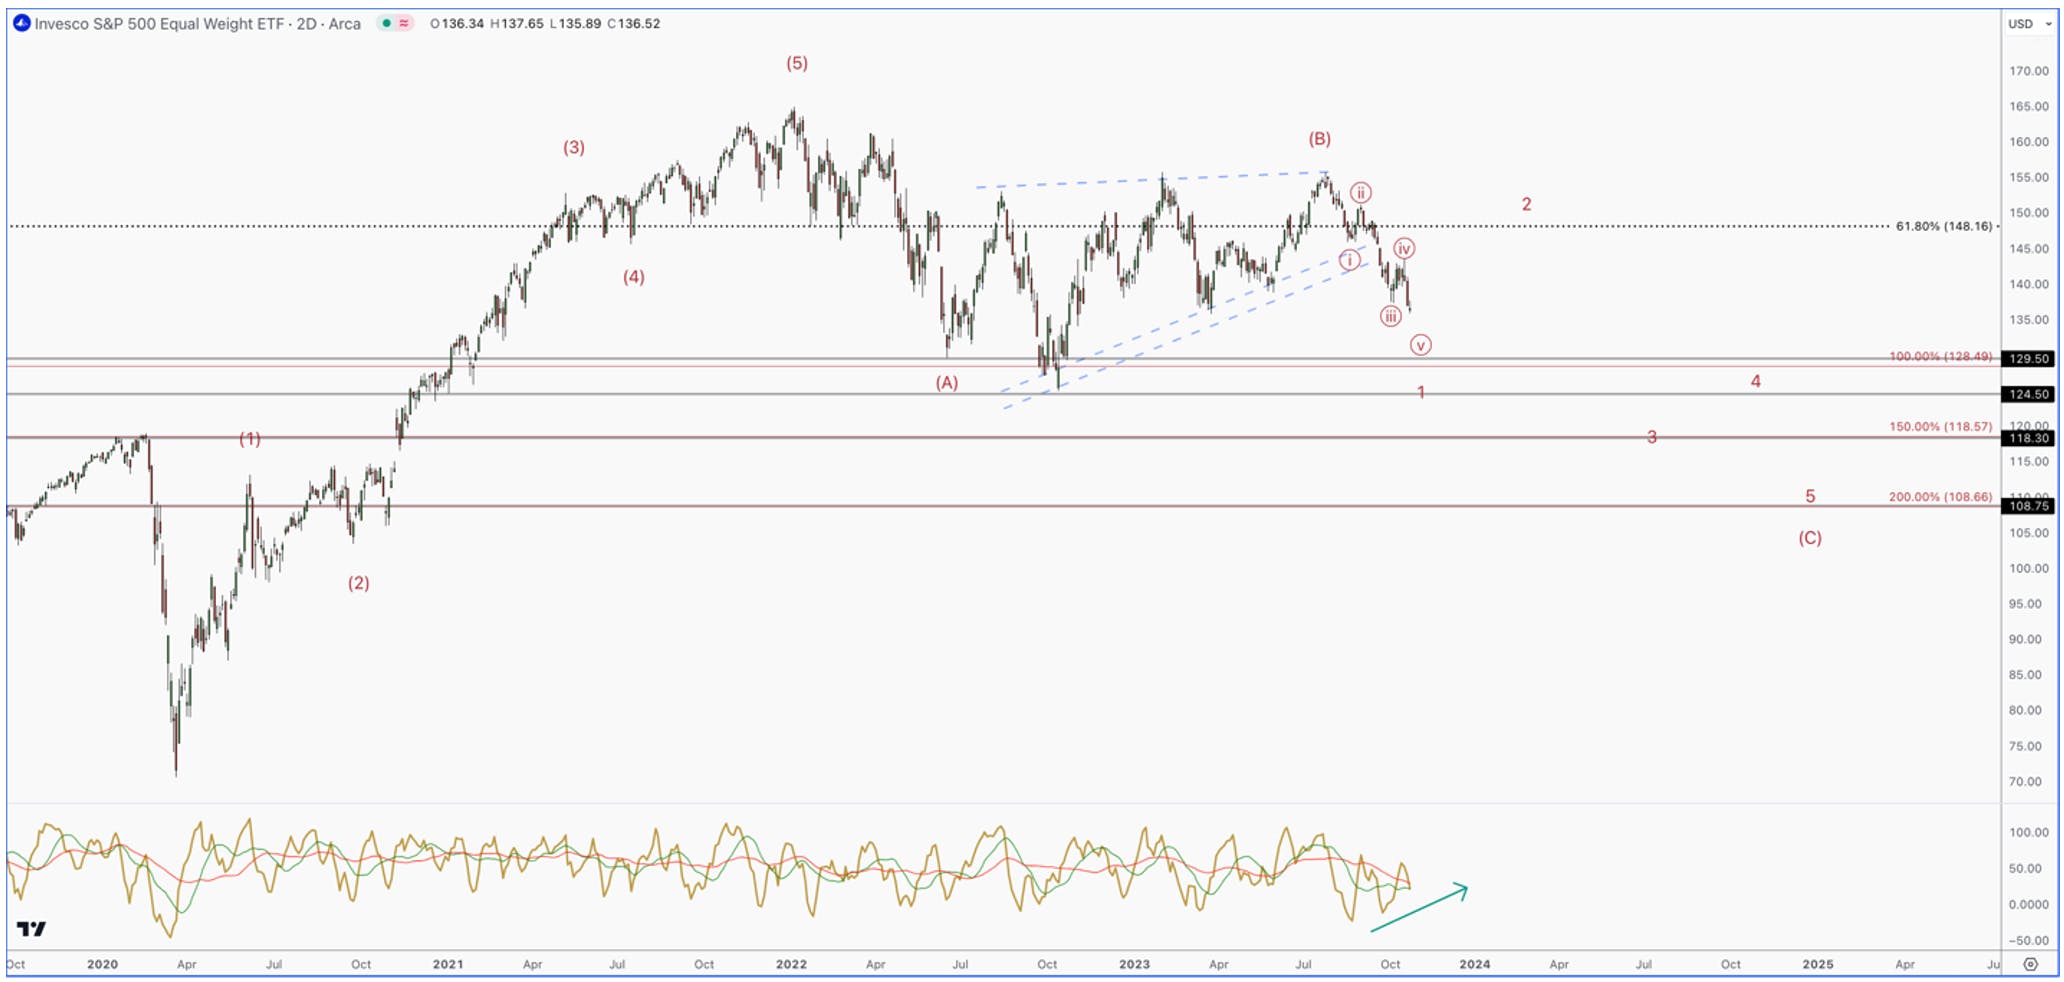
The Equal Weighted S&P 500, like many others indexes, has put in a large top, and will likely not see a new all-time high for a long time. Note in the below chart that RSP could not sustain above its February highs, and has now broken through the major trendline in a 5-wave pattern.

invesco chart analysis

If the market is going to continue the bear market that started in 2022 to new lows, it will have to take the form of a 5-wave pattern pointing down. These patterns are fractal, which means that a small one builds into a larger one until we reach our target. So, the fact that the current drop in RSP is taking the shape of a 5-wave pattern is quite concerning, and also confirms that we are likely still in a larger bear market.

However, markets do not drop in straight lines. The current 5-wave pattern is only the first wave (of 5) that should take us much lower. What follows this pattern is always a 3 wave retrace that makes a lower high. So, even though sentiment is prepping for a crash, we still have one more bounce before that happens.

Even with this weakness we are seeing throughout the market, the magnificent 7 stocks account for ~28% of the S&P 500’s total weighting, and nearly ~42% of the NASDAQ-100. It is feasible that even with the broad level of weakness we are seeing, a handful of these stocks can push the bigger markets higher, and even potentially make another high in the NASDAQ-100.

The Macro Backdrop

In late August, we stated that..

“According to the economic trends we are seeing, there is simply no evidence of a recession brewing in Q3 of this year, and this is important for investors to realize this when looking for some type of top.”there is simply no evidence of a recession brewing in Q3 of this year, and this is important for investors to realize this when looking for some type of top.”

This remains true today, as the resilience of the US economy is still chugging along.

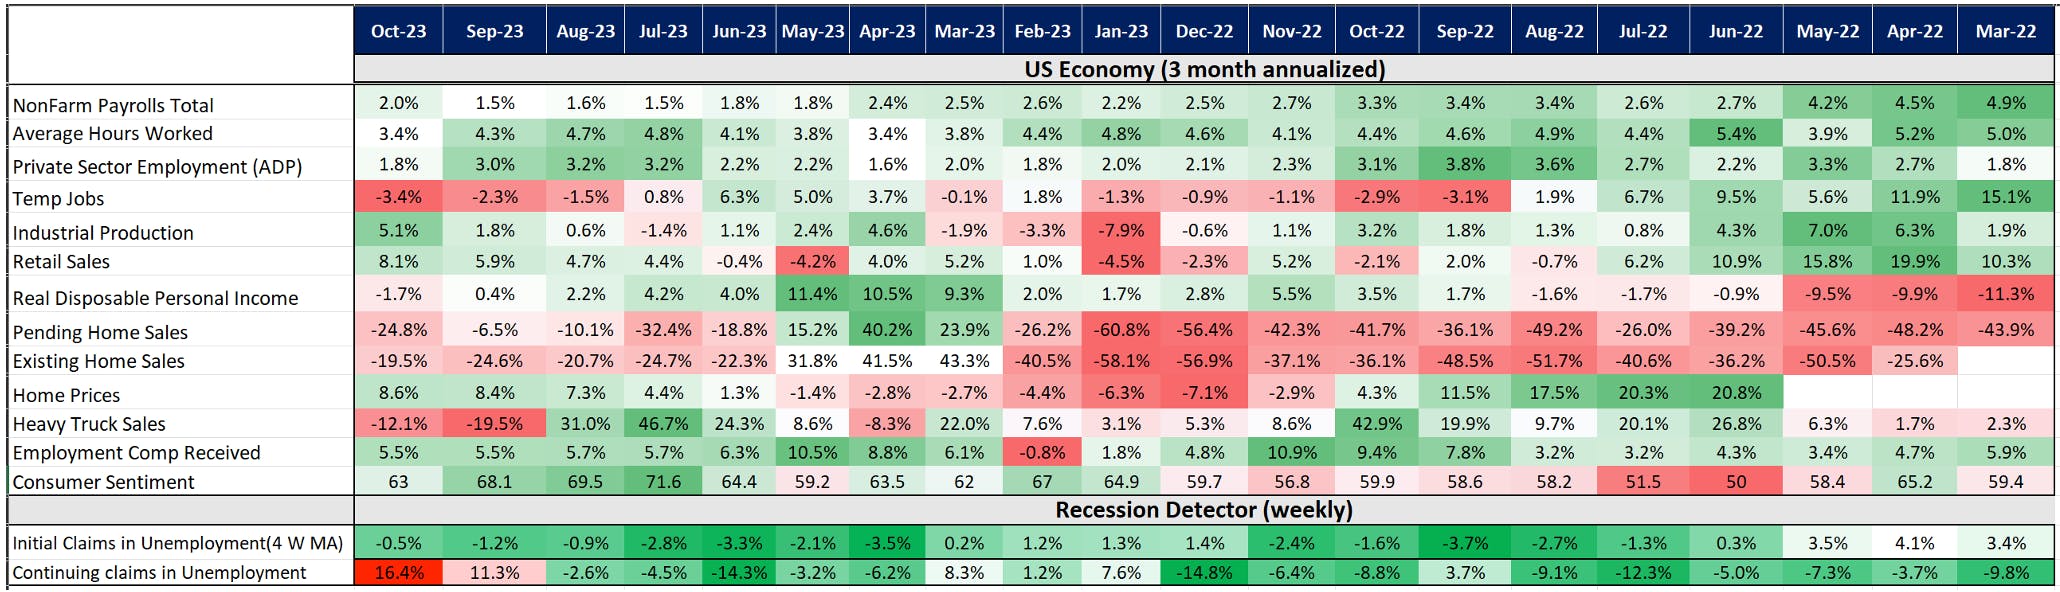
macro stocks chart

Not only has retail sales accelerated for the 6th month in a row, but industrial production gave us the strongest 3-month annualized reading since May of 2022. Most importantly, employment is still quite strong. Once we see a sharp rise in the 4 week average for initial jobless claims, we can start to looking for an imminent recession. Until then, we simply see no sign that the economy is heading into a recession right now.

Furthermore, we warned our readers to be cautious of claiming victory over inflation in June of 2023.

“Peak inflation is behind us, but the real battle will be getting these numbers back to the 2% target. In fact, going back in history, there is no instance where core PCE inflation backs off from an inflation impulse without a recession.”Peak inflation is behind us, but the real battle will be getting these numbers back to the 2% target. In fact, going back in history, there is no instance where core PCE inflation backs off from an inflation impulse without a recession.”

This has proven to be true, as we have seen 2 months in a row of reacceleration in CPI numbers. Most importantly, these numbers have bottomed well above the FED’s 2% targets on a YoY basis. In the below chart, core inflation has remained well above the Fed’s target, while the incredible disinflation that we saw in the Spring/Summer was due to decelerating energy prices.

cpi chart

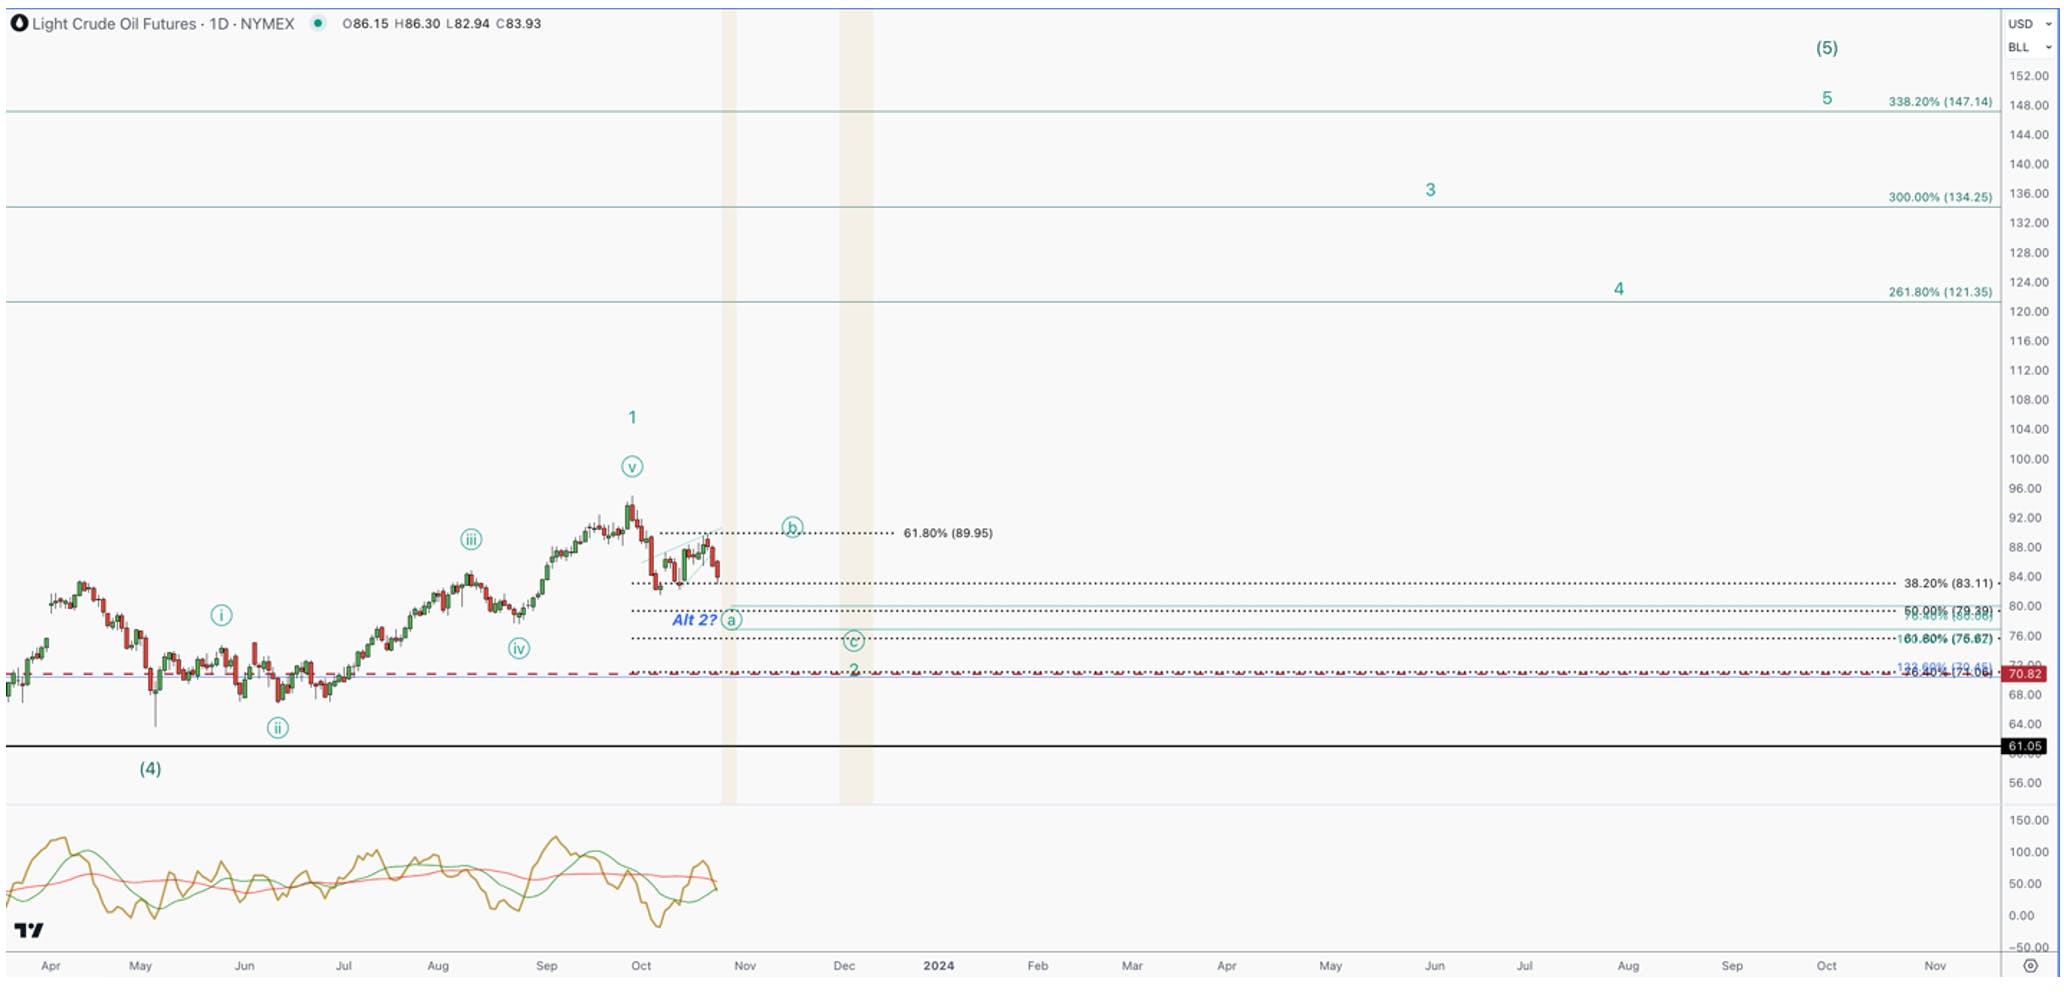
It has been our view that energy prices would make a run back to the highs in the coming months, and this new uptrend has further confirmed this thesis. However, as stated prior, markets do not move in a straight line. Now that we have a completed a full 5-wave move off the low in crude oil, which would be the 1st wave, we are now seeing the 2nd wave pullback.

Sign up for I/O Fund's free newsletter with gains of up to 221% – Click hereSign up for I/O Fund's free newsletter with gains of up to 221% – Click hereClick here

The most likely path is the count presented in green. We are seeing the end of the first leg in a 3 leg correction. This could take us as low as $76/barrel and could last through November/December. If this plays out, this will relieve pressure from the coming CPI prints, and allow equities to make the next leg higher.

light crude oil chart

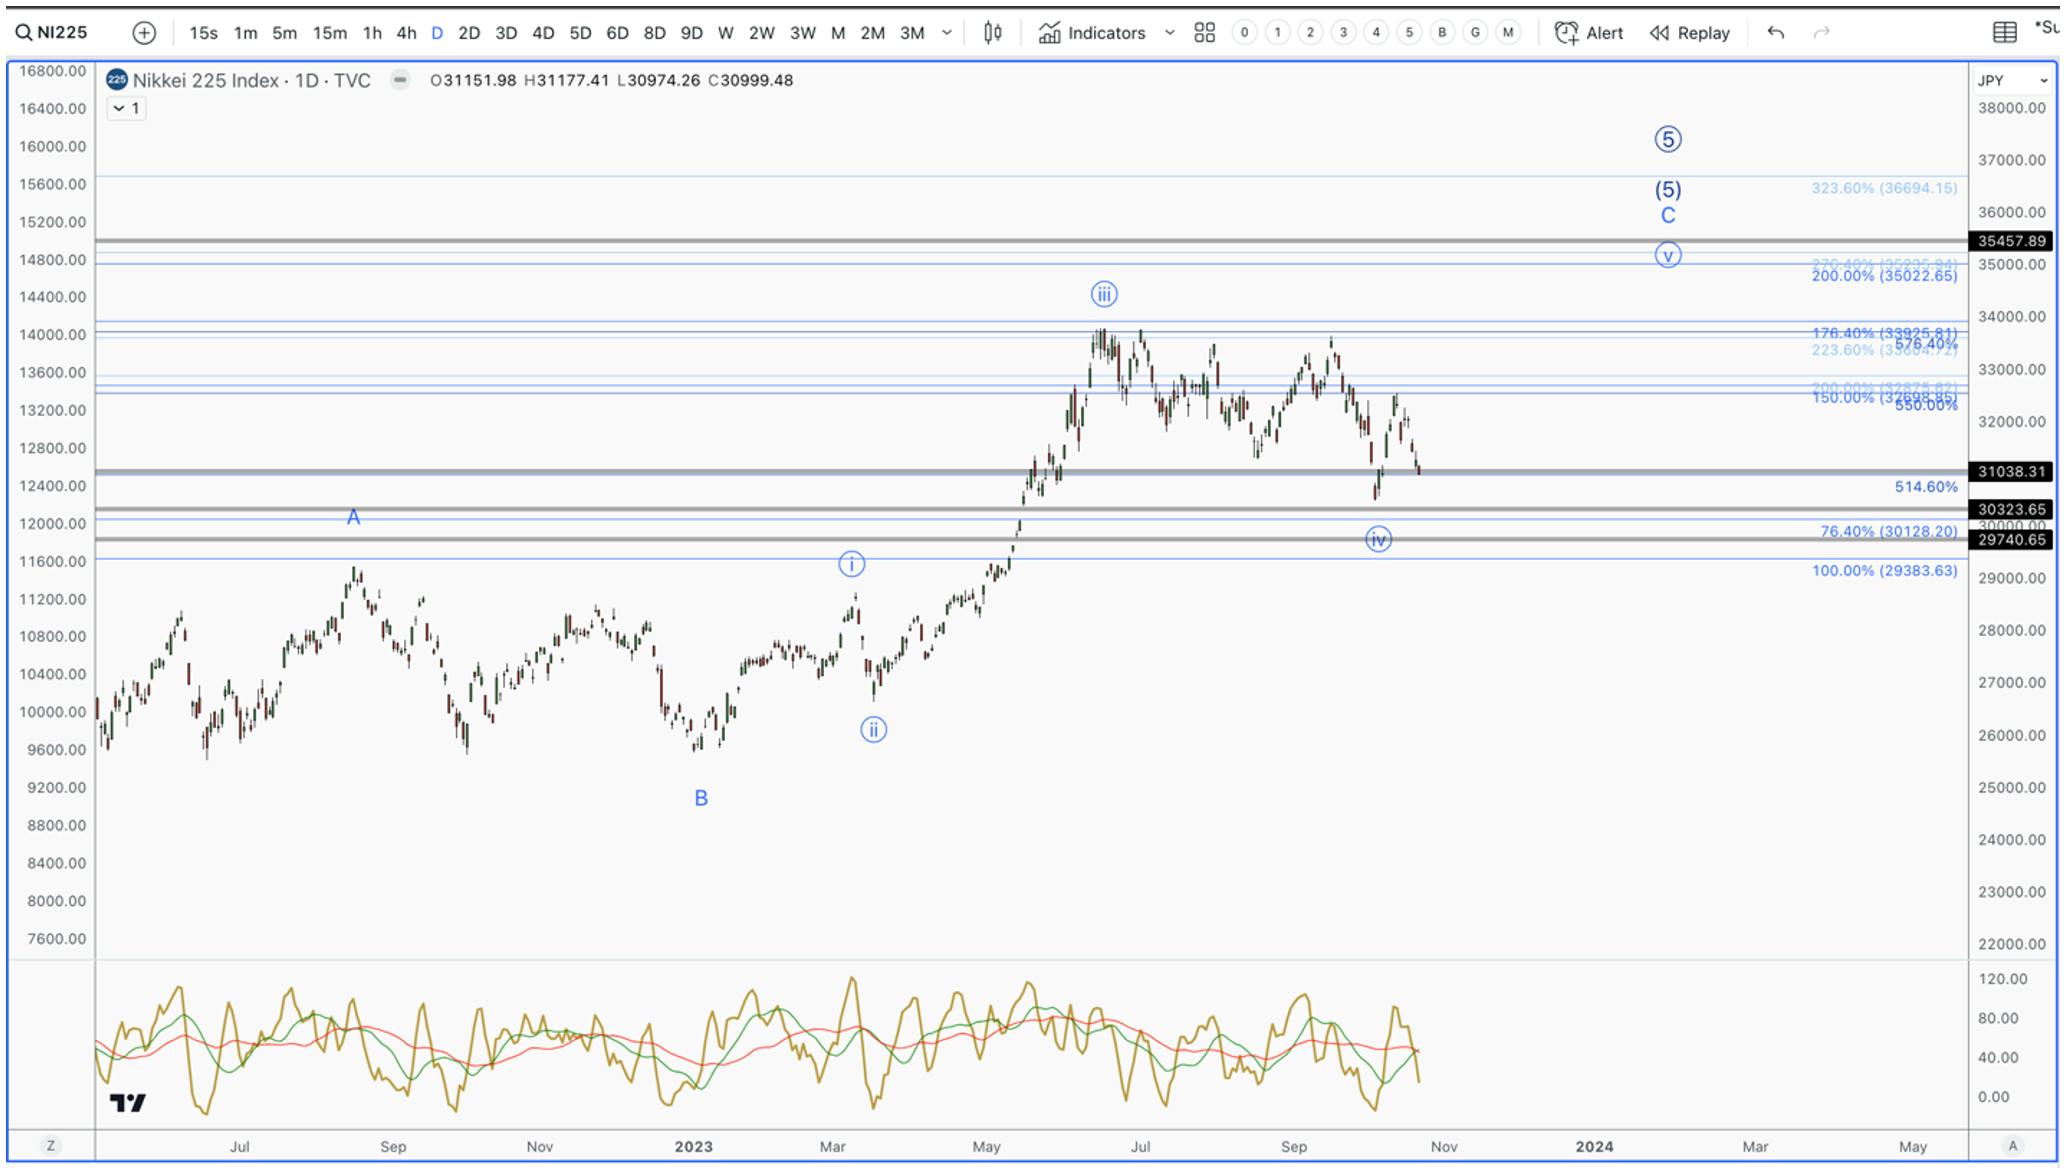
This is further confirmed when we look at the Japanese Nikkei, which has a strange history of leading the NASDAQ. Japan must import all of their oil. So, if oil is moving higher, companies within the Nikkei will see contracting margins, which is not good for stocks. When we look at the Nikkei, much like many of the magnificent 7, it has an incomplete uptrend.

nikkei 225 stock chart

Note how the correction, so far, has been an overlapping mess of a pattern. This is very common in 4th waves. It also implies that a 5th wave rally is needed to complete the larger pattern. If Japan is going higher, oil is going lower, which should propel equities in the US through the end of the year.

What This Means for S&P 500

In mid-September we laid out 3 potential paths that this bull market would to into a major top. From our assessment, the odds of a recession were very low in Q3, which was proven correct. Because of this, if the July high was the actual top, then it would likely be an event that pulls forward the recession.

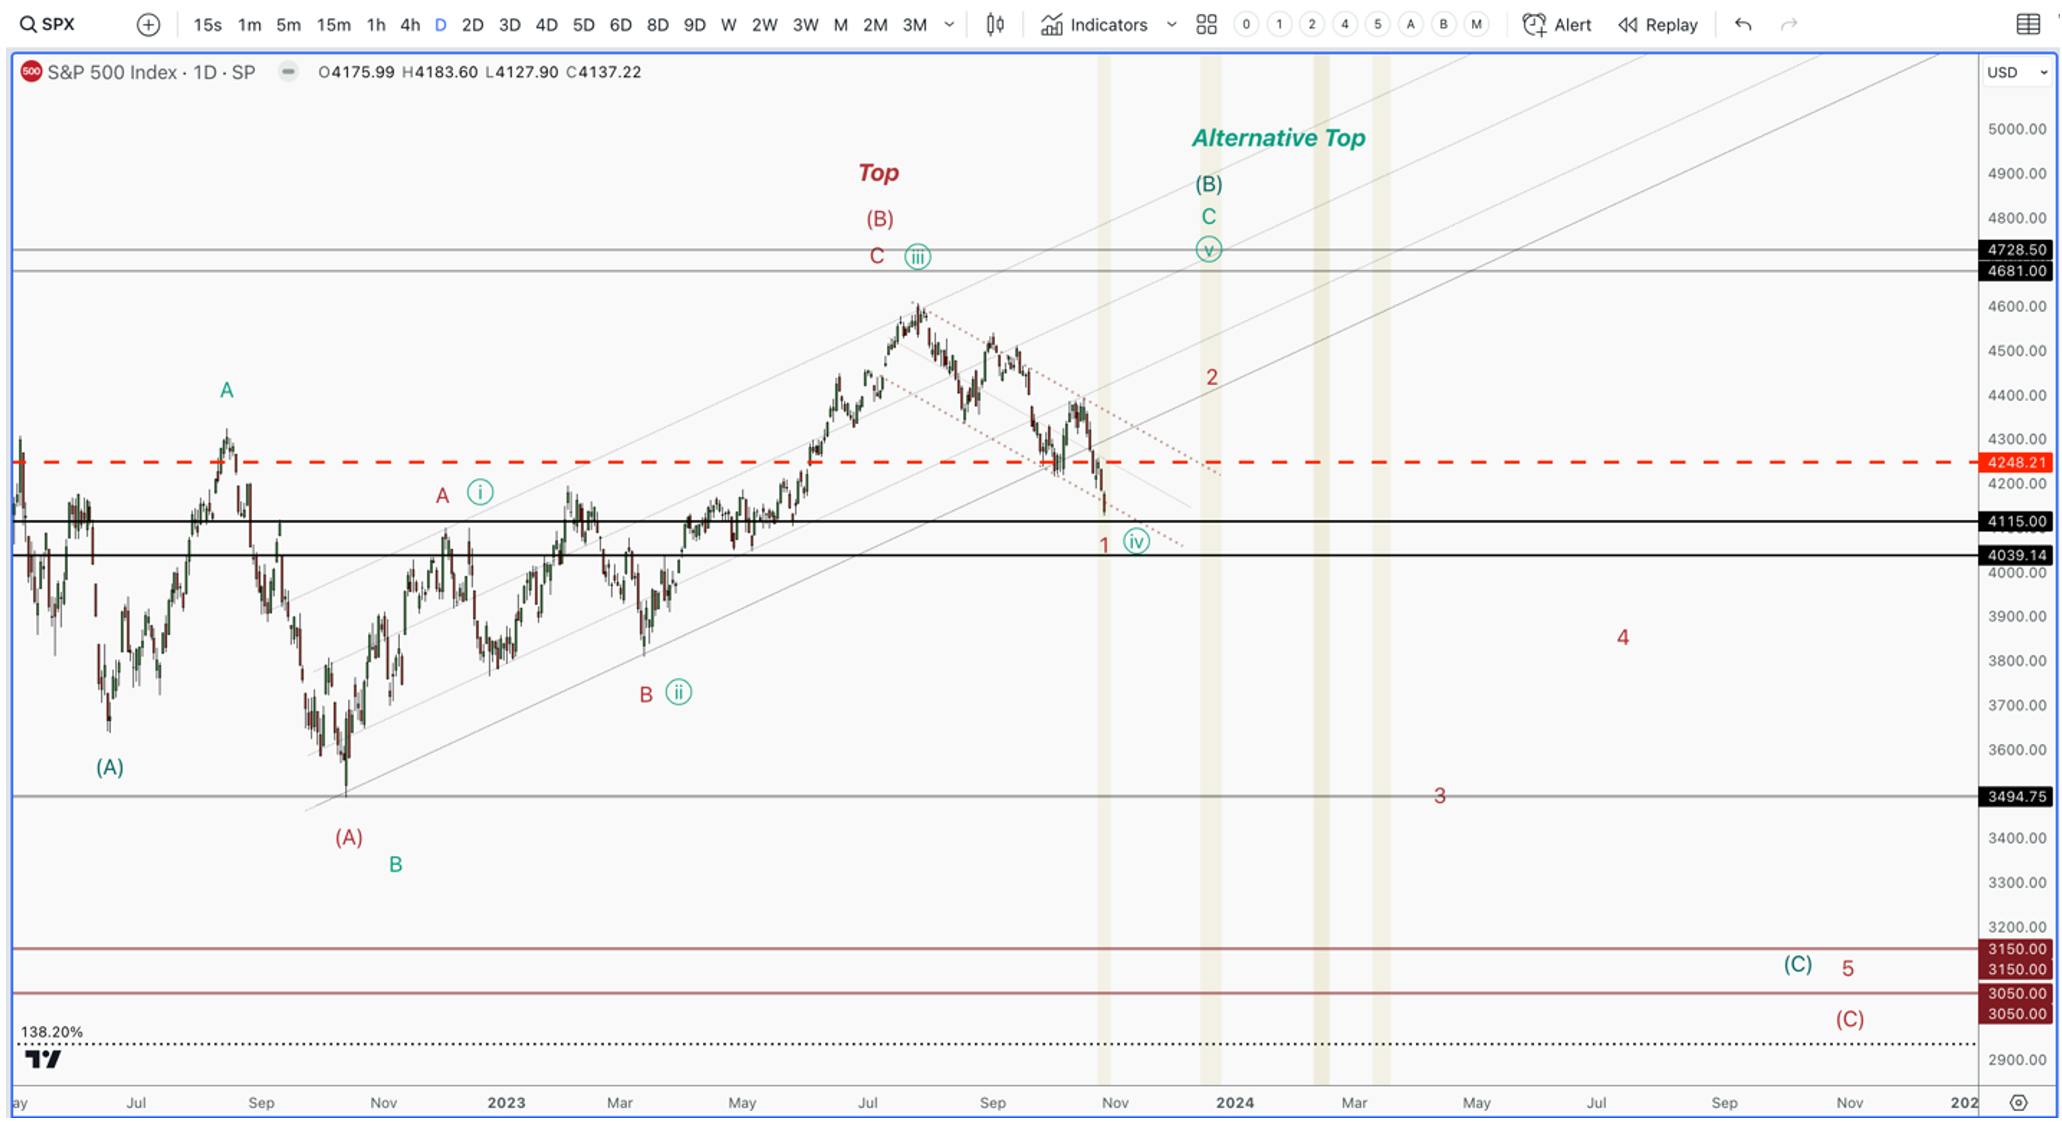
Our line in the sand was 4245 SPX, which we breached and have continued lower. Because of this, we have narrowed the potential paths to two, and are leaning into our top-is-in count, in red.

sp500 daily stock chart

This drop in the S&P 500 has gone too low, and lowered the odds of us making a new high. However, at minimum, we are due for a sizable bounce over the coming weeks – months, which we believe will be led by a handful of Big Tech names.

My green count above sees the S&P 500 making one more high, which is not completely off the table. In order for this to happen, we would need to see Microsoft and Apple both present solid reports, and start new uptrends. A lot rides on how the market reacts to Apple’s report. We would also need to see Amazon, Meta, and Nvidia participate, all of which have charts that can allow for one more high. So, it’s not improbable to see the above green count play out with only a handful of stocks leading.

These scenarios are what we are game planning for, while also keeping a cautious eye on the bigger picture – we are likely setting up for a return of the bear market sooner than most think. For this reason we have been quite defensive for most of the year. If we instead see a vertical drop from these levels that takes us below 4000 SPX, we will drop the thesis that we are setting up for a bounce, and assume that we are the central part of this drop.

In conclusion, we have been adamant that we are in a cyclical bull market within a secular bear market. The macro environment as well as weakness outside of the magnificent 7 has only continued to prove this thesis. However, in this environment, we only need 5 stocks to keep the market moving higher. With no recession in sight, and oil relieving inflation fears, the market is setting up for a move higher in the coming weeks/months. Regardless, if we make a new high or a lower high, the next sizable bounce we will use to further de-risk our portfolio

Recommended Reading:
Meta Q3 Earnings Update

Note: The I/O Fund is covering Big Tech more closely than usual this earnings season given the narrow leadership of the market. The Magnificent 7 is holding the market up with 78% combined YTD returns. Therefore, these particular companies carry importance for all tech investors whether we own them or not. Also, we track capex as a proxy for AMD and Nvidia. You can read our past analysis on this here.here.

Meta Q3 earnings report beat the top-line and bottom-line estimates along with strong ad impressions growth and cash flows. Operating margin rose to the highest level since Q2 2021. However, the mid-point of the revenue guidance missed analysts’ consensus estimates.

Founder and CEO Mark Zuckerberg had earlier this year announced in the Q4 2022 earnings call that 2023 is the ‘Year of Efficiency.’ This was in continuation of the restructuring of teams and capex reduction initiatives undertaken in 2022. This had led to price action of 140% YTD, yet has also set the company up to report perfection as this price action is unusually strong. The bottom line has expanded, yet where the market is a touch nervous is due to comments from the CFO. Primarily, this comment caused the price action to reverse:

"We've reflected the latest trends and advertiser reaction that we've seen into our Q4 outlook, which again, we think, reflects the greater uncertainty and volatility in the landscape ahead.” And later, the CFO said: "Thanks, Doug. We obviously have not shared a 2024 revenue outlook yet. You asked about what are some of the significant puts and takes, and I'd maybe point back to what I said earlier about the Q4 outlook just to highlight what a volatile macro environment we believe we're in. I think that will obviously have a big impact on the advertising market next year, and it's something we'll be keeping a very close eye on. But ultimately, we're very subject to volatility in the macro landscape. […] We'll also be obviously lapping stronger periods, especially in — as you saw with this quarter's results. So all of those factors, I think, will play into the 2024 revenue outlook."

Revenue and EPS

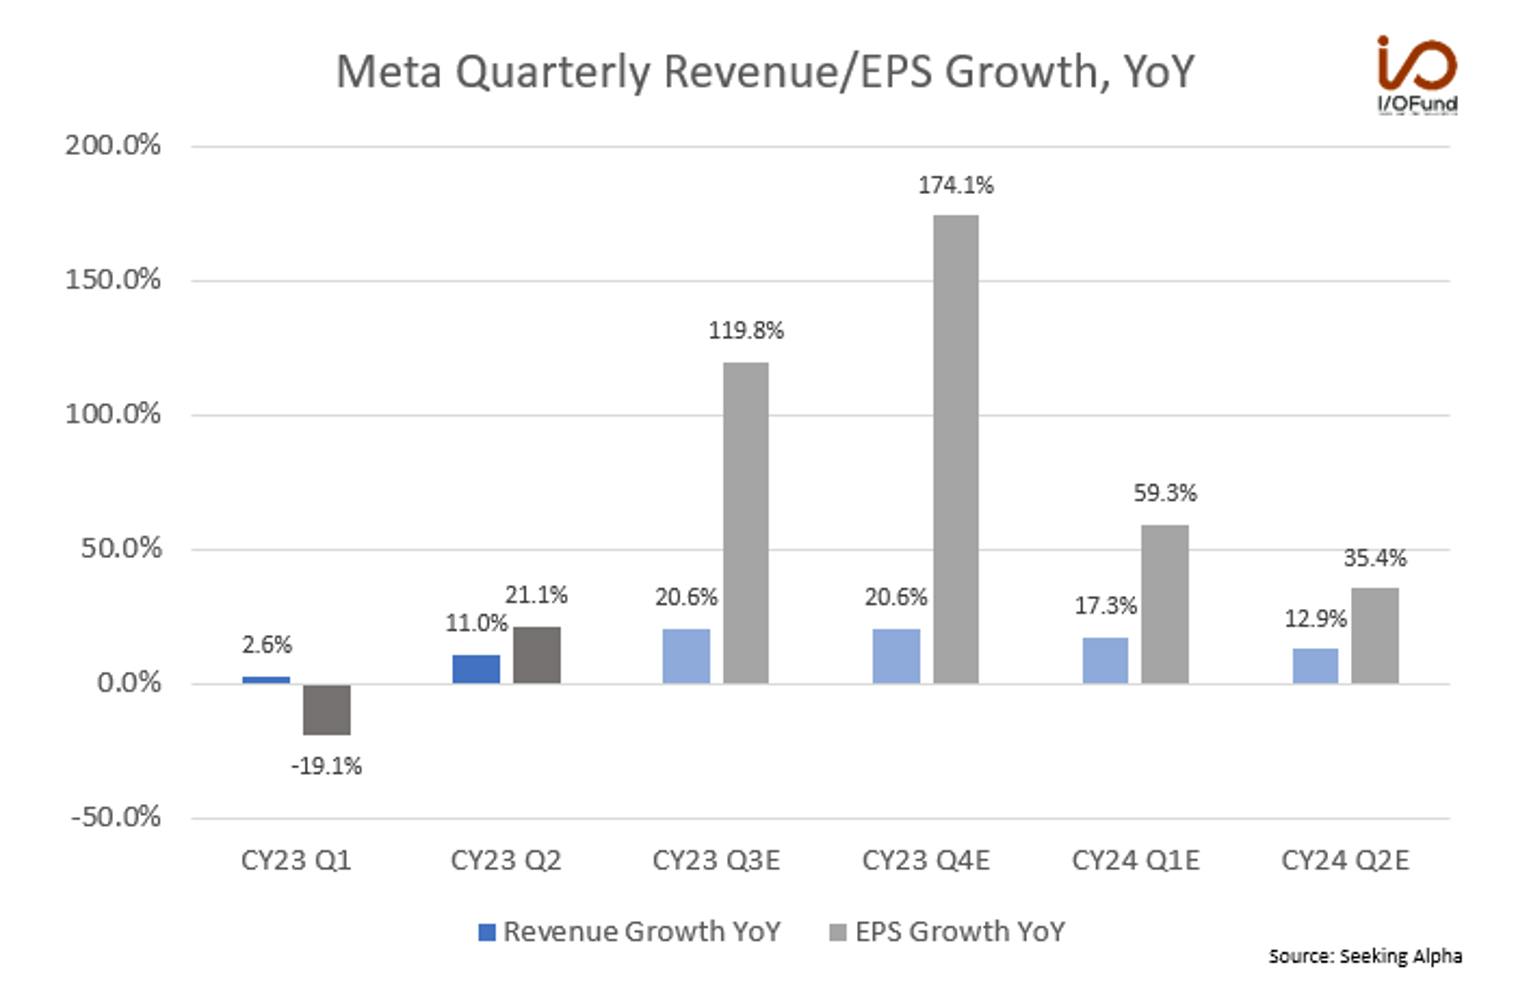
  • The company’s revenue grew by 23% YoY and 21% on constant currency basis to $34.15 billion.
  • EPS rose 168% YoY to $4.39 and beat estimates by 19.1%.            

Margins

  • Operating income rose 143% YoY to $13.75 billion.
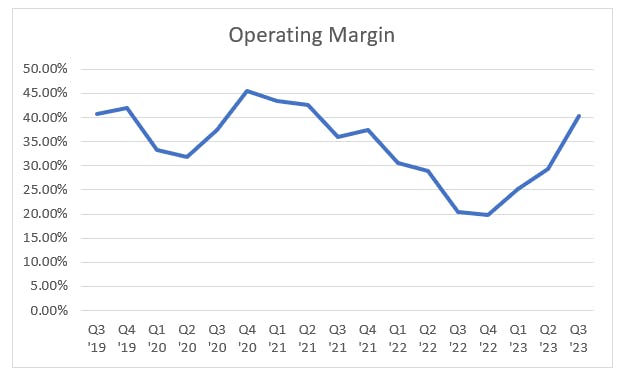
  • Operating margin rose to the highest level since Q2 2021, reaching 40.26%. That compares to 29.35% in Q2 and 20.44% in Q3 last year. It was helped by 7% decline in costs and expenses.
  • Net income rose 164% YoY to $11.58 billion. Net margin came at 33.9%, compared to 24.3% in Q2 and 15.9% in Q3 last year.

Cash Flows and Balance Sheet

  • Operating cash flow was strong: +110.5% YoY to $20.4 billion; YTD OCF was up 43.8% YoY to $51.7 billion.
  • Free cash flow also was strong: $13.64 billion for Q3 compared to $0.17 billion a year ago; YTD FCF was up 139.6% YoY to $31.5 billion. The cash flows also benefitted from deferral income taxes that was paid in Q4.
  • The company has cash and marketable securities of $61.1 billion and debt of $18.4 billion. It repurchased $3.7 billion of shares in the recent quarter.

Key Metrics

  • Family Daily Active People (DAP) continue to grow and was 3.14 billion on average for September 2023, up 7% YoY. Family Monthly Active People (MAP) was 3.96 billion as of September 30, 2023, up 7% YoY.
  • Facebook Daily Active Users (DAUs) continue to grow and was up by 5% YoY to 2.09 billion. Monthly Active Users (MAUs) grew by 3% YoY to 3.05 billion.
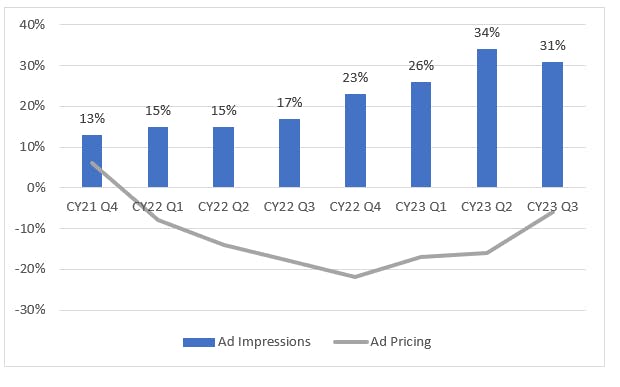
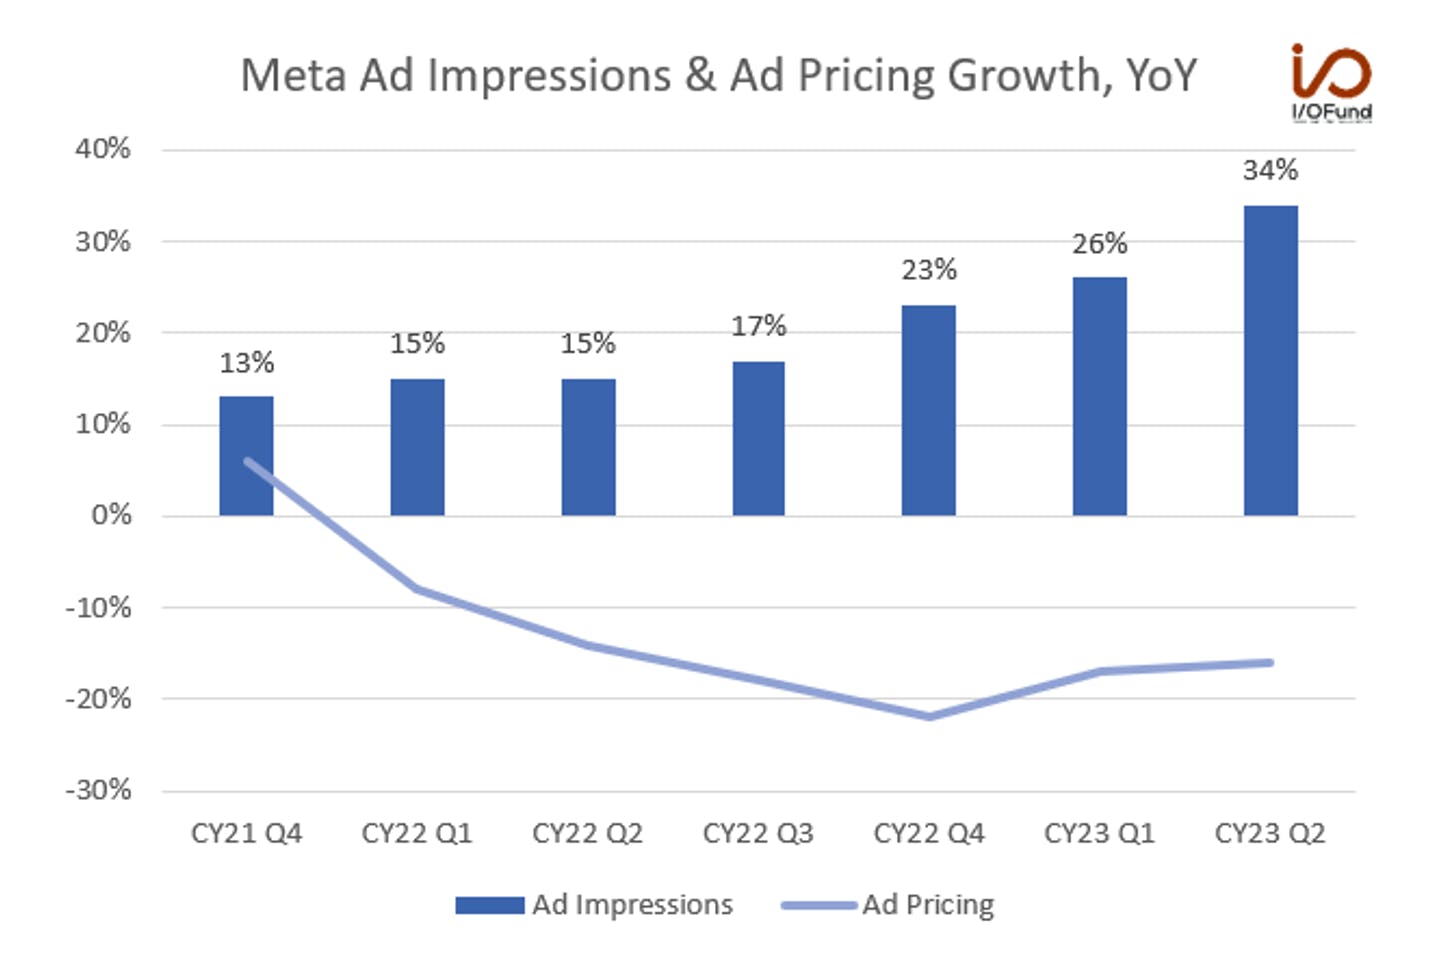
  • Ad impressions remained strong at 31% YoY growth and recorded a second straight quarter of over 30% growth. Average price per ad decreased by (6%) YoY.

Outlook

The management revenue guidance for the next quarter is $36.5 billion to $40 billion, representing a YoY growth of 18.9% at the midpoint. However, the mid-point missed the analysts’ consensus estimate of 20.95% YoY growth to $38.90 billion. This is why the CFO’s comments about relating Q4 to FY2024 had an outsized reaction — the CFO was basically saying more of the same could continue (what we quoted in the intro of this analysis), which translates to the potential for a miss on revenue in FY2024.

CFO Susan Li replied to an analyst question in the earnings call regarding the recent geopolitical tensions impact on the ad business. “Now in terms of how this translates into impact on the Q4 business, first of all, I should say that coming into Q4, we've been seeing continued strong advertiser demand in key segments, including online commerce and gaming. But having said that, we are also seeing more volatility at the start of the quarter. That's in part why we widened our guidance range to capture that uncertainty. And so for instance, while we don't have material direct revenue exposure to Israel and the Middle East, we have observed softer ad spend in the beginning of the fourth quarter, correlating with the start of the conflict, which is captured in our Q4 revenue outlook.”That's in part why we widened our guidance range to capture that uncertainty. And so for instance, while we don't have material direct revenue exposure to Israel and the Middle East, we have observed softer ad spend in the beginning of the fourth quarter, correlating with the start of the conflict, which is captured in our Q4 revenue outlook.”

The management lowered the 2023 total expenses guidance to the range of $87 billion to $89 billion from $88 billion to $91 billion. However, they expect higher 2024 total expenses in the range of $94 billion to $99 billion. The increase in expenses is due to higher depreciation expenses and higher costs to operate larger infrastructure. They also expect payroll expenses to rise as they look to add talent in priority business areas. Reality Labs operating losses are expected to increase YoY due to the ongoing product development efforts.

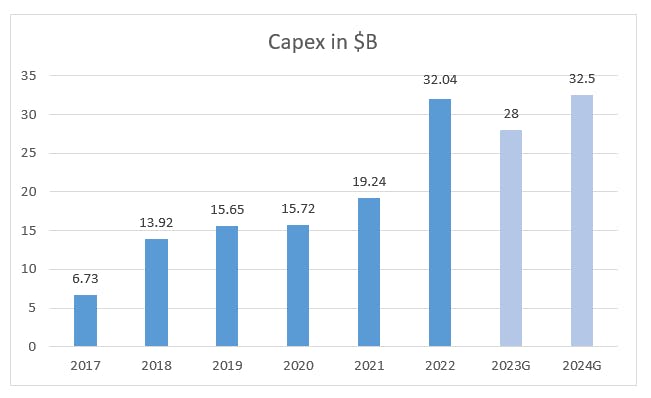
The management lowered the upper range of the 2023 capex. It is expected to be $27 billion to $29 billion from the earlier estimate of $27 billion to $30 billion, representing a YoY decline of (12.6%) at the mid-point. However, they expect higher capex for the next year in the range of $30 billion to $35 billion, representing a YoY growth of 16.1% at the mid-point. The CFO said in the earnings call, “With growth driven by investments in servers, including both non-AI and AI hardware, and in data centers as we ramp up construction on sites with the new data center architecture we announced late last year.”

Conclusion

The company’s earnings report was good, with the top-line and bottom-line beat, strong ad impressions growth, and cash flows. However, the revenue guidance disappointed, along with the management’s comments on the macro uncertainty that might impact the advertising market next year. If growth normalizes while costs go up, overall, Meta faces a tougher 2024 and was priced to perfection, up 140% YTD.

Royston Roche, Equity Analyst at the I/O Fund, contributed to this analysis.

Recommended Readings:

AEHR Fiscal Q1: More Orders Likely this Fiscal Year

Tesla’s Margins Fall Again

Netflix: Cash is King and Pivot is on Track

CrowdStrike: Steady Growth, Strong Bottom Line

Microsoft Fiscal Q1 Earnings: Operating Leverage from AI

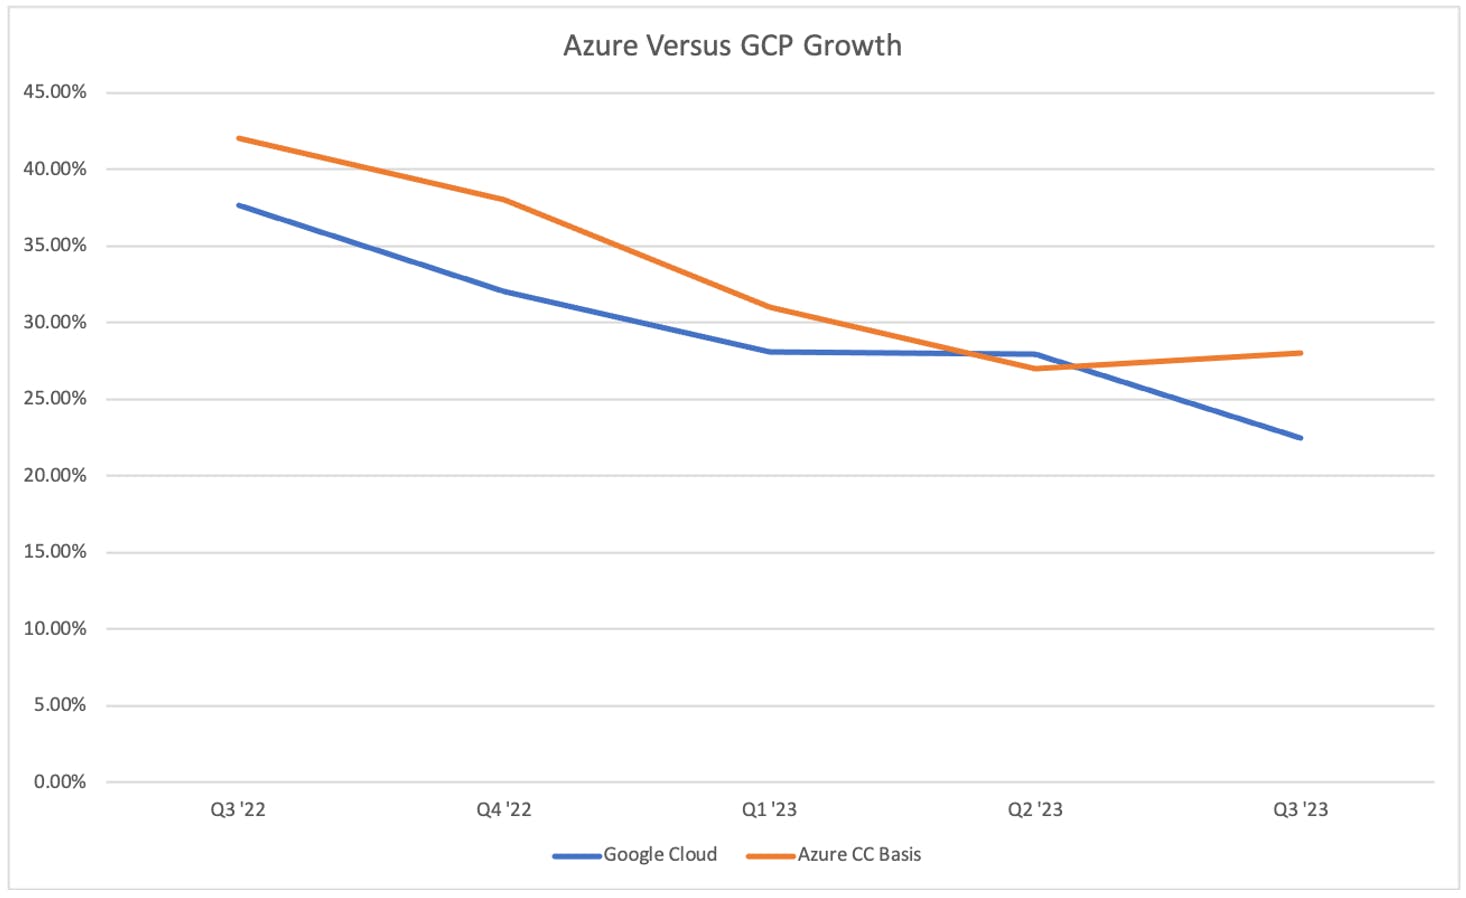
Microsoft posted strong results with the highlight coming from Azure and the Intelligent Cloud segment. Azure accelerated by 100 basis points on a constant currency basis, meanwhile, Google Cloud decelerated 549 basis points as reported on the same evening.

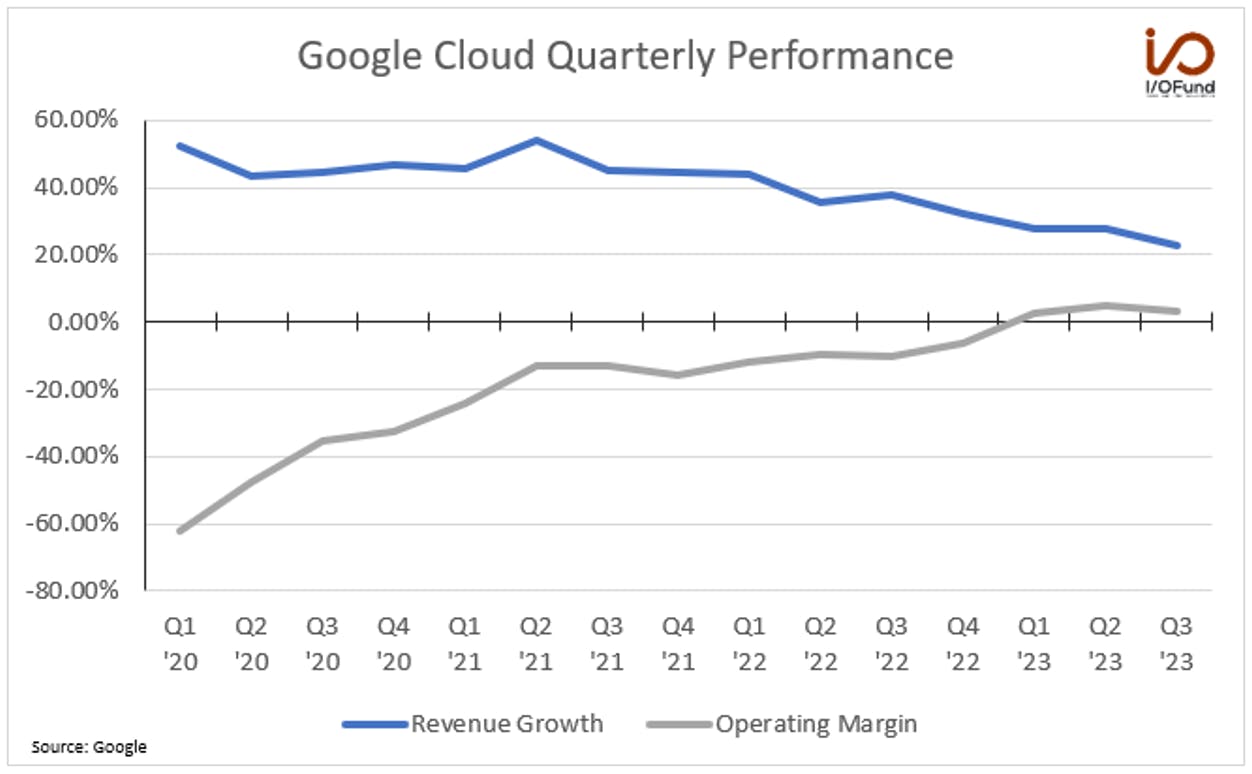
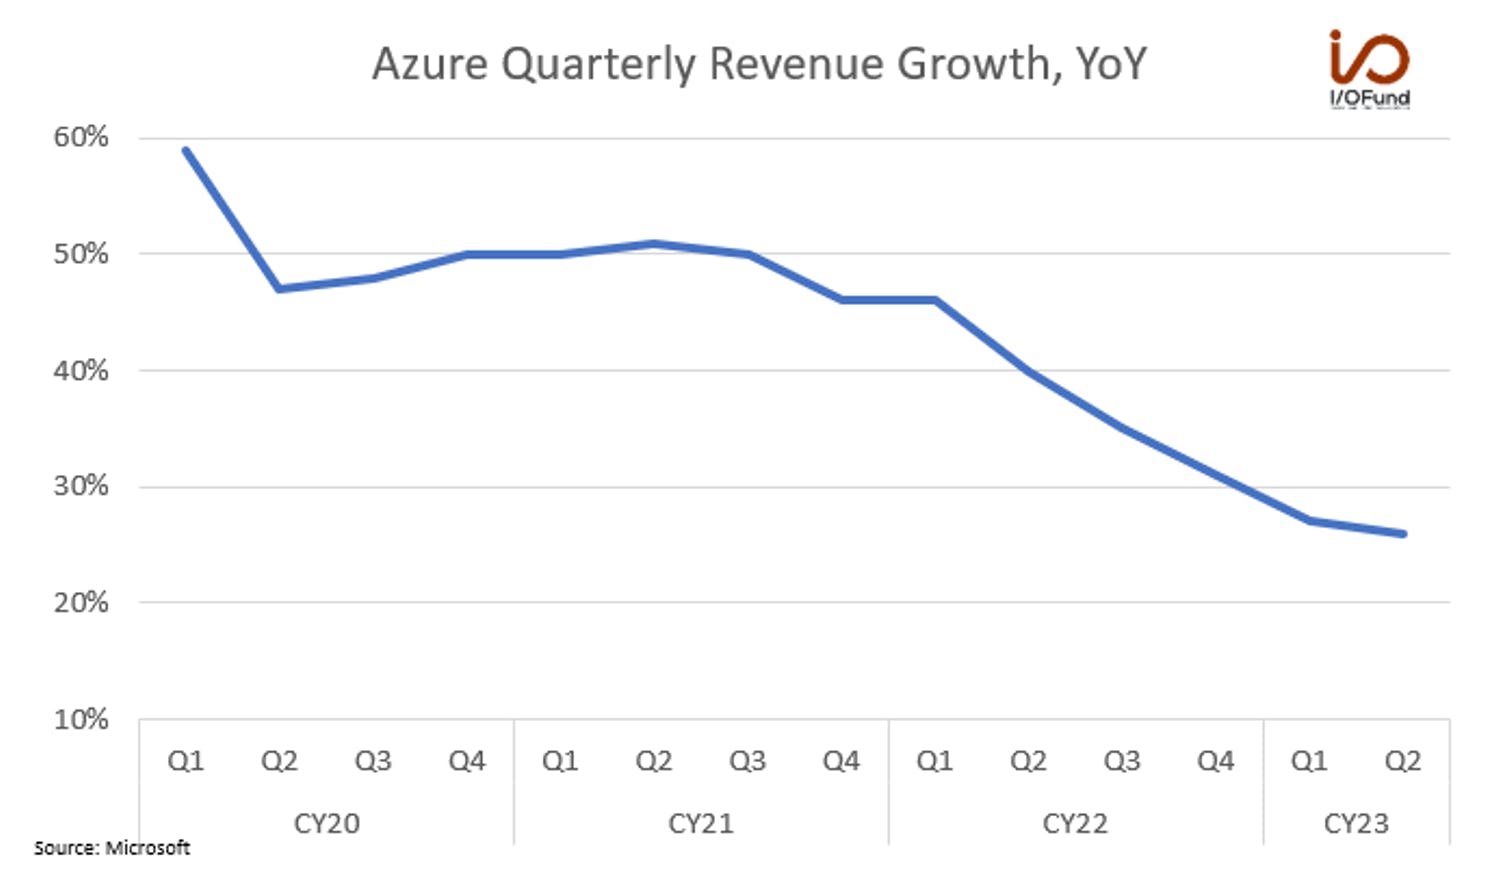
Azure reported growth of 28% YoY compared to 27% last quarter. Meanwhile, Google Cloud reported growth of 22.5% compared to 28% last quarter. This is important because GCP had finally passed Azure growth quarter, only to fumble in a fairly dramatic deceleration this quarter.

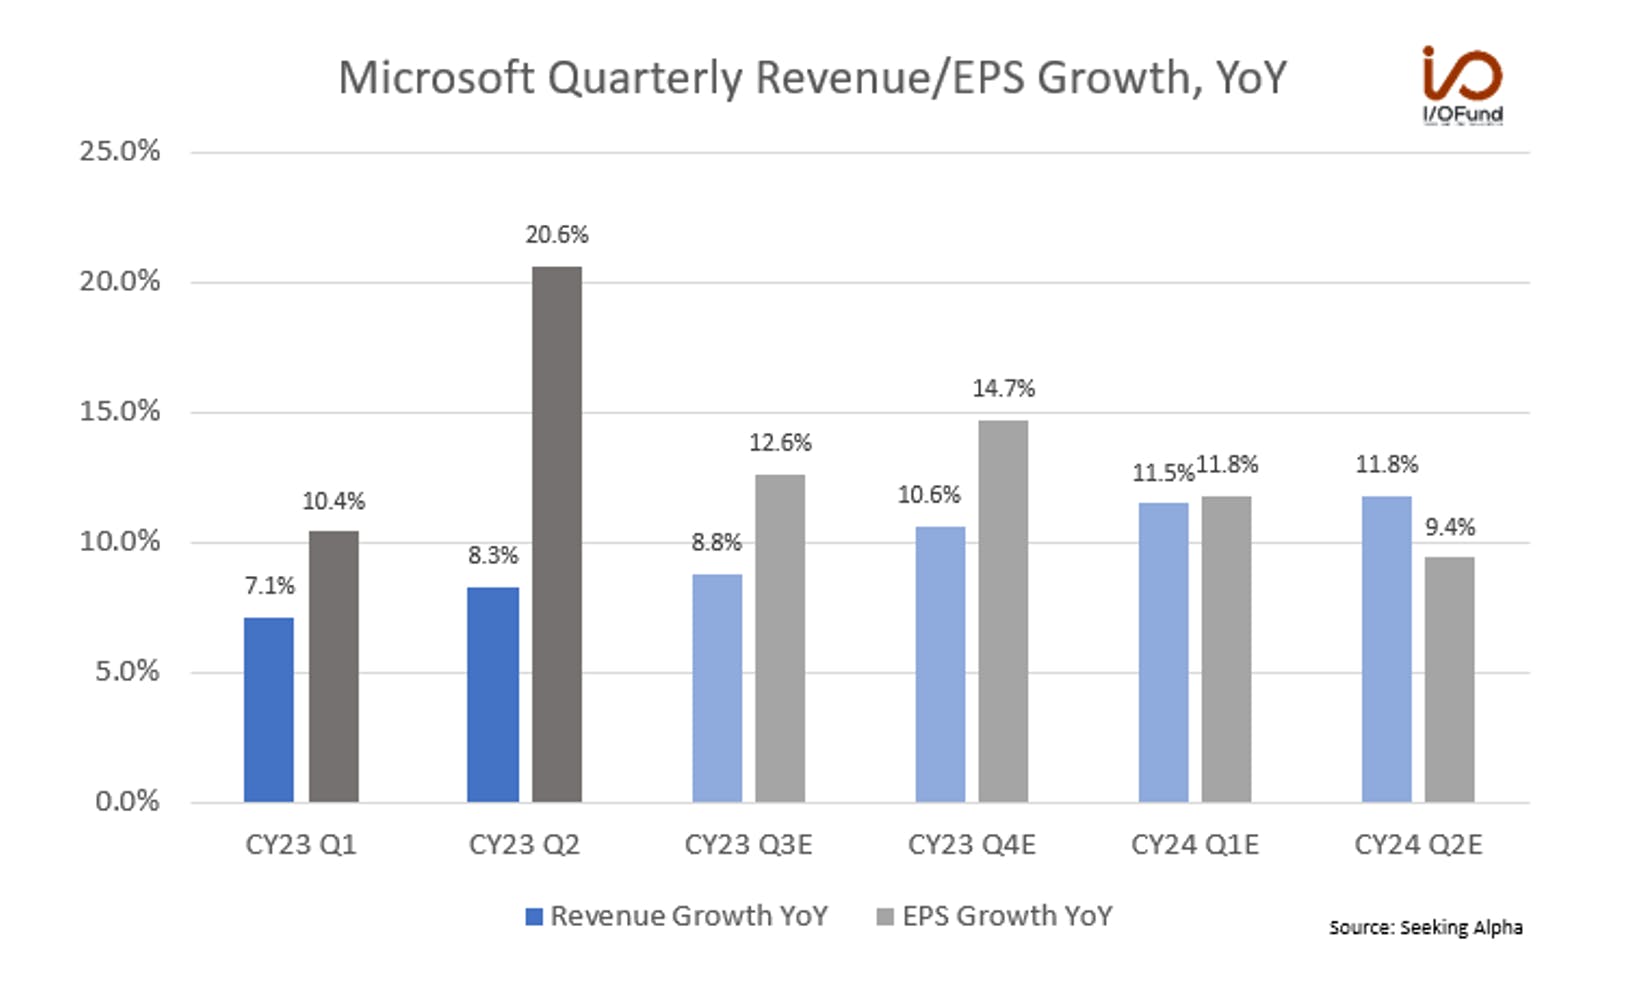
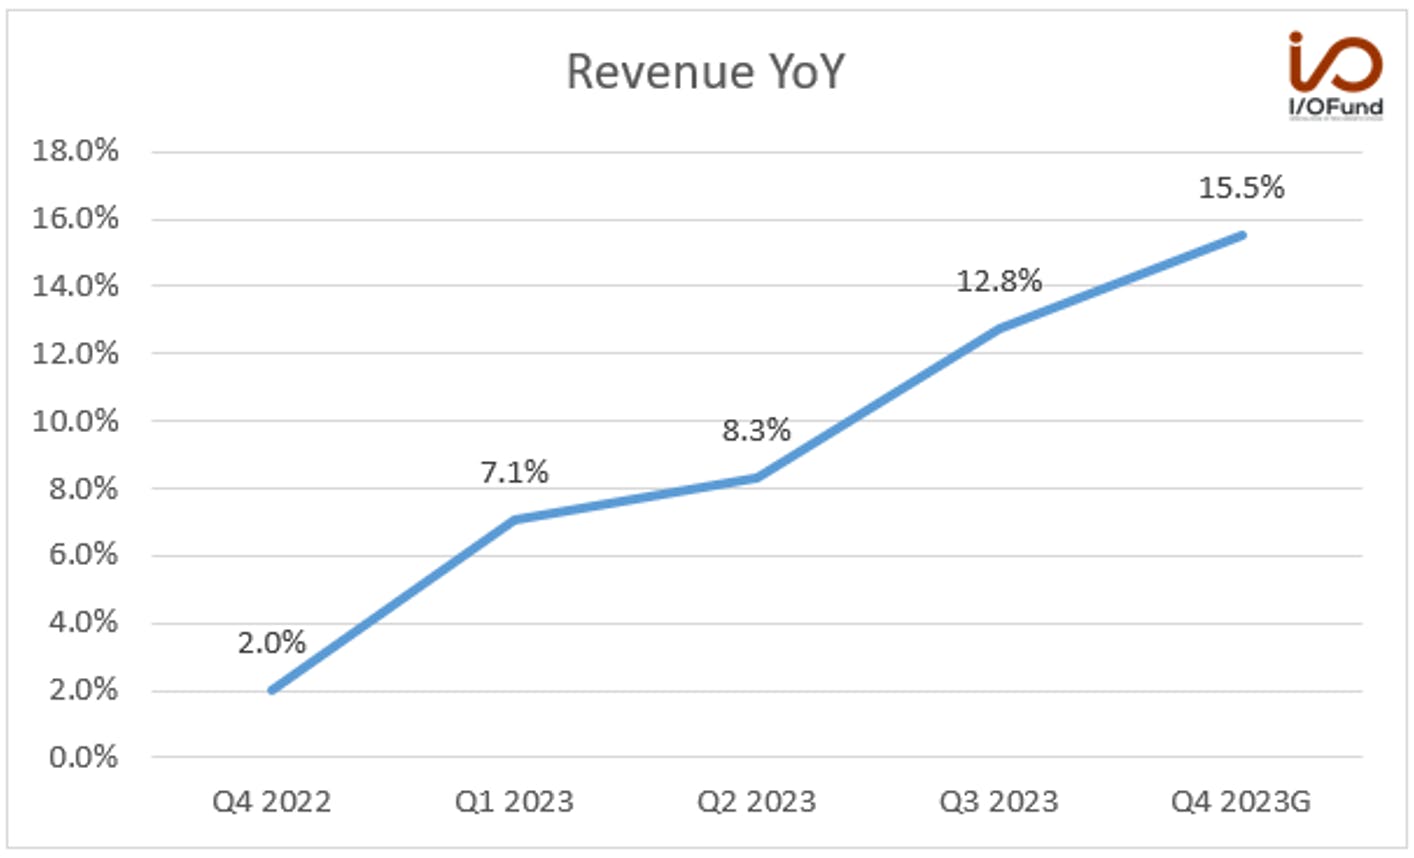
The company reported a fiscal Q1 growth rate of 12.8% for revenue of $56.5 billion versus 8.8% growth expected on revenue of $54.6 billion. Microsoft beat by almost $2 billion. This flowed through to the bottom line, which was also a sizable beat at $2.99 EPS reported compared to $2.65 EPS expected.

Microsoft’s guide for next quarter came in above expectations for 15.5% revenue growth compared to 11% expected. For next quarter, analysts were expecting revenue of $58.6 billion whereas management is guiding for $60.9 billion for a raise of $2.3 billion. The company is clearly seeing the early effects of AI revenue; however, the Activision acquisition is also contributing.

Of the roughly $2B beat this quarter, $850M of the beat is coming from the Intelligent Cloud segment. This segment reported $24.3 billion in revenue for growth of 19% on a CC basis. This is an acceleration from 17% on a CC basis last quarter. Per the CFO, “Higher-than-expected AI consumption contributed to revenue growth in Azure.” Later, the CFO stated something along the same lines in regard to Azure’s beat being AI-driven: “While the trends from prior quarter continued, growth was ahead of expectations, primarily driven by increased GPU capacity and better-than-expected GPU utilization of our AI services as well as slightly higher-than-expected growth in our per-user business,”

Personal Computing also came in better than expected by $1 billion at 3% growth YoY, which beat guidance of (-4.7%). For next quarter, the guide is 13.6% growth which is a considerable rebound from the many declining quarters this segment has been reporting. This is partly due to the Activision acquisition, which will contribute to gaming growth of mid to high 40%.

Although Microsoft guided Azure growth to decelerate 1-2pts for the December quarter and then to be “stable” throughout FY24, analysts were digging to find out if conservatism was baked into the guide, and how much room there is for potential upside in Azure based on new workload starts, mostly driven by AI workloads. In addition to this, optimizations were peaking in H2 of last fiscal year, and so that is technically a tailwind as Microsoft laps those quarters in H2 of this fiscal year.

Although Azure tends to grab the headlines, the margins were also impressive. We detail this and more below.

Revenue and EPS:

As stated, the company beat on the top line and bottom line.

  • Microsoft reported a fiscal Q1 growth rate of 12.8% for revenue of $56.5 billion versus 8.8% growth expected on revenue of $54.6 billion.
  • This flowed through to the bottom line, which was also a sizable beat at $2.99 EPS reported compared to $2.65 EPS expected.
  • Guidance was also strong at 15.5% revenue growth compared to 11% expected. For next quarter, analysts were expecting revenue of $58.6 billion whereas management is guiding for $60.9 billion for a raise of $2.3 billion.

Segment Revenue:

  • Productivity and Business Processes revenue increased to $18.6B (up 13% YoY) which is an acceleration of 300 basis points from last quarter.
  • Intelligent Cloud revenue increased to $24.3B (19% YoY) above guidance of $23.45B or 15.5% YoY and was driven by strength in Azure and other cloud services. This is up from 15% last quarter.
  • More Personal Computing was $13.7B and above guidance of $12.5B – $12.9B, driven by strength in Gaming and Windows, partially offset by a 22% YoY decline in Devices revenue growth

Guidance on Segment Revenue:

  • Productivity and Business expected to decelerate by 150 basis points at the midpoint for growth of 11% to 12% YoY.
  • Intelligent Cloud revenue is expected to decelerate 150 basis points at the midpoint for growth of 17.5%
    undefinedundefined
  • More Personal Computing is expected to show revenue of $16.5B – $16.9B representing 13.6% growth. Gaming is especially expected to be strong next quarter due to Activision, however, devices are still weak.

Margins:

This is where the report really shined.

Regarding gross margins, the company has done a good job of improving gross margins with 71.2% for the current quarter, up 200 basis points YoY. Microsoft Cloud gross margins increased by 200bps Y/Y when excluding the impact of useful lives. There was discussion on the earnings call that there is room for improvement in Cloud GMs as MSFT continues to benefit from the investments in its cloud infrastructure.

Microsoft is showing strong operating margin leverage with 47.6% in the current quarter, up from 43.2% last quarter along with strong operating margin expansion in Intelligent Cloud with 48.4% in the current quarter up from 43.9% last quarter. This flowed through to record net profit of $22.3 billion, up from $20.1 billion in the previous quarter.

There may be more room for operating margin expansion in Intelligent Cloud as the company continues to stay disciplined with OpEx with implementing the AI transition with Azure. Although MSFT maintained FY24 operating margins to be flat Y/Y, there is potential upside to operating margins on better-than-expected integration of the Activision acquisition and Microsoft’s continued efforts to improve Azure and Microsoft 365 gross margins.

  • Gross margin of 71.2% was up from 69.2% in the year ago quarter. The guide is for 68% next quarter.
  • Overall operating margin was 47.6%, expanding 470bps YoY and 440bps QoQ. The guide is for 42.4% next quarter. The guide for next fiscal year is for operating margin to be flat YoY.
  • Net margin of 39.4% will help cement Microsoft as the leading FAAMG in terms of GAAP profit margin again. The guide was for 33.5% next quarter.
  • Productivity and Business operating margin was 53.6%, expanding 310bps YoY and 410bps QoQ due to strength in Office 365.
  • Intelligent Cloud operating margin was 48.4%, expanding 430bps YoY and 460bps QoQ due to strength in Azure and other cloud services. This was the best Intelligent Cloud operating margin in six years.
  • More Personal Computing operating margin was 37.9%, expanding 620bps YoY and 420bps QoQ due to strength in Gaming and Windows, offset by weakness in Devices

Cash Flows:

Operating cash flow of $30.6 billion was up 32% year-over-year due to strong cloud billings and collections. This represents an operating cash flow margin of 54%.

Free cash flow was up 22% year-over-year for $20.7 billion. This compares to the June quarter with 12% YoY growth.

Key Metrics:

Commercial bookings increased 14% and 17% in constant currency in line with expectations, primarily driven by strong execution across our core annuity sales motions with continued growth in the number $10 million-plus contracts for both Azure and Microsoft 365.

GitHub CoPilot is growing rapidly with over 1 million paid copilot users across 37,000 organizations, which is up 40% QoQ. According to Microsoft, GitHub CoPilot increases developer productivity by up to 55%.

CoPilot 365 is one of the more crucial growth trajectories to watch as we move into calendar year 2024. This integrates an AI assistant for Microsoft Office and becomes available Nov 1st.

Azure Open AI Services has been adopted by 18,000 organizations, which allows companies to use OpenAI’s APIs for new development purposes. Ultimately, OpenAI creates more business for Azure even if a startup or company is not directly an Azure customer.

AzureArc is helping Microsoft to expand the meaning of hybrid and multi-cloud, to also include running apps across on-prem, edge and multi-cloud environments. This key metric grew 140% year-over-year.

Earnings Call:

The Microsoft management team is very polished so most questions are answered with fairly uneventful replies, at times. However, one analyst did get more color on future operating margin. The concern is that opex came in so low, where does Microsoft go from here?

Primarily, the CFO believes margins will be flat/stable due to: “improvements we're making in Azure and even Microsoft 365 gross margins, even in the core of the commercial cloud. It speaks to the pace at which we're delivering AI revenue with the increasing cost expense and capital investment ahead with the demand we see.”

And then, another analyst went right for the question on everyone’s minds, which is — can Microsoft sustain double-digit growth? Here is the transcript, which as you can see, the management team is fairly vague. But if you read between the lines, they’re using the word stability a lot, and that would imply no notable acceleration, but more importantly, no notable deceleration either. This could change if AI continues to show up in various segments (Office 365, Search, Security, etc)

“Question – Brent Thill: Thanks. Amy, good to see the 12% growth. Many investors are asking, can you sustain double-digit growth, especially with a stronger AI boost coming in the next several quarters?

Amy Hood: I think, looking at our – as I said, Q1 was a strong start to the year. Q2 certainly implies that we've talked about stability for Azure into the second half of the year looking at the – and in line with what we're seeing for Q2. And so I think we feel good about our ability to execute. But more importantly, our ability to continue to take share.”

Later, the CFO explained that by guiding for stable Azure growth, that Microsoft is overcoming optimization headwinds due to new AI workloads. The puts and takes lead to stable growth, and there was an underlying tone that this will ultimately set Microsoft apart: “And at the scale we're talking about being able to have stability in our Azure business does mean that we will have a lot of new workload starts. And primarily, we're expecting those to come from AI workloads, but AI workloads don't just use our AI services. They use data services and they use other things. And so that combination I think looking on a competitive basis, we feel good about our execution, we feel good about taking share, and we feel good about consistent trends. And so I feel good about that guide and what it says about where we are on share.”

If I were to wrap up the call in one word, it would be “leverage.” This was probably the most important statement on the call in terms on why the company may fare better than its peers in a recession (or excuse me, during extended periods of optimization):

“In addition, what Satya mentioned earlier in a question, and I just want to take every chance to reiterate it, if you have a consistent infrastructure from the platform all the way up through its layers, that every capital dollar we spend, if we optimize revenue against it, we will have great leverage. Because wherever demand shows up in the layers, whether it's at the SaaS layer, whether it's at the infrastructure lower, whether it's for training workloads, we're able to quickly put our infrastructure to work generating revenue.”

Conclusion:

At one point, Microsoft was left out of the FAANG acronym. This earnings season, and probably a few more in the near future, will place this profitable powerhouse at the front of the Big Tech train. This company is not messing around when it comes to the one unique advantage it has over its peers, which is simply this: enterprises.

Recommended Reading:
Alphabet: Search Accelerates While Cloud Decelerates

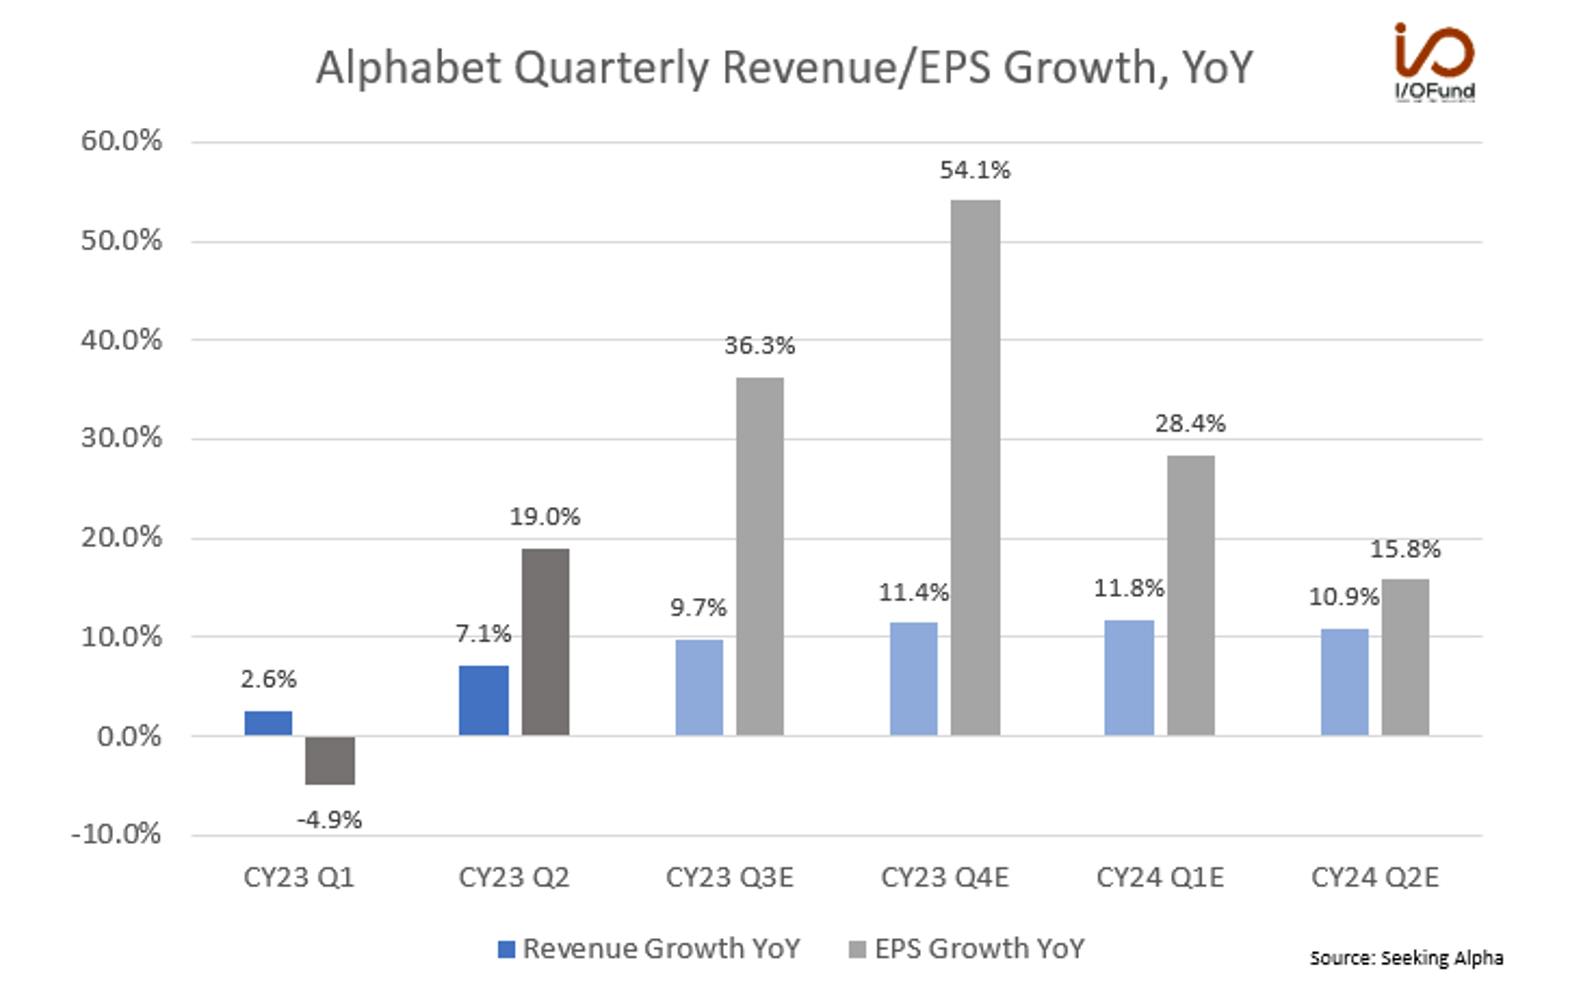
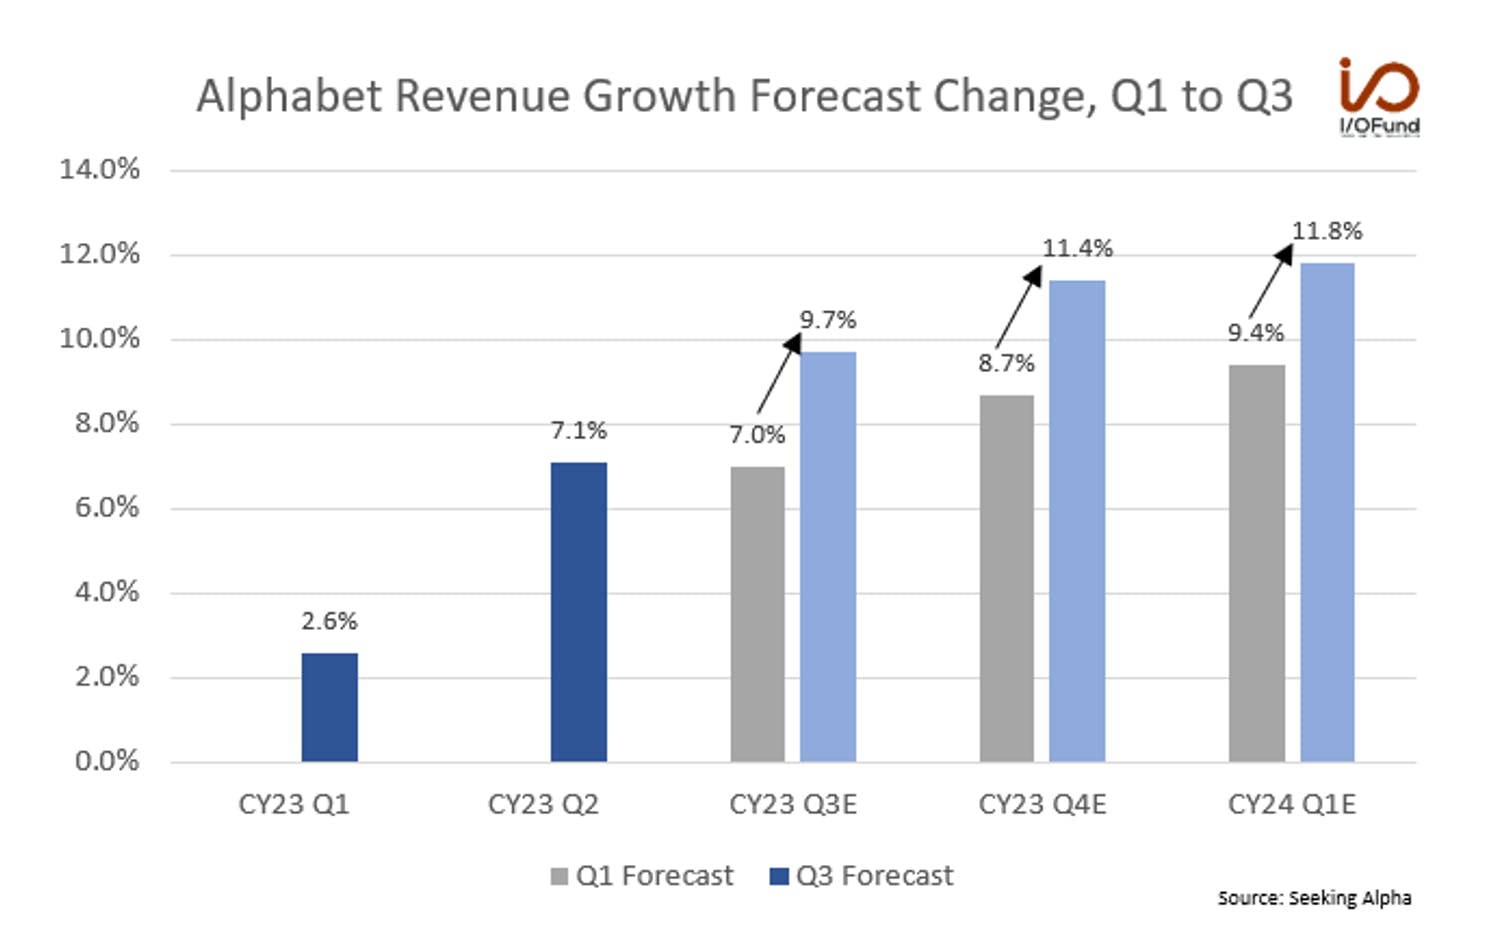
Alphabet’s Q3 report was strong on the headline: GAAP EPS of $1.55 beat estimates by $0.10, while revenues of $76.79 billion beat estimates by $0.98 billion. Revenue growth accelerated to +11.0% for the quarter, ahead of the expected +9.7% growth figure and much higher than the +7.1% growth in Q2 and the +6.1% growth in Q3 last year.

Operating margin expanded ~300 bp during the quarter to 27.8%, as Google Services’ segment operating margin rose to 35.2% compared to 30.8% in the year-ago quarter. Net margin for the quarter was 25.7%, increasing ~560 bp from 20.1% last year.

We highlighted four key factors back in August that drove our optimism for revenue acceleration with upside for margins through the end of this year:

  1. Resilience in Search
  2. stabilization in YouTube Ads
  3. Market share and profitability gains in Cloud
  4. Growth in Other Google (i.e. YouTube subscription)

Three of those points have panned out this year – Search growth has accelerated tremendously, YouTube Ads growth has picked up its pace, and growth in Other Google also accelerated; Cloud is the only disappointment so far, with revenue decelerating during Q3.

For a deeper dive into Alphabet and how the Search giant is entering its Year of Execution, read more here.here.

Revenue and EPS:

  • Revenue of $76.79 billion beat estimates by 1.3%, representing growth of +11.0% YoY
  • Search revenue of $44.04 billion grew by +11.3% YoY
  • GAAP EPS of $1.55 beat estimates by 6.5%, representing growth of +46.2% YoY

Margins:

  • Gross margin of 56.7% increased ~180 bp YoY from 54.9%, but decreased ~50 bp QoQ from 57.2%
  • Operating margin of 27.8% increased ~300 bp YoY from 24.8%, but decreased ~150 bp QoQ from 29.3%
  • Net margin of 25.7% increased ~560 bp YoY from 20.1% and increased ~110 bp QoQ from 24.6%
  • Operating cash flow margin of 39.9% increased ~610 bp YoY from 33.8% and increased ~150 bp QoQ from 38.4%
  • Free cash flow margin of 29.4% increased ~610 bp YoY from 23.3%

Cash & Debt:

  • Total cash, equivalents and marketable securities of $119.9 billion; cash and equivalents on hand of $30.70 billion increased +40.3% from $21.98 billion
  • Operating cash flow of $30.66 billion increased 31.3% YoY from $23.35 billion; YTD operating cash flow of $82.83 billion increased +22.0% YoY from $67.88 billion
  • Free cash flow of $22.60 billion increased +40.6% YoY from $16.08 billion; YTD free cash flow of $61.60 billion increased +40.0% YoY from $43.99 billion
  • Total debt of $13.78 billion

Segment Results:

  • Search revenue of $44.03 billion increased +11.3% YoY, highest growth rate since Q2 ‘22
  • YouTube Ads revenue of $7.95 billion increased +12.5% YoY, highest growth rate since Q1 ‘22
  • Google Other revenue of $8.34 billion increased +20.9% YoY, second straight quarter with greater than +20% growth
  • Google Cloud revenue of $8.41 billion increased +22.5% YoY

Search Growth Accelerating, Boosting Services Segment Margin

Search’s growth stole the show in Q3, with growth quickly accelerating to a double-digit rate — Search added ~$4.5 billion in revenue YoY and ~$1.4 billion QoQ, reaching a record level. Alphabet sees AI as driving the next ‘major evolution’ of Search, and evidence of that is already surfacing as generative AI tools are being integrated into Search and accelerating revenue growth at scale.

Growth in Search cooled rather quickly through 2022 as a challenging macro environment rapidly replaced a surging ad spending environment in 2021, with revenue growth bottoming out at a (1.6%) YoY decline in Q4 2022. Just three quarters later, Search returned to double-digit growth, accelerating in each quarter this year – rising from a ~$160 billion annualized run rate in Q1 to a ~$176 billion annualized run rate in Q3.

This acceleration in Search revenue alongside strong double-digit growth in YouTube Ads revenue and Google Other (YouTube subscriptions, etc.), significantly boosted margins. Not only is AI helping drive higher ROI and increased engagement for Google’s advertising customers, but it’s also showing an incrementally large boost to Google’s Services segment margin.  Compared to the year-ago quarter, Google’s Services segment added ~$6.6 billion in revenue, and from that ~$5.0 billion in operating income.

A quick note on Search:

I/O Fund said prior to earnings that “Alphabet’s Search ‘has proven resilient because it provides advertisers an attractive ROI on their ad spend. Looking ahead, Search Generative Experience, [Google’s generative AI-powered search tool], will improve advertisers’ ROI and will likely provide Alphabet additional pricing power. This will also improve their retail vertical’ – a trend already surfacing, with Q2’s Search growth driven by retail alongside SGE’s launch.”

The retail vertical again drove growth in Search in Q3, while management was upbeat about SGE and experimenting with new native ad formats in the tool. CEO Sundar Pichai said that “direct user feedback [for SGE] has been positive with strong growth and adoption,” with Google rolling the tool out to India and Japan with more countries and languages to come.

Google Cloud’s Deceleration Continues

Weighing down on strong results in Search and YouTube was Google Cloud, which saw growth decelerate once more to the low-20% range while Microsoft’s Azure saw a marginal acceleration this quarter to 28%.

Cloud’s revenue growth dropped to +22.5%, down from +28.0% in Q2 and +37.6% in the year-ago quarter. Aside from the deceleration, Google Cloud recorded its third-straight consecutive quarter with a positive operating margin; however, its operating margin declined ~170 bp QoQ to 3.2%.

The segment’s deceleration is particularly concerning this quarter, and even more so should it continue again in Q4, given the segment’s size relative to Microsoft’s Intelligent Cloud and Amazon’s AWS.

Google Cloud operates at a ~$34 billion annual run rate, compared to an ~$97 billion run rate to Microsoft’s Intelligent Cloud and ~$88 billion run rate for AWS. At its size, Google Cloud should theoretically be posting higher growth rates based on the law of large numbers, so this sharper deceleration raises red flags that:

  1. AI products are not boosting revenue as much as expected in the near term
  2. Azure is commanding a higher share of AI-based cloud spending, helped by its tie-in with OpenAI via APIs
  3. Cloud spending is shifting away from Google to Azure and AWS

CFO Ruth Porat said Cloud’s “Q3 year-on-year growth rate reflects the impact of customer optimization efforts,” signaling that some cloud customers may still be reining in spending. She added that “Google Workspace also delivered strong revenue growth, primarily driven by increases in average revenue per seat.” Overall, Porat said Alphabet was “pleased with the ongoing customer engagement with GCP and Workspace and the potential benefit of our AI solutions including infrastructure and services such as Vertex AI and Duet.”

Earnings Call:

Alphabet’s earnings call reiterated the fact that the company is “definitely seeing a lot of interest in AI,” as executives highlighted how AI is driving higher ROIs in advertising while discussing the need to continually invest in AI.

On the advertising side, SVP Philipp Schindler said that Alphabet’s “our proven AI-powered solutions like Search and PMax are helping retailers drive reliable, strong ROI and meet customers wherever they are across the funnel.” He added that PMax “gives advertisers really maximum performance across all inventory from, one, really AI-powered campaign, and it's probably the ultimate example of AI in action across our ads product. It's delivering excellent ROI. Those using it achieve like on average, over 18% more conversions at a similar cost per action.” In addition, “AI is helping advertisers find as many people as possible in their ideal audience for the lowest possible price. Early tests are delivering 54% more reach at 42% lower cost.” As Alphabet continues to roll out and improve AI-focused advertising solutions, it can continue to drive ROI and capture larger amounts of advertising spend throughout Search and YouTube.

With that in mind, Porat discussed how Alphabet will “continue to invest meaningfully in the technical infrastructure needed to support the opportunities we see in AI.” She said the company is expecting “elevated levels of investment, increasing in the fourth quarter of 2023 and continuing to grow in 2024,” this 2024’s “aggregate CapEx will be above the full year 2023.”

Conclusion:

Alphabet’s Q3 was a very solid report under the surface, with Search’s rapid reacceleration and Services’ major increase in operating income overshadowed by Google Cloud’s deceleration. Heading into a seasonally strong Q4 for advertising, Alphabet looks poised to reach record Advertising revenues and another record quarter for Search, boosted in part by AI integrations and SGE. Both showed signs of strength in Q3: Search revenue reached a record high, while Ad revenue rose to a seven-quarter high of $59.6 billion.

Moving on to Q4 and 2024, Google Cloud will remain in focus, and if revenue growth can inflect sooner rather than later, given that Azure is showing signs of stabilization shifting towards acceleration. AI’s impact on Search and Ads will also be watched – Alphabet is currently projected to post double-digit revenue growth in each quarter of 2024, driven by Ads and Search.

Every Thursday at 4:30 pm Eastern, the I/O Fund team holds a webinar for premium members to discuss how to navigate the broad market, as well as various stock entries and exits. We offer trade alerts plus an automated hedging signal. The I/O Fund team is one of the only audited portfolios available to individual investors. Learn more here.Learn more here.

I/O Fund Equity Analyst Damien Robbins contributed to this report.

Recommended Reading:
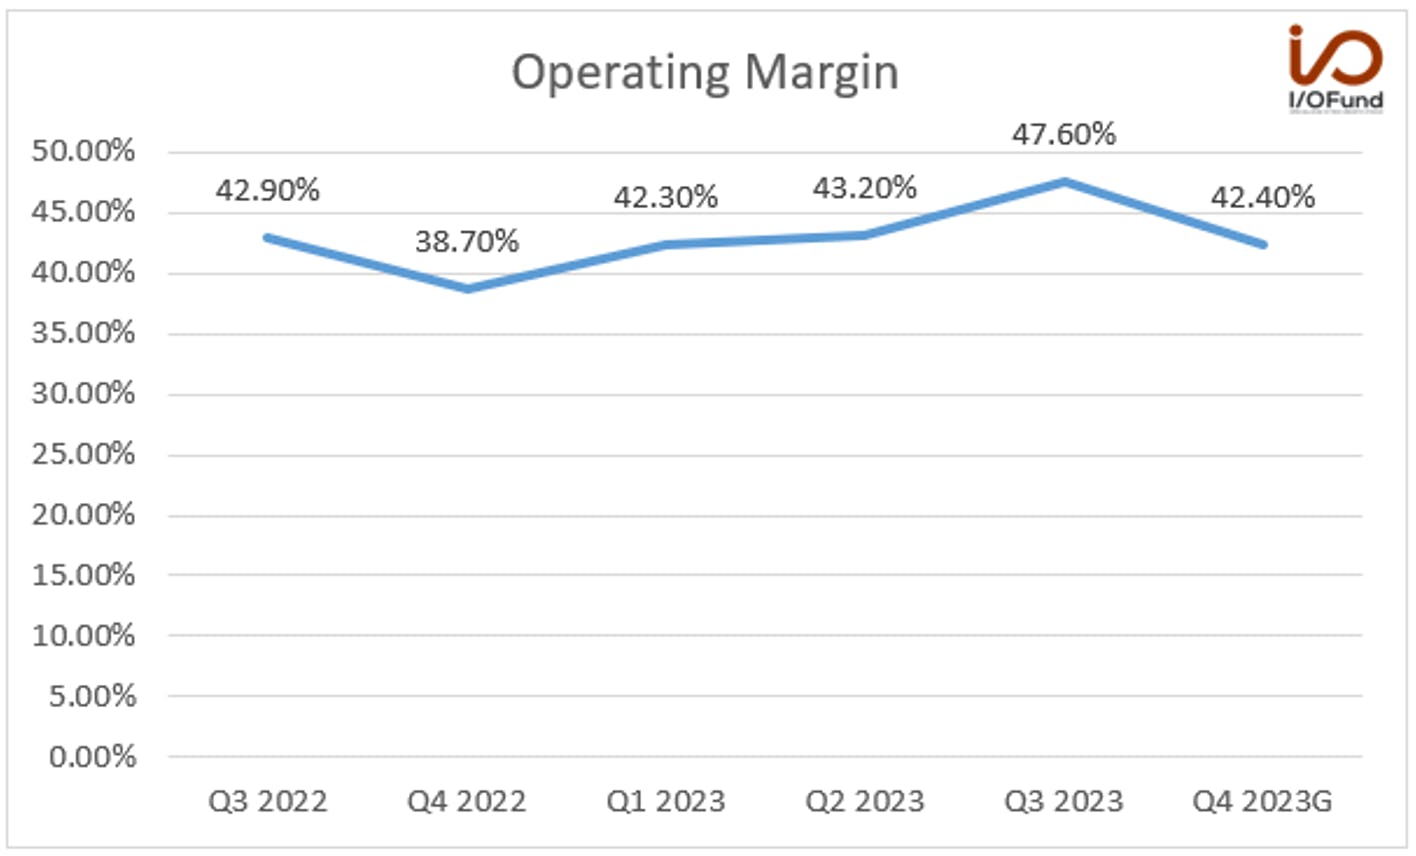
Microsoft Fiscal Q1 Earnings: Operating Leverage from AI

Microsoft posted strong results with the highlight coming from Azure and the Intelligent Cloud segment. Azure accelerated by 100 basis points on a constant currency basis, meanwhile, Google Cloud decelerated 549 basis points as reported on the same evening.

Azure reported growth of 28% YoY compared to 27% last quarter. Meanwhile, Google Cloud reported growth of 22.5% compared to 28% last quarter. This is important because GCP had finally passed Azure growth quarter, only to fumble in a fairly dramatic deceleration this quarter.

The company reported a fiscal Q1 growth rate of 12.8% for revenue of $56.5 billion versus 8.8% growth expected on revenue of $54.6 billion. Microsoft beat by almost $2 billion. This flowed through to the bottom line, which was also a sizable beat at $2.99 EPS reported compared to $2.65 EPS expected.

Microsoft’s guide for next quarter came in above expectations for 15.5% revenue growth compared to 11% expected. For next quarter, analysts were expecting revenue of $58.6 billion whereas management is guiding for $60.9 billion for a raise of $2.3 billion. The company is clearly seeing the early effects of AI revenue; however, the Activision acquisition is also contributing.

Of the roughly $2B beat this quarter, $850M of the beat is coming from the Intelligent Cloud segment. This segment reported $24.3 billion in revenue for growth of 19% on a CC basis. This is an acceleration from 17% on a CC basis last quarter. Per the CFO, “Higher-than-expected AI consumption contributed to revenue growth in Azure.” Later, the CFO stated something along the same lines in regard to Azure’s beat being AI-driven: “While the trends from prior quarter continued, growth was ahead of expectations, primarily driven by increased GPU capacity and better-than-expected GPU utilization of our AI services as well as slightly higher-than-expected growth in our per-user business,”

Personal Computing also came in better than expected by $1 billion at 3% growth YoY, which beat guidance of (-4.7%). For next quarter, the guide is 13.6% growth which is a considerable rebound from the many declining quarters this segment has been reporting. This is partly due to the Activision acquisition, which will contribute to gaming growth of mid to high 40%.

Although Microsoft guided Azure growth to decelerate 1-2pts for the December quarter and then to be “stable” throughout FY24, analysts were digging to find out if conservatism was baked into the guide, and how much room there is for potential upside in Azure based on new workload starts, mostly driven by AI workloads. In addition to this, optimizations were peaking in H2 of last fiscal year, and so that is technically a tailwind as Microsoft laps those quarters in H2 of this fiscal year.

Although Azure tends to grab the headlines, the margins were also impressive. We detail this and more below.

Revenue and EPS:

As stated, the company beat on the top line and bottom line.

  • Microsoft reported a fiscal Q1 growth rate of 12.8% for revenue of $56.5 billion versus 8.8% growth expected on revenue of $54.6 billion.
  • This flowed through to the bottom line, which was also a sizable beat at $2.99 EPS reported compared to $2.65 EPS expected.
  • Guidance was also strong at 15.5% revenue growth compared to 11% expected. For next quarter, analysts were expecting revenue of $58.6 billion whereas management is guiding for $60.9 billion for a raise of $2.3 billion.

Segment Revenue:

  • Productivity and Business Processes revenue increased to $18.6B (up 13% YoY) which is an acceleration of 300 basis points from last quarter.
  • Intelligent Cloud revenue increased to $24.3B (19% YoY) above guidance of $23.45B or 15.5% YoY and was driven by strength in Azure and other cloud services. This is up from 15% last quarter.
  • More Personal Computing was $13.7B and above guidance of $12.5B – $12.9B, driven by strength in Gaming and Windows, partially offset by a 22% YoY decline in Devices revenue growth

Guidance on Segment Revenue:

  • Productivity and Business expected to decelerate by 150 basis points at the midpoint for growth of 11% to 12% YoY.
  • Intelligent Cloud revenue is expected to decelerate 150 basis points at the midpoint for growth of 17.5%
    undefinedundefined
  • More Personal Computing is expected to show revenue of $16.5B – $16.9B representing 13.6% growth. Gaming is especially expected to be strong next quarter due to Activision, however, devices are still weak.

Margins:

This is where the report really shined.

Regarding gross margins, the company has done a good job of improving gross margins with 71.2% for the current quarter, up 200 basis points YoY. Microsoft Cloud gross margins increased by 200bps Y/Y when excluding the impact of useful lives. There was discussion on the earnings call that there is room for improvement in Cloud GMs as MSFT continues to benefit from the investments in its cloud infrastructure.

Microsoft is showing strong operating margin leverage with 47.6% in the current quarter, up from 43.2% last quarter along with strong operating margin expansion in Intelligent Cloud with 48.4% in the current quarter up from 43.9% last quarter. This flowed through to record net profit of $22.3 billion, up from $20.1 billion in the previous quarter.

There may be more room for operating margin expansion in Intelligent Cloud as the company continues to stay disciplined with OpEx with implementing the AI transition with Azure. Although MSFT maintained FY24 operating margins to be flat Y/Y, there is potential upside to operating margins on better-than-expected integration of the Activision acquisition and Microsoft’s continued efforts to improve Azure and Microsoft 365 gross margins.

  • Gross margin of 71.2% was up from 69.2% in the year ago quarter. The guide is for 68% next quarter.
  • Overall operating margin was 47.6%, expanding 470bps YoY and 440bps QoQ. The guide is for 42.4% next quarter. The guide for next fiscal year is for operating margin to be flat YoY.
  • Net margin of 39.4% will help cement Microsoft as the leading FAAMG in terms of GAAP profit margin again. The guide was for 33.5% next quarter.
  • Productivity and Business operating margin was 53.6%, expanding 310bps YoY and 410bps QoQ due to strength in Office 365.
  • Intelligent Cloud operating margin was 48.4%, expanding 430bps YoY and 460bps QoQ due to strength in Azure and other cloud services. This was the best Intelligent Cloud operating margin in six years.
  • More Personal Computing operating margin was 37.9%, expanding 620bps YoY and 420bps QoQ due to strength in Gaming and Windows, offset by weakness in Devices

Cash Flows:

Operating cash flow of $30.6 billion was up 32% year-over-year due to strong cloud billings and collections. This represents an operating cash flow margin of 54%.

Free cash flow was up 22% year-over-year for $20.7 billion. This compares to the June quarter with 12% YoY growth.

Key Metrics:

Commercial bookings increased 14% and 17% in constant currency in line with expectations, primarily driven by strong execution across our core annuity sales motions with continued growth in the number $10 million-plus contracts for both Azure and Microsoft 365.

GitHub CoPilot is growing rapidly with over 1 million paid copilot users across 37,000 organizations, which is up 40% QoQ. According to Microsoft, GitHub CoPilot increases developer productivity by up to 55%.

CoPilot 365 is one of the more crucial growth trajectories to watch as we move into calendar year 2024. This integrates an AI assistant for Microsoft Office and becomes available Nov 1st.

Azure Open AI Services has been adopted by 18,000 organizations, which allows companies to use OpenAI’s APIs for new development purposes. Ultimately, OpenAI creates more business for Azure even if a startup or company is not directly an Azure customer.

AzureArc is helping Microsoft to expand the meaning of hybrid and multi-cloud, to also include running apps across on-prem, edge and multi-cloud environments. This key metric grew 140% year-over-year.

Earnings Call:

The Microsoft management team is very polished so most questions are answered with fairly uneventful replies, at times. However, one analyst did get more color on future operating margin. The concern is that opex came in so low, where does Microsoft go from here?

Primarily, the CFO believes margins will be flat/stable due to: “improvements we're making in Azure and even Microsoft 365 gross margins, even in the core of the commercial cloud. It speaks to the pace at which we're delivering AI revenue with the increasing cost expense and capital investment ahead with the demand we see.”

And then, another analyst went right for the question on everyone’s minds, which is — can Microsoft sustain double-digit growth? Here is the transcript, which as you can see, the management team is fairly vague. But if you read between the lines, they’re using the word stability a lot, and that would imply no notable acceleration, but more importantly, no notable deceleration either. This could change if AI continues to show up in various segments (Office 365, Search, Security, etc)

“Question – Brent Thill: Thanks. Amy, good to see the 12% growth. Many investors are asking, can you sustain double-digit growth, especially with a stronger AI boost coming in the next several quarters?

Amy Hood: I think, looking at our – as I said, Q1 was a strong start to the year. Q2 certainly implies that we've talked about stability for Azure into the second half of the year looking at the – and in line with what we're seeing for Q2. And so I think we feel good about our ability to execute. But more importantly, our ability to continue to take share.”

Later, the CFO explained that by guiding for stable Azure growth, that Microsoft is overcoming optimization headwinds due to new AI workloads. The puts and takes lead to stable growth, and there was an underlying tone that this will ultimately set Microsoft apart: “And at the scale we're talking about being able to have stability in our Azure business does mean that we will have a lot of new workload starts. And primarily, we're expecting those to come from AI workloads, but AI workloads don't just use our AI services. They use data services and they use other things. And so that combination I think looking on a competitive basis, we feel good about our execution, we feel good about taking share, and we feel good about consistent trends. And so I feel good about that guide and what it says about where we are on share.”

If I were to wrap up the call in one word, it would be “leverage.” This was probably the most important statement on the call in terms on why the company may fare better than its peers in a recession (or excuse me, during extended periods of optimization):

“In addition, what Satya mentioned earlier in a question, and I just want to take every chance to reiterate it, if you have a consistent infrastructure from the platform all the way up through its layers, that every capital dollar we spend, if we optimize revenue against it, we will have great leverage. Because wherever demand shows up in the layers, whether it's at the SaaS layer, whether it's at the infrastructure lower, whether it's for training workloads, we're able to quickly put our infrastructure to work generating revenue.”

Conclusion:

At one point, Microsoft was left out of the FAANG acronym. This earnings season, and probably a few more in the near future, will place this profitable powerhouse at the front of the Big Tech train. This company is not messing around when it comes to the one unique advantage it has over its peers, which is simply this: enterprises.

Recommended Reading:
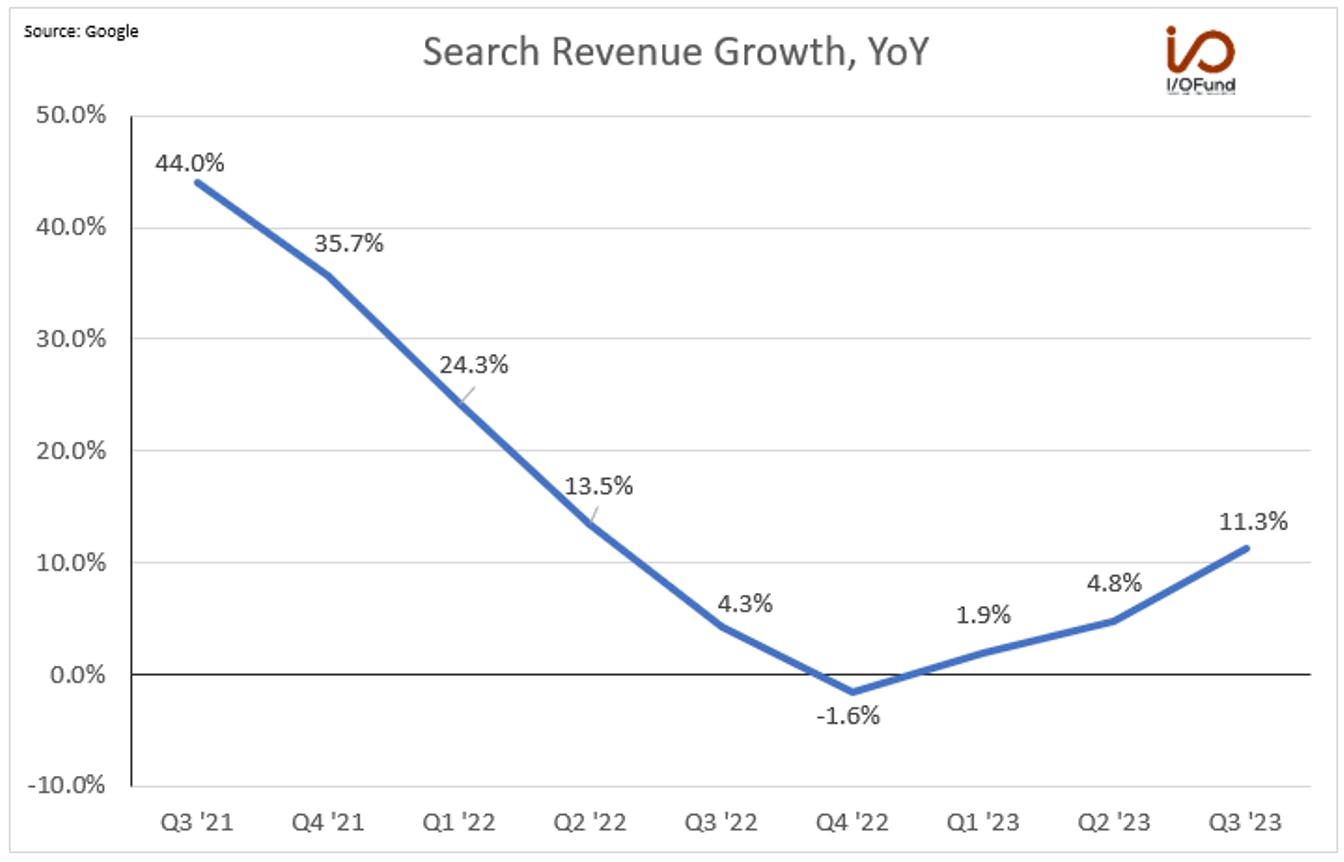
Big Tech Stocks: Q3 Earnings Preview

This article was originally published on Forbes on Forbes Forbes on Oct 19, 2023,10:47pm EDT

Earnings season has officially kicked off, with Big Tech headlining a busy week next week: Microsoft and Google report on Tuesday, followed by Meta on Wednesday, and Amazon on Thursday. Big Tech stocks have seen their dominance over the broader indexes soar this year, with the Magnificent 7 reaching nearly 30% of the S&P 500’s weighting, higher now than at its peak in 2022 and up from 20.0% at the beginning of this year.

In the Nasdaq 100, the combined weighting of Big Tech stocks is even higher, at 44.8%. The Nasdaq 100’s rebalance earlier this year in July dropped the overall weighting of the group from 55% to ~38%, but already, we’ve seen a 6 percentage point increase in just over one quarter.

This outsized influence that the Magnificent 7 has over the indexes is just one of the many reasons that Big Tech earnings reports next week will be some of the most closely watched this season. EPS estimates for the group will be in focus – estimates have all pushed higher during Q3, with Amazon, Meta, and Nvidia seeing some of the largest increases, and investors will likely be assessing how the group stacks up against heightened expectations.

Beth Kindig Big Tech Earnings Twitter Post

View Post: Click HereView Post: Click HereClick Here

Sign up for I/O Fund's free newsletter with gains of up to 221% – Click hereClick hereClick here

Microsoft: AI to Help Drive A ‘Noticeable Acceleration’ This Year

For Microsoft, a noticeable acceleration is expected this year, with revenue growth accelerating back to the low-double digits through FY25. For the quarter, revenue growth is estimated to be about +8.8% YoY to $54.5 billion, with EPS forecast to grow +12.6% to $2.65. Revenue growth is currently forecast to return to +10% to +12% growth over the next three quarters through calendar Q2 2024.

Microsoft Quarterly Revenue

Source: SEEKING ALPHA

Azure and AI will be two of the key areas to watch, given the overlap between the two. Microsoft is devoting 13% of Capex to AI in 2023, the most among the top cloud service providers.

Azure’s growth in the prior quarter was 27% in constant currency, including about 1% from AI services, a decline from 31% two quarters ago. Excluding currency impacts, growth slowed to 26% from 27%, hinting at a possible inflection point back to higher growth.

Azure's Quarterly Revenue Growth, YoY

Source: MICROSOFT

Microsoft also stands to benefit from its consumption pricing model for OpenAI’s APIs, given that the APIs are all new workloads for Azure this year. Microsoft said last quarter that it had “great momentum across Azure OpenAI Service” with around 100 customers added each day, bringing total customers to more than 11,000.

In addition, commercial subscriptions for Office 365’s Copilot AI assistant are expected to start on November 1, at a $30 per month per user price point, opening up a potential multibillion-dollar revenue opportunity over the next few years, with the first insights likely to come next quarter.

Every Thursday at 4:30 pm Eastern, the I/O Fund team holds a webinar for premium members to discuss how to navigate the broad market, as well as various stock entries and exits. We offer trade alerts plus an automated hedging signal. The I/O Fund team is one of the only audited portfolios available to individual investors. Learn more here.Learn more hereLearn more here.

Alphabet: Search & Cloud Momentum to Continue

Like Microsoft, Alphabet is expected to see revenues reaccelerate to the low double-digits through Q2 2024, a marked acceleration from forecasts at the beginning of the year. Revenue for Q3 is forecast to rise +9.6% YoY to $75.7 billion, with EPS growing +36.0% YoY to $1.44.

Alphabet Quarterly Revenue/EPS Growth, YoY

Source: SEEKING ALPHA

The combination of resilient Search growth, strong Cloud performance, and the integration of AI into Alphabet’s services is driving revenue growth expectations higher. Forward revenue growth rates for the next two quarters have risen upwards of 2 percentage points since the beginning of the year.

Alphabet Revenue Growth Forecast Change, Q1 to Q3

Source: SEEKING ALPHA

Search and Other advertising growth is picking up, rising 5.4% QoQ to $42.6 billion, as Google begins “building the next major evolution in Search” with AI integrations driving a higher ROI. As the I/O Fund highlighted previously, Alphabet’s Search “has proven resilient because it provides advertisers an attractive ROI on their ad spend. Looking ahead, Search Generative Experience, [Google’s generative AI-powered search tool], will improve advertisers’ ROI and will likely provide Alphabet additional pricing power. This will also improve their retail vertical” – a trend already surfacing, with Q2’s Search growth driven by retail alongside SGE’s launch.

Google Cloud will also be under the microscope, after posting two consecutive quarters of operating profitability, with operating margin reaching almost 5% last quarter. Revenue for Cloud stabilized at 28% growth YoY in both Q1 and Q2, as the platform remains a leading choice for training generative AI models. As enterprises start to think more deeply about AI and integrating AI across their organizations, Google Cloud stands to benefit in multiple ways – via its large language models such as Bard, its generative AI offerings including the recently launched Duet AI, offering AI model training with multiple AI supercomputers, and by “expanding our total addressable market and winning new customers,” according to CEO Sundar Pichai.

However, Google is in the midst of its antitrust trial, with regulators concerned that Google has been keeping an illegal monopoly on search. Google is reportedly paying Apple nearly $20 billion per year to remain the default search engine on Apple’s devices, are at the forefront of the case.

For a deeper dive into Alphabet and how the Search giant is entering its Year of Execution, read more here.here.

Meta: Ad Impressions to Drive Revenue Growth

Meta’s Q3 EPS estimate surged during the quarter, rising $0.60 from an estimate of $2.98 on June 30 to $3.58 by September 30. Meta returned to positive growth in Q1 this year, with revenues up +2.6%, and has since seen revenue growth accelerate – Q3 and Q4 are both expected to see YoY revenue growth up more than +20%.

Meta also has seen improvements in operating efficiency this year. Operating margin has expanded 9 percentage points in just two quarters, from 20% in Q4 to 29% in Q2. Revenue growth reaccelerating to more than +20% through the end of the year is set to drive EPS growth in the triple-digits as operating margin expands further.

Meta Quarterly Revenue/EPS Growth, YoY

Source: SEEKING ALPHA

Q3 is expected to be a banner quarter setting Meta up for a strong end-of-year finish: Meta is estimated to post 119% EPS growth to $3.58, with revenues expected to rise 20.6% to $33.4 billion. As an advertising-driven company, with more than 98% of revenues coming from ads, the mix of ad impressions and ad pricing will determine growth. So far this year, ad impressions have served as the primary driver, rising 26% YoY in Q1 and 34% YoY in Q2, offsetting weak pricing, which declined 17% YoY in Q1 and 16% YoY in Q2.

Meta Ad Impression and Ad Pricing Growth, YoY

Source: I/O FUND

Over the past four quarters, advertising spend looks to have bottomed out, recovering from Q4’s (-22%) decline, while ad impressions continue to accelerate past 30%. Impression growth has been driven by APAC and Rest of World, which, as lower monetizing regions, have contributed to that decline in pricing. AI is only just beginning to scratch the surface in optimizing ads and increasing ROI for advertisers, and Meta is seeing “strong advertiser demand,” with almost all of its advertisers “using at least one of [its] AI driven products.” Meta is continuing to release new AI advertising products, such as Meta Lattice for predicting ad performance and AI Sandbox for generative AI-powered ad generation.

Amazon: AWS Growth in Focus

Amazon is expected to see a slight acceleration in revenue growth through the end of the year, with Q3 and Q4 forecast to see revenues increase 11.4% and 11.7% respectively, following Q2’s 10.9% growth. EPS estimates for Q3 point to +114% growth to $0.60, as operating margins for North America are expected to continue a 5-quarter streak of improvement.

Amazon Quarterly Revenue Growth, YoY

Source: SEEKING ALPHA

AWS will also be a major focus of the upcoming report, as its revenue growth rate has declined for 7 straight quarters, from 40% growth in Q4 2021 to just12% growth in Q22023. Operating income has declined for three consecutive quarters but is on the verge of inflecting back to growth.

AWS Revenue/Operating Income Growth, YoY

Source: AMAZON

While AWS generates just ~17% of Amazon’s total sales, its influence down the line is increasingly large. In Q2, AWS contributed nearly 70% of Amazon’s $7.7 billion of operating income; on a TTM basis, AWS generated $21.1 billion in operating income, or 119% of Amazon’s total $17.7 billion, weighed down by losses on the e-commerce side.

Given that outsized impact on Amazon’s bottom line, an inflection in both AWS’ revenue growth and a pivot back to growth in operating income will help drive more confidence in Amazon’s high EPS growth rates over the next couple years – earnings are forecast to grow 43% and 41% in FY24 and FY25, respectively. However, should AWS fail to show that inflection in revenue growth and post a fourth consecutive quarter of declining operating income, higher EPS estimates over the next three to four quarters could come under pressure.

Beth Kindig Twitter Post

Watch the Video: Click HereWatch the Video: Click HereClick Here

Conclusion:

Heightened expectations stemming in part from surging AI interest and cloud spend stabilizing are the major theme heading into Big Tech’s earnings week next week. Meta and Google are forecast to see the strongest revenue accelerations over the next two to three quarters, while Amazon is expected to see a small bump up with AWS’ growth a prime factor. Microsoft’s AI initiatives are expected to drive revenue acceleration over the next four quarters as the company devotes more than 13% of its Capex to AI.

We have buy levels we are targeting for Big Tech, which we share with our premium research members each week as the stocks progress. We believe our target buy levels will set us up for gains in FAANG stocks when the next bull cycle begins. We provide in-depth macro and individual stock analysis so that readers can better understand why we buy/sell. In this market, we frequently take gains. You can learn more here including information on our weekly webinar series, where we review our positions live and discuss some of the top stocks of the week.

Every Thursday at 4:30 pm Eastern, the I/O Fund team holds a webinar for premium members to discuss how to navigate the broad market, as well as various stock entries and exits. We offer trade alerts plus an automated hedging signal. The I/O Fund team is one of the only audited portfolios available to individual investors. Learn more here.Learn more here.

I/O Fund Equity Analyst Damien Robbins contributed to this report.

Recommended Reading: