CrowdStrike reported a new record for net new ARR in Q4, far surpassing the record it set in the previous quarter, and GAAP margins continued to strengthen. Net new ARR accelerated significantly in the quarter to 27% growth, which is a 14-point acceleration from 13% growth in Q3. This is up from 2% growth for net new ARR in the year ago quarter. The turnaround in this particular key metric is notable, especially compared to other cloud stocks whose key metrics are decelerating. ARR increased 34% to $3.44 billion, which was down 1 percent from 35% growth last quarter.
For FY25, CrowdStrike’s guide was marginally above consensus, yet the market is clearly pleased with the continued expansion in operating and net margins. The turnaround on net new ARR is notable, yet the turnaround on GAAP profitability is what is most impressive compared to its cloud peers, especially considering the far majority of cloud stocks are years away from GAAP profitability (if they ever get there). We covered this in-depth here.
Revenue and EPS:
Q4 revenue was $845.3 million, beating estimates by $5.3 million, representing YoY growth of 33%. This is down from 36% growth in the previous quarter.
Q1 revenue was guided between $902.2 million to $905.8 million, representing YoY growth of 30%.
FY24 revenue was $3.06 billion, an increase of 36% YoY.
FY25 revenue was guided at $3.925 billion to $3.99 billion, slightly ahead of consensus for $3.94 billion and representing YoY growth of approximately 29% at midpoint.
Q4 adjusted EPS was $0.95, beating estimates by $0.13 and representing YoY growth of 102%. GAAP EPS was $0.22, compared to ($0.20) in the year ago quarter.
FY24 adjusted EPS was $3.09, an increase of 101% YoY. GAAP EPS was $0.37, compared to ($0.79) in FY23.
The bottom line is expected to grow steadily over the next two fiscal years, suggesting that GAAP profitability is permanent. With that said, analyst consensus for next quarter of $0.82 is lower than Q4’s EPS of $0.95. It’s likely we see upward revisions to Q1’s EPS over the next few days, although management guided for an adjusted operating margin that is four points lower QoQ than the current quarter.
Margins:
Margins strengthened across the board – driven by four quarters of GAAP gross margin at 75% and GAAP subscription margin at 78%. For the full year, CrowdStrike nearly broke even from operations, reporting just a ($2 million) loss from operations, or a (0%) margin, an 800 bp improvement from FY23. CrowdStrike also reported its first full year with GAAP net profitability, reporting a 2.9% net margin, compared to an (8.2%) margin in FY23.
Q4 saw net margin more than double sequentially, from 3% in Q3 to 6.4% in Q4, as net income surged 101% QoQ to $53.7 million – this means that CrowdStrike generated 60% of its GAAP net income in Q4 alone.
Q4 GAAP gross margin was 75.3%, compared to 72% in the year ago quarter.
Q4 GAAP operating margin was 3.5%, the second straight quarter with a positive margin and an increase from 0.3% in the previous quarter.
o To further illustrate CrowdStrike’s margin expansion, GAAP operating income was $30 million this quarter compared to (-$61.5) million in the year ago quarter. This is up from $3.2 million last quarter.
o CrowdStrike’s adjusted operating income was $213.1 million for a margin of 25%. The company is guiding for a lower margin next quarter of 21%.
Q4 GAAP net margin was 6.4%, the fourth consecutive quarter with a positive margin and an increase from 3% in the previous quarter.
Stock based compensation was 20.9% of revenue compared to 20.3% of revenue in the previous quarter for a total of $176.3 million.
Fiscal Year 2024 Margins:
FY24 GAAP gross margin was 75%, compared to 73% in FY23.
FY24 GAAP operating margin was (0%), compared to (8%) in FY23.
FY24 GAAP net margin was 2.9%, compared to (8.2%) in FY23.
For FY2025, the CFO provided the following color: “As a result of increased hiring in the first half of the year, changes to the timing of our merit cycle and the timing of certain marketing programs, we expect operating leverage to be more weighted to the back half of FY '25.”
Cash and Debt:
CrowdStrike is known for its strong cash flow margins and this quarter was no exception. The company raised its FY2025 free cash flow target by 1-point at the midpoint. Per the CFO: “Next, we are raising our free cash flow target for FY '25 from between 30% and 32% to between 31% and 33% of revenue.”
Q4 operating cash flow was $347 million, representing a 41% margin. Free cash flow in the quarter was $283 million, a 33.5% margin.
FY24 operating cash flow was $1.16 billion for a margin of 38%. Free cash flow was $938.2 million for a margin of 30.7%.
Cash, equivalents and short-term investments totaled $3.47 billion.
Debt totaled $742.5 million.
Key Metrics:
CrowdStrike added a record $281.9 million in net new ARR in Q4, far surpassing its previous net new ARR record of $223 million set just in Q3. Net new ARR increased 27% in Q4, a 14 percentage point acceleration from just 13% growth in Q3.
According to the CFO: “while we do not specifically guide to ending or net new ARR, given the incredible performance of Q4, I will share our currerpnt seasonality assumptions with respect to net new ARR in Q1, which calls for Q1 net new ARR year-over-year growth to be at least double digits up to the low teens.” The CFO is tempering expectations that 27% is not realistic for next quarter, but strong growth is still achievable.
ARR of $3.44 billion was up 34% YoY compared to ARR of $3.15 billion and growth of 35% in the previous quarter. Management has stated: “We continue to aggressively invest in our innovation engine and flank the company to achieve its vision of reaching $10 billion in ARR over the next 5 to 7 years.” That would imply about 200% growth in 5-7 years. The growth of deals with total value exceeding $1 million accelerated to “over 30%” this quarter for 250 customers.
Deferred revenue of $3.05 billion was up from $2.36 billion in the year ago quarter. The sequential increase from $2.5 billion suggests that billings are strong. Billings for this quarter comes to $1.36 billion, up 65% QoQ and up 39% YoY. There was mention on the call that total billings outgrew short-term billings, which translates to customers committing for longer contracts. Management likes to remind analysts that ARR is a better measure of their business, even during quarters when deferred revenue and billings are strong.
Similar to deferred revenue, RPO reported an astonishing surge that points toward CrowdStrike being resilient compared to its peers. RPO was up 35% YoY and up 24% QoQ to $4.6 billion. This is the highest QoQ growth we’ve seen the company report since tracking this metric over the past 11 quarters. Compare the 24% QoQ growth to only 3% QoQ growth last quarter.
Subscription revenue of $795.9 million increased 33% compared to 34% last quarter. Professional Services grew 26.3% for revenue of $49.4 million.
Customers with multiple modules increased 1% across the board, including in the 7+ module cohort, 6+ module cohort, and 5+ module cohort.
Dollar based net retention was 119%, same as last quarter. The company offered visibility (finally) into the quarterly DBNRR over the past year of “Net retention was 119% in Q3, 119% in Q2 and 122% in Q1.” These numbers had been left vague before. It’s softening a bit and 120% is the benchmark CrowdStrike has stated they want to achieve.
Earnings Call:
Data-Centric Architecture in a Single Platform:
The predominant question in the Q&A is why is CrowdStrike resilient when peers are not. As you’re likely aware, Palo Alto Network, Fortinet and Zscaler saw turbulence following their earnings reports. Overall, the CEO and management team focused on why a platform is important instead of a fragmented approach to acquisitions from “multi-platform hardware vendors [that] evangelize their stitched together patchwork of point products, masquerading as thinly veiled piecemeal platforms.” Wow, those are strong words. CrowdStrike is not shy about naming the companies they are taking business from. In this call, it was Azure Sentinel, Splunk and Palo Alto Networks. Later on, there was a quote that I think best juxtaposes the differences between the piecemeal platforms and what CrowdStrike is offering:
“So when we think about architecture, architecture does matter and really what we've created is a very data-centric architecture that allows us to get data at scale into our platform, leverage our AI and then create the outcomes. It's that collect once, use many. We have a single platform. Our competitors have many other platforms as they call them. We have a single agent. Our competitors have 5, 6, 7, 8 agents depending on the competitors.
So when we look at our architecture, it was really designed from the beginning to solve the problems of today and the future problems. And the result of that is ease of use, the outcome that a customer is looking for, stopping breaches and lowering the cost, and future proofing what they want. I've — in a prior life, I've been involved in companies that acquired a lot of products. And I can tell you, it is near impossible to stitch all this stuff together, particularly at the agent level unless you're very diligent about it.
This was further quantified in the opening remarks when it was stated that a recent IDC platform is “showcasing $6 of return for every dollar invested in the Falcon platform.”
It’s important to drop a note that many companies can break out AI revenue, whereas CrowdStrike’s data-driven AI features are inherent to the platform. Therefore, I don’t believe it’s possible to have a separate AI segment the same way other companies offer.
“The statement that CrowdStrike’s data is more valuable is based on the vast number of threats their platform has already detected. Essentially, the argument is that their XDR platform is better than competitors, and therefore, their data is better than competitors, which results in smarter and more accurate AI output. Here is how management spoke about it: “we actually have a very well-defined training set that's annotated based upon all the threat hunting that we've done over the last 10 years.”
Automation reduces the number of false positives. Instead of getting every piece of telemetry that requires the security team to investigate, AI-assisted endpoint detection and response solutions eliminates the noise so that the security team is only responding to those that have the potential to be critical. Fundamentally, cybersecurity is a data problem. CrowdStrike’s Falcon platform ingests, correlates, and queries petabytes of structured and unstructured data from ever-expanding disparate external and internal sources in real-time. It builds rich context and delivers greater visibility by constructing a dynamic representation of data across an organization. As a result, the company’s AI models are often highly accurate in triggering a response.
However, in the earnings report this quarter, the CEO stated a few new things that investors should see creates a more all-encompassing AI platform:
“We collect trillions of threat signals daily creating one of the world's largest and fastest-growing cyber threat data set. From day 1, we've been an AI company, training the industry's most effective and accurate AI models to prevent attacks based upon our data moat.”
Falcon for IT:
On the same note that AI is not a separate revenue segment for CrowdStrike, there are additional ways CrowdStrike plans to leverage its “AI-native” platform. One of the more popular hybrid use case is called Falcon for IT, which allows IT teams to leverage AI and automation to query the IT systems and servers. This is useful for things like fleet management, compliance, and performance monitoring. By using generative AI, IT Teams can query assets for unauthorized software, outdated machines, patch status and also schedule queries to detect anomalies.
I’m highlighting this as a segue into the broader idea that AI and automation is likely to have a large impact on CrowdStrike (and perhaps more immediate) compared to other cloud stocks on the market.
This was the CEO’s commentary on the call:
“Customers are looking for a better solution in this area. And one of the things that we found is that the security team has been solving a lot of IT problems and challenges for IT for a long time, and we really needed to carve out a home for IT. So when you look at some of our competitors in that market, it's — obviously, it's a pretty big market, but having a single agent and the ability to actually solve IT problems, which many of our customers were doing already, is fantastic.
So again, early days, but the feedback and the interest is off the charts for Falcon for IT, and it goes to the heart of how we built the platform. To collect data, it doesn't have to be security data. It can be almost any data related to either our agent first-party data or now third-party data we can ingest. And that solves many use cases beyond what we originally came to market with. So I think the sky is the limit there.”
FY2025 Net New ARR Commentary
Since ARR and net new ARR is what moves the stock, I wanted to include what the CFO stated in terms of FY2025. It’s very vague but sounds positive in terms of net new ARR building from Q1 and beyond.
Question Matthew Hedberg (Analyst)
I'll offer my congrats as well, guys. Burt, your new ARR commentary was helpful for Q1. I'm curious, this time last year, I believe you talked about flat net new ARR growth for fiscal '24. And obviously, I think you guys did about 6% this year. Any just sort of like directional guardrails you give us from a full year perspective in terms of just thinking about it from a net new perspective?
Answer Burt Podbere
So with respect to ARR, obviously, we don't guide to it. But we have talked about in the past where we've started the year in Q1 and build from there. And that's kind of really all I can really comment on ARR. You can kind of infer where we're going with our guide. And — but at the end of the day, our guide — the methodology has remained consistent, and that's how we think about it.
Conclusion:
CrowdStrike’s post-earnings reaction is as much about CrowdStrike as it is about the weakness of its peers. The excellent timing of the increasing GAAP profitability merging with accelerating key metrics is something we are not likely to see in any other best-of-breed cloud company this earnings season.
The market is anxious to find AI winners early-on. By combining cybersecurity with AI in a single platform with a data-centric architecture, CrowdStrike is emerging as one of the few cloud companies that has resiliency and the AI “it” factor. We continue to believe that 20 Forward P/S is the ceiling for cloud stocks, yet we also continue to believe that CrowdStrike is the leader in the cloud category. For reasons quite apparent this evening, CRWD is one of two that we are interested in owning now and into the foreseeable future out of the dozens and dozens of cloud stocks on the market.
Note: We have updated the analysis on 03/06 with the following: Billings for this quarter comes to $1.36 billion, up 65% QoQ and up 39% YoY.
This article was originally published on Forbes on Feb 29, 2024, 09:34pm ESTForbes Forbes on Feb 29, 2024, 09:34pm EST
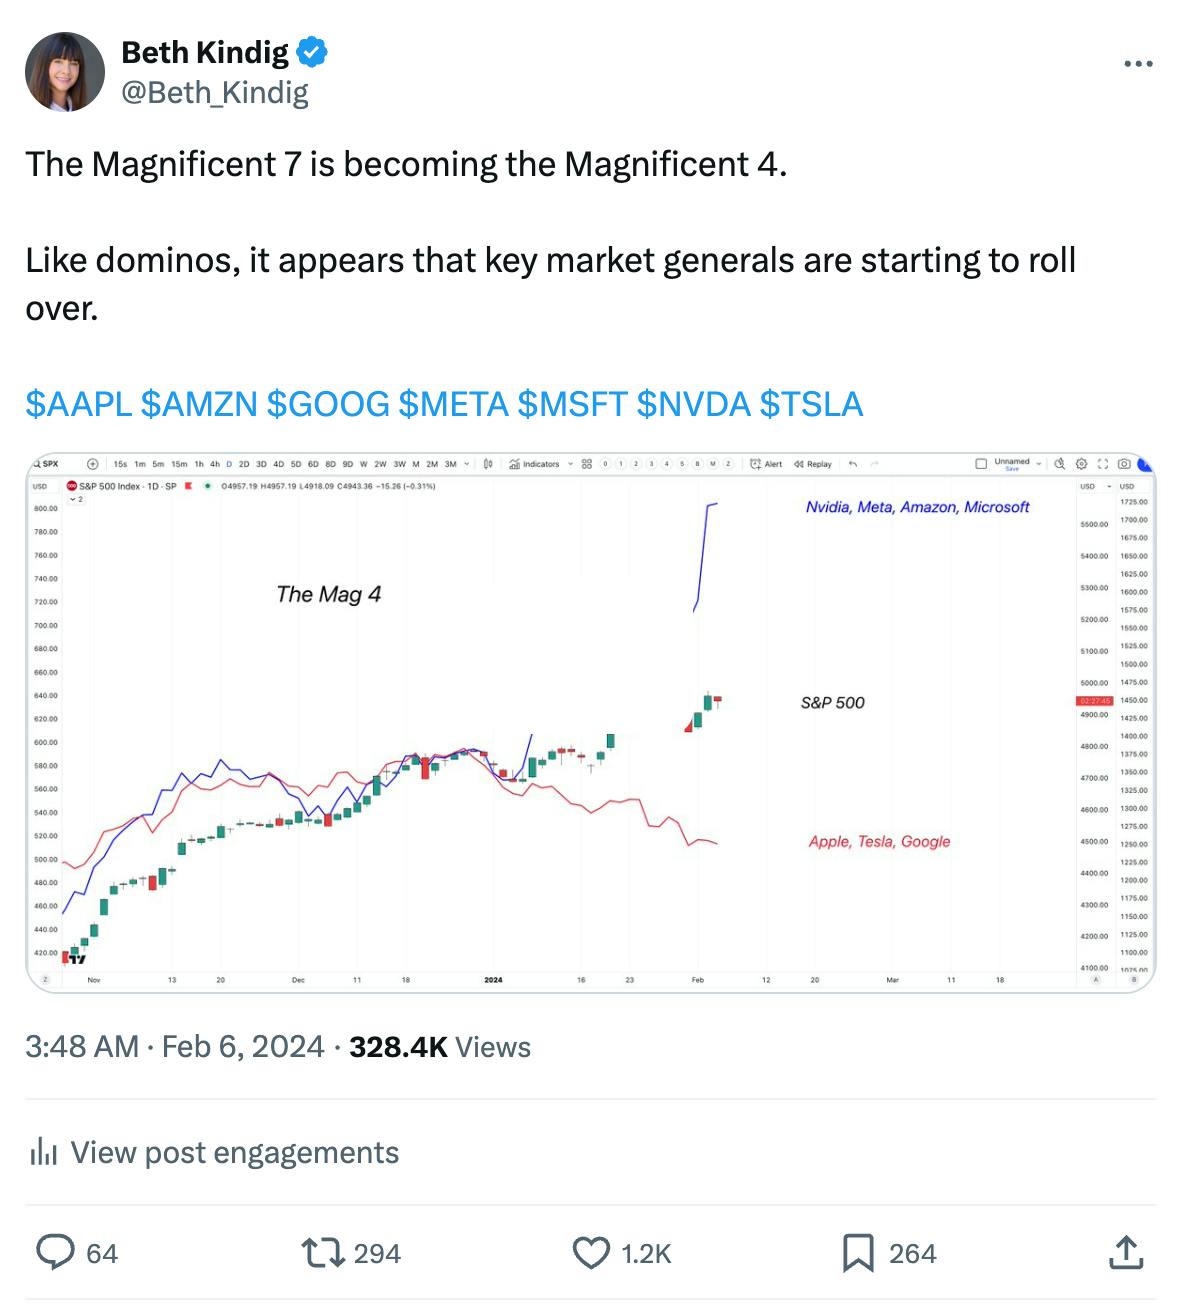
The Magnificent 7, defined as Apple, Alphabet, Amazon, Meta, Microsoft, Nvidia and Tesla, have seen a “magnificent” run fueled by AI optimism over the past fourteen months. The Magnificent 7 returned more than 106% in 2023, doubling the Nasdaq 100’s nearly 54% gain and significantly outperforming the S&P 500’s 24% gain. At first glance, it may appear that the Magnificent 7 are continuing their outperformance of the broader indexes in 2024.
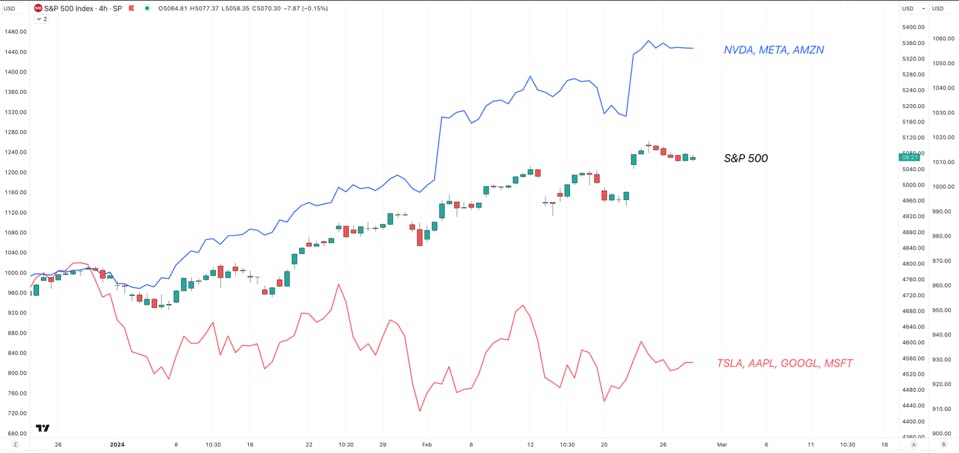
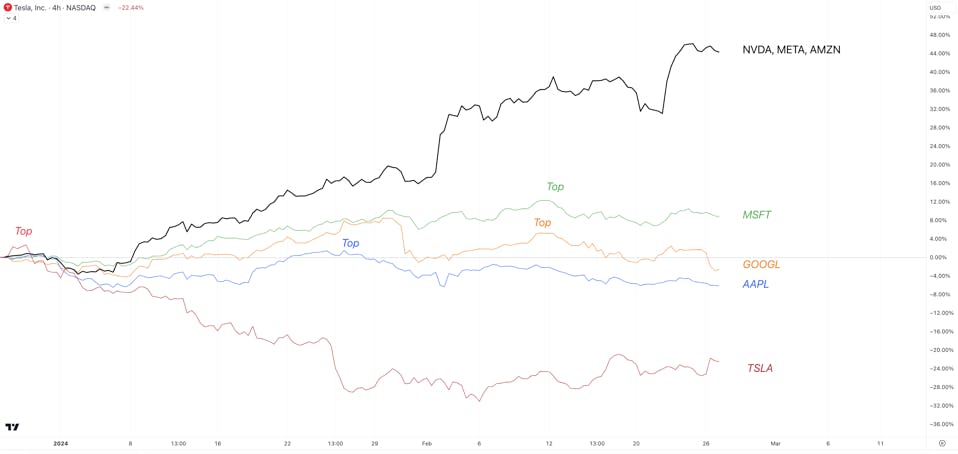
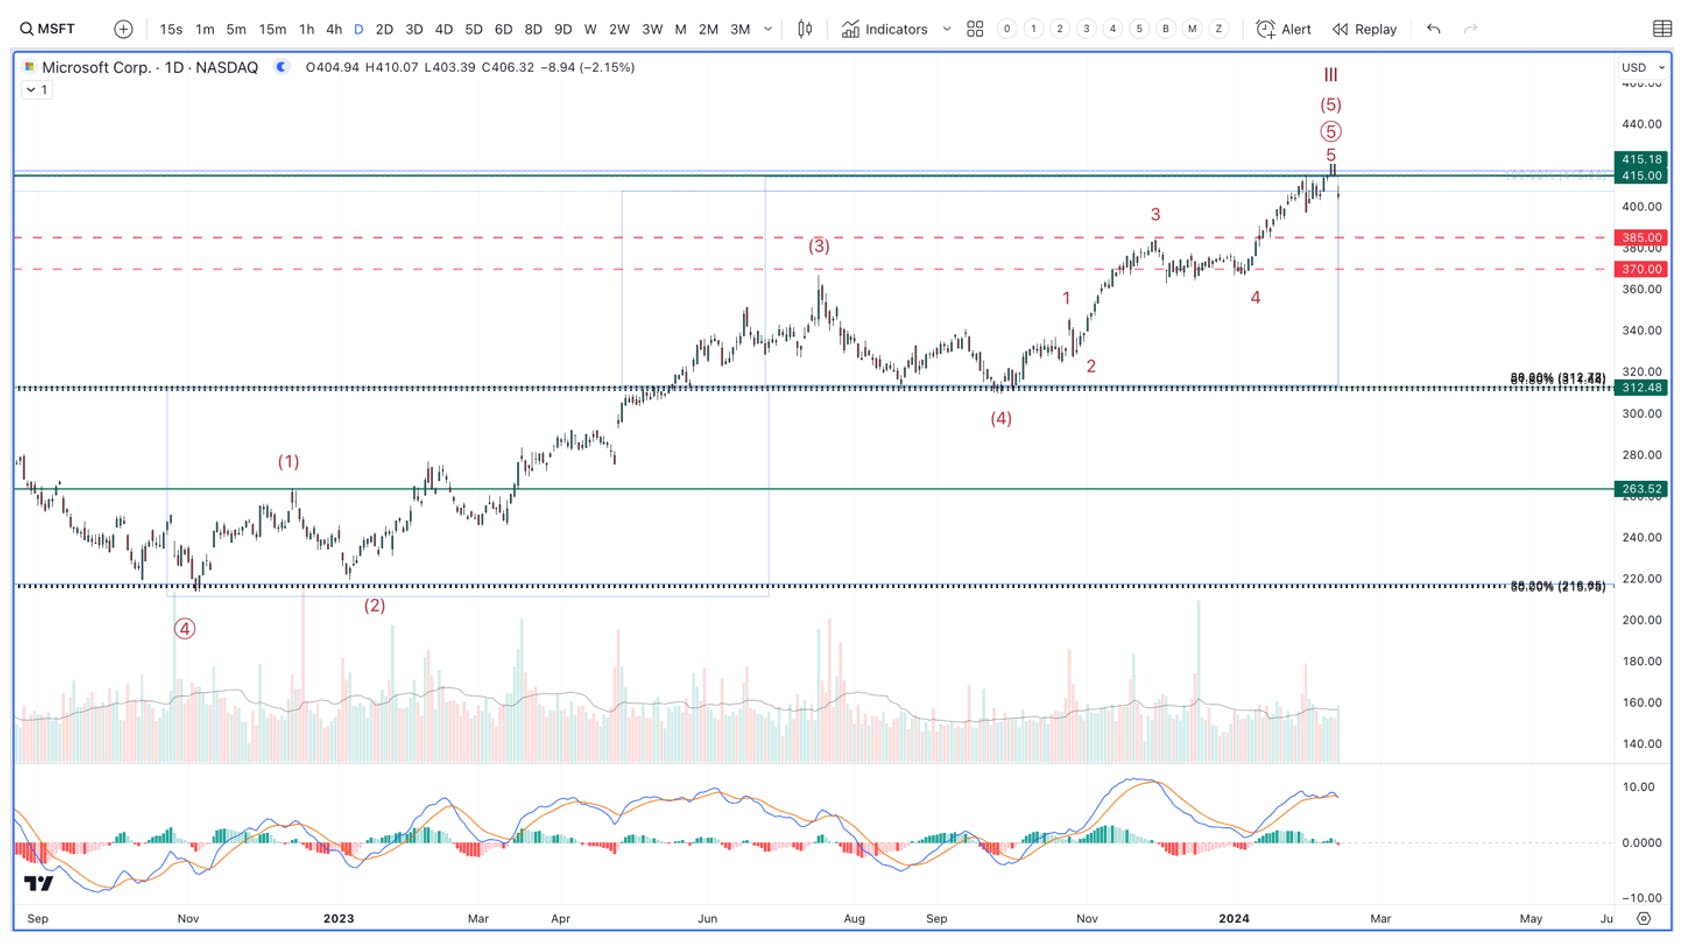
However, like dominos falling, these market generals are topping out and diverging from the broad market. First Tesla in July of 2023, then Apple and Google in February have topped, and now Microsoft is not making a new high with the broad markets’ most recent run higher.
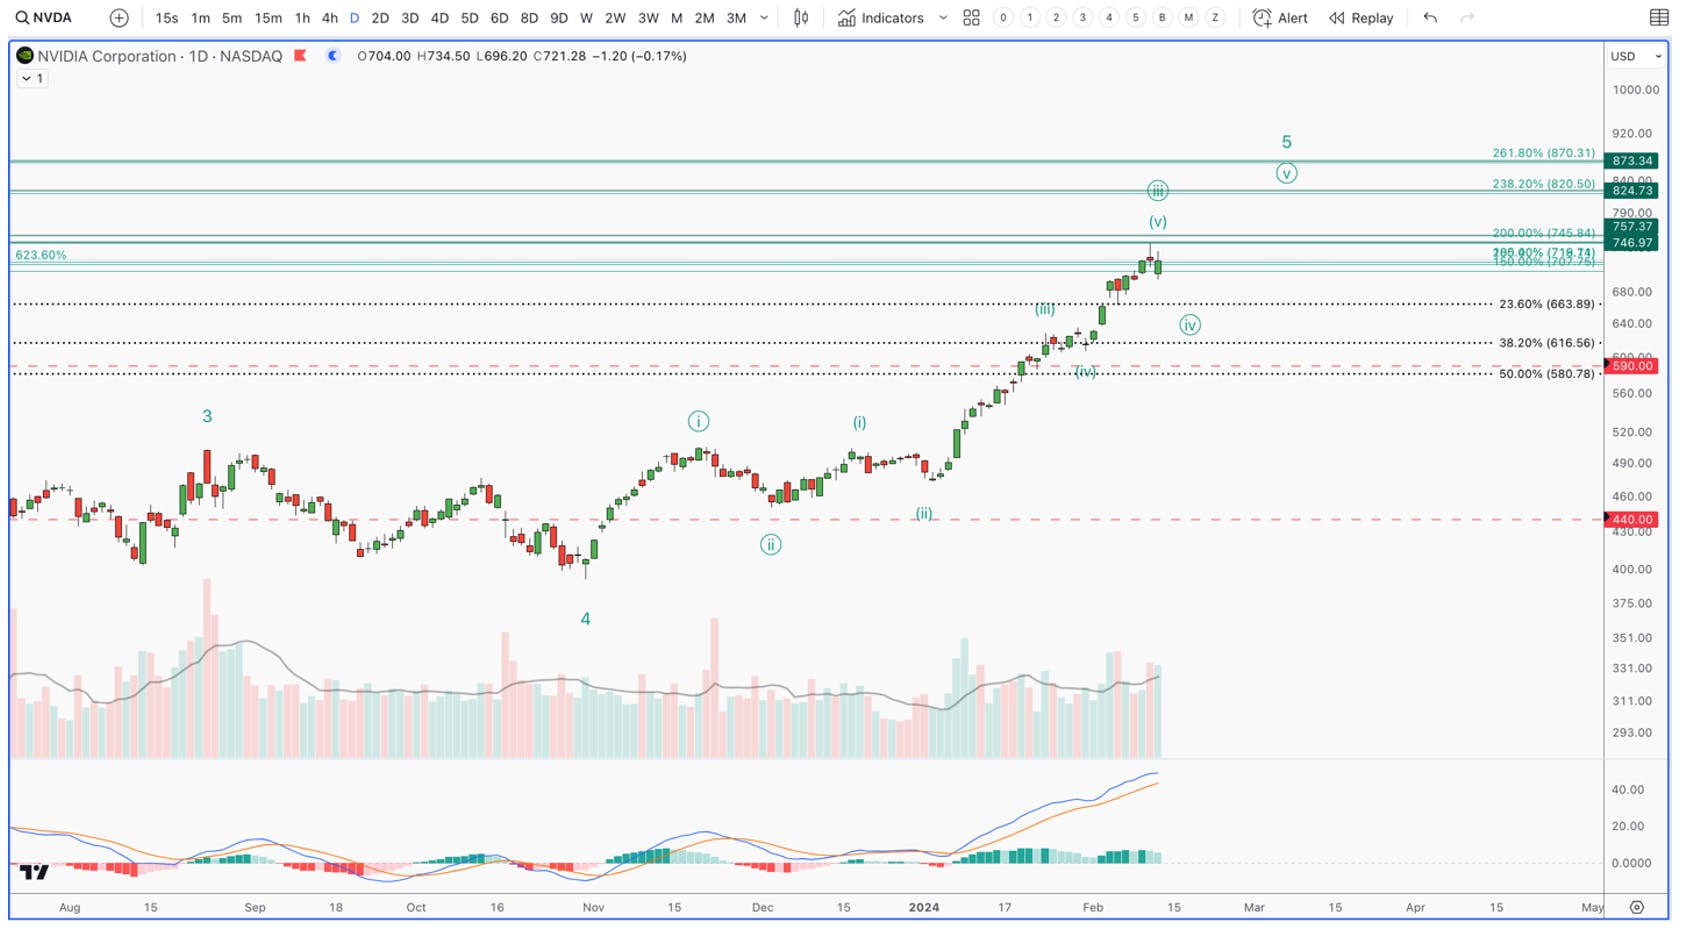
The Magnificent 7 of 2023 have now become 2024’s Magnificent 3: Nvidia, Meta and Amazon. Of these, Nvidia’s saw a stellar start to the year as shares have gained nearly 60% YTD due to the GPU leader’s beat-and-raise quarters.
Source: TradingView
There are two reasons why this matters – which we also outlined in our analysis “Five Stocks (Not Seven) Can Lead to New Highs” from October – that “a handful of these stocks [the Mag 7] can push the bigger markets higher,” but now we’ll need more than just three to keep the rally going.
First, these 7 stocks hold a significant weighting within the indexes. It will be difficult for a sustained push higher to continue if these FAANGs do not participate, considering their outsized weighting.
The Mag 7 comprises more than 40% of the Nasdaq 100 and more than 29% of the S&P 500.
MSFT, GOOGL, AAPL, and TSLA account for about 18% of the S&P 500 and about 25% of the NASDAQ-100.
For reference, just Apple and Microsoft combined hold a larger weighting in the S&P 500 than Berkshire Hathaway, JP Morgan, UnitedHealth Group, Visa, Exxon, Mastercard, Johnson & Johnson, Procter and Gamble, Home Depot, Costco, Merck, and Chevron combined. If these companies collectively all stalled, it would be a major warning sign. Yet, Apple and Microsoft are both stalling.
Sign up for I/O Fund's free newsletter with gains of up to 221% – Click hereClick hereClick here
Secondly, when the cycle leaders start to underperform, it tends to mark the start of a trend change. The FAANGs have been the undoubted leaders of this bull run, and we are now seeing them start to trend lower against the indexes. More times than not, the leaders on the way up, tend to be the leaders on the way down.
In today’s bull cycle, this leaves Nvidia, Meta and Amazon as the three remaining generals making new highs with the markets.
Nvidia, Meta and Amazon are the three remaining generals making new highs with the markets. Source: TRADINGVIEW
Combined, the trio account for approximately 15.8% of the Nasdaq 100 and 10.8% of the S&P 500. Nvidia’s post-earnings surge, in which the chip giant added nearly $250B in value, helped the S&P 500 add more than $2 trillion in market cap as it boosted other AI and tech stocks in general. Should the trio begin to follow in the path of the four fallen dominos, setting a high and drifting lower, the market may be at risk of giving up some of its newfound gains, similar to what we had discussed in our analysis “Apple Can’t Save This Tech Rally” at the end of January. In this, we outlined how both the bull and bear cases for the market “are calling for a level of volatility in 2024 that will, at least, retrace the rally we’ve seen since November 2023.”
Concentration Risk Elevated
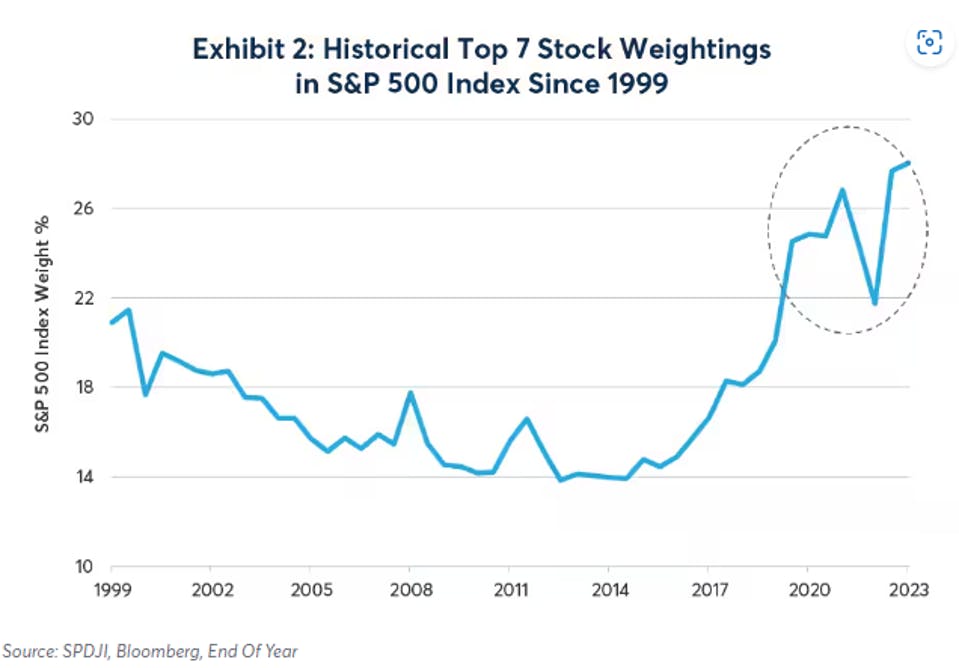
To an extent, the narrow leadership of this market stemming from the Magnificent 7’s AI-powered gains has raised warning bells for some investors, as the market’s concentration has surpassed levels seen in the dot-com bubble. To be clear, my firm is a pioneer in building an AI portfolio, and a selloff would be a buying opportunity. However, narrow leadership is a problem not to be ignored, and this is best illustrated by the chart below:
Source: CME
As mentioned earlier, the Magnificent 7 account for more than 29% of the S&P 500, more than the 21% concentration of the top 7 stocks in the S&P 500 seen in 1999 and 2000 — keep in mind that Tesla is no longer one of the top 10 largest stocks in the S&P 500, so the concentration of the top 7 today is above 30%. This also marks a dramatic increase from the 14% concentration seen a decade ago.
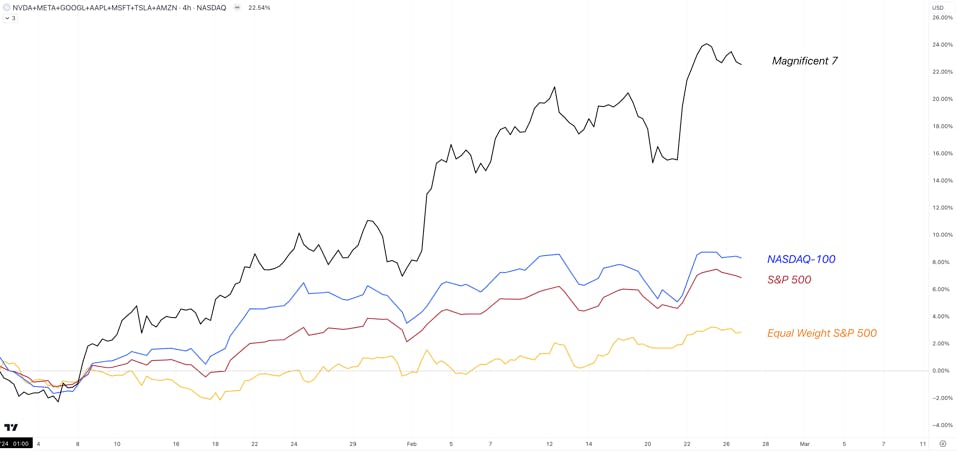
What this means is that as the Magnificent 7 as a whole continue to outperform – the seven have already gained more than 22% YTD in 2024 – they will continue to cover up the turbulence in the broader market that is brewing under the surface. For example, at the end of February, the Nasdaq 100 and S&P 500 are up nearly 9% and over 7%, respectively, while the equal-weighted S&P 500 has gained just over 2%.
Source: TradingView
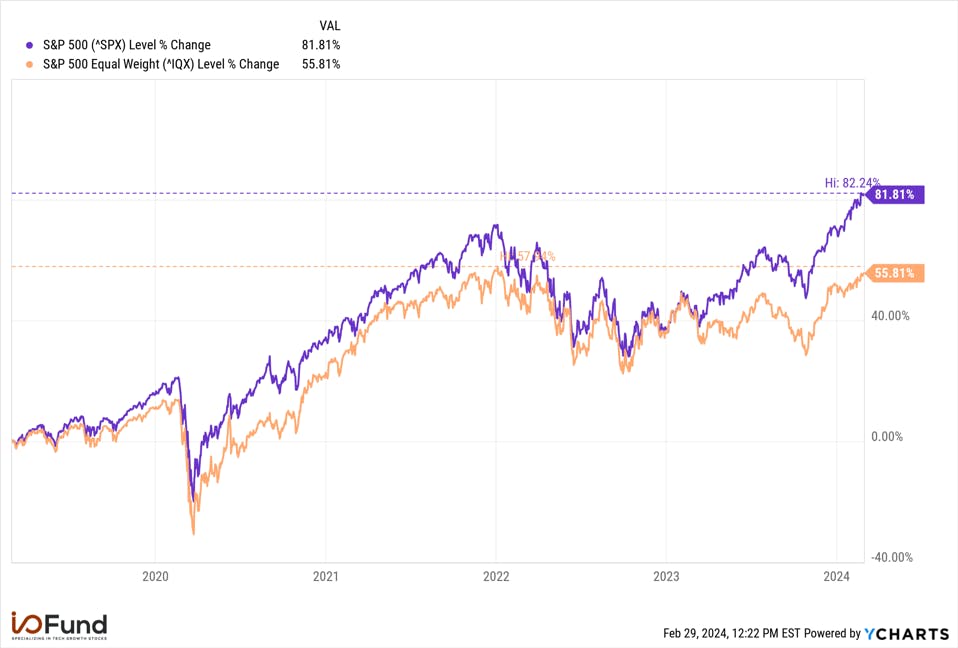
This concentrated dominance has helped the S&P 500 push to new highs, more than 6% above its 2021 high, while the equal weight S&P (orange) has yet to reclaim that 2021 high, sitting about 100 points lower. The influence of the Magnificent 7 is clearly visible — the S&P 500 has a 26 percentage point outperformance of the equal-weight index, returning 81% versus 55% over the past five years; this gap has widened throughout 2023, from 8 percentage points in April to 14 percentage points in July to 20 percentage points in October.
Source: YCharts
I/O Fund Portfolio Manager Knox Ridley outlined in our analysis in October, 5 Stocks (Not 7) Can Lead To New Highs that “a handful of these stocks [the Mag 7] can push the bigger markets higher, and even potentially make another high in the NASDAQ-100.” The setup was that the indices were “due for a sizable bounce over the coming weeks – months, which we believe will be led by a handful of Big Tech names.” Now that we are at new highs, we think we will need more than just three of the Mag 7 to keep going.
Every Thursday at 4:30 pm Eastern, the I/O Fund team holds a webinar for premium members to discuss how to navigate the broad market, as well as various stock entries and exits. We offer trade alerts plus an automated hedging signal. The I/O Fund team is one of the only audited portfolios available to individual investors. Learn more here.Learn more hereLearn more here.
Valuations Relatively Intact
Though the recent momentum-filled surges in AI favorites including Super Micro and Nvidia have some investors drawing parallels to Cisco’s ascent in 2000, valuations for the Magnificent 7 are relatively intact.
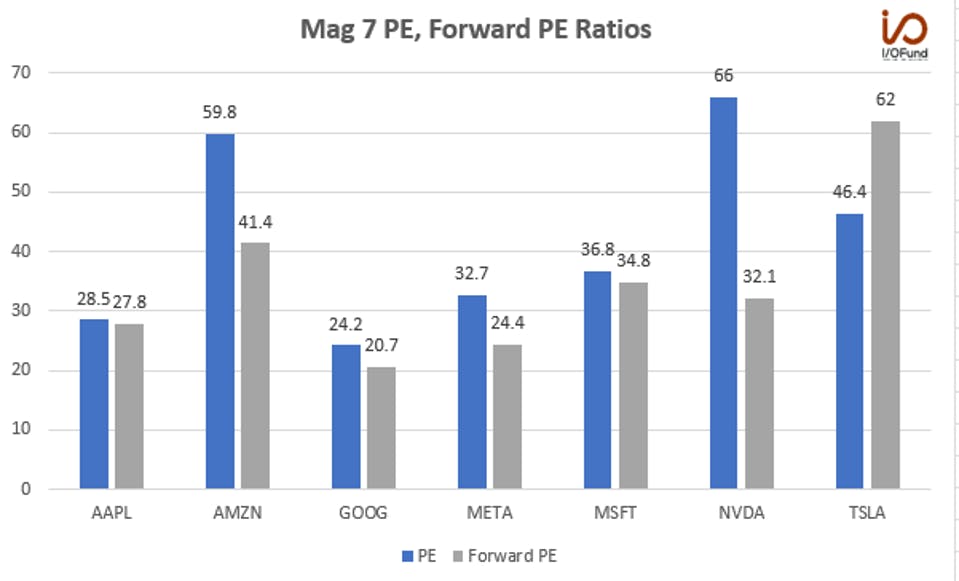
Tesla is struggling with earnings growth as price cuts bite margins, while Apple’s growth headwinds are leading to minimal earnings growth; on the other hand, Amazon is showing strong earnings leverage from improvements in its margins, Google is trading at a near 30% discount to its year-ago PE of 30x, and Nvidia is eerily cheaper now than it was when it had bottomed in October 2022 in the low $100 range.
Source: YCharts
Compare this to Cisco, given the parallels being drawn, which traded at more than 150 times earnings at the peak of the dot-com bubble – or more than twice as high a multiple as the most expensive of the Mag 7 of today.
We discussed on Fox Business News this week that keeping an eye on valuation is important for determining which stocks to buy on dips. The impact AI has had is very visible on the top line with blowout quarters from Nvidia, and on the bottom line with blowout quarters from both Nvidia and Meta. However, AI’s impact on valuations is being overlooked as these valuations are low and setting up a new buying opportunity should the broad market present weakness.
Conclusion
We will continue to track how the Magnificent 3 perform over the next few weeks, and whether Meta, Nvidia, and Amazon will continue to lead or if they will follow the trend of the remaining four in underperforming versus the broader indices.
When these cycle leaders start underperforming, it usually marks the start of a trend change. The FAANGs undoubtedly have led this bull run since 2023. We are now looking for what will lead the market next, and most importantly, when.
If you own AI stocks or are looking to own AI stocks, consider joining us for our next broad market webinar. Every Thursday at 4:30 pm Eastern, the I/O Fund team holds a webinar for premium members to discuss how to navigate the broad market, manage risk, as well as revealing our various long-term game plans regarding stock entries and exits. We offer trade alerts plus an automated hedging signal. The I/O Fund team is one of the only audited portfolios available to individual investors. Learn more here.
I/O Fund Portfolio Manager Knox Ridley and I/O Fund Equity Analyst Damien Robbins contributed to this report.
Please note: The I/O Fund conducts research and draws conclusions for the Fund’s positions. We then share that information with our readers. This is not a guarantee of a stock’s performance. Please consult your personal financial advisor before buying any stock in the companies mentioned in this analysis.
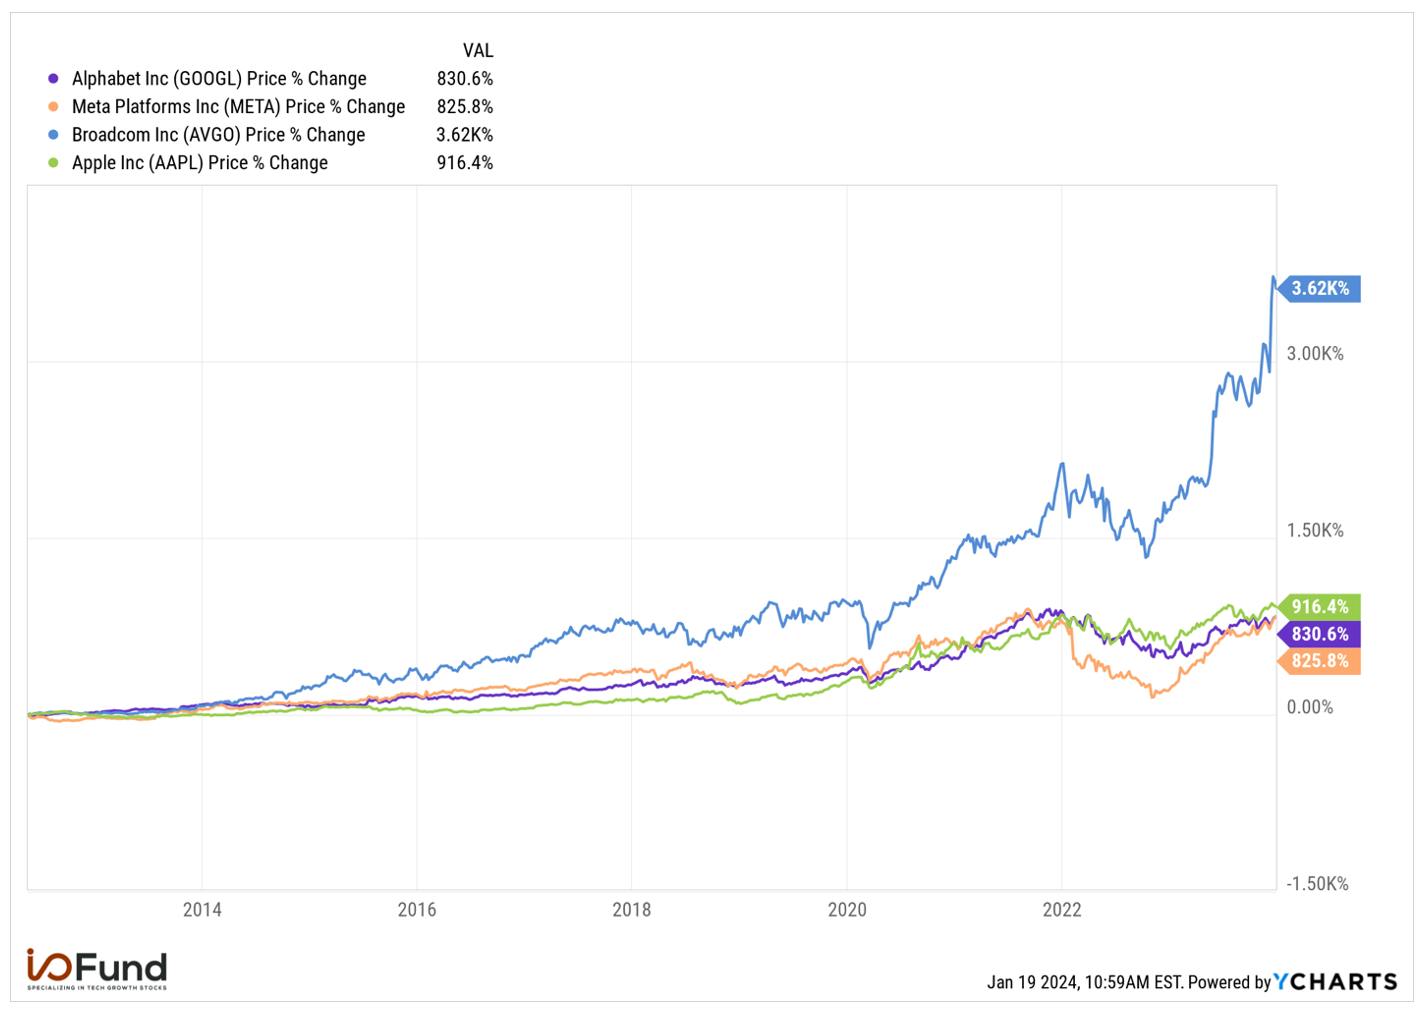
Broadcom has greatly outperformed the FAANGs over the past decade yet is rarely discussed as one of the market’s top-performing stocks. The ticker certainly does not participate in a catchy acronym. Half the battle with Broadcom is there are many revenue segments to analyze, some go through harsh cyclical downturns, and it acquires companies hand over fist. To put it plainly, this is not an easy stock to cover; there are no pithy ways to summarize the products and it doesn’t offer growth stock qualities.
Broadcom is reporting the second highest AI revenue on the stock market today, accounting for 16.1% at $1.5 billion, up from the July quarter at $1 billion and 11.3% of revenue. Of the smaller players, peers like AMD have guided for AI revenue of $3.5 billion in 2024, which would account for about 13.6% of the 2024 estimated revenue. Marvel expects AI revenue of $400 million in 2023 or 7% of revenue and is rising to $800 million or 13% of the expected 2024 revenue. Therefore, Broadcom is in second place, but notably, does not have a large lead by percentage of revenue. Juniper at 23.5% of revenue has a higher percentage yet is being acquired by HPE.
Ultimately, our goal is to get this stock lower, but to put into motion now the in-depth research required for a potential entry. As stated in the 2023 Year in Review webinar, Meta was the one that got away given its bottom line fits our criteria, but I consider Broadcom the one sitting in plain sight.
Broadcom has many departments that have been strung together through acquisitions with a vision of consolidating Ethernet, ASICs and now virtualization under one company. The reason this company is sitting in plain sight is because it was a major winner from the mobile era, is partnered with Big Tech as we move in the AI era, and is putting together the pieces to participate in AI strategically by not needing to compete on GPUs.
Broadcom’s Switch Products and Switch Fabric
Broadcom has a dominant market share of switching and routing semiconductors for hyperscalers and is seeking to maintain its market share, most especially as AI changes networking requirements. The Jericho3-AI launch was last April, which is a redesign intended to compete with Nvidia’s InfiniBand.
Broadcom has three switch products. The Tomahawk is the high-bandwidth switch platform, Trident is the platform with more features, and the new Jericho line combines the Jericho switch with routing ASICs. The Jerico3 was redesigned with deep packet buffers. Tomahawk and Trident are used in data centers yet are not optimized for AI workloads, especially when compared to InfiniBand.
Jericho has 160 switch ports dedicated to switch fabric, which allows multiple ASICs to be stitched together to support GPU clusters. The asymmetric split helps the chip overcome network congestion and network failures. According to Broadcom, Jericho3-AI performed 10% better than “alternative network solutions” — which is a clear reference to InfiniBand.
A few specs before we go deeper into how Broadcom’s solutions compare to Nvidia’s. As you’ll note, the specs for InfiniBand are superior with support for 64X 400Gbp or 128 200 GB/s ports compared to Jericho’s 36X 400 GbE and 72X 200GbE network-facing ports.
Jericho has 144X SerDes lanes and 106Gpbs PAM4 supporting 18X 800Gbe, 36X 400 GbE and 72X 200GbE network-facing ports. The Jericho3-AI allows for more than 32,000 GPUs to be linked for a massive AI training system and links directly to GPUs without the need for a server bus.
Tomahawk5 runs at 100 GB/second with PAM4 with aggregate bandwidth of 51.2 Tb/s
Compare this to Nvidia’s Quantum-2 InfiniBand which has support for 64X 400Gbp or 128 200 GB/s ports with 51.2 Tb/s and 66.5 billion packets per second.
Nvidia’s new Spectrum X Platform is an Ethernet solution that delivers 1.6X better networking performance than traditional Ethernet with 256X 200 Gbe ports or 16,000 ports for larger training systems.
On a similar note, and while we are on the topic, Marvell has some skin in the game too by offering a 51.2T switch called Teralynx 10 that offers ultra-low-latency at 80% cost savings. According to Moor Insight Strategy, Marvell is the supplier for AWS for “electro-optics, networking, security, storage, and custom-designed solutions.”
Marvell’s Nova 1.6 Tbps PAM4 electro-optics have eight 200G lanes that “double the networking bandwidth while reducing power and cost per bit by 30%.” According to the press release, “by doubling the bandwidth per lambda, the Nova-based modules reduce the number of lasers and related optical components by 50%.”
Marvell hopes to help data centers transition to 51.2 Tbps networking architectures by offering a platform that needs 32 optical modules instead of 64 optical modules.
Here’s a a quick glance on the rankings for AI networking revenue (approx. revenue)
Nvidia in first place with $2.5B per quarter from InfiniBand
Broadcom in second place with $1.5B from AI, primarily networking
Marvell at $200M per quarter from AI, primarily networking
Juniper Networks reported $321.2 million in the AI enterprise segment, or 23.5% of revenue. Recently, it was announced that Juniper is being acquired by HPE.
Further out in FY2025 and/or CY2025:
Cisco is expecting $1 billion in orders from a recent Nvidia partnership, per the earnings call: “our expectation is the majority of that $1 billion in orders will turn into revenue in our fiscal '25, just to be clear.”
Arista is expecting $750 million by 2025: “We are cautiously optimistic about achieving our AI revenue goal of at least $750 million in AI networking in 2025.”
AI Networking
We’ve covered networking as it relates to data centers, 5G, cloud applications and enterprises when we wrote about Nvidia’s acquisition of Mellanox in 2020 and Marvell’s acquisition of Inphi.
A few years back, we discussed that Nvidia acquired Mellanox for the strategic synergy that InfiniBand and Ethernet can provide in boosting GPU performance. Without proper interconnection, GPU performance could be limited, and so Nvidia strategically wanted to create the best-case scenario of owning both markets for AI accelerators — and their fabric and interconnects.
Mellanox supports Virtual Protocol Interconnect (VPI), which allows the ubiquitous Ethernet to provide bandwidth as cheap as possible, and InfiniBand to deliver higher throughput and fewer bottlenecks during high loads. In 2019, the split in Mellanox’s revenue was about 40% InfiniBand and 60% Ethernet. By leveraging a hybrid of Ethernet and InfiniBand, Mellanox was able to take market share from Ethernet incumbents.
The acquisition went under review in China, with officials believing Mellanox’s market share at the time was about 55% to 60% of the global interconnect market and 80% to 85% of the Chinese market. This illustrates how popular Mellanox was before Nvidia acquired the company.
The outcome of the review was that Nvidia was required to decouple the sale of InfiniBand from the sale of its GPUs to where a customer could buy one but not the other at no penalty. Even if a customer can buy them separately, there are many cases where it’s not practical to do so, such as with the DGX and HGX systems which achieve optimal performance with the A100s/H100s and InfiniBand.
Nvidia has stated that InfiniBand increase the effectiveness of AI infrastructure by 20% to 30%. Remote Direct Memory Access (RDMA) reduces CPU overhead by offloading data movement to network adaptors. In addition, Ethernet has quality of service (QoS) flow control and advanced error handling mechanisms that increase its network efficiency capabilities.
In the last earnings report, Nvidia stated in the opening remarks that “Networking now exceeds a $10 billion annualized revenue run-rate. Strong growth was driven by exceptional demand for InfiniBand, which grew fivefold year-on-year […] Azure uses over 29,000 miles of InfiniBand tabling, enough to circle the globe.”
The software defined fabric is popular for its low latency as its architecture reduces packet loss, high bandwidth and low management costs. The high-speed data transfer has link speeds of 10 to 400 gigabits per second due to its low overhead and efficient transport protocols, which is why InfiniBand is adopted by supercomputers and also AI/Big Data applications with high performance clusters. Due to very low latency, InfiniBand delivers real-time data transfer.
The $10 billion in annualized revenue run-rate reported by Nvidia in the Q3 October quarter represented 500% growth, which is nearly double the growth rate of the overall data center. Per the Q3 earnings call: “Networking now exceeds a $10 billion annualized revenue run-rate. Strong growth was driven by exceptional demand for InfiniBand, which grew fivefold year-on-year [..]” At the time, the data center had a run rate of $60 billion, so networking was 16.6%. In Nvidia’s most recent quarter, networking grew 155%.
According to Del’Oro, a research company out of the UK, AI systems account for less than 10 percent of the total addressable market for network switching, and of that, 90 percent are using Nvidia/Mellanox InifiniBand due to InfiniBand reducing packet loss, which is ideal for AI training workloads.
If right now, you’re thinking: “I thought this analysis was about Broadcom, not Nvidia!?” then that’s a fair question. Given AI networking is heating up across the board (Nvidia’s run rate, Broadcom, Juniper/HPE, Marvell, Cisco potentially, Arista), it’s important we touch on why Infiniband owns 90% of the AI market right now. We are overdue on revisiting Mellanox/InfiniBand as it’s been four years since we covered the acquisition. This also helps frame how Broadcom intends to compete with Ethernet.
Ethernet Vs InfiniBand
I wish I could make networking more conversational, but it’s pretty challenging to do that! Here are some bullet points on how the two compare; I’ve bolded the more important takeaways:
Benefits of Ethernet:
Raw bandwidth is a benefit with Ethernet hitting 51.2 Tb/s two years ago with support for 800 Gb/s port speeds. InfiniBand lags by topping out at 51.2 TB/s with 400 Gb/s port speeds. Although typical server nodes do no need the extra bandwidth, AI clusters come with 400 Gb/s NIC per GPU with some nodes having four to eight GPUs. By 2025, Dell’Oro believes switch ports for AI networks will be operating at 800 Gb/s and will further double to 1600 GB/s by 2027. Dell’Oro believes switch ports for AI networks will be operating at 800 Gb/s and will further double to 1600 GB/s by 2027.
smartNICs and AI-optimized switch ASICs help to reduce packet loss
Large pool of vendors whereas InfiniBand increases dependency on Nvidia.For this reason, AWS and Google Cloud have remained on Ethernet as they prioritize custom silicon.
Ethernet is the incumbent networking standard and most cloud providers have invested heavily here already. With Ethernet, providers don’t have to manage a new network stack.
Ethernet switching has evolved to where a new term has been coined “lossless” Ethernet. Even Nvidia is moving in this direction with their Spectrum X platform, due out this year.
Benefits of InfiniBand:
Outperforms for AI/ML workloads due to low latency and by reducing packet loss. Data packets are sent in a serial approach so multiple channels of data can be sent simultaneously. This is much better for AI/ML than a parallel approach for internal data flow, which creates bottlenecks.
Has 3X to 4X lower latency than traditional Ethernet switches based on ASICs
Highly scalable, can support tens of thousands of nodes per subnet. InfiniBand is also cheaper as it requires fewer connections for reliability.
Its QoS and failover capabilities are a reason it’s adopted for high-performance computing environments.
Reduces CPU resources
So, why is Ethernet Making a Comeback?
Broadcom’s Jericho3-AI has some promising benchmarks that could help shift the dominant market share InfiniBand has in AI networking (or at least prevent a monopoly). These benchmarks showed the Jericho3-AI outperforming InfiniBand by 10%, which is substantial when dealing with AI systems as it’s enough to increase the collective operations of the system.
“Leveraging this unique functionality, the Jericho3-AI fabric provides at least 10 percent shorter job completion times versus alternative networking solutions for key AI benchmarks such as All-to-All. This performance improvement has a multiplicative effect on decreasing the cost of running AI workloads since it implies that expensive AI accelerators are used 10 percent more efficiently. The network, in effect, pays for itself.” — You can read the press release here.
This means bare metal can work more effectively. Per Broadcom: “because it can handle 800Gbps port speed (for PCIe Gen6 servers) and more, it is a better choice [than InfiniBand.” At high price points, all hyperscalers want to see their investments working at maximum clock times. This is achieved by better load balancing and congestion control to improve network latency, whereas InfiniBand reduces port and hop latency inside the switch. Broadcom calls their product differentiation “Perfect Load Balancing” and “Congestion-Free Operation.”
A note on PCIe
The maximum bandwidth supported by PCIe 5.0 is 400Gbps per port. By using 106Gbps PAM4 SerDes, ASICs can be tuned to support 100, 200 and 400 Gbps port speeds. To work around this, and to achieve 800Gbps, chip makers are building NICs directly into the accelerator. According to The Register, the 800Gbps ports built into accelerators may reduce bottlenecks before PCIe 6.0 arrives on the market. The Register, the 800Gbps ports built into accelerators may reduce bottlenecks before PCIe 6.0 arrives on the market. This is what Broadcom is referring to.
Jericho3-AI supports 36 ports at 400 Gbps speed, and this can support Nvidia’s powerful DGX H100, which have 8 ports of 400 Gbps speed. In this case, four node racks are within Jericho’s capabilities. However, the Quantum-2 InfiniBand can handle 64 ports of 400Gbps, and so for Nvidia’s GPUs, it outperforms. Broadcom’s answer to this is that AWS and Google still prefer to not have vendor lock-in with Nvidia and use the Jericho3-AI to make use of their extensive Ethernet systems.
Overview of Custom Silicon (ASICs):
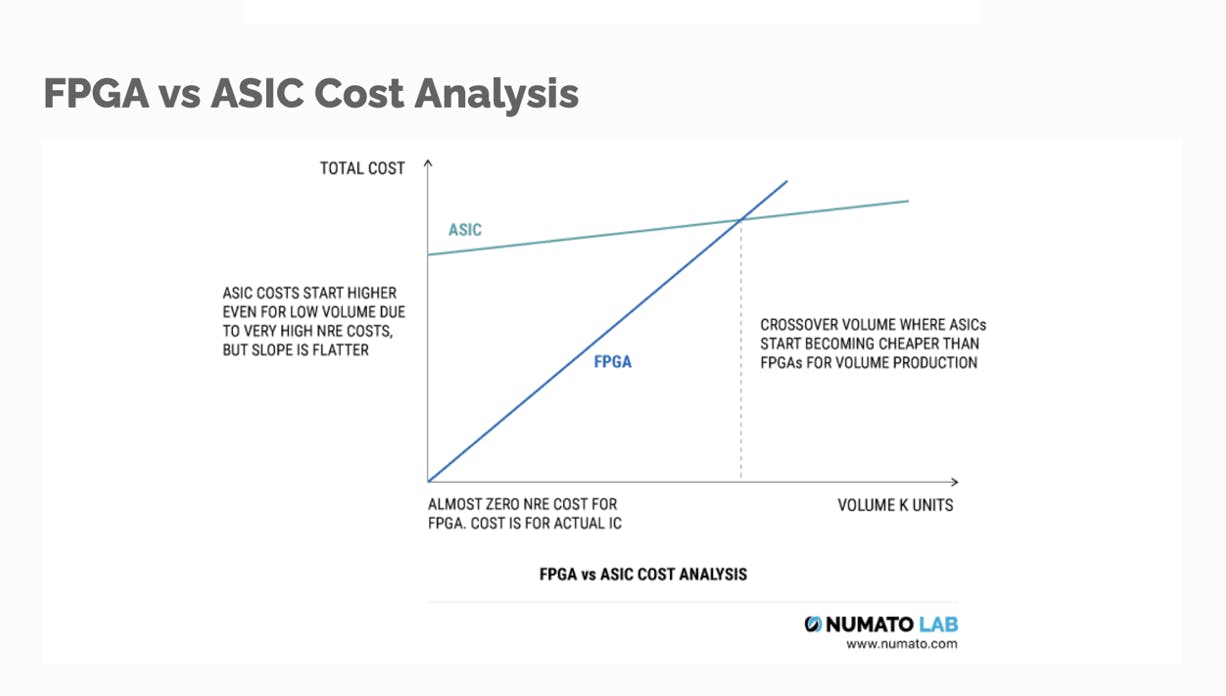
In addition to AI networking, Broadcom participates in the custom silicon market. ASICs are application-specific integrated circuits that are customized to perform a specific function for a specific application, hence the term “application-specific.” This is in contrast to GPUs which are more general-purpose. ASICs are expensive at the onset, yet become cheaper with volume production. We first published this graph in 2019 but the comparison still applies:
For now, custom silicon only makes sense for a company with deep coffers that has immensely popular applications – such as Google, Meta, Amazon. These companies use custom silicon to drive down costs on GPUs for their most popular applications. Across ASICs, the most well-known is Google’s tensor processing unit (TPU).
Google was one of the first to require low-power machine learning workloads for Search, YouTube and Google Maps. The compute intensive workloads were running on Nvidia’s GPUs for both training and inferencing until Google made their own processing unit, TPUs, to perform workloads at a lower cost and higher performance.
Performance between TPUs and GPUs is often debated depending on the current release (A100 versus fourth-generation TPU, for example). In some cases, TPUs have better performance per watt for power-constrained applications. Notably, some of this comes with the territory of being an ASIC, which is designed to do one specific application very well whereas GPUs can be programmed as a more general-purpose accelerator. In this case, the benchmarks where TPUs compete are object detection, image classification, natural language processing and machine translation — all areas where Google’s product portfolio of Search, YouTube, AI assistants, and Google Maps, for example, excels.
Notably, TPUs are used internally at Google to help drive down the costs and capex of its own AI and ML portfolio and they are also available to users of Google’s AI cloud services. For example, eBay adopted TPUs to build a machine learning solution that could recognize millions of product images.
Unless Google releases an internal technology as open-source, it won’t be adopted by the competitors. This is where Nvidia’s neutral position as traditionally a hardware company becomes a positive as it’s universally used by Amazon, Microsoft, Google — — and Alibaba, Baidu, Tencent, IBM and Oracle. Meanwhile, TPUs create vendor lock in (with a direct competitor) which most companies want to avoid. eBay is the exception here as the company needs Google-level object detection and image classification.
Why ASICs are Not a Near-Term Threat to GPUs
AI investors will need to get comfortable hearing about the battle between ASICs and GPUs. This debate has been going on since at least 2018, when Nvidia’s biggest threat was thought to be Google’s custom TPUs. There is some merit to these concerns as the largest customers for Nvidia’s GPUs have enough cash to make custom chips. There’s roughly $35B to $40B per Big Tech company per year that executives will naturally want to optimize to drive down costs.
To program ASICs is difficult, and they are application-specific, which means they cannot be reconfigured. Nvidia is wildly popular because GPUs are easy to program and are the best choice for a wide range of applications. Developers create the moat, which was our original Nvidia thesis. Therefore, I don’t believe there is much risk that Big Tech commercializes AI accelerators.
However, it’s quite plausible that someday Big Tech will reallocate capex toward more ASICs and fewer GPUs to where it will impact Nvidia. For now, demand outstrips supply, and there are long lead times for Nvidia’s GPUs. If a company like Google reallocates to more TPUs, another enterprise will certainly step up to fill those orders.
Broadcom & Google Partnership
It was confirmed last year that Google is a customer of Broadcom for its ASICs (TPUs). This was officially reported when The Information wrote an article stating Google wanted to ditch Broadcom in 2027, which Google has since denied:
“We are productively engaged with Broadcom and multiple other suppliers for the long term. Our work to meet our internal and external cloud needs benefit from our collaboration with Broadcom; they have been an excellent partner, and we see no change in our engagement." -Google’s response to The InformationGoogle’s response to The Information
Prior to this, it was never directly stated that Google was Broadcom’s main ASICs customer. Here is how Broadcom discussed it: “As you know, we supply a major hyperscale customer with custom AI compute engines. We are also supplying several hyperscalers a portfolio of networking technologies as they scale up and scale out their AI clusters within their datacenter.”
The following has also been stated about the Google-Broadcom relationship: “Broadcom supplies wireless chips for Google phones as well as chips for its data center and cloud services. At the same time, Broadcom is one of Google Cloud’s biggest customers for its cloud products. This bidirectional relationship has also forged a special bond." Per the same report, Meta is also working with Broadcom on ASICs, although does not deploy many of these “yet”
Last April, Broadcom migrated its infrastructure from AWS over to Google Cloud. Per the announcement: “Broadcom, a provider of enterprise security solutions, recently worked with Google Cloud Consulting to migrate its infrastructure from Amazon Web Services (AWS), and found the combination of technology and expertise critical for success. “Google's deep technical skills and its data, security and AI offerings have accelerated our transformation towards becoming a software-led company,” said Andy Nallappan, Vice President, CTO and CSO, Broadcom.
VMWare –Software-Defined Networks and Data Centers
In November, Broadcom closed its acquisition of VMware for $69 billion. VMWare is virtualization software that virtualizes compute and data centers. The software creates an abstraction layer, or a “hypervisor” which is the technical term for a computer or server that runs virtual machines called ESX. VMWare was the first company to virtualize x86 machines and was founded in 1998. Operating systems, such as Linux, Windows and MacOS, can share the same, virtualized resources by running on a x86 machine.
Over the past decade, VMware pivoted to offer a software-defined data center. On the most recent earnings call, Broadcom discussed building essentially a private cloud on-premise, which has some advantages, such as lowering capex by pooling memory, security, networking and server resources. “Our strategy going forward is simply to enable global enterprises to run their applications across the other data centers as well as on public clouds by consuming VMware’s higher-value software stack.”
Later it was stated: “We are creating with VMware, the same experience of virtualization of the data center on-prem for those companies, which has workloads, by the way, that are already running VMware products that application that’s already written on VMware Cloud Foundation. This is then giving these enterprises the opportunity to have a hyperscaler on-prem. That’s the plan we’re doing, plain and simple.”
Where software defined networks have seen quite a bit of success is with 5G networks. SDNs separate the control plane on embedded switching systems. This allows the networks to be managed remotely. Products from different suppliers can be used without incompatibility issues. By using open APIs, the 5G market has benefited from a more neutral ecosystem by allowing products from different suppliers. This is because SDNs allow network functions to be programmed by APIs instead of proprietary interfaces.
In 2012, VMWare acquired Nicera to create VMware NSX, virtual networking and security software that virtualizes network components. The NSX products, including NSX-T data center, programmatically creates and manages virtual networks from Layer 2 to Layer 7, which is defined as switching, routing, access control, firewall and QoS. NSX Manager and transport nodes can be assembled in seconds for proof-of-concept deployments, deployments with up to 64 hosts, or large-scale environments. Software-defined networks have a natural synergy with Broadcom, the leader in networking hardware.
A few years ago, VMWare expanded to virtualize containerized workloads for Kubernetes clusters. This product is referred to as Tanzu. This was a necessary evolution to keep cloud native customers. Many Kubernetes clusters use something called a multi-tenancy solution, which is to have non-connected “tenants” use a common pool of resources. This can be hard to implement correctly, and also has limited functionality once it’s set up. Virtualized containers are similar to a single-tenancy solution by having its own API server, controller manager and storage for data. Yet, it’s similar to a multi-tenancy solution by using a common pool of resources. Per the Broadcom earnings call: “And to attract and keep these workloads across the environment, we are investing in a rich catalog of microservices tools. This will be our focus. And the noncore businesses of end-user computing and Carbon Black will be divested.”
All of this sounds good, but virtualization is not a wild success. The software defined data center market at one time was expected to reach $77 billion by 2020 but instead has only reached $28 billion as of 2023. There are many vendors in the space, which creates pricing wars.
And so, it’s speculative as to how the software defined data center or networks would ultimately accelerate in growth based on AI workloads. The anticipated acceleration is mainly from restructuring, rather than product-market fit. This is what management said on the earnings call: “And it just doesn’t stop there because it’s the math and the trajectory. And to answer your question, you’re right, we are accelerating from $12 billion, and we’re probably seeing a double-digit growth for the next three years, just by sheer math of selling that higher value virtualization stack versus the very loose component sales in the past, particularly on compute only.”
There was a solid question about this in the Q&A which I’m quoting in full below.
Harlan Sur:
[…] but given the significant performance requirements of these workloads, right, training, inference, it appears that more of the near-term adoption of running these workloads is on bare metal, GPU, TPU, accelerated servers. So, how is the team exploiting a software-defined data center solutions via either cloud foundations or Tanzu to try to help customers focus on AI sort of drive better utilization, better economics, faster deployments on this very fast growing part of the market?
Hock Tan, CEO:
Well, as you may be aware, in the last VM Explore in Las Vegas, VMware came out and announced in partnership with NVIDIA, the VMware Private AI Cloud Foundation. Another way of describing it is, the VMware Cloud Foundation Software Stack, the whole VCF stack runs NVIDIA coder, runs the NVIDIA GPU. That is the partnership. So, if you’re an enterprise, it’s a very easy step to get into gen AI analytics because the data center that you as an enterprise own on-prem that runs VCF will by default run the NVIDIA GPU software stack as well.
Another way to put it, it virtualizes the NVIDIA GPU. That’s the VMware software stack as well. So it’s a very strong attraction in our — from our perspective to, in fact, accelerate thinking of a lot of enterprise to adopting the whole VCF site. It’s simply because not only does it virtualize the data centers and make your data on-prem data center much more resilient, easier to manage, lower cost to manage, it has the added benefit, a big attraction this is of being able to right away start running AI workloads
Broadcom’s Financial Overview:
Broadcom consistently delivered a net profit margin exceeding 37% throughout fiscal year 2023. Additionally, Broadcom demonstrates exceptional cash flow generation, with free cash flow exceeding 44% in each quarter of FY2023 and even surpassing 50% in the last three quarters.
Broadcom's acquisition of VMware in November 2023 is intended to bolster the company's position in the AI space, while also strengthening its software business. Secondly, the merger will eventually create recurring revenue streams, which once complete, will be a positive. Furthermore, this acquisition diversifies Broadcom's portfolio, with infrastructure software projected to account for roughly 40% of FY2024 revenue compared to 21% in FY2023. This shift mitigates the impact of cyclical downturns inherent to the semiconductor industry.
The integration process is expected to take a year and will initially have a drag on profit margins due to transition costs and VMware's lower margin profile, cost-cutting measures and merger synergies are anticipated to improve margins in the long term.
When an acquisition is complete, it typically weighs on stock price while investors move to the side lines to see how the teams merge internally and also externally for customers. Unfortunately, the VMware acquisition is not going too well with rumors that customers are disgruntled alongside Broadcom spinning off non-core segments and selling them off to other companies.
That complicates the picture as it requires understanding the precise impact of each segment independently, which is impossible to do given cloud companies tend to cross-sell products. It's also important to note that Broadcom is transitioning VMware clients to a subscription-based business. Per the earnings call: “[…] and we are converting more and more customers step-by-step as they come up for renewal into this higher value stack, and we’re doing it on a subscription basis. So become very focused. So we will kick it off at a much lower rate — because subscription generally brings down revenues, as you know, in software based on revenue recognition. But we see a trajectory of accelerated growth even in 2024 — through 2024. And it just doesn’t stop there because it’s the math and the trajectory. And to answer your question, you’re right, we are accelerating from $12 billion, and we’re probably seeing a double-digit growth for the next three years, just by sheer math of selling that higher value virtualization stack versus the very loose component sales in the past, particularly on compute only.”
When looking at revenue growth, it’s important to strip out VMware’s contribution post-acquisition. Management is firm in the earnings calls that the VMware will accelerate. If this comes to fruition, the Street will likely reward Broadcom as VMware is the primary risk given the synergy of the rather large acquisition ($60 billion) is unproven. However, due to the uncertainty around restructuring the VMware acquisition, time is on our side to try to get AVGO at a lower price.
Broadcom’s Revenue and EPS:
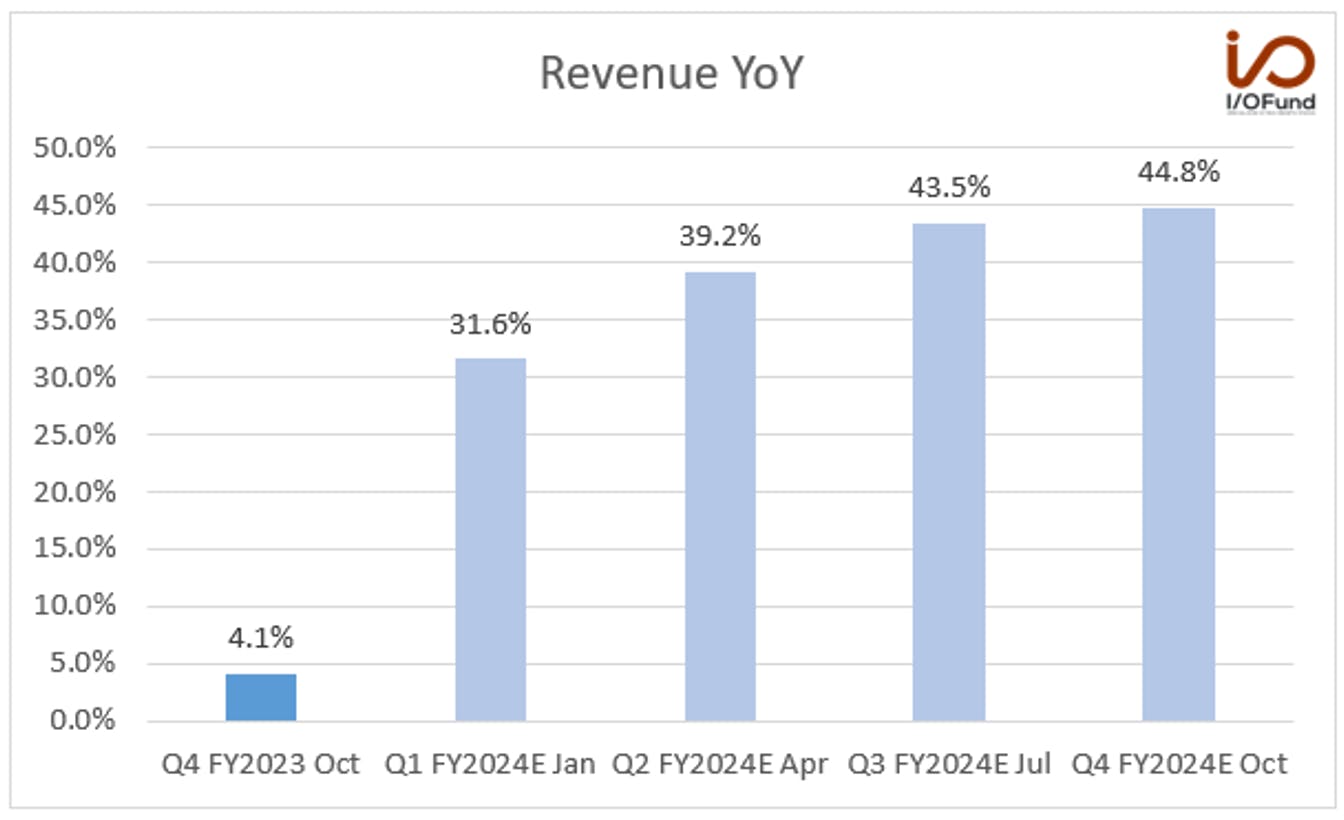
Broadcom’s revenue in the Q4 FY2023 ending Oct grew by 4.1% YoY to $9.3 billion. Revenue was in line with the analyst consensus.
Analysts expect revenue to grow 31.6% YoY to $11.73 billion in the next quarter. Since the company completed the acquisition of VMware on November 22, 2023, these estimates include VMware’s revenue. Headline revenue numbers are expected to accelerate for the next four quarters due to VMware and then will re-acclimate in the January 2025 quarter at 16.4% growth. These quarters are likely to be watched closely due to reasons outlined above, which is that it will be apparent and quite easy to model VMware’s impact.
Organic revenue, excluding the VMware acquisition, represents a 6.1% YoY growth for FY2024 ending in October, down from 7.9% in FY2023 due to the cyclical slowdown in the semiconductor sector. See more discussion on this below.
However, the company will see a higher growth rate in FY2025 at 10.9% YoY for $55.28 billion. The growth rate is helped by an increasing contribution from AI. Management stated in the earnings call that revenue from generative AI will grow from 15% in FY2023 to more than 25% in FY2024. The company’s CEO, Hock Tan, said in the earnings call, “Revenue from generative AI in fiscal ‘23 reached 15% of semiconductor revenue, in line with our expectation. And moving on to fiscal ‘24, we forecast semiconductor solutions revenue to be up mid- to high-single-digit percent year-on-year. We expect revenue from generative AI to represent more than 25% of the semiconductor revenue, consistent with prior guidance, which more than offset the lack of growth from non-AI semiconductor revenue.”
Management chose to not provide quarterly guidance, and to instead provide FY2024 guidance of $50 billion, representing YoY growth of 39.6% at the mid-point. This is a break in style as quarterly guidance is typically given. Here is what was said on the call: “Now on to guidance. As Hock discussed, with the recent closing of our VMware acquisition and the integration process, which will take at least one year, for fiscal 2024, we will provide our outlook for the full year instead of quarterly guidance. Based on current business trends and conditions, our guidance for fiscal year 2024 is for consolidated revenues of $50 billion. Within this, our fiscal year 2024 semiconductor revenue is expected to grow mid- to high-single-digit percent year-on-year. Our fiscal year 2024 infrastructure software segment revenue from continuing operations is expected to be $20 billion, including $8 billion from CA, Symantec Enterprise and Brocade and $12 billion from VMware.”
Management mentioned that VMware’s 11 months expected contribution from the time the acquisition is closed is $12 billion for the FY2024 ending October.
Pictured Above: Revenue includes VMware acquisition. Organic revenue, excluding the VMware acquisition, is expected to be 6.1% YoY growth for FY2024 ending in October, down from 7.9% in FY2023.
Segments
The Semiconductor Solutions segment revenue grew by 3% YoY to $7.3 billion and has witnessed a cyclical slowdown. It is down from 5% growth in the previous quarter and 26% growth in the same quarter last year.
In this segment, networking revenue is the largest by end markets, constituting 42% of Q4 semiconductor revenue.
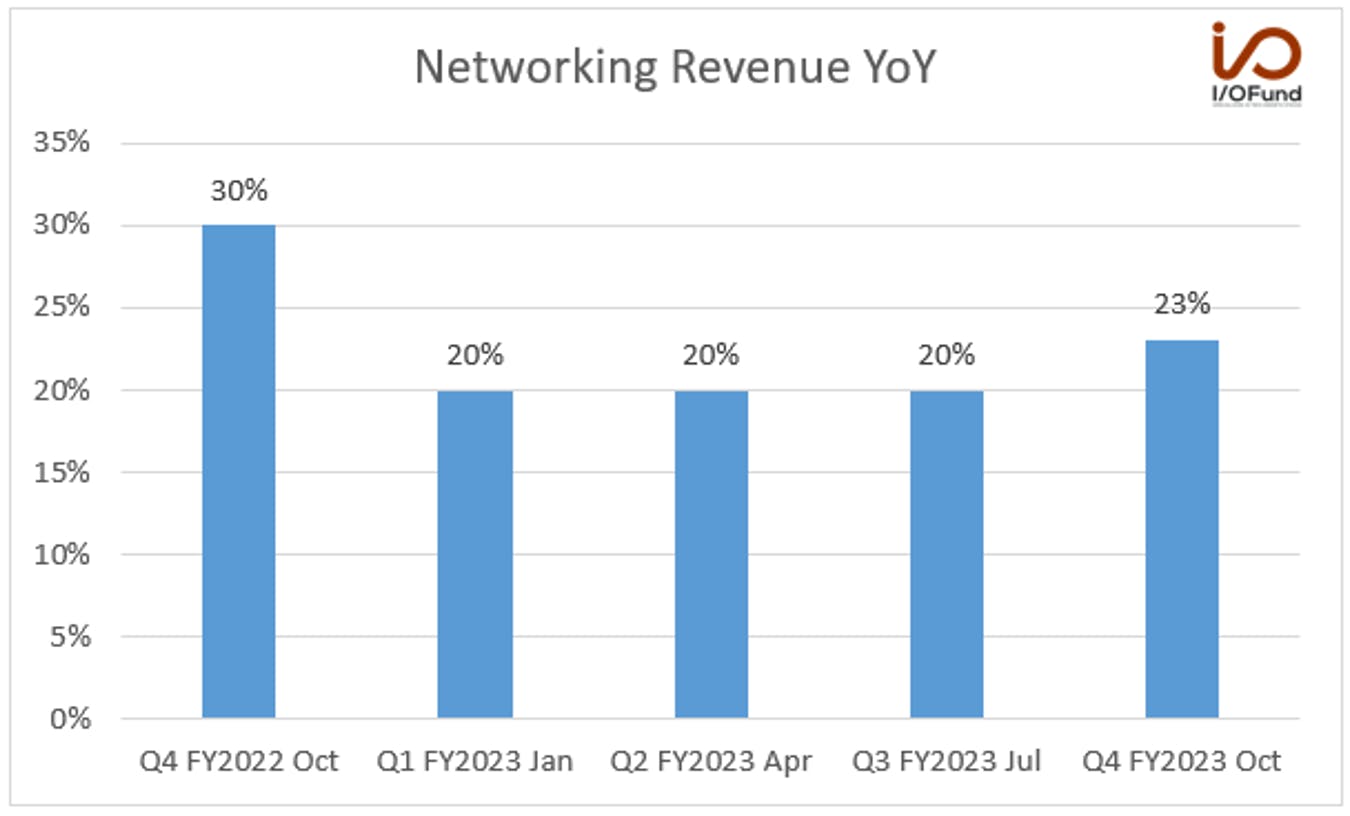
Networking revenue grew by 23% YoY to $3.1 billion due to strong demand from hyperscalers. Due to AI, management expects FY2024 networking revenue to grow 30% YoY, up from 21% in FY2023.
The company is a beneficiary of generative AI and reported $1.5 billion in Q4 FY2023, for a run rate of $6 billion per year. Citi Analyst, Christopher Danely, said in a research note that the company’s AI revenue will double from $4 billion in FY2023 to $8 billion in FY2024, and he expects the AI business will offset the correction in the semi-business.
Looking further out, Mizuho analyst Vijay Rakesh said “that Broadcom’s AI revenue will likely grow from $8 billion in 2024 to $20 billion in the calendar year 2027, thanks to its custom ASIC AI portfolio.”
The company’s CEO, Hock Tan, said in the earnings call, “This was primarily driven by strong demand from hyperscalers for our custom AI accelerators and as well for our networking switches, routers and NICs, Network Interface Cards, dedicated towards scaling our AI data centers.”
“As you know, even as Ethernet is the standard protocol in front-end networks, hyperscalers are also deploying Ethernet predominantly in their AI networks. In fiscal ‘23, networking revenue grew 21% year-on-year to $10.8 billion. If we exclude the AI accelerators, networking connectivity represented about $8 billion, and this is purely silicon, not systems, not cable nor subsystems. In fiscal 2024, we expect networking revenue to grow 30% year-on-year, driven by accelerating deployment of networking connectivity and expansion of AI accelerators in hyperscalers.”hyperscalers are also deploying Ethernet predominantly in their AI networks. In fiscal ‘23, networking revenue grew 21% year-on-year to $10.8 billion. If we exclude the AI accelerators, networking connectivity represented about $8 billion, and this is purely silicon, not systems, not cable nor subsystems. In fiscal 2024, we expect networking revenue to grow 30% year-on-year, driven by accelerating deployment of networking connectivity and expansion of AI accelerators in hyperscalers.”
The infrastructure software segment grew by 7% YoY to $2.0 billion and accelerated from 5% growth in the July quarter.
Due to the cyclical correction, server storage connectivity Q4 revenue declined by (17%) YoY to $1 billion. For FY2023, it grew by 11%. However, the cyclical weakness is expected to continue, and revenue is expected to decline in the mid-to-high teens for FY2024.
Broadband Q4 revenue also declined by (9%) YoY to $950 million due to the cyclical correction. The management expects the trend to continue, and for FY2024, revenue is expected to be down in the low-to-mid teens. In FY2023, broadband revenue grew by 8% YoY to $4.5 billion.
Wireless revenue declined by (3%) YoY to $2 billion. In FY2023, revenue was down (2%) YoY and the management expects revenue to be stable in FY2024. Lastly, the industrial resale revenue was flat at $236 million.
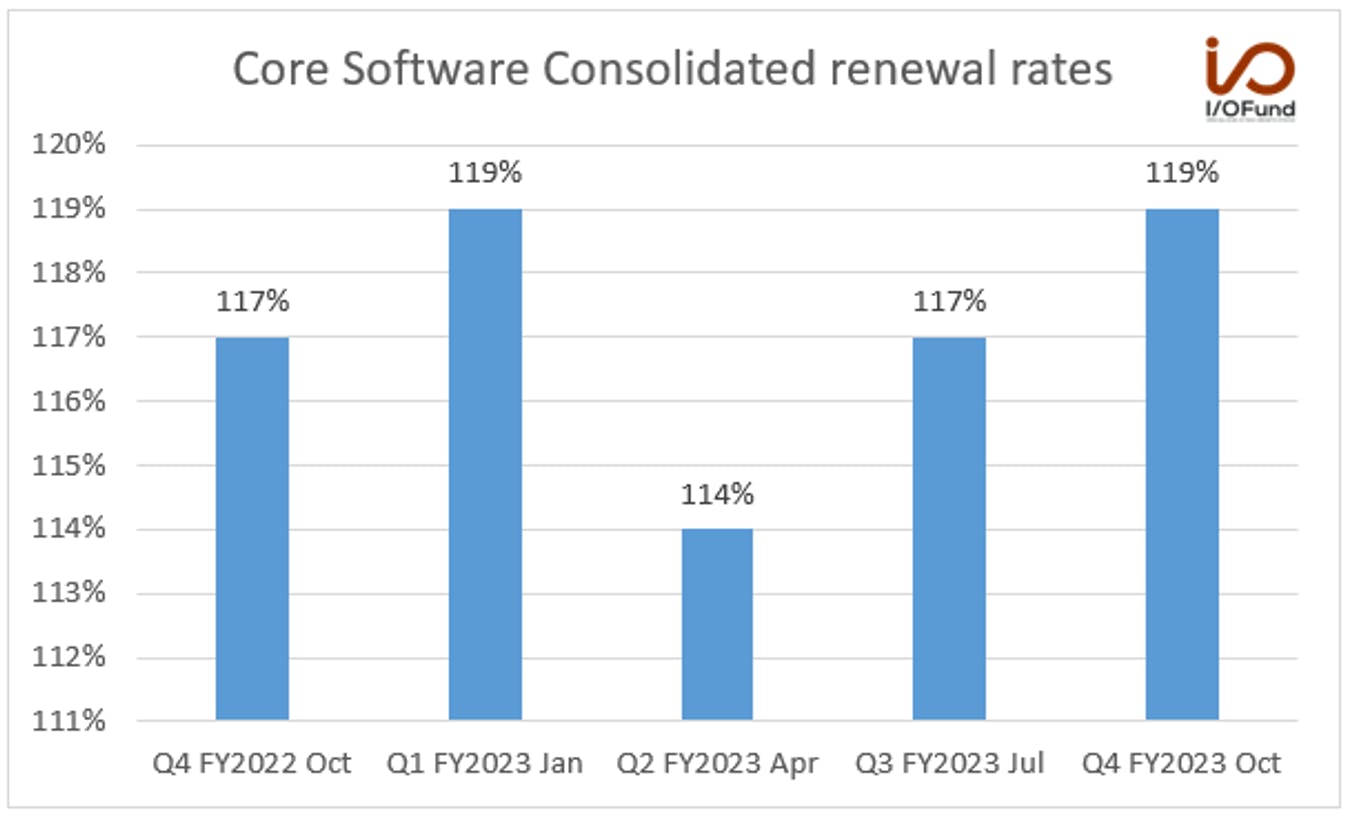
In the Core software segment, the consolidated renewal rates averaged 119%, up from 117% in the previous quarter. In the strategic accounts, it averaged 130% and was the highest in the last five quarters.
EPS:
EPS came in at $8.25 compared to $7.83 in the same period last year. The adjusted EPS came at $11.06 compared to $10.45 for the same period last year.
Analysts expect adjusted EPS to grow 0.9% YoY to $10.42 in the next quarter.
Prior to acquisition, VMware reported adjusted EPS of $1.83 in its last quarter (July 2023) as a public company.
Margins:
Gross margin for Q4 FY2023 ending Oct was 68.9% compared to 66.4% in the same period last year and 69.5% in the previous quarter.
The operating margin improved 100 bps YoY to 45.6%. The adjusted operating margin improved 20 bps YoY to 61.8%.
The company has a very strong bottom line. The net margin improved by 30 bps YoY to 37.9%. The adjusted net margin improved 90 bps YoY to 51.8% and was flat sequentially.
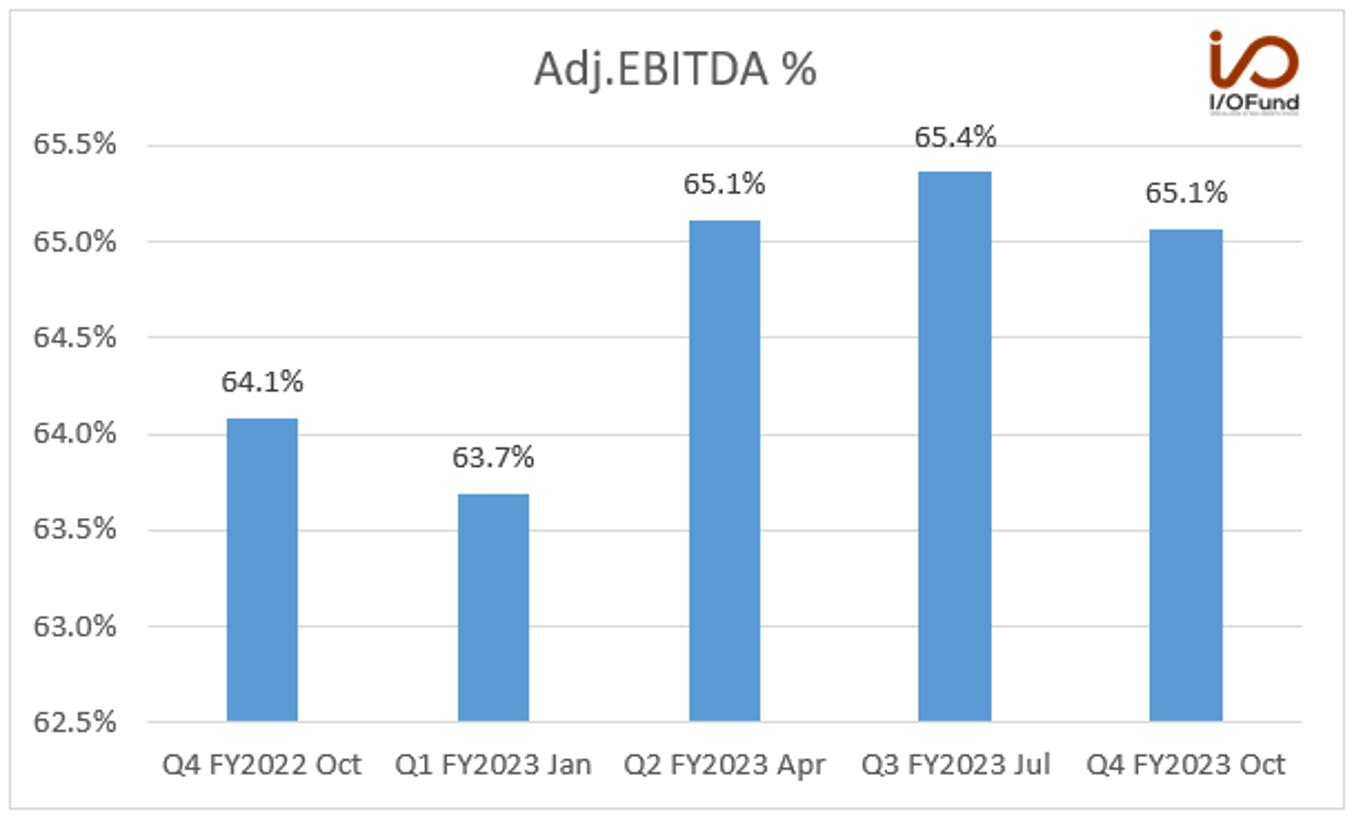
The adjusted EBITDA margin was 65.1% compared to 64.1% in the same period last year and 65.4% in the previous quarter.
VMWare’s EBITDA margin prior to acquisition in the July quarter was 28.6% compared to Broadcom’s 55.3%. The operating margin of VMware was 16% compared to 43.4% for Broadcom.
The adjusted EBITDA for the FY2023 ending Oct was 64.8%, and the management guide for the FY2024 is 60%, including VMware. The margin drop is mainly due to VMware's current lower margin. However, through cost-cutting initiatives like job cuts, Broadcom will aim to reach a 65% adjusted EBITDA margin for VMware. One focus area is SG&A expense, which constituted around 41% of revenue for VMware compared to around 4% for Broadcom. Hock Tan said in the earnings call, “At steady state, we’ll get to pretty close to 65% on VMware.”
The management also clarified that they are confident of achieving $8.5 billion EBITDA from VMware.
Harlan SurHarlan Sur
And then, just on my first question, are you guys still targeting $8.5 billion of EBITDA in three years on VMware?
Hock TanHock Tan
As Kirsten indicated, as we exit fiscal ‘24, we are practically at a run rate of $8.5 billion EBITDA.
Management said that the integration of VMware will take until the end of the fiscal year and require about $1 billion in transition spending. The CFO, Kirsten Spears, said in the earnings call, “During fiscal ‘24, we expect to incur about $1 billion of spend related to transitioning VMware into the new Broadcom model. This transition spending will be largely completed by the end of the fiscal year as our VMware spending run rate exits fiscal ‘24 at approximately $1.4 billion per quarter, down 40% from a year ago.”
The adjusted EPS for FY2024 is expected to grow 10.8% YoY to $46.83 and a further 19.4% YoY to $55.90 in FY2025. UBS analyst, in a research note, had earlier said that the VMware deal “to be 10% accretive to 2024 EPS and about 17% accretive to 2025.”
Cash Flow and Balance Sheet
Broadcom uses its large cash margin to frequently acquire companies.
Operating cash flow margin for Q4 FY2023 ending Oct was 51.9% compared to 53.2% in the previous quarter.
The free cash flow margin was 50.8% compared to 51.8% in the previous quarter.
The company has cash of $14.2 billion and debt of $39.2 billion. While the short-term debt is $1.6 billion, about $31.3 billion will mature after FY2028. At the end of FY2023, the company took a loan of $30.39 billion to finance the VMware merger and assumed $8.3 billion of VMware debt. While high debt is a concern, most of Broadcom’s debt has long maturities, and the company generates strong cash flows.
The company spent $15.3 billion for FY2023 in cash dividends and share repurchases. It had $7.2 billion remaining in the authorized share repurchase program.
More AI Commentary:
Vivek Arya, Bank of America analyst asked about Broadcom’s participation in the $400 billion AI accelerators market.
Hock Tan
“And we’re seeing this as we all are seeing LLM models continue to change and the face — the shape of generative AI dynamically change more and more, where training and inference are now starting to, in a way, converge and the chip designs are changing. And we are seeing that in the way we design specific custom chips for hyperscalers. That’s interesting. So that’s a very interesting opportunity for us. And as I indicated in my remarks, we see that revenue as part of networking revenue, $4 billion and networking — AI networks and going — doubling almost during 2024. Nothing new. We have said that before. And if anything else, we are reinforcing that particular guidance.”And as I indicated in my remarks, we see that revenue as part of networking revenue, $4 billion and networking — AI networks and going — doubling almost during 2024. Nothing new. We have said that before. And if anything else, we are reinforcing that particular guidance.”
Conclusion:
My takeaway is that the I/O Fund is likely to own Broadcom this year, but our goal is to enter at a lower price. Broadcom is trading above its 3-year median on PE Ratio at 40 PE compared to a 28.5 median. The current sales valuation of 15.5 PS is about double the 5-year median of 7.5 and about double the 3-year median of 8. When we go back to 2014, Broadcom has only traded above a PS Ratio of 10 one time at the height of the 2021 market. However, at a certain price, Broadcom belongs in our AI portfolio. Over the next few years, Big Tech is likely to diversify away from Nvidia’s GPUs, plus Ethernet networking continues to be upgraded for AI purposes, which means Broadcom should be on our radar.
In addition to valuation, for our purposes, we think the timing will be better once the VMware acquisition has settled as there are mixed reports from the customer perspective. Once this blows over and the restructuring is complete, it will be a more optimal time to enter Broadcom, which is richly valued at the moment.
This article was originally published on Forbes on Feb 23, 2024,04:41 pm ESTForbes Forbes on Feb 23, 2024,04:41 pm EST
In August of 2021, my firm made a very bold prediction that Nvidia will surpass Apple in valuation. At the time, Nvidia was at a market cap of $550 billion compared to Apple’s $2.5 trillion market cap. In the Forbes editorial “Here’s Why Nvidia Will Surpass Apple in 5 Years” I wrote the following:
“Notably, the stock is up 335% since my thesis was first published [my first AI thesis in 2018]AI thesis in 2018]
– a notable amount for a mega cap stock and nearly 2-3X more returns than any FAAMG in the same period.This is important because I expect this trend to continue until Nvidia has surpassed all FAAMG valuations.” published August 2021This is important because I expect this trend to continue until Nvidia has surpassed all FAAMG valuations.” published August 2021
Today, Nvidia surpassed a $2 trillion market cap compared to Apple’s $2.8 trillion. The company has surpassed Amazon, Google, Tesla, Meta and Netflix. The only one left standing is Apple and we have 2.5 years left to make good on my prediction.
Notice I did not say at the time that Nvidia would double its market cap to $1 trillion or surpass one of the FAANGs. Instead, I predicted that Nvidia would surpass the world’s most valuable company to take the throne, and would do it very quicklyvery quickly.
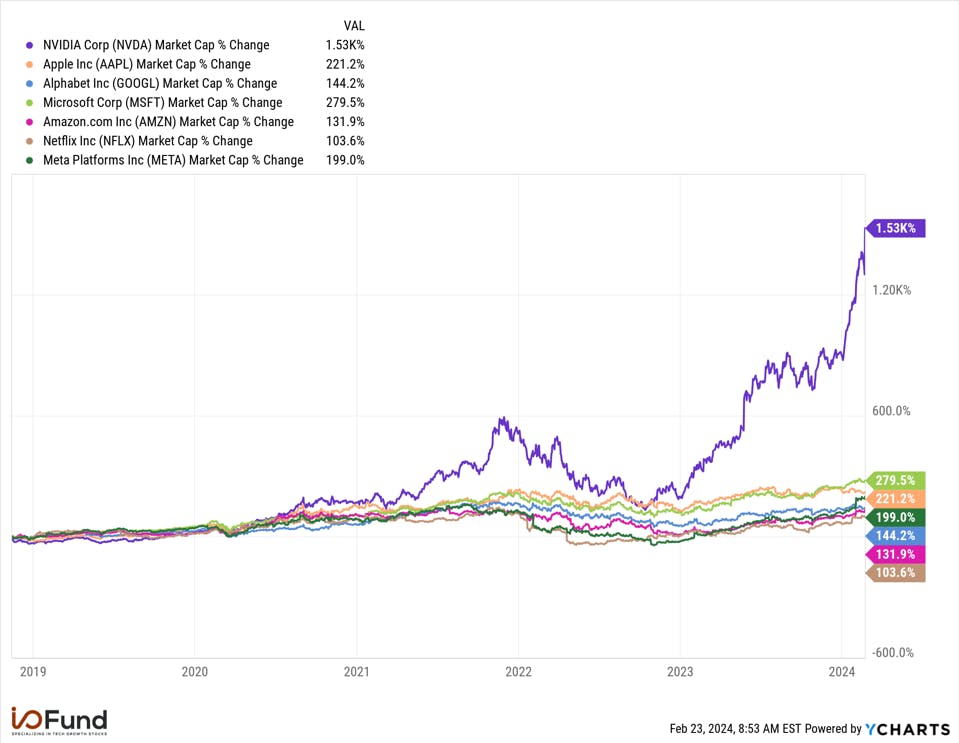
Here’s what Nvidia’s increase in market cap looks like:
Since November 2018, Nvidia's market cap has increased more than 1,500%, compared to the FAANG's gaining 100% to 280%. Source: YCHARTS
Sign up for I/O Fund's free newsletter with gains of up to 221% – Click hereClick hereClick here
How Nvidia Surpassed Many FAANGs — and why Apple is Next
Nvidia’s rapid rise to become one of the top five most valuable companies in the world stems from its leadership position at the forefront of AI —- which began with the A100. It was the A100 which combined training and inference that kicked off Nvidia’s strength in the data center –the H100 would come a couple of years later. The A100 left early breadcrumbs that Nvidia would see a glorious ascent to overtake Apple. Prior to the A100, there were additional clues, specifically Nvidia’s CUDA software platform, which my firm also made quite clear in 2018 would carve a deep moat for a near-monopoly.
Rapid top-line growth is the primary eye-catching statistic, as no other companies in tech have reported such blistering revenue growth at a rate above 200% for multiple quarters at an annualized revenue rate near $90 billion. These are growth rates we see in small caps or mid-caps that have a mere $1 billion or less in revenue. Rarely, if ever, do we see this growth rate above $5 billion in revenue let alone $90 billion.
The consistency and magnitude of the top-line beats is impressive, however, it’s the growth further down the income statement where Nvidia’s report truly shines. Nvidia’s stronghold grip on the data center market at the moment combined with pricing power and elevated demand for its H100 GPU has allowed substantial growth in operating income and has generated robust earnings.
Let’s take a closer look as to why Nvidia has been able to surpass every FAANG except Apple, and why it’s inevitable that Nvidia becomes the World’s Most Valuable company in the next 2.5 years. We are using the date of August 2021 through the Q4 January report to evaluate the fundamental growth since that is when we first predicted Nvidia would surpass Apple’s valuation by August of 2026.
Here are some staggering data points since that prediction:
Nvidia’s Data Center:
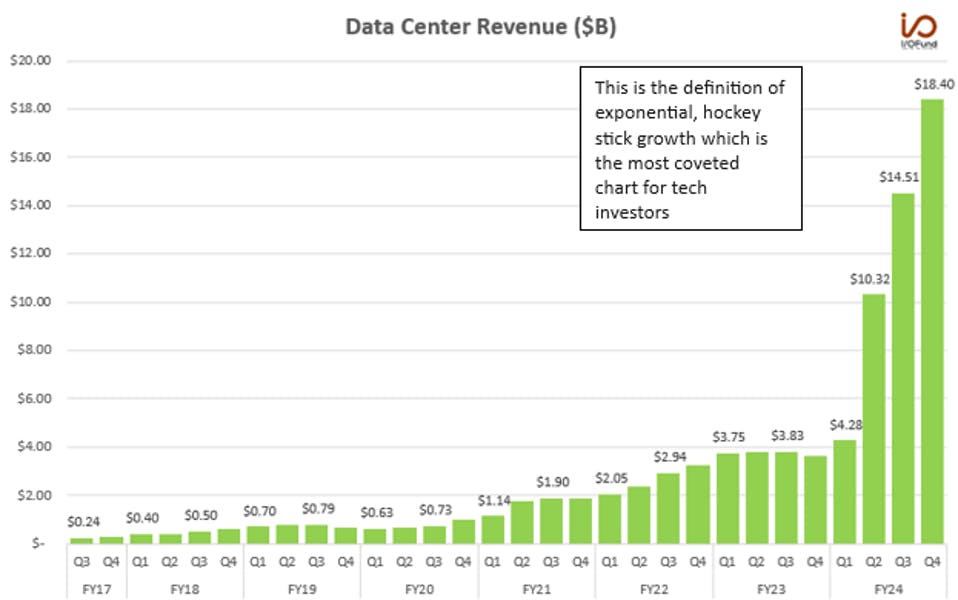
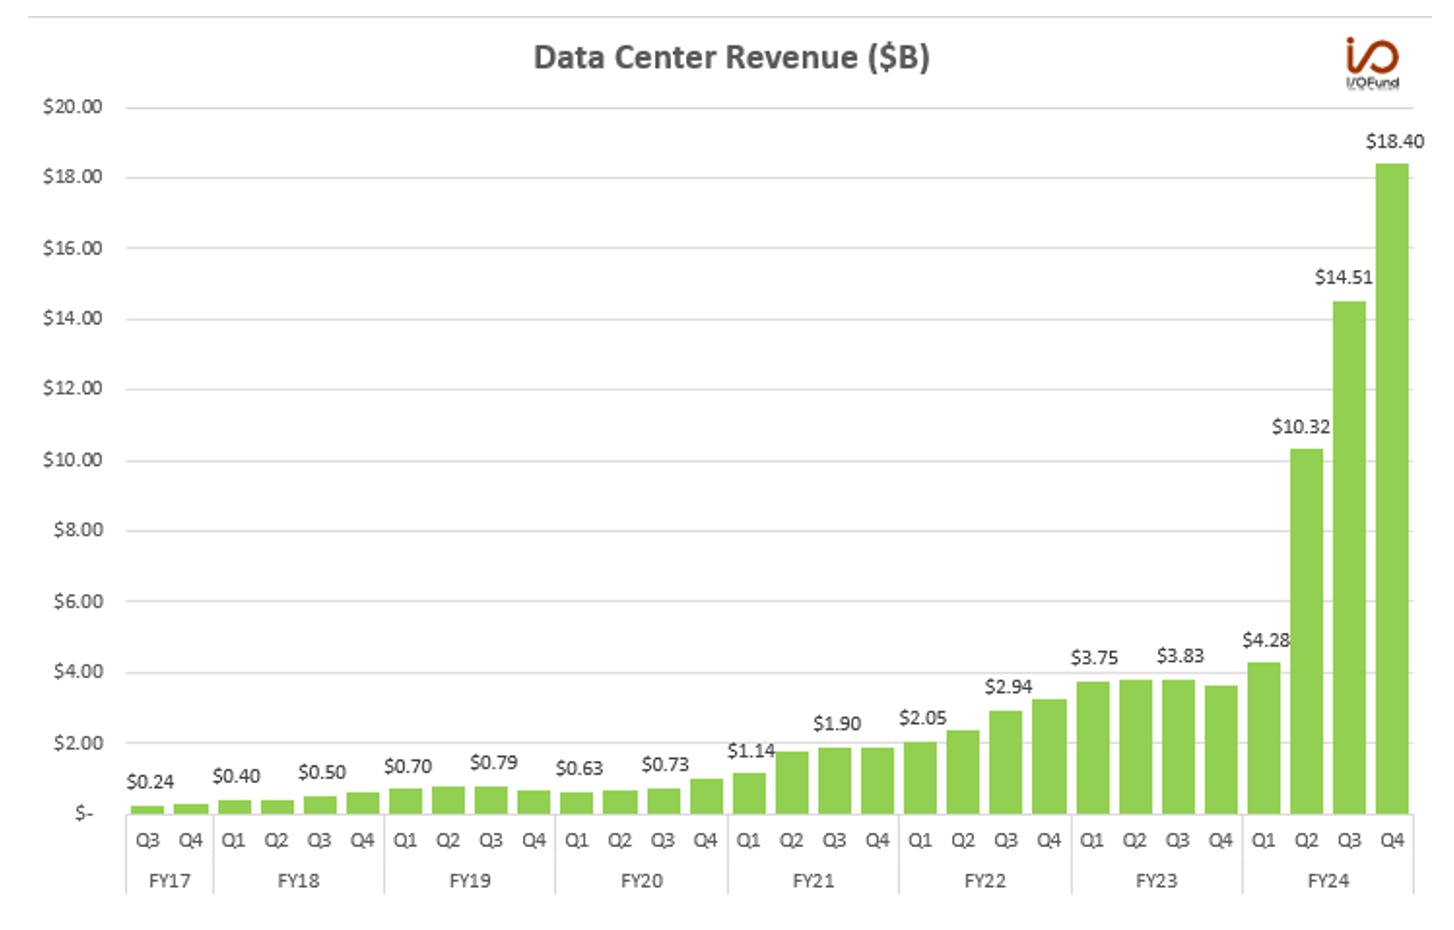
Data center revenue has grown more than 676%, from $2.37 billion in fiscal Q2 2022 to $18.40 billion in fiscal Q4 2024.
In just 10 quarters, Nvidia has taken the data center from a less than $10 billion annualized run rate to almost a $75 billion annualized run rate – no other company can boast growth at this scale. For context, Amazon’s AWS increased from a $12 billion annualized rate to $35 billion over 12 quarters from 2016 to 2019, but took six years to surpass $80 billion in 2022. Nvidia did the equivalent in 2.5 years.Nvidia did the equivalent in 2.5 years.
Data center revenues in Q4 accelerated again, growing 409% YoY compared to 279% YoY in Q3 and 171% YoY in Q1. Nvidia attributed Q4’s growth to “higher shipments of the NVIDIA Hopper GPU computing platform” alongside strong demand for InfiniBand which was up 5-fold.
To put in perspective just how rapid this ascent in data center revenues has been, this year’s $47.5 billion in revenue is 18% more than total revenues in the segment for the past five years combinedfor the past five years combined. Nvidia generated a total of $40.2 billion in data center revenue between CY17 through CY22.
Nvidia's data center revenue increased 409% YoY to $18.40 billion in Q4, compared to $2.37 billion in August 2021. Source: NVIDIA
Compare this to Apple’s prized iPhone segment since our prediction:
iPhone revenue increased 79% from $38.8 billion in fiscal Q4 2021 to $69.7 billion in fiscal Q1 2024; however, iPhone sales have increased just 12.7% to $43.8 billion in Q4 2023.
iPhone revenue increased just 4.5% from fiscal 2021 through fiscal 2023, from almost $192 billion to $200 billion, as growth has stagnated.
Every Thursday at 4:30 pm Eastern, the I/O Fund team holds a webinar for premium members to discuss how to navigate the broad market, as well as various stock entries and exits. We offer trade alerts plus an automated hedging signal. The I/O Fund team is one of the only audited portfolios available to individual investors. Learn more here.Learn more hereLearn more here.
Overall Revenue Growth for Nvidia of 240% Compared to Apple’s 43%:
Since August 2021, Nvidia’s revenue has grown at a much quicker rate than Apple, at a 240% total increase compared to 43% for Apple. That’s 96% growth on average for Nvidia per year and 17% growth for Apple averaged out per year – a 5.5X difference.
The iPhone’s installed base is reaching 1.5 billion and the market is showing signs of saturation. Growth stems primarily from existing devices being upgraded rather than building out the ecosystem. For data centers, we’re in the very early stages of growth, with Nvidia’s CEO Jensen Huang predicting that $1 trillion will be spent across the next four years to upgrade data centers for AI, with a majority of this spend stemming from hyperscalers and cloud providers procuring GPUs.
This massive capital spending on data centers is what will help Nvidia hammer the nail in the coffin to overtake Apple, as it will continue to drive significant growth in Nvidia’s data center revenues and thus overall revenue.
Q1’s revenue guide of $24 billion implies YoY growth of 235%, and suggests data center revenue may surpass $20 billion next quarter, for another blazing hot quarter with DC growth of 367% YoY.
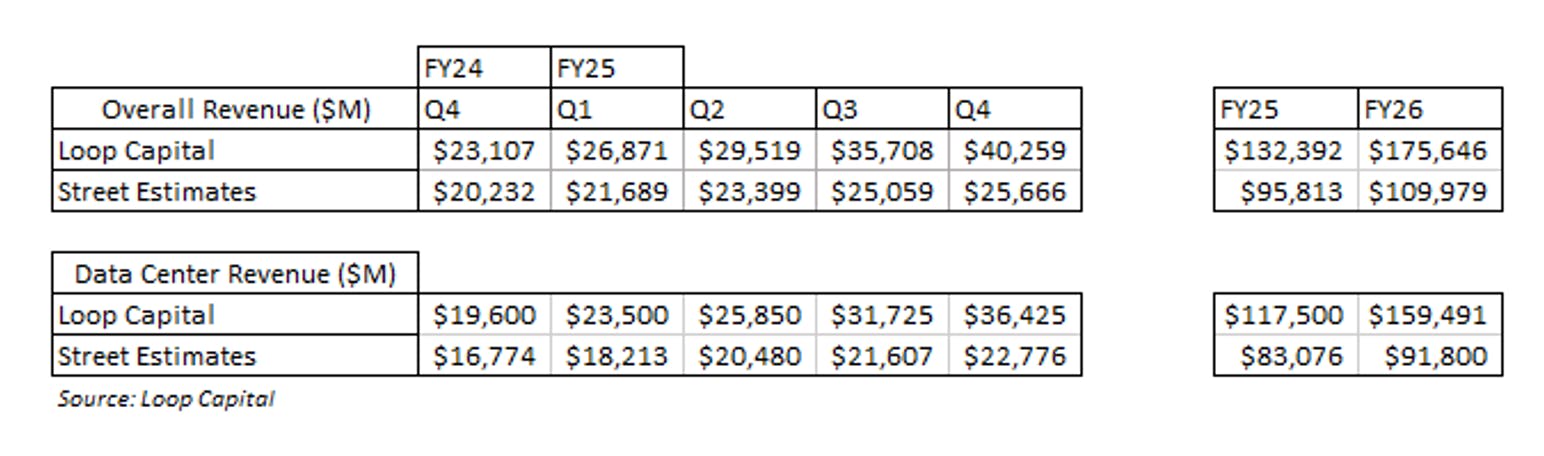
Looking forward through the rest of FY25, estimates on the Street for data center revenue range from $22.8 billion to $36.4 billion by fiscal Q4 2025, with total revenue ranging between $25.7 billion to $40.3 billion.
Should Nvidia reach $29 billion in overall revenue by next January with $25 billion in data center, its data center revenue will have grown more than 950% since August 2021 with total revenue up nearly 350%. Compare this to Apple, where revenues are expected to decline (4.1%) YoY next quarter and increase just over 1% for fiscal 2024.
Nvidia has Strong Margins, But Apple Has the Cash
Nvidia’s margins are much stronger than Apple’s, but Apple leads in cash and cash generation.
Since August 2021, Nvidia’s gross margin has expanded significantly, from 66.7% to 76.7% in fiscal Q4, first topping 70% in fiscal Q2 and expanding since then as a high degree of pricing power for its ultra popular H100 GPUs is aiding margin growth.
Apple has similarly seen gross margin expansion, stemming primarily from growth in high-margin Services revenue as opposed to hardware sales — Apple’s gross margin increased from 42.2% to 45.8% over the same period.
Nvidia’s operating margin has improved tremendously in fiscal 2024, as it managed to increase operating expenses by only 2% YoY while driving a 126% increase in revenue. Operating margin has increased from 47.2% to 66.7% since our prediction. Over the past two quarters, operating margin has increased 910 bp.
On the other hand, Apple’s operating margin has improved 520 bp over the same period, from 28.5% to 33.7% — Nvidia’s operating margin is now nearly double Apple’s.
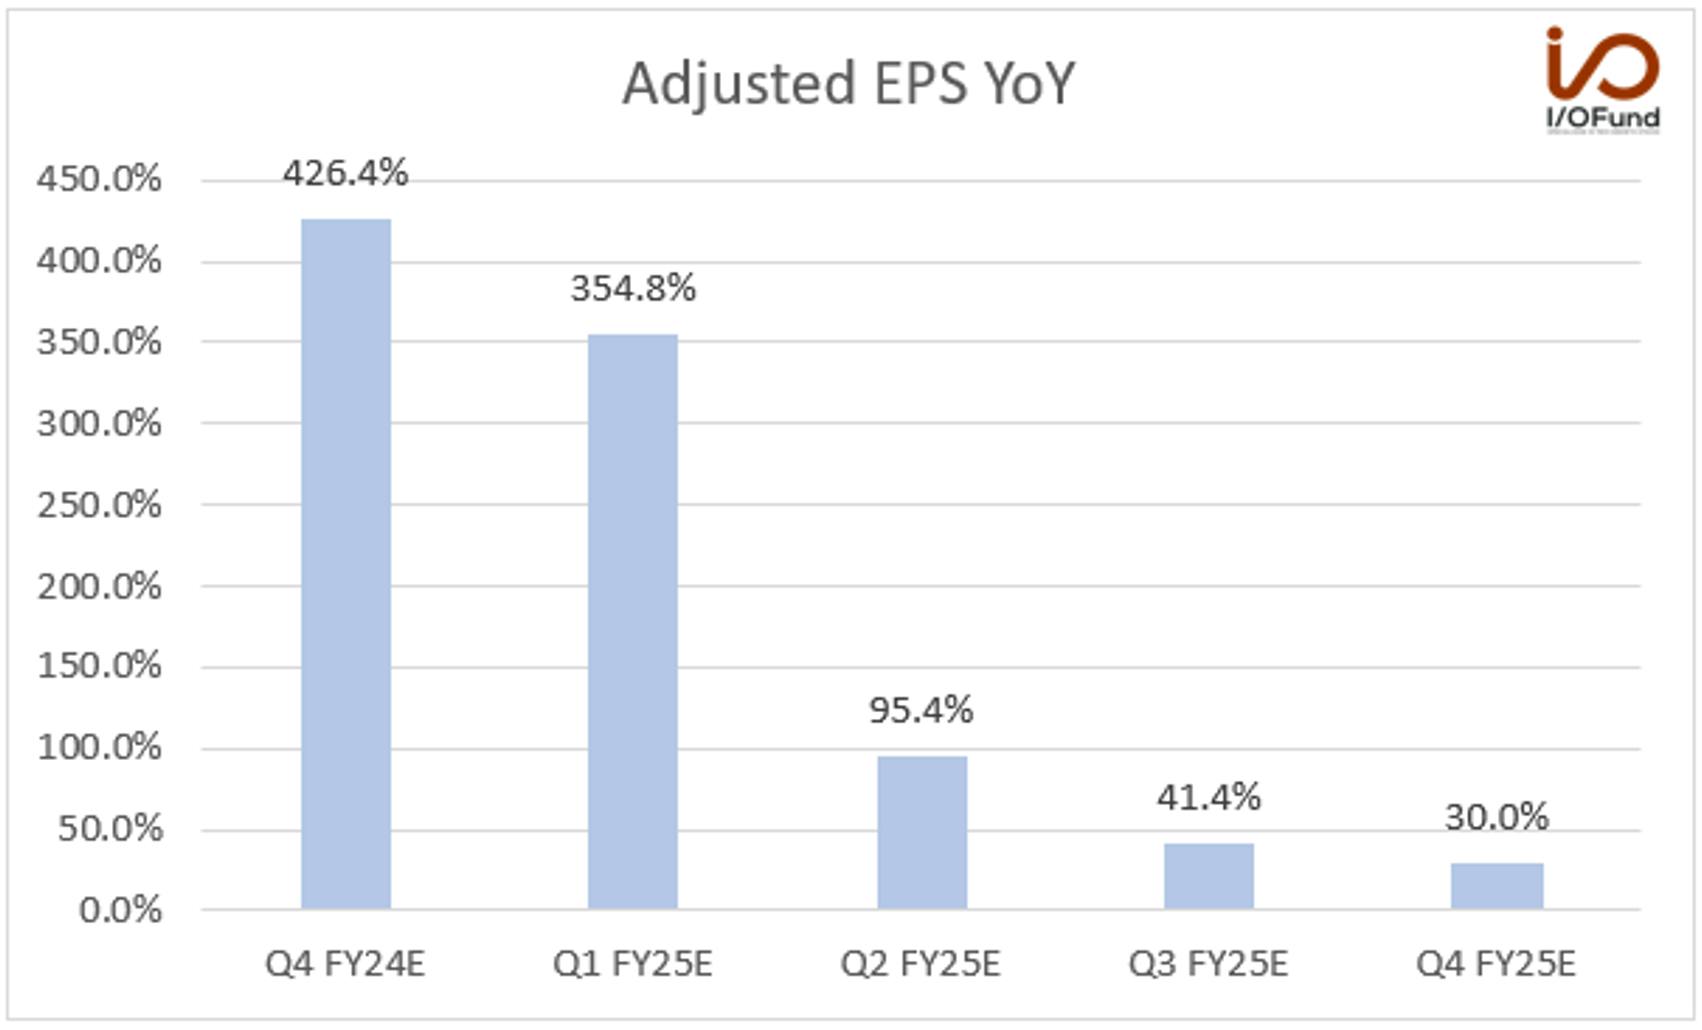
Because of this major increase in operating leverage, Nvidia has seen substantial growth in EPS. Nvidia reported $5.16 in EPS in fiscal Q4, nearly 400% growth from $1.04 reported in August 2021. Apple’s earnings growth over the same period has been just 14%, from $5.62 to $6.42 on a TTM basis.
However, Apple has the cash and cash flows, though Nvidia is quickly improving in both metrics. Apple’s cash on hand totals $172.6 billion, with over $72 billion in current cash, equivalents and marketable securities.
Nvidia has just $26 billion in cash and equivalents, an increase from $18.3 billion in Q3 and $13.3 billion in the year ago quarter as Nvidia is pocketing more cash.
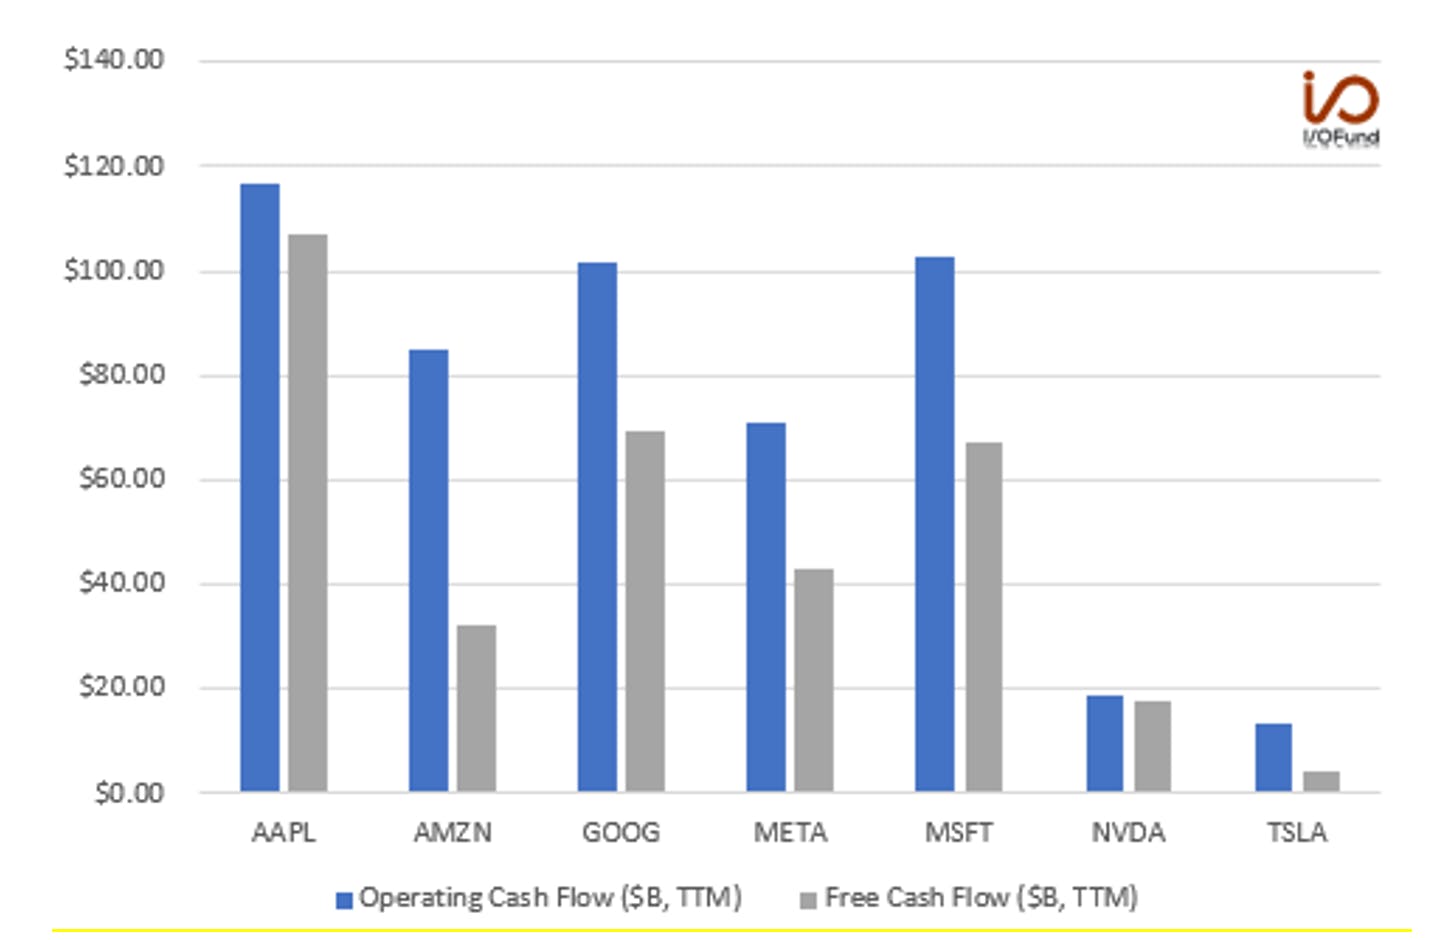
Apple leads the Mag 7 and tech in general as it generates the highest levels of operating cash flow and free cash flow. TTM operating cash flow was more than $116 billion, while FCF was more than $106 billion, or a FCF margin of 27.5%.
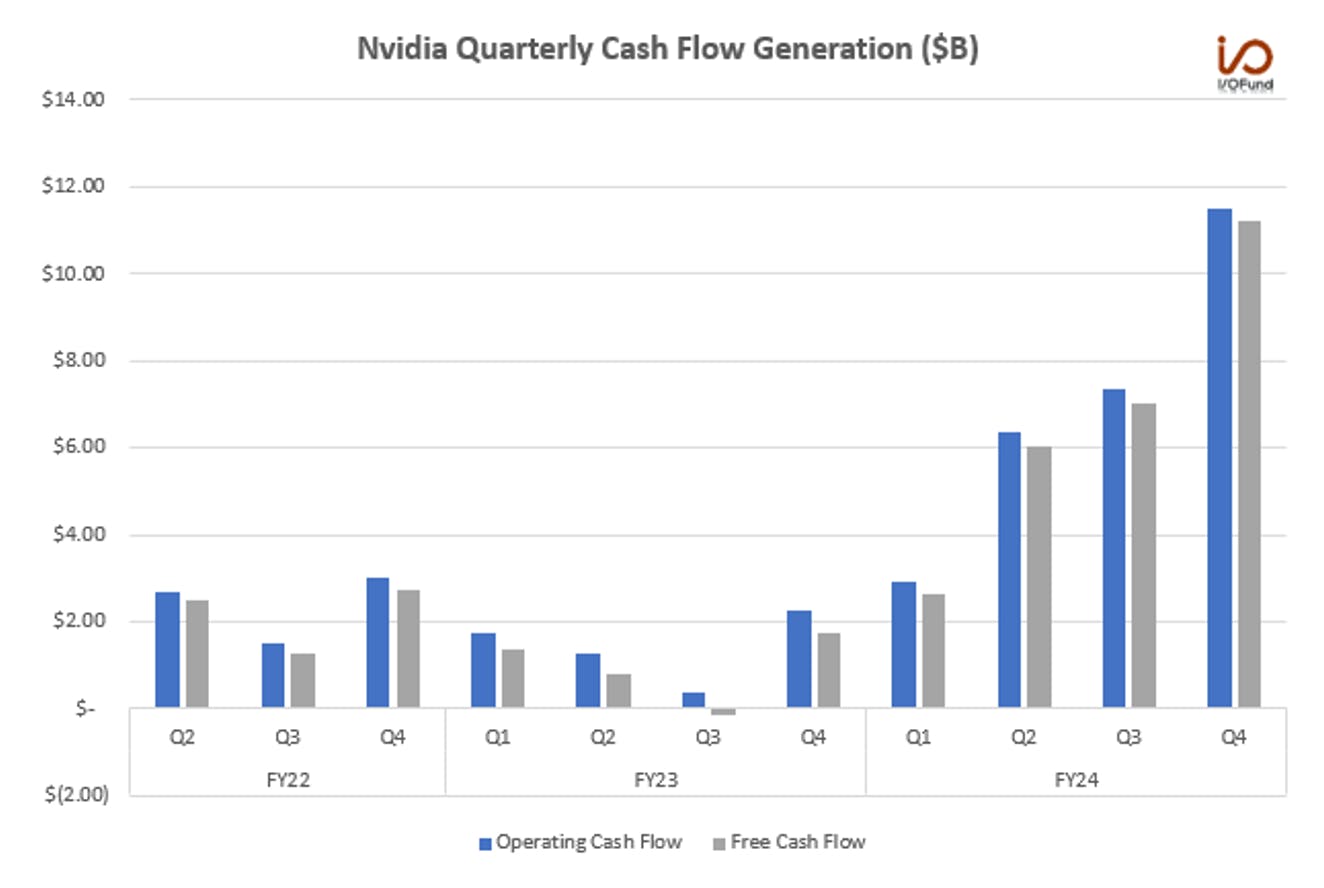
Nvidia’s operating cash flow grew 400% YoY to $28.1 billion, with FCF up 690% YoY to $27 billion. Nvidia’s margins here are now stronger than Apple’s, at 46% and 44%, but the scale of its revenues means it has a few more years to go before it can surpass the $100 billion threshold on cash.
While cash flows may nearly double to ~$50 billion in FY25, Nvidia’s software can complement this growth as it scales a few years in the future, much as Services is aiding Apple’s growth and margins.
How Nvidia Will Surpass Apple’s Valuation
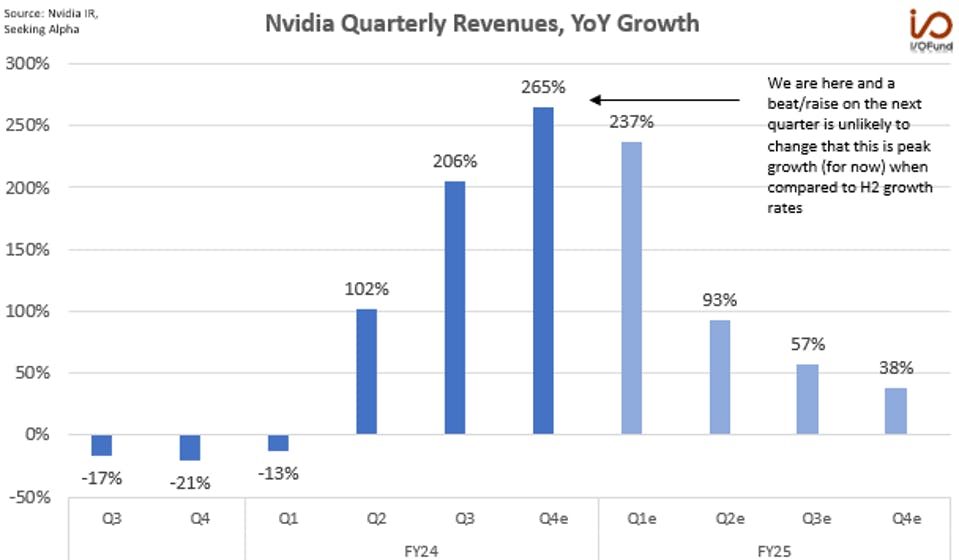
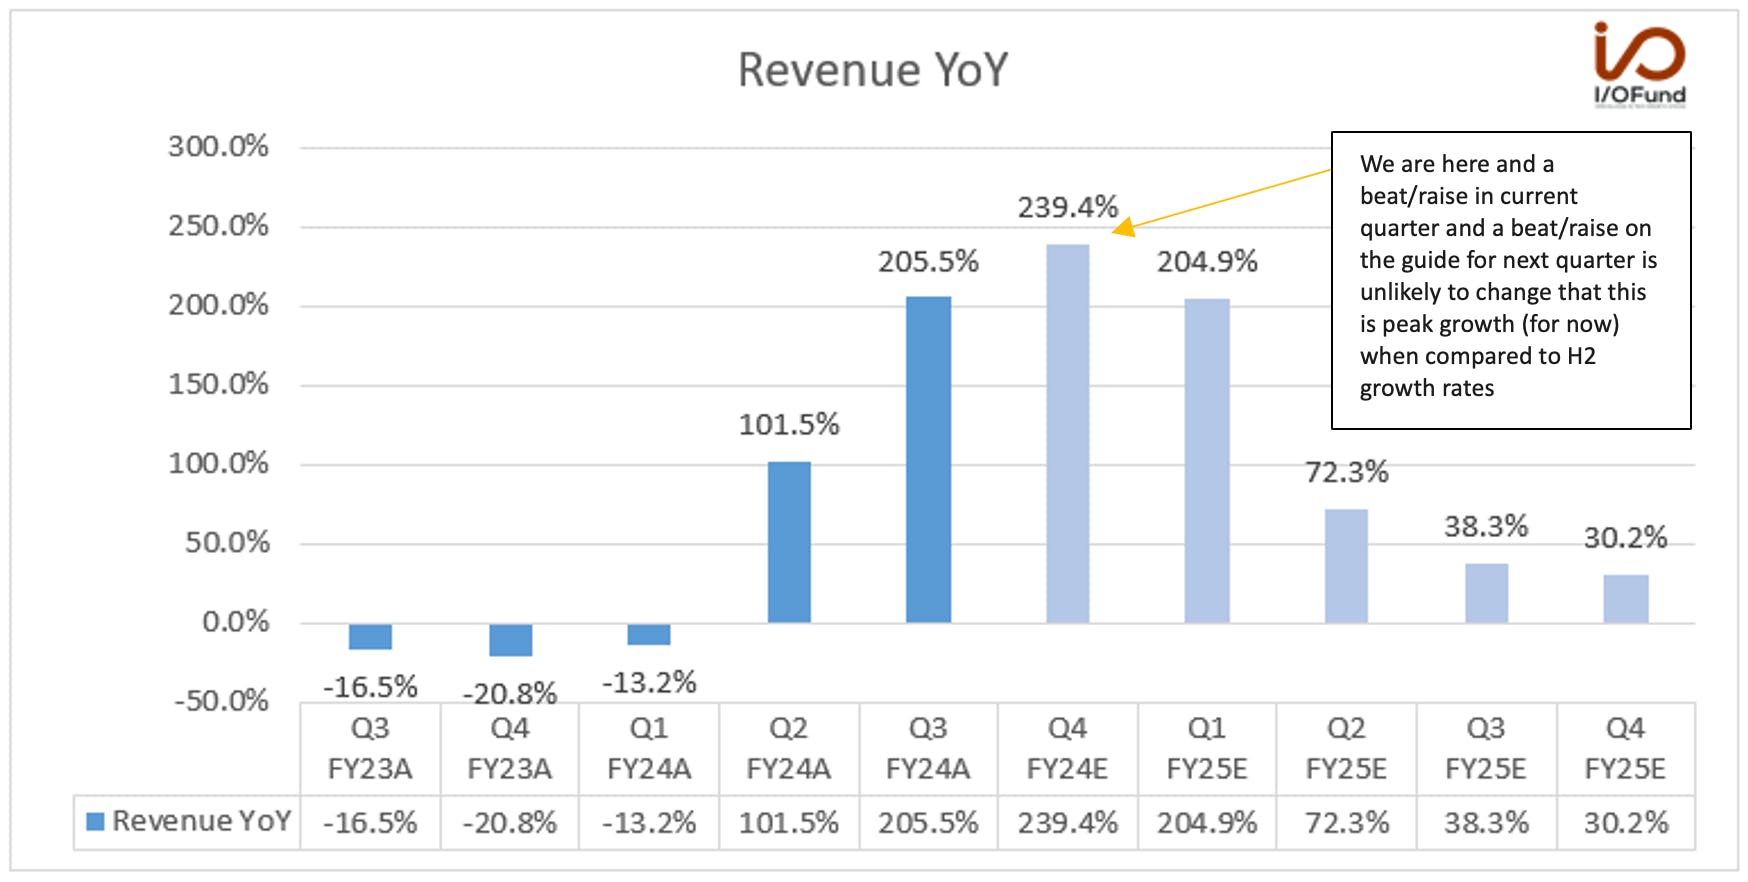
Before we go into a few reasons Nvidia has a long runway, it’s prudent to state that Nvidia has likely peaked in revenue growth (for now) either this quarter or next quarter. For revenue to peak next quarter, Nvidia has to beat by $2.2 billion or more.
Nvidia's revenue growth rates have peaked for now at 265% in Q4, when compared to growth rates inH2. Source: NVIDIA, SEEKING ALPHA
Nvidia’s post-earnings rally has taken it above a $2T valuation, as it continues to quickly close the gap with Apple. Here’s the path to Nvidia re-accelerating again sometime over the next 2.5 years to finish off Apple once and for all.
Software Opportunity
AMD’s CEO Lisa Su believes the AI accelerator market can reach $400 billion by 2027, as demand continues to far outpace supply with cloud giants gobbling up GPUs as fast as possible. With accelerators alone, Nvidia can surpass Apple as the company is estimated to control at least 90% of the data center GPU market. Even if Nvidia’s share slips to approximately 80% by 2027, that would be $320 billion in revenue.
Looking beyond accelerators, Nvidia’s software opportunity is a main factor in our thesis – that Nvidia will not only be the primary player for AI hardware, but simultaneously will become a predominant player for AI software. Software is the holy grail for a hardware company, especially for Nvidia; if competitors such as AMD can compete on performance and undercut on price, driving GPU prices lower over the long run, software will let Nvidia monetize its existing GPU base and generate streams of recurring revenue.
Right now, software is at a $1 billion run rate and CEO Jensen Huang stated that there is a “fundamental reason why Nvidia will be very successful in software” which is that it’s fundamentally required for accelerated computing and will be needed to open new markets. Nvidia’s Enterprise AI will “do the management, the optimization, the patching, the tuning, the installed base optimization for all of their software stacks” at about $4,500 per GPU.
This is key as Nvidia’s current analyst estimates do not take into account that AI software will ramp over the next two to three years. At max adoption, the software opportunity would be worth $11.2 billion but a more conservative scenario would be $5 billion. This may seem like peanuts compared to the $18.4 billion in data center revenue today but it will be accretive to margins and accelerate YoY whereas the data center may come under pricing pressure. To put it simply, we all know semis are cyclical and software is not – where those two meet will create fortuitous crossroads.
Accelerated Product Roadmap
In terms of hardware, Nvidia has an ambitious AI GPU roadmap, and is expected to release the next-gen H200 and B100 GPUs later this year, just over one year after releasing the H100. The two GPUs are expected to offer another leap in performance for AI training and inference, and the H200 is already in demand by the leading CSPs – AWS will be the first to deploy the new GPU, but Microsoft, Google and Oracle will also be deploying the chips.
It’s easy to see why the cloud giants are eager to upgrade quickly — Nvidia says the H200 will boast reduced energy usage and thus a lower TCO, while the introduction of HBM3e memory will essentially supercharge the GPU’s performance. For GPT-3 175B, the H200 is expected to offer 1.4x to 1.9x faster LLM inference on the leading GPT and Llama models compared to the H100, and an 18x performance upgrade compared to the A100.
Source: NVIDIA
While it will be too soon to gauge what level of demand there is for the two new GPUs from a Q1 guide, a fiscal year guide could provide insight into whether demand for the H200 and B100 can match the H100, or if Nvidia will face initial supply constraints while ramping production. Additionally, Nvidia will face competition this year from AMD’s MI300s.
Note on Automotive:
Automotive is another large, incoming segment for Nvidia with a $300 billion total addressable market by 2030. Nvidia has an enviable position with a lead across dozens of OEMs in the US and China. Nvidia’s automotive suite spans nearly the entire tech stack of the car: its Drive SoCs – Orin and Thor – serve as the central computer for the vehicle, enabling OEMs to move higher up the semi-autonomous capability curve, from L2 to L2+/L3, to localized L4, and potentially L5 in the future.
Nvidia’s entire autonomous platform, called Hyperion, has not fully hit the market yet – Hyperion 8 is expected to begin shipping this year with Hyperion 9 following in 2026. Automotive’s pipeline currently sits at just $11 billion, but the shift to predominantly L2+ architectures as OEMs compete on tech and ADAS features beckons to dramatically increase this pipeline.
Valuation Eerily Low Despite 420% Rally Since 2023
Fundamentally, the rapid bottom line growth has supported this massive valuation increase – rarely do you see EPS increase 1,200% over two fiscal years at a multibillion-dollar scale. Compare this to Apple, which is expected to see just 17% total growth in EPS over the next two years.
As discussed in our pre-earnings writeup, the valuation is eerily low still and it is very unusual for a stock to be up more than 400% in just over year and yet be cheaper than it was at its bottom (Oct 2022 for Nvidia) – and that’s still the case after Thursday’s surge.
Source: YCharts
Nvidia’s forward PE ratio is just above 32x at Friday’s close, which compares to a forward PE ratio of more than 75x in its November 2021 peak, nearly 90x in March 2022, and 34x when shares bottomed in the $115 range. The valuation is what makes it a buy on any dips. However, we also won’t be shy about taking gains if we reach predefined price targets. We have one in mind for Nvidia, so let’s see if we get there for our next trim.
Conclusion:
My firm was the defacto pioneer on building an AI-focused portfolio with Nvidia at the helm, and we were bold and quite clear at a time that Nvidia would rival Apple’s valuation when the very thought was inconceivable. There are many Nvidia bulls appearing today, where were they when the stock sold off (-60%) and was at the October 2022 low. I know where the I/O Fund was —- writing editorials that clearly stated the stock was bottoming and issuing 10 buy alerts to our premium research members when the stock was under $210.
One of the more critical media appearances was on Real Vision, when I stated that it would take World War 3 for me to sell my Nvidia position. The stock is up 400% since that show.
Note, I did not say it would take World War 3 for me to take gains. We are not shy about putting real money into the bank if we think we can get a stock lower than where it currently trades. After all, we have been trimming Nvidia and buying lower for six years for a higher return than a buy and hold strategy. For example, entries at $210 creates returns of 281% to 627% with our lowest tranche at $108 versus 162% returns since January 1st, 2022.
The very mission we are on is to help readers safely participate in the life-changing gains that tech can offer. We want it all — put money in the bank, lock-in gains, yet also hold high-conviction stocks for the long haul at a high allocation (and hedge if tech falls out of favor).
If you own Nvidia stock, or are looking to own NVDA, we encourage you to attend our weekly premium webinars, held every Thursday at 4:30 pm EST. Next week, we will discuss our plan following NVDA’s earnings, as well as a handful of other AI plays for 2024 – what our targets are, where we plan to buy as well as take gains. Learn more here.
I/O Fund Equity Analyst Damien Robbins contributed to this report.
Please note: The I/O Fund conducts research and draws conclusions for the company’s portfolio. We then share that information with our readers and offer real-time trade notifications. This is not a guarantee of a stock’s performance and it is not financial advice. Please consult your personal financial advisor before buying any stock in the companies mentioned in this analysis. Beth Kindig and the I/O Fund own shares in NVDA at the time of writing and may own stocks pictured in the charts.
Nvidia’s much-anticipated Q4 earnings report saw the AI GPU leader post another large beat and raise as it reported revenue growth of 265% YoY. Nvidia guided fiscal Q1 revenues nearly $2 billion above consensus on top of its almost $2 billion revenue beat in Q4, mirroring what we saw in Q3 as demand for its H100 Hopper GPUs remains elevated.
The consistency and magnitude of the top-line beats is impressive, with Q1’s guide signaling three quarters in a row of revenue growth above 200%. However, it’s the growth further down the income statement where Nvidia’s report truly shines. Nvidia’s stronghold grip on the data center market at the moment combined with pricing power and elevated demand for its H100 GPU has allowed substantial growth in operating income and has generated robust earnings.
Q4 revenue was $22.1 billion, beating estimates by 7.56%. This represented YoY growth of 265%, a 60 percentage point acceleration from 205% YoY in Q3.
FY24 revenue was $60.92 billion, an increase of 126% YoY.
Q1 revenue was guided at $24 billion, +/- 2%, ahead of estimates for ~$21.9 billion. This represents YoY growth of 235%, or a 30 percentage point deceleration from Q4’s growth rate. We had covered in our pre-earnings write up that revenue growth will peak in Q4 for now at the 265%. This seems to still be the case unless next quarter comes in at $2.2 billion over the current guide. As we have seen these past few quarters, it’s not out of the question that Nvidia beats by this much next quarter. However, it’s looking less likely that Nvidia can sustain this peak growth as we move into the second half of the year.
Q4 GAAP EPS of $4.93 beat estimates by 16.8%, representing YoY growth of 765%.
Q4 adjusted EPS of $5.16 beat estimates by 11.2%, representing YoY growth of 486%.
Margins:
Nvidia’s Q4 report highlighted the incredibly strong leverage and margin expansion that the rapid growth in the data center is driving.
GAAP gross margin was 76% in Q4, and adjusted gross margin was 76.7%, an expansion of 1270 and 1060 bp YoY respectively.
GAAP operating margin was 61.6% in Q4, and adjusted operating margin was 66.7%, an expansion of 4080 and 2990 bp YoY respectively.
GAAP net margin was 55.6% in Q4, and adjusted net margin was 58.1%, an expansion of 3320 and 2220 bp YoY respectively.
Notably, Nvidia is guided “Beyond Q1, for the remainder of the year, we expect gross margins to return to the mid-70s percent range.” It was mentioned on the call that the slightly softer gross might be caused by the higher cost of HBM3.
For FY24, GAAP gross margin was 72.7% up from 56.9% in FY23. Adjusted gross margin was 73.8% up from 59.2% in FY23.
For FY24, GAAP operating margin was 54.1% up from 15.7% in FY23. Adjusted operating margin was 60.9% up from 33.5% in FY23.
For FY24, GAAP net margin was 48.9% up from 16.2% in FY23. Adjusted net margin was 53% up from in FY23.
Cash Flows:
Cash on hand was $26.0 billion, an increase from $18.3 billion in Q3 and $13.3 billion in the year ago quarter.
Operating cash flow was $11.5 billion in Q4, an increase of 411% YoY. FY24 operating cash flow increased 416% YoY to $28.1 billion. For FY24, operating cash flow more than doubled to 46.1%, compared to 20.9% in FY23.
Free cash flow was $11.2 billion in Q4, an increase of 546% YoY as FCF margin topped 50%. For FY24, free cash flow increased 618% YoY to $26.9 billion. Free cash flow margin more than tripled to 44.2% from 13.9% last year.
Debt totaled $10.95 billion.
Key Segments:
Data Center:
Data center revenue dazzled again, with Nvidia attributing the growth to “higher shipments of the NVIDIA Hopper GPU computing platform” alongside growth for InfiniBand. Revenues rose 409% YoY and 27% QoQ to $18.4 billion – in other words, a $3.9 billion increase from Q3. Nvidia generated $47.5 billion in data center revenues in FY24, up 217% YoY from $15 billion in FY23.
This is what they mean by “hockey stick” growth:
To put just how rapid this ascent in data center revenues has been, this year’s $47.5 billion in revenue is 18% more than total revenues in the segment for the past five years combined – Nvidia generated $40.2 billion in data center revenue between FY18 through FY23.
According to the CFO commentary on the call for next quarter: “We expect sequential growth in data center and ProViz, partially offset by seasonal decline in Gaming.” As our pre-earnings writeup pointed out, a few analysts were modeling $25 billion data center quarters (for $100 billion per year), so it makes sense that we will see sequential growth in the data center into the foreseeable future.
The CFO also stated that 40% of data center revenue is from inference. This is the first I remember management discussing the percentage that is from inference, and I believe that’s because AMD is pushing hard on the narrative that the MI300s will specifically outperform on inference.
Regarding China, the following was stated: “Growth was strong across all regions except for China, where our Data Center revenue declined significantly following the U.S. government export control regulations imposed in October. Although we have not received licenses from the U.S. government to ship restricted products to China, we have started shipping alternatives that don't require a license for the China market. China represented a mid-single-digit percentage of our Data Center revenue in Q4, and we expect it to stay in a similar range in the first quarter.”
Gaming:
Gaming revenue in Q4 was $2.9 billion, representing a 56% YoY increase against a softer comp and flat growth QoQ. FY24 revenue was $10.4 billion, up 15% YoY.
Pro Viz
Pro Visualization revenue in Q4 was $463 million, up 105% YoY and 11% QoQ. FY24 revenue in the segment was $1.6 billion, up 1% YoY.
Automotive:
Automotive revenue was $281 million in Q4, up 8% QoQ but down 4% YoY. FY24 revenue was $1.1 billion, up 21% YoY as more automakers in China adopt Nvidia’s Drive platform for autonomous driving capabilities.
Additional Notes:
Nvidia’s rapid top-line growth is the primary eye-catching statistic, as no other companies in tech can report such blistering revenue growth at a rate above 200% for multiple quarters at an annualized revenue rate near $90 billion. However, the strengths of Nvidia’s report lie within the operating leverage that this growth is driving.
Operating income in Q4 increased 983% YoY to $13.6 billion, driving a 769% increase in net income to $12.3 billion.
For the full year, operating income of 681% to nearly $33.0 billion, up from $4.2 billion in FY23, while net income rose 581% YoY to $29.8 billion from $4.3 billion in FY23. FY24’s GAAP EPS of $11.93 was nearly 6x higher than FY23’s $1.74.
Cash flow generation surged, with OCF margin more than doubling and FCF margin tripling in FY24. OCF and FCF have increased sequentially each quarter this year, as top-line growth is flowing directly through to the bottom line.
Earnings Call:
There wasn’t much to dissect in the earnings call as what was delivered was another blowout quarter. However, there were some questions on supply that I want to note here. It’s no secret that demand is greater than supply, hence these blowout quarters. It did seem analysts were poking holes at what the timing could be as to when supply won’t be able to continue to afford this extraordinary growth. The answers to the questions were not very informative, rather I’m noting that this seems to the be predominant concern among the analysts even if management chose to remain vague.
Question Stacy Rasgon (Analysts)
I wanted to — Colette, I wanted to touch on your comments that you expected the next generation of products, so that black well [B100s] to be supply constrained. Can you dig into that a little bit? What is the driver of that? Why does that get constrained as Hopper is easing up? And how long do you expect that to be constrained? Like do you expect the next generation to be constrained like all the way through calendar '25? Like when do those start to ease?
Answer Jensen Huang (Executives)
Yes. The first thing is overall, our supply is improving. Overall, our supply chain is just doing an incredible job for us. Everything from, of course, the wafers, the packaging, the memories, all of the power regulators to transceivers and networking and cables, and you name it, the list of components that we ship […] The supply chain is really doing fantastic supporting us. And so overall, the supply is improving. We expect the demand will continue to be stronger than our supply provides, and through the year and we'll do our best. The cycle times are improving and we're going to continue to do our best. However, whenever we have new products, as you know, it ramps from 0 to a very large number, and you can't do that overnight. Everything is ramped up. It doesn't step up. And so whenever we have a new generation of products and right now, we are ramping H200s, there's no way we can reasonably keep up on demand in the short term as we ramp […] So we'll — with all new products, demand is greater than supply. And that's just kind of the nature of new products, and we work as fast as we can to catch up with the demand. But overall, net-net, overall, our supply is increasing very nicely.”
Here was another question on supply that was shrugged off, so to speak, yet helps our members to understand the Q&A had a few analysts focused on figuring out the supply constraints:
Question Timothy Arcuri (Analysts)
I wanted to ask about how you're converting backlog into revenue. Obviously, lead times for your products have come down quite a bit. Colette, you didn't talk about the inventory purchase commitments, but if I sort of add up your inventory plus the purchase commits and your prepaid supply, sort of the aggregate of your supply, it was actually down a touch. How should we read that? Is that just you saying that you don't need to take as much of a financial commitment to your suppliers because the lead times are lower? Or is that maybe you're reaching some sort of steady state where you're closer to filling your order book and your backlog?
Answer Colette Kress (Executives)
Yes. So let me highlight on those three different areas of how we look at our suppliers. You're correct. Our inventory on hand, given our allocation that we're on, we're trying to, as things come into inventory, immediately work to ship them to our customers. I think our customer appreciates our ability to meet the schedules that we've looked for.
The second piece of it is our purchase commitments. Our purchase commitments have many different components into it, component that we need for manufacturing but also often we are procuring capacity that we need. The length of that need for capacity or the length of the components are all different. Some of them may be for the next 2 quarters but some of them may be for multiple years. I can say the same regarding our prepaids. Our prepaids are predesigned to make sure that we have the reserve capacity that we need as several of our manufacturing suppliers as we look forward.
So wouldn't read into anything regarding approximately about the same numbers as we are increasing our supply. All of them just have different lengths as we have sometimes had to buy things in long lead times or things that need a capacity to be built for us.”
There was an important question about that pertains to our thesis that Nvidia will become a predominant player for AI software. Right now, software is at a $1 billion run rate. The comment below was the first that I can recall where the CEO was more detailed as to how Nvidia will become a force in AI software. I’m quoting it in full here as a follow up to our deep dive on AI software in July of 2022:
Answer Jensen Huang (Executives)
Let me take a step back and explain the fundamental reason why NVIDIA will be very successful in software. […] If you don't have software, you can't open new markets. If you don't have software, you can't open and enable new applications. Software is fundamentally necessary for accelerated computing. This is the fundamental difference between accelerated computing and general-purpose computing that most people took a long time to understand. And now people understand that software is really key.
And the way that we work with CSPs, that's really easy. We have large teams that are working with their large teams. However, now that generative AI is enabling every enterprise and every enterprise software company to embrace accelerated computing, and when it is now essential to embrace accelerated computing because it is no longer possible, no longer likely anyhow, to sustain improved throughput through just general-purpose computing, all of these enterprise software companies and enterprise companies don't have large engineering teams to be able to maintain and optimize their software stack to run across all of the world's clouds and private clouds and on-prem.
So we are going to do the management, the optimization, the patching, the tuning, the installed base optimization for all of their software stacks. And we containerize them into our stack called NVIDIA AI Enterprise. And the way we go to market with it is think of that NVIDIA AI Enterprise now as a run time like an operating system. It's an operating system for artificial intelligence. And we charge $4,500 per GPU per year. And my guess is that every enterprise in the world, every software enterprise company that are deploying software in all the clouds and private clouds and on-prem will run on NVIDIA AI Enterprise, especially obviously, for our GPUs. And so this is going to likely be a very significant business over time. We're off to a great start. And Colette mentioned that it's already at $1 billion run rate and we're really just getting started.
Conclusion:
The I/O Fund portfolio is on fire right now. Our audited results from last year will be out soon, and those results will put us in the 90th percentile of all funds in the world for 2023 and also on a 4-year cumulative basis. From there, the first two months of 2024 have been extraordinary as we positioned for Q1 with a high allocation to many year-to-date winners. However, we do not think it will always remain this way – tech cannot remain in favor forever.
As you know from our pre-earnings writeup, we think Nvidia’s hitting peak growth is “tricky” for investors while acknowledging the valuation is eerily low still — it is very unusual for a stock to be up 250% in a year and yet be cheaper than it was at its bottom (Oct 2022 for Nvidia). The valuation is what makes it a buy on any dips. However, we also won’t be shy about taking gains if we reach predefined price targets. We have one in mind for Nvidia, let’s see if we get there for our next trim.
Too many investors ride high on paper gains, and subsequently lose those gains. We don’t want to choose between holding a high conviction stock and making money. Instead, we want it all – put some money in the bank, lock-in gains, yet hold the stock for the long haul at a high allocation and hedge if tech falls out of favor.
We will keep doing our very best to bring you quality winners alongside risk management with the ultimate goal of answering the million-dollar or billion-dollar question, which is how to safely participate in the life changing gains tech has to offer. We do not believe this question has been satisfactorily answered. Which is why if you see us hit our price target on Nvidia … and trim our high conviction stock … but buy aggressively on dips — then, you’ll know we are working hard to answer this question for our members.
Nvidia’s much-anticipated Q4 earnings report saw the AI GPU leader post another large beat and raise as it reported revenue growth of 265% YoY. Nvidia guided fiscal Q1 revenues nearly $2 billion above consensus on top of its almost $2 billion revenue beat in Q4, mirroring what we saw in Q3 as demand for its H100 Hopper GPUs remains elevated.
The consistency and magnitude of the top-line beats is impressive, with Q1’s guide signaling three quarters in a row of revenue growth above 200%. However, it’s the growth further down the income statement where Nvidia’s report truly shines. Nvidia’s stronghold grip on the data center market at the moment combined with pricing power and elevated demand for its H100 GPU has allowed substantial growth in operating income and has generated robust earnings.
Q4 revenue was $22.1 billion, beating estimates by 7.56%. This represented YoY growth of 265%, a 60 percentage point acceleration from 205% YoY in Q3.
FY24 revenue was $60.92 billion, an increase of 126% YoY.
Q1 revenue was guided at $24 billion, +/- 2%, ahead of estimates for ~$21.9 billion. This represents YoY growth of 235%, or a 30 percentage point deceleration from Q4’s growth rate. We had covered in our pre-earnings write up that revenue growth will peak in Q4 for now at the 265%. This seems to still be the case unless next quarter comes in at $2.2 billion over the current guide. As we have seen these past few quarters, it’s not out of the question that Nvidia beats by this much next quarter. However, it’s looking less likely that Nvidia can sustain this peak growth as we move into the second half of the year.
Q4 GAAP EPS of $4.93 beat estimates by 16.8%, representing YoY growth of 765%.
Q4 adjusted EPS of $5.16 beat estimates by 11.2%, representing YoY growth of 486%.
Margins:
Nvidia’s Q4 report highlighted the incredibly strong leverage and margin expansion that the rapid growth in the data center is driving.
GAAP gross margin was 76% in Q4, and adjusted gross margin was 76.7%, an expansion of 1270 and 1060 bp YoY respectively.
GAAP operating margin was 61.6% in Q4, and adjusted operating margin was 66.7%, an expansion of 4080 and 2990 bp YoY respectively.
GAAP net margin was 55.6% in Q4, and adjusted net margin was 58.1%, an expansion of 3320 and 2220 bp YoY respectively.
Notably, Nvidia is guided “Beyond Q1, for the remainder of the year, we expect gross margins to return to the mid-70s percent range.” It was mentioned on the call that the slightly softer gross might be caused by the higher cost of HBM3.
For FY24, GAAP gross margin was 72.7% up from 56.9% in FY23. Adjusted gross margin was 73.8% up from 59.2% in FY23.
For FY24, GAAP operating margin was 54.1% up from 15.7% in FY23. Adjusted operating margin was 60.9% up from 33.5% in FY23.
For FY24, GAAP net margin was 48.9% up from 16.2% in FY23. Adjusted net margin was 53% up from in FY23.
Cash Flows:
Cash on hand was $26.0 billion, an increase from $18.3 billion in Q3 and $13.3 billion in the year ago quarter.
Operating cash flow was $11.5 billion in Q4, an increase of 411% YoY. FY24 operating cash flow increased 416% YoY to $28.1 billion. For FY24, operating cash flow more than doubled to 46.1%, compared to 20.9% in FY23.
Free cash flow was $11.2 billion in Q4, an increase of 546% YoY as FCF margin topped 50%. For FY24, free cash flow increased 618% YoY to $26.9 billion. Free cash flow margin more than tripled to 44.2% from 13.9% last year.
Debt totaled $10.95 billion.
Key Segments:
Data Center:
Data center revenue dazzled again, with Nvidia attributing the growth to “higher shipments of the NVIDIA Hopper GPU computing platform” alongside growth for InfiniBand. Revenues rose 409% YoY and 27% QoQ to $18.4 billion – in other words, a $3.9 billion increase from Q3. Nvidia generated $47.5 billion in data center revenues in FY24, up 217% YoY from $15 billion in FY23.
This is what they mean by “hockey stick” growth:
To put just how rapid this ascent in data center revenues has been, this year’s $47.5 billion in revenue is 18% more than total revenues in the segment for the past five years combined – Nvidia generated $40.2 billion in data center revenue between FY18 through FY23.
According to the CFO commentary on the call for next quarter: “We expect sequential growth in data center and ProViz, partially offset by seasonal decline in Gaming.” As our pre-earnings writeup pointed out, a few analysts were modeling $25 billion data center quarters (for $100 billion per year), so it makes sense that we will see sequential growth in the data center into the foreseeable future.
The CFO also stated that 40% of data center revenue is from inference. This is the first I remember management discussing the percentage that is from inference, and I believe that’s because AMD is pushing hard on the narrative that the MI300s will specifically outperform on inference.
Regarding China, the following was stated: “Growth was strong across all regions except for China, where our Data Center revenue declined significantly following the U.S. government export control regulations imposed in October. Although we have not received licenses from the U.S. government to ship restricted products to China, we have started shipping alternatives that don't require a license for the China market. China represented a mid-single-digit percentage of our Data Center revenue in Q4, and we expect it to stay in a similar range in the first quarter.”
Gaming:
Gaming revenue in Q4 was $2.9 billion, representing a 56% YoY increase against a softer comp and flat growth QoQ. FY24 revenue was $10.4 billion, up 15% YoY.
Pro Viz
Pro Visualization revenue in Q4 was $463 million, up 105% YoY and 11% QoQ. FY24 revenue in the segment was $1.6 billion, up 1% YoY.
Automotive:
Automotive revenue was $281 million in Q4, up 8% QoQ but down 4% YoY. FY24 revenue was $1.1 billion, up 21% YoY as more automakers in China adopt Nvidia’s Drive platform for autonomous driving capabilities.
Additional Notes:
Nvidia’s rapid top-line growth is the primary eye-catching statistic, as no other companies in tech can report such blistering revenue growth at a rate above 200% for multiple quarters at an annualized revenue rate near $90 billion. However, the strengths of Nvidia’s report lie within the operating leverage that this growth is driving.
Operating income in Q4 increased 983% YoY to $13.6 billion, driving a 769% increase in net income to $12.3 billion.
For the full year, operating income of 681% to nearly $33.0 billion, up from $4.2 billion in FY23, while net income rose 581% YoY to $29.8 billion from $4.3 billion in FY23. FY24’s GAAP EPS of $11.93 was nearly 6x higher than FY23’s $1.74.
Cash flow generation surged, with OCF margin more than doubling and FCF margin tripling in FY24. OCF and FCF have increased sequentially each quarter this year, as top-line growth is flowing directly through to the bottom line.
Earnings Call:
There wasn’t much to dissect in the earnings call as what was delivered was another blowout quarter. However, there were some questions on supply that I want to note here. It’s no secret that demand is greater than supply, hence these blowout quarters. It did seem analysts were poking holes at what the timing could be as to when supply won’t be able to continue to afford this extraordinary growth. The answers to the questions were not very informative, rather I’m noting that this seems to the be predominant concern among the analysts even if management chose to remain vague.
Question Stacy Rasgon (Analysts)
I wanted to — Colette, I wanted to touch on your comments that you expected the next generation of products, so that black well [B100s] to be supply constrained. Can you dig into that a little bit? What is the driver of that? Why does that get constrained as Hopper is easing up? And how long do you expect that to be constrained? Like do you expect the next generation to be constrained like all the way through calendar '25? Like when do those start to ease?
Answer Jensen Huang (Executives)
Yes. The first thing is overall, our supply is improving. Overall, our supply chain is just doing an incredible job for us. Everything from, of course, the wafers, the packaging, the memories, all of the power regulators to transceivers and networking and cables, and you name it, the list of components that we ship […] The supply chain is really doing fantastic supporting us. And so overall, the supply is improving. We expect the demand will continue to be stronger than our supply provides, and through the year and we'll do our best. The cycle times are improving and we're going to continue to do our best. However, whenever we have new products, as you know, it ramps from 0 to a very large number, and you can't do that overnight. Everything is ramped up. It doesn't step up. And so whenever we have a new generation of products and right now, we are ramping H200s, there's no way we can reasonably keep up on demand in the short term as we ramp […] So we'll — with all new products, demand is greater than supply. And that's just kind of the nature of new products, and we work as fast as we can to catch up with the demand. But overall, net-net, overall, our supply is increasing very nicely.”
Here was another question on supply that was shrugged off, so to speak, yet helps our Members to understand the Q&A had a few analysts focused on figuring out the supply constraints:
Question Timothy Arcuri (Analysts)
I wanted to ask about how you're converting backlog into revenue. Obviously, lead times for your products have come down quite a bit. Colette, you didn't talk about the inventory purchase commitments, but if I sort of add up your inventory plus the purchase commits and your prepaid supply, sort of the aggregate of your supply, it was actually down a touch. How should we read that? Is that just you saying that you don't need to take as much of a financial commitment to your suppliers because the lead times are lower? Or is that maybe you're reaching some sort of steady state where you're closer to filling your order book and your backlog?
Answer Colette Kress (Executives)
Yes. So let me highlight on those three different areas of how we look at our suppliers. You're correct. Our inventory on hand, given our allocation that we're on, we're trying to, as things come into inventory, immediately work to ship them to our customers. I think our customer appreciates our ability to meet the schedules that we've looked for.
The second piece of it is our purchase commitments. Our purchase commitments have many different components into it, component that we need for manufacturing but also often we are procuring capacity that we need. The length of that need for capacity or the length of the components are all different. Some of them may be for the next 2 quarters but some of them may be for multiple years. I can say the same regarding our prepaids. Our prepaids are predesigned to make sure that we have the reserve capacity that we need as several of our manufacturing suppliers as we look forward.
So wouldn't read into anything regarding approximately about the same numbers as we are increasing our supply. All of them just have different lengths as we have sometimes had to buy things in long lead times or things that need a capacity to be built for us.”
There was an important question about that pertains to our thesis that Nvidia will become a predominant player for AI software. Right now, software is at a $1 billion run rate. The comment below was the first that I can recall where the CEO was more detailed as to how Nvidia will become a force in AI software. I’m quoting it in full here as a follow up to our deep dive on AI software in July of 2022:
Answer Jensen Huang (Executives)
Let me take a step back and explain the fundamental reason why NVIDIA will be very successful in software. […] If you don't have software, you can't open new markets. If you don't have software, you can't open and enable new applications. Software is fundamentally necessary for accelerated computing. This is the fundamental difference between accelerated computing and general-purpose computing that most people took a long time to understand. And now people understand that software is really key.
And the way that we work with CSPs, that's really easy. We have large teams that are working with their large teams. However, now that generative AI is enabling every enterprise and every enterprise software company to embrace accelerated computing, and when it is now essential to embrace accelerated computing because it is no longer possible, no longer likely anyhow, to sustain improved throughput through just general-purpose computing, all of these enterprise software companies and enterprise companies don't have large engineering teams to be able to maintain and optimize their software stack to run across all of the world's clouds and private clouds and on-prem.
So we are going to do the management, the optimization, the patching, the tuning, the installed base optimization for all of their software stacks. And we containerize them into our stack called NVIDIA AI Enterprise. And the way we go to market with it is think of that NVIDIA AI Enterprise now as a run time like an operating system. It's an operating system for artificial intelligence. And we charge $4,500 per GPU per year. And my guess is that every enterprise in the world, every software enterprise company that are deploying software in all the clouds and private clouds and on-prem will run on NVIDIA AI Enterprise, especially obviously, for our GPUs. And so this is going to likely be a very significant business over time. We're off to a great start. And Colette mentioned that it's already at $1 billion run rate and we're really just getting started.
Conclusion:
The I/O Fund portfolio is on fire right now. Our audited results from last year will be out soon, and those results will put us in the 90th percentile of all funds in the world for 2023 and also on a 4-year cumulative basis. From there, the first two months of 2024 have been extraordinary as we positioned for Q1 with a high allocation to many year-to-date winners. However, we do not think it will always remain this way – tech cannot remain in favor forever.
As you know from our pre-earnings writeup, we think Nvidia’s hitting peak growth is “tricky” for investors while acknowledging the valuation is eerily low still — it is very unusual for a stock to be up 250% in a year and yet be cheaper than it was at its bottom (Oct 2022 for Nvidia). The valuation is what makes it a buy on any dips. However, we also won’t be shy about taking gains if we reach predefined price targets. We have one in mind for Nvidia, let’s see if we get there for our next trim.
Too many investors ride high on paper gains, and subsequently lose those gains. We don’t want to choose between holding a high conviction stock and making money. Instead, we want it all – put some money in the bank, lock-in gains, yet hold the stock for the long haul at a high allocation and hedge if tech falls out of favor.
We will keep doing our very best to bring you quality winners alongside risk management with the ultimate goal of answering the million-dollar or billion-dollar question, which is how to safely participate in the life changing gains tech has to offer. We do not believe this question has been satisfactorily answered. Which is why if you see us hit our price target on Nvidia … and trim our high conviction stock … but buy aggressively on dips — then, you’ll know we are working hard to answer this question for our Members.
When looking at Nvidia’s forward estimates, what stands out is that revenue growth will peak this quarter at 239%. This can be a tricky place for a tech investor when what’s ahead is slowing growth.
Nvidia could raise and beat, as it’s had a penchant for doing lately, but the slowing growth will eventually catch up to the stock and analysts are pegging H2 for this to happen. To contrast, Nvidia will top over the next two quarters according to revenue growth rates whereas AMD is bottoming.
It’s unclear how much of Nvidia’s expected $100 billion for the data center in FY2025 is priced in. This has been discussed since at least the last quarter’s earnings report, yet the valuation is still very reasonable. We look at this and more below to prepare you for the most anticipated earnings report of the quarter.
Revenue and Earnings:
Nvidia is expected to report revenue growth of 239.4% for revenue of $20.54 billion for fiscal Q4 ending in January. These estimates have been steadily rising since the H100-related historic quarter last May. Last spring, the January quarter was expected to report 40% growth, and by November, the January quarter estimates were at 195%. I want to paint a picture for why Nvidia’s price action has been so strong – these revised estimates create ample room in the valuation.
For next quarter, estimates are for 204.94% growth for revenue of $21.93 billion.
Fiscal year 2024 ending in January is expected to report revenue of $59.3 billion for growth of 119.7%.
For fiscal year 2025, the company is expected to report revenue of $94.1 billion for growth of 58.9% with the growth overweight in the first half of calendar year 2024.
Even if we see a beat and raise, the slowing growth in the second half will be hard to overcome due to high comps. As mentioned in the introduction, Nvidia will begin to lap some stellar quarters come the October CY2024 quarter as the growth in October of CY2023 was 205.5% YoY.
Note: See below for bullish scenarios from analysts where these estimates may be too low.
Earnings growth is similar to revenue growth where the current quarter and also next quarter are expected to be stellar.
Q4 FY2024 January quarter is expected to report growth of 426.4% for EPS of $4.63
Q1 FY2025 April quarter is expected to report growth of 354.8% for EPS of $4.96
From there, the July quarter is also strong at 95.4% growth yet tapers off as the company laps the high comps in the October quarter at 41.4%.
EPS growth of 40%+ is nothing to scoff at, yet the exuberance that pushed Nvidia to achieve a market cap of $1.8 trillion to where it is now the world’s second most valuable company blowing past Meta, Tesla and edging out Amazon, Alphabet is what must sustain. Fundamentals that decelerate are when the exuberance tends to wear off, and that is right around Fall of 2024 as of now.
For EPS the growth decelerates in line with revenue growth:
FY2024 ending in January is expected to report full year EPS of $12.40 for growth of 271.1%
FY2025 has estimates of $21.36 EPS for growth of 72.32% — as stated, right now, this is front half weighted
FY2026 has estimates of $26.54 EPS for growth of 24.24%
We broke our portfolio management rules of having a position above 10% allocation, and therefore, we have to take it seriously that both the top line and bottom line will decelerate from >200% to 40% over the span of six months. Most analysts are in agreement that a beat/raise is likely after hours tomorrow and perhaps for next quarter. What we are keeping an eye on is further out when Nvidia laps the strong quarters in October of this year. That is a long way off, but the market is forward-looking by about 9 months.
According to current estimates, there is no acceleration on the horizon through 2026. We think those estimates will ultimately be wrong especially once AI software ramps, but for now, this is the estimates investors are working with for pricing the stock.
Margins:
Gross margin of 74.5% expected this quarter compares to GAAP GM of 63.3% in the year ago quarter. This equals $14.9 billion in gross profit. The adjusted gross margin is expected to be 75.5% this quarter.
Operating margin of 58.7% is expected this quarter for operating profit of $11.7 billion. The adjusted operating margin is expected to be 64.5%.
Last quarter, net margin was 51% for net profit of $9.25 billion and adjusted net margin was 55.3% for adjusted profit of $10.02 billion.
Cash Flow:
When we compare the world’s most valuable companies, Apple stands out for its cash. This is where Nvidia will have to improve to ultimately surpass Apple. During the hype cycle of AI software is where that is most likely to occur.
Nvidia’s cash flow is still strong, yet it doesn’t hurt to compare it to other Mag 7 stocks:
Nvidia is the third strongest cash flow generator in the Mag 7, with an operating cash flow margin above 40%, but its smaller scale puts it in sixth place in terms of cash flow generation on a dollar basis. Nvidia’s $17.5 billion in TTM free cash flow pales in comparison to Microsoft’s and Alphabet’s nearly $70 billion – and while it’s not necessarily fair to compare companies in different tech verticals, Nvidia’s rapid ascent to a valuation above Alphabet and Amazon at some point will need to be reflected in the scope of its cash flows, especially when growth begins to decelerate.
Revenue Segments:
Data center revenue last quarter was $14.5 billion, up 279% YoY. This compares to 31% growth in the year ago quarter. For this upcoming quarter, Nvidia is expected to report data center revenue of $16.9 billion for growth of 367%, which we outlined here along with a few different scenarios including how Nvidia can get to data center revenue of $101 billion in fiscal year 2025. Note that some of the data center revenue is also driven by networking for AI system with InfiniBand up 500% last quarter to $10 billion annualized run rate. We will update you more on networking after Nvidia’s report tomorrow and also when Marvell reports early March.
Gaming revenue of $2.86 billion is up 81% YoY. This compares to a decline of (-23%) YoY in the year ago quarter.
Pro Visualization was up 108% YoY for revenue of $416 million compared to a decline of (-65%) YoY in the year ago quarter.
Automotive revenue of $261 million was up 4% YoY compared to 86% growth in the year ago quarter.
Additional Notes:
Analysts are Bullish
Bullish is the common theme heading into the report, given that Nvidia has raced from 13% growth in Q1 to 235% expected growth in Q4, and nothing describes the exuberance that accompanies this historic acceleration better than a handful of analyst estimates.
It’s within the data center that this bullishness is visible, as some analysts are expecting a nearly 20% beat on the Street’s $16.8 billion estimate, up to 60% higher than the Street by end of fiscal 2025.
Loop Capital is Nvidia’s largest bull heading into earnings, attaching a Street-high $1,200 price target on shares as the firm believes data center and overall revenue growth through FY 2026 will be meaningfully above the Street’s estimates. Loop is modeling a 17% beat in data center revenue to $19.6 billion, the highest on the Street, driving a 14% beat in total revenue to $23.1 billion.
Loop is projecting the data center to reach a $100 billion annual run rate by fiscal Q2 2025, closing the year out with data center revenue of $117.5 billion, 41% higher than the Street’s consensus of $83 billion. Overall, Loop is modeling more than $132.3 billion in total revenue for Nvidia next year, 38% higher than consensus at $95.8 billion and representing 123% YoY growth, 65 percentage points above the Street.
It is entirely plausible that Nvidia’s growth continues to fly past expectations and mirror a scenario similar to what Loop is modeling, given the elevated levels of demand for its H100 combining with the launch of its faster H200 and B100 GPUs later this year.
KeyBanc sees that Nvidia’s AI capacity is well above the Street and can support data center revenues above $100 billion in calendar 2024, nearly 30% higher than what the Street is modeling. In that sense, there still may be room for another surprise in 2024.
UBS follows closely behind Loop with expectations for a similarly large data center beat in Q4 and impressive Q1 guide on strong demand for AI compute. Analysts are expecting Nvidia to beat on data center revenue by ~$2.5 billion to $3 billion, with their estimate at $19.5 billion for the segment and $23 billion for total revenue. UBS also believes that with “supply chain work,” Nvidia could guide to $25 billion to $26 billion in revenue for fiscal Q1, more than 16% above consensus estimates for $21.9 billion.
BofA is more tame than Loop and UBS, calling for a modest 3-5% beat, or between $500 million to $1 billion above consensus for Q4’s report and Q1’s guide. This view for a beat and raise stems from supply gains offsetting impacts from China restrictions. However, BofA cautions that a beat of this size “’would pale vs. the 10%/22% beat/raise of prior quarters and perhaps disappoint some bulls,’ the more measured pace will also be seen as creating more fertile ground for continued growth.”
Meanwhile, going back to Q3’s report in November, analysts at Barclays said that the Nvidia's large Q3 beat “may not have cleared a very high hurdle,” and "didn't quite meet sky-high expectations" at "only" $2B ahead of consensus with margins at 75% and increasing into January. That commentary serves as a clear, yet somewhat brutal, reminder that even a $2 billion beat and raise had a muted response.
Market Shifts in Anticipation of Growth Rate Changes
An interesting pattern has been playing out with Nvidia’s stock price over the past few years as its quarterly revenue growth rate has shifted.
Nvidia’s shares topped in November and December 2021, around 7 months before growth decelerated from the 50% range to just 3% growth in the July quarter. Shares bottomed in October 2022, 7 months in advance of revenues inflecting off a (21%) decline in the January quarter to a (13%) decline in the April quarter.
Current estimates are calling for a significant deceleration to just 38% growth in the October quarter, and if this pattern continues, then we are at the brink of setting a top above the $700 range as the market anticipates this deceleration.
H200 and B100 to Launch in Q2 and Q4
Nvidia has an ambitious AI GPU roadmap, and is expected to release the next-gen H200 and B100 GPUs later this year, just over one year after releasing the H100.
The GPUs are expected to offer another leap in performance for AI training and inference, and the H200 is already in demand by the leading CSPs – AWS will be the first to deploy the new GPU, but Microsoft, Google and Oracle will also be deploying the chips.
It’s easy to see why the cloud giants are eager to upgrade quickly — Nvidia says the H200 will boast reduced energy usage and thus a lower TCO, while the introduction of HBM3e memory will essentially supercharge the GPU’s performance. For GPT-3 175B, the H200 is expected to offer 1.4x to 1.9x faster LLM inference on the leading GPT and Llama models compared to the H100, and an 18x performance upgrade compared to the A100.
While it will be too soon to gauge what level of demand there is for the two new GPUs from a Q1 guide, a fiscal year guide could provide insight into whether demand for the H200 and B100 can match the H100, or if Nvidia will face initial supply constraints while ramping production of the two at the same time. Additionally, Nvidia will face competition this year from AMD’s MI300s.
A Note on China:
We detailed in our Q3 report the risks surrounding China given its importance to Nvidia as well as the export restrictions impacting Nvidia’s ability to sell the A100 and H100. Nvidia’s CFO said last quarter that “export controls will have a negative effect on our China business, and we do not have good visibility into the magnitude of that impact even over the long term.”
Any China commentary will be critical, given the $80 billion to $100 billion data center segment that may be impacted. Keybanc has the $101 billion estimate for the data center segment this year yet believes that $20 billion is dependent on China. Per our write-up: “Keybanc sees a $5 impact to Nvidia’s $25.62 EPS estimate, and up to a $20B impact to its data center segment with current estimates at $101B for the data center in FY2025.”
Valuation:
Fundamentally, Nvidia’s valuation is still quite cheap compared to historical benchmarks, given the sheer leverage and earnings power that the H100 is driving.
Shares are trading at a 91x PE and 32x forward PE ratio, and though it may look elevated, it’s not a range that Nvidia is unaccustomed to – shares traded between a 75x to 100x PE ratio for a majority of the time from the second half of 2020 to early 2022. However, Nvidia’s forward PE of 32x is where the valuation has room to run. Shares bottomed in October 2022 at a 34x forward PE with declining revenue and EPS, compared to today, where EPS is expected to grow at least 73% YoY to $21.36.
On a PS basis, Nvidia still looks reasonably valued, with more potential upside if it can surprise again in 2024. Shares are trading at a forward PS of just over 18x, around the same level it held through the second half of 2023 and a steep discount to the 32x forward PS it peaked at in late 2021. Prior to 2023, Nvidia last traded at around an 18x forward PS in July and August 2022, despite the challenging macro headwinds and declining revenue growth.
Conclusion:
Our process is such that we have no issues placing Nvidia at a lower allocation if needed, or increasing that allocation back to the #1 position if needed. We want to remain flexible while acknowledging two things – the first, is the company will eventually lap high comps and the sky-high growth will not sustain forever. Secondly, that this company is the defacto leader in the multi-generational investment opportunity of AI and is trading at a reasonable valuation.
It’s entirely plausible we get a beat/raise tomorrow and a beat/raise for the next quarter. What needs to be watched is the H2 estimates as they lap high comps of 200%+. The first graph above best illustrates this.
With that said, we are in the first, early powerful move for AIfirst, early powerful move for AI. We have two more powerful moves to go — AI software and AI at the edge, and then automotive will be the grand finale. Nvidia is a leader in both, and I’ve been our stance is that AI software for Nvidia specifically will drive more revenue than AI accelerators. We are seeing early indication that Nvidia can and will compete with Big Tech on AI software and AI at the edge with the Chat with RTX application.
When looking at Nvidia’s forward estimates, what stands out is that revenue growth will peak this quarter at 239%. This can be a tricky place for a tech investor when what’s ahead is slowing growth.
Nvidia could raise and beat, as it’s had a penchant for doing lately, but the slowing growth will eventually catch up to the stock and analysts are pegging H2 for this to happen. To contrast, Nvidia will top over the next two quarters according to revenue growth rates whereas AMD is bottoming.
It’s unclear how much of Nvidia’s expected $100 billion for the data center in FY2025 is priced in. This has been discussed since at least the last quarter’s earnings report, yet the valuation is still very reasonable. We look at this and more below to prepare you for the most anticipated earnings report of the quarter.
Revenue and Earnings:
Nvidia is expected to report revenue growth of 239.4% for revenue of $20.54 billion for fiscal Q4 ending in January. These estimates have been steadily rising since the H100-related historic quarter last May. Last spring, the January quarter was expected to report 40% growth, and by November, the January quarter estimates were at 195%. I want to paint a picture for why Nvidia’s price action has been so strong – these revised estimates create ample room in the valuation.
For next quarter, estimates are for 204.94% growth for revenue of $21.93 billion.
Fiscal year 2024 ending in January is expected to report revenue of $59.3 billion for growth of 119.7%.
For fiscal year 2025, the company is expected to report revenue of $94.1 billion for growth of 58.9% with the growth overweight in the first half of calendar year 2024.
Even if we see a beat and raise, the slowing growth in the second half will be hard to overcome due to high comps. As mentioned in the introduction, Nvidia will begin to lap some stellar quarters come the October CY2024 quarter as the growth in October of CY2023 was 205.5% YoY.
Note: See below for bullish scenarios from analysts where these estimates may be too low.
Earnings growth is similar to revenue growth where the current quarter and also next quarter are expected to be stellar.
Q4 FY2024 January quarter is expected to report growth of 426.4% for EPS of $4.63
Q1 FY2025 April quarter is expected to report growth of 354.8% for EPS of $4.96
From there, the July quarter is also strong at 95.4% growth yet tapers off as the company laps the high comps in the October quarter at 41.4%.
EPS growth of 40%+ is nothing to scoff at, yet the exuberance that pushed Nvidia to achieve a market cap of $1.8 trillion to where it is now the world’s second most valuable company blowing past Meta, Tesla and edging out Amazon, Alphabet is what must sustain. Fundamentals that decelerate are when the exuberance tends to wear off, and that is right around Fall of 2024 as of now.
For EPS the growth decelerates in line with revenue growth:
FY2024 ending in January is expected to report full year EPS of $12.40 for growth of 271.1%
FY2025 has estimates of $21.36 EPS for growth of 72.32% — as stated, right now, this is front half weighted
FY2026 has estimates of $26.54 EPS for growth of 24.24%
We broke our portfolio management rules of having a position above 10% allocation, and therefore, we have to take it seriously that both the top line and bottom line will decelerate from >200% to 40% over the span of six months. Most analysts are in agreement that a beat/raise is likely after hours tomorrow and perhaps for next quarter. What we are keeping an eye on is further out when Nvidia laps the strong quarters in October of this year. That is a long way off, but the market is forward-looking by about 9 months.
According to current estimates, there is no acceleration on the horizon through 2026. We think those estimates will ultimately be wrong especially once AI software ramps, but for now, this is the estimates investors are working with for pricing the stock.
Margins:
Gross margin of 74.5% expected this quarter compares to GAAP GM of 63.3% in the year ago quarter. This equals $14.9 billion in gross profit. The adjusted gross margin is expected to be 75.5% this quarter.
Operating margin of 58.7% is expected this quarter for operating profit of $11.7 billion. The adjusted operating margin is expected to be 64.5%.
Last quarter, net margin was 51% for net profit of $9.25 billion and adjusted net margin was 55.3% for adjusted profit of $10.02 billion.
Cash Flow:
When we compare the world’s most valuable companies, Apple stands out for its cash. This is where Nvidia will have to improve to ultimately surpass Apple. During the hype cycle of AI software is where that is most likely to occur.
Nvidia’s cash flow is still strong, yet it doesn’t hurt to compare it to other Mag 7 stocks:
Nvidia is the third strongest cash flow generator in the Mag 7, with an operating cash flow margin above 40%, but its smaller scale puts it in sixth place in terms of cash flow generation on a dollar basis. Nvidia’s $17.5 billion in TTM free cash flow pales in comparison to Microsoft’s and Alphabet’s nearly $70 billion – and while it’s not necessarily fair to compare companies in different tech verticals, Nvidia’s rapid ascent to a valuation above Alphabet and Amazon at some point will need to be reflected in the scope of its cash flows, especially when growth begins to decelerate.
Revenue Segments:
Data center revenue last quarter was $14.5 billion, up 279% YoY. This compares to 31% growth in the year ago quarter. For this upcoming quarter, Nvidia is expected to report data center revenue of $16.9 billion for growth of 367%, which we outlined here along with a few different scenarios including how Nvidia can get to data center revenue of $101 billion in fiscal year 2025. Note that some of the data center revenue is also driven by networking for AI system with InfiniBand up 500% last quarter to $10 billion annualized run rate. We will update you more on networking after Nvidia’s report tomorrow and also when Marvell reports early March.
Gaming revenue of $2.86 billion is up 81% YoY. This compares to a decline of (-23%) YoY in the year ago quarter.
Pro Visualization was up 108% YoY for revenue of $416 million compared to a decline of (-65%) YoY in the year ago quarter.
Automotive revenue of $261 million was up 4% YoY compared to 86% growth in the year ago quarter.
Additional Notes:
Analysts are Bullish
Bullish is the common theme heading into the report, given that Nvidia has raced from 13% growth in Q1 to 235% expected growth in Q4, and nothing describes the exuberance that accompanies this historic acceleration better than a handful of analyst estimates.
It’s within the data center that this bullishness is visible, as some analysts are expecting a nearly 20% beat on the Street’s $16.8 billion estimate, up to 60% higher than the Street by end of fiscal 2025.
Loop Capital is Nvidia’s largest bull heading into earnings, attaching a Street-high $1,200 price target on shares as the firm believes data center and overall revenue growth through FY 2026 will be meaningfully above the Street’s estimates. Loop is modeling a 17% beat in data center revenue to $19.6 billion, the highest on the Street, driving a 14% beat in total revenue to $23.1 billion.
Loop is projecting the data center to reach a $100 billion annual run rate by fiscal Q2 2025, closing the year out with data center revenue of $117.5 billion, 41% higher than the Street’s consensus of $83 billion. Overall, Loop is modeling more than $132.3 billion in total revenue for Nvidia next year, 38% higher than consensus at $95.8 billion and representing 123% YoY growth, 65 percentage points above the Street.
It is entirely plausible that Nvidia’s growth continues to fly past expectations and mirror a scenario similar to what Loop is modeling, given the elevated levels of demand for its H100 combining with the launch of its faster H200 and B100 GPUs later this year.
KeyBanc sees that Nvidia’s AI capacity is well above the Street and can support data center revenues above $100 billion in calendar 2024, nearly 30% higher than what the Street is modeling. In that sense, there still may be room for another surprise in 2024.
UBS follows closely behind Loop with expectations for a similarly large data center beat in Q4 and impressive Q1 guide on strong demand for AI compute. Analysts are expecting Nvidia to beat on data center revenue by ~$2.5 billion to $3 billion, with their estimate at $19.5 billion for the segment and $23 billion for total revenue. UBS also believes that with “supply chain work,” Nvidia could guide to $25 billion to $26 billion in revenue for fiscal Q1, more than 16% above consensus estimates for $21.9 billion.
BofA is more tame than Loop and UBS, calling for a modest 3-5% beat, or between $500 million to $1 billion above consensus for Q4’s report and Q1’s guide. This view for a beat and raise stems from supply gains offsetting impacts from China restrictions. However, BofA cautions that a beat of this size “’would pale vs. the 10%/22% beat/raise of prior quarters and perhaps disappoint some bulls,’ the more measured pace will also be seen as creating more fertile ground for continued growth.”
Meanwhile, going back to Q3’s report in November, analysts at Barclays said that the Nvidia's large Q3 beat “may not have cleared a very high hurdle,” and "didn't quite meet sky-high expectations" at "only" $2B ahead of consensus with margins at 75% and increasing into January. That commentary serves as a clear, yet somewhat brutal, reminder that even a $2 billion beat and raise had a muted response.
Market Shifts in Anticipation of Growth Rate Changes
An interesting pattern has been playing out with Nvidia’s stock price over the past few years as its quarterly revenue growth rate has shifted.
Nvidia’s shares topped in November and December 2021, around 7 months before growth decelerated from the 50% range to just 3% growth in the July quarter. Shares bottomed in October 2022, 7 months in advance of revenues inflecting off a (21%) decline in the January quarter to a (13%) decline in the April quarter.
Current estimates are calling for a significant deceleration to just 38% growth in the October quarter, and if this pattern continues, then we are at the brink of setting a top above the $700 range as the market anticipates this deceleration.
H200 and B100 to Launch in Q2 and Q4
Nvidia has an ambitious AI GPU roadmap, and is expected to release the next-gen H200 and B100 GPUs later this year, just over one year after releasing the H100.
The GPUs are expected to offer another leap in performance for AI training and inference, and the H200 is already in demand by the leading CSPs – AWS will be the first to deploy the new GPU, but Microsoft, Google and Oracle will also be deploying the chips.
It’s easy to see why the cloud giants are eager to upgrade quickly — Nvidia says the H200 will boast reduced energy usage and thus a lower TCO, while the introduction of HBM3e memory will essentially supercharge the GPU’s performance. For GPT-3 175B, the H200 is expected to offer 1.4x to 1.9x faster LLM inference on the leading GPT and Llama models compared to the H100, and an 18x performance upgrade compared to the A100.
While it will be too soon to gauge what level of demand there is for the two new GPUs from a Q1 guide, a fiscal year guide could provide insight into whether demand for the H200 and B100 can match the H100, or if Nvidia will face initial supply constraints while ramping production of the two at the same time. Additionally, Nvidia will face competition this year from AMD’s MI300s.
A Note on China:
We detailed in our Q3 report the risks surrounding China given its importance to Nvidia as well as the export restrictions impacting Nvidia’s ability to sell the A100 and H100. Nvidia’s CFO said last quarter that “export controls will have a negative effect on our China business, and we do not have good visibility into the magnitude of that impact even over the long term.”
Any China commentary will be critical, given the $80 billion to $100 billion data center segment that may be impacted. Keybanc has the $101 billion estimate for the data center segment this year yet believes that $20 billion is dependent on China. Per our write-up: “Keybanc sees a $5 impact to Nvidia’s $25.62 EPS estimate, and up to a $20B impact to its data center segment with current estimates at $101B for the data center in FY2025.”
Valuation:
Fundamentally, Nvidia’s valuation is still quite cheap compared to historical benchmarks, given the sheer leverage and earnings power that the H100 is driving.
Shares are trading at a 91x PE and 32x forward PE ratio, and though it may look elevated, it’s not a range that Nvidia is unaccustomed to – shares traded between a 75x to 100x PE ratio for a majority of the time from the second half of 2020 to early 2022. However, Nvidia’s forward PE of 32x is where the valuation has room to run. Shares bottomed in October 2022 at a 34x forward PE with declining revenue and EPS, compared to today, where EPS is expected to grow at least 73% YoY to $21.36.
On a PS basis, Nvidia still looks reasonably valued, with more potential upside if it can surprise again in 2024. Shares are trading at a forward PS of just over 18x, around the same level it held through the second half of 2023 and a steep discount to the 32x forward PS it peaked at in late 2021. Prior to 2023, Nvidia last traded at around an 18x forward PS in July and August 2022, despite the challenging macro headwinds and declining revenue growth.
Conclusion:
Our process is such that we have no issues placing Nvidia at a lower allocation if needed, or increasing that allocation back to the #1 position if needed. We want to remain flexible while acknowledging two things – the first, is the company will eventually lap high comps and the sky-high growth will not sustain forever. Secondly, that this company is the defacto leader in the multi-generational investment opportunity of AI and is trading at a reasonable valuation.
It’s entirely plausible we get a beat/raise tomorrow and a beat/raise for the next quarter. What needs to be watched is the H2 estimates as they lap high comps of 200%+. The first graph above best illustrates this.
With that said, we are in the first, early powerful move for AIfirst, early powerful move for AI. We have two more powerful moves to go — AI software and AI at the edge, and then automotive will be the grand finale. Nvidia is a leader in both, and I’ve been quite clear that our stance is that AI software for Nvidia specifically will drive more revenue than AI accelerators. We are seeing early indication that Nvidia can and will compete with Big Tech on AI software and AI at the edge with the Chat with RTX application.
Stay tuned for our post-ER writeup to hit your inboxes tomorrow night.
Premium Members, you can look forward to a deep dive on a stock that is new to the IOF portfolio that we plan to accumulate this year – we called Meta the one that got away in our year end webinar. This stock is the runner-up and we think it has more room to go (fingers crossed). Look for this in your inboxes next week.
This article was originally published on Forbes on Feb 15, 2024,04:51 pm ESTForbes Forbes on Feb 15, 2024,04:51 pm EST
Palantir’s Q4 earnings confirmed an acceleration in its US commercial business as it closed out its first GAAP profitable year. Shares are reflecting the optimism surrounding Palantir’s commercial segment and bottom line expansion, with shares up more than 47% YTD and nearly 280% since the start of 2023.
We noted in our stock newsletter in December that Palantir was “exhibiting multiple signs of acceleration heading into 2024 with an improved fundamental backdrop driven by increasing AI demand. Palantir’s Artificial Intelligence Platform (AIP) is driving a significant acceleration in its US commercial business, while underlying metrics and the bottom line are rapidly improving.”
Revenue acceleration stemming from the commercial business is the major story for Palantir through 2024 and into 2025, with revenue growth poised to accelerate from 17% last year to 20% this year and nearly 21% in 2025.
Sign up for I/O Fund's free newsletter with gains of up to 221% – Click hereClick hereClick here
Strong Acceleration in US Commercial Is Driving Growth
In a deep dive at the time of Palantir’s direct listing, our firm said in 2020 that the “commercial sector is the growth story.” Palantir’s public offering was seen as a way to facilitate attracting and acquiring commercial clients before AI brought a wave of competition. The fruits of Palantir’s labor are beginning to pay off, with a newfound rapid acceleration in its US commercial business after AIP’s launch in Q2 was met with “unprecedented” demand. At its core, Palantir’s AIP is a comprehensive AI solution that lets customers lever Palantir’s AI and machine learning tools and harness the power of the latest large language models (LLMs) within Foundry and Gotham. Customers can deploy LLMs on their own private networks using their own private data, maximizing data security and improving efficiency by helping reduce data transfer and storage costs.
Although its US commercial segment accounts for less than 25% of quarterly revenue — it just surpassed a $500 million annual run rate in Q4 — it is now becoming the dominant factor behind the strong business momentum Palantir has seen over the past few quarters.
US commercial revenue rose 70% YoY to $131 million, a 37 percentage point acceleration from Q3 and a 58 percentage point acceleration from the year ago quarter. For the full year, US commercial revenue rose at more than double Palantir’s growth rate, increasing 36% YoY to $457 million.
The graph below illustrates just how strong the recent quarter was:
Source: PALANTIR
This acceleration in the US over the past two quarters is driving global commercial revenue higher. Palantir’s global commercial revenue accelerated by 22 percentage points, from 10% growth in Q2 to 32% in Q4. The segment topped a $1.1 billion annual run rate last quarter, up from a $920 million run rate two quarters ago.
Source: PALANTIR
While the revenue acceleration was the main headline for the US commercial business, a closer look reveals that the segment also drove more than 90% of Palantir’s customer additions with very strong underlying metrics.
Palantir reported 55% YoY and 22% QoQ growth in US commercial customer count to 221 in the quarter, as customer growth continues to accelerate. Over the past two quarters, Palantir has added 60 net new US commercial customers with 40 customers added in Q4 alone. This is more than 3X higher than the previous period of just 18 net new US commercial customers from Q4 2022 to Q2 2023.
Source: PALANTIR
Global commercial customers increased 44% YoY and 14% QoQ to 375 customers – representing 45 net new customer additions in the quarter. This means the US commercial segment drove more than 90% of Palantir’s net new customer additions in Q4. That compares to below 63% of net new customer additions in Q3 and just 20% in Q2.
This growth was “meaningfully driven by AIP” with Palantir saying that “demand is off the charts” for its new product. AIP is “propelling growth both through new customer acquisitions and expansions with existing customers,” with evidence of AIP bootcamps “helping to significantly compress sales cycles and accelerate the rate of new customer acquisition.”
Palantir had set a goal in October to hit 500 AIP bootcamps to drive top of funnel growth, and it has already surpassed that target, completing 560 bootcamps in just four months.
CRO Ryan Taylor commented on how this translates through to growth in the US commercial segment, with “70% year-over-year growth in revenue in Q4, 55% growth in customer count year-over-year, and a 107% growth in TCV closed on an adjusted basis […] Either it's — first, it's bootcamps that are quickly converting to paying customers or its expansion of existing customers or it's customers where maybe we've been engaged for a while and introduction of AIP, that whole process has been accelerated. We're seeing that across the board, and yet at the same time, we barely touched that addressable market.”
Engaging customers via bootcamps to then translating that engagement into new customer deals or expanded deals sets the foundation for sustained revenue growth at a higher rate, more so if it can drive its net retention rate higher.
Every Thursday at 4:30 pm Eastern, the I/O Fund team holds a webinar for premium members to discuss how to navigate the broad market, as well as various stock entries and exits. We offer trade alerts plus an automated hedging signal. The I/O Fund team is one of the only audited portfolios available to individual investors. Learn more here.Learn more hereLearn more here.
A Note on Net Retention Rate
Palantir reported a company-wide NRR of 108% in Q4, but noted that it “does not yet fully capture the acceleration in our US commercial business” since customers acquired over the last twelve months are not reflected in the calculation. A majority of the net new customer additions have come in the last two quarters, suggesting US commercial NRR will be higher than 108% come the end of FY24 when this customer cohort is reflected. For context, Palantir reported an NRR of 150% at the end of FY21 in US commercial, but that likely fell significantly when growth slowed to a crawl at the end of FY22.
If AIP can continue to drive a high level of customer acquisition and expansion through FY24, this can help drive and maintain the revenue acceleration we’re seeing in the segment through FY25 and into FY26.
Valuation Remains a Risk Despite Strong Improvement in Fundamentals
Fundamentally, Palantir has seen major improvements throughout FY23, as it became the company’s first GAAP profitable year.
Gross margin has expanded consistently throughout the year, rising 300 bp YoY from 79% to 82% in Q4. GAAP operating margin shifted positive and expanded in each quarter in 2023, rising from (4%) in Q4 2022 to 11% last quarter.
Net income growth has been particularly strong, with Palantir generating nearly $210 million in net income during the year, compared to nearly ($374 million) in 2022. Cash flow generation has improved substantially, with operating and free cash flow both more than doubling QoQ in Q4 to over $300 million. Palantir ended the year with a 32% OCF margin and a 33% adjusted FCF margin.
Source: YCHARTS
While the fundamentals are certainly supporting an increase in Palantir’s share price, the AI hype may be overshooting the near-term potential for returns at this level. What’s striking is that investors are paying prices last seen when the market set a major top in November 2021, meanwhile the 2021 growth story is decoupled from management’s long-term 30% revenue growth target.
In early 2021, Palantir’s management expected to reach $4 billion in revenue by 2025 as they expected more than 30% annual revenue growth each year for the next five years, or through 2026. Palantir exceeded this target with 34% growth in 2021, but a macro-inflicted deceleration in late 2022 and early 2023 has practically nullified its ability to reach that $4 billion target after posting 24% growth in 2022 and just 17% in 2023. Current analyst estimates point to nearly 21% growth to $3.22 billion in revenue in 2025, meaning Palantir is one year off track – it’s projected to reach the $4 billion milestone in 2026, one year later than expected.
To reach $4 billion by the end of 2025, Palantir would need to record 35% growth this year and next, about 15 percentage points above estimates for both years. While AIP is aiding strong acceleration in the US commercial segment, it’s unlikely to drive revenues to that target. As a result, shares may be pricing in perfection for AIP and AI-related stock performance.
Source: YCHARTS
Prior to Q4’s earnings, Palantir was trading near its average P/S ratio of 18x, but the strong rally has now taken shares to over 26x P/S and 20x forward P/S – this is the highest level since late 2021 yet growth has slowed. On a cash flow basis, shares are trading at around 60x 2024’s projected $800 million to $1 billion in adjusted FCF.
Palantir’s shares are no longer cheap. It’s the third most expensive enterprise software stock on a forward P/S basis, behind Cloudflare and Snowflake, despite having the slowest forward revenue growth rate by more than 700 basis points, at 20% compared to 27% to 30% for the other two. This valuation may open up the door for downside throughout the year as it leaves no room for error, considering its lower revenue growth rate compared to peers; in addition, any dampening to growth stock sentiment from higher-for-longer rates with cut expectations being pushed back further in the year also presents a potential headwind for shares.
Conclusion
Enterprises are showing elevated interest in Palantir’s Artificial Intelligence Platform, which is translating to new customer additions. AIP’s early success in the US commercial segment drove Palantir’s new customer additions in Q4. US commercial revenue is accelerating significantly, reaching 70% YoY growth in Q4 from 33% in the prior quarter.
Management’s commentary about how Palantir is engaging and converting customers via bootcamps sets a foundation for a sustained acceleration thanks to a rapid customer acquisition cycle. However, the size of the US commercial business at less than 25% of quarterly revenues means that the AI-related acceleration may not be enough to sustain the stock’s current valuation.
Every Thursday at 4:30 pm Eastern, the I/O Fund team holds a webinar for premium members to discuss how to navigate the broad market, as well as various stock entries and exits. We offer trade alerts plus an automated hedging signal. The I/O Fund team is one of the only audited portfolios available to individual investors. Learn About our Premium Services
I/O Fund Equity Analyst Damien Robbins contributed to this analysis.
Please note: The I/O Fund conducts research and draws conclusions for the Fund’s positions. We then share that information with our readers. This is not a guarantee of a stock’s performance. Please consult your personal financial advisor before buying any stock in the companies mentioned in this analysis.
MSFT went above our $415 target briefly, before gaping down on February 13th. Based on valuations as well as a very mature 5 wave pattern completing on the technicals, we have further sold MSFT down in our portfolio. Below $385 is the first warning for the bulls, and below $370 will signal the bigger top is underway.
Nvidia (NVDA)
This is a stock we will likely hedge, and not reduce considering its leading position within the burgeoning AI trend. Unlike many stocks, NVDA looks like it has room for one more high. The uptrend is missing a 4th and 5th wave. This drop is likely the start of 4, and should pull back to the $660 – $615 range; however, it can drop as low as $590 and still maintain the potential to push higher in the coming weeks/months. Our upper targets are $820 – $864 for the 5th, as long as $590 holds.
Bitcoin (BTCUSD)
The $57,000 resistance will be the major line in the sand overhead. If we can cross it and hold, then our long-term targets will increase in probabilities. In the meantime, I still believe we are in correction, and should see a drop back into the $38,000 – $36,000 range. The larger uptrend remains intact as long as we stay over $25,100.
Advanced Signals Members receive in-depth technical analysis from our Portfolio Manager, Knox Ridley. Learn more here.