Baidu: An Emerging China-AI Momentum Play

The I/O Fund team believes that Baidu could make for an interesting momentum play. We define a momentum position as one where technicals lead, where we respect the stops, and where the fundamentals may not be perfect for one reason or another. For Baidu, risk from China is too high for the stock to be considered for anything more than momentum. Due to the emphasis on technicals, we only release momentum plays to Advanced Members.

Liquidity and Valuations

By Knox Ridley

China’s property sector accounts for nearly 30% of their GDP. This is far greater than any other developed nation, and exposes them to broad based deflation as their real estate market continues to unwind.
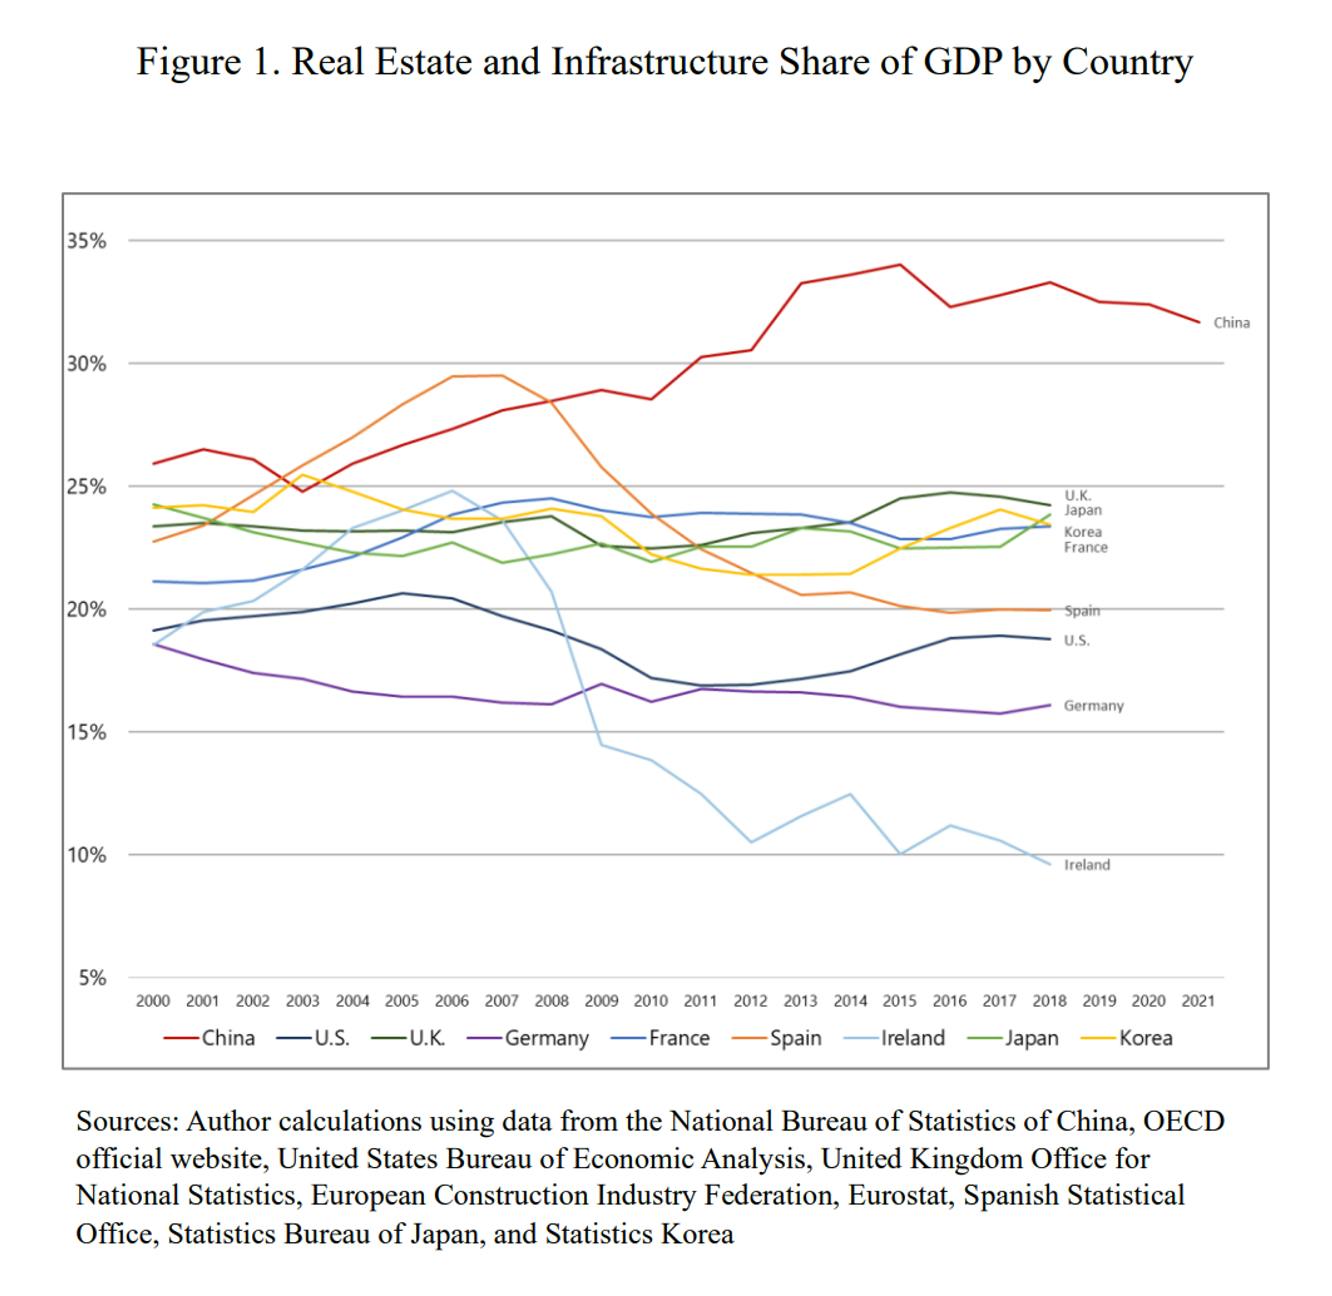
The Chinese property downturn is in its 3rd year, as new housing starts are down 60% compared to pre-COVID levels. This is a shocking slowdown in a short amount of time, yet, due to centralized control of the economy, we have yet to see housing prices fall in accordance with demand. While we have seen eight straight months of house prices decline in China, with recent data showing a 1.4% YoY drop, which is an acceleration to the downside from last month’s 0.7% YoY drop, the Chinese government is providing a wide range of defensive measures to prevent a full scale crash in the housing market.

For example, developers and lenders are allowed to delay recognizing bad loans in an effort to avoid bankruptcies, which is helping overextended banks stay solvent. We are also seeing rules on how listings must be priced in an attempt to prevent price discovery based on an oversupply in the face of decreasing demand.

How these measures will play out is yet to be seen. However, the one measure that is of interest to Chinese risk assets is how the People’s Bank of China (PBOC) has reacted. We have seen a large expansion of their balance sheet, which increases liquidity in the Chinese economy. This matters, as Chinese equities have a high correlation to liquidity expansions and contractions.
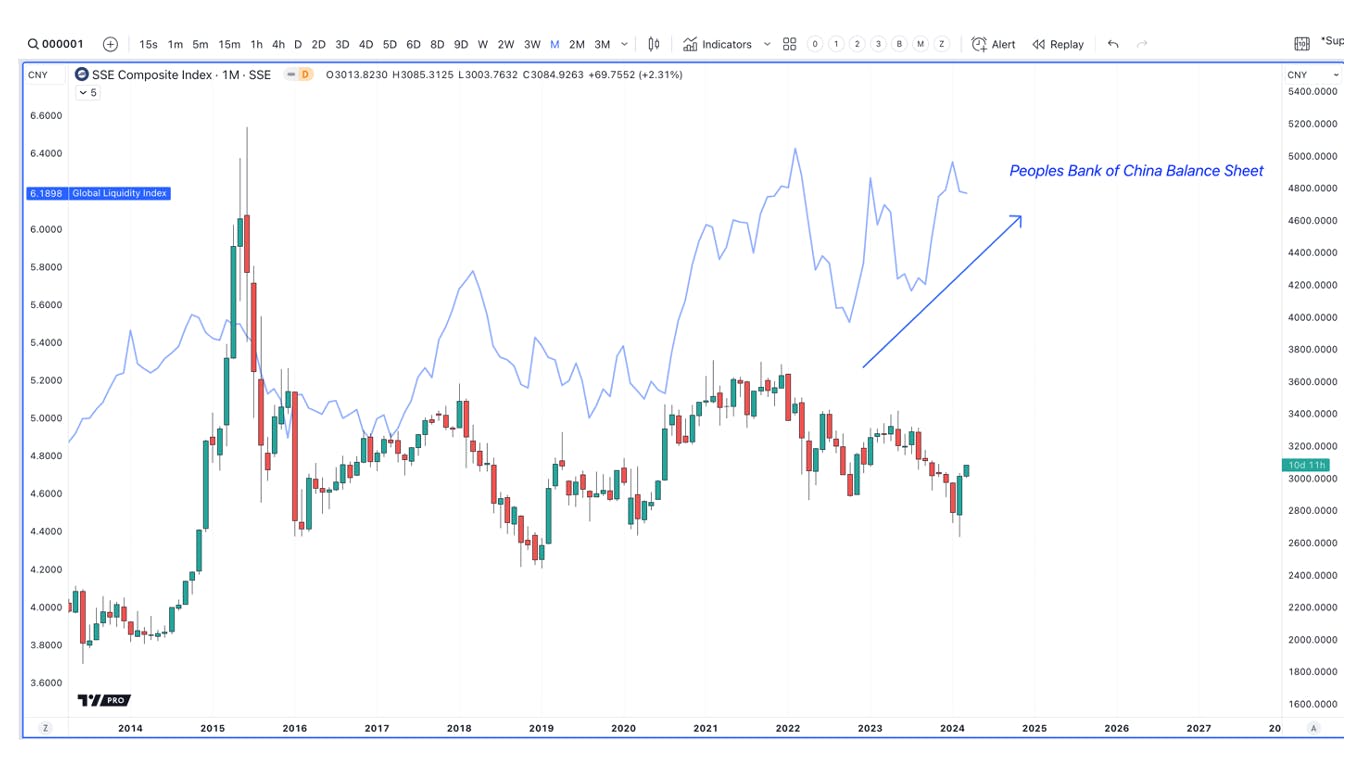
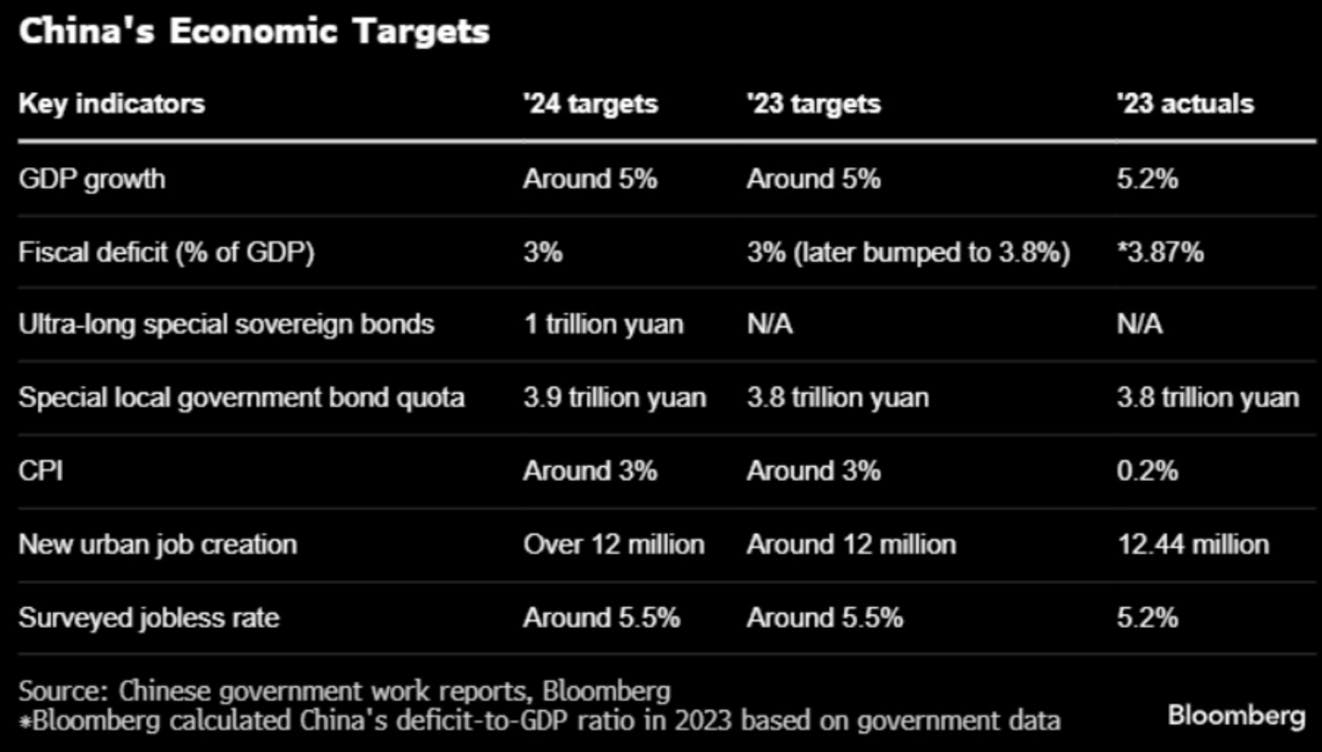
This correlation to expanding liquidity in China is one reason why we are interested in a small momentum allocation to Chinese equities. It is apparent that the CCP is adamant about preventing contagion from their struggling real estate markets. Furthermore, they have announced their inflation, growth and employment targets for 2024, which is highly supportive of a continuation of easing liquidity.
The other reason can be seen in the fundamentals. Since topping in February of 2021, the popular Chinese ETF, FXI, is currently down 52%, while the tech focused Chinese ETF, CQQQ, is down nearly 70% from its 2021 highs.

This has created some appealing valuations within Chinese tech. Baidu is trading at a 13.2x trailing PE ratio and a 8.9x forward PE ratio, as well as a 2x PS ratio and a 7.4x price to free cash flow ratio. Compare this to American search and generative AI rival Alphabet, which is trading at a 26.2x trailing PE, a 19.3x forward PE, and a 6.6x PS and 28.2x P/FCF ratio.
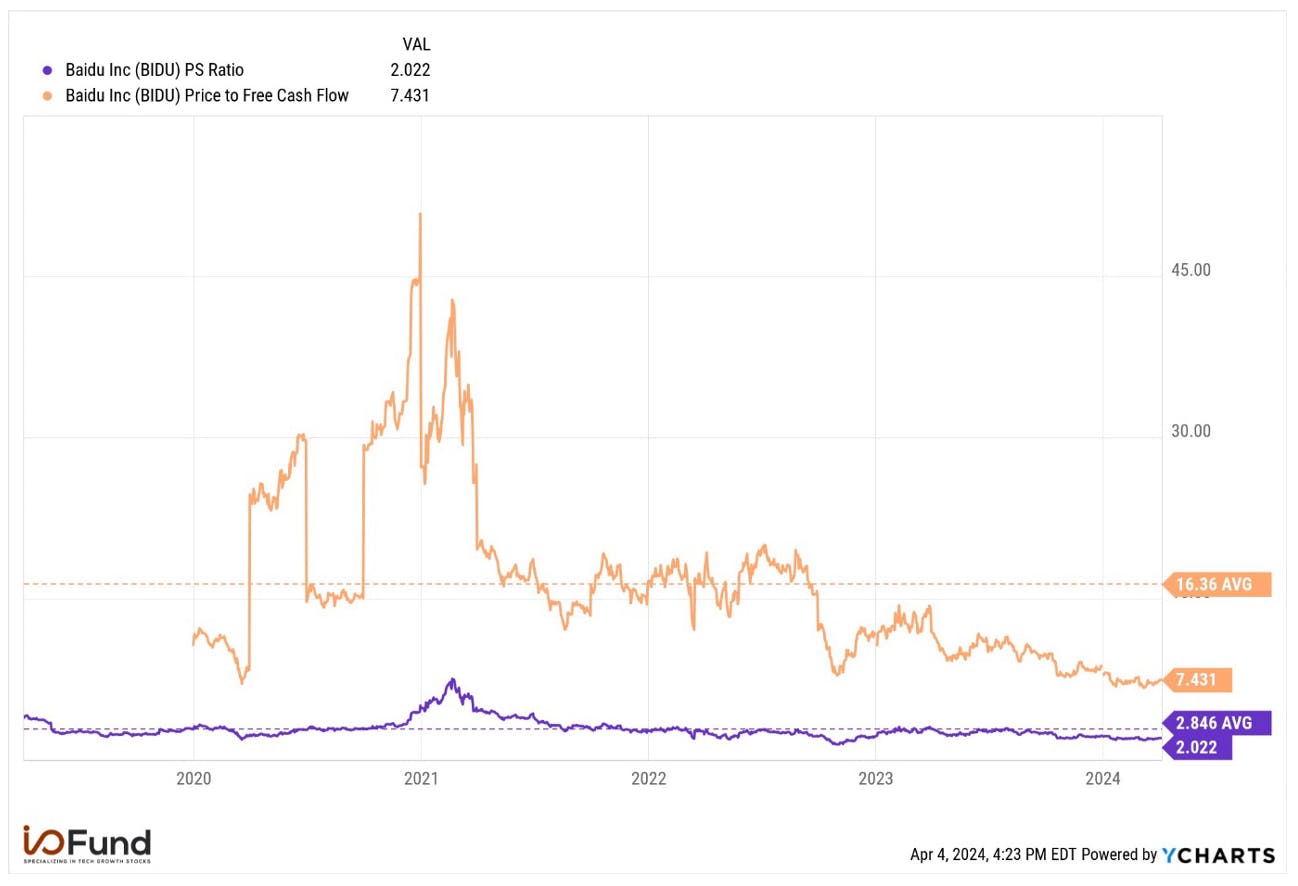
Baidu is trading at a significant discount relative to its three-year medians for these valuation metrics, though revenue growth next quarter risks declining and EPS growth is expected to be negative in two quarters this year.

However, as a whole, Chinese stocks have been deeply discounted, and the variegated risks from the economic risks discussed here, along with mounting geopolitical risks, has investors looking elsewhere for gains. This has created some attractive valuations within a market that is not correlated to the US markets.

Technical Outlook

How these risks and reactions from the Chinese government are getting baked into the price is interesting.  For one, the Shanghai Composite Index (SSE) has broken a trendline that has been in place since 2006. Price has reclaimed this trendline, which is another reason why we are interested in this sector. When this trendline breaks, and if a retest had failed, then it would be a rather large problem for Chinese equities.
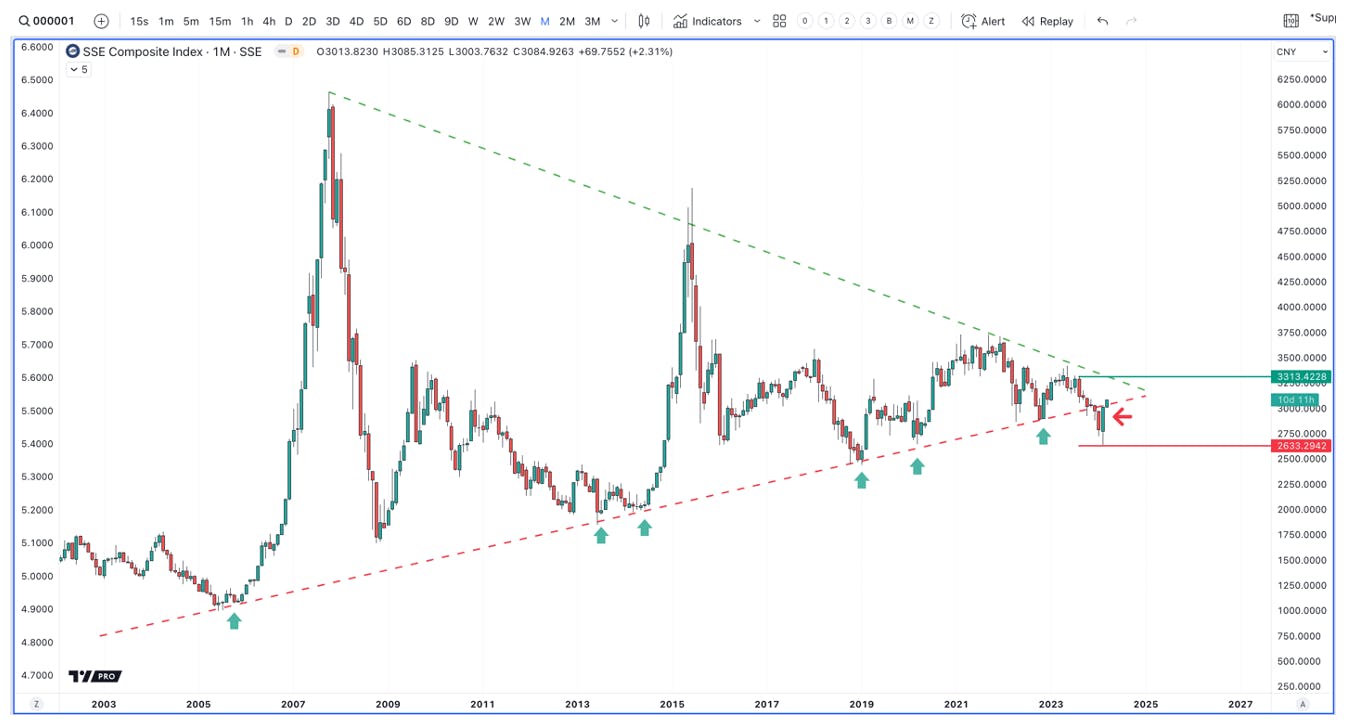
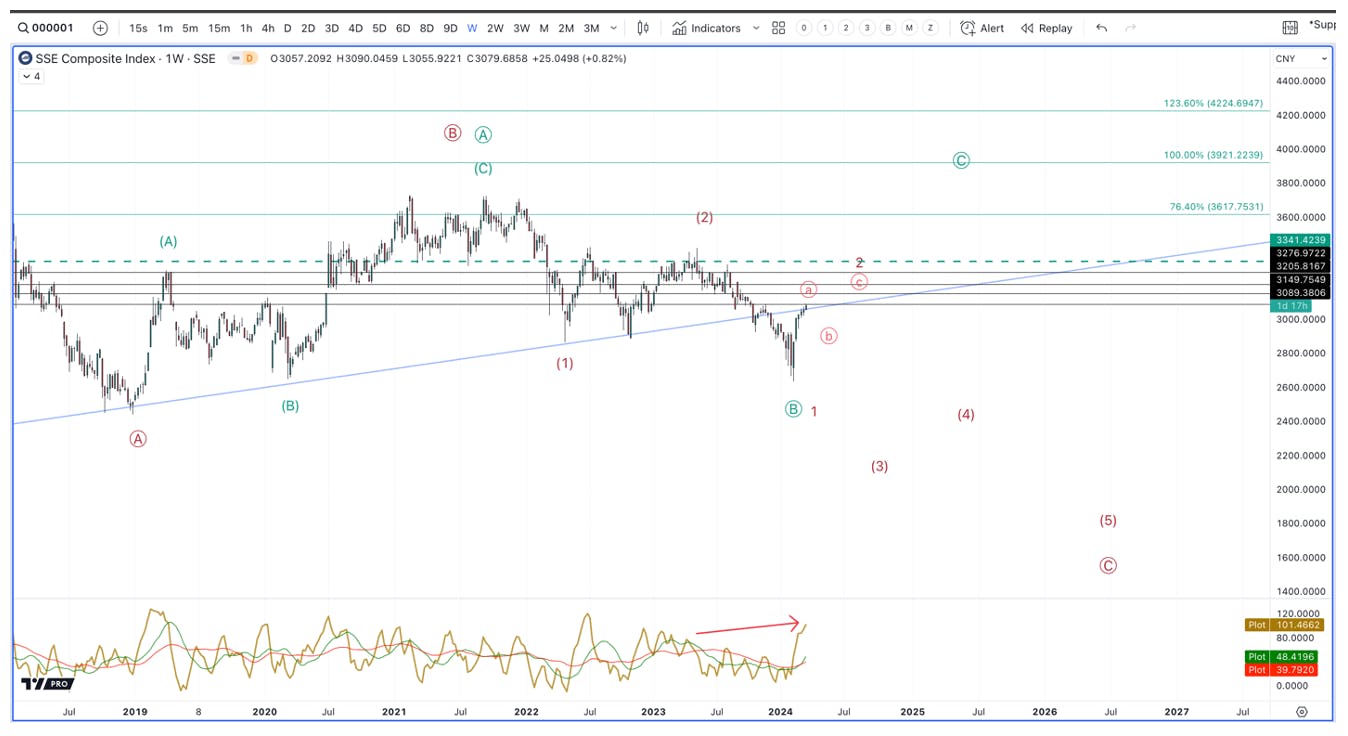
As of now, if SSE can break above the 3315 resistance, then we could see a nice swing higher into 2024/2025. How this pattern can be counted is in two general ways. The most bearish one would have us in a large degree 2nd wave. This count would have us, likely, test the 3315 region before rolling over. The other count I’m tracking would have us in a large degree B wave. This count would have us breaking above 3315, at minimum. Both counts do not look favorable for the Chinese markets on a long-term basis, which is why any plays we initiate will come with stops and targets.

My interpretation of the price action can be best counted in 2 general ways. The red count is the most bearish. It has us completing the A wave of a larger 2nd wave. The green count has us in the start of a new cyclical bull market within a larger secular bear market. Both scenarios can account for the setups we are seeing within the Chinese stock market.
Baidu’s Chart:
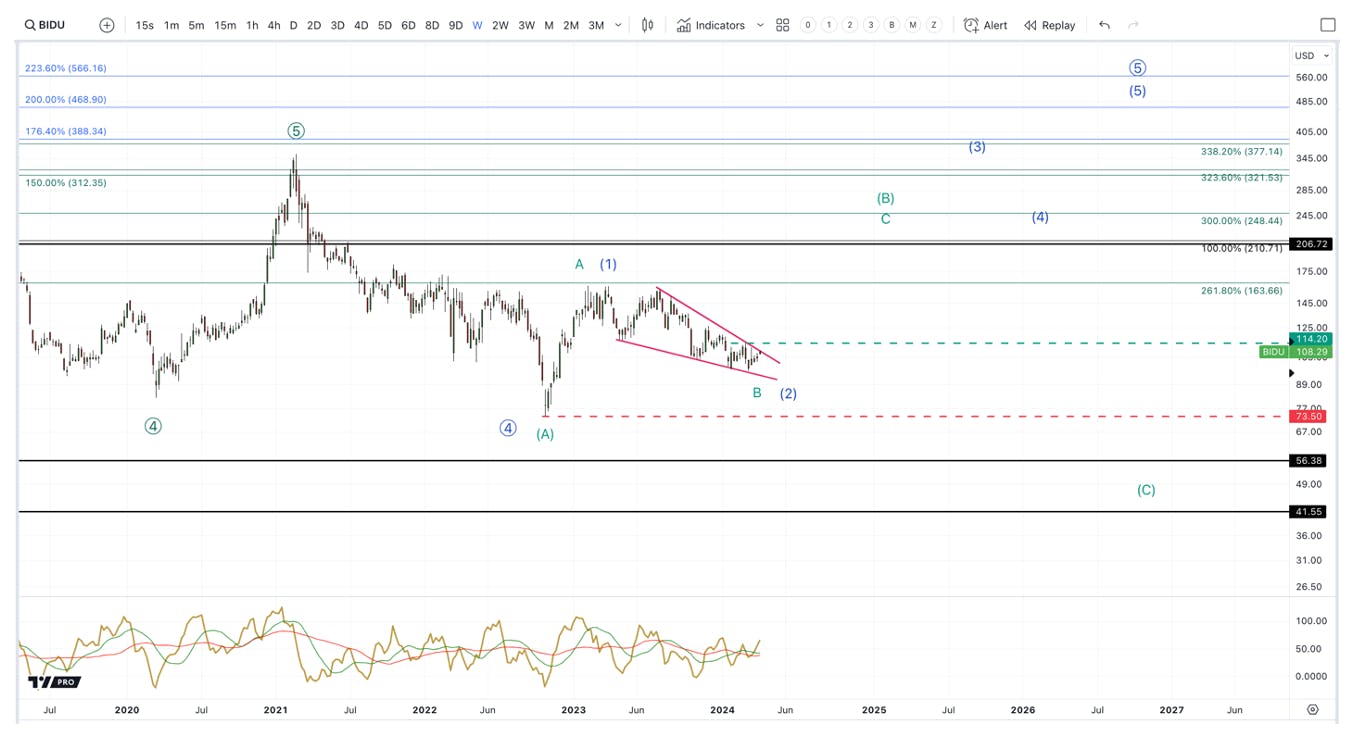
There are two counts that I am tracking in BIDU:

  • Green – we are about to start the C wave of a Zig-Zag correction. Long-term, this would be a bear market rally; however, the C wave is targeting ~100% gains, from current levels.
  • Blue – We have a first and now second wave in place in a large degree 5 wave move higher. This would be wave 5 of a very large 5 wave pattern.

The bounce off of the October 2022 low appears to be a 5 wave move. This has been followed by and overlapping, messy correction that is making a higher low, so far. This favors the two bullish counts listed. If we do see a breakdown below $73.50, it will invalidate these two bullish outcomes. Furthermore, the next breakout bounce must be a 5 wave move higher, and it needs to break over $114. This would likely be our signal to buy, with a stop to sell our position if we then move under $93.

ERNIE Versus ChatGPT: Baidu Quickly Catching Up

By Damien Robbins

Baidu is making strides in generative AI, evidenced via rapid growth in its generative AI offering ERNIE Bot. This rapid growth in consumer adoption of its ERNIE chatbot and strong initial adoption of its enterprise APIs are a positive sign for AI cloud helping drive a revenue acceleration for Baidu. We’re already seeing strong interest from leading consumer firms to integrate ERNIE – Samsung will integrate ERNIE in its S24 smartphones, Apple is in discussions to use ERNIE in devices in China, while Great Wall Motors will use ERNIE for an in-vehicle assistant.

Daily queries on ERNIE rose 190% QoQ to more than 50 million. Baidu noted that queries in the first half of November were 50% higher month-over-month relative to October, while daily queries had reached tens of millions. For context, ChatGPT had 60 million daily queries in August last year with over 1.4 billion monthly visits.

For Baidu, what’s important to watch is the growth trajectory of ERNIE, and if it can continue to show strong growth trends in both enterprises adopting APIs as well as within daily queries, as that suggests usage remains high.  Baidu is expecting to see more enterprises build LLMs using ERNIE’s APIs, which will serve as a growth driver for AI cloud revenue as model deployment and usage increases.

OpenAI has shown signs of successfully monetizing ChatGPT via both APIs and a consumer-facing subscription to unlock more advanced features. OpenAI reached $1.3 billion in ARR in October,  which then rose to $2.0 billion in December. Baidu’s generative AI and foundation model revenue was just $90 million (RMB656 million) in Q4, so there’s still a lot of catching up needed with OpenAI in terms of revenue.

Apollo Go: Moonshot Project Making Steady Progress

Baidu is quickly establishing itself as one of China’s outright leaders in autonomous driving via Apollo Go, and while the robotaxi services continue to expand, it remains at a small scale.

Apollo Go announced two significant milestones in 2024 alongside the 5 million cumulative rides: it launched a 24/7 driverless service in Wuhan and launched a highway pilot in Beijing to Beijing Daixin Airport, the world’s first robotaxi airport service in a capital city. Expanding service hours, fleet size, testing in new cities and expanding testing zones within cities are all necessary steps for Apollo Go’s expansion; however, fleet sizes do still remain small, and its geographic presence has not yet proliferated rapidly.

Management has signalled a willingness to push forward with a more rapid expansion path once it reaches UE (unit equivalent) breakeven in Wuhan. Robotaxis are operating in only 10 cities at the moment, and Wuhan’s fleet size reached just 300 vehicles in September, so a swift expansion to more cities with larger fleets opens the door for substantial revenue generation; however, given the small current scale, this is more of a moonshoot bet for 2024 (much in the sense that Tesla’s FSD is a moonshoot) rather than a contributor to the near-term thesis.

Baidu’s Revenue

By Royston Roche

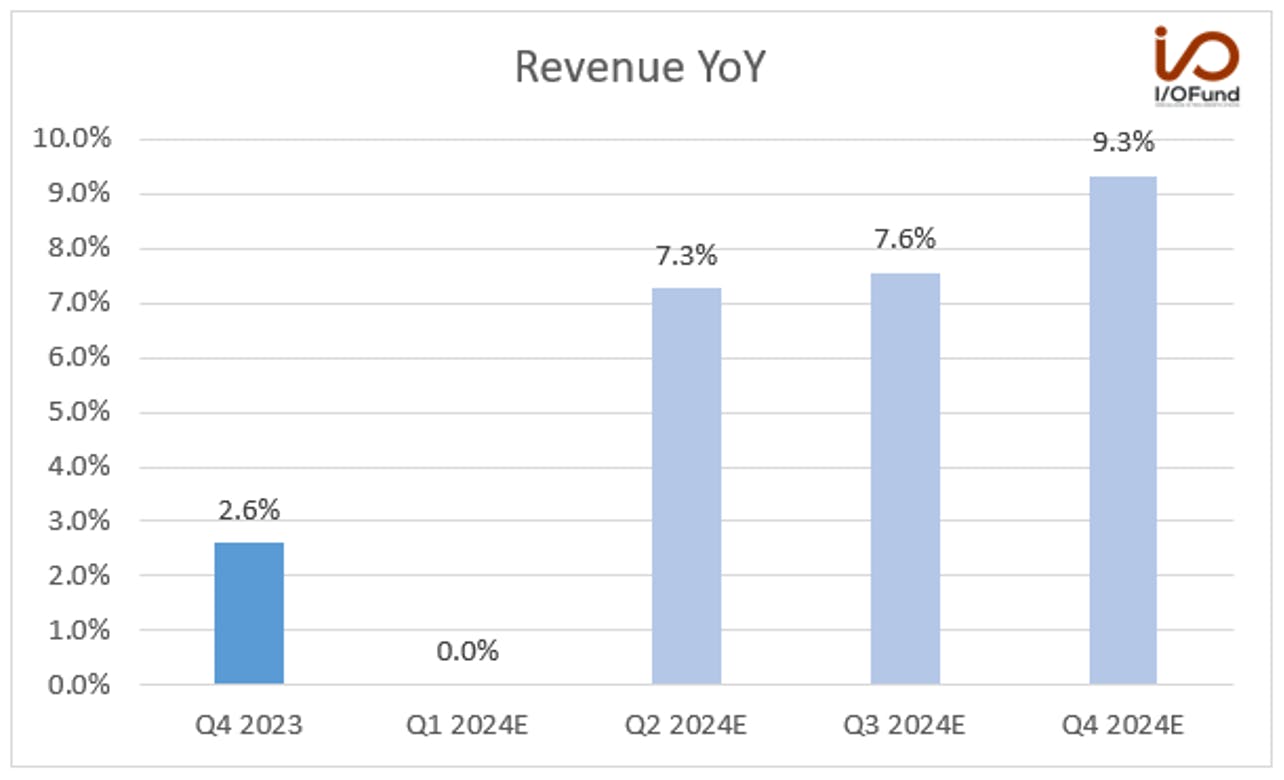
Baidu’s Q4 revenue grew by 2.6% YoY to $4.92 billion. Revenue in local currency grew by 6% YoY to RMB 35 billion. Analysts expect revenue to be flat next quarter and is expected to accelerate to 7.3% YoY growth in Q2 and 7.6% in Q3. It’s clear with the chart below that Baidu’s revenue growth will bottom in Q1, barring any unforeseen issues.
  • Revenue from Baidu Core grew by 7% YoY to RMB 27.5 billion or $3.87 billion. Baidu Core includes online marketing that grew 6% YoY to RMB 19.2 billion or $2.7 billion and non-online marketing revenue that grew by 9% YoY to RMB 8.3 billion or $1.17 billion, primarily helped by the growth in AI cloud revenue.
  • Revenue from streaming service iQIYI, popularly known as ‘Netflix of China’ grew by 2% YoY to RMB 7.7 billion or $1.09 billion.

The company’s investment in AI has started yielding results and is expected to contribute more meaningful to revenue in 2024.

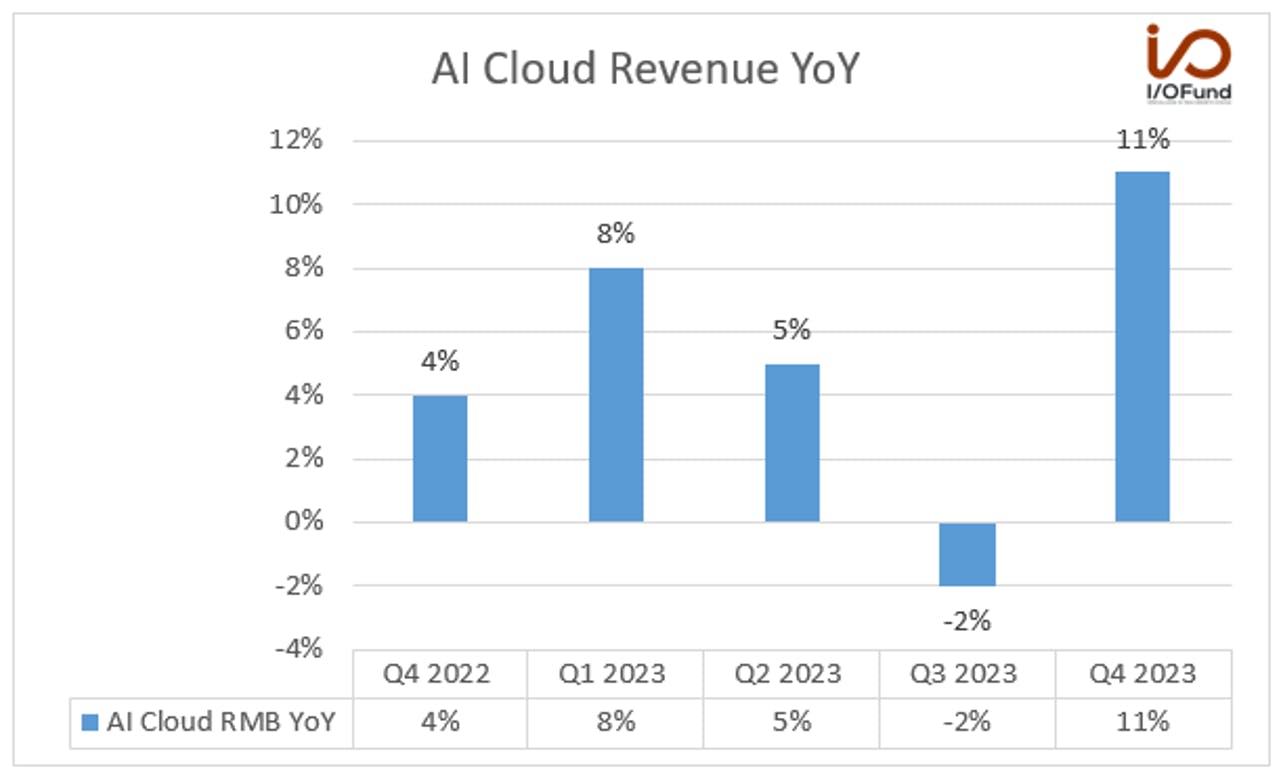
AI cloud revenue grew by 11% YoY to RMB 5.7 billion or $802.8 million, accelerating from a (2%) decline in Q3, helped by the strong demand for large language models.

Robin Li, co-founder and CEO said in the earnings call, “AI Cloud revenue grew by 11% year-over-year to RMB5.7 billion and continue to improve profitability in the fourth quarter. Revenue from Gen AI and foundation model represents 4.8% of our AI Cloud revenue in Q4. The increasing demand for model building played a significant role in this accelerated revenue growth, along with increasing distributions from inference.AI Cloud revenue grew by 11% year-over-year to RMB5.7 billion and continue to improve profitability in the fourth quarter. Revenue from Gen AI and foundation model represents 4.8% of our AI Cloud revenue in Q4. The increasing demand for model building played a significant role in this accelerated revenue growth, along with increasing distributions from inference.

We have seen a growing number of enterprises, in particular, tech companies turning to our public cloud to build their models. Additionally, the AI cloud revenue generated by Baidu Core, other business groups, such as the Mobile Ecosystem Group and the Intelligent Driving Group was about RMB2.7 billion in Q4. Within the Q4 internal cloud revenue, Gen AI and foundation model accounted for about 14%. On a combined basis, the total internal and external AI Cloud revenue was RMB8.4 billion in Q4, with Gen AI and foundation model contributing around RMB656 million.” On a combined basis, the total internal and external AI Cloud revenue was RMB8.4 billion in Q4, with Gen AI and foundation model contributing around RMB656 million.” The total from both internal and external AI cloud revenue was $1.18 billion in USD and Gen AI and foundation model contributed around $92.4 million.
Margins

The gross margin and the operating margin have improved on a YoY basis, but sequentially, there is a dip due to the higher costs in the AI cloud business. Management believes that the margins will improve in the long-term in the AI cloud business as revenue increases. The net margin was down mainly due to the equity method investment adjustments, which vary each quarter and there was one-time adjustment related to preference shares. However, we saw an uptick in the adjusted net margin sequentially and on a YoY basis.

The gross margin was 50.2% compared to 48.8% in the same period last year and 52.7% in the September quarter. The gross margin partially benefitted from lower content costs, but the higher costs in the AI cloud business were a drag. Management believes that the AI cloud margins will improve in the long term and replied to an analyst question on the margin trend for 2024.

“We are pretty confident in maintaining profitability for our AI Cloud. For Enterprise Cloud, we should be able to consistently improve gross margins for the legacy cloud businesses. As for Gen AI and LLM businesses, the market is still at a very early stage of development. So we should hold a pretty dynamic pricing strategy to quickly educate the market and expand our penetration into more enterprise customers. So we believe over the long term, the new business should have higher normalized margins than the traditional cloud businesses.”As for Gen AI and LLM businesses, the market is still at a very early stage of development. So we should hold a pretty dynamic pricing strategy to quickly educate the market and expand our penetration into more enterprise customers. So we believe over the long term, the new business should have higher normalized margins than the traditional cloud businesses.”          

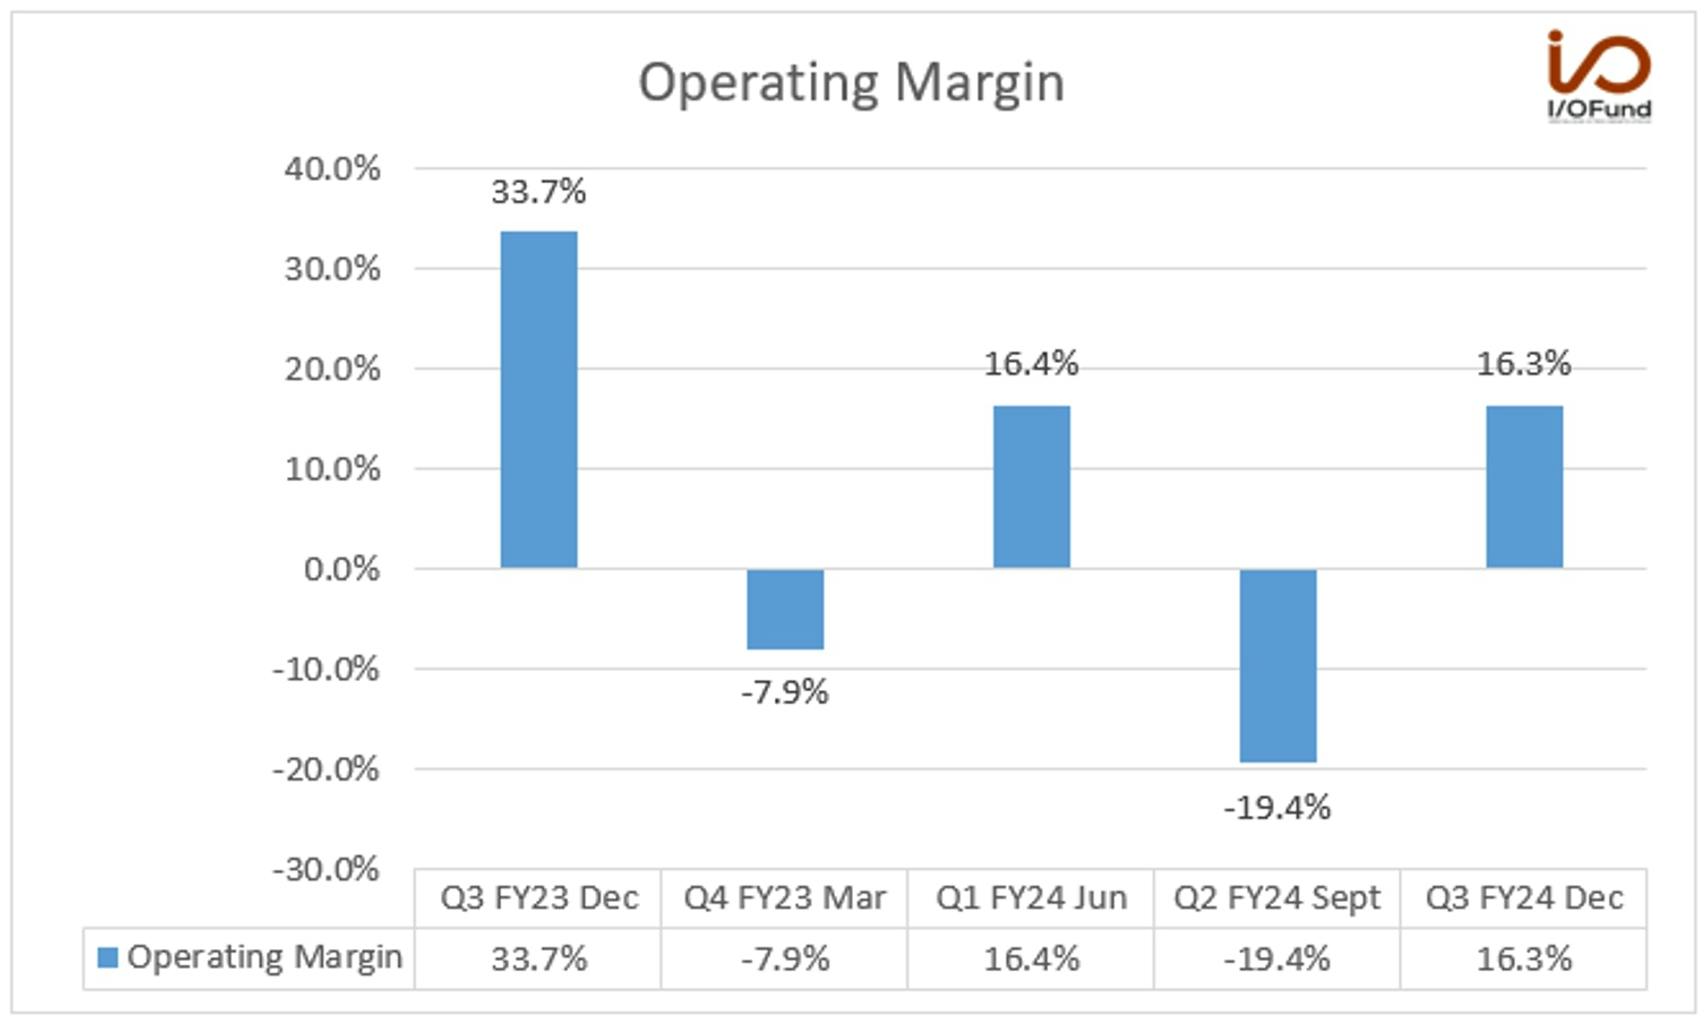
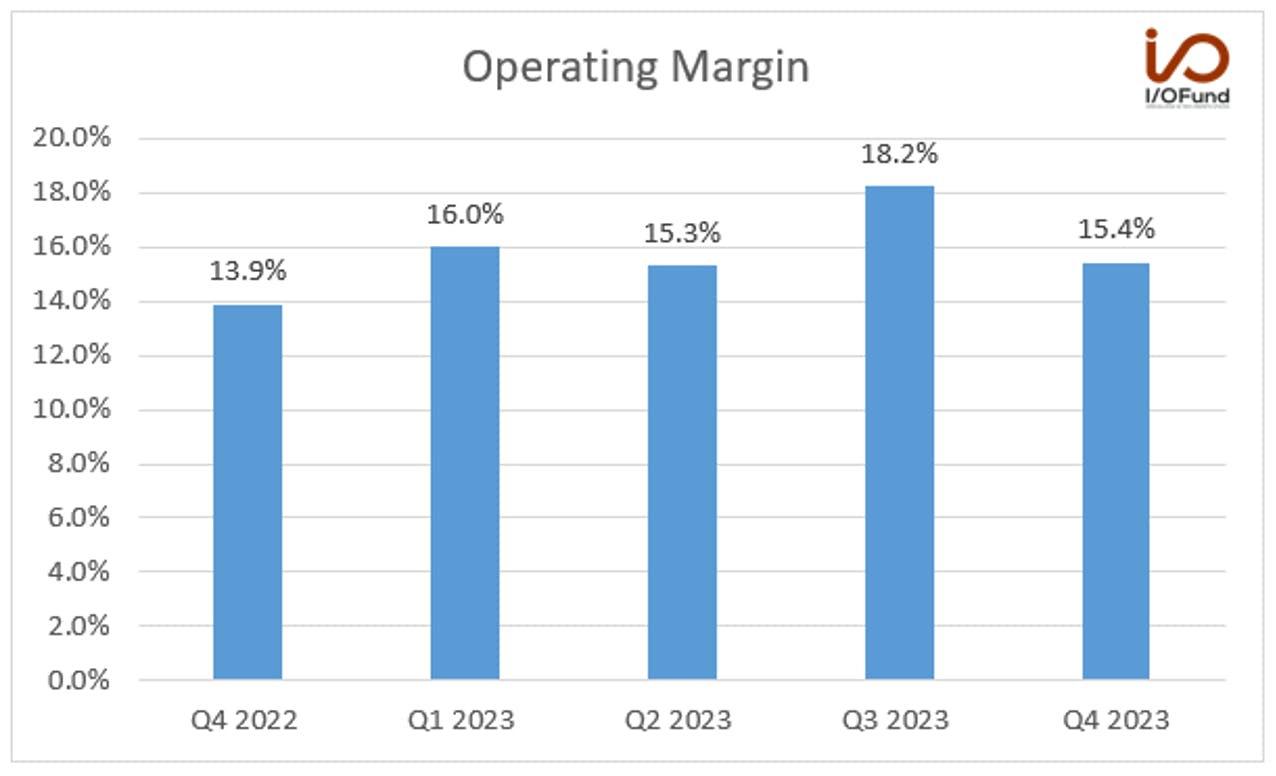
The operating margin was 15.4% compared to 13.9% in the same period last year and 18.2% in the September quarter. The SG&A expenses remained flat YoY, but R&D expenses increased 11% YoY due to the higher server depreciation expenses and server custody fees related to Gen AI R&D.
The net margin was 7.4% compared to 15% in the same period last year. The net margin was down primarily “due to a pickup of losses from an equity method investment as a result of a modification of certain terms of the underlying preferred shares.”  The adjusted net margin was 22.2% compared to 16.2% in the same period last year and 21.1% in the September quarter. GAAP EPS was $0.95 compared to $1.97 in the same period last year. Adjusted EPS was $3.08 compared to $2.21 in the same period last year. The analysts expect adjusted EPS to grow 2.3% YoY in Q1 and decline (6.3%) in Q2.
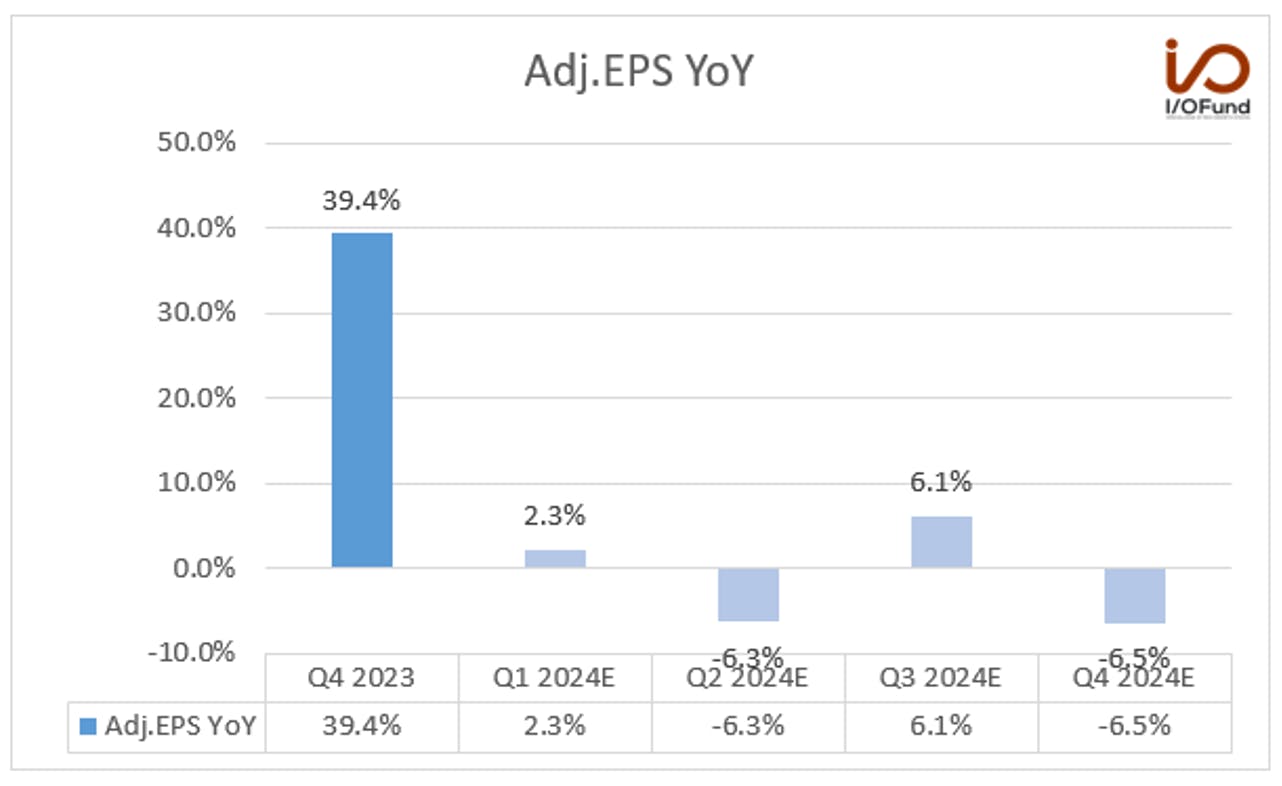
On an annual basis, Baidu is expected to grow fiscal year EPS (-2%) in FY2024 and then 10% over the next two years before EPS is expected to rapidly accelerate in growth in fiscal year 2027 to +33%. Overall, analysts are not expecting any further negative growth beyond FY2024.

Cash Flow and Balance Sheet

The operating cash flow was $1.5 billion or 30.4% of revenue compared to $1.14 billion or 23.8% of revenue in the same quarter last year. The free cash flow was $980 million or 19.9% of revenue compared to $859 million or 17.9% of revenue in the same quarter last year. Management attributed to “Mobile ecosystem exhibited solid performance across revenue margin and cash flow.” They expect mobile ecosystem (includes Baidu App, Ernie bot, Haokan, and Baidu Post, among others) to continue to generate steady profits and cash flows in 2024.

Cash, restricted cash, and short-term investments were $28.93 billion, and debt was $10.77 billion, compared to $27.78 billion and $10.93 billion at the end of the September quarter. The company repurchased $318 million worth of shares in Q4 and totaled $669 million under the 2023 share repurchase plan.

Earnings Call

  • The company’s investments in AI are expected to yield several billion RMB revenue in 2024. Robin Li said in the earnings call:

“Since Q2 2023, we have actively utilized ERNIE to revolutionize our products and services, creating AI native experiences. We believe real applications are essential to unleashing the full business potential of ERNIE and ERNIE Bot. Recently, we began to generate incremental revenues from ERNIE and ERNIE Bot. In the fourth quarter, we earned several hundred million RMB primarily from ad technology improvement, and helping enterprises build their own models. I'll provide a more detailed explanation in the business review section.Recently, we began to generate incremental revenues from ERNIE and ERNIE Bot. In the fourth quarter, we earned several hundred million RMB primarily from ad technology improvement, and helping enterprises build their own models. I'll provide a more detailed explanation in the business review section.

Looking into 2024, we believe this incremental revenue will multiply to several billion RMB primarily from advertising and AI cloud building.”Looking into 2024, we believe this incremental revenue will multiply to several billion RMB primarily from advertising and AI cloud building.”

  • The company launched a new version of AI model Ernie 4.0 in Q4 2023, which it claims will rival Chat GPT-4. Management mentioned in the earnings call that the Ernie API is used in Samsung S24 and Honor Magic 8.0 (Honor was spun off from Huawei in November 2020).

“As the front runner in AI, Baidu probably became the first public company globally to launch a GPT model with our EP 4.0 standing high as the most powerful foundation model in China. ERNIE continues to gain market recognition, as evidenced by ERNIE API calls from multiple well known companies.

Notably, Samsung uses ERNIE API on its Galaxy S24 5G sales. Honor uses ERNIE API in its Magic 8.0 and Autohome using ERNIE API to power multiple AITC apps.”

The management also highlighted the increasing use of Ernie by enterprises as the CEO stated, “In December about 26,000 enterprises are actively using ERNIE through API on a monthly basis, increasing 150% quarter-over-quarter. And ERNIE is now handling more than 50 million queries every day. That's up 190% quarter-over-quarter is a significant rise in third party quality.”

  • The company is using AI to increase revenues in advertising.

“In the fourth quarter Baidu’s core online marketing revenue increased by 6% year-over-year, driven by verticals in travel, healthcare, business services, and others.

In Q4, we generated several hundred million RMB incremental ad revenue due to improvements in ad tech.”

  • The company expects to achieve operational break-even in 2024 for Apollo Go.

“Our intelligent driving business continued to focus on achieving new breakeven for Apollo Go. In Wuhan, Apollo Go's largest operation, about 45% of our orders were provided by fully driverless vehicles in Q4. This metric surpassed 50% in January. The increase is because we intensified operations during peak hours in areas with complex traffic conditions and further expanding our operating area in the past few months. This development resulted from our ongoing efforts to improve technology through safety — through safely operating Apollo Go on public doles.

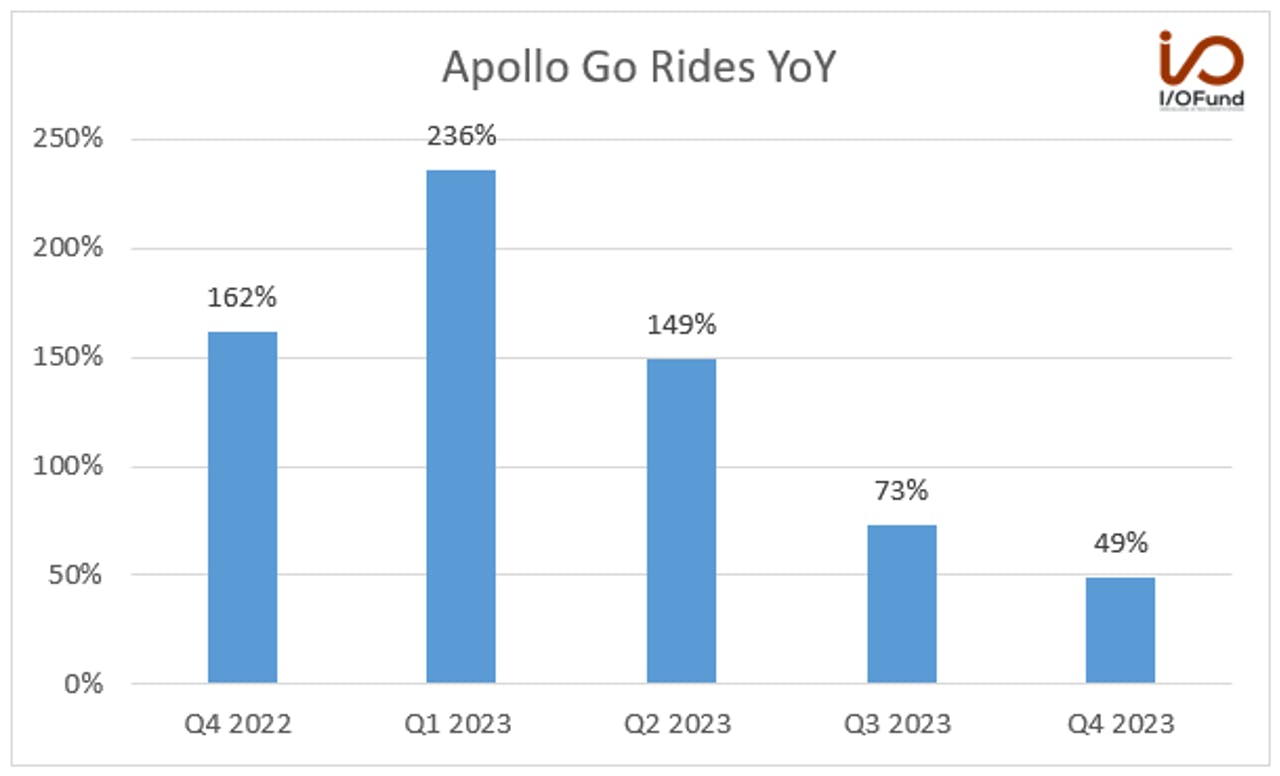
In China, Apollo Go provided about 839,000 ride in the public in Q4, marking up 49% year-over-year increase. In early January, the cumulative rides offered by Apollo Go exceeded 5 million. The substantial data collected from operations will further help us enhance the efficiency of safe operations.

Looking into 2024, we will remain focused on getting closer to Apollo Go's UE breakeven target and managing our costs and expenses to reduce losses in intelligent driving. Upon reaching UE breakeven, we plan to swiftly replicate our successful operations in Wuhan to other regions.”

Other Key Metrics

Baidu’s PaddlePaddle AI developer community has reached 10.7 million developers by the end of 2023. Developers created 860,000 models on PaddlePaddle by the end of last year.

Enterprises actively using ERNIE’s APIs on a monthly basis increased 150% QoQ to 26,000 in Q4. Baidu opened ERNIE APIs to enterprise customers at the end of August after receiving approval to deploy ERNIE on a larger scale.

Daily queries on ERNIE rose 190% QoQ to more than 50 million. ERNIE also reached a 100 million user milestone in December, less than five months after launching in August. OpenAI reported in November that ChatGPT had approximately 100 million weekly active users.

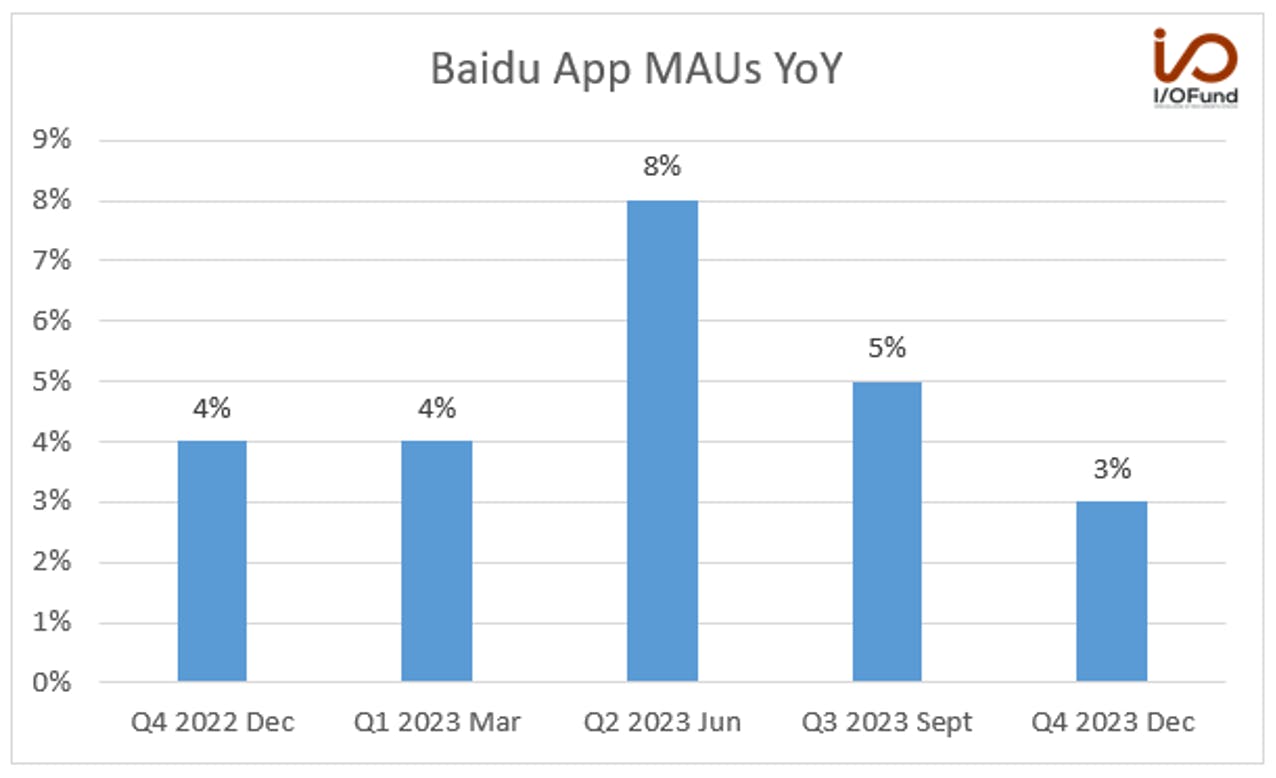
Baidu App’s Monthly Active Users (MAUs) grew by 3% YoY to 667 million in December 2023 and has been slightly lower than 5% growth in September 2023.
In Q4, Apollo Go rides grew by 49% YoY to 839,000. The company achieved 5 million cumulative rides from Apollo Go in January this year, marking a major milestone.
Conclusion:

Given the emphasis on AI in the markets combined with China pushing for its domestic tech to be the predominant tech used by its citizens, we foresee a scenario where Baidu emerges as a strong choice for those who want to participate in lower valuations. China’s population can be a catalyst for ERNIE to exceed Chat-GPT in user adoption. With that said, China is risky, ERNIE’s success is still quite speculative given the low revenue, and this is not a stock we can consider as quality. We will use technical analysis to its fullest as we attempt to participate.

Royston Roche and Damien Robbins, Equity Analysts at the I/O Fund, contributed to this article.

Recommended Reading:
Dell Fiscal Q4: Early Shoots from AI Servers

Dell stock shot up 31% following its fiscal Q4 results. The market was excited to see orders for AI-optimized surge 40% QoQ despite only contributing 5% of overall revenue. There is certainly room in Dell’s valuation when management convinces the market it’s a serious AI player with each subsequent earnings report. Compared to other AI stocks, Dell is a slow-growth company, per analyst estimates. As a percentage of revenue, SMCI has 50% AI revenue versus Dell’s 5% AI revenue.

There is also a concern among analysts due to dilutive margins from the company’s AI server portfolio, mixed with additional pricing pressures on traditional servers due to inflationary pressures and an intensely competitive market.

Ultimately, there are a few key things we’d like to see from Dell as we consider a position. We detail this and more below.

Revenue and Earnings:

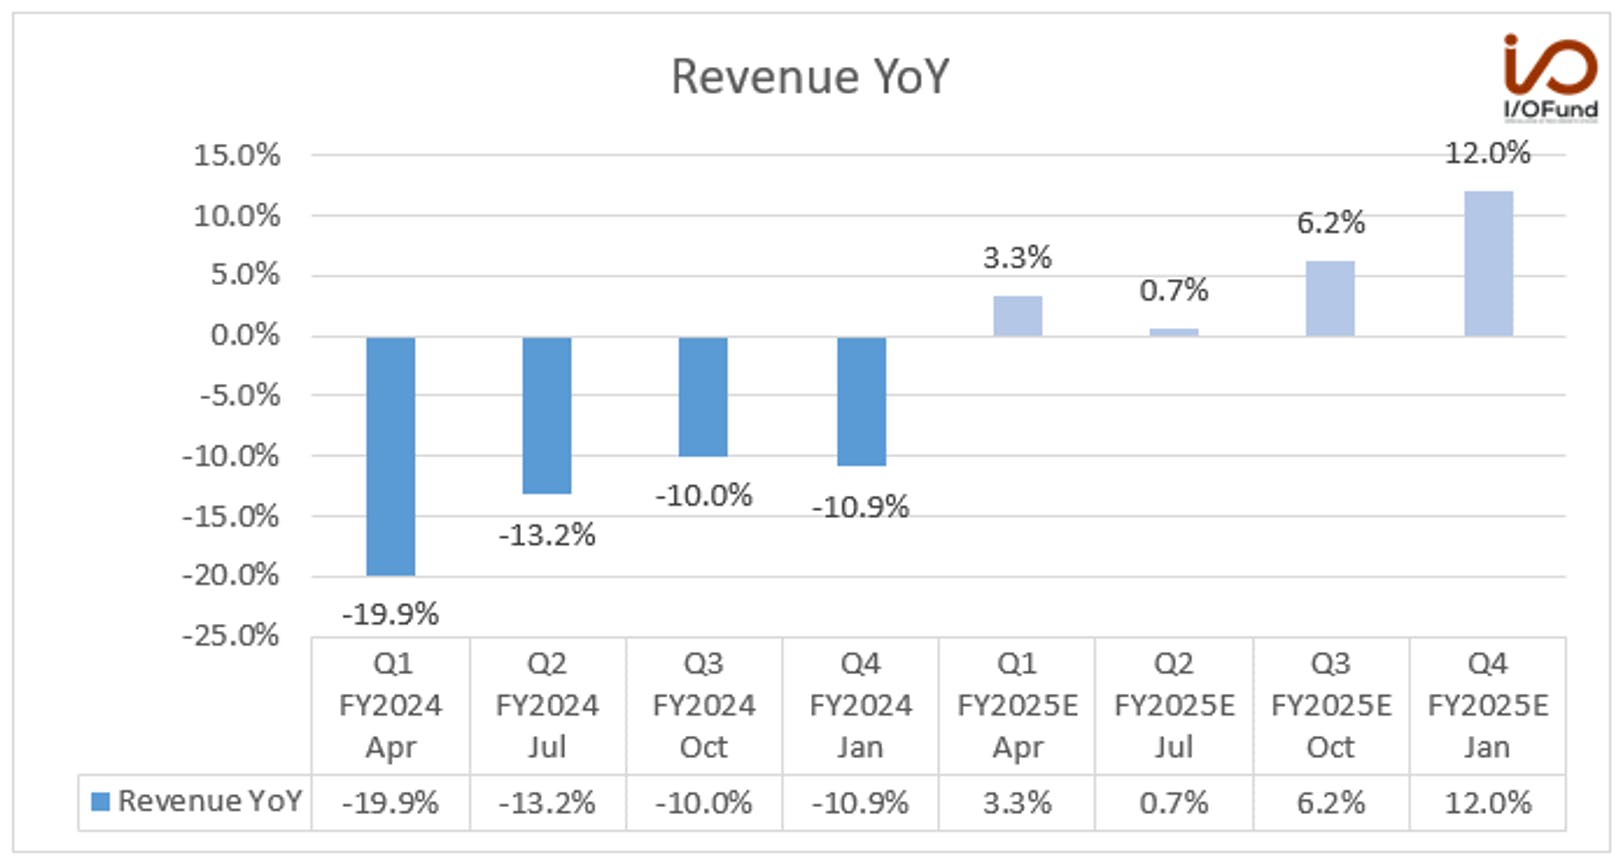
Dell reported fiscal Q4 revenue of $22.3 billion for revenue decline of (-10.9%). This was flat QoQ but an improvement from the April quarter at (-19.9%). Dell is expected to return to positive growth next quarter at 3.3% for revenue of $21.6 billion.

For the full year, analysts are expecting growth of 5.8% for revenue of $93.5 billion.

Revenue Segments:

The lower total revenue was driven by a (-6%) decrease in Infrastructure Solutions Group (ISG) and a (-12%) decrease in the Client Solutions Group (CSG) YoY.

Client Solutions Group (CSG) delivered fourth quarter revenue of $11.7 billion, down (-5%) sequentially and (-12%) year over year. Commercial client revenue was $9.6 billion, and Consumer revenue was $2.2 billion. Operating income from the segment was $726 million. Full-year CSG revenue was $48.9 billion, down (-16%) year over year, and full-year operating income was $3.5 billion, down (-8%) year over year.

Moving forward, CSG is expected “to be down in the low single digits, so minus three about year-over-year.” Management has indicated a recovery in PCs is likely in the second half of the year.

Infrastructure Solutions Group (ISG) incl AI revenue:

ISG revenue was $9.3 billion, down (-6%) and up 10% sequentially. Servers and networking revenue was $4.9 billion, down (-2%) year-over-year and up 4% sequentially. ISG operating income was 15.3% of revenue and $1.4 billion was down (-7%), driven by a decline in revenue and a lower gross margin rate given the higher AI-optimized server mix, partially offset by lower operating expense.

Moving forward, ISG is expected “to grow in the teens driven by traditional and AI services.” Per the CFO: “[…] from a traditional server standpoint, we're expecting modest growth, so growth in the upcoming year. AI servers, certainly a very strong growth, especially from a year-over-year standpoint. And then storage, will lag a bit, but we expect tailwinds as the year progresses in the storage portfolio.”

Per management: “Our AI mix of server demand increased again sequentially given strong customer interest in GenAI.” The company shipped $800 million of AI-optimized servers with a backlog that “nearly doubled sequentially, exiting the fiscal year at $2.9 billion.” The press release stated orders increased nearly 40% sequentially and backlog nearly doubled to reach the $2.9 billion. Regarding how the backlog digests, it was later stated: “We believe we will ship more in Q1 than we shipped in Q4. As we look forward in our annual guidance, Yvonne has our best estimate of our demand and fulfillment of that demand that we've put into the annual guidance.”

Additional commentary was offered on the earnings call: “Demand continues to outpace GPU supply, though we are seeing H100 lead times improving. We are also seeing strong interest in orders for AI-optimized servers equipped with the next generation of AI GPUs, including the H200 and the MI300X. Most customers are still in the early stages of their AI journey, and they are very interested in what we are doing at Dell.”

Storage revenue of $4.5 billion was down (-10%) year-over-year and up 16% sequentially. Per management: “demand improved sequentially across the storage portfolio, above our normal seasonality.” Storage reported improved profitability due to a mix of proprietary storage software.

Margins:

Margins have improved YoY as the company juggles margin contraction and margin expansion in varied segments. The company is not expected to continue this trend of improving profit margins for a few reasons. First, the high-growth AI market is generating lower margins than the company’s other leading products. In addition, the company expects input costs to increase further in FY25, driven by anticipated inflation for component costs as the year progresses. Management also anticipates the pricing environment to be more competitive in FY25.

Gross margin has been steady at 23% to 24% although this may change with higher AI product mix and also inflationary input costs. Gross profits were $5.32 billion last quarter. The CFO guided a 100-basis points moderation in the adjusted gross margin for FY2025 and to be 200 bps lower next quarter. For reference, FY2024 adjusted GM was 24.3%.

Operating margin of 6.7% is up 190 bps from the year ago quarter as operating expenses as a percentage of revenue was reduced to 17.1% compared to 18.3% in the same quarter last year. This is also higher than FY2024 at 5.9% operating margin. Adjusted operating margin was 9.6%.

Net margin of 5.2% was up 270 bps from the year ago quarter. This is higher than FY2024 net margin of 3.6%. The adjusted net margin was 7.2%.

Margins were a focus in the Q&A with the CFO expanding on what will drive lower margins next quarter:

“And then we get to gross margin rate, which I think is the key to your question. So we expect that to be down quarter-on-quarter, about 200 basis points. Now, what is supporting that expectation? We are seasonally lower in storage mix. We see that every Q4 to Q1, so that's one of the drivers. We will have higher AI optimized server mix in Q1. Jeff already talked about that in question.

And then holistically, we have another few influences on the margin. We've got an inflationary component cost environment. We're moving from deflationary last year to inflationary in the year that we are in right now. And then I'd say there's more competitive pressure. We're seeing more and more of that. And so that's what we expect to be impacting the gross margin. And I'd say operating margin rates will be down quarter-over-quarter due to all the items I just mentioned. But for the year, we're expecting improved performance as the quarters progress.”

Regarding competitive pressure, this is coming from traditional servers. Per the CEO: “we did see in traditional servers that in large bids, the competitiveness did increase quarter-over-quarter in Q4. We expect that to continue.”

Dell had a large beat on adjusted EPS reporting $2.20 compared to $1.72 expected for a beat of 27.9%. Next quarter, the company is expected to report $1.22 for a decline of (-7.1%). We discussed above some of the factors like inflationary cost pressure, seasonality lower storage revenue mix, and higher proportion of AI product mix for lower margins in the next quarter.

Cash Flow:

Operating cash flow of $1.53 billion in fiscal Q4 represented a margin of 6.9%. Free cash flow of $806 million represented a FCF margin of 3.6%.

There is $8.7 billion in cash and investments on the balance sheet and $26 billion in debt. Debt has decreased since Q4 2023 from $29.59B to $25.99B for Q4 2024 as the company focused on deleveraging.

Dell announced a 20% hike in the annual dividend to $1.78 per share and substantial share buyback program reflects Dell's confidence in sustained cash flow generation and long-term value creation. Per the earnings call: “we repurchased 11.2 million shares of stock at an average price of $74.67 and paid a $0.37 per share quarterly dividend. And earlier today, we announced a 20% increase in our annual dividend to $1.78 per share, well above our long-term financial framework and a testament to our confidence in the business and our ability to generate strong cash flow.”

Earnings Call:

Dell’s management team is expecting a return to growth with a focus on AI and a bullish view on the PC refresh cycle by the exit of FY2025.

AI-Related Revenue

The 40% QoQ growth in AI servers is clearly the driver for the 30%+ after hours pop the day the company reported. Here are some of the more pertinent points discussed on the call regarding AI revenue:

From the CEO, regarding where the demand is coming from – notably, Dell’s management was quite clear their AI opportunity is more with enterprises and on-premise servers as opposed to purely hyperscalers. This helps explain why Dell’s AI revenue is ramping more slowly as it’s more of a phase two server company (phase 2 being enterprise-driven, client-driven, and especially characterized by edge AI).

Let me start with maybe the demand. And you heard us talk about the demand up sequentially 40%. And that demand was across a rich customer set. The number of CSPs grew, the number of enterprise buyers grew. So for us, two important indicators is less concentrated this quarter than the previous quarter with more customers in both the CSP category and the enterprise category buying from us.And you heard us talk about the demand up sequentially 40%. And that demand was across a rich customer set. The number of CSPs grew, the number of enterprise buyers grew. So for us, two important indicators is less concentrated this quarter than the previous quarter with more customers in both the CSP category and the enterprise category buying from us.

That demand was spread across the H100, H800, the H200 and the MI300X. So we sold a broad portfolio or a broad portfolio of silicon diversity into the marketplace for our customers […] Probably another important characterization about the demand and how the backlog looks is the pipeline grew. We talked about our five-quarter pipeline at the last call. The five-quarter pipeline grew this quarter as well. So who we sold to grew. The potential of who we're going to sell to grew. The number of shipments that we had during the quarter grew and the backlog grew. And we expect to ship more in Q1 than we shipped in Q4. I hope that was the color that you're looking forbably another important characterization about the demand and how the backlog looks is the pipeline grew. We talked about our five-quarter pipeline at the last call. The five-quarter pipeline grew this quarter as well. So who we sold to grew. The potential of who we're going to sell to grew. The number of shipments that we had during the quarter grew and the backlog grew. And we expect to ship more in Q1 than we shipped in Q4. I hope that was the color that you're looking for.”

In Jeff Clark’s, CEO, opening remarks, “We saw strong demand continue for our AI-optimized server portfolio, including our flagship PowerEdge XE9680, which remains the fastest-ramping solution in company history. We have just started to touch the AI opportunities ahead of us, including broader adoption of AI by enterprise customers and the projected growth in unstructured data where we are well-positioned with industry-leading storage solutions.”

Margins, and the fact Dell’s AI servers have dilutive margins, was a common focus for analysts on the call. AI server sales were less than 5% of overall revenues, however it’s expected AI will have a negative impact on profit margins for the company as it grows. As of now, margins have expanded YoY and QoQ.

Enterprise is an AI Opportunity for Dell:

I want to drill down on the comment I made above that enterprise is where Dell anticipates they will see a larger AI product mix as they will then be able to cross-sell. On the call, Dell’s CFO pointed toward enterprise being a larger opportunity than hyperscalers for their servers. The CFO stated: “What I'm really excited about is the other thing that Jeff talked about on really getting more and more value out of our GPU servers, really with, as we move more and more into the enterprise and get more richly configured, more services, etcetera, attached to that.”really getting more and more value out of our GPU servers, really with, as we move more and more into the enterprise and get more richly configured, more services, etcetera, attached to that.”

The CEO backed this up by saying: “That's the path. There's storage, deployment services, pro support, our consulting services, networking, so in the entire basket of the solution.”

Later, the CEO stated again: “I need to mention we got a storage opportunity in there, that we have a networking opportunity in there, and we have a services opportunity in there and to go for the last of the bunch of financing opportunities. So those — how could you not be excited about that given the demand environment?”

Sizing the AI-Related Opportunity

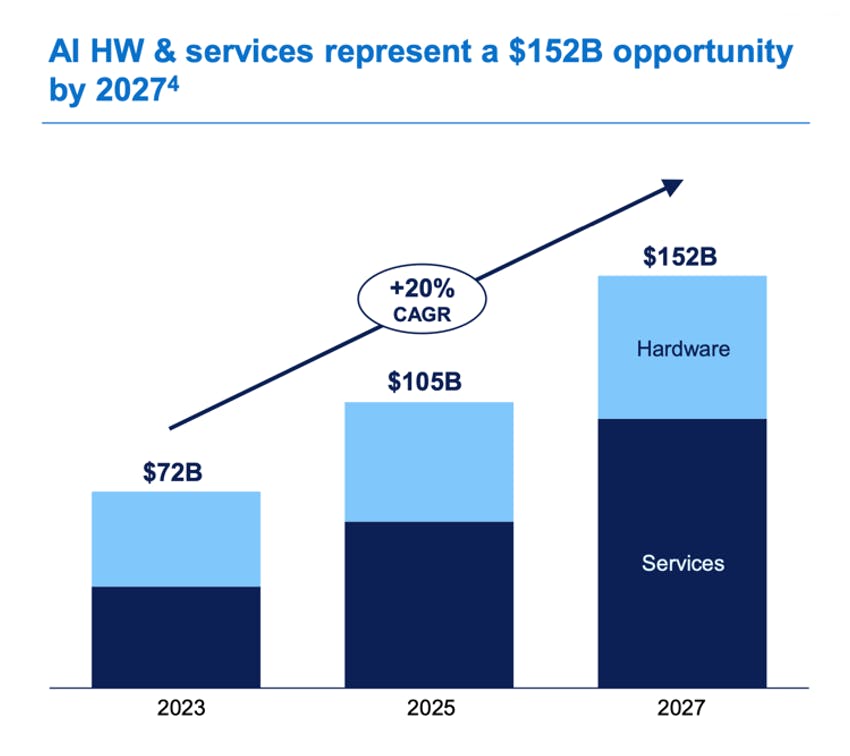
There were also questions about how big the opportunity is and how Dell will participate as TAM rapidly grows at 20% CAGR over the next few years. The CEO answered with the following:

The first thing you probably noticed in our web deck is we increased our view of the opportunity in the marketplace to $152 billion, 20% CAGR going forward to 2027. And quite frankly, that's probably a lagging indicator. It's still catching up. We think demand continues to be ahead of that. Primarily driven is the overall desire, demand for the computational components to do AI exceeds the supply picture. And quite frankly, it's refreshing to see. We have a high growth category here.”

This was one of the more important comments on the call:

“And then if I think long-term going forward, as we look at the opportunity, and again, we referenced the $152 billion in our web deck, but we've done some analysis that's available out in the public domain, but we're looking at an opportunity where every dollar that is for a AI server, GPU server, there's $2 to a growing $3 of professional services around that, networking around that, storage around that.”but we've done some analysis that's available out in the public domain, but we're looking at an opportunity where every dollar that is for a AI server, GPU server, there's $2 to a growing $3 of professional services around that, networking around that, storage around that.”

In October, Dell published an Investor’s Presentation that showed the AI hardware and services opportunity (ISG segment) growing at 18% CAGR for $124 billion by 2027. In the quarterly presentation, the company updated this to a 20% CAGR reaching $152 billion by 2027.

An analyst from Citi asked about the change in total addressable market (TAM) on the call:

Asiya Merchant

Hey, thank you for very much for taking my question. Great results by the way. Just a quick question. I know you guys refreshed sort of your AI TAM as part of this presentation. Just the questions that I get from investors, as you think about the 150 billion TAM that you guys are highlighting now in 27, given Dell's share in storage, obviously your server, mainstream server share and overall share tam in servers. How do you guys think about your share in this 152 billion market by 27? Should we assume the share that you guys have now for servers and storage translates itself into the 150 billion share TAM equivalent? Thank you.

Jeff Clarke:

[…] quite frankly, that's probably a lagging indicator. It's still catching up. We think demand continues to be ahead of that. Primarily driven is the overall desire, demand for the computational components to do AI exceeds the supply picture. And quite frankly, it's refreshing to see. We have a high growth category here […] So this notion of enterprise, our enterprise customer base growing, we've sold to education customers, manufacturing customers, governments. We've sold to financial services, business, engineering and consumer services companies. They're seeing vast deployments, proving out the technology. And some cases are using the tooling of the public cloud. And then they quickly find that they want to run AI on-prem because they want to control their data. They want to secure their data. It's their IP and they want to run domain specific and process specific models to get the outcomes they're looking for.”

Foxconn also stated the AI server market will reach $150 billion by 2027, yet stated it would be due to cloud service providers (CSPs) whereas what Dell is describing is a bit different, as their view is that it will be driven by enterprises.

Following the Q&A, the Citi analyst updated to the following: “Our estimates move higher on higher revenues with slightly lower gross margins offset by tighter operational expenditures. Our estimates assume AI revenues of around $10B by FY26/CY25, and we see upside to $12-15B."

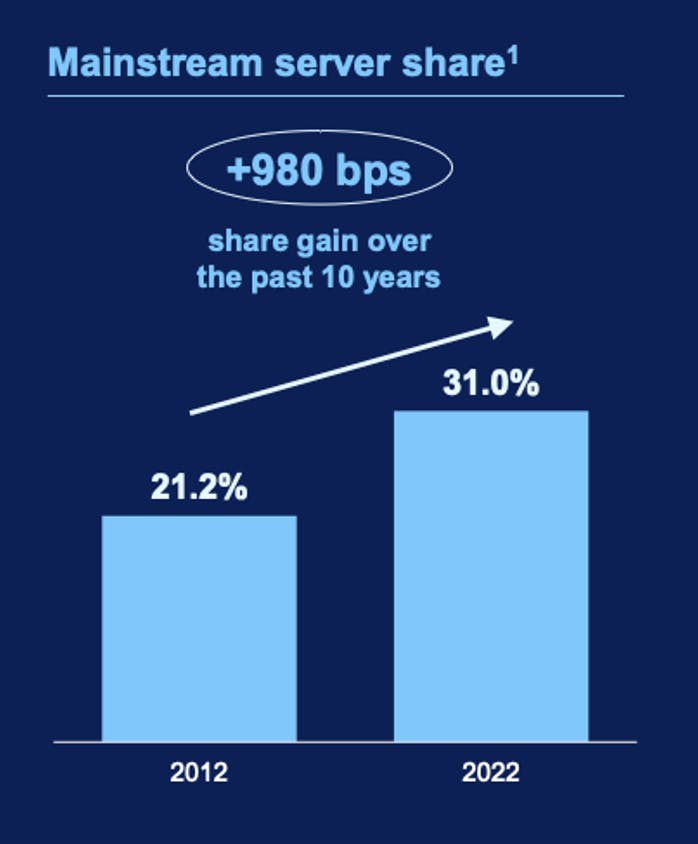
However, this seems low if Dell has a server market share of 21% according to Statista. Dell’s recent investor’s presentation shows a server market share of 31% and “accounts for 43% of new industry revenue over the past 10 years.” Dell also has a 30% market share in storage and “accounts for 38% of new industry revenue over the past five years.” Due to AI revenue being quite speculative at this point (although off to a great start on the sequential growth), it’s likely these estimates are conservative.

Source: Dell’s Investor Presentation

Traditional Server Market & PCs Rebounding (Per Dell):

What is key to our Micron, Broadcom positions and even AMD is the PC rebound as this is when the combination of AI revenue merging with other leading segments will be most evident. The same is true for Dell, and even more so.

According to management, traditional servers will no longer weigh on the company’s revenue in the near-term: “We talked about traditional servers. There's momentum there. Three consecutive quarters of sequential growth and demand. First quarter in a long time of year-over-year demand growth. We exit with good momentum. We tried to reflect that in our guidance. That is in all geographies.”

Since Dell is a major player in PCs, are also noting here comments on when PCs will see a recovery:

“Do I expect the PC market to be bigger in calendar 2024 than 2023? Yes. Do I think the PC market is likely bigger in the second half of 2024 than it is in the first half? Absolutely so. Hence our remarks that we believe the opportunity in PCs is second half driven.

Dell is a Valuation Story, Like SuperMicro:

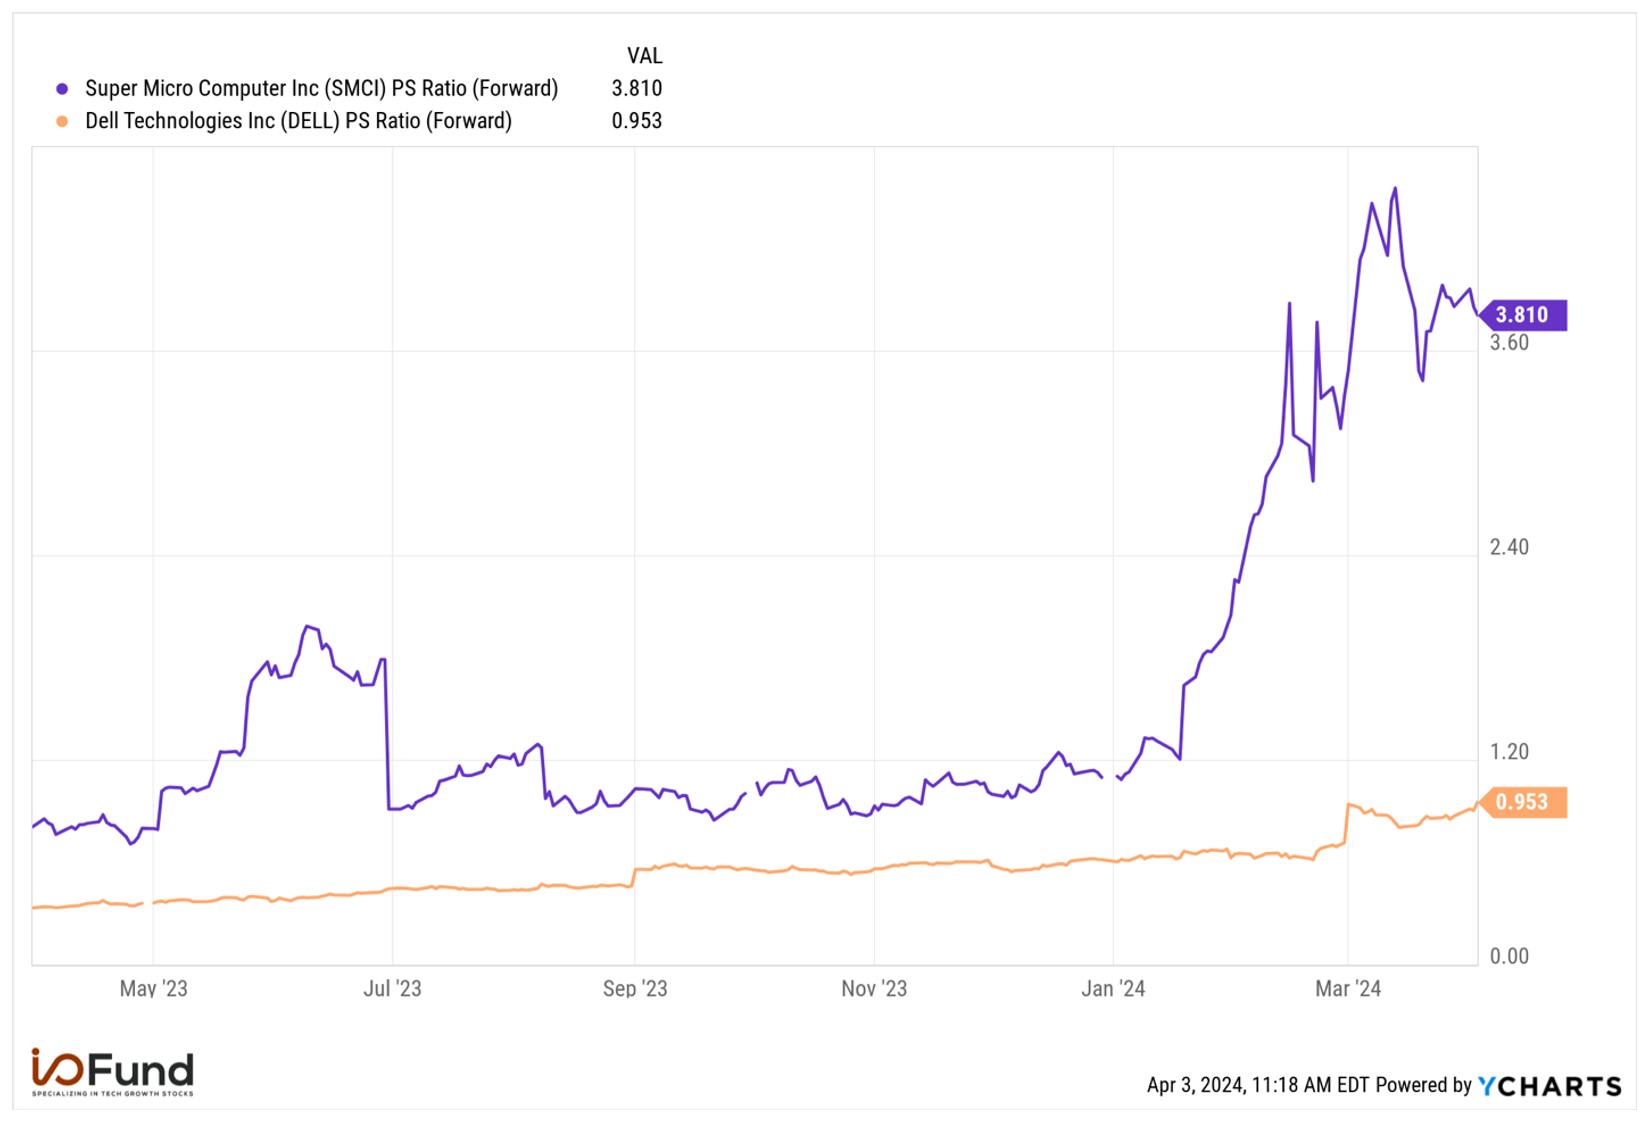
Last summer, I made the argument on Fox Business News that integral to our position in SMCI was its valuation, as moving from a commoditized hardware stock to an AI stock would surely boost the valuation from roughly a 1 Fwd PS to something more reflective of an AI stock. About six months later, in January of 2024, SMCI shot up in valuation to 3 Fwd PS.

Therefore, if Dell continues to report more AI revenue, then the company will be on the precipice of challenging its valuation as a commoditized hardware company. To be clear, Dell is not on par with Super Micro in terms of its AI revenue. Dell has 5% AI revenue and SMCI has a whopping 50%, which we called out as a top company in terms of AI revenue in August.

By 2027, if the Citi estimate is correct, Dell would have about 15% of its revenue from AI if we use the $15 billion. If the $30 billion is what materializes (based on Dell’s current server market share of 21% based on a market size of $152B) then there’s potential to reach 31% of revenue from AI by 2027. Both are speculative but also reasonable given Dell’s dominance in servers.

Truly, Dell is a different profile than Super Micro as Dell is a more conservative, blue chip stock and Super Micro is a high-flier that was a small cap less than a year ago. Super Micro has also announced its intent to raise $2 billion from an equity sale compared to Dell’s $836M buyback program this year alone while also offering a rare dividend among tech stocks.

Dell has a net margin of 5.2% and adjusted net margin of 7.2% which is lower than Super Micro’s at 8.1% and 9%, respectively. However, Dell has scale to help offset a lower margin.

On the bottom line, Dell is trading well at a forward PE ratio of 16.7 above its 3-year median at 11.3. However, if/when Dell is re-rated as an AI stock, there is plenty of room as most AI peers are trading at a 40-50 forward PE ratio.

Technical Analysis

By Knox Ridley

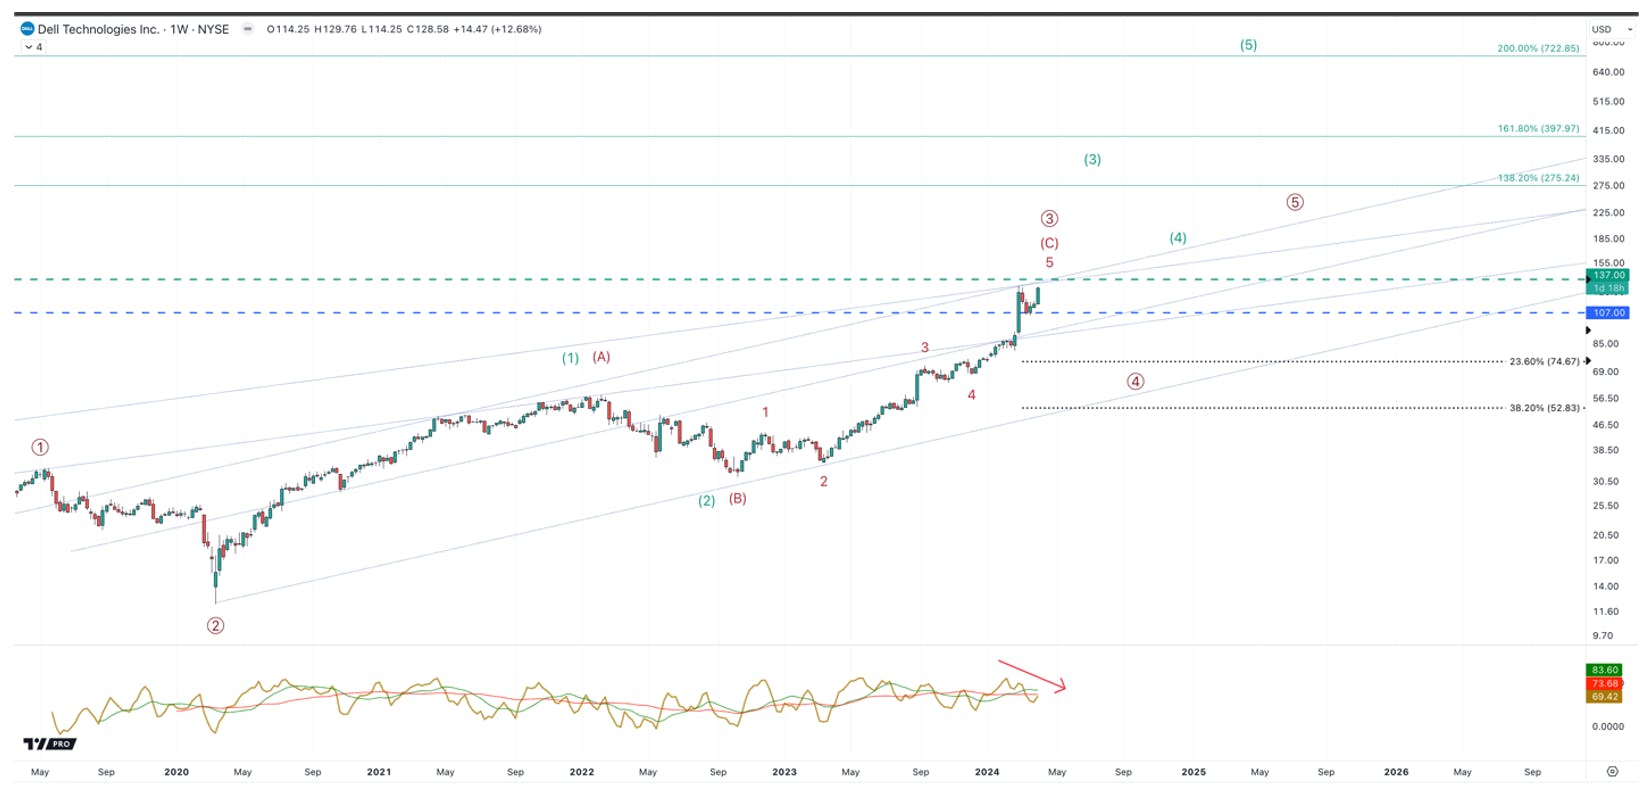
There are two scenarios that best fit the price action of Dell. The direction that we break out of the range between $107 and $137 will determine what path we game plan for.

Green – This scenario would have Dell decisively breakout above $137 on expanding volume and in a straight line. This would signal that we are around the halfway mark of a large degree 5 wave pattern. This would be targeting $275 – $395 before the next notable pullback.

Red – This scenario fits well, especially considering the move off the 2022 low is a clean 5 wave pattern. Note that momentum is fading as price is pushing higher. This fits with a coming pullback, which would start a 4th wave toward the $70 region. A decisive move below $107 would likely put a notable top in for Dell, and favor the red scenario.

There has been considerable institution activity above the $107 region. Either this is accumulation for the next leg higher, or it is distribution for the red scenario. This increases the importance of this region.

Conclusion:

The last earnings report showed signs of early shoots for Dell’s AI potential. If enterprise servers are going to see an AI overhaul, then it makes sense that Dell will participate. What we like about Dell is its conservative blue-chip profile, characterized by a company that operates at scale, offers a buyback program and a dividend. This offers some diversification compared to Super Micro’s risk-on profile.

Even though Dell is optimistic about FY25 growth, in large part thanks to AI server growth and an expected uptick in storage, the company expects input costs to increase further in FY25. This is going to weigh on margins, driven by anticipated inflation for component costs as the year progresses. They also anticipate the pricing environment to be more competitive in FY25, further putting pressure on margins to shrink. This will be a strong focus for calls, as it is for Super Micro, as well.

We would love to participate in Dell if the re-rating on valuation comes sooner rather than later. However, we also want to be cautious as the 5% AI revenue is quite low. We are likely to wait for the breakout detailed above instead of front-running this stock as any breakout will still provide plenty of time to capture Dell if it does get a new valuation.

Recommended Reading:

I/O Fund Catapults to 131% Cumulative Performance Due to Leading AI Allocation: Official Press Release

Actively managed portfolio and research site announces triple-digit returns over a four-year period.

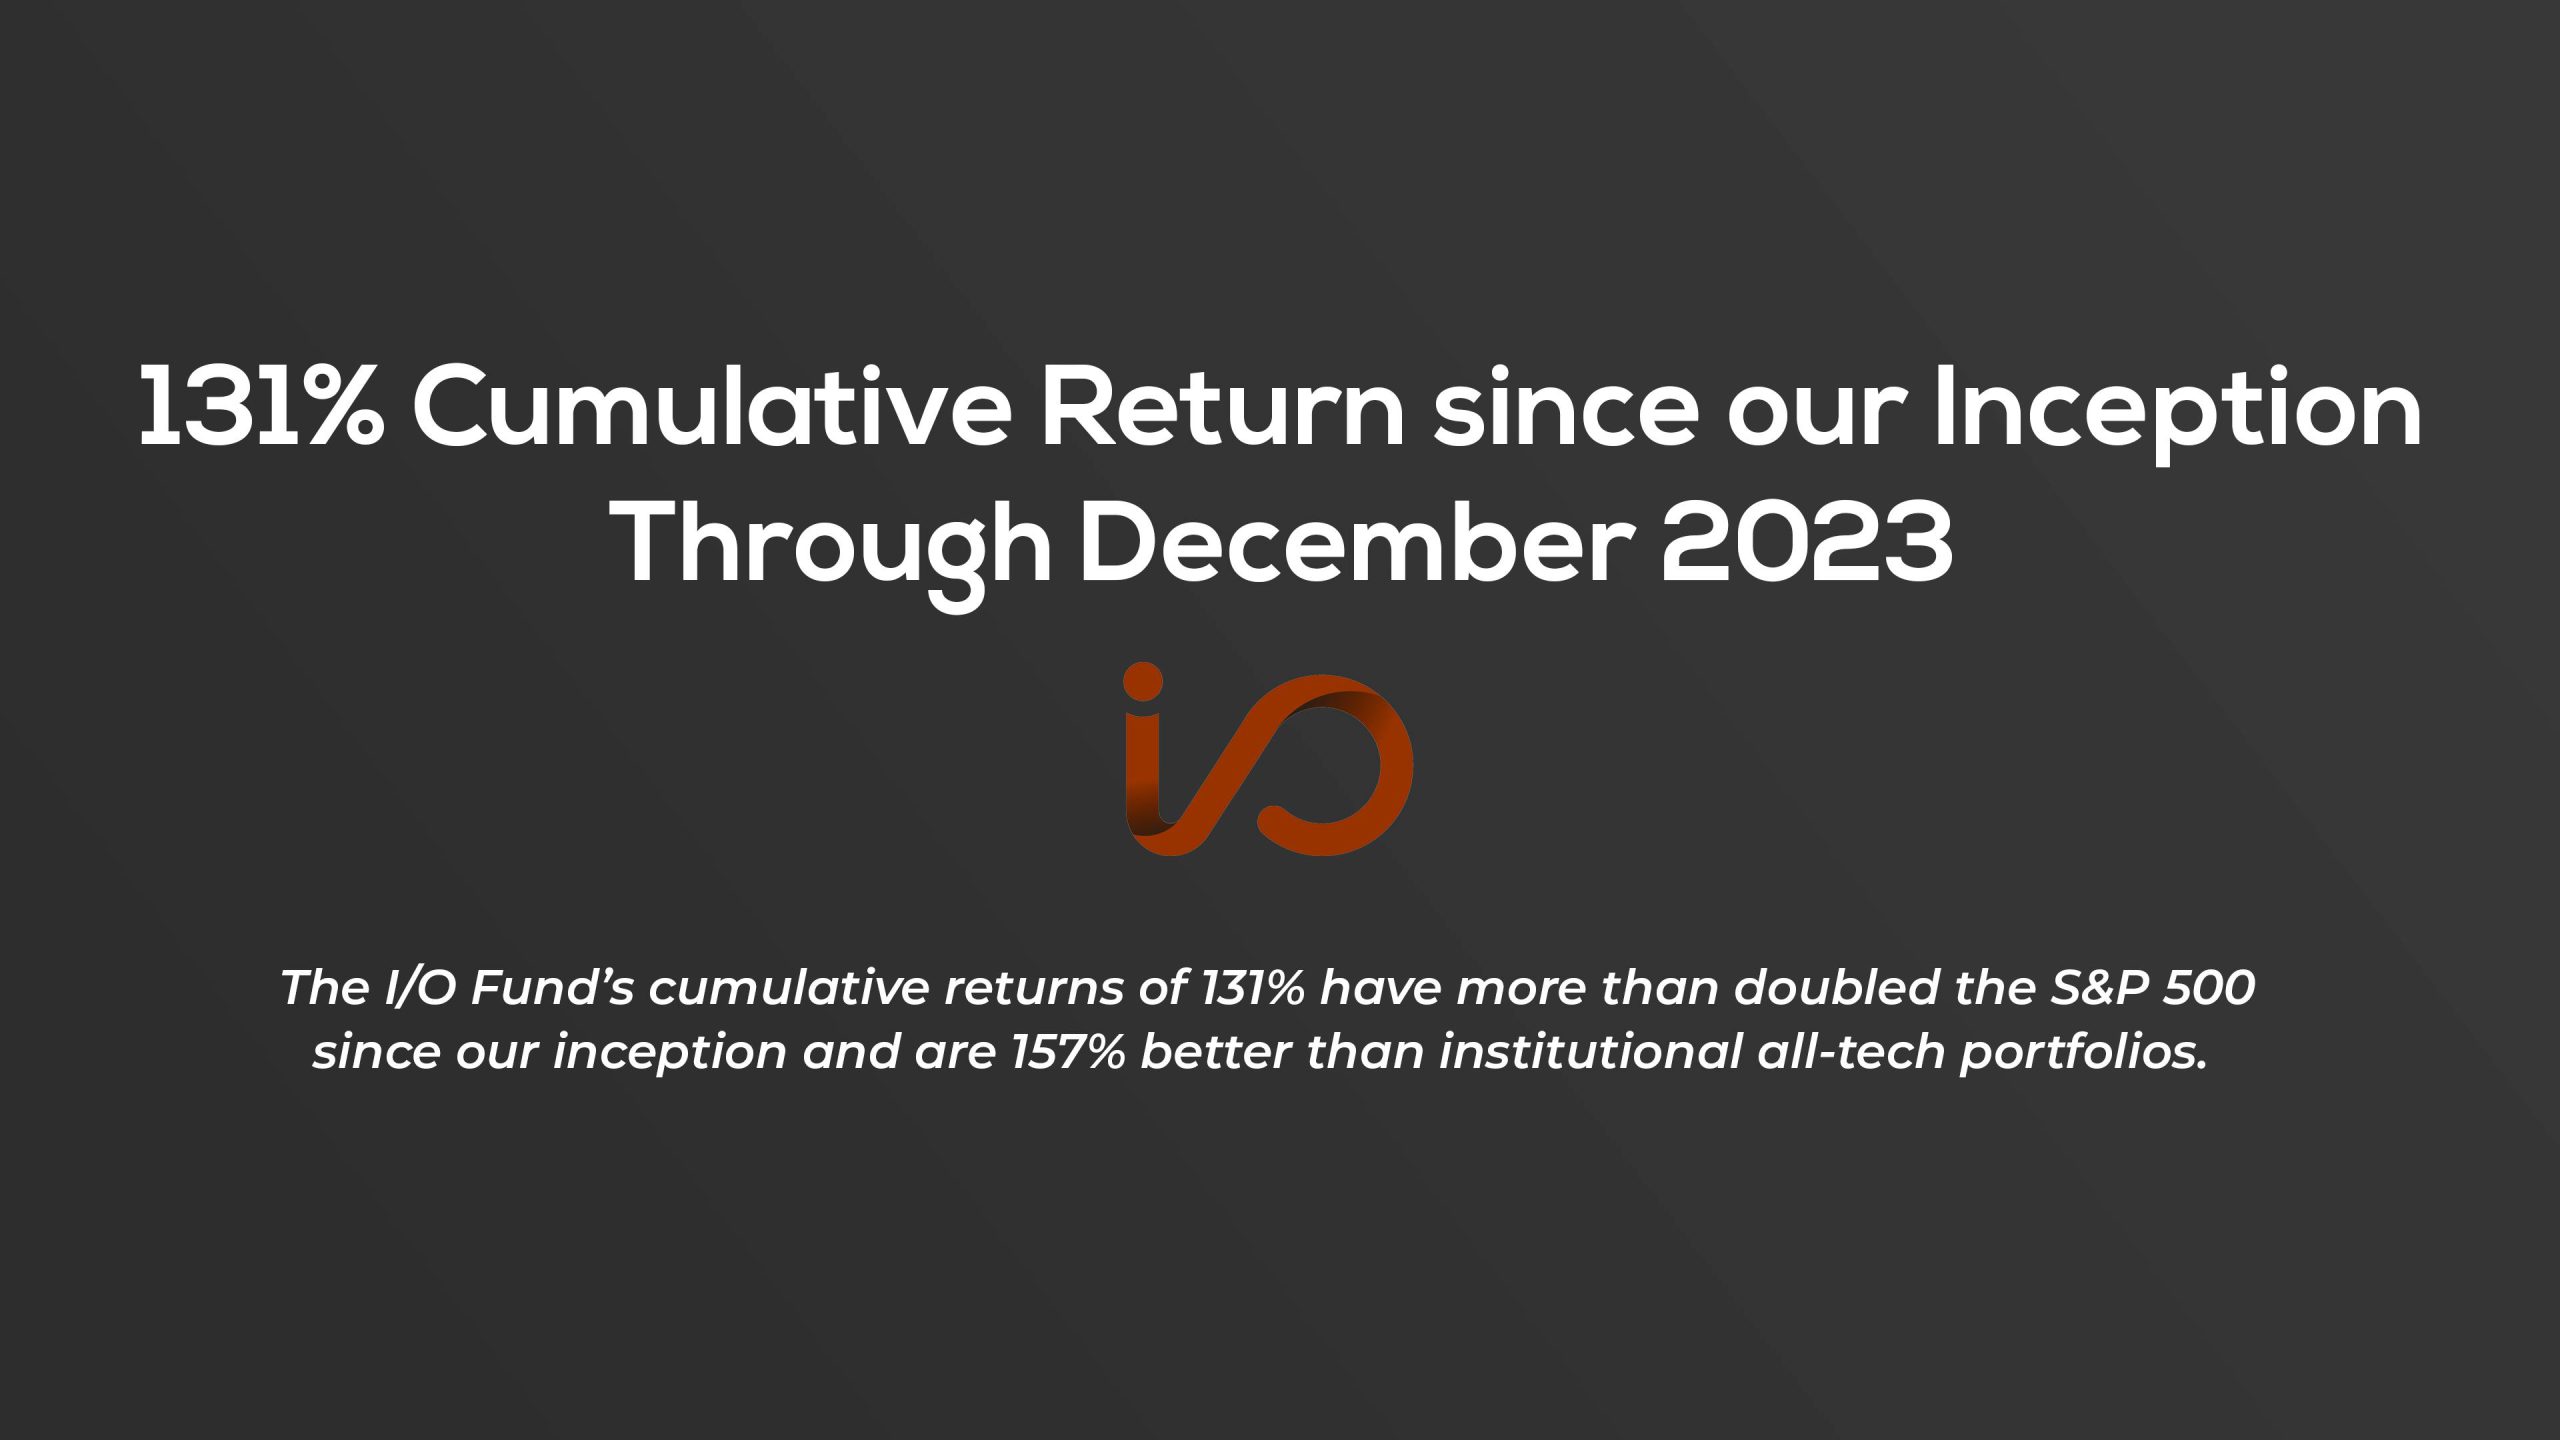
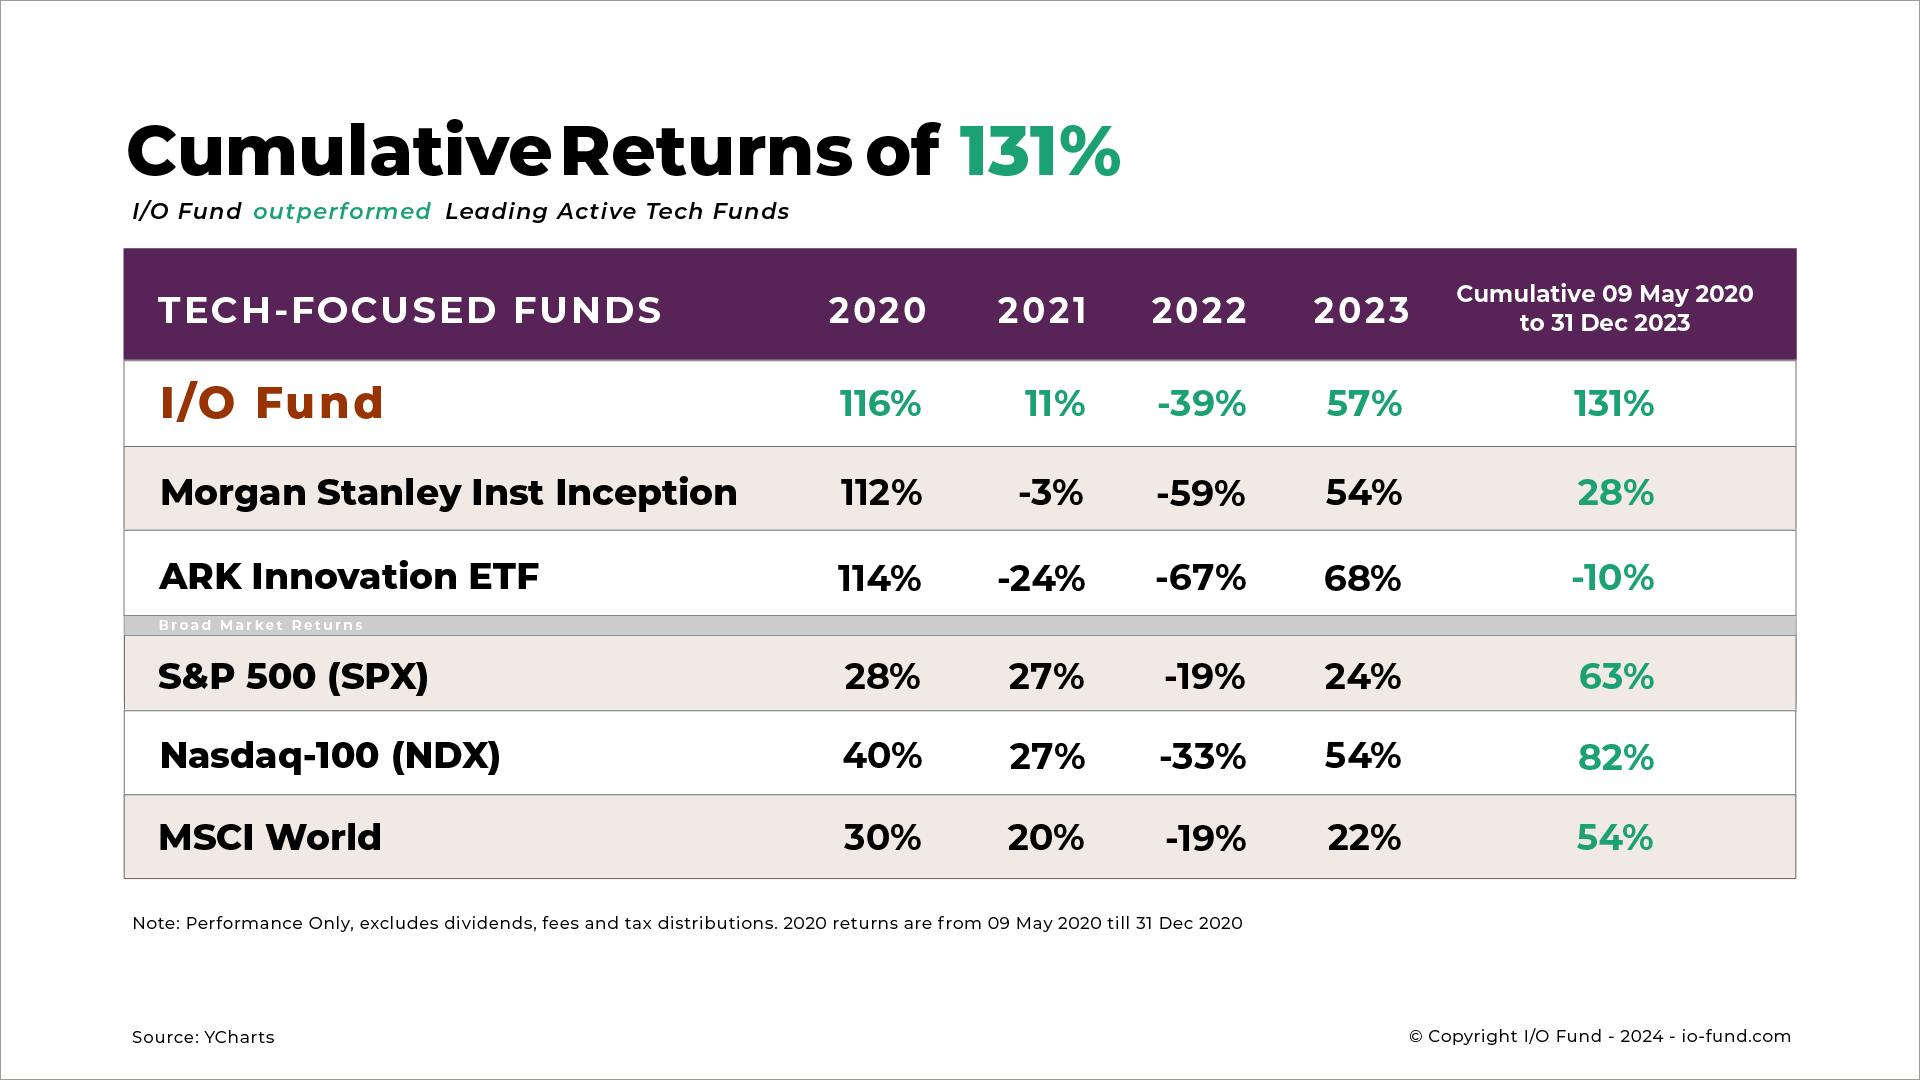
I/O Fund, a tech research site that actively manages a real-time portfolio, announces returns of 57% in 2023 with a cumulative return of 131% since inception. This compares to popular tech ETFs that have cumulative returns of (-10%) in the same time period for an outperformance of 141% in less than four years.

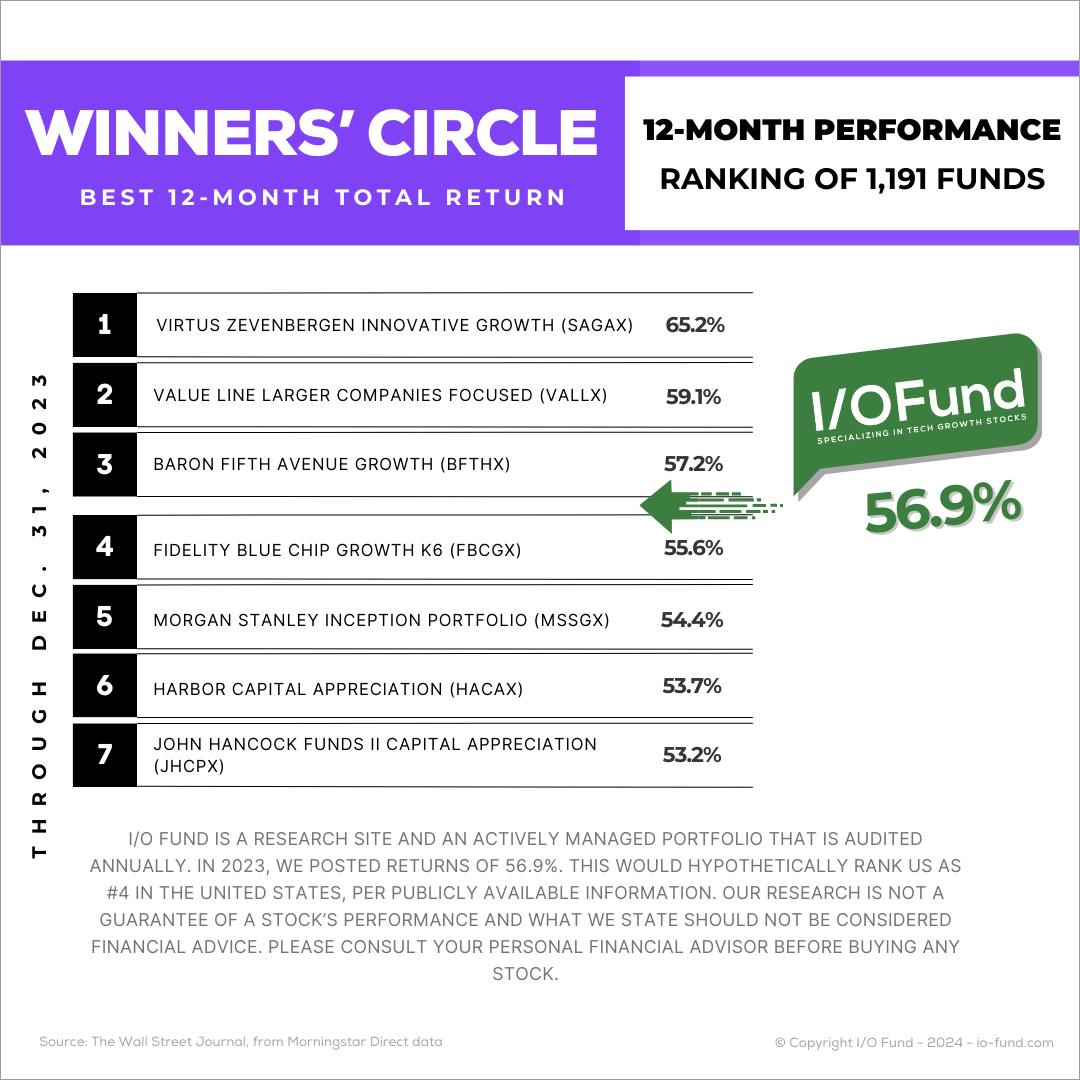
In 2023, the I/O Fund had seven positions beat the Nasdaq-100. According to the Wall Street Journal’s Winners’ Circle ranking of hedge funds, a performance of 57% would hypothetically rank the I/O Fund portfolio as #4 across 1,191 funds.

Leading AI Allocation Drives Impressive Cumulative Returns

Since its inception, the I/O Fund has rivaled and exceeded Wall Street’s best firms. A few highlights of the I/O Fund’s performance include:

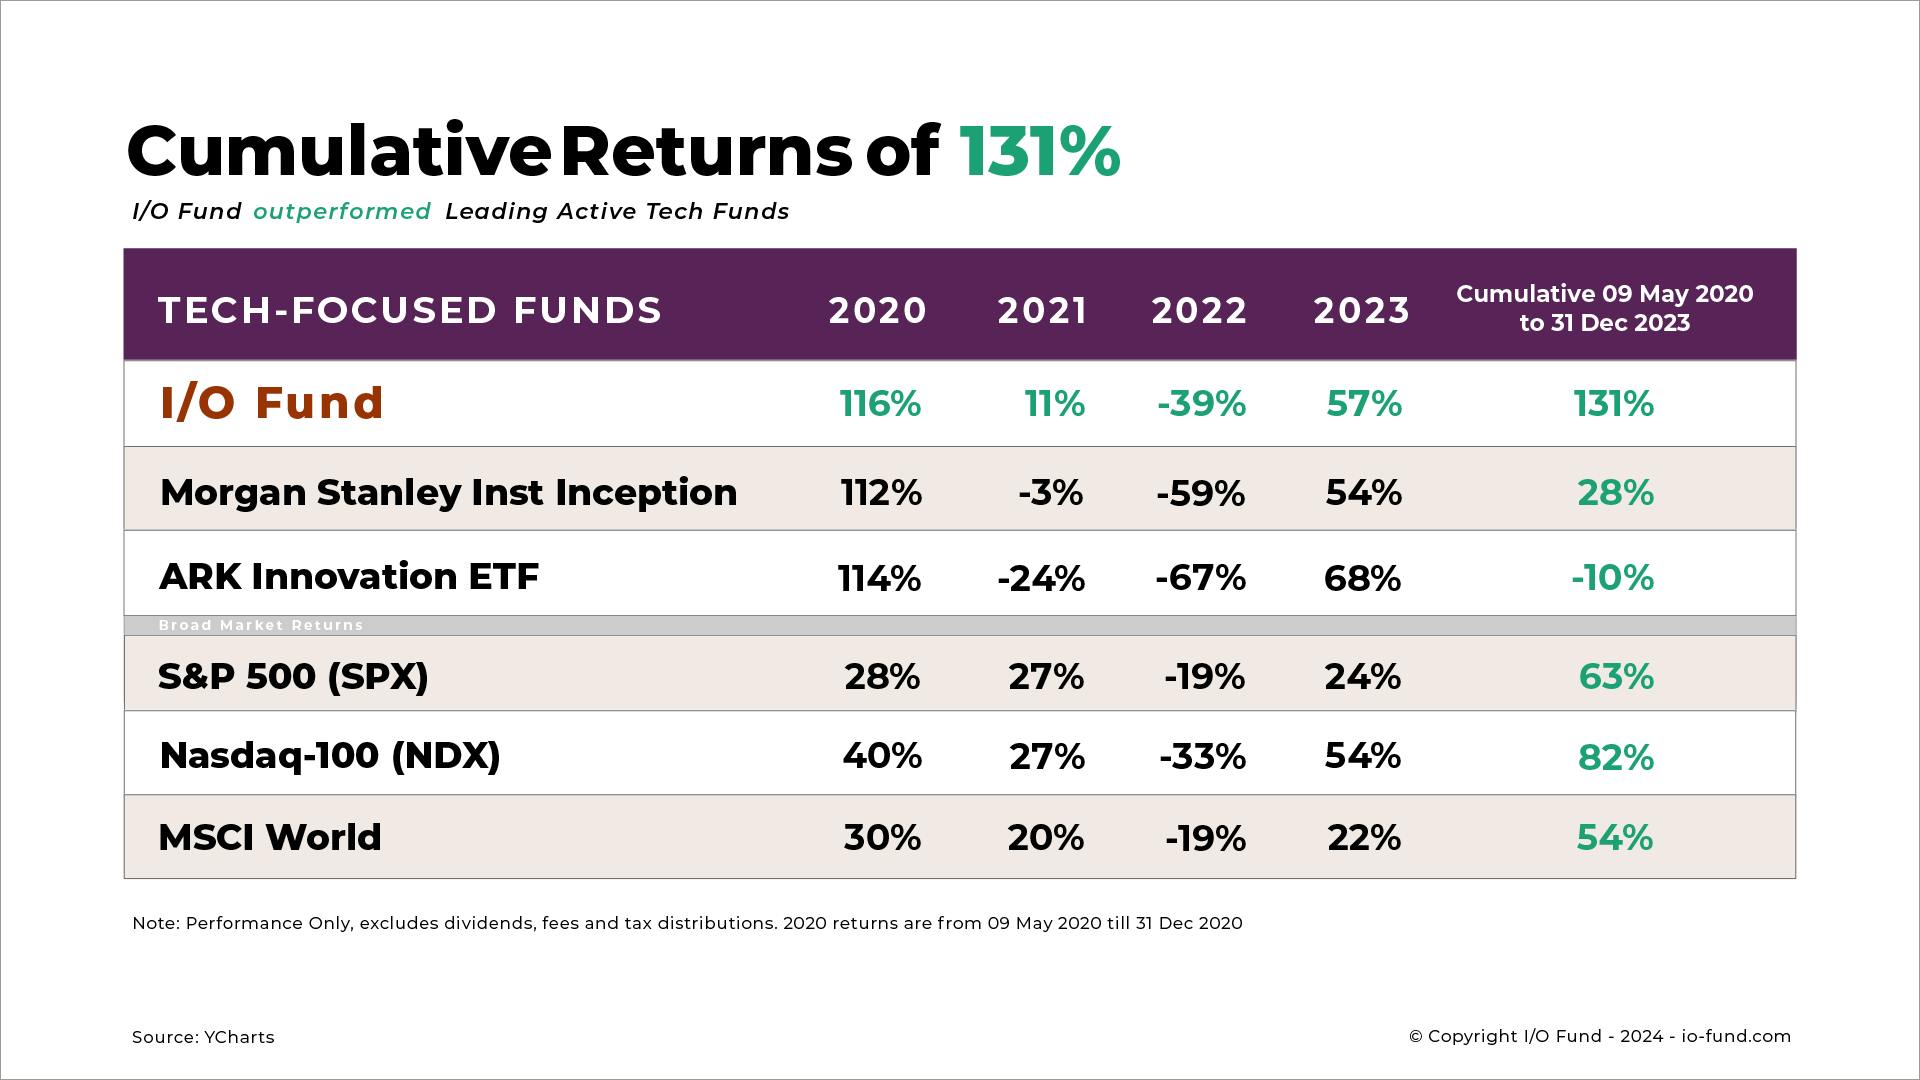
  • The I/O Fund’s cumulative returns since inception of 131% compared to popular tech ETFs at (-10%) with a relative outperformance of 141% in less than four years.
  • The I/O Fund’s cumulative returns outperformed the Nasdaq-100 by 49% and outperformed the S&P 500 by 68%.
  • Since inception, the I/O Fund has a lead over institutional technology portfolios by as much as 157%.
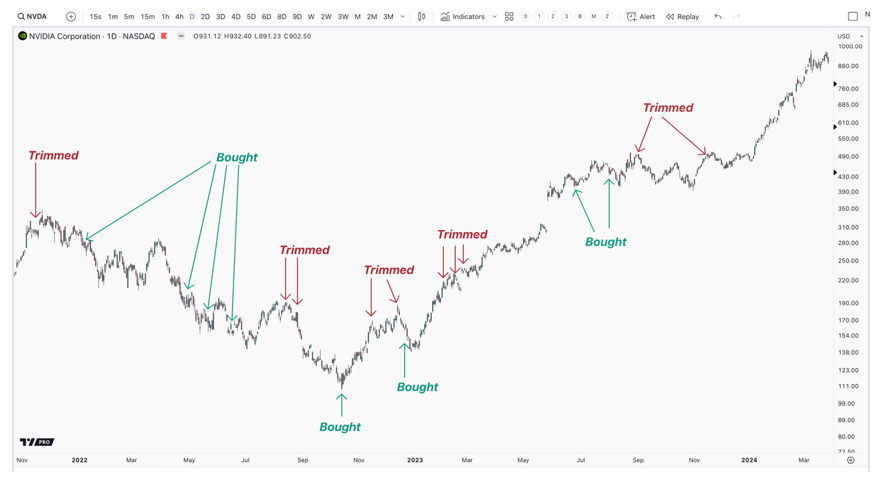
  • In 2021-2022 we issued 9 buy alerts for Nvidia with the lowest at $108.51 on October 13th, 2022 for gains of up to 775% in eighteen months.

Impeccable timing on Nvidia and other AI stocks led to the I/O Fund having one of the highest allocations to AI on record at 45%. Previously, our firm was early to cloud in 2019, then rotated into AI in 2022.

Our high allocation to AI of 45% in 2023 was timely as it allowed us to beat Wall Street to the explosive trend of AI. Nvidia was a strong call by our firm and was our largest position at the time of its knockout report. Most importantly, our track record places us as a front runner within this trend, and we are confident we will find additional winners. We exited the year with an AI allocation of 52%.

The I/O Fund began as an experiment to see if a team of retail investors can beat Wall Street. We are setting out to answer the million-dollar or billion-dollar question, which is how to safely participate in tech while limiting the downside. We do not believe this question has been truly answered. Hedge fund managers often pick one tech stock or a few tech stocks and place them alongside a diversified portfolio as a means of limiting the downside. However, tech is the world’s most valuable industry – no other industry offers you the opportunity for life-changing gains repeatedly, year after year. Therefore, diversifying away from tech certainly helps protect the downside but it greatly limits the upside, as well. 

That leads to our mission, which is to offer an all-tech portfolio that participates in the upside yet aims to limit the downside. That’s how we hope to set our portfolio apart. Our comparison chart proves we are off to a great start in answering this problem.

I/O Fund Cumulative Returns

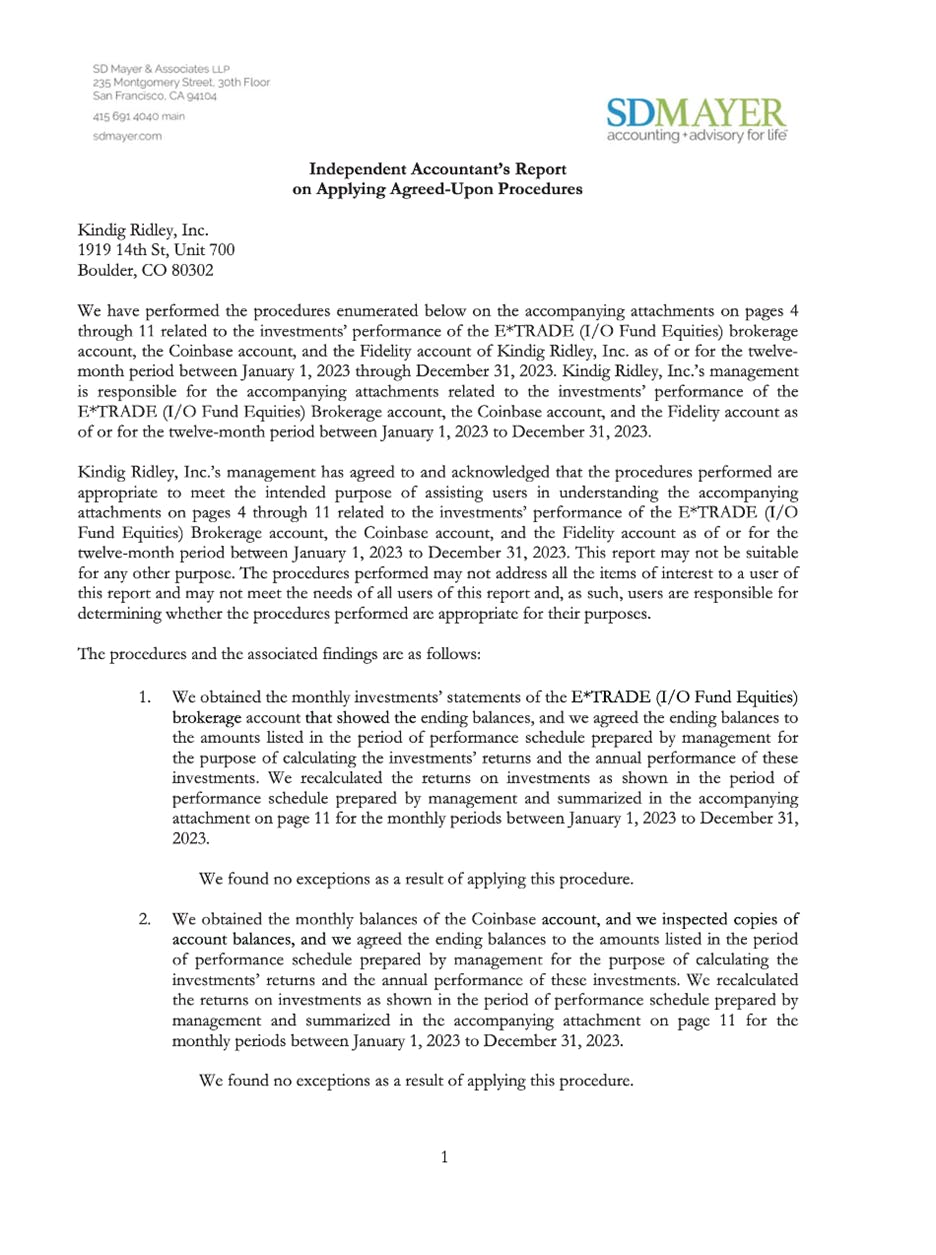
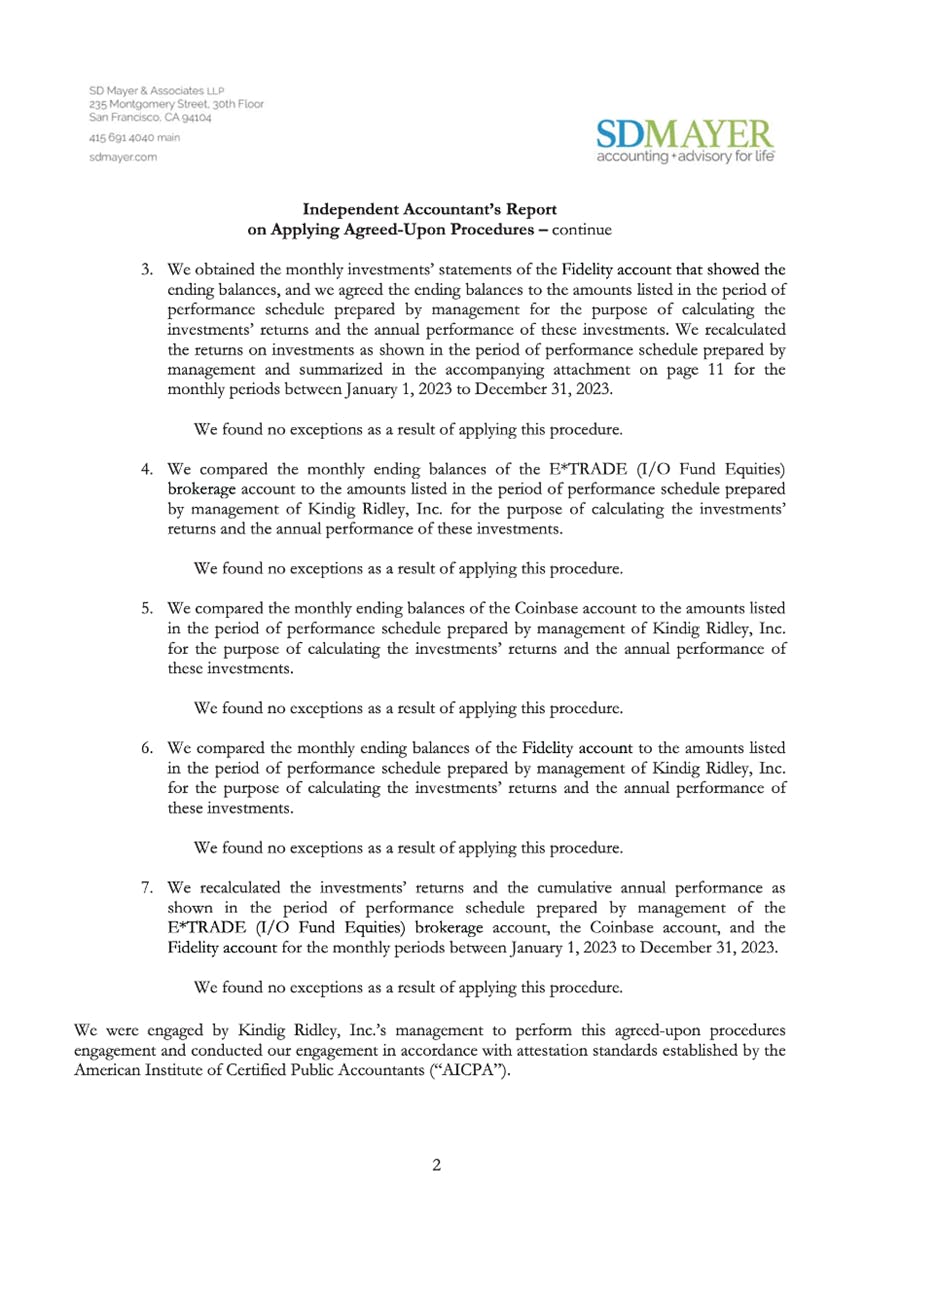
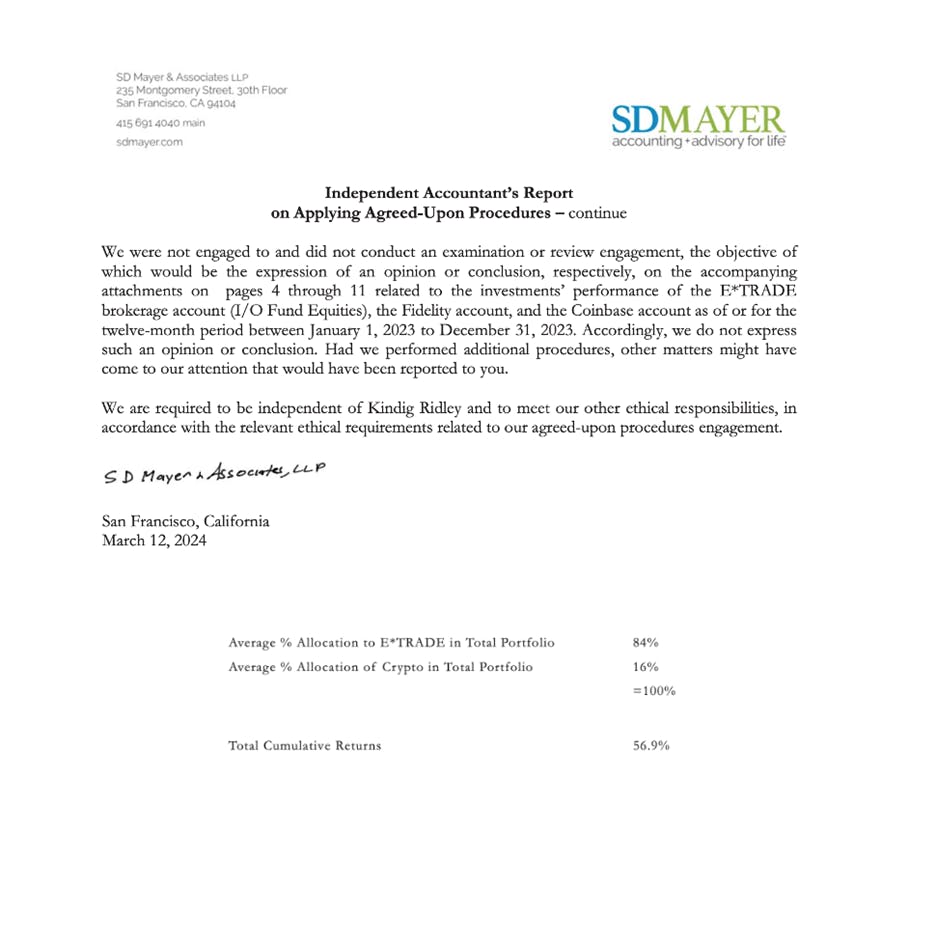
These results were independently audited by an accounting firm in San Francisco. More details can be found on the I/O Fund website.

If you had invested $10,000 with the I/O Fund’s picks versus other all-tech portfolio at inception, the difference would be a portfolio value of $23,052 with IOF versus $8,982 with institutional tech-focused portfolio. The difference in value is 157%.

You can read the official Business Wire press release below. A copy of the verified procedures and the verified performance percentage is shared with I/O Fund customers in the paywall article “2023 Audited Returns.” To become a customer of the I/O Fund, learn more here.2023 Audited Returns.” To become a customer of the I/O Fund, learn more here.

Full Press Release from BusinessWire:

Published March 27th, 2024

I/O Fund, a tech research site that actively manages a real-time portfolio, announces returns of 57% in 2023 with a cumulative return of 131% since inception. This compares to popular tech ETFs that have cumulative returns of (-10%) in the same time period for an outperformance of 141% in less than four years.

The I/O Fund grew to prominence in 2023 due to famously calling Nvidia an AI stock in 2018 and repeating the thesis over 25 times including Tier 1 media appearances. In 2021, the firm publicly stated that Nvidia would surpass Apple to become the world’s most valuable company. At the time, this was inconceivable.

Since its inception, the I/O Fund has rivaled and exceeded Wall Street’s best firms.

  • The I/O Fund’s cumulative returns since inception of 131% compared to popular tech ETFs at (-10%) with a relative outperformance of 141% in less than four years.
  • The I/O Fund’s cumulative returns outperformed the Nasdaq-100 by 49% and outperformed the S&P 500 by 68%.
  • Since inception, the I/O Fund has a lead over institutional technology portfolios by as much as 157%.

These results were independently audited by an accounting firm in San Francisco. More details can be found on the I/O Fund website.

“We are unrivaled when it comes to choosing artificial intelligence winners. Nvidia was our highest allocation, yet there are many other AI winners the I/O Fund is poised to capture. We beat Wall Street to an explosive moment for AI and we plan to beat Wall Street again to other AI leaders,” said Beth Kindig, CEO and Lead Tech Analyst.

Lead Tech Analyst, Beth Kindig, was dubbed “Queen of Nvidia” by Fox Business News when she stated on live TV that her firm was sticking with Nvidia after the company reported a $2.5 billion revenue miss in 2022.

Kindig’s firm sent out 9 trade alerts under $200 for Nvidia in 2021 and 2022 with one trade alert as low as $108.51 on October 13th, 2022 for gains of up to 775% in under eighteen months. Due to Kindig’s unique approach to tech analysis, the portfolio holds a handful of stocks she believes will ultimately become large AI winners.

Impeccable timing on Nvidia and other AI stocks led to the I/O Fund having one of the highest allocations to AI on record at 45%. Previously, the firm was early to cloud in 2019, then rotated into AI in 2022.

“We were early to Nvidia’s AI story and we are confident we will be a frontrunner in finding the next big AI stock. The AI trend is the best investment opportunity of our lifetime, and we offer an invaluable resource to those who want to capture it,” said Beth Kindig, CEO and Lead Tech Analyst.

In 2023, the I/O Fund had five positions with returns over 100% and seven positions beat the Nasdaq-100.

The I/O Fund portfolio manager, Knox Ridley, uses risk management tools such as intermarket analysis, Elliott Wave and Gann theory to increase the resiliency of the portfolio returns compared to a buy-and-hold approach.

“The million-dollar or even billion-dollar question that has yet to be answered is how to not simply participate in tech, which anyone can do, but rather how to safely participate in tech. The I/O Fund set out to be the first to answer this question, which is why our returns significantly outperform buy-and-hold strategies,” said Knox Ridley, Portfolio Manager.

In 2022, the I/O Fund partnered with Vincent Duchaine of WealthUmbrella to develop an automated hedging signal. Duchaine is an A.I. and Machine Learning University Professor who worked with Ridley to create an automated risk-on/risk-off signal for retail investors. The hedge is the primary tool the I/O Fund uses to hold onto gains from AI and other profitable tech trends irrespective of a broader selloff.

Ridley and Duchaine provide exceptional analysis for crypto markets including Bitcoin. The duo published analysis that was prescient in identifying the bottom in 2022 at $16,500 after identifying the previous top in 2021 at around $58,000.

The I/O Fund hires an independent accounting firm to conduct its periodic audits. It reviewed statements from January 1st, 2023 through December 31st, 2023 from the company’s brokerage and blockchain accounts and found no discrepancies.

For more information, including pricing plans for the I/O Fund’s research, visit their website at https://io-fund.com. Premium members access a portfolio of 10+ positions, webinars, institutional-level research, real-time trade notifications and more. The firm also offers a free weekly newsletter.

Commitment to Transparency and Accountability

At the heart of I/O Fund, we believe that transparency is key to our success over the last few years. We keep our members in the loop with real-time trade alerts and audited performance reviews. This raises the bar on accountability as no other retail site goes to these lengths by offering an actively managed and transparent portfolio.

Over the past three years, the I/O Fund has invested over $165,000 into accountability and transparency for our members. When we launched in July of 2019, for the first year or so, we used a forum hosted by Tribe for our trade alerts. By January of 2021, we had migrated to SMS and email tools that were the least likely to experience an outage for our real-time trade alerts. This costs us $30,000 to $40,000 per year, depending on our trading frequency.

In addition to this, we use an auditor from a large firm in San Francisco to mathematically review and verify the performance of our I/O Fund portfolio trading account and crypto account. The process is quite extensive and it takes up to four months to complete. This costs $4,500 per audit and we’ve completed five audits for a total of $22,500 spent on this process.

Premium members can access the verified procedures, verified performance and engagement letter behind our paywall in the article “2023 Full Year Audited Returns.”

I/O Fund Analyst, Beth Kindig, recently wrote “The Importance of Verified Returns and Risk Management for Retail Investors” which identifies three key reasons retail tends to underperform professional investors. The I/O Fund has worked diligently and made sizable investments to empower retail investors by addressing these issues which include automation, risk management tools and being the only retail firm to offer a verified performance.

The I/O Fund Experiment: Empowering Retail Investors

The I/O Fund's mission since inception is to help retail investors beat Wall Street in the competitive and complex tech sector. Our experiment in providing institutional-level research and tools to retail investors has been successful since we first launched in 2019. This includes having a cloud-focused portfolio in 2020, beating our other all-tech portfolios in the tough years of 2021 and 2022, and pivoting to a high AI allocation well ahead of 2023, which helped us triple our performance on a cumulative basis.

If you are ready to optimize your investment strategies, join the I/O Fund Community and experience the advantages of accountability, innovation, and exceptional performance. Subscribe to our premium analysis service to access real-time trade alerts, weekly webinars that review our positions plus the broad market, a forum to connect with other skillful investors, and deep dive research from a Silicon Valley trained analyst who is frequently in Tier 1 media. Learn about our Premium Services here or Explore Pricing Options here.

Please note: The I/O Fund conducts research and draws conclusions for the Fund’s positions. We then share that information with our readers. This is not a guarantee of a stock’s performance. Please consult your personal financial advisor before buying any stock in the companies mentioned in this analysis.

2023 Full Year Audited Returns

We issued a press release yesterday in Business Wire with our full audited returns entitled “I/O Fund Catapults to 131% Cumulative Returns Due to Leading AI Allocation,” which you can find here.

The I/O Fund portfolio posted returns of 56.9% in 2023. If we were a hedge fund, our ranking would be #4 in the Wall Street’s Journal Winners’ Circle ranking of 1,191 funds. For those who don’t have access to the article since it’s behind a paywall, the average fund returned 19.7% in 2023 and the top three funds returned 65.2%, 59.1%, 57.2%, with the fourth returning 55.6%.

Source: Wall Street Journal

Our cumulative returns of 131% also exceeds other tech peers. When compared to the most popular tech ETF on the market, we are ahead by as much as 157%.

If you had invested $10,000 with the I/O Fund’s picks versus other all-tech portfolio at inception, the difference would be a portfolio value of $23,052 with IOF versus $8,982 with popular tech ETFs. The difference in value is 157%.

Our high allocation to AI of 45% in 2023 was timely as it allowed us to beat Wall Street to the explosive trend of AI. Nvidia was a strong call by our firm and was our largest position at the time of its knockout report. Most importantly, our track record places us as a front runner within this trend, and we are confident we will find additional winners. We exited the year with an AI allocation of 52%.

A Few Important Stats About our Performance:

  • The I/O Fund’s cumulative returns of 131% outperformed the Nasdaq-100 by 49%
  • The I/O Fund cumulative returns of 131% outperformed the S&P 500 by 68%.
  • The I/O Fund’s cumulative returns since inception of 131% compared to popular tech ETFs at (-10%) with a relative outperformance of 141% in less than four years.
  • Since inception, the I/O Fund has a lead over institutional technology portfolios by as much as 157%.
  • Our 2023 returns of 56.9% would rank us as the #4 performing hedge fund in the United States, according to the Wall Street Journal.
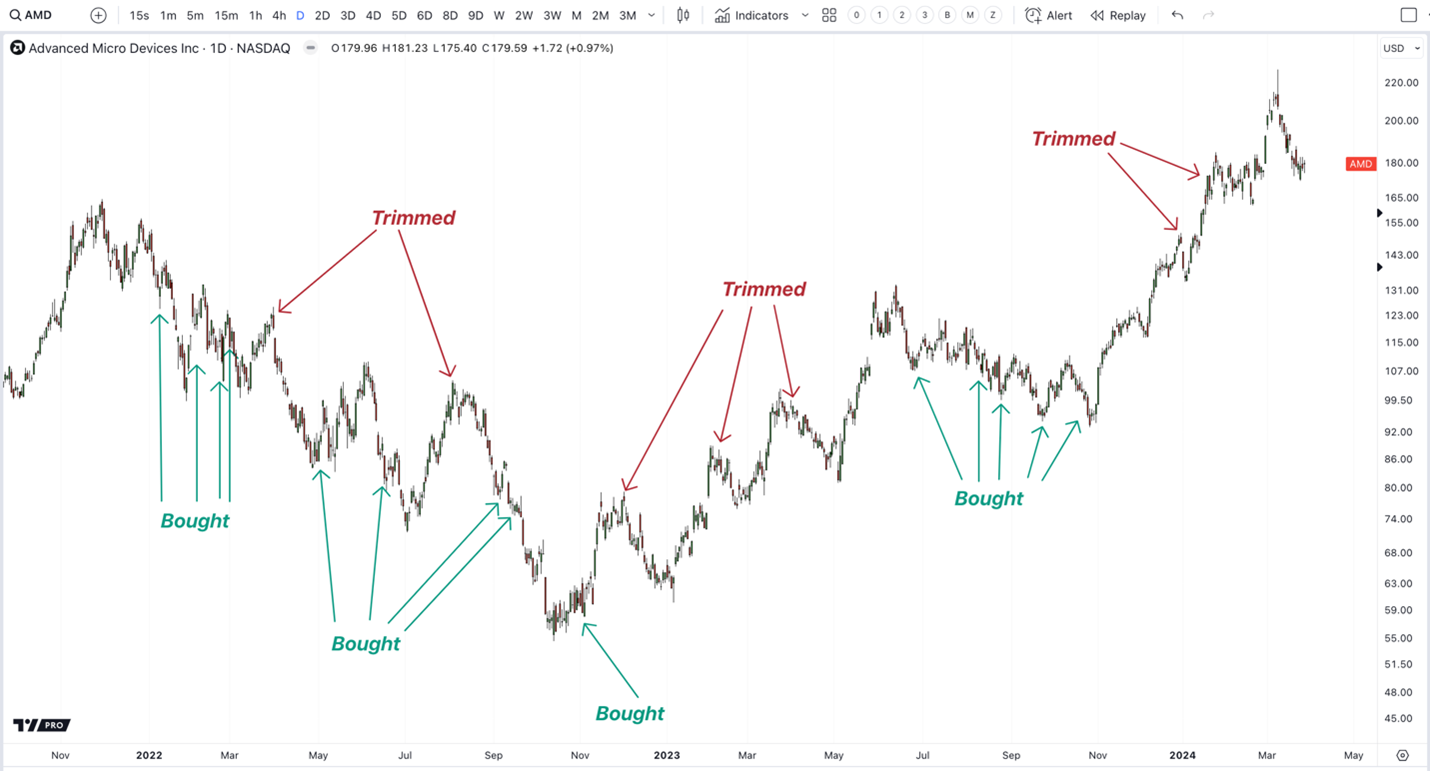
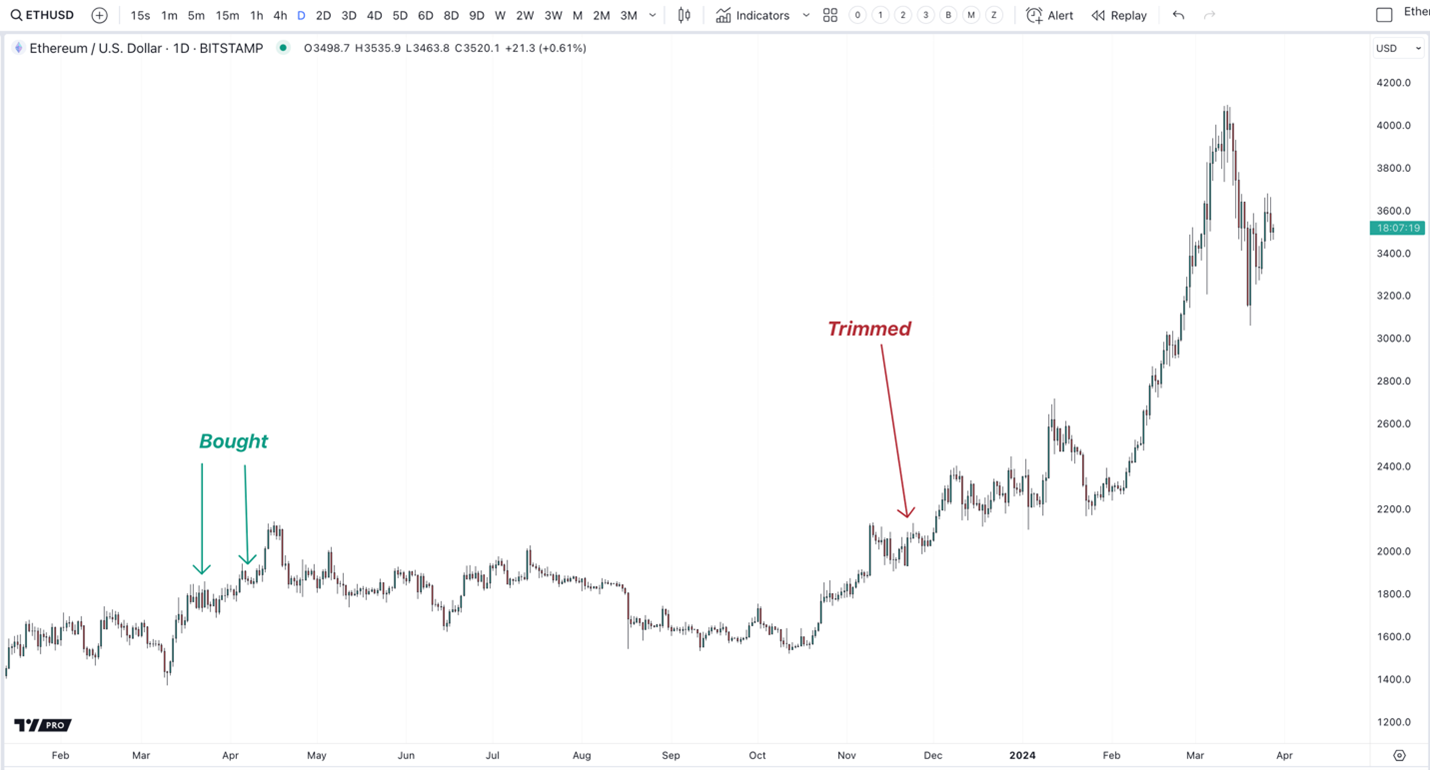
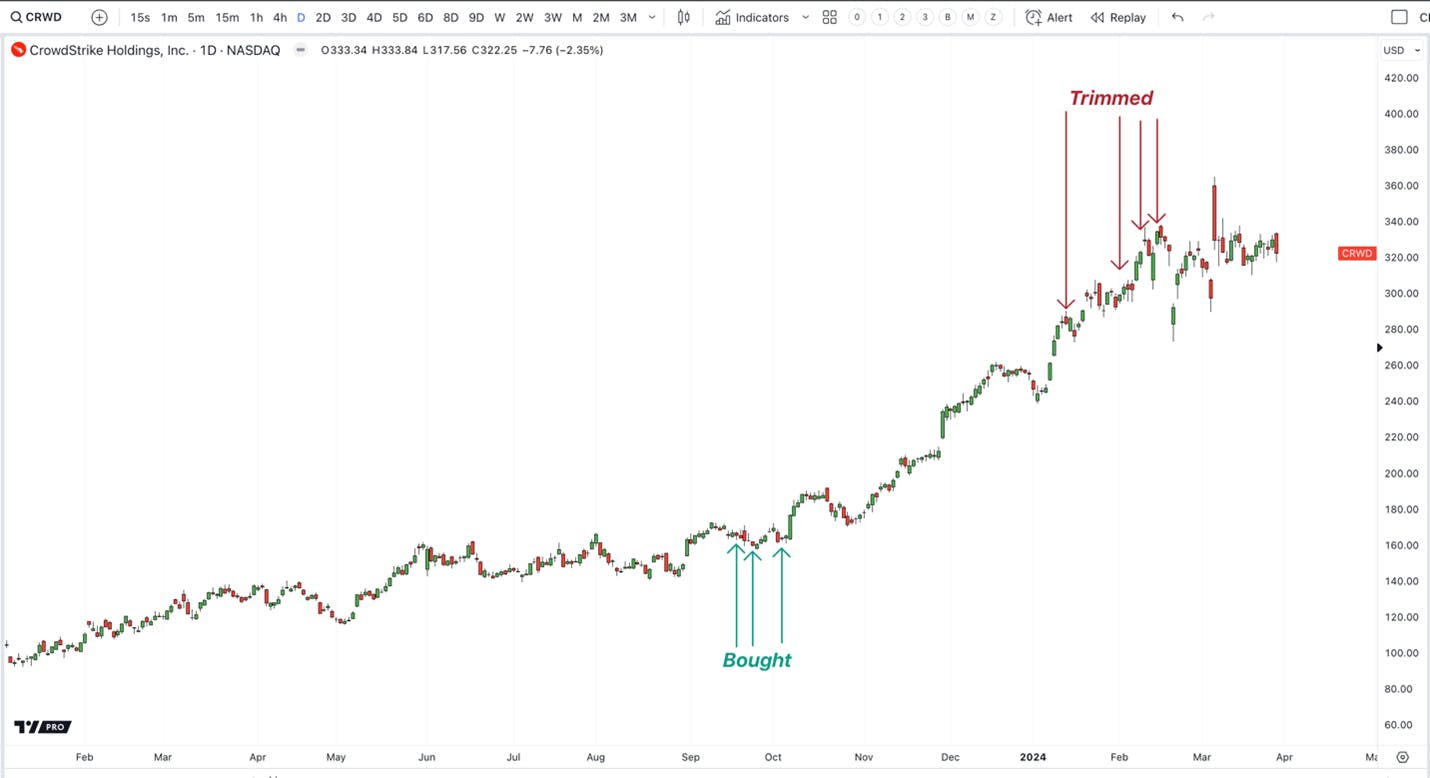
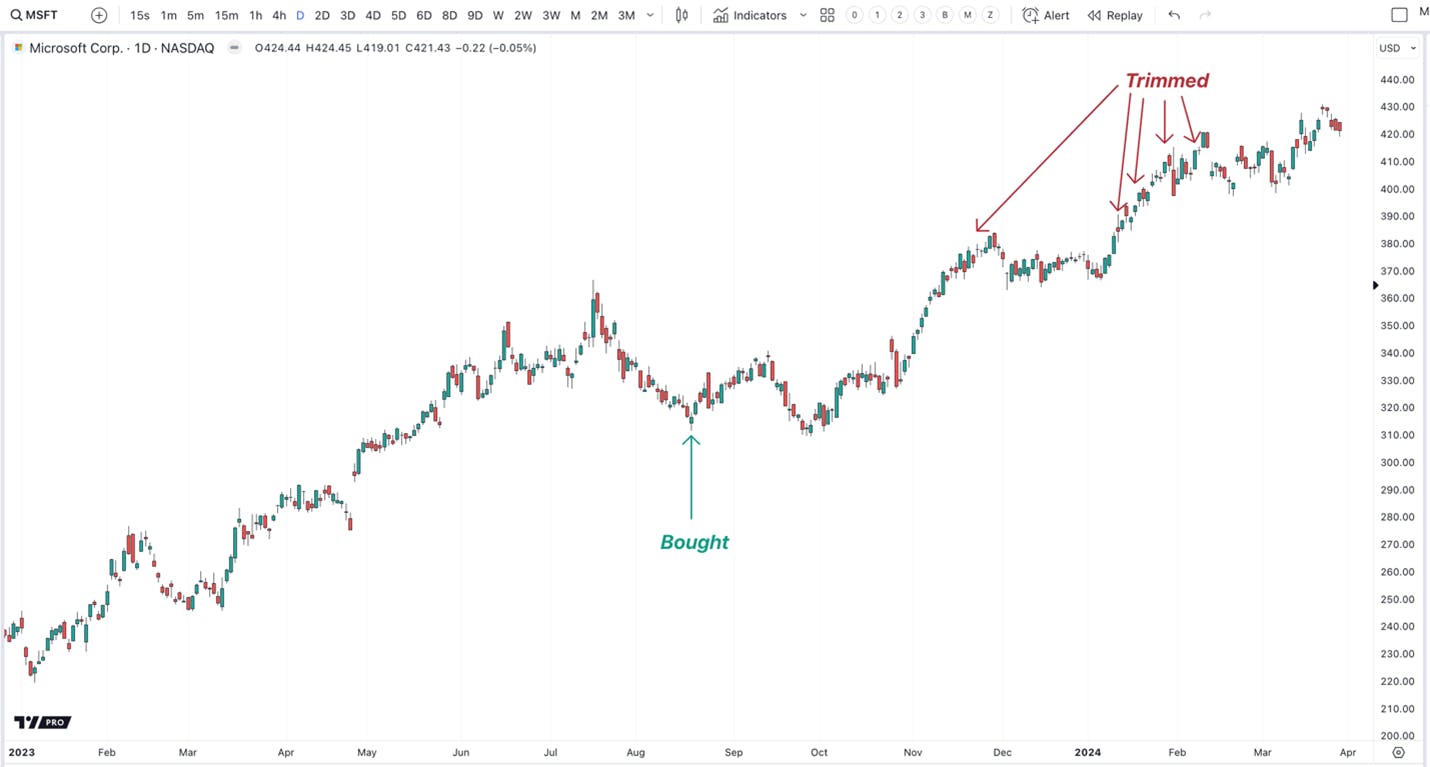
  • We had seven positions beat the Nasdaq-100. These positions were Nvidia +237%, Bitcoin +158%, Chainlink +168%, AMD +123%, Ethereum +92%, CrowdStrike 58%, and Microsoft 54.6%.
  • In 2021-2022, we issued 9 buy alerts under $200 for Nvidia with the lowest at $108.51 on October 13, 2022 for gains of up to 775% in eighteen months.
  • During the same time period, we issued 11 buy alerts on AMD under $110.

2023 Winning Positions Overview

Nvidia:

On average, a 15% allocation, which was our top position for most of 2022 and 2023. The returns for 2023 were 237% for 2023.

Bitcoin:

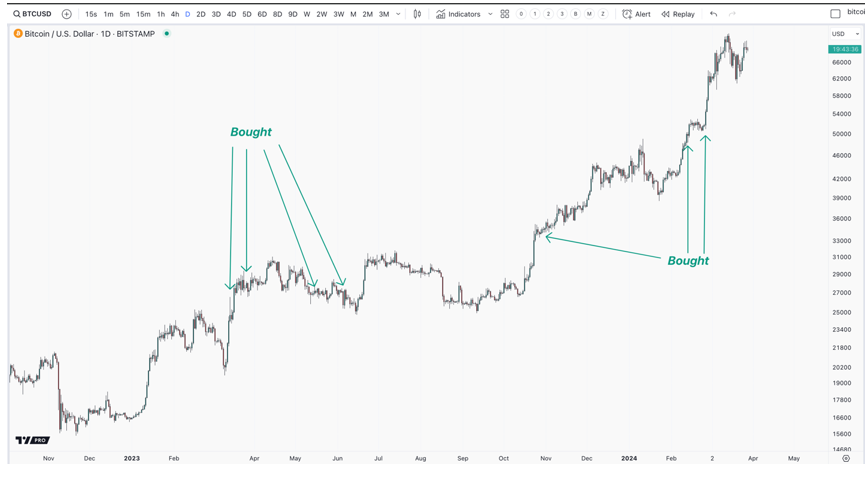
Once we confirmed a new uptrend in Bitcoin, we began to accumulate heavily throughout 2023. It is now one of our top 3 positions, and returned 158% in 2023.

Chainlink:

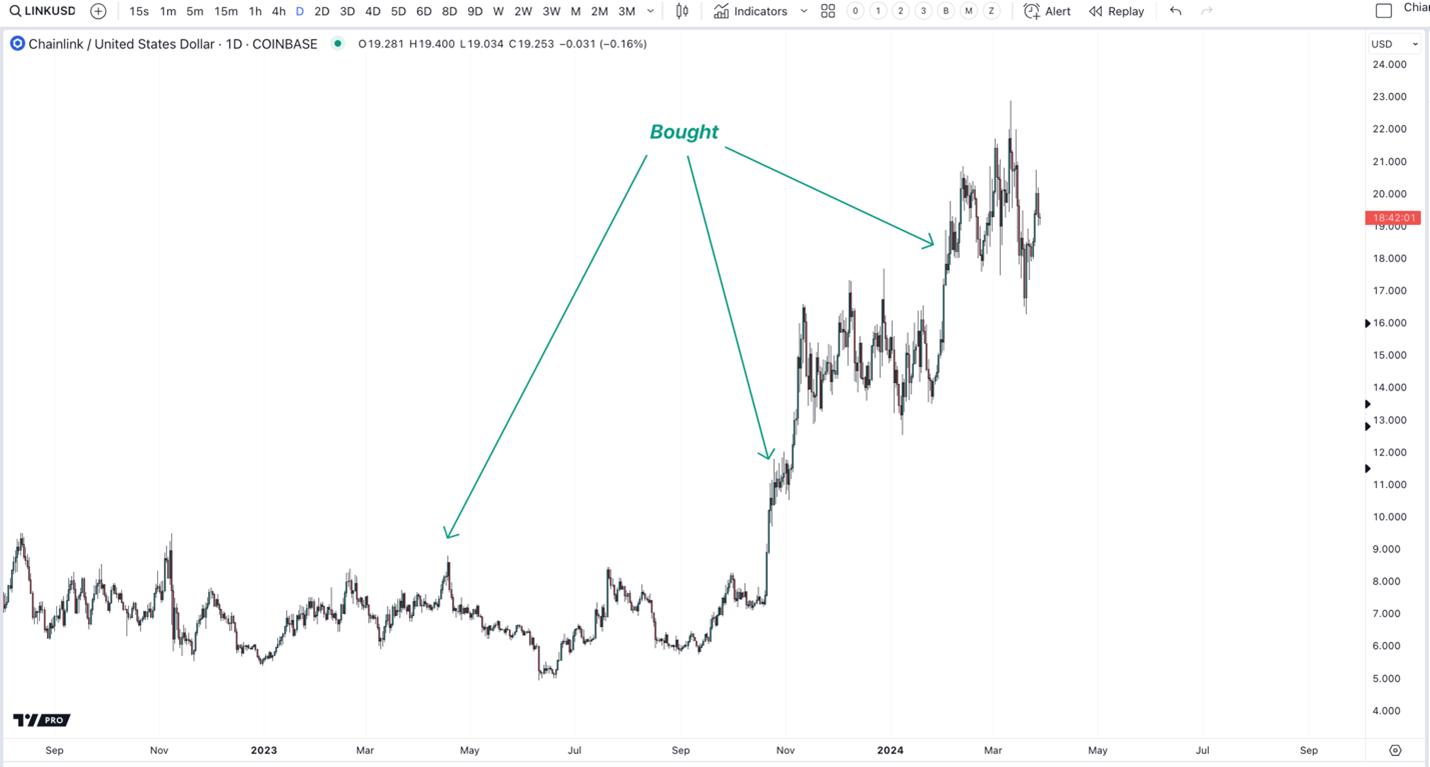
Chainlink has been a staple in our portfolio. It once held a 7% allocation in late 2020, and we reduced it to 2% in 2021. Now that we have a new confirmed bull cycle, we have been accumulating this alt coin in 2023. It returned 168% in 2023.

AMD:

AMD has been a top 3 position for most of 2022 – 2023. We heavily accumulated throughout most of 2023. The position was up 123% in 2023.

Ethereum:

Ethereum was up 92% in 2023 and has been a solid holding for us in 2024, so far.

CrowdStrike:

We began accumulating CrowdStrike in the $160 range. It returned 58% in 2023. We have since been taking significant gains in the $280 – $320 range, and it still remains a 6% position.

Microsoft:

Microsoft was up 54.6% in 2023. We began taking gains in 2023 and have continued into 2024. We plan to begin accumulate when the valuations become more favorable.

Performance Review:

Below is the engagement letter from the firm that reviews and verifies our performance. Our terms and conditions with the accounting firm state that this engagement letter is to only be shared with paying customers. For that reason, our performance letter resides behind our paywall. 

With that said, any paying customer can access the engagement letter which is posted on io-fund.com for this purpose. The I/O Fund owns the performance review and we do not authorize our customers or any person on our site to share a confidential engagement letter or performance review outside of our paywall. As the owner of the report, we will at times market our performance number outside of the paywall. The terms and conditions can be found here.

The I/O Fund Mission:

The I/O Fund began as an experiment to see if a team of retail investors can beat Wall Street. We are setting out to answer the million-dollar or billion-dollar question, which is how to safely participate in tech while limiting the downside. We do not believe this question has been truly answered. Hedge fund managers often pick one tech stock or a few tech stocks and place them alongside a diversified portfolio as a means of limiting the downside. However, tech is the world’s most valuable industry – no other industry offers you the opportunity for life-changing gains repeatedly, year after year. Therefore, diversifying away from tech certainly helps protect the downside but it greatly limits the upside, as well.

That leads to our mission, which is to offer an all-tech portfolio that participates in the upside yet aims to limit the downside. That’s how we hope to set our portfolio apart. Our comparison chart proves we are off to a great start in answering this problem.

When it comes to research sites, our edge is the accountability and transparency we offer. By tracking every trade in real-time, we are forced daily into instant accountability on every action we take. What results is rapid self-improvement, similar to athletes who track every mile they run, or every swing of the bat. By measuring every single daily action, our accountability has shot through the roof as has our drive to improve. 

Real-time trade alerts and an audited performance are extremely uncomfortable when you’re not performing well. However, it was this very thing that forced us to become better over the past four years. We made the case in our free newsletter that this is partly why retail performs so poorly. There are simply too few resources available that mirror what real money managers do. Transparency is integral to outperformance; money managers have to answer to their daily actions and this forces them to become better.

With that said, most professional money managers resemble what Knox does on the I/O Fund site, which is actively managing positions, with lots of activity, pivots and course corrections. This is the reality even if Retail is sold on the utopian idea that you can buy one stock and hold into eternity. In some cases, this is the correct thing to do, but it’s rare.

Risk Management:

What’s important to remember when viewing our returns is that Ark had strong returns in 2023, primarily due to Coinbase’s phenomenal performance of 400%+ which was their top position — yet our returns on a cumulative basis are 157% higher than Ark’s because of our emphasis on risk management. Retail investors are often hyper focused on the upside, which is a grave mistake because losses are geometric in nature. For example, if you are down 50%, you must go up 100% to break even. If you are down 80%, you have to go up 400% to breakeven. The impact is visible when you view our cumulative returns compared to others who had steeper losses in 2022. What separates smart money from retail is an emphasis on limiting the downside. 

Conclusion:

The I/O Fund's mission since inception is to help retail investors beat Wall Street in the competitive and complex tech sector. Our experiment in providing institutional-level research and tools to retail investors has been successful since we first launched in 2019. This includes having a cloud-focused portfolio in 2020, beating our other all-tech portfolios in the tough years of 2021 and 2022, and pivoting to a high AI allocation well ahead of 2023, which helped us triple our performance on a cumulative basis.

In the arena of investing, 2023 was a strong win for us. We easily rank in the top 90th percentile according to publicly available information on the annual returns and our cumulative returns. What I hope our members see when they review our performance is a team that has strived to deliver quality and value. The only way to truly beat Wall Street is by remaining humble while working hard at producing original analysis. The value of original analysis cannot be underestimated when working in an environment where ideas are recycled, an investment edge becomes quickly eroded, and competition is high. What we intend to deliver is the opposite, which is original and actionable analysis that helps our members get ahead of Wall Street.

We want to thank you for your business and your vote of confidence in our abilities. We love our jobs, and we are honored to tackle 2024 with you.  

Verified Returns & Risk Management: A Retail Investor’s Imperative

Last year was a stellar year for investors – in 2023, the Nasdaq 100 rose 54% for its best annual return since 1999, while the S&P 500 gained 24%. The Magnificent 7 were the de facto leaders of this market rally, with the group’s returns averaging 111% for 2023 and accounting for more than 60% of the S&P 500’s annual gain.

This was the opposite of 2022, the only year in history in which Treasury bonds and the S&P 500 both lost 10%. It was a year so rough that it marked the greatest destruction of wealth in modern history with an estimated $57.8 trillion lost across all asset classes combined.

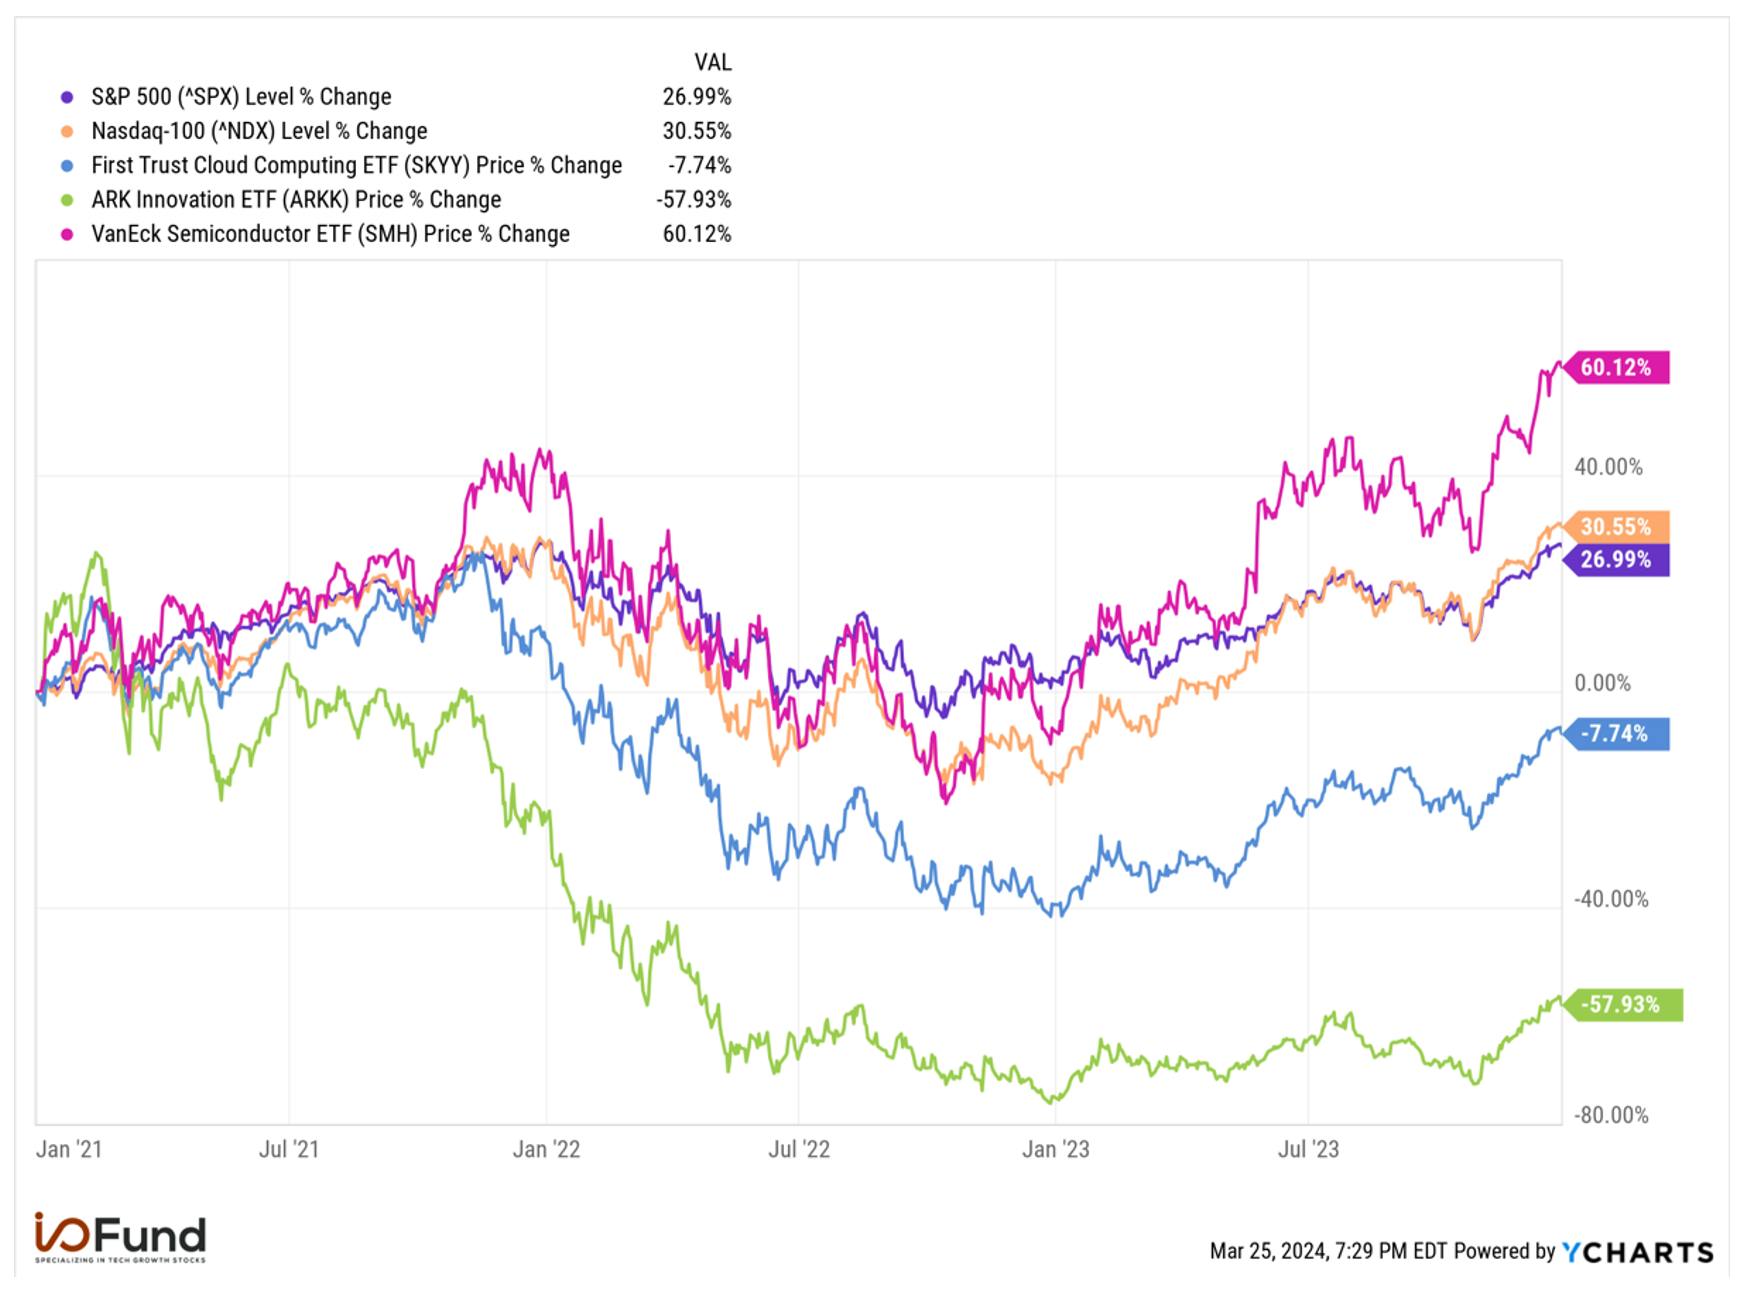
And while 2023’s Big Tech-driven rally looks superb in headlines, a deeper glance shows this was not always the case – especially when accounting for 2022’s steep losses. In fact, on a 3-year cumulative basis, the indexes’ performances make a strong case for investing in indexes over ETFs.

broad market stocks level % change

Simply put, allocating only to a leading sector, such as cloud in 2020 and 2021, would lead to significant underperformance through 2022 and 2023, when multiples were cut dramatically as budgets were slashed. Semiconductors underperformed in mid to late 2022, but outperformed significantly in mid to late 2023. It’s these disparities in between different sectors of tech that prove the value of active investing versus passive investing.  

Our firm believes that having an actively managed portfolio is where you get the best of both world’s – performance that far exceeds the indexes and ETFs by paying close attention to allocation, (quickly) cutting stocks that do not meet specific criteria, and choosing stocks that have strong, fundamental strength.

The I/O Fund is releasing our official 2023 returns plus our updated cumulative returns next week — so stay tuned to your inbox. Our returns help to prove an actively managed portfolio can exceed all indexes and major ETFs on a cumulative basis (that we are aware of).

However, before we release our returns, we think it’s prudent to discuss the importance of verified returns for retail investors. The I/O Fund goes to great lengths to deliver a rare level of transparency for our Members. This is not about a victory lap; it’s about raising the bar. We do not know of another research site that publishes every single trade in real-time, and then takes this further to have their performance independently verified. We do this because it’s the right thing to do, but there are other reasons putting our best foot forward with verified returns is important for retail investors.

The New Norm of Quant Trading Puts Retail at a Disadvantage

Algorithms account for up to three-quarters of equity trading volume, as hedge funds and investment banks are increasingly turning to algorithms and quant trading systems to outperform benchmarks. Algorithmic trading is one of the primary culprits to the extreme volatility seen in recent years, most notably with the flash crashes and rallies of 2020.

This creates a serious disadvantage for retail investors and those who do not have a team of Python developers to leverage quant systems that trade in the blink of an eye. Ray Dalio, the fund manager for Bridgestone, has openly discussed that the best approach to the modern-day stock market is what he calls “the man and machine.” His firm has 1,500-employees that use computer models to test hypotheses; which is just one of the many advantages hedge funds and institutions have over retailers.

According to Dalio, the ideal is to have an algorithm work alongside a portfolio manager for a customized approach to predicting the markets. Although the I/O Fund does not have a team of Python developers, we partnered with Vincent Duchaine of WealthUmbrella  in 2022 to close the gap between human-driven actions and emotionless machines.

This marked an important turnaround for our firm as we gave up what I would call “retail idealism” which centers around the idea that holding a stock for a long period of time is retail’s only defense. This works during times of economic expansion, but where this can go (horribly) wrong is when a new, more challenging macro changes the outlook for any given company.

For example, in 2022, hundreds of tech stocks finished down 70%, and nearly every tech stock finished down 50%. This includes the indestructible FAANGs, with many falling to trade at historic low valuations. An investor would have to be in denial to focus on the poor performance of an individual company rather than acknowledge something much bigger was going on. 2022 highlighted a crucial yet overlooked point (that we encourage our readers to do): let go of the idea that picking good stocks alone can save a portfolio in the tech industry and to instead fully embrace risk management tools.  

2023 reiterated this point very well – although numerous stocks saw face-ripping rallies, such as Nvidia’s 239% rally and Meta’s 156% gain, only a handful outperformed and ended with positive returns on a 2-year basis from 2022 through 2023. Looking at Meta, despite that 156% rally, it ended just 5.2% higher since the start of 2022. Tesla rallied nearly 102% in 2023, but since the start of 2022, returns were (-29.5%). Alphabet’s 2-year return was (-2.6%), even with its 59% rally in 2023.

Risk Management Tools

In April 2022, the I/O Fund stopped relying on stock picks as the primary, offensive measure because this approach simply wasn’t working with the new macro. After partnering with Wealth Umbrella on an automated hedge, the I/O Fund began to boldly hedge up to 100% of our portfolio, at times, and we still continue this approach today.

We pivoted to playing defense rather than offense. Those who watch team sports will understand this transition well, as the strategy changes from attempting to make money (or make a goal) to a strategy that prevents losses (or prevents a goal).

Unlike many other all-tech portfolios and ETFs, we believe a more active stance is necessary for long-term tech investing. We also believe that the easy years of buy and hold are over, marked by the narrow leadership we saw in 2023 where a small number of stocks drove the rally last year. As a result, we rotate our portfolio frequently, raise cash and actively hedge our portfolio with an automated signal.

Real-time trade alerts are sent to our members the minute we decide to buy, sell, trim or add to a stock. For those who may not be aware, this is extremely challengingextremely challenging to do as it combines the two most advanced forms of portfolio management.

  1. One of the most advanced forms of portfolio management is real-time trade alerts. This places immense pressure on a portfolio manager as the stakes are high to record what you do every second in real-time. To voluntarily choose to have the highest level of accountability in retail is nearly unheard of, yet registered fund managers are required to do this and file their stock trades.
  2. Secondly, hedging up to 100% of a portfolio is also a large psychological hurdle, and traditionally a risky one. Markets spend the vast majority of their history in uptrends, for one. Secondly, the amount you can lose on a short is literally infinite, to where one’s downside risk is capped at 0 on the long side. To overcome these hurdles, we have spent considerable resources developing a “man and machine” signal with the help of Wealth Umbrella that is truly state of the art.

It’s only natural for retail services to want to ease the pressure of having to report in real-time. The stakes are much higher when what you do is recorded the minute the action is taken, but overall, having the highest level of accountability possible has made the I/O Fund much sharper investors.

Logging trades in real-time also places immense pressure on the analysts at the I/O Fund, as well, who are not allowed to simply choose a stock but must also determine the allocation for the stock. After recommending a stock, the analysts must help the portfolio manager actively manage the position, which can change at any time.

There is a reason most services do not provide this level of transparency and activity. The more granularity that is offered, the more skill is required. Also, compare this to social media, where some investors will casually claim trades that were not logged in real-time.

Verified Returns

In addition to a lack of risk management tools, I believe a lack of verified returns in the retail space contributes to the losses this investor type experiences. Smart money is careful about who they consider a good investor — they do not take someone’s word they are a good investor; they make the investors or firms they follow prove it. Every single hedge fund must report their returns, which reduces the chances of posturing.

Retail is not offered these checks and balances, and instead, this investor type follows many influencers and research sites who verbally state their performance without proper verification. Across the board, retail is offered a very low amount of accountability – this includes unverified month-end reviews, a list of stock tickers, unchecked screenshots, or other methods that are easy to manipulate. This widespread acceptance of loosely stating a stock performance is odd, to say the least, considering the finance industry is more inclined than any other industry toward deceptive practices.

How the I/O Fund Sets a High Bar for Accountability

Over the past three years, the I/O Fund has invested over $165,000 into accountability and transparency for our members. When we launched in July of 2019, for the first year or so, we used a forum hosted by Tribe for our trade alerts, but by January of 2021, we had migrated to SMS and email tools that were the least likely to experience an outage for our real-time trade alerts. This costs us $30,000 to $40,000 per year, depending on our trading frequency.

In addition to this, we use an auditor from a large firm in San Francisco to mathematically review and verify the performance of our I/O Fund portfolio trading account and crypto account. The process is quite extensive and it takes up to four months to complete. This costs $4,500 per audit and we’ve completed five audits for a total of $22,500 spent on this process. Accountability is expensive but we feel it’s worth it.

Conclusion

I believe real investors take necessary steps to prove their returns, that they accept the pressure that comes with registering trades in real-time and that they do not expect anyone, under any circumstances, to lower their standards and accept an unverified number regarding portfolio performance. Due diligence on stocks requires scrutiny, and this same level of scrutiny should be applied to the company you keep in the finance industry. 

To put it simply, the I/O Fund was founded to bring the standards that smart money insists on to the retail investment class. We think retail will be empowered to outperform when their standards are higher on who they follow and what research they read, and when they refuse to accept a lower standard on transparency.

The I/O Fund is wrapping up our annual audit for 2023 this week (you can access our previous audits including here, here, here and here). We look forward to adhering to the high standards that retail investors deserve. You can look forward to our 2023 performance being published shortly.

Please note: The I/O Fund conducts research and draws conclusions for the Fund’s positions. We then share that information with our readers. This is not a guarantee of a stock’s performance. Please consult your personal financial advisor before buying any stock in the companies mentioned in this analysis.

Recommended Reading:

AI’s Opportunity: Growth, Investment, and the Future

The rise of AI marks a transformative technological, economic, and societal inflection point — one with extreme implications for how we live and invest. So, how can investors take advantage of the trend? Jordi Visser, CIO and Chairman of Weiss Multi-Strategy Advisers, spoke to Beth Kindig, our Lead Tech Analyst on the Real Vision podcast on March 20th, to dive deep into AI’s potential for explosive economic growth, how to find winners in this theme, sectors that benefit from AI, the potential for crypto to decentralize AI, and more.
Click here to watch.

Timestamps:

00:00 – Introduction

03:35 – Artificial Intelligence

07:44 – The Impact of AI

12:18 – AI compared to Mobile

16:48 – How long will it last?

22:14 – Tech sectors that will benefit from AI

30:14 – Sectors AI will disrupt

35:26 – AI, DeepMind and other industries

40:16 – Crypto and AI

43:28 – Q&A

Note: The I/O Fund owns Broadcom as of March 21st per our real-time trade alert sent to Premium members.

Recommended Reading:

AI’s Opportunity: Growth, Investment, and the Future

The rise of AI marks a transformative technological, economic, and societal inflection point — one with extreme implications for how we live and invest. So, how can investors take advantage of the trend? Jordi Visser, CIO and Chairman of Weiss Multi-Strategy Advisers, spoke to Beth Kindig, our Lead Tech Analyst on the Real Vision podcast on March 20th, to dive deep into AI’s potential for explosive economic growth, how to find winners in this theme, sectors that benefit from AI, the potential for crypto to decentralize AI, and more.

Timestamps:

00:00 – Introduction

03:35 – Artificial Intelligence

07:44 – The Impact of AI

12:18 – AI compared to Mobile

16:48 – How long will it last?

22:14 – Tech sectors that will benefit from AI

30:14 – Sectors AI will disrupt

35:26 – AI, DeepMind and other industries

40:16 – Crypto and AI

43:28 – Q&A

Note: The I/O Fund owns Broadcom as of March 21st per our real-time trade alert sent to Premium members.

Recommended Reading:

Arm Stock: AI Chip Favorite Is Overpriced

This article was originally published on Forbes on Mar 21, 2024,01:49 pm EDTForbes on Mar 21, 2024,01:49 pm EDT

Arm Holdings is positioned to capitalize on the growing adoption of artificial intelligence (AI) technologies, leveraging its established licensing model and extensive ecosystem to drive future growth. Arm's established licensing model offers a recurring and relatively stable income source, and the stock is seeing favorable price action due to the growing tailwinds from its higher-royalty v9 design supporting next-generation AI chips from Nvidia, Microsoft, Amazon and others.

Yet, despite Arm dominating the smartphone market with 99% share, the company has made very little on licensing compared to its partners. For example, mobile handsets created a $200+ billion segment for Apple, which relies on Arm technology for the iPhone, yet only resulted in (roughly) $3 billion for Arm. In this case, it was far better to own Apple.

The market is excited about the fact that AI will drive double the licensing fees for Arm. My contention is that, similar to mobile, it’s better to own the AI leaders who license Arm’s technology rather than Arm. Analyst estimates have Arm growing to $6.5 billion by 2028. For our purposes, this isn’t high enough growth to ensure insiders, aka SoftBank, won’t take their exit following the IPO lock-up expiration. Frankly, the valuation on Arm is absurdly expensive, at more than double the most-expensive chip stocks, including Nvidia. This is why we’ve stated in the past that Arm makes a better acquisition target. For public investors’ purposes, there is no riskier proposition than an IPO that is richly valued.

Background on Arm

Arm offers the most popular CPU architecture in the world with 250 billion chips shipped since inception, of which 30.6 billion were shipped in FY2023. It’s most dominant in mobile CPUs with 99% market share, and 40.8% in automotive, for an overall share of 48% in Arm’s related markets. This dominant market share is achieved through its developer ecosystem.

For mobile (and how it came to reach 99% share), Arm’s design known as “heterogenous compute” has helped facilitate lower power requirements as the architecture allows different CPU parts to work together for improved efficiency. This enables workloads to work across both high-performance and low-performance CPU cores to lower energy by balancing performance.

Arm’s different licensing models are the following:

Arm Total Access Agreements: It is a type of licensing model wherein the company provides a package of CPU designs and related technologies for an annual fee. The agreement has a fixed term and Arm reserves the right to modify the package by adding or removing specific products.

Arm Flexible Access Agreements: This model provides a selection of CPU designs and related technologies for an annual fee. However, the latest products are not included. In comparison, the total access agreement is a comprehensive package. Another key difference is that the customers need to pay a single-use license fee for specific products if they are included in the final chip design. Like total access agreements, the company reserves the right to modify the package.

Technology Licensing Agreements: It involves licensing a specific CPU design or technology to the customer for a fixed fee. The license can be used for a fixed term or the number of uses.

Architecture License Agreements: Under this agreement the customers design their own customized CPU designs using the Arm’s Instruction Set Architecture (ISA).

Arm’s v9 Architecture

The latest Arm v9 architecture offers significant improvements in performance and efficiency, particularly for artificial intelligence (AI) applications. This has led to increased adoption by its partners, particularly in the premium smartphone segment and with hyperscalers developing their own custom silicon for data center use.

CEO Rene Haas explained that the “premium smartphone is almost exclusively now v9, and virtually every high-end data centre chip is v9. When you look at Grace Hopper, when you look at Graviton, when you look at Microsoft Cobalt, these are all v9-based designs.” However, CFO Jason Child emphasized that Arm is “overweighted towards smartphones on v9, primarily because it’s an annual refresh cycle.”

Compared to the previous v8 architecture, v9 chips command double the royalty rate. This means Arm receives a higher percentage of the chip's selling price when a manufacturer uses v9 designs.

The rapid growth in v9 adoption and its higher royalty rates have already contributed to a significant increase in Arm's royalty revenue. v9 constituted 10% of royalty revenue in the September quarter and accelerated to 15% in the recent quarter. By doing the math, v9 revenue grew 69% QoQ to $70.5 million. As adoption continues to rise, the v9 architecture is expected to be a major driver of future royalty income growth for Arm.

Sign up for I/O Fund's free newsletter with gains of up to 221% – Click hereClick hereClick here

Addressable Market

The company’s total addressable market was $203 billion in 2022 and is expected to grow at a compound annual growth rate (CAGR) of 6.8% to $247 billion in CY2025. The company has maintained a market share of over 99% in the mobile applications processor market. It expects this market to grow at a CAGR of 6.4%, from $29.9 billion in 2022 to about $36 billion in 2025. The company estimates that the aggregate value of chips that contain Arm technology was $98.9 billion (48.9% market share) for the CY ending December 2022, up from 38.7% in 2014. Notably, the 6.8% CAGR is a low CAGR for an AI trend with AI chips expected to grow at a 38.2% CAGR.

Arm also has strong market share of 40.8% in the automotive chip market. Management expects the automotive chip market to grow from $18.8 billion in 2022 to $29.1 billion in 2025, growing at a CAGR of 15.7%.

The cloud compute chip market is expected to grow at a CAGR of 16.6% from $17.9 billion in CY2022 to $28.4 billion in CY2025. Arm’s market share in the cloud computing chip market has increased from 7.2% in CY2020 to 10.1% in CY2022. Since Arm-based chips are increasingly used in data centers, its market share is expected to increase significantly in the future.

Per the prospectus, “Arm-based chips have been gaining market share as CSPs, such as Amazon AWS and Alibaba, have started to deploy Arm products in their own in-house designed chips used in their data centers, and as other CSPs, such as Microsoft and Oracle, start to deploy chips designed by Arm licensees, such as Ampere. As a result, we expect our market share of cloud compute to grow significantly faster than the overall cloud compute market.”

Financials

Arm’s recent Q3 FY2024 revenue ending December grew by 13.8% YoY to $824 million, helped by the recovery in the smartphone market and demand for AI technology. This marks the second consecutive quarter of positive revenue growth, following declines of (2.5%) in the June quarter and (3.7%) in the March quarter, due to the cyclical downturn from smartphones.

License and other revenue grew 18% YoY to $354 million. The company has seen strong growth in license revenue as they are signing long-term and high value agreements with its customers due to demand for Arm’s advanced CPUs to run AI workloads. The trend was strongest in the Sept quarter as license revenue grew by 106%.

CEO Rene Haas said in the earnings call, “And that has seen growth in not only the smartphone sector but also in infrastructure and other markets, which drives growth. We are also seeing strong momentum and tailwinds from all things AI. From the most complex devices on the planet for training and inference, the NVIDIA Grace Hopper 200 to edge devices such as the Gemini Nano Pixel 6 from Google or the Samsung Galaxy S24, more and more AI is running on more end devices, and that's all running on Arm.”strong momentum and tailwinds from all things AI. From the most complex devices on the planet for training and inference, the NVIDIA Grace Hopper 200 to edge devices such as the Gemini Nano Pixel 6 from Google or the Samsung Galaxy S24, more and more AI is running on more end devices, and that's all running on Arm.”

They expect another record quarter for the licensing revenue. CFO Jason Child said Arm is “expecting another strong quarter for licensing with revenue up sequentially to near record levels. As with recent quarters, we expect to sign multiple new ATA deals in Q4, and demand for our latest technology remains high as customers need access to AI-capable CPUs and related technology such as our Compute Subsystems.”we expect to sign multiple new ATA deals in Q4, and demand for our latest technology remains high as customers need access to AI-capable CPUs and related technology such as our Compute Subsystems.”

Arm reported record royalty revenue, thanks to its higher value v9 technology and market share gains in cloud server and automotive markets. Royalty revenue rebounded to 11% YoY growth to $470 million from a decline of (5%) and (8%) in the previous two quarters.

Management’s guide for the next quarter is to grow over 30% YoY, due to a weak comp against the “bottom of the industry wide inventory correction that occurred in prior year Q4.” On a sequential basis, royalty revenue was guided to increase by the mid-single digits.

Royalty Revenue YoY

Source: ARM

CFO Jason Child explained that the “sequential growth is mainly coming from increasing penetration of Arm v9, where royalty rates are on average, at least double the rates on equivalent Arm v8 products. Additionally, we are seeing an increasing amount of Arm technology in chips being deployed and as the amount of Arm technology in chips increases, so does the royalty rate.”increasing penetration of Arm v9, where royalty rates are on average, at least double the rates on equivalent Arm v8 products. Additionally, we are seeing an increasing amount of Arm technology in chips being deployed and as the amount of Arm technology in chips increases, so does the royalty rate.”

Management increased its revenue guidance for the next quarter by $95 million to a range of $850 million to $900 million, representing YoY growth of 38.2% at the midpoint. This strong upward revision was due to the points discussed earlier, including the rebound in royalty revenue and the higher revenue opportunity from AI. Analysts expect revenue to grow 37.4% YoY to $869.88 million in the next quarter and 27.9% in the June quarter.

Revenue YoY

Source: Seeking Alpha

FY2023 revenue ending March declined by (0.9%) YoY to $2.679 billion. Analysts expect FY2024 revenue to grow 18.7% YoY to $3.18 billion and 23.9% YoY to $3.94 billion for FY2025.

RPO

Remaining performance obligations (RPO) grew by 38% YoY to $2.43 billion, helped primarily by high-value license agreements and renewal of long-term customer agreement. As per the shareholder letter“We expect to recognize approximately 28% of RPO as revenue over the next 12 months, 26% over the subsequent 13-to-24-month period, and the remainder thereafter.”

RPO YoY

Source: ARM

Every Thursday at 4:30 pm Eastern, the I/O Fund team holds a webinar for premium members to discuss how to navigate the broad market, as well as various stock entries and exits. We offer trade alerts plus an automated hedging signal. The I/O Fund team is one of the only audited portfolios available to individual investors. Learn more here.Learn more hereLearn more here.

Margins

Gross margin was 95.6% in the recent quarter compared to 96% in the same quarter last year. Adjusted gross margin improved 50 basis points YoY to 96.8%.

Operating margin was 16.3% compared to 33.7% in the same period last year. The operating margin was lower due to the increase of R&D expenses from an increase in engineering headcount and SG&A expenses from increase of non-engineering headcount.

In the Sept quarter, the operating margin was low at (19.4%) due to increased R&D expenses, stock-based compensation, and IPO-related expenses. SBC was higher than it is expected to be in future quarters as the IPO triggered a one-time expense for previously granted shares. SBC in the September quarter was “$509 million with $19 million in cost of sales, $343 million in R&D and $147 million in SG&A.” The future SBC run rate “will depend on a number of factors, including the share price, but is currently expected to be between $150 million to $200 million per quarter.” At the midpoint, this will be about 20% of revenue.

Adjusted operating margin was 43.8% compared to 39.9% in the same period last year and 47.6% in the Sept quarter.

Operating Margin

Source: ARM

Net margin was 10.6% compared to 25.1% in the same period last year and (13.7%) in the Sept quarter. The adjusted net margin was 39.3% compared to 31.1% in the same period last year and 46.9% in the Sept quarter.

Valuation and Risks

Arm’s IPO lock-up period expired on March 12th, so there is risk of volatility in the coming months. Arm is wildly expensive, and it’s this ultra-premium valuation that leads to elevated downside risk for investors, especially now that SoftBank’s IPO lock-up has expired.

Arm was previously listed from 1998 to 2016 when it was taken private by SoftBank Group, and it holds about 90% of the outstanding shares. Arm’s current valuation of $133 billion (90% of that is ~$120 billion) is significantly higher than SoftBank’s current market valuation of $86 billion. The lockup expiration frees up SoftBank’s 90.6% (~930 million shares) stake, allowing SoftBank to lock in gains on Arm after acquiring the company in 2016, should the holding company decide to do so.

Arm’s shares have doubled since its IPO in September 2023, and it is currently trading at a forward P/S ratio of 43x, far higher than AI semiconductor companies that have much higher growth. For as much as Nvidia is being called a ‘bubble’, Arm is trading at more than double its forward P/S multiple of 20x. Meanwhile, AMD and Broadcom, also followed closely for AI potential, are trading in the 11x P/S range, or one-quarter of Arm’s multiple.

Semiconductor PS Ratio

Source: Ycharts

Though Arm’s licensing and royalty model allows it to have a superior gross margin profile relative to its GPU customers, it does not have the same hypergrowth profile that will allow it to command such a multiple, let alone expand on such a multiple to provide gains for investors at these levels.

Nvidia is expected to see 81% revenue growth in FY25 (Q1 beginning in February) to more than $110 billion, with similar earnings power, whereas Arm is expected to record just 24% revenue growth to $3.95 billion. Despite tens of billions in revenue growth next year for Nvidia, not to mention other AI chipmakers underpinned by Arm’s designs, Arm is expected to only see $800 million in revenue growth. Even with a beat above the $800 million, this is not nearly enough to support the $60 billion gained in valuation since Arm’s earnings report.

On the bottom line, Arm still trades at a significant premium to peers. Arm is currently trading above a 113x forward PE, more than double AMD’s 50x multiple and triple Nvidia’s 37x multiple. Looking ahead to Arm’s fiscal 2025, Arm is trading at an 86x forward PE with estimated earnings growth of just 27%, compared to 91% for Nvidia.

Semiconductor PE Ratio

Source: Ycharts

The rich valuation combined with lockup expiration is the predominant risk, however, the longer-term risk is RISC-V.

Arm is based on lower power instruction sets and hardware, which is also known as a RISC architecture (Reduced Instruction Set Computing). As stated, this contributes to Arm’s approach to power efficiency by reducing the number of instruction sets required. Intel and AMD’s x86 CISC, or Complex Instruction Set Computing, offers more complex instructions that execute multiple operations. This leads to better performance but more power consumption due to the need to decode the complex instructions.

There is a third competitor to Arm and x86 which belongs in the RISC architecture category, called RISC-V. The instruction sets for RISC-V are similar to Arm’s yet RISC-V is open source and is also very new with an official launch in 2019. Compare this to Arm, which was founded forty years ago. RISC-V emphasizes register access over direct memory access, which may be more suitable for parallel processing.

It’s unlikely that RISC-V overtakes Arm in the near-term but it could become a serious contender in future years – some of Arm’s customers support RISC-V, which could limit Arm’s ability to raise prices.

Conclusion

Strong tailwinds for growth exist in Arm’s core markets, notably in AI, automotive and cloud compute chips, while royalty revenue is accelerating on the backs of increased royalties from the v9 design. Despite accelerating key metrics, including revenue, RPO and average contract value, Arm’s valuation poses significant risks, given that it is trading at exuberant levels even relative to the hottest AI chip stocks. In the event the valuation comes down drastically, we’ve done a thorough analysis on Arm as it’s a central player to edge AI and is key to the next phase for AI.

I/O Fund Equity Analyst Damien Robbins contributed to this report.

Please note: The I/O Fund conducts research and draws conclusions for the Fund’s positions. We then share that information with our readers. This is not a guarantee of a stock’s performance. Please consult your personal financial advisor before buying any stock in the companies mentioned in this analysis.

Recommended Reading:

Cloud Earnings Review: AI a key driver for growth

Every quarter, we provide an overview of the cloud sector including hyperscalers and best-of-breed companies. We had discussed in our last analysis that the hyperscalers are showing signs of stabilization. In a further positive development, the hyperscalers growth accelerated in the recent quarter, helped by a much-needed boost from AI.

Below, we look at best-of-breed companies that are expected to decline sequentially by 4 points, the same deceleration we noticed in Q3 to Q4. This is an improvement from an 11 point decline in Q1-Q2 of last year. We also discuss various financial metrics that can help determine which cloud companies will continue to lead.

Tracking the Cloud ETFs YTD performance, SKYY beat the QQQ (tracks the Nasdaq-100 Index) by one percentage point and other ETFs are trailing with WCLD with (1.37%) return and CLOU with (4.06%) YTD returns.

Big Tech is the Best Proxy for Cloud

Big Tech Companies are more insulated than Best-of-Breed cloud and offer a 360-degree view of how the cloud industry is faring. The Big 3 cloud providers are the best proxy since they account for 67% of the cloud market. They also represent the layer in the tech stack that tends to be the most resilient in terms of churn. The switching costs are quite high for cloud IaaS services.

Microsoft Azure had the fastest growth of 30% among the Big 3 and all the three companies showed an acceleration that was helped by AI revenue. Microsoft Azure Q4 growth rate and AWS accelerated by 1%, while Google Cloud accelerated by 4%. This is an improvement from the trend in the previous quarter when we noted, “Microsoft Azure’s Q3 growth rate was the outlier among the Big 3 as its growth rate accelerated by 3%, while AWS remained steady albeit at a slower growth rate, and Google Cloud decelerated by 6%. The steep deceleration in Google Cloud was a negative surprise as analysts were expecting it to grow 26% compared to the actual 22%.”

According to Synergy Research Group the combined Q4 YoY growth of the Big 3 cloud providers marked the highest growth compared to the previous three quarters and also the largest sequential increase ever. “The year-on-year growth rate was 20% in Q4, markedly higher than the previous three quarters. Notably, the market grew by $5.6 billion from Q3. That is by far the largest quarter-on-quarter increase ever achieved.”

Microsoft

  • Microsoft Azure grew 30% YoY and 28% in constant currency, including a 6% incremental contribution from AI.
  • Growth accelerated from 29% in the previous quarter and was slightly down from 31% in the same period last year.
  • The company’s CFO, Amy Hood, said Azure growth will remain stable in the next quarter. “In Azure, we expect Q3 revenue growth in constant currency to remain stable to our stronger-than-expected Q2 results. Growth will be driven by our Azure consumption business with continued strong contribution from AI.”Growth will be driven by our Azure consumption business with continued strong contribution from AI.”

AI’s impact on Azure was notable: Microsoft said that Azure’s 30% growth stemmed from “strong demand for our consumption-based services including 6 points from our AI services.” This 6-point contribution is impressive, given that AI services contributed 3 points to growth last quarter and 1 point in fiscal Q4. While that may seem small, it is significant considering the scale that this growth is attached to, with Azure’s revenue at a $74 billion run rate.

Microsoft’s earnings call reflected growing AI optimism, with strong key metrics for its AI offerings across its product suite. Satya Nadella also signaled in the earnings call Q&A that optimization is over for now on traditional workloads, which is positive. “I'll call it, optimization only and no new workloads start, that I think has ended at this point. So what you're seeing is much more of that continuous cycle by customers, both whether it comes to AI or whether it comes to the traditional workloads.”

AWS

  • AWS revenue grew by 13% YoY to $24.2 billion and is now approaching a $100 billion annualized run rate.
  • Growth accelerated by one percentage point from 12% in the last quarter yet was lower than the 20% in the same period last year.

The company’s CEO, Andy Jassy, sounded very optimistic in the earnings call on the prospects of AI. “Gen AI is and will continue to be an area of pervasive focus and investment across Amazon, primarily because there are a few initiatives, if any, that give us the chance to reinvent so many of our customer experiences and processes, and we believe it will ultimately drive tens of billions of dollars of revenue for Amazon over the next several years.”we believe it will ultimately drive tens of billions of dollars of revenue for Amazon over the next several years.”

The company’s CFO pointed out that optimizations are slowing. “Similar to what we shared last quarter, we continue to see the diminishing impact of cost optimizations. And as these optimization slow down, we're seeing more companies turning their attention to newer initiatives and reaccelerating existing migrations.”

Google Cloud

  • Google Cloud revenue grew by 26% YoY to $9.2 billion, helped by the increasing contribution from AI, beating the estimates of $8.94 billion.
  • Even though the growth is lower when compared to the 32% growth in the same period last year, it has accelerated from 22% in the previous quarter.
  • The strong growth in the quarter also helped the company narrow the gap to 4 percentage points with Microsoft Azure’s leading growth of 30% compared to 7 percentage points in the previous quarter.

In the earnings call, CFO Ruth Porat said, “The Cloud team is intensely focused on bringing the benefits of Gemini, our industry-leading AI technology, to enterprises and governments globally, and we are gratified with the level of engagement. The strong demand we are seeing for our vertically integrated AI portfolio is creating new opportunities for Google Cloud across every product area.” The company launched Gemini in December and offers three versions: Gemini Ultra, Gemini Pro, and Gemini Nano.

The company’s CEO Sundar Pichai also echoed the thoughts of Microsoft and Amazon’s management on cost optimizations reducing, saying “the cost optimizations in many parts are something we have mostly worked through.”

Best of Breed

We took a sample of the top-ranking cloud stocks on revenue growth, free cash flow, adjusted operating margin, and valuations.

Best-of-breed cloud companies are expected to decline sequentially by 4-points; from 5% QoQ growth last year to the expected 1% QoQ this year. This is the same as we noticed in Q3 to Q4, wherein it showed an improvement from a decline of 11 points in Q1 to Q2 of last year.

However, on a percentage basis, the recent QoQ/YoY deceleration is 72% compared to the 47% decline in Q3 to Q4 estimates and slightly better than the 83% decline in the same period last year.

All the best-of-breed cloud companies showed a deceleration similar to the trend seen in our previous analysis. CrowdStrike has the lowest deceleration, from 9% last year to 7% expected this year. Bill Holdings has the highest deceleration, from 5% growth last year to (4%) this year. In our previous analysis, Bill Holdings had the lowest deceleration.

Earnings Beats

Bill Holdings led with a revenue beat of 6.8%. The company’s revenue grew by 22% YoY to $318.5 million. The core revenue, which includes subscription and transaction fees, grew by 19% YoY to $275 million. Management highlighted the better-than-expected standalone total payment volume (TPV) growth of 10%. However, they are still cautious on macro, “It's too early to call a trough in B2B spend, and we expect the current interest rate environment will continue to depress overall spend growth.” The management guide for the next quarter is $299 million to $309 million, representing a YoY growth of 11.5% at the midpoint.

MongoDB’s revenue exceeded analyst expectations by 5.2%. The company’s revenue grew by 27% YoY to $458 million. However, the stock sold off post earnings as the FY guidance missed estimates. Management FY revenue guide was $1.9 billion to $1.93 billion below the estimates of $2.03 billion. The adjusted EPS guide was $2.27 to $2.49, far below the estimates of $3.22.

HashiCorp’s revenue grew by 15% YoY to $155.8 million, beating estimates by 4.3%. Management revenue guide for the next quarter is $152 million to $154 million, representing a YOY growth of 10.9% at the midpoint. The management highlighted in the earnings call that they are targeting 20% growth sometime in FY2026. Per CFO, “And then what follows is basically progressive improvement on the growth rate until it reaches 20% in the fiscal 2026 period, not that fiscal '26 will be 20%, just to be clear. So what we're signaling is that — the fourth quarter was a great quarter, and we feel like the optimization cycle is abating. There are signs of positive activity. We're not out of the woods.”we feel like the optimization cycle is abating. There are signs of positive activity. We're not out of the woods.”

HashiCorp’s adjusted EPS came at $0.05 compared to ($0.07) in the same period last year, beating estimates by 501%. This was the second consecutive non-GAAP profitability for the company. Snowflake’s adjusted EPS grew by 150% YoY to $0.35, beating estimates by 98%. MongoDB ranked third with a beat of 82.6% and its adjusted EPS grew by 50.9% YoY to $0.86.

Bottom Line and Free Cash Flow

GAAP profitability is another crucial metric to monitor closely, especially with macroeconomic uncertainty. Most of the names listed in the chart below are unprofitable on a GAAP basis because they pay high stock-based compensation.

This is one of the more important metrics that separates the winners from the laggards. For example, CrowdStrike recently achieved the feat of four consecutive quarters of GAAP profits and a full year in GAAP profits. The stock has been up 140% in the past year.

Bill Holdings has improved its operating margin to (13%) from (43%) in the same period last year. CrowdStrike has improved to 4% from (10%) in the same period last year. Zscaler reported (9%) compared to (17%) last year.

ServiceNow has the highest free cash flow margin of 55%, up from 52% in the same period last year. Snowflake ranks second with a free cash flow margin of 42% and Datadog ranks third with a free cash flow margin of 34%.

Valuations

CrowdStrike has the highest forward P/S ratio of 19.5 among the best-of-breed cloud stocks. It is followed by Cloudflare at 19.3 and Datadog at 15.5.

Ranking based on revenue estimates change for next quarter.

GitLab’s revenue estimates have been revised by 2.5% and Zscaler ranks second with a positive revision of 1%. MongoDB had a negative revision of (2.1%) after the company’s FY guidance came in below analyst expectations.

Ranking based on adjusted EPS estimates change for the next quarter.

Zscaler had the highest adjusted EPS revision of 10.5% among the best-of-breed cloud stocks. It is followed by CrowdStrike at 8.3% and Snowflake at 0.8%.

Highlights and Lowlights in Q4

CrowdStrike reported the fourth consecutive quarter of GAAP profits and the first full year of GAAP profits. The turnaround in GAAP profitability is most impressive compared to its cloud peers. The company’s key metrics are also accelerating. Notably, the net new ARR accelerated by 14% to 27% growth in the recent quarter from 13% in Q3. The company is in a unique position by combining cybersecurity with AI in a single platform with a data-centric architecture. Our complete post-earnings analysis is here.

Cloudflare beat revenue estimates by 2.7% and adjusted EPS by 26.3%. The company’s adjusted operating margin grew by 500 bps to 11% in the recent quarter. The free cash flow margin improved by 200 bps to 14%. CEO and co-founder Matthew Prince said in the earnings call, “The machine that underlies Cloudflare is firing efficiently on all cylinders, and we've been able to execute even as the macro environment remains choppy.” Key metrics accelerated, RPO accelerated to $1.245 billion, up 37% YoY compared to 30% YoY growth last quarter. We have discussed the company further in our post-earnings analysis here.

Zscaler beat revenue estimates by 3.6% and adjusted EPS estimates by 31%. On the macro, the company’s CFO said in the earnings call, “We believe we are still operating in a challenging macroenvironment and customers continue to scrutinize large deals.” Despite the beat and raise, the stock sold off post-earnings since the company guided for a (7%) sequential decline in calculated billings, suggesting further deceleration in this key metric to the low-20% range. We have discussed the company further in our cybersecurity analysis here.

Conclusion

The hyperscalers growth accelerated with a boost from AI. Cloud optimizations are reducing, which is positive. However, the macro conditions are still challenging. We will continue to look for outliers in the cloud category as we move into next quarter’s earnings season. We added CrowdStrike and Cloudflare to our portfolio partly informed by scans such as these, which revealed bottom line strength coupled with strong growth. We also use these overviews to keep an eye on valuation, of which cloud stocks are particularly sensitive to in this environment with very few successfully trading over 20 Fwd P/S since Q4 of 2021.

Royston Roche, Equity Analyst at the I/O Fund, contributed to this article.

Recommended Reading:
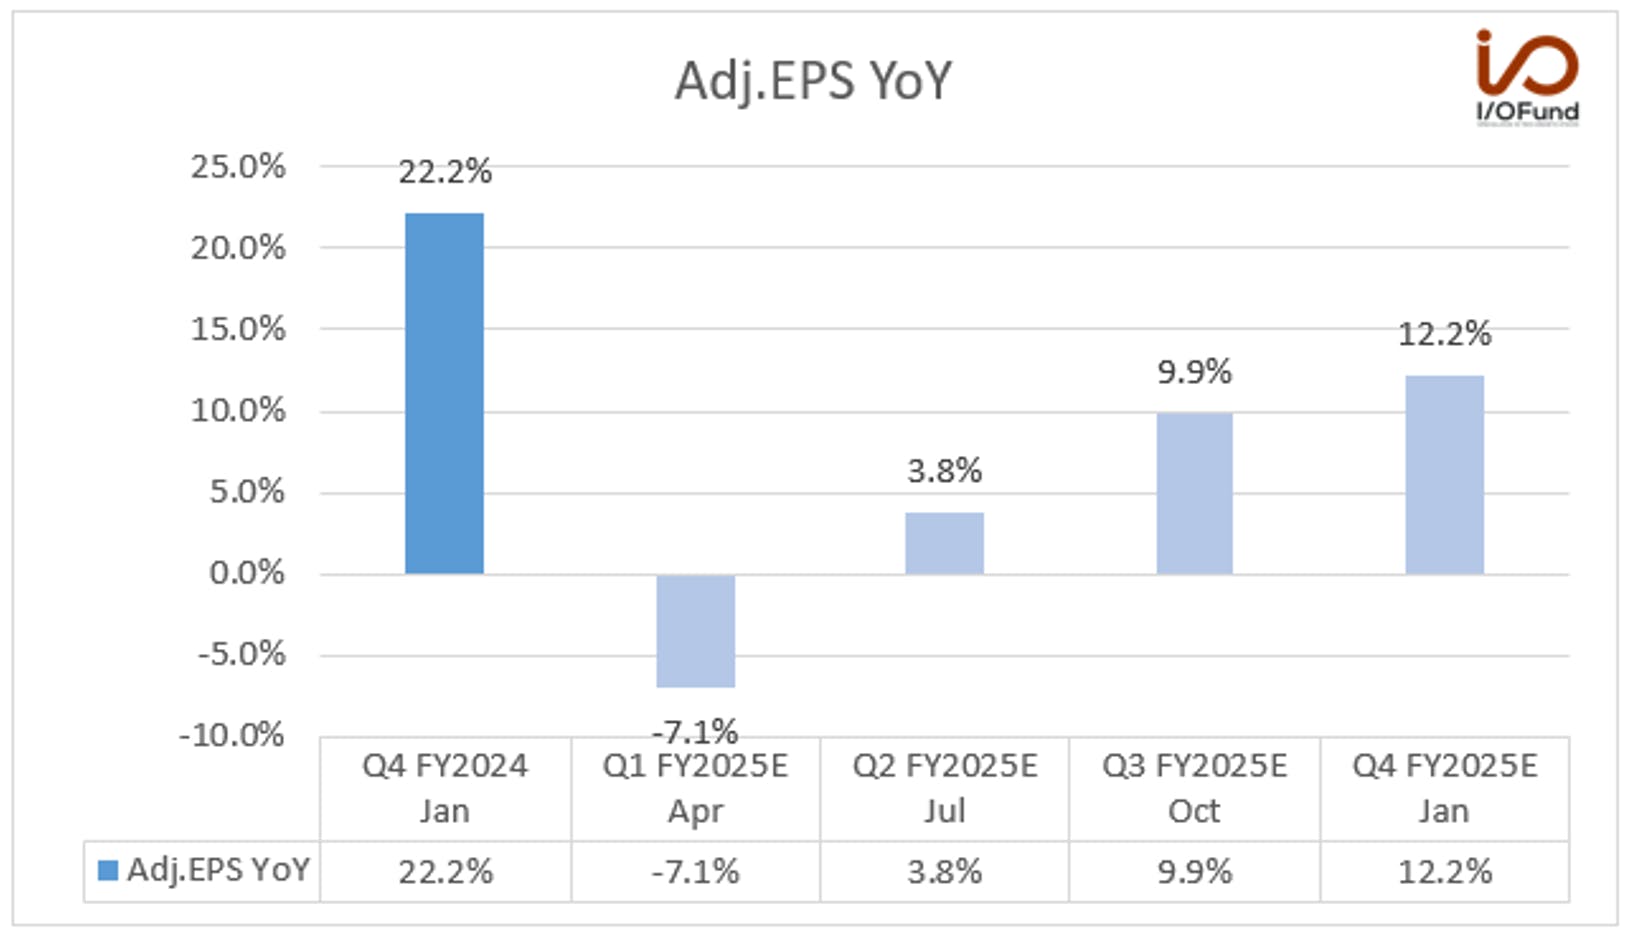
Cloud Earnings Review: AI a key driver for growth
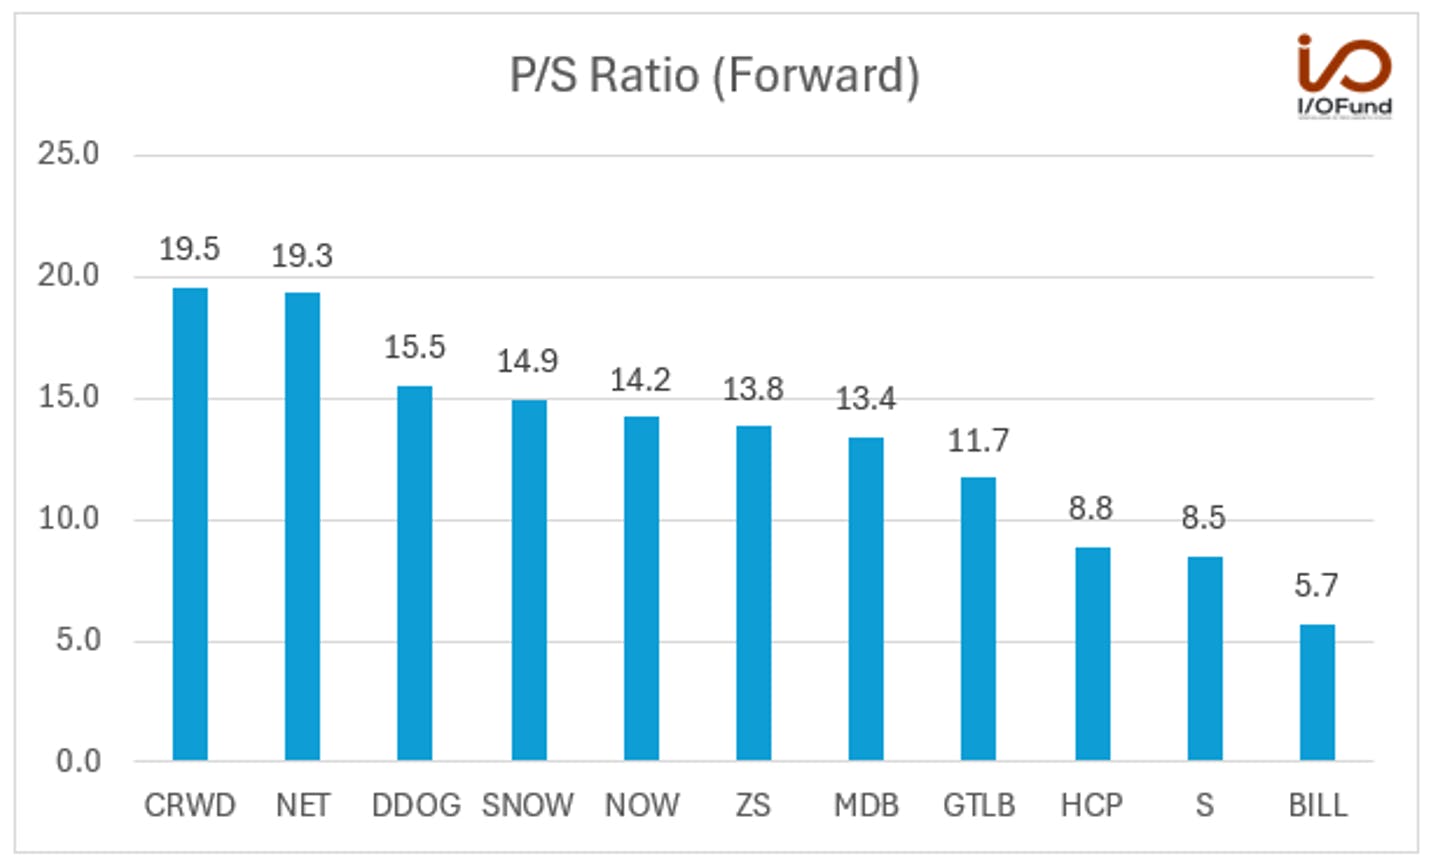
Every quarter, we provide an overview of the cloud sector including hyperscalers and best-of-breed companies. We had discussed in our last analysis that the hyperscalers are showing signs of stabilization. In a further positive development, the hyperscalers growth accelerated in the recent quarter, helped by a much-needed boost from AI.

Below, we look at best-of-breed companies that are expected to decline sequentially by 4 points, the same deceleration we noticed in Q3 to Q4. This is an improvement from an 11 point decline in Q1-Q2 of last year. We also discuss various financial metrics that can help determine which cloud companies will continue to lead.

Tracking the Cloud ETFs YTD performance, SKYY beat the QQQ (tracks the Nasdaq-100 Index) by one percentage point and other ETFs are trailing with WCLD with (1.37%) return and CLOU with (4.06%) YTD returns.

Big Tech is the Best Proxy for Cloud

Big Tech Companies are more insulated than Best-of-Breed cloud and offer a 360-degree view of how the cloud industry is faring. The Big 3 cloud providers are the best proxy since they account for 67% of the cloud market. They also represent the layer in the tech stack that tends to be the most resilient in terms of churn. The switching costs are quite high for cloud IaaS services.

Microsoft Azure had the fastest growth of 30% among the Big 3 and all the three companies showed an acceleration that was helped by AI revenue. Microsoft Azure Q4 growth rate and AWS accelerated by 1%, while Google Cloud accelerated by 4%. This is an improvement from the trend in the previous quarter when we noted, “Microsoft Azure’s Q3 growth rate was the outlier among the Big 3 as its growth rate accelerated by 3%, while AWS remained steady albeit at a slower growth rate, and Google Cloud decelerated by 6%. The steep deceleration in Google Cloud was a negative surprise as analysts were expecting it to grow 26% compared to the actual 22%.”

According to Synergy Research Group the combined Q4 YoY growth of the Big 3 cloud providers marked the highest growth compared to the previous three quarters and also the largest sequential increase ever. “The year-on-year growth rate was 20% in Q4, markedly higher than the previous three quarters. Notably, the market grew by $5.6 billion from Q3. That is by far the largest quarter-on-quarter increase ever achieved.”

Microsoft

  • Microsoft Azure grew 30% YoY and 28% in constant currency, including a 6% incremental contribution from AI.
  • Growth accelerated from 29% in the previous quarter and was slightly down from 31% in the same period last year.
  • The company’s CFO, Amy Hood, said Azure growth will remain stable in the next quarter. “In Azure, we expect Q3 revenue growth in constant currency to remain stable to our stronger-than-expected Q2 results. Growth will be driven by our Azure consumption business with continued strong contribution from AI.”Growth will be driven by our Azure consumption business with continued strong contribution from AI.”

AI’s impact on Azure was notable: Microsoft said that Azure’s 30% growth stemmed from “strong demand for our consumption-based services including 6 points from our AI services.” This 6-point contribution is impressive, given that AI services contributed 3 points to growth last quarter and 1 point in fiscal Q4. While that may seem small, it is significant considering the scale that this growth is attached to, with Azure’s revenue at a $74 billion run rate.

Microsoft’s earnings call reflected growing AI optimism, with strong key metrics for its AI offerings across its product suite. Satya Nadella also signaled in the earnings call Q&A that optimization is over for now on traditional workloads, which is positive. “I'll call it, optimization only and no new workloads start, that I think has ended at this point. So what you're seeing is much more of that continuous cycle by customers, both whether it comes to AI or whether it comes to the traditional workloads.”

AWS

  • AWS revenue grew by 13% YoY to $24.2 billion and is now approaching a $100 billion annualized run rate.
  • Growth accelerated by one percentage point from 12% in the last quarter yet was lower than the 20% in the same period last year.

The company’s CEO, Andy Jassy, sounded very optimistic in the earnings call on the prospects of AI. “Gen AI is and will continue to be an area of pervasive focus and investment across Amazon, primarily because there are a few initiatives, if any, that give us the chance to reinvent so many of our customer experiences and processes, and we believe it will ultimately drive tens of billions of dollars of revenue for Amazon over the next several years.”we believe it will ultimately drive tens of billions of dollars of revenue for Amazon over the next several years.”

The company’s CFO pointed out that optimizations are slowing. “Similar to what we shared last quarter, we continue to see the diminishing impact of cost optimizations. And as these optimization slow down, we're seeing more companies turning their attention to newer initiatives and reaccelerating existing migrations.”

Google Cloud

  • Google Cloud revenue grew by 26% YoY to $9.2 billion, helped by the increasing contribution from AI, beating the estimates of $8.94 billion.
  • Even though the growth is lower when compared to the 32% growth in the same period last year, it has accelerated from 22% in the previous quarter.
  • The strong growth in the quarter also helped the company narrow the gap to 4 percentage points with Microsoft Azure’s leading growth of 30% compared to 7 percentage points in the previous quarter.

In the earnings call, CFO Ruth Porat said, “The Cloud team is intensely focused on bringing the benefits of Gemini, our industry-leading AI technology, to enterprises and governments globally, and we are gratified with the level of engagement. The strong demand we are seeing for our vertically integrated AI portfolio is creating new opportunities for Google Cloud across every product area.” The company launched Gemini in December and offers three versions: Gemini Ultra, Gemini Pro, and Gemini Nano.

The company’s CEO Sundar Pichai also echoed the thoughts of Microsoft and Amazon’s management on cost optimizations reducing, saying “the cost optimizations in many parts are something we have mostly worked through.”

Best of Breed

We took a sample of the top-ranking cloud stocks on revenue growth, free cash flow, adjusted operating margin, and valuations.

Best-of-breed cloud companies are expected to decline sequentially by 4-points; from 5% QoQ growth last year to the expected 1% QoQ this year. This is the same as we noticed in Q3 to Q4, wherein it showed an improvement from a decline of 11 points in Q1 to Q2 of last year.

However, on a percentage basis, the recent QoQ/YoY deceleration is 72% compared to the 47% decline in Q3 to Q4 estimates and slightly better than the 83% decline in the same period last year.

All the best-of-breed cloud companies showed a deceleration similar to the trend seen in our previous analysis. CrowdStrike has the lowest deceleration, from 9% last year to 7% expected this year. Bill Holdings has the highest deceleration, from 5% growth last year to (4%) this year. In our previous analysis, Bill Holdings had the lowest deceleration.

Earnings Beats

Bill Holdings led with a revenue beat of 6.8%. The company’s revenue grew by 22% YoY to $318.5 million. The core revenue, which includes subscription and transaction fees, grew by 19% YoY to $275 million. Management highlighted the better-than-expected standalone total payment volume (TPV) growth of 10%. However, they are still cautious on macro, “It's too early to call a trough in B2B spend, and we expect the current interest rate environment will continue to depress overall spend growth.” The management guide for the next quarter is $299 million to $309 million, representing a YoY growth of 11.5% at the midpoint.

MongoDB’s revenue exceeded analyst expectations by 5.2%. The company’s revenue grew by 27% YoY to $458 million. However, the stock sold off post earnings as the FY guidance missed estimates. Management FY revenue guide was $1.9 billion to $1.93 billion below the estimates of $2.03 billion. The adjusted EPS guide was $2.27 to $2.49, far below the estimates of $3.22.

HashiCorp’s revenue grew by 15% YoY to $155.8 million, beating estimates by 4.3%. Management revenue guide for the next quarter is $152 million to $154 million, representing a YOY growth of 10.9% at the midpoint. The management highlighted in the earnings call that they are targeting 20% growth sometime in FY2026. Per CFO, “And then what follows is basically progressive improvement on the growth rate until it reaches 20% in the fiscal 2026 period, not that fiscal '26 will be 20%, just to be clear. So what we're signaling is that — the fourth quarter was a great quarter, and we feel like the optimization cycle is abating. There are signs of positive activity. We're not out of the woods.”we feel like the optimization cycle is abating. There are signs of positive activity. We're not out of the woods.”

HashiCorp’s adjusted EPS came at $0.05 compared to ($0.07) in the same period last year, beating estimates by 501%. This was the second consecutive non-GAAP profitability for the company. Snowflake’s adjusted EPS grew by 150% YoY to $0.35, beating estimates by 98%. MongoDB ranked third with a beat of 82.6% and its adjusted EPS grew by 50.9% YoY to $0.86.

Bottom Line and Free Cash Flow

GAAP profitability is another crucial metric to monitor closely, especially with macroeconomic uncertainty. Most of the names listed in the chart below are unprofitable on a GAAP basis because they pay high stock-based compensation.

This is one of the more important metrics that separates the winners from the laggards. For example, CrowdStrike recently achieved the feat of four consecutive quarters of GAAP profits and a full year in GAAP profits. The stock has been up 140% in the past year.

Bill Holdings has improved its operating margin to (13%) from (43%) in the same period last year. CrowdStrike has improved to 4% from (10%) in the same period last year. Zscaler reported (9%) compared to (17%) last year.

ServiceNow has the highest free cash flow margin of 55%, up from 52% in the same period last year. Snowflake ranks second with a free cash flow margin of 42% and Datadog ranks third with a free cash flow margin of 34%.

Valuations

CrowdStrike has the highest forward P/S ratio of 19.5 among the best-of-breed cloud stocks. It is followed by Cloudflare at 19.3 and Datadog at 15.5.

Ranking based on revenue estimates change for next quarter.

GitLab’s revenue estimates have been revised by 2.5% and Zscaler ranks second with a positive revision of 1%. MongoDB had a negative revision of (2.1%) after the company’s FY guidance came in below analyst expectations.

Ranking based on adjusted EPS estimates change for the next quarter.

Zscaler had the highest adjusted EPS revision of 10.5% among the best-of-breed cloud stocks. It is followed by CrowdStrike at 8.3% and Snowflake at 0.8%.

Highlights and Lowlights in Q4

CrowdStrike reported the fourth consecutive quarter of GAAP profits and the first full year of GAAP profits. The turnaround in GAAP profitability is most impressive compared to its cloud peers. The company’s key metrics are also accelerating. Notably, the net new ARR accelerated by 14% to 27% growth in the recent quarter from 13% in Q3. The company is in a unique position by combining cybersecurity with AI in a single platform with a data-centric architecture. Our complete post-earnings analysis is here.

Cloudflare beat revenue estimates by 2.7% and adjusted EPS by 26.3%. The company’s adjusted operating margin grew by 500 bps to 11% in the recent quarter. The free cash flow margin improved by 200 bps to 14%. CEO and co-founder Matthew Prince said in the earnings call, “The machine that underlies Cloudflare is firing efficiently on all cylinders, and we've been able to execute even as the macro environment remains choppy.” Key metrics accelerated, RPO accelerated to $1.245 billion, up 37% YoY compared to 30% YoY growth last quarter. We have discussed the company further in our post-earnings analysis here.

Zscaler beat revenue estimates by 3.6% and adjusted EPS estimates by 31%. On the macro, the company’s CFO said in the earnings call, “We believe we are still operating in a challenging macroenvironment and customers continue to scrutinize large deals.” Despite the beat and raise, the stock sold off post-earnings since the company guided for a (7%) sequential decline in calculated billings, suggesting further deceleration in this key metric to the low-20% range. We have discussed the company further in our cybersecurity analysis here.

Conclusion

The hyperscalers growth accelerated with a boost from AI. Cloud optimizations are reducing, which is positive. However, the macro conditions are still challenging. We will continue to look for outliers in the cloud category as we move into next quarter’s earnings season. We added CrowdStrike and Cloudflare to our portfolio partly informed by scans such as these, which revealed bottom line strength coupled with strong growth. We also use these overviews to keep an eye on valuation, of which cloud stocks are particularly sensitive to in this environment with very few successfully trading over 20 Fwd P/S since Q4 of 2021.

Royston Roche, Equity Analyst at the I/O Fund, contributed to this article.

Recommended Reading: