Cloudflare Q1: H2 Deceleration to 26.5%, CEO Spooked by Macro

Cloudflare reported a razor-thin beat in Q1, with revenues increasing 30.5% YoY to $378.6 million, marginally ahead of the company’s guide for $373 million by $5.6 million. The guide next quarter is for $394 million at the midpoint. Analysts were expecting $393.5 million. The stock is selling off because although Cloudflare beat for two quarters, management is not raising full year guidance.

If you do the math, the current guide implies a growth rate in the second half of 26.5%. The growth rate for H1 was:

  • Q1 actual of $373M
  • Q2 guide for $394M
  • H1 of $767M compared to H1 revenue last year of $598.7 for H1 2024 growth of 28.1%
  • H2 will be revenue of $883M compared to H2 revenue last year of $698M for H2 2024 growth of 26.5%. Notably, H1 2023 had higher comps (53% both qtrs) than H2 2023 (47% and 41%) so that doesn’t help explain the deceleration, in fact, it would make the decel stand out more.

The interesting part is that Cloudflare’s key metrics are not throwing any major flags as to what is causing the deceleration. Paying customers accelerated by 20 basis points from 17% to 17.2%. Customers above $100K were up 33.5% compared to 35% in the prior quarter. RPO increased 8% QoQ from $1.245 billion to $1.343 billion for growth of 40% YoY. This is an acceleration from growth of 37% YoY in the previous quarter. 

When asked why management didn’t raise full year guidance, the answer was macro concerns. Essentially, what this earnings report is communicating is that Cloudflare is quite strong, but the macro environment is not, per signals Cloudflare is seeing from their vantage point as a company that has visibility into many industries.

Revenue and EPS:

Management said Q1’s results were “fueled by a record number of net-new customers year-over-year spending more than $100,000, $500,000, and $1 million with Cloudflare on an annualized basis.”

Although adjusted EPS increased 100% to $0.16 and beat estimates by 23%, Cloudflare struggled to make improvements down the line on a GAAP basis, with GAAP operating loss widening YoY and GAAP net loss showing little improvement. Cloudflare has stubbornly high SBC expense, at $69.7 million in Q1. This is about 18.4% of revenue, meaning that Cloudflare’s path to GAAP profitability will rely on continual improvements in gross profit growth and minimizing SBC growth.

  • For Q1, Cloudflare reported revenue of $378.6 million, increasing 30% YoY and beating estimates by 1.4%.
  • Adjusted EPS of $0.16 increased by 100% YoY, and beat estimates by 23.1%. GAAP EPS was ($0.10), an increase of 16.6% YoY.
  • For Q2, Cloudflare guided revenue of $393.5 million to $394.5 million, representing YoY growth of 27.7%.
  • For Q2, Cloudflare guided adjusted EPS to be $0.14, a slight sequential decline but a YoY increase of 40%.
  • For FY24, Cloudflare maintained its revenue guidance for $1.648 to $1.652 billion, for YoY growth of 27.3%. Management increased its adjusted EPS forecast by $0.02, now seeing full-year adjusted EPS of $0.60 to $0.61.

Margins:

A higher mix of Zero Trust and SASE revenue contributes to the gross margin expansion. Zero Trust and SASE are discussed in more detail here.

A closer look at Cloudflare’s report shows that as revenues increased $88 million YoY, operating expenses increased $81 million, more than offsetting improvements in gross margin. However, Cloudflare reported a one-time sales & marketing compensation expense of $15 million, which was likely the primary reason for a ~41.6% YoY increase in sales & marketing spend. Stripping out this one-time expense would see GAAP operating loss improve by nearly $8 million YoY, from ($47.3 million) in Q1 of last year to ($39.5 million), instead of slipping deeper into the red at ($54.6 million).

  • GAAP gross margin in Q1 was 77.5% for profit of $293.6 million, a 180 bp YoY and 50 bp QoQ expansion.
  • Adjusted gross margin was 79.5%, a 170 bp YoY and 60 bp QoQ expansion for $301.1 million.
  • GAAP operating margin was (14.4%), a 190 bp YoY improvement but a 260 bp QoQ contraction from (11.8%) in Q4 2023 for operating losses of (-$54.6) million. As stated, stock-based compensation is $69.7 million which drags down GAAP profits into the red.
  • Adjusted operating margin was 11.2%, a 450 bp YoY and 20 bp QoQ expansion for adjusted operating income of $42.4 million.
  • GAAP net margin was (9.4%), a 370 bp YoY improvement but a 170 bp QoQ contraction to ($35.5) million.
  • Adjusted net margin was 15.4%, a 500 bp YoY and 80 bp QoQ improvement for $58.2 million.
  • For Q2, based on management’s guidance, adjusted operating margin is expected to be ~9%, a 220 bp QoQ contraction. They expect FY adjusted operating margin of 9.8%.

Cash and Debt:

Free cash flow decelerated from 14% last quarter to 9% this quarter for a total of $35.6 million. Operating cash flow of $73.6 million had a margin of 19.4% down from 24% last quarter. On a YoY basis, Cloudflare is trending up on cash flows but the market is sensitive right now on this line item. Despite the QoQ deceleration, the CFO stated on the call that cash would increase in H2: “We expect free cash flow to be relatively consistent with operating profit for the full year 2024 with the first half lower and the second half higher compared with operating profit.”

Network capex is expected was 8% this quarter and is expected to be 10% to 12% for FY2024, which is in line with prior comments, yet will be up from FY2023 by 200 basis points, at the midpoint.

Essentially, the 10,000-foot view is that Cloudflare is competing with hyperscalers who have very large capex budgets. The concern is that Cloudflare may not be able to keep up — where will the cash come from to build a larger footprint given the cash flow margins are fairly thin with $1.7 billion on the balance sheet although net cash is $432 million when you consider the $1.28B in debt.

The CFO pointed out why capex should remain reasonable: “We were at 8% to 9% of revenue with network CapEx in the first quarter. We said the year will be close in the range of 10 to 12, and this includes the rollout of GPU capacity pretty much to every server and every location we have.”

The CEO said something similar later in the call – that capex will remain reasonable as a percentage of revenue: “If we have to — we — so it may be that we — on a just pure dollars basis, end up spending more on GPUs. But as a percentage of revenue, we feel very comfortable that we can service these applications very well at the percentage of revenues that it is in our forecast going forward.”But as a percentage of revenue, we feel very comfortable that we can service these applications very well at the percentage of revenues that it is in our forecast going forward.” There was additional discussion from the CEO on the call quoted below.

  • Operating cash flow was $73.6 million in Q1, or 19% of revenue, compared to $85.4 million or 24% of revenue in Q4.
  • Free cash flow was $35.6 million, or 9% of revenue, compared to $50.7 million or 14% of revenue in Q4.
  • Cash and equivalents totaled $1.72 billion.
  • Debt totaled $1.28 billion.

Key Metrics:

RPO increased 8% QoQ from $1.245 billion to $1.343 billion for growth of 40% YoY. This is an acceleration from growth of 37% YoY in the previous quarter. 

DBNRR was 115% in Q1, flat QoQ but down from 117% in the year ago quarter.

  • Customers with ARR of >$100K grew 33.5% YoY to 2,878. This customer cohort accounted for 67% of revenue in Q1, compared to 66% in Q4 and 62% a year ago.
  • This is down from last quarter with 35% YoY growth.
  • This is down from the year ago quarter with 40% YoY growth.
  • Paying customers of 197,138 accelerated both YoY and QoQ
  • This is up 20 basis points from 17% growth last quarter
  • This is up from 13% growth in the year ago quarter

Cloudflare is reporting 2 million developers on their Workers platform. This is up from “more than a million” in a press release in November of 2023 and is up from 450K developers in May of 2022 per a corporate blog. Per the opening remarks: “The last few months were incredible for the entire workers' ecosystem. First, we crossed over 2 million active developers building applications on Cloudflare Workers. Second, in April, we GA-ed a number of key products like DY, our serverless SQL database; hyperdrive, which makes any traditional database perform like it's globally distributed; and Workers AI, which allows developers to run and tune AI models across our global network.”

Earnings Call:

The earnings call can be boiled down into two key discussions. The first was on capex, which was a very important discussion for the longer-term thesis of AI inference at the Edge and the Workers Platform, which we discussed here.

The second important discussion was analysts grilling management on why they didn’t raise guidance for the back half of the year. The brief answer is macro reasons, but the discussion addresses the primary reason the stock is down after hours.

Network Capex:

Today, for this report, network capex is not an issue. However, we did recently note that Super Micro has a fundamental problem where the company must raise cash to grow. Investors should pencil-in that Cloudflare could be in a similar issue someday. The management team is pulling a lot of levers to make sure this isn’t a serious concern, and ultimately if they can time their need to scale to when cash is cheap, then all will be well.

Here is what management said regarding why their approach is different from the hefty cash approach the hyperscalers take.

Answer
Matthew Prince (Executives)

[…] the thing which is really magical about Cloudflare's business, which is really elegant is that it all fits together so well. So for instance, as we sell more of our Zero Trust and SASE products, those are extremely high-margin products, and they don't require a significant additional amount of CapEx. That then frees up our ability to invest that CapEx in other areas, including in the AI space.

[…] That means that as we deploy CapEx, it's literally not shipping an entire server to support AI, but shipping just the GPU cards that go into existing servers that are in the field. That reduces the amount of CapEx that has to be deployed. And again, it works because it is all running on 1 unified network. The fact that every server across Cloudflare's entire platform is capable of performing any function that we need. That has allowed us an enormous amount of flexibility in how we can deploy things and has helped us. 

[…] But in the average hyperscaler, if they're getting maybe 20% utilization out of a CPU or GPU resources that they've deployed, we can often be many times that in terms of the utilization where in CPUs we're seeing almost 80% utilization. So that efficiency allows us to get more out of every CapEx dollar. Finally, I would say that inference is different than training. And so you need different resources for that. You don't mean necessarily the most cutting-edge GPUs in order to do inference tasks. And so that has meant that we haven't had to chase down what is a — GPUs that have limited quantity. It's also meant that we can be much smarter about picking and choosing between different GPU vendors and matching workloads to whoever it is that can provide the best service. And I think over time, that gives us a significant advantage over people who are just trying to rent 1 particular type of GPU or rent that and let their customers figure out how to be as efficient as possible.

–End Quote

Workers Platform:

As we likely face some turbulence in the near-term (defined as next couple quarters) due to cloud valuations being quite high, it’s important to remember the medium-term thesis (next 1-2 years). When asked what was special about the Workers Platform, the CEO stated the following, some of which we described in detail in the October deep dive.

Answer
Matthew Prince (Executive)

In terms of why, what is it about Cloudflare that's unique? I think there are sort of 3 things that stand out to me about it. The first is just the performance of Cloudflare Workers AI because we are distributed around the world and today, over 150 locations globally, as we serve customers that serve a global audience, we can just give them a much better experience in having to ship all of your code back to some central location

The second is that we can actually be significantly more cost effective. If you're using one of the big hyperscale cloud in order to do any sort of AI task, it's up to you to manage efficiency. You have to make sure that you're getting the most out of the GPU that you're renting whereas what we do is much more of a serverless AI model where you only pay for the task that you actually run. So especially in a lot of the start-ups, they're finding that they can just get significant better efficiency, significant better cost if they use our platform in order to deliver that AI experience. And then the third thing is that because we got it distributed globally and because of the fact that we have such a rich ecosystem that we've built, where you can get a AI experience that's allowing people to actually fine-tune their models […] We can actually correspond all of the local and regional differences all around the world. That's something that you don't get anywhere else. 

—End Quote

Macro Concerns:

The tone on this particular call was that macro is providing early signals of a H2 slowdown. This was not your typical “oh, macro is hard to predict” discussion. When they discussed the H2 slowdown, it was not Cloudflare specific at all, rather that Cloudflare would have better visibility than other companies due to where they sit in terms of the internet.

This was a sample of the opening remarks:

“In the short term, however, my crystal ball is less clear. We see a lot of signals based on our privileged position running a good chunk of the Internet […] The short term is uncertain, the long term is bright, and so in the medium term, we're going to keep our hands firmly on the levers of our business […]”

Here’s an additional glimpse into the tone on the call, at times:

Question
Jonathan Ho (Analysts)

Excellent. And just a quick follow-up. Is there something specific in the macro that's maybe causing you a little bit of pause? Anything that you can sort of point to in terms of that additional concern on the outlook.

Answer
Matthew Prince (Executives)

I think that we we get a lot of signal based on where we sit on the Internet. And what I would say right now is that it's not any one thing pointing in any one clear direction. But there's a lot of noise pointing in a number of different directions that give us, I think, reason to be cautious and I think that, that is in our very nature is always taking as much signal being data-driven and making sure that we're making investments in a responsible way. And so I think the obvious thing is the geopolitical uncertainty around the world. That absolutely causes changes in buying behavior. On the other hand, some of that — those changes in buying behavior have been positive for us as we're seeing, especially in our government business, pick up because of that uncertainty. 

So there are puts and takes that are out there. What we want to do is just make sure that we are being prudent and responsible and thoughtful as we make investments and as we think through how to handle the responsibility that we have with investors capital and that they've trusted us with.

–End Quote

Additional discussions on macro had a similar tone, such as this one from the CEO: “We can make investments and we can think through what that future looks like in part because we just get much more signal than I think the average enterprise SaaS company gets. And I think that, that has served us well. And I think we try not to be surprising in any way. And so as we see — I would say that there is certainly an uptick in uncertainty and sort of potential downside this quarter over last quarter.”I would say that there is certainly an uptick in uncertainty and sort of potential downside this quarter over last quarter.”

Here is more along those lines: “I think my level of concern is not at the same level that it was in Q1 of 2022, but it is definitely heightened over a lot of what we've seen in more recent quarters.”

However, one analyst didn’t let them off the hook so easily, and so to really drive home the tone of the call, I’m quoting in full one of the last questions where the analyst pushed for management to be crystal clear.

Question
Alex Henderson (Analysts)

So if nothing is really spooking you here, I'm still struggling with the guidance and the outlook for the back half of the year. You've given guidance that — or commentary that you're seeing significant strengthening of your pipeline, you're saying you're duration stable. You're seeing solid closure rates. You're adding more sales capacity, you're winning large customer deals at an accelerating rate. You’re spending more on hiring people and productivity in your sales force is significantly improving. Yet your guidance implies with the first quarter beat and the second quarter are above the Street, the back half is much more conservative. So I guess the question is, is that a function of specific weakness in a particular geography or due to political issues? Or is it just trying to feather in more opportunity for the sales organization to be realigned as Mark comes on and drives things because ultimately, it sounds like the mechanics imply an acceleration, not a deceleration.

Answer
Matthew Prince (Executives)

Yes. Alex, I'll start and then Thomas can give a little bit more color. I would push back on your initial statement, which was that nothing spooks me, a lot spooks me right now. So just because just — and I want to make it clear, we are in a much more uncertain environment and the signal that we're seeing is that uncertainty is up. In addition to that, I think you're correct that whenever you have a sales leadership change, there is risk that comes with it. And so there's a bit of that. But the primary factor here is that as we look at the signals in the overall macro economy, it is — it feels like a much more — it feels like there's much more reason to worry in Q1 than there was in Q4. But that doesn't mean that it was the same, just sound the alarm bells that we were seeing back in Q1 of 2022.

–End Quote

Conclusion:

Cloudflare’s valuation at 18x forward sales is hovering at the 20x forward PS level that ‘best-of-breed’ cloud stocks struggle to maintain. If macro does weaken, cloud stocks will get slammed for their thin FCF margins (far majority have negative FCF) and lack of GAAP profitability. Remember, I’m simply the messenger here. The reality is that cloud gets hit hard. We trimmed the position over the past quarter or so because cloud simply doesn’t sustain well at certain valuations. Had we not already trimmed Cloudflare, we would be doing so today – primarily based on valuation, secondly due to this management team being better than most at giving investors a heads-up when something is off. Meaning, management stated their crystal ball was “cloudy,” but in reality, if you’re listening, they’re being crystal clear.

With that said, Cloudflare is one of our favorite choices for the medium-term. The company sits in an enviable position for AI inference at the Edge. The key metrics are strong incl an acceleration in RPO, and I suspect that won’t be the case with most cloud peers this quarter. The developer growth on Workers to 2M is fire. I liked management’s response on network capex as it shows they have a strategy, and it’s showing up today with cash flows remaining at an acceptable percentage of revenue – although, notably, we do want to stay neutral here in terms of what the network capex reports in the future and also continue to scrutinize cash flow margins.

Recommended Reading:

The Risk is Higher in the Market than it Feels

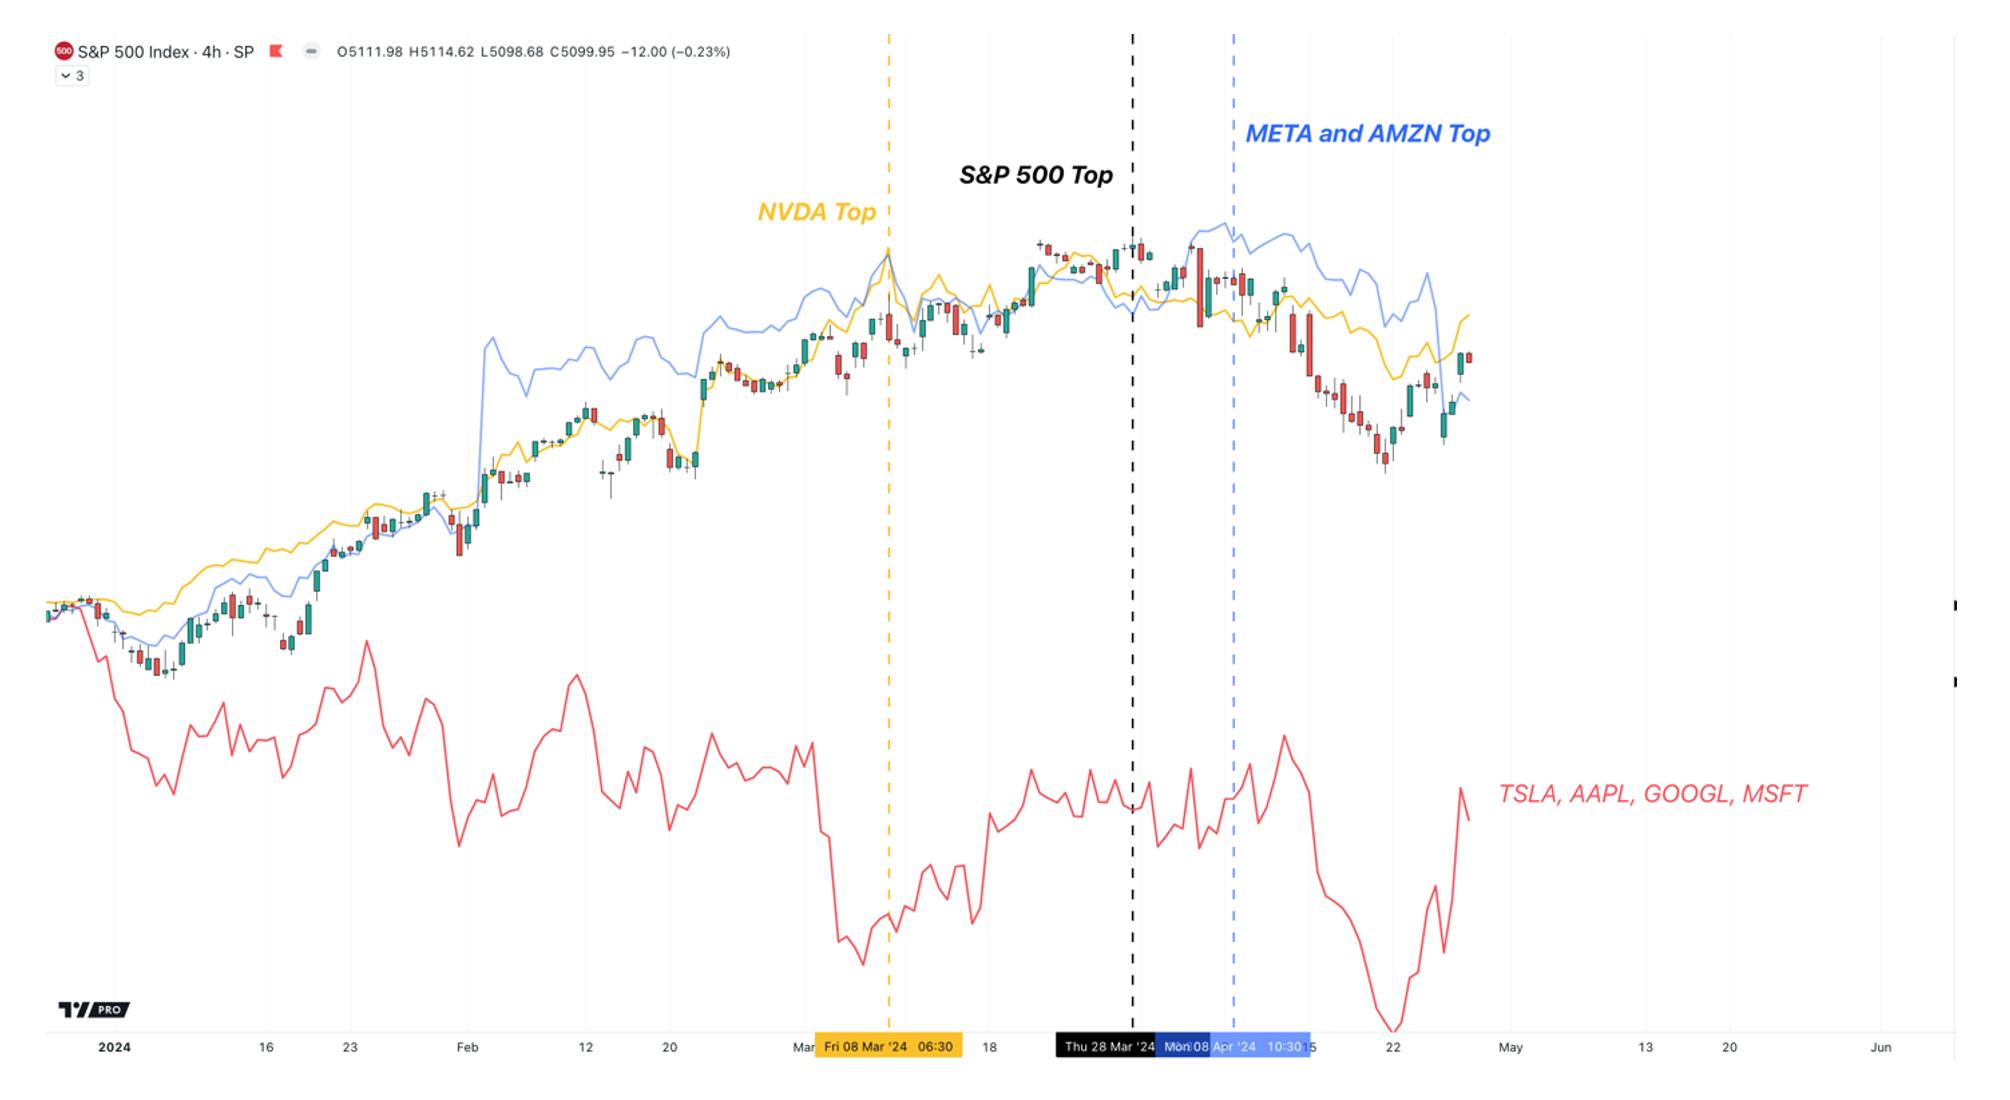
Our last broad market report entitled “The Magnificent 7 are Falling Like Dominoes; Only 3 Remain” warned investors that risk was building in the markets. Specifically, it was discussed that the current market leaders, deemed the indestructible “Magnificent 7,” were putting in tops one leader at a time. First Tesla put in a top, then Apple, Google and Microsoft, all started making lower highs, while the broad market kept trending higher.  As we stated in that report, “When these cycle leaders start underperforming, it usually marks the start of a trend change.”

Just days later, the AI powerhouse and market leader, Nvidia, put in a top on March 8th, while the S&P 500 continued higher. This left only Amazon and Meta from the original Magnificent 7 pushing higher with the S&P 500.

sp500 & mag7 chart analysis

Source: I/O Fund

Sure enough, on March 28th, the S&P 500 followed the Mag 7 down, as we are now seeing volatility pick up for the first time in over 5 months. Now, investors are wondering if this is a buying opportunity in a larger uptrend or the start of something more severe?

In this report, we will show that the sentiment readings over the last several months suggest investors should be cautious. This is backed up by our broad market analysis, which indicates that risk is more elevated than most investors may think. This doesn’t mean we can’t push marginally higher. Instead, it is suggesting that the downside is greater than any additional upside. Interestingly, the last two standing from the Mag 7, Meta and Amazon, appear to be giving the strongest clues that we could see more volatility over the coming weeks to months.

Historic Sentiment

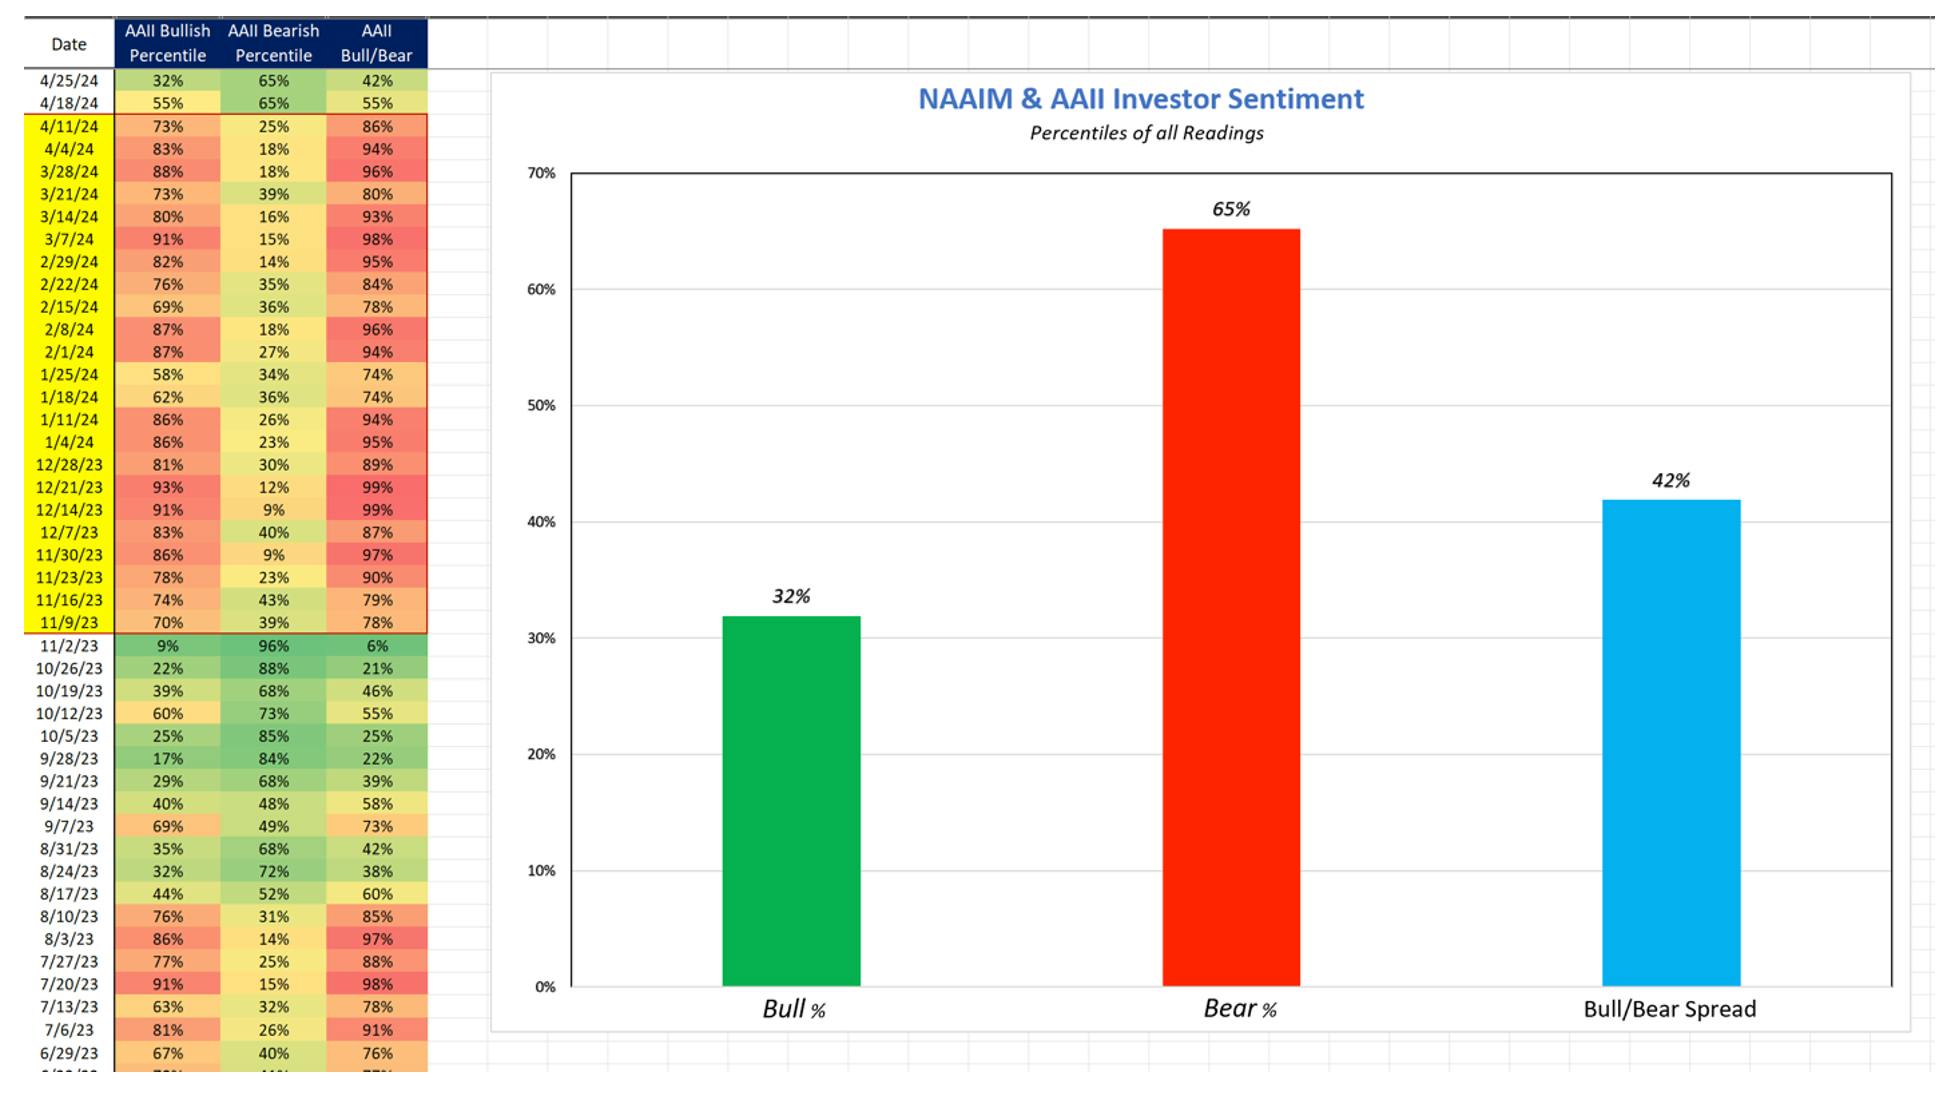
The below graph measures the percentile rankings of the weekly AAII Investor Sentiment Survey going back to 1987. The survey simply asks a group of investors where they believe the market will be going over the next 6 months.

Based on the answers, it provides a percentage of those surveyed that have a bullish or bearish outlook about the markets. It then measures the spread between the bulls and bears to provide a comprehensive reading regarding market sentiment.

It is best used as a contrarian indicator. The idea is that the more extreme the readings become, the closer we are to trend change.

naaim & aaii investor sentiment

Source: I/O Fund

Based on recent volatility, the participants are starting to get more concerned about the future markets, as you can see the increased number of bears over the last 2 weeks. However, look at the highlighted period November 2023 – April 2024. The spread between the bulls vs. the bears during this 22 week period stayed in the 70th percentile of all bullish readings going back to 1987. Out of these 22 weeks, 13 weeks were in the 90th percentile of all bullish readings.

We have not seen a consistent streak of exuberance that lasted this long within the history of this survey. The closest period was December of 1999 – February of 2000, where we had 18 weeks where the spread between bulls and bears were in the 70th percentile, with 14 of these weeks above the 90% threshold.

This level of exuberance warrants cation based on historic readings. Sentiment is a powerful measurement, as investing is not a zero-sum game. For every buyer, there must be a seller, and when everyone piles into the same side of a trade, willing to pay any price to get more gains, there is only one way for the market to go.

Broad Market

The extreme sentiment readings are coinciding with a potential top, of sorts, unfolding in the broader market. The S&P 500 broke out to new all-time highs earlier this year, which means that the 2022 bear market was just a deep correction within a larger uptrend.

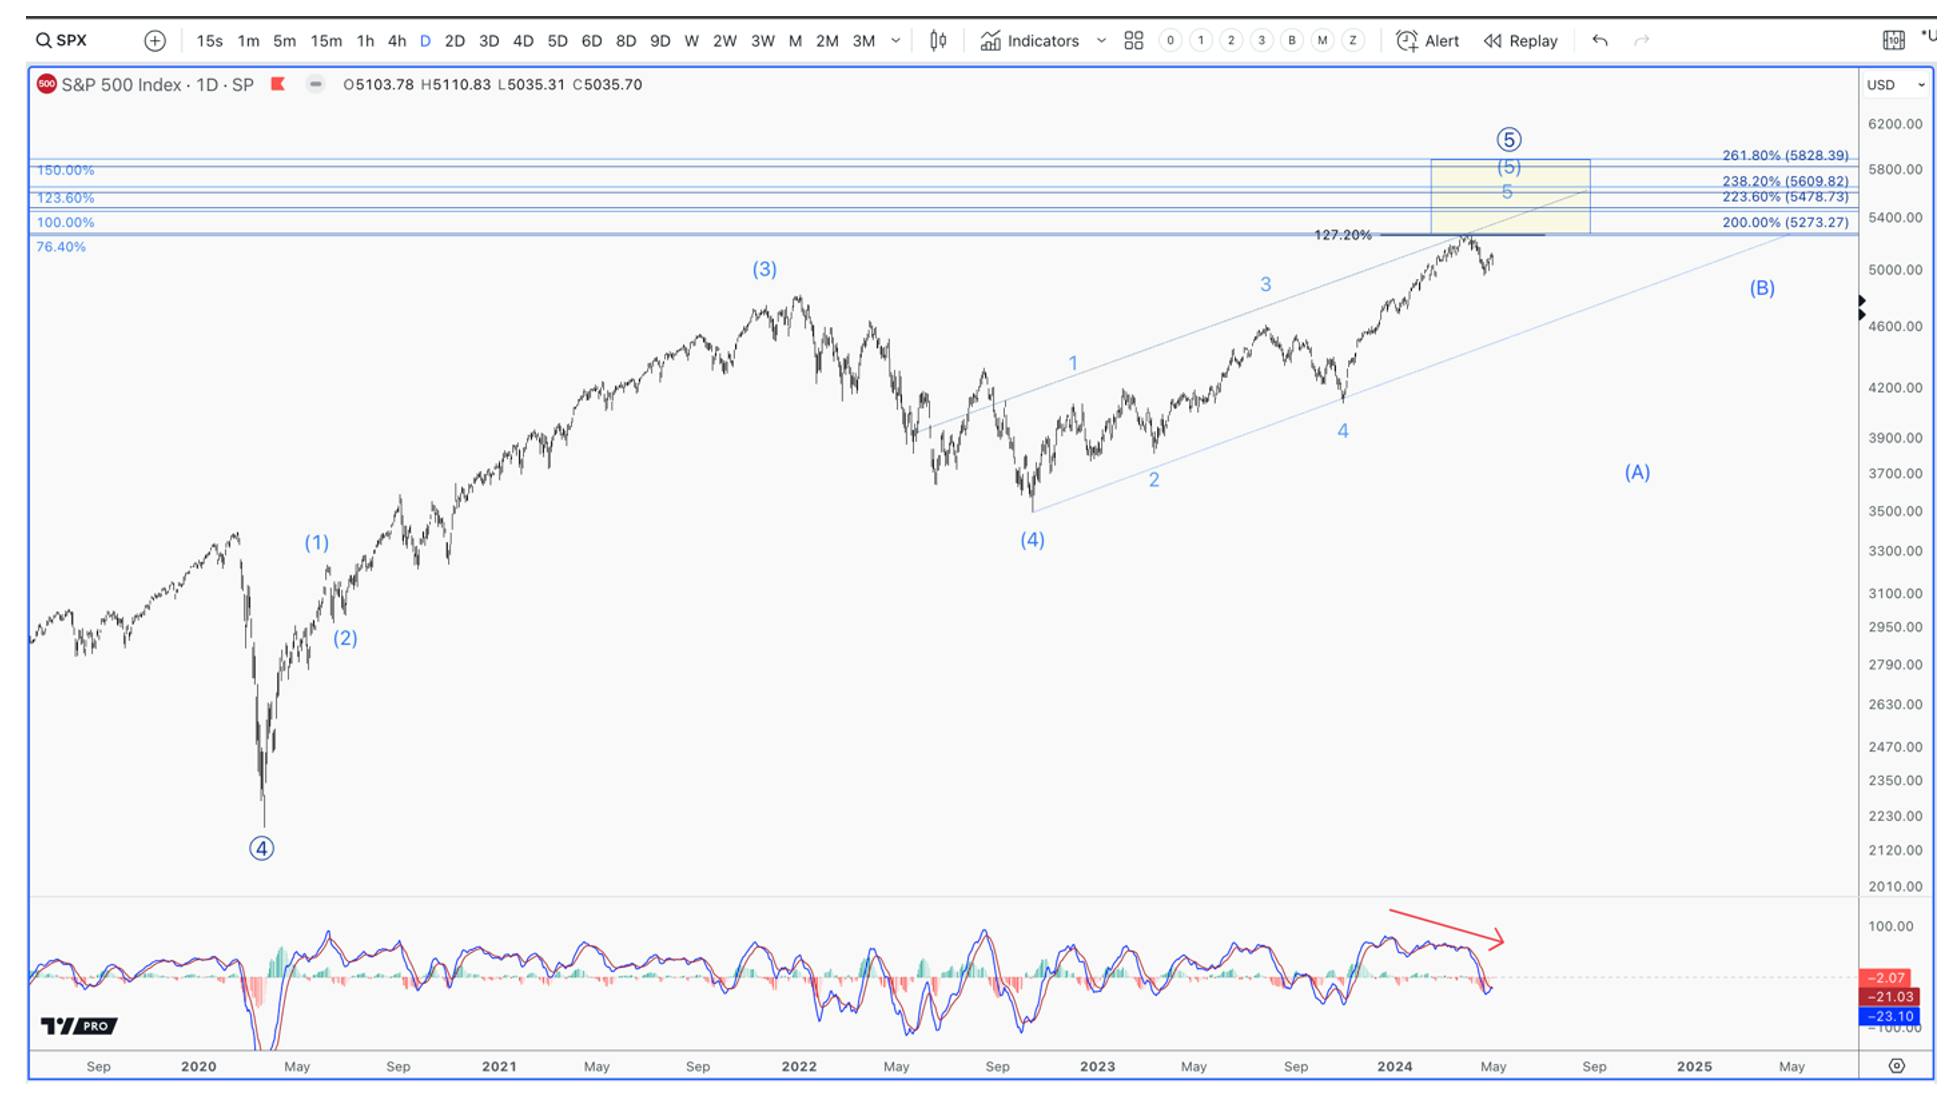
The pattern that has unfolded in this new bull cycle has taken the shape of a common technical pattern called an ending diagonal. This is a choppy, and narrow pattern that traces within a channel and always consists of five waves. Most importantly, these patterns only show up in the final 5th wave, which is the end of a trend.

sp500 chart analysis

Source: I/O Fund

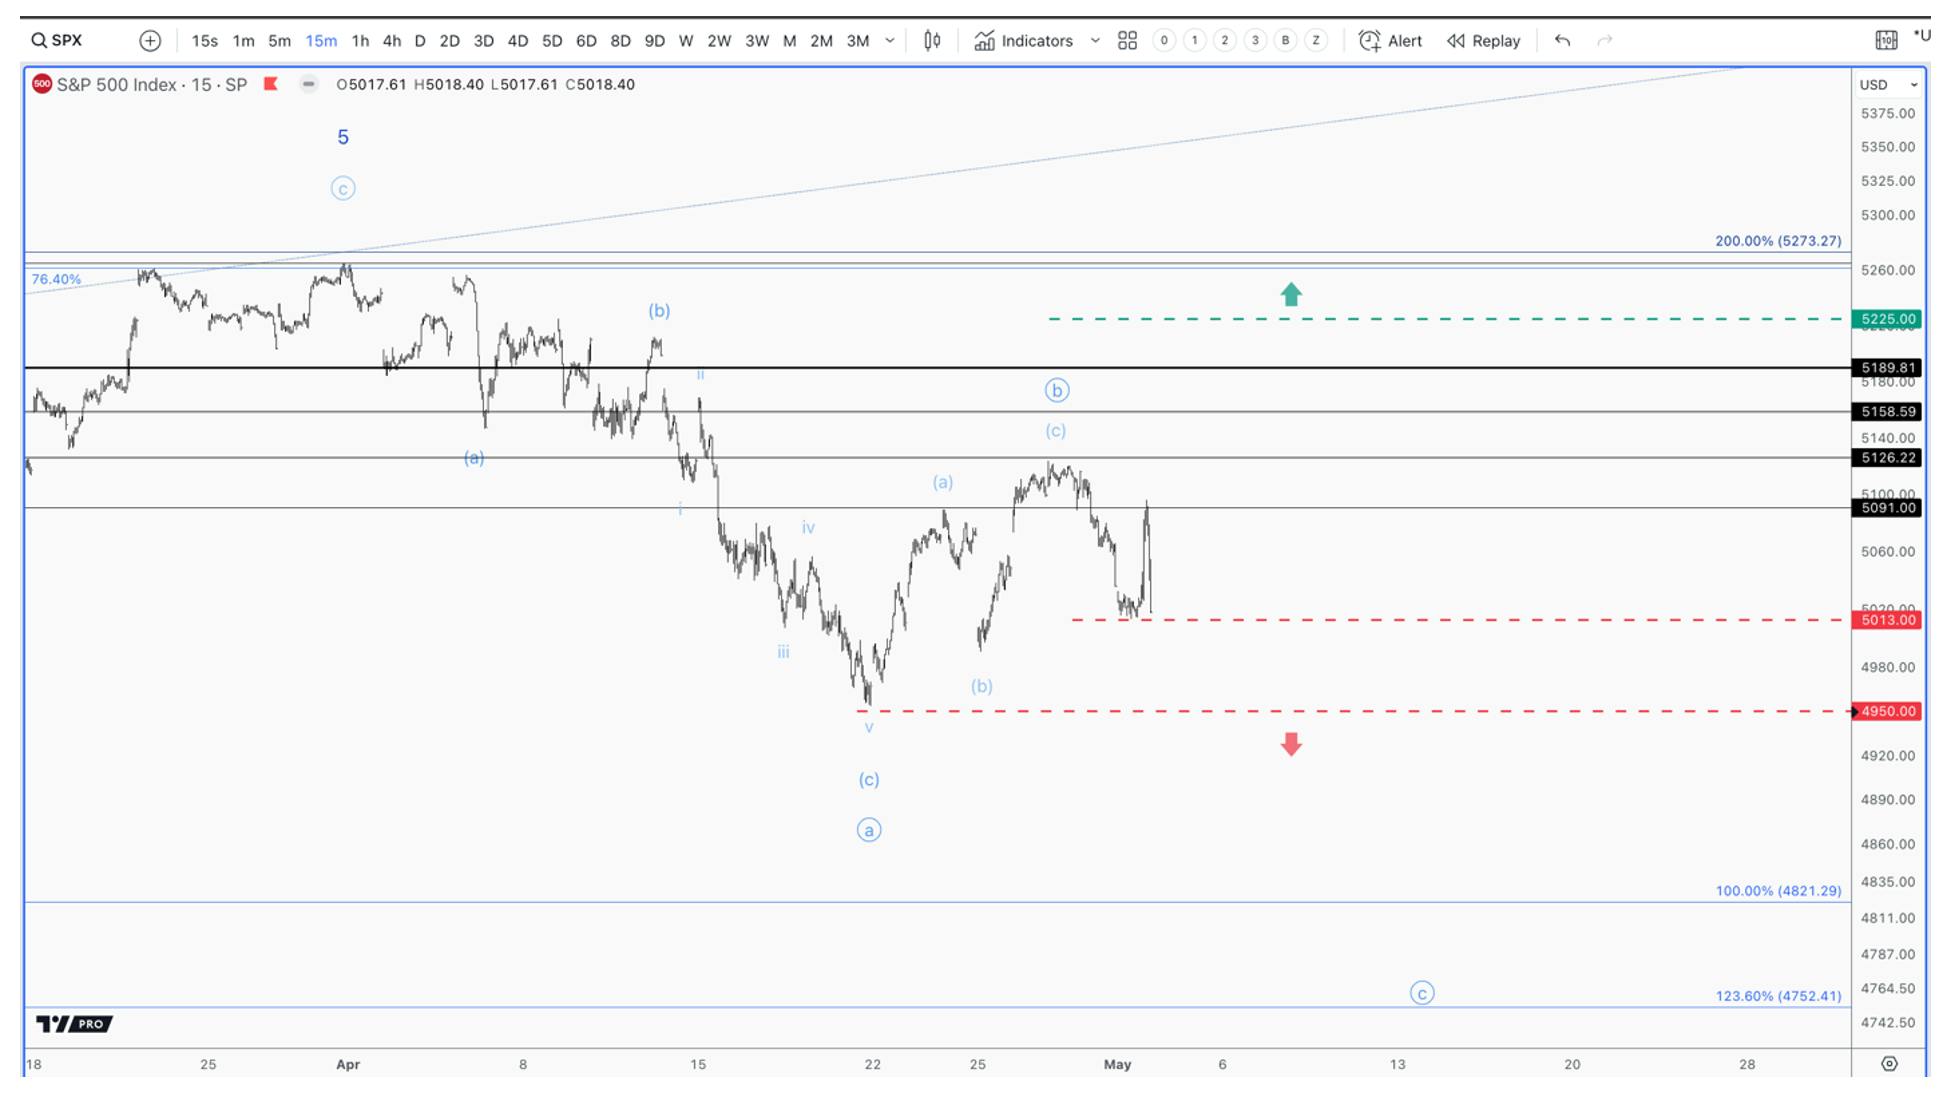
Note how we are very far along in the 5th wave pattern, and touching the lower boundary of our 5th wave topping zone. We are pushing higher on fading momentum, which is a typical sign that we see in the final 5th wave of an uptrend.

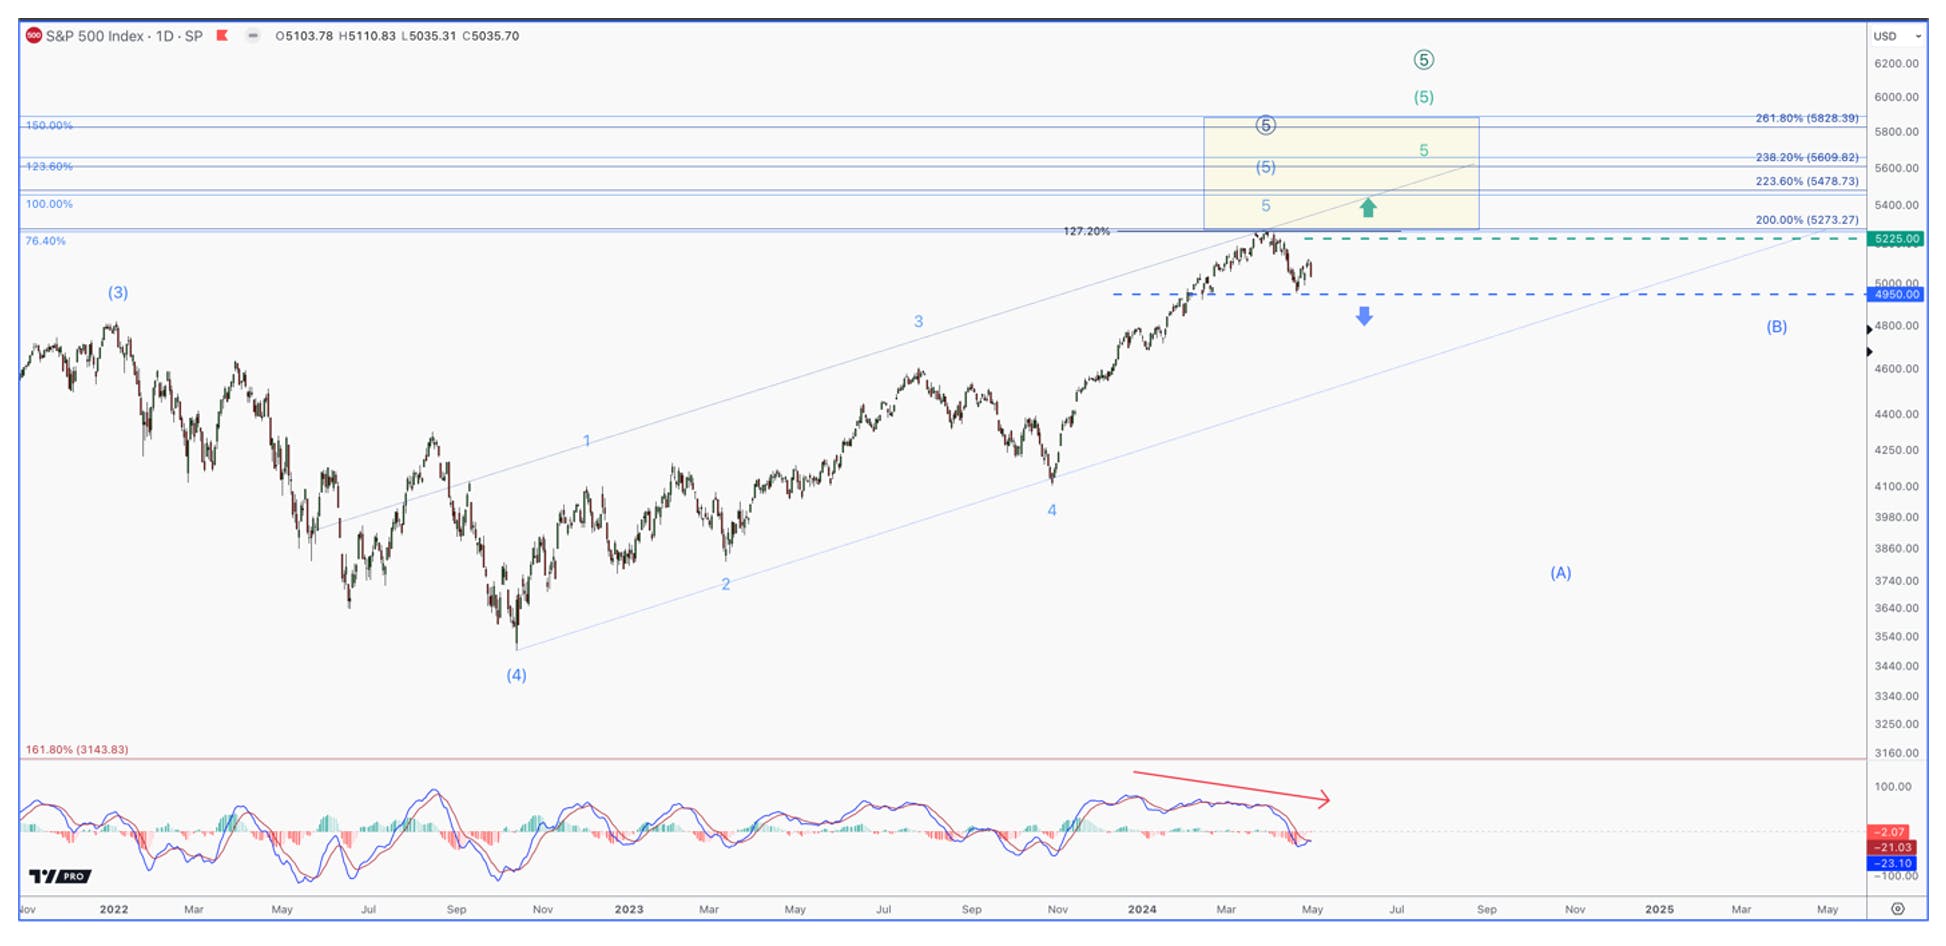
The breakdown, so far, has made a push into the upper regions of the 5th wave target box less likely. However, until we break below 4950, there is a chance we could push higher before rolling over. It would require the market not making a new low, and then breaking out above the 5225 level.

sp500 daily chart

Source: I/O Fund

Based on the current price information, I believe we are still in a downtrend, which is bets shown in the chart below.  The below path in blue shows an overlapping bounce off the recent lows. We can still push higher from here, but as long as we do not see a vertical breakout above 5225, I expect this bounce to fail as we push lower. A break below 5015 will be the first warning, and the final support will be 4950. If we do break below 4950, what my particular style of analysis tells me, is that there is not a path to new highs within the ending diagonal pattern that started in October of 2022. We will need to see a sizable correction, at best, in order to start a new pattern pointing higher. For this reason, it is likely that we see volatility pick up.

sp500 weekly chart analysis

Source: I/O Fund

The Mag 2

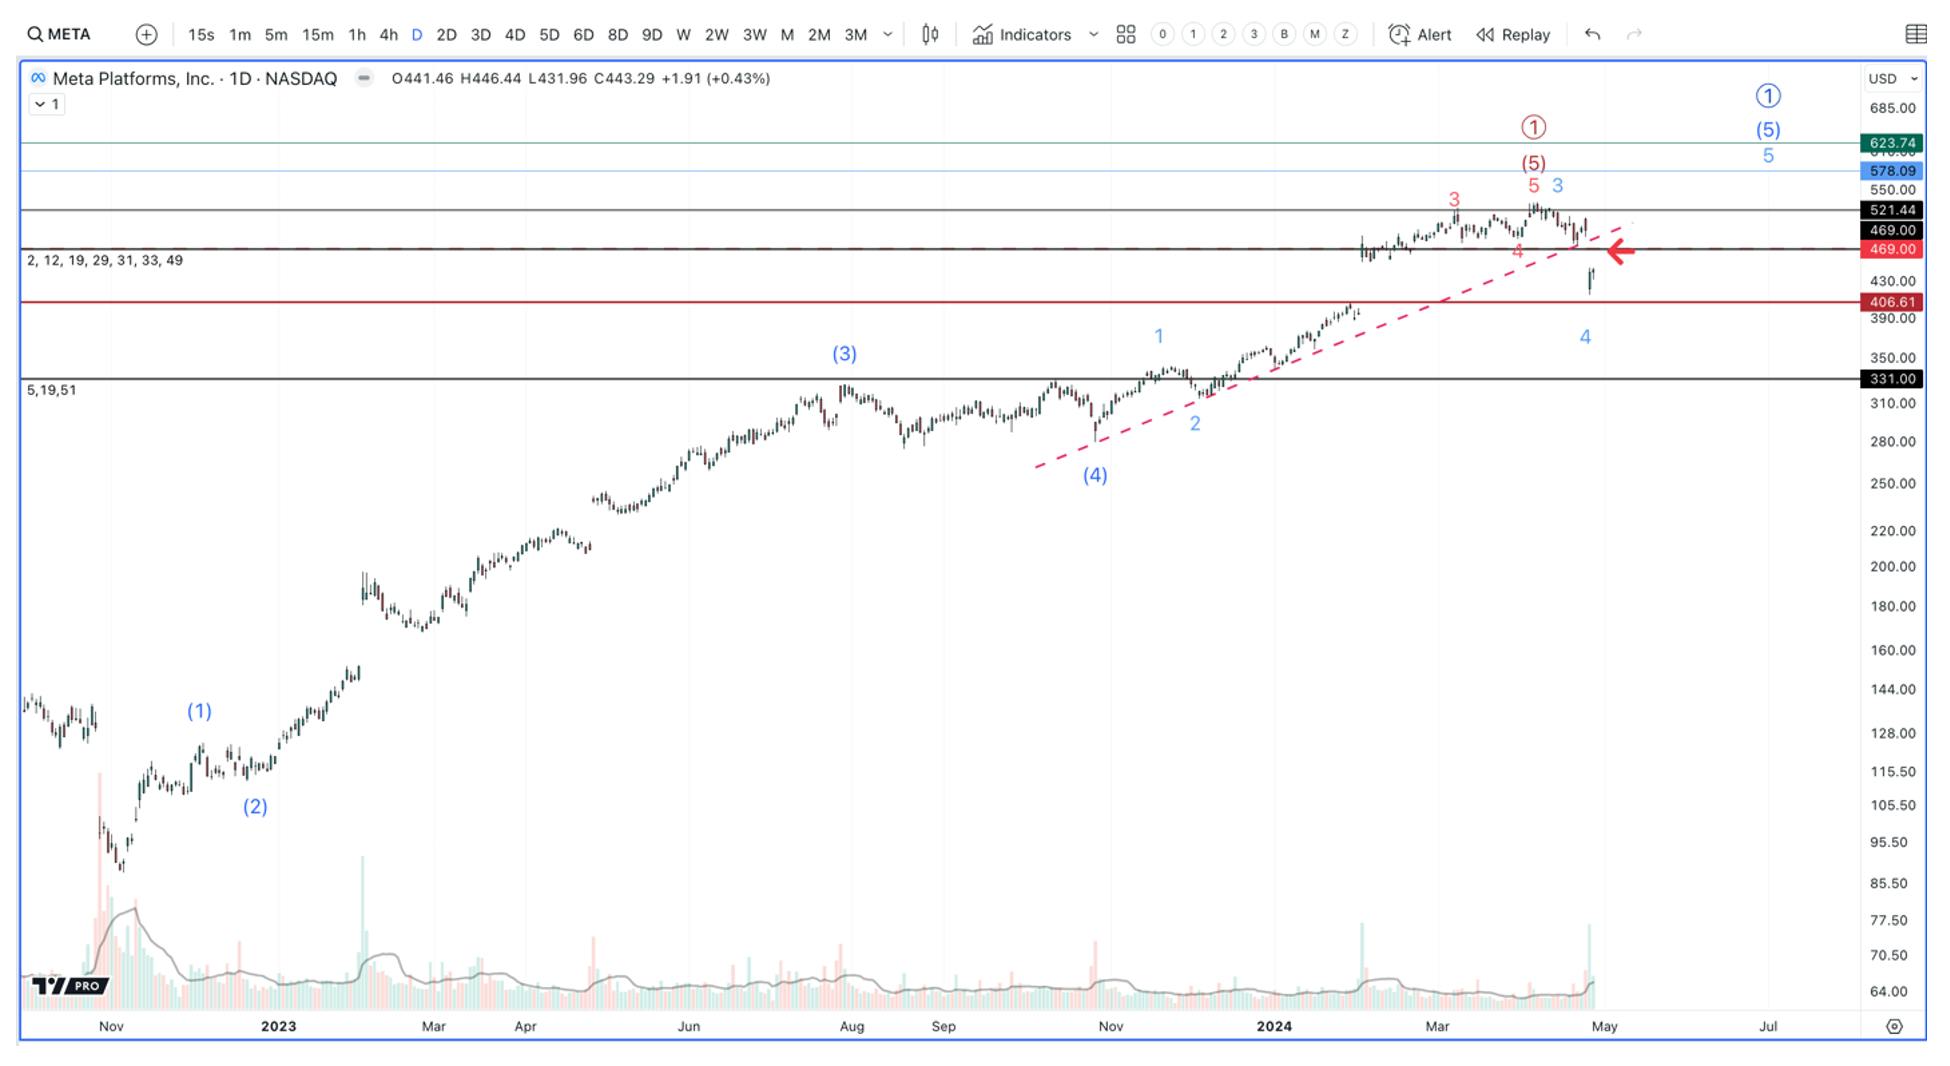
The final two Mag 7 stocks appear to be supporting the conclusion that a top is in place. Meta, for example, has been tracing the final 5th wave off the November 2022 low. Note how this final move higher has happened on lower momentum. This is common in the final 5th wave of a trend.

meta stock chart analysis

Source: I/O Fund

There is a low probability that we hold $406 and turn higher for one more high. However, I find this to be unlikely based on the additional clues within the chart.

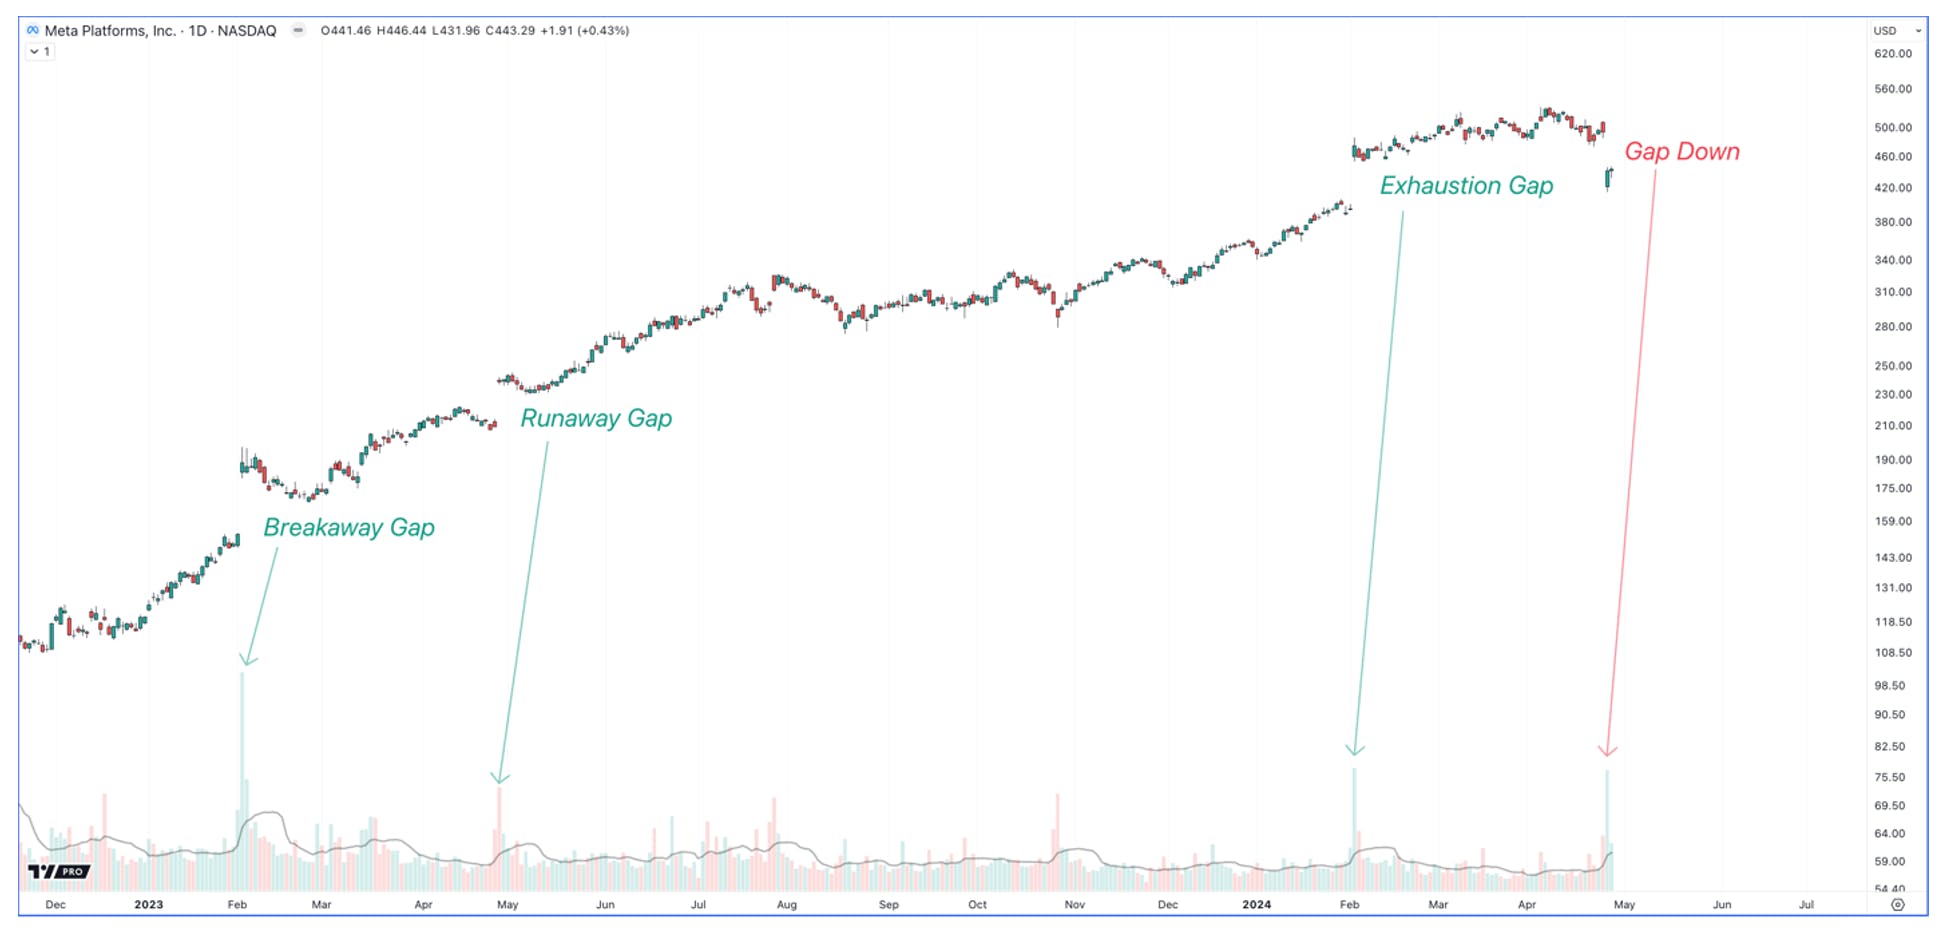
The choppy consolidation after their Q4 results resembles a distribution top, which is where we see large institutional trades sell to an eager retail crowd. This was confirmed by the recent earnings report resulting in a large gap below the major trend line, which happened on heavy volume.

Sign up for I/O Fund's free newsletter with gains of up to 370% – Click hereSign up for I/O Fund's free newsletter with gains of up to 370% – Click hereClick here

Also, it’s worth noting the importance of gaps within an uptrend. These are literal gaps between the closing price and opening price, usually on heavy volume. They are key markers within a trend and tend to unfold in 3s: the breakaway gap is the 1st indication that a new uptrend has started, the runaway gap typically happens around the halfway point of the larger uptrend, and the final gap is the exhaustion gap, which tends to happen around the end of the trend. So far, this is exactly what we have seen, and was confirmed with the recent selling gap, which tends to signal a trend reversal.

meta stock chart

Source: I/O Fund

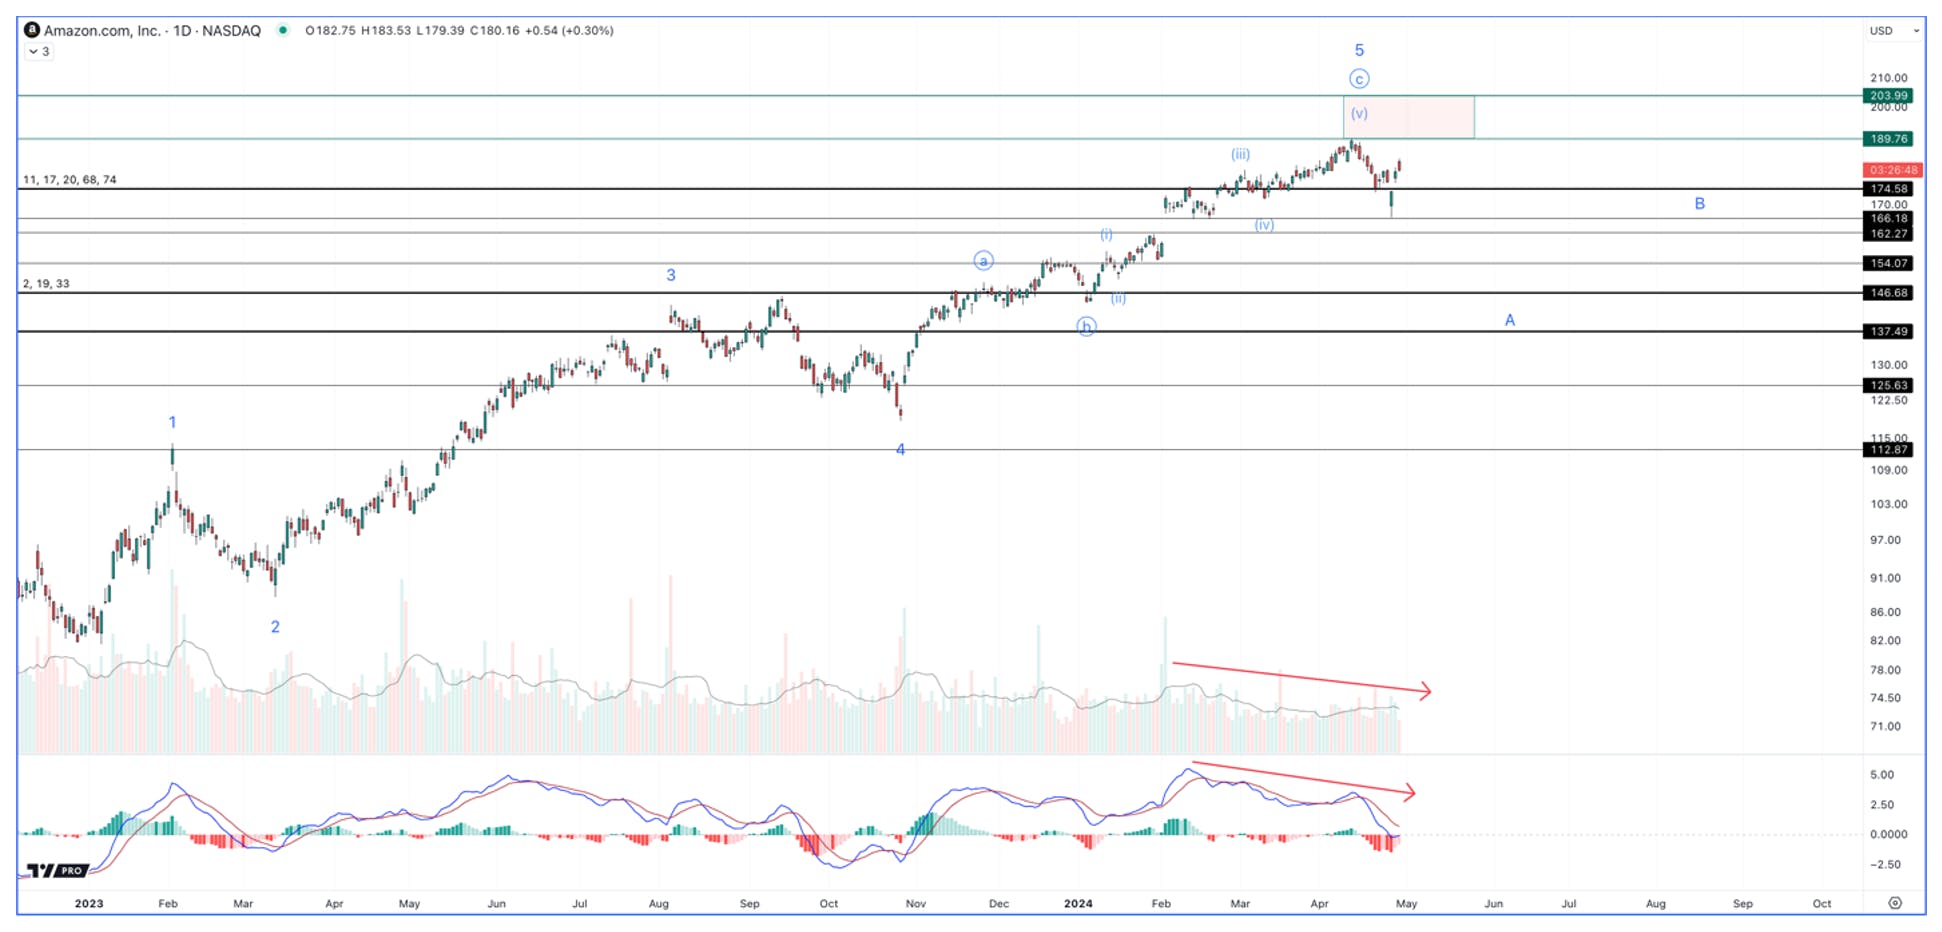
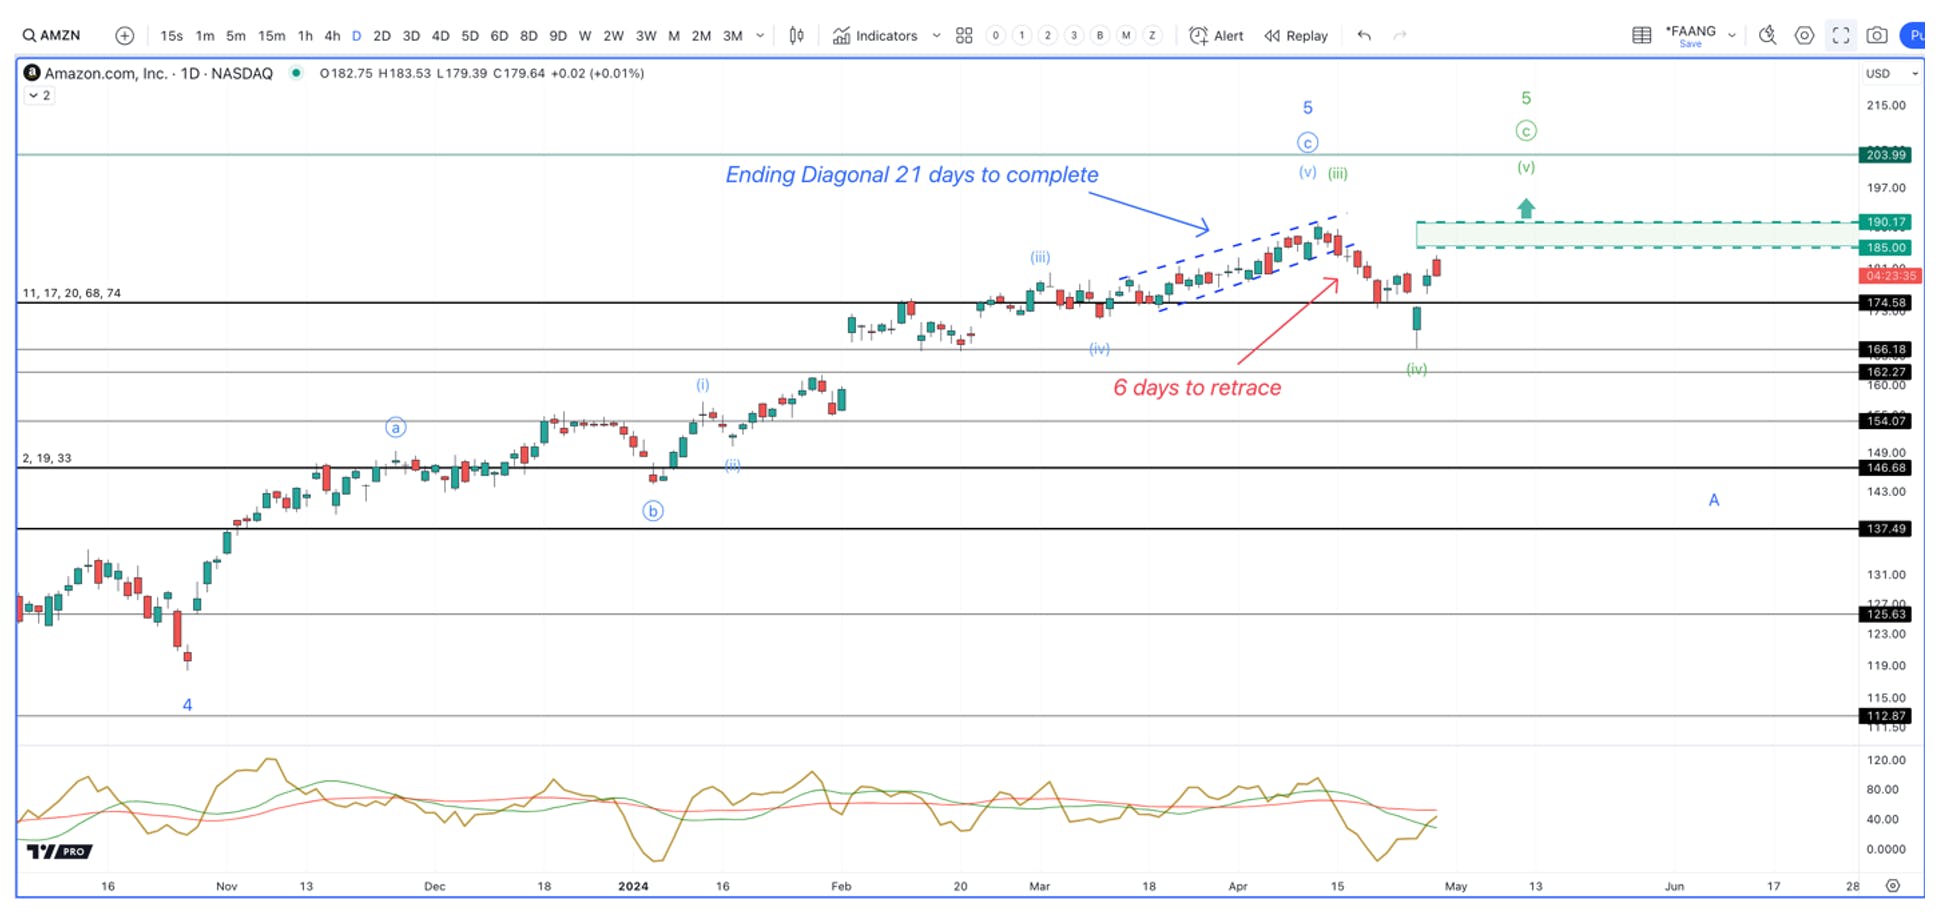
Amazon is another Mag 7 stock that is signaling a larger pullback is likely underway. Note the clear 5 wave uptrend off the 2022 low. Just like in Meta, the final 5th wave in Amazon was happening on weaker momentum, signaling that the strength in the uptrend was fading.

amazon stock chart analysis

Source: I/O Fund

What follows a five wave uptrend is a correction of the same degree. We are unfortunately dealing with a 1.5 year five wave uptrend. If this is what is playing out, this means we should see a multi-month correction, which should retrace most of the final push off the October 2023 low.

Amazon’s pattern is an ending diagonal, which is another piece of evidence supporting the final push will be a top for Amazon. As stated earlier, these patterns are tight, with choppy moves higher that trace a trend channel. They happen as the final 5th wave of a move, and when they end, we tend to see a swift drop back to the start of the pattern.

amazon chart analysis

Source: I/O Fund

The above ending diagonal pattern took 21 days to complete and only 6 days to retrace the entire pattern, which further confirms that this is likely an ending diagonal. Since these patterns only occur at the end of a move, we are likely setting up for more volatility into the coming weeks – months. If the current bounce can break above $190, then we could see an extension of this final 5th wave higher before rolling over.

A Note on Google

The divergences discussed in our last report regarding the Magnificent 7 was the clearest signal that a correction was building. Google was the 3rd of the seven to start making lower highs against the market pushing higher. This was the right call, as the market is now in a clear correction.

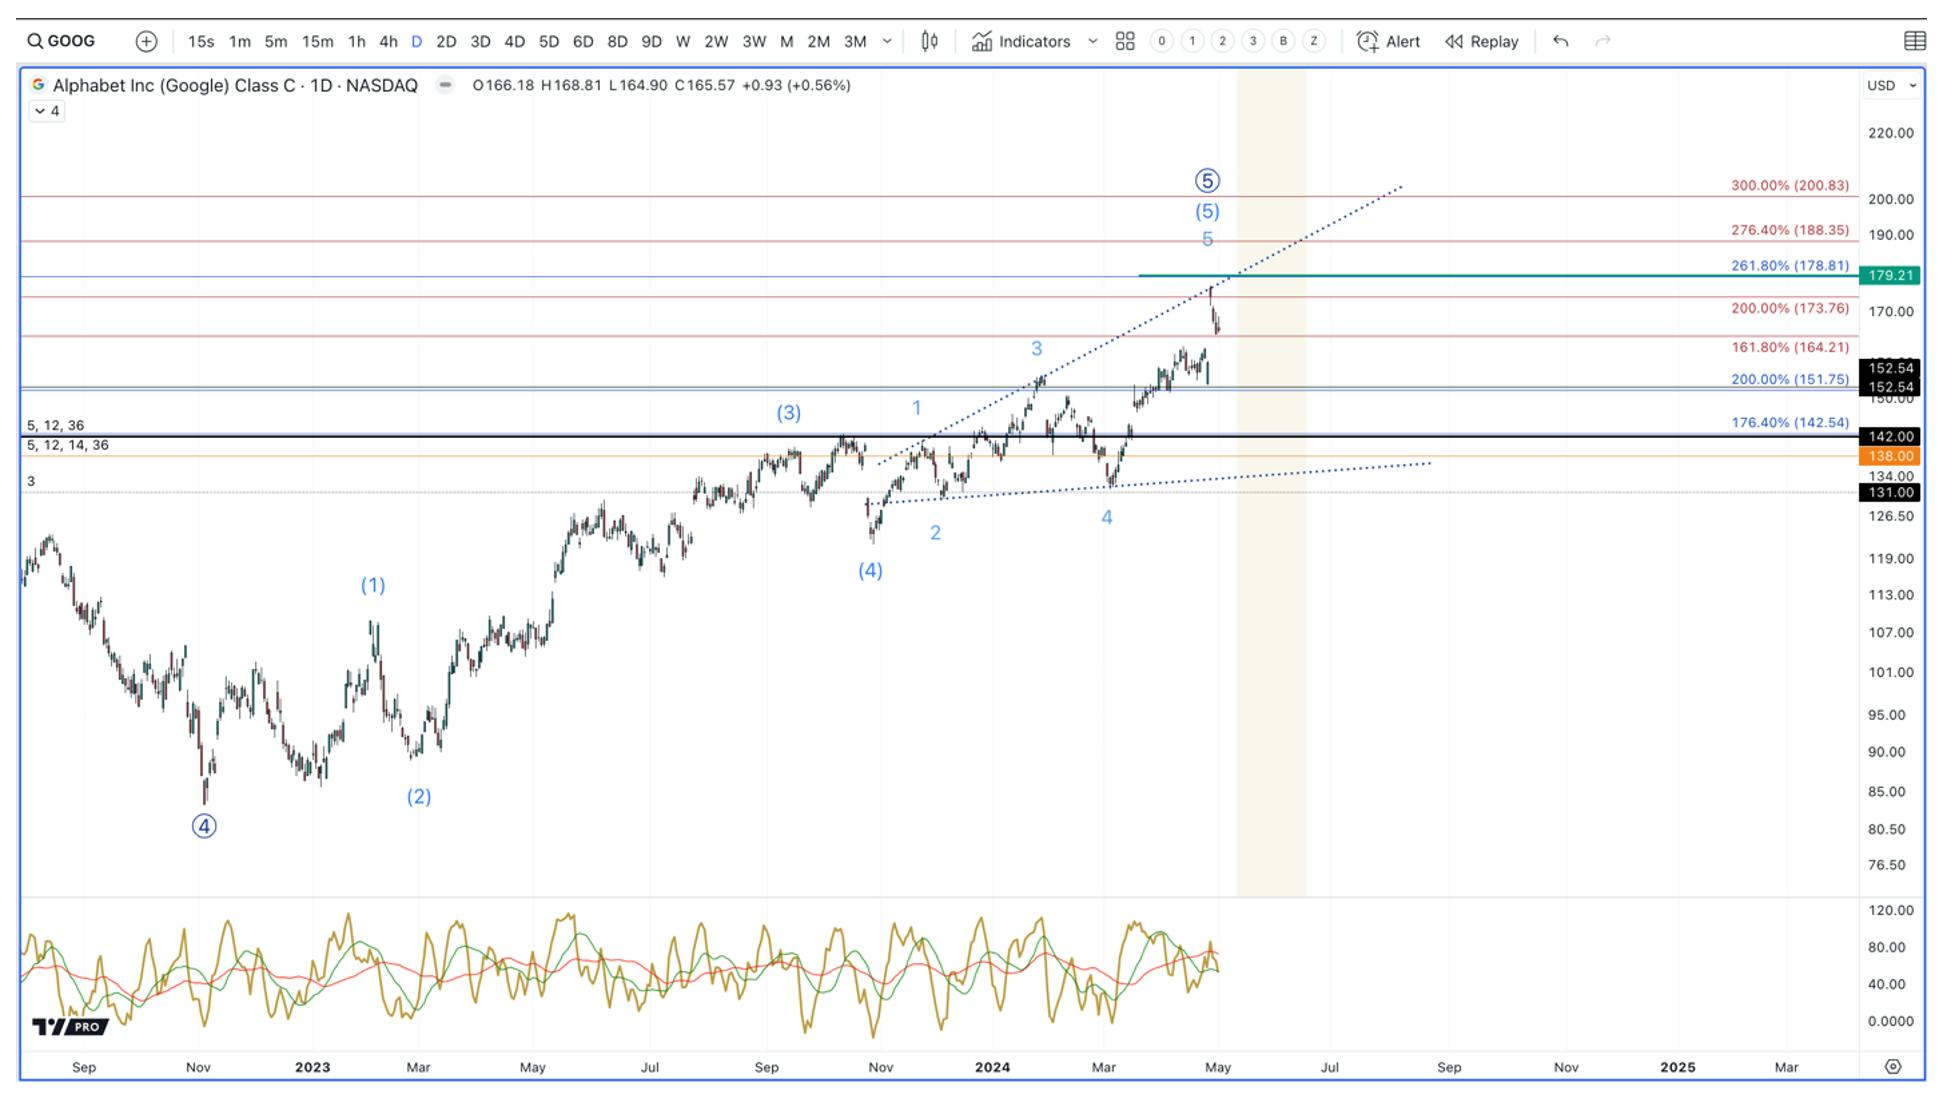
However, GOOGL recently pushed to new highs in their last earnings report. I believe this push was the final 5th wave within a pattern called an expanding diagonal. This patter is common in 5th waves, and also lines up with the rest of the market. Note below how the  final 5 waves each moved respected the expanding trend channel. If GOOGL closes the recent gap around $157, this will be the first signal that this pattern is in play.

alphabet stock chart analysis

Source: I/O Fund

Regardless, future market leaders will emerge from volatility. They will go down less than the broad market and tend to bottom before the broad market. It is too soon to tell, but this move in GOOGL is one we are watching as a potential market leader when this volatility ends. 

Conclusion:

The last six months have been a historic, and nearly vertical move higher. From November 2023 to March 2024, we have not seen even a shallow pullback — which is uncommon. With that came a level of exuberance that has not been recorded before in the AAII Investor Sentiment Survey. The level of greed in the market has not only created extreme valuations with stocks, but it created a tight rope that the broad market had to walk in order to keep pushing higher.

Once the recent volatility broke below the 5080 – 5055 support zone, the odds tilted in favor of a top being in. As long as we hold 4950 and break back above the 5225 region, we can extend this move higher. However, if 4950 breaks, we will have full confirmation that a top is in as the next move tests the 4800 – 4600 region. Because of this, we believe this market warrants caution.

If you own Tech stocks or are looking to own Tech stocks, consider joining us for our next broad market webinar. Every Thursday at 4:30 pm Eastern, the I/O Fund team holds a webinar for premium members to discuss how to navigate the broad market, manage risk, as well as revealing our various long-term game plans regarding stock entries and exits. We offer trade alerts plus an automated hedging signal. The I/O Fund team is one of the only audited portfolios available to individual investors. Learn more here.

Please note: The I/O Fund conducts research and draws conclusions for the Fund’s positions. We then share that information with our readers. This is not a guarantee of a stock’s performance. Please consult your personal financial advisor before buying any stock in the companies mentioned in this analysis.

Recommended Reading:
AMD Q1 Earnings: GPU Revenue Outlook Raised to $4B

AMD reported an in-line quarter on both revenue and EPS, with data center revenue coming in just above $2.3 billion for 80% YoY growth and a slight 2% QoQ increase. Margins were stable, with management guiding for a slight 100 bp QoQ expansion in adjusted gross margin. Cash flows improved sequentially, with AMD posting strong double-digit QoQ growth in both operating and free cash flow.

AMD’s GPU revenue forecast was boosted by ~14%, with management now seeing full year revenues at $4 billion, compared to its prior view for $3.5 billion plus. However, analyst expectations were largely pointing to $4 billion as the ‘minimum’ figure, with some looking for GPU revenue as high as $8 billion. The raise is welcomed with MI300 cumulative sales surpassing $1 billion since the launch in Q4, however, it’s not enough to meet a wide range of heightened expectations.

Below, we breakdown the glass half-full or glass-half empty psychology that is overshadowing AMD’s accomplishments right now (and which side of the proverbial debate we are on, and why).

Revenue and EPS:

  • Q1 revenue was $5.47 billion, marginally ahead of expectations for $5.45 billion and representing YoY growth of 2.2%.
  • Q2 revenue was guided at $5.7 billion, +/- $300 million for YoY growth of approximately 6% and QoQ growth of 4%. This was in line with consensus estimates for $5.69 billion.
  • Q1’s adjusted EPS was $0.62 in line with estimates for $0.61, representing YoY growth of 3%. GAAP EPS was $0.07 which missed estimates of $0.17 EPS.
  • Q2 estimates from analysts are for $0.69 EPS in the June quarter and $1.00 in the September quarter.

Key Segments:

Data Center:

AMD had guided for Q1 data center revenue to be approximately flat QoQ, implying revenues around $2.3 billion for YoY growth of ~77%. The company reported data center revenue of $2.34 billion, up 80% YoY.

AMD says the YoY growth was “driven by growth in both AMD Instinct™ GPUs and 4th Gen AMD EPYC™ CPUs,” and the sequential growth was “driven by the first full quarter of AMD Instinct GPU sales, partially offset by a seasonal decline in server CPU sales.” AMD added that MI300 cumulative revenues have surpassed $1 billion since launching in Q4 2023, signaling strong initial adoption and an ability to quickly ramp production.

The CFO guided for next quarter: “Sequentially, we expect data center segment revenue to increase by double-digit percentage, primarily driven by the data center GPU ramp.” Later it was stated: “In the second quarter, we expect overall data center to be up strong double digits.”

An analyst offered verbal math of $900 million for GPU sales next quarter, to which the CFO simply stated she was not guiding to those details. For our purposes, this is a good number to go with. The company called out Microsoft, Meta and Oracle as customers.

Regarding EPYC CPUs, on the call, an analyst stated that his math points toward AMD’s CPU server sales declining 5-6% which is considered strong compared to a competitor (likely Intel). “It looks like your server CPU business was also down at the lower end of the seasonal range. By my math, it was down like 5%, 6% sequentially. Is that right? And that's less than half the decline of your competitor?

Per the opening remarks: “Given our high core count and energy efficiency, we can deliver the same amount of compute with 45% fewer servers compared to the competition, cutting initial CapEx by up to half and lowering annual OpEx by more than 40%” and also: “We believe we gained server CPU revenue share in the seasonally down first quarter led by growth in enterprise adoption and expanded cloud deployments.”

Client, Embedded, Gaming:

Client segment revenue increased 85% YoY to $1.37 billion, driven predominantly by Ryzen 8000 series processor sales. Revenues declined just (6%) sequentially for the segment.

For Q2, it was stated that Client revenue would increase QoQ.

Per the opening remarks: “Looking forward, we believe the market is on track to return to annual growth in 2024, driven by the start of an enterprise refresh cycle and AI PC adoption. We see AI as the biggest inflection point in PC since the Internet with the ability to deliver unprecedented productivity and usability gains.”

Embedded segment revenue was $846 million, declining (46%) YoY and (20%) QoQ as customer inventory management continued.

For next quarter, the CFO stated Embedded would be flat QoQ, which implies a (47%) decline in Q2. The weakness is coming from automotive, which is widespread.

Gaming revenue was $922 million, declining (48%) YoY and (33%) QoQ “due to due to a decrease in semi-custom revenue and lower AMD Radeon GPU sales.” Looking forward, gaming is expected to decline by a “revenue to decline by significant double-digit percentage.” It was later stated on the call that gaming would be down a “similar zip code” as Q1. In the Q&A, it sounded like this won’t improve this year.

Per the CFO:

“If you look at the gaming, the demand has been quite weak, that's quite very well known and also their inventory level. So based on the visibility we have, the first half both Q1, Q2, we guided down sequentially more than 30%. We actually think the second half will be lower than first half that's basically how we're looking at this year for the gaming business.”

Margins:

Margins for the first quarter were in line with management’s expectations, while Q2’s guide implied a 1 percentage point expansion in adjusted gross margin, driven by an increase in data center mix and lower gaming revenue as gaming has a lower margin than DC.

  • GAAP gross margin was 47%, unchanged from Q4 but up 300 bp from 44% in the year ago quarter. Adjusted gross margin was 52%, in line with management’s guidance, and representing a 100 bp QoQ and 200 bp YoY expansion. Increased data center and client revenues and lower gaming revenue aided the margin expansion.
  • GAAP operating margin was 1% in Q1, an improvement from (-3%) in the year ago quarter but down from 6% in Q4. Adjusted operating margin was 21%, flat YoY and down 200 bp QoQ.
  • On a segment view, data center operating margin was 23.1%, an 1170 bp YoY expansion but a 620 bp QoQ contraction, likely driven by efforts to ramp up MI300 GPU production.
  • Notably, the MI300s are lower than the “corporate gross margin” right now but is expected to be above corporate gross margin over time. For full year 2021, the gross margin was 48%, so that’s a good benchmark for a best-case scenario GM.  Per the CFO: “It's the GPU gross margin right now is below the data center gross margin level. I think there are 2 reasons — actually, the major reason is we actually increased the investment quite significantly to, as Lisa mentioned, to expand and accelerating our road map in the AI side, that's one of the major drivers for the operating income coming down slightly. On the gross margin side, going back to your question, we said in the past and we continue to believe the case is. Data center GPU gross margin over time will be accretive to corporate average, but it will take a while to get to the server level for gross margin.”
  • GAAP net margin was 2%, an improvement from (1%) in the year ago quarter but down from 11% in Q4. Adjusted net margin was 19%, unchanged from Q4 and up slightly from 18% in the year ago quarter.
  • For Q2, management guided adjusted gross margin of 53%, implying a 100 bp QoQ and 300 bp YoY expansion.
  • For Q2, adjusted operating margin is expected to be ~21% given management’s guidance for $1.8 billion in operating expenses.

Cash and Debt:

AMD’s cash flow improvements stood out in Q1’s in line report, as the company drove significant double-digit sequential growth in cash flows and margin improvements.

  • Operating cash flow was $521 million in Q1, an increase of 7.2% YoY and 36.7% QoQ. Operating cash flow margin was 10%, a 300 bp sequential improvement.
  • Free cash flow was $379 million in Q1, an increase of 15.5% YoY and 56.6% QoQ. Free cash flow margin was 7%, a 300 bp sequential improvement.
  • AMD reported cash and equivalents of $6.04 billion.
  • Debt was unchanged at $2.47 billion.

Earnings Call:

AMD’s AI Revenue Ramp: Glass Half-Full or Glass Half-Empty

AMD is an interesting case of is the glass half-full or is the glass half-empty. Interviews like this one, from an analyst that closely follows the stock, would cause you to believe the glass is half-empty. From the reaction after hours, it would be hard to tell that the primary segment reported 80% YoY growth and is expected to grow strong double digits sequentially.

My take is that the glass is 30% full and will likely exit the year half-full. Per the call, one analyst’s math is for $900M in GPUs next quarter. If we take $2.4 billion for the DC segment this quarter and assume strong double-digit growth, that puts us at a $3B data center segment next quarter (roughly). If this analyst’s math is correct, this means within two quarters of shipping; GPUs will be 30% of DC segment in Q2. I can’t think of another company that has ramped this fast outside of Nvidia. Broadcom has had ASICs revenue for years from Google’s TPUs (maybe 2018-ish) so we aren’t looking at as fast of a ramp there.

AMD is in Nvidia’s shadow with GPU revenue, and understandably so, given Nvidia is commanding a $80B annual data center segment (on its way to a $100B segment). Therefore, AMD stock is up against some hefty investor psychology with its tiny $10B segment (roughly).

However, if we zoom-out, sometime in 2025, CPU revenue will be eclipsed by GPU revenue. We were looking at about a $1.7B-ish segment on CPUs prior to the MI300 release for the Frontier supercomputer in Q4. Whenever GPUs exceed $7B in revenue, they will have officially passed up AMD’s CPUs, which took almost 10 years to build that kind of revenue (first gen EPYC was released in 2014). Meanwhile, AMD’s CPU trajectory resulted in 1700% gains in stock price due to flawless execution against Intel. Meaning, that was a breathtaking 10 years.

Now, I’m not saying this will translate to the exact same gains as the CPU comeback story — but by my estimation, doing what took 10 years in as brief as 2 years (with a long runway to go) should translate to something.

$4B in AI Revenue but Vague as To the Exit Rate

Management left room for a higher exit rate this year in terms of AI revenue. There was nothing said concretely but there were some subtle hints that we will hear a higher exit rate in the coming quarters. This was the most pointed discussion in that regard:

Question
Vivek Arya (Analysts)

Lisa, I just wanted to go back to the supply question and the $4 billion outlook for this year. I think at some point, there was a suggestion that the $4 billion number, right, that there are still supply constraints. But I think at resent point, you said that you have supply visibility significantly beyond that. Given that we are almost at the middle of the year, I would have thought that you would have much better visibility about the back half. So is the $4 billion number of supply constrained number? Or is it a demand constrained number? Or relatively, if you could give us some sense of what the exit rate of your GPU sales could be. I think on the last call, $1.5 billion was suggested. Could it be a lot more than that in terms of your exit rate of MI for this year?

Answer
Lisa Su (Executives)

Yes. Vivek, let me try to make sure that we answered this question clearly. From a full year standpoint, our $4 billion number is not supply capped — I'm sorry, yes, it's not supply cup. It is — we do have supply capability above that. It is more back half weighted. So if you're looking at sort of the near term, I would say, for example, in the second quarter, we do have more demand than we have supply right now, and we're continuing to work on pulling in some of that supply. By the way, I think this is an overall industry issue. This is not at all related to AMD. I think overall, AI demand has exceeded anyone's expectations in 2024. So you've heard it from the memory guys. You've heard it from the foundry guys. We're all ramping capacity as we go through the year. 

And as it relates to visibility, we do have good visibility into what's happening. As I said, we have great customer engagements that are going forward. My goal is to make sure that we pass all of the milestones as we're ramping products. And as we pass those milestones, we put that into the overall full year guidance for AI. But in terms of how customer progression things are going, they're actually going quite well, and we continue to bring new customers on and we continue to expand workloads with our current customers. And so hopefully, that clarifies the question, Vivek.

The Concerning Rumor about Microsoft:

No doubt, the main thing that needed to be cleared was the Microsoft rumor that we detailed in our pre-earnings report. I agree and appreciate the tone of this question, as there is never-ending noise with AMD, and am quoting it in full:

Question
Matthew Ramsay (Analysts)

I appreciate that, Lisa. As my follow-up, a little bit shorter term. And I guess having followed the company super closely for a long time. I think there's been — there's always been noise in the system from whether the stock price is $2 a share or $200, there's been kind of always consistent noise with the other. But the last 1.5 months has been extreme in that sense. And so I wanted to just — I got random reports by inbox about changes in demand from some of your MI300 customers or planned demand for consuming your product. I think you answered earlier about the supply situation and how you're working with your partners there. But has there been any change from the customers that you're in ramp with now or that you soon will be of what their intention is for demand? Or in fact, has that maybe strengthened rather than gone down in recent periods because I keep getting questions about it?

Answer
Lisa Su (Executives)

Sure, Matt. Look, I think I might have said it earlier, but maybe I'll repeat it again. I think the demand side is actually really strong. And what we see with our customers and what we are tracking very closely is customers moving from, let's call it, initial POCs to pilots to full-scale production to deployment across multiple workloads. And we're moving through that sequence very well. I feel very good about the deployments and ramps that we have ongoing right now. And I also feel very good about new customers who are sort of earlier on in that process. So from a demand standpoint, we continue to build backlog as well as build engagements going forward. And similarly, on the supply standpoint, we're continuing to build supply momentum. But from a speed of ramp standpoint, I'm actually really pleased with the progress.

–End quote

My take is that all corporate executives are trained to smooth things over, so we can’t tell from this answer if Microsoft truly canceled orders to some effect or not. But the overall message is that demand outstrips supply.

Conclusion:

If I were to guess, we are hitting up against valuation concerns which are being waved off with conversations on CNBC and elsewhere that AI revenue isn’t materializing fast enough. This simply isn’t true.

However, AMD is expensive — all semis are expensive — and we’ve been here before. This is not our first rodeo when the market doubts a company and comes up with outlandish narratives when it simply hits a valuation ceiling.

Seeing the forest through the trees is important because we need to put our ducks in a row on how to manage our portfolio given these valuations are high, yet these stocks are driving forward a massive market unlike anything we’ve seen before (compare EPYC CPUs ramp to Instinct GPUs ramp — it’s very clear we are in unchartered territory with the growth of AI).

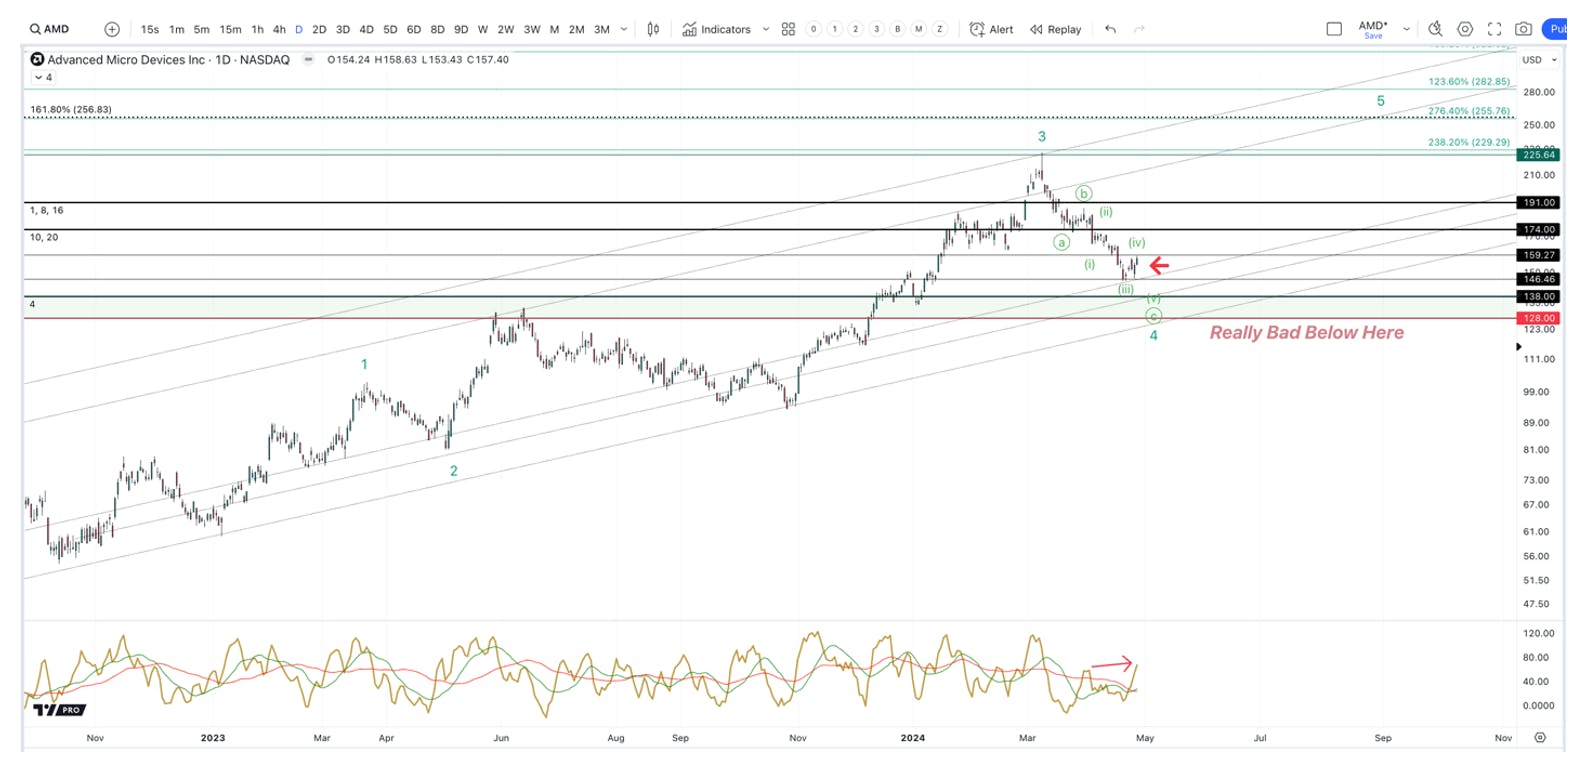
A few weeks ago (and again after hours), AMD retested and broke support for the bullish count of $158. We are looking for AMD to hold $138 and will likely add here. Notably, a break below $128 is more concerning but this report should be enough to avoid that scenario. We will keep you updated in our weekly webinars and with real-time trade alerts as we carefully manage this high-conviction position.

Recommended Reading:
Super Micro FYQ3: Cash is the Achilles Heel

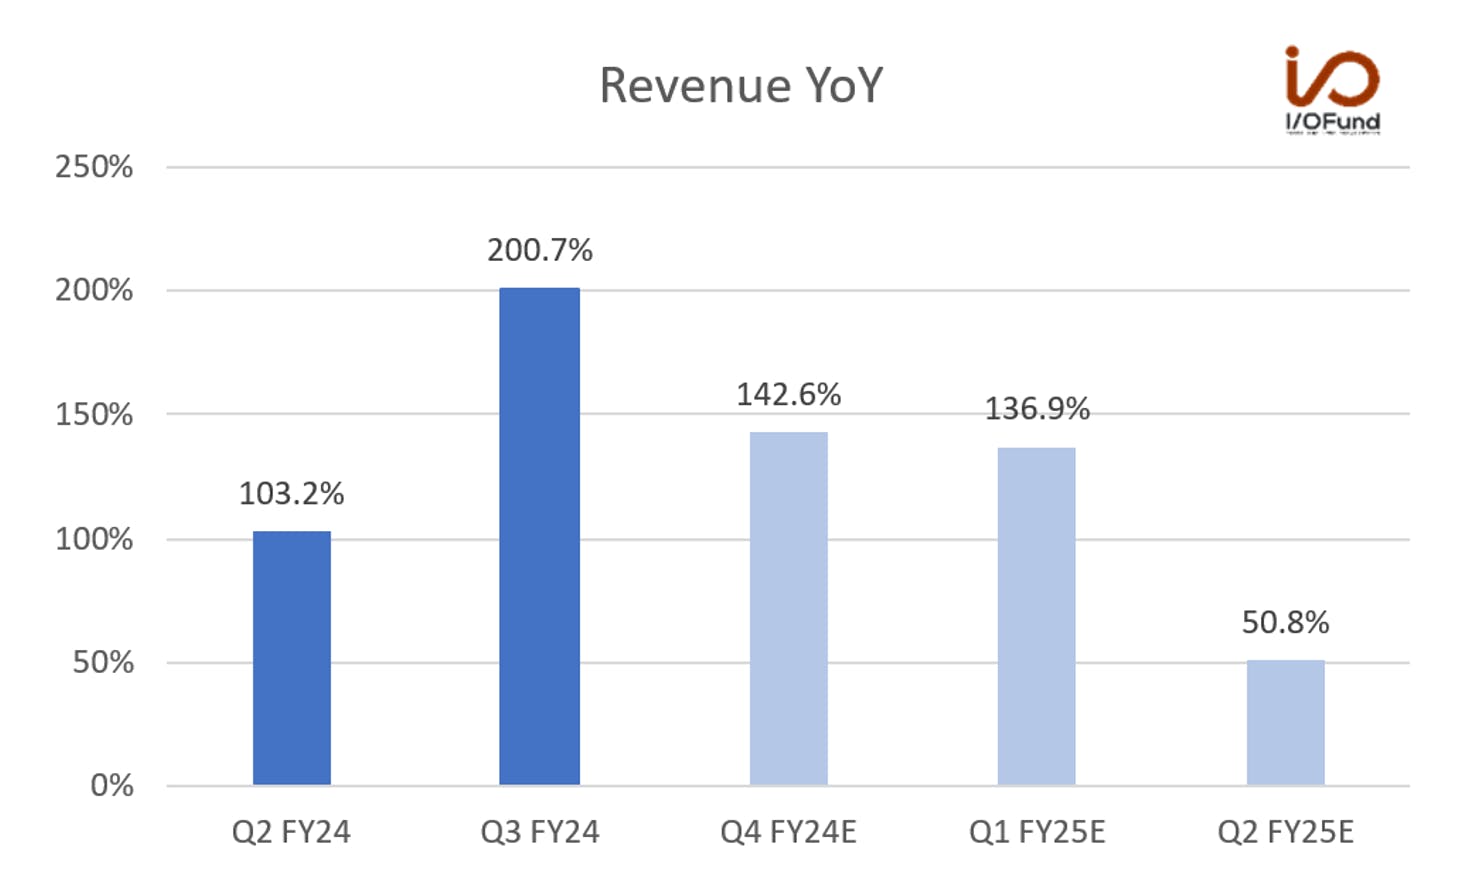
This quarter, Super Micro reported revenue of $3.85 billion, reflecting a staggering growth rate of 200.7% YoY. This technically missed estimates by 1.3%. Management increased guidance to between $5.1 billion to $5.5 billion, up from $4.9 billion, indicating year-over-year growth of 142.6% at the midpoint.

The company's GAAP EPS of $6.56, surpassed analyst expectations of $5.16. Next quarter, the expected GAAP EPS ranges from $7.20 to $8.05 compared to analyst expectations of $6.87 EPS.

What lies beneath this phenomenal growth rate is the need to raise cash to fund operations, which for Super Micro means buying excess inventory to prepare for future growth, especially as it relates to liquid cooling. Inventory of $4.1 billion amounts to 85% of revenue, whereas SMCI held closer to 70% of revenue in the past.

This quarter, the operating cash flow margin was (-39.5%) and the free cash flow margin was (-42%). This is a material change to the story given the current macro environment, and management did not indicate it will get better in the near-term as it’s related to components for liquid cooling systems. Per management: “We continue to face some supply chain challenges due to newer products that require new key components, especially, specifically, DLC related components, and believe this situation will gradually improve in the coming quarters.”

Revenue and EPS

For the third quarter of fiscal year 2024, Super Micro reported revenue of $3.85 billion, up $2.57 billion, or 200.7%, compared to $1.28 billion for the same quarter in the previous year. This growth was slightly under the projected midpoint based on management’s previous guidance of revenue in the range of $3.7 billion to $4.1 billion.

For Q4 FY24, management is guiding for revenue in the range of $5.1 billion to $5.5 billion, representing YoY growth of 142.6% at the midpoint. This compares to analyst estimates for $4.9 billion and growth of 124% going into the print.

There is a drop off in Q2 FY25, which is calendar year Dec 2024, and hopefully revisions flow through to increase this growth rate. It may seem far off, but this is a high beta stock that sees volatile price action based on signs of weakness or strength.

Management raised full year revenue growth to 109.3% for revenue of $14.9 billion. This is up from guidance for revenue of $14.5 billion last quarter.

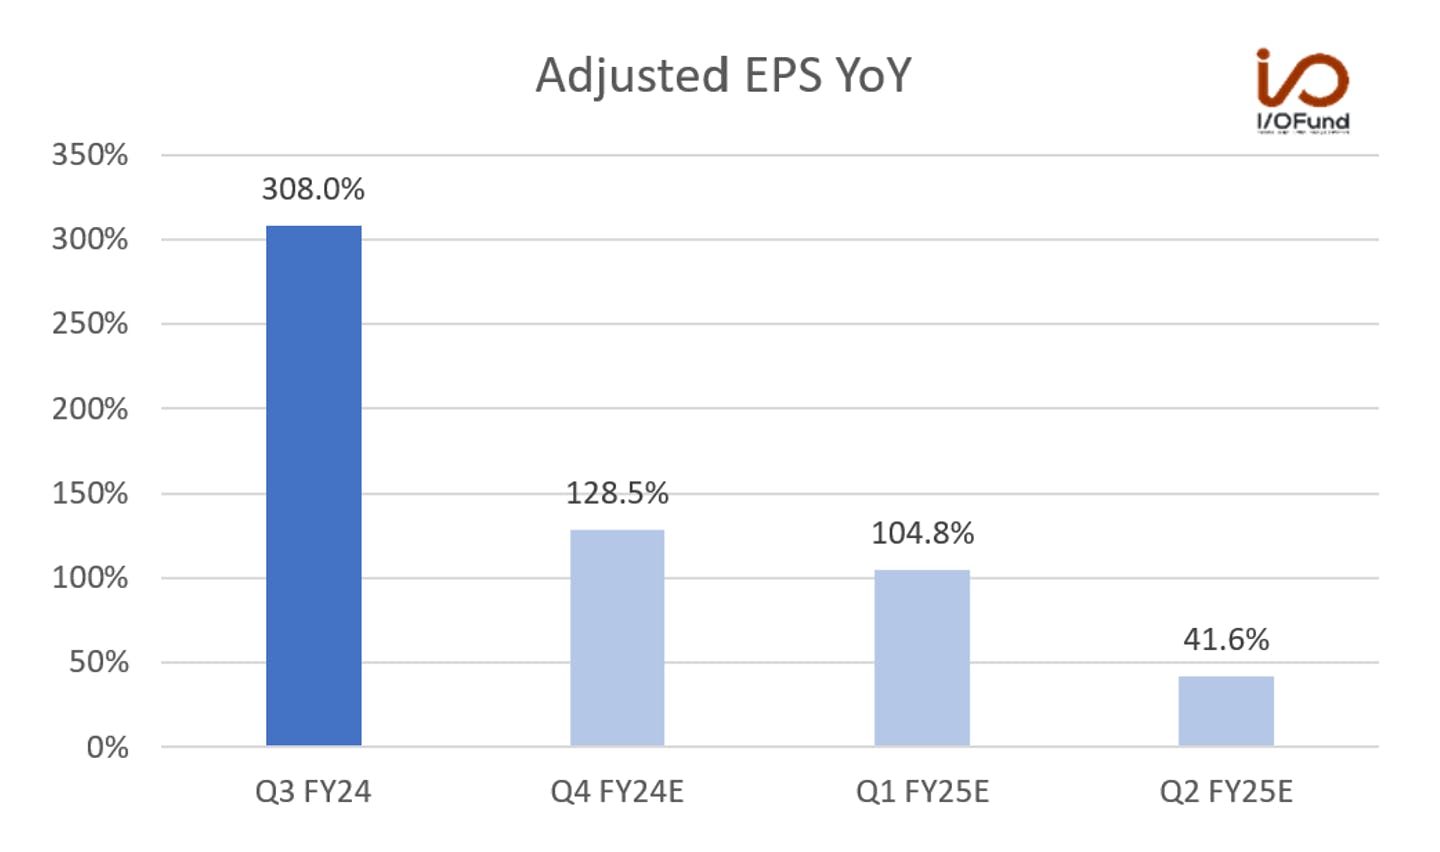
SMCI also established full year GAAP EPS and non-GAAP EPS guidance for FY24. GAAP EPS is guided to $21.61 to $22.46, compared to GAAP EPS of $11.43 for FY23. This would mark a 92.9% increase YoY at the midpoint of guidance. Management expects non-GAAP EPS to be in the range of $23.29 and $24.09 for FY24. This would be YoY growth of 100.6% at the midpoint compared to FY23 non-GAAP EPS of $11.81.

GAAP EPS for March was $6.56 compared to analysts’ consensus of $5.16. This is 28.6% higher sequentially with $5.1 GAAP EPS in the previous quarter and is 328.8% growth from the year-ago quarter. Adjusted EPS was $6.65 for similar YoY and QoQ growth.

Looking forward, next quarter’s GAAP EPS is expected to be between $7.20 and $8.05 for over 122.3% growth from the year-ago quarter. Adjusted EPS of $8.02 at the midpoint will see similar YoY growth. This compares to analyst estimates of $7.16.

Margins

  • Gross margin was 15.5% in Q3 for gross profit of $597.4 million. The company is guiding to a lower gross margin next quarter. An analyst on the call implied it would be 13.5% to 14% next quarter.
  • Operating margin was 9.8% for operating profit of $378.3 million and adjusted OPM was 11.3%.
  • Net margin was 10.5% for net profits of $402.5 million. Adjusted net margin was 10.7%.

Adjusted gross margin was 15.6% for Q3, improved slightly QoQ from 15.5%, however, adjusted gross margin was down 210 bps YoY compared to 17.7% in the same quarter a year ago. On the adjusted gross margin declines, management stated it is due to product/customer mix and focus on market share gains.

Note: Margins on SMCI tend to be thinner than most semiconductors, which is a key topic of analysts’ focus during each earnings call. The CFO has stated the target margin is between 14% and 17%.

Cash Flow and Balance Sheet

Cash flow used in operations for Q3 was $1.5 billion compared to cash flow usage of $595 million during the previous quarter as the company grew inventory and accounts receivable for higher levels of business.

Cash flows from strong profitability was offset by higher Inventory, a large portion of which was received late in Q3, and higher Accounts Receivable from increasing revenues. The Q3 closing inventory was $4.1 billion, which increased by 67% QoQ from $2.5 billion in Q2 due to the purchase of key components. Capex was $93 million for Q3 resulting in negative free cash flow of $1.6 billion for the quarter.

On its balance sheet, the company reported $2.12 billion in cash and cash equivalents and $1.86 billion in debt, up from $726 million in cash and debt of $376 million in the previous quarter. Consequently, the net cash position stood at $260 million, declining from $350 million in the last quarter.

During the quarter, SMCI announced a $1.5 billion principal amount of convertible senior notes that will be due in 2029. The company also announced a public offering of common stock as SMCI raises capital to support operations, including purchases of inventory and other working capital needs, manufacturing capacity expansion and increased R&D investments.

Key Metrics:

Server and Storage Systems & Subsystems

  • Server and storage systems were $3.7 billion in revenue for growth of 218% YoY and was 96% of Q3 revenue.
  • Subsystems and Accessories were $152 million, up 27% YoY and was 4% of Q3 revenue.

Vertical Markets

  • OEM Appliance & Large DC: 50% of total revenues, down from 59% last quarter and up from 47% a year ago.
  • Organic (Enterprise & Channel), AI/ML: 49% of revenues, increasing from 40% of revenues last quarter, and slightly down from 50% of revenues a year ago.
  • 5G, Telco & Edge/IoT: 1% of revenues, flat compared to last quarter and down from 3% of total revenues a year ago.

According to the CFO: “One existing CSP large data center customer represented 21% of Q3 revenues and one existing enterprise channel customer represented 17% of revenues.” This compares to last quarter’s customer concentration of 26% and 11%, respectively.

Inventory:

Inventory days increased to 92 days compared to 67 days in the previous quarter. The company’s Q3 closing inventory was $4.1 billion, which increased by 67% quarter-over-quarter from $2.5 billion in Q2 due to the purchase of key components.

This was asked about on the call and we detail it for you below. It’s also reflected in the steep, negative operating cash flow reported this quarter.

Geography:

All revenues were up by a wide margin QoQ.

  • United States was 70% of revenue, and increased 242% YoY and 3% QoQ.
  • Asia was 20% of revenue, and increased 257% YoY and 17% QoQ.
  • Europe was 7%, and increased 30% YoY and 3% QoQ
  • ROW was 3%, and was up 87% YoY and was down 11% QoQ
  • China accounted for 1% of total revenue.

Earnings Call:

Inventory increase:

The inventory days increasing doesn’t entirely explain the steep $4.1 billion in inventory. Rather, the company has to hold more inventory while waiting for key components related to liquid cooling. This is out of character for Super Micro to hold this much inventory and this will not be comfortable for the Street to accept given the company has diluted shareholders and raised debt in the past quarter.

Question
Aaron Rakers (Analysts)

Yes. I'll try and slip in 2 here, if I can. So I guess one of the just kind of housekeeping questions is a very significant increase in inventory this quarter. I know you said that it came in towards the end of the quarter. How do we think about the trajectory of inventory as the supply comes on? Do you expect inventory to stay at this level? Do you expect it to start to come down? I'm just kind of curious how we think that flow through kind of looks as you take on more supply […]

Answer
Charles Liang (Executives)

Two reasons we had to increase inventory: One is because Q4, I mean, June quarter, we will have a strong revenue growth; a second reason because we're preparing for high-volume liquid cooling. Again, we have more than 1,000 of 100k watt, I mean, liquid cooling rack we have to ship to customers in Q4. And liquid cooling as you know, is pretty new. So we had to prepare enough inventory so that we can deliver liquid cooling rack scale product to customer on time or with minimal lead time. So both factor, indeed, is a positive factor. And with our economic scale continuing to grow, indeed, our inventory average [ daily ], indeed, will slightly improve.

Answer
David Weigand (Executives)

Yes. So Aaron, my take on that is I hope that our inventory continues to grow because that means there's a reason behind it, so — and it's tied to sales. 

–End quote

Here was another discussion around the inventory levels:

Question
Nehal Chokshi (Analysts)

Congrats on a strong guide here. Talk about the guide here. Inventory increased $1.5 billion Q-over-Q. And Dave, as you mentioned, you'd like to see inventory increase. I do too because it's a strong indicator of things to come. And you guided June quarter to increase by $1.6 billion Q-over-Q. If I do this math, where I'm looking at the inventory at the quarter end and then the [ fourth ] quarter revenue, typically, it's around 60% to 70% of revenue. But with your March Q ending inventory and your current [ June, too, ] guidance, that equates to about 85% of projected revenue. So can you just explain what seems to be a little bit more usual inventory buildup given the revenue guidance range?

Answer
David Weigand (Executives)

Sure. Absolutely. That's a fair question. So we actually got a substantial amount of inventory in the last week of the quarter, okay, which obviously, we're not going to be able to ship, but we took in $700 million in the last week of the quarter. So that's not something — that's something that has to do with when inventory arrives. And so we — it hurts our cash flow, but you know what, it doesn't matter, because we need that inventory for Q4 shipments.

Answer
Charles Liang (Executives)

Yes. Again, 2 reasons, right? Q4, we will have a strong revenue, so we had to prepare for Q4. And also, I mean, liquid cooling, I mean, it's new. So we had to prepare enough safety inventory for liquid cooling demand for June quarter and September quarter as well. So that's another reason why we have a slightly higher inventory now.

Answer
David Weigand (Executives)

Yes. And I want to add, Nehal, that, that's exactly why we did capital raises, too, is to prepare for these Q4 shipments, and — so that we could make those large purchases, and we hope to continue that.

–End Quote

Sequential Growth is the New Normal

My ears perked up on this comment, when the CEO was asked if they are capable of future sequential growth:

Answer
Charles Liang (Executives)

Yes. As you know, traditionally, in the last 10 years, right, I mean, the September quarter and March quarter, always our soft quarter. But now with AI, we've been growing so strong. So we basically are able to grow sequentially. So although March and September be a little weak, but basically, because of strong AI growth and our market share growing, so the sequential growth will become the normal. And basically, I mean, we have even better technologies than before ever, and now economic scale become much bigger. Malaysia campus production will be ready by end of this calendar year, so we see a lot of positive factors to grow our business.

–End Quote

SMCI Likely to Raise more Capital

This is likely the comment that caused the stock to go down 10% AH despite the strong beat and raise. An analyst asked the CFO if he foresaw a need to raise more capital. Here was his reply:

Answer
David Weigand (Executives)

Yes. So the way I would answer that is, is that I hope that I have — I need more capital, Jon, because that means that we're booking — that we're growing revenues even faster. So we've got capital adequate to get us through the current market, which means today. But in a week, that — we hope that, that changes, and we hope that we've got orders that require even more capital. So all I can say is I hope that — I'm hoping for the need for more capital.

Answer
Charles Liang (Executives)

Yes. We believe our revenue will continue to grow strong. And that's why we need more capital to grow faster. If we grow 20%, 30%, we may have enough capital now, but it will grow much faster. Then for sure, we need more capital to grow stronger.

–End Quote

My comment: this is not what the market wants to hear right now, which is that you have to raise capital to fund growth. Supermicro is an incredible company situated perfectly between hyperscalers and the world’s best design companies. However, this is not the right macro environment to need to raise capital. Not even an AI bullet train can change those facts.

Conclusion:

There is no doubt, we rode a phenomenal wave with Supermicro over the past few months. The comment that sequential growth will be the new norm is music to our ears, as growth investors. However, we can’t fight the Fed. This is a good time to put the surf board down for a little while and let the next wave gather strength before we attempt Supermicro again.

In our pre-earnings writeup, I had stated: “it’ll be negative cash flow margins and/or dilution that penalizes the stock,” as well as: “The stock seems to be on a never-ending winning streak, however, what could be Super Micro’s Achilles heel is the cash issue — as the company must grow capacity to keep up with the revenue growth, yet to do so will require cash.”

If it were just about inventory, to where the shipments came in late in the quarter but was spoken for the following quarter, then that would not be an issue. From this report, the concern is the large appetite the company has to raise more cash to support growth. The tie-up on inventory for the direct liquid cooling components is an additional concern but it’s the primary issue around having to raise more cash that ultimately doesn’t meet our criteria at this time.

As you are aware, Super Micro is a high beta stock and we plan to adhere to our line in the sand. The good news is that we’ve made sizable profits and plan to put those to work at lower levels.

Recommended Reading:
AMD Q1 Earnings Preview: $3.5B GPU Revenue is the Benchmark

AMD heads into its fiscal Q1 report with rather high expectations, after management raised FY2024 GPU revenue forecast by 75% last quarter to $3.5 billion plus. Earnings reports last week from Microsoft, Meta and Google reaffirmed a bullish outlook on AI infrastructure spending for 2024, with all three combining for at least $135 billion in capex this year, with management commentary signaling a bulk of that spend will go to data center infrastructure and GPUs.

Therefore, data center revenue and GPU commentary are in focus this report. Yet, it’s key to be objective, and to note for our Members that some analysts are toning down estimates on the data center. Given the channel checks that analysts can do on a company like AMD, the polarized nature of the commentary going into the print tomorrow is interesting. We include analyst commentary below.

As a reminder, just last quarter analysts were setting a very high bar with some pushing for a $6 billion GPU revenue guide for the full year. We are seeing as low as $4 billion and as high as $8 billion. This wide of a range on a key metric is highly unusual, — and investors should be aware, it’ll be nearly impossible for AMD to beat the high-end of the FY expectations for the data center in Q1.

Therefore, it’s important we come up with our own expectations, of sorts. Broadcom is in second place with $1.5B in AI revenue, or $6B annual run rate. Due to analysts muddying the water a bit here on what is reasonable for a Q1 discussion on the call tomorrow, I think a decent goal (and win) would be for AMD to have GPU revenue equal to 2023 data center revenue by the time we exit the year, which was $6B. This number is also in line with AVGO’s current AI revenue and is the midpoint of analyst estimates.

Revenue and EPS:

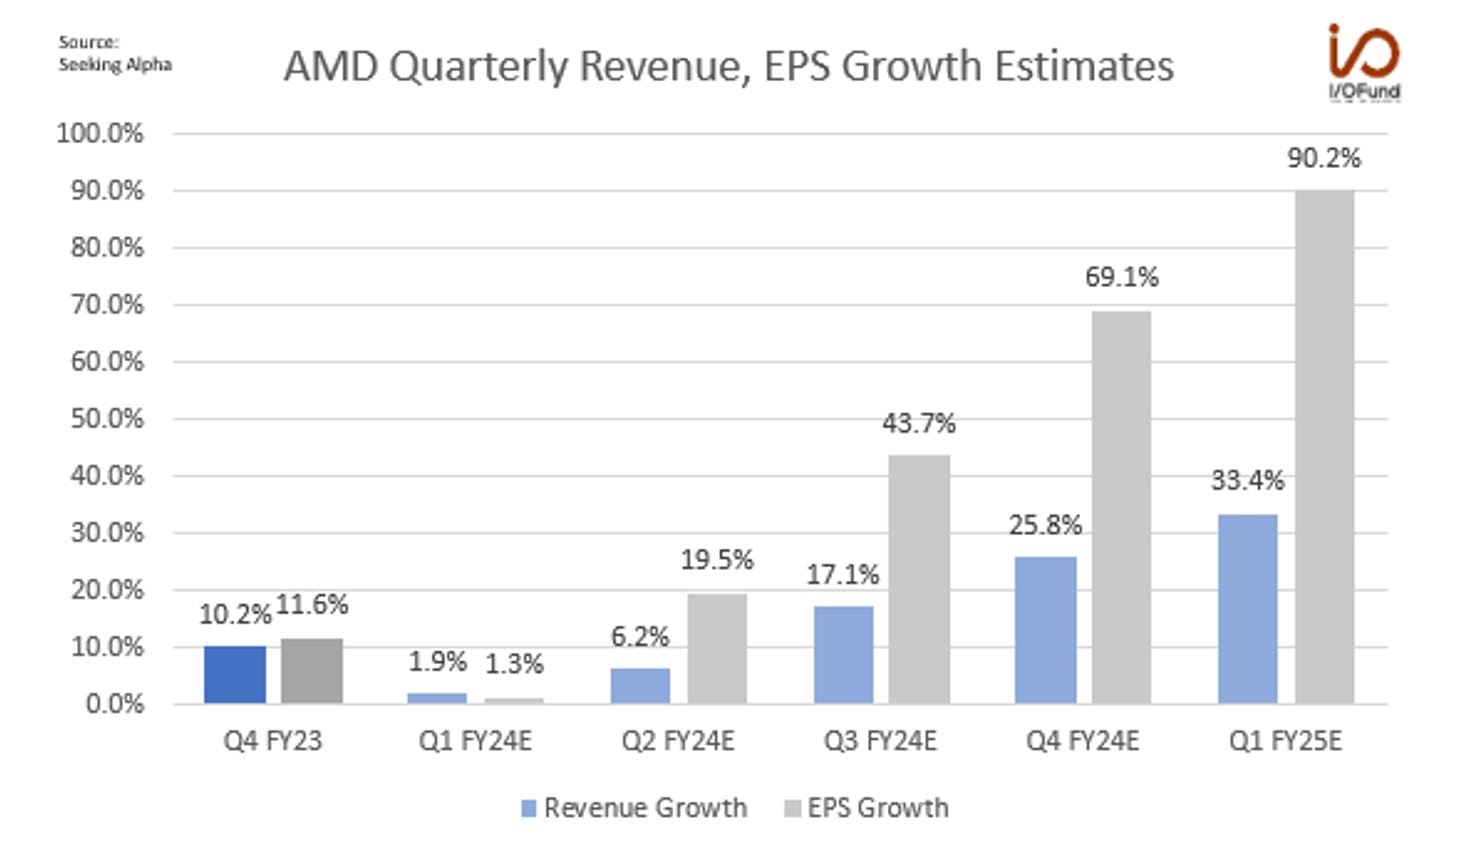
  • Q1 revenue was guided to be $5.4 billion, +/- $300 million, for YoY growth of approximately 0.9% and a QoQ decline of (12.5%). Analysts are expecting slightly higher revenues of $5.45 billion for YoY growth of 1.9%. As you can see above, Q1 should mark the bottom with a strong ramp into Q1 of next year.
  • Q1’s adjusted EPS is estimated to be $0.61, for YoY growth of 1.3%. Adjusted EPS growth is expected to accelerate to 90% by Q1 of next year.

Q2’s guide will be important to track. Susquehanna noted Monday, after lowering its price target, that it is “expecting in-line to slightly weaker guidance as Server/PC/XLNX/Gaming continue to weigh.” Q2 revenue is currently estimated to be $5.69 billion for YoY growth of 6.2%.

Key Segments:

Data Center: AMD guided for Q1 data center revenue to be approximately flat QoQ, implying revenues of $2.3 billion for YoY growth of ~77%. This is due to “a seasonal decline in server sales offset by a strong Data Center GPU ramp.”

Data center revenue, and more importantly, MI300 revenue is likely to be the most critical aspect of Q1’s report and Q2’s guide, as analysts are simultaneously resetting and increasing expectations for MI300 revenues in April. This will be discussed in more detail in the section “MI300 GPU Sales in Focus” below.

For the full year, management said “the largest incremental revenue opportunities are going to come from Data Center between both the server side gaining more share, and Data Center GPU side with the significant ramp up of our MI300.”

Client, Embedded, Gaming: AMD guided for Client, Embedded and Gaming segment sales to “decline sequentially, with semi-custom revenue expected to decline by a significant double-digit percentage.”

Margins:

Adjusted gross margin is guided to be 52% in Q1, a 120 bp QoQ expansion as data center mix increases.

Adjusted operating margin is expected to be 20%, a ~300 bp QoQ contraction and the lowest level in three quarters. However, data center operating margin has expanded significantly over the past two quarters, from 19.1% in Q3 to 29.2% in Q4. For context, DC generated $666 million in operating income in Q4, up 118% QoQ and the most of any of AMD’s segments.

CFO Jean Hu shed more light on both the trajectory of margins and DC margin in Q1 and the rest of the year:

We guided the Q1, 120 basis points higher than Q4 sequentially, primarily because the higher Data Center contribution actually more than offset the decline of Embedded business in Q1. Going forward, the way to think about it is as you said is the major driver is going to be Data Center business is going to grow much faster than other segment. That mix change will help us to expand the gross margin nicely. I think you also are spot on, the Embedded coming back in second half, which will be a tailwind. With the Data Center GPU, we are at the very early stage of ramp. We are improving testing time yield and continue to expand gross margin and we expect to be accretive to corporate average. So, those are all the tailwinds coming in the second half. I would say the headwinds side continue to be in the first half where we see Embedded business not only Q1 we see sequential decline, Q2 probably are going to be sequentially flattish versus Q1.”higher Data Center contribution actually more than offset the decline of Embedded business in Q1. Going forward, the way to think about it is as you said is the major driver is going to be Data Center business is going to grow much faster than other segment. That mix change will help us to expand the gross margin nicely. I think you also are spot on, the Embedded coming back in second half, which will be a tailwind. With the Data Center GPU, we are at the very early stage of ramp. We are improving testing time yield and continue to expand gross margin and we expect to be accretive to corporate average. So, those are all the tailwinds coming in the second half. I would say the headwinds side continue to be in the first half where we see Embedded business not only Q1 we see sequential decline, Q2 probably are going to be sequentially flattish versus Q1.”

Cash and Debt:

AMD reported operating cash flow of $381 million in Q4 for a margin of 6.1%, and FY23 OCF was $1.67 billion for a 7.4% margin. Free cash flow was $242 million in Q4 for a margin of 4%, and FY23 FCF was $1.12 billion for a 4.9% margin.

Operating cash flow growth is expected to unfold as one of the larger fundamental recoveries in 2024. Current estimates point to nearly 277% YoY growth in OCF to $6.28 billion, or a margin in the 24% range based on current revenue estimates of $25.7 billion for the year.

AMD has $5.77 billion in cash and equivalents on hand, and total debt of $2.47 billion.

MI300 GPU Sales in Focus

As noted earlier, AMD’s MI300 GPU revenue outlook for the full year will be the most important data point coming out of Q1’s report, after AMD increased its outlook by 75% last quarter.

Analysts are hinting towards possible weakness in Q1 due to rumors of Microsoft cutting some orders, though other analysts are expecting full year GPU revenue of $8B, more than double AMD’s guide. This is setting up an interesting scenario in which even if AMD surprises with better-than-expected GPU revenue in Q1, the full year picture may still disappoint against outsized expectations for $4.5B+ all the way to $8B.

Here’s some recent analyst commentary and updated expectations for GPUs:

  • Susquehanna analyst Christopher Rolland said it is likely that “upward revisions to the MI300 are ‘necessary’ for the stock to move higher, especially as investor sentiment has cooled” following Nvidia’s GTC conference. “Buy-side expectations for the MI300 are as high as $8B, while Rolland estimates revenue from the MI300 for this year at around $5B.”
  • Deutsche Bank “believes the most anticipated aspect of the quarter will be any update to the company's 2024 outlook for MI300 revenues. On this metric, it thinks buy-side expectations have recently fallen on the back of suspected order cancellations by Microsoft, which are yet to be substantiated, but still are likely at a minimum of $4B.”
  • TD Cowen is expecting strength in the data center and “increased its MI300 2024 revenue estimate to $4.5B from $4B, saying ramps at several customers will continue to happen more quickly than typical.”
  • HSBC says that “market expectations for the company's MI300 2024 and 2025 revenue have been reset,” but thinks AMD “has enough supply capacity and demand to surpass management's artificial intelligence revenue guidance” for the year.
  • Baird believes “MI300X orders have been cut by a U.S. hyperscaler recently,” saying that the “magnitude of the initial order suggests it was a multi-year agreement, but it does not know whether the cut is due to market share shift or the hyperscaler scaling down to numbers more in line with shipment expectations.” Baird also “continues to believe there is ‘comfortable upside’ in AMD's artificial intelligence revenue guidance for this year, based on high-bandwidth memory order visibility.”
  • Wells Fargo analyst Aaron Rakers says the “focus on AMD is squarely on upside related to its MI300X accelerator chips,” and sees “a path towards AMD generating $8B in revenue from the MI300 (up from $3.5B to $4B), and wonder if there is a recovery in the traditional server market and an ‘underappreciated’ story in market share gain.” Rakers adds that concerns over Microsoft’s order cuts are “too narrowly cited."

While rumors for Microsoft’s order cuts are yet to be substantiated, there are further notes discussed on the site Tom’s Hardware that Microsoft is reportedly able to purchase MI300 GPUs at a 33% discount, at approximately $10,000 per GPU compared to a $15,000 price tag for other customers. This could present a margin headwind in Q1 should Microsoft account for a majority of GPU shipments in the quarter due to the pricing discrepancies.

In the bigger picture, to meet the lowest end of analysts’ GPU revenue estimates of $4 billion and $4.5 billion, AMD would need to boost its forecast by 15% to 30% — the question here is whether management has enough visibility after one quarter to confidently raise its full-year outlook to that extent after raising it by 75%.

Big Tech Capex Commentary

Capex commentary from Big Tech last week was directionally bullish, with Microsoft, Meta and Alphabet expecting to spend upwards of $135 billion this year, predominantly on AI infrastructure. This sets up a positive long-term picture for AMD to increase market share against Nvidia among the major hyperscalers, given AMD’s GPUs are available, can compete on performance, and undercut on price.

Microsoft increased its capex 80% YoY to $14 billion this quarter, and for the entire fiscal year, capex will increase approximately 50% YoY to more than $50 billion. Demand for Azure’s AI services is outpacing its capacity in the near-term, hence the need for Microsoft to accelerate spending to boost GPU supply.

Meta boosted its full year capex range to $35-40 billion, up from $30-37 billion, to build out AI infrastructure and support its internal AI roadmap. However, Meta’s Q1 capex was only $6.7 billion, implying that the bulk of this spend will hit in the second half of the year and accelerate into 2025. By the end of 2024, Meta is aiming to have 350,000 H100 GPUs and 600,000 total GPUs including H100 equivalents, leaving ~250,000 GPUs split between its custom processors and AMD’s MI300. Assuming AMD can capture 50% of that remaining 250K units, MI300 revenue to Meta may surpass $1.8 billion this year.

Alphabet’s capex rose 91% YoY to $12 billion in Q1, primarily for technical infrastructure – this capex spend was led by servers and followed by data centers. Management is expecting quarterly capex “to be roughly at or above the Q1 level,” implying a full-year capex around $50 billion.

Overall, the planned capex outlays and management commentary from the trio is ultimately bullish. Meta’s Q1 spend declined ~$300 million YoY, and was low compared to its full year forecast, and rumors for Microsoft’s order cuts can’t entirely be shrugged off. As such, there is a chance that Q1’s data center and MI300 sales come in light before finding strength in the back half of the year.

AMD Count and Game Plan

By Knox Ridley

This is the bullish count we’re following, and it’s the best interpretation higher given the price information. Here’s what we would guess based on the current technicals: we get a final drop into the $138 region, which will get bought, and then we push higher. If this is going to happen, we must hold $128. Below here and we could see a bigger drawdown take hold, as the below path higher will get invalidated.

Look at the red arrow in the chart above. That’s indicating a 3-wave bounce, which is usually corrective (suggesting lower). This is happening on momentum making a higher high with price making a lower high (common in downtrends). However, I think that what is missing is the final 5th wave lower before reversing. This is a very stretched downtrend pattern, so we should see a reversal soon.

Look for us to buy around $138 on a pullback or around $174 if we get a breakout. If price breaks below $128, we will risk manage the position. (Note: real-time trade alerts and weekly webinars reviewing IOF positions are offered for Advanced Members)

Insiders Activity

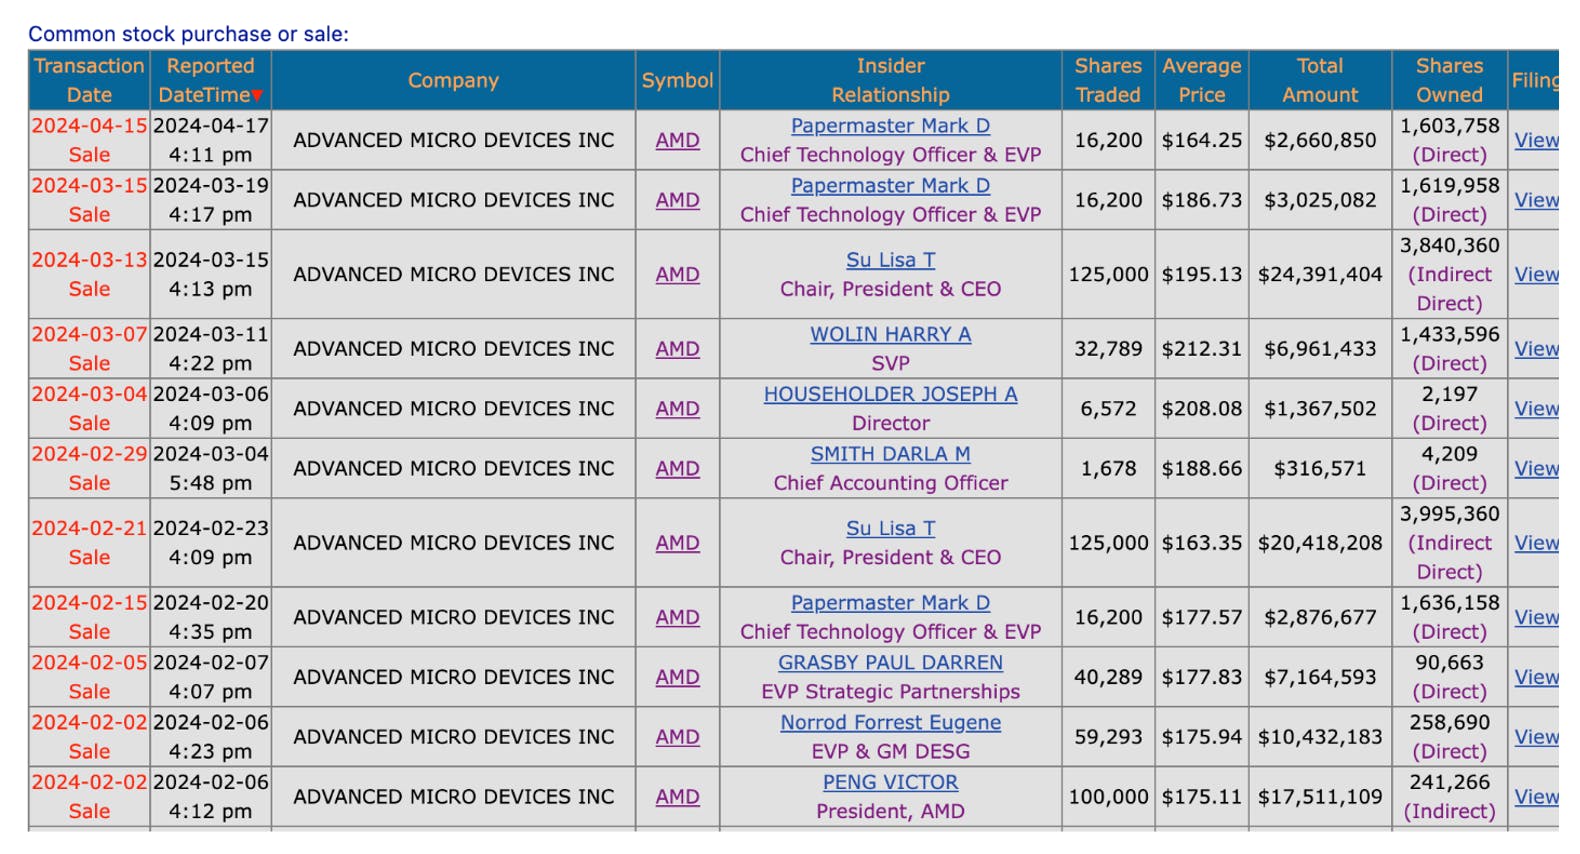
Since February of 2024, we’ve seen about $95M of insider sells. Lisa Su was about $50M of this total. Forrest Norrod and Victor Peng also had sales above $10M. The CTO sold about $8M. This is the largest cluster of sales since December of 2021. The synchronicity of four top tier execs, two on the same day, is not my favorite thing to see. We collect these details to help inform our decision if the stock should break a key level.

Conclusion

AMD’s Q1 report is one of the most highly anticipated reports of the quarter as the company is battling both lowered near-term estimates and heightened long-term expectations for GPU revenue. Analyst estimates on MI300s range from $4 billion to $8 billion.

AMD’s fundamentals are expected to improve throughout the year as data center sales accelerate, with operating cash flow growth of nearly 277% on top of an acceleration in EPS growth to the 90% range by the first quarter next year. We’re continuing to track Big Tech’s capex for signs on AI spending, and so far, there’s indications that spend will continue to increase for multiple quarters, leaving time for AMD to gain share.

Analyst estimates are showing a sizable rebound in H2. Let’s see what management says. Stay tuned for our post-earnings report in your inboxes tomorrow night.

Damien Robbins, Equity Analyst for the I/O Fund, contributed to this analysis

Recommended Reading:
Super Micro Q3 Pre-Earnings: Puts and Takes for the AI Bullet Train

In our last write-up, we called Super Micro the “AI Bullet Train” due to neck-breaking growth rates. Last quarter, the company reported a notable 103% year-over-year growth, with revenues surging to $3.66 billion. Management's projections are for nearly double the growth, anticipating Q3 revenues to range between $3.7 billion and $4.1 billion, or growth of 204.7% year-over-year at the midpoint. Consensus estimates are for $3.92 billion, for 206.3% growth expected in tomorrow’s print.

Such predictions underscore a consistent upward revision in earnings guidance, reflecting anticipated strong growth for the remainder of the fiscal year and extending into 2025.

To understand how we got here, it was through multiple analyst revisions. For example, the March quarter started with estimates of $2.1 billion in August for growth of 45% but were revised by 160 points (!) to $3.92 billion for growth of 205.7%. The June quarter was seen upward analyst revisions increase by 92 points, and the September quarter’s numbers revised by 82.7 points in the span of one quarter!

Here's what that looks like:

The takeaway is that Super Micro’s bullet train-like price action is based on upward revisions, which is unique from earnings beat/raise or simply strong estimates. In fact, the stock was down (-12%) following its last earnings report and is now up 80% since that call with gains as high as 135%. This is a stock that does not rely on earnings pops, like most growth stocks, and rather, it requires a bit of tenacity as the intra-quarter changes have been quite profitable.

With that said, below is a deeper look into SuperMicro, including the underlying factors contributing to these impressive figures ahead of tomorrow’s Fiscal Q3 results and the risks that accompany this high beta stock.

Revenue and EPS

Last quarter, the company’s Q2 FY2024 revenue grew by 103% YoY to $3.66 billion. Management Q3 guidance is in the range of $3.7 billion to $4.1 billion, representing YoY growth of 204.7% at the mid-point. The consensus analysts’ estimate is $3.92 billion, representing a YoY growth of 206.3%. The guidance has increased consistently through recent months as strong growth is expected for the remaining quarters of the fiscal year and into 2025.

The drop off in Q2 FY25, which is calendar year Dec 2024, will be key to keep an eye on following this earnings report. It may seem far off but this is a high beta stock that gets slammed on any weakness. The opposite can also happen, which is that we see more revisions which supports the price action extending, as outlined in the introduction above.

Fiscal year estimates were revised upward over the past year by 87.8 points for growth of 105.5% and revenue of $14.6 billion. This is higher than the midpoint of management guidance for revenue of $14.5 billion, at the midpoint. Next fiscal year ending June 2025 has been revised upward 33 points to 44% growth. We will be watching these estimates closely as we manage our position intra-quarter throughout the next few months.

GAAP EPS for December was $5.10 compared to analysts’ consensus of $4.90. This is nearly 80% higher sequentially with $2.85 GAAP EPS in the previous quarter and is 62% growth from the year-ago quarter. Adjusted EPS was $5.59 for similar YoY and QoQ growth.

Looking forward, next quarter’s GAAP EPS is expected to be between $4.79 and $5.64 for over 240% growth from the year-ago quarter. Adjusted EPS of $5.60 at the midpoint will see similar YoY growth.

Note: Normally, we’d be hesitant to see the slowing growth on both top line and bottom line pictured above as moving from hypergrowth to average growth tends to cause a re-rating in valuation. However, we’d like to see if SMCI will continue its pattern of seeing upward revisions given the strength of the AI trend.

Margins

  • Gross margin was 15.4% in Q2 for gross profit of $564.4 million
  • Operating margin was 10.1% for operating profit of $371.5 million and adjusted OPM was 11.3%
  • Net margin was 8% for net profits of $295 million. Adjusted net margin was 9%

Adjusted gross margin was 15.5% for Q2, compared to 17% in Q1 and 18.8% in the same quarter a year ago. On the gross margin declines, management stated: “in order to take market share, we will take opportunities by being more competitive on pricing.”

The gross margins guide for Q3 is expected to be “slightly lower than Q2 levels.” This indicates another YoY and QoQ decline in gross margins if the management’s guide is correct. The goal is that margins will return to baseline once the company is operating at scale. However, it’s worth mentioning that stocks with thin margins tend to underperform in a Fed-driven market. This is one reason we will adhere to stops with SMCI.

Margins on SMCI tend to be thinner than most semiconductors, which is a key topic of analysts’ focus during each earnings call. The CFO has stated the target margin is between 14% and 17%.

Cash Flow and Balance Sheet

Operating cash flow reached (-$595) million, with a margin of (-16.2%). This performance contrasts with the positive margins of +12.8% and +9% reported in the September quarter and the June quarter, respectively.

The CFO explained that the cash outflow in operations for Q2, totaling (-$595) million, was a shift from the $271 million generated in the prior quarter. Despite robust profitability and an increased level of accounts payable, this was counterbalanced by a rise in inventory and accounts receivable, driven by preparations for Q3 and shipment timings in Q2.

Cash flow will be a primary focus on the call as any additional quarters that report negative free cash flow will force investors to price-in future stock dilution and cash raises. This line item can cause the stock to be re-rated should it continue to be weak.

Free cash flow was also negative at (-$610) million, representing a (-16.6%) margin, compared to positive margins of +12.7% last quarter and +8.4% in the corresponding quarter of the previous year.

On its balance sheet, the company reported $726 million in cash and $376 million in debt, up from $543 million in cash and net debt of $146 million in the previous quarter. Consequently, the net cash position stood at $350 million, slightly down from $397 million in the last quarter.

The company boosted its cash reserves with an equity offering. As stated by the CFO, the proceeds from the equity offering will be used to strengthen working capital, continued investments in R&D and expand global capacity.

Key Metrics:

In the latest quarterly financial update, the OEM Appliance and Large Data Center segment led the company's revenue streams, contributing $2.15 billion, which accounts for 59% of total revenue. This segment saw significant growth of 175% year-over-year and 83% quarter-over-quarter.

The Organic (Enterprise & Channel), AI/ML segment followed with $1.48 billion, making up 40% of the revenue and growing by 55% year-over-year, fueled by enterprise AI initiatives and CPU upgrade programs. The 5G, Telco, and Edge/IoT sectors, however, represented just 1% of revenue at $35 million.

In terms of the revenue mix, server and storage systems generated $3.4 billion and comprising 94% of the quarter's revenue, reflecting a year-over-year growth of 107%. Subsystems and Accessories contributed $229 million, accounting for the remaining 6% of revenue and marking a 61% increase from the previous year.

Inventory management improved, with inventory days reducing to 67 from 91 in the previous quarter, indicating a tightening of supply as noted by the management.

What to look for in the earnings report:

1) Declining margins are going to be a key focus of analysts.

Notably, Super Micro has weaker margins than Wall Street prefers and tend to be weaker amongst its peers. It’s no surprise when analysts pick up on this during the call and slide in a question or two on it.

Last quarter, there was a large revenue beat that did not flow through to a higher gross margin or operating margin, and in the following Q&A session, the CFO stated: “And so, at this time we are we are growing really quickly. And in order to do that and in order to take market share, we will take opportunities by being more competitive on pricing.” The CEO followed up with: “The good thing is that when we continue to grow our economies of scale, our operation margin indeed will be still able to keep in healthy position.”

2) Nvidia Relationship – Liquid Cooling Reaches Inflection with Nvidia’s B100s

Super Micro is primarily air cooled right now, yet liquid cooling is growing. Per the CEO in the opening remarks, we can expect major updates in the coming quarters on their progress: “By this June quarter, we will have high volume, dedicated capacity for manufacturing 100 kilowatt to 120 kilowatt racks with liquid-cooling capabilities, providing DLC, direct liquid cooling racks capacity up to 1,500 racks per month and our total rack production capacity will be up to 5,000 racks per month by then.” To read more on liquid cooling, reference our previous Super Micro analysis here.

3) Conservative Commentary by Management

This word, “conservative,” has been continually referenced by management in recent quarters. We hope to continue to hear the twelve-letter C-word from SMCI tomorrow evening!

David Weigand

“[…] And so really as Charles mentioned earlier, our only constraint is supply. However, the good news is, the supply is improving. And so, to your point, we have to be somewhat conservative, because we are constrained still by supply.”

Conclusion:

Despite facing declining gross margins, the firm's substantial year-over-year revenue and EPS growth underscore its product strength and positioning in a fiercely competitive environment. In case it’s not clear, Super Micro is an outlier and it all comes down to product differentiation, which you can read about here.

The stock seems to be on a never-ending winning streak, however, what could be Super Micro’s Achilles heel is the cash issue — as the company must grow capacity to keep up with the revenue growth, yet to do so will require cash.

Due to the high beta nature of Super Micro, I foresee us trying to ride this wave a few more times in the coming years. We will play this one with the understanding that volatility goes both ways, armed with the information that it’s the upward revisions that reward this stock (mainly intra-quarter), and it’ll be negative cash flow margins and/or dilution that penalizes the stock.

Overall, for our risk profile, entries in high beta stocks are accompanied by a strategy and with predetermined stops. You can read more about our line in the sand here along with upper price targets.

Chad Shoop, Equity Analyst for the I/O Fund, contributed to this analysis

Recommended Reading:
Microsoft Fiscal Q3 2024 Earnings: 80% YoY Increase in Capex; Azure AI is Hitting Capacity

Highlights this quarter include Azure’s growth of 31% up from 30% and 28% on CC basis last quarter. Of this, 7 points was from AI compared to 6 points from AI last quarter. The reason that Azure did not see more QoQ growth from AI is due to capacity constraints. In other words, Microsoft has higher demand than they have GPU supply. This is leading Microsoft to grow its capex 80% YoY from $7.8 billion in the year ago quarter to $14 billion this quarter. On a fiscal year basis, capex will grow 50% this year, and what this quarter proves, is that this high growth rate on already high capex spend is only accelerating.

Beyond Azure, management’s focus was on Copilot, which are tools that are not capacity constrained. There were many impressive statistics on Copilot that we share with you below. In addition to Copilot, Microsoft emphasized that security is their number one priority – “over anything else” – which was a good reminder for investors given AI takes up the majority of the time on the call. There were also some initial AI-powered PC stats from this ER that we share below, as well.

Microsoft has a knack for in-line reports. However, bookings and RPO were exceptionally strong this quarter. We detail this and more below.

Microsoft Fiscal Q3 Financials:

Revenue and EPS:

Fiscal Q3 revenue of $61.85 billion beat expectations by $960 million, driven by a 21% increase in Intelligent Cloud revenue and a 17% increase in More Personal Computing revenue. Azure growth was 31%, marking a continuation of the acceleration we’ve seen since the June quarter. Of this, AI drove 7 points. Per the CFO: “Azure and other cloud services revenue grew 31% ahead of expectations, while our AI services contributed 7 points of growth as expected.”

The company guided for Azure growth of 30% to 31% percent next quarter, which represents a management guide of flat growth QoQ.

Revenue and EPS:

  • Revenue of $61.85 billion beat estimates by 1.7%, representing YoY growth of 17% but a QoQ decrease of 0.3%.
  • For next quarter, management guided to $64 billion, which is under analyst estimates of $64.6 billion and lower mainly due to the rising US dollar.
  • GAAP EPS of $2.94 beat estimates by $0.11, representing YoY growth of 20%. Non-GAAP EPS of $2.94 beat estimates by $0.10.

Segment Revenue:

  • Productivity and Business revenue was $19.6 billion, up 12% YoY, driven by 15% growth in Office 365 Commercial. Growth came in 100 bp ahead of the midpoint of the guided range.
  • Intelligent Cloud revenue was $26.7B, up 21% YoY, driven by strong demand for server products and cloud services revenue from Azure and other cloud services revenue growth of 31%. This was a 260 bp acceleration from last quarter.
  • More Personal Computing revenue was $15.6 billion, up 17% YoY. Windows revenue increased 11% with OEM revenue growth of 11%, while devices revenue decreased (17%).

Guidance on Segment Revenue:

  • Productivity and Business revenue guided to $20.05 billion at midpoint for growth of 8.7% to 10.4% YoY. This would be a deceleration of 145 bps in growth rate, at the midpoint.
  • Intelligent Cloud revenue was guided to $28.55 billion at midpoint for growth of 18.3% to 19.6% YoY. This is a deceleration of 205 bps in growth rate, at the midpoint.
  • More Personal Computing revenue was guided to $15.4 billion at midpoint for growth of 9.4% to 12.2% YoY. This would be a deceleration from 17% growth on CC basis this quarter.

Margins:

Margins were strong across the board, topping management’s guide in gross margin, operating margin and net margin. Operating margin for Q3 was 45%, 210 bp above guidance, and a 270 bp increase YoY.

We’ve previously discussed how there may be room for continued operating margin expansion in Intelligent Cloud, but in this report, it was Microsoft’s More Personal Computing segment that experienced strong operating margin expansion, up 610 bp QoQ to 31.6% as the company shifted the sales mix to higher margin businesses.

One of the more bullish comments on the call was the CFO guiding full year operating margin to be up 2 points for FY2024. There was a note it would be down 1 point for FY2025 due to higher capex. Overall, Microsoft has done an excellent job maintaining margin strength.

  • Gross margin of 70.1% was up from 69.5% in the year ago quarter. The guide for next quarter is approximately 69.2%.
  • Operating margin was 45%, up from 42.3% in the year-ago quarter. Operating margin is guided for 42.3% next quarter.
  • Net margin was 35.5%, up from 34.6% in the year-ago quarter. Net margin is guided to decelerate to 33.6%, implying a decrease QoQ.
  • Productivity and Business operating margin was 51.8%, down 160 bp QoQ but expanding 250 bp YoY.
  • Intelligent Cloud operating margin was 46.9%, down 120 bp QoQ but expanding 400 bp YoY due to strength in Azure.
  • More Personal Computing operating margin was 31.6%, up 610 bp QoQ due to a sales mix shift to higher margin businesses.

Cash and Debt:

Operating cash flow was $31.9 billion, up 31% YoY driven by strong cloud billings and collections.

Free cash flow was $21 billion, up 18% YoY reflecting higher capital expenditures to support cloud and AI offerings.

Microsoft returned $8.4 billion to shareholders with $5.6 billion in dividends and $2.8B in share repurchases.

For Q3 2024, the company has $65.44 billion total debt, with $80.02 billion in cash and short-term investments.

Key Metrics:

Bookings increased 29% YoY and 31% on a constant currency basis. This was driven by strength in large, long-term Azure contracts and “strong execution across our core annuity sales motions.” This compares to 17% growth (9% on CC basis) in Bookings last quarter and compares to 11% growth (12% on CC basis) in Bookings in the year ago quarter. This is the highest quarter for bookings since fiscal year 2022.

Commercial RPO grew by 20% YoY to $235 billion. This compares to 17.5% growth last quarter and 26% YoY growth in the year ago quarter.

Last quarter, it was stated that “more than half of the Fortune 500 are using Azure OpenAI Services” and this was updated to “more than 65% of the Fortune 500 now use Azure OpenAI services.” Last quarter, it was stated that “Azure AI customers totaled more than 53,000, with one-third of these being new customers over the past twelve months. This implies customer growth rate of approximately 50% YoY.” This quarter, it was updated to: “The number of $100 million-plus Azure deals increased over 80% year-over-year, while the number of $10 million-plus deals more than doubled.” These aren’t exactly apples-to-apples but seems to imply the trend is up.

According to the opening remarks, over half of Azure AI customers use their data and analytics tools. The next-gen analytics platform, Microsoft Fabric, has over 11,000 paid customers.

Beyond AI, Microsoft stated cloud migrations contributed to Azure growth, as well. Azure Arc has 33,000 customer up 200% YoY as legacy workloads from Oracle and SAP are migrated to Azure.

GitHub commentary certainly showed impressive growth with paying subscribers at 1.8 million, up from 1.3 million last quarter for growth of 35% QoQ up from 30% QoQ. Revenue accelerated 45% YoY and it was stated that “more than 90% of the Fortune 100 are now GitHub customers.”

Copilot for Microsoft 365 was available for its first full quarter with 30,000 organization using Copilot Studio. The low code, no-code Power Platform is being used by “over 330,000 organizations, including over half of Fortune 100 have used AI-powered capabilities in Power Platform, and Power Apps now has over 25 million monthly active users, up over 40% year-over-year.”

There was an important update on CoPilot for Windows provided, which is that it’s now available in 225 million Windows 10 and Windows 11 PCs and is “up 2X quarter-over-quarter.” The company also teased an upcoming event: “And there's much more to come in just a few weeks, we'll hold a special event to talk about our AI vision across Windows and devices.

Earnings Call:

Well, I won’t be shy about the fact that our firm has been particularly keen to hear capex commentary from this week’s earnings reports. Microsoft’s report was as bullish as it could be on that point.

Capex:

Microsoft stated capex was $14 billion this quarter compared to $7.8 billion in the year ago quarter, up 80% YoY. This compares to $11 billion in the previous quarter, up a whopping 27.2% sequentially.

The way analysts are thinking of this is up 50% YoY on a run rate for this current fiscal year ending in June with whispers this could get to $100 billion.

Keith Weiss (Analysts)

congratulations on the fantastic quarter. a lot of excitement in the marketplace around generative AI and the potential of these technologies. But there's also a lot of investment going on behind them. It looks like Microsoft is on track to ramp CapEx over 50% year-on-year this year to over $50 billion. And there's media speculation of more spending ahead with some reports talking about like $100 billion data center. So obviously, investments are coming well ahead of the revenue contribution. It looks like Microsoft is on track to ramp CapEx over 50% year-on-year this year to over $50 billion. And there's media speculation of more spending ahead with some reports talking about like $100 billion data center. So obviously, investments are coming well ahead of the revenue contribution. 

But what I was hoping for is that you could give us some color on how use as the management team, try to quantify the potential opportunities that underlie these investments because they are getting very big. And maybe if you could give us some hint on whether there's any truth to the potential of like $100 billion data center out there.And maybe if you could give us some hint on whether there's any truth to the potential of like $100 billion data center out there.

There was not a direct answer other than the following tone – but the overall message is key to the I/O Fund’s portfolio allocation, and thus, the question in this case reveals more than the answer in terms of what institutions are expecting: “So this is not the quarter. I realize in the news, it's a lot more in the quarter nowadays. But if you look at it, we have been doing what is essentially capital allocation to be a leader in AI for multiple years now, and we plan to sort of essentially keep taking that forward.”

AI Demand Exceeds Capacity

According to the CFO’s opening remarks: “We expect capital expenditures to increase materially on a sequential basis driven by cloud and AI infrastructure investments. As a reminder, there can be normal quarterly spend variability in the timing of our cloud infrastructure build-outs and the timing of finance leases. We continue to bring capacity online as we scale our AI investments with growing demand. Currently, near-term AI demand is a bit higher than our available capacity.” Currently, near-term AI demand is a bit higher than our available capacity.” It was also stated that growth in Azure next quarter “will be driven by our Azure consumption business and continued contribution from AI with some impact from the AI capacity availability noted earlierwith some impact from the AI capacity availability noted earlier

This later led to an important part of the Q&A that helps spell out why Microsoft must increase capex, and how they expect it to flow-through to Azure. Commentary that Azure is hitting capacity due to demand is very bullish for the outlook on GPUs and ASICs this year.

Question
Karl Keirstead (Analysts)

Satya and Amy, congrats on these outstanding Azure results. I'd love to hone in a little bit on the 7-point lift to Azure growth from AI, outstanding number, but it's leveling off a little bit from 6 points in December. I'm wondering if you could unpack that a little bit. To what extent did the capacity issues that you Amy highlighted on the call, impact that number. Is there any seasonality? I wouldn't think so or any other factor that can swing around that number that you'd advise us to keep in mind?

Answer
Amy Hood (Executives)

[…] it is how much capacity we have in play and how much capacity that we have to sell on the inferencing side, in particular. And so that is partially why you see the capital investment in the shape that is, is because right this minute, we do have demand that exceeds our supply by a bit. So it is fair to say that, that could have been an impact on the number for the quarter and it does impact a little bit the number in Q4.it is how much capacity we have in play and how much capacity that we have to sell on the inferencing side, in particular. And so that is partially why you see the capital investment in the shape that is, is because right this minute, we do have demand that exceeds our supply by a bit. So it is fair to say that, that could have been an impact on the number for the quarter and it does impact a little bit the number in Q4.

Security #1 Priority:

I wanted to pull out this quote from the opening remarks as it was a particularly strong statement in terms of how Microsoft thinks of their security products moving forward. It seemed as if this means security is an even bigger priority than AI (although the capex increase communicates otherwise):

Security underpins every layer of the tech stack and it's our #1 priority. We launched our Secure Future initiative last fall for this reason, bringing together every part of the company to advance cybersecurity protection and we are doubling down on this very important work, putting security about all else before all other features and investmentsSecurity underpins every layer of the tech stack and it's our #1 priority. We launched our Secure Future initiative last fall for this reason, bringing together every part of the company to advance cybersecurity protection and we are doubling down on this very important work, putting security about all else before all other features and investments.”

Conclusion:

For our purposes, Microsoft’s report confirms we are on the right track for 2024 in terms of how we have structured our portfolio for the AI data center (reference the webinar highlights here). Microsoft’s report signals the trend is clearly up for AI in the years to come – both for Microsoft and the many other AI data center stocks we own. We are pleased to have this stock in our portfolio and our goal is to continue to add at key levels. There is no question in my mind that Microsoft will remain in the Mag 7 over the next decade, alongside Nvidia. The only remaining questions are when do we buy and how much. If we are lucky, we will get it lower in the near-term to hold for the long-term.

Recommended Reading:
Microsoft Fiscal Q3 2024 Earnings: 80% YoY Increase in Capex; Azure AI is Hitting Capacity

Highlights this quarter include Azure’s growth of 31% up from 30% and 28% on CC basis last quarter. Of this, 7 points was from AI compared to 6 points from AI last quarter. The reason that Azure did not see more QoQ growth from AI is due to capacity constraints. In other words, Microsoft has higher demand than they have GPU supply. This is leading Microsoft to grow its capex 80% YoY from $7.8 billion in the year ago quarter to $14 billion this quarter. On a fiscal year basis, capex will grow 50% this year, and what this quarter proves, is that this high growth rate on already high capex spend is only accelerating.

Notably, Microsoft’s report, Tesla report with 130% increase in H100 equivalents, and Meta’s earnings report supports what we discussed in our recent Quarterly Kickoff webinar on capex and AI spend. To understand critical points on how we have structured our AI portfolio, view the Quarterly Kickoff webinar here. Per the webinar, Microsoft’s report was a vote of confidence we are positioned well.

Beyond Azure, management’s focus was on Copilot, which are tools that are not capacity constrained. There were many impressive statistics on Copilot that we share with you below. In addition to Copilot, Microsoft emphasized that security is their number one priority – “over anything else” – which was a good reminder for investors given AI takes up the majority of the time on the call. There were also some initial AI-powered PC stats from this ER that we share below, as well.

Microsoft has a knack for in-line reports. However, bookings and RPO were exceptionally strong this quarter. We detail this and more below.

Microsoft Fiscal Q3 Financials:

Revenue and EPS:

Fiscal Q3 revenue of $61.85 billion beat expectations by $960 million, driven by a 21% increase in Intelligent Cloud revenue and a 17% increase in More Personal Computing revenue. Azure growth was 31%, marking a continuation of the acceleration we’ve seen since the June quarter. Of this, AI drove 7 points. Per the CFO: “Azure and other cloud services revenue grew 31% ahead of expectations, while our AI services contributed 7 points of growth as expected.”

The company guided for Azure growth of 30% to 31% percent next quarter, which represents a management guide of flat growth QoQ.

Revenue and EPS:

  • Revenue of $61.85 billion beat estimates by 1.7%, representing YoY growth of 17% but a QoQ decrease of 0.3%.
  • For next quarter, management guided to $64 billion, which is below analyst estimates of $64.6 billion and lower mainly due to the rising US dollar.
  • GAAP EPS of $2.94 beat estimates by $0.11, representing YoY growth of 20%. Non-GAAP EPS of $2.94 beat estimates by $0.10.

Segment Revenue:

  • Productivity and Business revenue was $19.6 billion, up 12% YoY, driven by 15% growth in Office 365 Commercial. Growth came in 100 bp ahead of the midpoint of the guided range.
  • Intelligent Cloud revenue was $26.7B, up 21% YoY, driven by strong demand for server products and cloud services revenue from Azure and other cloud services revenue growth of 31%. This was a 260 bp acceleration from last quarter.
  • More Personal Computing revenue was $15.6 billion, up 17% YoY. Windows revenue increased 11% with OEM revenue growth of 11%, while devices revenue decreased (17%).

Guidance on Segment Revenue:

  • Productivity and Business revenue guided to $20.05 billion at midpoint for growth of 8.7% to 10.4% YoY. This would be a deceleration of 145 bps in growth rate, at the midpoint.
  • Intelligent Cloud revenue was guided to $28.55 billion at midpoint for growth of 18.3% to 19.6% YoY. This is a deceleration of 205 bps in growth rate, at the midpoint.
  • More Personal Computing revenue was guided to $15.4 billion at midpoint for growth of 9.4% to 12.2% YoY. This would be a deceleration from 17% growth on CC basis this quarter.

Margins:

Margins were strong across the board, topping management’s guide in gross margin, operating margin and net margin. Operating margin for Q3 was 45%, 210 bp above guidance, and a 270 bp increase YoY.

We’ve previously discussed how there may be room for continued operating margin expansion in Intelligent Cloud, but in this report, it was Microsoft’s More Personal Computing segment that experienced strong operating margin expansion, up 610 bp QoQ to 31.6% as the company shifted the sales mix to higher margin businesses.

One of the more bullish comments on the call was the CFO guiding full year operating margin to be up 2 points for FY2024. There was a note it would be down 1 point for FY2025 due to higher capex. Overall, Microsoft has done an excellent job maintaining margin strength.

  • Gross margin of 70.1% was up from 69.5% in the year ago quarter. The guide for next quarter is approximately 69.2%.
  • Operating margin was 45%, up from 42.3% in the year-ago quarter. Operating margin is guided for 42.3% next quarter.
  • Net margin was 35.5%, up from 34.6% in the year-ago quarter. Net margin is guided to decelerate to 33.6%, implying a decrease QoQ.
  • Productivity and Business operating margin was 51.8%, down 160 bp QoQ but expanding 250 bp YoY.
  • Intelligent Cloud operating margin was 46.9%, down 120 bp QoQ but expanding 400 bp YoY due to strength in Azure.
  • More Personal Computing operating margin was 31.6%, up 610 bp QoQ due to a sales mix shift to higher margin businesses.

Cash and Debt:

Operating cash flow was $31.9 billion, up 31% YoY driven by strong cloud billings and collections.

Free cash flow was $21 billion, up 18% YoY reflecting higher capital expenditures to support cloud and AI offerings.

Microsoft returned $8.4 billion to shareholders with $5.6 billion in dividends and $2.8B in share repurchases.

For Q3 2024, the company has $65.44 billion total debt, with $80.02 billion in cash and short-term investments.

Key Metrics:

Bookings increased 29% YoY and 31% on a constant currency basis. This was driven by strength in large, long-term Azure contracts and “strong execution across our core annuity sales motions.” This compares to 17% growth (9% on CC basis) in Bookings last quarter and compares to 11% growth (12% on CC basis) in Bookings in the year ago quarter. This is the highest quarter for bookings since fiscal year 2022.

Commercial RPO grew by 20% YoY to $235 billion. This compares to 17.5% growth last quarter and 26% YoY growth in the year ago quarter.

Last quarter, it was stated that “more than half of the Fortune 500 are using Azure OpenAI Services” and this was updated to “more than 65% of the Fortune 500 now use Azure OpenAI services.” Last quarter, it was stated that “Azure AI customers totaled more than 53,000, with one-third of these being new customers over the past twelve months. This implies customer growth rate of approximately 50% YoY.” This quarter, it was updated to: “The number of $100 million-plus Azure deals increased over 80% year-over-year, while the number of $10 million-plus deals more than doubled.” These aren’t exactly apples-to-apples but seems to imply the trend is up.

According to the opening remarks, over half of Azure AI customers use their data and analytics tools. The next-gen analytics platform, Microsoft Fabric, has over 11,000 paid customers.

Beyond AI, Microsoft stated cloud migrations contributed to Azure growth, as well. Azure Arc has 33,000 customer up 200% YoY as legacy workloads from Oracle and SAP are migrated to Azure.

GitHub commentary certainly showed impressive growth with paying subscribers at 1.8 million, up from 1.3 million last quarter for growth of 35% QoQ up from 30% QoQ. Revenue accelerated 45% YoY and it was stated that “more than 90% of the Fortune 100 are now GitHub customers.”

Copilot for Microsoft 365 was available for its first full quarter with 30,000 organization using Copilot Studio. The low code, no-code Power Platform is being used by “over 330,000 organizations, including over half of Fortune 100 have used AI-powered capabilities in Power Platform, and Power Apps now has over 25 million monthly active users, up over 40% year-over-year.”

There was an important update on CoPilot for Windows provided, which is that it’s now available in 225 million Windows 10 and Windows 11 PCs and is “up 2X quarter-over-quarter.” The company also teased an upcoming event: “And there's much more to come in just a few weeks, we'll hold a special event to talk about our AI vision across Windows and devices.

Earnings Call:

Well, I won’t be shy about the fact that our firm has been particularly keen to hear capex commentary from this week’s earnings reports. Microsoft’s report was as bullish as it could be on that point.

Capex:

Microsoft stated capex was $14 billion this quarter compared to $7.8 billion in the year ago quarter, up 80% YoY. This compares to $11 billion in the previous quarter, up a whopping 27.2% sequentially.

The way analysts are thinking of this is up 50% YoY on a run rate for this current fiscal year ending in June with whispers this could get to $100 billion.

Keith Weiss (Analysts)

congratulations on the fantastic quarter. a lot of excitement in the marketplace around generative AI and the potential of these technologies. But there's also a lot of investment going on behind them. It looks like Microsoft is on track to ramp CapEx over 50% year-on-year this year to over $50 billion. And there's media speculation of more spending ahead with some reports talking about like $100 billion data center. So obviously, investments are coming well ahead of the revenue contribution. It looks like Microsoft is on track to ramp CapEx over 50% year-on-year this year to over $50 billion. And there's media speculation of more spending ahead with some reports talking about like $100 billion data center. So obviously, investments are coming well ahead of the revenue contribution. 

But what I was hoping for is that you could give us some color on how use as the management team, try to quantify the potential opportunities that underlie these investments because they are getting very big. And maybe if you could give us some hint on whether there's any truth to the potential of like $100 billion data center out there.And maybe if you could give us some hint on whether there's any truth to the potential of like $100 billion data center out there.

There was not a direct answer other than the following tone – but the overall message is key to the I/O Fund’s portfolio allocation, and thus, the question in this case reveals more than the answer in terms of what institutions are expecting: “So this is not the quarter. I realize in the news, it's a lot more in the quarter nowadays. But if you look at it, we have been doing what is essentially capital allocation to be a leader in AI for multiple years now, and we plan to sort of essentially keep taking that forward.”

AI Demand Exceeds Capacity

According to the CFO’s opening remarks: “We expect capital expenditures to increase materially on a sequential basis driven by cloud and AI infrastructure investments. As a reminder, there can be normal quarterly spend variability in the timing of our cloud infrastructure build-outs and the timing of finance leases. We continue to bring capacity online as we scale our AI investments with growing demand. Currently, near-term AI demand is a bit higher than our available capacity.” Currently, near-term AI demand is a bit higher than our available capacity.” It was also stated that growth in Azure next quarter “will be driven by our Azure consumption business and continued contribution from AI with some impact from the AI capacity availability noted earlierwith some impact from the AI capacity availability noted earlier

This later led to an important part of the Q&A that helps spell out why Microsoft must increase capex, and how they expect it to flow-through to Azure. Commentary that Azure is hitting capacity due to demand is very bullish for the outlook on GPUs and ASICs this year.

Question
Karl Keirstead (Analysts)

Satya and Amy, congrats on these outstanding Azure results. I'd love to hone in a little bit on the 7-point lift to Azure growth from AI, outstanding number, but it's leveling off a little bit from 6 points in December. I'm wondering if you could unpack that a little bit. To what extent did the capacity issues that you Amy highlighted on the call, impact that number. Is there any seasonality? I wouldn't think so or any other factor that can swing around that number that you'd advise us to keep in mind?

Answer
Amy Hood (Executives)

[…] it is how much capacity we have in play and how much capacity that we have to sell on the inferencing side, in particular. And so that is partially why you see the capital investment in the shape that is, is because right this minute, we do have demand that exceeds our supply by a bit. So it is fair to say that, that could have been an impact on the number for the quarter and it does impact a little bit the number in Q4.it is how much capacity we have in play and how much capacity that we have to sell on the inferencing side, in particular. And so that is partially why you see the capital investment in the shape that is, is because right this minute, we do have demand that exceeds our supply by a bit. So it is fair to say that, that could have been an impact on the number for the quarter and it does impact a little bit the number in Q4.

Security #1 Priority:

I wanted to pull out this quote from the opening remarks as it was a particularly strong statement in terms of how Microsoft thinks of their security products moving forward. It seemed as if this means security is an even bigger priority than AI (although the capex increase communicates otherwise):

Security underpins every layer of the tech stack and it's our #1 priority. We launched our Secure Future initiative last fall for this reason, bringing together every part of the company to advance cybersecurity protection and we are doubling down on this very important work, putting security about all else before all other features and investmentsSecurity underpins every layer of the tech stack and it's our #1 priority. We launched our Secure Future initiative last fall for this reason, bringing together every part of the company to advance cybersecurity protection and we are doubling down on this very important work, putting security about all else before all other features and investments.”

Conclusion:

For our purposes, Microsoft’s report confirms we are on the right track for 2024 in terms of how we have structured our portfolio for the AI data center (reference the webinar here). Microsoft’s report signals the trend is clearly up for AI in the years to come – both for Microsoft and the many other AI data center stocks we own. We are pleased to have this stock in our portfolio and our goal is to continue to add at key levels. There is no question in my mind that Microsoft will remain in the Mag 7 over the next decade, alongside Nvidia. The only remaining questions are when do we buy and how much. If we are lucky, we will get it lower in the near-term to hold for the long-term.

Recommended Reading:

We Are Raising Our Bitcoin Targets To $106K – $190K

Bitcoin is an asset where the bulls pound the table to “buy, buy, buy,” and the bears relentlessly and stubbornly call it a scam. In reality, both are the wrong approach. This is because although Bitcoin is the highest performing asset in the past ten years, it’s also the one of the most volatile. Consider that it was trading at $58,000 in March of 2022, and by December of 2022 had lost 72% of its value. That year, the loud and proud Bitcoin bulls were not your friends.

Timing is everything. When it comes to timing, our firm has a proven track record of navigating the life-changing bull case that crypto offers while minimizing the volatility associated with different coins – we achieve this via a unique approach combining technical and on-chain analysis to identify major lows and major tops in each cycle. For example, we diligently detailed to our readers in December of 2022, when Bitcoin was trading in the $16,000 region, that we are “Bullish on Bitcoin”:

“Though we are in the 4th bear cycle in Bitcoin's history, the prior 3 cycles suggest where we are is a rare buying opportunity. There is ample evidence to support the $15,500 level is either a major low or very close to a major low. Both the technical and on-chain analysis support this. As Bitcoin continues to integrate into the global economy, we expect both the volatility and epic returns to calm down. For now, we are content buying Bitcoin at these lows with a long-term mindset.”

One year later, our most recent Bitcoin article stated that the coming pullback into the $39,000 – $35,000 region would likely be “the last great buying opportunity” in this bull cycle. At the time our upper targets were between $75,000 – $132,000. That correction bottomed around $38,500 then led to 90% rally, which topped less than 2% from our $75,000 target.

If Bitcoin were in the Mag 7, it would be the second strongest performer both YTD and on a 1-year basis, edging out Meta at returns of 133% in 1-year and 52% YTD. Had you bought in the $16,000 region, the returns would be 300% in about 17 months’ time.

bitcoin price % change

Source: YChartsYCharts

Looking forward, an important question to ask is, are we at the end of a bull cycle or do we have more room to run? We believe that there is more room within this uptrend. As a result, we are raising our upper Bitcoin targets, as the current volatility appears to be another correction within a much larger uptrend.

In this article, we will support this thesis through on-chain analysis as well as technical analysis. We will also address how Bitcoin appears to be setting up for higher levels while equities look like they’re topping. The popular narrative is that crypto and stocks – especially tech stocks — are correlated. It’s our stance that these two investments are not as correlated as many believe, which lends credence to this potential divergence.

Updated Bitcoin Game Plan

We have remained steadfast on the long-term pattern for Bitcoin, which you can see was intact as far back as July of 2022. While the 2022 drawdown went lower than we anticipated, once we got signs of a bottom, we maintained this pattern around the $15,000 lows. The implication was that 2022 was a correction within a much larger uptrend, and that we were going to see a new bull cycle into 2023 – 2024.

As of today, we are more than halfway into the current bull cycle, which is the final 5th wave in a very large 5 wave uptrend that started in late 2018. What this means is that as we approach our upper targets, our game plan will shift from accumulation to distribution.

bitcoin weekly chart

Source: I/O Fund

The current drawdown appears to be tracing a bull flag, which is a correction within an uptrend. The $57,000 region is very strong support, which is the upper range of our support zones that need to hold in order for us to push higher. This is over 25% lower than price currently is, which shows the level of strength still in Bitcoin. If we do see another drop, we can go as low as $42,750 without invalidating the larger uptrend in play. So, this ongoing pattern is comfortably intact and has ample room to drop, if we see more volatility.

While the pattern appears to be corrective, and tracing a standard pattern we see within larger uptrends, the momentum oscillator below price is at a major support zone. Note how this support region acted as key lows, especially in the current uptrend that started in late 2022. Also, note how much higher price is compared to other instances where this support was tested. This suggests a low being put in, while also suggesting that we have ample room to push higher in the coming weeks to months.

Because of this development, we are increasing our upper target zone from $75,000 – $130,000 to $106,000 on the low end, and $190,000 on the high end. As long as the $42,750 support region holds on any on-going volatility, then we have no reason to doubt the uptrend in place. That being said, we do not see the same upside within the equity markets, which begs the question – is Bitcoin highly correlated to tech stocks?

Bitcoin vs. Tech

On April 18th, we saw an escalation of the concerning geopolitical conflict between Iran and Israel. As a result, the NASDAQ-100 closed down over 2% the following day, with AI leaders like NVDA giving back 10% in a single day.

There were not many areas of tech that were spared on that day of selling, as investors sought to de-risk at any price. One would think Bitcoin would follow tech on this day, but it was instead up nearly 1%. In fact, many alt-coins shrugged off this news and pushed higher. Granted this is only one day, but it is an intriguing development. This was the first instance of panic selling in over 6 months where we saw investors dumping high risk tech stocks, and Bitcoin not only did not participate, but saw buyers.

If we look back at the long-term correlation to Bitcoin and the heavily focused NASDAQ-100, you will note that the majority of times, these two investments are closer to having minimal to to no correlation. This is in contrast to being highly correlated, as many would believe.

bitcoin & nasdaq comparison chart

Source: I/O Fund

The above chart measures the correlation between these two investments. The best way to read the chart is when the line is moving up, it means the two are correlated and heading in the same direction, while the inverse indicates they are moving in opposite directions. Also, when the cumulative reading is above 0.5 (green), the two investments are highly correlated, between 0.5 and -0.5 (yellow) the two have minimal to no correlation, and when the reading is below -0.5 (red) they have an inverse correlation and are moving in the opposite direction.

Considering the correlation is cumulative on a weekly scale, the two investments have to stay inversely correlated for some time in order to cross below 0. As you can see, there are significant periods where the two have been inversely correlated, which I’ve marked with the gray vertical shades.

For reference, the below chart shows the correlation between the S&P 500 and the NASDAQ-100 through the same period. While there are brief periods where the two indexes have diverged, the cumulative correlation rarely goes below 0.5% (green), and only briefly crossed the 0 line.

sp500 & nasdaq comparison chart

Source: I/O Fund

The point is to show actual data in regards to the popular narrative that Bitcoin is just another tech equity play. The data shows that the cumulative correlation has periods where it is highly correlated to tech, but what is key to understand, is that it also has extended periods where it is inversely correlated. The norm is that the two investments have had a low to no correlation, which supports the inverse move that we saw between Bitcoin and tech stocks on April 19th.

This supports a probable scenario where equities could put in a top while Bitcoin continues to run higher.

Sign up for I/O Fund's free newsletter with gains of up to 221% – Click hereClick hereClick here

Equities Topping While Bitcoin Goes Higher

In our March report, we showed how the current bull market leaders, the Magnificent 7, were topping, one at a time, while the broad market was continuing to push higher. At the time of the report, only 3 of the Mag 7 were making new highs with the broad market. We then saw the AI leaders within the semiconductor space, including Nvidia, top around early March, while the broad market pushed higher into April.

Seeing the bull market leaders diverge from the broad market is usually a sign of coming weakness, not strength. More times than not, we will see the leaders top first when a meaningful change in trend is about to happen, which we warned our readers about. If we were going to push higher, these leaders needed to breakout to new highs, and until then, we were at risk of a trend change.

This lines up with the potential topping pattern we are seeing within the equity markets, compared to Bitcoin, which appears to have more room to run.

equity markets compared to bitcoin chart

Source: I/O Fund

The above chart shows the NASDAQ-100 has completed a mature 5 wave pattern off the 2022 low, and has broken the first of two major supports – 17,265 and 17,000. Bitcoin, on the other hand, is still in an incomplete 5 wave pattern, which is still tracing the 3rd wave higher. Note the current correction is taking the shape of a bull flag, and is nearly 25% above the first critical support level.

The reason for this could have several explanations. For one, it’s worth noting that the demand for Bitcoin has increased substantially, while its supply has remained the same. Spot Bitcoin ETFs have quickly become a popular investment vehicle, and have seen a surge in net inflows, surpassing more than $30B AUM in mid-April after amassing $17B in funds in less than two months after a launch in mid-January. For example, BlackRock’s iShares Bitcoin ETF recorded 71 consecutive days of net inflows. In addition, trading volume on the ETFs nearly tripled in March, reaching $111 billion – for an asset class that launched only two months prior, that’s a significant figure.

Another explanation is the fact that not all markets top and bottom at the same time. For example, small caps topped in 2021 while the NASDAQ-100 continued higher into 2024. Therefore, Bitcoin could be one of the last assets to put in a larger top, after the NASDAQ-100. This would lead to several lower highs within a large range for the NASDAQ-100, while Bitcoin makes its final series of higher highs. After which, they would align in a potential downtrend.

Another answer could be something more fundamental. Bitcoin was created to answer a specific flaw within the centralized banking system. It is fundamentally different than a tech stock, and has the potential to provide a hedge against various banking and/or currency problems that tech stocks would not be able to address. In this case, Bitcoin could be picking up on some deeper issue within the system, which is causing the potential divergence.

The other scenario is that I could be wrong, and the NASDAQ-100 holds this support region, the Mag 7 and AI Semis find more strength, and push higher with Bitcoin, or vice versa. I’m open to this, but until Bitcoin starts breaking critical support levels in a direct fashion, like most equity markets recently have, there is no reason to pivot away from a more bullish outcome in Bitcoin.

On Chain Analysis

For those that are not familiar with on-chain data, it is the unique fundamental analysis within crypto, and a relatively new field of study. We partnered with WealthUmbrella, a team of Machine Learning engineers and professors, to provide this level of analysis within the crypto space. According to WealthUmbrella, the underlying strength that our technical analysis is picking up on is also being supported within on-chain data. The below section was written by Vincent Duchaine, CEO of WealthUmbrella.

Bitcoin’s recent move to $73,000 created some of the most overbought conditions we have seen throughout Bitcoin’s history. One of the indicators used to gauge these overbought levels measures the value of Bitcoin’s network through the increase/decrease in active users.

At the recent high in Bitcoin, this indicator, which only rose briefly to a historically high value, gave us a reading of 3.3. As you can see below, this reading represents an outlier in Bitcoin history.

MLDP Z-Score Distribution chart

Source: I/O Fund

A reading this high historically leads to a top, of sorts. The good news is that the recent volatility has taken this indicator back to a reading of 0.84, which is in the lower range of what we have seen during a correction in a bull market over the last 6 years. This further confirms our long-standing outlook that the bull cycle in Bitcoin will likely move higher.

bitcoin usd chart from wealth umbrella

Source: I/O Fund

This extreme overbought reading was also picked up by our SOPR Indicator, which stands for the Spent Output Profit Ratio. This indicator measures the daily transactions in Bitcoin and measures if the combined ratio has a profit or loss based on when they were bought. As the indicator moves up, it is signaling that all the majority of daily transactions in Bitcoin were sold for a profit.

As you can see, this indicator also reached a historically high reading when Bitcoin first hit $73,000. However, it has greatly cooled down since and is now slowly curving to the right.

bitcoin usd daily chart from wealth umbrella

Source: I/O Fund

These two metrics were warnings that a correction was likely coming due to being extremely overbought. However, since then, we have seen them cool off to a level that suggests we could be getting close to the bottom of the current correction and resume the uptrend.

This thesis is being supported by other metrics that we track. For example, since the arrival of the new Bitcoin ETF, the amount of Bitcoin that hasn’t moved in more than a year was in a constant drop, implying that long-term holders (hodlers) were finally taking gains, which was increasing supply. This selling by the Bitcoin hodlers has since stopped since April 2nd, which you can see in the chart below.

wealth umbrella bitcoin chart analysis

Source: I/O Fund

Like any asset, Bitcoin's price movements are the result of supply and demand. We are now seeing long-term holders of Bitcoin cease the selling that started in late 2023. This is bullish as it creates a constraint on the supply side of the equation.

Not only are hodlers not selling, but whales have also bought the recent dips in a notable way. The below chart measures large block trades within Bitcoin. The most recent spike happened last Thursday, April 18th, when whales bought 19,700 BTC at an average price of $62.5k.

bitcoin large holders net flows chart

Source: I/O Fund

Regarding the demand for Bitcoin, we have historically measured this through monitoring the number of newly created Bitcoin addresses with a non-$0 balance. As new addresses are created that actively buy Bitcoin, this implies that demand is increasing. However, this is likely not as relevant in light of the new Bitcoin ETFs.

Before the creation of these ETFs, the predominant means to access Bitcoin was through the creation of wallets or personalized crypto exchange accounts. Now, an investor can simply buy an ETF on a public exchange and get access to Bitcoin’s price movements. This has now opened the door to institutional investors as well as investors who want diversification but did not want to deal with the hassle of dealing with crypto exchanges and the safety concerns that come with them. Regarding demand, this development is arguably the most important element in Bitcoin’s history, and we view as quite bullish in regards to the demand side of the price equation. Lead Tech Analyst Beth Kindig went on Fox Business News and discussed how Bitcoin has never had a more fundamentally bullish moment:

Bitcoin has never had a more fundamental bullish moment: Beth Kindig (X.com)

Source: Beth's TwitterBeth's Twitter

In summary, the internals are supporting higher levels, as we are now seeing demand start to catch up with supply. We view the current state of Bitcoin’s pullback as a buying opportunity within a larger uptrend. This is confirmed by one of our most powerful tools, which we call the Kwiatkowski Indicator, named after its creator. This tool is designed to spot tops by looking at the profit of all market participants in an organized way. It is currently indicating a value of around 12, while we don’t expect a cyclical top until 35.

bitcoin bullish trend chart analysis

Source: I/O Fund

Conclusion:

We are seeing evidence that Bitcoin wants to go higher, while equities appear to be setting for a top. Bitcoin has a history of not being correlated with tech stocks, so this scenario is not as improbable as the popular narrative would suggest. Both technical and on-chain analysis support higher levels for Bitcoin, and as long as any further weakness holds $42,750, we view this dip as a buying opportunity.

If you own crypto or are looking to own crypto stocks, consider joining us for our next broad market webinar. Every Thursday at 4:30 pm Eastern, the I/O Fund team holds a webinar for premium members to discuss how to navigate the broad market, manage risk, as well as revealing our various long-term game plans regarding stock and crypto entries and exits. We offer trade alerts plus an automated hedging signal. The I/O Fund team is one of the only audited portfolios available to individual investors. Learn more here.here.

Please note: The I/O Fund conducts research and draws conclusions for the company’s portfolio. We then share that information with our readers and offer real-time trade notifications. This is not a guarantee of a stock’s performance and it is not financial advice. Please consult your personal financial advisor before buying any stock in the companies mentioned in this analysis. Beth Kindig and the I/O Fund own BTC at the time of writing and may own stocks pictured in the charts.

Recommended Reading:
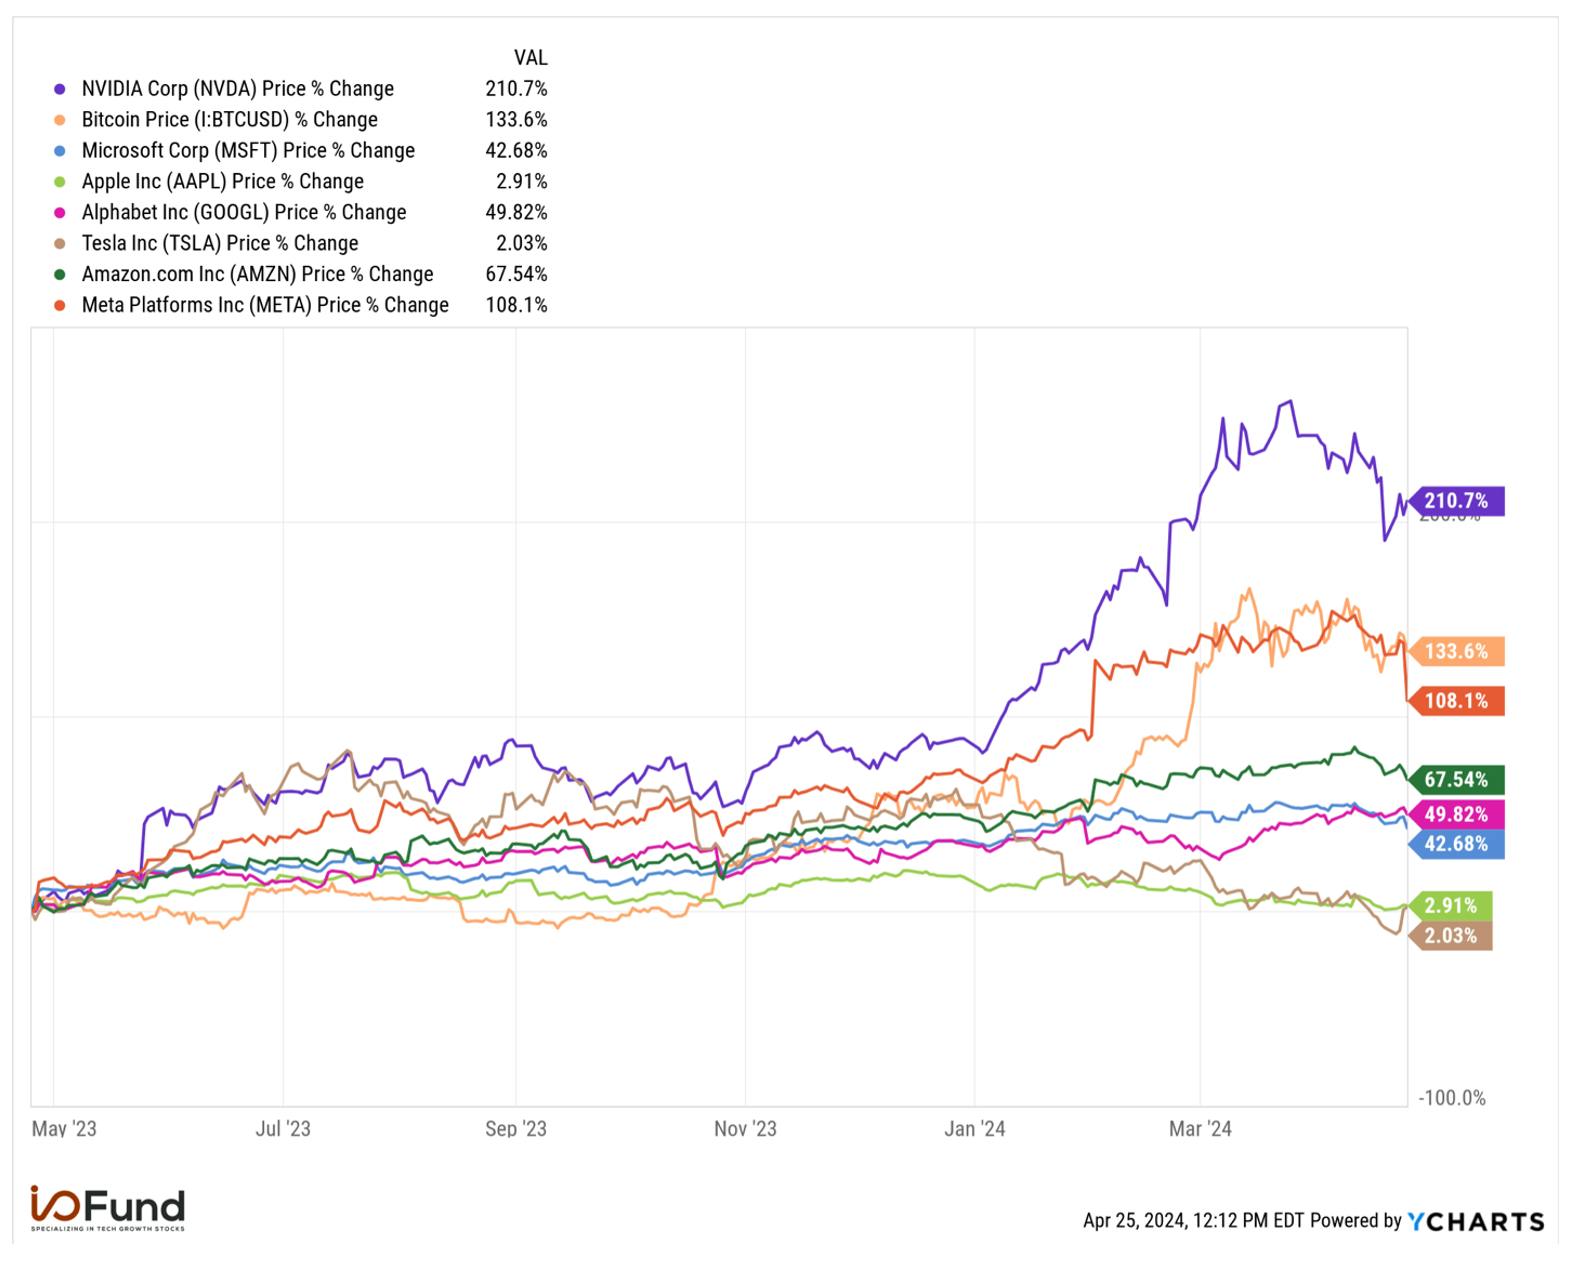
Tencent: China AI Momentum Play with Technicals

Tencent stands out for its dividend, buybacks, strong margin expansion, increased cash, and plus WeChat in mainland China was quite strong this past quarter. However, we want to emphasize that any trades on Tencent or Baidu are momentum trades only. These are not shared with Pro or Essentials Members and are more like crypto, where technicals not only lead but are roughly 90% of the decisions we make around the position.

Below is research into Tencent’s financials with the gentle reminder that the technical analysis section below is the ultimate determining factor in how we manage the momentum position.

Revenue and EPS:

In the last earnings report, the conversion rate was stated to be based on USD1 to RMB7.0827. The currency rates may fluctuate in the upcoming earnings report and thus any USD numbers will not be exact.

Tencent is expected to report growth of 2% this quarter for revenue of $21.9 billion USD. This compares to $21.98 USD or RMB 155.2B in the previous quarter for growth of 7%. The company is expected to report growth of roughly 10% the next three quarters with the March quarter expected to be the bottom.

On an annual basis, 2023 reported growth of 10% for RMB 609B or $86B USD compared to a decline of (-1%) for RMB 554.6B or $79.6B USD for the full year 2022. Looking forward, Tencent is expected to report growth of 8.9% for USD $92.2B. The company is expected to report roughly 10% growth over the next few fiscal years with 2022 expected to be the bottom on an annual basis.

This quarter, the company is expected to report EPS of USD $0.64, or calculated to be RMB $4.53 EPS. This is flat from RMB $4.50 EPS reported last quarter yet the estimates represent growth on a year-over-year basis of 33%, up from RMB $3.10. Next quarter, Tencent is expected to report EPS of $0.64 or RMB $4.53 to be flat QoQ yet up 21% year-over-year.

On an annual basis, adjusted EPS is expected to grow 23.4% for USD $2.80, calculated to be RMB $19.9 EPS. This is up from RMB $16.3 adjusted EPS in FY2023. EPS is expected to grow 16% in FY2025 and 29% in FY2026.

Tencent focuses closely on Profit Attributable to Shareholders on a Non-IFRS basis (which is Non-GAAP adjusted net income for our reporting standards). In the most recent quarter, this was RMB $42.7B or USD $6B and was up 44% YoY.

EBITDA of $54B RMB or $7.6B USD was up 22.7% from $44B RMB in the year ago quarter. Adjusted EBITDA of $59.5B RMB or $8.4B USD was up from $49.6B RMB in the year ago quarter. The adjusted EBITDA margin increased to 38% up from 34% in the year ago quarter.

Margins:

Tencent is seeing expanding margins and this is a key piece as to why Tencent could see favorable price action.

Last quarter, the gross margin of 50.2% expanded from 43% in the year ago quarter and was up 120 basis points QoQ. Gross profit was up 25% from $61.8 RMB to $77.68 RMB or USD $11B.

Per management: “Importantly, our gross profit growth has consistently surpassed revenue growth due to the margins of our incremental revenue being significantly higher than the 50% overall gross margins for the entire company. This incremental revenue is generated predominantly from our leading social and payment platforms, which have already been built and had their costs covered. We now consider gross profit growth as a key proxy and, frankly, a better proxy than revenue growth for our organic growth given this shift in terms of the revenue mix.”

Last quarter, the operating margin of 27% increased from OPM of 20% in the year ago quarter yet decreased 400 bps from the previous quarter. The operating profits were $41.4B RMB or $5.8B USD.

The adjusted operating margin of 32% was up from 27% in the year ago quarter and is up 11-points in two years. This is down QoQ 400 basis points.

Per management regarding this efficiency: “We further enhanced our operating profit growth from gross profit growth through operating leverage. First, we streamlined operations and prudently reduced aggressive marketing expenditures. We perceive these measures as a less recurring strategy. Second and more importantly, we are committed to operational efficiency and disciplined resource allocation, which includes thoughtful staff distribution and effective marketing expense management. This approach ensures a focused organization and a lean cost structure moving forward.”

  • The net margin of 18% for profits of 27.9 RMB doesn’t comp well against a one-time event in the year ago quarter, which had led to a net margin of 74%, but the 18% is in line with previous quarters. 
  • The adjusted net margin of 28% compares to an adjusted net margin of 21% in the year ago quarter. This is down 200 basis points QoQ.

Cash Flow:

Operating cash flow last quarter was RMB $54 billion or USD $7.6B, up 52% YoY. This represents an operating cash flow margin of 35% up from a margin of 25% in the year ago quarter.

Free cash flow of RMB $34.2B or $4.8B was up 48% YoY and represents a free cash flow margin of 22% up from 16% in the year ago quarter. Some quarters have a higher FCF margin than others, with Q3 and Q1 reporting a FCF margin of 33% and 35%, respectively.

The company has RMB 403.3B or USD at $56.9B in cash. This is up from USD 45.9 in the year ago quarter. The company has debt of RMB 348.6B or USD 49.2B for net cash of RMB 54.7B, which calculates to net cash of $7.72B USD.

Last quarter, the company spent RMB 7.5B in capex, which was up 33% YoY.

The fair value of shareholding in listed investee companies was RMB 550.7B or USD $77.8 billion. This has been trending upward but is a risk to have this much exposure to other companies.

The carrying book value of unlisted investee companies was RMB 337.3B or USD $47.6 billion. This has been flat over the past few quarters.

Dividends and Buybacks

Tencent pays an annual dividend and recently increased this by 42% to HKD 3.40 per share, which has a current exchange rate of $1 = $7.84. This would equal USD $0.43. Also, according to the last earnings report: “we intend to at least double the size of our share repurchases, from approximately HKD49 billion in 2023 to over HKD100 billion in 2024.” This equals roughly USD $12.7 billion.

Per the earnings call: “We believe this commitment to return at least HKD 132 billion or US $16.9 billion to shareholders during the year is well supported by our free cash flow, which was US $24 billion for the full year of ’23, along with our gross cash position of US $57 billion and our investment portfolio of US $126 billion.”

Key Metrics:

The Online advertising revenue segment reported RMB 39.8B up 21% YoY. This compares to 15% growth in the year ago quarter. This represents 19% of revenue with a gross margin of 56.8%. The gross margin was up 12.6 points year-over-year.

Fintech and Business services were up 15% YoY for RMB 54.4B compared to a decline of (-1%) YoY to RMB 47.2 billion in the year ago quarter. This represents 35% of revenue. Gross margin in fintech and business services is at 43.9% which was up 10.3 points year-over-year.

Revenue from value-added services (VAS) which includes international games, domestic games, communication and social, and also digital content, was down 2% YoY to RMB 69 billion and was also down 2% in the year ago quarter. Revenue from music-related and game-related livestreaming services decreased while revenue from the video accounts streaming service, music subscriptions and mini-games increased. This segment has a gross margin of 53.7% and was up 3.9 points YoY.

Despite the puts and takes in the segment, management stated the following highlights: “Our mini-games platform increased gross receipts by over 50% year-on-year. Our number of major hit games in China achieving both high DAU and substantial monetization increased from six in 2022 to eight in 2023 and in connection with games achieved double digit revenue growth and rose to 30% of games revenue.”

Management also stated they expect games to improve “from the second quarter of 2024.” There is also a popular game on desktop expected to launch on mobile in the second quarter called DnF mobile.

  • Combined MAU of Weixin (mainland China) and Wechat (global app) is 1.343B up 2% YoY
  • Mobile Device MAU was down (-3%) YoY to 554
  • Fee-based VAS registered subscriptions was up 6% YoY to 248

Additional metrics:

  • Tencent Video had 117 million paid subs. Long form video subscription revenue increased 1% year-on-year, driven by higher ARPU, while their video subscriptions declined slightly to RMB 117 million.
  • Tencent Music had 107 million paid subs. Music subscription revenue increased 45% year-on-year on 21% growth in subscription count and 20% growth in ARPU.

Some highlights this past quarter include management stating: “Weixin Search has now achieved over 100 million DAU, up over 20% year-on-year, and Weixin Search content QV grew over 30% year-on-year. Our search revenue grew multiple times year-on-year in 2023 as we ramped up monetization on this under-monetized asset.”
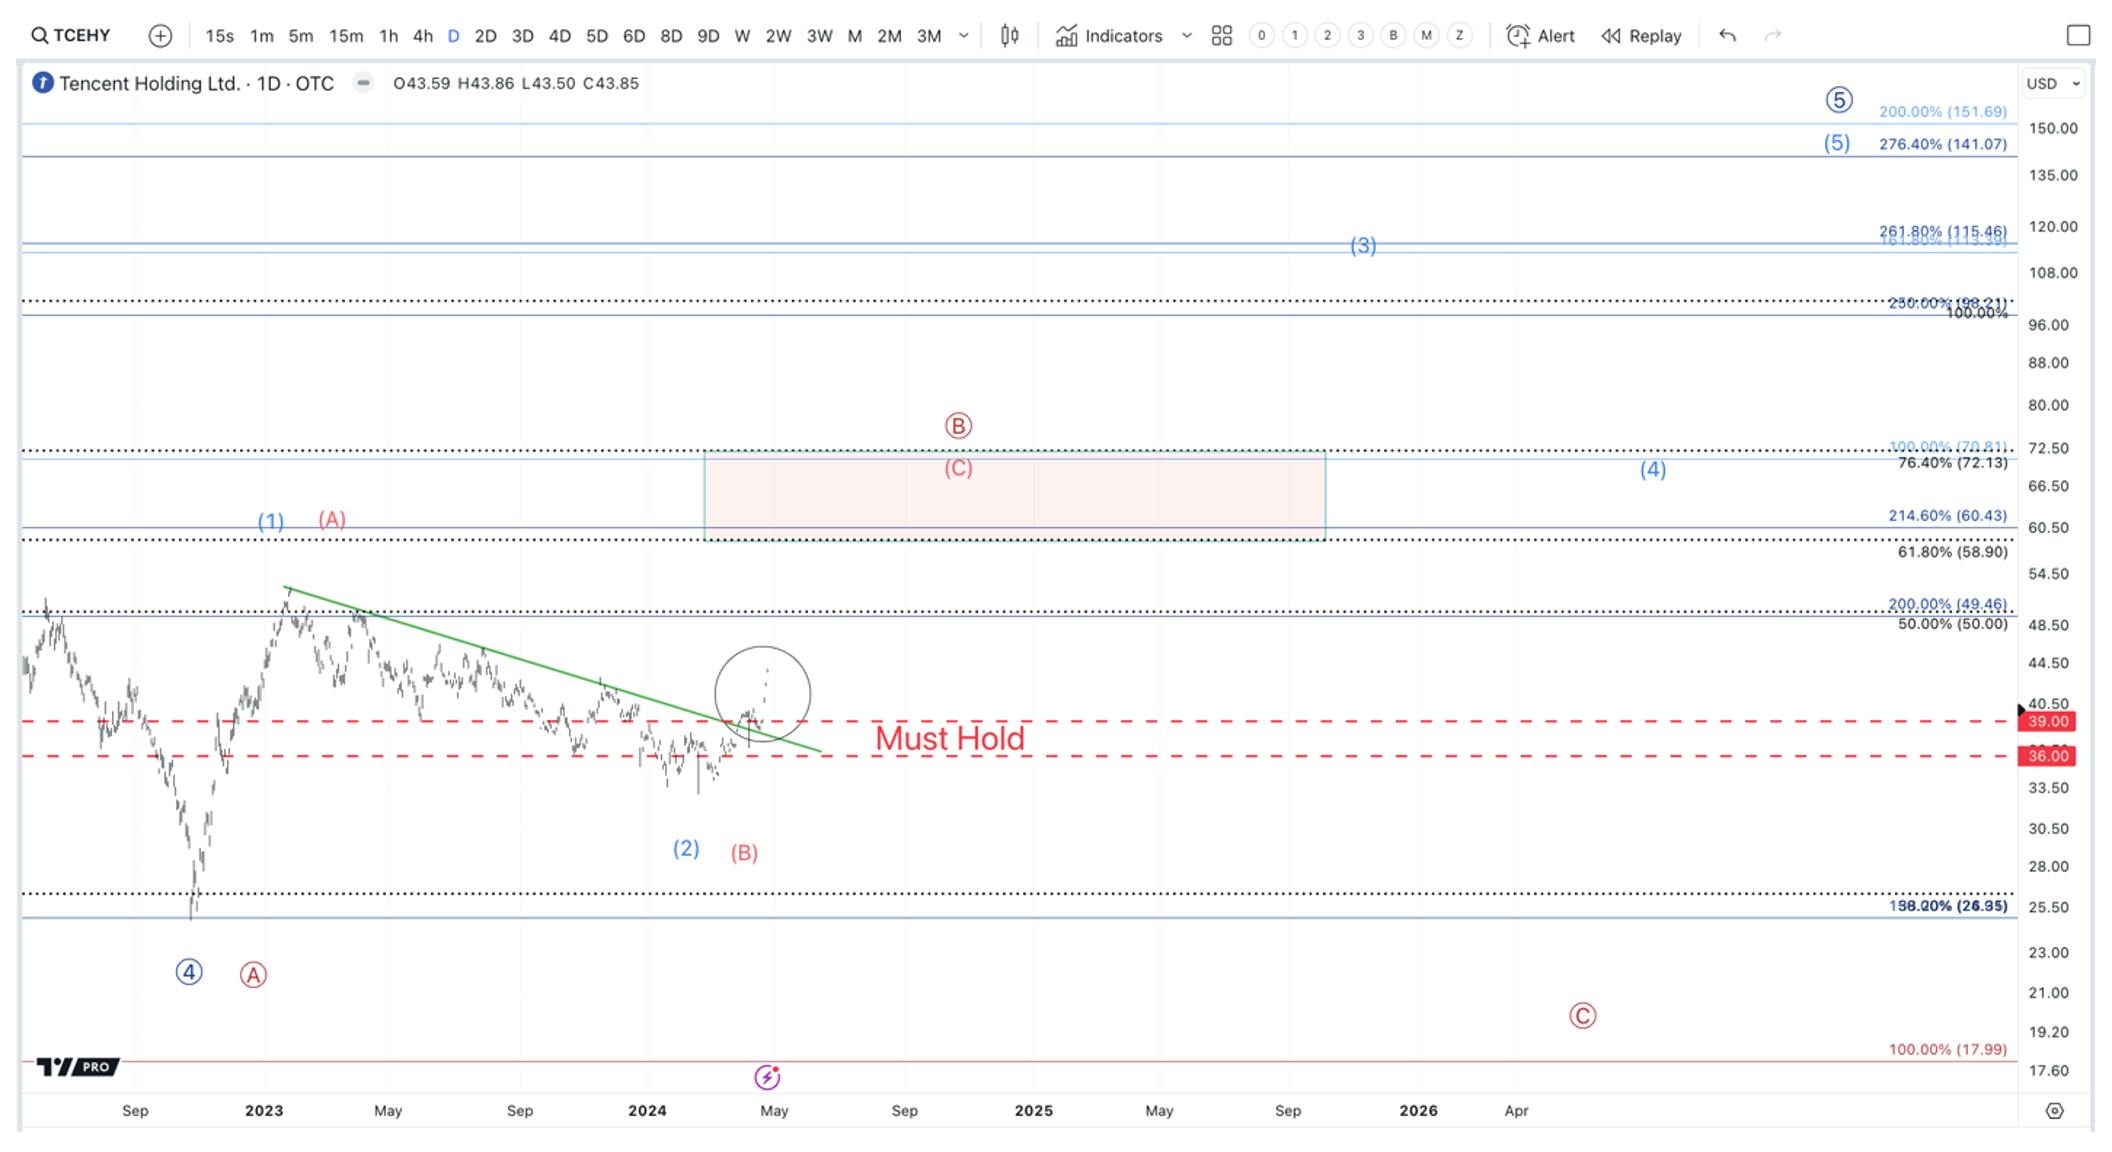
Later it was also stated: “Weixin video accounts on the content consumption side, time spent increased over 80% year-on-year in the fourth quarter driven partly by DAU and mostly by time spent per user.”

Risks:

There are some risks associated with Tencent stock that are important to keep in mind, especially since United States stocks do not carry the same level of risk. The first is United States-China tensions, the second is that Tencent’s financials are unaudited, and third that Tencent is an over-the-counter stock which means the stock is not traded on an exchange.

Valuation:

Tencent trades at a PS ratio of 4.5 and a 4 EV/Sales which is in line with three year averages yet is low on a 5-year average basis. The 3-year median is 5 and the 5-year median is 6-8 EV/Sales

The company trades at a Fwd PE Ratio of 12 based on next year’s earnings compared to a 15 Fwd PE Ratio on a 3-year basis. However, the forward PE Ratio on a 5-year median is 30.

Price to FCF is 28.7 and has primarily traded higher except in 2022. The stock has traded as high as a 50 Price to FCF, but this is the absolute max it’s traded in the last few years.

Earnings Call:

AI driving Ad Revenue increase:

Per the earnings call:

“Moving to online advertising, our ad revenue was RMB 30 billion in the fourth quarter, up 21% year-on-year, benefiting from upgrades to our ad tech platform and more advertising revenue and video accounts. We generated increased ad revenue from all major categories except automotive with notable step-ups in revenue from internet services, healthcare and consumer goods categories. We refined our ad targeting by utilizing more real-time data in the AI powering our ad tech, enabling us to match target users with more relevant ads in a more timely manner across both our owned and our ad network properties.We refined our ad targeting by utilizing more real-time data in the AI powering our ad tech, enabling us to match target users with more relevant ads in a more timely manner across both our owned and our ad network properties.

Our video accounts ad revenue more than doubled year-on-year despite maintaining a very low ad load, due to increased video views and upgraded ad targeting. Weixin Search increased its revenue several-fold year-on-year in the quarter on growth on commercial queries and RPM.”

Later it was also stated:

Moving to communications and social networks, for Weixin video accounts on the content consumption side, time spent increased over 80% year-on-year in the fourth quarter driven partly by DAU and mostly by time spent per user, benefiting from our enhanced content recommendation engine […] Our video accounts ad revenue more than doubled year-on-year despite maintaining a very low ad load, due to increased video views and upgraded ad targeting. Weixin Search increased its revenue several-fold year-on-year in the quarter on growth on commercial queries and RPM.”

More on Artificial Intelligence

“Our Tencent Hunyuan foundation model is now among the top tier of large language models in China with notable strength in advanced logical reasoning. Our upgraded advertising AI model enables us to deliver better ad targeting and higher revenue.”

“In 2023, we also made notable progress in core technologies, especially those involving AI that will serve as our growth multiplier going forward. After deploying leading edge technologies such as the mixture of experts, or MoE architecture, our foundation model Tencent Hunyuan is now achieving top tier Chinese language performance among large language models in China and worldwide. The enhanced Hunyuan excels particularly in multi-turn conversations, logical inference, and numerical reasoning, areas which have been challenging for large language models. We have scaled the model up to the trillion parameter mark leveraging the MoE architecture to enhance performance and reducing [indiscernible] costs, and we are rapidly improving the model’s text-to-picture and text-to-video capabilities.

We are increasingly integrating Hunyuan to provide copilot services for our enterprise SaaS products, including Tencent Meeting and Tencent Docs, and we are also developing new gen-AI tools for effective content production internally. More generally, deploying AI technology in our existing businesses has begun to deliver significant revenue benefits. This is most obvious in our advertising business where our AI-powered ad tech platform is contributing to more accurate ad targeting, higher ad click-through rates and thus faster advertising revenue growth rates. We also see earlier stage business opportunities from providing AI services to Tencent Cloud customers.”

Technical Analysis

If we analyze the bigger trend in Tencent (TCEHY), there are two interpretations on the pattern in play.

  • The Blue Count has the large correction that started in February of 2021 was actually a correction within a larger uptrend. This pattern would be playing out in 5 waves, and the current breakout would be the start of the final 5th wave higher. If this is in play, we will push past the $72 resistance, breakout to new all-time highs and then target the $115 – $140 region.
  • The Red Count has the larger 5 wave pattern ending in February of 2021. This would imply that we are in a larger degree corrective bounce, which should take us to the $58 – $72 region, and potentially higher. We would be in the final push of a B wave, which is a 3 wave move.

If we zoom in on this move, what is worth noting is that both counts suggest a move to the $58 – $72 region.

From current levels, this is a 35% – 65% move. How TCEHY reacts in this region will determine if the more bullish blue count is in play. For any immediate entry, our stops would be between $39 – $36. If we catch the trend correctly, these stops would move higher with price.

Conclusion:

Similar to our analysis on Baidu, we foresee China’s push for domestic tech to be a force to contend with when it comes to AI. We could not be clearer that United States stocks are richly valued at the moment, and it’s quite difficult to find a good deal on tech in this market. Should we look toward China for alpha, it would be brief and a decision based on technicals. This means a position ranging from 1 day (should the setup fail) to a couple of months maximum. The weekly webinars and trade alerts are especially informative in this case, which is why the analysis is not shared with subscription tiers that do not have access to these Premium benefits. China is risky, Tencent is not audited, and is an OTC stock, and there are geopolitical tensions to navigate. With that said, the likelihood is high that we will attempt this half-court shot, so keep an eye out for the trade alert.

Knox Ridley, Beth Kindig, and the I/O Fund Analysts, contributed to this analysis

Recommended Reading: