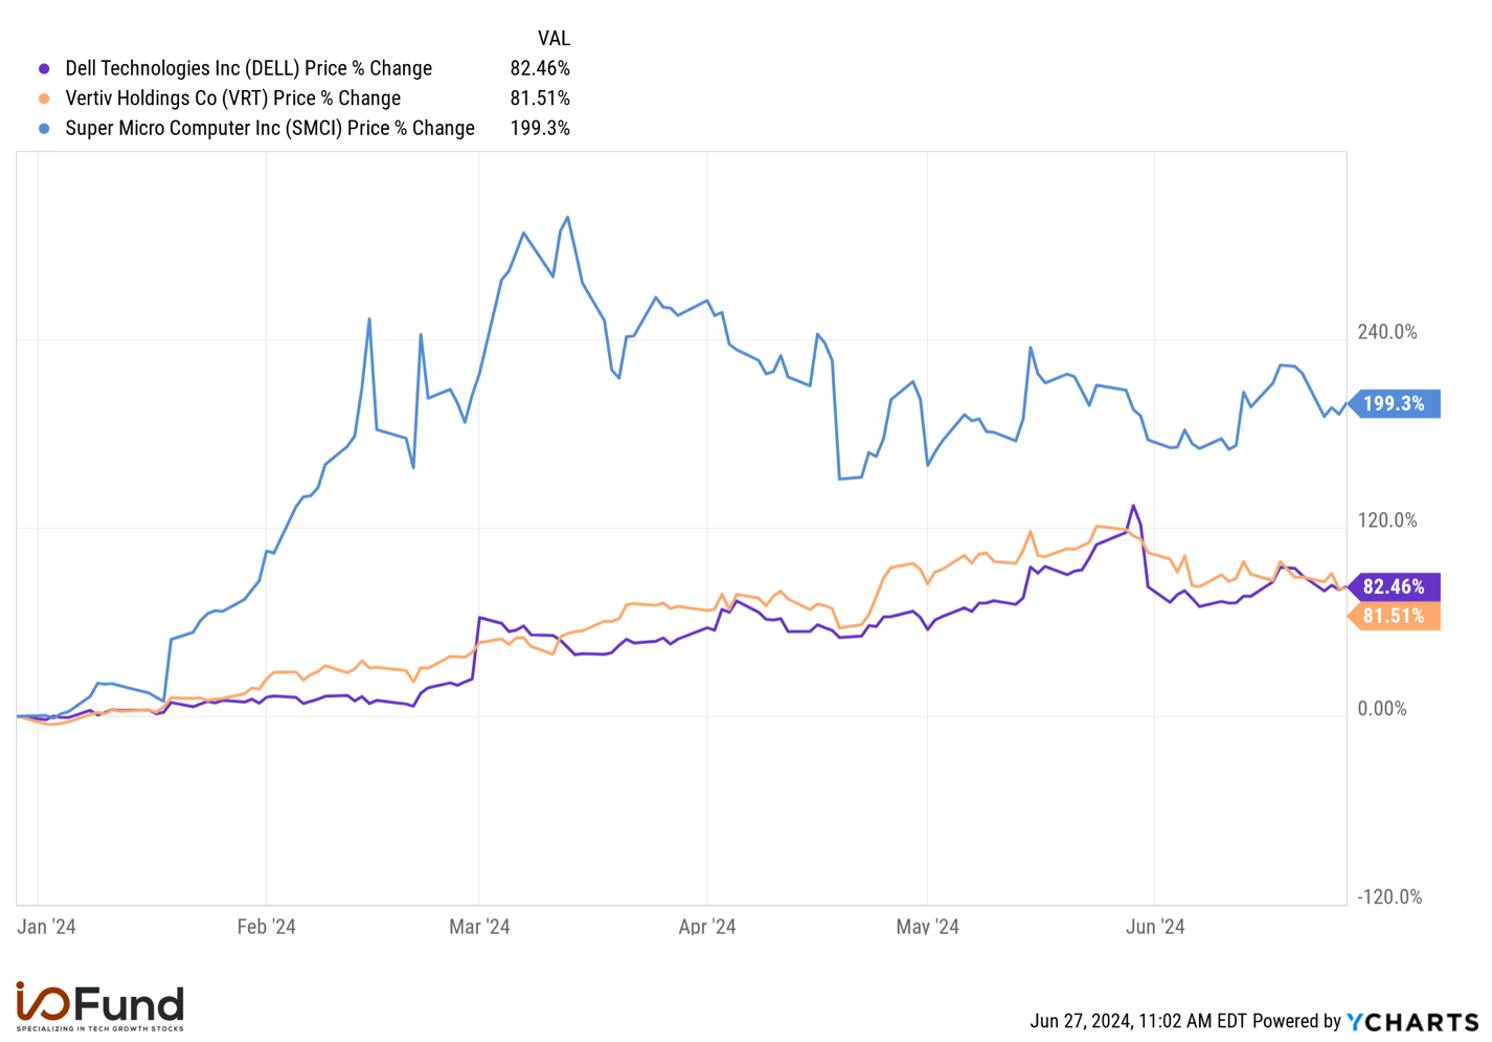
The market is currently pricing in up to three rate cuts this year, which is putting pressure on Magnificent 7 stocks, defined as Apple, Alphabet, Amazon, Meta, Microsoft, Nvidia and Tesla. Due to their global exposure, heavy cash positions and positioning within the growing AI trend, they have been perfectly situated to benefit from a bifurcated and complex macro environment. Because of this, the Mag 7 has significantly outperformed the broad market, and also led it higher for nearly 2 years.
To put this into perspective, the first six months in 2023 was the biggest 6-month rally in Nasdaq history – and since then, over a year ago now, the NASDAQ has plowed through key levels to reach a staggering 72% return in a little over 21 months. It’s not only the returns we’ve seen in 2023 and 2024 that are unusual, but the fact it happened back-to-back. Tech investors can thank the Mag 7 for this spectacular outperformance.
However, we are now getting evidence that a change is happening. As excitement over reduced rates has investors rotating into beaten down small caps and consumer facing stocks that have sat out tech’s historic rally.
By not participating, small caps and other pockets in tech that are more traditionally cash-strapped are now undervalued. Optimism around the Fed could spark a continuation of the relief rally in the Russell 2000 and further rotation out of the Mag 7. Below, we look at the pros and cons of a Mag 7 rotation and how we plan to personally handle this shifting landscape.
Why The Mag 7 Worked
The complexity of this business cycle can’t be overstated. On one hand we are seeing one of the longest and steepest yield curve inversions in market history. This signal has a near perfect track record of predicting recession, which is being backed up by a weakening consumer, and a deep and prolonged manufacturing recession that is now filtering into the services sector. On the other hand, corporate profits are healthy, the job market remains relatively tight, and AI is creating a new economy that is driving historic top line and bottom line growth for the AI leader (we think there will be many moremany more beneficiaries beyond Nvidia).
This bifurcation within the economy can be seen in equity markets. For example, markets that are dependent on a strong consumer, thrive with lower interest rates, or in need of cheap money to expand – like high beta tech, small caps, real estate, consumer discretionary – are still well below their 2021-2022 highs.
At the same time, we are seeing markets that have global exposure, flush with cash and are not dependent on the consumer, all well above their 2021-2022 highs. This is most obvious with the Mag 7, who were leading this market higher in early 2023, and continuing into today.
For this reason, we need to take a closer look at select charts within the Mag 7 to get an idea on where the market is going over the short-term, as well as the medium to long-term.
Sign up for I/O Fund's free newsletter with gains of up to 2600% because of Nvidia's epic run – Click hereClick hereClick here
Certain Stocks Within the Mag 7 Continue to Provide Clues
Our broad market analysis in 2024 has been focused on the relative performance of the Mag 7. Without question, these 7 stocks are the most important stocks in the current bull market. Historically, as long as the cycle leaders continue to move higher with the market, all is well. However, as stated in our March Report…
“When the cycle leaders start to underperform, it tends to mark the start of a trend change. The Magnificent 7 have been the undoubted leaders of this bull run, and we are now seeing them start to trend lower against the indexes. More times than not, the leaders on the way up, tend to be the leaders on the way down.”
This was the pattern that warned us about the April selloff, and again in July.
What followed our March report was a 6.3% drop in the broad market. However, high fliers like NVDA and META dropped 22%, TSLA dropped an additional 32% while the rest of the Mag 7 dropped between 15% – 10%.
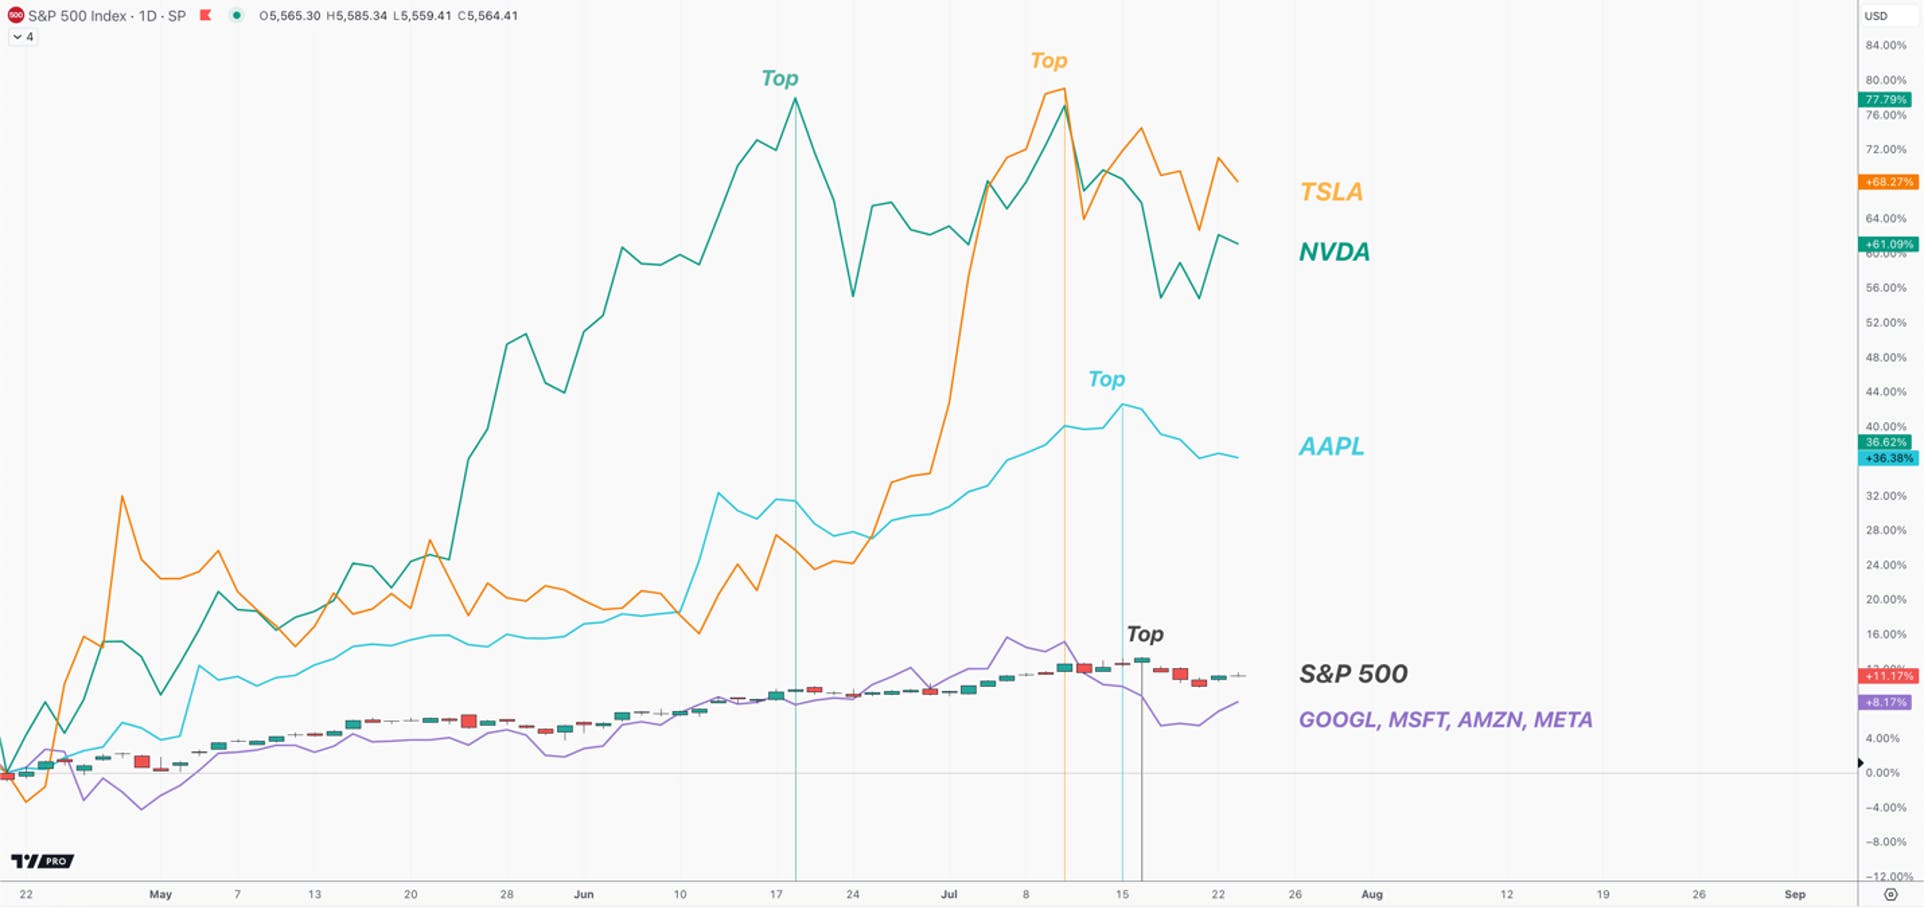
Since then, the market has recovered and resumed the bull market higher; however, we have seen new leadership emerge from the Mag 7. Since the April 19th low, the S&P 500 is up +12%, while Apple is up 32%, Nvidia is up 64% and Tesla is up 77%. Lead Tech Analyst, Beth Kindig, pointed out on Bloomberg Asia that Tesla was simply trading too low at the time, and to look for a bounce.
What is interesting is that the same pattern that we saw from the Mag 7 in early March, was also warning investors leading into the July 16th high.
Nvidia first started making lower highs on June 10th, followed by Tesla on July 10th, and then finally Apple on July 15th. So, while the broad market continued to make higher highs, it was doing so without its leaders, signaling that trouble is likely ahead.
What The Majority of the Mag 7 is Saying Now
The divergence above within the Mag 7 stocks warned us of the coming volatility. We can use further analysis of these important stocks to help tell us what the market may do next.
Of the Mag 7 charts, Apple, Microsoft, Nvidia, Amazon and Google are the clearest. They all suggest that what we are seeing is a correction within a larger uptrend, and that it is likely that we see higher levels in the coming weeks. While Meta and Tesla can be interpreted in the same way, they are not as clear as the ones we will discuss below. For reference, the 5 stocks below account for ~28% of the S&P 500, and should have a very strong correlation on the direction of the broad market over the coming weeks to months.
Nvidia
Nvidia is the most important stock in the current bull market. Within the most recent bull market, it has gone from a top 25 stock in the S&P 500 to now the 2nd most valuable company in the U.S. due to its positioning within the new AI trend. Our firm was the first to lay out NVDA’s path to becoming the most valuable company in the world. Now that it has surpassed Apple, we further presented how it has a clear path to becoming a $10 Trillion Company by 2030.
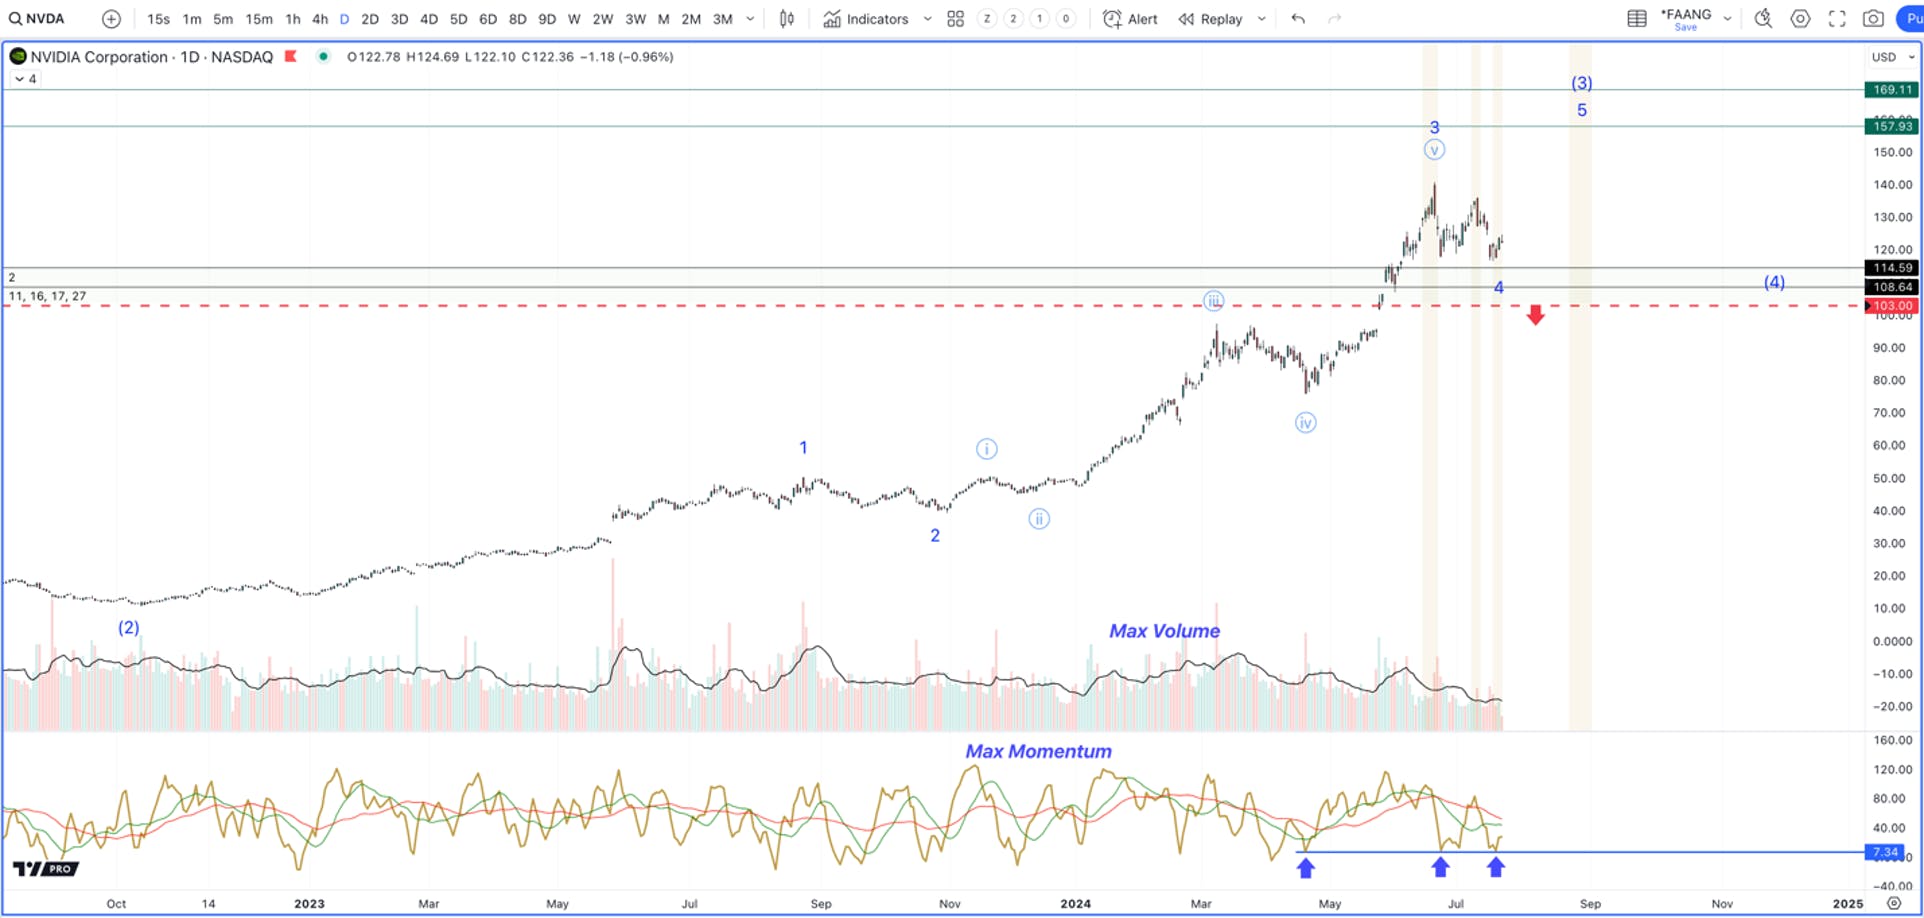
Since the 2022 low, NVDA has been tracing out a very large 5 wave pattern higher. Note the vertical move higher in early 2024. This was met with max volume and max momentum to the upside. This is the marker that you are in the most powerful moment of a trend, which is the 3rd wave. This is also around the halfway point of the entire 5 wave pattern.
The pattern appears to be incomplete. Even though NVDA topped early, the drop is a clean 3 wave pattern within an incomplete uptrend. We still need a 5th wave to new highs in order to complete the larger 5 wave move.
Nvidia may have one more drop into the $113 region before bottoming, but appears to be developing a bottom right now. Look at the momentum indicator below. It is bottoming in the exact same region the April low tagged, and it is doing so while price is much higher. These are the type of bottoming signals we look for when degerming a low is close within a developing uptrend. As long as any further drop holds $103, we expect NVDA to push higher.
Apple
With Apple’s push into bringing AI to the consumer, coupled with the likelihood that the Fed will lower rates soon, Apple has stopped becoming a laggard and is instead one of the leading Mag 7.
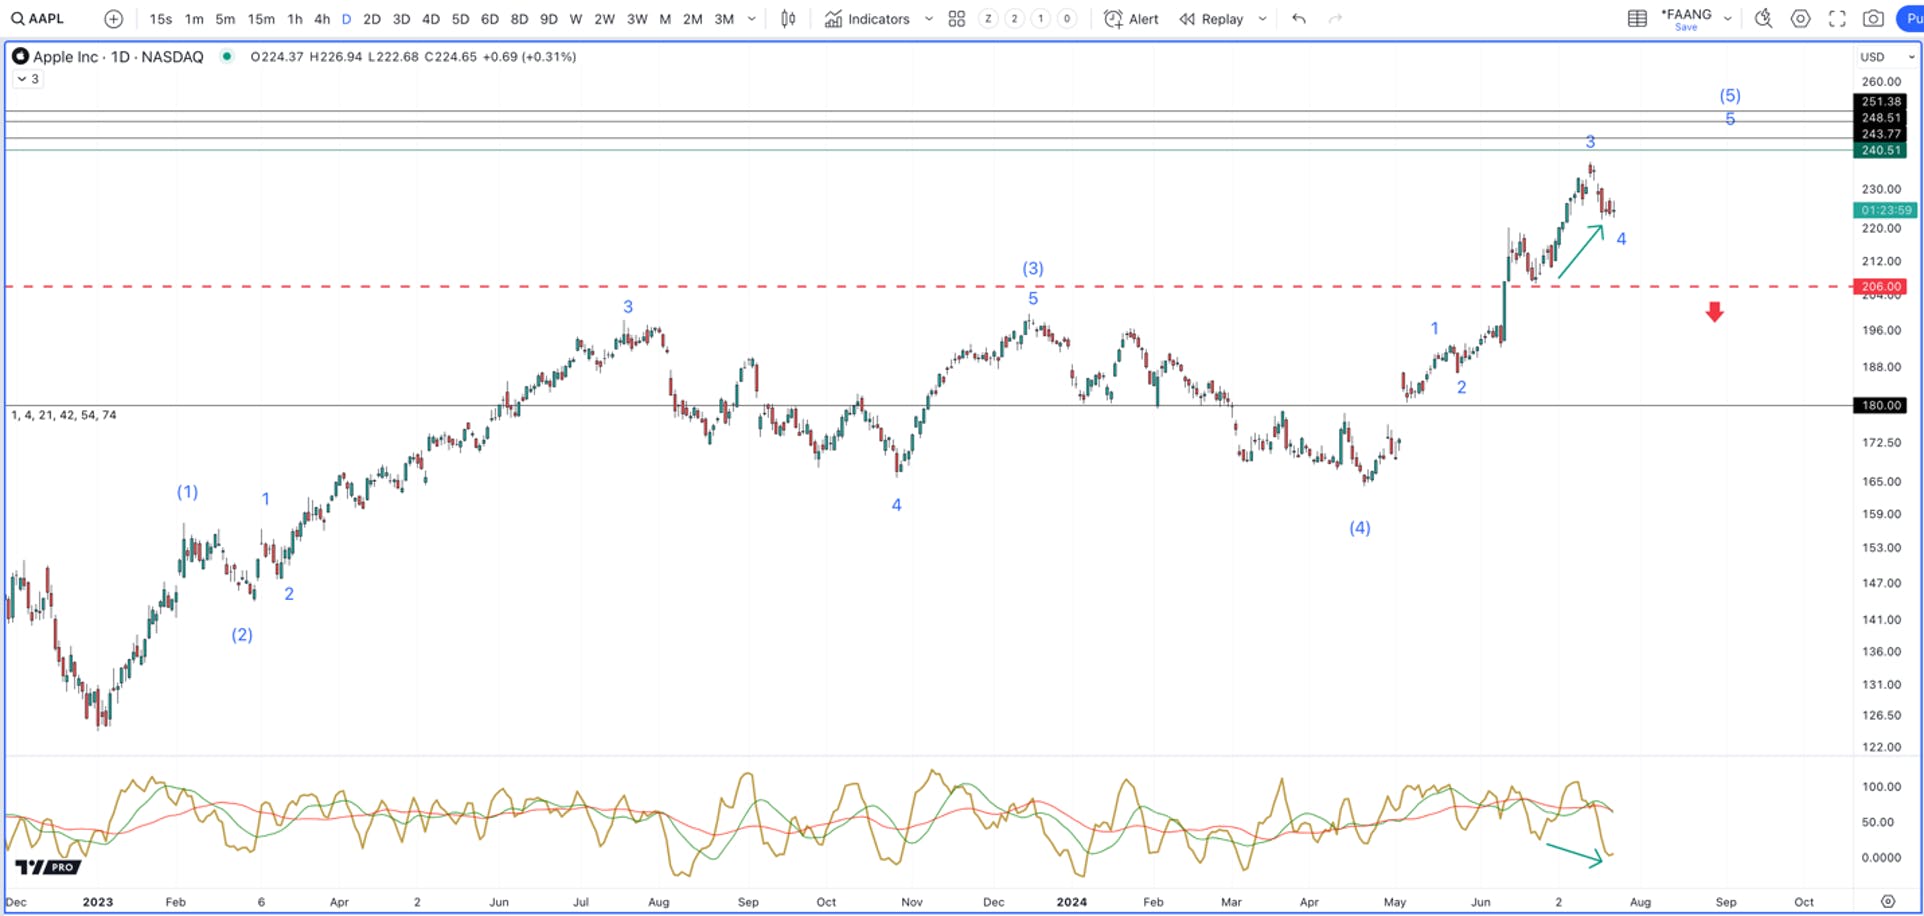
It appears to be a bit further along in its uptrend pattern off the 2022 low. While NVDA needs a large degree 5th wave, Apple is missing a smaller degree 5th wave. Like NVDA, the pattern is incomplete while giving us clear bottoming signals.
Note how the momentum indicator is making a lower low from the June low into today’s low. This is happening while price is making a higher low. This is the type of pattern we see in on-going uptrends, and supports that we should see another swing higher into late summer/early fall. As long as Apple hold over $206, we expect to see this move higher manifest.
Microsoft
Our firm recently closed MSFT for a sizable profit due to valuation concerns. While the chart does suggest it has one more swing higher, we see other stocks within tech having more upside in both valuations and technical targets. For this reason, we have rotated these gains into Nvidia, as well as other AI stocks that we have been targeting for months.
However, like Apple and Nvidia, Microsoft is a bellwether for the broader market and an important stock to cover. It is very rare to see MSFT move against the market, and when it does, it is a sign of a brewing trend change.
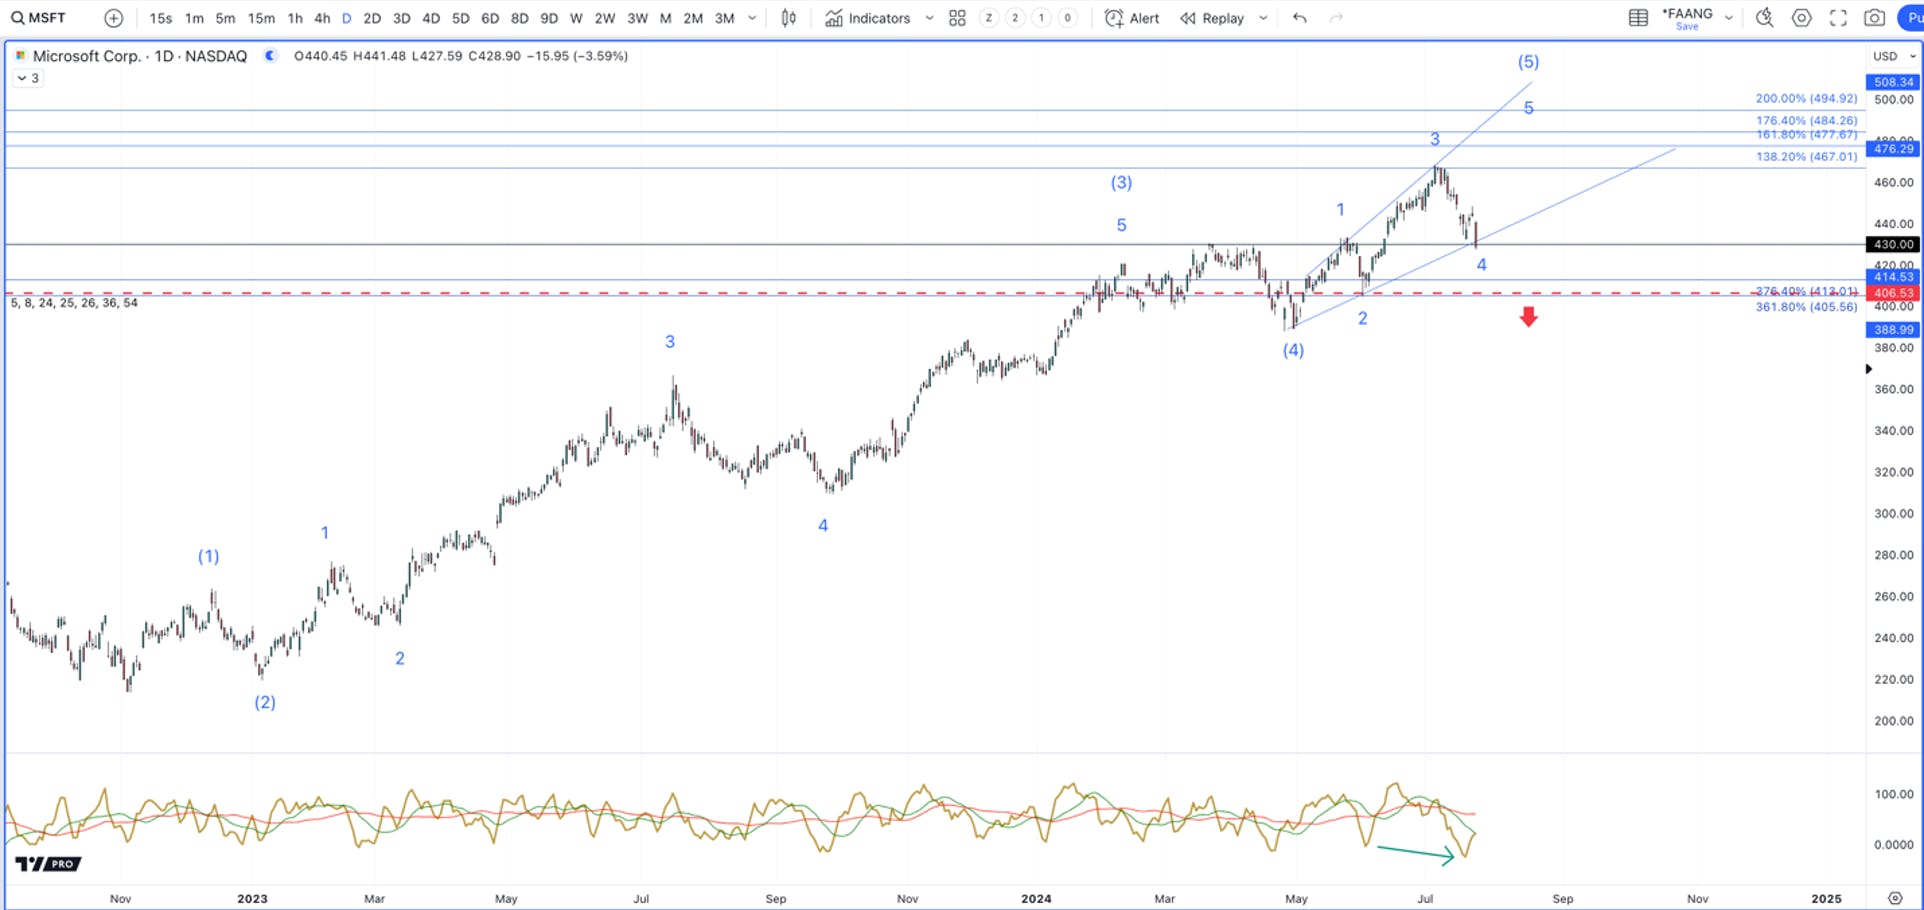
The below chart shows a very mature uptrend off the 2022 low. We have a very large 5 wave pattern that is suggesting it has one more swing left. This would be wave 5 of a larger 5th wave, and is estimated to be anywhere between 8 – 15%.
We are seeing similar bottoming patterns in MSFT as we saw in AAPL. Microsoft appears to be completing what looks like a 4th wave drop. As long as any further weakness holds $406, I expect a final 5th wave push in the coming weeks.
Amazon
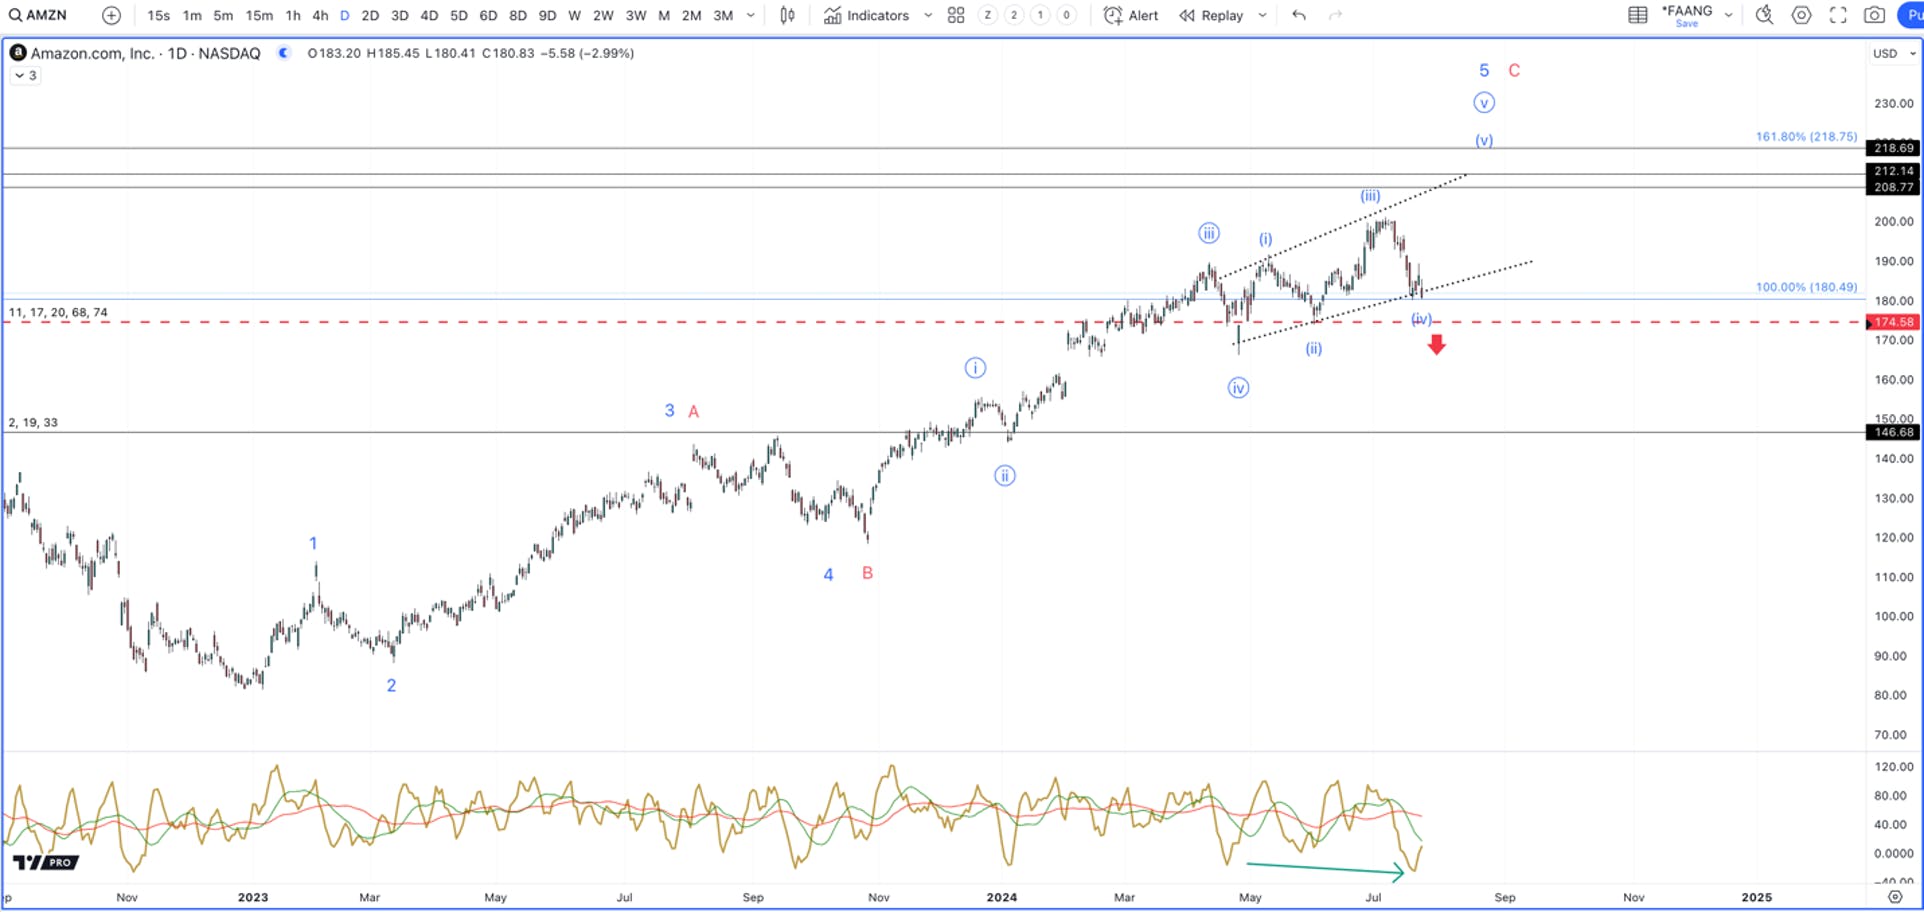
Amazon looks a lot like MSFT and AAPL. It is tracing out a 5 wave pattern and needs the final 5th wave higher to complete the uptrend. The current drop also appears to be a 4th wave and showing bottoming signals like the above charts. As long as AMZN can hold $174.50, we expect a 5th wave bounce in the coming weeks.
Google
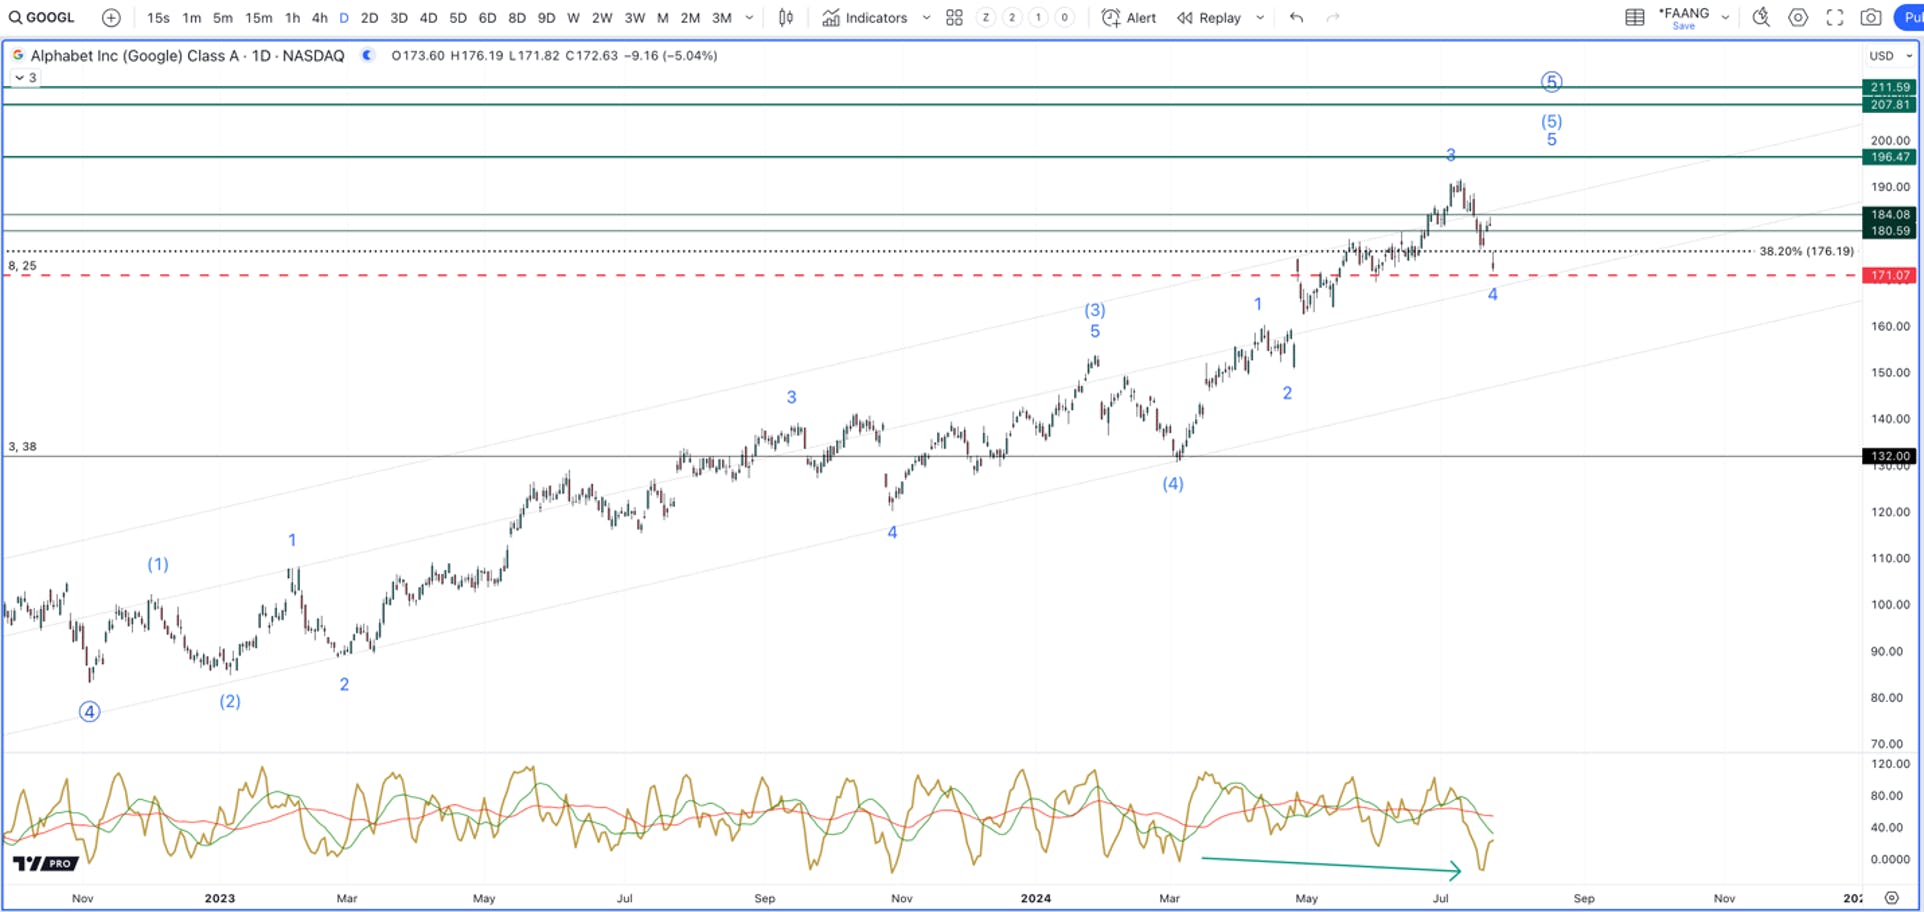
Google is making a lower high while it is at extreme oversold conditions. Like the above charts, it looks like it needs one more high to complete the larger 5 wave pattern. As long as any additional weakness can hold $169, it looks like it needs a 5th wave bounce to complete the bigger uptrend.
Broad Market
The broad market in the S&P 500 is signaling the same push higher that we are seeing in the above key stocks. While it appears that we have another move higher to look forward to, according to the larger pattern in play, the next move will likely be the final move we see before having to contend with, at best, a multi-month and deep correction.
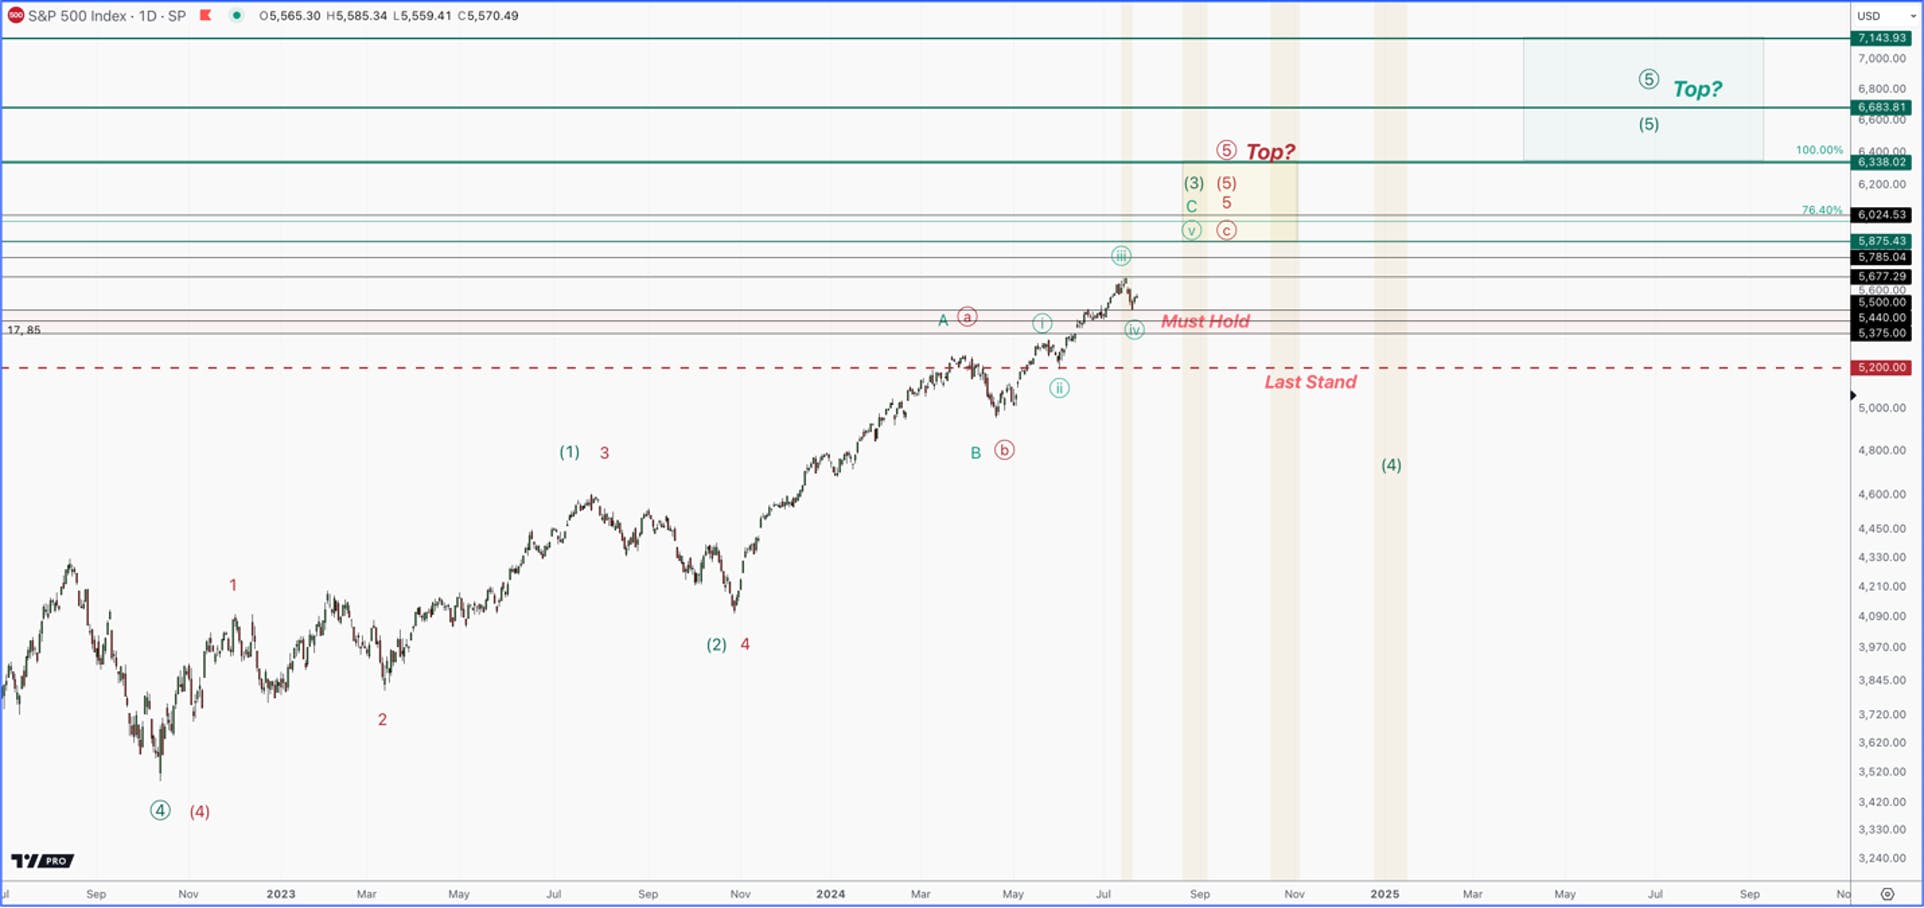
The pattern that the S&P 500 is tracing off the 2022 low is what is called an ending diagonal pattern. It is the only pattern that can account for the messy, overlapping moves that we have seen in both directions. The only question is what degree of a 5 wave pattern is in play, which is what my two counts represent.
Green – This count has the 2022 bear market as a large degree 4th wave in the secular bull market that started in March of 2009. That would put us in the final 5th wave, which is developing as a large ending diagonal pattern.
These patterns are 5 wave patterns that overlap. More times than not, the 4th wave will go be so deep, as to move into 1st wave territory. The next swing higher would be the final move in the 3rd wave, which would be targeting 5850 – 6340. Once this 3rd wave ends, the 4th wave would likely be a multi-month drop and on the larger side of a bull market correction. This would set up a tremendous buying opportunity, once completed.
Red – This count has us in a smaller degree ending diagonal pattern. It has an extended 5th wave that is playing out. The targets would be the same as above, 5850 – 6340 SPX. However, unlike the green count, we would not see a 5th wave to new highs, but instead a lower high in a much larger downtrend.
As long as any further weakness holds over 5375 – 5200, we should continue to see the bull market continue for another move higher. Below this level decrease the odds of this happening. The final support for any pattern that can take us higher would be 5,200. Below this level and the larger period of volatility will have likely begun.
Small Caps
The June CPI numbers came in softer than expected. This coupled with weakening economic data, triggered the market into a rotation based on the expectation that the FED will have to cut rates sooner rather than later. As a result, the Russell 2000 is up about 9% from that moment, while the Mag 7 are down an average of 13%. Furthermore, we are seeing an expansion of breadth into more consumer based value stocks as well as some high beta names.
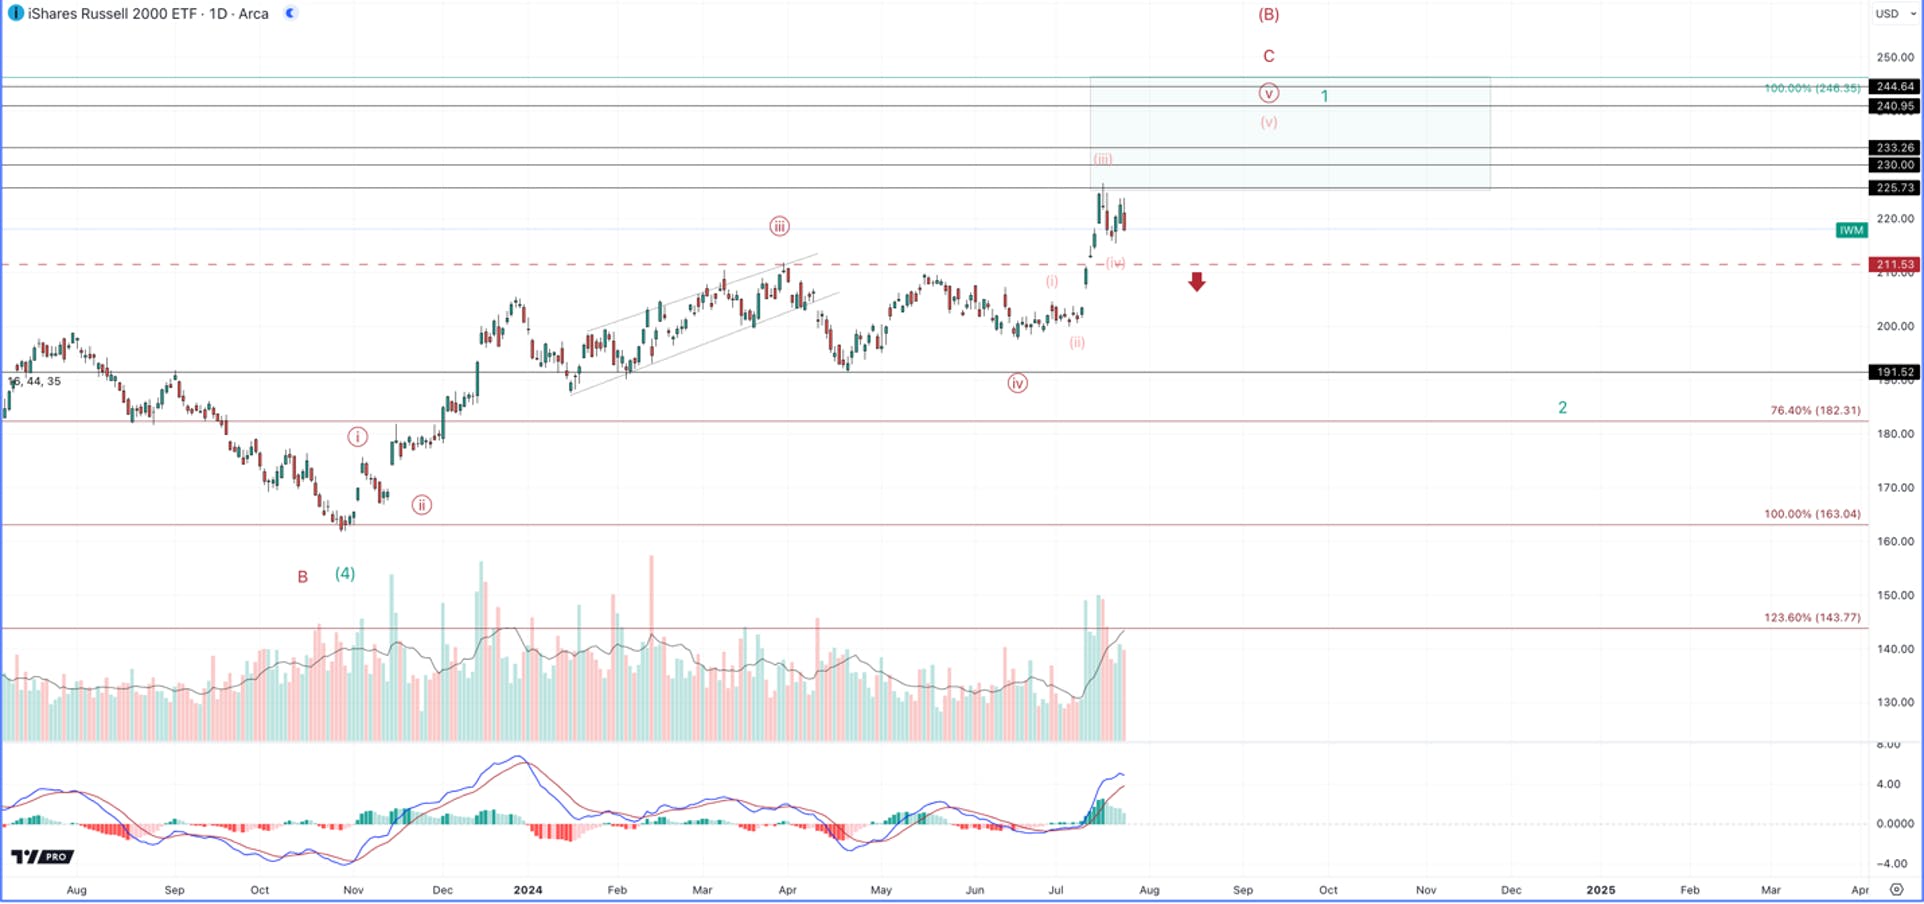
As stated, it appears that the majority of the Mag 7 and the S&P 500 are supporting another push higher. This is also supported by small caps. The benchmark for small caps, the Russell 2000, for example, appears to be in a 4th wave correction, which is around the halfway point of the move higher. As long as any further weakness holds $211 (IWM), like the rest of the markets and stocks we covered, it should continue higher before putting in a more meaningful top.
The broads Small Cap Index is also suggesting that a low is being put in and we should see another swing higher. The upside pattern is incomplete and likely around the halfway point of the move higher. However, we do still believe this is a stock pickers market, so we have positioned some of our portfolio into select small cap positions that have exposure to AI. While the rotation into small caps may continue, it looks like the bulk of this rotation is complete, as the broad market is setting up the next leg higher.
Realized Volatility
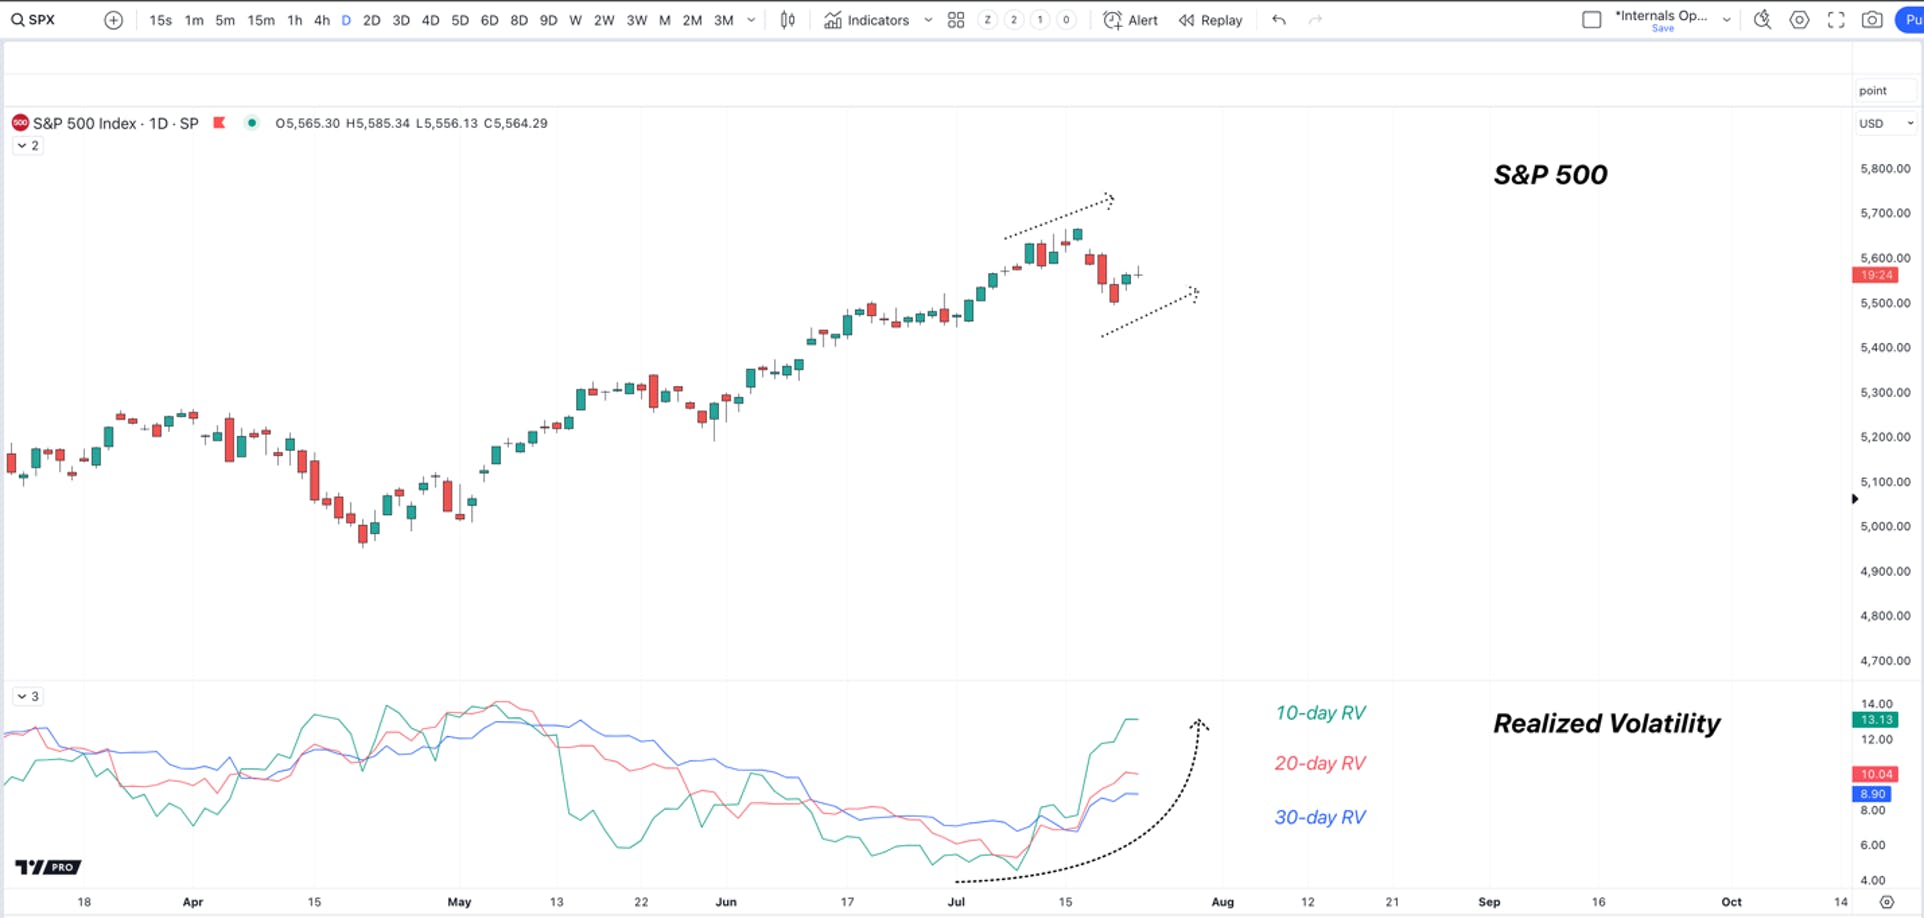
Realized volatility (RV) is a measurement of price swings on a day-to-day basis. The lower RV is, the smaller swings in either direction are to be expected. Ideally, you want to see RV trending lower as price moves higher. This tends to mark a healthy uptrend.
The best way to think about Realized Volatility is as a measurement of liquidity entering or exiting the markets. The more liquidity there is, the smaller the moves we tend to see, as the market continues to grind higher. The higher Realized Volatility goes, the less liquidity is in the market – i.e., big money is raising cash, which can cause larger swings in the market.
What matters to me is how Realized Volatility is trending with the market. This is what we are seeing today. Look at the 10-day, 20-day and 30-day measurement of Realized Volatility is trending up with price. The last time RV hit these levels that we last around the April low. This is significant, as it is indicating that liquidity is leaving the markets while price is much higher.
As long as Realized Volatility continues to trend higher with price, it is a warning that liquidity is exiting. However, this also means that less liquidity can propel the markets higher up to several months.
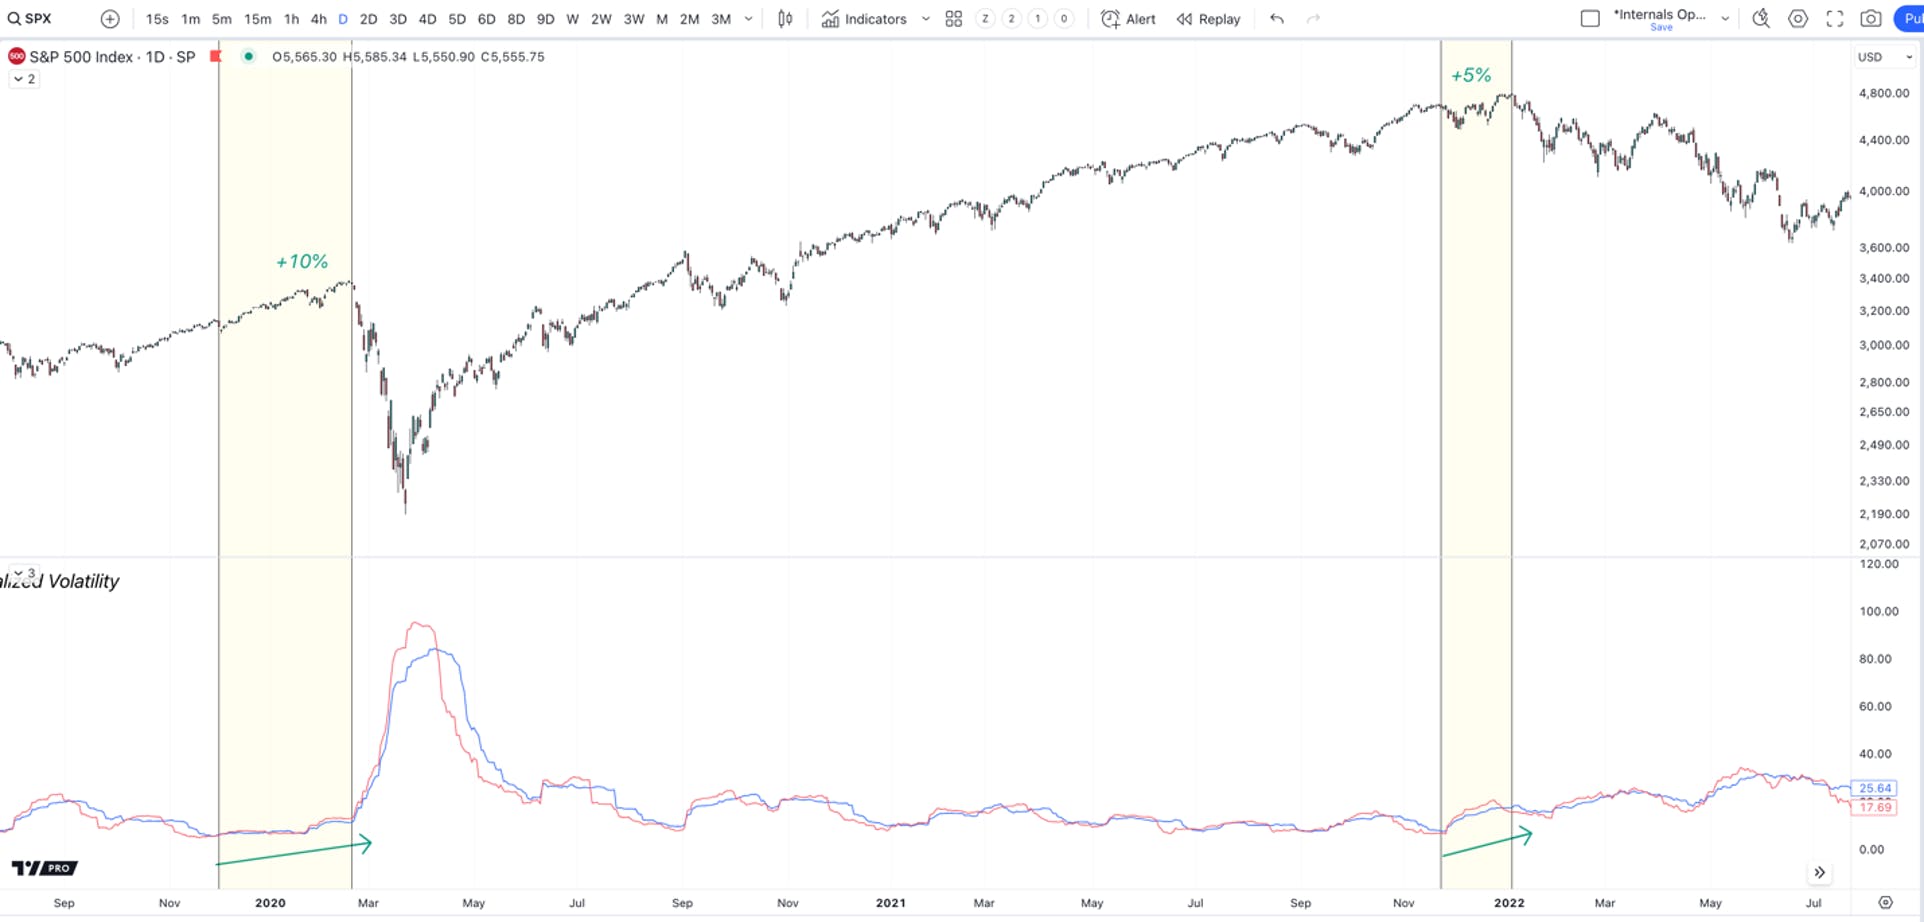
Note the two most recent periods this happened – 2020 and 2022. Once we saw RV start trending higher with price in 2022, we only saw a 5% move higher over a 1.5 month period. However, in 2020, this trend lasted for +3 months and led to a 10% swing higher in the markets.
Conclusion
In conclusion, the stage is set for a meaningful move higher, if we can see SPX break above 5670. While less liquidity tends to mark the early warning of trend reversals, it also means that any bullish catalyst can propel the markets higher in larger than normal daily swings. This lines up with what the majority of the Mag 7 is suggesting – a 5th wave rally to new highs is needed to complete the larger uptrend.
As long as the supports listed hold, this is what we are expecting. While the next move higher could last anywhere from a few weeks to several months, it’s important for investors who are buying the dip to realize the risks involved within the larger picture. While being nimble can pay off handsomely in moments like this, not having a risk management plan can do the opposite once the market rolls over.
If you are sitting on outsized gains from the current bull market, looking to protect those positions, or interested in owning AI leaders at reasonable prices, join us each Thursday, at 4:30 EST for our premium members webinar. This week we will discuss our risk management plan, buy and trim targets for various AI positions as well as crypto. Learn more about I/O Fund’s premium services herepremium services here.
Please note: The I/O Fund conducts research and draws conclusions for the Fund’s positions. We then share that information with our readers. This is not a guarantee of a stock’s performance. Please consult your personal financial advisor before buying any stock in the companies mentioned in this analysis.
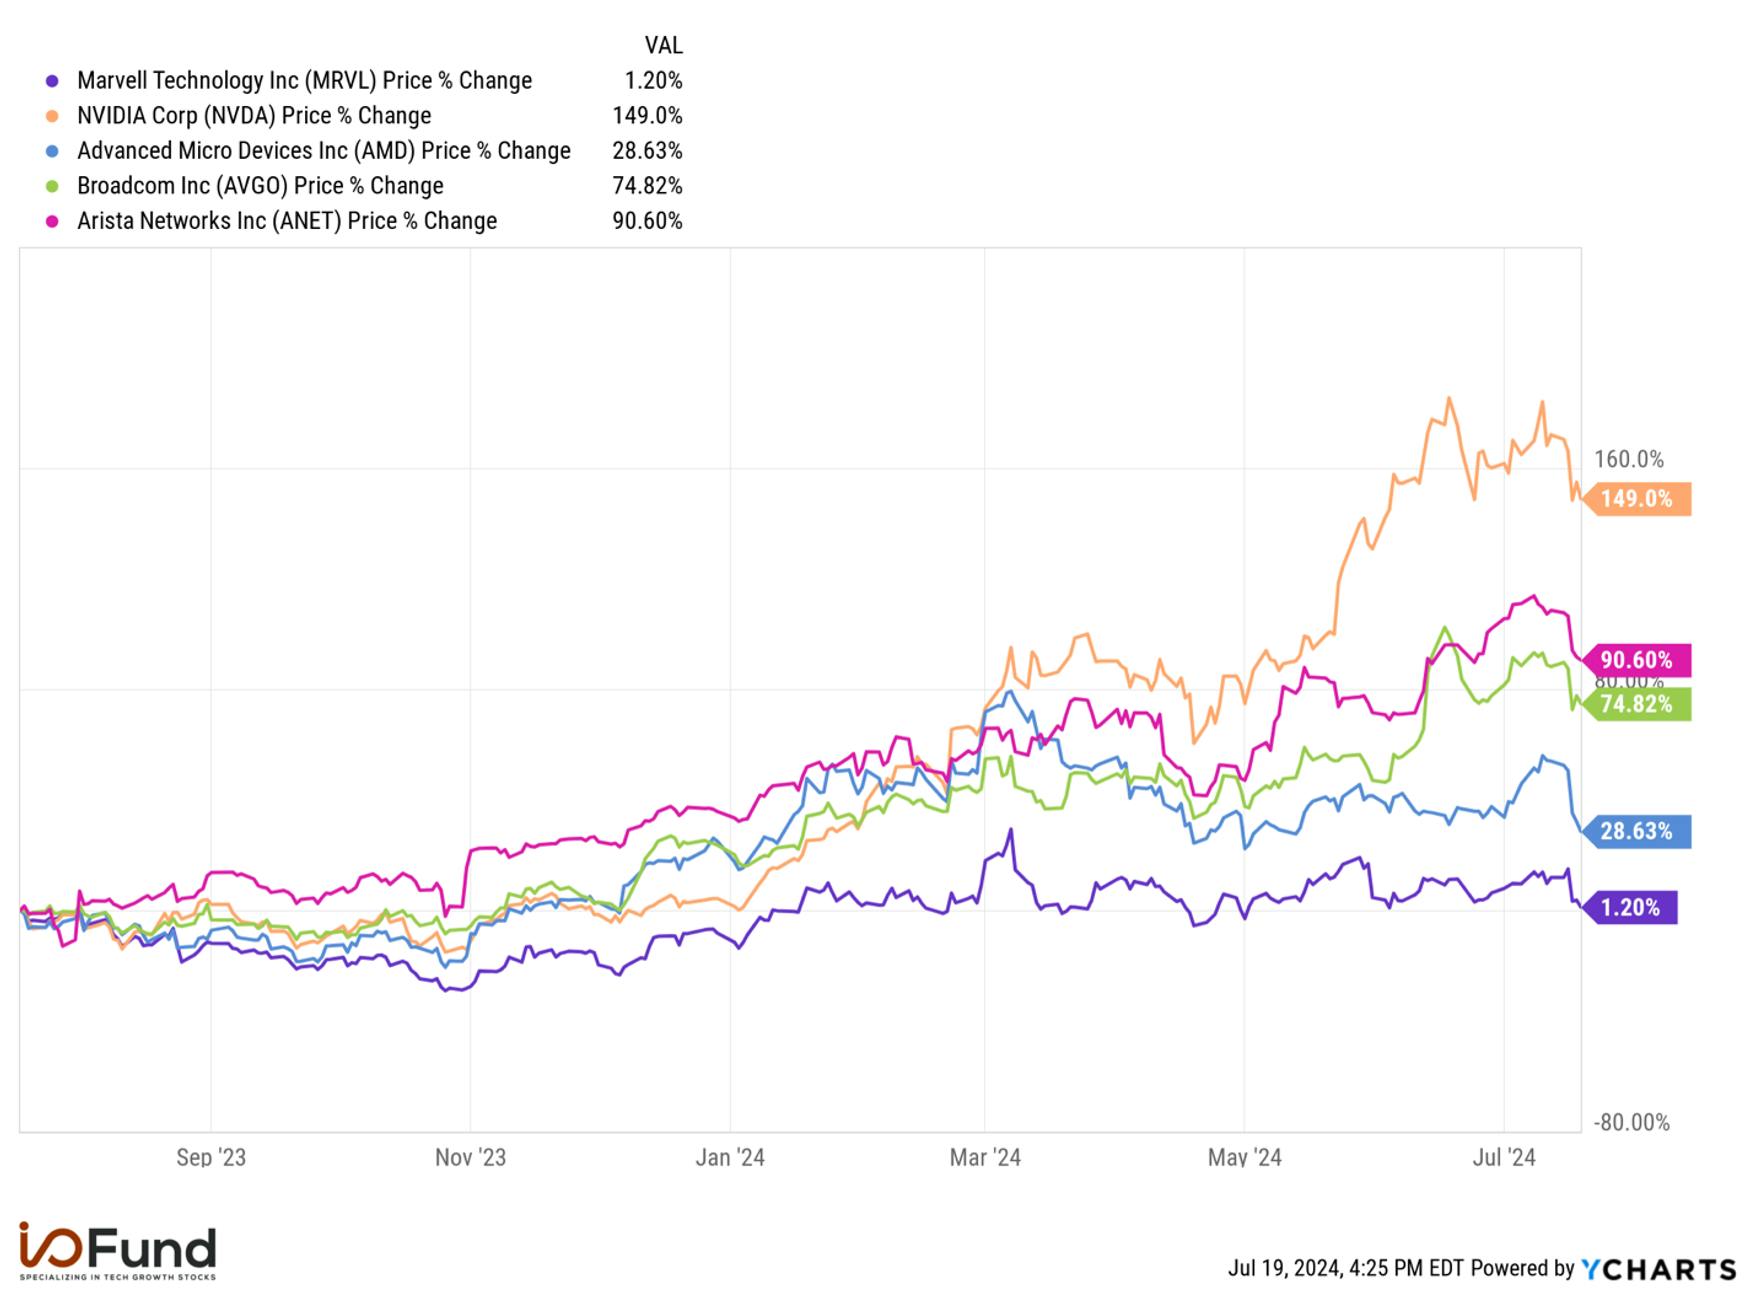
Marvell is one of the earliest semiconductor stocks we’ve covered on our site, dating back to November of 2019 when we first covered application-specific integrated circuits (ASICs), commonly known as custom slicing. Despite having a clear AI story, Marvell has lagged other AI stocks over the past year:
Our last position in Marvell was bought at $56.90 in June of 2023 and closed at $77.19 in March of 2024. Not bad, but not great. At the time of closing the stock, it was becoming clear that Broadcom was the stronger near-term story when my last analysis stated: “As I left the Marvell call and moved along to join the Broadcom earnings call, there is no doubt which company is stronger right-here, right-now. It’s Broadcom. Marvell has a strong product story but it’s in a sea of AI whales that are ramping quickly.”
Despite closing Marvell, the stock remains on the list of our top 10 ideas. There is abundant AI potential buried by other segments that are in a steep, cyclical trough. As we look on the horizon, CY2025 has the makings of a solid comeback for this often-overlooked AI stock.
Marvell’s Fiscal Q1 2025 Financials:
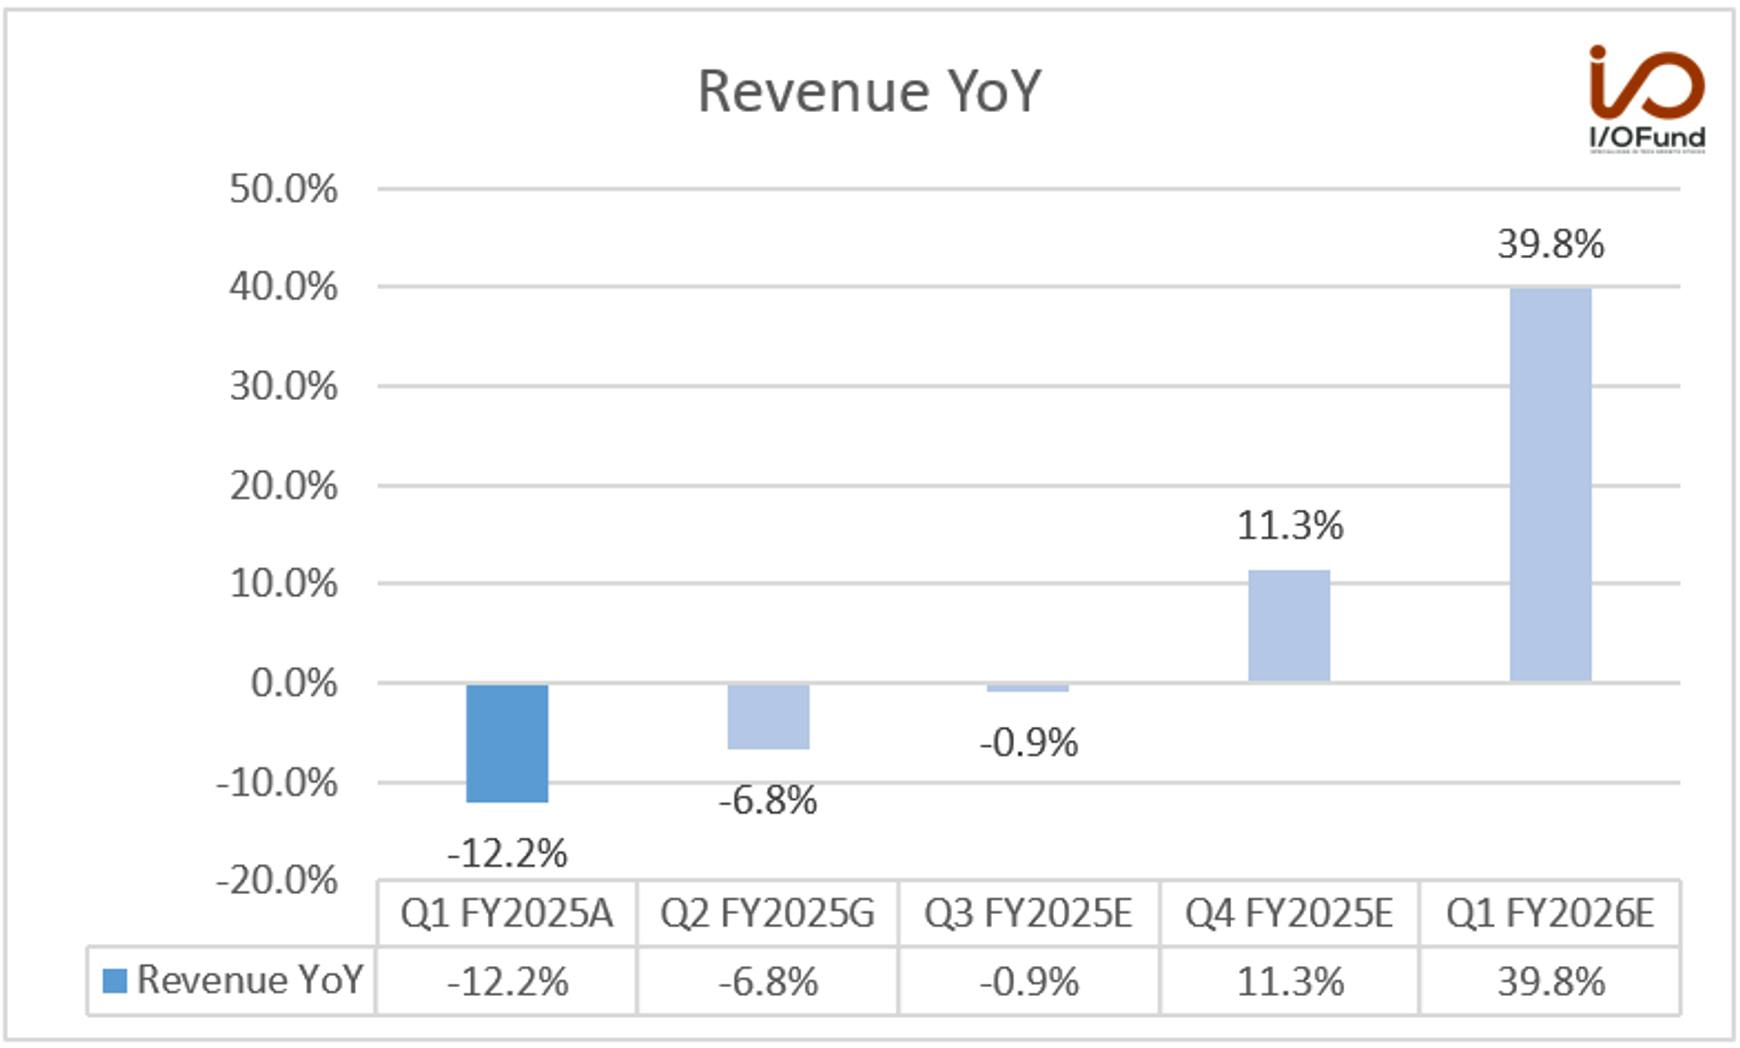
For fiscal Q1 ending in April, Marvell reported revenue growth of (-12.2%) for revenue of $1.16 billion. This marginally missed estimates by (-0.1%). The revenue growth is the lowest since we’ve tracked the stock, dating back to 2021. According to analyst consensus, this should mark the bottom with sequential growth of 8% next quarter.
For fiscal Q2 ending in July, management guided revenue of $1.25 billion, at the midpoint, representing a decline of (-6.8%). According to consensus, this will be the first quarter to report sequential growth of 7.8%, and the sequential growth is expected to continue.
Here is some more information on the rebound that is materializing:
Fiscal Q3 ending in October is expected to report (-0.9%) YoY for $1.41 billion, which will represent QoQ growth of 12.8%.
Fiscal Q4 ending in January is expected to report 11.3% YoY for $1.59 billion, which will represent QoQ growth of 12.7%
Fiscal Q1 ending in April is expected to report 39.76% YoY for $1.62 billion, which will represent QoQ growth of 1.9%.
When looking on a fiscal year basis, it’s easy to see that Marvell’s stock is struggling due to cyclical segments. This is not unique to Marvell as the recovery in consumer electronics, automotive, and telecom has taken longer than anticipated. As a reminder, these segments surged during the pandemic and during a long period of quantitative easing. Now, semiconductor companies are collectively weathering a deep trough that began in CY2022.
For FY2025 ending in January, analyst consensus is for (-1.88%) on revenue of $5.4 billion – yet, twelve months ago, FY2025 estimates were for growth of 17.8% for revenue of $8.40 billion. What’s interesting is that AI is doing better than expected, and it’s the other segments that created the twelve-month disparity.
For FY2026, the estimates have gone up but not due to higher revenue, rather due to lower comps. The growth rate of 32.6% for FY2026 is expected on revenue of $7.17 billion. This is a bit lower than the $7.52 billion expected for this fiscal year twelve months ago.
What this situation represents is a lack of confidence in both management’s tone and analysts’ financial modeling in predicting when consumer-driven segments will see a sustained recovery.
Marvell is not GAAP profitable due to recent acquisitions and the related costs, and also stock-based compensation sits at 11% of revenue.
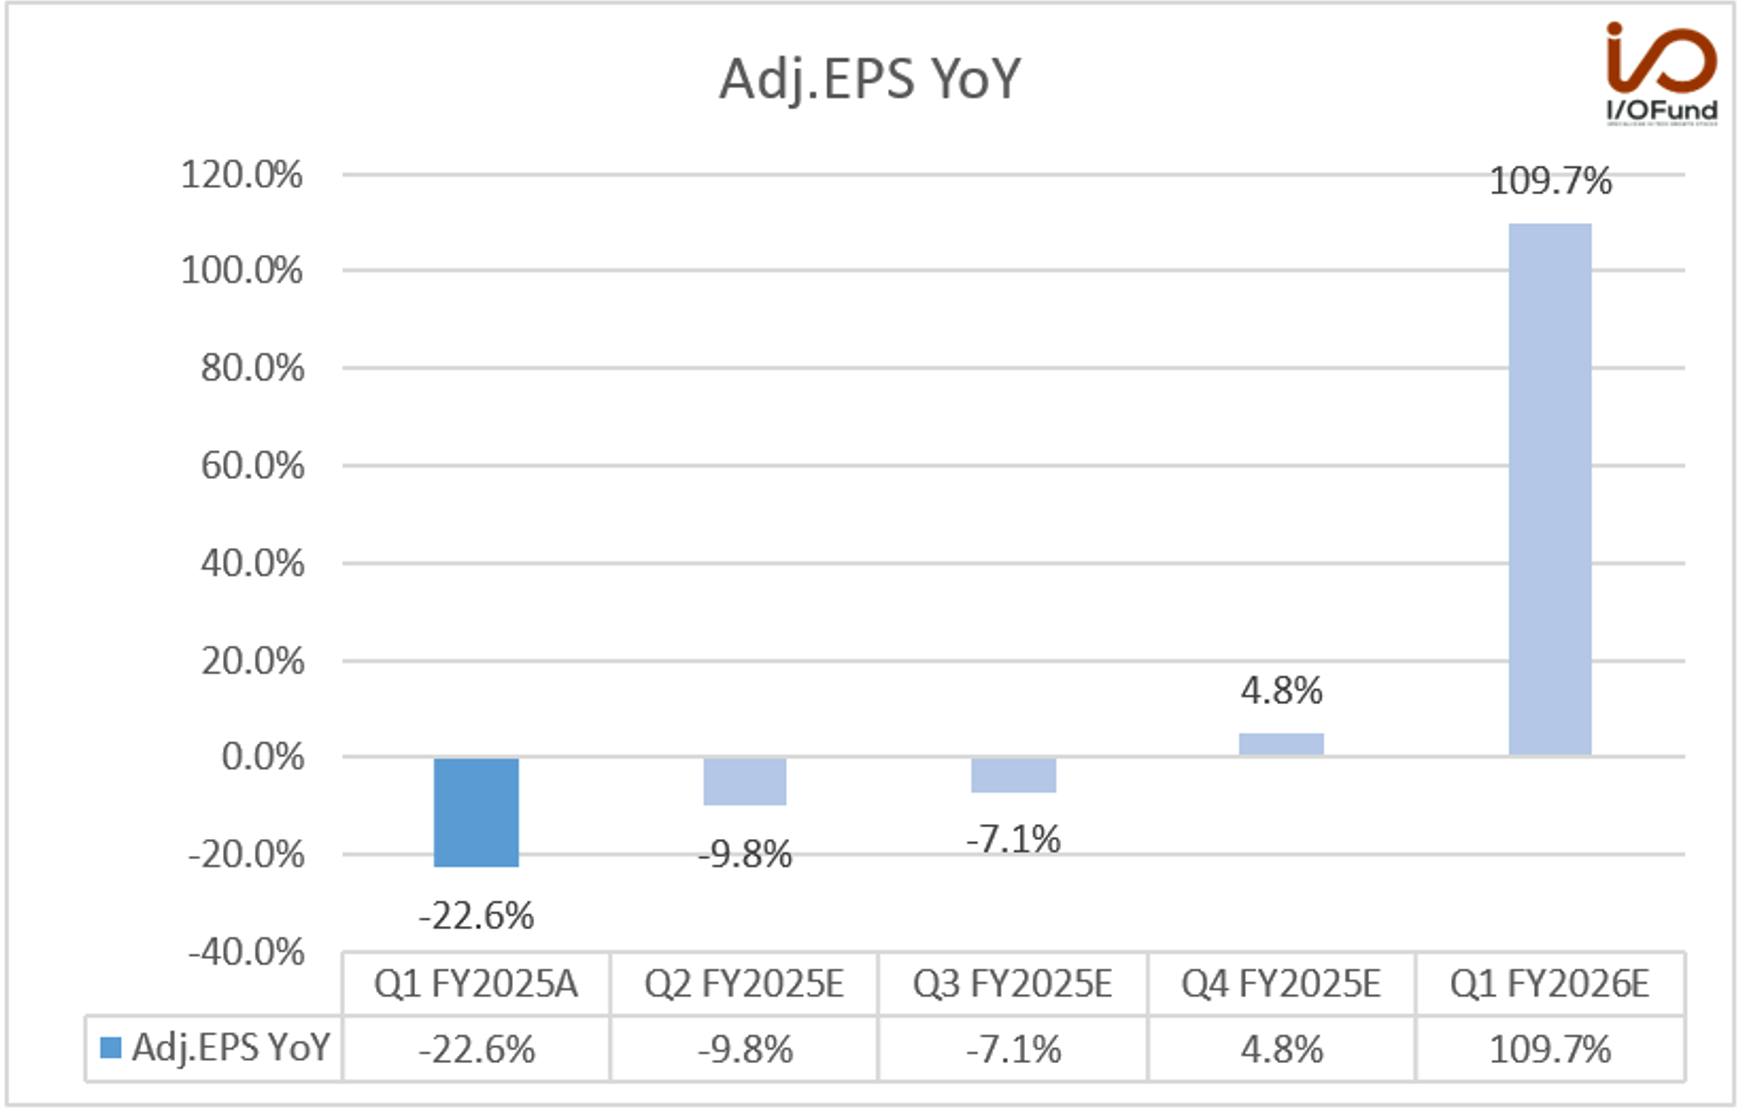
In the most recent quarter, the company reported GAAP EPS of ($-0.22) which missed estimates of (-$0.25). Adjusted EPS of $0.24 was in line. According to analyst estimates, this is expected to be the bottom with sequential growth beginning in the July quarter.
For the upcoming quarter ending in July, the company is expected to report adjusted EPS of $0.30, representing a YoY decline of (-9.78%).
Here is what the rebound looks like on the bottom line. We can reasonably assume Marvell will be GAAP profitable again sometime during FY2026. Notably, this depends on the other segments as growth in AI accelerators (custom silicon) weighs on margins.
On a fiscal year basis, Marvell is expected to see the following:
FY2025E adjusted GAAP EPS of $1.40 for a decline of (-7.5%)
FY2026E adjusted GAAP EPS of $2.46 for growth of 76%
FY2027E adjusted GAAP EPS of $3.33 for growth of 35%
Key Segments:
For the past two quarters, the data center has been growing rapidly, and has reached a historical high. This is notable given Marvell completed a large data center-focused acquisition a few years back (Inphi) which provided immediate, accretive data center revenue.
Data center revenue in the current quarter was $816.4 million, up 87% YoY and up 7% QoQ. This is on the heels of another historic data center quarter of $765.3 million, up 54% YoY and up 38% QoQ. The data center outperformance comes from electro-optics and interconnect products, whereas custom silicon saw “initial shipments” in the quarter. Looking to next quarter, management expects data center to grow in the mid-single digits “as our custom AI silicon continues ramping.” It was mentioned on the call that optical interconnects are up against a tough comp, and thus, will be flat QoQ but will still perform well YoY.
“I'd say in the short-term, the way to think about the optical business into July is we're modeling it right now and our guide is flattish to slightly up. And the reason for that is we outperformed pretty big both in Q4 and Q1. […] So as we look into July, we're modeling it to be flat to slightly up, it may do better, let’s see order trend come in. But year-over-year will be very strong because also in the second half to your point, those traditional standard cloud infrastructure build-outs and upgrades are going to happen.”
Of this, the company is expected to exit the year with a minimum of $1.5 billion in AI revenue in FY2025. About a year ago, we had published that Marvell was on track to report 14.4% in AI revenue when the company doubled its AI expectations to $800 million, up from $400 million.
With the current update of $1.5 billion provided in April at the AI Investor Day, the company is now on track to report 27.8% in AI revenue. Per management comments, the $1.5 billion is a “floor” and there was discussions in the Q&A on the likelihood the FY2025 exit rate will be higher in the next few months.
Brace yourself, however, as the other segments are deep in the red:
Carrier infrastructure was down (75%) YoY and down (58%) QoQ for $72 million. Carrier infrastructure is expected to be flat sequentially next quarter. According to commentary, the recovery in this segment is harder to predict than the others. The company is shipping a new 5nm DPU product next year that is expected to help expand 5G market share.
Enterprise networking was down (58%) YoY and down (42%) QoQ for $153 million. Enterprise networking is also expected to be flat sequentially. The recovery is expected to begin in the second half of this fiscal year.
Consumer was down (70%) YoY and down (71%) QoQ for $42 million. This segment has been weighed down from a soft gaming market, yet Marvell’s primary customer is expected to rebound and the segment is expected to double on a sequential basis.
Automotive was down (13%) and down (6%) QoQ for $78 million. This segment is expected to be flat sequentially yet will resume growth in the second half of the fiscal year.
Margins:
Gross margin in the current quarter of 45.5% is low and there were questions on the call about this (see below). Ultimately, the AI story weighs on Marvell’s gross margins but does not affect the operating margin. The guide for next quarter is gross margin of 46.2%. This will represent gross profits of $577.5 million.
Adjusted gross margin of 62.4% in the most recent quarter with a guide of 62% next quarter is low compared to the historic adjusted gross margin in the 65% range. Next quarter, adjusted gross profits are expected to be $775 million.
GAAP operating margin last quarter was (13.1%) and this is certainly a blemish in the report. Next quarter, GAAP operating margin is expected to be (8.8%) for a GAAP operating loss of $110.5 million.
Adjusted operating margin of 23.3% last quarter is lower than the historic adjusted OPM in the mid-30% range. Adjusted operating margin in the upcoming quarter is expected to be 25.6% for adjusted operating profit of $320 million.
Net margin last quarter was (18.6%) and adjusted net margin was 17.8% for adjusted net profits of $206.7 million.
Cash Flow:
Cash flow for Marvell is decent yet the debt-to-equity ratio is high.
In the most recent quarter, the operating cash flow was $324.5 million for a margin of 28%. The free cash flow was $232.5 million, for a margin of 20%. This is lower than usual due to annual employee cash bonuses. Inventory was $826 million, decreasing $38 million from the prior quarter. On a year-over-year basis, inventory has been reduced by $200 million or 20%. Days sales outstanding decreased 8 days to 69 days.
The company has $847.7 million in cash on the balance sheet and has $4.15 billion in debt. The company’s net debt to EBITDA ratio is 1.8X and the gross debt to EBITDA ratio is 2.27X.
In the recent quarter, the company returned $52 million to shareholders through cash dividends. The company also repurchased $150 million of our stock during the first quarter, an increase of $50 million from the prior quarter with expectations to increase repurchases in Q2.
Quick refresher on Marvell’s Products:
Marvell offers 200-gig, 400-gig and 800-gig PAM-based electro-optics. The 800-gig is the primary interconnect for AI deployments. The company is qualifying a 1.6T solution with 200-gig per lane for the next leg up in AI acceleration. For the 1.6T solution, Nvidia will be a lead partner. Here’s a video on Marvell and Nvidia’s partnership on optical interconnects.
Electro-optics help to increase data rates and has replaced NRZ data transmission due to doubling the bit rate. Hyperscalers require high bandwidth and port density. PAM4 connects networking ASICs and machines, like servers and AI machines. Digital-based PAM4 uses analog-to-digital converters to clean up the signal in the digital domain before converting it back to analog to transmit.
Artificial intelligence and machine learning drive demand for the 800-gig PAM to increase the speed of input-output and to process the data flows. This doubles the throughput (bandwidth) due to an 8x100Gpbs optical transceiver for inside and between AI clusters.
In the most recent earnings call, Marvell discussed their plans to compete in the PCIe Gen 6 retimer interconnect market. PCIe 6.0 will be the first to use PAM4 signaling technology. Marvell is sampling eight and 16 lane PCIe 6.0 retimers with customers, which will help data center compute fabrics scale. Per management: “AI applications are driving data flows and connections inside server systems at significantly higher bandwidth, driving the need for PCIe retimers to meet the required connection distances at the faster speeds.”
Marvell also offers data center interconnect (DCI) products, which connects data centers over various distances to transfer data, content and critical assets. COLORZ silicon photonics increase the speed of data movement while keeping power and cost low. The 400 gig ZR and 800 gig DCI products with coherent DSP (digital signal processor) extends the reach to 1,000 kilometers.
Teralynx are ethernet switches with the 800 Gb/sec Teralynx 10 built for cloud data center and AI fabrics. The company also provides Ethernet controllers and PHY transceivers, and is a competitor to Broadcom on switch ASICs in that regard. Teralynx and Broadcom’s Tomahawk will be in lock-step for the release of 1.6Tb switch ASICs.
Custom silicon refers to ASICs or application-specific integrated circuits that are customized to be “application-specific” with the benefit of becoming cheaper with volume production. ASICs are expensive at the onset, yet become cheaper with volume production. Custom silicon is attractive to Big Tech as cash is not an issue with these companies for ASICs very high startup costs (well into the millions). Big Tech also immensely popular applications to justify the non-recurring engineer (NRE) costs in developing chips for a specific purpose.
Across ASICs, the most well-known is Google’s tensor processing unit (TPU). Yet, there is a vast array of custom silicon that has hit the market since TPUs were first introduced in 2016 for the TensorFlow framework. Amazon was second to diversify with custom silicon for AI workloads with Graviton and Inferentia in 2018, and the more recent Trainium announced in 2020. Last year, Microsoft announced the 5nm Maia 100 AI chip to reduce dependency on data center GPUs, and a Cobalt 100 Arm-based CPU to increase the performance on Azure-based virtual machines for scaling web applications, microservices and open-source databases. We covered in our 2019 Marvell analysis that Microsoft was pursuing FPGAs (Xilinx), but FPGAs have now been replaced with ASICs, which is what Marvell and Broadcom offer.
Discussions on AI Revenue:
Naturally, there were questions on the guidance for $1.5 billion in AI revenue exiting the fiscal year. Regarding the current quarter, one analyst is modeling for $500 million per quarter in AI revenue.
When pressed, management hinted this is the minimum number to work with: “And then, the whole thing in flex meaningfully in the second half and I'd say from a full year perspective, the way to think about it, maybe some additional color would be, we talked about a floor of $1.5 billion for AI revenue for Marvell for this fiscal year with about two-third in electro-optics and a third in custom. . And we see now both of those exceeding that number.”
Where the market could get excited is if Marvell’s custom silicon surprises to the upside. As of now, it’s expected to contribute one-third of the $1.5 billion quoted above next year. Marvell’s custom AI silicon business is beginning to ramp and investors will see more evidence of this in the second half of this year. Per the opening remarks: “Our custom compute AI programs are beginning to shift in the first half of this fiscal year and we are expecting a very substantial ramp in the second half of this year, followed by a full year of high volume production in fiscal 2026.”
The market for custom silicon is expected to grow from $7 billion in CY2023 to $40 billion in CY2028 at a 45% CAGR. My comment is that this is probably too low; as the market is too nascent to accurately predict a higher number.
Outside of custom silicon, Marvell’s management expects the aggregated data center opportunity to grow at a CAGR of 29% from $21 billion to $75billion. There was a comment that management predicts they will double their market share from 10% to 20%: “We see a massive opportunity ahead with the data center TAM expected to grow from $21 billion last year to $75 billion in calendar 2028 at a 29% CAGR, we have numerous opportunities across compute, interconnect, switching and storage, as a result, we expect to double our market share over the next several years from our approximately 10% share last fiscal year.”
That’s quite a statement as it implies Marvell’s data center segment will grow from $3.2 billion today to $15 billion in the next several years. Given they tied the statement to the 2028 projection, then this implies a 368% growth rate on the data center segment over the next 4 years.
Notably, the statement was repeated in the Q&A: “So we articulated the AI day, a very robust custom silicon TAM in excess of $40 billion going out into 2028 time frame and that TAM growing very significantly. And yes, we — I think your numbers are about right in terms of the share. We're going to end up with near-term and then Raghib articulated our goal to drive that in the custom silicon area to 20%. So you got to draw a line kind of from here to there in terms of the opportunity.”
Looking forward, management stated the floor for next fiscal year on AI revenue is $2.5 billion, up from the $1.5 billion, as custom silicon is expected to see its first full year of volume.
On the topic of custom silicon expanding next year, this will weigh on the gross margin, yet it will help to drive a strong operating margin, primarily due to non-recurring engineering costs.
Conclusion:
We have another attempt at Marvell in the works, and we are looking closely at timing. On one hand, we may be too early and have to deal with a couple of earnings reports that are duds until we get to the rebound in 2025. On the other hand, Marvell may start to move quicker than current consensus is forecasting as it’s participating in a few explosive trends.
How the market perceives the non-AI segments until we get a material recovery in these segments is anyone’s guess. In a risk-on environment, these segments will be dismissed and the number of times a management team mentions the words “AI” on an earnings call is all that matters. In a risk-off environment, Marvell’s unfortunate exposure to telecom and gaming will mute the upside.
To put it simply, we are cautiously optimistic on Marvell. Over the next few months, we plan to revisit if we see a break above $79.
I/O Fund Advanced Members receive trade alerts and weekly webinars to discuss our entries and exits. Learn more here.Learn more here.
This article was originally published on Forbes on Jul 18, 2024,05:46pm EDTForbes Forbes on Jul 18, 2024,05:46pm EDT
We are no strangers to Palantir’s story, saying as far back as September 2020 prior to Palantir’s public offering that the “commercial sector is the growth story” for the company as it expands beyond government clientele. Heading into 2024, Palantir was exhibiting “multiple signs of acceleration” stemming from strong growth in its US commercial segment, driven by AIP, Palantir’s Artificial Intelligence Platform that lets customers lever Palantir’s AI and ML tools and harness the power of the latest large language models (LLMs) within Foundry and Gotham.
AIP and US commercial growth are still the main storyline for Palantir investors to watch moving through 2024, given the two are the pr imary growth drivers this year. A closer look in Q1 reveals that momentum is not slowing down for AIP, and US commercial revenue growth remains intact. Government revenue also bucked its trend of decelerating growth throughout 2023, rebounding from under 11% YoY growth in Q4 to 16% YoY growth in Q1.
However, Palantir’s management shed light on some potential hiccups in AIP’s sales cycle, which we outline below. Meanwhile, the market is pricing in a perfect story this year, which puts pressure on the stock to execute.
US Commercial Business Remains Strong
Palantir’s US commercial segment remained strong in Q1, with AIP driving strong customer growth as revenue growth accelerated on a sequential basis. Management continued to drill home AIP’s momentum in the quarter by saying: “US commercial business continues to see unprecedented demand driven by momentum from AIP.”
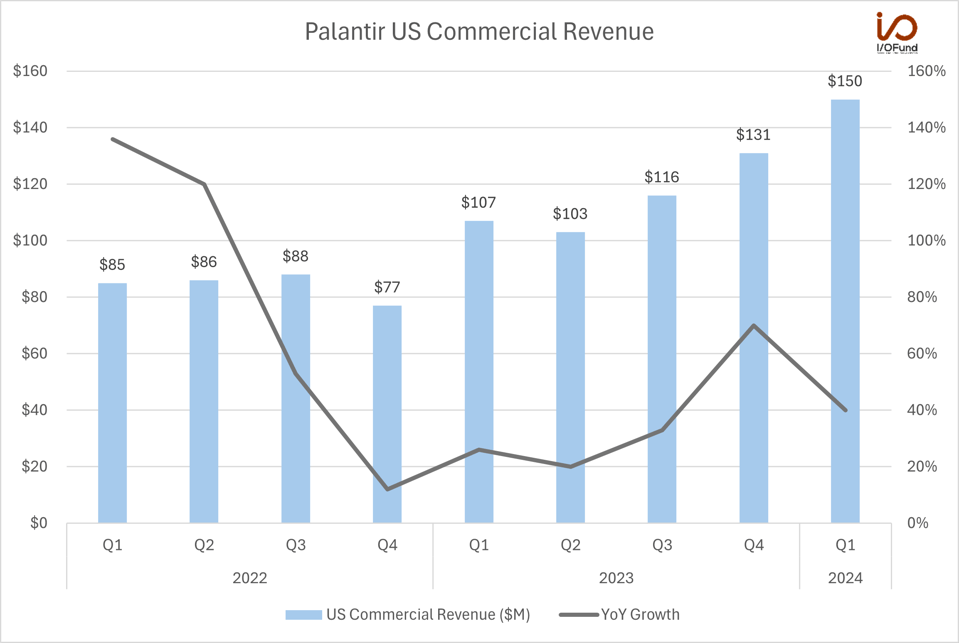
Palantir reported $150 million in US commercial revenue in Q1, an increase of 40% YoY.
Source: I/O Fund
US commercial revenue rose 40% YoY and 14% QoQ to $150 million in Q1, accelerating 100 bp on a QoQ basis. While this was technically a deceleration from 70% YoY growth last quarter, that came against an extremely weak comp, with the QoQ growth acceleration more reflective of Q1’s strength.
Management explained that the segment is “where we're seeing the greatest transformation. While Q1 is seasonally our slowest quarter, AIP adoption by new and existing customers helped drive notable growth in customer acquisition and revenue in our US commercial business.”
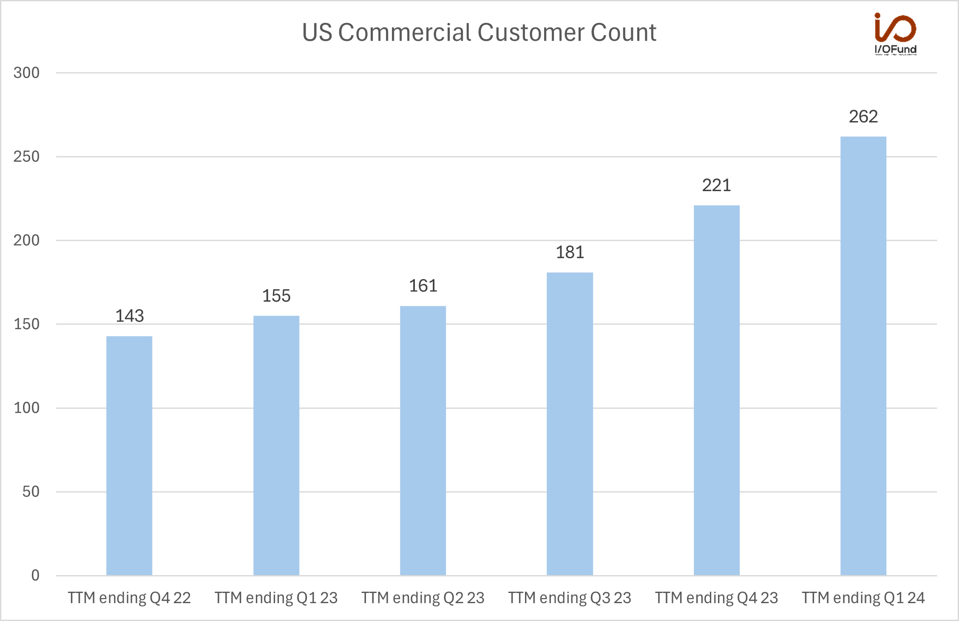
Palantir added 41 net new US commercial customers in Q1, an increase of 69% YoY and 19% QoQ.
Source: I/O Fund
Palantir added 41 net new customers in the segment, an increase of 69% YoY and 19% QoQ. This accelerated from 55% YoY growth in Q4. We also saw customer additions broaden beyond the US this quarter – the commercial segment (including international) reported total net new adds of 52. As a whole, commercial customer count rose 53% YoY and 14% QoQ to 427 customers.
This means that the commercial segment, driven by US commercial, once again dominated net new adds in the quarter. US commercial contributed 41 (and commercial 52) of Palantir’s 57 net new additions, or ~72%, compared to more than 90% of net new adds last quarter; the entire segment still contributed more than 90% of net new adds with international growth.
Sign up for I/O Fund's free newsletter with gains of up to 2600% because of Nvidia's epic run – Click hereClick hereClick here
AIP Interest Remains High
As has been the case since its launch just over a year ago, Palantir is continuing to witness elevated interest and high demand for AIP, and is offering developers a free trial to explore and build on AIP, but it is limited in user size and Ontology quantity.
Management said that “continued interest in AIP is loud and clear,” and shared an update on AIP bootcamp progress, saying that they have sustained the “high volume of bootcamps with over 915 organizations participating to date to meet inbound demand.” Palantir had completed 560 bootcamps across 465 organizations by February, tacking on an additional 450 organizations in just the past five months. Palantir did not share an updated bootcamp total.
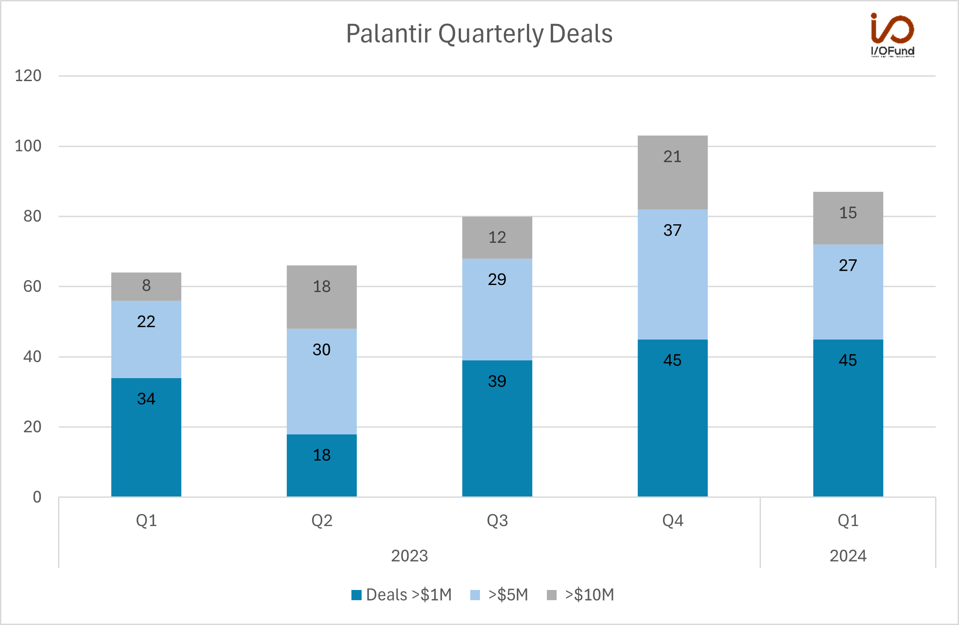
Palantir also said that AIP was aiding in customer conversion and expansion, aligning with trends observed earlier in the year, where management said AIP bootcamps were “quickly converting to paying customers” or expanding existing customers’ contracts. US commercial deals rose 94% YoY to 136, and total contract value (TCV) increased 131% YoY in Q1 to $286 million. Overall, commercial TCV bookings increased 187% YoY to $505 million, with the US driving more than half of that.
In addition, Palantir said that it is “seeing substantial deal cycle compression. As one example, a leading utility company signed a seven-figure deal just five days after completing a bootcamp. Another customer immediately signed a paid engagement after just one day of their multi-day bootcamp and then converted to a seven-figure deal three weeks later.” We have seen Palantir’s quarterly deals accelerate following AIP’s launch, but we have also seen a larger proportion of deals on the smaller end, between $1 million and $5 million.
Palantir signed 87 deals in Q1, of which 27 were >$5 million and 15 of which were >$10 million.
Source: I/O Fund
Questions In Converting Customer Interest to Contracts
Despite the optimism and reiteration on elevated interest in AIP, CEO Alex Karp shared one key shortfall that the company has – which is difficulties in selling AIP.
Karp explained that Palantir is “at the way early days of figuring out how to actually get customers to buy our product. We are good at educating customers on what is the art of the possible, and then some portion of those customers buy it. So, I expect as we get better and better at that, our numbers will increase. But it is really early days. It's not — we're not flawlessly executing on our sales motion.”
While this could be viewed as a positive given the high interest in AIP, implying that Palantir is not closing as many deals as it potentially could, the market is pricing in perfection this year, and essentially looking for a beat and raise in every quarter this year. Having a sales model where management is still figuring out how to market and sell AIP to interested customers while the market wants acceleration sets the stage for a potential shortfall if Palantir cannot meet these elevated expectations.
International Headwinds Persist
Palantir is also facing some headwinds internationally, primarily in its European business.
International commercial revenue grew 16% YoY, but declined (3%) QoQ to $149 million, “as a result of continued headwinds in Europe and the revenue catch-up in Q4 that we noted last quarter.”
Management further clarified that they “do have headwinds in Europe, 16% of our business in Europe. Europe is gliding towards zero percent GDP growth over the next couple of years. That is a problem for us. There is no easy remedy for that.” Shifting into a low or no GDP growth environment may continue to pressure customer deal expansion and present headwinds to larger deal sizes if budget scrutiny persists.
Every Thursday at 4:30 pm Eastern, the I/O Fund team holds a webinar for premium members to discuss how to navigate the broad market, as well as various stock entries and exits. We offer trade alerts plus an automated hedging signal. The I/O Fund team is one of the only audited portfolios available to individual investors. Learn more here.Learn more hereLearn more here.
Market Pricing Palantir’s Stock for Perfection
With Q1’s beat in store and US commercial still strong, the market is looking ahead for a strong year – essentially pricing in beat and raises each quarter this year, though Palantir’s extended valuation for barely 20% YoY growth enhances downside risk to shares given the international headwinds and the noted friction in its sales process.
Palantir reported $634 million in revenue in Q1, and guided fiscal Q2 revenue between $649 million to $653 million, an increase of 22.1% YoY at midpoint. For FY24, management guided revenue of $2.677 billion to $2.689 billion, up 20.6% YoY, with US commercial revenue of $665 million, for at least 45% YoY growth.
This translates to $1.285 billion in revenue in 1H, and $1.398 billion in revenue in 2H. However, analysts are expecting Palantir to generate $1.414 billion in 2H, with FY24 revenue estimates ranging from $2.68 billion on the low end to $2.80 billion on the high end. That’s about 4.4% higher than Palantir’s guide, suggesting analysts are expecting business momentum to accelerate each quarter with a beat and raise, and increased FY24 guidance.
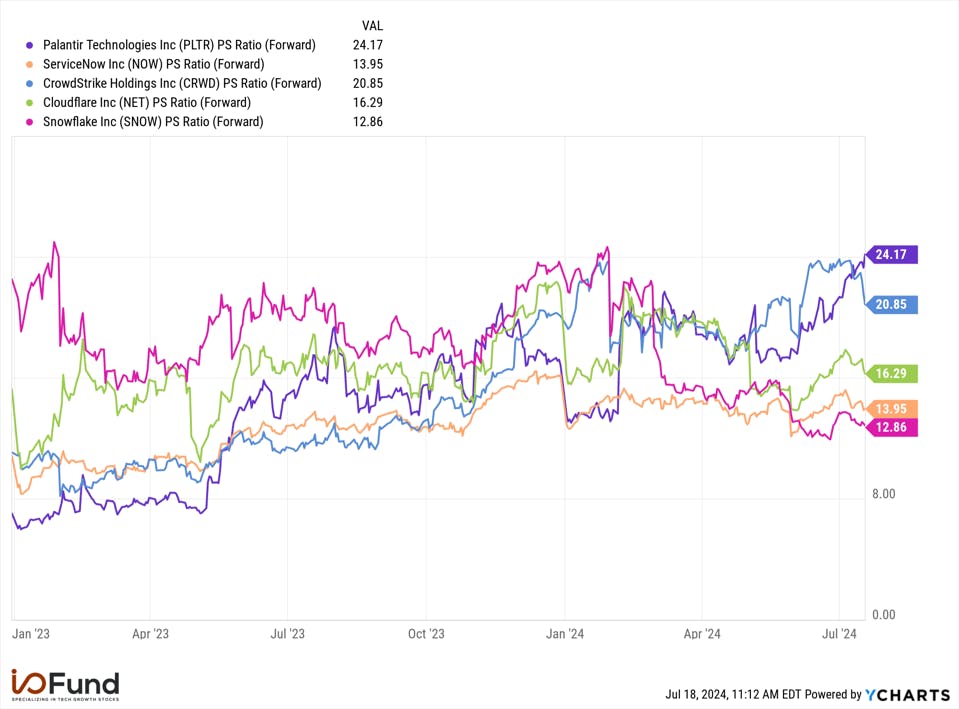
Palantir’s valuation leaves little to no room for error here, trading at elevated levels compared to AI-exposed large-cap enterprise software stocks with similar top-line growth and bottom-line margins. For example, Palantir’s stock trades at more than 24x forward sales, versus less than 14x forward sales for ServiceNow, which has been reporting revenue growth of >24% the last three quarters, versus 17% to 21% for Palantir.
Other ‘best-of-breed’ software stocks trade at lower multiples, despite having stronger top-line growth rates than Palantir – CrowdStrike has pulled back to below 21x sales after hovering at 24x. Snowflake and Cloudflare trade at 12.9x and 16.3x forward sales, respectively. Since the start of 2023, best-of-breed software has repeatedly struggled to achieve or maintain a valuation above 24x sales, with most rerating back to the 16x level.
While investors can argue that Palantir deserves an ‘AI premium’ from its product suite, investors will still have to value it as a mature company rather than a hypergrowth SaaS, as it’s no longer in that basket. This is the most expensive Palantir has been on a top-line valuation since November 2021, with revenue growth nearly 30 percentage points slower.
Palantir trades at more than 24x forward sales, a premium to best-of-breed software peers.
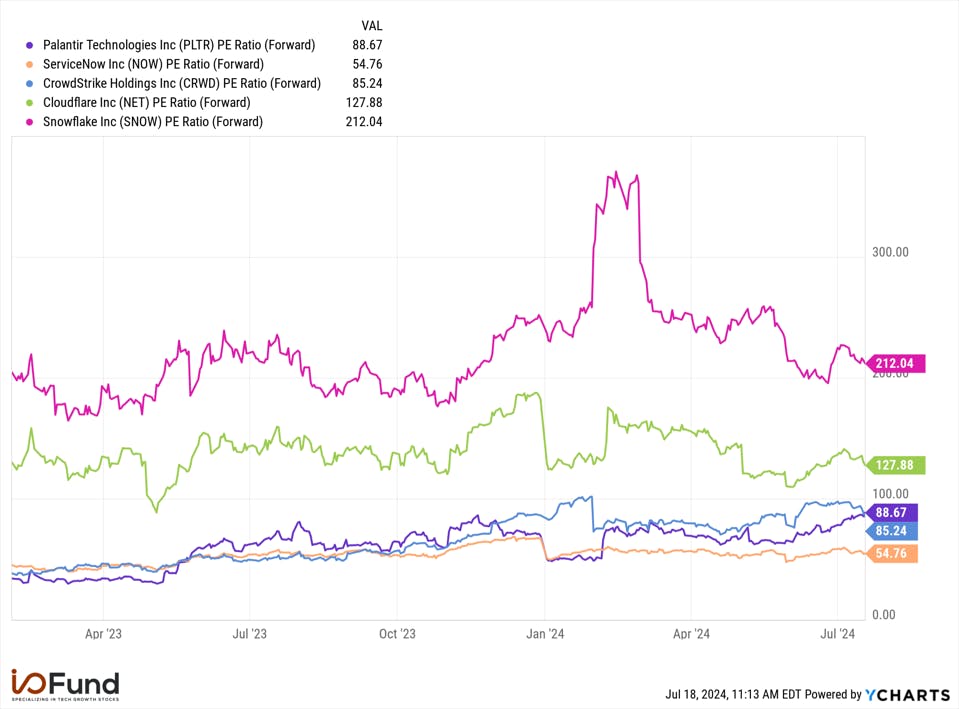
Down the line, Palantir trades at nearly 89x forward earnings (non-GAAP), again at its most expensive level in more than a year, with adjusted EPS expected to grow 32% YoY to $0.33. ServiceNow trades below 55x forward earnings for 25% EPS growth, while CrowdStrike trades similarly to Palantir at 85x forward earnings. Snowflake and Cloudflare, both not profitable on a GAAP basis, trade far above 100x forward adjusted earnings.
If Palantir’s adjusted EPS growth does slow to <20% as currently estimated by analysts, its premium multiple risks rerating lower.
Palantir trades at nearly 89x forward adjusted earnings, again at its most expensive level in more than a year.
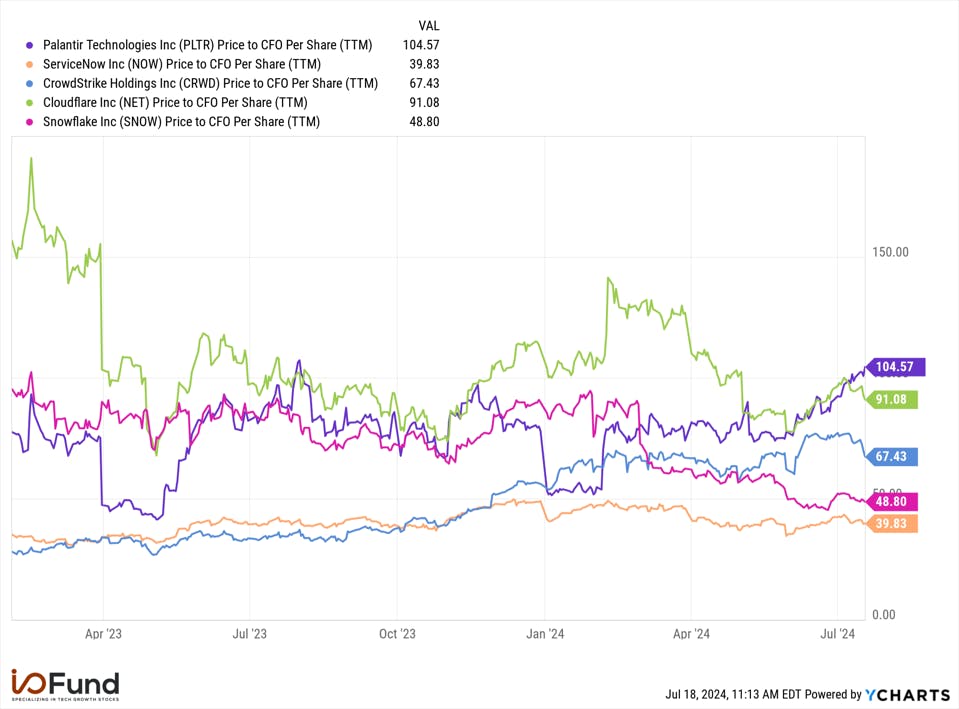
In terms of cash flow, Palantir trades at more than 100x operating and free cash flow multiples, with an operating cash flow margin of 20% and an adjusted FCF margin of 23% in Q1. ServiceNow trades at less than half of Palantir’s multiples, despite having a superior margin profile, at a 52% OCF margin and 47% FCF margin. CrowdStrike trades at 67x OCF with a 42% margin, while Snowflake trades below 49x OCF with a 43% margin.
Across the board, Palantir trades at elevated valuation multiples, whether it be on the top-line, bottom-line, or on cash flows, not only relative to peers, but also relative to itself, trading at its highest levels or near its highest levels of the past twelve months.
Conclusion
Palantir continues to exhibit strong momentum in its US commercial segment, with Q1 results reflective of this with sequential growth accelerating alongside customer count. While AIP demand remains elevated and a core driver of Palantir’s growth, management highlighted a pitfall in that there is friction in selling the product, a key risk to watch moving forward as the market is looking for nothing short of perfection through the end of fiscal 2024.
Please note: The I/O Fund conducts research and draws conclusions for the Fund’s positions. We then share that information with our readers. This is not a guarantee of a stock’s performance. Please consult your personal financial advisor before buying any stock in the companies mentioned in this analysis.
Last week, Aehr’s stock surged after providing a preliminary look at fiscal 2025’s revenue and net profit before tax, guiding to $70 million in revenue, for a YoY gain of ~5.7%, as well as net profit before tax of at least10%. However, $10 million in revenue would be coming from Incal, meaning organic revenue would be $60 million, or a YoY decline of just over (9.3%).
Today, the stock surged again due to an AI-related acquisition announced yesterday in the official earnings report. We’ve had close eyes on this stock as it was a former I/O Fund holding in the tough market of 2022, and was our highest performing stock that year, before it turned sharply downward in 2023. We ultimately closed the position around the time the EV market softened and bellwether Tesla sold off. As a reminder, AEHR supplies wafer burn-in testing systems for silicon carbide to ON Semi, who in turn, supplies silicon carbide inverters to Tesla and other EV OEMs. However, AEHR has discussed for some time that their end markets are diversifying. This report points toward progress in these new end markets.
The positive price action this week is not based on fundamental strength. Under the hood, AEHR is quite weak. The $70M guidance includes $10M per year from the acquisition. Therefore, organic revenue for FY2025 of $60M would represent a decline of (-9.3%) from the $66.2 million AEHR reported this past fiscal year (FY2024). Keep in mind, that a few months ago, AEHR was forecasting revenue of $100M for FY2024 ending in May. Despite the positive price action, this company will not return to growth in the next four quarters and the $100M is more than two years out, per current consensus.
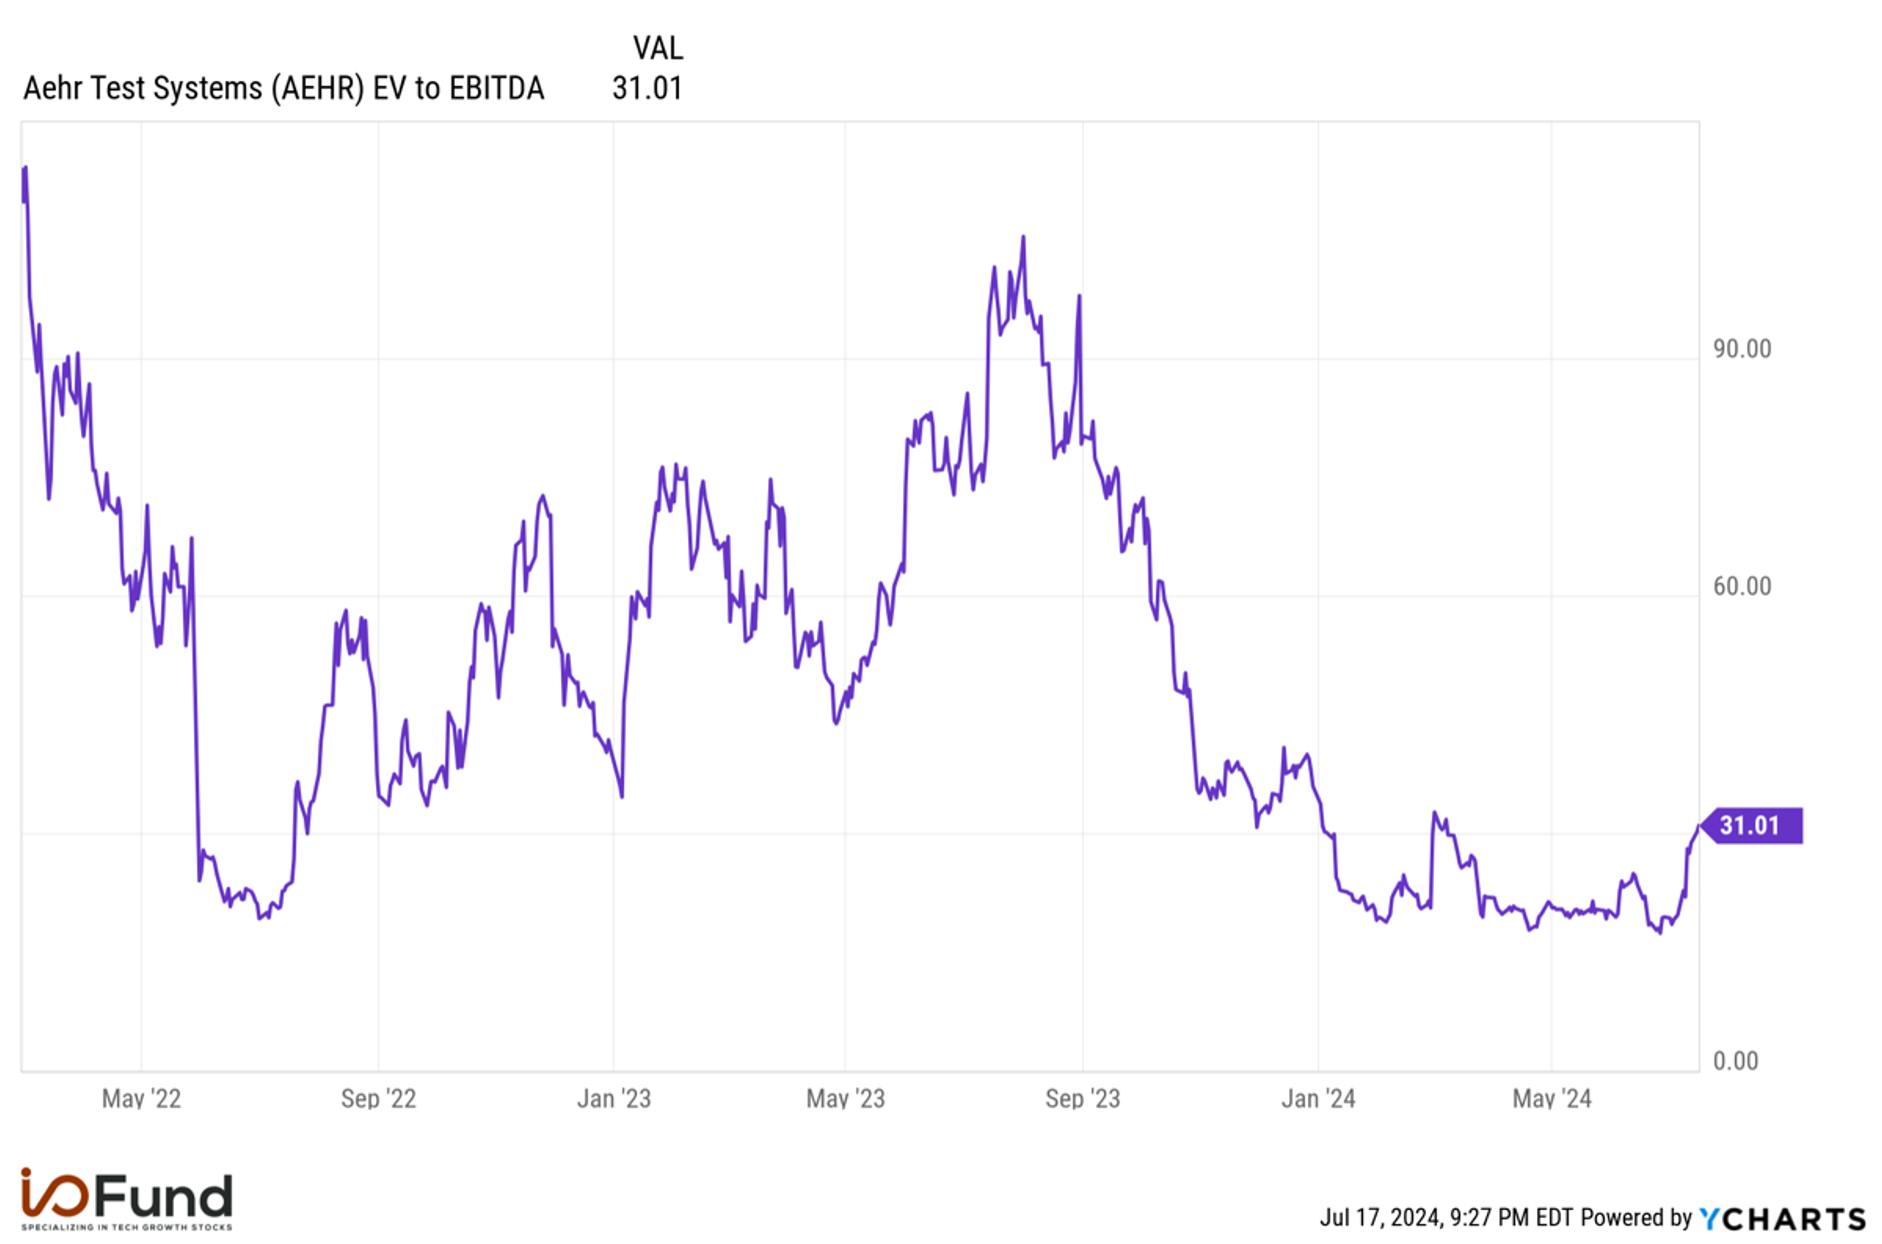
With that said, AEHR is trading at a low valuation, and even after the 66% power move off the low, there’s still quite a bit of room in the valuation due to the ongoing, steep selloff over the past year. Of the stocks we monitor, this one has substantial room. Valuation alone may be enough to justify this price action.
AEHR Q4 Earnings Report:
Aehr Test Systems reported preliminary Q4 revenue and net income figures last week, with both figures exceeding management’s guided range. Management noted that while Aehr “saw customer push outs of our products for silicon carbide devices due to slowing electric vehicle (EV) demand in the second half of our fiscal year, we still achieved another record year for annual revenue.”
Management also provided a quick look into the trends driving fiscal 2025: while SiC is expected to remain a core part of Aehr’s revenue, management sees bookings and revenue from new markets and customers, including silicon photonic ICs, flash memory and SSDs, AI processors, and GaN power chips for data centers and solar.
Aehr also announced that it received $12.7 million in FOX WaferPak orders from an SiC customer, with WaferPaks expected to be delivered over the course of the next three months. This likely will provide a large boost to fiscal Q1’s results. The company also expects to receive orders “from a significant number” of SiC customers by the end of this fiscal year.
There was mention of a hard disk drive customer that is forecast to ramp in the current fiscal year, “most likely the second half.” This customer will be up to 10% of revenue. Management also discussed a silicon photonics customer that will ship in the third fiscal quarter of this year. GaN is expected to penetrate power conversion in EVs, solar and the data center. AEHR received “a significant number of WaferPak orders through the year” for GaN.
Revenue and EPS
Aehr reported Q4 revenue of $16.6 million, for a YoY decline of (25.5%), and a QoQ increase of 120%.
Aehr reported Q4 GAAP net income of $23.9 million, which includes a $20.8 million tax benefit from the release of Aehr’s full income tax valuation allowance. Excluding this impact, net income would normalize to $3.1 million.
GAAP EPS was $0.81, including the $0.61 impact from the tax allowance. Adjusted EPS was $0.84.
For fiscal 2024, revenue was $66.2 million, up 1.4% YoY and above prior guidance for $65 million.
For fiscal 2024, GAAP net income is $33.2 million, including Q4’s tax benefit; excluding that, GAAP net income is $12.4 million.
GAAP EPS was $1.12 for FY24; non-GAAP EPS was $1.21.
Margins
Aehr’s preliminary results offered no insights as to how margins would look, after taking a hit in fiscal Q3 as revenue declined substantially on a QoQ basis. Margins recovered sequentially in Q4, but operating margin remained substantially lower on a YoY basis.
Q4’s gross margin was 50.9%, up 820 bp from 41.7% in Q3, but down 60 bp from 51.5% in the year ago quarter.
FY24’s gross margin was 49.1%, down 130 bp from 50.4% in FY23.
Q4’s operating margin was 15.3%, up from (27.1%) in Q3, but down from 25.3% in the year ago quarter. As discussed in the call, management believes they will reach an operating margin of 20% when they return to an annual run rate of $80M+.
FY24’s operating margin was 15.2%, down 540 bp from 20.6% in FY23.
Excluding the income tax valuation benefit, Q4’s net margin would be ~18.8%, versus 30.4% in Q4 2023.
For the full year, net margin was 50.1% including Q4’s tax benefit; excluding that, net margin would be ~18.8%.
Cash and Debt
Cash flows have struggled this year, with Q3 seeing significant net outflows at nearly 40% of revenue.
Q4 operating cash flow is $1.23 million, or a margin of 7.4%. This is down from an OCF margin of 26.4% in the year ago quarter.
FY24 OCF was $1.76 million, down nearly (82%) YoY, for a margin of 2.7%.
Cash and equivalents totaled $49.2 million in Q4, and debt remained zero.
Key Metrics
Inventory was $37.5 million in Q4, down from $38.1 million in Q3, but up from $23.9 million in the year ago quarter.
Bookings were $4 million in Q4, down from $24.5 million in Q3.
Backlog was $7.3 million in Q4, down from $20 million in Q3. Effective backlog was $20.8 million.
To note, Aehr’s largest customer accounted for 59.6% of revenue in Q3 2024, and its second largest customer accounted for 19.3% of revenue.
Acquisition of Incal and Wafer Burn-in for AI Accelerators
Aehr also announced that it was acquiring Incal to expand its presence in the burn-in market for AI accelerators, which it believes is a $100 million annual market with the potential to capture “meaningful share” in fiscal 2025. Aehr purchased Incal for $21 million, or ~1.75x TTM revenue of $12 million (or ~2.1x forward revenue of $10 million). The purchase price is split between $14 million in cash and more than 552K shares, convertible at $12.673 per share.
The goal is to combine Incal’s high-power test solutions with AEHR’s wafer-level testing to sell FOX-XP systems to AI chip companies for wafer testing up to 3,500 watts. According to management, the opportunity size is $100 million “and with this combined product portfolio, we have the opportunity to capture a meaningful share of this market within this fiscal year.” This naturally led to questions in the Q&A as to why the guide is weak for next year. I’ve included the response in the section below.
On the note of wafer burn-in for AI accelerators, this comment was key in the opening remarks – I’m quoting it in full so our Members understand the full effect of the comment that has led to today’s price action as the comment implies AI revenue will come to fruition this year:
“Now let me talk about the AI processor market. Last month, we announced we're working with an AI accelerator company to move their AI processor test and burn-in to wafer level and have secured a commitment from them to evaluate our FOX Solution for production level test and burn-in of their high power processors. This company recognizes the potential of the significant benefits of production test and burn-in of their accelerators while still in wafer form before they're integrated into the end application product, which would prove to be more cost effective and significantly more scalable than doing the screening later in their manufacturing process.
We think this is an amazing opportunity to displace the current package and system level tests for AI processes for large language model development and we believe we can meet this enormous challenge with the current capabilities of our new high power FOX-XP system with up to 3,500 watts per wafer testing. We're working on this benchmark as I speak here in the lab right now and expect to complete the evaluation in the next couple of months. Upon successful demonstration of wafer level test results and throughput, we expect they will utilize our new high-power FOX-XP systems for production of their next generation AI processors, starting this fiscal year.”
It was later clarified the customer is “not Nvidia.” It’s also important to emphasize the qualification is not complete yet: “I've got my fingers crossed that we can work through all this stuff. And we think we are pretty confident that we can make this work. And the customer is hoping and cheering us on to make it work.”
Lack of Revenue Growth in FY2025:
The obvious issue is management’s opening comments do not match the revenue guide. There is a stark contrast between the bullish earnings call/commentary and the weak guide. The issue is the weak EV market, as despite AEHR seeing promising signs of new end markets, the fact remains that SiC is AEHR’s primary market as it stands today. The new markets are not able to offset the softness in EVs (yet).
Here was a question to that effect:
Jon Gruber
Yeah, yeah, I mean good presentation, a lot of prospects, but what I don't understand is with the acquisition, all these prospects, you get flash member 30% in new things, the disk drive, why is there no revenue growth excluding the acquisition?
Gayn Erickson
[…] It's really about the push-outs that we saw with respect to the silicon carbide ramps, things we were expecting people to be coming in pretty strong. And we're just looking at soft forecasts right now.
[…] But I think if you look at the top four silicon carbide customers, they all guided down this year. And so, there have been people that are — we're wondering how bad it was going be for us, and can we even continue to maintain our growth while they're having a soft year followed by a strong year. So I think we're — it's the right thing to do right now is to communicate this. If we see strength in the second half come in harder than we are currently conservatively forecasting, then we'll guide up at that time.
Valuation:
Aehr’s valuation is low if we look at its historic trend. Granted, the stock had stronger fundamentals at the time, it’s important to note this small cap remained GAAP profitable even after a 36% reduction in its expected annual revenue. The company also held onto a thin cash flow margin, yet to Aehr’s credit, remained FCF positive for FY2024.
Conclusion:
Small caps are being hyped in the market; this makes sense because many are on sale. We began to sniff this out with entries into AOSL but we certainly wouldn’t mind more exposure if this rotation is confirmed.
Due to a lack of fundamental strength, we will only consider AEHR a quality stock once the company has returned to growth. Aehr will one day report real AI revenue, but for now, the price action is exuberant in nature. We want to be clear as day quality fundamentals are not in the driver’s seat at this time, rather, pure speculation is driving the price action. In the meantime, it’s under consideration for a momentum play only. If we re-enter, the position will come with a tight stop.
Damien Robbins, Equity Analyst at I/O Fund, contributed to this analysis
GPU sales are surging at the moment, primarily from Big Tech’s $200 billion in capex for AI infrastructure services. Critical data center components, including networking, are required for GPU systems. There is a well-quoted discussion from Dell executives earlier this year, that by the end of the systems lifecycle, $2 to $3 will be spent on networking and storage for every $1 spent on GPUs. Granted, the effects of this 2-X market demand will be spread across many more players compared to GPUs. Yet, there is ample evidence that networking is sparking a remarkable growth trajectory of its own. For example, Nvidia’s InfiniBand has seen triple digit growth, Cisco has provided strong AI commentary, and Arista Networks’ view is that networking is mission-critical to improve GPU utilization.
Arista Networking is positioning itself as a pure-play in AI-driven networking, and management sees tailwinds to growth not only via Ethernet establishing itself as the go-to choice in networking, especially for AI training, but also stemming from the broader market opportunity arising from the massive shipment volumes of Nvidia’s GPUs.
Why Data Center Spend Is Accelerating
The current AI landscape is spearheaded by Big Tech. Microsoft and Amazon are touting multi-billion-dollar cloud revenue run rates from AI, Google sees a clear path to monetizing AI features, and Meta is aggressively investing in AI with some initial evidence it’s boosting average revenue per user (ARPU). What’s unfolding is an AI ‘arms race’, in that Big Tech, and a handful of startups including OpenAI, Mistral, Anthropic, and others, are competing to develop, deploy and commercialize the next cutting-edge AI model. This race also spreads over to who can develop the best AI assistants/Copilots, increase adoption of GenAI tools, and accelerate revenue growth in the cloud.
Nvidia CEO Jensen Huang explained exactly why this race is rapidly unfolding, and why Big Tech’s AI expenditures are increasing not only this year, but likely for the next few years: “time is really, really valuable to them. Let me give you an example of time being really valuable, why this idea of standing up a data center instantaneously is so valuable and getting this thing called time to train is so valuable. The reason for that is because the next company who reaches the next major plateau gets to announce a groundbreaking AI. And the second one after that gets to announce something that's 0.3% better. And so the question is, do you want to be repeatedly the company delivering groundbreaking AI or the company delivering 0.3% better? And that's the reason why this race, as in all technology races, the race is so important. And you're seeing this race across multiple companies because this is so vital to have technology leadership, for companies to trust the leadership and want to build on your platform and know that the platform that they're building on is going to get better and better.”
The conclusion is that Big Tech firms are snapping up Nvidia’s GPUs as fast as they reach the market, and this demand spills over into AI servers and networking components, as both are crucial for AI systems.
Networking Becoming Indispensable
Big Tech is deploying thousands to (soon) millions of GPUs and in-house AI accelerators, and networking is a mission-critical piece. Switches are crucial for communication inside the GPU clusters, allowing quick, efficient communication and transfer of data between each node, which is essential for parallel processing, and thus overall job completion time when it comes to training large-scale AI models and completing larger workloads.
A cohesive networking layer with high-quality switching technology can lower power consumption needs significantly and improve performance job completion times. As a result, the industry is going all-in on Ethernet, Nvidia included, in part due to its compatibility, cost and performance advantages, and security.
According to Arista, Ethernet has advantages over Nvidia’s InfiniBand: “AI workloads are placing greater demand on Ethernet, as they are both data and compute-intensive across thousands of processes today. Basically, AI at scale needs Ethernet at scale. AI workloads cannot tolerate the delays in the network, because the job can only be completed after all flows are successfully delivered to the GPU clusters. All it takes is one culprit of worst-case link to throttle an entire AI workload.”
Broadcom’s management seconded this, explaining that as companies scale GPU clusters, they are “going to have to use the best networking technology. And we believe that the best networking technology is Ethernet.” Broadcom’s Ram Velaga added that whether GPUs are “connected inside a data center or across data centers, you cannot get around the fact that you have to connect multiple GPUs. Once you accept the fact that it is a distributed computing problem and you need a network, then I would make a very strong case for you that the best network in the world, over multiple generations, over and again, has been Ethernet.”
Velaga used Meta as an example as to why networking (and Ethernet) is so important: when Meta is running “large workloads, anywhere between 18% to 57% of the time, the traffic is just sitting in the network. That means during this period of time, the GPUs are actually sitting idle. Now think about it. If on an average somebody is charging somebody between $20,000 to $30,000 per GPU and you've got 100,000 GPUs, you're talking about a $2 billion to $3 billion infrastructure. And if $2 billion to $3 billion infrastructure is sitting idle for 18% to 57% of the time, that's a lot of money, right?”
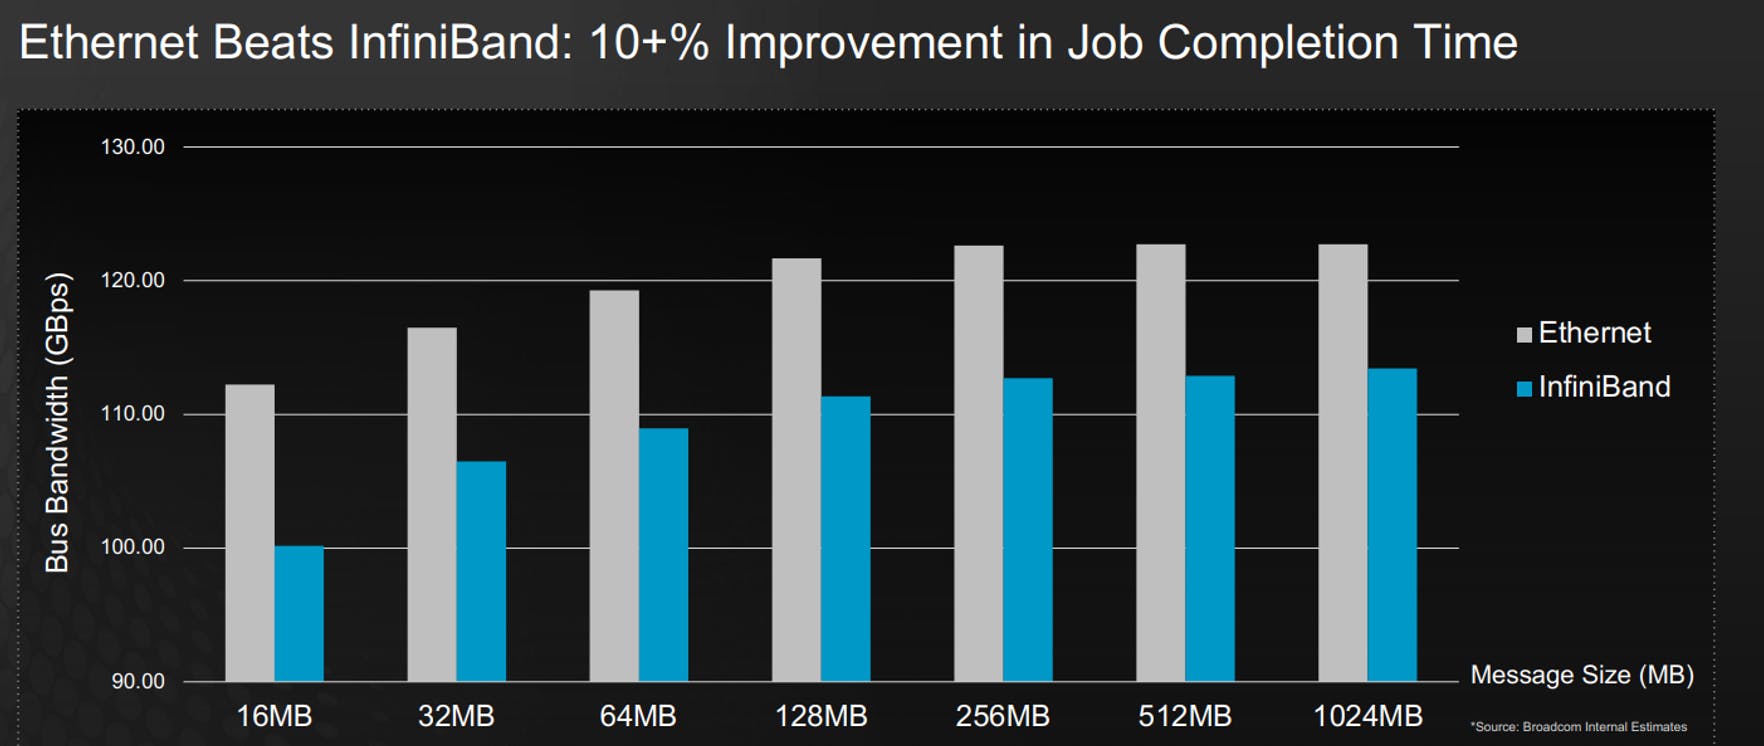
By creating more efficient lines of communication between GPUs, Ethernet can help accelerate job completion times, and in turn, allow more jobs to be completed on the clusters. Velaga touched upon the performance advantages of Ethernet versus Nvidia’s InfiniBand, noting that Meta tested both on a 24,000 GPU cluster and found that Ethernet provides up to 10% better performance at half the cost, which, when translated over to overall infrastructure costs, could equal hundreds of millions to billions saved.
Nvidia is also prioritizing Ethernet with its new Spectrum-X solution, despite seeing strong triple-digit networking revenue growth (accelerating from 94% YoY to 242% YoY in 4 quarters to over $3 billion in quarterly revenue) driven by InfiniBand. CEO Jensen Huang said Nvidia is “all-in on Ethernet” with an “exciting road map coming.” He added that “Spectrum-X is ramping in volume with multiple customers, including a massive 100,000 GPU cluster. Spectrum-X opens a brand-new market to NVIDIA networking and enables Ethernet only data centers to accommodate large-scale AI. We expect Spectrum-X to jump to a multibillion-dollar product line within a year.”
For more information on how Ethernet compares to InfiniBand, reference our analysis: “Broadcom: Networking/ASICs Giant and The Second Largest by AI Revenue” where we go through a side-by-side comparison including why Big Tech is pushing for Ethernet over Nvidia’s in-house InfiniBand.Broadcom: Networking/ASICs Giant and The Second Largest by AI Revenue” where we go through a side-by-side comparison including why Big Tech is pushing for Ethernet over Nvidia’s in-house InfiniBand.
Arista Confident in Ethernet Opportunity
Arista echoed much of Broadcom’s comments on Ethernet’s performance advantages versus InfiniBand, reiterating that Ethernet is “proving to offer at least 10% improvement of job completion performance across all packet sizes versus InfiniBand.”
Arista added that they are “witnessing an inflection of AI networking and expect this to continue throughout the year and decade” as Ethernet emerges as “a critical infrastructure across both front-end and back-end AI data centers.”
Per Arista’s Q1 call, we are “progressing well in four major AI Ethernet clusters that we won versus InfiniBand recently,” and in the four clusters, they are “migrating from trials to pilots, connecting thousands of GPUs this year, and we expect production in the range of 10K to 100K GPUs in 2025.”
Arista’s management reiterated the company will reach an AI target of $750 million in 2025. Barclays believes Arista “can top its guidance of $750M in AI-related back-end revenue for 2025,” commanding 18% market share in data center switching (versus 27% share for Nvidia and 22% for Cisco).
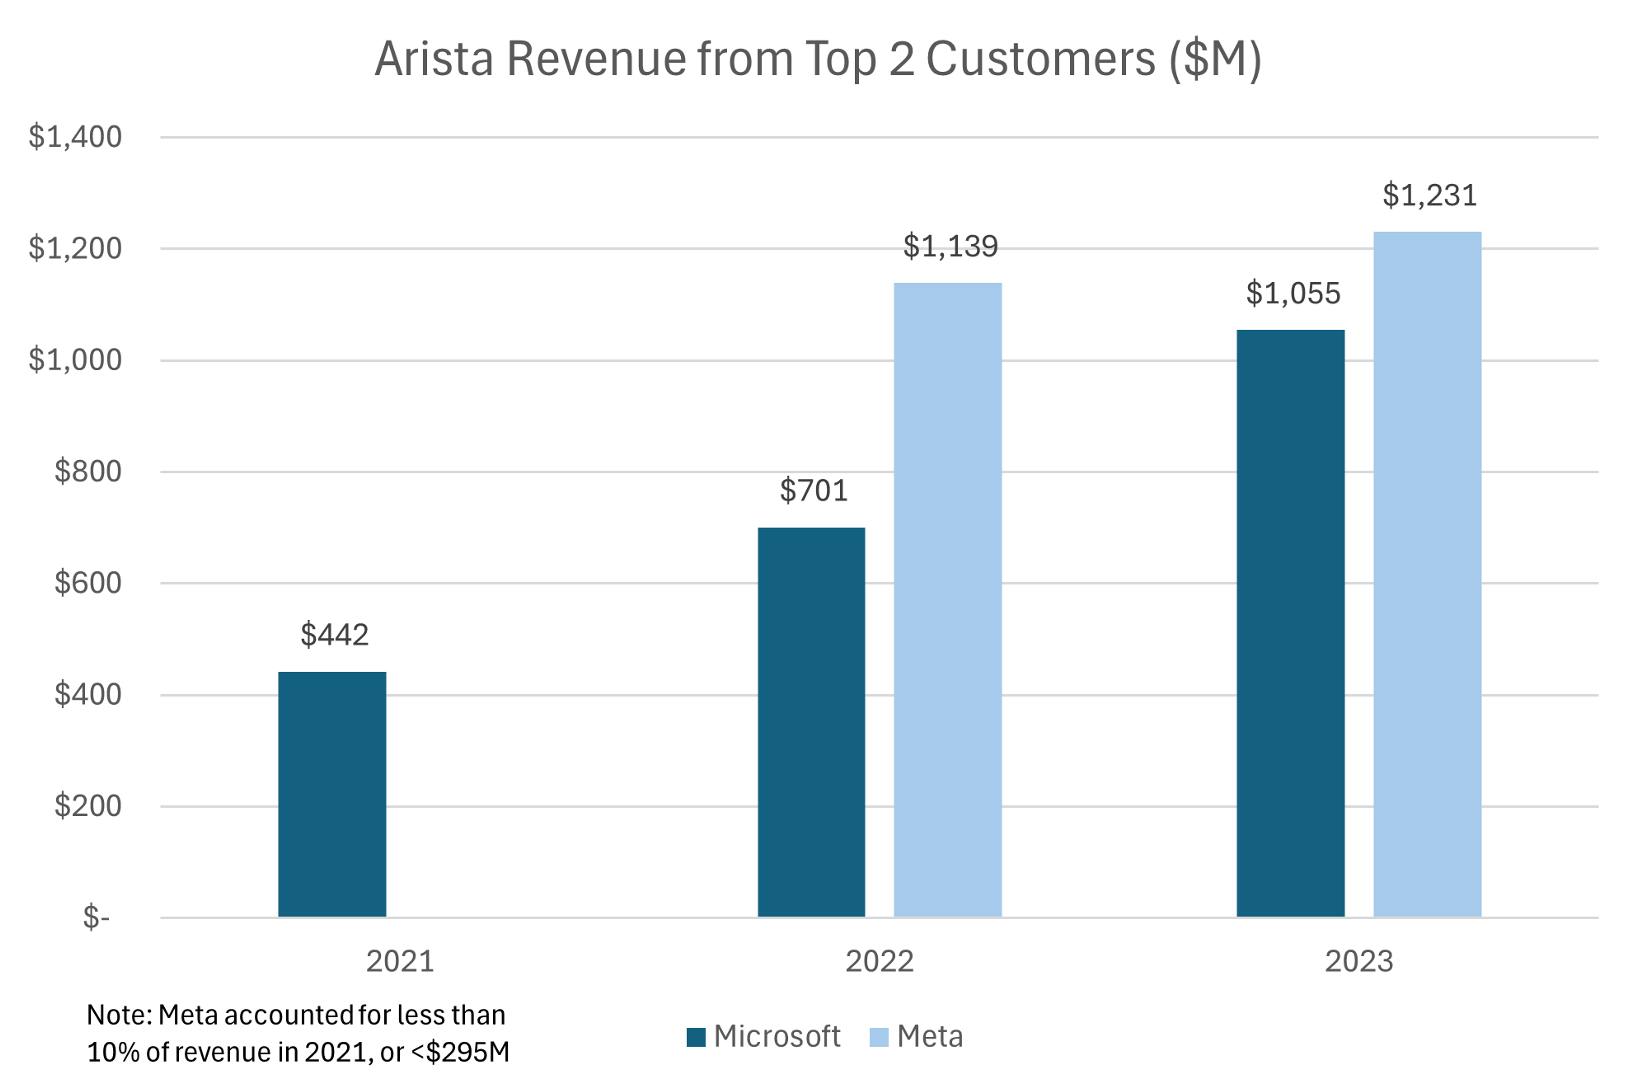
Arista also has a few core risks, particularly in that revenue is heavily concentrated in two major customers, Microsoft and Meta, accounting for 38% of company-wide revenue ($2.2 billion of Arista’s $5.8 billion in revenue in 2023). While we are seeing both companies spending quite aggressively in AI this year and next, revisions to capex plans intra-year (much like how we saw Meta increase its full year capex guide last quarter) can move Arista’s stock price.
Microsoft and Meta accounted for 39% of Arista’s revenue in 2023, down slightly from 42% in 2022 but up significantly from less than 25% in 2021. In dollar terms, the two are both billion-dollar customers, with revenue from Microsoft increasing more than 50% in 2023 and nearly 59% in 2022.
Both Microsoft and Meta increased 2024’s capex plans, with Microsoft’s Q1 capex rising 80% YoY to $14 billion, and full fiscal year capex up 50% YoY to $50 billion. Microsoft is reportedly seeking to triple its GPU supply this year to 1.8 million GPUs to support AI demand on Azure, and demand for networking components should rise hand in hand.
Meta boosted its full year capex range to $35-40 billion, pointing to 33% YoY growth and $4 billion more than previously anticipated, to build out AI infrastructure and support its internal AI roadmap. Meta’s Q1 capex was only $6.7 billion, implying that the bulk of this spend will hit in the second half of the year, possibly accelerating at a ~20% QoQ rate and exiting 2024 above the $11 billion range – hinting that Meta’s contributions to Arista’s revenue growth may not be felt in full force until the back half of 2024.
While the capex growth is positive, competition in the networking space is high, from Broadcom to Nvidia to Cisco to others. Cisco noted that it has been seeing strong momentum in Ethernet AI fabric deployment at three of the top four hyperscalers, possibly alongside Arista’s solutions, while Nvidia has recently released its Spectrum-X Ethernet solution which it expects to become a multibillion-dollar product line with a year. According to Nvidia, Spectrum-X delivers 1.6X better networking performance than traditional Ethernet.
Our previous Broadcom analysis points toward the Ethernet networking giant being second in AI revenue, primarily from AI networking revenue. Forward-looking, Broadcom is expected to end the year with $2.75 billion per quarter in AI revenue for $11B per year. Compare this to Nvidia’s networking revenue at $3.2 billion.
InfiniBand increases dependency on Nvidia, requires a new networking stack, and lags Ethernet on raw bandwidth. Improvements in Ethernet systems are expected to offer better load balancing and congestion control to help close the gap with InfiniBand’s low latency. Broadcom’s Jericho3-AI switch platform is the company’s AI fabric that competes with InfiniBand on AI training completion times, and it allows for more than 32,000 GPUS to be linked for a massive AI training system.
Regarding Arista, the company has partnered to offer a holistic solution, where a remote Arista-based AI agent will help customers optimize and manage their AI clusters with a single control point; however, investors should expect competition in the market to remain fierce as hyperscalers continue to build out data center infrastructure.
Turning to fiscal Q1’s earnings — Arista delivered a solid report, with revenue ahead of expectations as margins remained strong. However, headline revenue growth has decelerated rather quickly as Arista faced difficult comps in Q1. Despite the deceleration, the bottom line remains strong and in fact is strengthening.
In terms of AI revenue, management did not provide a figure for 2024, but its $750 million target for 2025 would represent close to 10% of total revenue, with consensus for FY2025 at $7.82 billion.
Revenue and EPS:
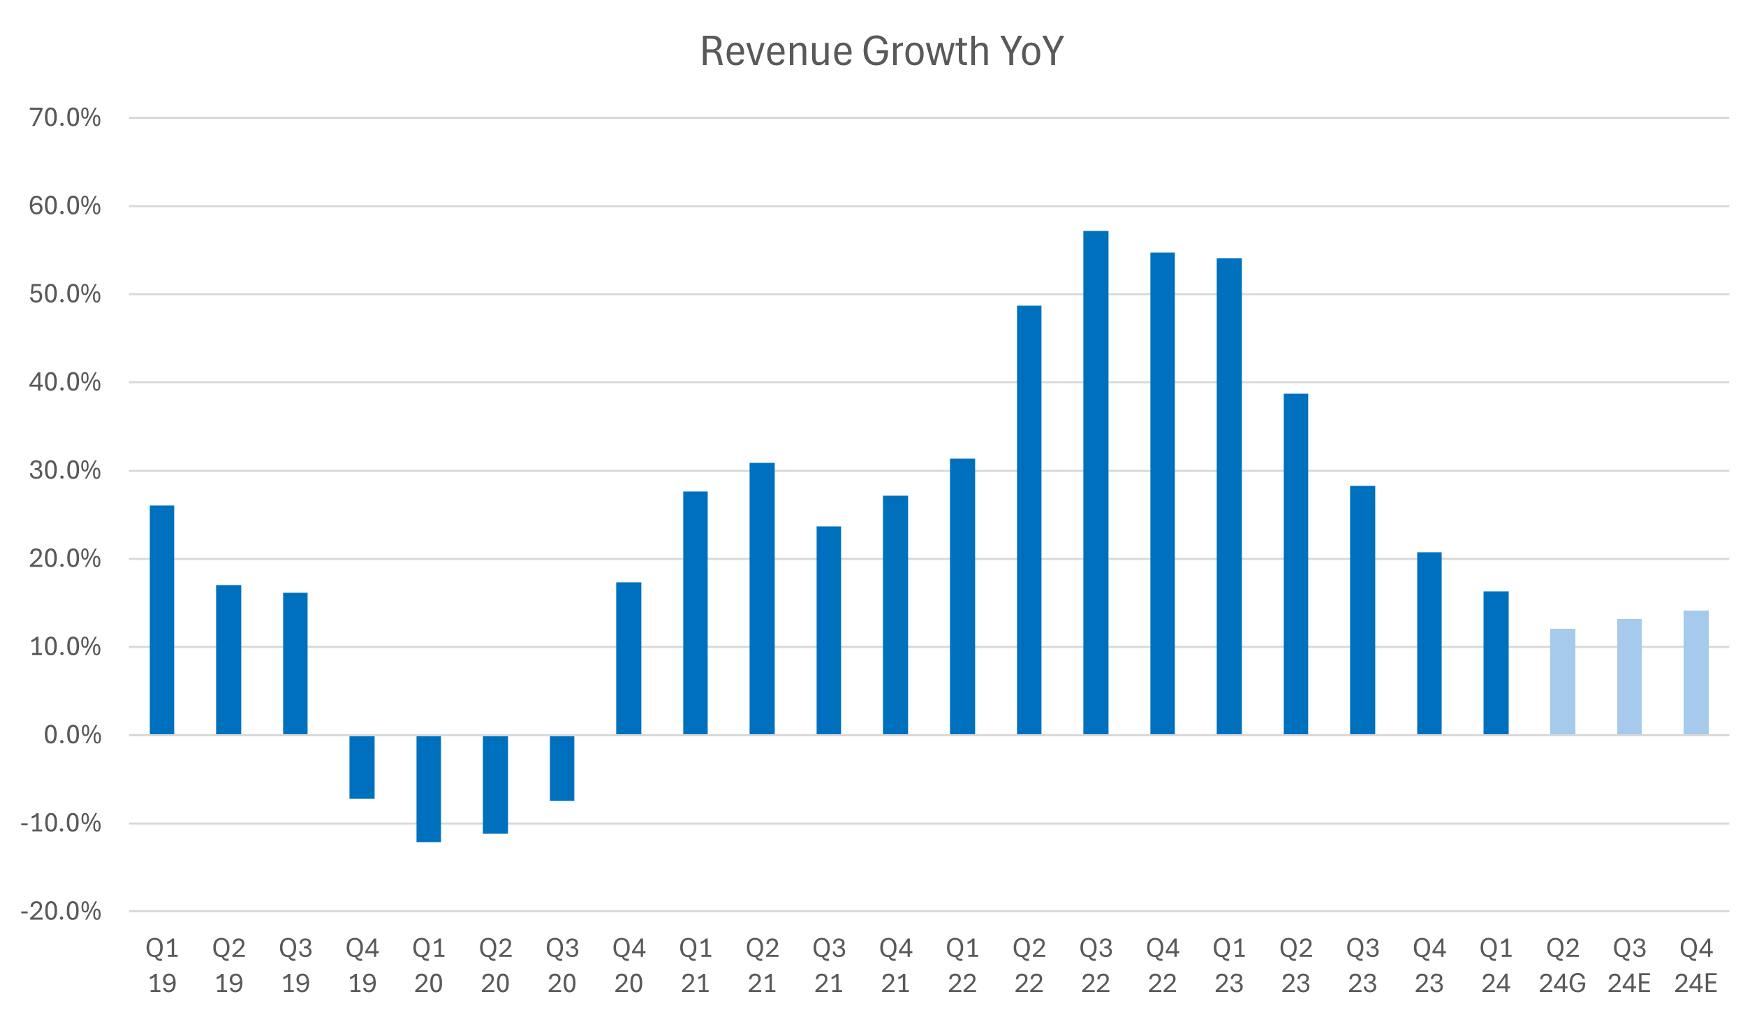
Arista reported revenue of $1.57 billion in Q1, representing YoY growth of 16.3% and beating expectations by nearly $24 million. This is down from 54% growth in the year-ago quarter. Growth is expected to decelerate more than 4 percentage points on a sequential basis in Q2.
GAAP EPS of $1.99 represented YoY growth of 44.2%, beating estimates by $0.40.
For Q2, Arista guided revenue between $1.62 billion and $1.65 billion, representing YoY growth of 12.1% at midpoint, a fifth consecutive quarter of decelerating revenue growth. However, Q2 is expected to mark the bottom, with analysts expecting growth to reaccelerate to the 14%+ range by Q4.
Margins:
Gross margin was 63.7% in Q1, down 120 bp QoQ from a six-year high in Q4 at 64.9%. Gross margin has been relatively stable in the 63% to 64% range aside from a dip to the 60% range in the first half of 2023.
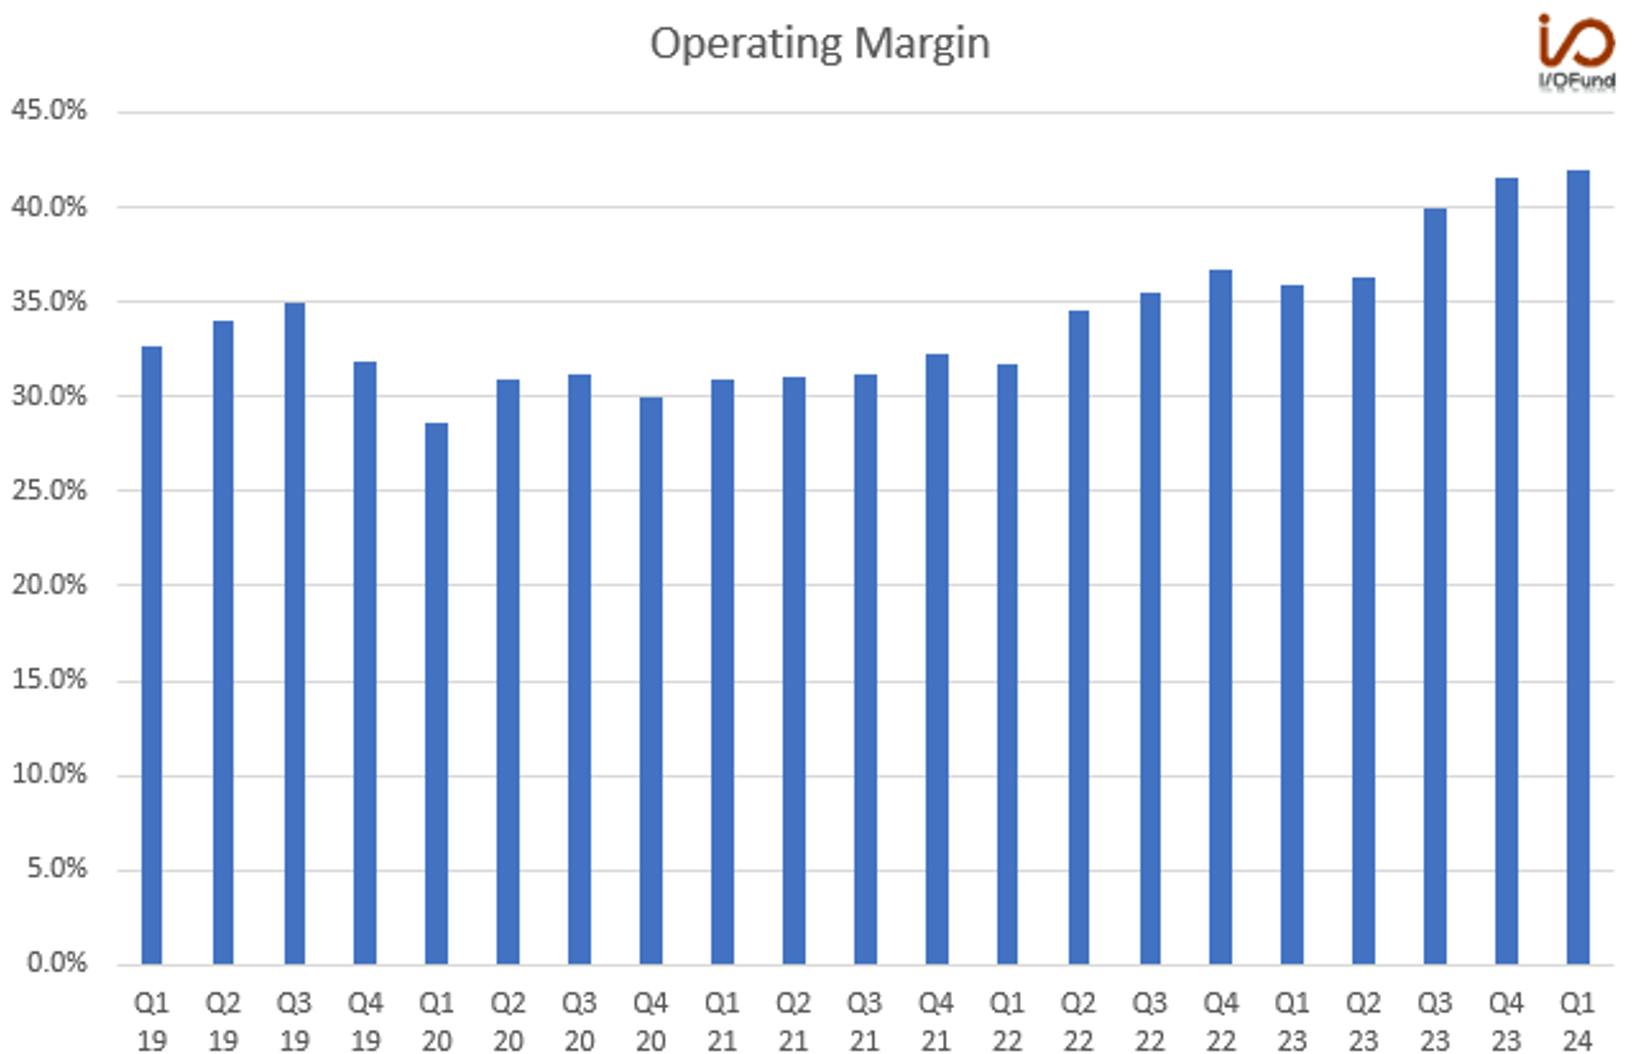
Operating margin reached a record high at 42.0% in Q1, and represented a 50 bp QoQ and 610 bp YoY expansion. Operating margin has expanded steadily since 2021, increasing nearly 10 percentage points from the low 30% level.
Net margin was 40.6%, up 80 bp QoQ and 830 bp YoY. Arista’s bottom line strength should not be overlooked, especially as leverage improves down the line even with decelerating revenue growth. In the market’s top AI stocks at the moment, Arista has one of the strongest bottom lines outside of Nvidia.
Cash and Debt:
Arista reported cash and equivalents of $5.45 billion, and has zero debt.
Cash flow margins are strong — operating cash flow increased over 37% YoY to $514 million, for a 32.7% margin. Free cash flow also increased 37% YoY to $504 million, for a 32% margin.
How Arista Networks Ranks on AI Revenue:
Here’s a quick glance on the rankings for AI networking revenue, with Arista near the bottom of the list. Nvidia and Broadcom lead the sector, with Nvidia recently surpassing a $13 billion annual run rate in networking.
Nvidia is in first with $3.2 billion in networking revenue in fiscal Q1, after recently surpassing a $13 billion annual run rate in Q4. Nvidia is expecting its new Spectrum-X product to reach a multi-billion dollar run rate “within a year.”
Broadcom is in second place with AI revenue of $3.1 billion in fiscal Q2, projecting an annual run rate of more than $11 billion, or more than $2.75 billion per quarter. Based on management’s commentary, networking likely contributed upwards of $1 billion in the quarter, and could exit the year in the mid-$4 billion range.
Marvell reported approximately $500 million in AI revenue in the most recent quarter, with management eyeing a “a floor of $1.5 billion for AI revenue” for this fiscal year, with two-thirds coming from electro-optics and one-third from ASICs.
Juniper Networks reported $321.2 million in the AI enterprise segment, or 23.5% of revenue. Recently, it was announced that Juniper is being acquired by HPE.
Arista has not broken out AI revenue on a quarterly basis yet, but is targeting $750 million in AI revenue in 2025, which is equivalent to ~10% of revenue for that year.
Valuation:
Arista’s top line valuation has surpassed historical peaks. Bottom line strength and improved operating leverage are driving increased earnings power exiting 2024 with a bottom line valuation in line historically.
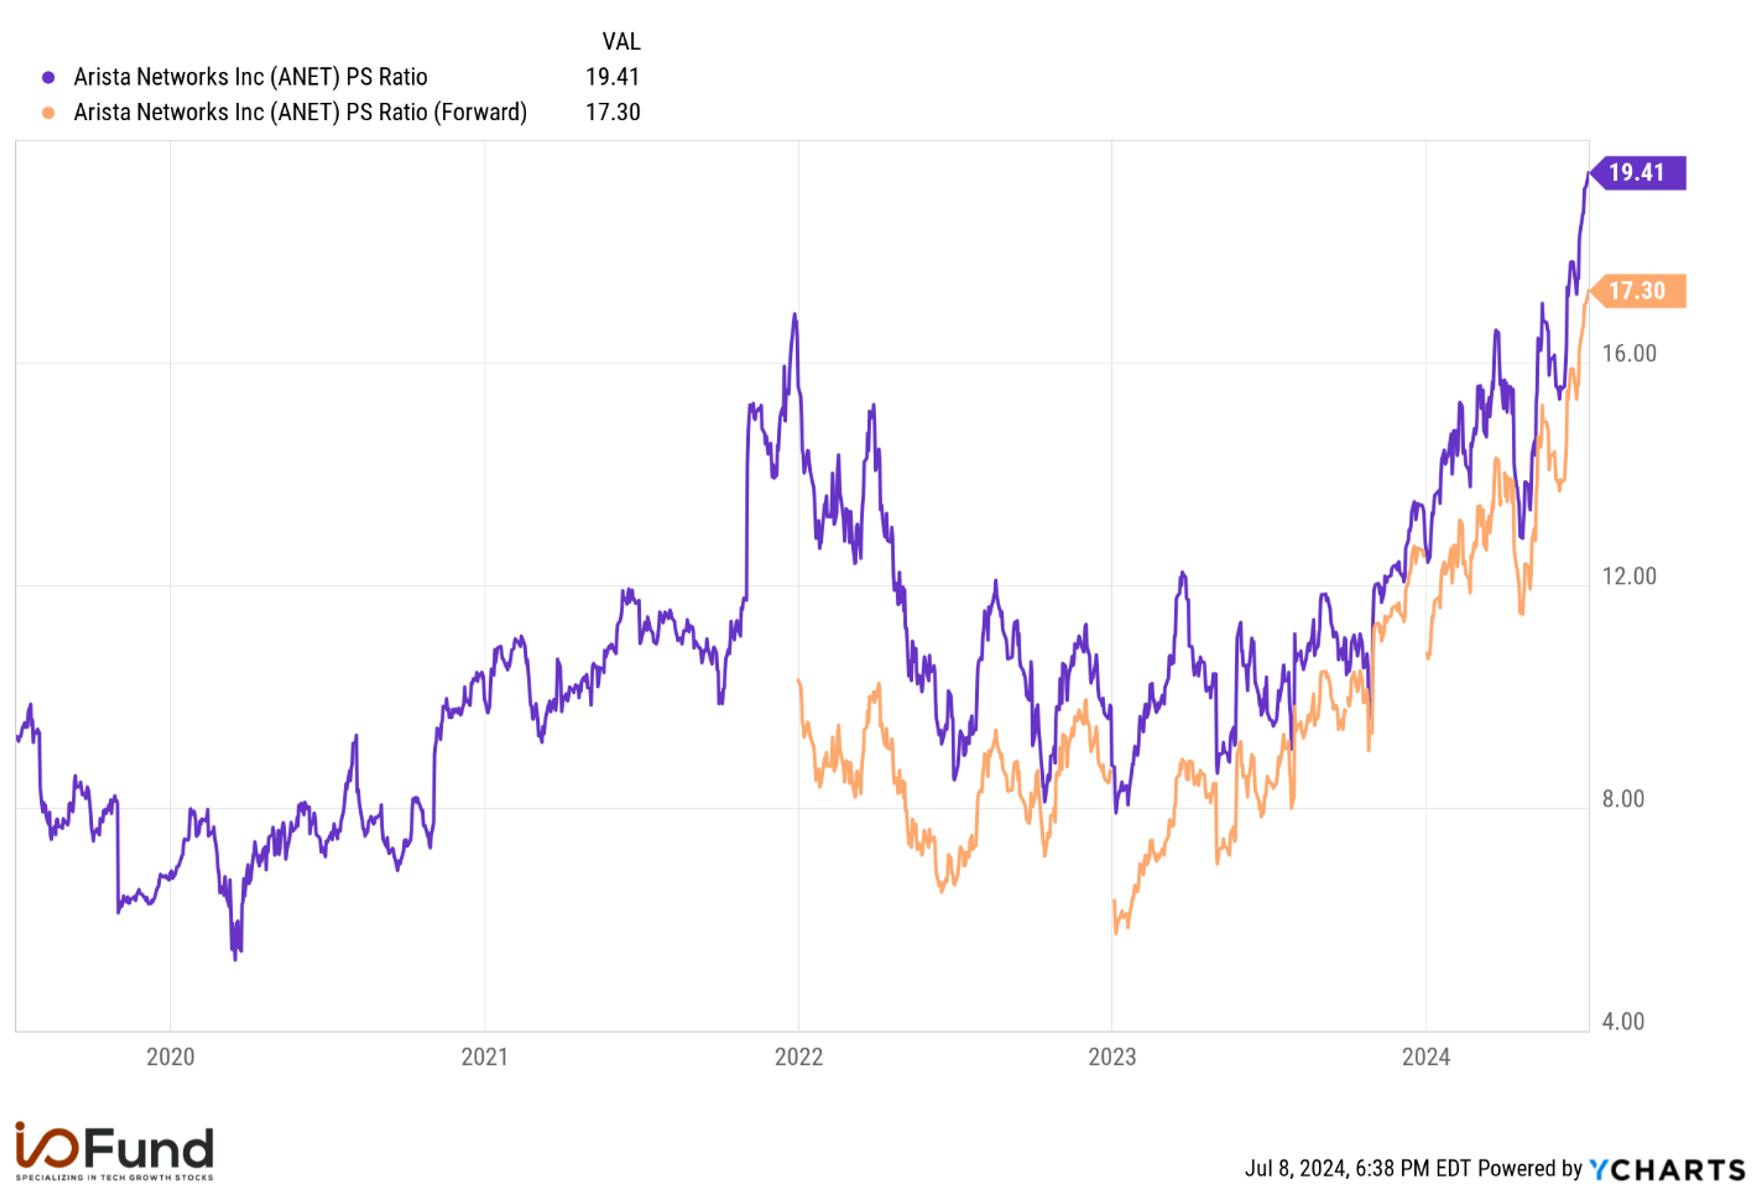
Arista currently trades at 19.4x sales and 17.3x forward sales, both above historical highs – in late 2021, Arista peaked at just under 17x sales, the same level where it pulled back from in early May following its post-earnings rally. Buying in the 8x sales range offers a higher probability for upside, although notably, AI stocks have not offered low entries over the past year.
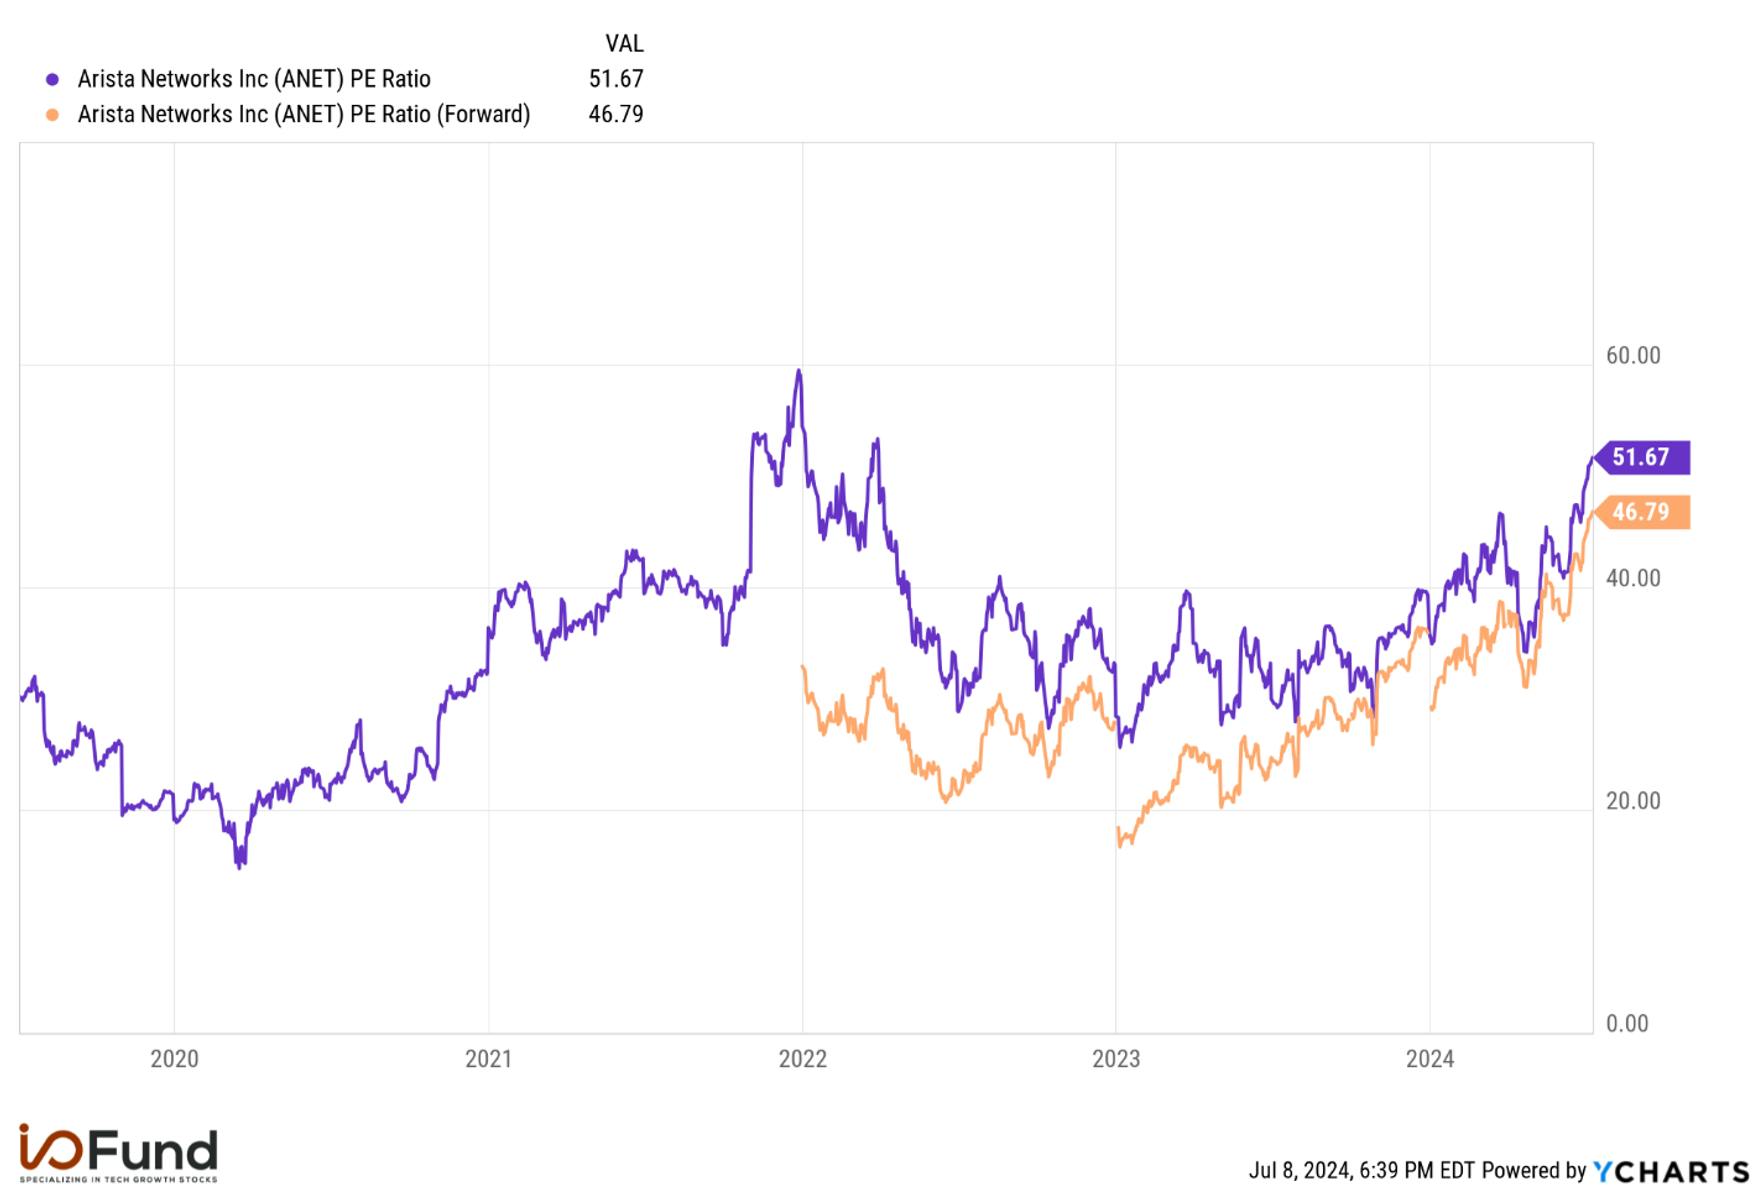
On the bottom line, Arista trades slightly below 52x earnings and nearly 47x forward earnings, which on the surface is expensive, and above its 5-year average of 34x. Arista peaked at 60x earnings at its 17x sales peak multiple in late 2021, providing a tiny bit of breathing room for the bottom-line valuation on improved earnings power later this year and through next; however, downside risk is more prevalent as both the top and bottom-line valuations become stretched.
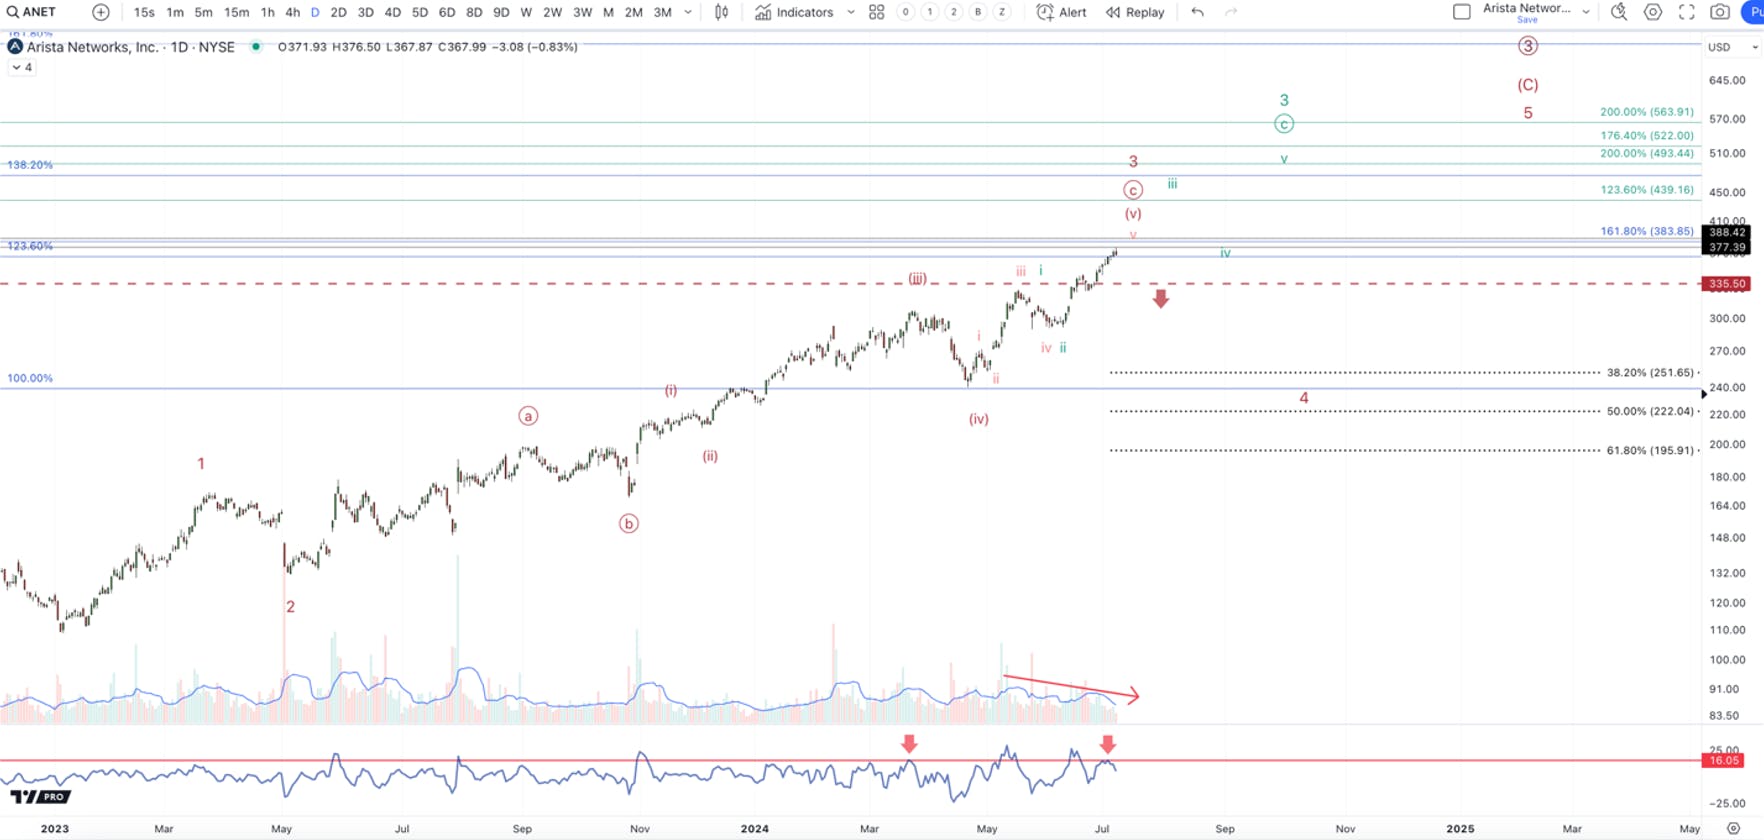
There are currently two counts that I see playing out in this final push higher. Both counts have us in the final swing higher of the larger 3rd wave, they only differ on how high this swing can go before we see a larger pullback:
Technical Analysis
By Knox Ridley
There are currently two counts that I see playing out in this final push higher. Both counts have us in the final swing higher of the larger 3rd wave, they only differ on how high this swing can go before we see a larger pullback:
Green – If we can breakout over $390 and hold this level, then the odds favor this path higher. This would target the $440 – $480 region directly. The final target should be between $490 – $520 before we see the larger 4th wave pullback.
Red – If we fail to breakout over $390, and instead see a breakdown below $335. This would signal that we are in the 4th wave drop, which I generally have targets between $260 – $200. If this plays out, as long as we hold $195, this would be a decent buying opportunity for the final 5th wave swing higher.
Conclusion
InfiniBand has been reporting up to 500% growth and more recently 300% growth, yet for the first time since the AI surge, Nvidia reported that networking declined sequentially this past quarter.
Despite Nvidia’s GPU moat being fully intact, its networking lead is in question. Gartner recently reported that by 2028, 80% of hyperscalers will “opportunistically” prefer Ethernet over proprietary technologies. According to Broadcom, this shift is happening quickly with management predicting that as soon as next year “all mega-scale GPU deployments will be on Ethernet.”
Arista Networks is a stock to watch in this space, primarily for its defensibility on the bottom line. The company sees $750 million in back-end AI revenue in 2025 stemming from growth among hyperscalers. Heavy revenue concentration in Meta and Microsoft is a core risk to watch, yet capex spend is accelerating for the time being, providing growth tailwinds for the networking industry as a whole. Next week, we will revisit another Ethernet networking play with more revenue and a stronger growth story for 2025, despite being weaker on the bottom line.
Damien Robbins, Equity Analyst at the I/O Fund, contributed to this article.
This article was originally published on Forbes on Jul 11, 2024,09:48pm EDTForbes Forbes on Jul 11, 2024,09:48pm EDT
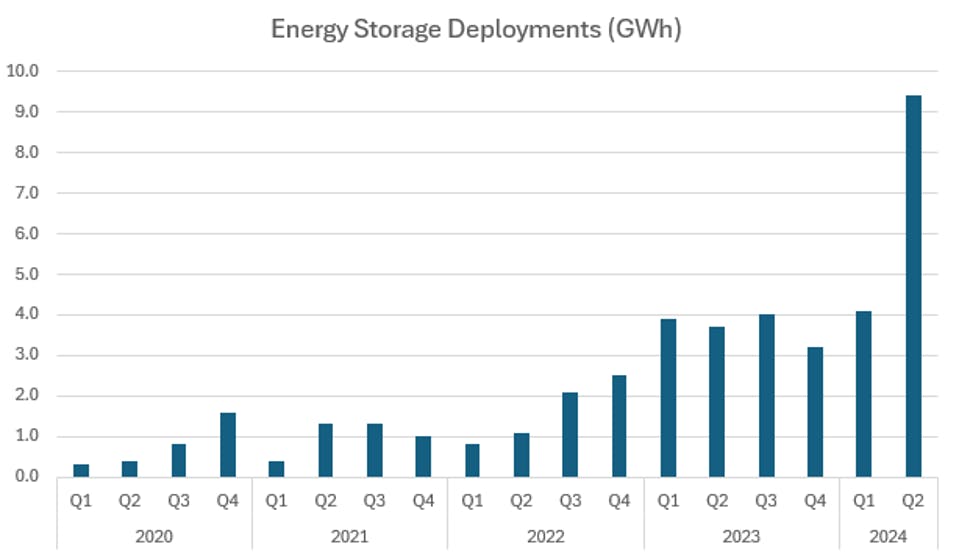
After months of being the lowest performing Mag 7 stocks, Tesla saw rapid gains — up 42% in a one month rally, with 37% of those gains in eight sessions — after it reported Q2 deliveries ahead of expectations and a surge in energy storage deployments.
Optimism had also been building for its much-anticipated robotaxi reveal on August 8, but that now has reportedly been pushed back until October. Despite the surge in share price and renewed deliveries growth in Q2 relative to Q1, Tesla still is facing an EV demand problem with production and deliveries set to decline in 2024. Investors are hoping Tesla is at a meaningful bottom, yet that will require significant growth in the back half of the year.
Production & Deliveries Decline
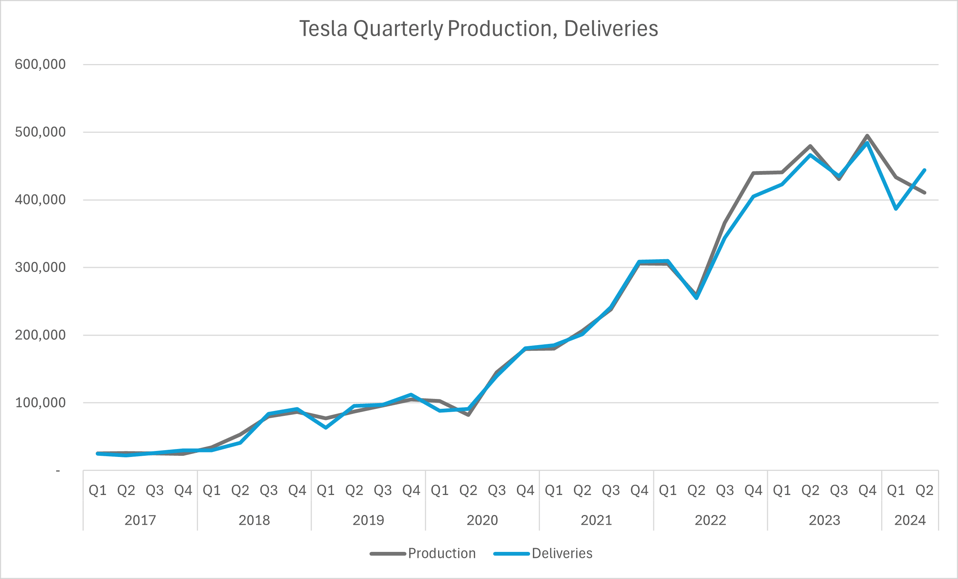
Tesla delivered 443,956 EVs in Q2, about 1% more than consensus for 439,302 deliveries. Despite rebounding to a 57,000 QoQ increase from Q1, Q2 notched a second straight YoY decline, at (4.8%), though this was an improvement from Q1’s (8.5%) YoY drop.
Production fell to the lowest level in seven quarters, falling to 410,831 vehicles – this represented a (5.2%) QoQ and (14.4%) YoY decline in production. This follows production issues the EV maker faced in Q1, primarily impacts to ramping up the refreshed Model 3 in Fremont, and more recent issues with lowered Model Y production in China and five days of production pauses in Germany in June.
Source: I/O Fund
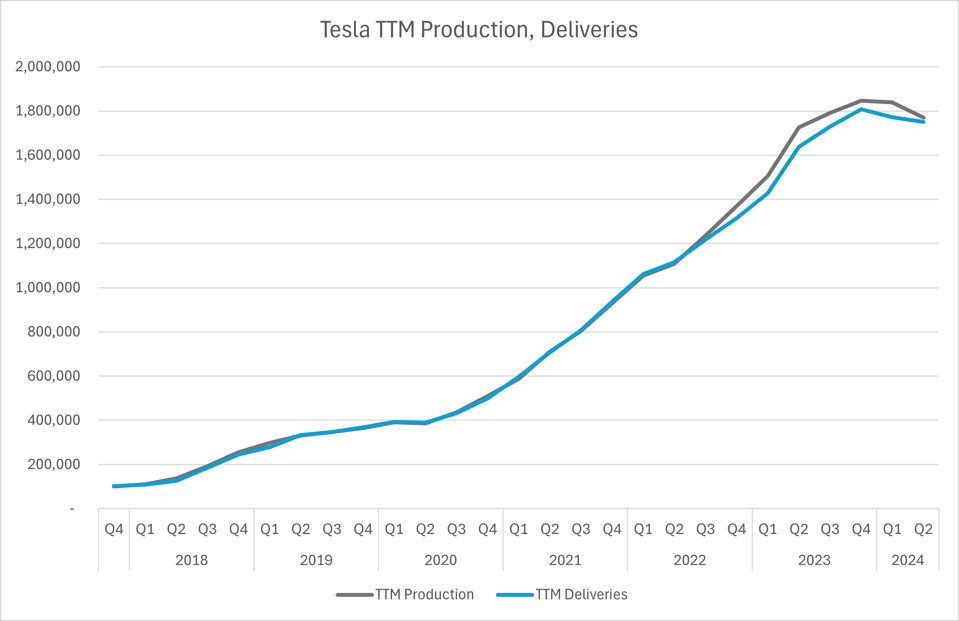
While the QoQ increase in deliveries was a positive sign to see after Q1’s sharp sequential decline, production and deliveries are both peaking in the short term on a TTM basis. Both have pulled back below the 1.8 million mark in Q2 – production totaled 1.769 million vehicles, with deliveries at 1.75 million vehicles. This comes after Tesla warned in Q1 that 2024’s “vehicle volume growth rate may be notably lower than the growth rate achieved in 2023.” At the moment, we’re tracking for a (3%) to (4%) decline.
Production and deliveries both declined below 1.8 million on a TTM basis.
Source: I/O Fund
Q2’s deliveries point to inventory reduction/channel clearing efforts. Q1 had excess inventory of more than 46,000 vehicles, and thus Tesla had lowered production for this excess to be absorbed in Q2.
In Q1, Tesla noted that it began lowering vehicle and subscription prices, and offering leasing and financing deals to help boost demand, and its TTM trend seems to confirm that weaker demand from Q1 is persisting through to Q2. The industry backdrop in the US remains challenged, as EV demand “has grown more slowly than expected due to high borrowing costs, economic uncertainty and consumer preference for gasoline-electric hybrids.”
To ease these fears, Tesla would need to report strong sequential growth in Q3 and Q4, for both production and deliveries. Assuming 5% QoQ growth in production in Q3 and 7% QoQ growth in Q4, for volumes of ~431,370 and 461,570 respectively, and 2% residual inventory in each quarter, Tesla would end the year at 1.737 million vehicles produced and 1.705 million delivered. This would mark a nearly (6%) YoY decline.
Every Thursday at 4:30 pm Eastern, the I/O Fund team holds a webinar for premium members to discuss how to navigate the broad market, as well as various stock entries and exits. We offer trade alerts plus an automated hedging signal. The I/O Fund team is one of the only audited portfolios available to individual investors. Learn more here.Learn more here.
China Deliveries, Market Share Slip
Tesla continues to face major headwinds in China, with China-made deliveries declining on a YoY basis for a third consecutive month in June. We noted to our free readers in November and December 2023 that primary rival BYD’s strong growth presented a tangible and challenging headwind for Tesla in that nation.
Now, we’re seeing more evidence that Tesla’s growth challenges are unique for China. Tesla’s China-made deliveries totaled 71,007 vehicles in June, a 2.2% MoM decline and a 24.2% YoY decline. Stripping out exported vehicles, local deliveries were 59,261, down nearly (20%) YoY but up 7.3% from 55,215 deliveries in May.
BYD outsold Tesla more than 2-to-1 in June, delivering 145,179 BEVs in the month, up 13.2% YoY. Smaller EV rivals Nio and Zeekr also saw strong deliveries, posting record high tallies for June. Industry-wide growth was strong, with NEV sales projected to rise 8% MoM and 28% YoY to 970,000 vehicles. Tesla’s market share dropped below 7% in June, down from more than 11% a year ago as industry growth remains strong and as BYD continues to outsell Tesla significantly in China.
Tesla has an easy comp for July, where China-made deliveries were 64,285 vehicles, including exports. It’s imperative that Tesla break this string of declines in one of its core automotive markets as it heads into Q3. China-made sales were 205,747 vehicles in Q2, or more than 46% of total deliveries.
Energy Storage a Bright Spot, But EPS Impact Likely to be Minimal
Energy storage was a bright spot in Q2, with Tesla reporting a record 9.4 GWh in deployments, up more than 129% QoQ and 154% YoY. Q2’s deployments exceeded historical levels at 4 GWh per quarter, at a maximum.
Source: I/O Fund
This strong growth in deployments should help the segment contribute more to both revenue and gross profit, as its contribution to gross profit has increased significantly through 2023 and 2024. Energy storage contributed less than 8% of revenue in Q1, but could contribute 14% or more of total revenue assuming revenue more than doubles sequentially.
In terms of gross profit contribution, energy storage contributed 10.9% of Tesla’s $3.69 billion in gross profit last quarter, compared to 3.7% in Q1 2023. Energy storage has a superior margin profile versus Tesla’s automotive segment, at above a 24% gross margin in Q1. However, EPS impacts will be minimal in Q2 despite the likely triple digit QoQ revenue growth, as automotive margin has stabilized in the 18% range.
Assuming energy storage gross margin expands at the same pace in Q1 at 3 percentage points, to a 28% gross margin, the segment could generate $1.05 billion in gross profit, up from $403 million in Q1. This $600 million sequential growth would be a primary driver of sequential growth in gross profit company-wide, likely to $4.7 billion to $4.8 billion in Q2, up from $3.7 billion in Q1.
However, this boost to gross profit, driven by energy storage, won’t translate into a meaningful bottom-line impact. Assuming a 10% QoQ increase in operating expenses, net income would project to $1.85 billion, or ~$0.62 per share, just $0.01 ahead of the current consensus estimate for $0.61.
Sign up for I/O Fund's free newsletter with gains of up to 2600% because of Nvidia's epic run – Click hereClick here
Revenue, EPS Growth Muted
Q2 is currently expected to be the last quarter in which Tesla registers negative growth on both the top and bottom line, with analyst estimates pointing to (2.8%) revenue growth to $24.24 billion and (33.5%) adjusted EPS growth to $0.61.
Source: I/O Fund
Analysts expect Tesla to return to YoY growth in Q3, with revenue growth of 9.2% and adjusted EPS growth of just 2%, suggesting margin headwinds are expected to persist as this comes against a weak comp. It also highlights that despite this recent rapid growth in energy storage, automotive sales and margins will be a primary driver of bottom-line strength or weakness. Should energy storage continue to grow off of Q2’s level of deployments, it may shape up to be a more significant driver in 2025.
Margins Yet To Rebound
We have tracked Tesla’s margins for nearly a year now, assessing how low Tesla’s margins could go in an analysis in August 2023. We had estimated that Tesla’s operating margin would decline to 7.8% in our base case, or to 6.2% in a more bearish case. We also reiterated after Q3 earnings that this continual decline in margins highlights a broader concern for investors in that Tesla has provided no concrete guidance on how far margins will decline.
Tesla's operating margin continues to slide on a quarterly and TTM basis
Q1 2024’s actual operating margin was 5.5%, down from 11.4% in Q1 2023. On a TTM basis, operating margin fell to 7.8%, back to 2021 levels, and down from a peak of 17% at the end of 2022. Automotive margin has yet to rebound, and energy storage’s contribution is still not large enough to drive a meaningful inflection in operating margin.
Tesla's automotive operating margin dropped back below 16.4% in Q1, just a fraction above Q3 2023’s low.
Source: I/O Fund
Automotive operating margin dropped back below 16.4% in Q1, just a fraction above Q3 2023’s low. If this is a sign of stabilization in the 16% to 17% range, Tesla is facing a rocky road ahead, as operating margin has weakened consistently with automotive gross margin below 20%.
Conclusion
Tesla’s monster 42% one-month rally follows its Q2 delivery beat and budding optimism for its robotaxi reveal event, but under the surface, Q2’s delivery numbers do not seem quite as strong. TTM production and deliveries both peaked and have begun to decline, and it would take strong double-digit sequential growth through the remainder of the year to break this trend and return to positive YoY growth.
Demand issues look to be persisting as Tesla has lowered production to sell off a large chunk of existing vehicle inventory, with Q2’s production volume the lowest in seven quarters and more than 5% below delivery volume. Energy storage was a bright spot with triple-digit sequential growth, but its contribution down the line is not yet meaningful enough to drive a significant EPS beat.
While many will argue that Tesla is one of the most advanced AI companies in the world, my response is “sure,” but Tesla is also heavily exposed to consumer spending — and this is entirely out of their control. It’s been our contention for some time that Tesla is a Fed-related stock as vehicle financing and EV demand hinges on interest rates.
Interest rates are truly the most important data to track for Tesla in the current environment as high interest rates mean Tesla must lower prices (or vice versa). Therefore, it’s not surprising that Tesla has rallied during a period of increased optimism that a rate cut may be on the horizon.
Some will talk about recurring software revenue from robotaxis as the most important catalyst, but the harsh reality is that the Fed lowering rates is the most important catalyst for Tesla today. That may not be as exciting as AI, but Tesla is one of many tech stocks whose revenue growth and profitability is depends on the Fed instilling a more dovish policy.
Please note: The I/O Fund conducts research and draws conclusions for the Fund’s positions. We then share that information with our readers. This is not a guarantee of a stock’s performance. Please consult your personal financial advisor before buying any stock in the companies mentioned in this analysis.
TSMC is a foundry that manufactures the world’s most advanced chips, designated by node size. The most advanced node in production today is the 3nm and is primarily used by Apple in iPhones and MacBooks. The 5nm/4nm is used by Nvidia and others for AI accelerators, with high-performance computing quickly moving to 3nm and even 2nm.
Taiwan Semiconductor reported earnings on April 18th. The company topped analyst estimates and its internal guide with revenue growth of 12.9% YoY growth for US$18.9 billion. EPS beat by 4.4% at $1.38 reported compared to $1.32 expected.
Advanced node revenue continues to remain strong, though 3nm revenue dipped sequentially. Per the opening remarks: “3-nanometer process technology contributed 9% of wafer revenue in the first quarter.” This is down from 15% last quarter. The decline is temporary with Trend Force expecting 3nm production capacity utilization to be up 80% by year end. This quarter, revenue from 5nm and 7nm both expanded 2 points.
Despite warning of a slowdown in the broader semiconductor industry this year, TSMC’s April sales surged to NT$236 billion for growth of 60% YoY and 21% MoM. This marks a positive start to the 20-percentage point acceleration to 33% revenue growth that analysts expect as soon as the September quarter.
May sales grew by 30.1% YoY to NT$229.6 billion and June sales grew by 32.9% YoY to NT$207.87 billion, primarily due to the strong demand for AI chips.
We’ve provided an important foundry update on TSMC in early June, which you can find here. Ultimately, we feel obliged to cover TSMC again for our premium members as it’s truly the one that got away from us in H1 2024.
We feel some of the most important work we can do as investors is to look at the stocks that got away from us. The team is continually looking to improve, and thus we present you with an update on the financials as we look for an entry again.
Market Dominance
According to Trend Force research, TSM is the leading global foundry in terms of revenue. It has a market share of 61.7% in Q1 2024, up from 61.2% in Q4 2023. Samsung ranks a distant second with a market share of 11%, down from 11.3% in Q4 2023. SMIC and UMC rank third and fourth with a market share of 5.7%.
Most importantly, the company has over 90% market share in the manufacturing of advanced AI chips.
Financials Update: Strong Q2 Sales due to AI
The company’s June monthly sales grew by 32.9% YoY to NT$207.87 billion. May monthly revenue grew 30.1% YoY to NT$229.6 billion and April monthly revenue grew 59.6% YoY to NT$236 billion. Q2 revenue grew by 40.1% YoY to NT$673.51 billion. In USD, it grew by 32.9% YoY to $20.83 billion using the average exchange rate of 1 US dollar to 32.33 NT dollars. We will get the official USD numbers when the results are announced on July 18th. The monthly numbers suggest that Q2 revenue will easily beat the management guide of $19.6 billion to $20.4 billion. The company is benefiting from the strong demand for Artificial Intelligence chips and a recovery in the PC market.
The company reported its Q1 2024 results on April 18th. Revenue grew 12.9% YoY and down (-3.8%) QoQ to $18.87 billion and beat management guidance of $18 billion to $18.8 billion. The recent quarter showed an acceleration of revenue from a decline of (-1.5%) in the previous quarter. Management guidance for the next quarter is $19.6 billion to $20.4 billion, representing YoY growth of 27.6% at the midpoint.
The analyst consensus estimates are trending higher. They expect revenue to grow 29.8% YoY in the next quarter, up from the 20.6% YoY growth expected in mid-October and are expected to accelerate to 32.7% YoY growth in the September quarter.
Note: The below figures will differ slightly from our reports/the company IR due to the currency conversion. However, we use the estimates below to understand the expected growth rates.
Margins
The Q1 gross margin improved 10 bps sequentially to 53.1%, but it was down 320 bps YoY. The gross margin was down YoY as the company is witnessing higher costs due to the increase in electricity costs and due to a higher contribution from the 3nm node. This is expected, given that TSMC has historically seen headwinds in the initial ramp phase before ultimately realizing higher margins once the node has scaled.
The gross margin guide for the next quarter is 51% to 53%. The gross margin is expected to decline 110 bps sequentially at the mid-point primarily due to the impact of the earthquake on April 03rd in Taiwan and due to another hike in the electricity prices in April this year.
Wendell Huang, CFO of the company, said in the Q1 earnings call, “After last year's 17% electricity price increase from April 1, TSMC's electricity price in Taiwan has increased by another 25% starting April 1 this year. This is expected to take out 70 to 80 basis points from our second quarter gross margin. Looking ahead to the second half of the year, we expect the impact from higher electricity cost to continue and dilute our gross margin by 60 to 70 basis points. We also expect the higher electricity cost to indirectly lead to higher materials, chemical and gases and other variable costs.
In addition, we expect our overall business in the second quarter of the year to be stronger than the first half. And the revenue contribution from 3-nanometer technologies is expected to increase as well, which will dilute our gross margin by 3 to 4 percentage points in second half of '24 as compared to 2 to 3 percentage points in first half of '24.”
The operating margin improved 40 bps sequentially to 42% and was down 350 bps YoY due to the points discussed above. The company is working on tighter cost controls and has helped to reduce operating expenses to 11.1% of revenue in the recent quarter from 11.4% in the December quarter. The operating margin guide for the next quarter is 40% to 42%.
The net margin declined 20 bps sequentially to 38% and down 270 bps YoY. GAAP EPS came at $1.38 compared to $1.31 in the same period last year and beat estimates by 4.4%. The analysts expect GAAP EPS to grow 21.1% YoY to $1.38 in the next quarter and accelerate to 34.1% growth to $1.73 in Q3.
Management is confident of achieving a “long-term gross margin of 53% and higher and sustainable ROE of greater than 25%.”
Due to the economies of scale and its leadership position in the foundry industry, the company maintained good profitability. Many companies have struggled with rising costs, while TSM has successfully navigated these challenges by controlling costs and negotiating better prices with its customers.
Cash Flows and Balance Sheet
The operating cash flow was $13.9 billion or 74% of revenue compared to $12.66 billion or 76% of revenue in the same period last year.
The company’s financial stability is evident in its free cash flow growth, which has more than doubled YoY. Free cash flow was $8.12 billion or 43% of revenue compared to $2.72 billion or 16% of revenue last year. The foundry industry is capital-intensive, and the company is witnessing a stabilization in capital investments that led to higher free cash flow in the recent quarter.
The company has cash and marketable securities of $60 billion and debt of $30.25 billion compared to $54.89 billion and $30.03 billion in the December quarter. The company paid $2.48 billion in cash dividends in the recent quarter.
Advanced Nodes and AI revenue
The Advanced nodes are defined as 7-nanometer and below. We discussed in our recent editorial on the advanced nodes and AI-related revenue reaching fresh records. Most of the AI chips produced by the company utilize 5-nanometer and 4-nanometer process technology. However, 3-nanometer revenue is expected to triple this year. Volume production for 2-nanometer is expected in Q4 of 2025 and should have a meaningful revenue contribution in the first half of 2026.
We mentioned, “Currently, AI accelerators use TSMC’s 5nm process. Nvidia’s Hopper and Blackwell are built with a N4X process that is tailored for high-performance computer applications. This is a customized variant called “4N” that Nvidia uses, yet TSMC recognizes this as 5nm revenue in their earnings report. AI accelerators are expected to quickly move to smaller nodes to help lower power consumption. TSMC’s 3nm process is more energy efficient, and energy efficiency will improve further with the 2nm process.”N4X process that is tailored for high-performance computer applications. This is a customized variant called “4N” that Nvidia uses, yet TSMC recognizes this as 5nm revenue in their earnings report. AI accelerators are expected to quickly move to smaller nodes to help lower power consumption. TSMC’s 3nm process is more energy efficient, and energy efficiency will improve further with the 2nm process.”
Due to its leadership position, management has been optimistic about the long-term opportunity in the manufacturing of AI chips. “In summary, our technology leadership enable TSMC to win business and enables our customer to win business in their end market. Almost all the AI innovators are working with TSMC to address the insatiable AI-related demand for energy-efficient computing power. We forecast the revenue contribution from several AI processors to more than double this year and account for low-teens percent of our total revenue in 2024.Almost all the AI innovators are working with TSMC to address the insatiable AI-related demand for energy-efficient computing power. We forecast the revenue contribution from several AI processors to more than double this year and account for low-teens percent of our total revenue in 2024.
For the next 5 years, we forecast it to grow at 50% CAGR and increase to higher than 20% of our revenue by 2028. Several AI processors are narrowly defined as GPUs, AI accelerators and CPU's performing, training and inference functions and do not include the networking edge or on-device AI. We expect several AI processors to be the strongest driver of our HPC platform growth and the largest contributor in terms of our overall incremental revenue growth in the next several years.”For the next 5 years, we forecast it to grow at 50% CAGR and increase to higher than 20% of our revenue by 2028. Several AI processors are narrowly defined as GPUs, AI accelerators and CPU's performing, training and inference functions and do not include the networking edge or on-device AI. We expect several AI processors to be the strongest driver of our HPC platform growth and the largest contributor in terms of our overall incremental revenue growth in the next several years.”
According to the Commercial Times report, the company is planning to increase the price of 3 nanometer chips by 5% and price of advanced packaging by 10-20% next year. This should help to clear up some of the margin worries caused by the increase in electricity prices and the increased costs of operations of overseas fabs.
Nvidia’s CEO Jensen Huang replied to a question from Morgan Stanley analyst on Nvidia’s opinion on raising prices saying “The price of TSMC's services was too low, and that TSMC's contribution to the world and to the technology industry was not adequately reflected in its financial reports.” It shows the immense pricing power of TSMC.
Its customers Apple, Nvidia, Qualcomm, and AMD have booked the company’s 3nm process technology through 2026 amid the strong demand for AI chips. It further shows TSMC's leadership position in advanced nodes. TrendForce also reported that the company has received new orders from MediaTek and Google for the 3nm advanced chips.
The AI wave has also boosted the company’s advanced packaging business, particularly Chip-on-wafer-on-substrate (CoWoS) services. During the last earnings call, the management also highlighted that the demand for advanced packaging “is high, extremely high. And we do our best to increase the capacity to alleviate the shortage.” TSMC’s monthly CoWoS capacity is expected to expand to 60,000 wafers by the end of next year, up 300% from 15,000 at the end of 2023.
The company’s other advanced packaging technology, system-on-integrated chips (SoIC), is also in robust demand. According to TrendForce, the company is expected to increase the monthly capacity to 5,000 to 6,000 units by the end of this year, up 2.5x to 3x from 2,000 units in 2023. Furthermore, by the end of next year, it is expected to scale to 10,000 units. According to the Economic Daily News, the company has secured Apple as the second major customer of SoIC.
Valuation
The company is trading at a P/E ratio of 35.1 and a forward P/E ratio of 28.9. The P/S ratio is 13.4 and the forward P/S ratio of 11.3. In the last five years, the P/E ratio peaked at 41.8 in February 2021 and hit a low of 10.3 in November 2022. The stock is now trading above its five-year average P/E ratio of 23.7. However, with the expected growth from the increasing contribution of AI revenue and its leadership position in advanced nodes, the market will likely continue to reward with a premium valuation.
Conclusion
TSMC has good long-term revenue growth potential due to its leadership position in advanced technology nodes. The primary catalysts are HPC, particularly AI chips and the recovery in the smartphone market. It has been able to negotiate better prices with its customers, made cost improvements, and maintained strong margins and free cash flows. Here are some technical analysis notes from Portfolio Manager Knox Ridley:
There are times in which Technical Analysis can be quite accurate at nailing lows/highs and managing risk. We use it in conjunction with our outstanding fundamental process to increase our accuracy. However, there are times in which the technicals are at odds with the fundamentals, meaning one is wrong. This is exactly what happened in November of last year, as the technicals sensed risk while the fundamentals did not.
The one in red was a 5 wave drop from the June high followed by a 3 wave bounce. More times than not, when we see this setup from a technical perspective, it tends to lead to more downside. This is not what happened, as TSM took the green path higher, and then exceeded it.
We decided to lock in +20% gains in TSM on this bounce, due to technical and geopolitical risk, leaving a lot on the table. This happens in investing, and it has led to the I/O Fund tightening up our process moving forward.
That being said, where TSM is today is much clearer now that we have a solid trend in place.
The near vertical move higher suggests that we are in an unfinished uptrend. This is unfolding as a 5 wave pattern, which still needs at least a 4th wave drop and a 5th wave push higher to complete. This is where the two counts in the chart diverge:
Red – We are completing the large 3rd wave, should see a sizable 4th wave correction soon, followed by one more large push to new highs.
Green – We are completing a minor 3rd wave soon. This would be followed by a smaller correction, which would then lead to at least two more swings higher.
Like most 3rd waves, they can continue to extend, which makes identifying a turning point challenging. But, at some point, this 3rd wave will need to correct which is why we plan to buy on a dip rather than a breakout. The best way to handle this is set up a moving support line that will signal the 3rd wave has ended and the 4th wave drop has begun. That level for TSM is $176.
Once we drop below $176, it will signal that the expected correction is underway, and we will setup our buy plan.
Two weeks ago, Knox Ridley was asked to present at the Seeking Alpha Investing Summit in New York. The topic of the presentation was “How to Safely Invest in Tech: The Million Dollar Question,” a topical question that we believe has not been answered. Tech investors either buy with no risk management measures in place, or they are too safe and do not participate fully in the life-changing returns that tech has to offer. As a result, we’ve seen investors hold the wrong stocks for too long, the right stocks for not long enough, or approach tech investing as a long term buy and hold strategy that has led to large losses.
With audited returns of 131% since inception, compared to the NASDAQ-100’s 82%, portfolio manager, Knox Ridley, lays out how we have successfully maintained an overexposure to the right tech stocks, while navigating the inherent volatility within tech. We also discussed our views on AI and if we view it as a bubble, as well as our views on crypto currencies. The entire presentation can be viewed on Seeking Alpha here.
Below are a few highlights of the event. Knox Ridley discusses the importance of a catalyst within proper tech investing, how the investing community is already confusing AI, and how the our team is preparing for a potential weak spot within the economy.
If you are a tech investor who would like know our plans for participating in the upside tech has to offer, and how we minimize the downside, we encourage you to attend one of our weekly webinars. Every Thursday at 4:30 EST, portfolio manager, Knox Ridley, goes through various broad market charts, as well as discusses our game plan on various stocks and crypto currencies that we currently own or want to own. Learn more here.
Please note: The I/O Fund conducts research and draws conclusions for the Fund’s positions. We then share that information with our readers. This is not a guarantee of a stock’s performance. Please consult your personal financial advisor before buying any stock in the companies mentioned in this analysis.
Lead Tech Analyst and CEO Beth Kindig recently joined Real Vision’s Nico Brugge to discuss her AI outlook on leading AI stock Nvidia, while sharing which AI stock she believes may outpace Nvidia’s returns through 2030.
This AI stock’s opportunity is in the AI inference market, which will begin to take shape when large language models (LLMs) migrate and operate locally on AI-capable client devices, such as PCs and smartphones. Kindig has boldly stated in Forbes, and on CNBC, and Bloomberg that Nvidia will reach a $10 trillion valuation by 2030. Yet, she believes this AI stock may outpace Nvidia’s stock and provide investors with a larger percentage return.
We built a leading AI portfolio beginning with Nvidia’s AI thesis in 2018, with our AI allocation of 45% in 2023 helping push us to a 131% cumulative return since inception. Now, we’re closely tracking what we believe is one of the next explosive growth waves in AI – and it’s not the cloud. Learn more here.here.
Training Versus Inference
Nvidia had surged to briefly become the world’s most valuable company due to its impenetrable moat in the data center GPU market, which was built upon the CUDA software platform for the purposes of training AI models. Eventually, we will see a shift from AI training to AI inference, which leaves the market open for competitors.
Kindig explained in the interview with Brugge that Nvidia’s H100 transformer engine was the impetus for Chat-GPT’s moment. Chat-GPT, and its competitors, are essentially large R&D departments for training models. We are in the midst of AI training, and what follows will be the AI inference market. As Kindig explains, “when you take the models and you bring them to the edge, and you run those models and have it make predictions based on live data for actionable results, that’s inference.” She pointed out that “for the most part, it’s agreed that inference will be a larger market than training once the ecosystem is mature.”
Currently, there’s one primary headwind to the inference market; devices are not powerful enough to handle the requirements to run AI at the edge. Kindig says that “one of the things holding back inference is our client devices, so our PCs and mobile. Inference runs best close to the data, and we don’t have powerful enough devices for inference, for where AI needs to go.”
AI PCs are currently working on solving this critical bottleneck, with NPU, GPU and CPU equipped devices packing the necessary power and efficiency to operate AI models locally, on-device and without relying on data being sent to and from the cloud.
Kindig told Brugge on Real Vision that she believes one AI stock is well positioned to capitalize on the long-term opportunity arising in AI inference — that stock is AMD.
Why AMD Can Outpace Nvidia Through 2030
Nvidia will need to rise nearly 250% by 2030 to reach Kindig’s $10 trillion target, yet she thinks AMD has the potential to provide a larger return over that time frame.
She told Brugge that her “time horizon would be that we see really nice movement by 2027, but we really need this 2030 time period to play out, and there’s a few reasons. Number one, Nvidia has the training market cornered right now. Training requires a lot of compute power, and they’ve gone through architectural changes that have defied Moore’s Law. This is things like Tensor Cores, which do matrix computations; floating-point precision, moving from 16 point [FP16] to 8 point [FP8], [the transformer engine switches back and forth which] increases accuracy while also increasing speed [depending on the workload]. So, all of those things, Nvidia has 98% of the GPU market and is crushing it, but a lot of that is training.”
Core to this thesis on AMD is giving time for the budding inference market to take off and mature – Kindig explains that “where AMD is going to compete with Nvidia is a market that is very early, so we need time for that to mature, which is inference. Many people may get that confused, because we are fully in the AI market today because Nvidia is putting up those huge data center numbers. We are in the data center training market today; one day, we will be an AI market led by inference.”
Kindig told Brugge that there are a “few reasons” that AMD could do better than Nvidia in inference and etch a niche, with the primary reason being that inference is “one way to circumvent CUDA.” CUDA is Nvidia’s proprietary software stack that has essentially locked developers into its GPU ecosystem, and what has driven its ~98% market share in AI GPUs.
For a deep dive on CUDA and how it’s Nvidia’s moat and first line of defense in the AI accelerator market, read more here and here.here and here.
How AMD Can Fend Off Nvidia
AMD is equal to Nvidia on hardware in many regards, but CUDA has locked in Nvidia’s monopoly; however, it’s likely that Big Tech and developers will seek alternatives to CUDA to limit reliance on Nvidia for the entirety of the hardware stack for AI development.
Kindig notes that CUDA will be the “biggest hurdle for sure” for AMD to compete against, “but after that, it’s probably product roadmap versus product roadmap, meaning that for everything AMD does, can Nvidia do better, by 6 months.” Put differently, Nvidia took the industry by storm with its transformer engine-equipped H100s, which saw extreme demand outstrip supply for multiple quarters. No company could compete at the time with a similarly spec’d GPU that could provide the same level of AI computing performance.
Now, AMD is accelerating its product roadmap cycle to align with Nvidia’s, after being a generation behind. AMD is aiming to launch its MI400 lineup in 2026 alongside Nvidia’s Rubin platform, catching up in the release cycle after being behind the GB200 with its MI350x accelerators.
AMD has an edge over Nvidia in that it is undercutting them quite heavily on price, though this is detrimental to margins and thus bottom line growth. Kindig explains that this “incentive of saving $20,000 or more [per GPU] is big enough for these companies that are building these huge data centers, that they’re likely to try their very best to make this work with their in-house engineering departments. This is Big Tech only. This will not apply to enterprises or small businesses, which won’t have the time or resources to do anything other than CUDA.”
At scale, that $20,000 savings for a GPU with similar compute performance capabilities and similar memory bandwidth, albeit with AMD’s software instead of CUDA, can entice companies to shift towards allocating some of the tens of billions flowing to Nvidia’s chips to AMD in the long-run.
For example, Microsoft is reportedly aiming to triple its GPU supply this year, from 600,000 GPUs to 1.8 million GPUs, and is a customer of both Nvidia and AMD. As AI accelerator purchases increase in size and scale, with upgrades to the latest generation for performance improvements and decreasing TCOs, Big Tech can save billions by allocating a fraction to AMD – hypothetically speaking, allocating one-third of a 1.2 million GPU purchase could save $8 billion with AMD’s pricing. That $8 billion could then be deployed to purchase more GPUs, train the next generation of AI models, and otherwise remain ahead of stiff competition.
Kindig explains that this is both an “opportunity and a risk that AMD undercut so much on price, because their margins will not look as good as Nvidia’s. Nvidia has been an amazing stock not only because of these revenue beats, but because the margins and the pricing power that CUDA has created” has driven 600% growth on the bottom line that AMD won’t be able to replicate.
Analysts foresee strong growth for AMD on both the top and bottom lines over the next few years, though it pales in comparison to Nvidia’s streak of blazing triple-digit growth rates. AMD’s revenue growth is forecast to accelerate from under 13% in 2024 to 28% in 2025, before moderating to 18% in 2026. Adjusted EPS growth is expected to accelerate from 32% to 59% in 2025.
Source: Seeking Alpha
While it is by no means the triple digit growth that Nvidia has been putting up, these top and bottom line accelerations are what has been rewarded by the market, especially for AI stocks. Because of the differing growth rates, AMD trades at a cheaper valuation than Nvidia: currently, AMD is valued at 7.8x 2025 revenue and 28.3x adjusted EPS, versus 19.2x revenue and 34.7x adjusted EPS for Nvidia for the same period. However, both companies are currently trading above long-term historical averages for these valuation multiples, with AMD trading above its 10-year average 4.3x revenue multiple and Nvidia above its 10-year average of 14.0x revenue.
Conclusion
Nvidia has greatly rewarded investors as it quickly ascended to be the pinnacle of the generative AI revolution of 2023 and 2024, with revenue consistently exceeding expectations so far on robust demand. Beth Kindig and the I/O Fund have projected Nvidia to potentially rise to a $10 trillion valuation by 2030 on strong data center growth from its rapid GPU roadmap and upcoming software and automotive opportunities, but Kindig believes that AMD and its opportunity in AI inference may help the stock outpace Nvidia’s projected 250% return through 2030.
For more insights on AMD, consistent deep dive research on AI stocks and mega-trends, weekly webinars with AI stock and broad market outlooks, real-time trade alerts on AI stock buys and sells, consider taking a look at the I/O Fund’s premium services here.here.
Disclaimer: The I/O Fund conducts research and draws conclusions for the company’s portfolio. We then share that information with our readers and offer real-time trade notifications. This is not a guarantee of a stock’s performance and it is not financial advice. Please consult your personal financial advisor before buying any stock in the companies mentioned in this analysis. Beth Kindig and the I/O Fund own shares in NVDA and AMD at the time of writing and may own stocks pictured in the charts.
Recently, the I/O Fund team wrote an article in Forbes: “AI Power Consumption: Rapidly Becoming Mission-Critical” where it was stated: “Over the past few months, multiple forecasts and data points reveal soaring data center electricity demand, and surging power consumption. The rise of generative AI and surging GPU shipments is causing data centers to scale from tens of thousands to 100,000-plus accelerators, shifting the emphasis to power as a mission-critical problem to solve.”
As the analysis points out, eventually we will see million-plus accelerator data centers. Thus, AI’s electricity demand is forecast to surge, especially in the data center. Morgan Stanley’s base case is calling for 500% increase in power demand over the next three years. Wells Fargo is projecting AI power demand to grow 550% by 2026, before rising another 1050% by 2030, from 8 TWh to 652 TWh in a seven-year period.
Liquid Cooling plays an important role in reducing the heat that AI systems generate. We first covered Liquid Cooling in a Super Micro analysis in May of 2023, yet would like to double-click on this trend for our premium members as it’s becoming what we consider to be “the third realm of competition.” Liquid cooling technology has been around for decades, yet this technology is becoming mission critical due to the increasing levels of compute power from AI accelerators, starting with the GB200 systems and B200 GPUs.
Per the previous analysis: “In 2022, Supermicro stated that liquid cooling is being used in 10% of supercomputers but will grow to be used in the “vast majority” in order to offset the heat generated by power-consuming components.”
Although the GB200 will ship end of this year, and the B200 will fully ship in early 2025, vendors are scaling their liquid cooling capacity now. The capacity investments are being made right now, and we can see evidence of this in Super Micro’s most recent earnings report with an increase in inventory. We also find hints of this in Dell’s earnings report, with the company also reporting an increase in inventory as these leading AI server companies wait for Nvidia’s Blackwell to ship.
Last week, we clearly outlined that AI power consumption is a problem the industry must work diligently to solve. For our premium members, we take this further to discuss how liquid cooling is at the forefront of driving down energy requirements for AI systems. Below, we look at the beneficiaries of this important trend and what we are looking for in managing our positions – including our plans for re-entering Super Micro, how we view Dell given the weak earnings report, plus some brief analysis on Hewlett Packard Enterprises (HPE), Vertiv, to name a few.
Brief Overview of Liquid Cooling:
Liquid molecules are closer together than air molecules, which results in higher heat transfer. This results in liquid removing 4 times more heat than air. The heat capacity of water or glycol is higher than air, so the amount of heat being transferred is higher. Most servers today are air-cooled, yet AI necessitates a shift to liquid cooling are GPUs are already at 700W of power and are moving toward 1000W of power.
AI/ML require massive amounts of data processing, and as future generations of CPUs and GPUs are released, these systems will exceed air cooling capacity. Liquid cooling also solves throttling, which occurs when CPUs and GPUs overheat and are throttled back to avoid damage to the chip. In the case of high-performance computing, liquid cooling reduces total cost of ownership as air cooling requires air conditioning and server fans to run constantly.
Cooling data center servers is responsible for 40% of the data center energy consumption. According to Dell, enclosed DLC solutions can save up to 23% of energy compared to traditional air-cooled racks. McKinsey places this number at 27% savings when there is 75% liquid cooled and 25% air cooled servers.
Direct Liquid Cooling: DLC uses liquid-cooled cold plates that in direct contact with GPUs and CPUs. The cold plates transport heat away from the processors. The process of circulating liquid directly over the components is also known as Direct to Chip Cooling, and is a closed loop system, or also known as a self-contained cooling system.
Immersion Cooling: The system is immersed in liquid for cooling. The immersion tank has a coolant distribution unit, including a pump to circulate dielectric fluid to extract heat from the servers.
Rear Door Heat Exchanger: Uses a specialized rear door to the rack where coolant absorbs the heat.
In-row cooling refers to solutions designed to cool and distribute air in a data center aisle. When combined with row or rack containment, the in-row coolers capture 100% of the IT-generated heat.
In addition to lowering power consumption, benefits from liquid cooling includes higher server density as the need to create space for airflow is removed. Liquid cooling also eliminates hot spots with more even distribution. The lower temperatures from liquid as opposed to air also extends the life of the server (removes throttling).
Nvidia’s Blackwell is Hot
Nvidia’s A100 released in 2021 operates at 300W, the H100s released in 2023 operate at 700W. The Blackwell architecture is a catalyst for liquid cooling as it nears 1000W, specifically the GB200 systems and the B200. This represents a 40% increase from the previous generation. Tom’s Hardware makes the argument that: “we can only refer to the basic rule of thumb with heat dissipation, which says that thermal dissipation typically tops out around 1W per square millimeter of the chip die area” and that “When it comes to high-performance AI and HPC applications, we need to consider the performance measured in FLOPS and the power it takes to achieve these FLOPS and cool the resulting thermal energy. What matters for software developers is how to use those FLOPS efficiently. What matters for hardware developers is how to cool the processors producing those FLOPS.”
Therefore, as computing power increases with each GPU generation, which is measured in FLOPS, cooling the GPUs is the crux, as it becomes a larger thermal dynamics issue that must be solved.
In terms of timing, the B100 is due out first and will be primarily air cooled. The B200 systems and chipsets will be the first release to be primarily liquid cooled. This is due to consuming upwards of 1,000 watts, which is too hot to be air cooled. The B200 doubles the transistor count compared to the H100 and provides 20 petaflops of AI performance compared to the H100s 4 petaflops. The resulting 3X leap in training performance and 15X leap in inference performance is shifting the focus to ways that power consumption can be lowered. Note: We’ve covered Nvidia’s upcoming Blackwell extensively, please see resources below.
The B200 will technically be out in late 2024 as a system that combines either 36 GPUs or 72 GPUs with Nvidia’s in-house Arm-based Grace Hopper CPUs. These superchips are called the GB200 NVL36/NVL72 and will operate as one supercomputer, allowing for trillion-plus parameter models to be trained.
The B200 chipset will ship in early 2025. As stated in a previous analysis on Nvidia, the B200 chipset will offer “a second-generation transformer engine that supports 4-bit floating point (FP4) with the goal of doubling the performance and size of models the memory can support while maintaining accuracy […] This is helpful because AI models are moving toward neural nets that lean on the lowest precision and yet still yield an accurate result. In this case, 4 bits double the throughput of 8-bit units, compute faster and more efficiently, and they require less memory and memory bandwidth.”
Nvidia offers SuperPODs that combine eight H100 GPUs connected with NVLink with the DGX SuperPOD connecting 32 nodes of eight GPUs for a total of 256 H100 GPUs. As the B200s come out, these SuperPODs will scale to provide more than 1 exaflop of AI compute power and move from FP8 precision to FP4. The DGX GB200 SuperPODs will connect up to tens of thousands of GB200 superchips with shared memory.
This section is included to help cement the inevitability that liquid cooling is becoming what Damien Robbins, equity analyst at the I/O Fund dubbed the third realm of competition.
Recent Commentary on Liquid Cooling:
At BofA’s Global Technologies Conference in early June, analyst Vivek Arya questioned Nvidia’s VP of Accelerated Computing Ian Buck about the increasing power requirements per GPU. Since liquid cooling’s catalyst begins with Nvidia’s second release in the Blackwell generation (GB200 and B200), it’s important for us to examine what is being said before we look more closely at the beneficiaries.
Vivek Arya:
How is the outlook around Blackwell as we look at next year? First of all, do you think that because of the different — the power requirements that are going up significantly, does that constrain the growth of Blackwell in any way?
Ian Buck, Nvidia:
“Data centers don't drop out of the sky. They're big construction projects. [Customers] need to understand what is a Blackwell data center look like and how is it going differ than Hopper. And it will. The opportunity we saw with Blackwell was to transition to a denser form of computing, to put 72 GPUs in a single rack, which has not been taken to scale before. … In Taiwan, for example, the people that are building the liquid cooling infrastructure, the power shelves, the WIPs, which is the cables that go down into the bus bars. The opportunity here is to help them get the maximum performance through a fixed megawatt data center and at the best possible cost and optimized for cost. By doing 72 GPUs in a single rack, we need to move to liquid cooling. We want to make sure we had the higher density, higher power rack, but the benefit is that we can do all 72 in one NVLink domain.
Connect them all up with copper instead of having to go to optics, which adds cost and adds power. And every time you add cost and power, you're just taking away from a number of GPUs you can put in your 10-, 50-, 100-megawatt data center. So that is driving us towards reducing cost, increasing density.
So when you look at a Blackwell, you may say, well, it's really hot, that's actually going to be significantly improving the total throughput of a fixed power data center. So there's a strong economic and technological driver to transition to more denser and more power efficient and more — and next-generation cooling technologies than just air.
Water is a fantastic mover of heat. Your house is built with insulation that is nothing more than just trapping air. Air is actually an insulator. It's not a good transfer to heat, but water is excellent at it. If you ever jumped from a 70-degree pool from a 70-degree air, it feels really cold.
That's because water is sucking the heat right out of you. It's really good at moving heat around. And that efficiency goes right to more GPUs, more capabilities and denser, more capable AI systems.”
–End Quote
Buck’s response did not directly touch upon increasing power requirements, but hinted that this shift to Blackwell and beyond, with larger racks and denser compute, will be built upon liquid cooling, which will allow these more powerful and power-hungry GPUs to operate efficiently at scale.
Nvidia CEO Jensen Huang also discussed liquid cooling in Q1’s earnings call: “the Blackwell platform has expanded our offering tremendously. The integration of CPUs and the much more compressed density of computing, liquid cooling is going to save data centers a lot of money in provisioning power and not to mention to be more energy efficient. And so it's a much better solution.”The integration of CPUs and the much more compressed density of computing, liquid cooling is going to save data centers a lot of money in provisioning power and not to mention to be more energy efficient. And so it's a much better solution.”
Super Micro: Leader in Liquid Cooling
Super Micro’s ascent in the server market has been breathtaking. In 2021, the company ranked #6 among server companies with $2.5 billion in revenue compared to Dell’s $14 billion in server revenue and HPE’s $12 billion. Fast-forward and SMCI is on a direct path to reaching $25 billion in revenue over the next year. That’s a 10X revenue increase in about 3-4 years’ time.
Super Micro expects liquid cooling to be rapidly adopted over the next year and a half. The company is deploying three of the “world’s largest DLC liquid-cooled” systems in the current quarter, ending in June. The Nvidia HGX AI supercomputers with liquid cooling are expected to “potentially” save customers up to 40% of energy costs compared to air-cooled systems.
SVP and CFO, David Weigand, explained at BofA’s conference:
“we have started to ship liquid cooling at really at scale, at larger volumes in this core. And so, there's no question that that industry is coming up to speed with the reality of where we're going, which is the fact that power is constrained all around the world. And then — and therefore, when you build these large data centers, you're going to have to think twice now about using liquid cooling, because by you using liquid cooling, you can not only — we say that it's free with a bonus, and that's because it's free because you're not only having to put in smaller chillers, you don't have to use air conditioning.
If you have really liquid cooled racks, you can put more dense racks and more racks into a data center, so it's more efficient if you're using liquid cooling. And so, it's really the cutting-edge companies right now that are putting in liquid cooling, liquid cooled racks into their data centers so that it's — the huge use of power right now is going to really drive liquid cooling. As much as the fact that all the GPUs and CPUs are running at higher wattage as they go over 1000, it's going to start to become painfully obvious.”
–End Quote
SMCI’s management has stated that liquid cooling will cost more as it takes longer to assemble and test, and the company plans to charge for this. It’s also expected that SMCI will be the first to ship liquid cooled AI systems before its competitors.
At a recent investors conference, management stated the company has a rack capacity of 5,000 per month and a liquid cooled rack capacity of 2,000 racks per month. This means that SMCI plans to utilize direct liquid cooling (DLC) in 30% of its racks, to start.
According to the CFO, the Malaysia site will offer the opportunity to “double eventually our worldwide capacity” and will offer both air cooled and liquid cooled servers. With this in mind, Super Micro CEO Charles Liang expects direct liquid cooling (DLC) adoption to reach 15% in the next 12 months and 30% over the next two years, a rapid shift up from 1% of the market. The CEO updated this on xAI, stating they now foresee DLC adoption growing from <1% to 30% in a year.
Super Micro is Seeing Higher Inventory Levels and Lower Cash Levels
Per our recent SMCI earnings write-up, inventory increased to 92 days compared to 67 days in the previous quarter. The company’s Q3 closing inventory was $4.1 billion, which increased by 67% quarter-over-quarter from $2.5 billion in Q2 due to the “purchase of key components.” Our post-earnings analysis explained that the increase of inventory and key components was partly related to liquid cooling.
The CEO stated: “Two reasons we had to increase inventory: One is because Q4, I mean, June quarter, we will have a strong revenue growth; a second reason because we're preparing for high-volume liquid cooling. Again, we have more than 1,000 of 100k watt, I mean, liquid cooling rack we have to ship to customers in Q4. And liquid cooling as you know, is pretty new. So we had to prepare enough inventory so that we can deliver liquid cooling rack scale product to customer on time or with minimal lead time. So both factor, indeed, is a positive factor. And with our economic scale continuing to grow, indeed, our inventory average [ daily ], indeed, will slightly improve.”
Super Micro has further discussed its plans to fund its capacity expansion efforts through short-term debt, or perhaps by diluting shareholders. In the last earnings writeup, I called cash Super Micro’s “Achilles heel” as the seemingly invincible company has one drawback – in order to keep growing, they must build more facilities, which requires more cash. Liquid cooling also necessitates more components, which means inventory levels will rise. This combination is putting a wrench in SMCI’s cash flow.
Ruplu Bhattachary:
David, let's talk about working capital. So, to support growth, you need to support a lot of working capital. When do you make the determination, or how do you make the determination that you need to raise more capital? And how should investors think about your trade-off between using more debt or doing another equity raise?
David Weigand:
Yeah. We've had to do a couple of raises in the past six months, because we saw the permanent level of our business going up higher. So it wasn't temporary. Now, remember, as a manufacturer, if we sell a billion dollars, an additional billion dollars in a quarter, we have to. And remember, when I first started, we were doing about $3.5 billion a year, and now we're doing well, more than that per quarter.
So, when you're increasing by a billion dollars in a quarter, you've got to go out and you've got to, let's say even if the margin is 20%, you have to buy 80% of materials and you have to carry those through inventory. You have to carry them through accounts receivable until they convert to cash. And so it becomes an immediate problem. And we've had some very large customers come that I've sat across the table from, and they say, we have two questions. Do you have the capacity, do you have the capital to take this project on? And so we had to go out and get some more permanent capital so we could answer that question always, yes. So, we finished out with $2 billion at the end of last quarter.
We think that the things that we've done in terms of raising the visibility of the company, raising the profits, raising the sales, have been good for our shareholders, and we want to continue to balance that because we don't like dilution. We previously used to repurchase shares that's still in our tool bag. But right now, it's about being able to deliver against our backlog. And so therefore, we will get as much capital as we need to in order to do that. And so, it's really about whether you see, with short term debt, we can address temporary increases, but if we see sustained orders such as we have seen, then we're going to have to do some more permanent debt raises like we've done with the convertible bonds and also with the common stock equity raise.
–End Quote
The rise in inventory due to liquid cooling components plus Super Micro needing to increase capacity to further meet AI server demand may lead to a lower entry price, which we will gladly take.
Barron’s published just today that SMCI is the top performing stock in the S&P 500 for the first six months of the year. This is on the heels of being the second-best performing stock of 2023, ending the year a tad bit higher than Nvidia. We’ve participated since mid-2023 for a roughly 300% return in less than a year. We have plans to re-enter Super Micro which can be found here.
Dell
Dell has a long way to go to catch up with Super Micro as the company reported $2.6 billion in AI-optimized server revenue and AI server backlog of $3.8 billion. This represents 7.6% of Dell’s revenue. Compare this to Super Micro with over 50% of its revenue from AI and this number is surely higher today.
Due to Dell’s scale, it will take some time before Dell sees this level of AI concentration, as Client revenue is a large portion of Dell’s overall revenue. Therefore, for Dell to become a full-fledged AI stock, it will need AI PCs to participate. It’s only a matter of time before AI PCs provide the next leg up for AI investors, with our best guess being 2025 on the early side and late 2026 on the late side.
Dell may have a long way to go to see the levels of concentration that Super Micro has, but AI also has a long way to go. In our Dell write-up, the base case is for 15% of Dell’s revenue to be from AI, yet the more likely outcome is we will see something in the 30% range by 2027. This does not factor-in AI PCs which will rapidly accelerate this percentage once the trend is in play.
It's doesn’t require much speculation to think Dell will be the runner-up when SMCI reaches capacity. Jensen Huang of Nvidia recently stated: “Everybody who is building these chatbots and Generative AI, when you are ready to run it, you need an AI factory and nobody is better at building end-end systems of very large scale for the enterprise than Dell.” you need an AI factory and nobody is better at building end-end systems of very large scale for the enterprise than Dell.” Last week, we saw Elon Musk’s xAI announce the AI project is ordering servers from both Super Micro and Dell.
Dell’s Power Edge Servers with Liquid Cooling
Dell’s Power Edge servers are designed for AI and HPC (high-performance computing) workloads. In September, the servers were launched with support for four H100 Tensor Core GPUs with liquid cooled GPUs with higher efficiency due to liquid cooling and higher GPU capacity per rack.
In May, Dell announced a new Power Edge server “L” version with liquid cooling and eight Blackwell Tensor Core GPUs. The eight GPUs communicate seamlessly with NVLink across memory and cores, which helps to support the training of large language models. Independent industry analysts have described the new Power Edge Server XE9680L as “the densest rack scale architecture in the industry.” The ”L” version is expected in the second half of this year and offers “33% more GPU density per node.” The air-cooled version can support 64 GPUs whereas the liquid cooled rack scale design supports 72 GPUs.
Upcoming AI Releases for Dell
Dell has a few more important AI release coming out this year. AI factories integrate Nvidia’s AI Enterprise software to allow companies to go-to-market quickly on AI workloads. The goal is to reduce setup time for AI development by up to 86%. The fully integrated solution combines Dell’s Hardware with Nvidia’s infrastructure and software.
As of now, Nvidia has three software businesses: Nvidia AI Enterprise, Omniverse and newly-announced Nvidia NIM. Dell’s AI factories set up Nvidia’s road map for both AI Enterprise software and NIMs, which provides models as optimized containers for generative AI application development. You can think of NIMs as something similar to an app store, to where developers can develop and market AI apps.
We’ve stated numerous times that Nvidia’s AI software revenue will rival the company’s GPU revenue. This is one of many examples where the stage is being set. In this case, Dell will ship fully integrated systems to enterprises, startups and SMBs who want to skip critical steps to deploy quickly.
Dell NativeEdge is another recent announcement, and is a software platform that reduces the amount of resources required for deploying an AI application at the edge. The platform targets the immense amount of operations work that is needed for when AI applications are deployed across many endpoints and devices. The most obvious first customer will likely be the Federal Government or hospitals and other industries that manage very large data sets at the edge.
Dell is Reporting Higher Inventory, Too
There were comments on the call that inventory is higher-than-usual at Dell, as well. If the higher-than-usual inventory levels at both Dell and SMCI are due to building out liquid cooling systems, then we will likely see higher inventory again this quarter. Inventory should alleviate in Q4 to Q1 when Blackwell’s GB200s and B200s ship. There are some cases where higher inventory is a good thing, such as when companies prepare for a spike in demand. It’s likely these companies are preparing for a spike in demand on DLC systems, rather than the opposite, which is that inventory is building because demand is waning.
Here is what Dell’s CFO stated:
“Our cash conversion cycle was negative 47 days, flat sequentially, with higher inventory related to our AI business, offset by strong collections performance.”
Here was a discussion on the earnings call relating to the higher inventory, and why this may be a bullish indicator for determining demand over the next six months and beyond:
Amit Daryanani
[…] And then, Yvonne, could you also just clarify, the inventory was up dramatically in the quarter and it's somewhat unusual for it to be up in this quarter. So just talk about what's driving that and is it AI pre-builds or strategic inventory? Any help on that would be great as well. Thank you.
Yvonne McGill
Sure. So let me start with inventory, because I think that's pretty straightforward. So inventory was up and I would say slightly, for 25 days, really representing about a $1.2 billion increase quarter over quarter. We mentioned inventory was up slightly as we ramp our AI server business. So I think it's nothing substantial. I don't know, Jeff, if you have anything to add on inventory.
Jeff Clarke
No, but we didn't go out and make any strategic purchases. Some of the terms of the AI gear we need to deploy means we take ownership of it. We did and we have it in backlog. We'll ship it as those customer orders are fulfilled. That was the driver. We weren't out buying strategic or making strategic investments of inventory across the large component basins.
Vertiv
Super Micro, Dell and Vertiv are three stocks with fantastic returns this year. SMCI is up about 200% (down from a high of about 300%), Dell is up 83% (down from a high of 118%) and Vertiv is up 82% (down from a high of 117%).
Vertiv offers power management and thermal management to data centers and telecom companies, such as Alibaba, AT&T, China Mobile, Tencent and Verizon. The company was formed in 2016 after spinning off from Emerson, and reported $6.8 billion in revenue last year. The company is considered one of the larger players in data center technologies, in terms of power management and thermal management, with 24,000 employees and 30 manufacturing facilities. Vertiv’s thermal management technologies include liquid cooling for servers and racks.
The data center accounts for 75% of Vertiv’s business with communications networks and commercial/industrial facilities at 25% of revenue. Most recently, their management team stated that AI-related projects have doubled in the past two months.
“The ramp-up of production of liquid cooling globally continues as planned, and I'm happy to report we have production underway already at two of the three plants we shared with you we were planning to activate in 2024. We are on track with the capacity ramp-up as shared in February. We continue to see strong momentum with AI-related orders. While we are not disclosing specific detail on our liquid cooling orders, or more broadly AI-related orders, we did see the pipeline for AI projects more than double in the last two months.”
Vertiv offers many thermal management solutions. Among them is the Liebert XDU, which is a compact unit that sits in the row near the rack or on the perimeter. The liquid-to-liquid cooling distribution unit (CDU) functions as a heat exchanger between the data center and IT equipment, and is used in all forms of liquid cooling: direct-to-chip, rear door heat exchange and immersion. The Liebert XDU offers a secondary fluid cooling loop so that alternative cooling fluids can be used alongside water.
In 2023, Vertiv acquired a company called CoolTera after partnering with the company for three years to add advanced cooling technologies to its thermal management portfolio. One of the main areas of need for data centers and colocation sites is to convert air-cooled equipment to liquid cooled equipment. Retrofitting existing air-cooled infrastructure is an area where Vertiv specializes, as opposed to only providing thermal solutions for new servers and racks.
In May of 2023, Nvidia selected Vertiv to design a cooling system that secured a $5 million grant from the COOLERCHIPS program. In 2024, Vertiv joined the Nvidia Partner Network with a statement that Vertiv is “collaborating to build state-of-the-art liquid cooling solutions for next-gen NVIDIA accelerated data centers powered by GB200 NVL72 systems.”
In late 2023, Vertiv announced a partnership with Intel to supply air-cooled and liquid-cooled servers for the Gaudi3 AI accelerator.
This is a thematic analysis on liquid cooling, and thus, we have not done a deep dive into Vertiv’s financials. Briefly, the company reported revenue of $1.63 billion in Q3, up 7.76% YoY yet down sequentially from $1.86 billion. The operating margin of 12.6% expanded from 9.6% for operating profit of $206 million. The adjusted operating profit was $249 million. Net margin decelerated from 3.3% to (-0.36%). Cash flow was $101 million in the most recent quarter and the company repurchased $600 million for share repurchases in the quarter,
Hewlett-Packard Enterprise (HPE)
HPE is another commoditized hardware company that is seeing a revival due to its large portfolio of liquid cooling technologies and patents. The company has over 300 patents related to direct liquid cooling (DLC) with four of the world’s top 10 supercomputers featuring liquid cooled servers from HPE. According to HPE, their Apollo DLC System reduces fan power by 81%.
The HPE Cray EX Liquid-Cooled Cabinet offers liquid-cooled cabinetry that provides DLC to all the components in a compact design. This is for CPUs and GPUs in excess of 500W, and can help to reduce the interconnect cabling systems that are required, which further reduces operational expense. As a reminder, Cray is a supercomputer built by HPE that ranks as the #1 and #2 supercomputers in the world. Therefore, the liquid cooling for these systems is quite advanced as the #1 Cray supercomputer contains hundreds of thousands of AMD EPYC CPUs and 37,000 AMD Instinct GPUs. The cooling technology for Cray features a bladed cabinet that allows for the mixing and matching of various CPUs and GPUs, and allows for easy upgrading as new generations of CPUs and GPUs are released. At one point, a system the size of Cray was reserved for only supercomputers, but the AI market is driving forth 24,000-plus GPU clusters today and Broadcom believes we will see million-plus GPU clusters by 2027.24,000-plus GPU clusters today and Broadcom believes we will see million-plus GPU clusters by 2027. HPE’s experience on liquid cooling the Cray supercomputers will be helpful as GPU clusters continue to scale.
HPE held a recent conference with Nvidia’s Jensen Huang, who appeared at a recent HPE conference to showcase the strength of the partnership between the two companies. There was a string of announcements, the primary one being that HPE and Nvidia are partnering on a private cloud (presumably to compete with Broadcom’s VMWare integration). You can find more information here in the press release on Nvidia-HPE announcements.more information here in the press release on Nvidia-HPE announcements.
In the most recent earnings report, HPE provided the following color related to AI sales: “Our cumulative AI system product and service orders since Q1 2023, rose approximately $600 million sequentially to $4.6 billion. I am very pleased with our AI system product revenue more than doubled sequentially to over $900 million. This strong revenue growth allowed us to make progress against our backlog, which is now $3.1 billion.” The company also stated that enterprise is “north of 15%” of the AI orders, which is a key market for both HPE and Dell (as opposed to predominately hyperscalers like SMCI).
The stock has risen about 20% YTD, quite a bit less than SMCI’s outperformance, and is lagging Dell and Vertiv considerably, as well.
Conclusion:
As pointed out in our AI power consumption write-up, AI power demand is forecast to rise at a rapid rate. GPU demand is showing no signs of slowing as Big Tech continues to spend billions on AI infrastructure, with each GPU generation seeing higher peak power consumption. The industry is quickly taking steps to address this, and power consumption, or more specifically, power efficiency per chip, looks to be emerging as the third realm of competition.
The first two realms of competition are raw computing power and memory; both have been extensively covered for our premium members. Now, we turn toward keeping an eye on the AI power consumption space as new winners will emerge now that power consumption has become mission critical.
As of now, our plans are to jump aboard the AI bullet train again (i.e., Super Micro) at key levels and to also follow our trading plan on Dell. If we decide any others are a good fit, then you will surely get a deep dive into those stock names.
To view our recent Advanced Market Signals webinar with SMCI and DELL trading plans, click here.click here.
Damien Robbins, Equity Analyst at the I/O Fund, contributed to this article.