This AI Stock is Set to Surge from Inference Demand — Broadcom

This article is a continuation of our free newsletter from June 12, This AI Stock is Set to Surge from Inference Demand

For our Premium Members, we discuss the following:   

  • The one thing Broadcom CEO stated that all investors MUST hear to help position for 2025-2026.  
  • The clear catalyst within Broadcom’s product portfolio and timing for this product to help push forward the next leg up in AI revenue growth. 
  • The I/O Fund’s trade setup and buy zones we are eyeing for Broadcom given its immense demand yet stretched valuation.  

What Hock Tan Said that Every Investor Needs to Hear 

There was a subtle yet important change in commentary this past quarter around Broadcom’s hyperscale customer deployment expectations.  

  • In Q4 FY25, two quarters ago, Broadcom stated that they expected each of their three current hyperscale customers to deploy 1 million XPUs across a single fabric by 2027.  
  • However, in Q2, this commentary shifted – management now said they “eventually expect at least three customers to each deploy 1 million AI accelerator clusters in 2027.”  

This implies that one or more of their four prospective customers are also planning a significant accelerator deployment in short fashion, driving Broadcom’s total revenue opportunity higher. 

There were additional hints the current estimates are too low, such as when Hock Tan stated: “Turning to XPUs or custom accelerators. We continue to make excellent progress on the multiyear journey of enabling our 3 customers and 4 prospects to deploy custom AI accelerators. As we had articulated over 6 months ago, we eventually expect at least 3 customers to each deploy 1 million AI accelerated clusters in 2027, largely for training their frontier models. And we forecast and continue to do so a significant percentage of these deployments to be custom XPUs. These partners are still unwavering in their plan to invest despite the certain economic environment.  

In fact, what we've seen recently is that they are doubling down on inference in order to monetize their platforms. And reflecting this, we may actually see an acceleration of XPU demand into the back half of 2026 to meet urgent demand for inference on top of the demand we have indicated from training. And accordingly, we do anticipate now our fiscal 2025 growth rate of AI semiconductor revenue to sustain into fiscal 2026.” 

This circles back to Q4 2024’s serviceable addressable market (SAM) forecast, when management laid out a 60% CAGR through 2027 to a $60 billion to $90 billion SAM, which AI growth is now tracking. That SAM forecast was based on its view for three hyperscalers deploying 1 million accelerator clusters, or ~$20 to $30 billion per hyperscaler. Prospective customers were not included but it was noted they could “significantly” expand the SAM should they transition to revenue-generating customers. 

The subtle shift in deployment commentary hints that Broadcom’s SAM could expand to north of $100 billion on the high end should it be able to transition just one of its prospective customers to revenue-generating. With AI growth of 60% YoY this year and next tracking SAM growth, a possible SAM expansion and thus a higher SAM CAGR suggests AI revenue could remain stronger for longer, or expand above current forecasts as 2027 rolls around. Bank of America analysts seem to share this view, saying it is “only a matter of time” before the SAM forecast is raised, “especially as the FY27 sell-side AI revenue consensus estimate is still well below $45 billion.” 

Tomahawk 6 Enabling Path to 1 Million Accelerator Clusters  

Broadcom has been quite vocal about the industry’s path to 1-million-plus accelerator clusters, constantly reiterating how its three hyperscalers “each race towards 1 million XPU clusters by the end of 2027.” This would be multiples larger than current deployments, with xAI’s Colossus supercomputer recently expanding from 100K to 200K GPUs. Broadcom has continuously re-emphasized this forecast as it represents two major growth opportunities for the company: significant growth in accelerator deployments with inference tailwinds, and even more growth in networking deployments to support these clusters.  

The shift to Ethernet and away from Nvidia’s lock-in ecosystem of GPU + InfiniBand is benefiting Broadcom, with the industry pointing to rising Ethernet demand. Arista said that momentum for Ethernet “has really shifted in the last year” while Nvidia touted that its new Spectrum-X Ethernet is annualizing at $8 billion in revenue, or $2 billion quarterly. Broadcom noted that AI networking revenue rose 170% YoY in Q2 as demand remained above expectations.  

The company is committed to remaining on the leading edge of networking with its newest Tomahawk 6 switch, the industry’s first 102.4 Tbps Ethernet switch. The next-gen switch doubled the bandwidth of its predecessor, while offering flexible deployment ability with 1,024 100G or 512 200G SerDes options, reducing switch count.  

This raw performance upgrade paves the way for >100K to 1 million accelerator clusters by allowing larger leaf-spine fabrics to be constructed, while drawing less power and keeping latency low. Broadcom exec Ram Velaga said that demand for the new switch is “unprecedented” with multiple >100K accelerator deployments “using Tomahawk 6 for both the scale-out and scale-up interconnect.” 

When discussing Tomahawk 6, management points toward the flattening of the AI cluster as an important catalyst for this product, stating: “[…] Tomahawk 6 enables clusters of more than 100,000 AI accelerators to be deployed in just two tiers instead of three … this flattening of the AI cluster is huge because it enables much better performance in training next-generation frontier models through a lower latency, higher bandwidth and lower power.” 

Additional commentary the CEO shared in terms of the AI networking opportunity was that the opportunity for scale up is 5-10X more than scale out – setting up a nice trajectory as AI clusters grow: 

“In fact, the increased density in scale up is 5 to 10x more than in scale out. And that's the part that kind of pleasantly surprised us and which is why this past quarter, Q2, the AI networking portion continues at about 40% from what we reported a quarter ago for Q1. And at that time, I said I expect it to drop. It hasn't.” 

Quick Note on Margins 

The market loves this stock – and one of the primary reasons why is its earnings power. 

Broadcom reported adjusted operating income of $9.8 billion, up 37% YoY, outpacing revenue growth by a factor of 1.8x. Adjusted operating margin was 65.3%, expanding more than 8 points YoY. Adjusted EBITDA surpassed $10 billion for the first time, for a 67% margin.  

Margins are also rather strong in both of Broadcom’s segments: Semiconductor gross margin expanded 1.4 points YoY to 69%, while operating margin rose 2 points YoY to 57%. Infrastructure Software gross margin surged 5 points YoY to an astounding 93%, while excellent execution on integrating VMWare drove operating margin 16 points higher to 76%.  

However, VMWare’s expensive price tag means Broadcom’s debt is elevated, at $67.8 billion in gross principal debt versus $9.5 billion in cash. Given the structure of Broadcom’s debt with a majority at a fixed 3.8% rate, annual debt payments are currently close to $2.7 billion. 

Quick Note on VMWare Software: 

VMWare helped drive outperformance in Infrastructure Software, with revenue growing 25% YoY to $6.6 billion in Q2, ahead of management’s expectations for $6.5 billion on successful conversion of enterprise customers from perpetual vSphere to full VMWare Cloud Foundation (VCF) software stack subscriptions. Broadcom noted that strong VCF momentum has led to double-digit ARR growth in core Infrastructure Software. However, for Q3, Broadcom guided for a deceleration to 16% YoY growth to $6.7 billion. 

For a deeper dive on VMWare, read the analysis Broadcom: Networking/ASICs Giant and The Second Largest by AI Revenue.Broadcom: Networking/ASICs Giant and The Second Largest by AI Revenue

Broadcom Trade Setup: 

By Knox Ridley

Like many AI related tech stocks, Broadcom appears to be in a large-degree uptrend that is not finished. The pattern that this bull cycle is tacking is a diagonal pattern, which is a 5-wave pattern that is marked with strong swings in both directions.  

Based on the historic price action, there are two scenarios that we are tracking, both suggest higher levels from here, after we see an immanent period of volatility.  
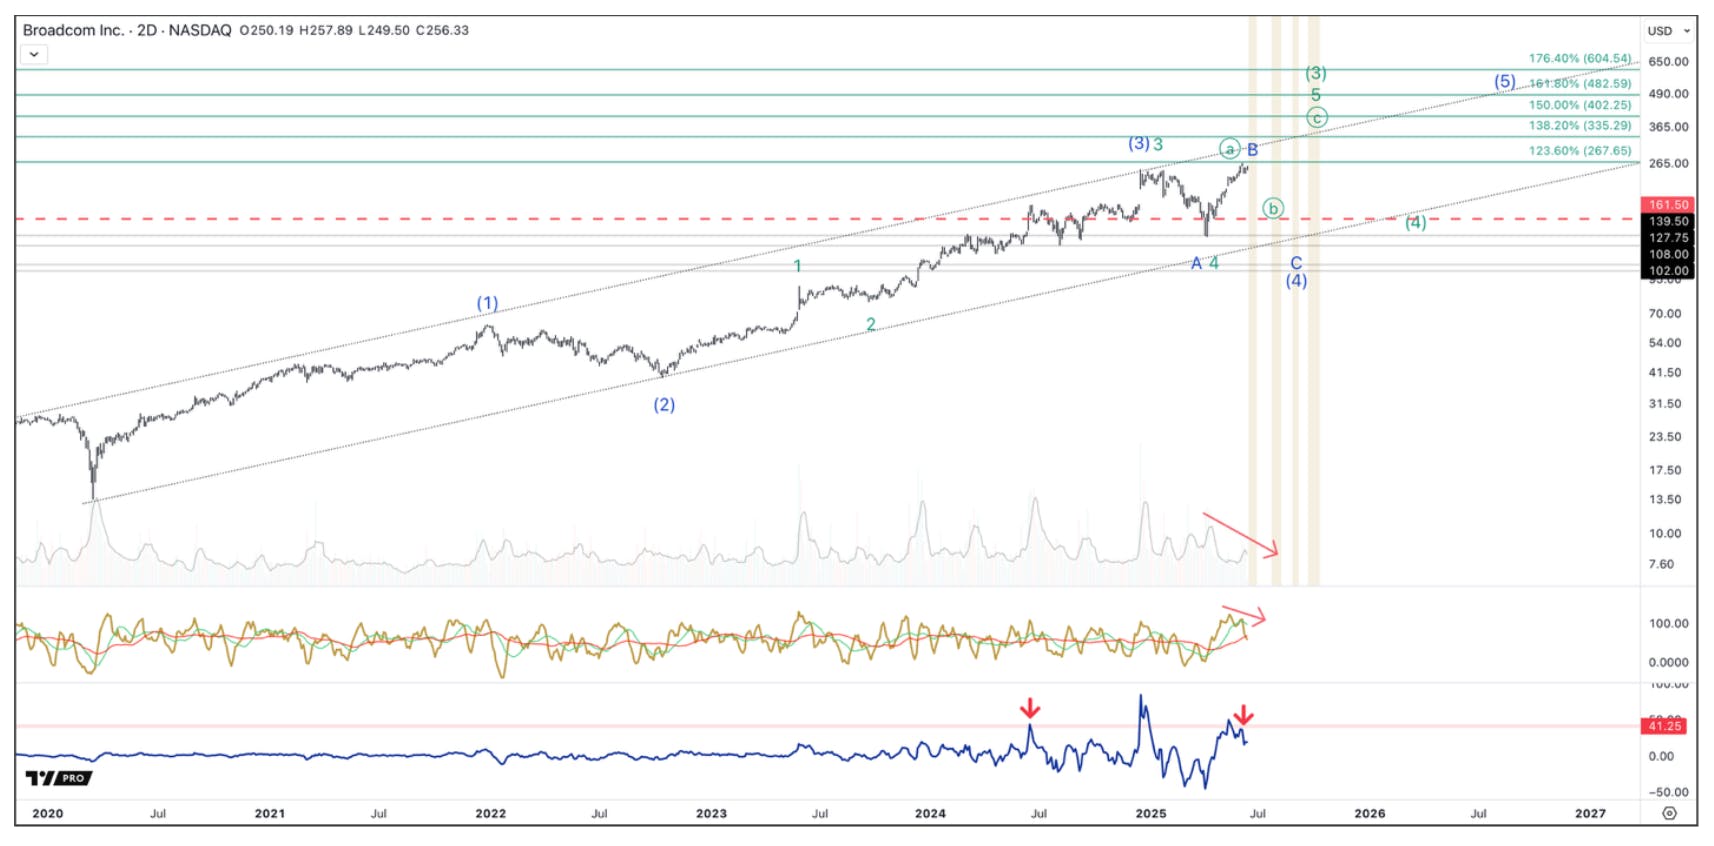
  • Blue – This scenario suggests that the 3rd wave within the larger diagonal pattern ended in December of 2024. This would mean that we are in the 4th wave correction, and that the bounce off the April lows is a bounce within this larger correction. If this is playing out, the next drop will take the shape of an aggressive, and direct 5-wave pattern that ultimately breaks through $161.50. The final targets for this drop will be $139.50 – $102. We would then turn higher for another bull cycle to new highs. 
  • Green – This scenario suggests that the larger 3rd wave is not complete. When AVGO tops, the retrace will take the shape of a messy and overlapping 3-wave pattern, which will hold over $161.50. We will then turn higher toward the $400s in the coming months. This swing higher will complete the larger 3rd wave, as we set up for the larger 4th wave correction into 2026. 

We do believe that the broad market signals are suggesting a correction is immanent. Several warning signals are also flashing in AVGO’s chart. One of which can be seen in how the last swing to new all-time highs, just before their earnings report, was accompanied with decelerating volume and momentum. In other words, though the sellers have not stepped up, the number of buyers is fading the higher we go. This is a common pattern that we see just before reversals. 

In conclusion, how AVGO corrects from here is key. If we see a 3-wave retrace that holds over $161.50, it is setting up a great buying opportunity for a move to new highs. On the other hand, if we see a 5-wave pattern develop that breaks through $161.50, we will patiently wait for lower prices, which most investors believe is impossible based on how relentless this stock continues to advance.  

Conclusion 

The shift from AI training to AI inference is becoming increasingly visible as Big Tech and model providers highlight strong growth in tokens and revenue. Broadcom has already benefited from both increasing compute and networking needs – but we think the surge in inference demand will disproportionately (and positively) flow to Broadcom’s top line and bottom line. 

This is because custom silicon’s cost advantages and ability to drive lower inference serving costs at scale creates a strong value proposition for Big Tech. As more and larger clusters are deployed to serve exploding inference demand, there will be additional long-term tailwinds for networking for the Ethernet networking giant.  

Broadcom’s FY26 visibility is improving with management expecting near 60% YoY AI revenue growth to continue, while SAM could potentially expand past $100 billion as customer engagements remain strong.  

We have plans to add Broadcom to our portfolio – keep an eye on your trade alerts and join Knox in his weekly Thursday webinar at 4:30 p.m. EST for more information on buy levels.

Upgrade to the Advanced Annual Plan – Just $599Upgrade to the Advanced Annual Plan – Just $599

Email us to upgrade now or to claim this limited-time offer.

Please note: The I/O Fund conducts research and draws conclusions for the Fund’s positions. We then share that information with our readers. This is not a guarantee of a stock’s performance. Please consult your personal financial advisor before buying any stock in the companies mentioned in this analysis.

Recommended Reading:

This AI Stock is Set to Surge from Inference Demand

Broadcom stock joined Nvidia, Alphabet and Microsoft in calling out surging AI inference demand, noting that this rapid growth could drive increased demand for custom silicon in the second half of 2026, and with it, higher AI revenue. 

Despite an in-line print and guide, Broadcom’s AI revenue is tracking above Street estimates for next year towards the $30 billion mark, up nearly 150% in two years, with growing tailwinds from inference and networking as clusters increase in size. AI revenue growth is also tracking Broadcom’s addressable market forecast of a 60% CAGR.  

Broadcom is cementing itself as the clear second in AI with key ingredients for success as inference demand rises. However, its premium valuation to Nvidia looks to be pricing in above-expected AI revenue growth into 2027, likely closer to a 70%+ CAGR, as there exists a $160 billion gap in AI-driven revenue between the two. 

Inference Driving Possible Acceleration into 2H 26 

The AI ecosystem’s pivot from training to inference, now emerging as a strong revenue engine for hyperscalers, is a structural tailwind for Broadcom's custom silicon and networking products.  

We’ve seen quite a handful of signs over the last couple of months that inference demand (and revenues) are beginning to explode: 

  1. Microsoft reported 5x YoY growth in tokens processed to 100T in Q1, with AI contributing 16 points or nearly half of Azure’s 33% growth last quarter. Microsoft’s AI run rate at the end of January was $13 billion, up more than 175% YoY. 
  2. Alphabet reported 9x YoY growth to 480T tokens processed in April. 
  3. OpenAI this week announced that it had crossed $10 billion in ARR, nearly doubling from $5.5 billion at the end of 2024. 
  4. Anthropic’s ARR rose 200% in five months and 50% in 2 months to $3 billion. 

With hundreds of millions of users interacting frequently with AI assistants, inference becomes the focal point for providers such as OpenAI and Google. Meeting these levels of growing demand, without significant response delays or downtime, requires more and more accelerators, networking and interconnect products.  

Broadcom’s edge goes beyond the fact that custom accelerators are often multiples cheaper than Nvidia’s GPUs for inference tasks – it's that custom silicon is increasingly performant with each generation. By optimizing algorithms (software), Big Tech can drive higher performance from large language models (LLMs) — which helps to drive down costs while also increasing output for specific workloads. For example, a rough idea as to how much it costs Nvidia to make merchant GPUs is estimated around $3,000 to $5,000 whereas the company charges $25,000 to $30,000 – hence the AI leader’s excellent margins. Reducing Nvidia’s high pricing power is what Big Tech is after and this can be accomplished both in the hardware costs but also through optimizing the workloads for specific use cases. 

Big Tech is prominent in Broadcom’s custom silicon customer list, which includes Google and Meta. ByteDance reportedly emerged as the third customer last summer, though some reports surfaced earlier this year that this project could be cancelled. OpenAI and Apple are also heavily rumored to be prospective customers. 

Why Big Tech Is Chasing Cheaper Inference 

For the providers in the AI ecosystem, monetizing GPUs depends on inference, and thus revenue becomes a function of GPUs and tokens and profits become a function of cost. Nvidia’s Blackwell offers a massive leap in performance and can train models such as Meta’s Llama 3.1 405B in as little as 27 minutes, yet the cost advantages offered by custom silicon can translate into higher margins in the long run from lower inference serving costs.  

For example, Google recently announced that its upcoming seventh-gen TPU Ironwood is its “most performant and scalable custom AI accelerator to date, and the first designed specifically for inference.” Ironwood comes in two sizes, a 256 and a 9,216 chip configuration, with the larger size offering up to 42.5 exaflops of performance.  

Google adds that Ironwood offers 2x the performance per watt as last-year’s generation Trillium, with 6x more HBM and 4.5x the HBM bandwidth. This allows it to deliver more capacity per watt at a time when power is a primary constraint, and provide customers with more cost-effective AI workloads. 

This is exactly what Broadcom sees arising from this inference growth curve, as CEO Hock Tan asserted that the company has quite a bit of visibility into “increased deployment of XPUs next year, much more than we originally thought and hand-in-hand with it, of course, more and more networking.” The necessity of networking in larger clusters means demand is likely to remain robust even given custom silicon will not keep pace with Nvidia’s merchant sales into the hundreds of billions. 

Higher-than-expected deployments of custom silicon combined with strong demand for networking should provide robust tailwinds for AI revenue growth beyond 2026. Broadcom currently has enough visibility to place possible demand acceleration for 2H 2026 on the table, and this could easily persist through 2027 and beyond should inference demand flourish and as the path to 1 million accelerator clusters materializes.  

Assuming Broadcom can maintain another 60% YoY growth in FY27 on stronger demand and potential conversion of its 4 current prospects, AI revenue would close in on $50 billion, or up to 60% share of revenue. Even if growth then slows to 30% YoY in FY28, Broadcom would still be more than doubling its AI revenue to $65 billion in just three years. 

Broadcom Reports 170% YoY Growth in AI Networking 

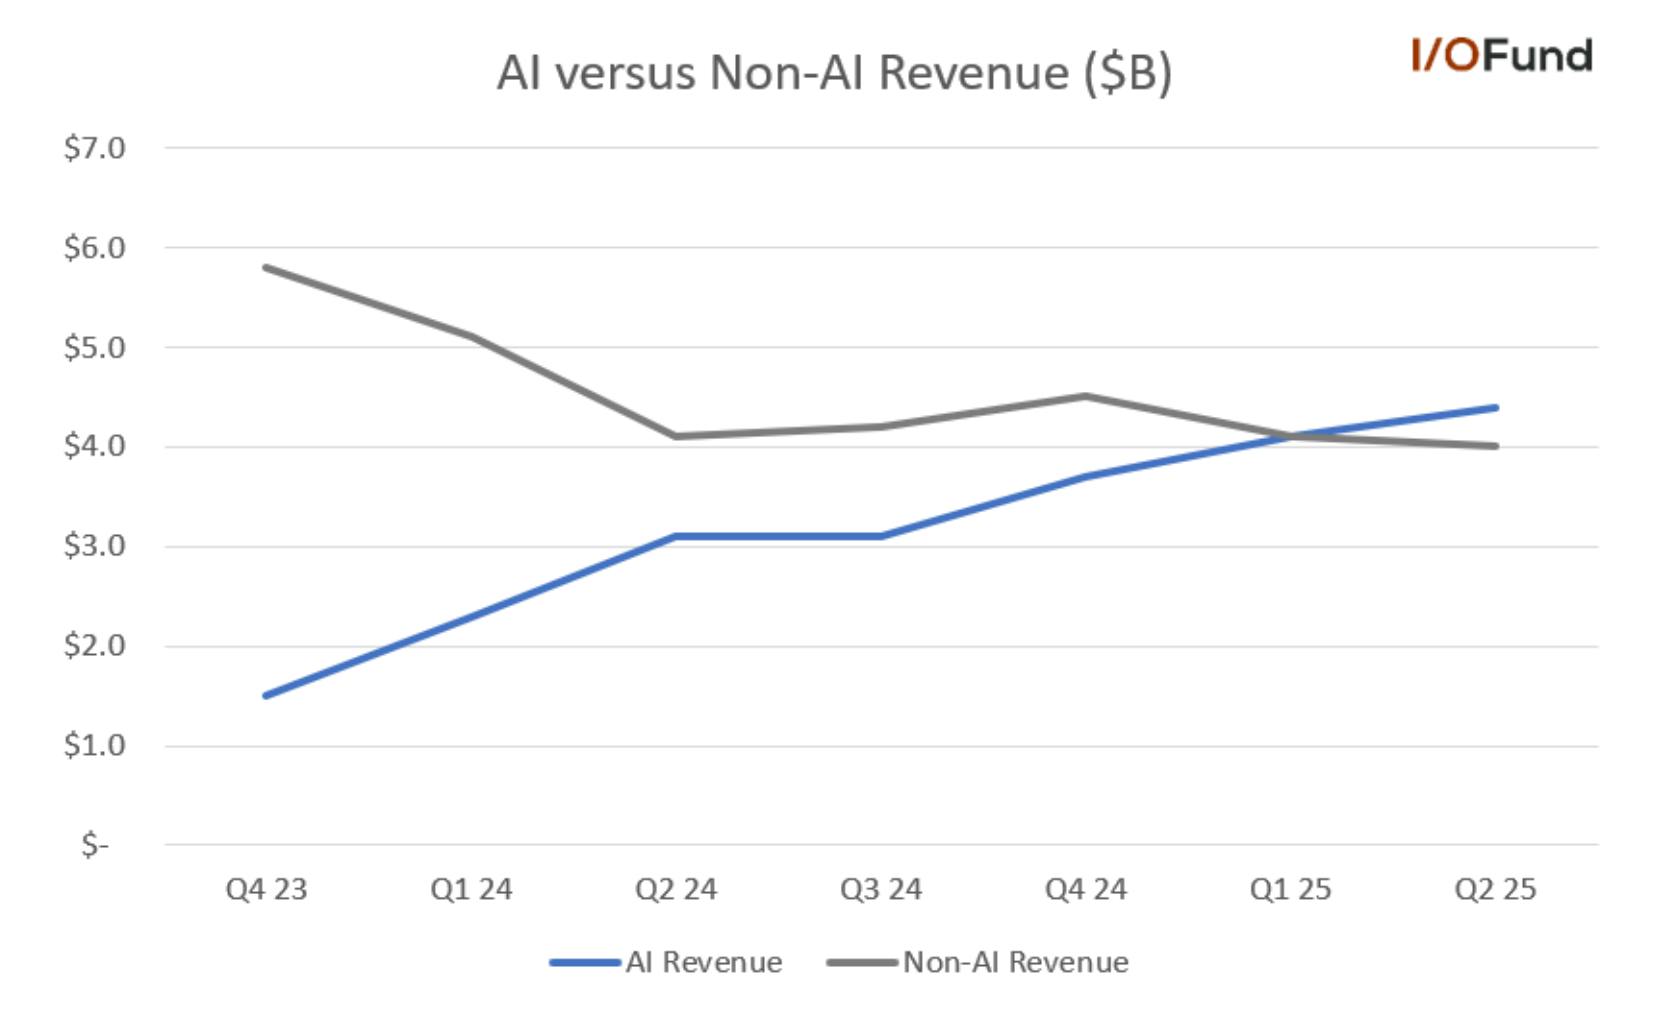
Broadcom has cemented itself in second place in AI revenue as it closes in on $20 billion this fiscal year in AI revenue — with a line of sight toward $30 billion by the end of fiscal 2026. AI revenue accounted for more than 50% of Semiconductor revenue for two quarters in a row and nearly 32% of total revenue in Q2. 

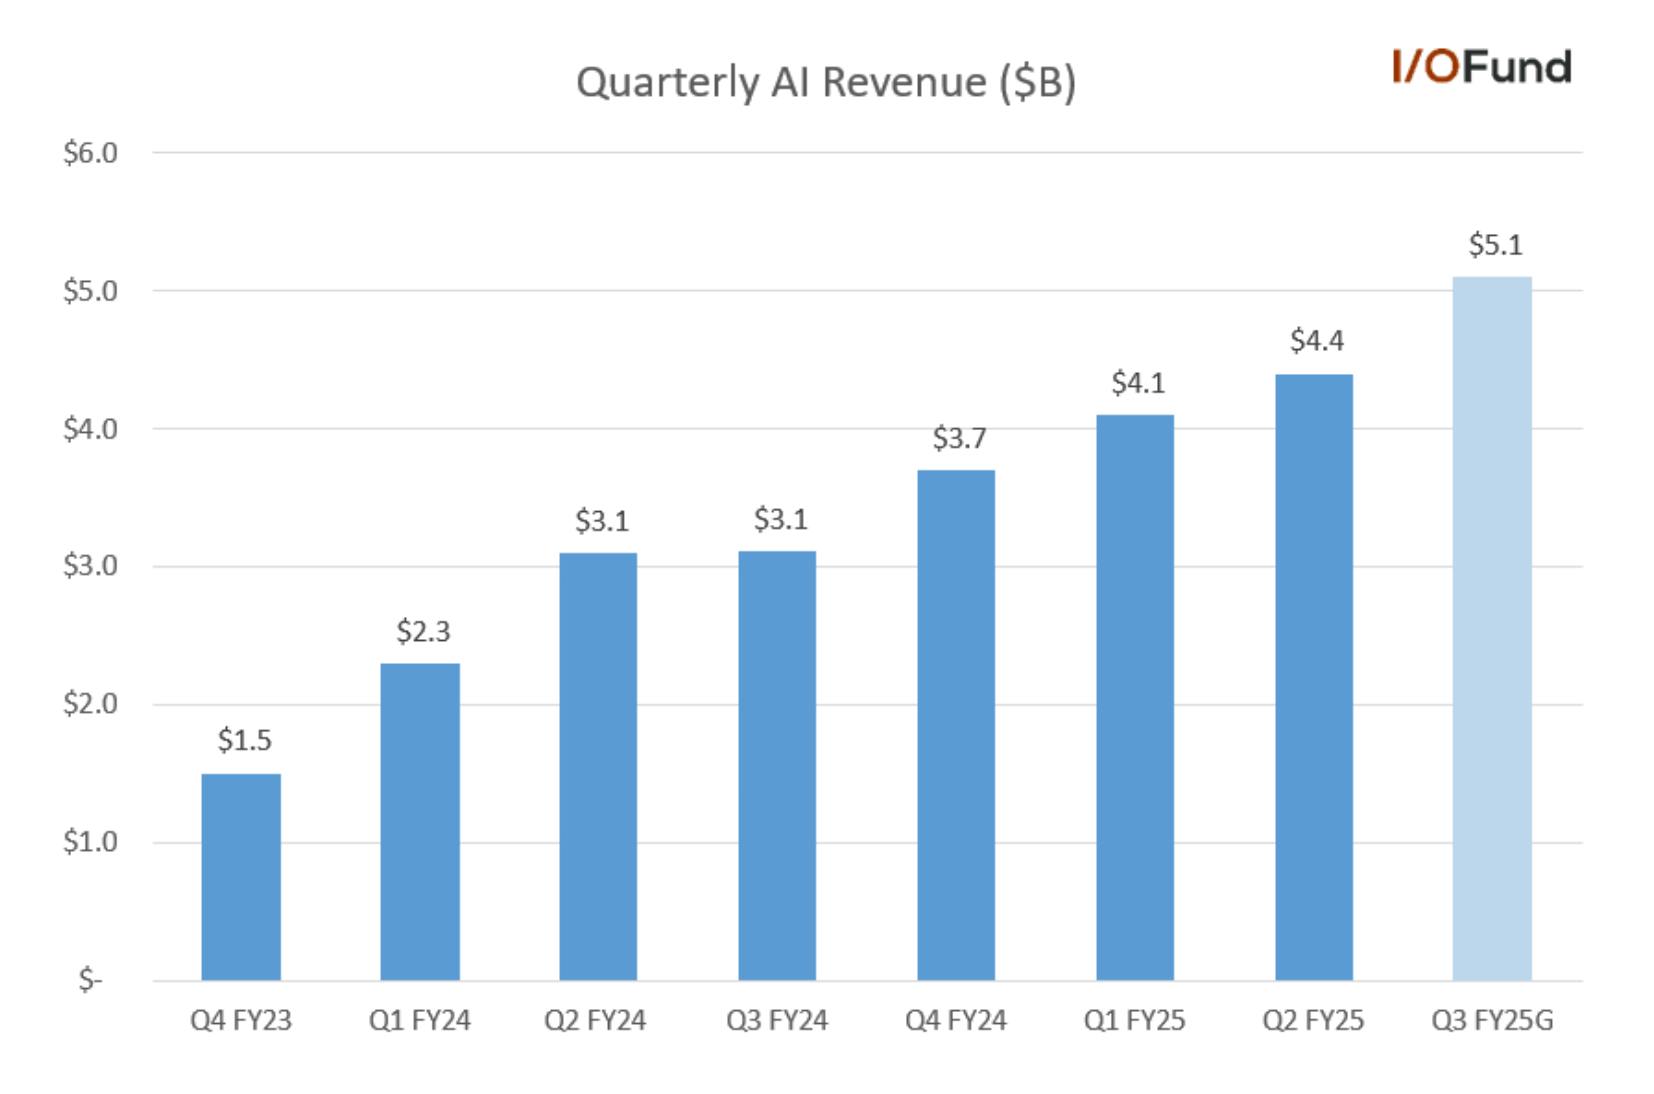
AI semiconductor revenue rose 46% YoY to $4.4 billion, in line with management’s guidance. Although this was a deceleration from 77% YoY growth in Q1, Broadcom forecast $5.1 billion in AI revenue in Q3, pointing to a rebound to 60% YoY growth – marking ten consecutive quarters of growth.  

In the current quarter, the 46% AI semiconductor growth was driven by networking, which was up 170% YoY and represented 40% of AI revenue. In the opening remarks, the CEO stated the following regarding this outsized growth: “As a standard-based open protocol, Ethernet enables one single fabric for both scale out and scale up and remains the preferred choice by our hyperscale customers. Our networking portfolio of Tomahawk switches, Jericho routers and NICs is what's driving our success within AI clusters in hyperscalers.” 

Graph of Broadcom stock's quarterly AI revenue accelerating from $4.4 billion to $5.1 billion in Q3.

Broadcom’s AI revenue was forecast to reaccelerate in Q3 to 60% YoY to $5.1 billion. Source: I/O Fund 

Q3’s guidance was ahead of some analyst expectations for $4.9 billion in AI revenue in the quarter, ticking higher as Google’s TPU v7p (Ironwood) begins to ramp. Q3 would also mark the largest sequential growth in over a year on a dollar basis, at ~$700 million.  

Additionally, analysts look to already be penciling in further strength in Q4, with Bernstein’s Stacy Rasgon suggesting that Broadcom could be eyeing $5.8 billion in AI revenue in Q4 assuming it sustains 60% YoY growth. Given that Broadcom’s 1H revenue was up more than 57% YoY, this seems a reasonable assumption, especially considering management is eyeing near 60% growth in FY26. 

More importantly, AI’s strength is masking persisting softness in non-AI revenue, which could continue to be pressured due to Broadcom’s high consumer exposure. Broadcom noted that non-AI revenue “is close to the bottom” but it “has been relatively slow to recover” with revenue down (5%) YoY to $4 billion in Q2.  

A graph of Broadcom's AI versus non-AI revenue showing AI revenue share now exceeding 50% on strong growth.

Broadcom’s AI revenue accounts for more than 50% of Semiconductor revenue, masking persisting softness in non-AI revenue. Source: I/O Fund 

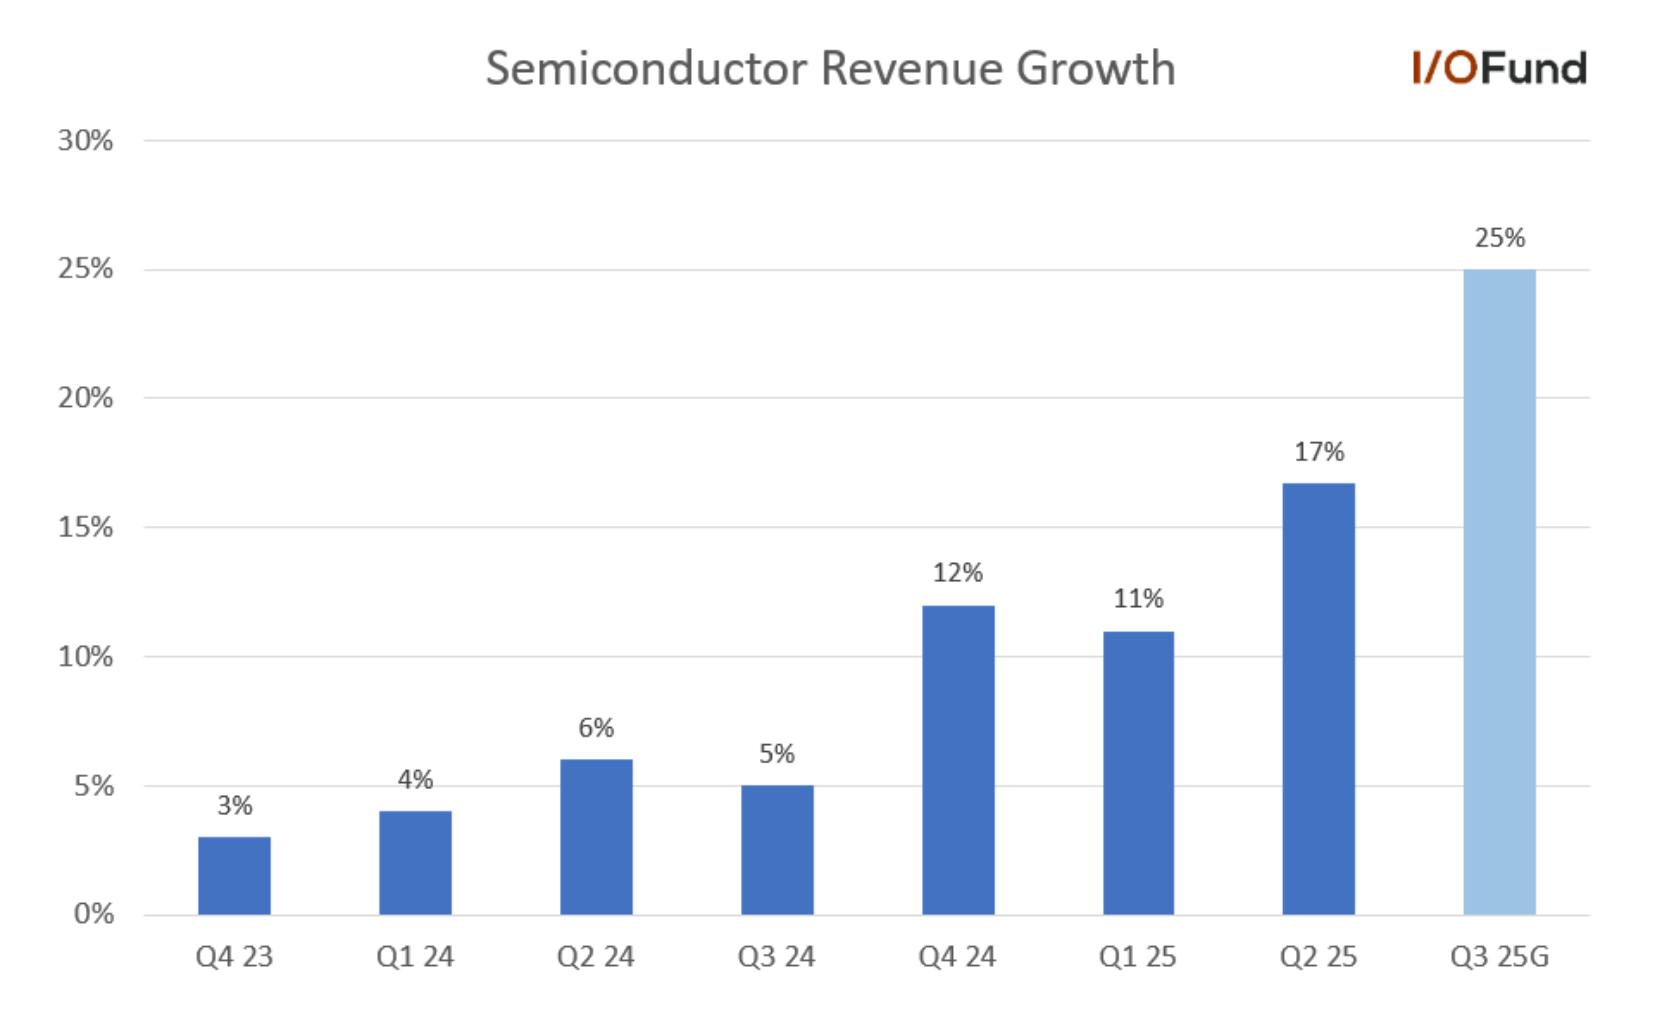
Despite this weakness extending into Q3 with revenue expected to be flat QoQ at $4 billion, semiconductor revenue is accelerating – growth accelerated from 11% to nearly 17% in Q2, with the $9.1 billion semiconductor revenue guide pointing to an acceleration to nearly 25% growth in Q3.  

Should non-AI revenue soon find the bottom and begin to recover, this will provide support for continued Semiconductor growth. However, any persisting weakness in non-AI stemming from this elevated consumer and Apple exposure that AI revenue must absorb presents a real risk that investors should keep in mind through the rest of the year. Broadcom is also one of the more exposed semiconductor companies to China with tariffs, with more than $10 billion in revenue from the nation in fiscal 2024.  

A graph of Broadcom stock's quarterly Semiconductor revenue growth showing acceleration from 11% in Q1 to 25% guided in Q3.

Broadcom’s AI revenue strength is evident as Semiconductor revenue was guided to accelerate 8 points to 25% YoY despite flat non-AI revenue. Source: I/O Fund 

Broadcom Stock to See Lift from AI Inference 

Broadcom is aiming to capture growing inference tailwinds, with management explaining that the recent surge in inference demand is driving increased confidence in their FY26 AI revenue growth rate.  

CEO Hock Tan said that Broadcom’s hyperscale clients are “doubling down on inference in order to monetize their platforms,” and as a result, he expects Broadcom could “actually see an acceleration of XPU demand into the back half of 2026 to meet urgent demand for inference on top of the demand we have indicated from training.” This new dynamic is what is driving Tan’s confidence in stronger growth in FY26, saying that he now anticipates the “fiscal 2025 growth rate of AI semiconductor revenue to sustain into fiscal 2026.” 

This commentary plus potential demand acceleration in 2H 26 suggests that Broadcom has visibility into $30 billion AI revenue potential next year. Broadcom has not provided a full FY25 AI revenue guide yet, but it is on track to deliver approximately $19 to $20 billion in AI revenue in FY25, up ~60% YoY assuming 60% growth to $5.9 billion in Q4.  

Graph of Broadcom stock's AI revenue projections showing 60% YoY growth in FY25 and FY26 to $19.5 billion and $30 billion.

Broadcom’s AI revenue is projected to grow approximately 60% YoY in FY25 and maintain that growth in FY26. Source: I/O Fund 

Maintaining 60% growth through FY26 would project AI revenue to $30 to $32 billion. This trajectory indicates Broadcom is likely driving AI revenue ahead of expectations over the next four to six quarters, with Morgan Stanley saying that $26 to $30 billion in AI revenue is “higher than what is in Street models.” Evercore is modeling 58% AI revenue growth in FY25 and 50% in FY26, implying $28.9 billion.  

Broadcom Passes Nvidia Stock's Valuation – First Time in 9 Years

There’s no denying that Nvidia is the outright leader in the AI accelerator market with an estimated $200 billion in revenue this year with roughly $180 billion of that from AI data center whereas Broadcom will report $20 billion this year.  

Who is in second place is no contest yet what is second place worth when there is nearly a $160 billion gap? Broadcom clearly has key ingredients to have earned this second-place position yet there is also exposure to China and exports via Apple and ByteDance, one of its rumored customers. 

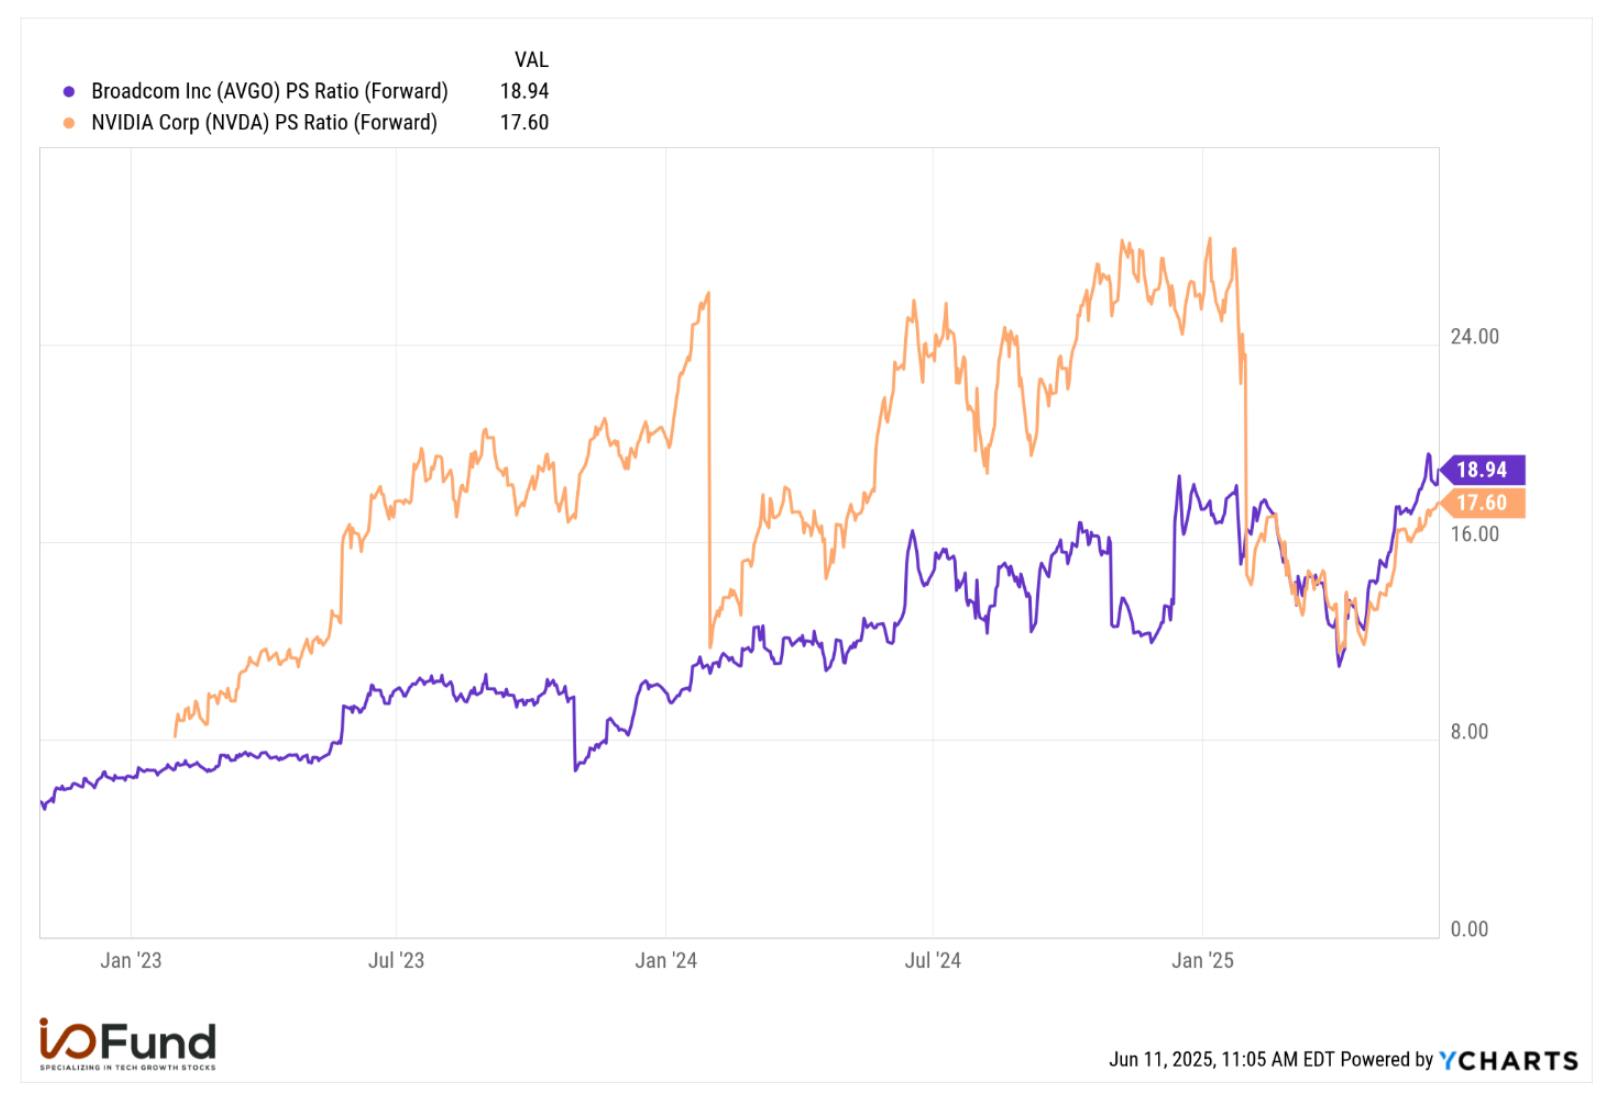
Meanwhile, for the first time in nine years, Broadcom has a higher valuation than Nvidia. 

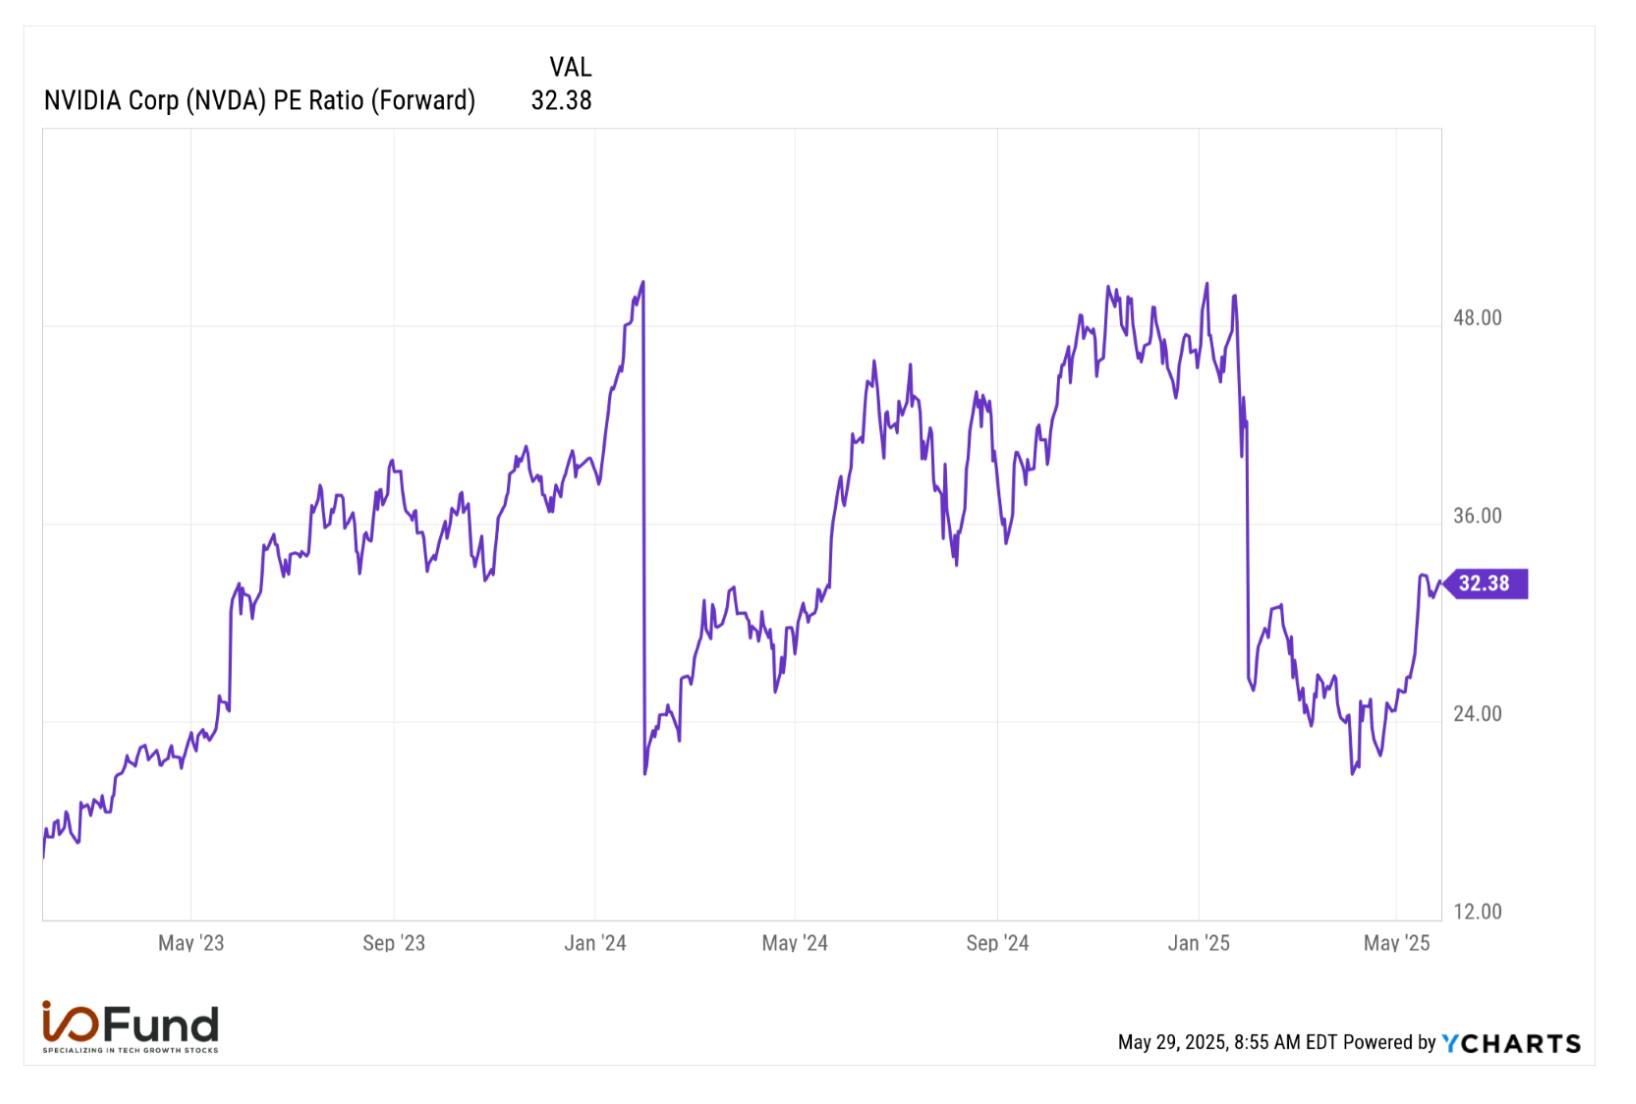
On the top-line, Broadcom trades at nearly 19x forward revenue, an almost 8% premium to Nvidia’s 17.6x multiple. AVGO stock was at a 14% premium heading into Q2’s earnings. This is also 65% higher than Broadcom’s 5-year average 11.4x forward revenue multiple.  

Graph of Broadcom stock versus Nvidia stock valuation on a forward price-to-sales basis, with Broadcom now trading at a premium valuation.

Broadcom is currently valued at an 8% premium to Nvidia on a forward price-to-sales basis. Source: YChartsYCharts 

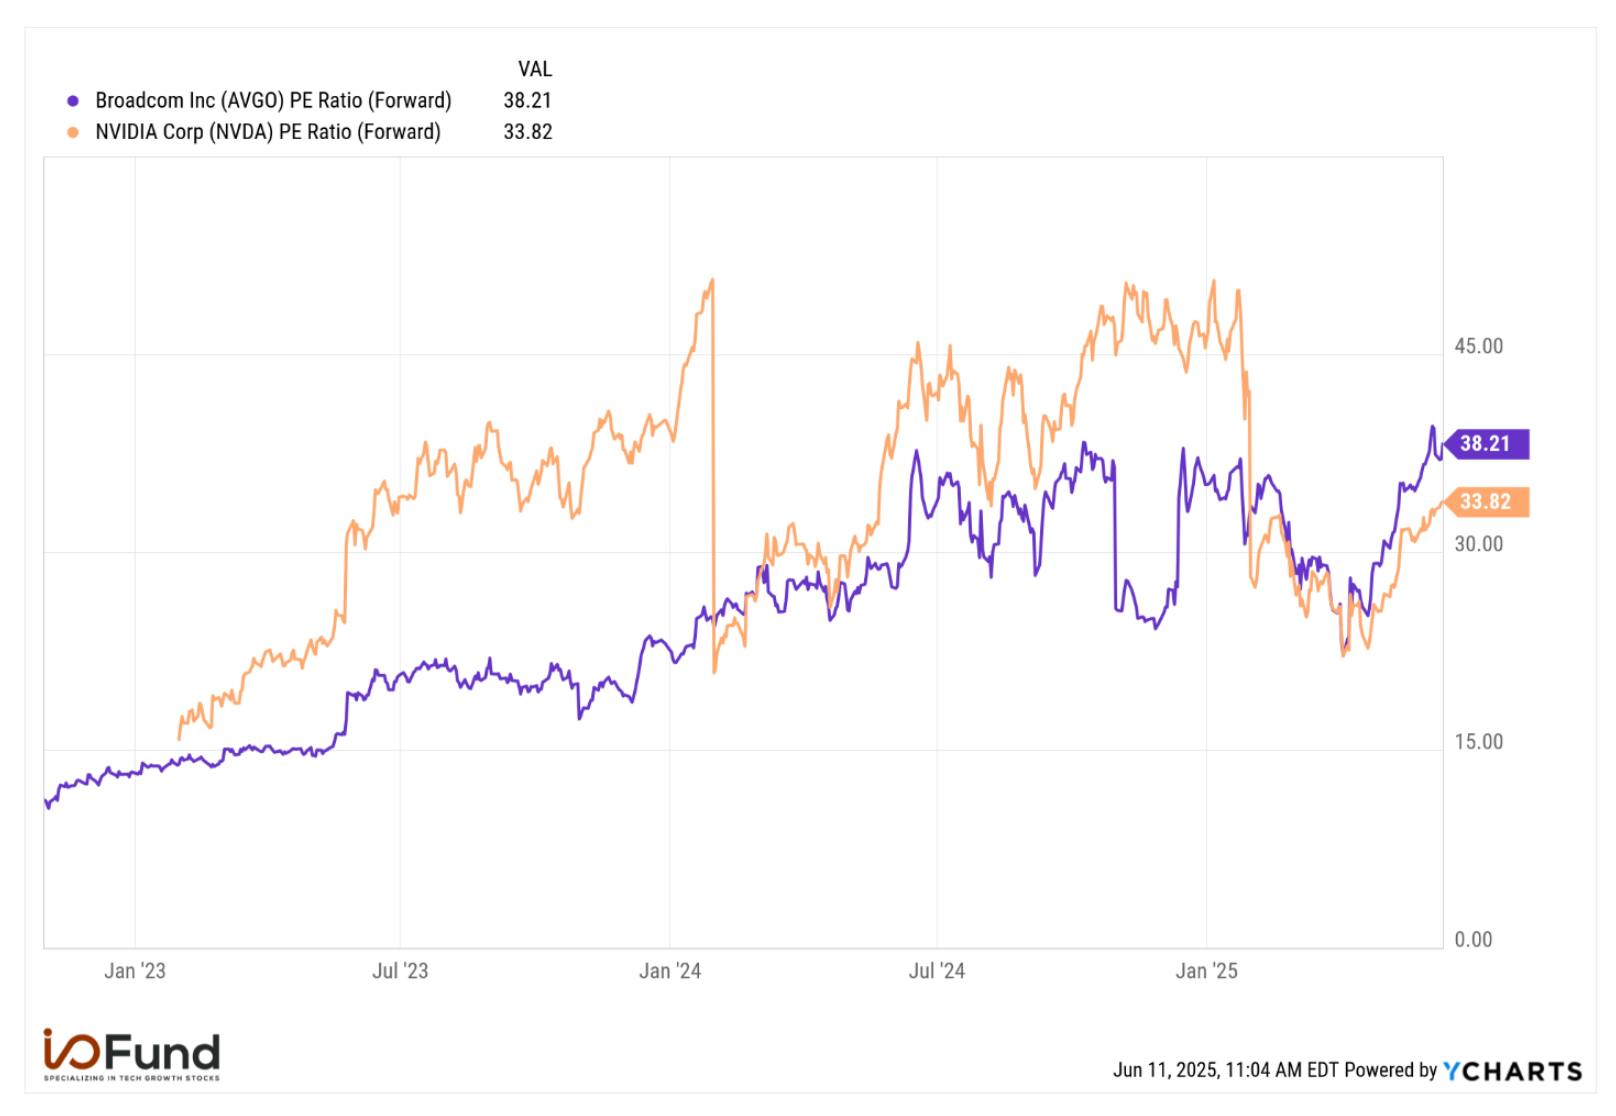
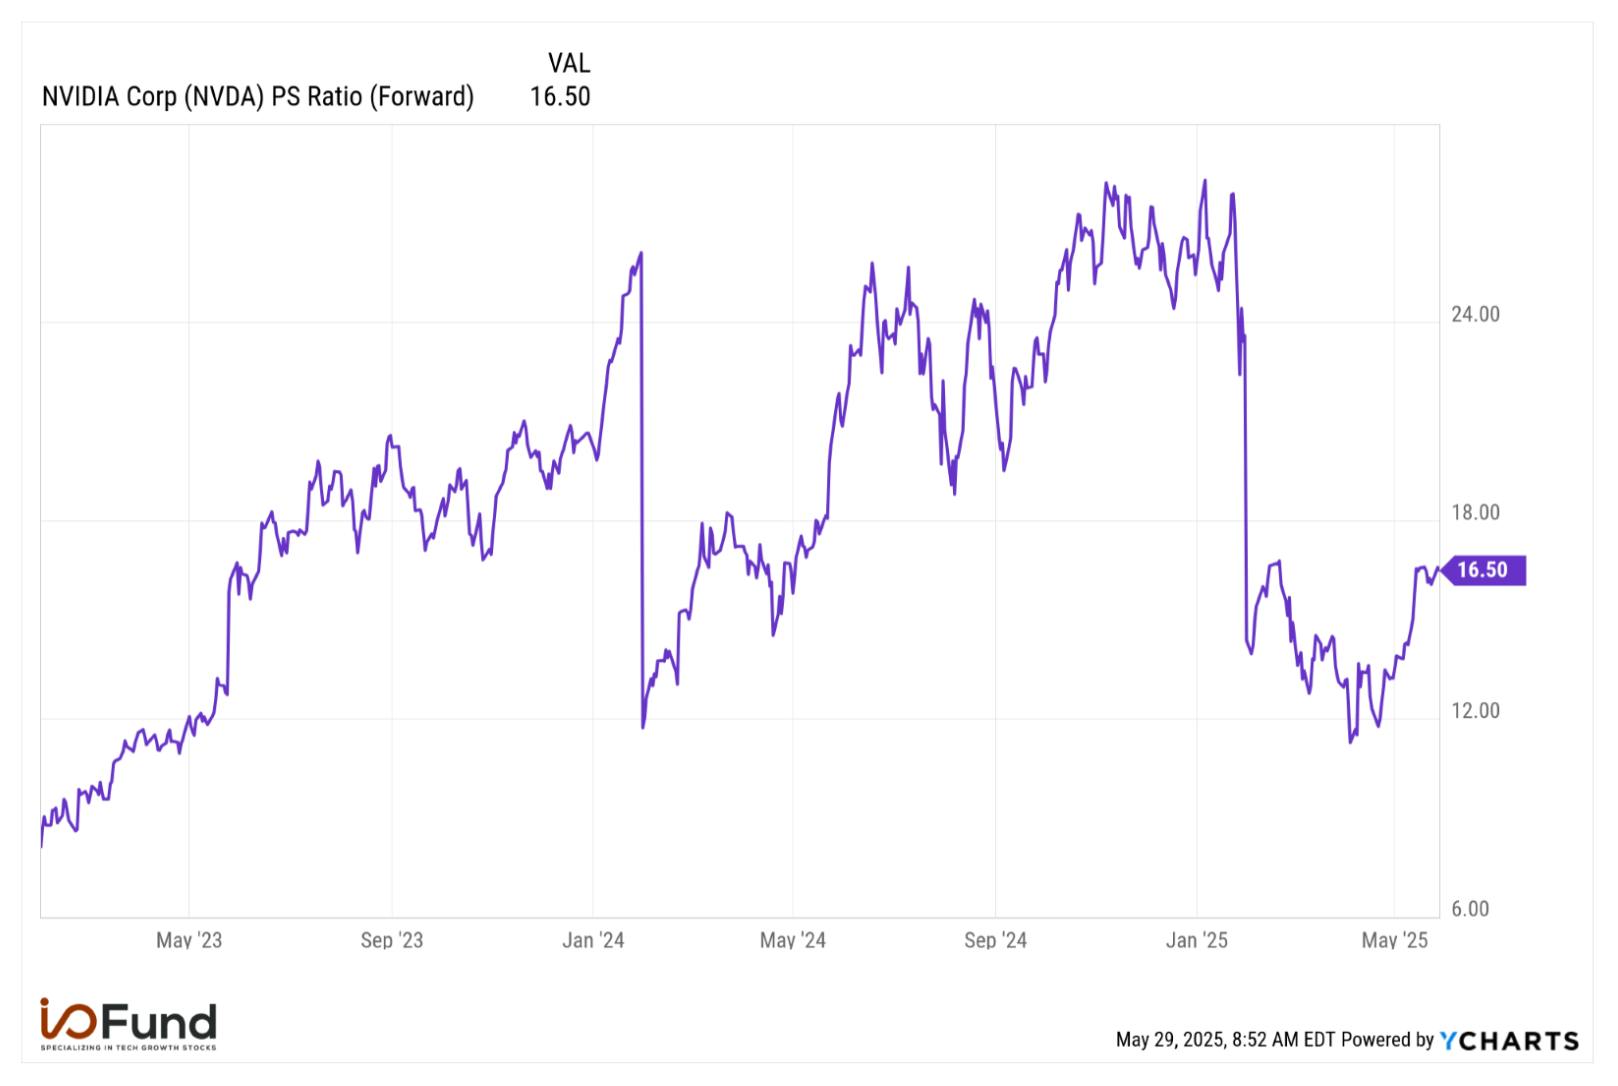
On the bottom line, Broadcom trades at 38.2x forward earnings, a 13% premium to Nvidia and a more than 18% premium to the semiconductor industry at 32.3x. Broadcom has strong margins – 65% adjusted operating margin and 52% adjusted net margin – driving strong EPS growth, at a 25% expected CAGR through FY27; however, the custom silicon ramp presents some headwinds to gross margin as it grows its mix share.  

Graph of Broadcom stock versus Nvidia stock valuation on a forward price-to-sales basis, with Broadcom now trading at a premium valuation.

Broadcom trades at 38.2x forward earnings, a 13% premium to Nvidia and a more than 18% premium to the broader semiconductor index on a forward PE basis. Source: YChartsYCharts 

Broadcom’s competitiveness with Nvidia on margins and its ability to drive strong EPS growth via operating leverage, while capitalizing on growing accelerator and networking demand lend to its valuation, as it is a clear second to Nvidia and far ahead of smaller peers Marvell and AMD in AI revenue. However, this premium valuation looks to price in above-expected AI revenue growth through 2026, likely closer to a 70% or even 75% CAGR through 2026 as Broadcom is currently tracking its SAM CAGR at 60% through FY26. 

Is Broadcom Stock a Buy? 

Subscribe for Full Access to the Article  

Behind the Paywall is the Following information: 

  • It’s often subtle commentary – and not the headlines – that reveals the biggest opportunities. Find out the one thing Broadcom CEO stated that all investors MUST hear to help position for 2025-2026.  
  • The clear catalyst within Broadcom’s product portfolio and timing for this product to help push forward the next leg up in AI revenue growth. 
  • The I/O Fund’s trade setup – exclusive only to subscribers. We detail buy zones we are eyeing for the #2 stock in AI given its immense demand yet stretched valuation.
    Sign Up to Continue ReadingSign Up to Continue Reading

Paid subscribers, click here to view the full articleclick here to view the full article

Not ready to subscribe but want more thoughtful analysis from a top-performing team in tech? Every week, we publish free research. 👉 Sign up here.ere.

Please note: The I/O Fund conducts research and draws conclusions for the company’s portfolio. We then share that information with our readers and offer real-time trade notifications. This is not a guarantee of a stock’s performance and it is not financial advice. Please consult your personal financial advisor before buying any stock in the companies mentioned in this analysis. Beth Kindig and the I/O Fund do not own shares in AVGO at the time of writing and may own stocks pictured in the charts.

Recommended Reading:

Palantir Stock: Strong Sequential Growth and Strong Underlying Key Metrics 

When thinking of strong earnings reports this past quarter, Astera Labs and AppLovin come to mind in terms of ticking critical boxes on fundamentals. However, one could argue that Palantir is tied for the top position on this list, although with Palantir, you pay for what you get with a valuation that is as outrageous as its CEO. 

The company continues to report accelerating growth on a QoQ and YoY basis. The cherry on top is that fiscal year guidance was raised, and key metrics support continued growth down the line.  

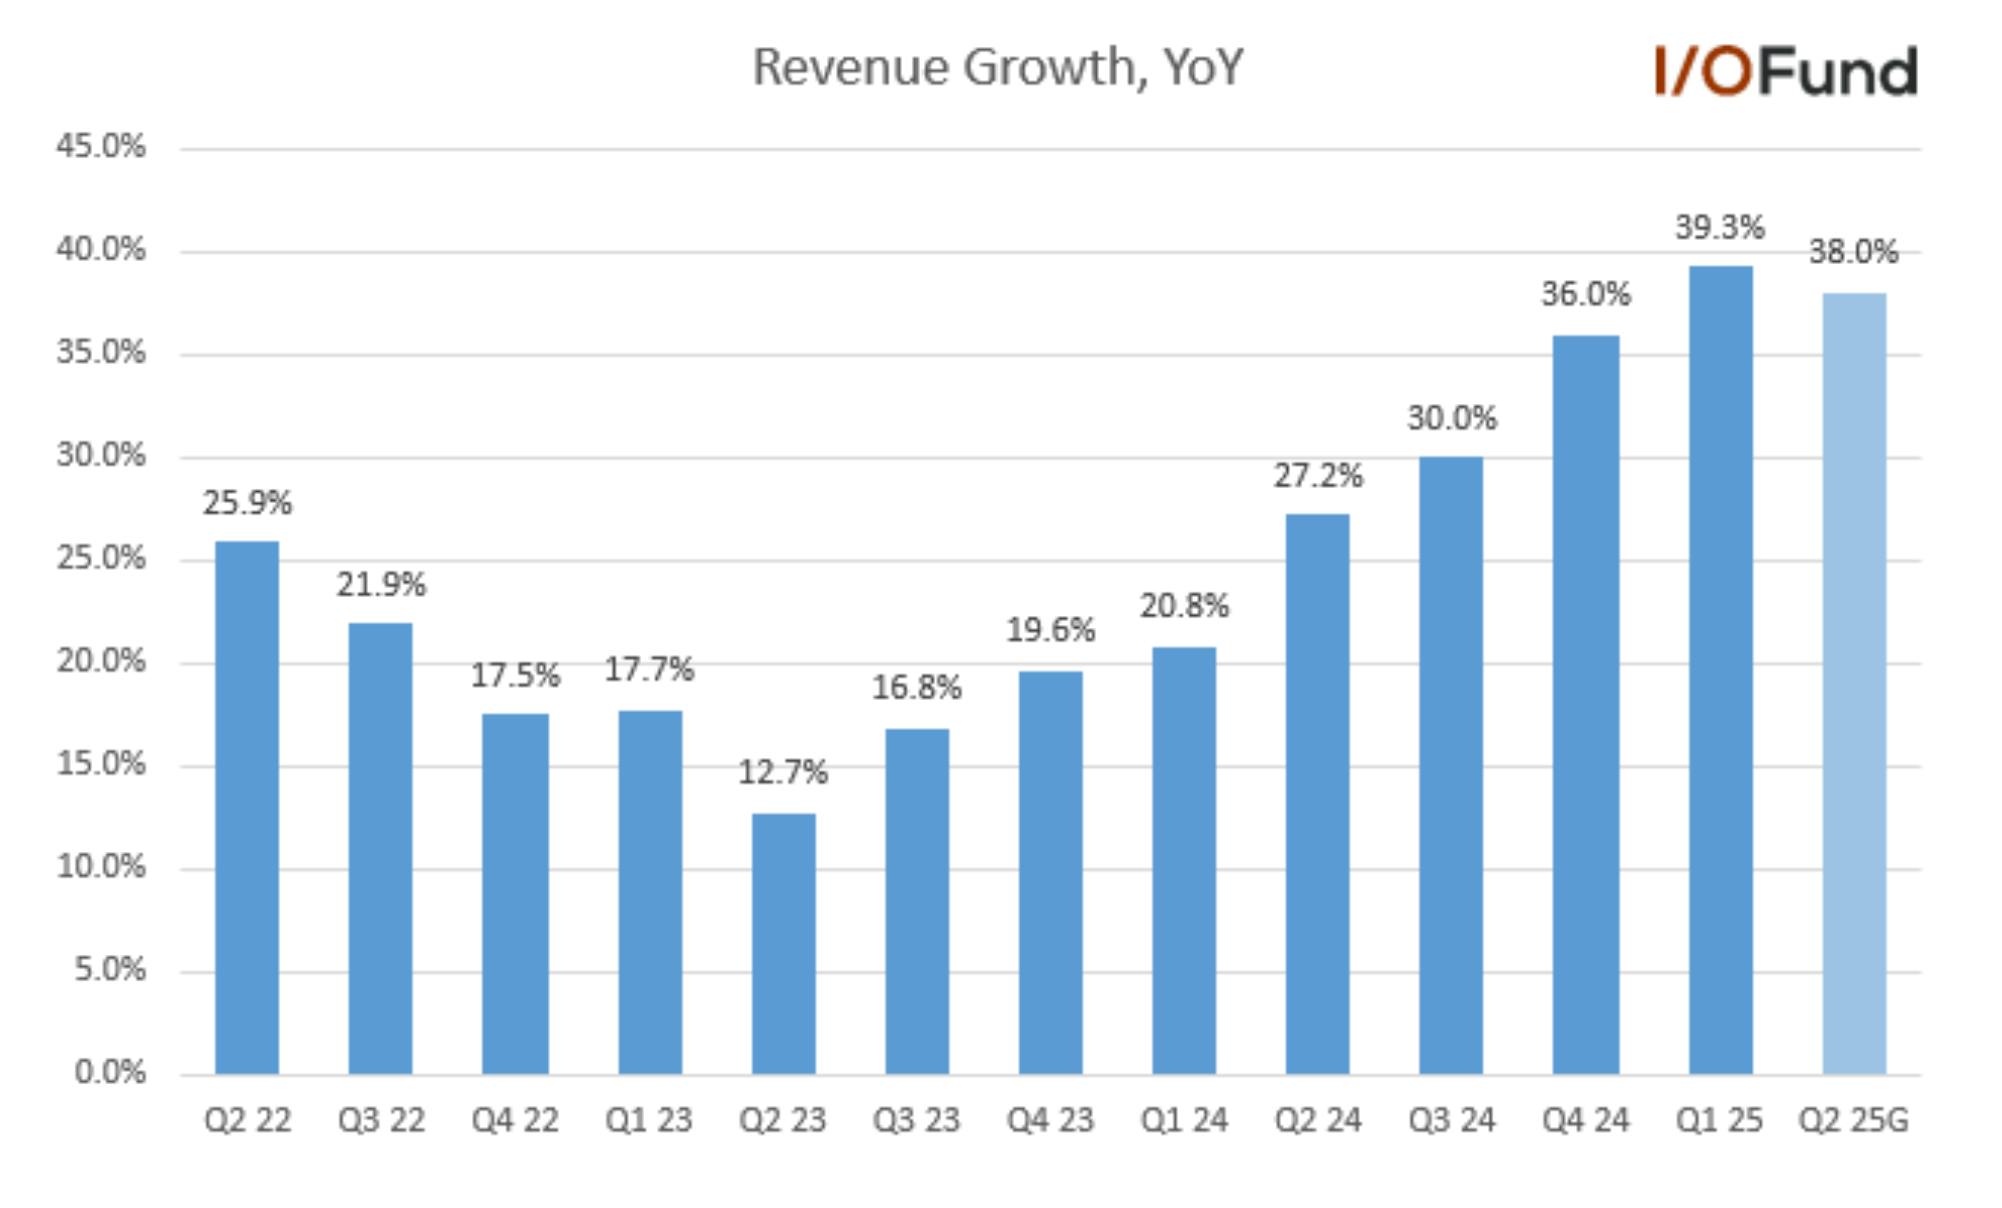
In Q1, the company reported $884 million in revenue for growth of 39%, up from growth of 36% last quarter and 21% last year. This represents QoQ growth of 7%. Perhaps most importantly, US commercial revenue drove the results, with 71% YoY growth and QoQ growth of 19% for the segment’s first-ever $1 billion annual run rate.  

Key metrics such as commercial total contract value (TCV), US commercial customer count, US commercial remaining deal value (RDV) and RPO are supportive of continued growth in future quarters.  

There are also robust cash flows and expanding margins to strengthen the story. What is this Perfect 10 worth? The market clearly loves this stock despite its 83 forward PS valuation; therefore, given Palantir’s ongoing invincibility, it’s truly anyone’s guess if the stock can sustain the valuation or not.  

Background on Palantir’s Platforms 

Palantir’s first platform was Gotham for government purposes before many of the integrated features were expanding to Foundry, which launched around 2021 for Commerical purposes (exact date is not available but generally understood to be around this time).  

Gotham and Foundry create a unified data set for actionable insights across industries such as manufacturing, product development, and customer experience. The data that Palantir gets is from the customer database although the company may use other data sets for government customers, such as scraping social media or other publicly available information on the web. The traditional deployment includes hosting Palantir’s servers in a customer’s data center. 

The difference between Palantir and other AI-enabled database competitors is that Palantir is able to answer questions a model cannot answer. Traditional business intelligence companies require a complete data set whereas Palantir is able to tackle situations where there is not a complete data set. You can think of the competitive advantage as being actionable depth, which Palantir has described as “the reasoning that goes into decision-making, not just data.”  

The core platforms were built for the “ability to construct a model of the real world from countless data points.” Unlike a SQL database, natural language is used to query data and return results in real-time rather than through strings.  

Gotham:  

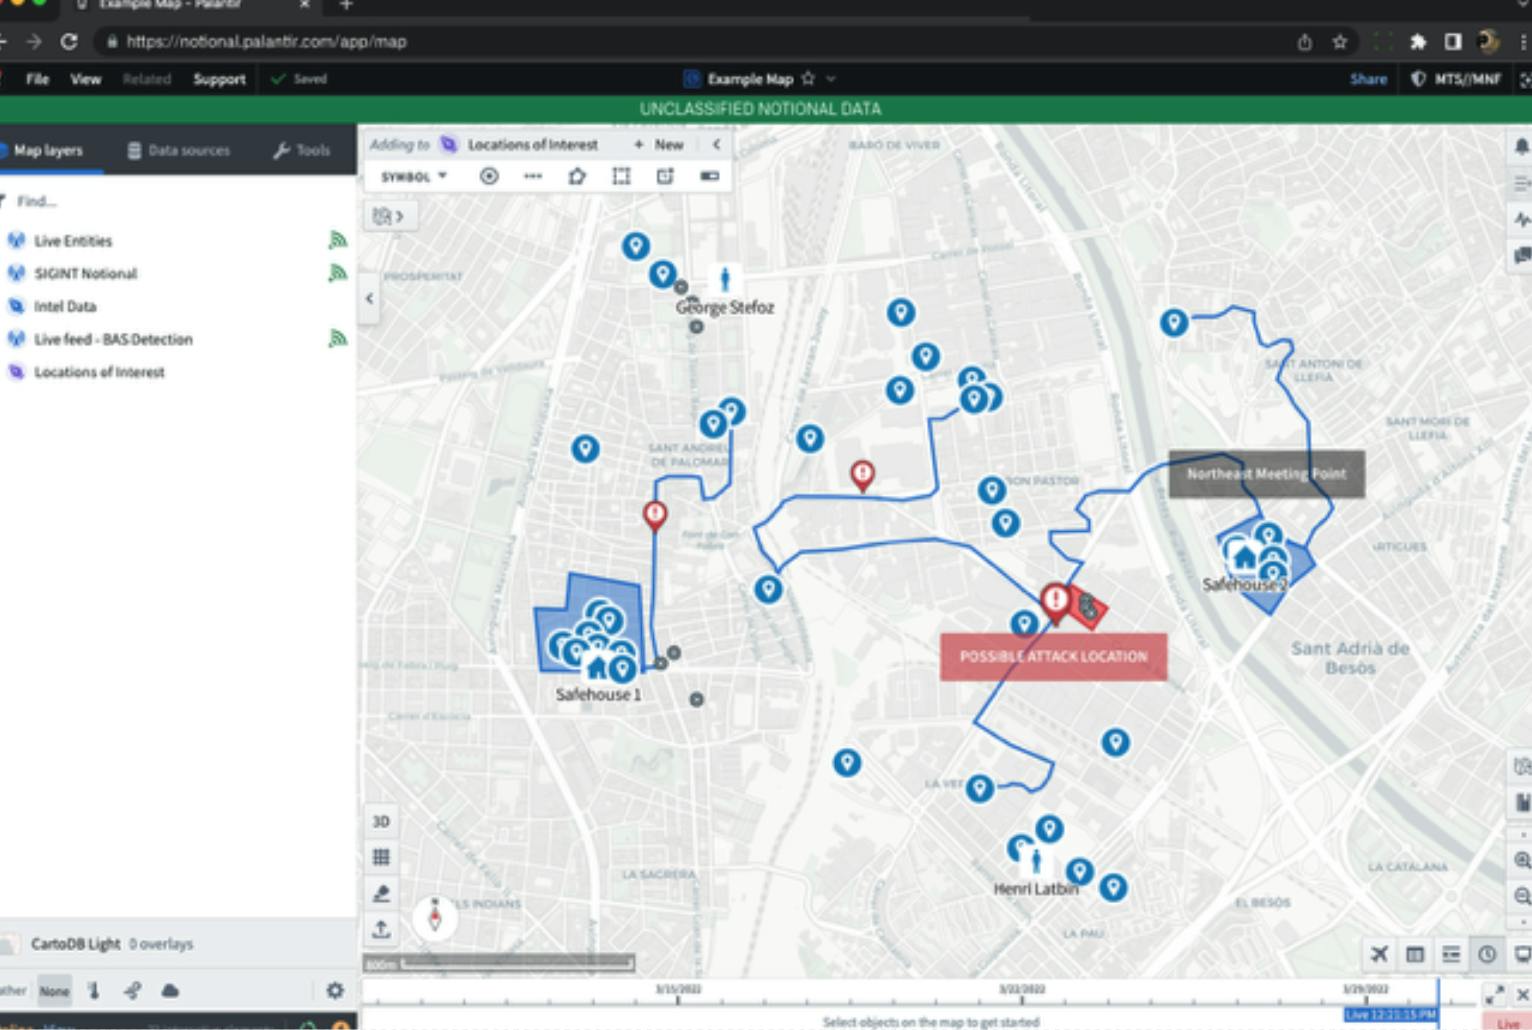
Palantir Gotham was the company’s first platform, built for government operatives in defense and intelligence sectors. The platform enables users to identify patterns hidden deep within datasets using semantic, temporal, geospatial and full-text analysis.  

Here are some ways the platform is used: 

  • Graph application allows data objects to be seen as nodes and edges for the ability to visualize events, filter objects and plot characteristics 
  • Object explorer allows users to query billions of objects, somewhat similar to Apache Spark 
  • Browser allows perform search queries and surface information  

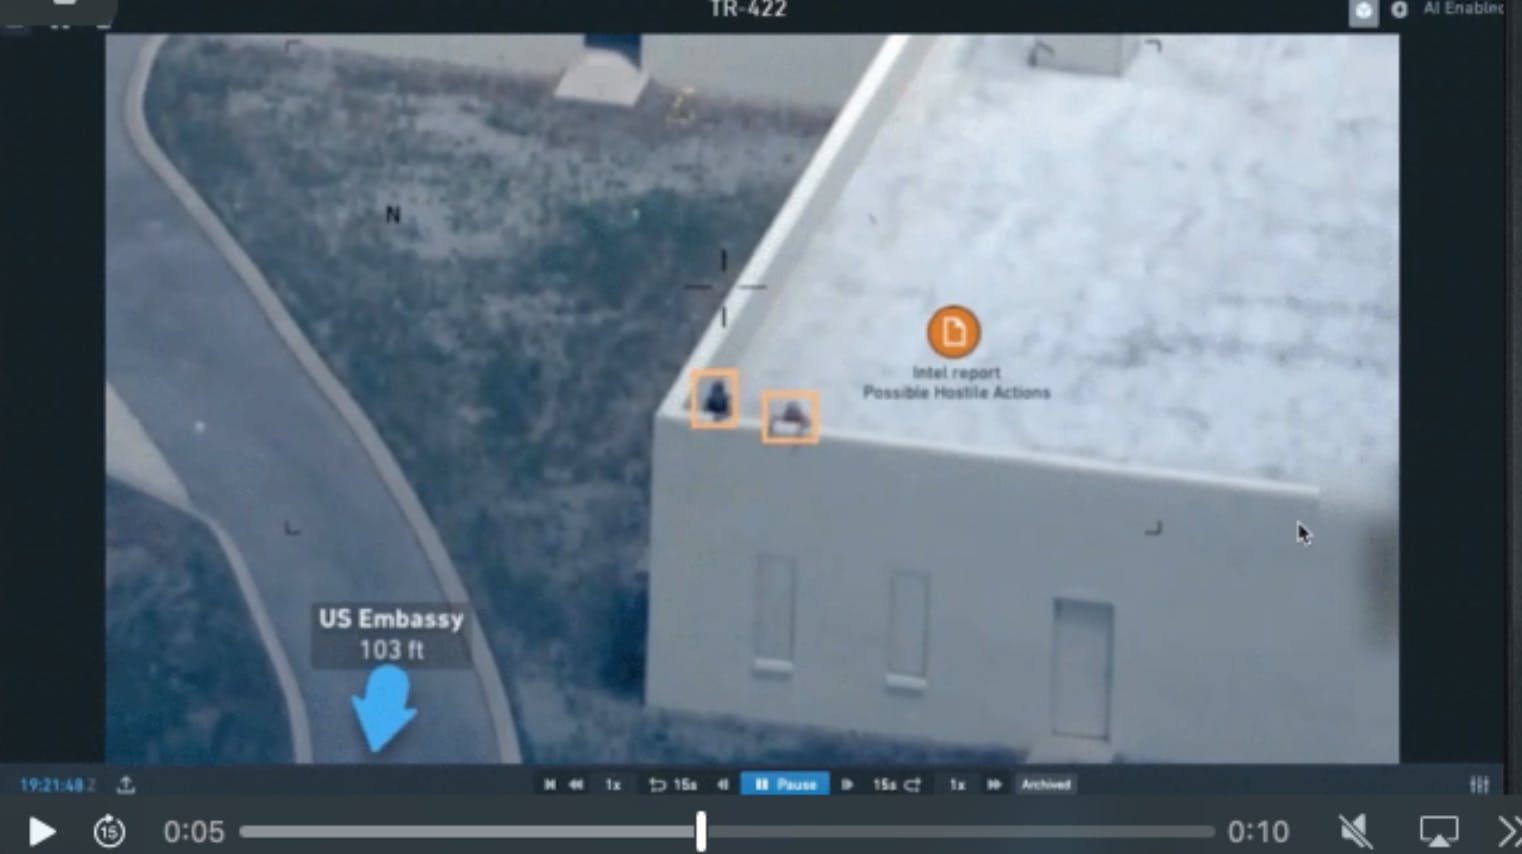
Pictured Above: Gotham uses AI detection models 

Pictured Above: Gotham uses ML models to detect objects and event matches acrsos varying sensor data types, satellite images, audio, text and video.  

Foundry: 

Palantir Foundry is the commercial offering and has four layers of tooling: Foundry Core, Data Foundation, Ontology and Workflows. This four-step process does the following, with the Ontology layer offering a distinct, competitive advantage: 

  • brings volumes of data into one place 
  • transforms the data into a format that analysts can work with and enables validation in any number of programming languages 
  • the “ontology layer” allows datasets to be turned into real-world concepts with the ability to accelerate on the company’s core ontology to reduce redundancy 
  • workflows is where it all comes together in an integrated environment for object exploration, point-and-click top-down analysis, code authoring, time series analysis, data science and application development. When a user has a question, it answers it using all layers and tools available

Pictured: Workflow builder on AIP platform 

Pictured Above: AI-powered Shipments and Supply Chains using AIP platform 

Apollo: 

The Apollo layer provides continuous delivery and an automated configuration layer that allows Foundry and Gotham to work across all cloud environments and also in places where there is little to no connectivity. On top of Palantir being able to form conclusions from incomplete data sets, the company can also deploy its platform and applications anywhere. 

Palantir’s marketing team says Apollo “goes where no SaaS has gone before” because it allows what is done on-premise to also run on multi-cloud SaaS with code that is deployed across all environments rather than written for a specific environment. The orchestration allows for on-hardware AI models to consume real-time data from sensors, radio, geo-data and time series data.  

Where bandwidth is not an issue, the company transmits all raw inputs and enriched metadata from models. Where there are constraints, the platform transmits meta-data only which can reduce bitrate by 20X. At times, a simulated environment can be created with Palantir’s Edge AI from historical data to help train AI models. The simulated environment is then deployed at the edge. With Apollo, Palantir’s centralized operations team is capable of 41,000 updates per week at no additional cost. 

Apollo Edge AI links together satellites to lower latency for the AI-enabled decision chain by orchestrating up to 237 satellites in what the company is calling a “meta-constellation.” This meta-constellation optimizes hundreds of orbital sensors and AI models to power Palantir’s models. One example is tracking submarines that pose a threat to the U.S. and its allies. In this case, submarines are being tracked on a granular level in areas where there is no bandwidth available. These are the kinds of obstacles that Palantir overcomes while being independent of one cloud environment, such as AWS or Azure. 

AIP: 

The Artificial Intelligence Platform has helped the stock surge in recent years as it integrates generative AI with operational data and workflows. When AIP is combined with Foundry and Apollo, it provides an AI service mesh that can run hundreds of microservices, scale compute through its Rubix engine and orchestrate updates through Apollo. Similar to Apollo, AIP Is independent from any one cloud environment.  

AIP Ontology is what Separates Palantir: 

The knowledge graph referred to as Ontology is a distinct advantage. The graph offers better context than a large language model would on its own – or as Palantir states, it’s “the reasoning that goes into decision-making.” 

You will often hear the management team state large language models will become commoditized, which is a way of saying the software that is on top of the LLM is where value creation comes from rather than the LLM alone. For this reason, AIP is designed to not only be cloud agnostic but to also be LLM-agnostic as it works with any large language model – for example, OpenAI, Anthropic, Meta’s Llama, etc. 

The platform also offers an AI agent workflows for building AI agents that are further optimized for specific use cases and customized through additional tools. Autonomous agents can be built and tested on the platform.  

When it comes to security and governance, Palantir’s roots in government contracts means the software company is exceptional compared to peers in this area.

Palantir Reports Accelerating Growth YoY and QoQ, Raises FY Guidance 

Palantir reported $883.9 million in revenue in Q1, beating estimates by more than $21 million. As stated above, this represents growth of 39%, up from growth of 36% last quarter and up from 21% last year. On a QoQ basis, Q1 accelerated 7% from Q4. This is an impressive performance given Q1 is typically one of the slowest quarters seasonally. For Q2, Palantir guided for $934 to $938 million in revenue, or 38% YoY growth. 

Over the past seven quarters, revenue growth has accelerated nearly 27 points, an exceptional feat driven by reaccelerating government growth, persisting AI momentum in US commercial, and strong execution.  

Driven by the strong Q1 report and upbeat Q2 guide, Palantir hiked its full-year revenue growth forecast by 5 points, a rather high-conviction move after just one quarter. Palantir now sees FY25 revenue of $3.89 to $3.902 billion for 35.9% YoY growth, a significant ~$150 million raise from its prior view for $3.741 to $3.757 billion for 30.9% YoY growth.  

With that said, the updated FY25 guidance also suggests that revenue growth may begin to moderate in the back half of the year, given 1H growth is in the mid-38% range. There was a hint in the call that government could be lumpy, thus it’s likely to be the cause for H2 being slightly lower than H1. The other possibility for H2 being forecast to report slower growth would be Europe or other global weakness, which was present in this report. 

Key Segments: US Commercial Revenue Growth Drives Results 

US Commercial drove the results this quarter although Global Commercial was still at a lower growth rate than Government due to weakness in Europe. It’s clear to see in the numbers below that Government contracts remain crucial for Palantir’s success. 

Government: 

  • Government revenue growth accelerated 5 points sequentially to 45% YoY to $487 million, accounting for 55% of revenue.  
  • US government revenue grew 45% YoY to $373 million, and international government revenue also rose 45% YoY to $114 million.  

Palantir said US growth was driven by new awards reflecting growing AI software demand, while international growth was driven by UK healthcare and defense sector work and the new NATO contract.  

In the call, the CEO used the word lumpiness when asked about government contracts, and notably, did not answer the question directly rather used it as an opportunity to talk about the overall business in both the quoted portion below and the lengthier response found here

Dan Ives: 

Thanks. And, another amazing quarter. I mean, it's just — so my question is, given that what we're seeing in the government, isn't that another opportunity where you could actually gain more share of budgets as you go to more meritocracy? Like, Palantir should actually gain more dollars within the budgets of DoD and a lot of other agencies. 

Alex Karp: 

We're very optimistic about what we're going to do in the US, but the devil's in the details. And we're running this business for you with you as owners, which means it's like there's going to be maybe lumpiness, but we predict we're going to do very, very well […] “ 

There was mention on the call that they are seeing government demand globally minus Europe … although that could go against the trend toward sovereign AI.  

Per management: “I would say as an unknown variable, we're seeing very significant demand for our software, our government software around the world outside of Europe. And those are early days, but the demand — the signal there is very strong.” 

US Commercial Revenue Accelerates to 71%: 

Commercial revenue growth accelerated two points sequentially to 33% YoY to $397 million, as Palantir is growing rapidly in the United States, yet faces persisting headwinds in Europe.  

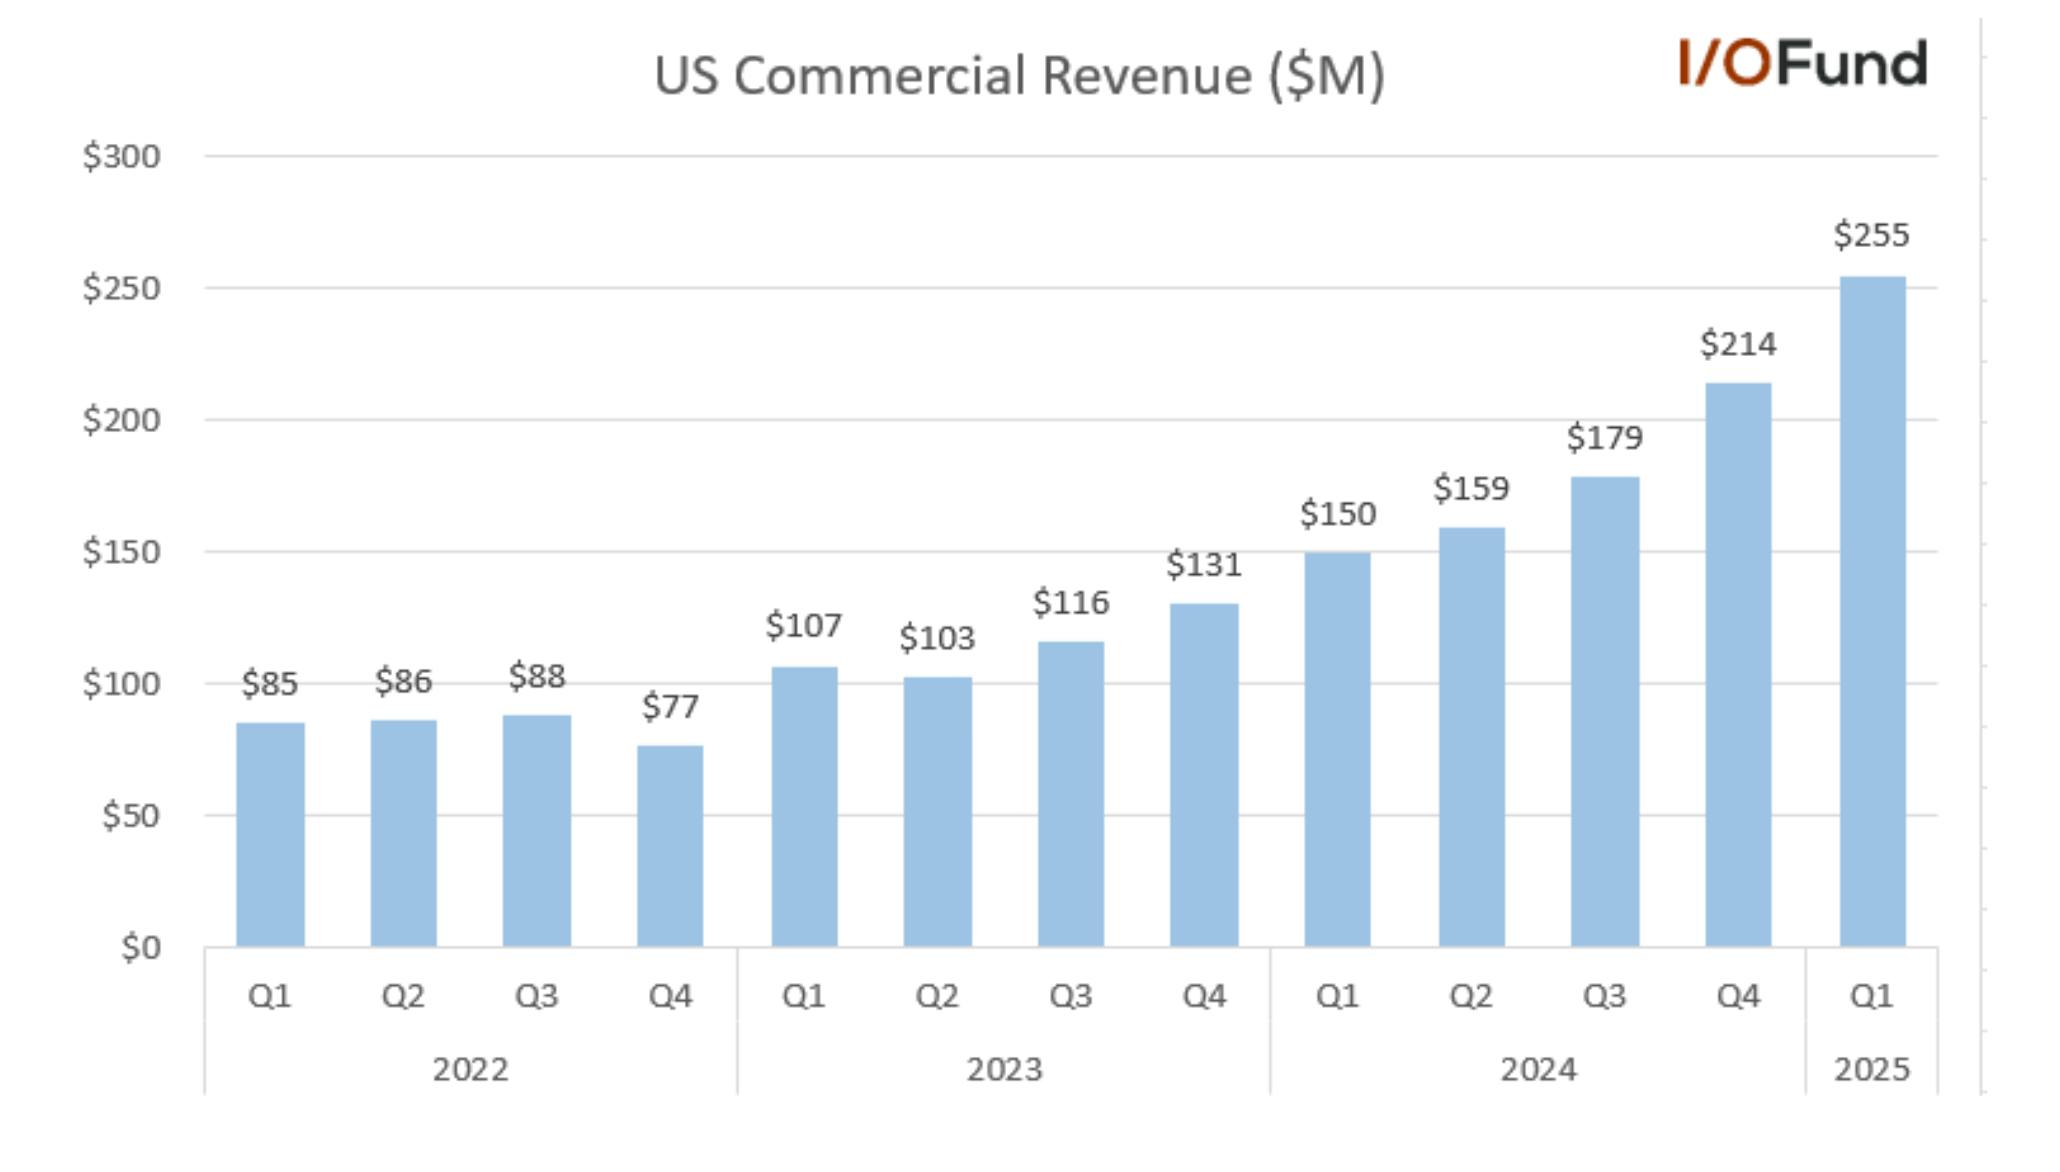
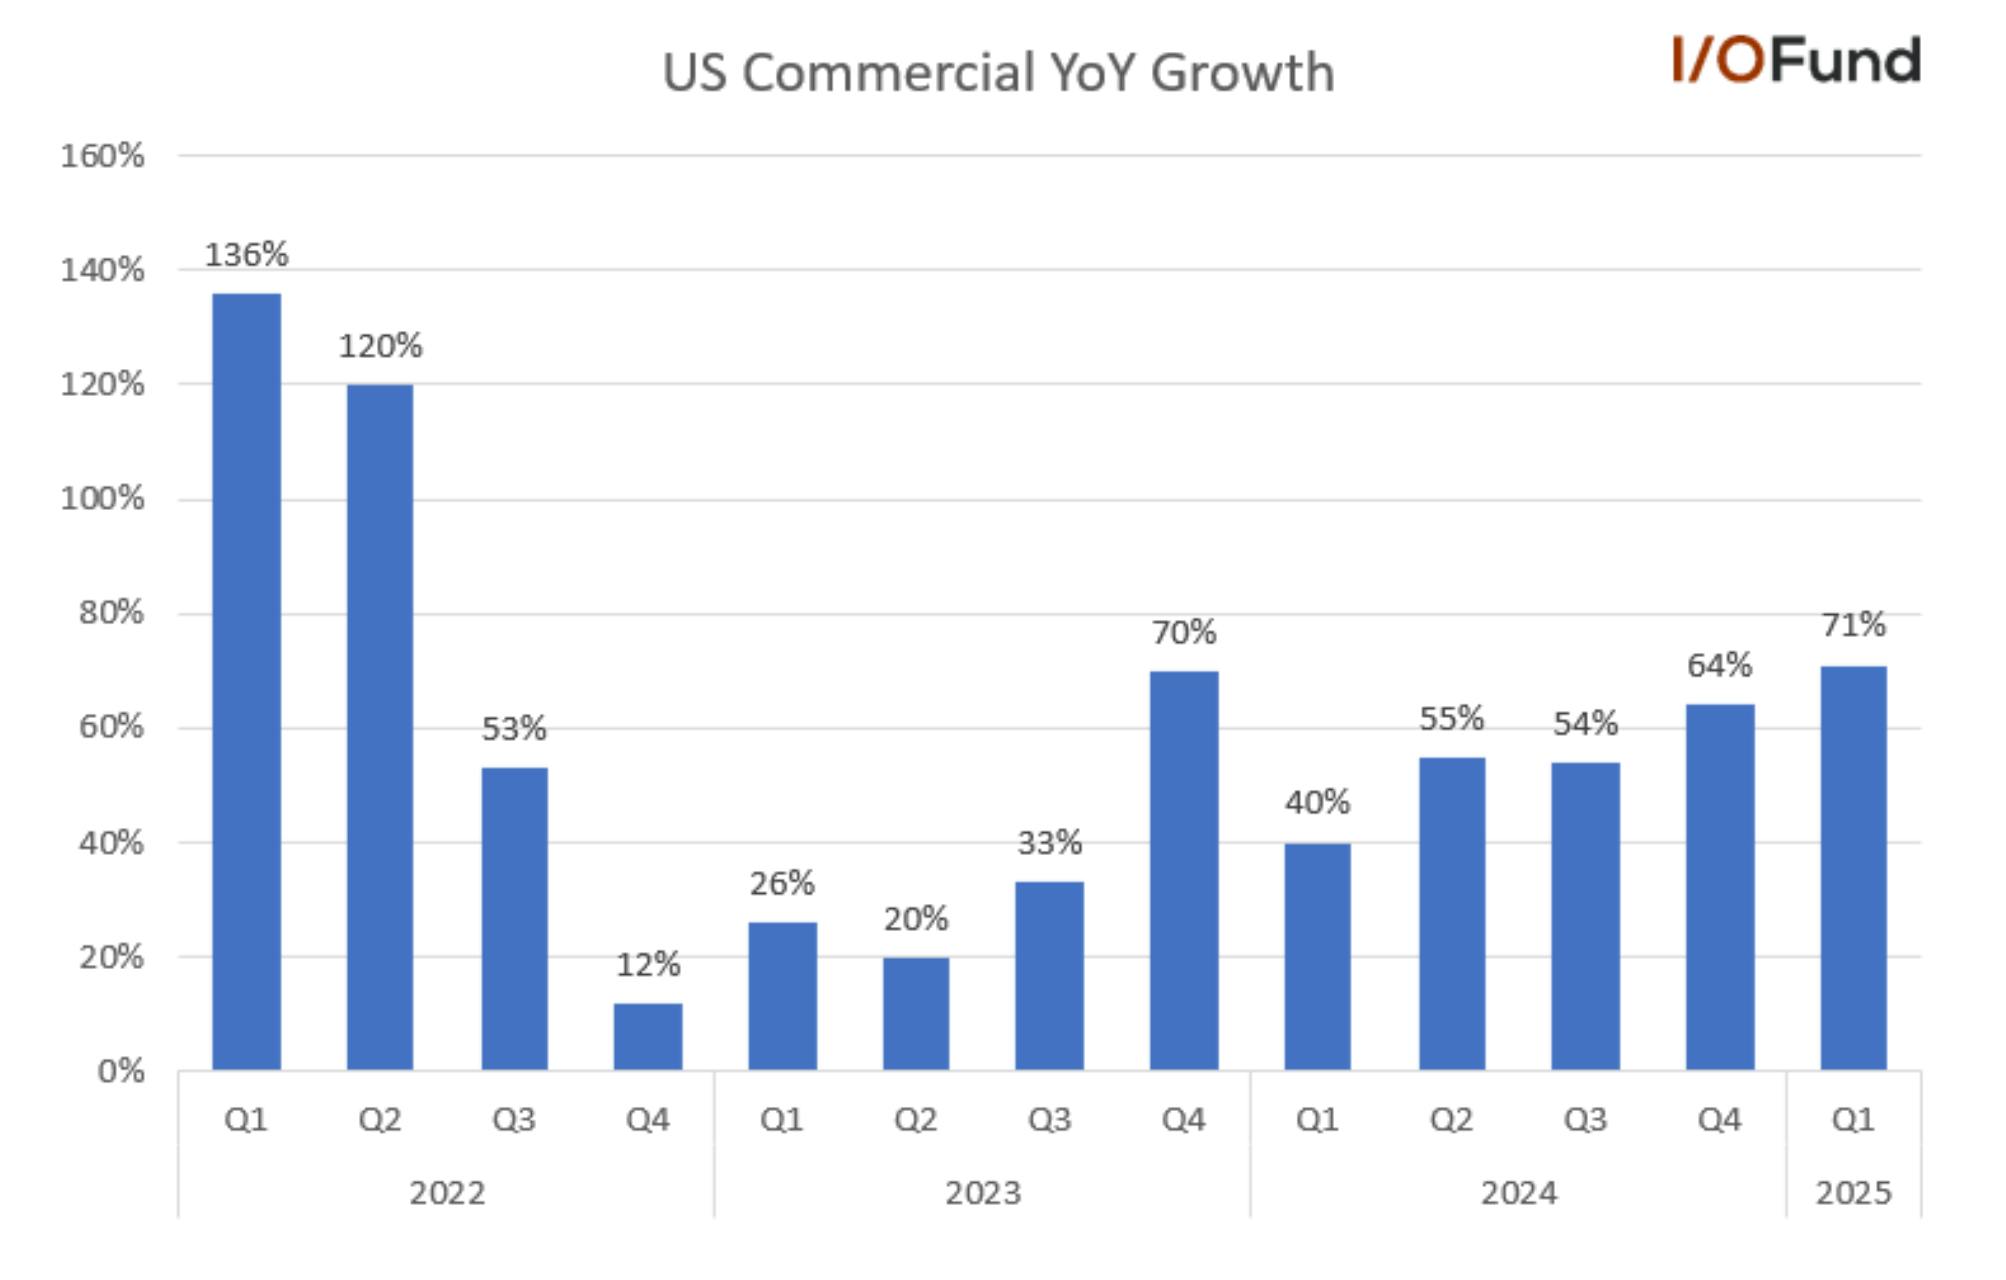
  • US commercial revenue accelerated from 64% last quarter to 71% YoY this quarter to $255 million, surpassing a $1 billion annualized run rate for the first time on elevated AI demand. However, the guide for next quarter does indicate Q1 could be the peak with fiscal year growth of 68% guided. 
  • International commercial revenue declined (5%) YoY to $141 million, weighed down by soft European demand and a one-time revenue catch-up in Q4. 

Not only did Palantir’s US commercial segment see revenue growth accelerate to the highest growth rate in nearly three years, but it also saw record growth in a handful of key metrics that support strong growth continuing through the year.  

  • US commercial accelerated 31 points YoY and 7 points QoQ to 71% in Q1, surpassing Q4 2023’s 70% level and the highest growth since Q2 2022. This strong growth means that Palantir’s US commercial segment is on track to rise more than 2.5x in two years.  
  • Palantir raised its FY25 US commercial growth guidance from 54% YoY to 68% YoY, projecting revenue of $1.178 billion, compared to $457 million in 2023. The raise represents about $100M more than previously expected. 

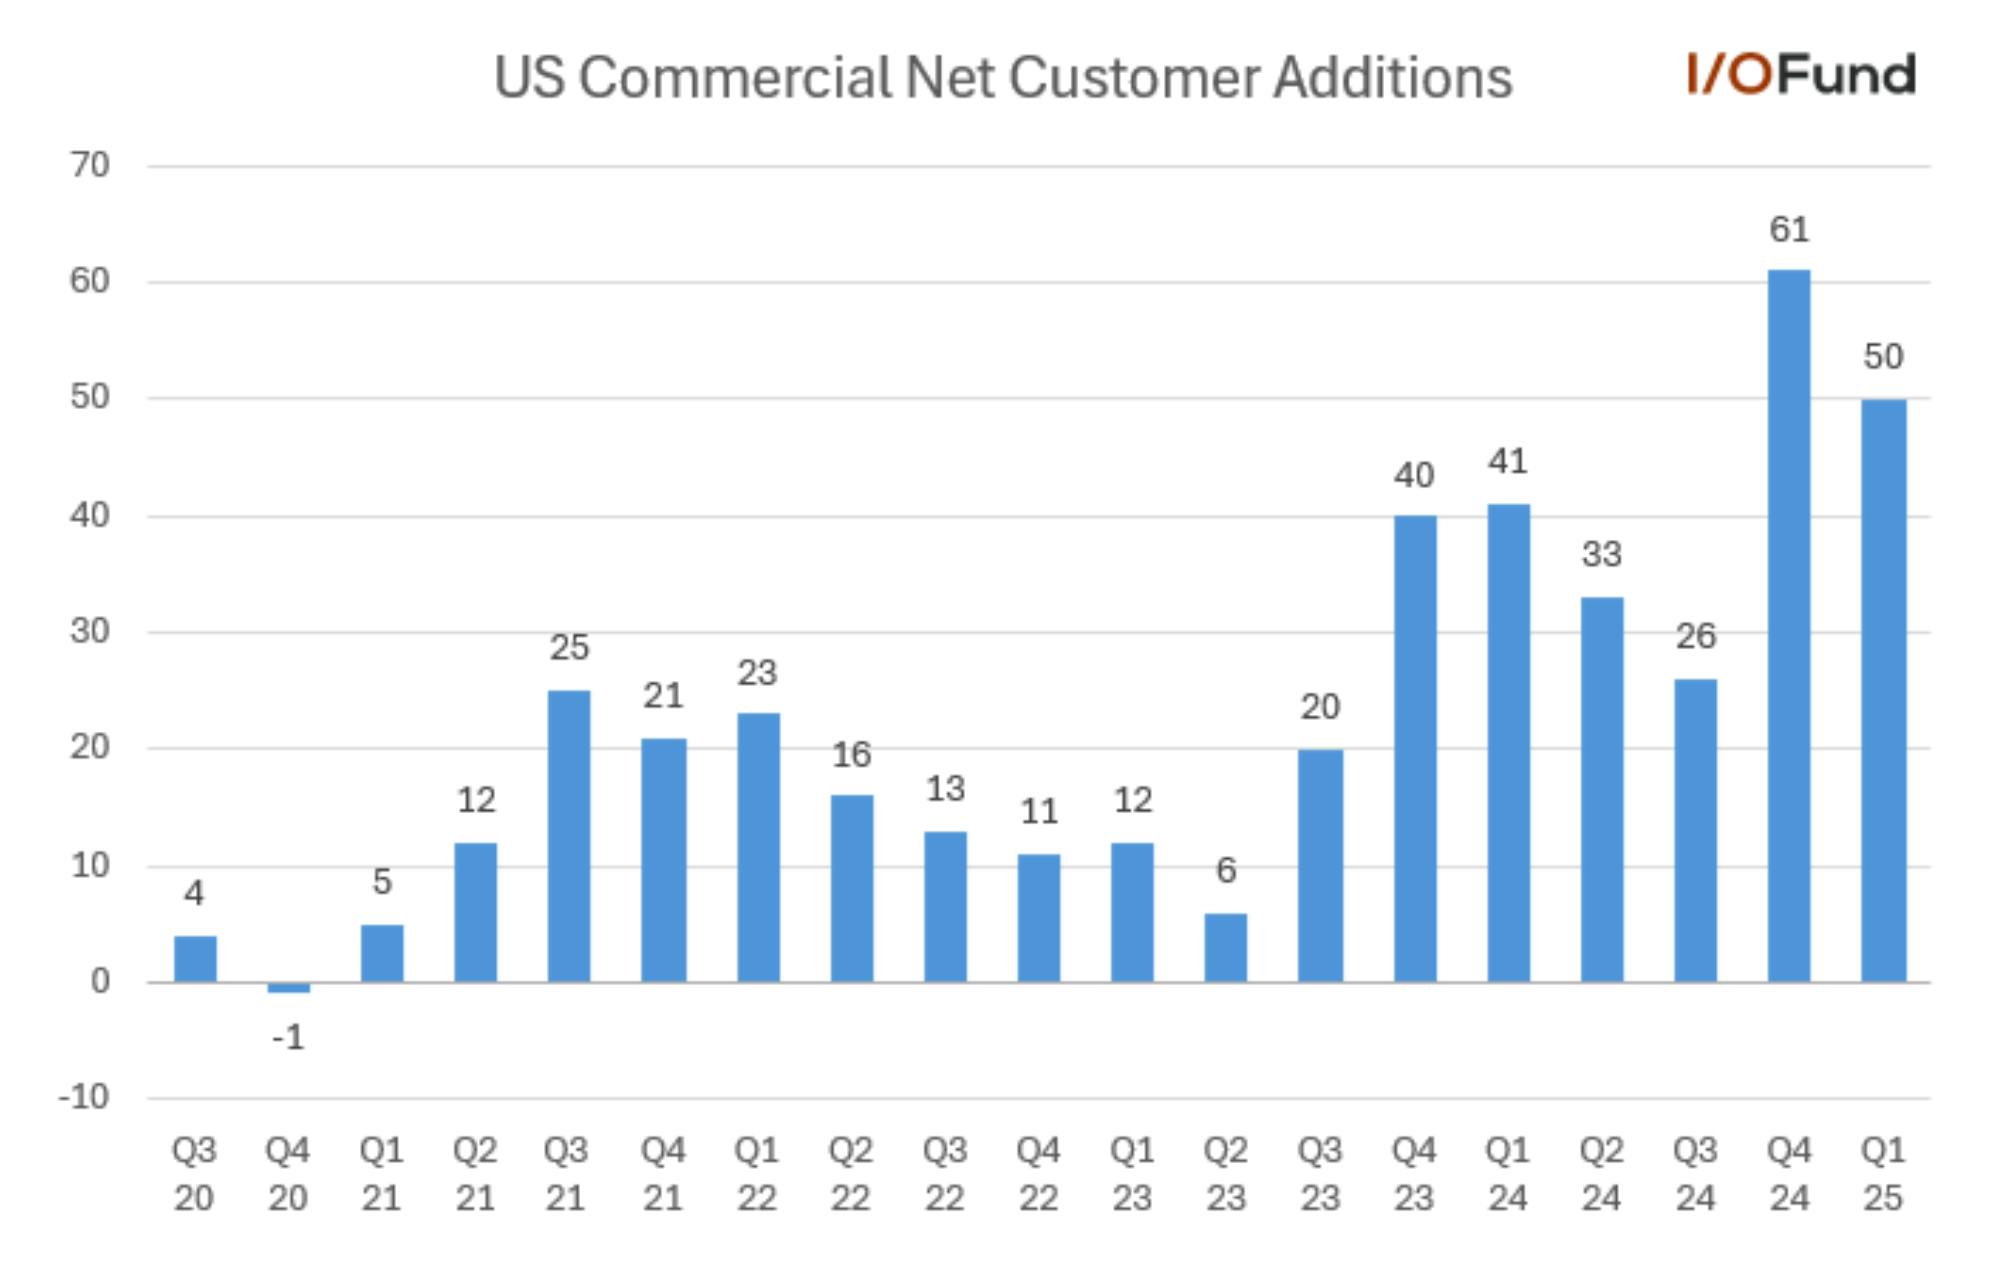
US commercial customer count rose 65% YoY and 13% QoQ to 432, with Palantir adding 50 net new customers in the quarter. Palantir has added 111 net new customers in Q4 and Q1 combined, its highest two-quarter total on record.  

The segment’s strong growth outlook is supported by robust key metrics: 

  • 2x YoY growth in US commercial deals closed above >$1M 
  • 127% YoY and 30% QoQ growth in US commercial remaining deal value to $2.32 billion 
  • 183% YoY growth in US commercial total contract value (TCV) booked of $810 million 

Key Metrics Support Continued Growth 

While US Commercial featured many strong key metrics yet NRR, RPO and Billings stood out with strong growth as well in Q1. 

  • Total remaining deal value (RDV) accelerated from 39.2% in Q4 to 45.6% in Q1 as it rose to $5.97 billion. 
  • RPO accelerated from 39.5% YoY in Q4 to 46.1% YoY in Q1 at $1.90 billion. 
  • Total contract value (TCV) booked increased 66% YoY to $1.5 billion. 
  • Billings rose 44.8% YoY to $905 million. 
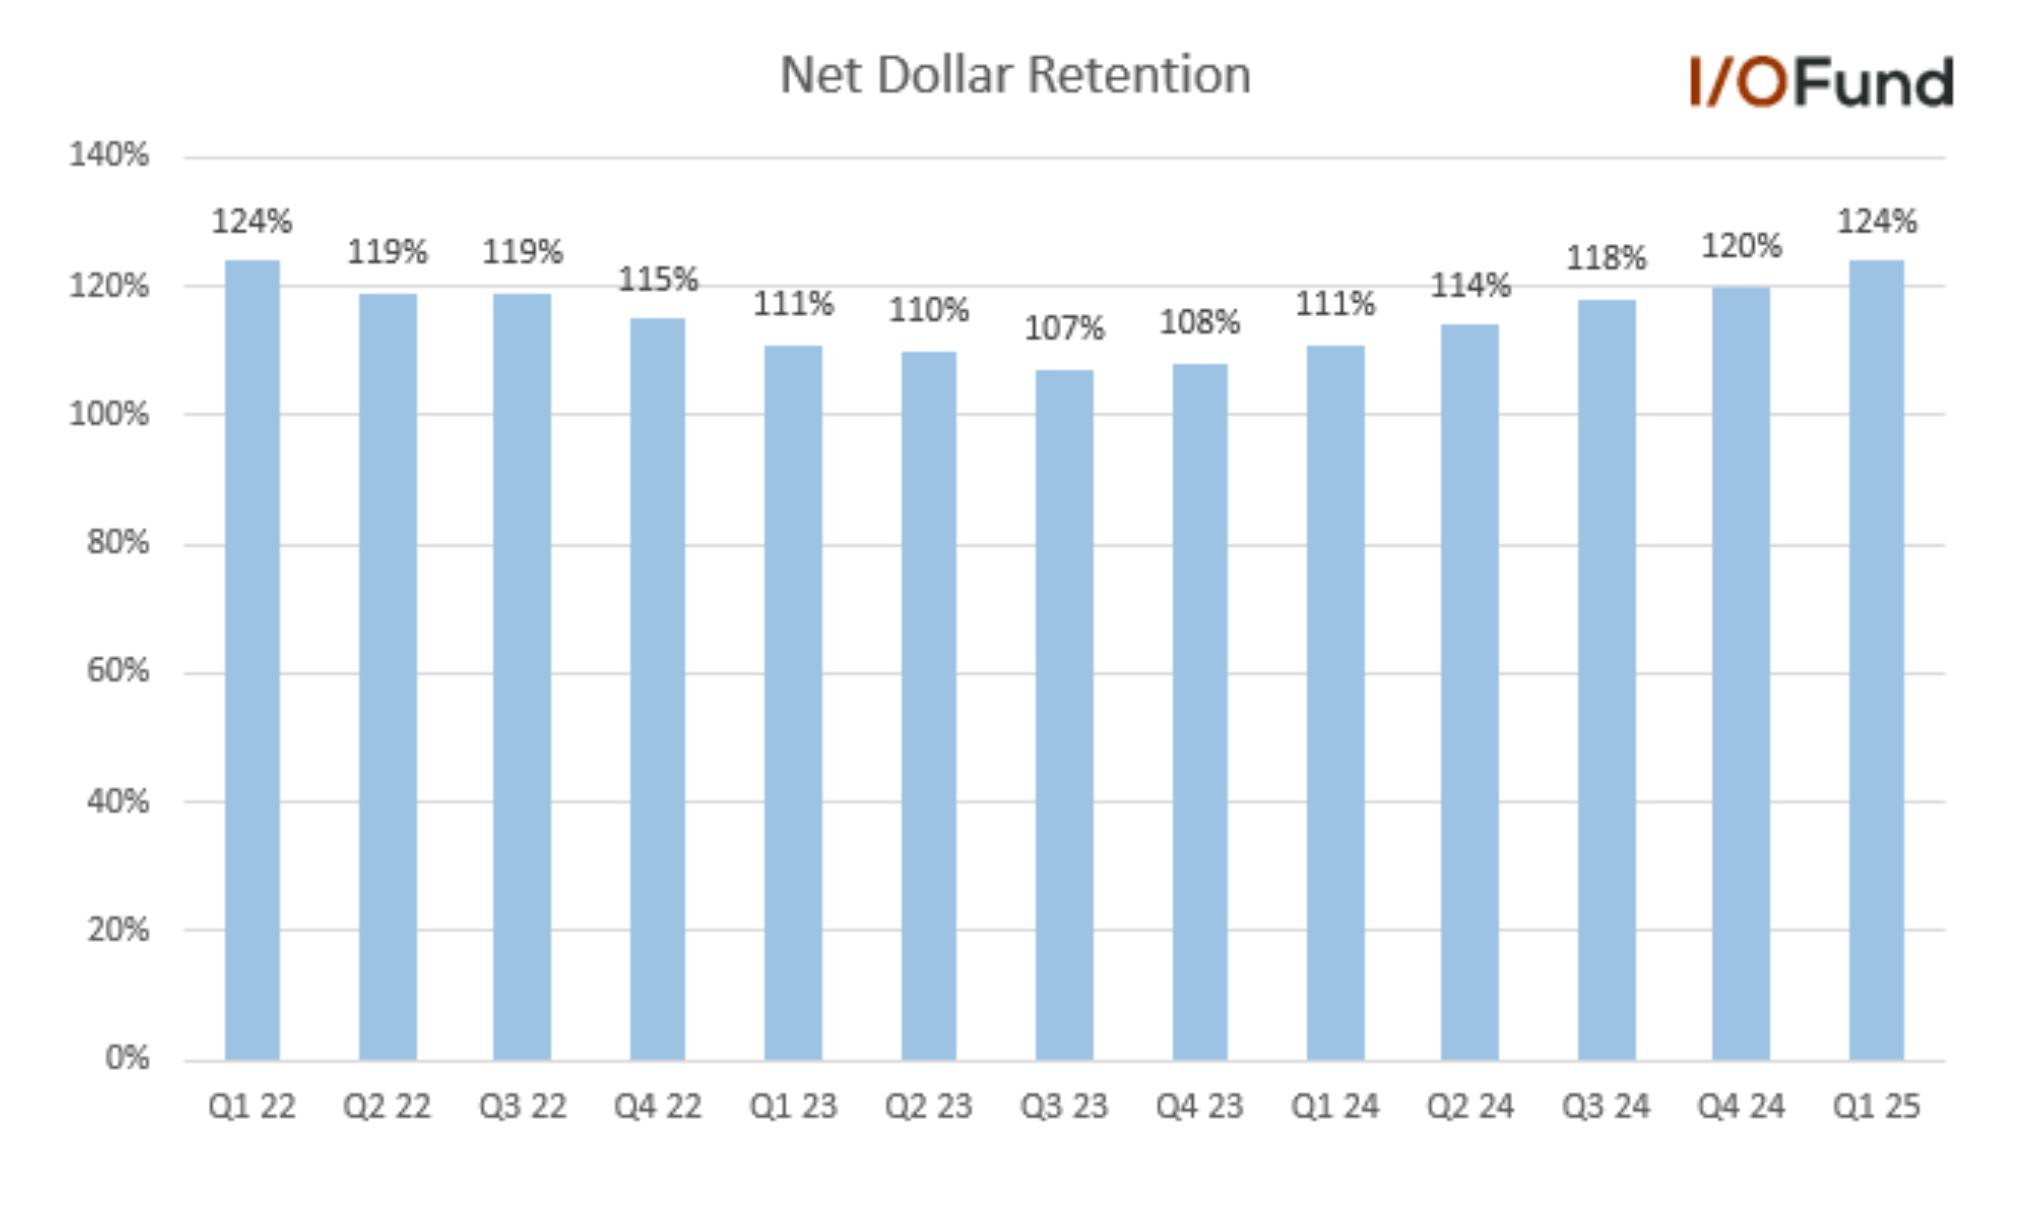
  • Net retention rate (NRR) rose four points sequentially to 124%, its highest level in three years. Palantir pointed out that NRR should continue to expand in the coming quarters: “As net dollar retention does not include revenue from new customers that were acquired in the past 12 months, it has not yet fully captured the acceleration and velocity in our US business over the past year.” 

Margins 

Palantir’s margin profile is exceptionally strong, as the company continues to drive operating margin expansion while accelerating revenue growth. This helps the company’s Rule of 40 metric, which stands at 83 as it combines EBITDA margin with revenue – or more than double the ideal 40 that many SaaS companies set out to acheive yet cannot due to a lack of GAAP margins.  

  • GAAP gross margin was 80.4% in Q1, down 1.3 points YoY. Adjusted gross margin was 82.1%, down more than 1 point YoY. 
  • GAAP operating margin expanded to 19.9%, up more than 7 points YoY.  
  • Adjusted operating margin was 44.2%, up 8.5 points YoY. For Q2, Palantir guided its adjusted operating margin to 43.1%, which would represent a third consecutive quarter above 40% and up nearly 6 points YoY. 
  • GAAP net margin was 24.2%, up more than 7.5 points YoY.  
  • Adjusted net margin was 37.8%, up nearly 8 points YoY. 

Palantir also boosted its full-year adjusted operating income forecast from its prior view of $1.551-1.567B to $1.711-1.723B. FY25’s adjusted operating margin is now projected to be 44.1%, up from its prior view of 41.6%.  

EPS 

Despite the top-line beat, Palantir met adjusted EPS estimates in the quarter at $0.13, up 68% YoY. GAAP EPS was $0.08, up 100% YoY.  

Looking ahead through the rest of FY25, adjusted EPS growth is expected to decelerate, from Q1’s 68% YoY to 20% YoY by Q4. However, estimates have risen over the past three months – Q2’s growth rate has come up 11 points and Q3’s up by 9 points. 

For FY25, Palantir is expected to see adjusted EPS growth of nearly 43% YoY to $0.58, before decelerating to 25% growth to $0.73 in FY26. 

Cash Flows and Balance Sheet 

Palantir stands out for its ridiculously strong cash flows, though operating and free cash flow margins moderated quite substantially in Q1 relative to 2H 2024.  

  • Operating cash flow was $310.3 million in Q1 for a margin of 35%, down from 56% in Q4.  
  • Adjusted free cash flow was $370.4 million for a 42% margin, down from a 63% margin in Q4. Palantir raised its adjusted FCF guidance for FY25 from $1.5-1.7 billion to $1.6-1.8 billion, implying an FCF margin of 43.7%. 
  • Adjusted EBITDA margin was 45%. 
  • Cash and equivalents totaled $5.43 billion, while debt was zero. 

Conclusion: 

Part of our process is to highlight stellar earnings reports and Palantir certainly qualifies. It’s hard to find a blemish in the company’s current quarter as it’s perhaps the best report the company has reported yet – which is saying a lot. We are certainly seeing companies at the data layer doing well in AI with Oracle also reporting strong results, and this is likely to be a theme in the coming years.  

The valuation with Palantir is a gamble. The bulls believe they’ve speculated correctly, while there’s likely to be short sellers who do well with this stock too. PLTR is attempting to set a new bar for AI software with the 80 forward valuation, yet 39% revenue is a tricky spot to be as it barely qualifies as high-growth (yes, it’s US commercial segment does qualify, but you could say that for a few stocks trading a much lower valuations).  

Congrats to all the Palantir longs, it’s certainly paid off in spades. As for the IOF, this isn’t one I was able bite on at the high valuation and that remains my conclusion at this time. If we can get a more reasonable valuation, however, we’d love to have this one in the portfolio.

Please note: The I/O Fund conducts research and draws conclusions for the Fund’s positions. We then share that information with our readers. This is not a guarantee of a stock’s performance. Please consult your personal financial advisor before buying any stock in the companies mentioned in this analysis.

Recommended Reading:
Taiwan Semiconductor: Building a Moat under Geopolitical Tensions

This article is a continuation of our free newsletter from May 23, Nvidia Stock Faces a Choppy Q2, But Tailwinds Build for H2 Acceleration

For our Premium Members, we discuss the following:  

  • Our analysis on the stock’s valuation and if the stock is a “buy” or a “hold” given the stock faces immense demand from the AI economy yet must also weather geopolitical tensions. 
  • The I/O Fund’s trading plan for TSMC including never-before published buy targets over a 12 to 18-month time frame.

TSMC’s Valuation: 

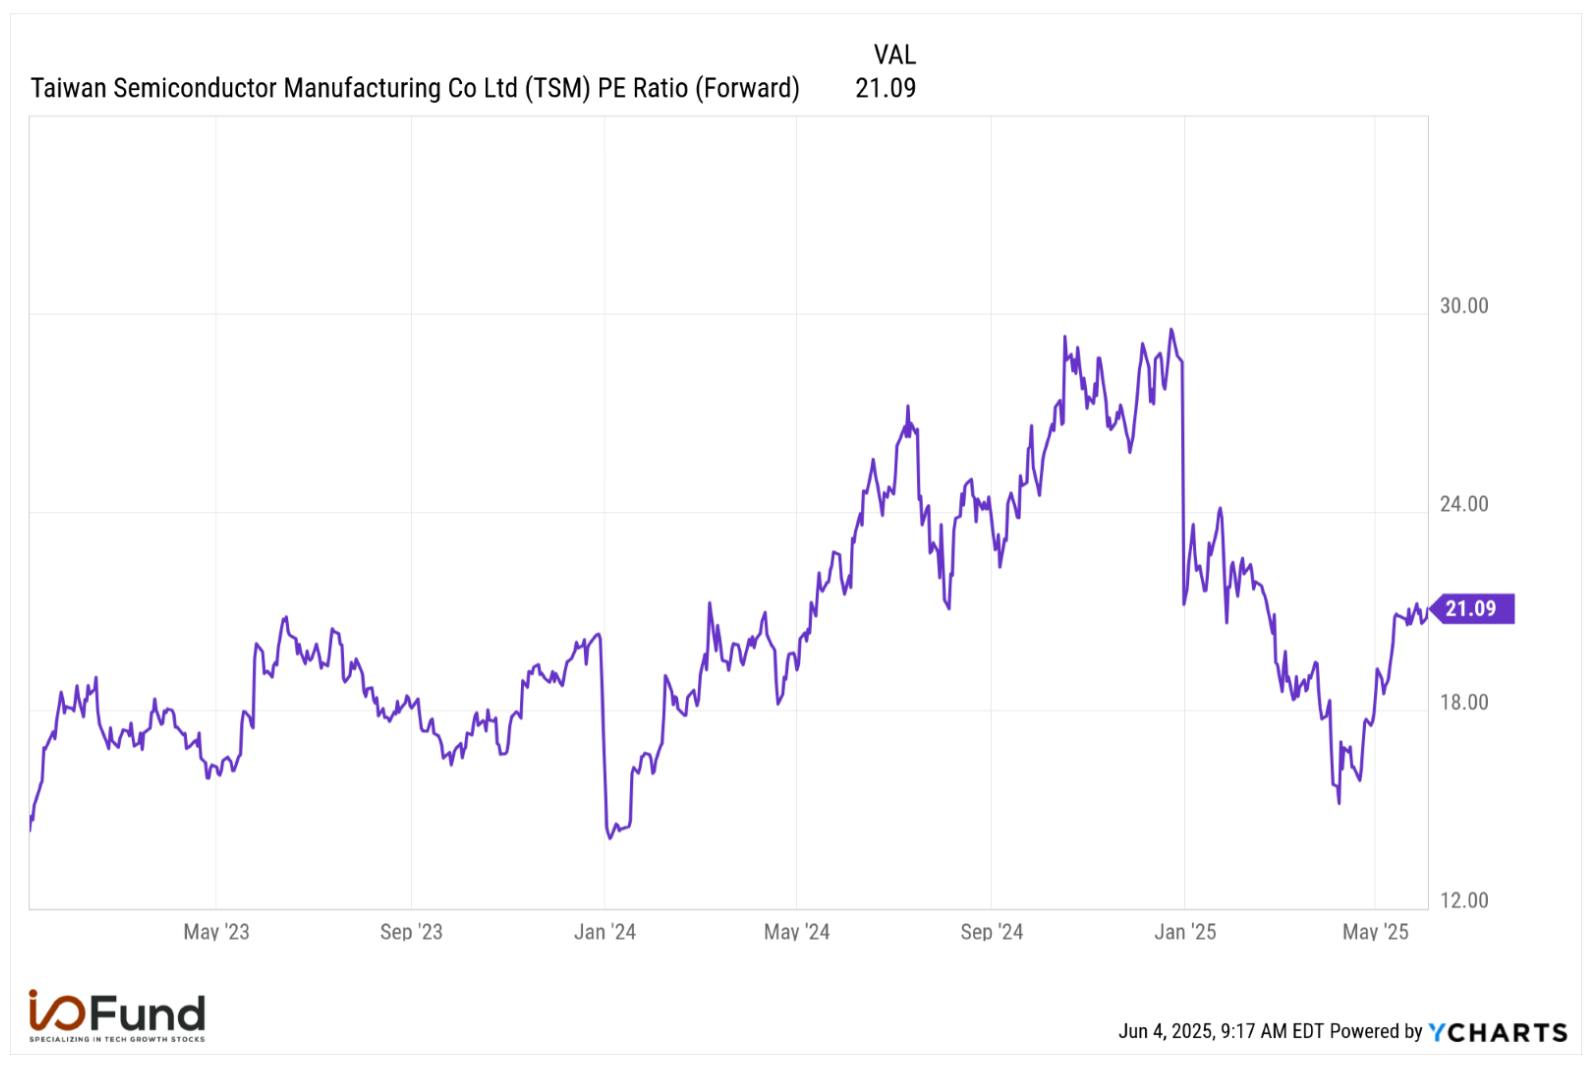
Historically, semiconductors do not trade at the valuations we saw in 2024. Therefore, the market is essentially saying (given the risks around China), we are not willing to pay the exuberant premium of 2024. Valuation is the primary reason most semiconductors are flat over a 1-year period.  

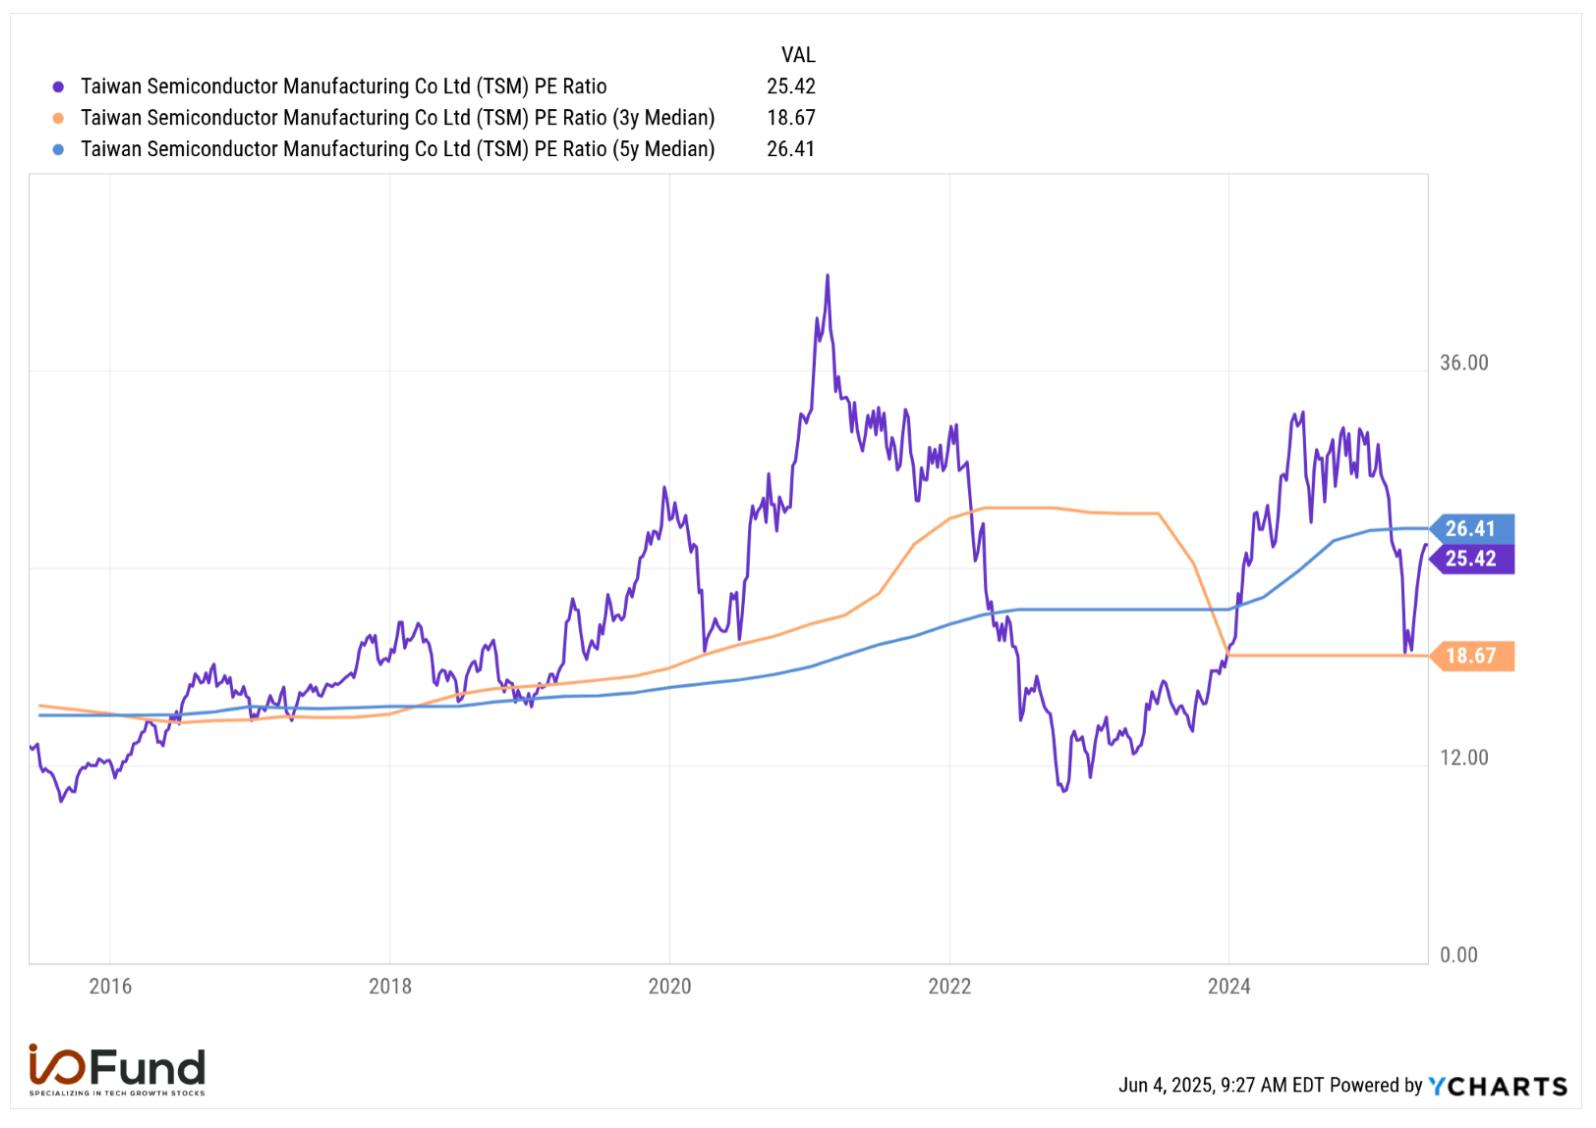
This is visible in TSMC’s forward PE ratio to where anything over 20 is quite rare. The 3-year median is 18.5 while the stock is trading at 21. The forward PE ratio peaked at 30. 

When you zoom out 10 years, the TTM PE ratio rarely trades over 25 except for the blowoff top in 2021 and the AI boom of 2024. 

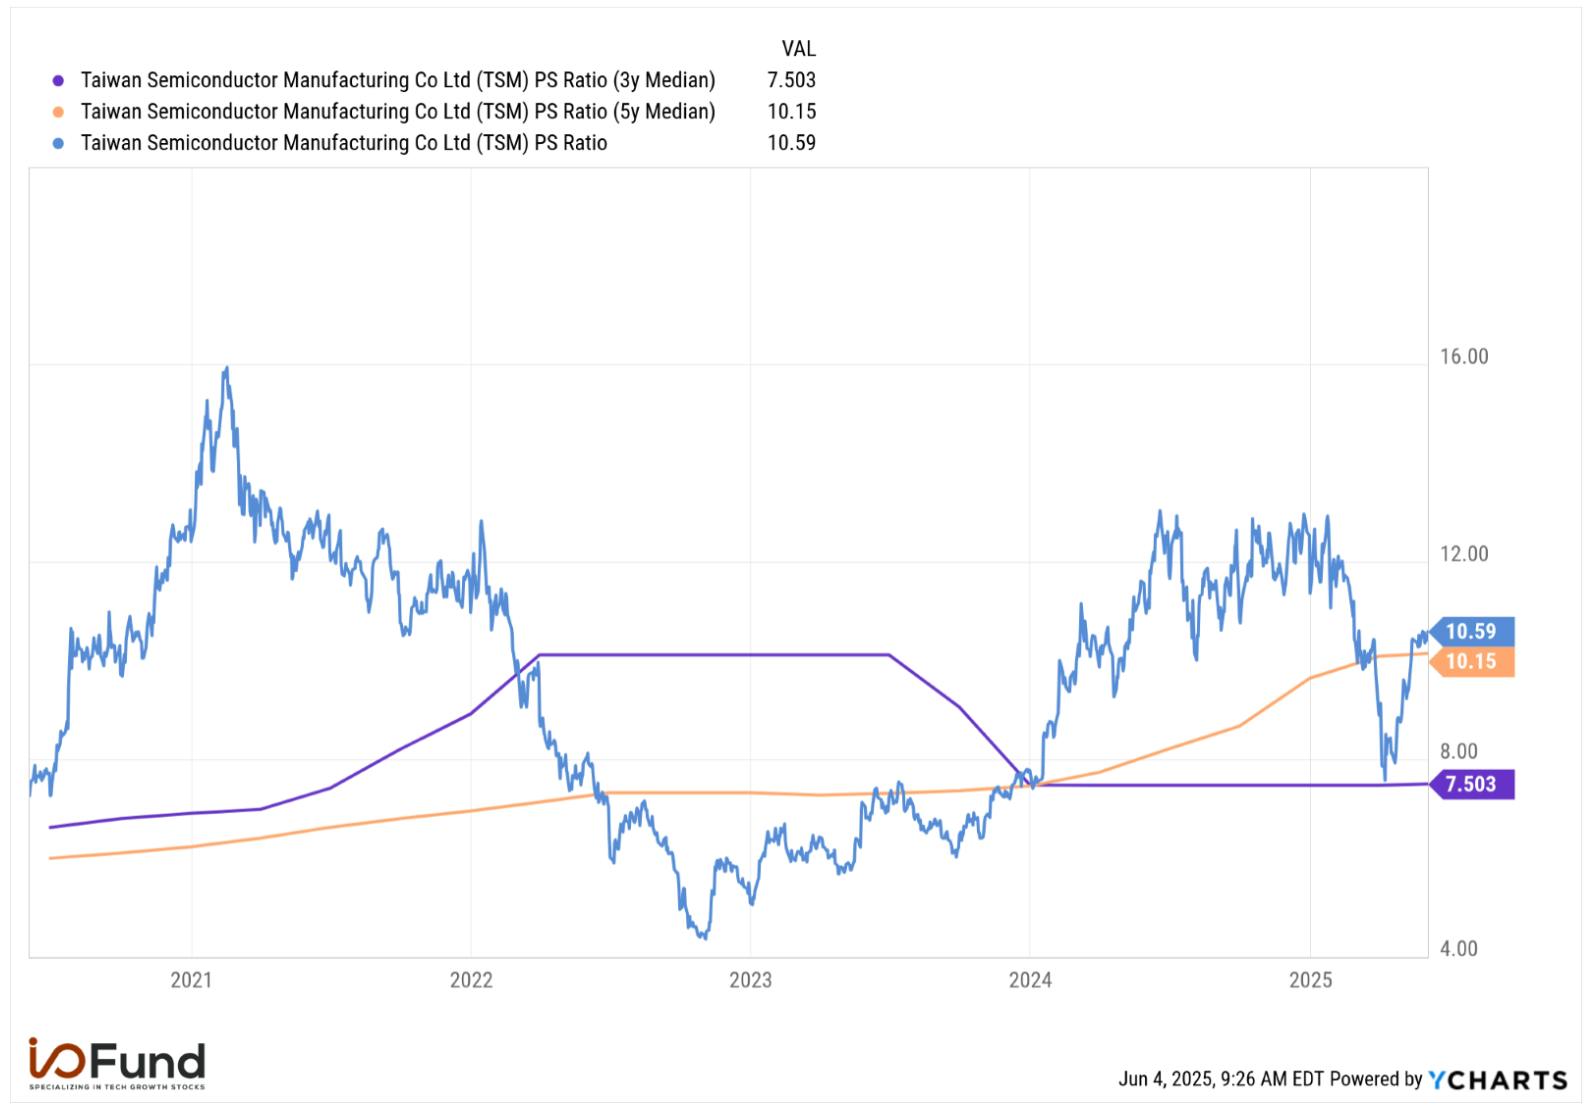
When you look at the top line, something similar is seen to where the stock is trading at the 5-year median of 10 PS on a TTM basis. 

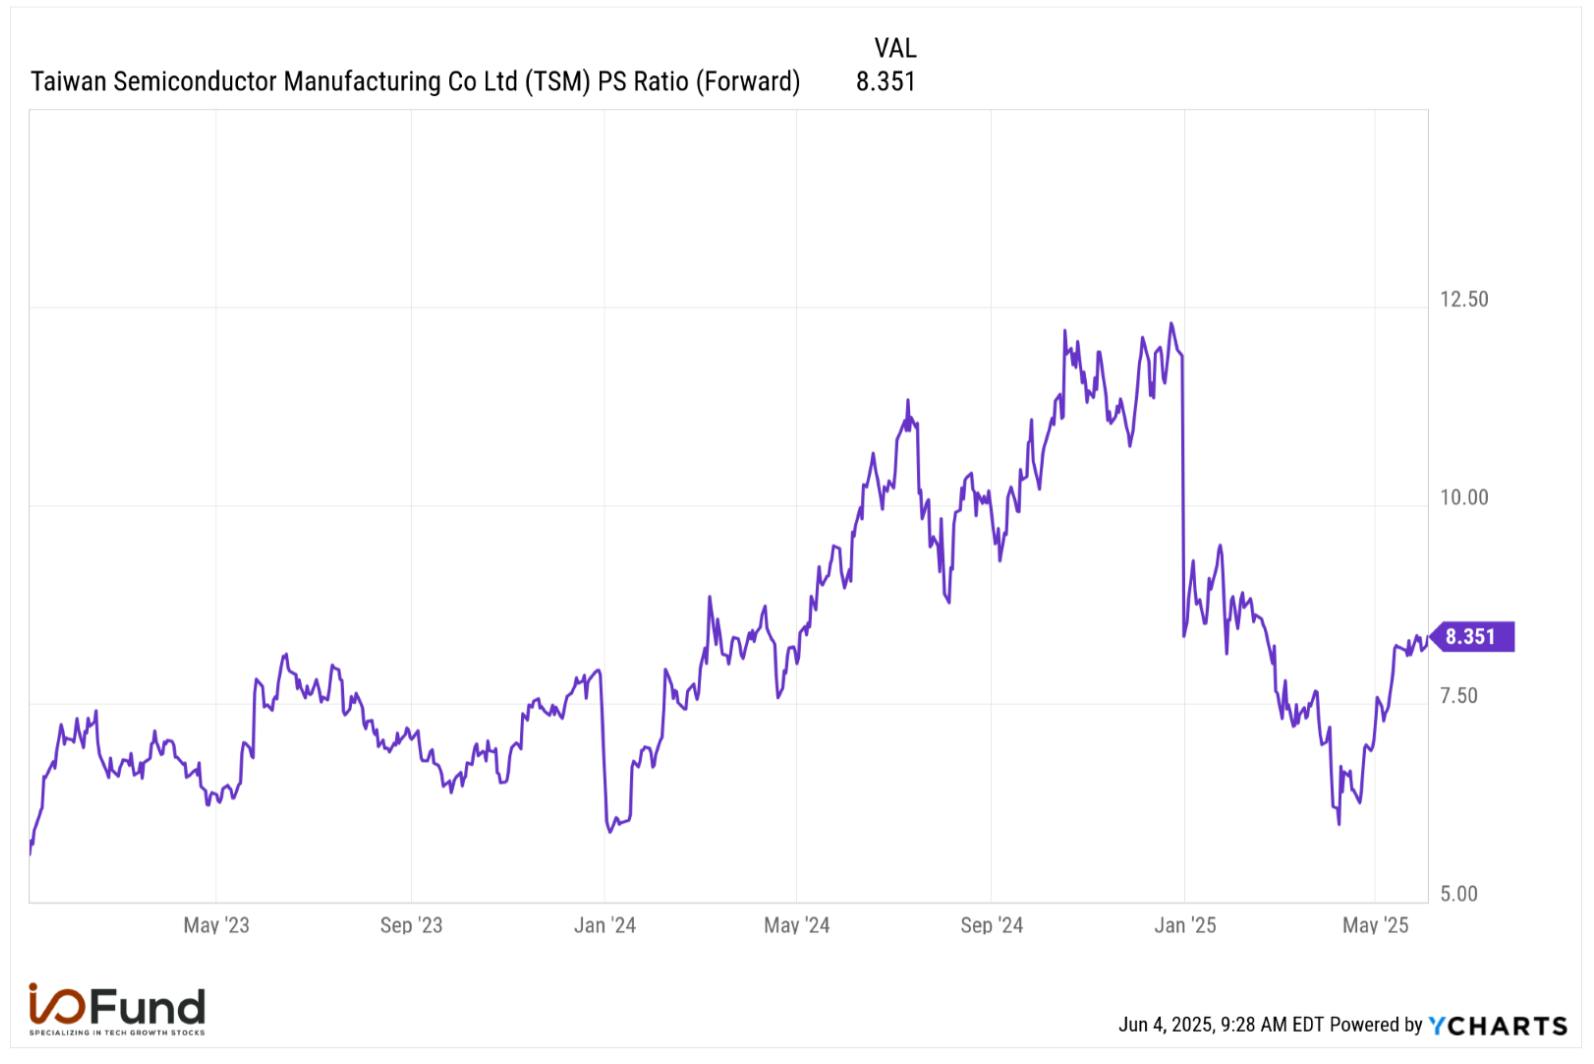
On a forward basis, the stock is trading at 8.3 — which essentially means the stock is fully valued unless a technical setup shows us the broad market, semiconductor baskets (ETFs) and/or other leaders like Nvidia are ready to resume leading the market. Rarely will we buy a stock that is at its 3-year or 5-year median unless there is broader participation. With that said, once there are signals that TSMC and a few other AI stocks are ready to lead again, we will not hesitate to buy as the stock is a safe, long-term winner in our opinion.   

A Few Simple Reasons we like TSMC as a Long-term Winner: 

  • Demand exceeds supply and will into the foreseeable future  
  • It’s one of the only companies that has strong pricing power – in fact, it exceeds Nvidia on this point. Reference my Q2 webinar around minute 13:32 
  • The margins and the cash separate it from other semiconductor choices 
  • The United States government will ensure TSMC is successful as a matter of global dominance 
  • One thing to watch out for: TSMC is exposed to smartphones and even with outsized AI demand, HPC segment can be lumpy and cyclical. The H2 slowdown that management guided for could put pressure on the stock.

Taiwan Semiconductor (TSM) Technicals Overview: 

By Knox Ridley 

Like the entire market, TSM is coming to the end of an impressive recovery off the April 7th lows. Note how price went vertical in early – mid May in the chart below. This happened with the highest amount of volume and momentum that we have seen in the bounce, so far.  What has followed is a continuation higher in price; however, with less volume and less momentum. This is a common occurrence toward the end of a trend. Furthermore, since late May, TSM has been trading within a rising wedge pattern, which is a common pattern seen in the last push higher of a trend.  

As long as TSM holds over $188, we can see a continuation of this drift higher throughout June.  Once we break below $188, we will see a reversal of this bounce. When this happens, what will be important are two factors on determining the next larger move in TSM, as well as the larger market: 

What is the pattern the correction takes? If we see a messy/overlapping drop that takes the shape a of a 3-wave pattern, then we believe TSM is setting up for a bigger push to new highs later into the year. If instead, we see a more aggressive/direct drop lower that takes the shape of a 5-wave pattern, we are setting up for a larger drop below the April 7th lows. 

Any drop, regardless of pattern, must hold over $146. Below this level, and the odds greatly favor that we are heading to new lows.  

Based on how the next correction plays out within the above parameters, there are two general scenarios that the price action best represents: 

Red – This would see the next drop taking the shape of a 5-wave pattern that ultimately breaks through $146. If this happens, we will see final targets for this drop to be, at least, in the $120s.  

Green – If we see the next drop take the form of a 3-wave drop that holds over $146, then we could be setting up for a rally toward the $300s.  

As stated, both fading momentum and volume, coupled with a filled-out pattern is suggesting that we are closer to the end of this bounce. Once it completes, the nature and depth of the correction will determine if we aggressively buy more or hedge our position.

Unlock Full Access to the I/O Fund

Pro Members receive access to the I/O Fund’s portfolio, deep-dive research on all portfolio stocks, and quarterly earnings kickoff webinars.

Advanced Market Signals Members get regular technical and broad market analysis, weekly webinars from Portfolio Manager Knox Ridley, our hedge signal, and real-time trade alerts.

Exclusive Offer for Existing Essentials Members:

Upgrade to the Advanced Annual Plan for just $599 and gain full access to everything above — including real-time trade alerts and our complete portfolio strategy.

To claim this limited-time offer or subscribe to the Advanced Plan, contact us at premium@io-fund.compremium@io-fund.com or email us to upgrade

Please note: The I/O Fund conducts research and draws conclusions for the Fund’s positions. We then share that information with our readers. This is not a guarantee of a stock’s performance. Please consult your personal financial advisor before buying any stock in the companies mentioned in this analysis.

Recommended Reading:
Taiwan Semiconductor: Building a Moat under Geopolitical Tensions

This article is a continuation of our free newsletter from May 23, Nvidia Stock Faces a Choppy Q2, But Tailwinds Build for H2 Acceleration

For our Premium Members, we discuss the following:  

  • Our analysis on the stock’s valuation and if the stock is a “buy” or a “hold” given the stock faces immense demand from the AI economy yet must also weather geopolitical tensions. 
  • The I/O Fund’s trading plan for TSMC including never-before published buy targets over a 12 to 18-month time frame.

TSMC’s Valuation: 

Historically, semiconductors do not trade at the valuations we saw in 2024. Therefore, the market is essentially saying (given the risks around China), we are not willing to pay the exuberant premium of 2024. Valuation is the primary reason most semiconductors are flat over a 1-year period.  

This is visible in TSMC’s forward PE ratio to where anything over 20 is quite rare. The 3-year median is 18.5 while the stock is trading at 21. The forward PE ratio peaked at 30. 

When you zoom out 10 years, the TTM PE ratio rarely trades over 25 except for the blowoff top in 2021 and the AI boom of 2024. 

When you look at the top line, something similar is seen to where the stock is trading at the 5-year median of 10 PS on a TTM basis. 

On a forward basis, the stock is trading at 8.3 — which essentially means the stock is fully valued unless a technical setup shows us the broad market, semiconductor baskets (ETFs) and/or other leaders like Nvidia are ready to resume leading the market. Rarely will we buy a stock that is at its 3-year or 5-year median unless there is broader participation. With that said, once there are signals that TSMC and a few other AI stocks are ready to lead again, we will not hesitate to buy as the stock is a safe, long-term winner in our opinion.   

A Few Simple Reasons we like TSMC as a Long-term Winner: 

  • Demand exceeds supply and will into the foreseeable future  
  • It’s one of the only companies that has strong pricing power – in fact, it exceeds Nvidia on this point. Reference my Q2 webinar around minute 13:32 
  • The margins and the cash separate it from other semiconductor choices 
  • The United States government will ensure TSMC is successful as a matter of global dominance 
  • One thing to watch out for: TSMC is exposed to smartphones and even with outsized AI demand, HPC segment can be lumpy and cyclical. The H2 slowdown that management guided for could put pressure on the stock.

Taiwan Semiconductor (TSM) Technicals Overview: 

By Knox Ridley 

Like the entire market, TSM is coming to the end of an impressive recovery off the April 7th lows. Note how price went vertical in early – mid May in the chart below. This happened with the highest amount of volume and momentum that we have seen in the bounce, so far.  What has followed is a continuation higher in price; however, with less volume and less momentum. This is a common occurrence toward the end of a trend. Furthermore, since late May, TSM has been trading within a rising wedge pattern, which is a common pattern seen in the last push higher of a trend.  

As long as TSM holds over $188, we can see a continuation of this drift higher throughout June.  Once we break below $188, we will see a reversal of this bounce. When this happens, what will be important are two factors on determining the next larger move in TSM, as well as the larger market: 

What is the pattern the correction takes? If we see a messy/overlapping drop that takes the shape a of a 3-wave pattern, then we believe TSM is setting up for a bigger push to new highs later into the year. If instead, we see a more aggressive/direct drop lower that takes the shape of a 5-wave pattern, we are setting up for a larger drop below the April 7th lows. 

Any drop, regardless of pattern, must hold over $146. Below this level, and the odds greatly favor that we are heading to new lows.  

Based on how the next correction plays out within the above parameters, there are two general scenarios that the price action best represents: 

Red – This would see the next drop taking the shape of a 5-wave pattern that ultimately breaks through $146. If this happens, we will see final targets for this drop to be, at least, in the $120s.  

Green – If we see the next drop take the form of a 3-wave drop that holds over $146, then we could be setting up for a rally toward the $300s.  

As stated, both fading momentum and volume, coupled with a filled-out pattern is suggesting that we are closer to the end of this bounce. Once it completes, the nature and depth of the correction will determine if we aggressively buy more or hedge our position.

Recommended Reading:

Taiwan Semiconductor Stock: AI Growth Amid Geopolitical Risk 

Despite their leadership, AI stocks like Taiwan Semiconductor and Nvidia are flat year-to-date and trading at similar levels as June 2024. Clearly, the AI trade is not as straightforward as it might seem. Taiwan Semiconductor, in particular, sits at the center of geopolitical tensions — yet those tensions tend to surround companies with deep IP in the AI economy. What makes this economy so distinct is not just the extraordinary commercial demand, but also its rare, historical role in shaping global alliances (and adversaries). 

Investors are confronted almost daily with friction between the U.S. and China — and at the center of it all is one stock: Taiwan Semiconductor (TSMC). While enthusiasm around AI demand remains strong, assuming it will simply override geopolitical headwinds is overly optimistic. Onshoring a supply chain like TSMC’s takes years, yet markets can react to a negative headline in seconds. 

Headlines aside, the bigger picture is that TSMC is deepening its moat with advanced nodes, such as N2 and A16. The company already powers tens of trillions in market cap on the stock market when you consider Apple, Nvidia, Broadcom, Amazon, AMD and Google are customers of TSMC. Essentially, all mega cap stocks have an AI strategy spanning merchant GPUs and custom silicon, and of course, software – yet the common denominator to these strategies is they all funnel into TSMC. 

The problem my firm helps with is this — how does an investor ride out the inherent cyclical nature of semiconductors given the powerful, secular trend of AI? For every stock that becomes a multi-generational winner, there are dozens that never reclaim their all-time highs. The cloud sector for example, is becoming an all-time high graveyard with once-upon-a-time Wall Street darlings trading meaningfully below their ATHs for over three years now. 

TSMC will very likely push beyond its ATH yet returns can increase meaningfully if an investor has the guts to buy during a steep selloff. Other times, that selloff isn’t coming and it’s best to buy before a breakout. We answer these complex questions in the analysis below. 

TSMC’s Advanced Nodes have Created a Competitive Moat 

The most advanced node shipping today is the 3nm, offering 15% better performance than the 5nm process when power level and transistors are equal. The die sizes are an estimated 42% smaller than the 5nm and TSMC also states the 3nm process can lower power consumption by as much as 30%.  

Power efficiency is a major advantage, helping to deepen TSMC’s moat. Samsung was first to introduce 3nm process chips in 2022 yet has not been as competitive on yield and power efficiency at a roughly 10% to 20% difference compared to TSMC. The moat is visibly seen in TSM’s pricing power with the dominant foundry charging 25% more for its 3nm process compared to its 5nm process, and customers are willing to forego Samsung to pay the higher pricing.  

Last year, companies such as Apple, Nvidia, AMD and Intel committed to working with TSMC for its 3nm process, and eventually Google and Qualcomm left Samsung “after careful consideration” to also secure a partnership with TSMC.  

This was an important moment for TSMC to complete its near-monopoly in advanced nodes as Google had been outsourcing its Tensor processors to Samsung’s foundry for four generations, before moving to TSMC for the fifth generation. Qualcomm also switched to TSMC from Samsung for the Snapdragon 8 Gen 4 series. 

To attract these large customers with different end markets, TSMC offers a few 3nm processes, such as the N3E, N3P and N3X. This allows a company like Apple to customize the 3nm chips differently than AI chips for hyperscalers. N3E is the baseline for IP design with 18% increased performance and 34% power reduction, N3P has higher performance and lower power consumption, whereas the N3X will offer high-performance computing very high performance but with higher power leakage. 

To illustrate the near monopoly that TSMC has over other foundries, consider that its market share stands at 67.1%, up 2.4% QoQ in Q4. Meanwhile, second-place Samsung was at 8.1% down from 9.1% for a lead of 59 points.  

When comparing revenue, TSMC reported $26.85 billion in Q4 for a 14.1% increase compared to Samsung’s $3.26 billion, which declined 100 basis points to 8.1%.  

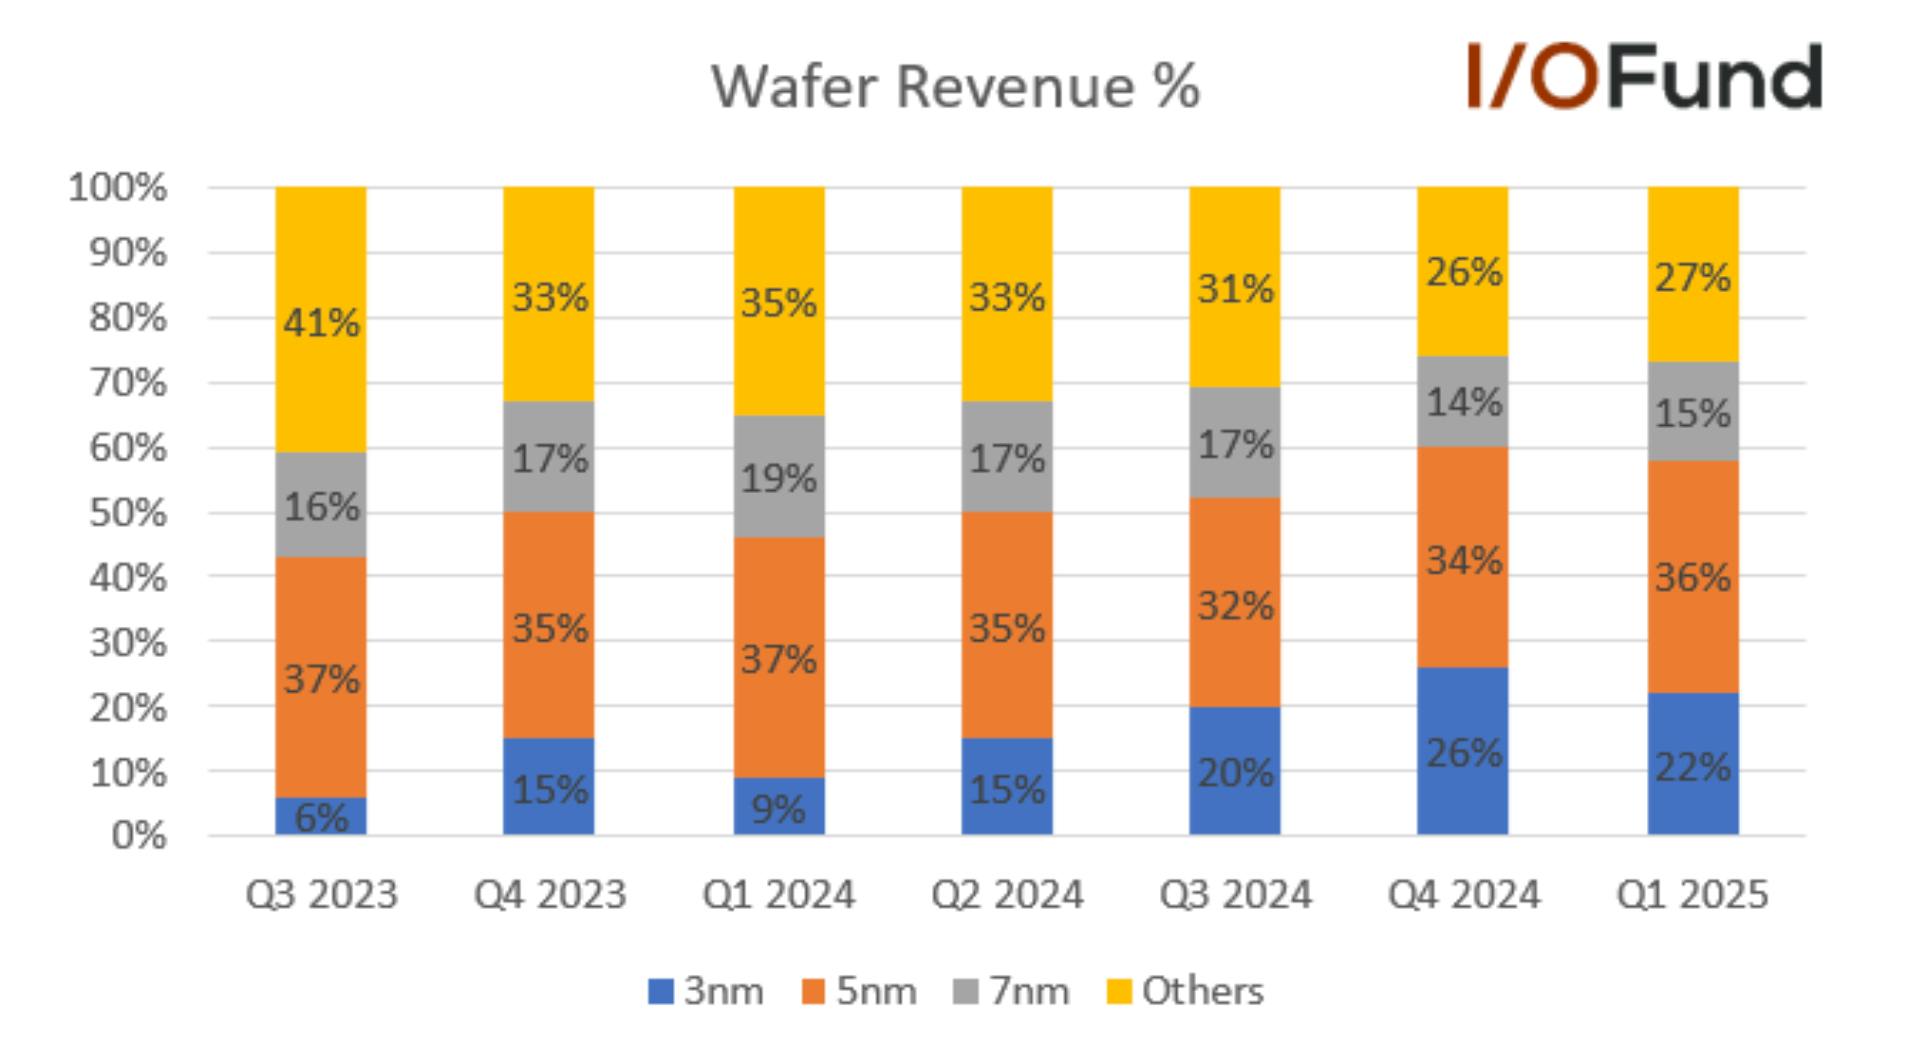
In the latest quarter, advanced nodes below 7nm drove 73% of wafer revenue with 3nm contributing 22% of revenue and 5nm representing 36% of revenue. Nvidia is not on the 3nm process yet for its Blackwell shipments, thus 5nm is outsized in terms of its market share.

TSMC 3nm revenue surpasses 20%, up from 9% year-over-year

Pictured Above: 3nm revenue for TSMC has ramped quickly, up from 9% in the year ago quarter and in its third consecutive contributing >20% of revenue. 

TSMC’s 2nm Nanosheet Transistors (Gate All-Around) 

Looking ahead, 2nm is expected to see volume production in the second half of 2025 with a more advanced iteration called N2P scheduled for volume production in the second half of 2026. The 2nm marks a new era in TSMC's transistor architectureas N3 relied on FinFET while gate-all-around (GAA) is being introduced for N2. As the name implies, the gate is wrapped around on all sides compared to FinFET which had a gate wrapped on three sides. By having the gate wrap “all-around,” a greater surface is created for better electrostatic control and to also reduce leakage.  

For TSMC, the 2nm will feature NanoFlex technology, which is similar to FinFlex to where designers can use cells from different libraries. However, due to the new gate-all-around (GAA) nanosheet transistors, there are additional benefits, such as customizing the width and height of cells. For example, GAA can uniquely widen the channels for a performance boost, or there is an option to narrow the channel to optimize power cost. The goal is to increase the performance-per-watt to enable higher levels of output and efficiency.  

According to management on the earnings call: “N2 will deliver full-node performance and power benefits with 10% to 15% speed improvement at the same power or 20% to 30% power improvement at the same speed and more than 15% chip density increase as compared with N3E.” 

Similar to the 3nm, there will be a few variants of the 2nm chip for customers to optimize performance with power requirements. The first two years of the 2nm ramp is outpacing the 3nm and 5nm ramp, signaling good things to come for TSMC. 

TSMC Stock will Close out the Decade with Pricing Power 

As a growth investor, it certainly doesn’t hurt to keep an eye on the horizon. A16 is the 1.6nm process node that will emphasize backside power delivery. Our firm first covered this topic last year in the analysis: “Taiwan Semiconductor Stock: April Sales Soar From Advanced Nodes" stating the Angstrom era will translate to “future process generations where the nodes are not smaller necessarily, rather the transistors they’re built with will be improved upon.”  

For the A16, the Super Power Rail (SPR) backside delivery will offer a redesign to where power routing is moved from the front to the back, which allows for the signaling on the front side to have lower latency. By reducing voltage drop, SPR becomes attractive for AI workloads since multiple cores are operating at high speeds with complex signal routes and dense power requirements.  

Intel’s PowerVia is first to market with the backside power delivery design, yet TSMC’s design will likely result in higher yields and volume production. TSMC also connects the backside power delivery to each transistor’s source and drain, which is more expensive yet also more efficient compared to Intel’s approach. 

The A14 is due out in 2028 and will offer a significant breakthrough in performance while offering up to 25% to 30% lower power consumption, with increased density of 20% to 23%. There will be an A14 variant that offers backside power delivery in 2029. It's expected that A14 will help to drive forward edge AI due to a combination of speed improvements and power reduction. Pricing for the A14 is expected to increase from $30,000 per wafer for the 2nm process to $45,000 per wafer as we close out the decade.  

TSMC to Grow Revenue Mid-20%; AI Accelerator Revenue will Double 

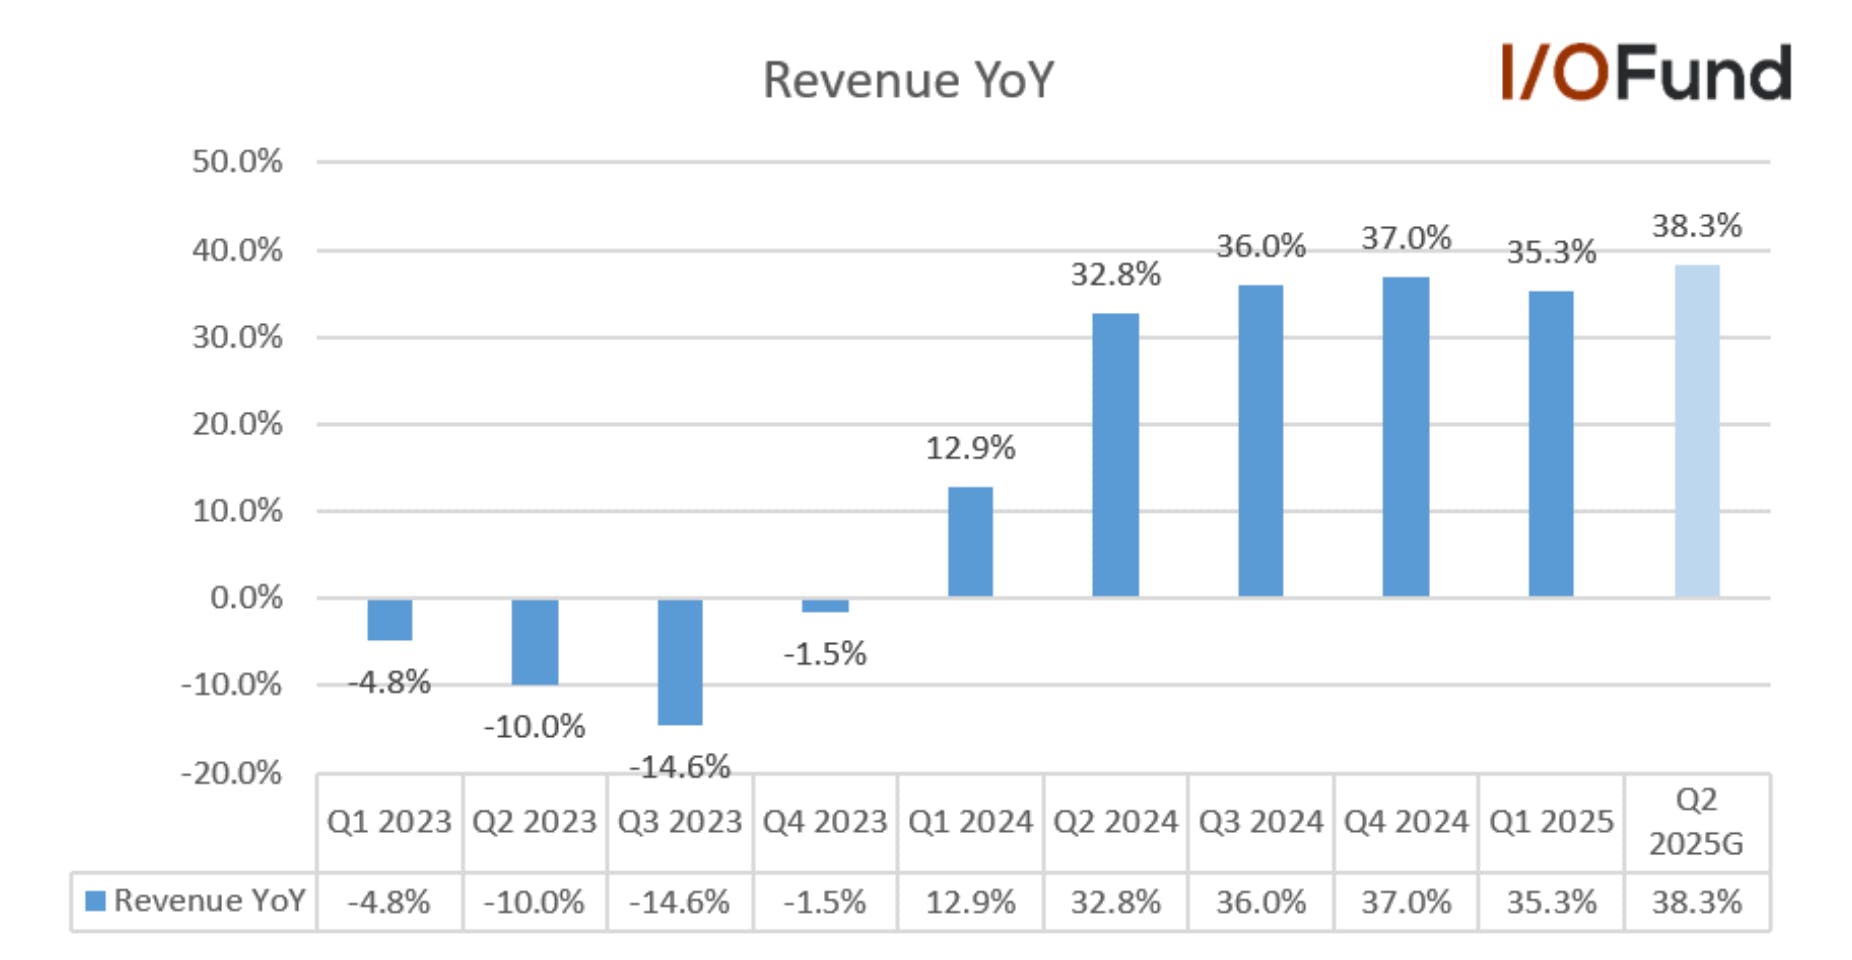
The company is off to a good start for the year with revenue growth of 35.3% YoY while guiding for an acceleration to the 38% range in Q2.  Revenue was down (5.1%) sequentially, impacted by smartphone seasonality, partially offset by AI-related demand growth. However, the Q2 guide represents 13% QoQ growth with revenue between $28.4-29.2 billion.  

TSMC offers monthly reports with April starting Q2 off strong as monthly revenue surged 48.1% YoY and 22% MoM to ~$11.55 billion, with Bloomberg stating the outperformance could be due to a rush in pre-tariff ordering, although certainly 3nm and 5nm demand helped as well.  

TSMC earnings: strong H1 growth, slower H2 outlook

TSMC earnings show strong growth in H1 followed by lower growth in H2. 

This year, IDC is forecasting Foundry 2.0 will grow by 11% compared to 6% last year. Foundry 2.0 describes a broader range of foundry technologies, with the foundry segment expected to grow 18% down from 20% last year.  

Regardless of which way you dice it, TSMC is guiding for above industry growth, stating in the most recent quarter: “we continue to expect our full-year 2025 revenue to increase by close to mid-20s percent in U.S. dollar term.”  

Of this, AI accelerator revenue is expected to double in 2025 and management also forecasts AI to grow at a mid-40% CAGR for five years from 2024: “Based on our planning framework, we are confident that our revenue growth from AI accelerators will approach a mid-40s percentage CAGR for the next five years period starting from 2024.” 

Slower Growth Up Ahead with H1 > H2 

An area of concern is that TSMC is guiding a slowdown in the second half of the year, given the mid-20% revenue growth is below Q1/Q2 revenue growth of 35% to 38%.  

There was a question on the call about this from analyst Charlie Chan asking: “And also based on your full-year guidance, so called the mid-20%, it seems like second half recovery will be very, very gradual or flattish. So I'm wondering if you're already bake in kind of consumer tech demand impact. And if a tariff have some kind of turnaround, right, meaning, for example, major smartphone brands whether there's a chance for you to revise your full-year revenue guidance? Thank you.”

Management answered the H2 weak guide is due to uncertainty and tariffs: “Charlie, as we also said in the prepared remarks, there are uncertainties and potential risk from tariffs exist.”

Analysts are a bit concerned about the full-year guide given the risks key customers are facing from April’s tariff shocks. JPMorgan analysts say TSMC “could pare [its forecast] slightly to target low- to mid-20%” sales growth, while Deutsche Bank analysts raised the concern that the chipmaker “may also withdraw its guidance as customers adjust to tariffs.”    

Management also stated that things are more “balanced now” — meaning demand is not overwhelming supply like it once did: “Brett, three months ago. Now I can tell you that three months ago, we are barely – we just cannot supply enough wafer to our customer. And now it's a little bit balanced, but still the demand is very strong. And you are right. Other than China, the demand is still very strong, especially in U.S. And so we are confident that we are going to double our AI revenue this year.” 

Echoing these comments, if we look at the segments listed below, we can see that smartphones are reporting higher seasonal weakness than last year. 

TSMC Reports Strength in HPC offset by Smartphones 

HPC Revenue rose 7% QoQ 

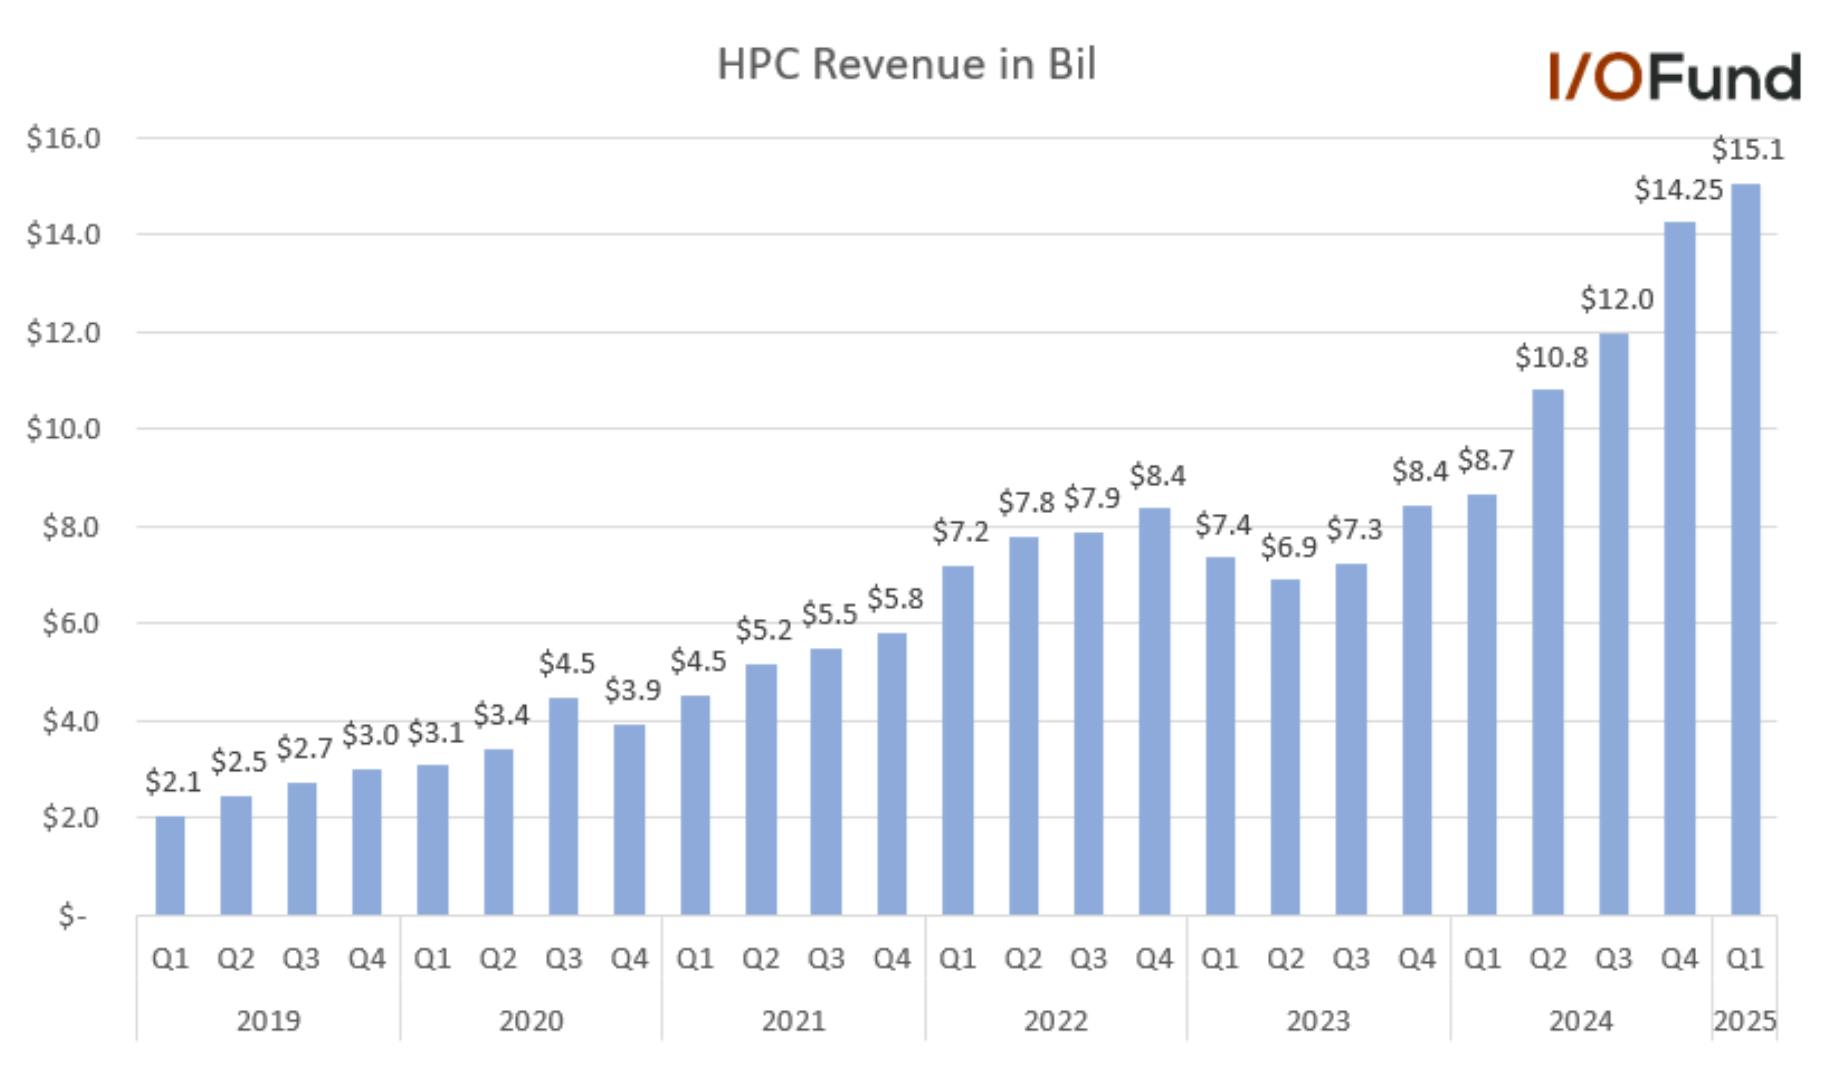
TSMC continues to ride AI accelerator tailwinds, evident in its rising HPC revenue and mix. HPC revenue rose 7% QoQ in Q1, surpassing $15 billion for the first time. HPC accounted for 59% of TSMC’s revenue, expanding from 53% of revenue last quarter.

Top tech firms drive TSMC AI chip growth via HPC segment

Pictured above: Major tech companies choose TSMC for AI chips, visible in its HPC segment 

Management stated that they “continue to observe robust AI-related demand from our customers,” and reaffirmed that AI accelerator (GPU + ASIC + HBM) revenue is expected to double YoY in 2025. As stated, management also confidently forecast AI accelerator revenue to grow at a mid-40% CAGR over the next five years starting in 2024. 

Smartphones Declined 22% QoQ: 

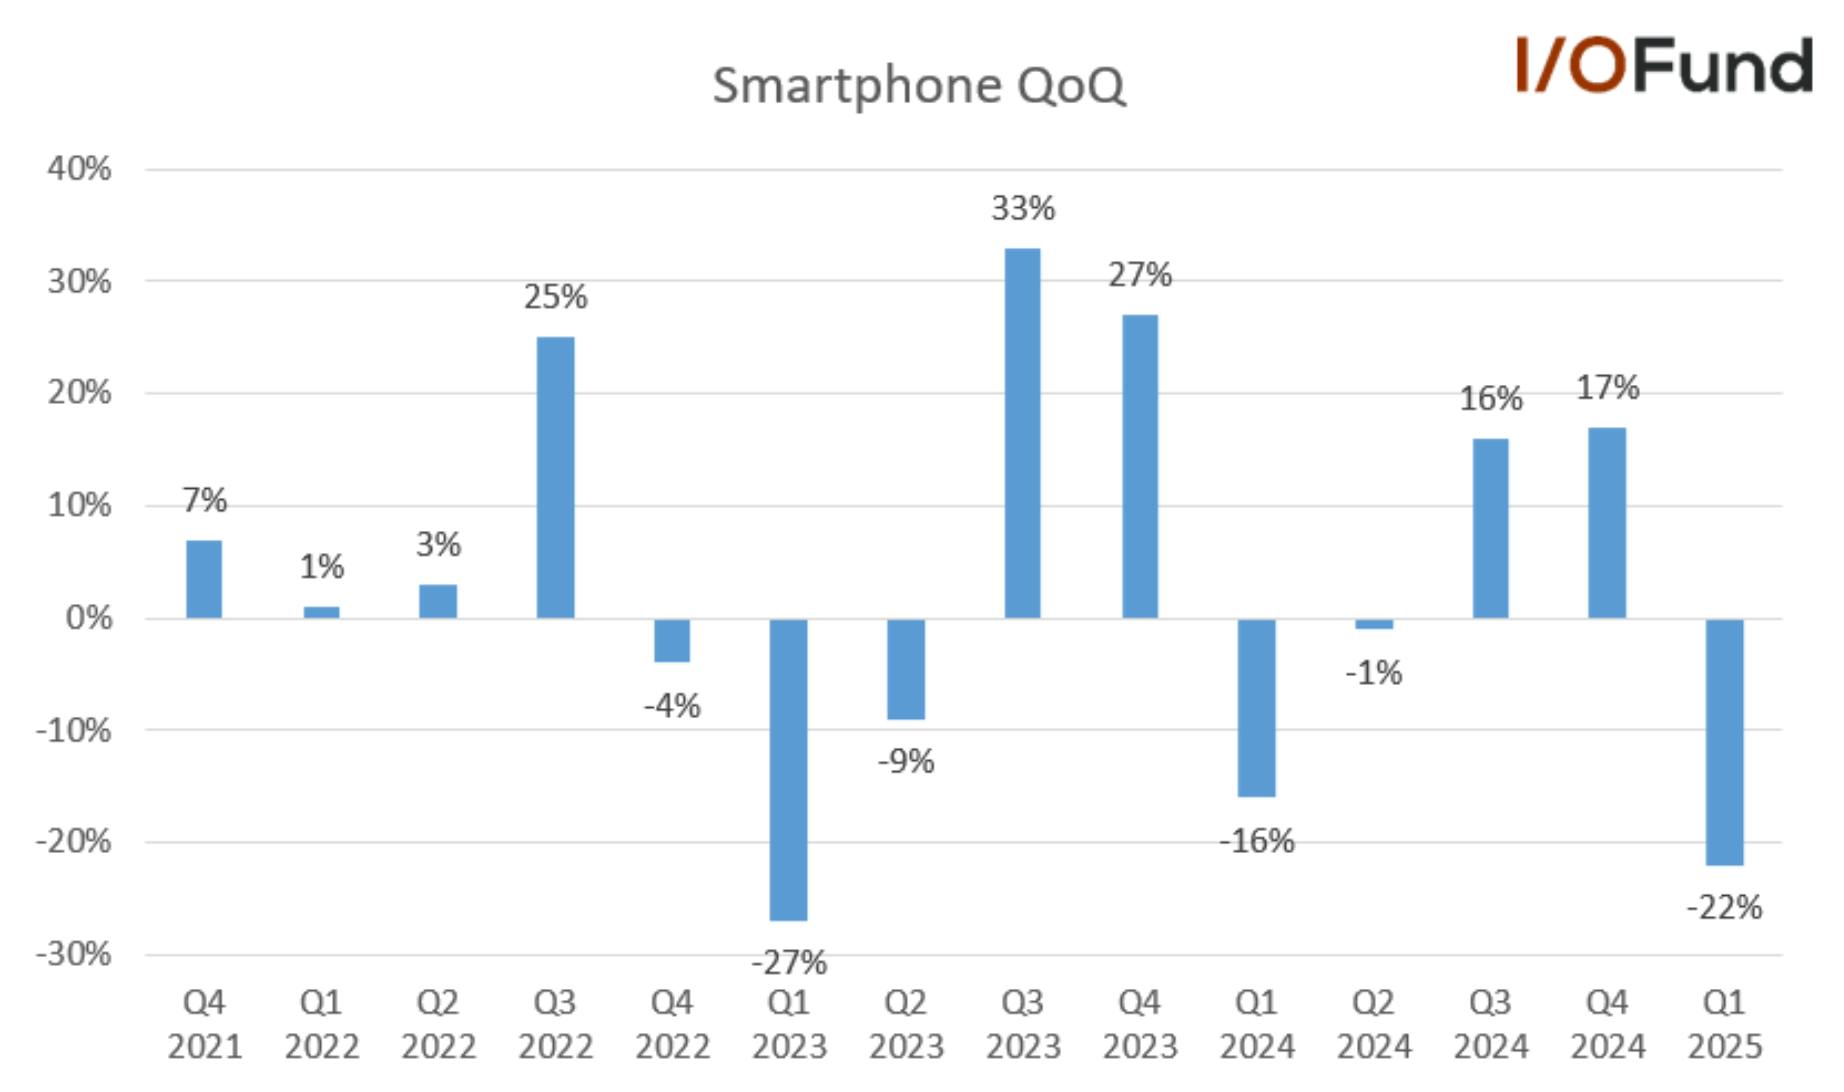
Smartphone revenue declined (22%) QoQ due to seasonal trends, accounting for 28% of revenue in Q1. This was larger than last year’s (16%) seasonal decline.

TSMC sees increased seasonal weakness in smartphone segment

TSMC is reporting higher seasonal weakness in the smartphone segment compared to last year. 

IoT, Auto and Other: 

IoT revenue declined (9%) QoQ to account for 5% of revenue, while Automotive revenue increased 14% QoQ to also account for 5% of revenue. Digital Consumer Electronics increased 8% QoQ to account for 1% of revenue, while Other revenue rose 20% QoQ to account for 2% of revenue. 

Gross Margin to See 3% to 4% Headwind  

Margins came in at the higher end of guidance in Q1, with TSMC seeing continuing strength in Q2.  

  • Gross margin was 58.8%, at the high end of management’s guided range for 57-59%, dipping slightly sequentially from the January earthquake impacts and the ramp of the Kumamoto fab. On a YoY basis, gross margin expanded 5.7 points. 
  • Operating margin was 48.5%, at the high end of the guided 46.5-48.5% range.  
  • Net margin was 43.1%, flat with Q4 and up 3.1 points YoY. 

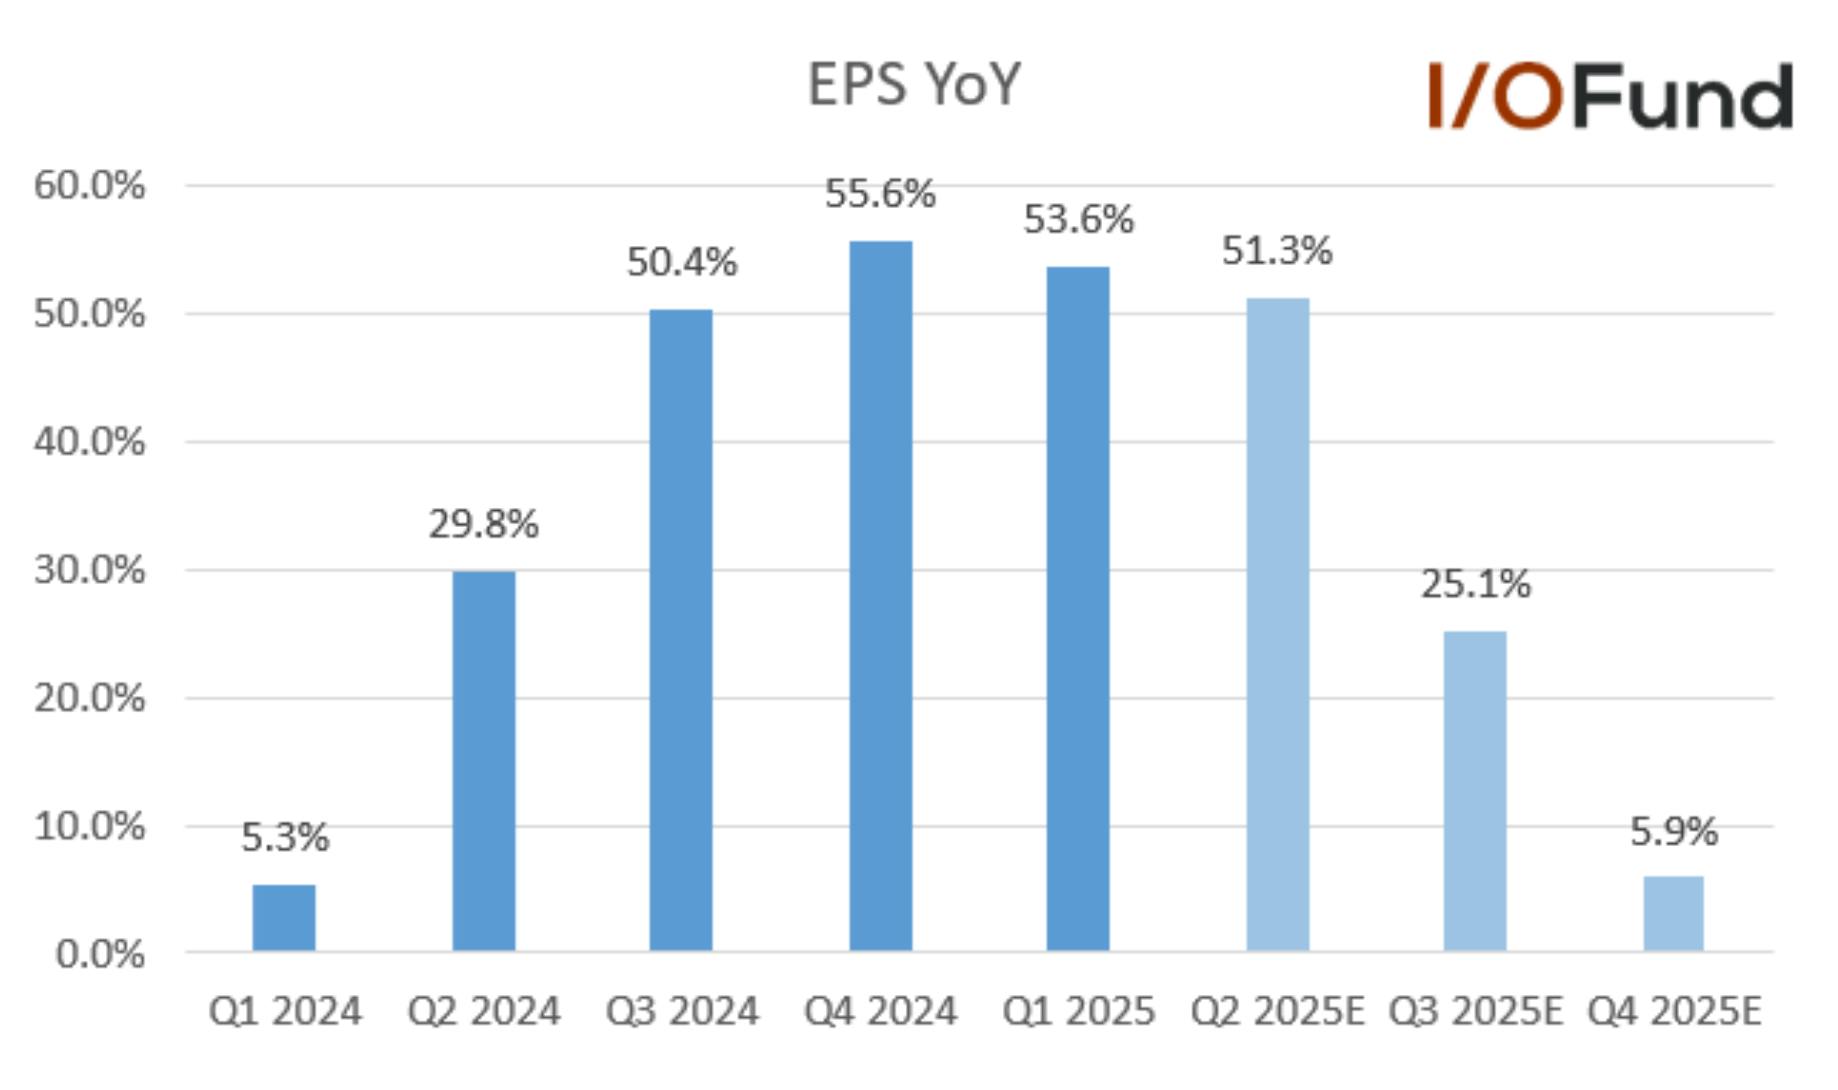
TSMC delivered nearly 54% YoY growth in EPS in Q1 as it delivered a slight beat to $2.12, its third straight quarter with EPS growth above 50% YoY. This growth also reflects TSMC’s operating leverage, outpacing revenue growth in the mid to high-30% range.

TSMC Q1 EPS up 53.6%, but growth expected to plateau later in the year

In Q1, TSMC reported strength on the bottom line with EPS growth of 53.6% although EPS will face tough comps with growth plateau’ing toward the end of the year. 

For Q2, EPS growth is expected to maintain this >50% growth rate to $2.24, before decelerating rather sharply to the mid-single digits by Q4 as it begins to lap these more difficult 50% growth comps. 

FY25 EPS is currently expected to increase 31.5% YoY to $9.26, before decelerating to 15.2% growth in FY26 to $10.66. 

For Q2, TSMC guided for similar gross and operating margin ranges, but flagged some headwinds from the fabs buildout. However, a larger headwind exists – FX. TSMC’s guidance below assumes an exchange rate of US$1 to NT$32.5, yet the current rate sits at US$1 to $NT30.1, down nearly 8% from the guided level.  

  • Gross margin is forecast at 57-59%, down 0.8 points sequentially at midpoint as dilutive impacts from ramping the Arizona fab kicks in. Management added that overseas fab impacts are expected to grow more pronounced throughout the year, forecasting 2-3% dilutive impact for the full year from Arizona and Kumamoto. 
  • Operating margin is forecast at 47-49%, down 0.5 points sequentially at midpoint. 

Over the next five years, management sees the dilutive impact from ramping its overseas fabs widening, projecting it to start at 2-3% each year in the early ramp stages before widening to 3-4% each year. Despite this, TSMC remains confident in its ability to keep long-term gross margins at 53% or higher.  

$100B Investment Announced for Arizona Fabs 

In the recent quarter, the company’s cash flow increased 37% YoY to $19.0 billion, for a 74.5% margin, a slight YoY expansion. Capex was $10.1 billion in Q1, down more than 10% QoQ but up more than 74% YoY. Cash and equivalents rose $7.5 billion sequentially to $81.4 billion, while debt is $30.4 billion. 

In March, TSMC announced a new $100 billion investmentto expand manufacturing in the United States. The $100 billion will go toward building new fabs in Arizona bringing TSMC’s total investment in the United States to $165 billion. Once the new fabs are built, 30% of TSMC’s advanced nodes capacity will be located in Arizona.  

TSMC’s current Arizona fabs began producing chips this year, with Apple being the first to receive chips on the 4nm/5nm process and Nvidia receiving chips later this year. In addition, it’s been reportedthe 2nm process is seeing a 90% yield for memory products in the newer Arizona fab.  

Notably, due to rising costs, there are rumors that TSMC will raise prices from the Arizona fab by 30%. 

Subscribe for Full Access to the Article 

Below the Paywall is the Following information  

  • Our analysis on the stock’s valuation and if the stock is a “buy” or a “hold” given the stock faces immense demand from the AI economy yet must also weather geopolitical tensions. 
  • The I/O Fund’s trading plan for TSMC including never-before published buy targets over a 12 to 18-month time frame.
    Sign Up to Continue ReadingSign Up to Continue Reading

Paid subscribers, click here to view the full articleclick here to view the full article

Not ready to subscribe but want more thoughtful analysis from a top-performing team in tech? Every week, we publish free research. 👉 Sign up here.

For any account-related issues, please contact our customer support team at premium@io-fund.com.

Please note: The I/O Fund conducts research and draws conclusions for the Fund’s positions. We then share that information with our readers. This is not a guarantee of a stock’s performance. Please consult your personal financial advisor before buying any stock in the companies mentioned in this analysis.

Recommended Reading:
Dell Riding Nvidia’s Tailwinds to Record $12.1B in AI Server Orders in Q1

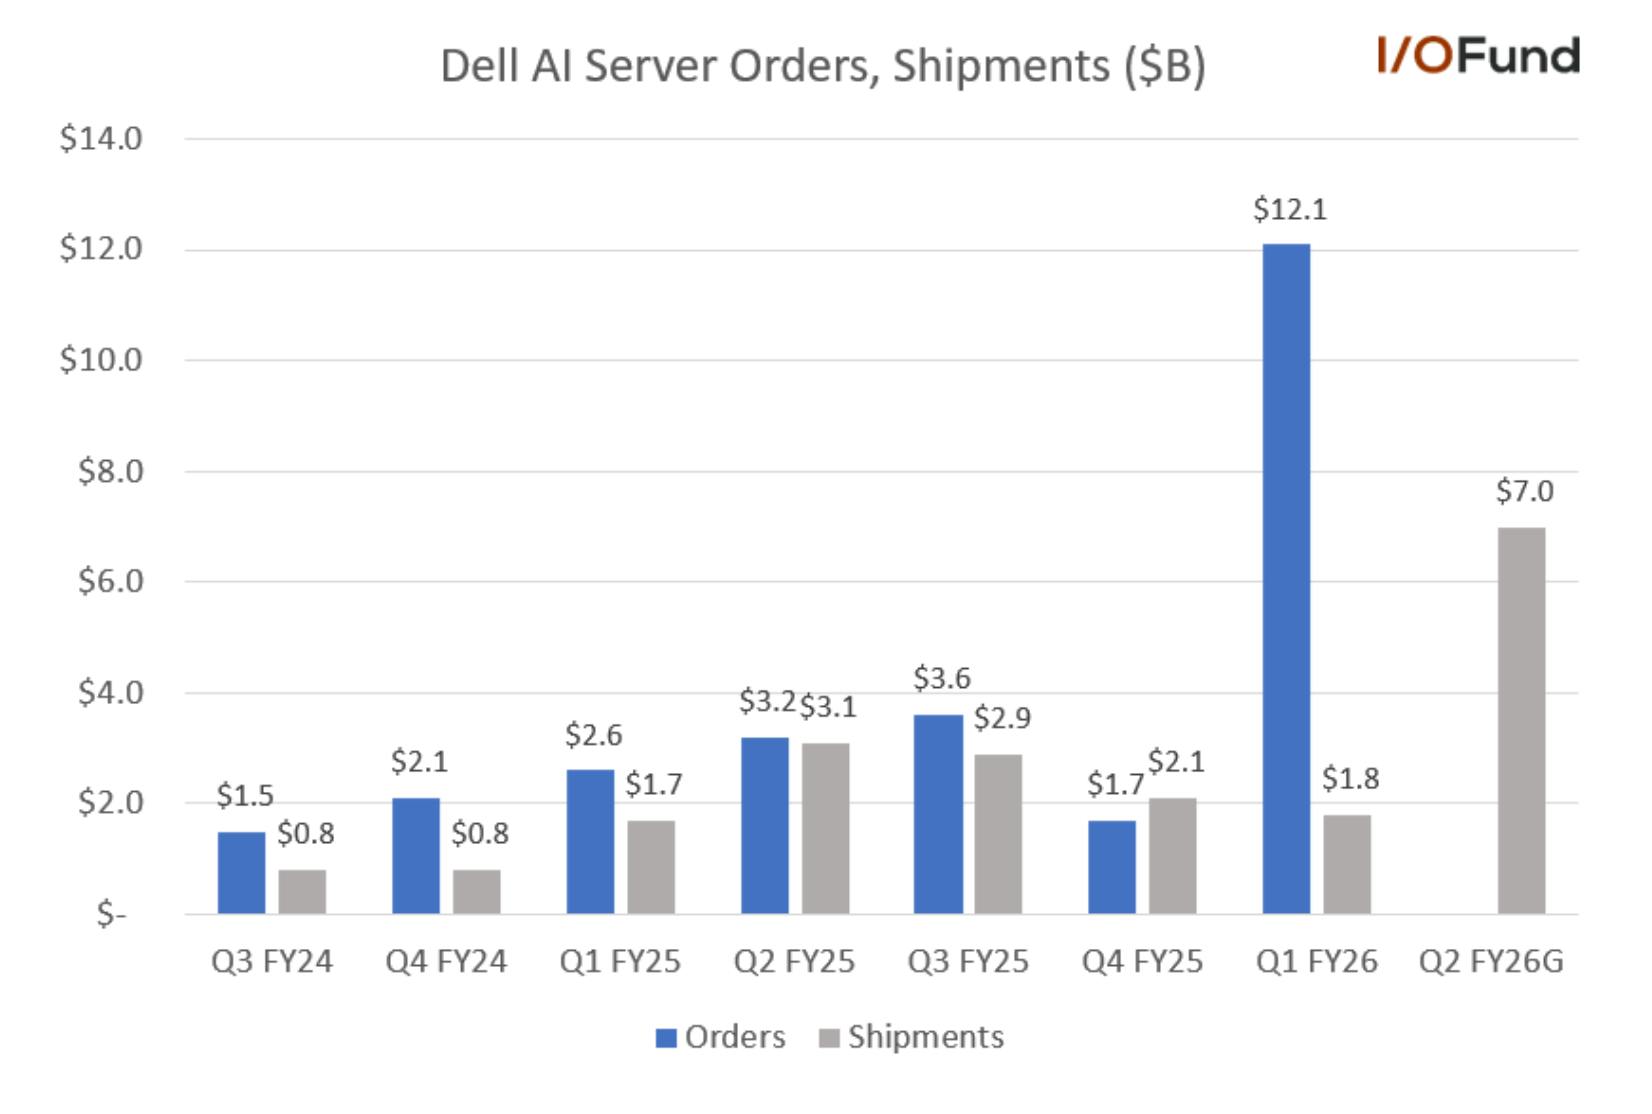
Dell reported surging demand in AI optimized servers in Q1 with orders of $12.1 billion. This outpaces the entirety of last year while representing a 612% sequential increase from $1.7B last quarter. To further compare, the peak quarter for orders last year was $3.6B. 

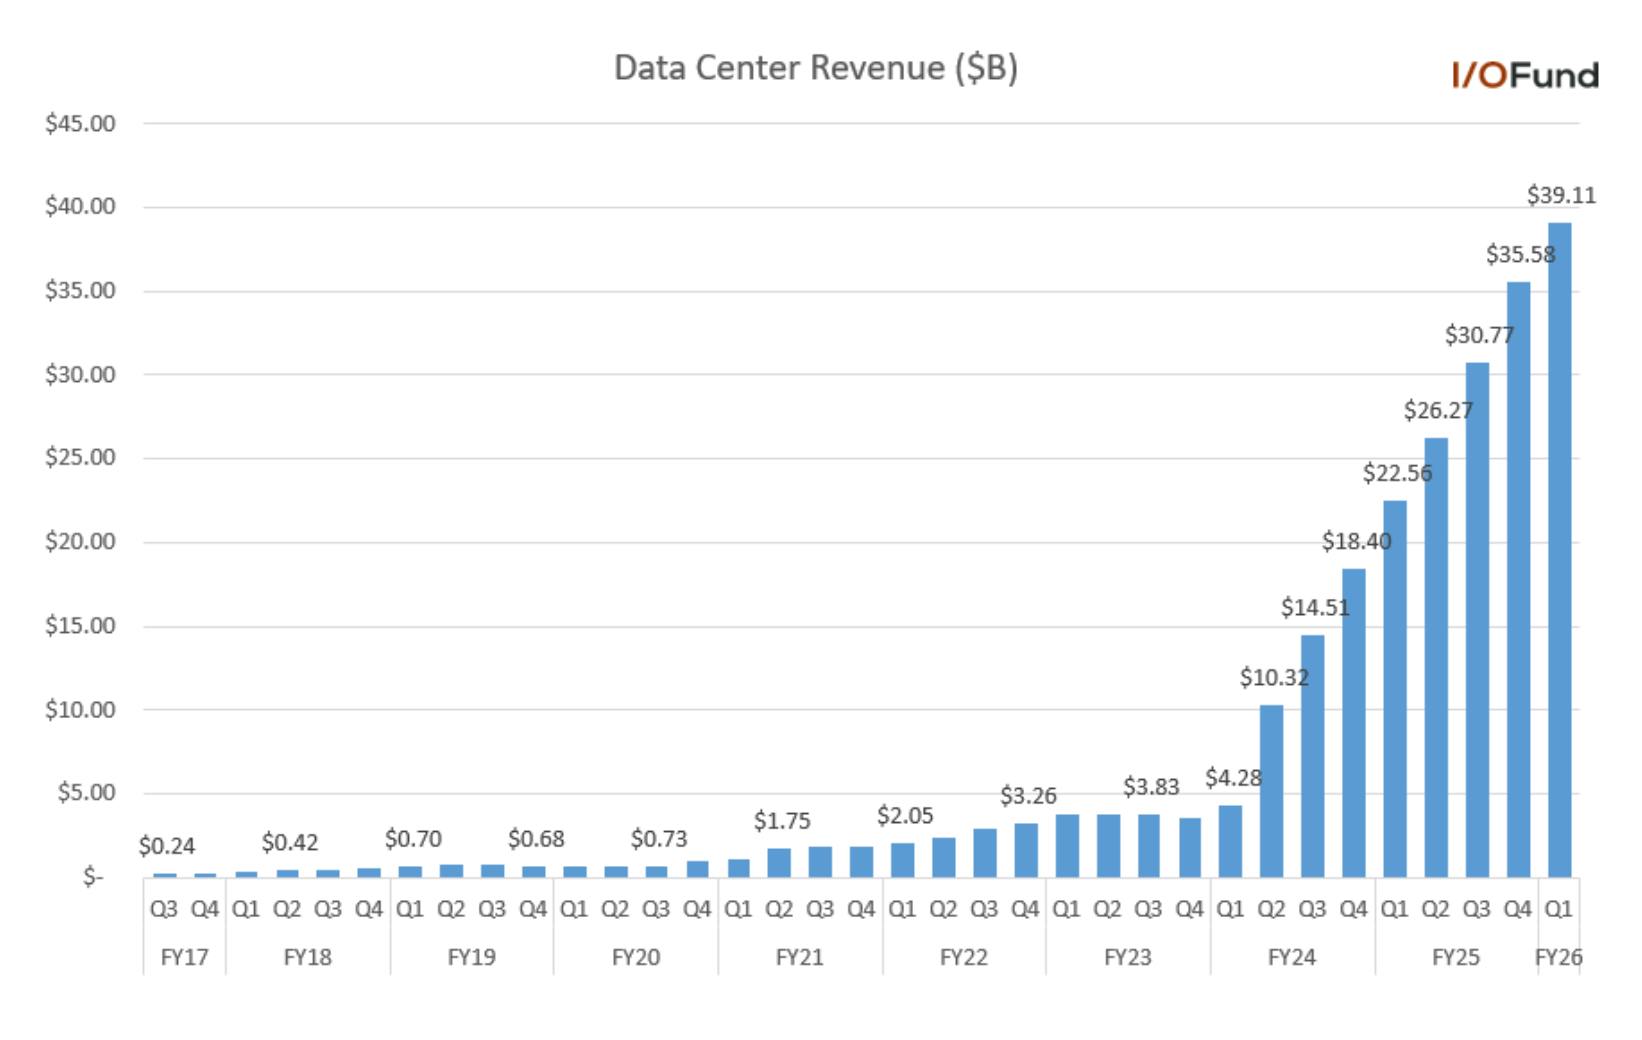
Server shipments were low in Q1, which has readthrough to Blackwell as all around Q1 was slow for Blackwell servers. Server shipments were guided to be nearly 4x higher sequentially in Q2. Check out the graph below for the sudden inflection point from this quarter in terms of server growth. 

This strong AI server shipment forecast contributed to a nearly $4 billion beat for Q2’s guidance. Notably, Dell did not raise its revenue forecast for the year, suggesting that tariff-related impacts may still bite in H2, or that AI server shipments will be lumpy and not be linear from here out. 

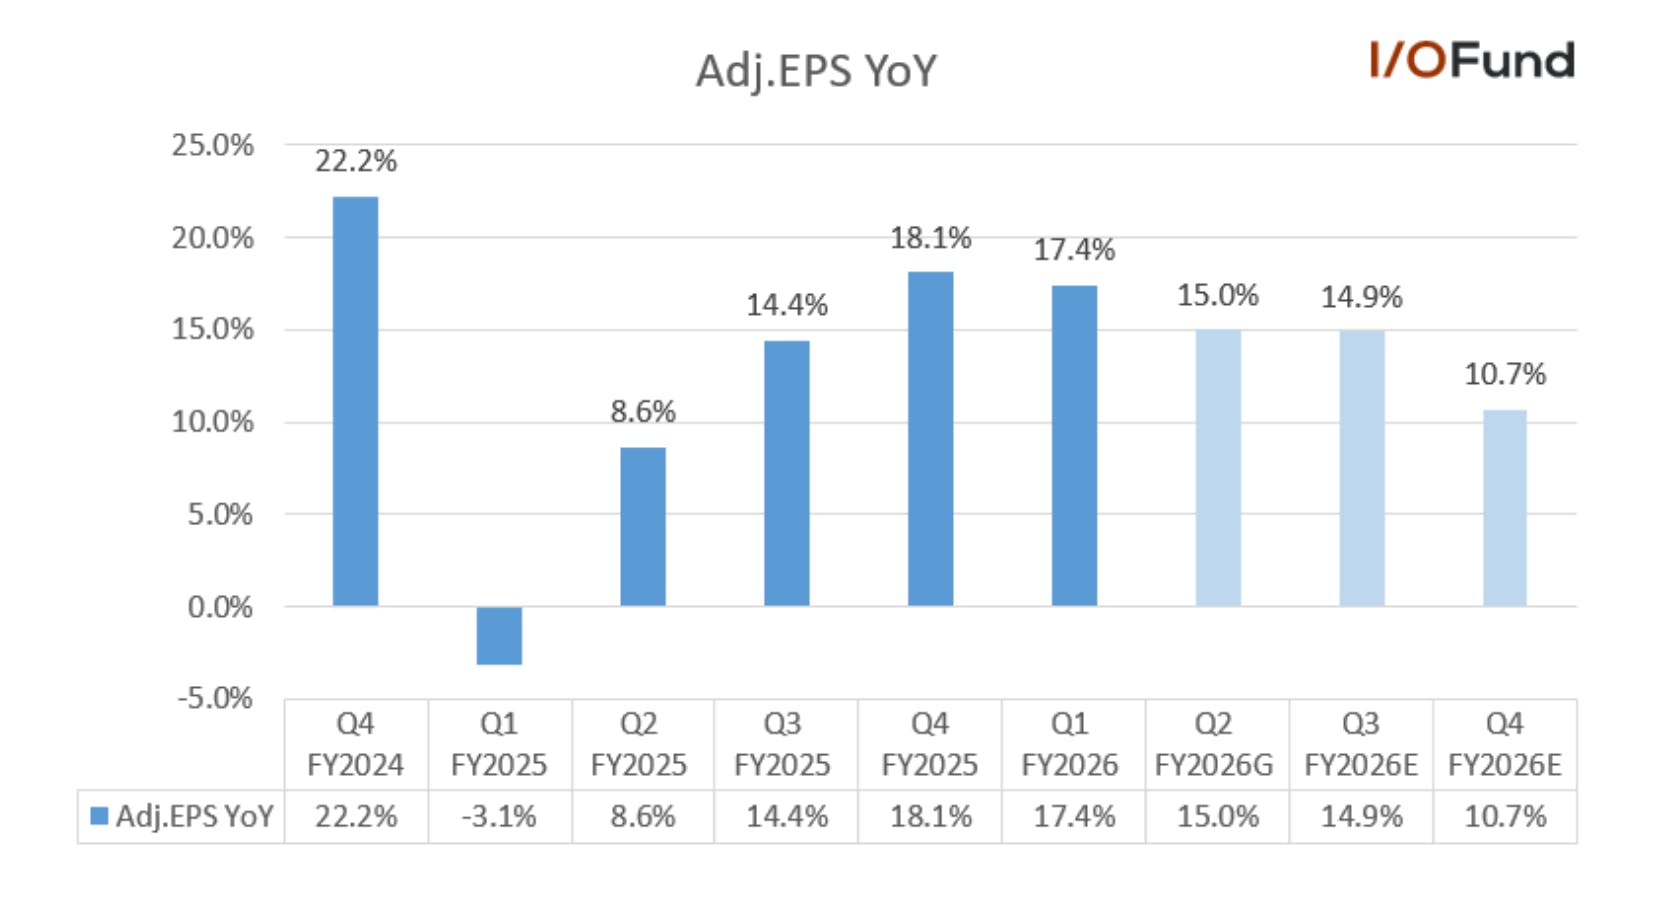
Cash flows improved significantly in Q1, with strong triple-digit YoY growth for both operating and free cash flow. Adjusted EPS missed consensus estimates by more than 8%. Despite misisng estimages, EPS increased 17% or 3X faster than revenue.  

Revenue Growth to Accelerate 11 Points in Q2 

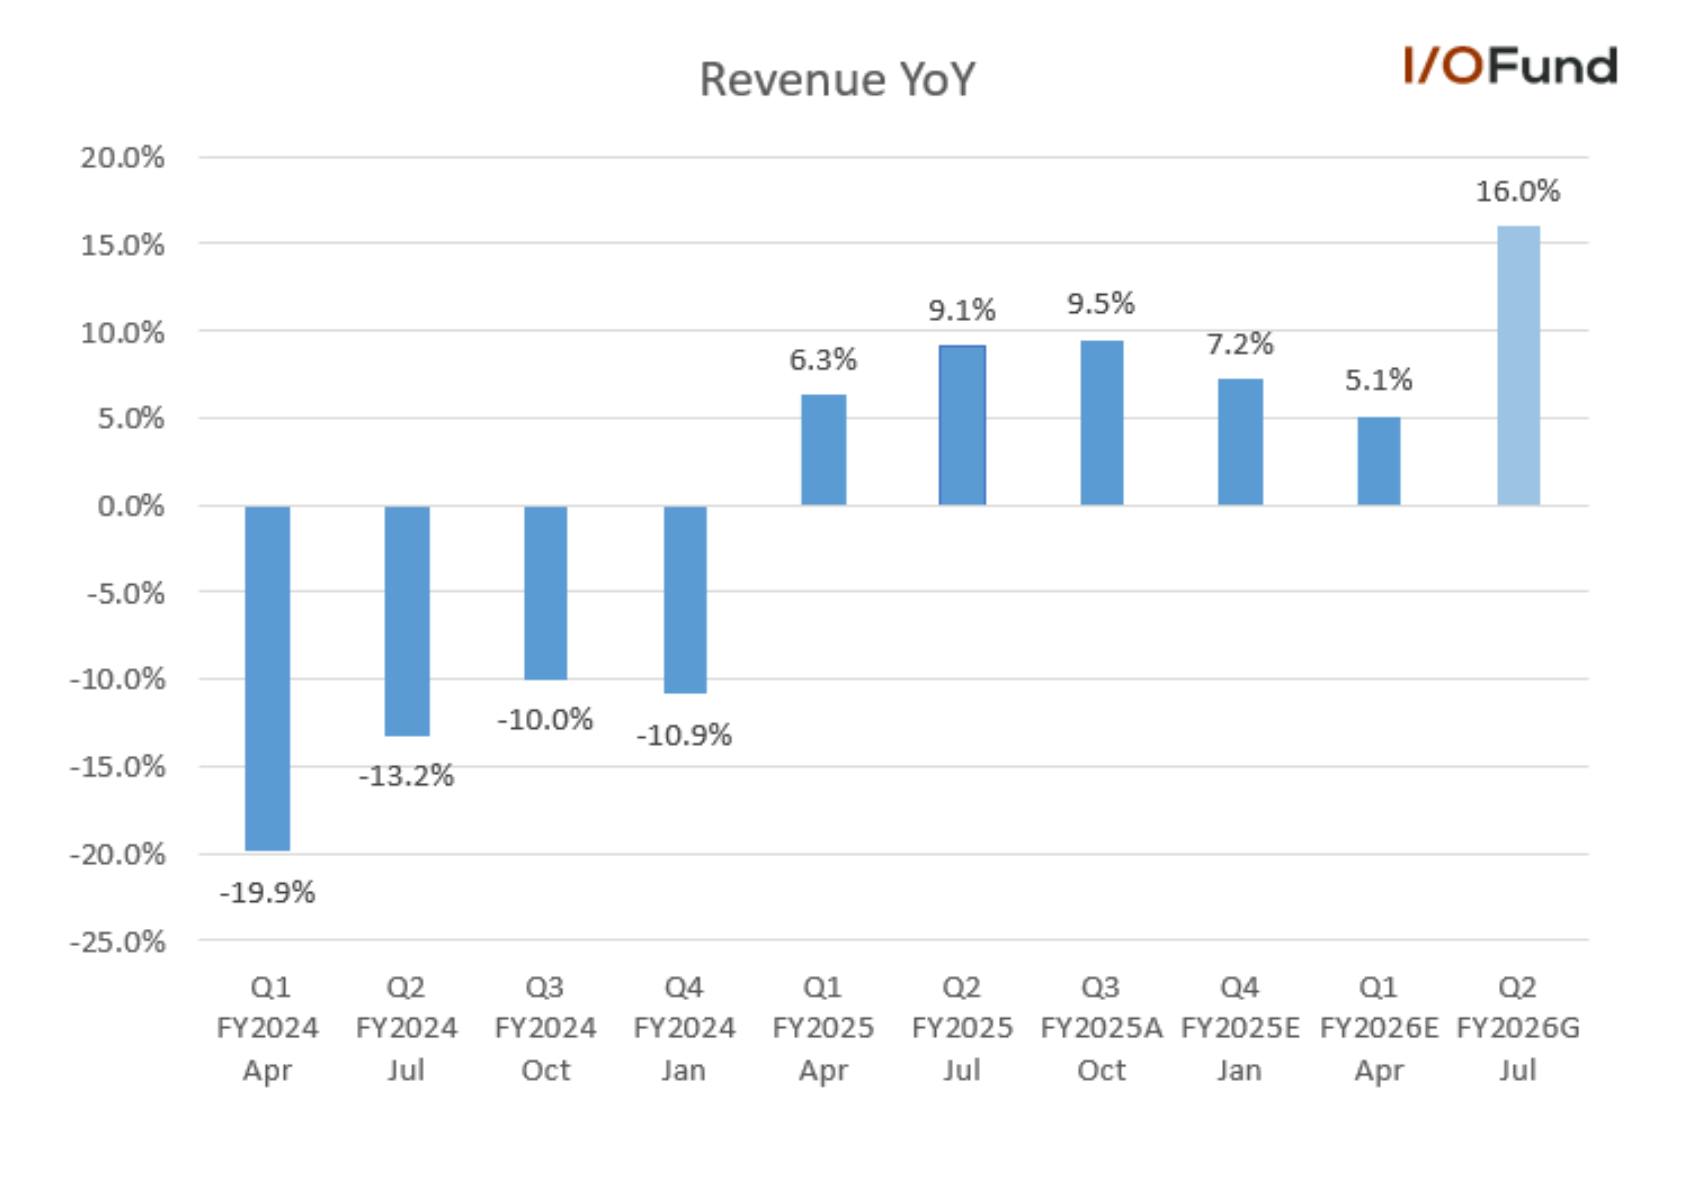
Dell reported $23.38 billion in revenue in Q1, a slight <1% beat to estimates as all of its core businesses grew in the quarter. Revenue growth decelerated to 5.1% YoY in the quarter with Dell forecasting a sharp acceleration in Q2 as it is now rapidly ramping AI server shipments after orders surged in Q1. 

For Q2, Dell guided $28.5 to $29.5 billion in revenue, or 15.9% YoY growth at the $29 billion midpoint, which marks a nearly 11-point sequential acceleration. Interestingly, while Q2’s guidance was nearly $4 billion ahead of the consensus estimate for 0.9% growth to $25.26 billion in revenue, Dell opted to maintain its FY26 revenue forecast at $101 to 105 billion.

Key Operating Segments 

Infrastructure Solutions Group 

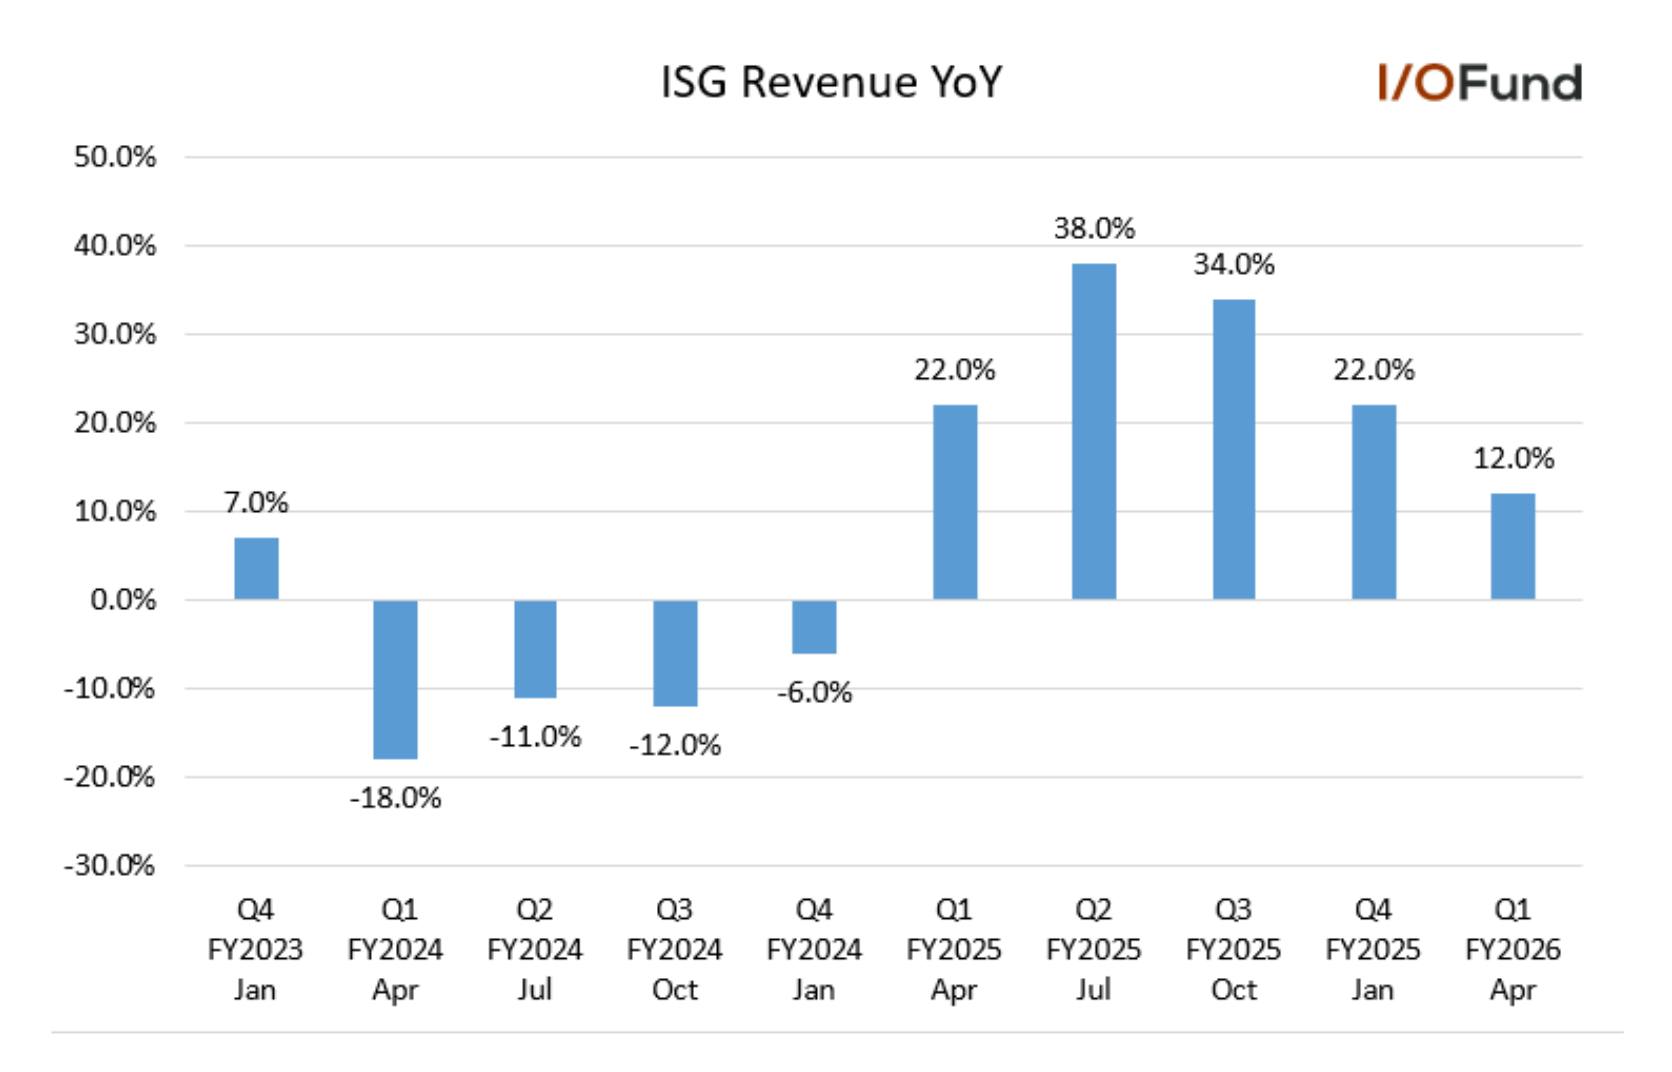
Dell’s ISG segment grew 12% YoY to $10.32 billion in revenue, as Dell’s surge in AI server orders did not translate into booked revenue this quarter. ISG operating income was $0.99 billion, up 36% YoY for a 9.7% operating margin. This was up 1.7 points YoY in what is typically the lowest seasonal quarter for profitability for the segment.  

In Q1, AI server orders were up 612% YoY and QoQ to $12.1 billion with Dell saying this exceeded the entirety of their fiscal 2025 AI server shipments of $9.8 billion. This surge in orders brought Dell’s AI server backlog up to $14.4 billion, up from $4.1 billion in Q4. 

However, Q1’s AI server shipments were just $1.8 billion, up just 6% YoY and down more than (14%) QoQ. This likely boils down to the timing of Blackwell’s ramp, as Dell projected more than $7 billion in shipments in Q2.  

This also raises the question that Q2’s shipment forecast is simply a surge aligning with Blackwell’s strong ramp, as Nvidia’s earnings pointed toward yesterday. With that said, AI server shipments could normalize at a much lower quarterly run rate, something in the range of $3.5 billion to $4 billion (with what we know today). Dell is remaining conservative by only slightly changing the language of its AI server guidance for the year, previously sticking to $15 billion but now aiming for $15B+.  

Within ISG: 

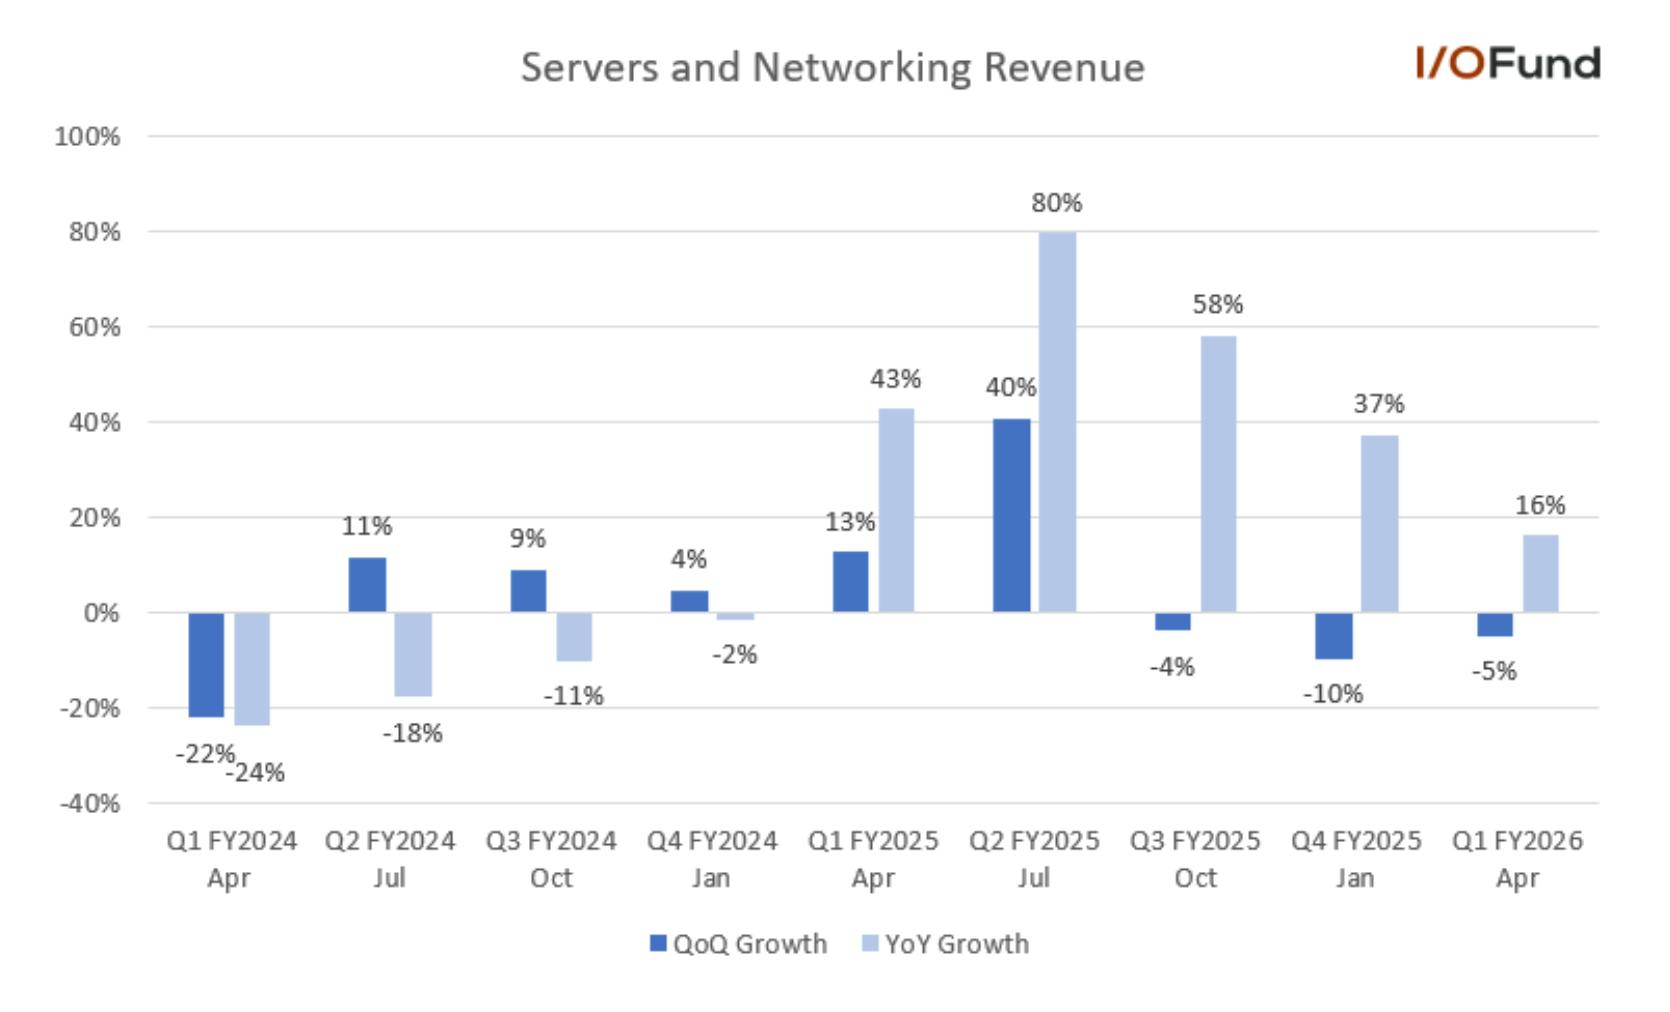
  • Servers and Networking revenue grew 16% YoY to $6.32 billion, with Dell stating that demand has grown for a sixth consecutive quarter, with traditional servers seeing double digit growth. Revenue has continued to decelerate off of Q2 FY25’s peak at 80%, though the $7 billion AI server shipment forecast will reverse this trend.  
  • Storage revenue increased 6% YoY to $4.0 billion, the third consecutive quarter of storage growth. 

Client Solutions Group 

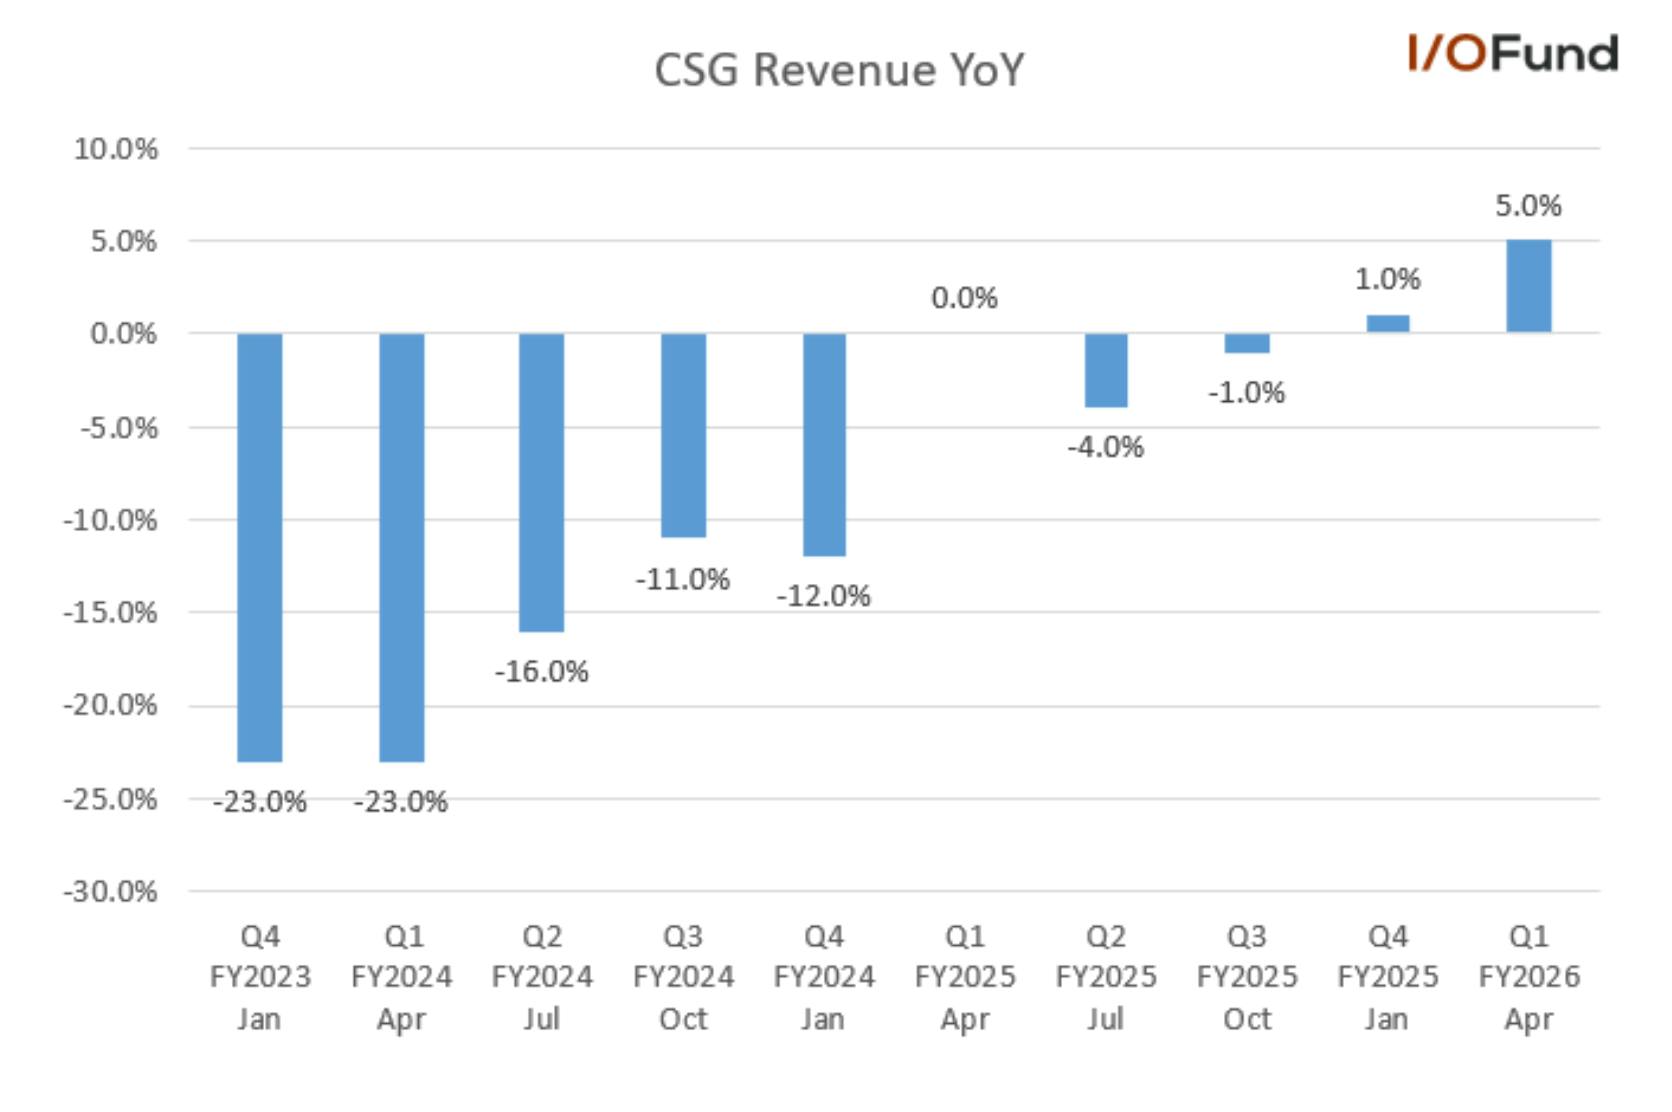
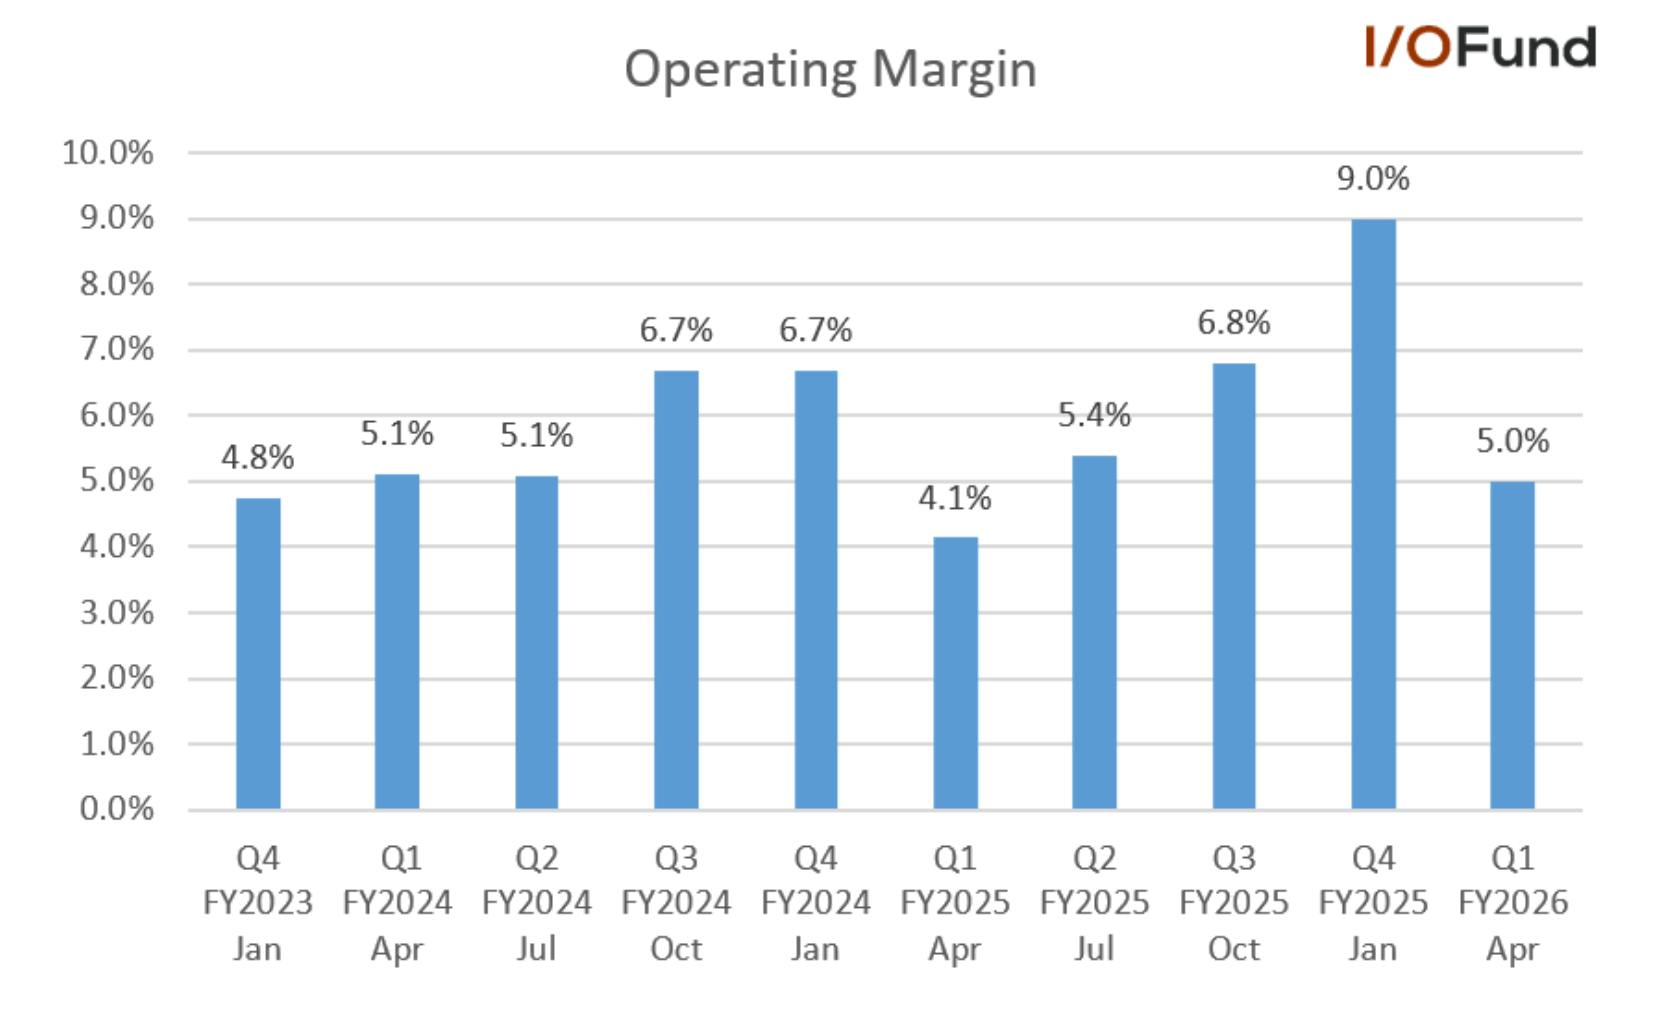
Client Solutions segment revenue fared much better than expected despite weak Consumer revenue, with growth of 5% YoY to $12.51 billion. This accelerated from 1% growth in Q4 and marked Dell’s second consecutive quarter for growth. CSG operating income was $653 million, down (16%) YoY for a 5.2% margin. 

This growth was driven by increased momentum in Dell’s Commercial PC business, where Dell said that demand was up YoY for a fifth consecutive quarter and up double-digits this quarter. Management also said that they are “seeing clear indications that the install base is upgrading to new Windows 11 PCs, many of them AI PCs.” 

Commercial’s momentum helped offset Consumer weakness, as revenue decelerated further, dropping (23%) QoQ and (19%) YoY, versus a (12%) YoY decline in Q4. Within CSG: 

  • Commercial revenue accelerated from 5% in Q4 to 9% in Q1 to $11.05 billion. 
  • Consumer revenue declined (19%) YoY to $1.46 billion. 

Margins Down Sequentially on Seasonality, Mixed YoY 

Dell had forecast its adjusted margins to come down sequentially due to seasonality, which played out in the quarter. On a YoY basis, gross margins contracted though margins down the line were relatively strong, suggesting Dell is beginning to capture some operating leverage via cost cuts. 

  • GAAP gross margin was 21.1%, down half a point YoY and more than 2.5 points sequentially due to lower storage and higher AI server mix. Adjusted gross margin was 21.6%, down more than half a point YoY and more than 2.5 points sequentially. 
  • GAAP operating margin was 5.0%, up more than 0.8 points YoY as Dell cut expenses by (3%) YoY, but down 4 points sequentially on seasonality. Adjusted operating margin was 7.1%, up half a point YoY but down 4 points sequentially.  
  • GAAP net margin was 4.1%, lower than last year’s 4.5%. Adjusted net margin was 4.6%, up 0.3 points from 4.3% last year.  

Adjusted EPS Misses Estimates, Though FY EPS Guide Raised 

Dell reported a fairly large (8.3%) miss on adjusted EPS, reporting $1.55 in the quarter versus its guidance for $1.65 and analyst estimates for $1.69. However, Dell raised its FY26 EPS guidance, speaking to management’s confidence in executing as AI servers ramp and tariffs cloud the macro outlook. 

For Q2, Dell guided for $2.15 to $2.35 in adjusted EPS for growth of 15% at midpoint, marking a slight deceleration from the 17.4% growth reported in Q1. Q3 and Q4 are expected to see EPS growth decelerate a bit further, with growth of just 10.7% in Q4. 

For the full year, Dell slightly raised its FY26 adjusted EPS guidance to $9.40 for 15% growth, up from its prior view for $9.30 for 14% growth. Dell also slightly hiked its GAAP EPS view for FY26, now seeing $7.99 for 25% growth versus its prior view for $7.85 for 23% growth. 

Cash Flows Show Strong Triple Digit Growth 

Some of the stronger numbers of the report aside from AI server orders were Dell’s cash flow metrics, showing strong triple digit growth and a return to double digit margins for OCF. 

  • Operating cash flow rose 168% YoY to $2.80 billion. OCF margin was 12.0%, up more than 7 points from 4.7% a year ago and more than 9.5 points higher than Q4’ s 2.4% margin. 
  • Free cash flow rose 388% YoY to $2.23 billion, while adjusted free cash flow rose 258% YoY to $2.23 billion. FCF and adjusted FCF margin was 9.5%, a significant improvement from 2.1% and 2.8% a year ago.  
  • Cash, equivalents and investments totaled $9.29 billion, up more than $4 billion QoQ. Debt also rose more than $4 billion QoQ to $28.78 billion. 
  • Inventories were $7.42 billion, up more than 10% sequentially.  

Share Buybacks and Dividends: 

In the recent quarter, Dell returned $2.4 billion to shareholders with 22.1 million shares of stock repurchased and also paid a dividend of $0.53 per share. The CFO pointed out that since the start of 2023, Dell has returned $13.2 billion to shareholders through stock repurchases and dividends. 

Earnings Q&A: 

Lumpy Server Orders – Not Budging on the $15B Annual Forecast 

Per our analysis yesterday, Nvidia stated the ramp for Blackwell is happening very quickly “On average, major hyperscalers are each deploying nearly 1,000 NVL72 racks or 72,000 Blackwell GPUs per week and are on track to further ramp output this quarter.” 

Dell primarily focuses on Tier 2 CSPs, yet a press release was issued stating the following that would indicate Dell is shipping Nvidia’s largest systems at scale: “One of Dell’s U.S. factories can ship thousands of NVIDIA Blackwell GPUs to customers in a week. It’s why they were chosen by one of their largest customers to deploy 100,000 NVIDIA GPUs in just six weeks.” 

Also buried in the call was a comment by the CEO stating they have 3,000 AI customers – which feels very high to me given the current order number (meaning orders should follow i time): “Our enterprise growth is exciting with over 3,000 customers now buying various forms of our Dell AI factories. We saw a mix from Hopper technology and Blackwell technology across those. We saw it with [Worm and x86] (ph), so a great cross-representation there.” 

Despite this excitement, Dell offered a muted tone on the call especially as they declined to increase their AI forecast for $15 billion in AI servers this year, stating: “The customer deployments that we have in front of us are large. They're complex. They have very detailed schedule deliveries. There's lots of dependencies on this. We've talked about this business being lumpy and nonlinear. The dependencies in this business are waiting for data centers to be built, power to be provided, direct liquid cooling infrastructure put in place. We're orchestrating a highly complex supply chain [..]” and later it was stated: “[…] I like our prospects of converting more pipeline in the second half, but at this point, we're on the $15 billion plus side. Our annual guidance that we just delivered suggests that's exactly where we are.” 

My readthrough is that Dell is not willing to offer guidance on these systems that have had many delays. From what I can tell, companies in the United States supply chain would rather just surprise the market down the line than overpromise on something outside of their control.  

When it comes to other Nvidia server makers such as Foxconn, Wistron and Quanta, many of them have extensive manufacturing operations in China (although headquartered in Taiwan). I would not be surprised if we see Nvidia more “encouraged” to use USA-based server makers such as Dell somewhere down the line. 

Discussions around AI Server Margins 

There was an exchange around ISG margins on the call with an analyst trying to pinpoint if AI servers result in “a low single-digit operating margin” — however, management pushed back on this stating that ISG margins are expanding on a QoQ basis due to AI servers. 

Because AI server margins can make or break a stock like Dell (or Supermicro), I’m quoting the response in full – this is about the guide and not the current quarter results, which had lower margins. 

The CEO stated: “When I think about AI and the numbers that we gave, the $7 billion of incremental revenue. When you look at it, I believe it's roughly $4 billion on a year-over-year basis. It's roughly $5 billion on a quarter-over-quarter basis. And it drives significant gross margin dollar growth on both a year-over-year and quarter-over-quarter basis. And it drives significant operating income dollar growth on a quarter-over-quarter and year-over-year basis. I'll turn it over to Yvonne, she can add more.” 

The CFO later stated: “Yes, I'd say embedded within the guide is a 10% quarter-over-quarter increase in gross margin dollars. As Jeff mentioned, we're seeing — what we're seeing in ISG quarter-over-quarter is [indiscernible] $5.3 billion more revenue, with roughly $0.5 billion more in operating income, which is being driven by AI server profitability and to a lesser extent improvement in the profitability within our Storage portfolio.” 

This would mean the flat guide on adjusted operating margin is coming from traditional servers as it was stated in the opening remarks: “We are expecting sub-seasonal performance in traditional server and storage, our larger profit pools that provide scale, as customers evaluate their IT spend for the year given the dynamic macro environment.” 

Weak Macro Backdrop: 

When asked directly about a tariff pull forward, Dell cut to the chase and confirmed they believe a pull forward occurred in all three of their traditional businesses of PCs, storage and non-AI servers. 

The CEO was quite granular in discussing the details: 

Jeff Clarke: 

 I think I mentioned in my remarks at North American, EMEA and APJ all grew double digits from a demand perspective. We did see a slowdown in month three. Month one was greater than January. Month two was greater than February. Month three slowed in weeks 10 through 12 in actually all three US businesses, commercial PCs, traditional servers, and storage. So clearly there is a bump along the journey there, along they reference to that with a slowdown in our traditional server business. So, a pull ahead. We are still optimistic about the year. We have all of the businesses growing. We are maybe a little more needed in what we think in those businesses. They may be down a point in terms of their absolute market growth. I don't think anyone knows, but when you look at traditional servers, you look at storage, the other two businesses that I was referring to. I think, both were growing nicely. North America speed bump with 10 through 12 in month three. Worked our way through that. We now have that reflected in our guidance in Q2.” 

Conclusion: 

We took a stab at Dell as it was becoming apparent from Nvidia’s report that Dell would likely beat its AI server business. It was a blowout in that regard, as the chart shows, yet there are a few puts and takes to consider. First off, Dell is not comfortable guiding to more than what they are sure will be delivered in light of many delays with Blackwell. Secondly, Dell’s other segments saw a pull forward and will weigh on results as we move into future quarters. However, one reason we took a stab is that a bullish setup is forming – like with many AI stocks right now, it requires some patience.

Please note: The I/O Fund conducts research and draws conclusions for the Fund’s positions. We then share that information with our readers. This is not a guarantee of a stock’s performance. Please consult your personal financial advisor before buying any stock in the companies mentioned in this analysis.

Recommended Reading:
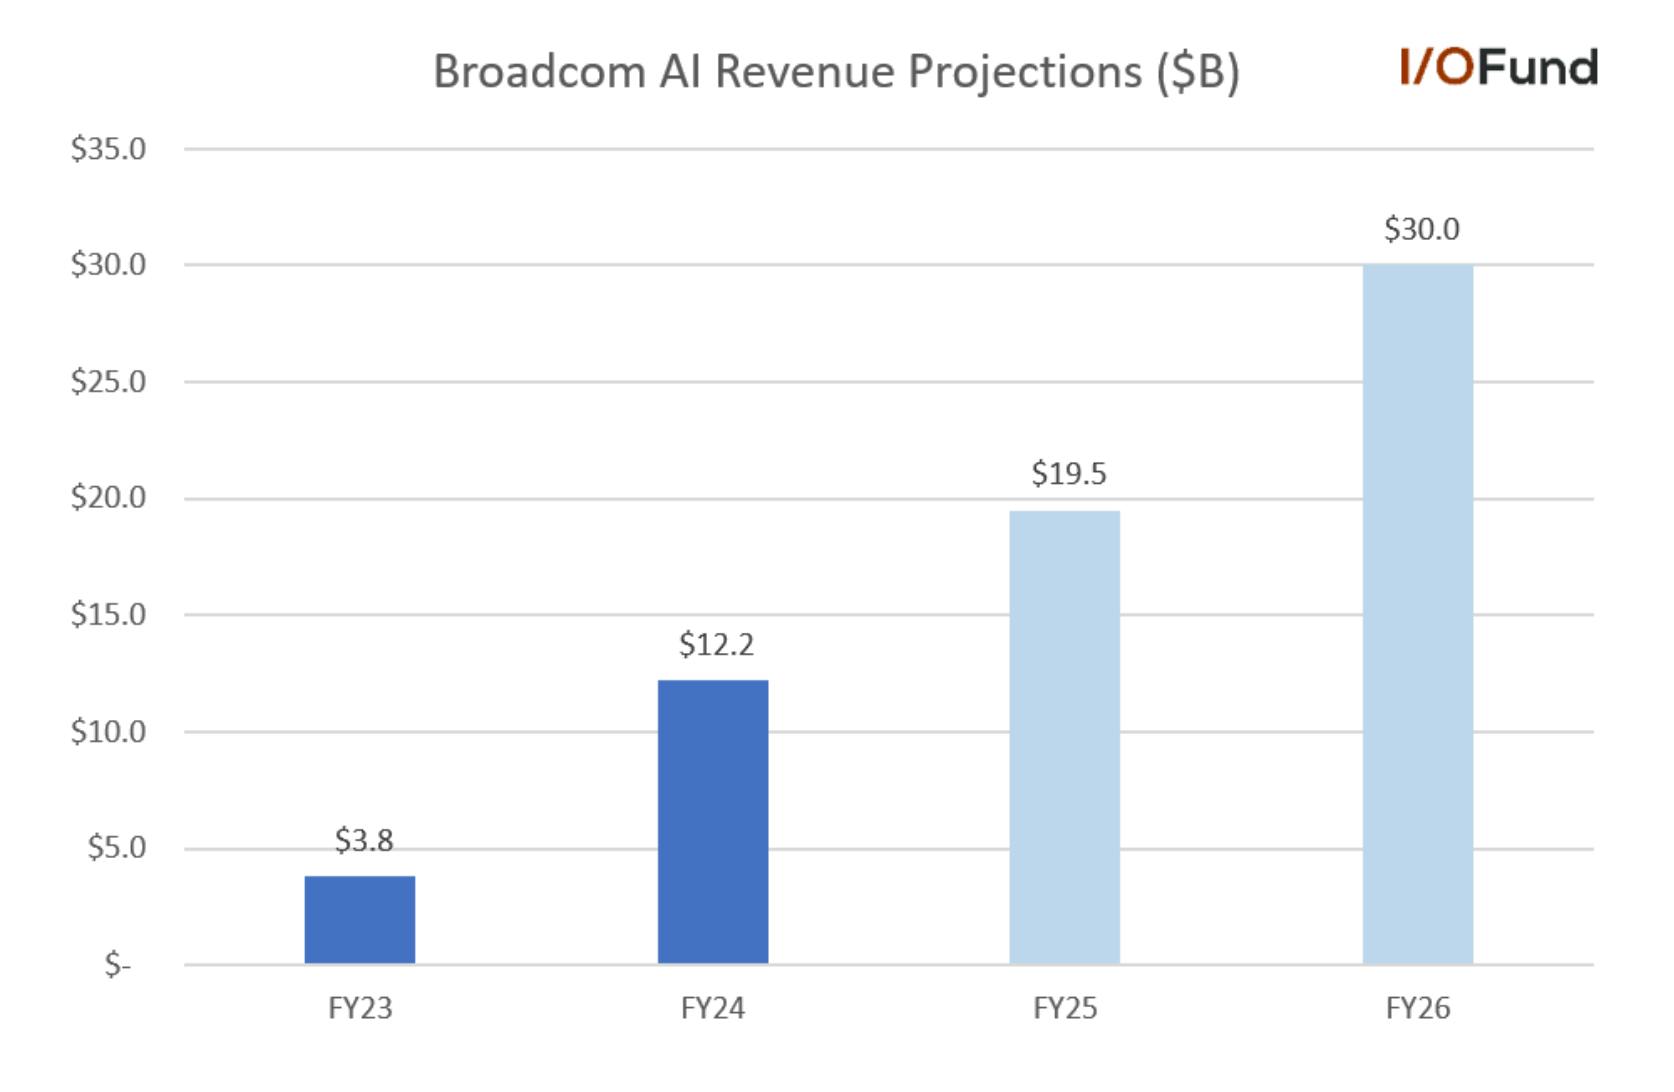
Nvidia Q1/Q2 Guide: Blackwell is (Finally) Here 

Nvidia posted a strong Q1 and marginally missed estimates in Q2 due to Blackwell revenue that exceeded expectations. The larger Blackwell systems are in full production and are shipping in volume now, which sets up a strong second half of the year.  

According to management commentary, the ramp is happening very quickly: “On average, major hyperscalers are each deploying nearly 1,000 NVL72 racks or 72,000 Blackwell GPUs per week and are on track to further ramp output this quarter.” The rough math here implies hyperscalers are deploying $3 billion every week right now since each rack goes for $3 million. Furthermore, the run rate of this comment implies data center revenue will be above and beyond analyst consensus for Q2, Q3 and Q4 – thus, either analyst consensus comes up or these systems will become further supply constrained somewhere down the line and analysts are being conservative for now. 

Among the many reasons that Blackwell is an improvement compared to the Hopper architecture, management focused on inference stating: “Compared to Hopper, Grace Blackwell is some 40 times higher speed and throughput compared.” 

The loss of China revenue in Q1 was $2.5 billion yet inventory charges were higher at $4.5 billion from orders placed prior to April 9. For Q2, the loss of China revenue was $8 billion –or about $2 to $3B higher than the typical $5.5B in China revenue. The readthrough is that Blackwell came in $2-$3B above analyst expectations to absorb that impact from China, since guidance marginally missed. 

You can view an interview on Fox where I discussed the puts and takes going into the earnings report plus the new price target I/O Fund published here. If you’re brief on time, the takeaway is that Blackwell has enough ammo to push the stock into the mid-to-high $200s or a $6+ trillion market cap. I discuss this and more below. 

Slight Revenue Beat in Q1, Marginal Miss in Q2 

Nvidia reported a slight revenue beat in Q1, reporting 69.2% YoY growth to $44.06 billion in revenue, just ahead of the $43.25 billion consensus.  

For Q2, Nvidia guided $45 billion, +/- 2%, representing a deceleration to 49.8% YoY growth and a marginal miss at midpoint versus consensus at $45.66 billion. At the low end of the guide, revenue growth would be up only 2.3% sequentially, reflecting how large of an impact the H20 ban is having on growth.  

Nvidia also quantified more of the H20 impact, providing details on the revenue impact to both Q1 and Q2 – in total, both quarters are seeing a combined impact of just over $15 billion. Nvidia added that the inventory charge of $4.54 billion was less than the $5.5 billion anticipated as it was able to re-use certain materials.  

For Q1, Nvidia said that it recorded $4.6 billion in H20 revenue, or about 10.4% of revenue, while it was unable to ship an additional $2.5 billion of H20 revenue due to export restriction. In total, this implies $7.1 billion in H20 revenue in Q1. This would represent around 16% of total revenue or 18.2% of data center revenue in the quarter.  

For Q2, Nvidia said that its guidance reflects the loss of approximately $8 billion in H20 sales, implying nearly 13% QoQ growth was expected to fill extremely high Chinese demand for the chip. However, based off management’s commentary, its $45 billion guide for Q2 suggest that other Blackwell SKUs are ramping rapidly and filling much of the H20 void.  

Key Segments 

Data Center 

Nvidia reported 73.3% growth in data center revenue to $39.11 billion in Q1, marginally higher than analyst expectations from Visible Alpha of $39.08 billion. This marked the end of Nvidia’s seven-quarter streak of $1 billion-plus beats in the segment – based on the Visible Alpha estimate, Nvidia beat by just $33 million, its lowest in the past nine quarters.  

Compute revenue rose 76% YoY but just 5% QoQ to $34.16 billion, impacted by the H20 ban, while Networking revenue rebounded swiftly, rising 56% YoY and 65% QoQ to $4.96 billion. Nvidia said Networking’s performance was “driven by the growth of NVLink compute fabric in our GB200 systems and continued adoption of Ethernet for AI solutions at cloud service providers and consumer internet companies.” 

In contrast to the prior two quarters, Nvidia did not give a number for Blackwell revenue in the quarter, stating only that its Blackwell ramp expanded to all customer categories and that large CSPs remained its largest customers at just under 50% of data center revenue. 

Nvidia also said that its hyperscaler customers “are each deploying nearly 1,000 NVL 72 racks or 72,000 Blackwell GPUs per week,” with this output level on track to ramp further this quarter.  

  • Gaming revenue rebounded sharply, rising 48% QoQ and accelerating 53 points sequentially to 42% YoY with revenue of $3.76 billion in Q1. Nvidia said that this was driven by its Blackwell architecture and the fastest ramp in company history. 
  • Automotive revenue rose 72% YoY but declined (1%) QoQ to $567 million.  
  • Pro Viz revenue rose 19% YoY and was approximately flat QoQ at $509 million. 
  • OEM and Other revenue rose 42% YoY but declined (12%) QoQ to $111 million. 

Margins Take Large Hit from H20, Though Q2 Points to Swift Rebound 

Nvidia’s margins took a rather large hit from the H20-related inventory write-down, with gross margin and operating margins contracting significantly. However, management’s guidance for Q2 points to a rapid recovery in margins as Blackwell ramps, likely aided by its pricing power.  

  • GAAP gross margin was 60.5% and adjusted gross margin was 61%, around 10 points below management’s initial guidance for 70.6% and 71% due to the $4.54 billion charge related to the H20 ban. Management noted that excluding the charges associated with the ban, adjusted gross margin would’ve been 71.3%, at the upper end of the guided range of 71% +/- 0.5%. 
  • For Q2, management guided for 71.8% GAAP gross margins and 72% adjusted gross margins, a rebound of approx. 11 points sequentially. 
  • GAAP operating margin was 49.1%, well below guidance for 58.5% and a sequential contraction of 12 points. Adjusted gross margin was 52.8%, nearly 10 points below the guide for 62.6% and a sequential contraction of more than 12 points.  
  • For Q2, management’s guidance implies operating margins will rebound with gross margins, projecting approximately a 10 point sequential expansion to a 59.1% GAAP and 63.1% adjusted operating margin.  
  • GAAP net margin was 42.6%, while adjusted net margin was 45.2%. The broad-based margin recovery in Q2 is expected to mostly transfer through to the bottom line, with management guiding for a 7.6 point recovery to a 50.2% GAAP net margin. 

EPS Beats, Growth Expected to Rebound 

Nvidia reported a slight EPS beat despite the margin contractions, with adjusted EPS of $0.81 coming in ahead of the $0.75 estimate. GAAP EPS of $0.76 missed estimates for $0.81. 

Adjusted EPS growth slowed quite dramatically, decelerating more than 38 points sequentially, in part due to the H20 ban; Nvidia noted that excluding the ban, adjusted EPS would be $0.96. This would represent YoY growth of 57.4% versus the 32.8% reported. 

Looking ahead, adjusted EPS growth is expected to rebound and remain in the low to mid-40% range as margins recover. However, given that Q1’s EPS excluding the ban showed growth in the high-50% range, estimates may move higher as Q2’s margin outlook shows almost no persisting impact. 

Cash Flows and Balance Sheet 

Cash flows were surprisingly strong as Nvidia’s cash flow margins expanded approximately 20 points sequentially, while it added more than $10 billion in cash to its balance sheet. 

  • Operating cash flow was $27.41 billion, up nearly 79% YoY on higher revenue, timing of its cash collections, and lower cash taxes. OCF margin was 62.2%, up 20 points QoQ and more than 3 points YoY. Nvidia said it expects a substantial increase in cash taxes in Q2, which will weigh on OCF.  
  • Free cash flow was $26.14 billion, up 75% YoY. FCF margin was 59.3%, up nearly 20 points QoQ and just 2 points YoY. 
  • Inventories were $11.33 billion, rising more than 12% QoQ. However, days sales of inventory decreased from 86 days in Q4 to 59 days in Q1, due to the sharp increase in COGS from the H20 inventory charges. 
  • Accounts receivable were $22.1 billion, declining just over (4%) QoQ. Days sales outstanding decreased sequentially from 53 days to 46 days due to improved shipment linearity (shipments more evenly distributed throughout the quarter) and timing of collections. 
  • Cash and equivalents rose more than $10 billion sequentially to $53.69 billion, despite Nvidia returning more than $14.3 billion to shareholders in the quarter with $14.1 billion in share repurchases. 
  • Debt remained steady at $8.46 billion. 

Earnings Q&A: 

Inference Demand is Skyrocketing 

In the opening remarks, management stated they are seeing “a sharp jump in inference demand.” Our firm recently covered the 5X increase in tokens quoted by Microsoft to 50T tokens per month and 100T per quarter stated in their most recent earnings report. In that analysis, we pointed toward up to $18 billion in annualized revenue for API usage in high-end models. Google recently stated at their I/O Developer event they are processing 450T tokens per month up 50X from a year ago. 

In the opening remarks the following was shared about the NVL72 inferencing capabilities: “Inference serving startups are now serving models using B200, tripling their token generation rate and corresponding revenues for high-value reasoning models such as DeepSeek-R1 as reported by artificial analysis. NVIDIA Dynamo on Blackwell NVL72 turbocharges AI inference throughput by 30x for the new reasoning models, sweeping the industry […] In the latest MLPerf Inference results, we submitted our first results using GB200 NVL72, delivering up to 30x higher inference throughput compared to our 8-GPU H200 submission on the challenging Llama 3.1 benchmark.” 

Later, in the Q&A session, Jensen Huang stated inference is reaching an inflection point, stating “we've reached an extraordinary milestone with AIs that are reasoning, are thinking, what people call inference time scaling. Of course, it created a whole new — we've entered an era where inference is going to be a significant part of the compute workload.” 

It was then re-emphasized again in the Q&A with Huang stating: 

“Yeah, thanks. Thanks, Ben. I would say compared to the beginning of the year, compared to GTC timeframe, there are four positive surprises. The first positive surprise is the step function demand increase of reasoning AI, I think it is fairly clear now that AI is going through an exponential growth, and reasoning AI really busted through [… So, number one is inference reasoning and the exponential growth there, demand growth.” 

Note on Valuation: 

I've written a substantial amount on Blackwell — perhaps the most important being my $10T prediction came out about two months after Blackwell was announced at GTC. If you read-between-the-lines on our new price target, then I’m saying Nvidia can reach more thn a $6T market cap as soon as next year. 

This relies on two assumptions. The first is that we see Nvidia reach the valuation it saw in 2024 when the forward PE Ratio was at 50 forward a handful of times. That implies a move of up to 51% as it stands today. 

On the top line, NVDA has traded as high as 28 forward PS, implying room of up to 75%. 

The second assumption is that Nvidia beats estimates, forcing the valuation higher. We’ve seen a small glimpse of this in Q2 with $2 to $3B in Blackwell revenue absorbing China losses. However, I’ve been crystal clear that it’s the August call and November call that will be fireworks. I expect to see Nvidia grand slam beats in these quarters especially and/or analyst consensus moving up into those quarters, creating more room in the valuation then the 50% to 75% we see currently.  

Conclusion: 

The marginal miss in Q2 would have been more pronounced if Blackwell were not ramping. Pay attention, as this is the cyclical bottom for Nvidia as the Hopper generation fades out and yet its earnings reports have been unscathed. The future is bright and the fireworks are locked and loaded for H2.

Please note: The I/O Fund conducts research and draws conclusions for the company’s portfolio. We then share that information with our readers and offer real-time trade notifications. This is not a guarantee of a stock’s performance and it is not financial advice. Please consult your personal financial advisor before buying any stock in the companies mentioned in this analysis. Beth Kindig and the I/O Fund own shares in NVDA at the time of writing and may own stocks pictured in the charts.

Recommended Reading:
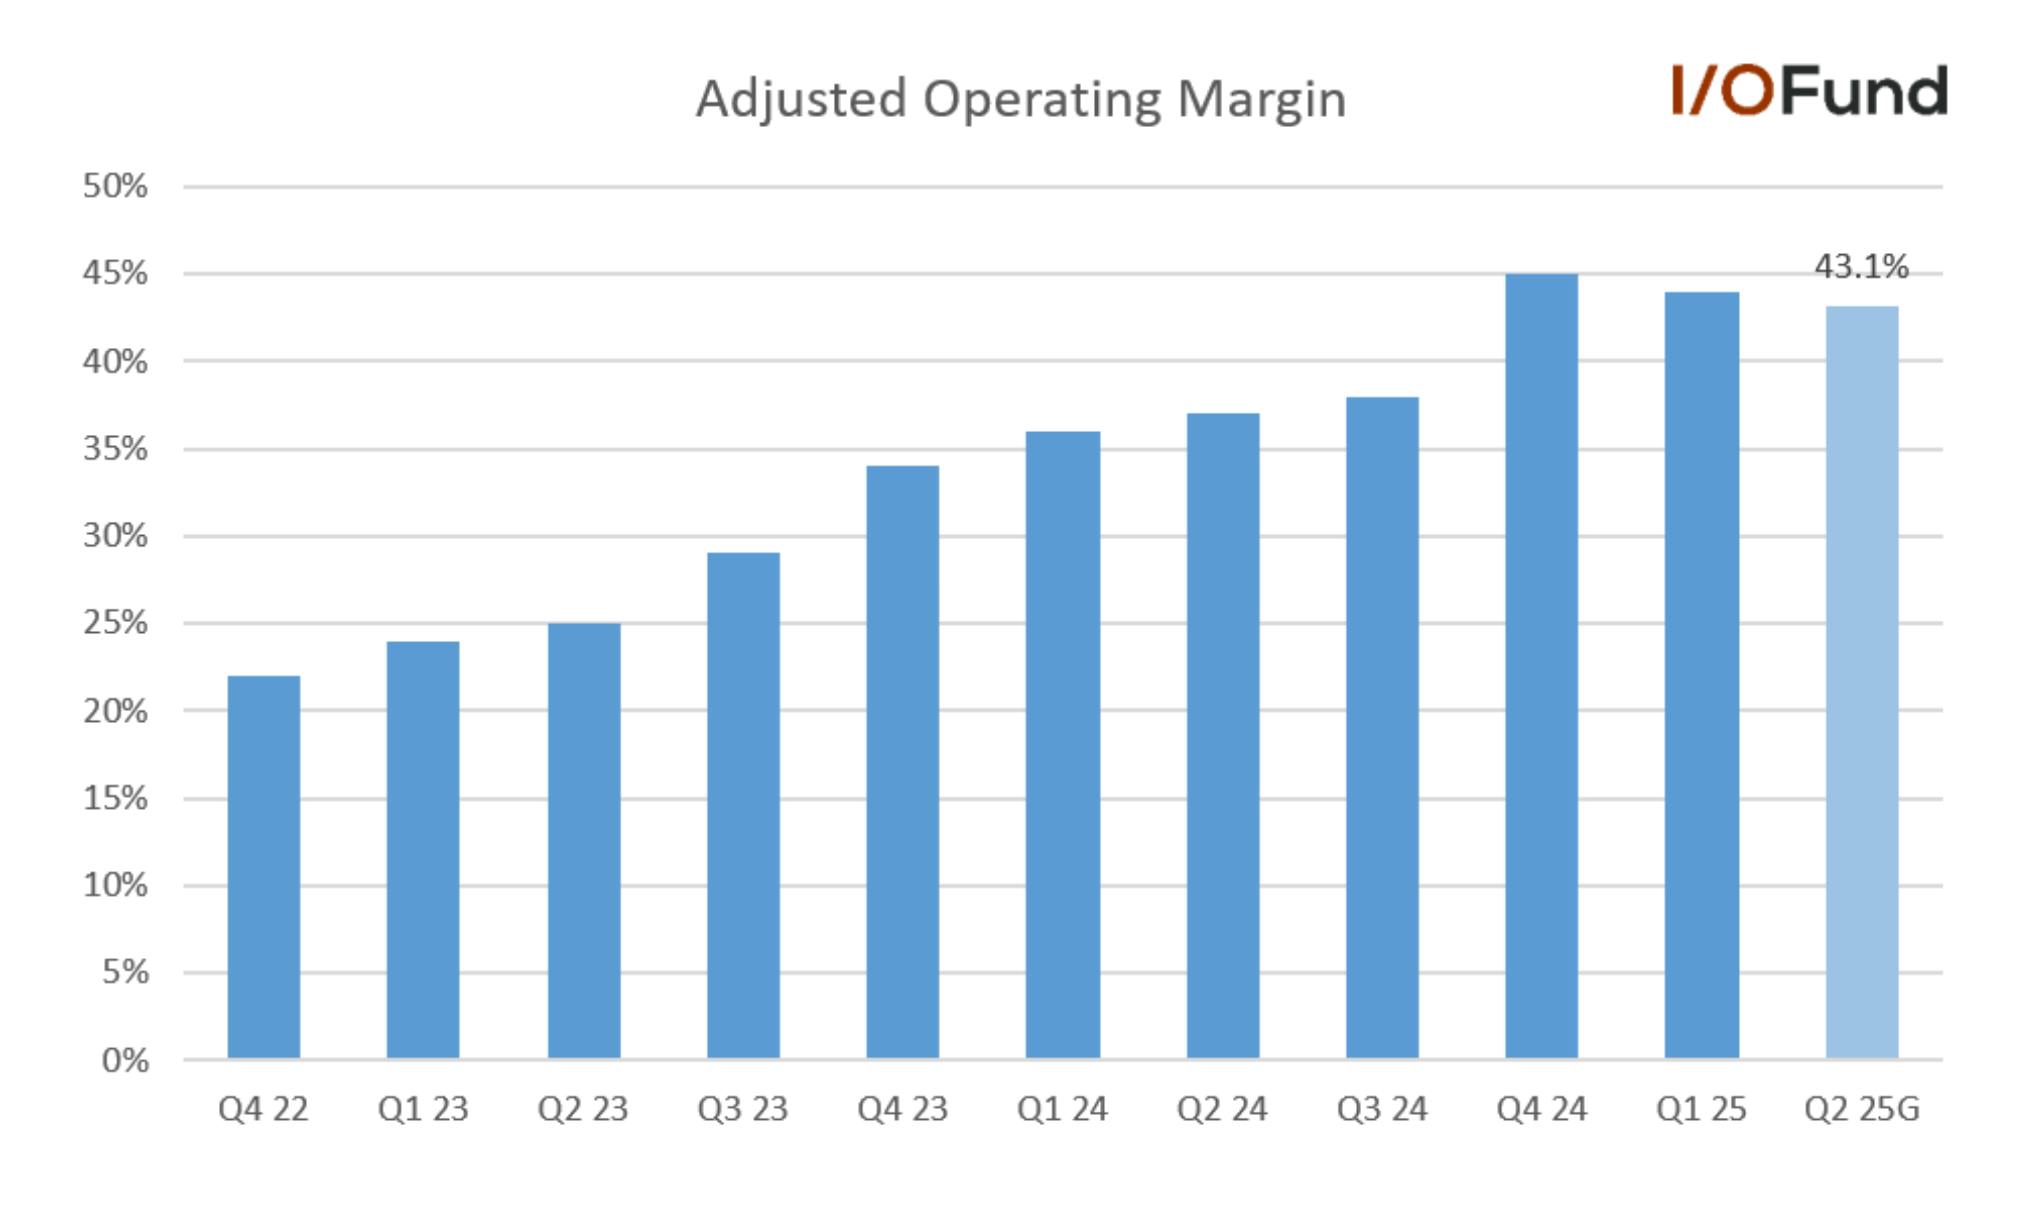
Nvidia Q1/Q2 Guide: Blackwell is (Finally) Here 

Nvidia posted a strong Q1 and marginally missed estimates in Q2 due to Blackwell revenue that exceeded expectations. The larger Blackwell systems are in full production and are shipping in volume now, which sets up a strong second half of the year.  

According to management commentary, the ramp is happening very quickly: “On average, major hyperscalers are each deploying nearly 1,000 NVL72 racks or 72,000 Blackwell GPUs per week and are on track to further ramp output this quarter.” The rough math here implies hyperscalers are deploying $3 billion every week right now since each rack goes for $3 million. Furthermore, the run rate of this comment implies data center revenue will be above and beyond analyst consensus for Q2, Q3 and Q4 – thus, either analyst consensus comes up or these systems will become further supply constrained somewhere down the line and analysts are being conservative for now. 

Among the many reasons that Blackwell is an improvement compared to the Hopper architecture, management focused on inference stating: “Compared to Hopper, Grace Blackwell is some 40 times higher speed and throughput compared.” 

The loss of China revenue in Q1 was $2.5 billion yet inventory charges were higher at $4.5 billion from orders placed prior to April 9. For Q2, the loss of China revenue was $8 billion –or about $2 to $3B higher than the typical $5.5B in China revenue. The readthrough is that Blackwell came in $2-$3B above analyst expectations to absorb that impact from China, since guidance marginally missed. 

You can view an interview on Fox where I discussed the puts and takes going into the earnings report plus the new price target I/O Fund published here. If you’re brief on time, the takeaway is that Blackwell has enough ammo to push the stock into the mid-to-high $200s or a $6+ trillion market cap. I discuss this and more below. 

Slight Revenue Beat in Q1, Marginal Miss in Q2 

Nvidia reported a slight revenue beat in Q1, reporting 69.2% YoY growth to $44.06 billion in revenue, just ahead of the $43.25 billion consensus.  

For Q2, Nvidia guided $45 billion, +/- 2%, representing a deceleration to 49.8% YoY growth and a marginal miss at midpoint versus consensus at $45.66 billion. At the low end of the guide, revenue growth would be up only 2.3% sequentially, reflecting how large of an impact the H20 ban is having on growth.  

Nvidia also quantified more of the H20 impact, providing details on the revenue impact to both Q1 and Q2 – in total, both quarters are seeing a combined impact of just over $15 billion. Nvidia added that the inventory charge of $4.54 billion was less than the $5.5 billion anticipated as it was able to re-use certain materials.  

For Q1, Nvidia said that it recorded $4.6 billion in H20 revenue, or about 10.4% of revenue, while it was unable to ship an additional $2.5 billion of H20 revenue due to export restriction. In total, this implies $7.1 billion in H20 revenue in Q1. This would represent around 16% of total revenue or 18.2% of data center revenue in the quarter.  

For Q2, Nvidia said that its guidance reflects the loss of approximately $8 billion in H20 sales, implying nearly 13% QoQ growth was expected to fill extremely high Chinese demand for the chip. However, based off management’s commentary, its $45 billion guide for Q2 suggest that other Blackwell SKUs are ramping rapidly and filling much of the H20 void.  

Key Segments 

Data Center 

Nvidia reported 73.3% growth in data center revenue to $39.11 billion in Q1, marginally higher than analyst expectations from Visible Alpha of $39.08 billion. This marked the end of Nvidia’s seven-quarter streak of $1 billion-plus beats in the segment – based on the Visible Alpha estimate, Nvidia beat by just $33 million, its lowest in the past nine quarters.  

Compute revenue rose 76% YoY but just 5% QoQ to $34.16 billion, impacted by the H20 ban, while Networking revenue rebounded swiftly, rising 56% YoY and 65% QoQ to $4.96 billion. Nvidia said Networking’s performance was “driven by the growth of NVLink compute fabric in our GB200 systems and continued adoption of Ethernet for AI solutions at cloud service providers and consumer internet companies.” 

In contrast to the prior two quarters, Nvidia did not give a number for Blackwell revenue in the quarter, stating only that its Blackwell ramp expanded to all customer categories and that large CSPs remained its largest customers at just under 50% of data center revenue. 

Nvidia also said that its hyperscaler customers “are each deploying nearly 1,000 NVL 72 racks or 72,000 Blackwell GPUs per week,” with this output level on track to ramp further this quarter.  

  • Gaming revenue rebounded sharply, rising 48% QoQ and accelerating 53 points sequentially to 42% YoY with revenue of $3.76 billion in Q1. Nvidia said that this was driven by its Blackwell architecture and the fastest ramp in company history. 
  • Automotive revenue rose 72% YoY but declined (1%) QoQ to $567 million.  
  • Pro Viz revenue rose 19% YoY and was approximately flat QoQ at $509 million. 
  • OEM and Other revenue rose 42% YoY but declined (12%) QoQ to $111 million. 

Margins Take Large Hit from H20, Though Q2 Points to Swift Rebound 

Nvidia’s margins took a rather large hit from the H20-related inventory write-down, with gross margin and operating margins contracting significantly. However, management’s guidance for Q2 points to a rapid recovery in margins as Blackwell ramps, likely aided by its pricing power.  

  • GAAP gross margin was 60.5% and adjusted gross margin was 61%, around 10 points below management’s initial guidance for 70.6% and 71% due to the $4.54 billion charge related to the H20 ban. Management noted that excluding the charges associated with the ban, adjusted gross margin would’ve been 71.3%, at the upper end of the guided range of 71% +/- 0.5%. 
  • For Q2, management guided for 71.8% GAAP gross margins and 72% adjusted gross margins, a rebound of approx. 11 points sequentially. 
  • GAAP operating margin was 49.1%, well below guidance for 58.5% and a sequential contraction of 12 points. Adjusted gross margin was 52.8%, nearly 10 points below the guide for 62.6% and a sequential contraction of more than 12 points.  
  • For Q2, management’s guidance implies operating margins will rebound with gross margins, projecting approximately a 10 point sequential expansion to a 59.1% GAAP and 63.1% adjusted operating margin.  
  • GAAP net margin was 42.6%, while adjusted net margin was 45.2%. The broad-based margin recovery in Q2 is expected to mostly transfer through to the bottom line, with management guiding for a 7.6 point recovery to a 50.2% GAAP net margin. 

EPS Beats, Growth Expected to Rebound 

Nvidia reported a slight EPS beat despite the margin contractions, with adjusted EPS of $0.81 coming in ahead of the $0.75 estimate. GAAP EPS of $0.76 missed estimates for $0.81. 

Adjusted EPS growth slowed quite dramatically, decelerating more than 38 points sequentially, in part due to the H20 ban; Nvidia noted that excluding the ban, adjusted EPS would be $0.96. This would represent YoY growth of 57.4% versus the 32.8% reported. 

Looking ahead, adjusted EPS growth is expected to rebound and remain in the low to mid-40% range as margins recover. However, given that Q1’s EPS excluding the ban showed growth in the high-50% range, estimates may move higher as Q2’s margin outlook shows almost no persisting impact. 

Cash Flows and Balance Sheet 

Cash flows were surprisingly strong as Nvidia’s cash flow margins expanded approximately 20 points sequentially, while it added more than $10 billion in cash to its balance sheet. 

  • Operating cash flow was $27.41 billion, up nearly 79% YoY on higher revenue, timing of its cash collections, and lower cash taxes. OCF margin was 62.2%, up 20 points QoQ and more than 3 points YoY. Nvidia said it expects a substantial increase in cash taxes in Q2, which will weigh on OCF.  
  • Free cash flow was $26.14 billion, up 75% YoY. FCF margin was 59.3%, up nearly 20 points QoQ and just 2 points YoY. 
  • Inventories were $11.33 billion, rising more than 12% QoQ. However, days sales of inventory decreased from 86 days in Q4 to 59 days in Q1, due to the sharp increase in COGS from the H20 inventory charges. 
  • Accounts receivable were $22.1 billion, declining just over (4%) QoQ. Days sales outstanding decreased sequentially from 53 days to 46 days due to improved shipment linearity (shipments more evenly distributed throughout the quarter) and timing of collections. 
  • Cash and equivalents rose more than $10 billion sequentially to $53.69 billion, despite Nvidia returning more than $14.3 billion to shareholders in the quarter with $14.1 billion in share repurchases. 
  • Debt remained steady at $8.46 billion. 

Earnings Q&A: 

Inference Demand is Skyrocketing 

In the opening remarks, management stated they are seeing “a sharp jump in inference demand.” Our firm recently covered the 5X increase in tokens quoted by Microsoft to 50T tokens per month and 100T per quarter stated in their most recent earnings report. In that analysis, we pointed toward up to $18 billion in annualized revenue for API usage in high-end models. Google recently stated at their I/O Developer event they are processing 450T tokens per month up 50X from a year ago. 

In the opening remarks the following was shared about the NVL72 inferencing capabilities: “Inference serving startups are now serving models using B200, tripling their token generation rate and corresponding revenues for high-value reasoning models such as DeepSeek-R1 as reported by artificial analysis. NVIDIA Dynamo on Blackwell NVL72 turbocharges AI inference throughput by 30x for the new reasoning models, sweeping the industry […] In the latest MLPerf Inference results, we submitted our first results using GB200 NVL72, delivering up to 30x higher inference throughput compared to our 8-GPU H200 submission on the challenging Llama 3.1 benchmark.” 

Later, in the Q&A session, Jensen Huang stated inference is reaching an inflection point, stating “we've reached an extraordinary milestone with AIs that are reasoning, are thinking, what people call inference time scaling. Of course, it created a whole new — we've entered an era where inference is going to be a significant part of the compute workload.” 

It was then re-emphasized again in the Q&A with Huang stating: 

“Yeah, thanks. Thanks, Ben. I would say compared to the beginning of the year, compared to GTC timeframe, there are four positive surprises. The first positive surprise is the step function demand increase of reasoning AI, I think it is fairly clear now that AI is going through an exponential growth, and reasoning AI really busted through [… So, number one is inference reasoning and the exponential growth there, demand growth.” 

Note on Valuation: 

I've written a substantial amount on Blackwell — perhaps the most important being my $10T prediction came out about two months after Blackwell was announced at GTC. If you read-between-the-lines on our new price target, then I’m saying Nvidia can reach more thn a $6T market cap as soon as next year. 

This relies on two assumptions. The first is that we see Nvidia reach the valuation it saw in 2024 when the forward PE Ratio was at 50 forward a handful of times. That implies a move of up to 51% as it stands today. 

On the top line, NVDA has traded as high as 28 forward PS, implying room of up to 75%. 

The second assumption is that Nvidia beats estimates, forcing the valuation higher. We’ve seen a small glimpse of this in Q2 with $2 to $3B in Blackwell revenue absorbing China losses. However, I’ve been crystal clear that it’s the August call and November call that will be fireworks. I expect to see Nvidia grand slam beats in these quarters especially and/or analyst consensus moving up into those quarters, creating more room in the valuation then the 50% to 75% we see currently.  

Conclusion: 

The marginal miss in Q2 would have been more pronounced if Blackwell were not ramping. Pay attention, as this is the cyclical bottom for Nvidia as the Hopper generation fades out and yet its earnings reports have been unscathed. The future is bright and the fireworks are locked and loaded for H2.

Please note: The I/O Fund conducts research and draws conclusions for the company’s portfolio. We then share that information with our readers and offer real-time trade notifications. This is not a guarantee of a stock’s performance and it is not financial advice. Please consult your personal financial advisor before buying any stock in the companies mentioned in this analysis. Beth Kindig and the I/O Fund own shares in NVDA at the time of writing and may own stocks pictured in the charts.

Recommended Reading:
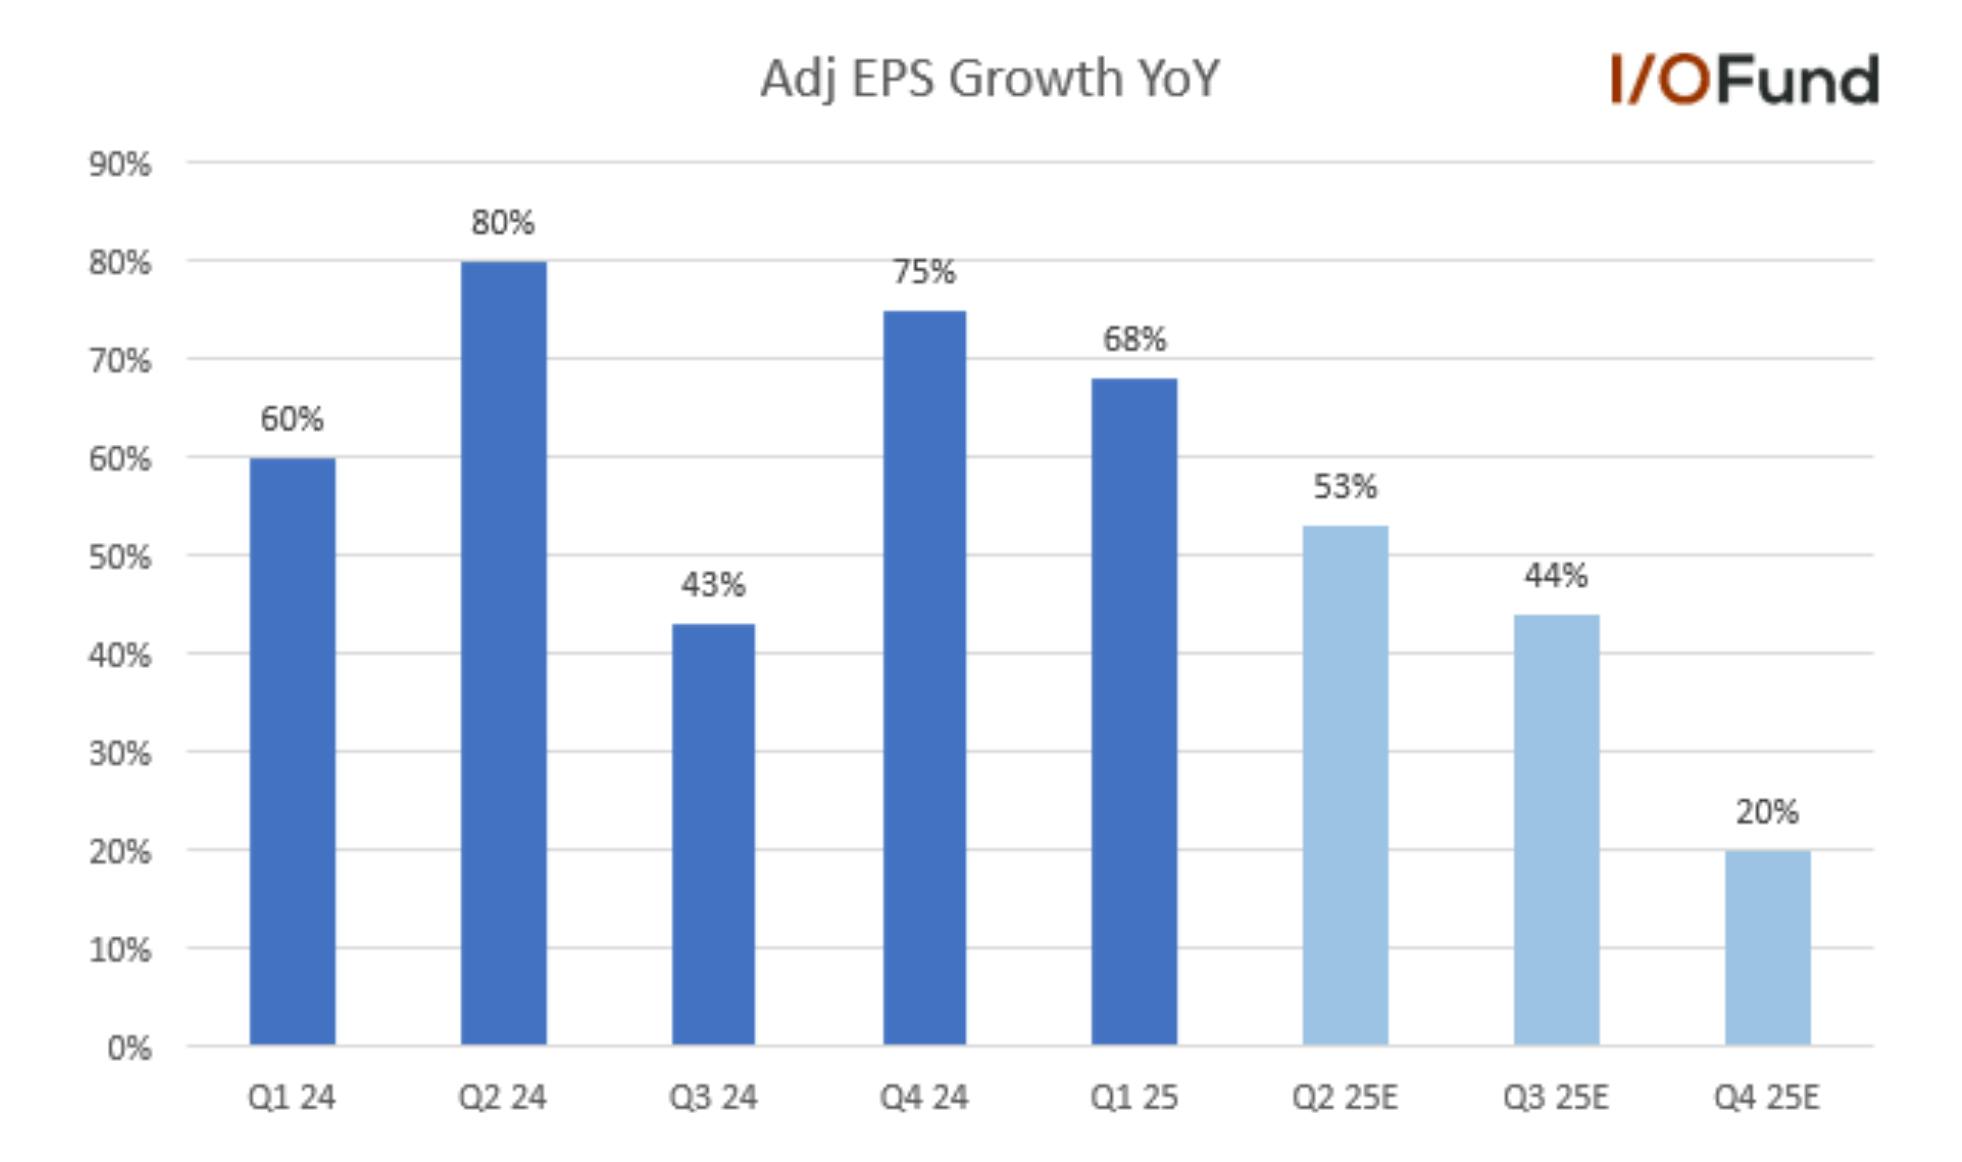
Historic Market Uncertainty Meets $7 Trillion Debt Wall: What Comes Next for the S&P 500

This article is a continuation of our free newsletter from May 27, Historic Market Uncertainty Meets $7 Trillion Debt Wall: What Comes Next for the S&P 500.

For our Premium Advanced Members, we discuss the following:
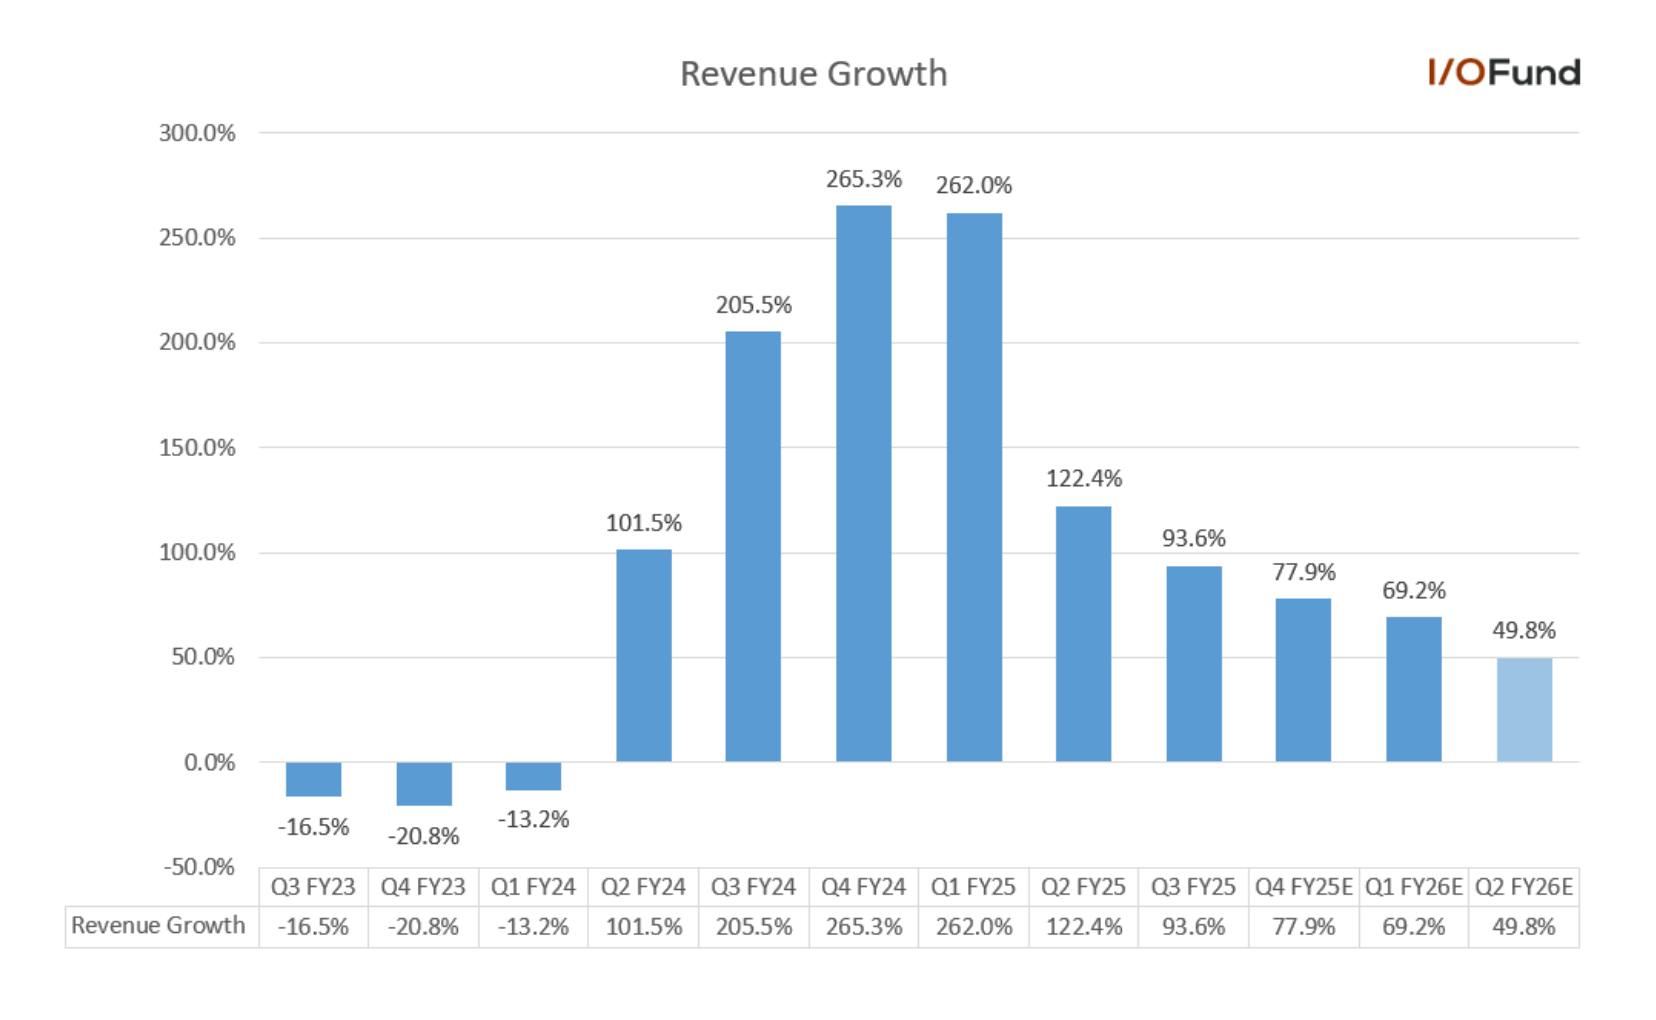
  • The specific game plan for how the I/O Fund plans to navigate the remainder of 2025 including the must-watch levels
  • The signals we are watching to gauge when the broad market tops and the exact levels where we will resume buying stocks.
  • Please keep an eye out for dial-in instructions for a 1-hour webinar on Thursday where I/O Fund Portfolio Manager, Knox Ridley, will discuss live the I/O Fund’s game plan for 2025. If you went into this sell-off fully invested without any risk management plan, we encourage our Advanced Members to attend our upcoming weekly webinar for premium members held this Thursday, May 29th at 4:30 ET.

Broad Market Analysis:
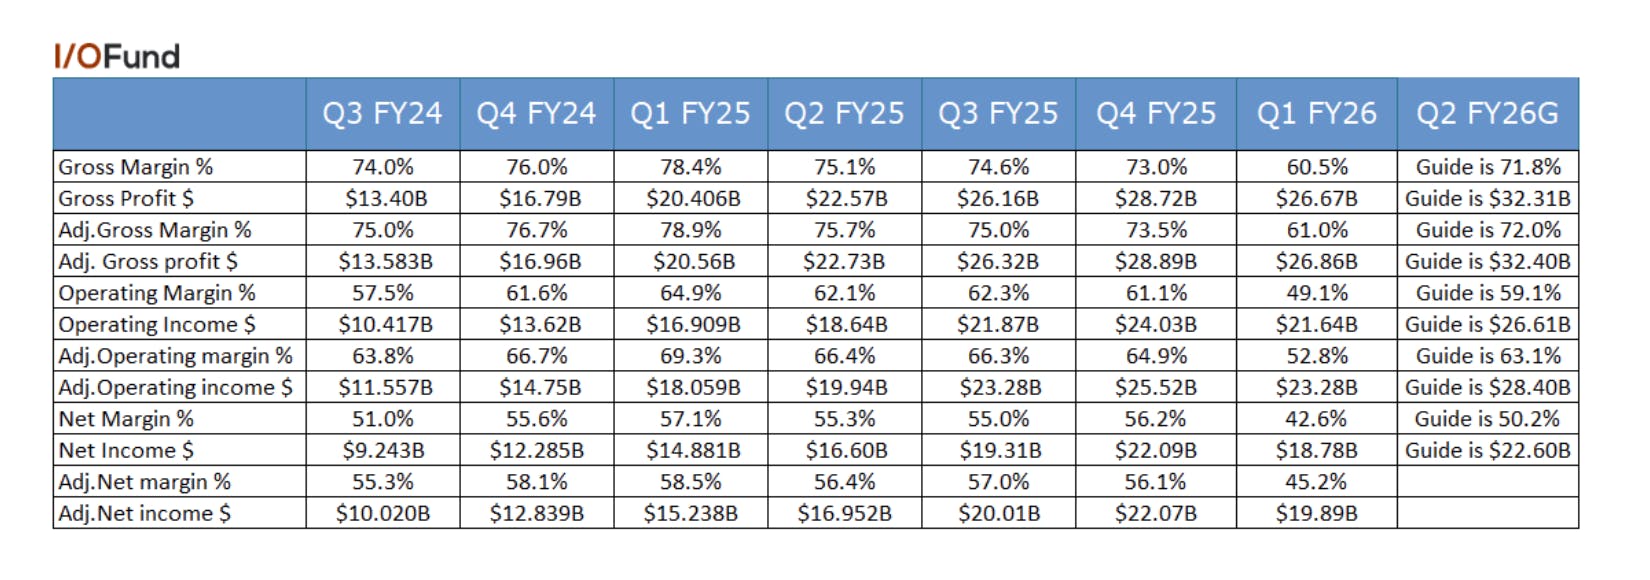
It is easy to draw on one’s emotional bias and therefore build a believable case for what the market will do next. We think this is a mistake for investors positioning for the remainder of 2025. Instead, we will continue to let the markets tell us what is to come.

While there is mounting evidence that the current bounce off the April lows could continue to new all-time highs, the unique risks being revealed in this market warrant caution. Furthermore, the larger pattern that has developed from the 2022 low is telling us that even if we do see a move to new highs, it will likely not be a prolonged trend higher before volatility picks back up.

I first posted this chart in our April 10th report titled, "The FED Can’t Save This One: Why Bonds May Break The Stock Market in 2025." During this report, the S&P 500 was trading around 5200 and we stated that

“The next move will be a corrective rally that makes a lower high. The targets for this bounce are between 5600 – 6050.”

We further stated that once we see our first larger correction from this region, how the market corrects from there will likely determine the remainder of the year.

The below analysis outlines our specific game plan for how we plan to navigate the remainder of 2025…

As of now, the market has topped at 5968 and has the potential for one more small push higher. Regardless, we are in a topping pattern for the expected correction into the summer.  

S&P 500 outlook and two scenarios depending on how the next correction plays out

The I/O Fund’s S&P 500 outlook and game plan depending on how the next correction pans out. Source: I/O Fund

  • Red: In this scenario, we have are completing a rally that should make a lower high. This will set us up for a drop to new lows.  The initial drop from the February 19th high was the A-wave. We are completing the lower high, B-wave, which will set us up for a 5-wave drop to new lows in the C wave. C-waves are always 5-wave patterns, so how we drop will be crucial for determining if this count is in play.
  • Green: This count would have us completing a larger correction within a bigger uptrend. If the coming drop is a messy and overlapping move that resembles a 3-wave pattern, it will likely make a higher low in an on-going bull market to new highs.  This correction will target the 5600 region, first. As long as it holds 5100, we can maintain a setup to new highs around 6300 – 6500 in the coming months.

If we see a more direct drop that takes the shape of a 5-wave pattern, then the market is telling us the risks described in this report are likely greater than the market believes, as we set up for a drop below the April lows.

If on the other hand, we see a messy/overlapping 3-wave retrace that finds support in the 5600 – 5100 region, then it is the market telling us to look past these risks for now. This would be the set up for new all-time highs in the coming months.

I do want to state that even if we do see the scenario where we push to new all-time highs later in the year, the larger pattern in play suggests this will be the final 5th wave in the bull market that started at the 2022 lows. It should be accompanied by numerous key markets and stocks making higher lows. In other words, this would be a rally that we would likely sell into, as we set up for a more prolonged period of volatility.

Conclusion

The market breadth, Q1 earnings beats, and the size of this rally suggest that new all-time highs are likely to follow; however, one cannot underestimate the unique risks within the backdrop of markets. We have never seen more uncertainty in geo-political dynamics, which is forcing companies to withhold guidance as many of the Q1 beats are due to tariff pull forwards.

Furthermore, with nearly half of the U.S. government debt needing to be refinanced this year and next, the bond market continues to move lower in the face of market volatility and uncertainty. This is a trend we have not seen in over 30 years and could be signaling a sea change in how global markets interact moving forward.

If we see an aggressive 5 wave drop, we will position defensively for a move below the April low. If we see an overlapping, 3-wave move that holds over 5100, we will position for the 2nd best buying opportunity of 2025.

Join me Thursday, May 29th at 4:30 pm EST as I discuss this in further detail in a live webinar. The recorded version will be released later in the evening on the 29th.

Please note: The I/O Fund conducts research and draws conclusions for the Fund’s positions. We then share that information with our readers. This is not a guarantee of a stock’s performance. Please consult your personal financial advisor before buying any stock in the companies mentioned in this analysis.

Recommended Reading: