Nvidia Q2: Guidance for Q3 Saved the Day; $10T Market Cap Prediction Revisited 

Nvidia is the global AI compute leader and there is not a distant second. Therefore, reporting (1%) for Q2’s compute segment should have tanked the stock. Instead, we are seeing a mild reaction because Q3 was quite strong and spells good things to come for Nvidia in the second half of the year.  

Given we are on the cusp of Blackwell starting to drive the stock’s narrative (c’mon already), it’s a good time to pause and talk about where Nvidia could go from here. I revisited the medium-term and longer-term forecast on a few pre-earnings discussions and was pleasantly surprised that Jensen Huang did the same on the earnings call.  

Also important for I/O Fund members who hold AI networking positions, the report was much stronger than expected with networking up a whopping 46% QoQ and 78% YoY to $7.25 billion. This foreshadows what’s to come in the AI networking space; and should be a boon for stocks like Astera Labs and Credo which supply Nvidia. 

Despite Q3 putting Nvidia right on track, I would not be surprised if the market offers soft price action on the stock in the near-term. The China narrative is confusing (and beaten to death), Q2 should mark a bottom and semiconductors don’t do well at their cyclical bottoms, plus the AI market is running on fumes until Nvidia can carry the market (Q3-Q4). 

First, we will run through the financials, and then in the second section I’ll break down what I think you can expect on this stock for the remaining part of this year, into calendar year 2026 and by the end of the decade. 

Slight Revenue Beat in Q2, Solid Q3 Guide 

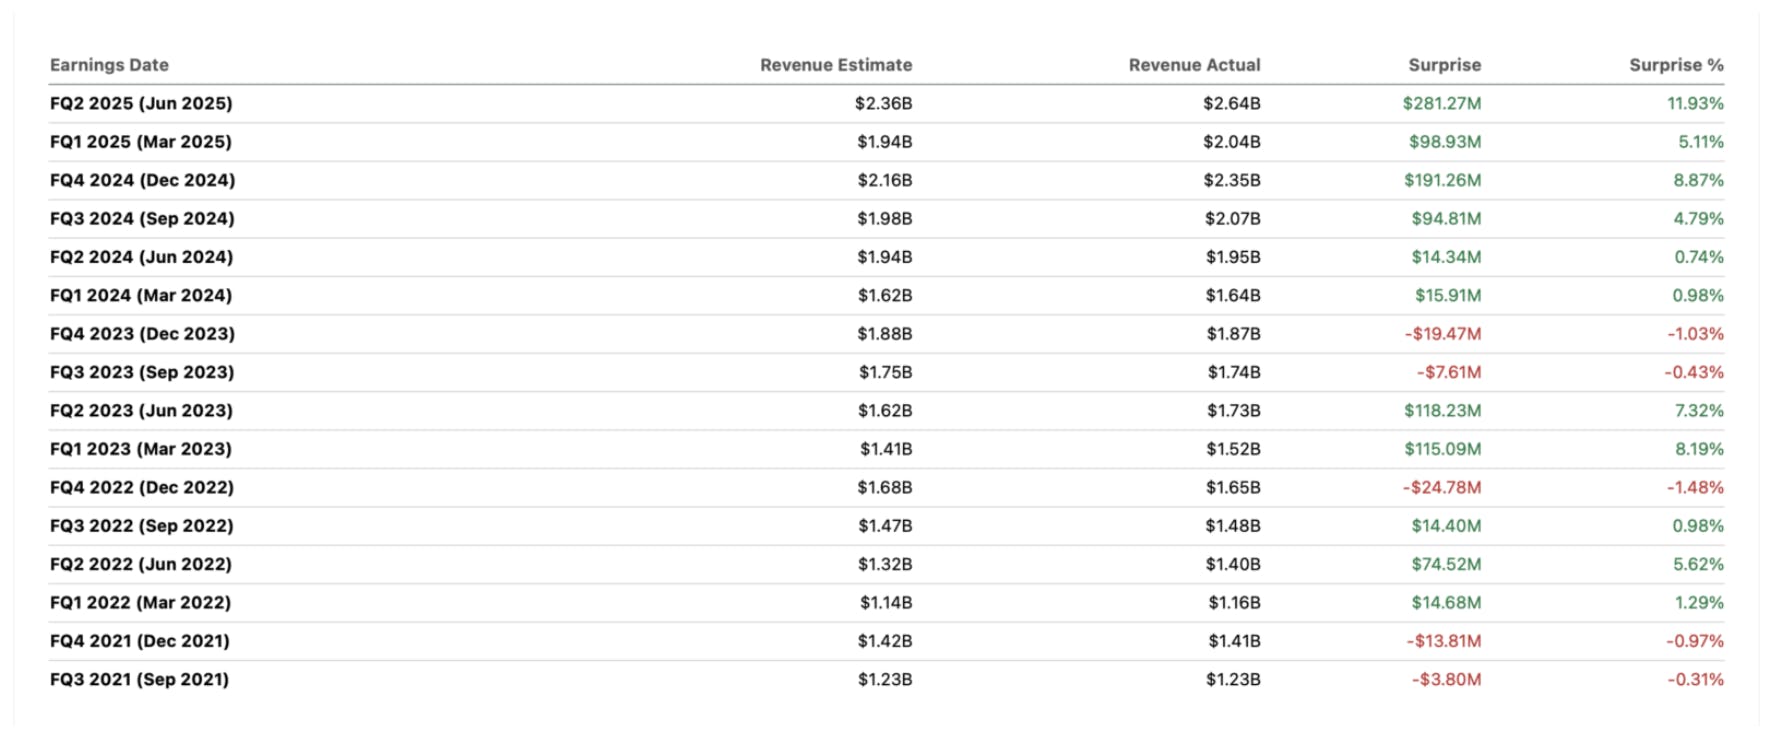
Nvidia reported $46.74 billion in revenue in Q2, slightly ahead of estimates for $46.13 billion. This corresponded to growth of 55.6% YoY, decelerating more than 13 points from 69.2% in Q1; on a QoQ basis, revenue increased just 6.1%, slowing from 12% in Q1.  

This is expected to be a temporary lull in sequential growth, as Nvidia guided for $54 billion in revenue, +/- 2%, for Q3, corresponding to 53.8% YoY growth and a rebound to 15.5% QoQ growth. This was ahead of estimates for $52.7 billion, even with Nvidia noting that this guidance assumed no H20 sales in the upcoming quarter.  
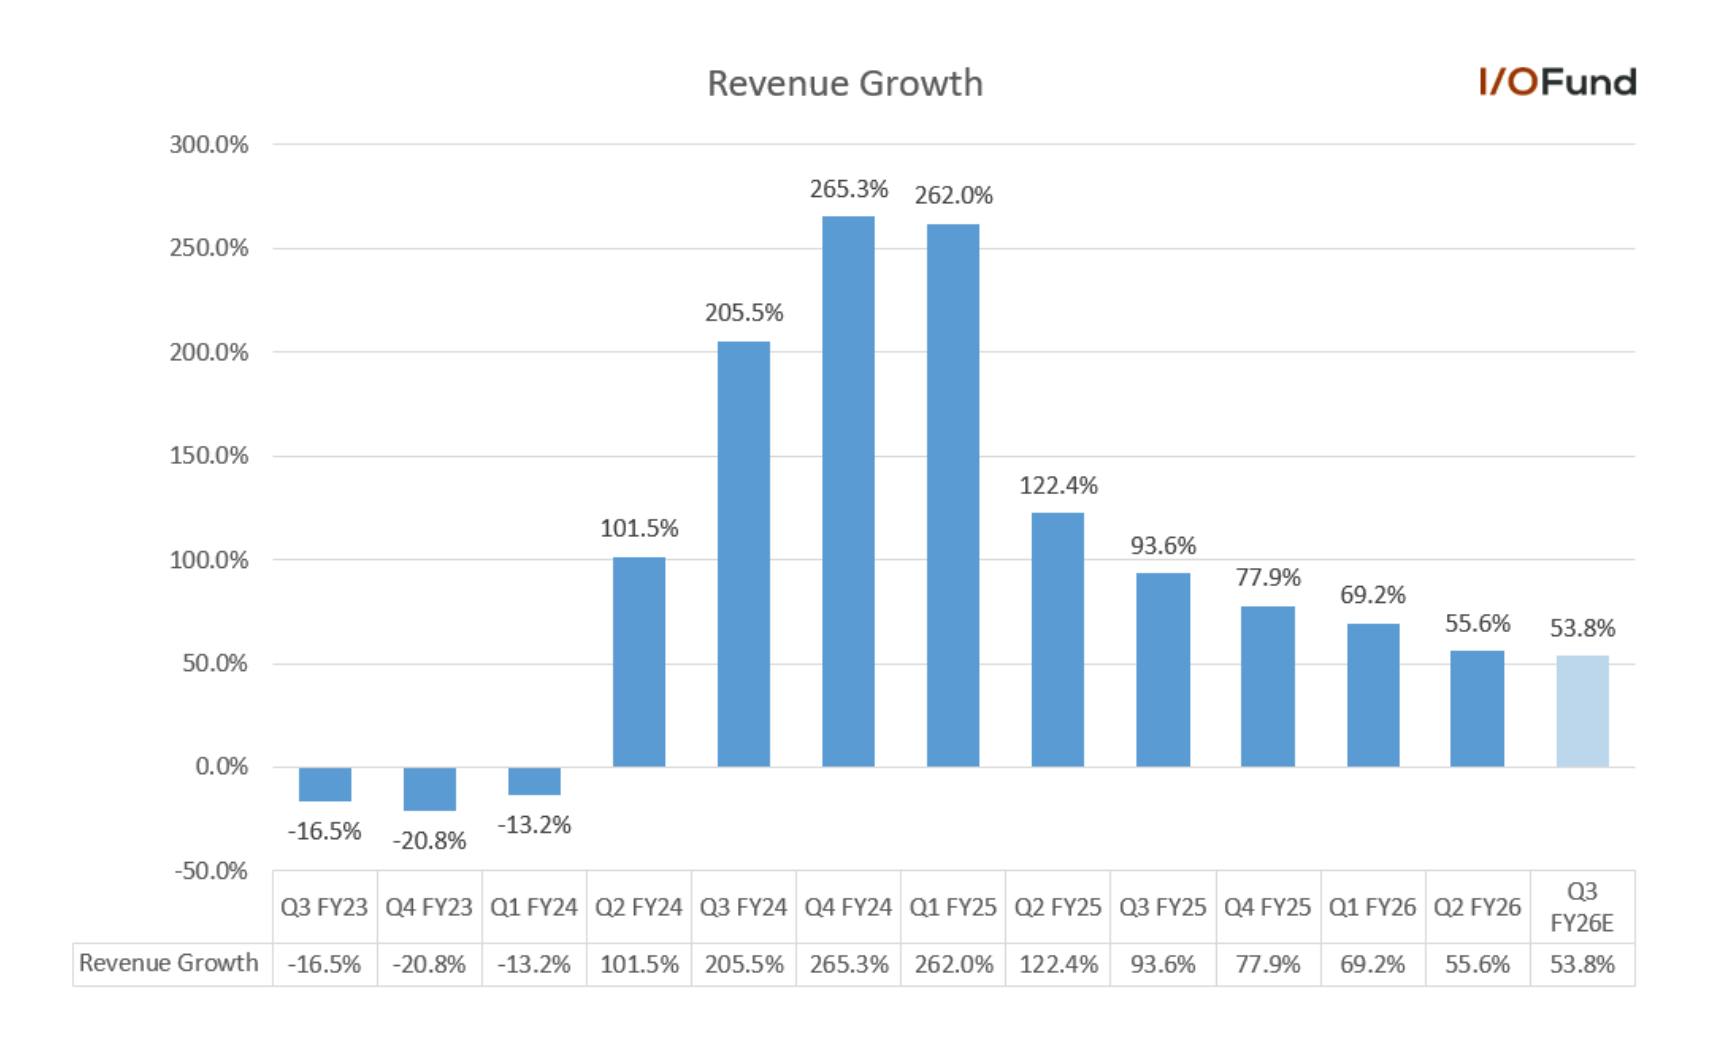
For FY26, Nvidia is currently expected to report 55.4% revenue growth to $202.8 billion, though it is likely that this figure is revised higher, towards $205 billion, accounting for the slight beat in Q2 and Q3’s guide.  

Key Segments: First Sequential Decline in Compute Revenue, No China Sales 

Nvidia’s data center revenue increased 56% YoY and 5% QoQ to $41.1 billion, a marginal miss versus estimates for ~$41.2 billion in the quarter. This is also the smallest sequential increase since Hopper’s breakout quarter at just ~$2 billion.  
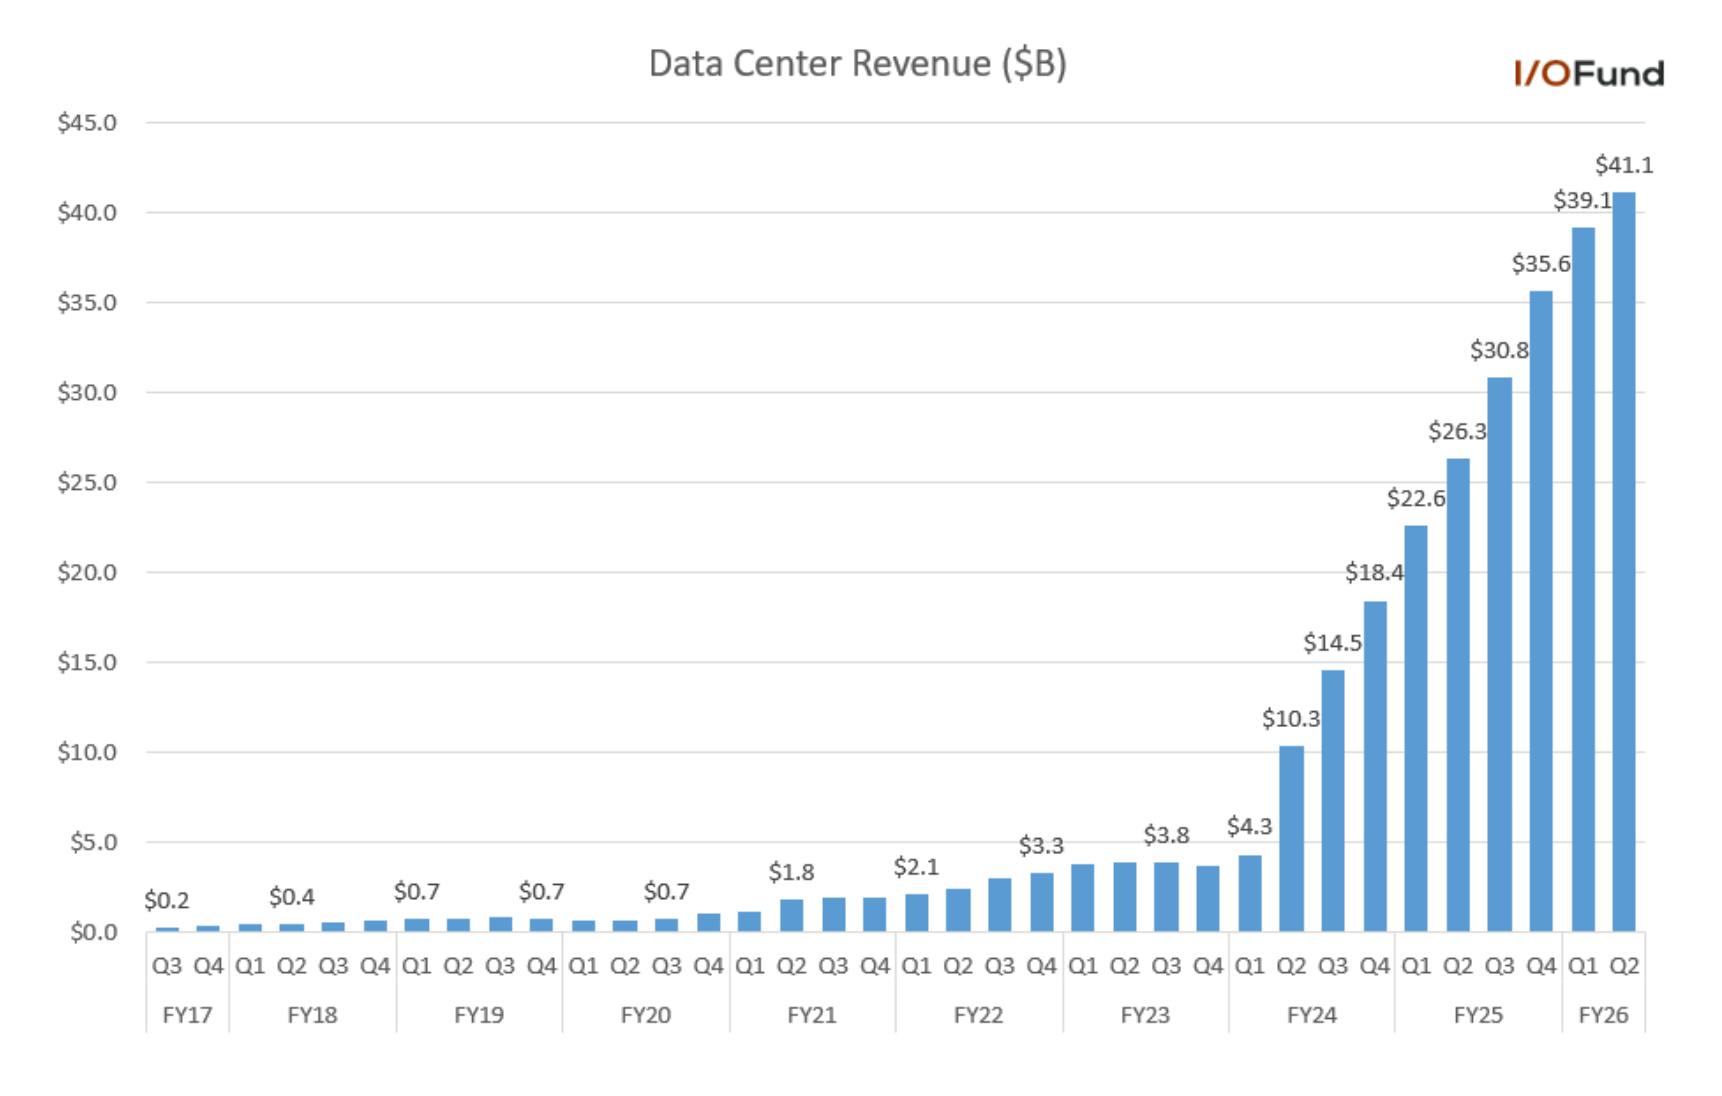
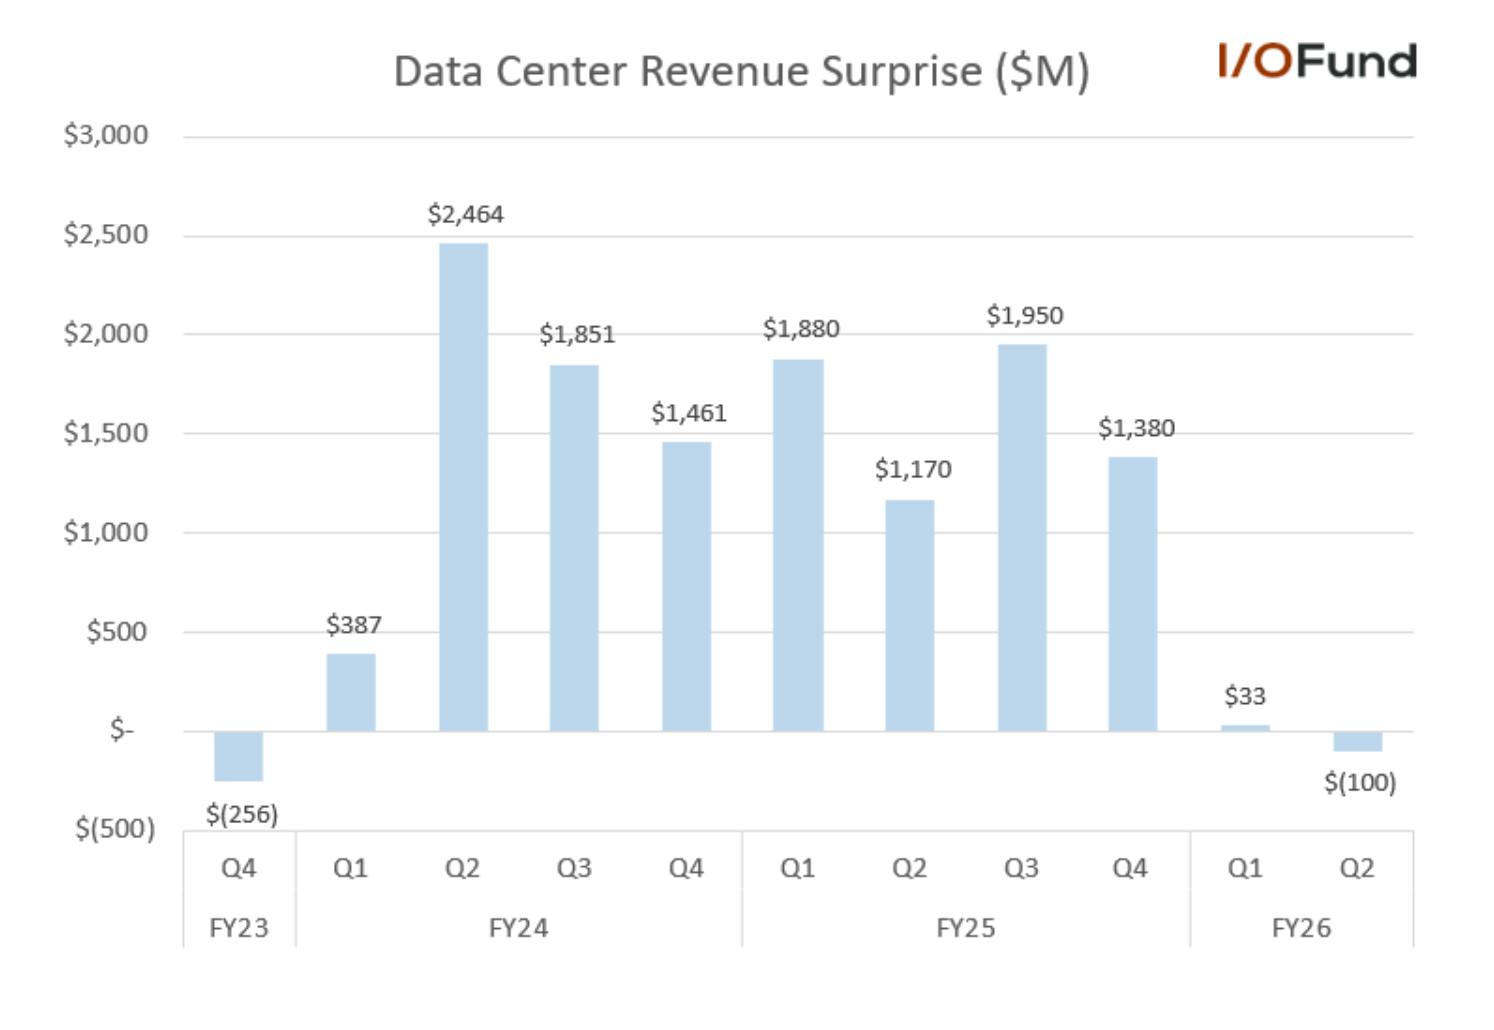
Notably, Q2’s data center result would mark the segment’s first miss since Q4 FY23 as Q1 was essentially in-line. 
While Compute revenue was up 50% YoY, the segment reported an unusual (1%) QoQ decline to $33.8 billion, a sharp shift from double-digit growth in late FY25 and 5% in Q1. Nvidia said the sequential decline was driven by a $4 billion QoQ reduction in H20 sales, as it reported no H20 sales to China this quarter and $0.65 billion in H20 sales to an unrestricted customer outside of China.  
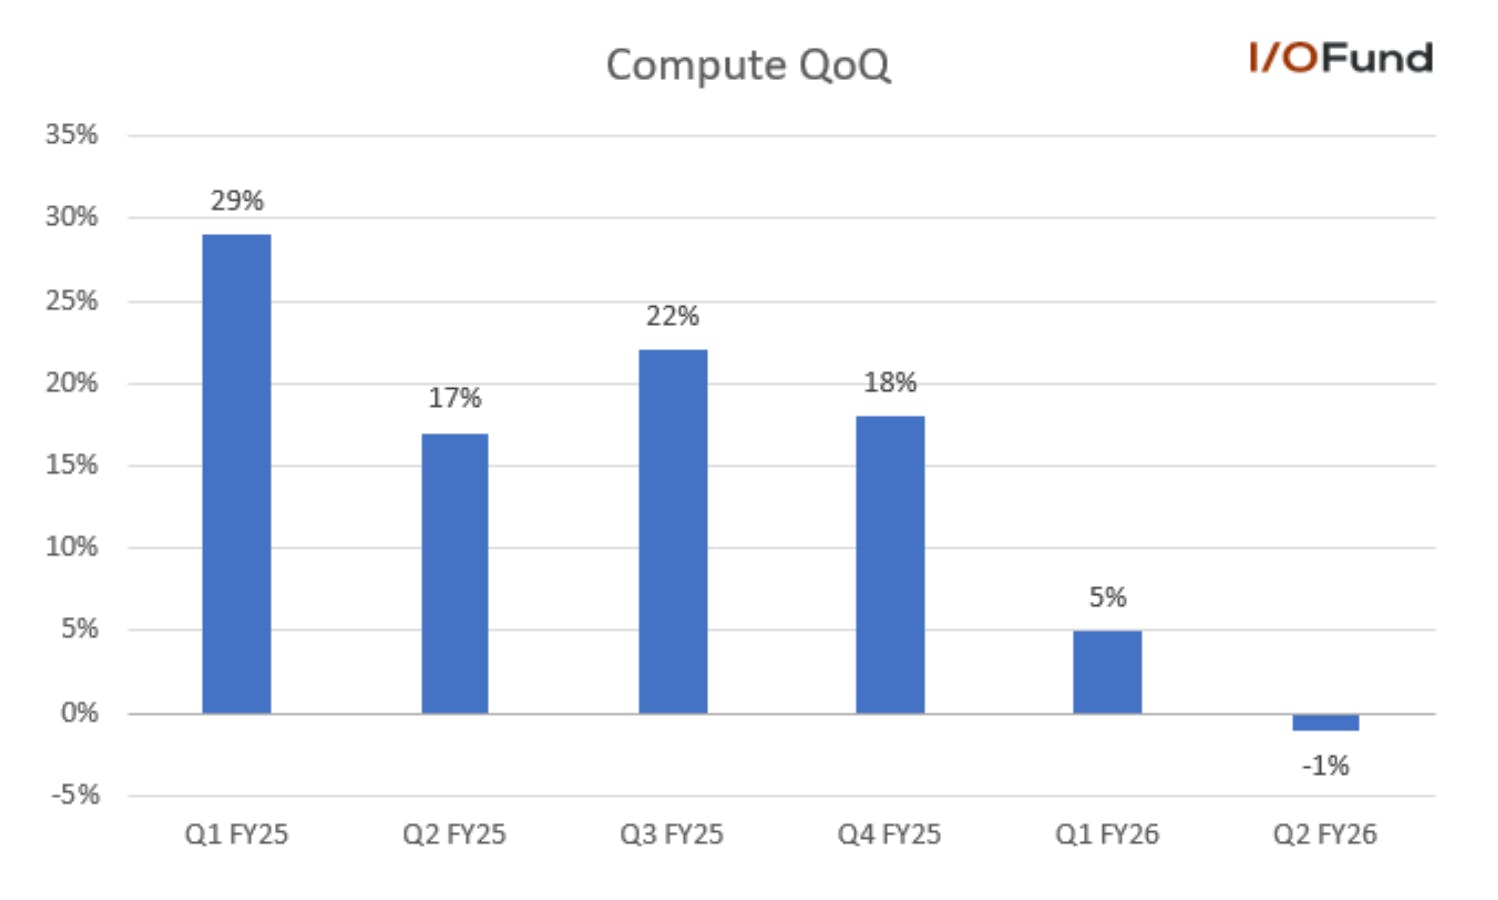
On a more positive note, Nvidia said that it is continuing to ramp Blackwell and now Blackwell Ultra GPUs, with growth of 17% QoQ. Based on comments from Q1 placing Blackwell revenue in the $23.5-24B range, this would place Blackwell revenue approaching $28 billion.  

Networking growth was also robust in Q2, helping offset the softness in Compute as revenue rose 46% QoQ and 78% YoY to $7.25B. This marked a 22 point acceleration from 56% YoY growth in Q1. Nvidia said the strong performance in Networking was driven by “growth of NVLink compute fabric for GB200 and GB300 systems, the ramp of XDR InfiniBand products, and adoption of Ethernet for AI solutions.” 

  • Gaming revenue was $4.29 billion, rising 14% QoQ and accelerating 7 points to 49% YoY. Nvidia said this was driven by sales of Blackwell-based GPUs. 
  • Automotive revenue rose 69% YoY and 3% QoQ to $586 million. 
  • Pro Viz revenue rose 32% YoY and 18% QoQ to $601 million. 
  • OEM and other revenue rose 97% YoY and 56% QoQ to $173 million. 

Margins Outperform in Q2 with Strong Expansion 

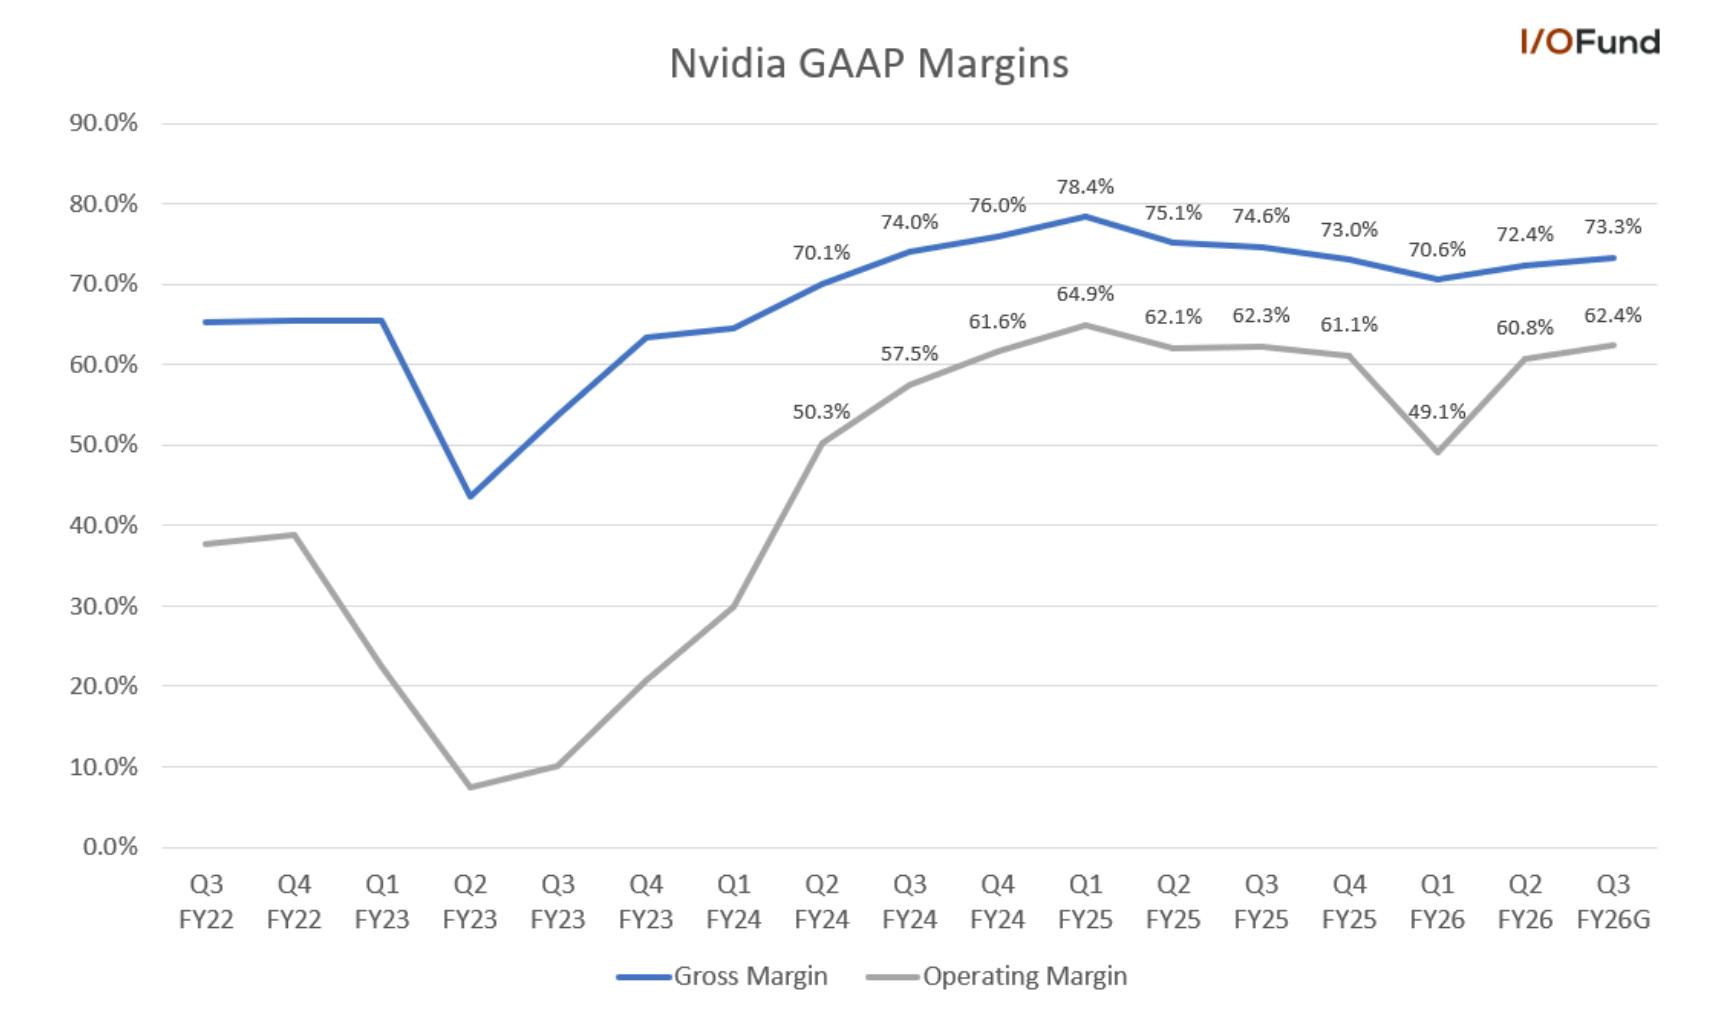
Despite the softness in data center compute, Nvidia outperformed on margins, beating its guidance across the board and delivering a notable uplift in operating margin. Nvidia guided for more sequential improvement in operating margin in Q3, to the highest level since Q1 FY25. 

  • GAAP gross margin was 72.4% in Q2, slightly ahead of guidance for 71.8%. Adjusted gross margin was 72.7%, or 72.3% excluding $180M in H20 inventory releases, ahead of guidance for 72%. 
  • For Q3, Nvidia guided for GAAP gross margin to improve nearly 1 point to 73.3%, +/- 0.5%, and adjusted gross margin to improve to 73.5%, +/- 0.5%. 
  • GAAP operating margin was 60.8% in Q2, improving nearly 12 points QoQ and coming in 1.7 points ahead of guidance for 59.1%. Adjusted operating margin was 64.5%, also up nearly 12 points QoQ and 1.4 points ahead of guidance for 63.1%. 
  • For Q3, Nvidia guided for GAAP operating margin to expand 1.6 point QoQ to 62.4%, signaling continuing operating leverage tailwinds in the quarter. Adjusted operating margin was guided at 65.7%, up 1.2 points QoQ. 
  • GAAP net margin was 56.6%, up 14 points QoQ and more than 6 points ahead of guidance for 50.2%. Adjusted net margin was 55.2%, up 10 points QoQ. 
  • For Q3, Nvidia’s guidance implies a GAAP net margin of 52.9%, moderating 3.7 points QoQ. 
Slight Adjusted EPS Beat in Q2 

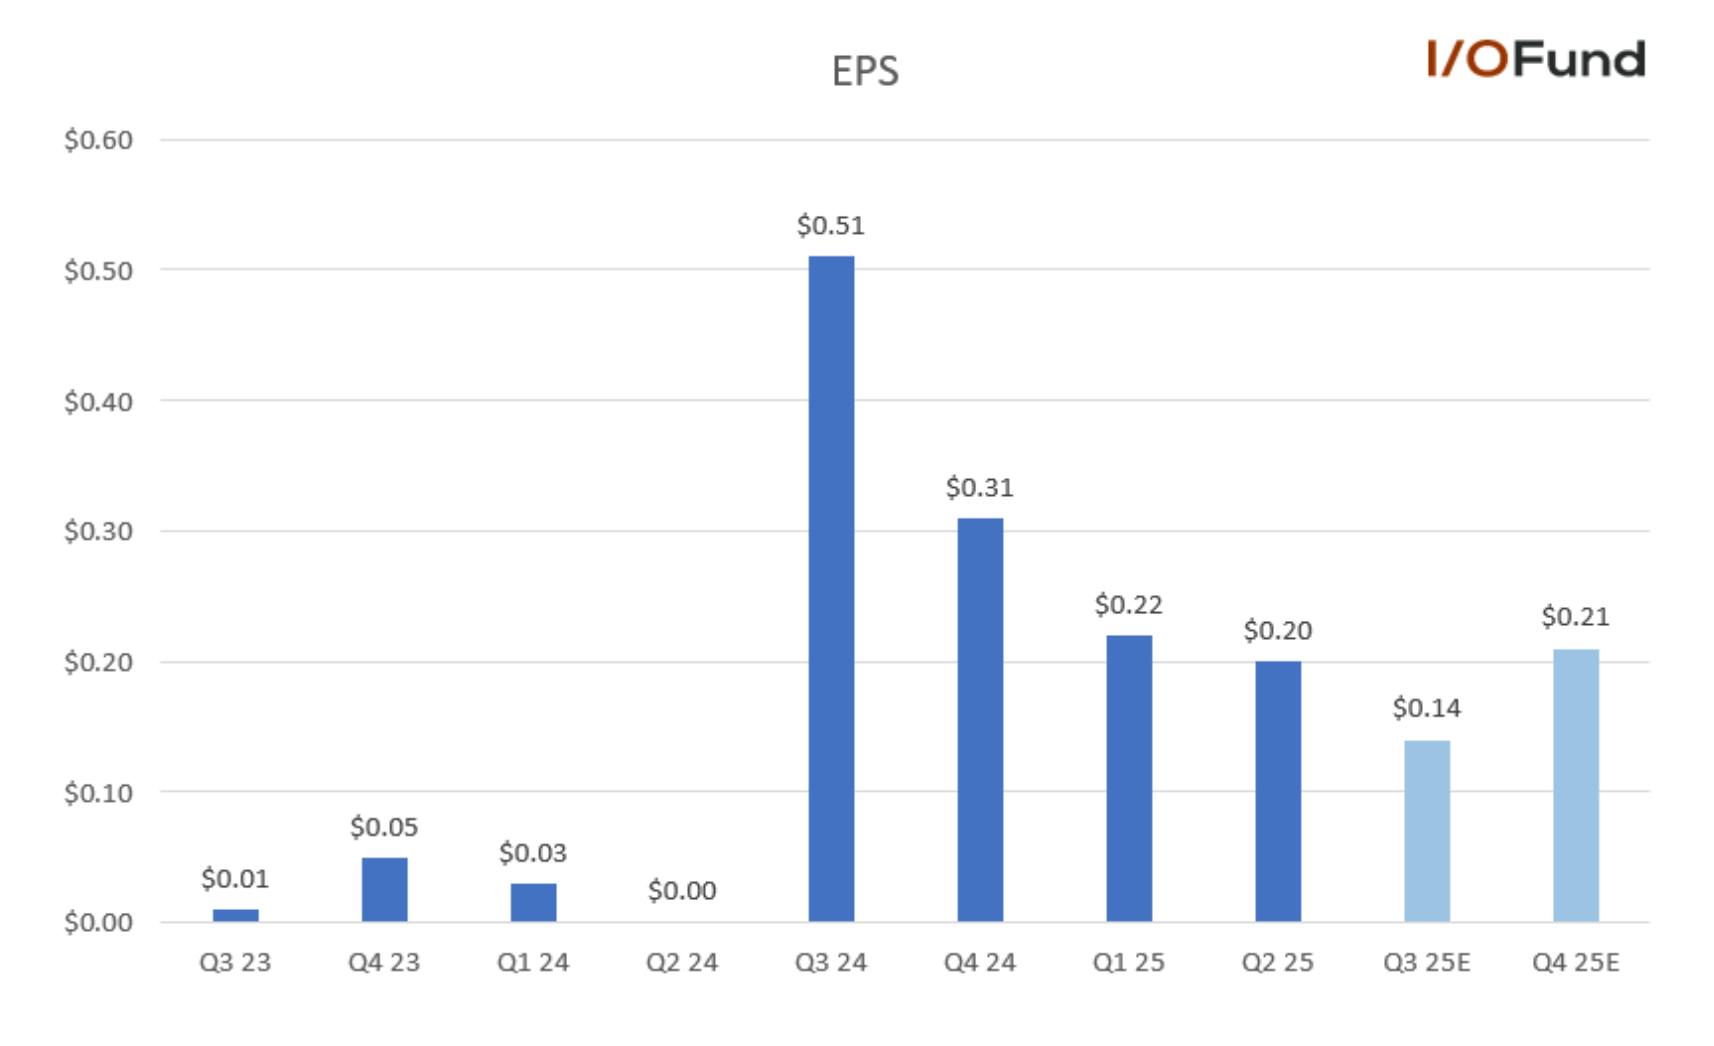
Nvidia reported just a 3.9% adjusted EPS beat in Q2, reporting $1.05 in earnings versus estimates for $1.01. This corresponds to growth of 54.4% YoY, rebounding substantially from Q1’s H20-affected 32.8% growth. Adjusted ESP growth is expected to remain strong through the rest of the fiscal year, at 47.2% and 53.2% in Q3 and Q4.  
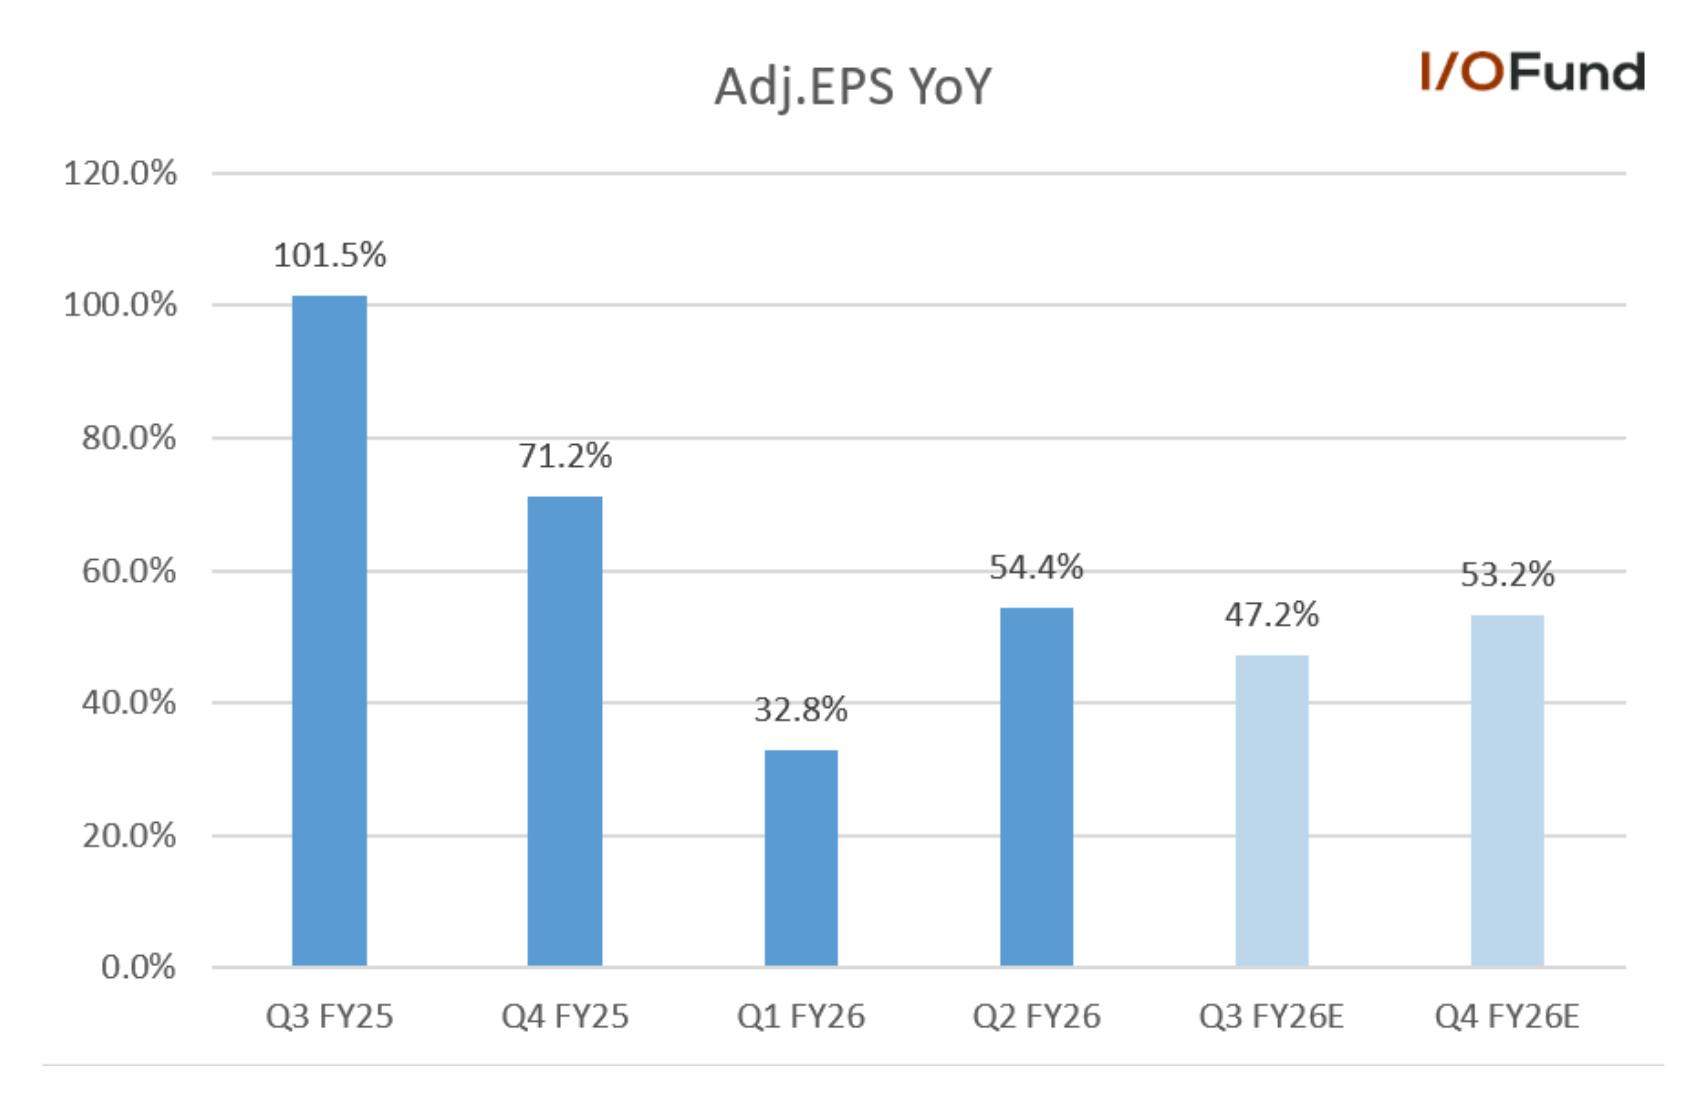
For FY26, analysts are currently expecting Nvidia to earn $4.36 in adjusted EPS, up 45.8% YoY. This has improved $0.20 since May’s estimate of $4.16, or 39.2% YoY growth. While still early, Nvidia’s earnings growth is expected to remain quite strong in FY27 at 38% YoY to $6.02. 

Cash Flow Margins Drop to Lowest Level since Q4 FY23 

Nvidia’s cash flow margins dropped to the lowest level since Q4 FY23, as sharp QoQ growth in accounts receivable and inventories weighed on both operating and free cash flow. 

  • Operating cash flow was $15.37 billion, down from $27.41 billion in Q1. OCF margin was 32.8%, down nearly 30 points QoQ and more than 15 points lower YoY.  
  • Free cash flow was $13.45 billion, down from $26.14 billion in Q1. FCF margin was 28.8%, again down more than 30 points QoQ and more than 16 points lower YoY. 
  • Accounts receivable surged $5.7 billion QoQ, or nearly 26%, to $27.8 billion. Nvidia said this was driven by timing of cash collections and Blackwell Ultra ramping late in the quarter. 
  • Inventories rose more than $3.6 billion QoQ, or 32%, to $14.96 billion, to support Blackwell Ultra’s ramp. 
  • Cash and equivalents totaled $56.8 billion, while debt remained steady at $8.47 billion.  

$200 Billion Run Rate (and why it matters) 

The Q3 guide was key as if we assume a similar mix of data center to other segments, Nvidia’s Q3 guidance puts it on the brink of achieving a $200B data center run rate with Q3 data center at $48.5B DC at midpoint.  

We had outlined more than a year ago in our free analysis that analyst estimates were too low, Nvidia Q1 Earnings Preview: Blackwell And The $200B Data Center stating: “These are the current estimates, yet if the analysts are correct, then the far right of the graph will end in $50B quarterly revenue. The difference between the current consensus and this much higher trajectory can be summarized in one word: Blackwell.” At the time, consensus was that we end the year with $33B in revenue. 

In fact, if we grow 10% QoQ in Q4 (it’s likely to be higher), then the data center will have quarterly revenue of $53.4 billion or about 62% higher than where analyst estimates were in May of 2024. This is a substantial disconnect for the world’s most valuable company (and a profitable one for investors who track this). 

The reason this matters is that if we nail the $50B quarter (very likely we do at $53.4B) then we are on track to hit a $75 billion data center quarter by the end of fiscal 2027. This assumes a 50% CAGR over 6 quarters and 10%-11% QOQ data center growth. Keep in mind, capex just grew 23% QoQ – which helps illustrate why 10% to 11% QoQ should be doable.  

If we do reach a $75 billion data center quarter compared to the $47 billion quarter that was recently reported, then that’s tracking about 60% growth in the AI segment. When you layer-in that we like to buy low when we can, and the market likes to sell semiconductors stocks at cyclical lows (when it’s really the best time to buy) we may see even more upside. 

Note: I elaborated on this pre-earnings in various interviews this week including Bloomberg, Schwab and Fox Business. Bloomberg, Schwab and Fox Business.  

$6 Trillion Market Cap Prediction – Revisited 

Nvidia has a 30 forward PS 3-year median but even if we go with something more reasonable like a 20 forward PS, then the market cap would be $6 trillion for $300 billion data center revenue.

From my perspective, it’d be better to get the stock lower if there is high confidence in reaching this market cap.

$10 Trillion Market Cap – Revisited 

To get to a $10 trillion market cap at a 20 forward PS, Nvidia’s revenue would have to be $500 billion. Analysts have the company reaching this a little after the year 2033 whereas I believe it will reach $10 trillion before 2030.  

The reality is that with Nvidia’s trajectory, we could see this market cap as early as 2028. That’s because we have not factored in software to the equation, which is expected to be an equal size market as hardware. The timing on software is tricky, and thus the I/O Fund has primarily preferred lower risk, yet also hypergrowth AI hardware stocks. 

Nvidia essentially has to grow the data center at a 30% CAGR for two years from 2026-2028 to reach my prediction of $10 trillion market cap two years early.  

That would mean analyst estimates are five years off as analysts have Nvidia reaching this revenue into the first quarter of 2034.

Note that I'm not stuck on this happening – we will shift if the market shifts. However, it leads back to why Q3 puts us right on track as the $50B data center quarter is achievable this year (the first milestone for these predictions). 

What Jensen Huang said in the Earnings Call 

I’d call this the total addressable market (TAM) earnings call as that was the predominant theme.  

In the opening remarks, JH stated: “We see $3 trillion to $4 trillion in AI infrastructure spend in the — by the end of the decade.” This was followed up by commentary that he sizes the market at $600 billion today. The math there is 5X growth.  

These are strong comments and thus it was followed up on during the Q&A where JH expanded his comments to say: 

“And so over the next couple of years, you're going to — well, you asked about longer term. Over the next 5 years, we're going to scale into with Blackwell, with Rubin and follow-ons to scale into effectively a $3 trillion to $4 trillion AI infrastructure opportunity. The last couple of years, you have seen that CapEx has grown in just the top 4 CSPs by — has doubled and grown to about $600 billion. So we're in the beginning of this build-out, and the AI technology advances has really enabled AI to be able to adopt and solve problems to many different industries.” 

This was followed up on by an analyst who asked for more specifics about what Nvidia’s share of that would be. Frankly, my guess would have been about 30% to 50% for Nvidia but management stated it would be closer to high 50% to 70%. 

“Benjamin Alexander Reitzes 

Jensen, I wanted to ask you about your $3 trillion to $4 trillion in data center infrastructure spend by the end of the decade. Previously, you talked about something in the $1 billion range, which I believe was just for compute by 2028. If you take past comments, $3 trillion to $4 trillion would imply maybe $2 billion plus in compute spend. And just wanted to know if that was right and that's what you're seeing by the end of the decade. And wondering what you think your share will be of that. Your share right now of total 

infrastructure compute-wise is very high, so I wanted to see. And also if there's any bottlenecks you're concerned about like power to get to the $3 trillion to $4 trillion. 

Jen-Hsun Huang 

[…] United States represents about 60% of the world's compute. And over time, you would think that artificial intelligence would reflect GDP scale and growth and so — and would be, of course, accelerating GDP growth. 

And so our contribution to that is a large part of the AI infrastructure. Out of a gigawatt AI factory, which can go anywhere from $50 billion to plus or minus 10%, let's say, $50 billion to $60 billion, we represent about $35 billion plus or minus of that and $35 billion out of $50 billion per gigawatt data center.” 

My thoughts are that this could be “CEO math” which is often too high. For example, JH had said 1K racks were shipping per week yet the reality is this print didn’t confirm that statement was true. The CFO did state that in this earnings call, and naturally, CFOs tend to be more accurate so let’s see if the 1K rack statement comes to fruition in the next earnings report. 

Regarding what was stated above, if the current number is $600B for AI infrastructure and we have close to a $200B run rate, then 33% is a good solid number to work with, especially given energy will take front and center on costs as we go along. At $3-$4 trillion, JH is basically stating Nvidia could have a $1 trillion data center segment if Nvidia sees 33% of that by the end of this decade. That would be up from a $184B data center segment today and up from a $200B data center segment in Q3. 

Additional Commentary: 

Management drew attention to the magnitude that demand outstrips supply: “Right now, the buzz is — I'm sure all of you know about the buzz out there. The buzz is everything sold out. H100 sold out. H200s are sold out. Large CSPs are coming out renting capacity from other CSPs. And so the AI-native start-ups are really scrambling to get capacity so that they could train their reasoning models. And so the demand is really, really high” 

In terms of why Rubin can stand its own against previous generations of GPUs and continue to drive forth demand, management expanded on the advent of reasoning agentic AI: 

“At the highest level of growth drivers would be the evolution, the introduction, if you will, of reasoning agentic AI. Where chatbots used to be one shot, you give it a prompt and it would generate the answer, now the AI does research. It thinks and does a plan, and it might use tools. And so it's called long thinking; and the longer it thinks, oftentimes, it produces better answers. 

And the amount of computation necessary for 1 shot versus reasoning agentic AI models could be 100x, 1,000x and potentially even more as the amount of research and basically reading and comprehension that it goes off to do.” 

Lastly, keep an eye on networking as it is a subtle clue that the NVL72s are starting to move the needle – above all else, we want to see these larger systems shipping as these massive SKUs are already at $28B this quarter and have a long runway to go. As you know, we are positioned to capture the AI networking tailwinds from these larger systems: 

“Networking delivered record revenue of $7.3 billion, and escalating demands of AI compute clusters necessitate high efficiency and low latency networking. This represents a 46% sequential and 98% year-on-year increase with strong demand across Spectrum- X Ethernet, InfiniBand and NVLink. Our Spectrum-X enhanced Ethernet solutions provide the highest throughput and lowest latency network for Ethernet AI workloads. Spectrum-X Ethernet delivered double-digit sequential and year-over-year growth with annualized revenue exceeding $10 billion. At Hot Chips, we introduced Spectrum-XGS Ethernet, a technology design to unify disparate data centers into giga-scale AI super factories. [ CoreWeave ] is an initial adopter of the solution, which is projected to double GPU-to-GPU communication speed.” 

Conclusion: 

I wouldn’t be surprised if the market continues to sell this report, as the market likes to do at cyclical lows for semiconductor companies. What’s quite impressive is that Nvidia has continued to beat even at its cyclical low (defined as being in-between GPU generations) and despite the curveball with China’s H20 revenue. 

Our fundamentals process favors QoQ acceleration and the 15% QoQ growth for Q3 helps put our estimates right on track. The strong networking growth spells good things to come as it indicates it’s the larger systems that are propping up the growth (Blackwell was stated to have grown 17% QoQ).  

Now is the perfect time to pause and look a the medium-term and longer-term picture to answer for ourselves if the world’s most valuable company can continue to grow – or are we in a bubble? Each Member will need to decide that for themselves although my answer is “yes, for many AI stocks we are in a bubble – but for Nvidia, we are not.” Hopefully, this post-earnings writeup helps to substantiate why I continue to believe there is room in this stock.

Please note: The I/O Fund conducts research and draws conclusions for the company’s portfolio. We then share that information with our readers and offer real-time trade notifications. This is not a guarantee of a stock’s performance and it is not financial advice. Please consult your personal financial advisor before buying any stock in the companies mentioned in this analysis. Beth Kindig and the I/O Fund own shares in NVDA at the time of writing and may own stocks pictured in the charts.

Recommended Reading:

Bitcoin Bull Market Guide: When to Hold, Trim, or Re-Enter (Webinar) 

In late 2022, Bitcoin fell into the $16,000 range amid the fallout from the FTX scandal. At the time, credible institutional buy calls were nowhere to be found, as Wall Street largely stayed on the sidelines.

Fast forward to today—Bitcoin now trades more than 600% above its 2022 lows, and a flood of institutional optimism has now entered the news cycle. Analysts and money managers are now calling for another doubling in price before year-end.

Market sentiment has always been a potent force. History shows that the most enthusiastic bullish narratives tend to emerge when prices are stretched, while more cautious takes often surface near market bottoms ,and this cycle is no different.

Throughout Bitcoin’s history, the I/O Fund has continued to distinguish itself with timely, accurate Bitcoin analysis dating back to 2019. While others chased the 2021 frenzy with $200,000 to $500,000 price targets, we remained disciplined—scaling back crypto exposure by half to secure profits. Later, when Bitcoin revisited the $16,000 region, we issued a Strong Buy Alert to our free subscribers, which was subsequently picked up by Tier 1 media.

Our track record is not the product of hype but of a systematic framework—one built on technical analysis, on-chain metrics, and a close watch on global liquidity conditions. Today, this very process is flashing warning signs, which has us, once again, going against the popular narratives, as we have begun the process of taking gains in Bitcoin and reducing risk.

Because of the warnings that our system is picking up on, the I/O Fund partnered with WealthUmbrella to release a free one-hour webinar outlining these risks as well as what we want to see to confirm a potential path higher from here. The presentation details the forces that move Bitcoin, along with the risk management techniques that enabled us to sidestep the 2021 top and re-enter near the 2022 low.  

Below are a few highlights from the presentation:  

In the below clip, Knox Ridley highlights the unique nature of Bitcoin’s price movements and how the I/O Fund manages risk in a market where narrative-based investing does not work. Since Bitcoin lacks traditional fundamentals, we rely on an original process designed specifically for crypto  — one that has allowed us to repeatedly identify both tops and bottoms. 

Though classic fundamental analysis does not apply to Bitcoin, there is a unique set of data points that can be analyzed to help determine the health of Bitcoins’ trend. This type of analysis is called on-chain analysis, which is explained in the below Clip, by Vincent Duchaine of WealthUmbrella.

Sign up below to Access the full video, which will offer: 

  • Interactive charting of Bitcoin. 
  • The price levels that must hold to confirm another leg higher in Bitcoin. 
  • What our game plan is and how far Bitcoin will drop if this level breaks. 
  • What on-chain analysis is telling us about the health of Bitcoin. 
  • The probable price target that WealthUmbrella is projecting before seeing a cyclical top.

If you are a crypto investor who would like know our plans for participating in any remaining upside Bitcoin has to offer, and how we plan to further minimize the downside, we encourage you to attend one of our weekly webinars. Every Thursday at 4:30 EST, portfolio manager, Knox Ridley, goes through various broad market charts, as well as discusses our game plan on various stocks and crypto currencies that we currently own or want to own. Learn more here

Please note: The I/O Fund conducts research and draws conclusions for the company’s portfolio. We then share that information with our readers and offer real-time trade notifications. This is not a guarantee of a stock’s performance and it is not financial advice. Please consult your personal financial advisor before buying any stock in the companies mentioned in this analysis. Beth Kindig and the I/O Fund own BTC at the time of writing and may own stocks pictured in the charts.

Recommended Reading:
Coherent Q4: Data Center Growth Slowing QoQ; Competitive Concerns 

Coherent has all of the right products to potentially become a sizable player in AI networking. Primarily, Coherent’s growth story centers around supplying Nvidia with pluggable optical transceivers (400G, 800G, 1.6T) including EML lasers, VSCEL lasers and CW lasers, and emerging CPO technologies for next-generation switches and interconnects.   

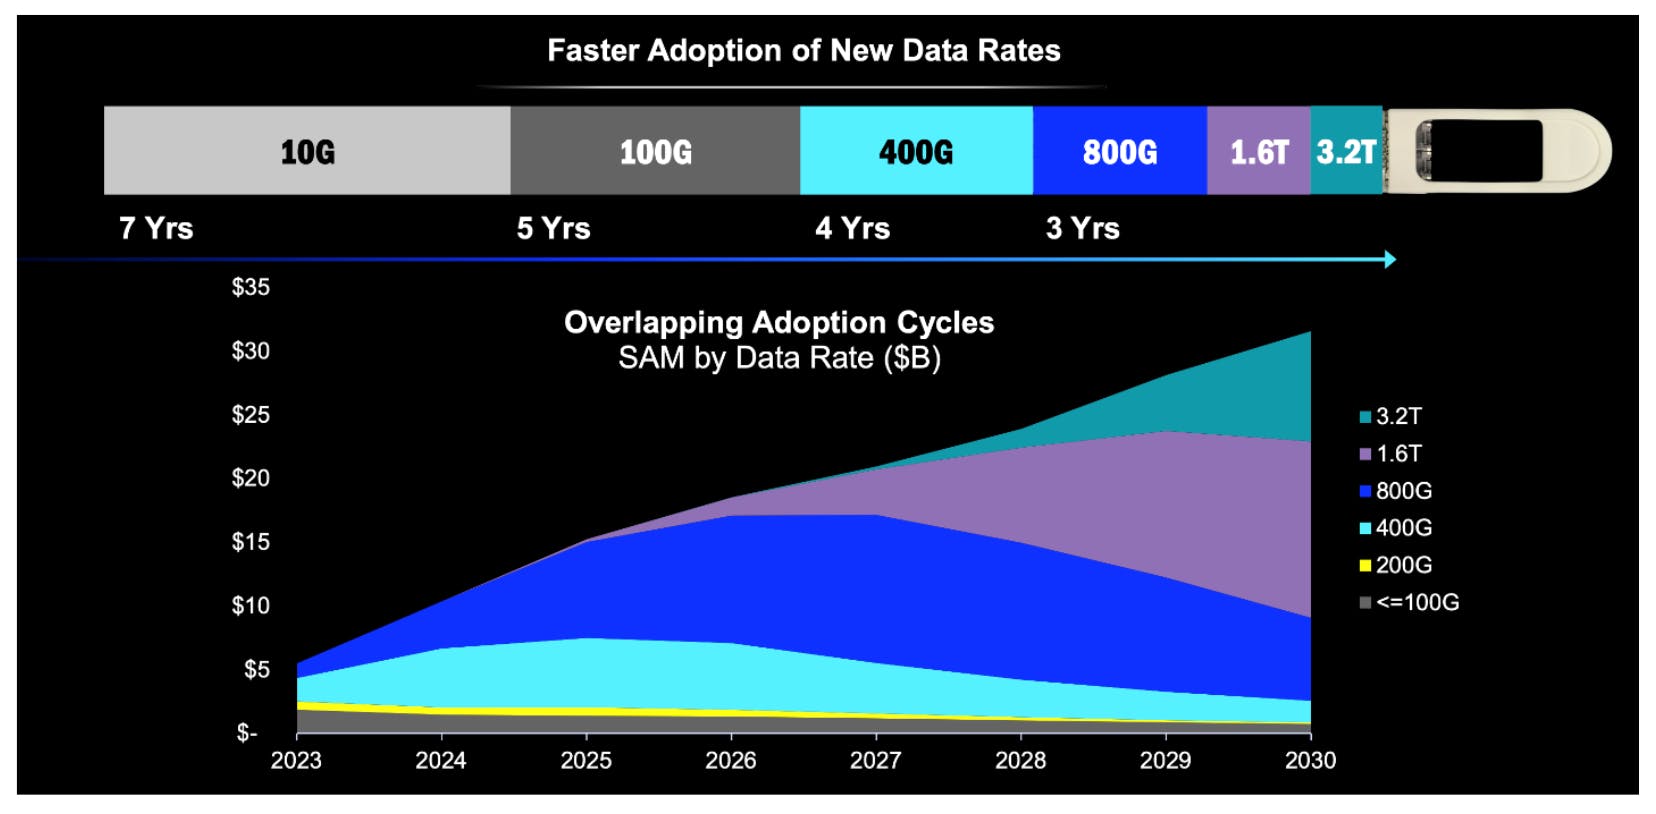
Transceiver speed has been growing with the highest data rates ranging from 100G to 200G to 400G. AI servers are driving a market for 800G data rates, which are shipping in production now, and 1.6T rates, which are initially shipping yet expected to grow in volume come 2026. 

Coherent’s transceivers work with both Ethernet or InfiniBand, as well as proprietary protocols such as Nvidia’s NVLink and Nvidia’s interconnect chips NVSwitch. The company has stated that their 100ZR pluggable transceivers can upgrade old 10GBps Ethernet links with 100 GBps at the optical network edge, representing a 10X upgrade. 

Coherent designs and manufactures the components, such as lasers, detectors and passive optics. Manufacturing the components (as opposed to buying them) is a strength as the company has supply chain resiliency by controlling the end-to-end process, and the manufacturing takes place primarily in the United States with some in Europe. 

What COHR must navigate is that other companies also offer optical interconnects, and thus, competition is heightened in the datacom transceivers, silicon photonics, and CW/EML/VSCEL laser space. For example, Chinese companies such as InnoLight and Eoptolink compete with Coherent, larger companies like Broadcom, and then smaller companies with agile engineering like Lumentum also directly compete. In fact, Lumentum’s report was stronger than Coherent’s report this quarter in a a few key areas which likely drove COHR’s weak price action. 

In terms of fundamentals, Coherent was weak in terms of the company guiding for lower sequential growth in its datacom segment than the prior two quarters. The company’s margins are also coming under pressure, which is the most important line item for a hardware company in terms of investor appetite.  

With that said, I don’t think Coherent is out of the game by any means. There are some important things in the pipeline – all discussed for you below. 

Quick note on Coherent Divesting the Aerospace and Defense Business: 

This quarter, Coherent divested its underperforming segment Aerospace and Defense; selling the unit for $400 million. This will help the company streamline its operations and provide more cash to help pay down elevated debt. The sale will result in Coherent exiting from 10 sites and reducing employee count by 550 employees, and thus, will be accretive to EPS.  

According to analyst notes, the expected headwind to revenue will be $170 million, thus growth will appear lower in the forward growth estimates provided below although the company will be growing organically at a higher rate. 

Revenue Growth Decelerating to Single-Digits 

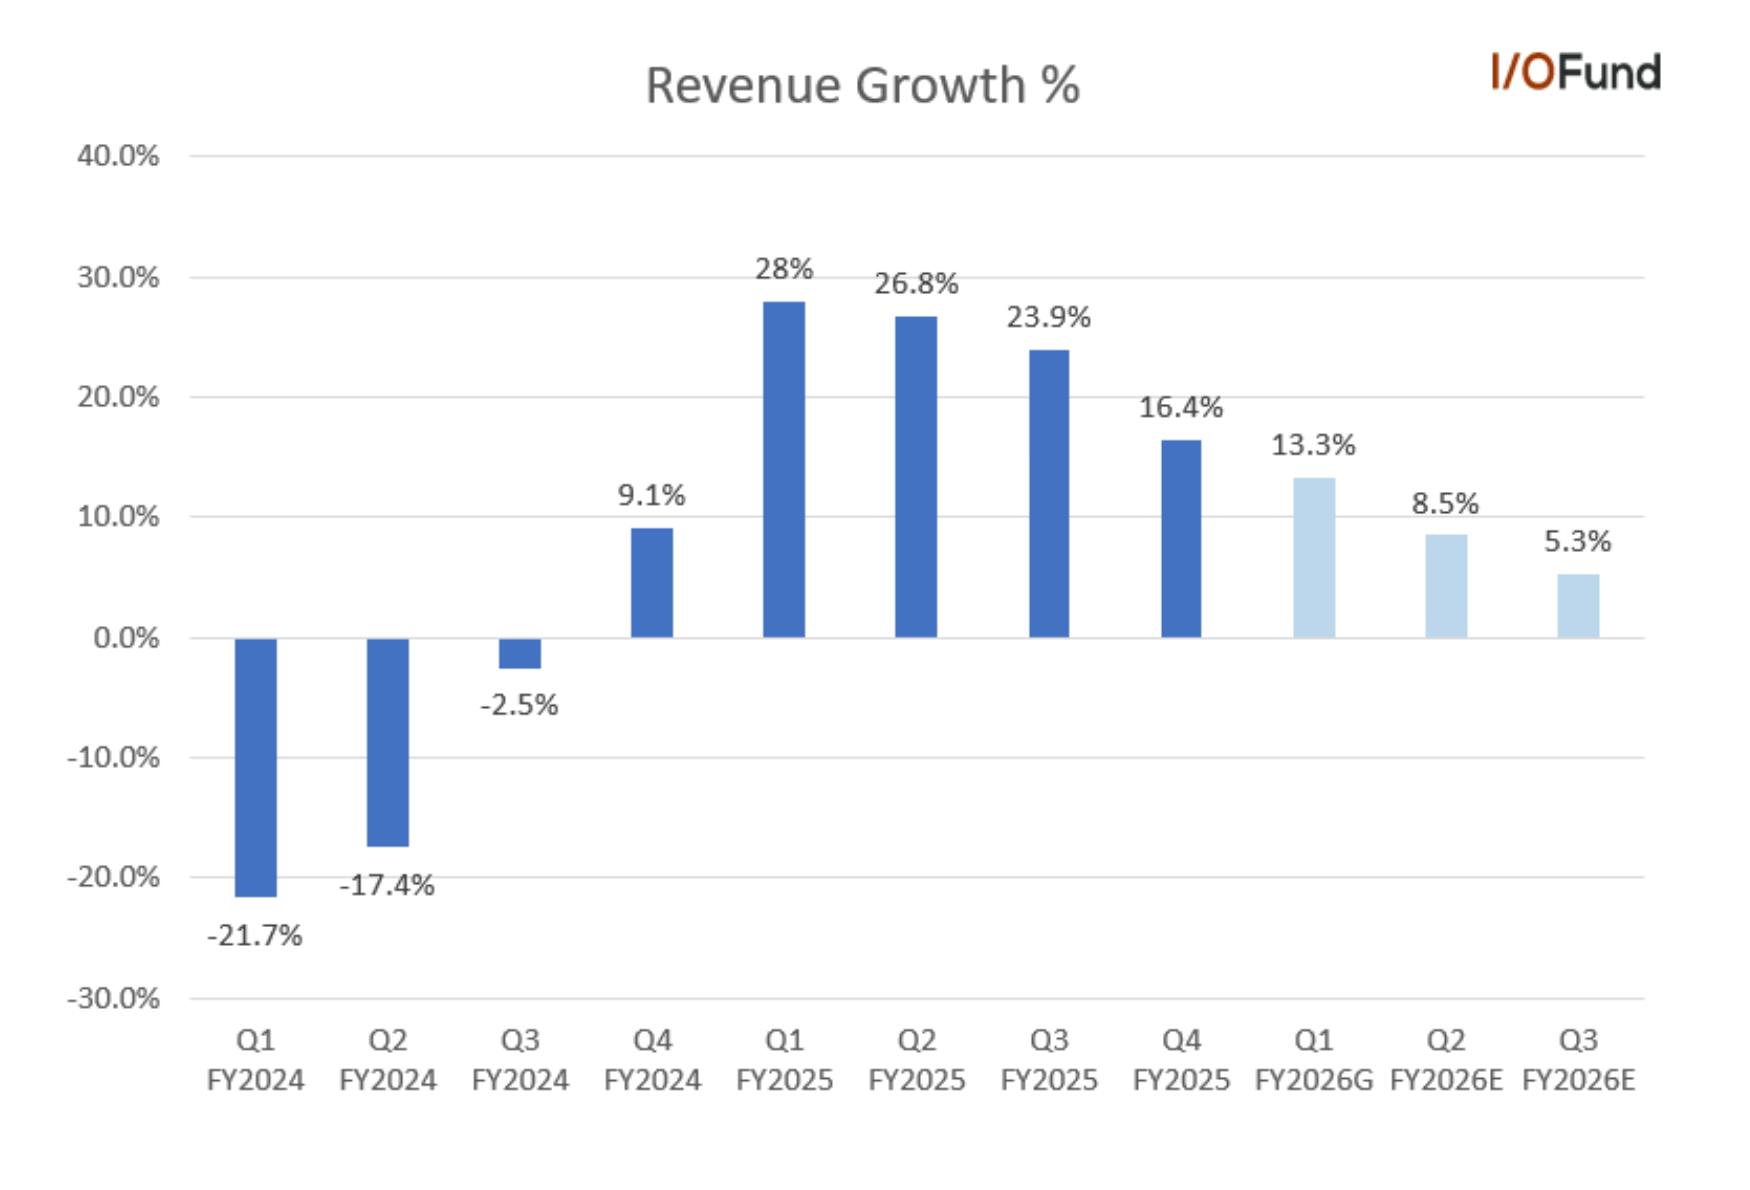
Coherent reported a slight 1.1% beat to revenue estimates, reporting Q4 revenue of $1.53 billion, up 16.4% YoY. Revenue growth has decelerated more than 10 points since the start of the fiscal year. 

For Q1, Coherent offered guidance for $1.46 to $1.60 billion in revenue, or $1.53 billion at the midpoint, excluding ~$0.02 billion in revenue related to its Aerospace & Defense unit that it expects to occur after the sale is closed.  

This compares to consensus estimates for $1.55 billion. On a YoY basis, this points to YoY growth of 13.3% at midpoint, with growth expected to decelerate to the mid single-digit levels in both Q2 and Q3.  

For fiscal 2025, Coherent reported 23.4% YoY growth in revenue to $5.81 billion, driven by a 51% increase in data center and communications revenue, offset by a (2%) decline in industrial and other revenue. This is discussed further in detail below. 

For fiscal 2026, Coherent is expected to report just 8.4% revenue growth to $6.3 billion, down from 10.0% growth to $6.37 billion at the end of July; however, the decline in growth estimates looks to stem from the Aero & Defense unit divestment.  BofA had estimated the sale would create a ~$170 million headwind (implying ~$6.2 billion), yet estimates are only ~$70 million lower, suggesting other segments are offsetting some of the impact.  

May 2025 Investor’s Day: 

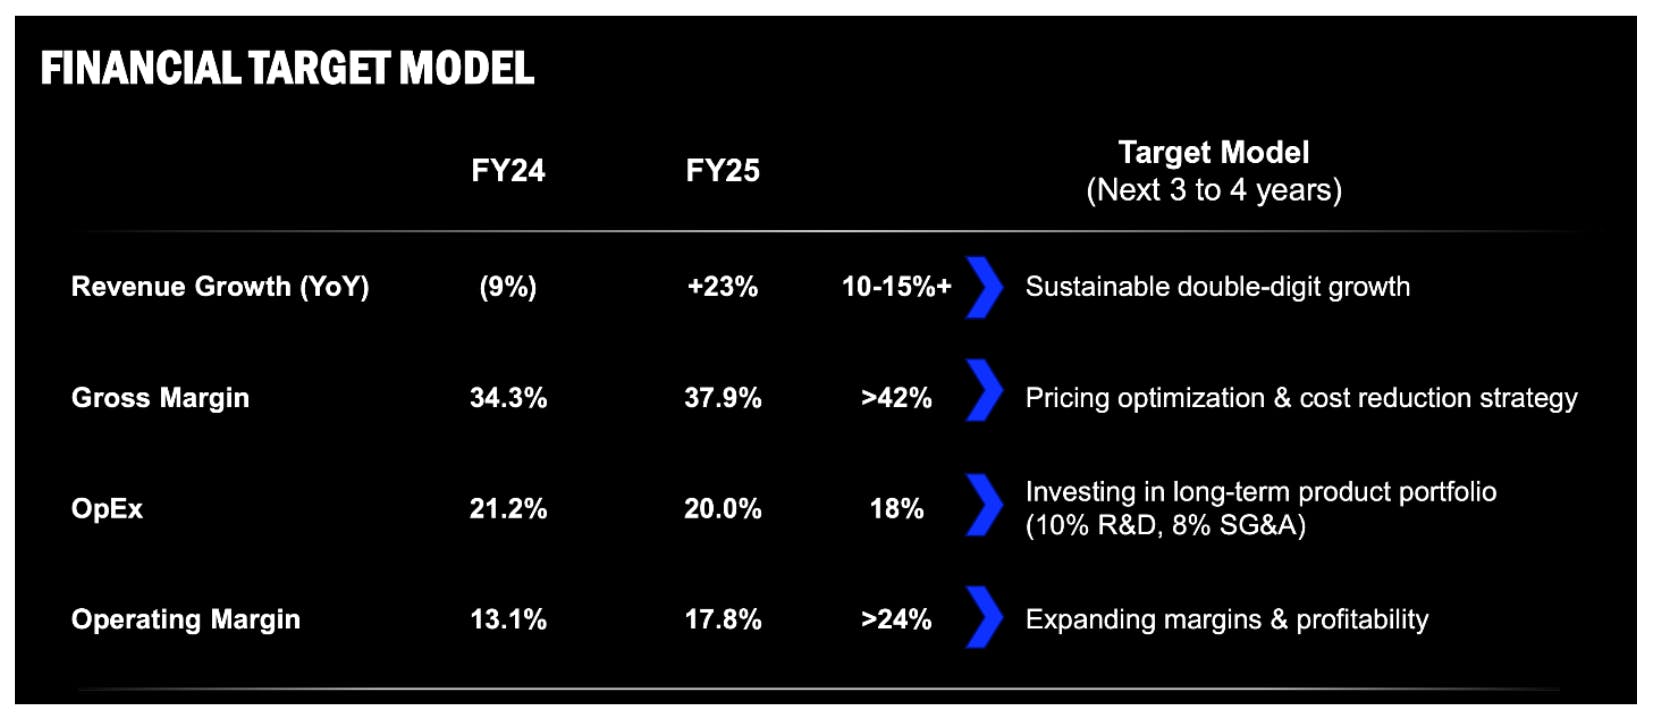
A few months back, Coherent provided updated growth targets for revenue and earnings. It’s notable that Coherent is guiding for lower top line growth in the coming years yet helps to illustrate the primary growth will be on the bottom line. 

  • Revenue growth of 23% in FY25 versus target model of 10% to 15% 
  • Yet, operating margin expansion expected of 6.2+ points to 24% operating margin 

Source: Coherent Investor DayCoherent Investor Day 

Key Segments: Networking Growth Decelerates to 39% 

Networking remains the primary driver of Coherent’s growth, with the company announcing that it commenced revenue shipments of its first 1.6T transceiver products and its first differentiated liquid-crystal optical circuit switch (OCS) platform. 

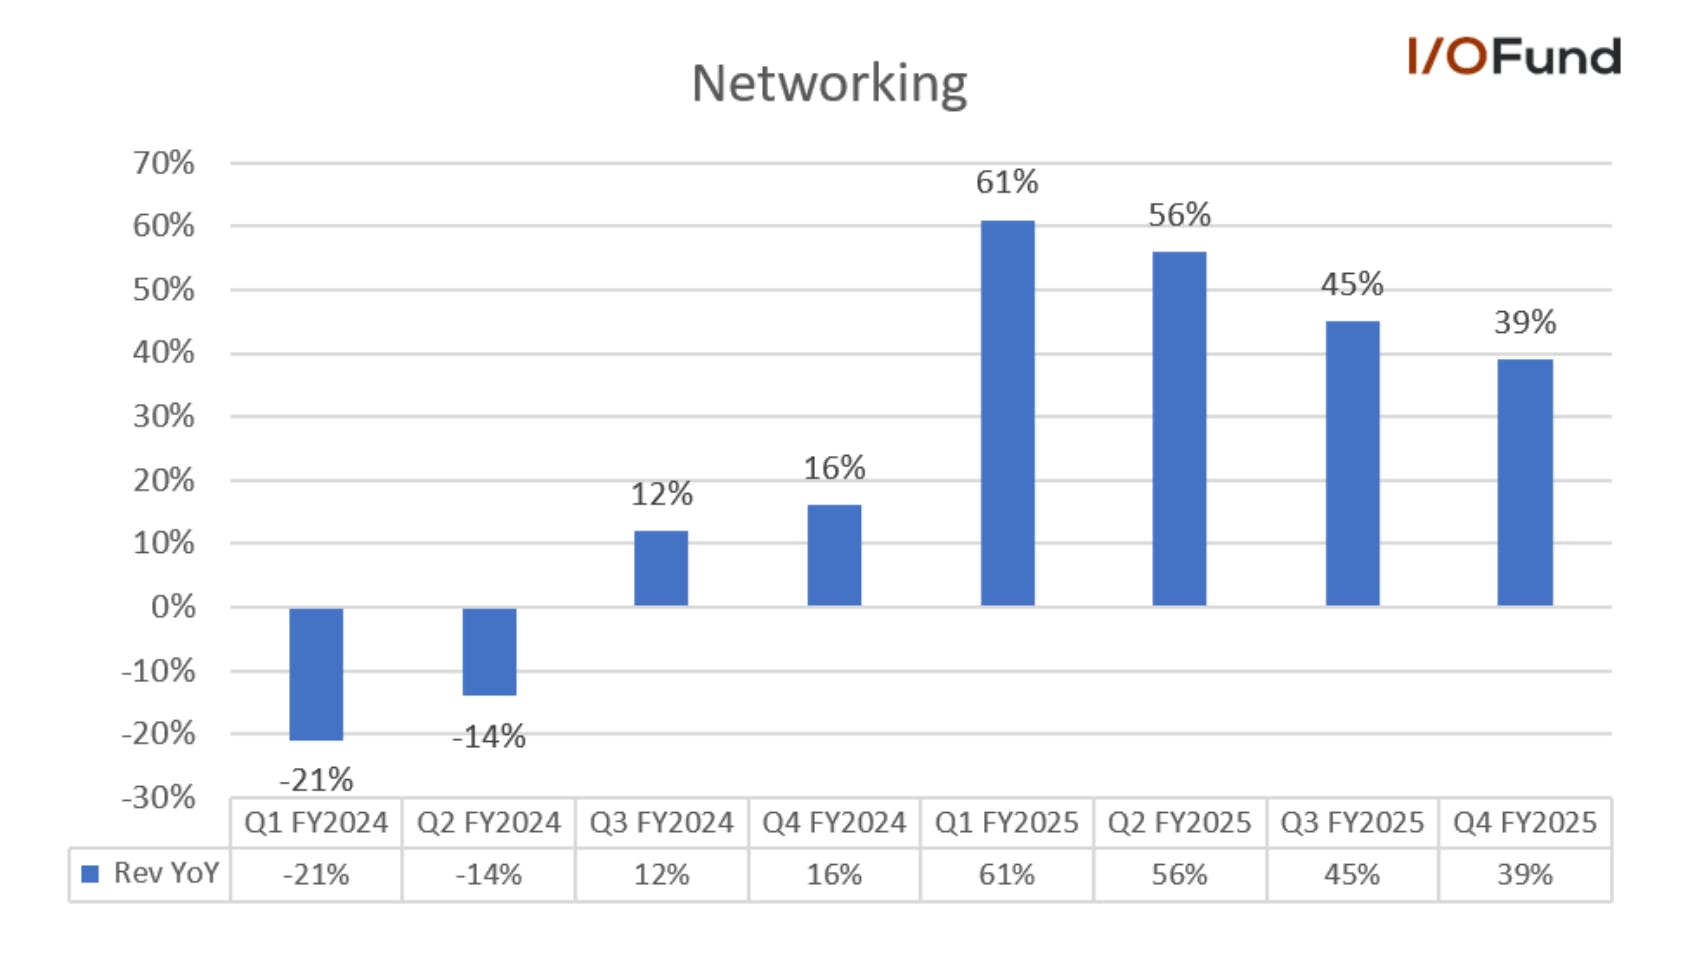
Networking revenue rose 39% YoY and 5% QoQ to $945.2 million in Q4, with its share of revenue growing by two points sequentially to 62%. For the full year, Networking revenue rose 49% YoY to $3.42 billion, accounting for 59% of revenue. 

Growth has decelerated steadily throughout the fiscal year, from 61% in Q1 to 45% growth in Q3 and now 39% in Q4. However, the primary concern is that the segment was showing a rather sharp deceleration on a QoQ basis, to the lowest sequential growth since early FY24. Coherent reported just 5% QoQ growth in networking in Q4, versus 10% in Q3.

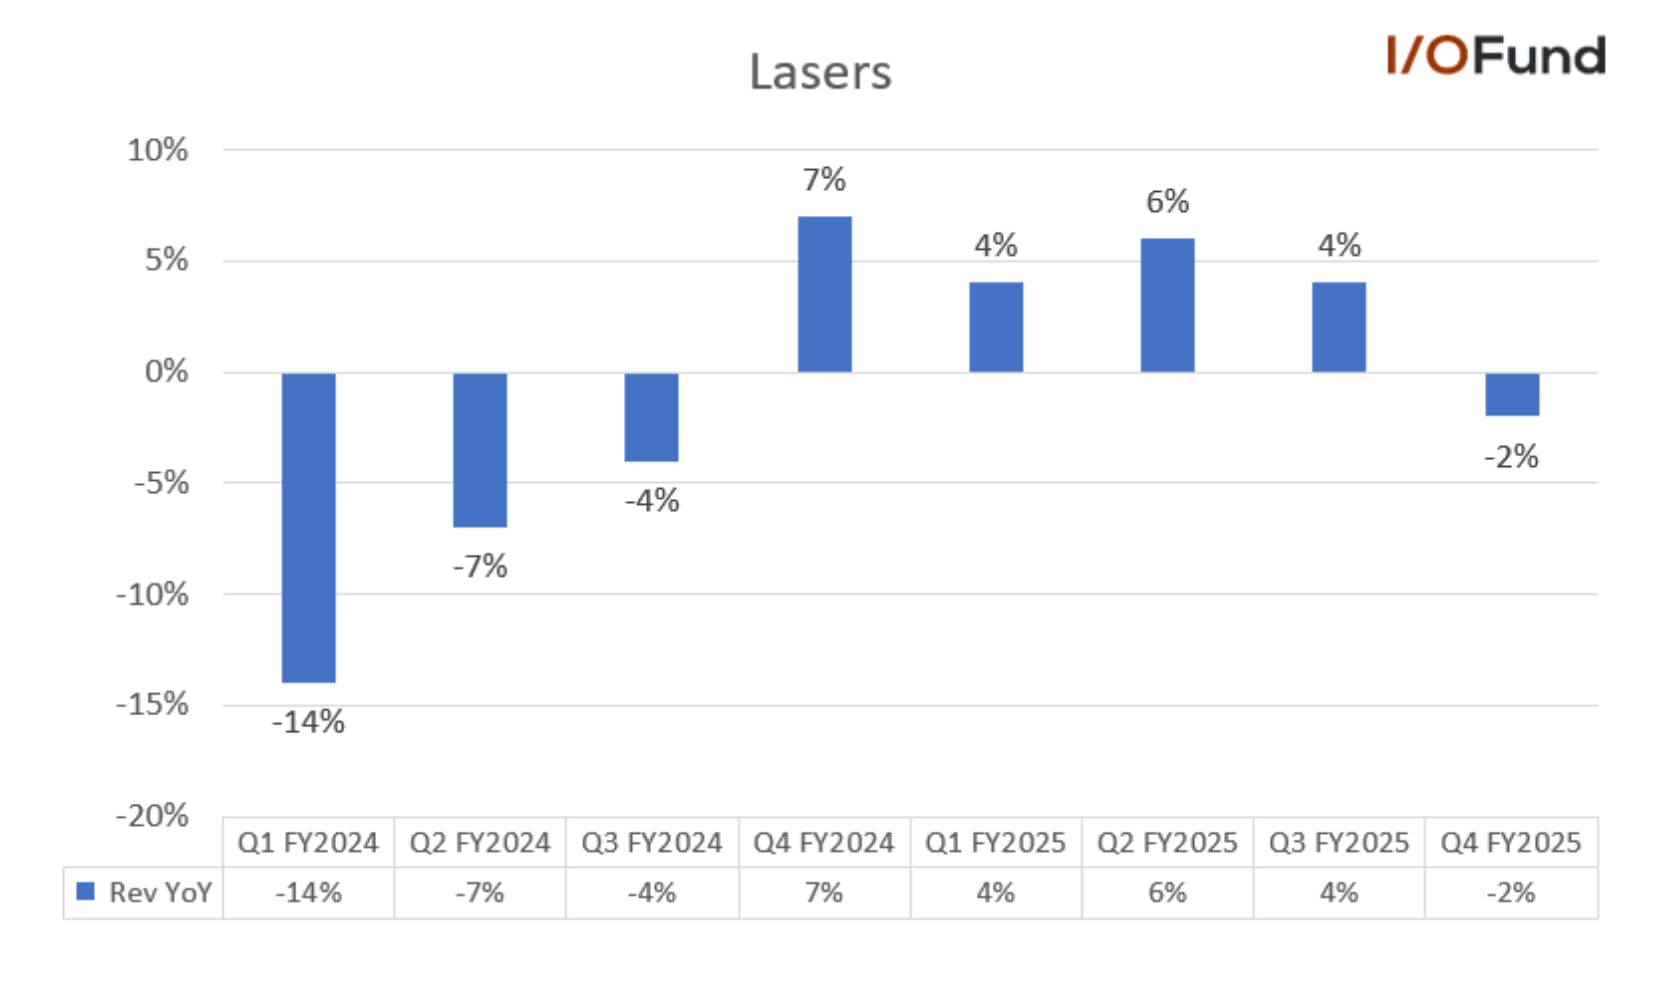
Lasers revenue declined (2%) YoY and (4%) QoQ to $348 million, the segment’s first YoY decline in five quarters. Lasers accounted for 23% of revenue in Q4, down from 24% in Q3. For the full year, Lasers revenue grew just 3% to $1.44 billion. 

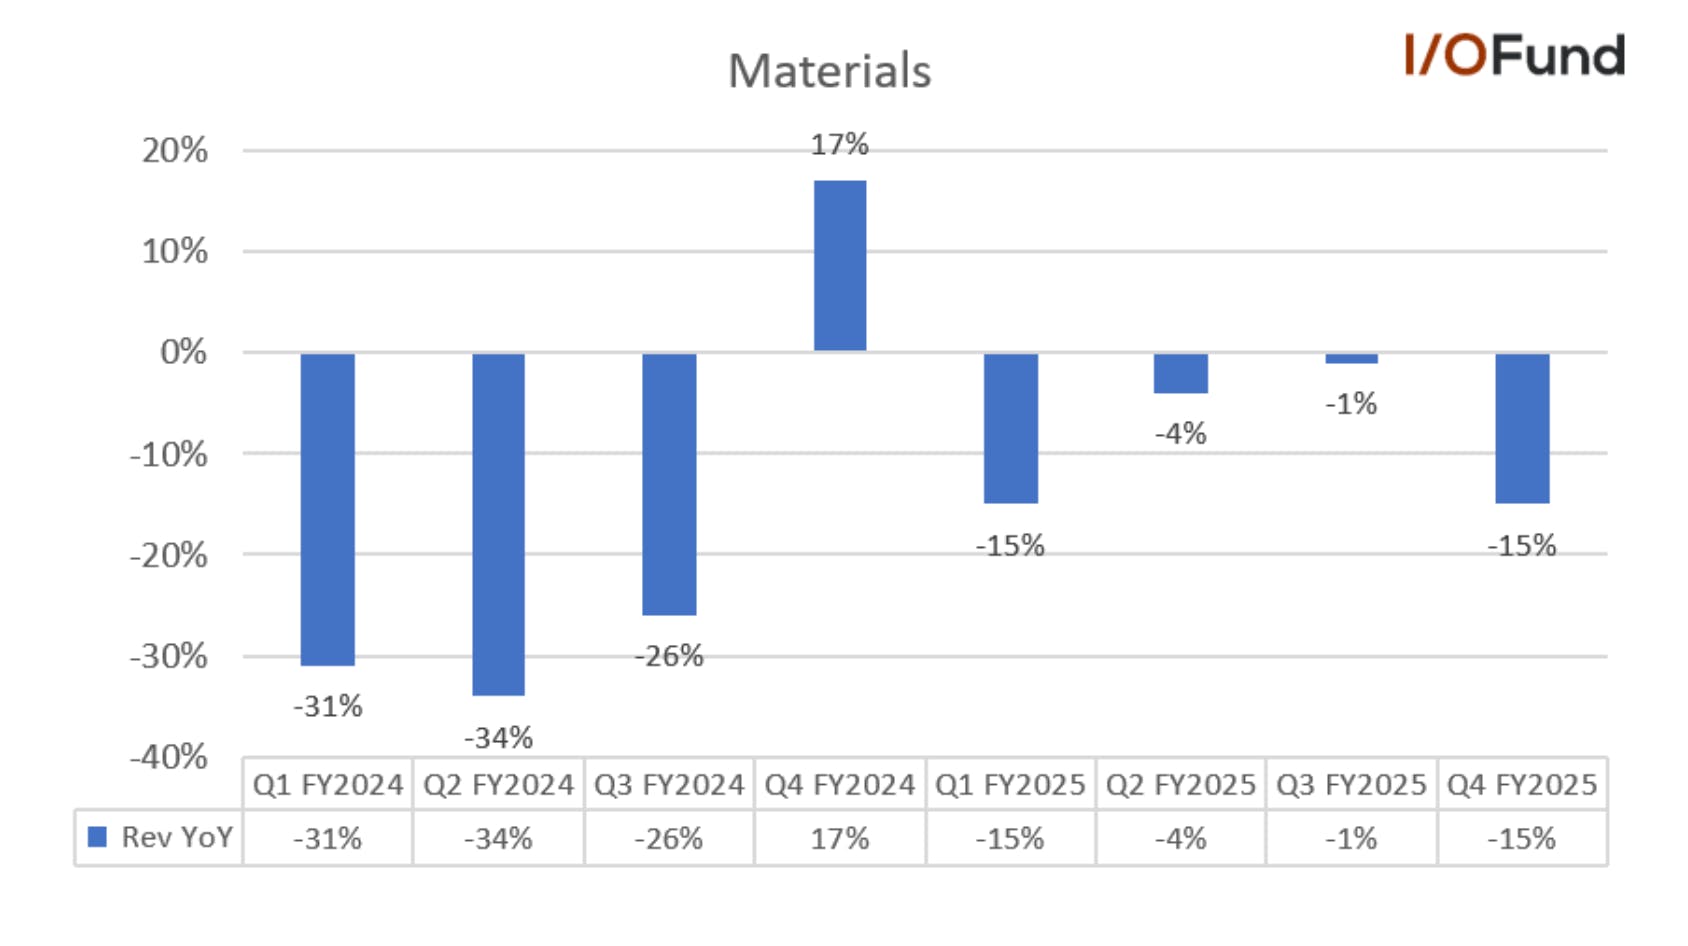
Materials revenue declined (15%) YoY and was flat QoQ at $236.2 million, its sharpest decline since Q1. Of the three segments, Materials was the only to see revenue decline in FY25, down more than (6%) YoY to $953.8 million. 

End Markets: Data Center Reporting Low 3% QoQ Growth 

Turning to end markets, Coherent has now reorganized its reporting into just two end markets: Data center and Communications, and Industrial (which includes its previously reported Instrumentation and Electronics end markets). 

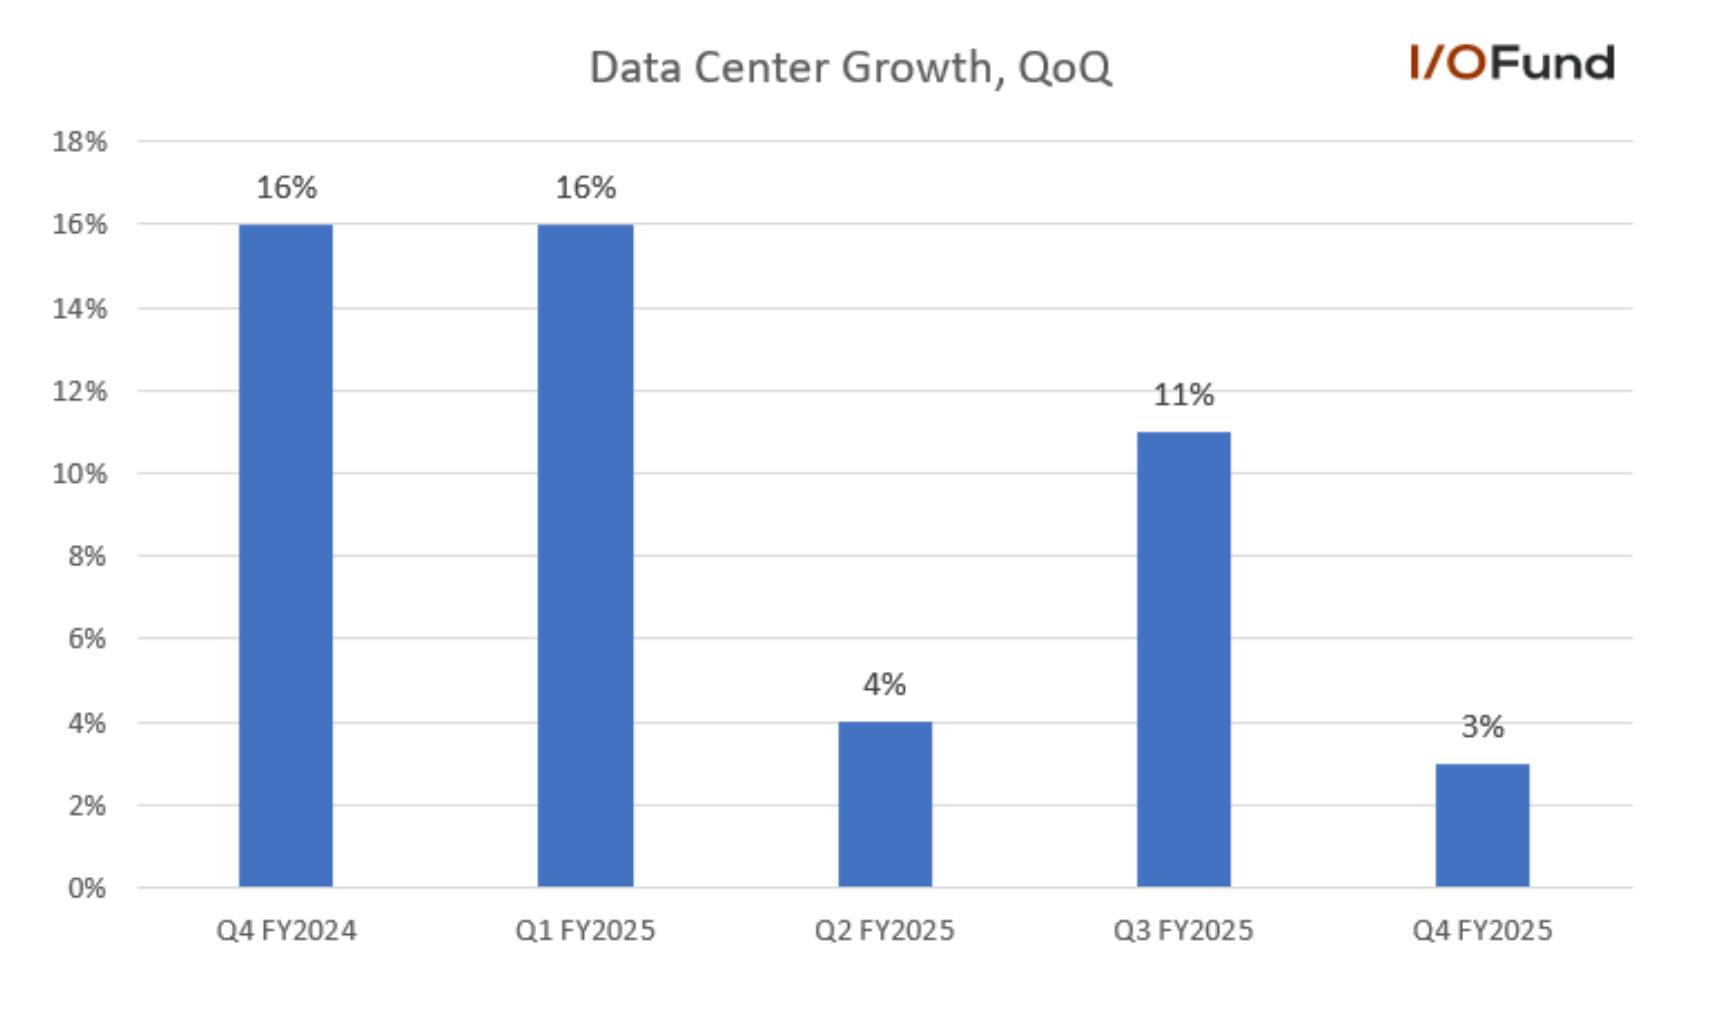
The main concern is that Data center growth has slowed dramatically on a QoQ basis, from 11% last quarter to 3% in Q4, despite signs of accelerating AI systems demand (capex spend increasing from Big Tech, Blackwell shipping, Blackwell Ultra seeing initial shipments, etc) 

Data center and Communications revenue rose 39% YoY and 5% QoQ in Q4 to $942 million. For the full-year, revenue increased 51% to $3.44 billion.  

Within this, Data center revenue increased 38% YoY but just 3% QoQ. For FY25, Data center revenue rose 61% YoY. Similar to Networking, the major concern here is that Data center growth has slowed dramatically on a QoQ basis, from 11% last quarter to 3% in Q4, despite those signs of accelerating AI systems demand.  

Management did state that “sequential growth rates can fluctuate quarter-to-quarter based on lumpiness of demand from our customers or supply or capacity related things,” but they offered little to soothe fears of rising competitive pressure within Nvidia’s supply chain. Aside from saying the see strong demand ahead, management dodged the question about when Data center’s QoQ growth would accelerate.  

In a brief update on the Data center product roadmap, Coherent said it expects 1.6T transceiver volume to ramp throughout calendar 2025 with more meaningful contribution in calendar 2026, while demand continued to grow in Q4 for <1.6T data rates.  

For Communications, Coherent said Q4 saw accelerated growth, up 11% QoQ and 42% YoY. For the year, Communications revenue grew 23%. Management stated that the 100G ZR product family is ramping rapidly, and they expected increasing revenue contribution through FY26 from 100G, 400G and 800G ZR/ZR+ transceivers. 

Industrial revenue declined (8%) YoY and (2%) QoQ to $587 million, while revenue for the full-year declined (2%) YoY to $2.37 billion. Coherent said that above-market growth in industrial lasers and services was offset by a decline in silicon carbide, consistent with softer end market demand from autos. Management said that silicon carbide has stabilized and is not expected to be a headwind in FY26.  

Margins Expand YoY in FY25 

Despite gross margin expanding in Q4, GAAP operating margin shrunk, pressuring GAAP EPS; however, adjusted operating margin met management’s guidance for the quarter. For the full-year, Coherent delivered expansion for gross and operating margins. 

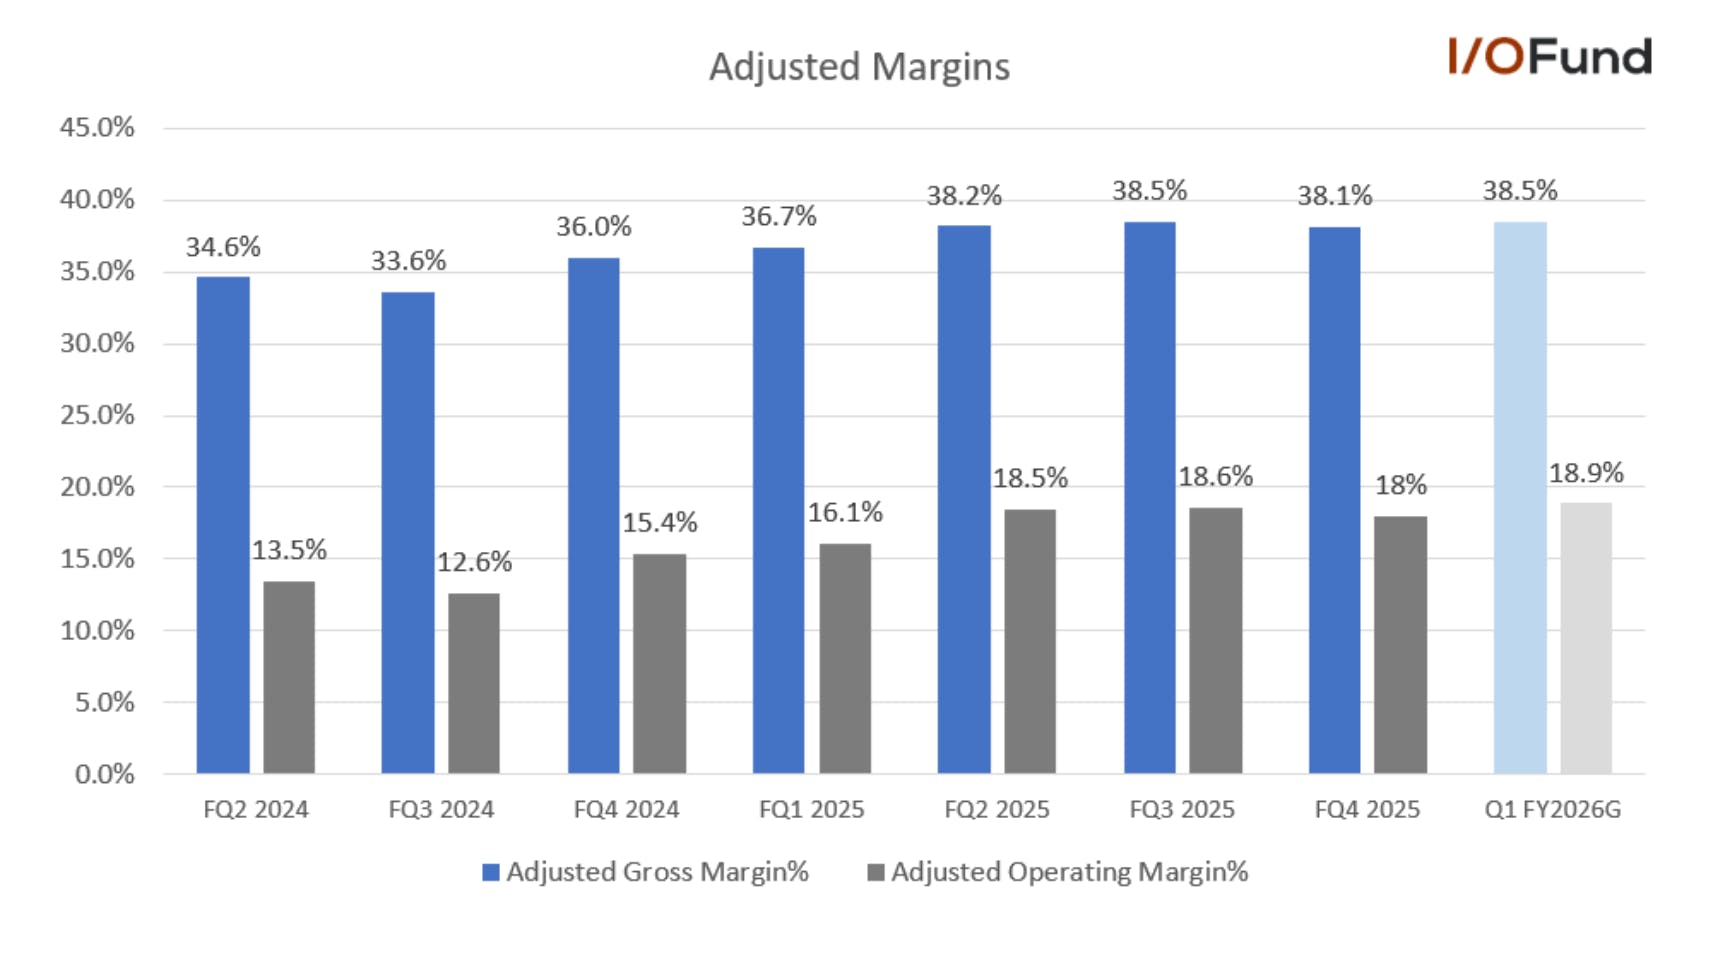
  • Q4 GAAP gross margin was 35.7%, up 2.8 points YoY and half a point QoQ. Adjusted gross margin was 38.1%, slightly above the midpoint of guidance for 37-39%, up 2.3 points YoY but down 0.4 points QoQ. 
  • Q4 GAAP operating margin was 0.4%, down 4.4 points YoY and QoQ; as a result of the pending divestment, Coherent recorded $85 million in asset impairment charges, impacting the margin. Adjusted operating margin was 18%, up 2.6 points YoY but down 0.6 points QoQ.  
  • Q4 GAAP net margin was (6.3%), down 2.6 points YoY and down 7.3 points QoQ. Adjusted net margin was 12.6%, up more than 4 points YoY and nearly 1 point QoQ. 

For Q1 FY26, management offered guidance for adjusted gross margin and adjusted operating expenses: 

  • Adjusted gross margin was guided between 37.5% to 39.5%, up 1.8 points YoY and 0.4 points QoQ at midpoint. 
  • Adjusted operating expenses were guided between $290-310 million, implying adjusted operating margin at 18.9%, up 2.8 points YoY and 0.9 points QoQ. 

For FY25:  

  • GAAP gross margin expanded 4.3 points YoY to 35.2%, while adjusted operating margin expanded 3.6 points YoY to 37.9%. 
  • GAAP operating margin increased 3 points YoY to 5.0%, while adjusted operating margin increased 4.7 points YoY to 17.8%. 
  • GAAP net margin expanded 4.1 points YoY to 0.8%, while adjusted net margin expanded 3.8 points to 11.9%. 

EPS Beat in Q4, Guidance In-Line Q1 

Coherent reported an 8.7% adjusted EPS beat in Q4, though offered guidance for Q1 in line with consensus estimates. 

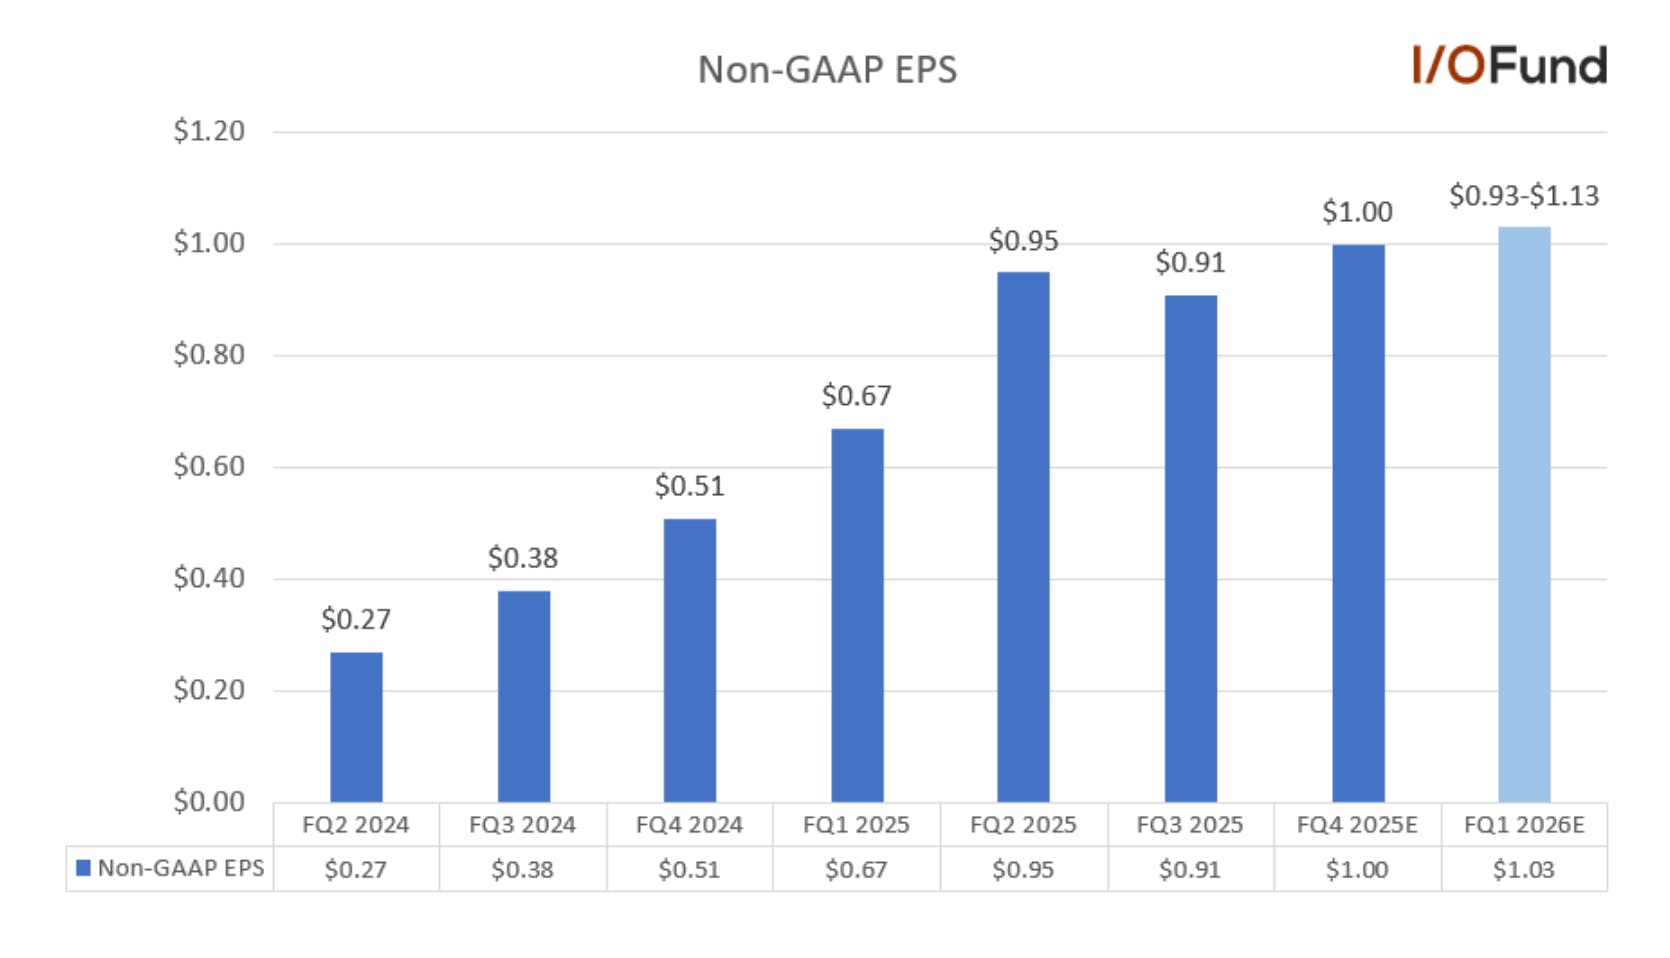
Q4 adjusted EPS was $1.00, ahead of estimates for $0.92 and representing YoY growth of nearly 64%. For Q1, Coherent guided for $0.93 to $1.13 in adjusted EPS, in line with the $1.03 estimate at midpoint and representing a deceleration to ~39% YoY growth. The deceleration is stemming from minimal expansion in adjusted margins in recent quarters combined with the top-line deceleration.  

For FY25, Coherent reported 192% YoY growth to $3.53 in adjusted EPS. FY26 is estimated to see growth moderate to 30% YoY to $4.59, while management noted that the Aero & Defense divestment is expected to be accretive to EPS. 

Cash and Balance Sheet 

Cash flows moderated and cash flow margins shrunk to the lowest levels in the past six quarters. Coherent also noted that proceeds from the divestment will be used to pay down debt. 

  • Operating cash flow was $130.3 million in Q4, down approximately (20%) YoY and QoQ. OCF margin was 8.5%, down nearly 4 points YoY and the first single-digit margin in the last five quarters.  
  • For FY25, operating cash flow rose 16% YoY to $633.6 million, for a 10.9% margin, down 0.7 points YoY due to the softer Q4. 
  • Free cash flow was ($1 million) in Q4, for a (0.1%) margin, down nearly 5 points YoY. It also was the first quarter with negative FCF since Q2 FY24.  
  • For FY25, free cash flow was $192.8 million, down (3%) YoY. FCF margin was 3.3%, down nearly 1 point YoY. 
  • Cash and equivalents were $909.2 million, while debt was $3.69 billion. 
  • Inventories rose 3.6% QoQ to $1.44 billion. 

Earnings Call Q&A: 

800G and 1.6T Shipping, yet Data Center reporting declining QoQ growth 

As discussed in our previous writeup on Coherent, the company supplies EML Lasers, VSCEL Lasers and CW Lasers for silicon photonics. While 100G per lane for 400G and 800G optical transceivers is what is supporting the growth now, it’s expected that 200G per lane and even 400G per lane for 1.6T optical transceivers is what will drive growth in the coming quarters.  

Management offered the following update in terms of 800G ramping now and 1.6T ramping i the coming quarters: 

“Okay. On the first part of the discussion, the way — I think the way to think about it is if you start with the 800-gig ramp, the 800-gig is obviously growing this calendar year versus prior. We expect 800-gig to grow again next calendar year, and that's ramping very quickly. And then on top of that, 1.6T, we believe, starts to ramp on top of that 800-gig ramp. We saw initial revenue in the prior quarter. We expect that revenue to grow over the coming quarters.” 

In the May investor’s day, the company provided the following timeline for the ramp of the new data rates, showing Coherent has a healthy pipeline over the next few years.  

However, despite these updates – the market is nervous that Coherent is not able to compete given data center sequential growth is declining QoQ.  There was a pointed question on the call on the unusual QoQ decline Coherent is expecting (lumpiness). Although the answer from the CEO does not directly address the timing issues, the concern is significant enough to quote the exchange in full: 

Vivek Arya, BofA: 

So the first one, Jim, I realized this is a little bit more short-term oriented. But when I look at your data center and communications segment, sequential growth rate has gone from 9% in March to 5% in June, and I think your September implied is probably at or somewhat below this number, even though you're starting to ramp 1.6T and OCS. So what is the right way to interpret, right, this kind of somewhat slowdown because when I look at the deployment of AI clusters, they seem to be accelerating in the back half and one of your closest peers guided to double-digit sequential growth. So how would you address that pushback and do you think the sequential growth rates can start to reaccelerate at some point? 

James Robert Anderson, CEO 

Yes. Thanks, Vivek. On a quarter-to-quarter basis, the sequential growth rates can fluctuate quarter-to-quarter based on lumpiness of demand from our customers or supply or capacity related things, so. But I think if you look over the full year of fiscal '25, I'm quite pleased with our growth in data center for full year. We saw over 60% growth and even faster growth in the higher speed data rates. And we believe over that fiscal '25, we gained share over that fiscal '25. We feel good about fiscal '25 results. And as I said, looking forward into the current fiscal year, again, we see very strong demand ahead of us, and a number of different growth vectors, 800-gig, 1.6T. We talked about OCS as well — as well as seeing very strong demand in our DCI segment. So we feel good about the growth ahead of us. And certainly, making sure that we've got all the capacity in place to meet that — those demand signals. 

InP Capacity Tripled plus 6-inch production line offers additional capacity  

EMLs were traditionally used by telecom customers, yet became attractive for AI servers due to meeting the 200G per second speeds necessary for 1.6T optical modules to support AI models. These are called single mode optics, made of Indium Phosphide, which has been used instead of silicon for long-haul networking due to being a superior choice for optical functions, such as enabling the laser, modulator, photodetector and amplifier.   

InP is more expensive at the component level as four EMLs are needed compared to two lower-cost CW lasers for silicon photonics modules, yet this difference at the component level can be made up for in data centers as InP reduces power consumption. 

Setting aside the data center segment lumpiness, one reason Coherent may not be down for the count (time will tell) is they have recently tripled their InP capacity and are rolling-out a 6-inch InP production line for yet another significant increase in capacity. 

According to Coherent, this will be the world’s first 6-inch wafers for InP. Inevitably, there were questions on the call about how quickly Coherent could produce more EML and CW lasers plus Co-Packaged Optics (CPOs) with this new production line: 

“This is a big benefit to us in 2 ways, both capacity, obviously, on a larger wafer size we get a significant increase in capacity. But also, we expect a significant cost structure advantage. And so as we fully ramp that capacity both the ability to just drive higher volume, but lower cost structure is a big advantage for that. So we're really excited about that and looking forward to that ramp.” 

Apple Partnership on VSCEL Lasers: 

Apple and Coherent have partnered in the past, yet there was a new partnership announced recently for VSCEL lasers to be used in iPhones and iPads. Per the opening remarks: 

“As mentioned in a recent Apple announcement regarding their American manufacturing program, we've entered into a new multiyear agreement with Apple for a new generation of VCSEL products that support Apple's iPhone and iPad products. We expect revenue from this expanded partnership with Apple to begin in the second half of calendar '26.” 

Analysts are penciling in 2027 as the year where Coherent could see a more meaningful boost in revenue although despite this takeaway, management did repeat impact would be seen H2 CY2026: 

“Yes, we feel really good about that expansion. I would describe it as an expansion of the partnership. It's a new generation of VCSELs that go into Apple iPad and iPhones and we do see that as an increase in revenue that will start to have impact to our revenue in the second half of next calendar year, so second half of '26” 

Additional Key Points: 

There are many moving pieces with Coherent and the following are also notable points from the earnings call: 

  • Optical circuit switching will increase their TAM by $2 billion. OCS was covered in the past here. Coherent has a more advanced approach to OCS through liquid crystal technology versus the more mechanical MEMS technology that competitors offer.  
  • Communications revenue is particularly resilient with 11% QoQ growth (outpacing DC when you separate the two). Driving this QoQ growth is DCIs (data center interconnects). Although recognized outside of the data center segment as part of telecom, the demand is driven by AI as the long-distance data transmissions were traditionally used for telecom purposes, yet and can range up to hundreds of kilometers and are now seeing demand for data center buildouts.   
  • USA footprint: Coherent has 20 U.S. manufacturing locations in 13 states, an advantage should trade wars heat up.

Conclusion: 

Coherent is in all the right place, but they are certainly not alone. The market and BofA analyst are correct to question why Coherent’s data center growth is declining QoQ especially given their competitor Lumentum had a solid earnings report. Lumentum saw 16% QoQ growth in Cloud & Networking in its Q4 and guided for ~10% QoQ in Q1.  

Ultimately, we had trimmed Coherent quite a bit prior to the report simply because we felt Credo and Astera Lab deserved higher allocations. After the report, I feel the same – which is that Coherent has some work to do to not only secure a spot in our portfolio but to compete with the strong AI networking stocks we already own.  

On our Discovery tier, we discuss if stocks we don't own such as Lumentum are a buy or not, plus other Nvidia Blackwell beneficiaries and AI data center energy plays. Portfolio Manager, Knox Ridley, also recently held a Discovery webinar discussing setups for new stocks. Sign up now to read more of our cutting-edge research and to view the 1-hour webinar.

Current Pro and Advanced Members: To subscribe to Discovery with 30% off, please click here to email us or email premium@io-fund.com and mention code DISCOVERY30.Current Pro and Advanced Members: To subscribe to Discovery with 30% off, please click here to email usclick here to email us or email premium@io-fund.com and mention code DISCOVERY30.

Damien Robbins, Equity Analyst at I/O Fund contributed to this analysis.

Please note: The I/O Fund conducts research and draws conclusions for the company’s portfolio. We then share that information with our readers and offer real-time trade notifications. This is not a guarantee of a stock’s performance and it is not financial advice. Please consult your personal financial advisor before buying any stock in the companies mentioned in this analysis. Beth Kindig and the I/O Fund do not own shares in COHR at the time of writing and may own stocks pictured in the charts.

Recommended Reading:
Cloudflare Q2: Multi-faceted AI Positioning, Steady Growth

Cloudflare offered a solid earnings report, yet the valuation is extraordinarily high, thus, the company really needed to report a blowout to justify the valuation (which did not happen). It’s good to see Cloudflare report steady growth, however, and its key metrics supporting sustained growth as we patiently wait for Cloudflare to lead in AI inference at the edge.  

There is a quiet strength in Cloudflare’s fundamentals and key metrics. For example, Cloudflare passed a $2B run rate for the first time, signed their first $100M deal, dollar-based net retention (DBNRR) seems to have bottomed along with a slight 1.3% acceleration in revenue. Regarding the bottom line, Cloudflare is certainly stronger than many cloud peers yet tends to walk a razor’s edge due to capex. 

Regarding AI inference, for the Workers Platform known as Act 3, management connected some important dots on the earnings call as to why agentic AI will drive forward the massive inference trend. The I/O Fund team recently dug up a stat inference is expected to account for 60% to 70% of AI workloads by 2030. In particular, Cloudflare emphasizes their position is what will help the company win this market: “The fact that we sit in front of so much of the web and that more than half of our dynamic traffic is already between APIs means that we are strategically positioned to deliver the agentic web of the future.” 

Cloudflare also introduced Act 4 – a new product that will help AI search engines connect with (and potentially) pay publishers for using derivatives of their copyrighted works. Although the amount of demand for this and exactly how Cloudflare will monetize this new product is not clear, it is interesting management feels confident enough to call the new use case its fourth act.  

Given Cloudflare’s valuation, the entry is probably the most important aspect of this stock right now – whereas in the medium to long-term the most important aspect is timing for the broader inference market.  

We’ve covered Cloudflare’s thesis and Acts 1, 2, and 3 in the analysis “Bringing AI Inference to the Edge” and repeated some of the key aspects later in an earnings update, “Cloudflare: Entering Act 3 to Become a Leader in AI inference at the Edge.”Bringing AI Inference to the Edge” and repeated some of the key aspects later in an earnings update, “Cloudflare: Entering Act 3 to Become a Leader in AI inference at the Edge.” 

Cloudflare Raises FY25 Revenue Growth to Nearly 27% After Largest Beat in Six Quarters

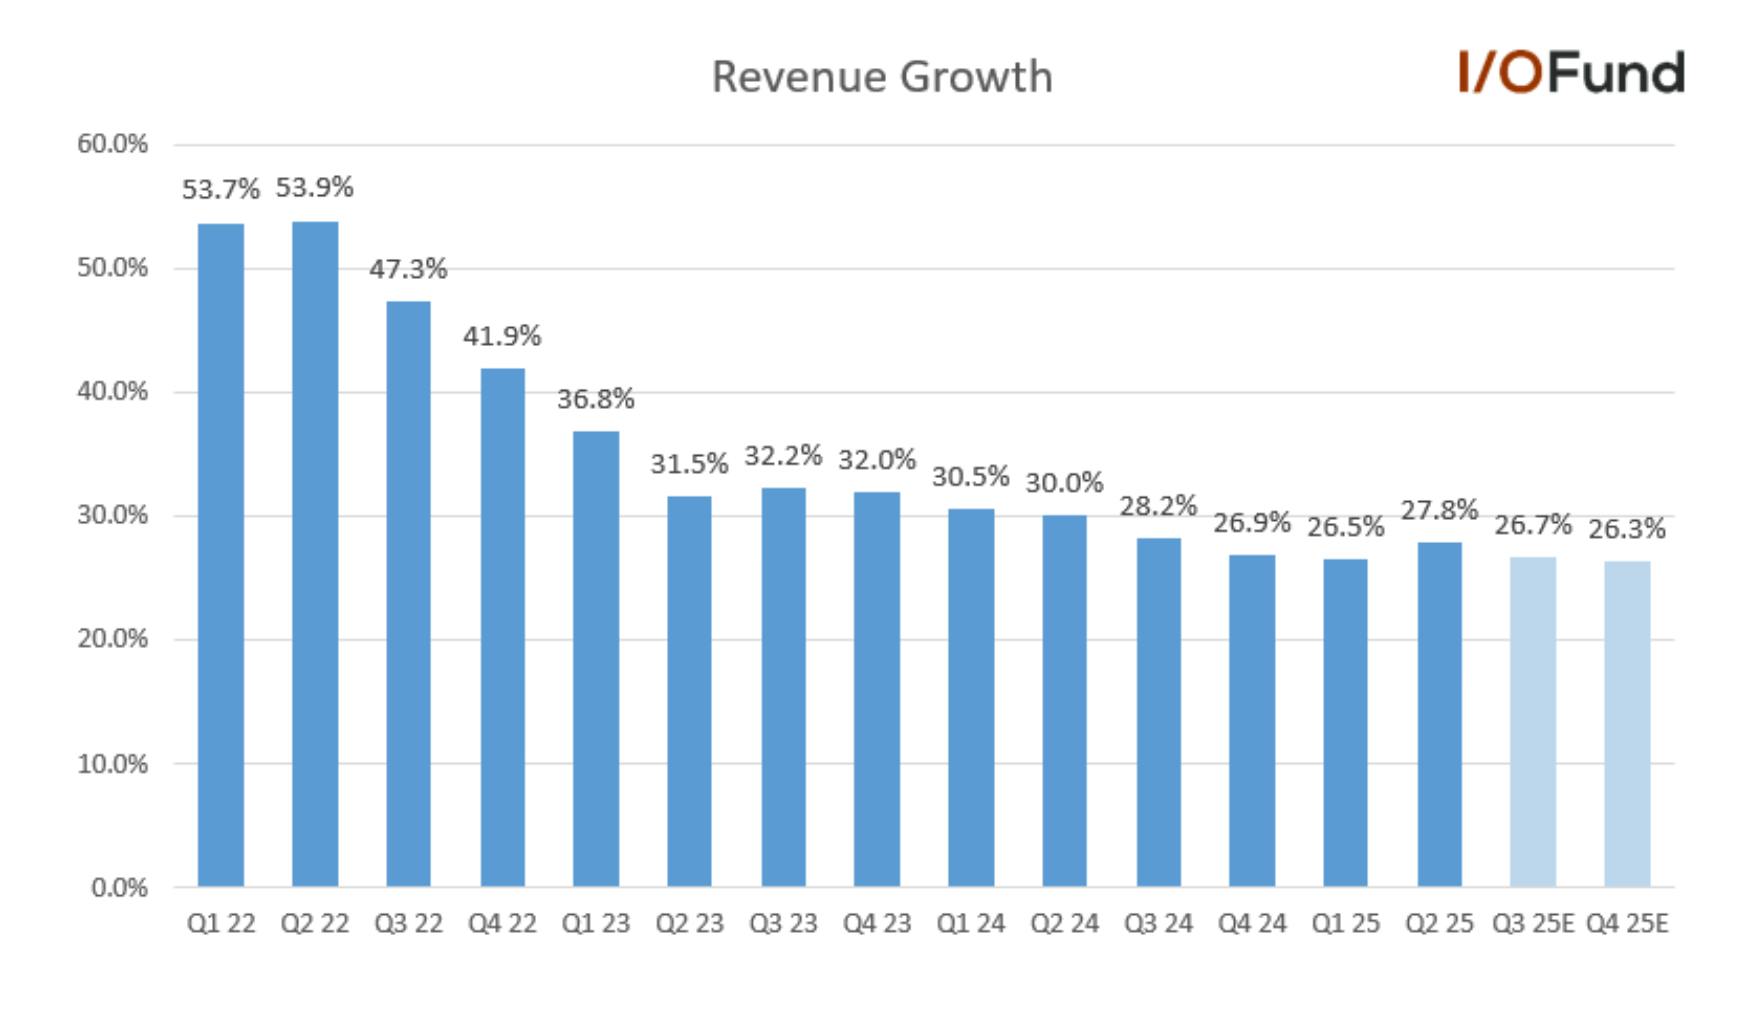
Cloudflare reported its largest revenue beat in the last six quarters at 2.1% above consensus, with Q2 revenue up 27.8% YoY to $512.3 million. This also marked a slight 1.3 point acceleration on the top-line from 26.5% growth in Q1.  

For Q3, Cloudflare guided for revenue of $543.5 to $544.5 million, ahead of estimates at the time for $538.9 million. This corresponds to a slight deceleration to the mid-to-high 26% YoY growth range, where Cloudflare is expected to remain through Q4. This provides no clear indication yet that the company is able to drive a sustained revenue acceleration aided by AI.  

However, not even three weeks from the report, the Street is already getting more optimistic and is now expecting a stronger Q3. Consensus estimates are now above the high-end of management’s guidance at $544.9 million, essentially already pricing in stronger momentum fueling a beat for Q3 despite how early it is in the quarter.  

For the full-year, Cloudflare raised its outlook to $2,113.5 million to $2,115.5 million, for YoY growth of 26.7%. This is a $22.5 million increase at midpoint from Cloudflare’s prior outlook for $2,090 million to $2,094 million for growth of 25.3%. 

DBNRR Inflects 3 Points to 114%, Paying Customer and cRPO Growth Remains Strong 

Cloudflare also showed strong key metrics in Q2, maintaining strong growth in paying customers and billings while DBNRR more meaningfully inflected.  

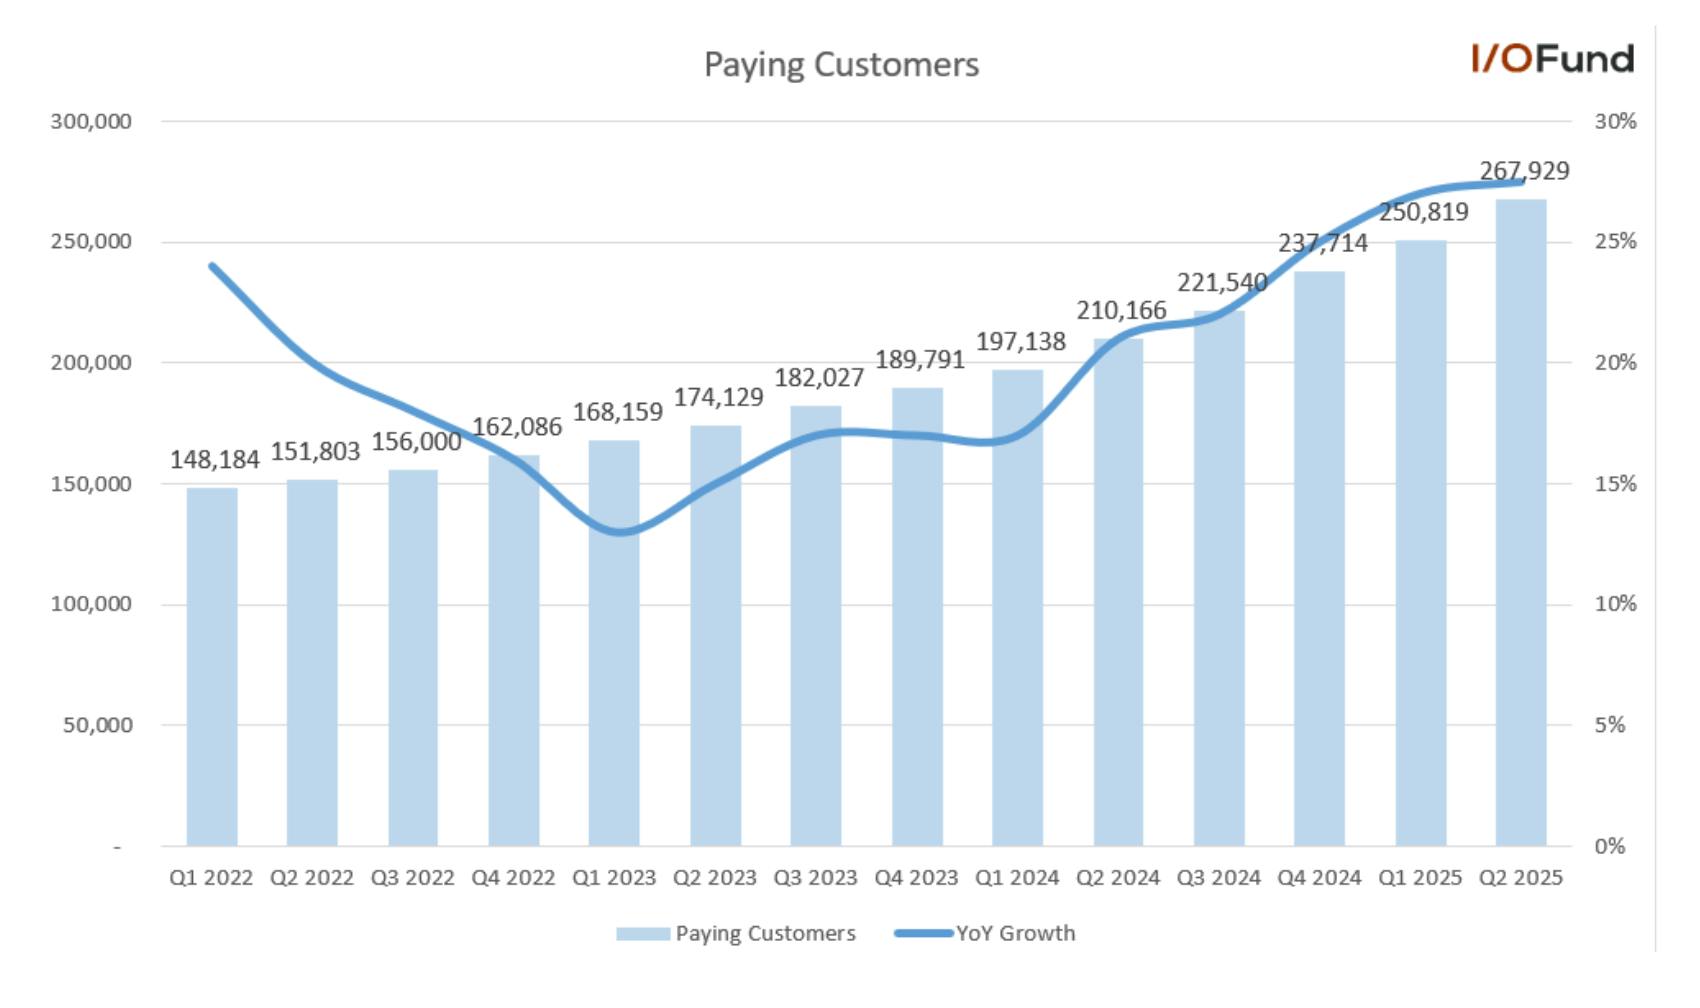
Paying customers increased 27.5% YoY to 267,929 in Q2, the second quarter in a row with 27%+ growth. This is a notable improvement from 17% and 21% growth in Q1 and Q2 2024. Cloudflare stated that it added a record number of customers YoY spending over $1M and over $5M.  

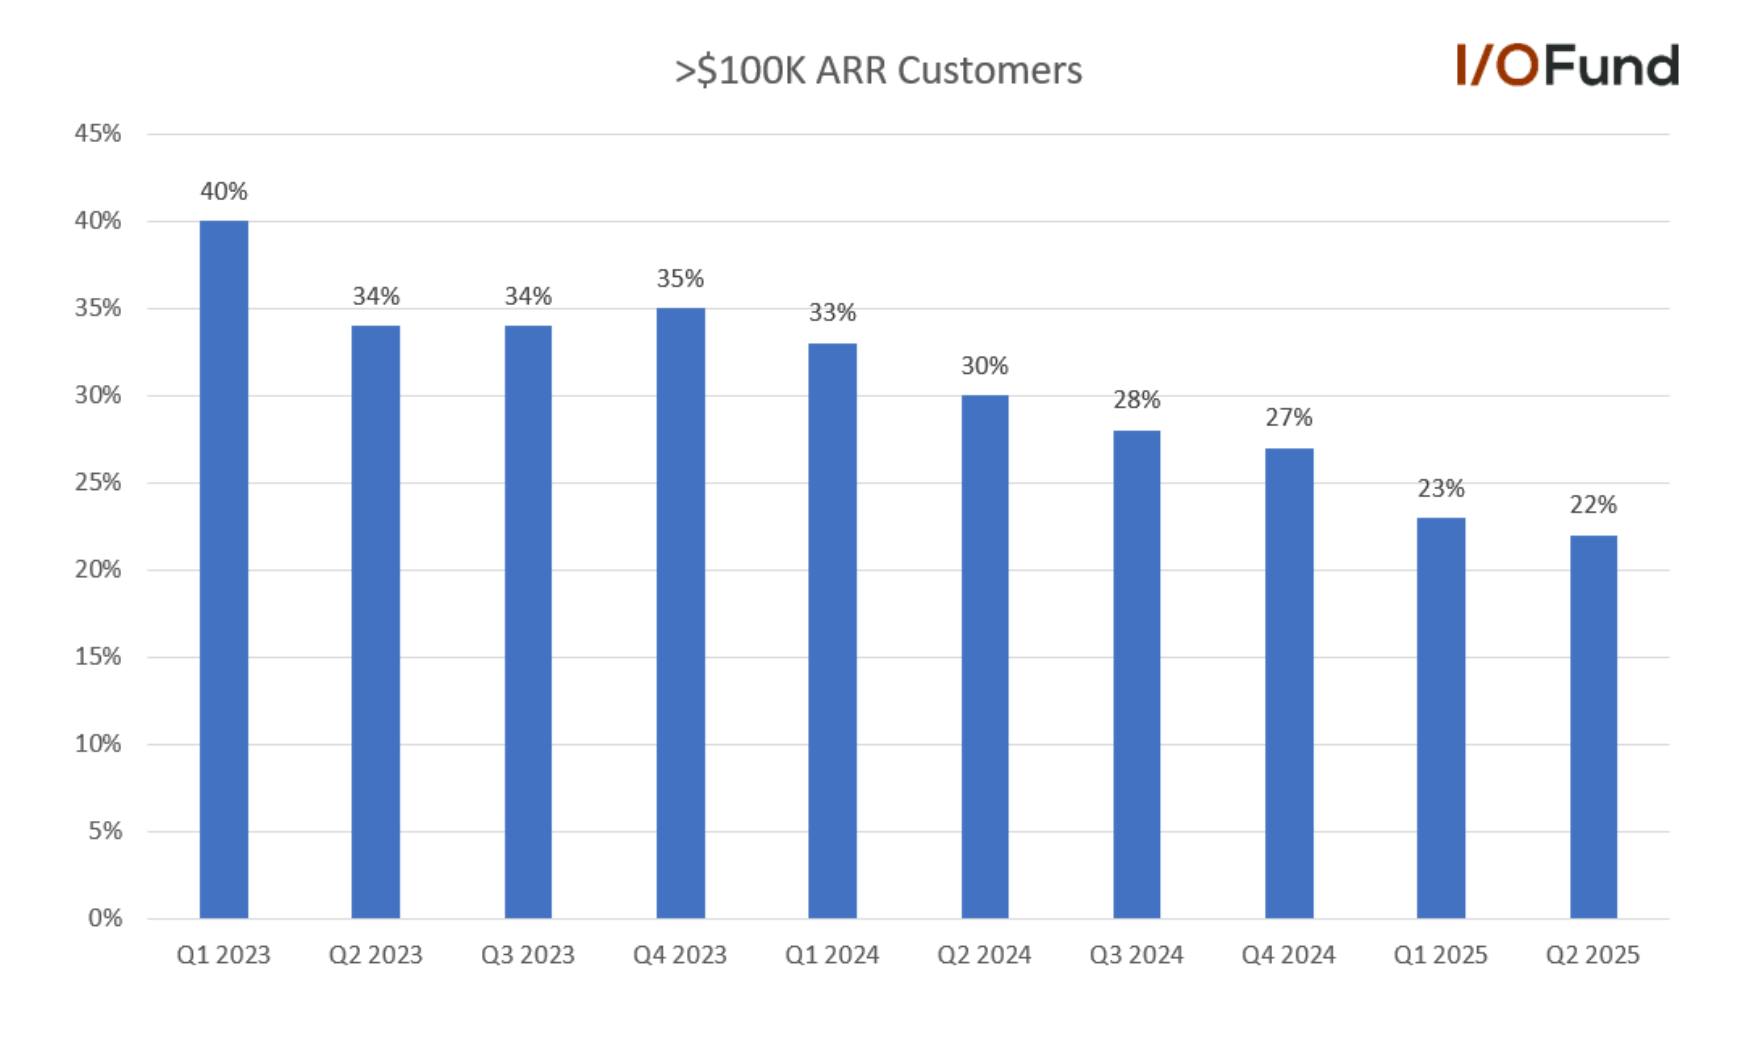
While Cloudflare noted that its largest customers are growing investments at the highest levels since 2022, growth in its large customer cohort ($100K+ ARR) is decelerating. Cloudflare reported 22% YoY growth to 3,712 $100K+ ARR customers in Q2, decelerating slightly from 23% in Q1 and 30% in the year ago quarter. This cohort accounts for 71% of revenue, up from 69% in Q1 and up from 67% in the year-ago quarter. 

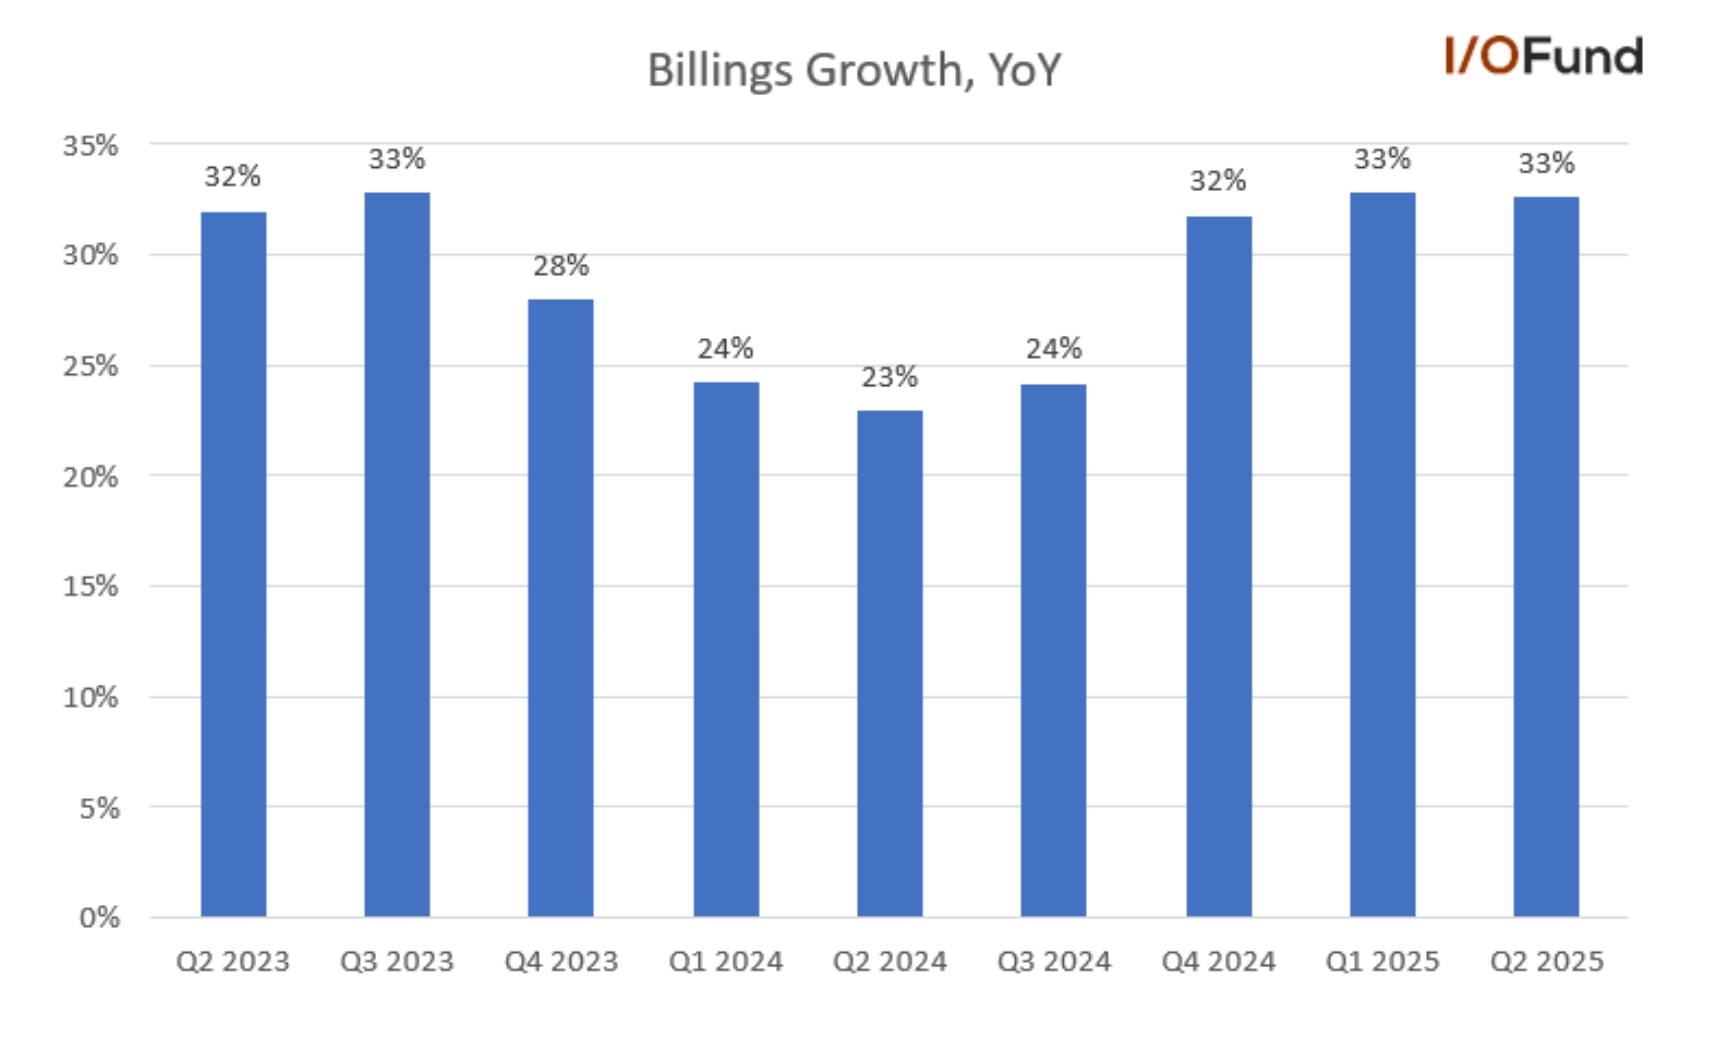
Billings increased 33% YoY to $559.2 million, a third straight quarter with growth above 30% YoY.  

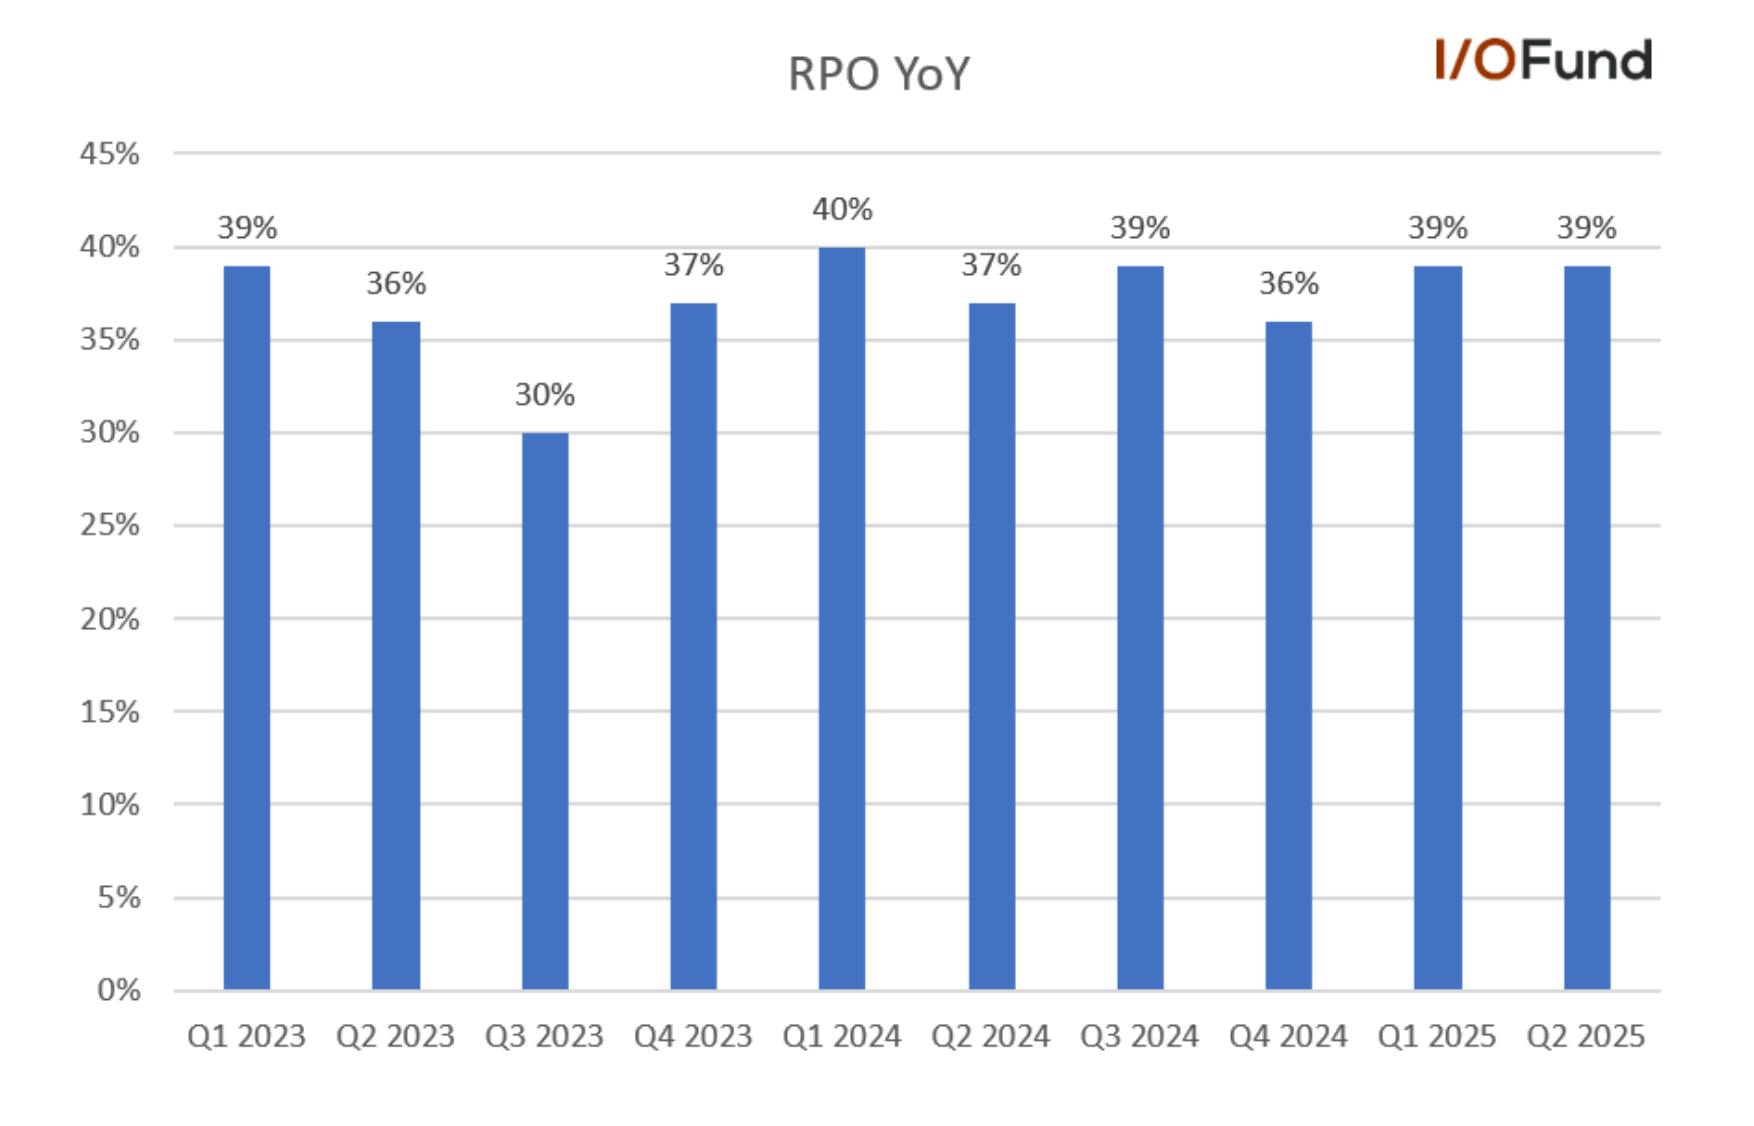
RPO increased 39% YoY and 6% QoQ to $1.98 billion.  

Current RPO accounted for 66% of total RPO, or ~$1.30 billion, increasing 33% YoY in Q2, a four point acceleration from 29% growth in Q1.This is also a notable uplift from 26% growth in the year ago quarter.  

Aided by strength in its >$1M customer cohort, which management said served as a tailwind, DBNRR more meaningfully inflected in Q2 to 114%, its highest level in more than a year.   

Quick note on Pool of Funds:  

We previously covered pool of funds here, explaining that pool of funds accounts are unique to the largest customers (for example, 4 of the top 10 customers are this account type) that use many products across the entire Cloudflare platform. These are considered larger platform deals that are paid on a monthly basis in a multi-year contract rather than an annual contract on one product. For some time, this shifted how DBNRR and RPO were reported since revenue is recognized as the customer consumes the service. 

The current update (albeit a bit vague) is that “pool of funds deals with our largest customers represented low double digit in the second quarter, up from less than 3% a year ago. So significant progress.” 

GAAP Margins Drift Lower 

Gross margins drifted lower in Q2, driven by both an increase in depreciation expenses and in allocated costs from higher network traffic from paying customers. GAAP operating margins followed, moving further away from reaching break-even. 

Cloudflare had an interesting comment on long-term margins, stating that it expects to remain comfortably in its 75% to 77% adjusted gross margin target despite passing on substantial savings to Workers’ customers. This suggests that upside to operating margins will be driven by expenditures, such as moderating higher sales & marketing spending, at 36% of revenue versus its target range of 27-29%, and high SBC at 24% of revenue. 

  • GAAP gross margin was 74.9% in Q2, down nearly 3 points YoY and 1 point QoQ. Adjusted gross margin was 76.3%, down 2.7 points YoY and 0.8 points QoQ. 
  • GAAP operating margin was (13.1%), down 4.4 points YoY and 2 points QoQ. Adjusted operating margin was 14.1%, approximately flat YoY and up 2.4 points QoQ; this was also ahead of guidance for 12.6%. 
  • For Q3, Cloudflare guided for adjusted operating income of $75-76 million, pointing to adjusted operating margin of 13.9%, down nearly 1 point YoY and moderating slightly QoQ. 
  • GAAP net margin was (9.8%), down 6 points YoY and 1.8 points QoQ. Adjusted net margin was 14.7%, down 2.6 points YoY but up 2.5 points QoQ. 

FY25 EPS Raised Slightly 

Cloudflare topped estimates in Q2 driven by the revenue beat and stronger adjusted margins, and boosted its FY25 adjusted EPS outlook as a result. 

  • GAAP EPS was ($0.15), missing estimates for ($0.08) as GAAP margins drifted lower. 
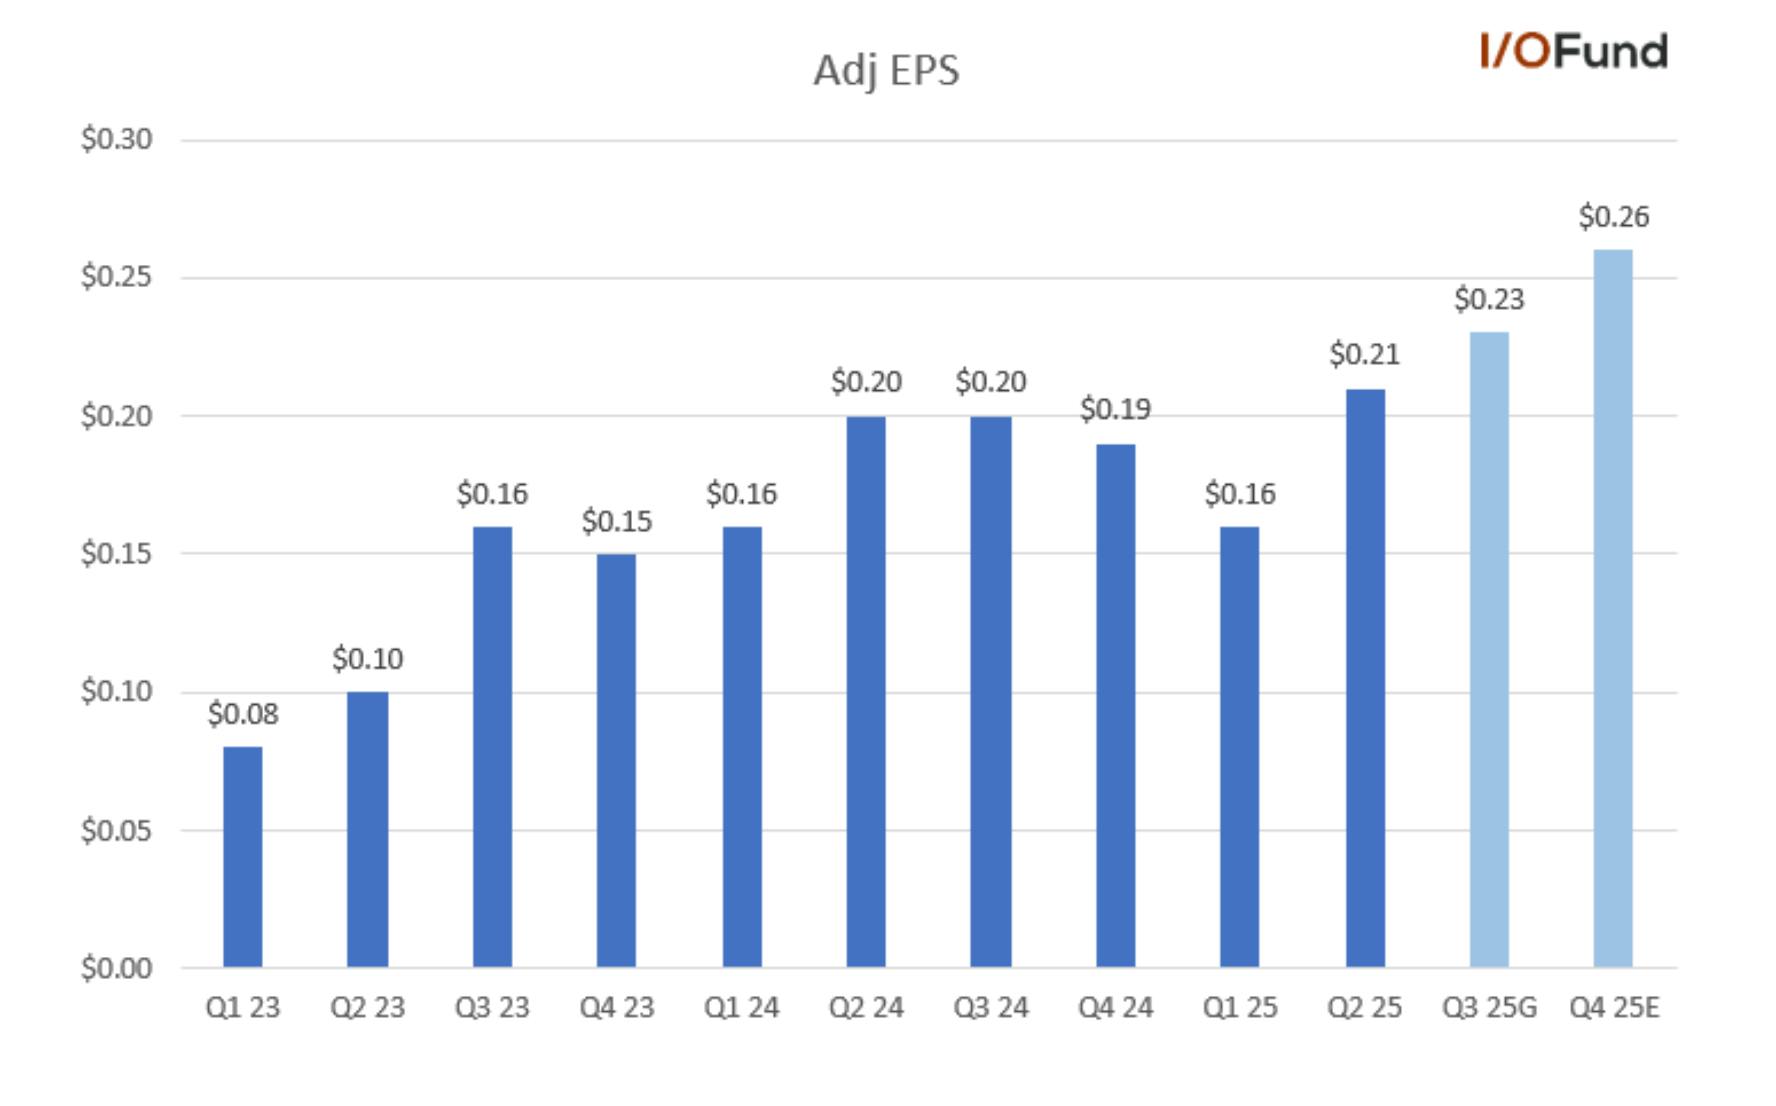
  • Adjusted EPS was $0.21, beating estimates for $0.18, fueled the outperformance in adjusted operating margin in the quarter.  

For Q3, Cloudflare guided for $0.23 in adjusted EPS, a slight uptick sequentially, while for FY25, the company raised its forecast from $0.79-$0.80 to $0.85-$0.86. This corresponds to growth of ~14.5% YoY, up from the mid-6% range previously. Growth is expected to be much stronger in FY26 at ~30% YoY to $1.12. 

Cash Flow Margins Contract, and Cloudflare Raises $2B in Convertible Debt 

Cash flow margins contracted sequentially, while Cloudflare significantly bolstered its cash pile after a large convertible note issuance.  

  • Operating cash flow was $99.8 million for a 19% margin, flat YoY but down from a 30% margin in Q1.  
  • Free cash flow was $33.3 million for a 6% margin, down 4 points YoY and 5 points QoQ.  
  • Network capex was 11% of revenue in Q2, down from 17% of revenue in Q2. Cloudflare stuck to its guidance for network capex to be 12-13% of revenue for the year, suggesting slight moderation in 2H.  
  • In June, Cloudflare raised $1.97 billion in new convertible notes due 2030, raising its cash on hand to $3.96 billion while convertible notes outstanding rose to $3.26 billion.  

Earnings Call Q&A: 

Agentic AI & Small Language Models (SLMs) is where Cloudflare’s AI impact will become more apparent 

Today, AI agents are mainly LLM-based copilots and assistants rather than truly autonomous agents. The broader vision is for agents to set goals and act without a human prompting each action. Gartner is a reasonable forecaster and is placing 2027-2028 as the time frame when 33% of enterprise software apps will include agentic AI.  

While large language models will continue to provide the more complex reasoning tasks, small language models will be deployed to execute the day-to-day automation with major benefits over LLMs such as being quicker and cheaper when running thousands or millions of decisions per user. The major difference is that LLMs are massive knowledge engines whereas SLMs are run locally and offer speed.  

That’s a critical distinction to make when listening to Cloudflare’s management talk about why their stock has not performed as well in the LLM phase of AI versus the upcoming SLM phase:  

“We would not be today the right place for one of the really massive LLMs to run because those, in many cases, will require multiple different machines working in coordination. It is a more complicated task. But for smaller models, we're finding that Cloudflare is the best place for anyone who's building that to run that. And over time, we are investing in making our systems able to support larger and larger and larger models.” 

In addition, Cloudflare represents 20% of the internet and that number is in the mid-30% when considering the top 10,000 sites. By managing a leading percentage of internet traffic, agentic AI will route through Cloudflare’s reverse proxy and CDN to fetch data and trigger APIs. The company offers Cloudflare Workers and WebAssembly for a low-latency and distributed hosting environment to run SLMs. Additionally, agentic AI will require enhanced security since autonomous actions can have a larger impact from errors (bad API calls) or security issues that are more malicious.  

This is how management discussed it on the earnings call: 

“I think what we feel confident, though, is that because of the fact that so much of the Internet sits behind us and inherently, those agents are going to be passing through us that we have an opportunity to help define what those rails are that the agents will ride on and take some fee from that — those transactions as we've helped facilitate them and make them faster, more reliable, more secure, give people the access to those rails.” 

Act 4 Seeks to Minimize the Impact AI has on Publishers 

Cloudflare recently launched a product that prevents AI bots from accessing websites without payment. It’s no secret that AI has made a dramatic impact on publishers given AI-driven search tools do not refer traffic to the sources they scrape data from. Whether it’s OpenAI and Microsoft getting sued by The New York Times or stats like this one that publishers are seeing 25% fewer referral clicks, the evidence is mounting that AI is destroying business models for both smaller, independent publishers and larger media conglomerates. 

Cloudflare had some wild statistics on their call, stating “based on the data that Cloudflare has observed, it's nearly 10x harder to get traffic from Google than it was just 10 years ago.” Even more crazy, they stated “every AI company we've tracked is worse than the Google of old with some being as much as 30,000x harder to get traffic from” – likely referring to OpenAI or Anthropic. 

This is one to watch as it could become one of Cloudflare’s fastest growing products given the pain point Act 4 seeks to solve.   

“But we aren't building search engines anymore. We're building answer engines. And the difference between a search engine and an answer engine is a search engine directs you to that content where you can go and the content creator can monetize it. An answer engine answers without you having to leave. And so there has to be some value creation back to content creators that isn't just based on traffic.” 

You can read the official Pay per Crawl announcement here

Valuation is high 

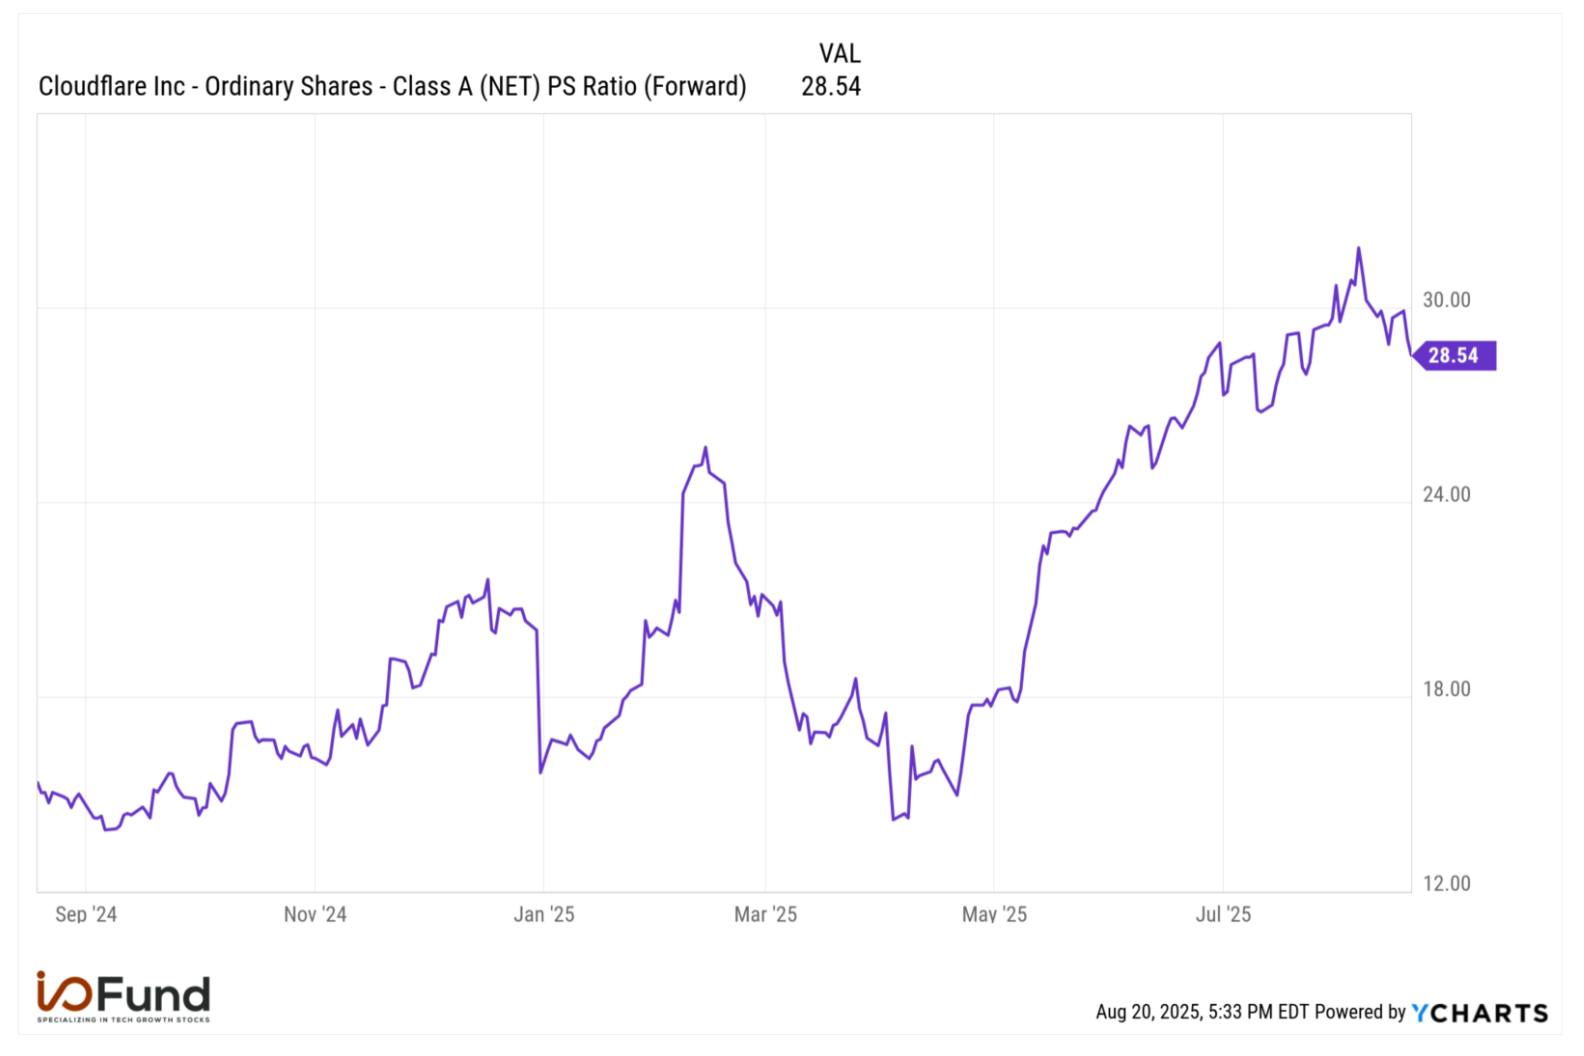
Cloudflare trades at a forward PS ratio of 28.5. The exuberant investor will tell you that any contribution from AI demands a higher valuation than what we’ve seen in the past, yet time will tell if that is true. We prefer to see if we can get Cloudflare and really any cloud stock under 20 forward PS. Typically, Cloudflare at a 15 forward PS is a great spot to buy. 

Conclusion: 

As of now, we are patiently waiting to get Cloudflare lower ahead of the inference market taking off. Remember – our thesis is about Cloudflare’s positioning, which is multi-faceted in terms of how Cloudflare can monetize its AI utility at the internet infrastructure level. As agentic AI and SLMs become a leading paradigm, Cloudflare’s network is set to become a critical player. You’re seeing some of this with Cloudflare able to seamlessly pivot toward helping publishers get paid by Big Tech, which is typically a cutthroat group. The company is also effortlessly expanding its use case for AI inference to include agentic AI and SLMs; meaning no matter where AI development takes inference, Cloudflare will be there.  

Since our firm likes to be prudent, margins are not actually bulletproof as Cloudflare is not GAAP profitable and margins contracted this quarter. This line item has a red mark on our checklist, and we will continue to look at this closely in the coming earnings reports.

Damien Robbins, Equity Analyst at I/O Fund contributed to this analysis.

Please note: The I/O Fund conducts research and draws conclusions for the company’s portfolio. We then share that information with our readers and offer real-time trade notifications. This is not a guarantee of a stock’s performance and it is not financial advice. Please consult your personal financial advisor before buying any stock in the companies mentioned in this analysis. Beth Kindig and the I/O Fund do not own shares in NET at the time of writing and may own stocks pictured in the charts.

Recommended Reading:
Reddit Stock Blows the Doors Off – Can it Last?

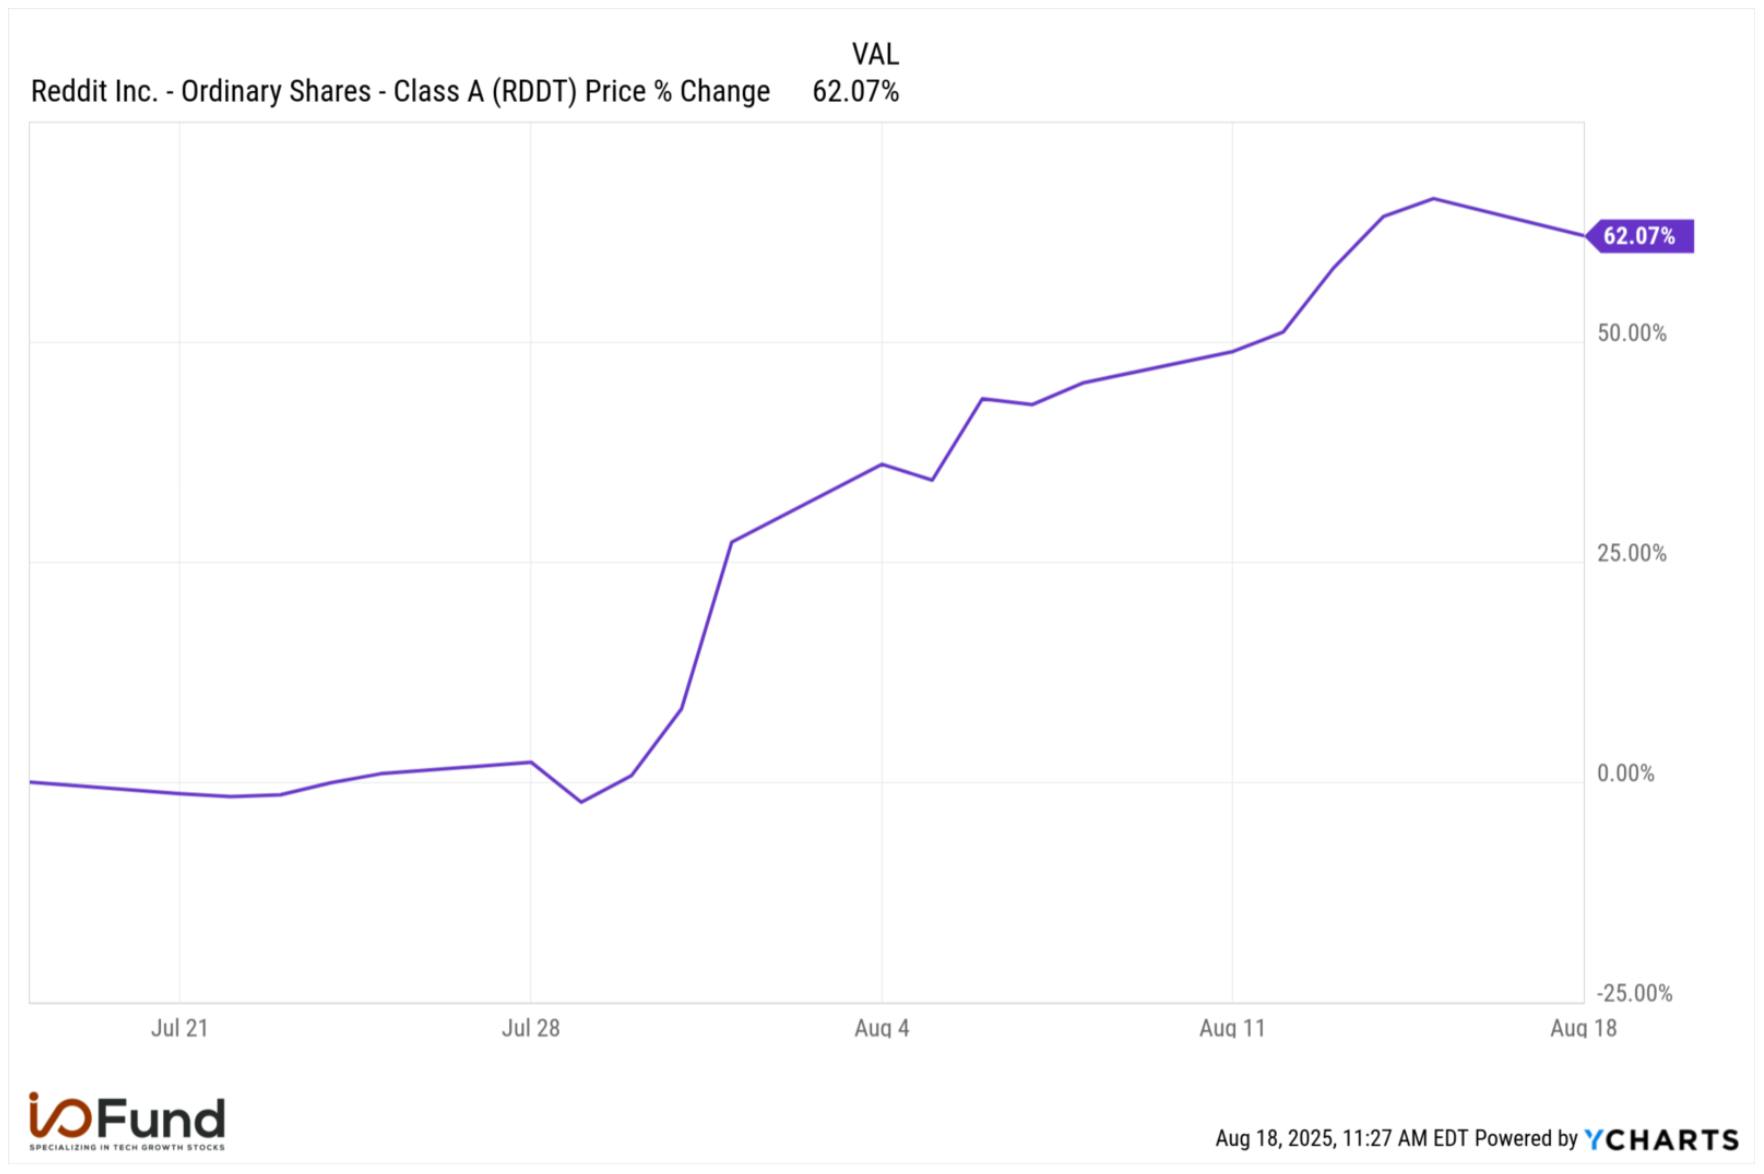
Reddit’s stock has surged 62% in one month, easily placing the company’s earnings report as one of the best to come out of the tech sector this quarter. The world’s leading forum site has only 416 million weekly active users compared to Facebook’s 2 billion yet ranks fifth behind Facebook as the most visited site in the United States. In addition, due to a few changes in how Google surfaces content with AI overviews, Reddit is now the second most visible site in the United States – ranking above Facebook for example – and the top line results show the company is reaping the rewards of being in the search giant’s good favor.  

Therein lies the risk, which is that Reddit’s current growth is dependent upon how a Big Tech company graciously offers visibility on its platform – something that is entirely outside of Reddit’s control. The partnership could continue for years, or it could stop at any time. 

Below, we offer a few ways to approach the opportunity that Reddit presents and what an investor should look for to determine if Reddit will continue to be an anomaly in that AI-driven search benefits the social platform (whereas it hurts traffic for most other publishers). The analysis also discusses what to watch for in terms of Reddit hitting peak growth and the catalysts that could drive the stock further.

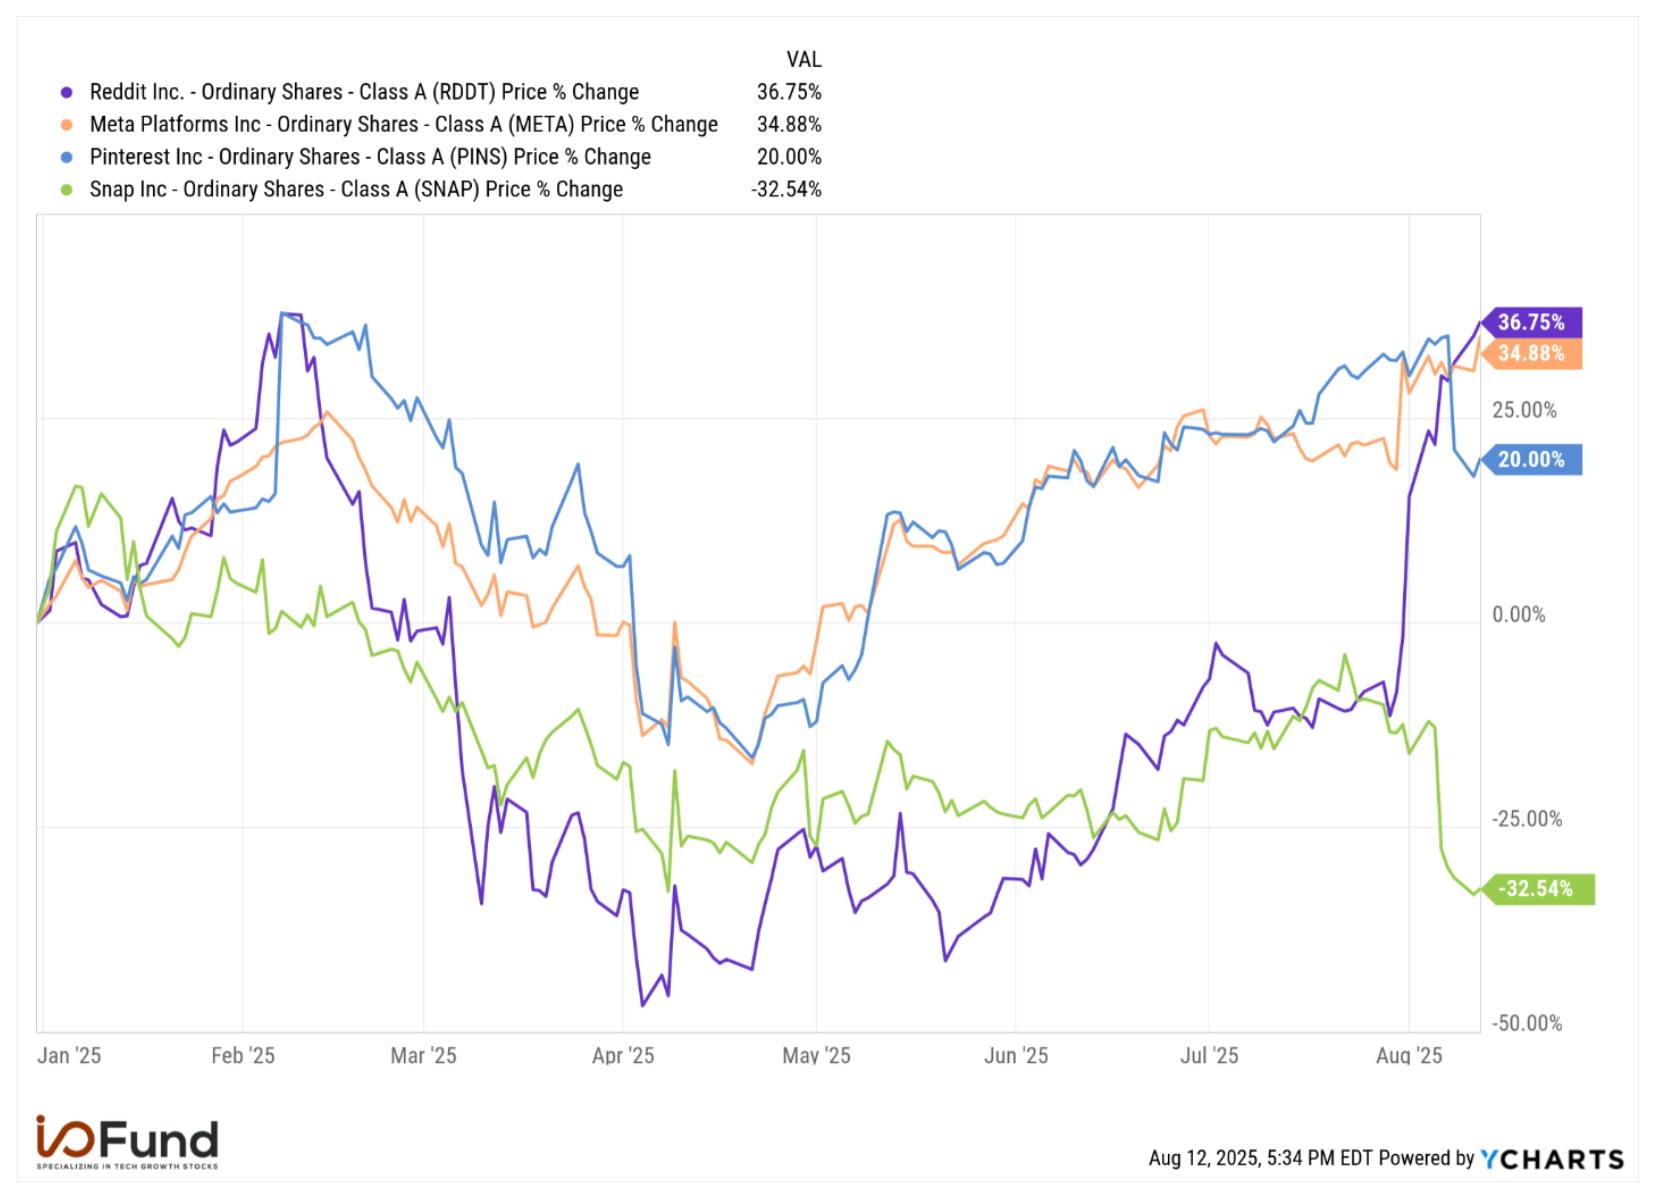
Reddit stock price jumps 62% in the weeks following its Q2 2025 earnings report.

Reddit stock surges 62% in the weeks following the Q2 2025 earnings report. Source: YChartsYCharts 

Reddit’s Web Rankings are Surging; Driving Stock Returns 

Reddit delivered a rather impressive Q2 on July 31st with revenue beating estimates by more than 17%. Growth translated to the bottom line as GAAP net margin expanded to 18%. Driving much of these results is the new improved web rankings that Reddit has seen over the past year due to Google’s AI Overviews. 

Over the last two years, Reddit has seen an explosion in SEO visibility on Google, with data from Sistrix placing growth from July 2023 to April 2024 at a whopping 1,328%. This moved Reddit from 85th most visible site to the 7th most visible.  

Now, as of August 2025, Reddit has moved to 2nd most visible site in the US, per Sistrix, behind Wikipedia, and ahead of popular sites such as Facebook in 7th, Amazon in 4th, and YouTube in 3rd. This major improvement in SEO ranking may be a potential contributor to Reddit’s accelerating growth over the past five quarters – yet as stated, the surge in growth is out of Reddit’s control and relies on Google SEO placement, which could change at anytime. 

In terms of user engagement, Reddit notched 4 billion visits as of July 2025, according to data from Similarweb, compared to 12.1 billion for Facebook, 6.6 billion for Instagram, and 4.5 billion for X. Users visited an average of 4.83 pages per visit with an average visit duration of 6 minutes, compared to 12.57 pages per visit and an average duration of more than 10 minutes for Facebook. Similarweb places Reddit as the fifth-most visited site in the US, behind Facebook in fourth place. 

Advertising Revenue Rises 84% YoY 

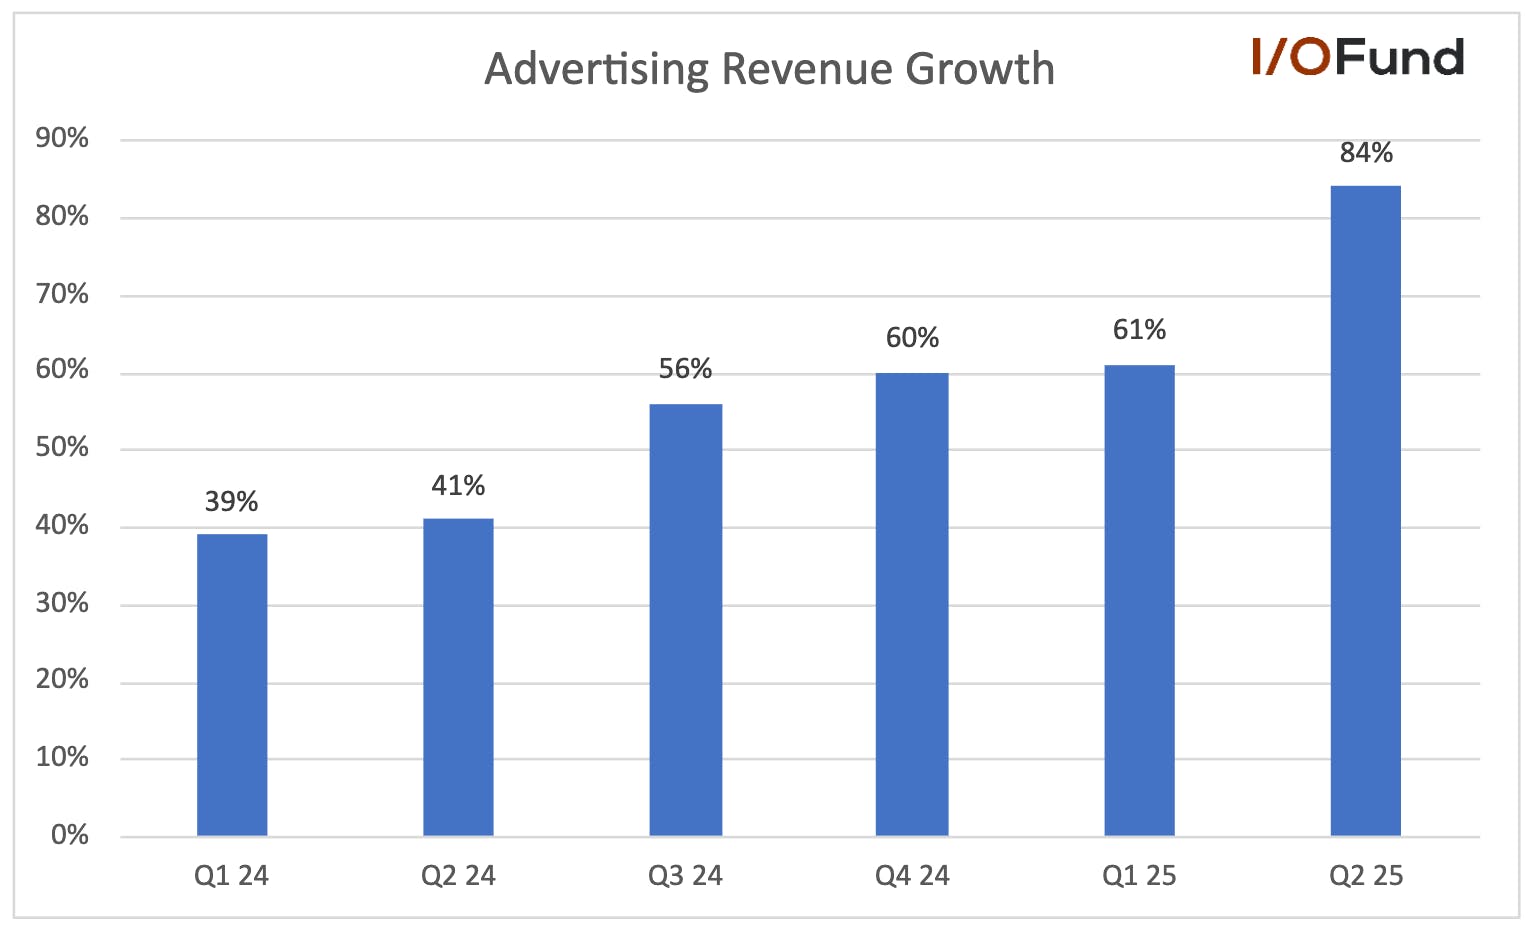
Behind the substantial revenue beat in Q2 was 84% growth in advertising revenue to $465 million. This marked a sharp 23 point acceleration from 61% growth in Q1. Sequentially, advertising revenue grew almost 30%, with growth of more $106 million QoQ, outpacing Q4 2024’s $79 million sequential increase. This is impressive considering Q4 is typically the strongest seasonally for the company.  

Reddit’s stock price rises sharply after reporting 84% year-over-year advertising revenue growth.

Reddit’s stock price surges after reporting advertising growth of 84% YoY 

Reddit said that the majority of this advertising growth was driven by existing advertisers deepening investments on the platform, though it did see 50% YoY growth in active advertisers as it continued to acquire new advertisers. Additionally, performance ads and brand ads both increased more than 80% YoY, reflecting strong engagement from advertisers on the platform.  

Reddit also highlighted ways it is driving higher return on ad spend for advertisers and higher click-through rates, both key factors in increasing ad spend to maintain a robust ad revenue flywheel. Management said that Dynamic Product Ads for shopping were made generally available in Q2, and advertisers were consistently achieving 2x higher ROAS on average versus standard campaigns. Reddit also said that Conversation Summary Add-Ons, which integrate positive user conversations directly into product or brand ads, were delivering more than 10% higher click-through rates versus standard image ads. 

Reddit Monetizes through Ads, yet is Expanding its Monetization Methods 

Similar to most large audiences online, Reddit monetizes through ads. While ads are its main revenue stream, the company has recently branched out into premium subscriptions and data licensing deals.  

Reddit’s recent product updates target all three of its stated growth levers: core product, search and international growth. 

In core product, Reddit is working to boost engagement and platform stickiness by lowering barriers to log-in, using AI to improve personalization of homescreens and community discovery, and improve user onboarding. Bringing more logged-in users to the platform is especially important considering logged-in users contribute a higher ARPU than logged-out, yet this cohort accounts for under 45% of daily active unique users (DAUq).  

Reddit Search is another product feature that now has 70 million weekly active unique users (WAUq) as of Q2, or a nearly 17% attach rate to its global WAUq of 416.4 million. Within this is Reddit’s AI-powered search engine Reddit Answers, which saw WAUq rise 500% sequentially in Q2, from 1 million to 6 million, or nearly 10% attach of Search users.   

Answers are separate from Search in Q1, although Reddit is now working to unify the two centrally in the same search-box, assisting in queries from new users, existing users, and users routed to Reddit via external search engines.  

Query growth has been very strong, with Reddit noting that average query volume rose more than 10X sequentially from Q1 to Q2.  

Reddit Seeks International Expansion: Double-edge sword 

Global expansion for Answers is continuing, with the feature only available to US users and some international markets including the UK, India, Australia and Canada. While International user growth is outpacing US growth by a large degree, Reddit expanded the rollout of its AI-powered automatic Machine Translation feature from 13 languages in Q1 to 23 in Q2.  

Available across 35+ countries worldwide, Machine Translation removes barriers between users in different geographies, by allowing them to “post and comment in their preferred language, which will be auto-translated into the community’s native language.”  

For example, Reddit says that users in Spain who typically use Reddit in Spanish could seamlessly contribute to French communities and threads. By lowering barriers to communicate between different geographies and languages, Reddit is opening the door to further expand its 235 million international user base (for comparison, Meta’s international active users are 11x higher). 

This is a double-edged sword, however, as the United States region presents a hidden risk and could create a headwind to growth as user growth stalls, considering the region contributes the bulk of revenue. 

Reddit’s WAUq Shows Stronger International Growth, US Plateau 

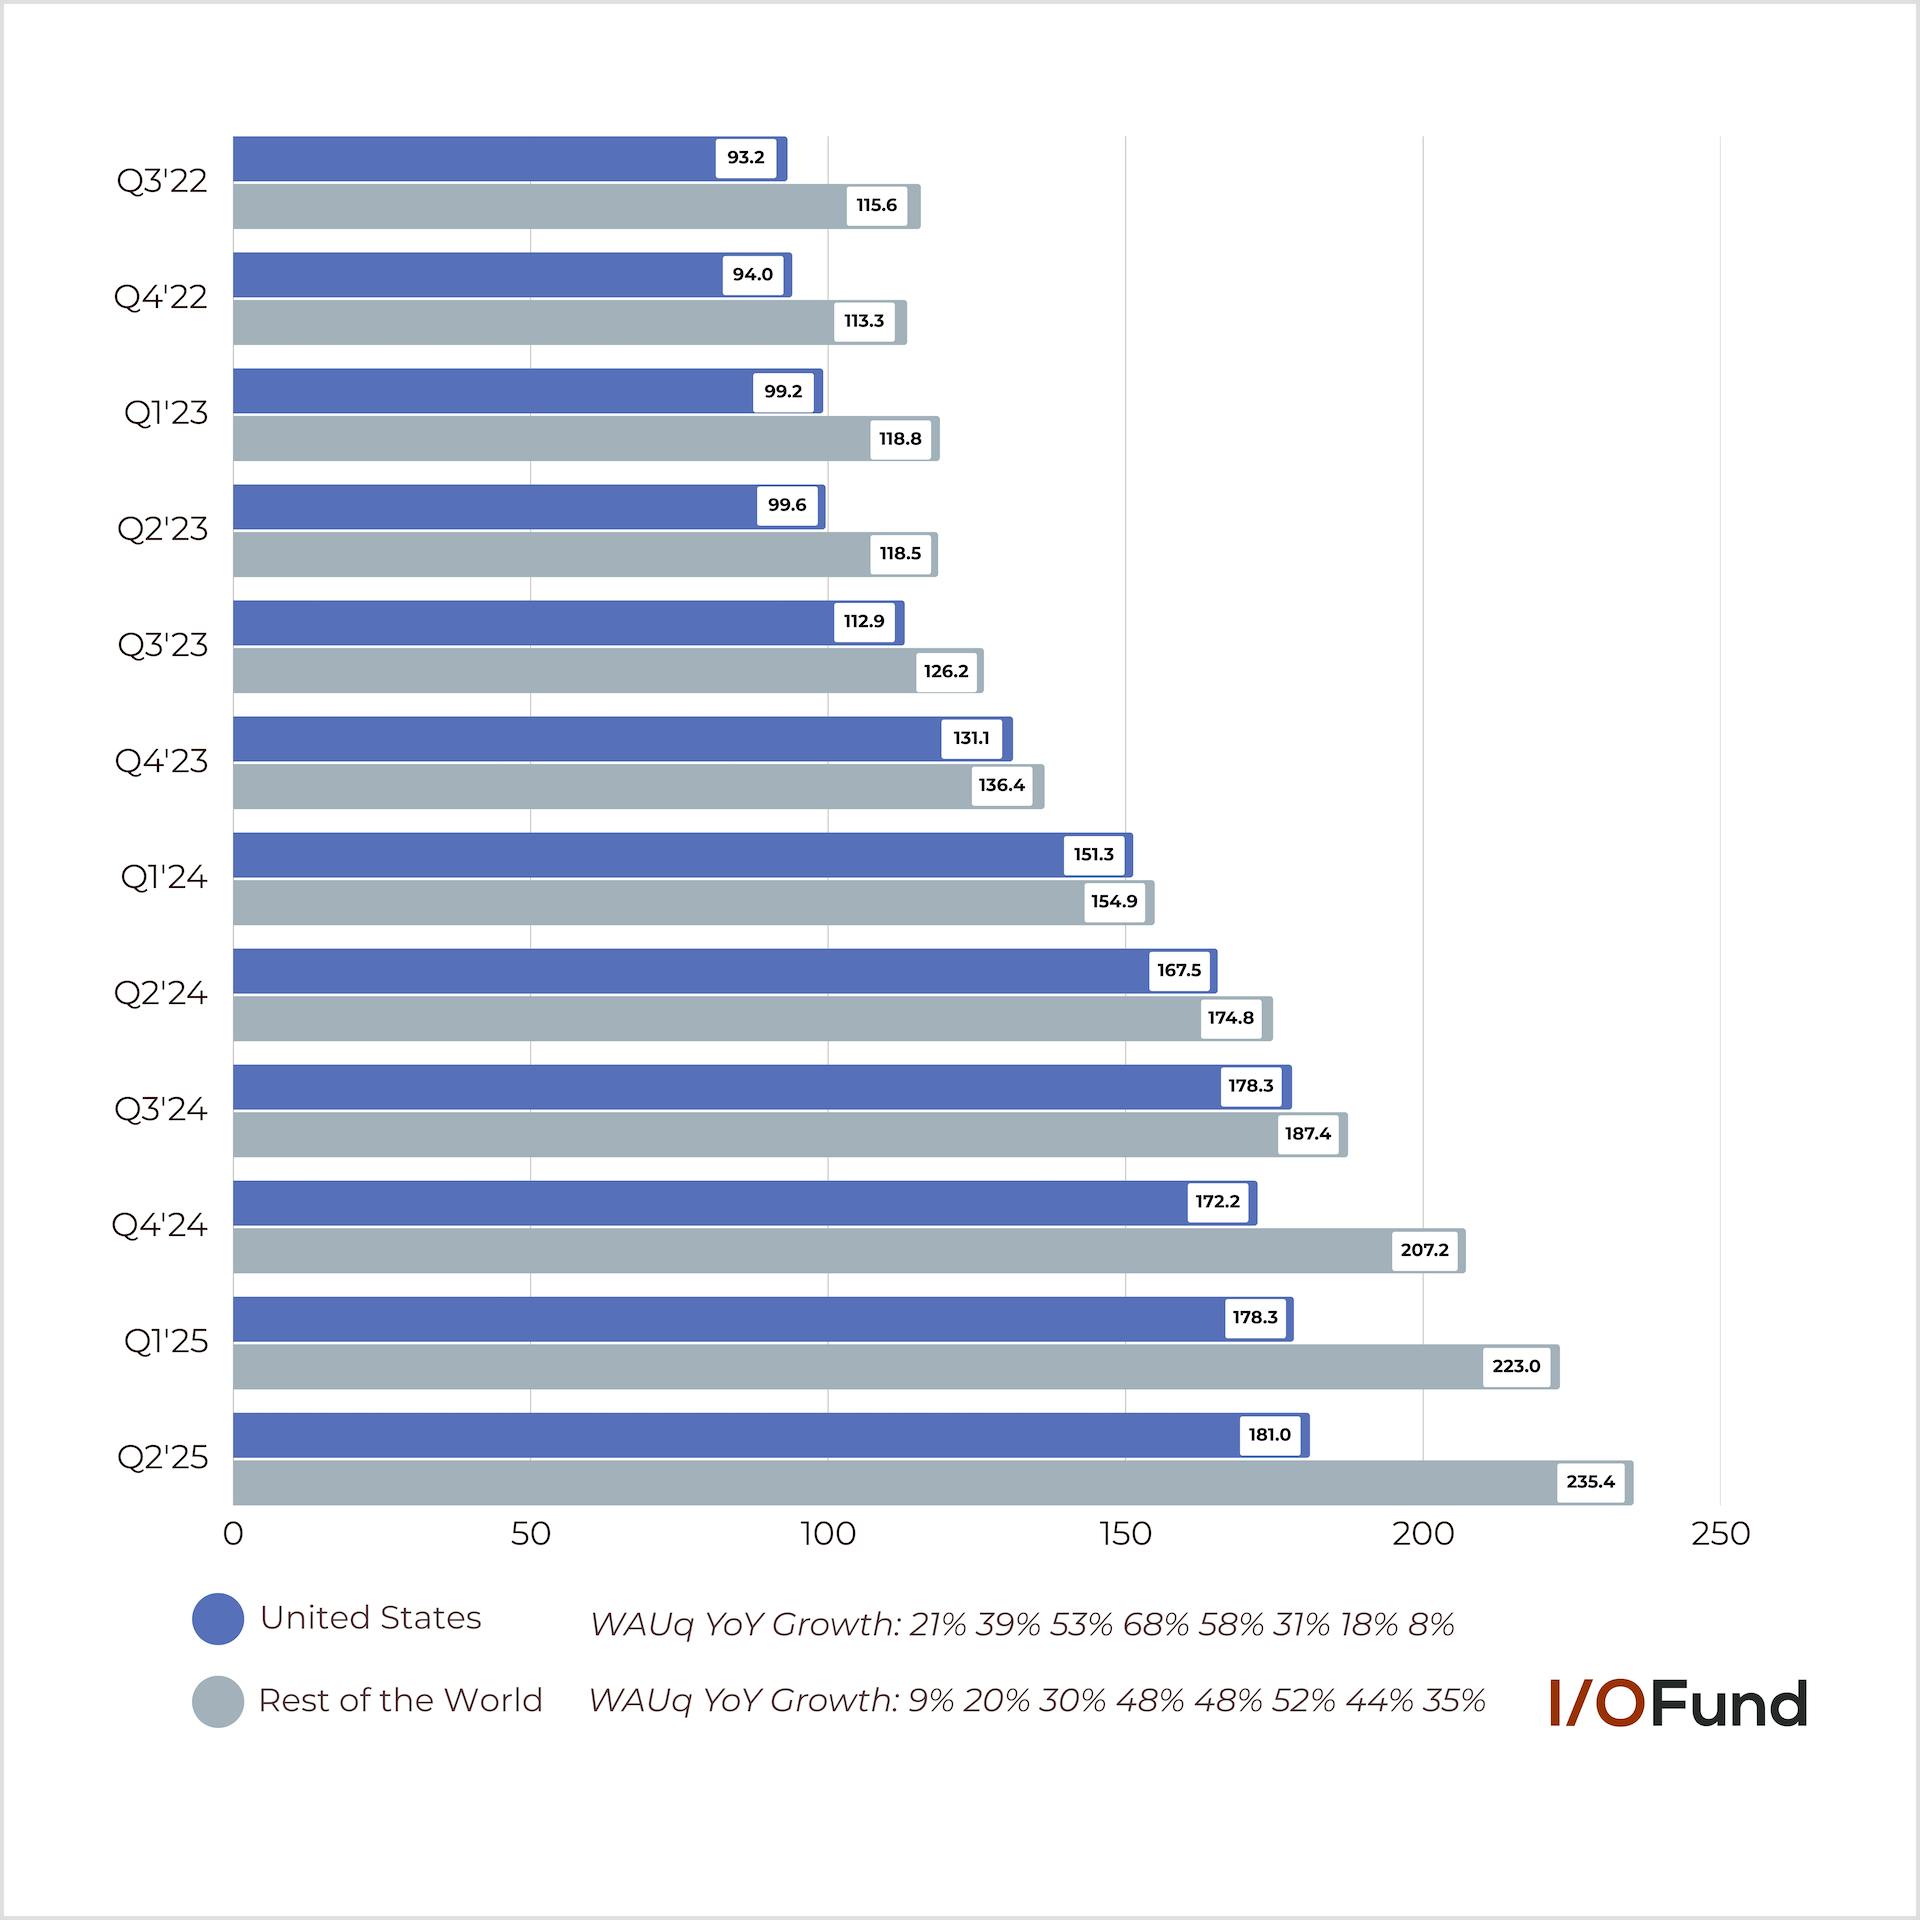
International weekly active unique users (WAUq) growth remains quite strong, with Q2 being its sixth consecutive quarter of >30% growth. Meanawhile, United States WAUq is plateauing, with growth decelerating 60 points over the past year and 10 points in the past quarter to just 8% in Q2.

Reddit earnings show slower U.S. active user growth while Rest of World drives the majority of growth.
  • Global WAUq rose 22% YoY and 4% QoQ to 416.4 million. 
  • US WAUq rose just 8% YoY and 1.5% QoQ to 181 million. In terms of user additions, YoY growth was just 13.5 million.  
  • International WAUq rose 35% YoY and nearly 6% QoQ to 235.4 million, or user additions of more than 60 million YoY.  

Why Slowing United States User Growth is not Ideal 

The plateau in US WAUq with minimal growth since Q3 2024 raises the risk that Reddit’s US penetration is approaching a peak and already maturing. With estimated US internet users of 322 million, Reddit’s penetration would be around 56%, versus Meta at 84% with 272 million MAUs in the US as of Q4 2023.  

Should Reddit find it difficult to boost its US penetration towards 200 million and above, or if US user growth does plateau here, future revenue gains will hinge on two key monetization drivers: impressions growth or ARPU growth.  

Driving impressions growth higher would rely on increasing ad loads either via higher platform engagement or content consumption (higher time spent or pages visited), or greater ad density. Ad density is a rather fine line to walk without oversaturating the platform with ads to the detriment of the user experience. ARPU growth would stem from improving ad pricing from better targeting or higher-value, higher-converting formats (increasing ROAS for advertisers), which Reddit is currently working on. 

This also ties into international growth – International monetizes at just over one-fifth the rate of US, yet now accounts for almost 57% of WAUq, up from 51% a year ago. If US plateaus and International continues to grow much quicker, say at >20% YoY, this presents a real headwind to global ARPU since the region monetizes at a much lower rate yet accounts for an increasingly larger share of users. 

The One Metric that Reddit Investors Should Watch Closely 

Reddit was the worst YTD performer against peers in June when fears were rising around traffic hits from Google’s AI Overviews, with shares down more than (30%) YTD. Barely two months later, shares have doubled, now making Reddit the best performer with its YTD return of 37%. 

We believe one key metric – above all other numbers – will help determine if Reddit can sustain darling status in 2025 and beyond. Given the meteoric rise this past month with Reddit’s stock seeing gains of 62% in one month, the information below is not to be missed. 

Sign up below to access the following information: 

  • The one key metric that provides an important hint as to whether Reddit can sustain its stock trajectory. 
  • Breaking down in granular detail why The Street is buying the stock; information we haven’t touched on yet in this analysis 
  • Why top line growth is important but may not be what ultimately drives the stock’s performance – and what will drive the stock further instead  

Reddit’s ARPU Accelerates to Record High 

The one metric that suggests Reddit’s run may not be over is the impressive acceleration seen in ARPU this past quarter.  

This past quarter marked the highest sequential growth in ARPU in more than three years at 25%, outpacing even Q4 24’s 18% growth. This could spell good things for the upcoming Q4, which is a seasonally high quarter for ad companies. 

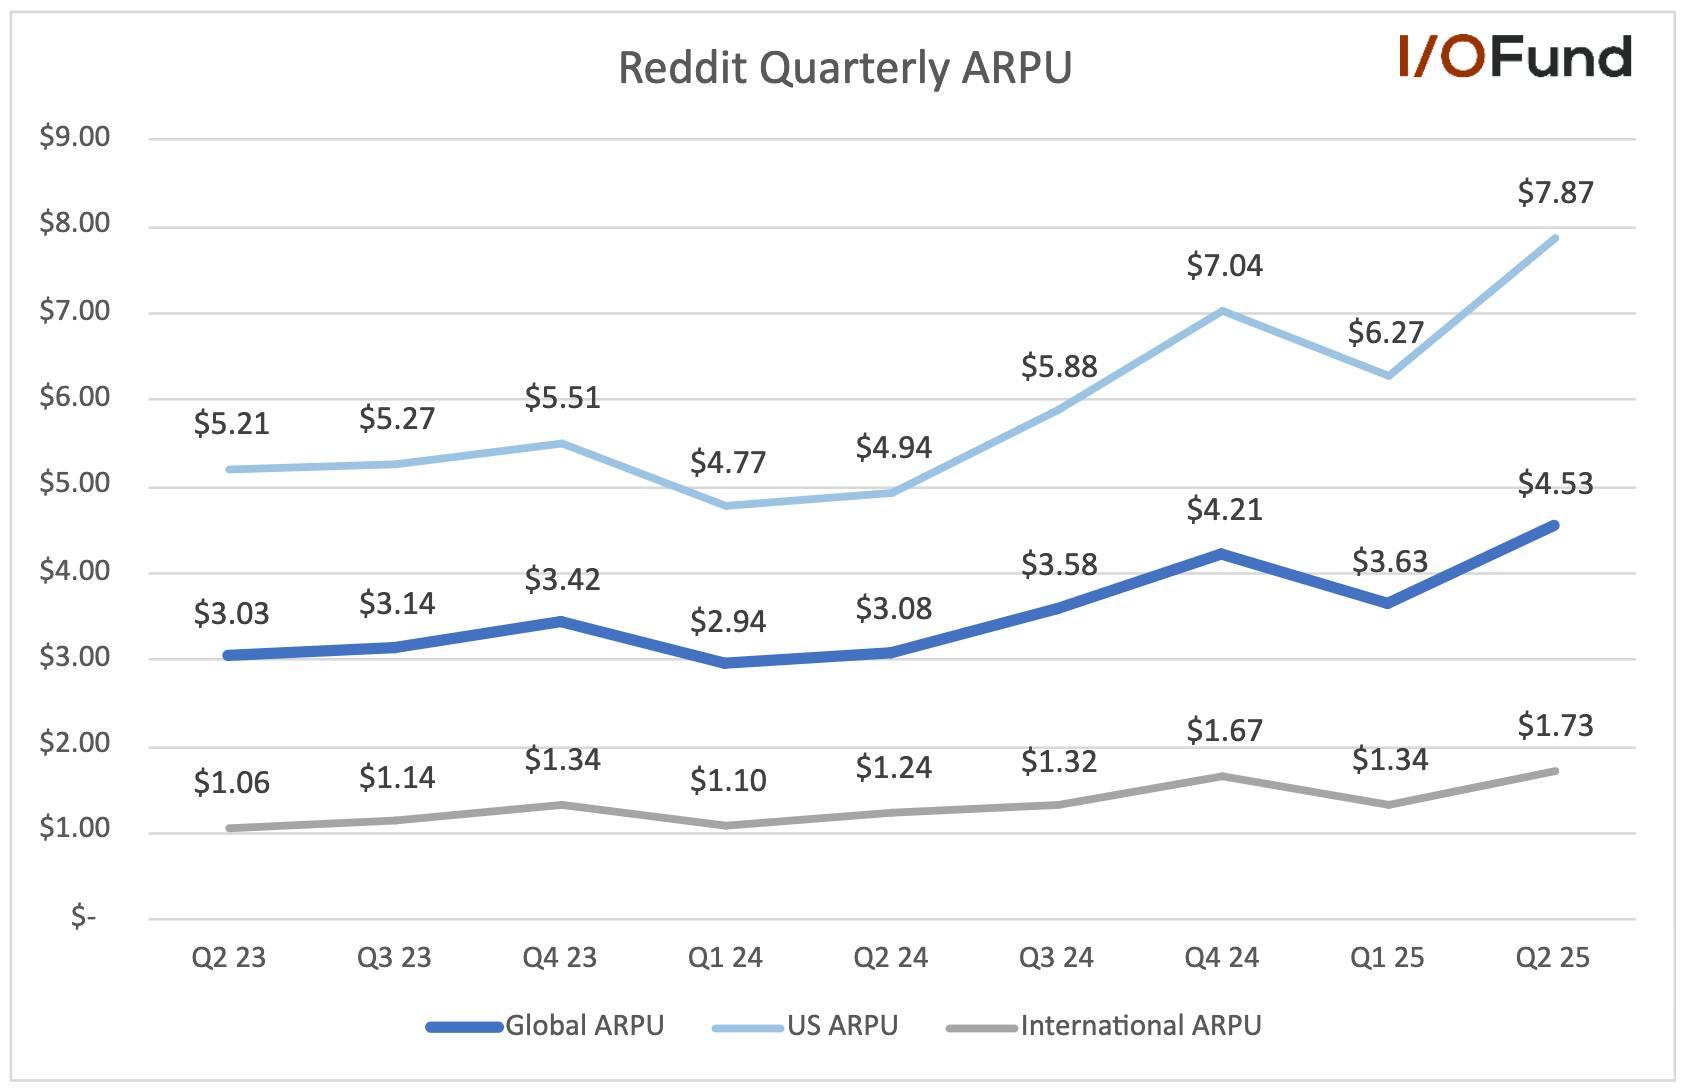
Reddit reports global ARPU of $4.53 in Q2, up 47% year-over-year, driven by higher ad impressions and modest ad pricing growth.

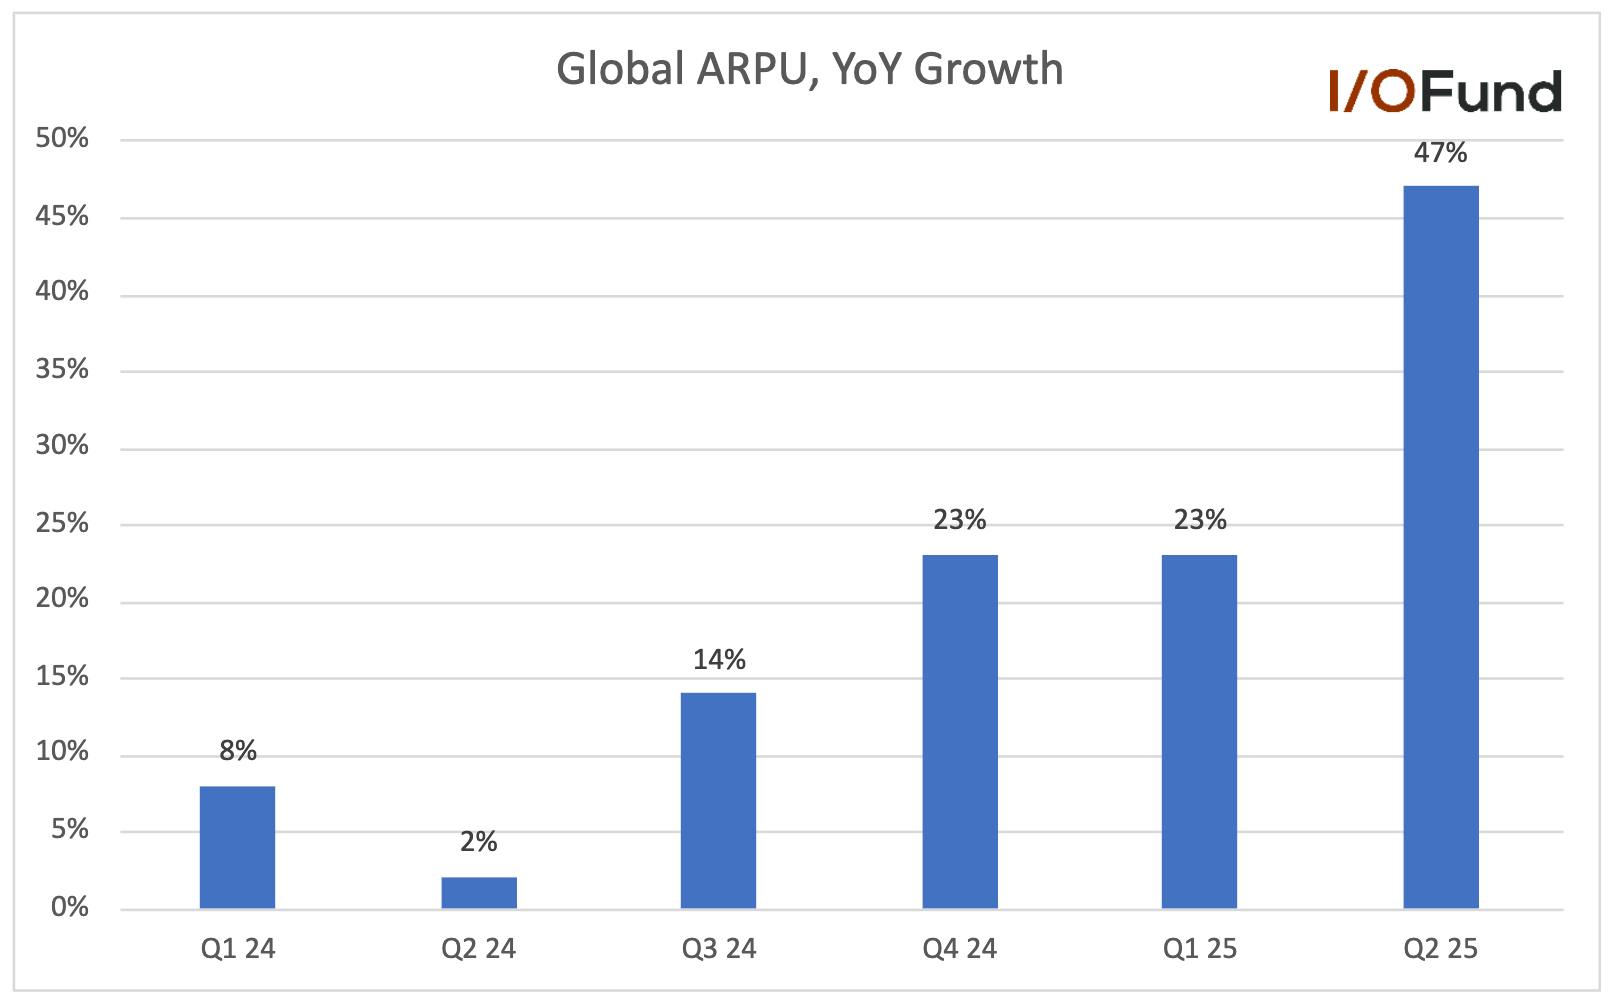
Global ARPU was $4.53 in Q2, accelerating 24 points to 47% YoY, driven primarily by growth in ad impressions and to a lesser extent, growth in ad prices. Ad pricing still did provide a “nice tailwind” in Q2, per Reddit, accelerating a bit further in Q2 after beginning to accelerate in Q1. Unlike Meta, Reddit does not break out impressions or pricing growth, so it’s impossible to see the pace at which the pricing metrics are growing. 

Management believes global ARPU is “still low on an absolute basis and remains an opportunity” for long-term improvement – for example, Meta’s global ARPU is around 3x of Reddit’s at $13.65 as of Q2, and though Meta hasn’t updated regional metrics since the end of 2023, it’s possible that US ARPU is 10x that of Reddit’s.  

Reddit’s US ARPU climbed to $7.87 in Q2, accelerating to 59% year-over-year after a weak 2024.

US ARPU jumped to $7.87, accelerating 28 points sequentially to 59% YoY in Q2. This is a remarkable achievement, considering US ARPU had struggled to grow in early 2024, with the year ago quarter seeing ARPU decline (5%) YoY.  

International ARPU rose 40% YoY to $1.73, also an 18 point sequential acceleration from 22% growth in Q1. While the region monetizes at a much lower rate than the US, similar to Meta, growth is lagging the US, presenting a headwind to global ARPU moving forward as international now begins to overtake the US in terms of active user share. 

Strong ARPU drives Revenue Acceleration, but may peak in Q2 

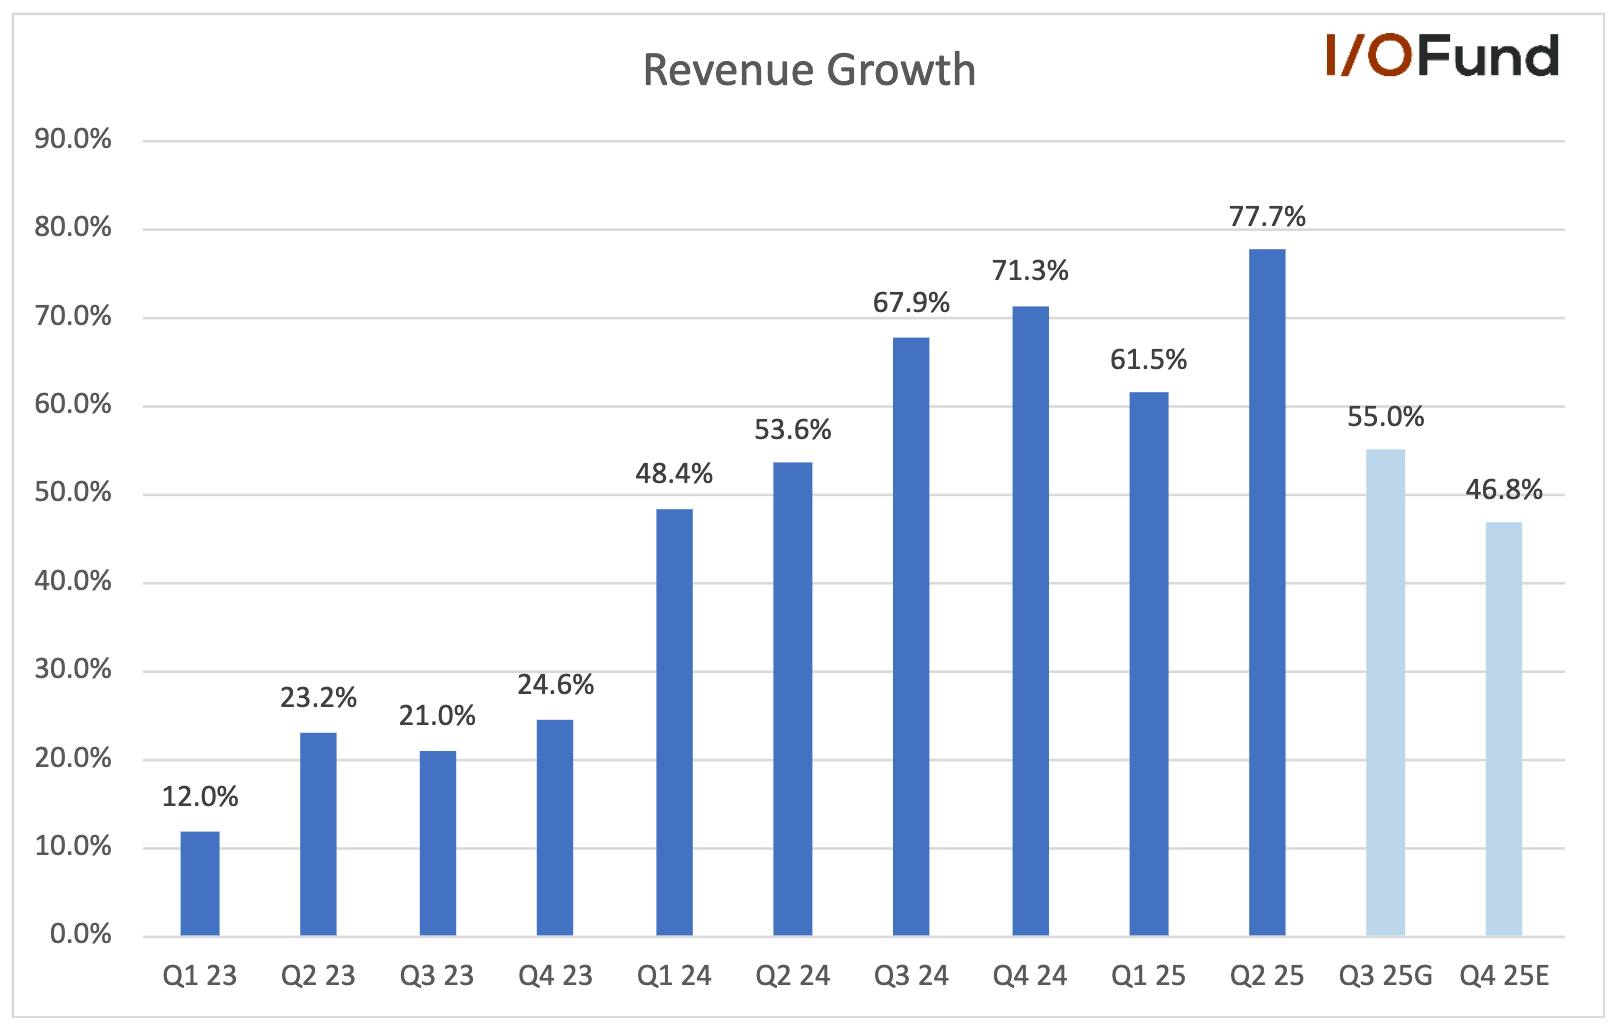
Reddit reported 77.7% growth in revenue in Q2 to $499.6 million, well ahead of estimates for just $426 million in the quarter – to put this in perspective, Reddit’s advertising revenue of $465 million alone would have beat estimates by more than 9%. AI data licensing and other revenue remains in the backseat, growing just 24% YoY to $34.8 million, or 7% of revenue. 

Q2 marked Reddit’s fastest growth since the start of 2022, and a significant improvement over the past two years from just 12% growth at the start of 2023. What’s even more impressive is that Reddit delivered this 77.7% growth on top of a rather difficult 53.6% comp, yet this may shape up to be the peak growth quarter for the year as comps get tougher.

Reddit guides Q3 revenue to $535–$545M, 55% growth and above expectations.

For Q3, Reddit guided for $535 to $545 million in revenue, or 55% at midpoint, against a 67.9% comp from Q3 2024. This was a strong outlook, more than 14% above consensus estimates for $473 million for the quarter. For Q4, analysts are currently expecting growth of 46.8% YoY to nearly $628 million.  

It’s not all smooth sailing for Reddit, as changes to Google’s algorithm and AI overviews have provided some headwinds. Management was straightforward in Q1 in saying that they do “expect some bumps along the way from Google because we've already seen a few this year. This is expected in any year, but given that the search ecosystem is under heavy construction, the near term could be more bumpy than usual.” Reddit did state that Google traffic varies from week to week, but that it was a headwind in Q2. 

Looking ahead, Reddit is currently expected to generate $2.06 billion in revenue in 2025, up nearly 59% YoY – this is 20 points faster than estimates from six months ago at 39% YoY to $1.81 billion. For 2026, Reddit is projected to report nearly 32% growth to $2.72 billion, more than doubling its revenue in just two years (from $1.3 billion in 2024).  

While discussing revenue, it’s important to touch upon advertiser concentration, as Reddit is quite heavily concentrated. Reddit noted that its top ten largest customers accounted for 25% and 26% of revenue in 2024 and 2023, or $325 million and $209 million respectively.

Analysts Raise Estimates = The Street buys the stock 

Reddit’s revenue and earnings revisions are strongly positive as the company’s business momentum continues to outpace estimates quarter after quarter — few stocks in the tech universe boast revenue and earnings revisions to this degree. 

Over the past month, consensus EPS estimates through Q4 2026, or the next six quarters, have been revised 23% to 66% higher; over the past six months, estimates have moved 20% to 57% higher, as margins strengthen. For example, Q2 2026 has seen its estimate move from $0.42 to $0.70 over the past month, and Q3 2026 from $0.55 to $0.83. This now projects three consecutive quarters of triple-digit YoY growth followed by three consecutive quarters of >50% growth.  

Consensus EPS estimates rise sharply, projecting strong growth through 2026.

For revenue, Reddit is now expected to see six consecutive quarters of >30% growth, with strong revisions to estimates through mid to late 2026. Q2 2026’s estimate has been revised nearly 21% higher over the past month from $545 million to $659 million, while Q3’s revenue has risen from $601 million to $711 million. 

Reddit’s revenue outlook strengthened, with six straight quarters of 30%+ growth expected and Q2–Q3 2026 estimates revised sharply higher.

On an annual basis, Reddit’s FY26 EPS has been revised 29% higher over the past month from $2.35 to $3.02, and revenue 14% higher from $2.39 billion to $2.72 billion. 

Reddit’s Quality Fundamentals 

In addition to the rapid rise in analyst estimates, which provides immediate room in the stock’s valuation, Reddit offers quality fundamentals (as many ad-based models do). 

GAAP Net Margin at 18% Despite Rising Costs, High SBC 

While the acceleration in advertising revenue and strong ARPU growth is certainly impressive, Reddit’s margin profile is arguably more impressive this quarter. The margin expansion is especially impressive considering SBC is quite high, and costs are rising at the highest pace in more than a year. 

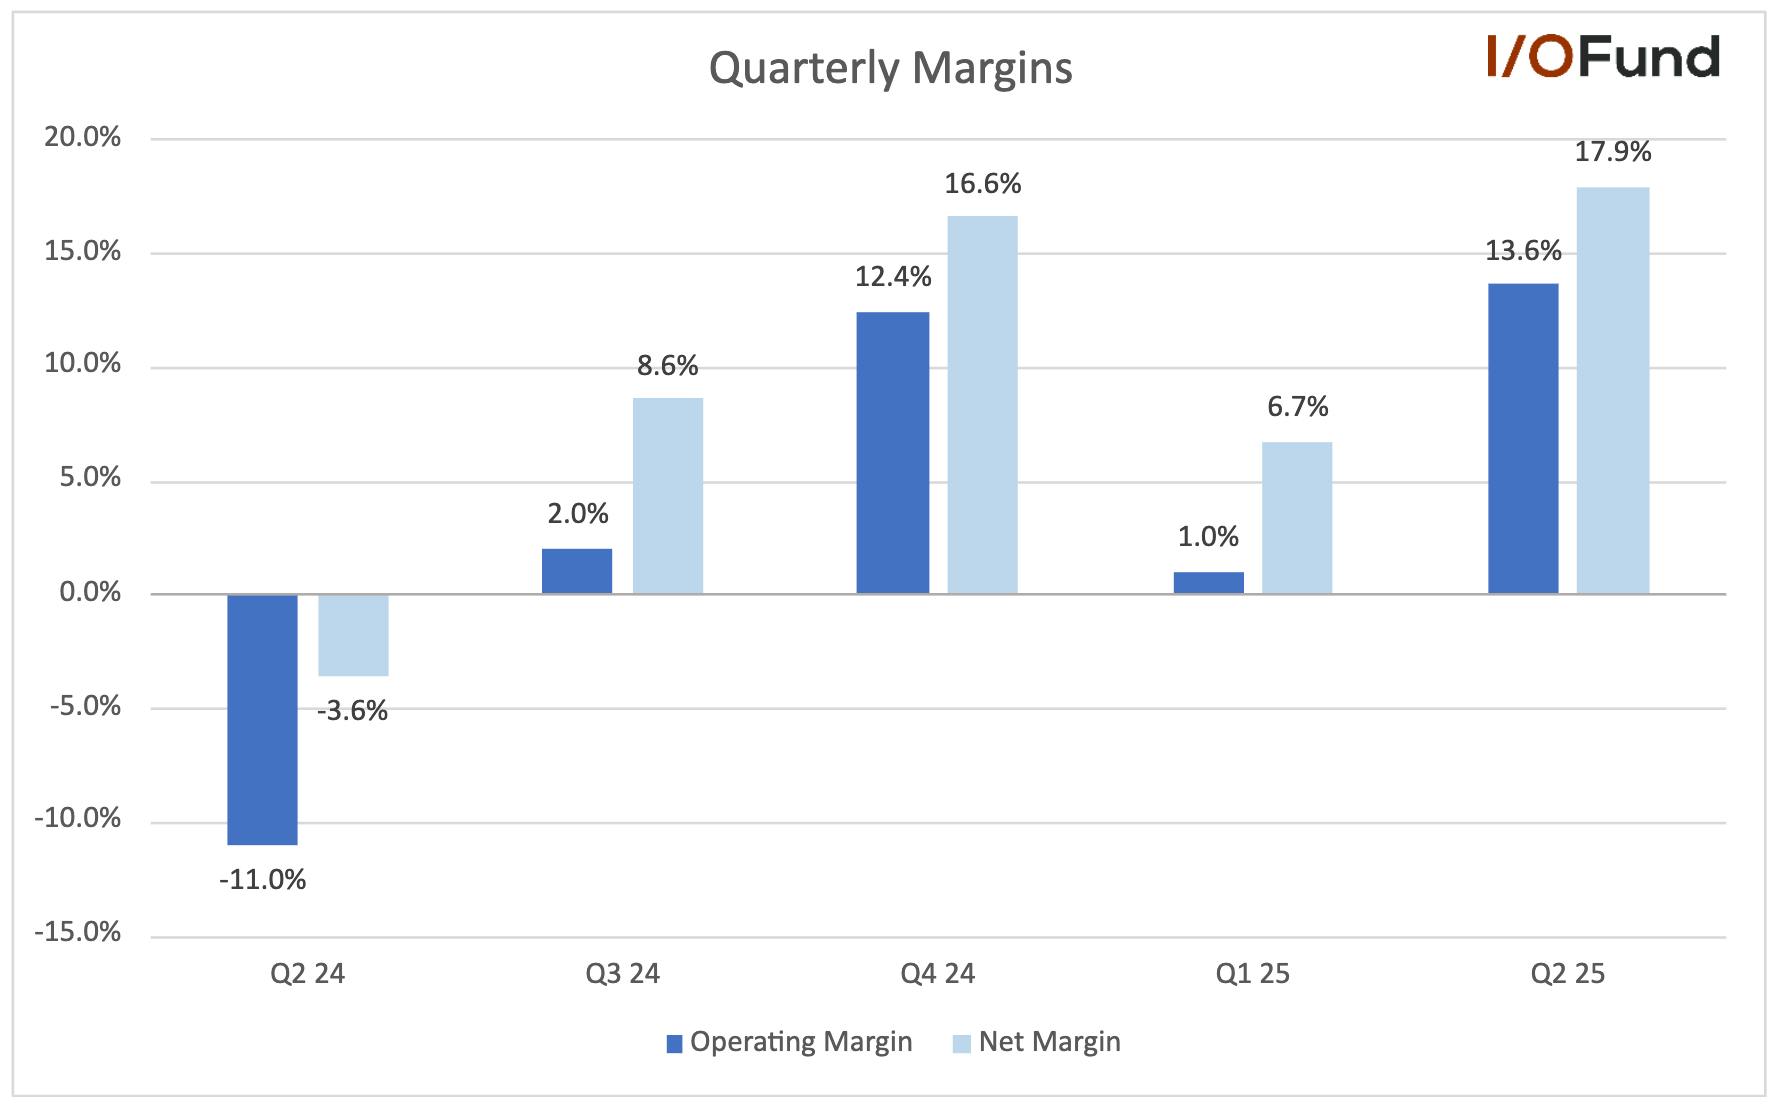
Reddit reported its fourth consecutive quarter with a >90% gross margin in Q2, while operating and net margin also marked their fourth consecutive quarter in positive territory. 

  • Gross margin was 90/8% in Q2, up 1.3 points YoY and marginally higher QoQ. 
  • Operating margin was 13.6%, up nearly 25 points YoY and 12.6 points QoQ. Notably, this also exceeded Q4 2024’s operating margin of 12.4%. 
  • Net margin was 17.9%, up more than 21 points YoY and 11.2 points QoQ. Net margin is higher than operating margin as Reddit benefits from interest income on its $2 billion in cash on hand. 
Reddit shows strong operating and net margin improvement even with 37% expense growth and 18% SBC, signaling long-term potential for higher profitability as costs normalize.

What’s remarkable here is that Reddit delivered this level of improvement in operating and net margin despite operating expenses rising nearly 37% YoY in Q2, and with SBC being quite elevated at 18% of revenue. This also implies that as Reddit matures and scales revenue into the billions in the long run, there is a pathway to potentially double net margin should expenses growth normalize back to the teens and SBC also normalize to a much lower percentage of revenue.  

EPS and Adjusted EBITDA 

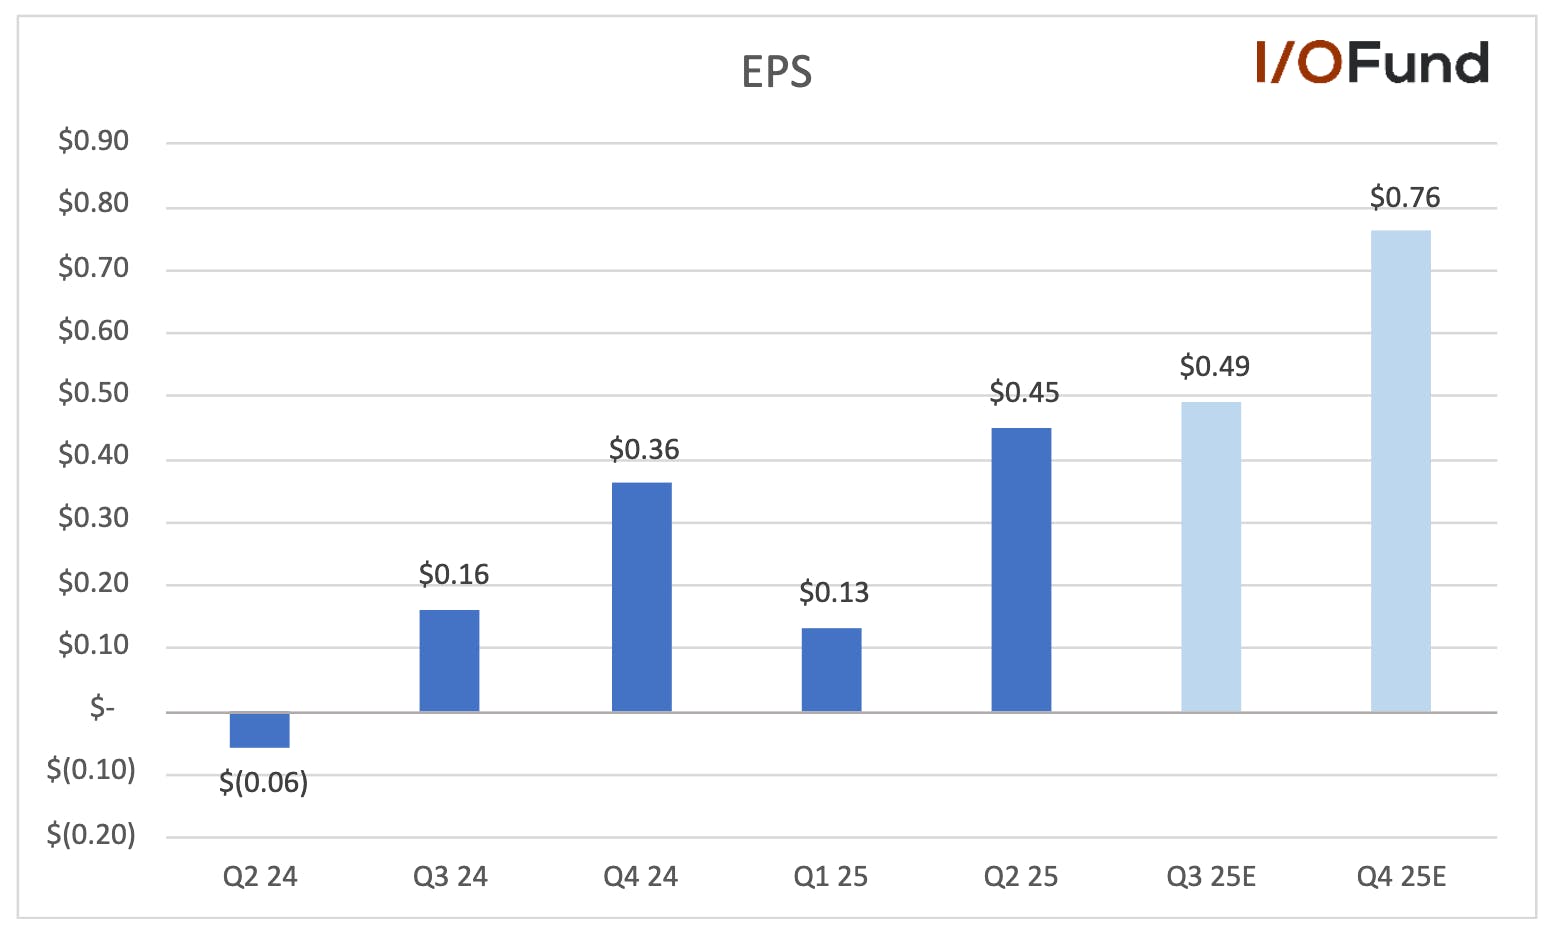
Fueled by the large top-line beat and strength in margins down the line, Reddit delivered an outstanding 138% EPS beat in Q2, reporting $0.45 per share versus estimates for $0.19.  

Looking ahead, EPS is expected to grow triple digits in both Q3 and Q4, with current estimates pointing to 209% YoY growth to $0.49 in Q3 and 111% growth to $0.76 in Q4. This implies analysts are placing Reddit’s net margin at approximately 25% by Q4, up 7 points, assuming minimal share dilution. 

Reddit earnings per share expected to grow triple digits in Q3 and Q4, with estimates of 209% YoY to $0.49 and 111% YoY to $0.76, implying net margins near 25% by Q4.

For the full year, Reddit is expected to report EPS of $1.86, with the majority of this coming in the next two quarters. For 2026, EPS is projected to grow nearly 63% YoY to $3.02, outpacing revenue growth by a factor of 2x as Reddit benefits from increasing operating leverage. 

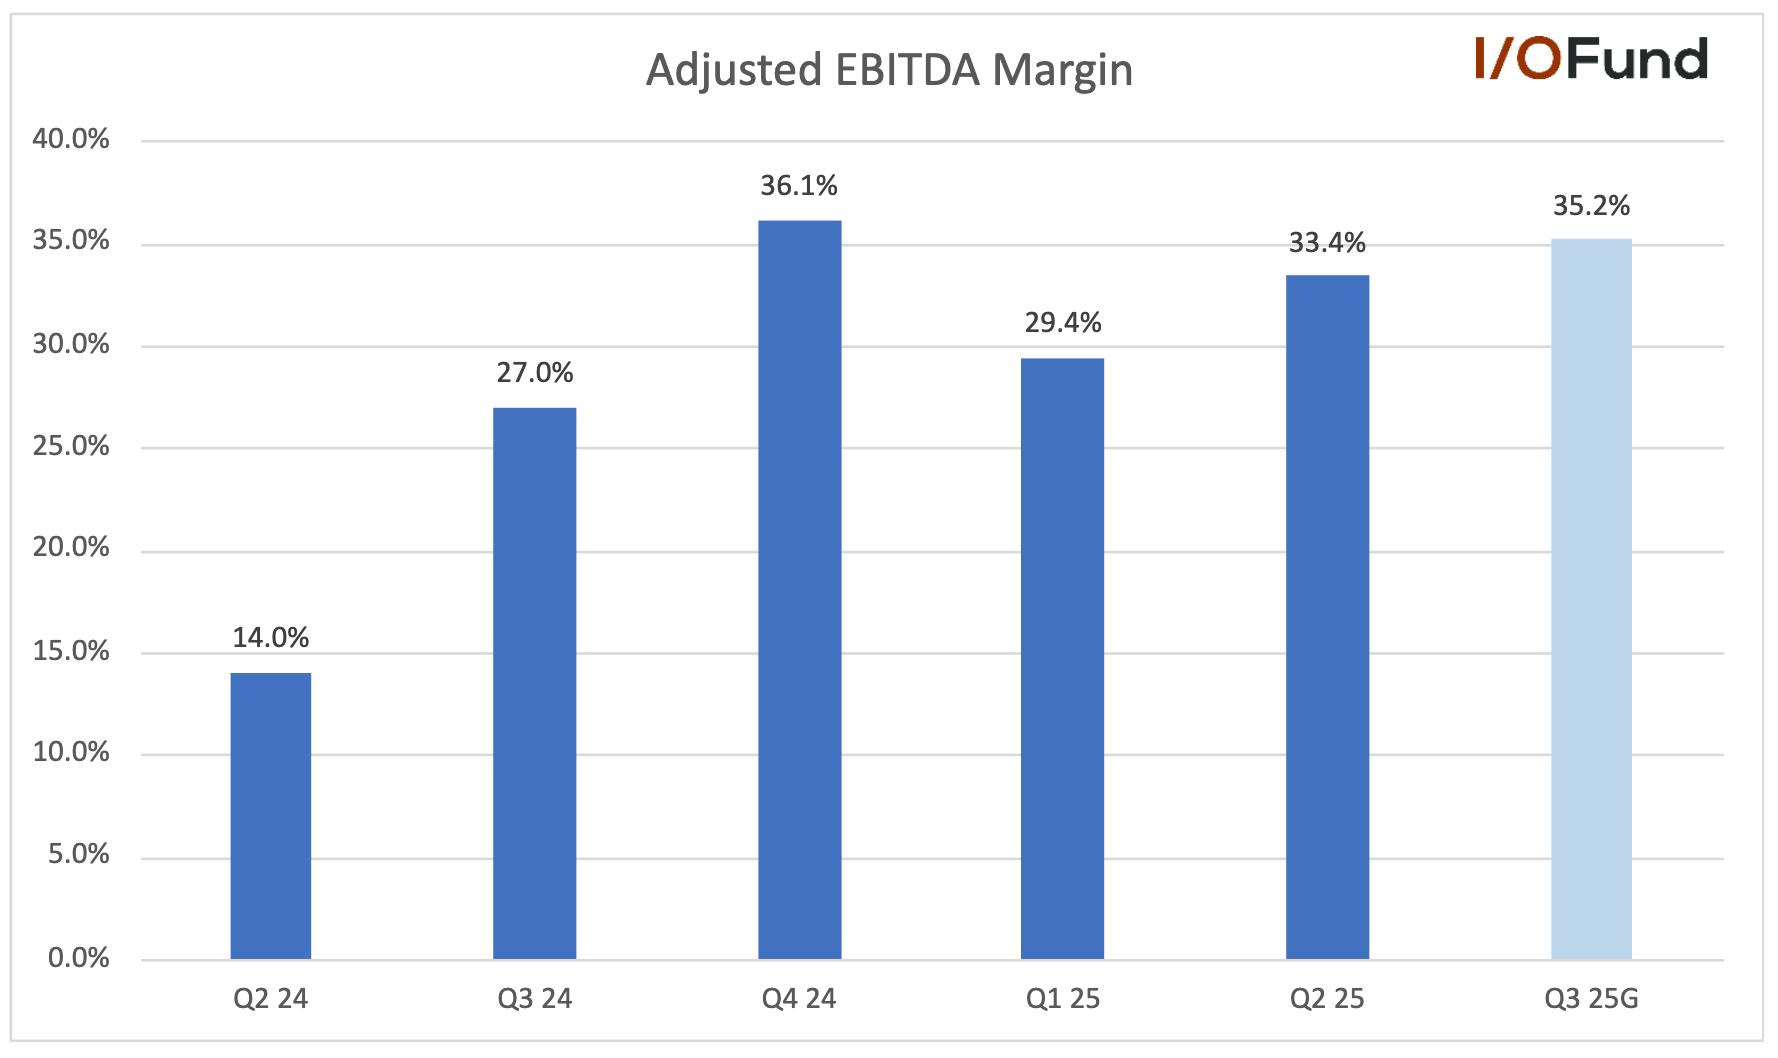
Adjusted EBITDA was $166.7 million in Q2 for a 33.4% margin, up more than 19 points YoY and 4 points QoQ. However, unlike operating and net margins, adjusted EBITDA margin did not surpass Q4’s level. For Q3, Reddit guided for $185 to $195 million in adjusted EBITDA, or a 35.2% margin at midpoint.

Reddit reported adjusted EBITDA of $166.7 million in Q2 2025 with a 33.4% margin, up 19 points YoY and 4 points QoQ, though still below Q4 levels. Q3 guidance is $185–195 million, or a 35.2% margin at midpoint.

Cash Flows and Balance Sheet 

Cash flows continue to be strong, with Q2 the fourth consecutive quarter with cash flow margins above 20%. Reddit’s balance sheet is very healthy as well, with no debt and more than $2 billion in cash and marketable securities. 

  • Operating cash flow was $111.3 million in Q2, up 292% YoY. OCF margin was 22.3%, down 10 points QoQ but up more than 12 points YoY. 
  • Due to limited capex expenditures, free cash flow and operating cash flow are correlated nearly 1:1. Free cash flow was $110.8 million in Q2 for a 22.2% margin. 
  • Cash and marketable securities have increased more than 20% over the past year to $2.06 billion. 

One more catalyst to mention: Reddit Seeks AI Data Licensing Deals: 

While advertising revenue is firmly in the drivers seat for growth, accounting for 93% of revenue in Q2, Reddit does have some opportunities from AI data licensing. Ahead of its IPO in early 2024, Reddit stated that it had signed contracts worth $203 million over a two to three-year period, letting companies train AI models on its >1 billion cumulative posts and >16 billion comments.  

In February 2024, it was revealed that Google was behind one of the deals, worth an estimated $60 million per year; shortly after this was announced, the FTC opened an inquiry into Reddit’s AI data licensing plans. In March 2024, Reddit signed another deal with PR firm Cision, and in May, Reddit signed a deal with OpenAI for data licensing, with OpenAI to bring ‘enhanced’ Reddit content to ChatGPT and become an ad partner on the site. 

However, the AI data licensing side has seen its fair share of controversy, with Reddit recently suing OpenAI competitor Anthropic in June, alleging it was training its AI models by scraping Reddit’s data without consent. Additionally, earlier this week, Reddit began blocking internet archive the Wayback Machine from accessing its site, in order to prevent unnamed AI firms from using the archive to scrape data for free. 

Valuation Far Above Peers 

Reddit was the worst YTD performer against peers in June when fears were rising around traffic hits from Google’s AI Overviews, with shares down more than (30%) YTD. Barely two months later, shares have doubled, now making Reddit the best performer with its YTD return of 37%.  

Reddit shifted from the worst YTD performer in June 2025, down over 30% amid Google AI Overviews traffic fears, to the best performer just two months later with shares doubling for a 37% YTD gain.

Source: YChartsYCharts

Interestingly, despite underperforming the sector through all of Q2, Reddit has traded at a premium on a forward PS basis the entire year, and has returned to its prior peak and frothy level at >20x forward PS. Reddit now trades at double Meta’s valuation at 10.1x forward PS, yet is admittedly a much higher growth stock. When compared to Applovin, another high growth ad model, Reddit trades similarly with APP at 24 forward PS.

Reddit trades at over 20x forward PS in August 2025, nearly double Meta’s 10.1x and far above Pinterest at 5.6x and Snap at 2.1x.

Source: YChartsYCharts

On the bottom line, Reddit trades at a forward PE ratio of 60 compared to Applovin at 40 and Meta at 20 forward PE ratio. EV to forward EBTIDA is similar with Reddit trading at a premium of 42 versus App at 30 and Meta at 15.

Conclusion 

Reddit is firing on all cylinders with a huge beat and raise in Q2, driven by a rapid acceleration in advertising revenue and ARPU. As of now, Q3’s guide, while nearly 15% above estimates, still implies Q2 will be the peak growth quarter for the year at 78% YoY before decelerating by >20 points into year-end. Despite topline growth being more subdued according to current analyst estimates, the company has triple-digit growth incoming on the bottom line for the next three quarters – any beat here will help the valuation. 

The company also delivered GAAP operating and net margin expansion to new highs at 13.6% and 17.9%, even with costs rising in the high-30% range YoY and elevated SBC in the high-teens percentage of revenue.  

The slowing United States user growth is to be watched, leaving the primary challenge of expanding ARPU globally.  So far, so good there as ARPU is hinting that something important is going on with the stock’s monetization strategy, which we’ve outlined in this report.

Special FREE 1-hour webinar on how to manage risk with Bitcoin and cryptocurrencies. Join the team that identified Bitcoin’s previous top and previous bottom with impeccable accuracy – Knox Ridley of the I/O Fund and Vincent Duchaine of Wealth Umbrella – in a special webinar held on August 21st at 4:30 pm ESTMore details here 

Our five-year cumulative returns of 210% would place us as #2 if we were a hedge fund and #5 if we were an ETF. Learn more here

Please note: The I/O Fund conducts research and draws conclusions for the company’s portfolio. We then share that information with our readers and offer real-time trade notifications. This is not a guarantee of a stock’s performance and it is not financial advice. Please consult your personal financial advisor before buying any stock in the companies mentioned in this analysis. Beth Kindig and the I/O Fund do not own shares in RDDT at the time of writing and may own stocks pictured in the charts.

Recommended Reading:
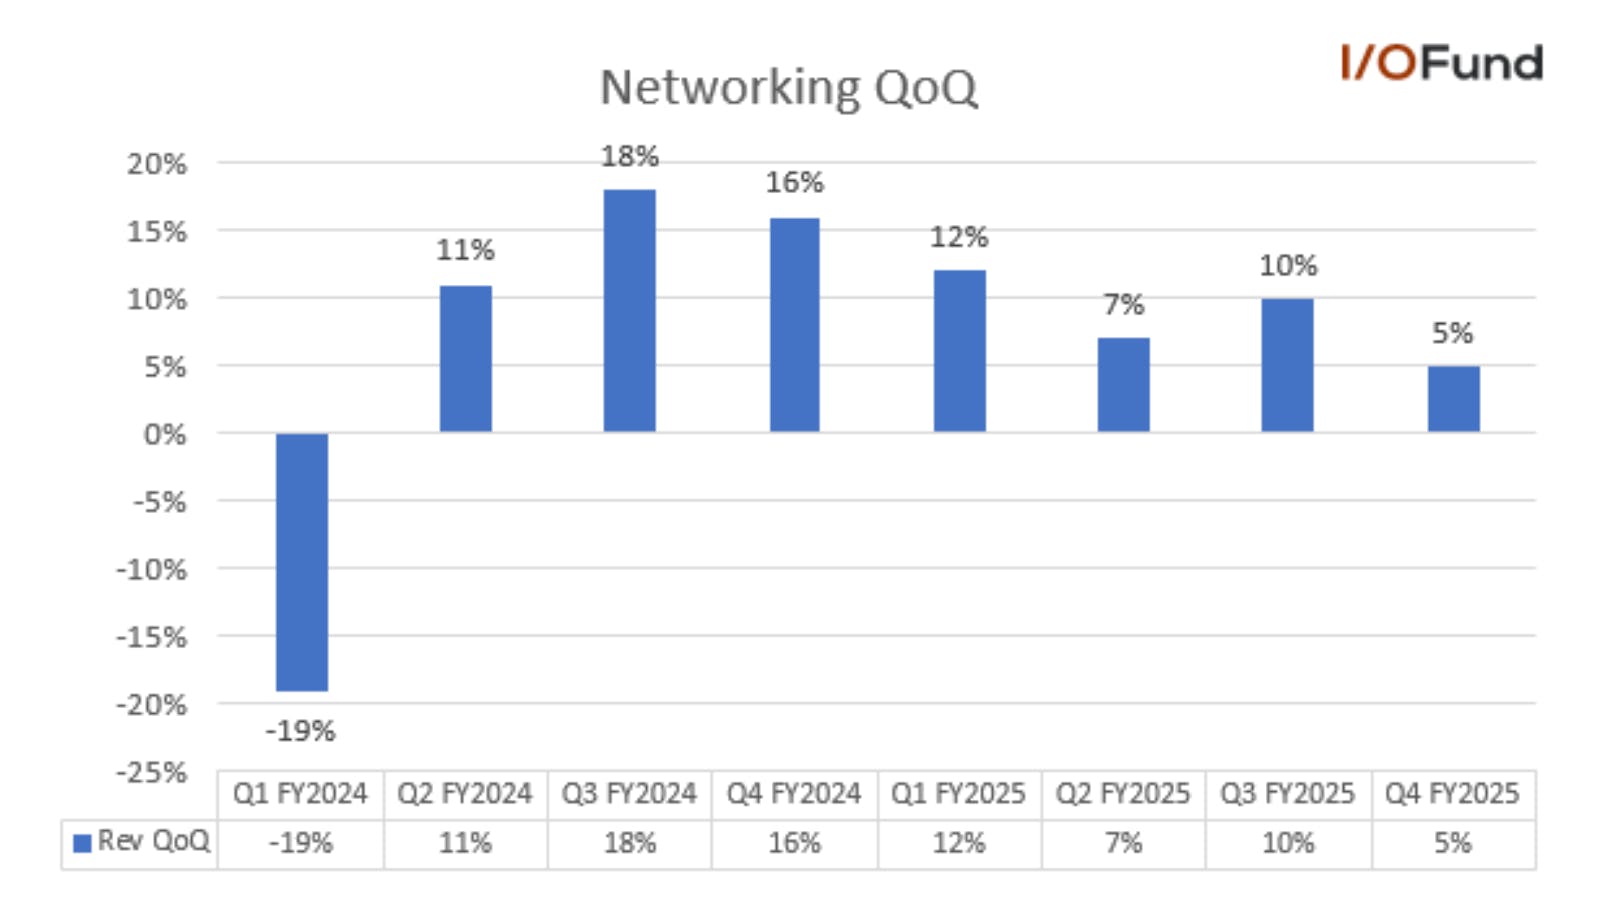
Essentials Service Discontinued on August 1st, 2025 

Thank you for being a valued part of our community and for supporting our mission to deliver high-quality stock analysis at an affordable price through the Essentials plan ($99/year). 

As we continue to expand our research and enhance the experience for our members, we’ve made the strategic decision to streamline our offerings. Beginning August 1, 2025, the Essentials plan will be discontinued. This change allows us to dedicate more resources to our premium tiers—Pro, Advanced, and Discovery—which will deliver even deeper insights, more frequent updates, and expanded coverage. 

What this means for you: 

  • We are extending special discounted upgrade opportunities to our premium tiers for Essentials members. Please reach out to premium@io-fund.compremium@io-fund.com for details. 
  • Archived Essentials Content will remain accessible under the Essentials tab until November 30, 2025. After that date, all Essentials research will be migrated to the Pro Dashboard for future access. 

We appreciate your continued trust and support as we grow. These changes will allow us to deliver an even higher standard of analysis and research to our members—helping you stay ahead in today’s rapidly evolving market.

Innodata: FY25 Revenue Growth Raised to >45%, yet Largest Customer Revenue is Flat for Two Quarters

Innodata boosted its full-year revenue growth outlook by five points in Q2, now forecasting more than 45% growth this year, driven by strong demand, significant new deal wins and a large pipeline geared toward the second-half of the year. 

However, digging into the details reveals that Innodata’s largest customer has not expanded over the last two quarters, and remains at the $135 million annualized rate as stated in Q4. This comes despite Innodata discussing expansion opportunities with this customer and a second SOW signed in Q1, with growth not yet materializing. 

The CEO offered an update in Q2 that they’ve won “several new projects” with their largest customer and have others in the pipeline: 

 “We recently won several new projects with our largest customer and we have others in pipeline that are not yet included in our forecast, but which we think are reasonably likely. Several of these new projects are under the second SOW we reported signing with this customer last quarter. We believe that the second SOW potentially gives us access to an even larger generative AI revenue pool with this customer.” 

Innodata is a $1.5B market cap stock highly dependent on the announcement of new customer wins and expanding its projects with the largest customer. Our strategy is to watch price closely for the best risk/reward on an entry; and any entry will have a tight stop. 

We’ve discussed in the past that Innodata appears to have a low valuation when compared to peers. Our previous analysis also went into the details of Innodata’s products, market positioning and can be found here: “Innodata: Early-Stage AI Data Engineering; Lumpy Growth” 

Discovery Members: You are invited to join Knox Ridley on Monday, August 18th at 4:30 pm EST for a special Discovery webinar where he will discuss technical setups on Discovery stocks.a special Discovery webinar where he will discuss technical setups on Discovery stocks. 

Revenue up 79.4% YoY 

Innodata reported a slight revenue beat in Q2, with revenue coming in 3.6% ahead of estimates to $58.4 million, up 79.4% YoY. This did mark a more than 40 point deceleration in growth sequentially, yet that was expected coming into the quarter. 

However, there have been some shifts in forward estimates for Q3 and Q4. For Q3, revenue estimates have been revised nearly $2 million lower since June, now projecting revenue of $59.8 million for growth of just 14.5% YoY. Q4 revenue has been revised more than $5.5 million higher to $70.9 million, for growth of almost 20% YoY. This suggest Q3 is now expected to see be a bottom of sorts before rebounding and reaccelerating into 2026. 

For the full-year, Innodata raised its revenue growth guidance from 40% to >45%, now implying revenue of >$247 million, up from $239 million as of Q1. It is important to keep in mind the fluid nature of Innodata’s business, and that any new contractual agreements or expansions could have a large and/or immediate impact on revenue.  

Management stated that the guidance hike was driven by “significant new deals that have been finalized since our last call as well as several deals that we believe are highly likely to close in the near term.” Any of these new deals could easily boost growth depending on how quickly they scale.  

One key point that could be behind the post-earnings sell-off was some comments made by management around customer engagement and deal sizes. CEO Jack Abuhoff said that with one Big Tech customer, Innodata was “recently awarded a number of significant engagements… enabling us to forecast $10 million of revenue from this customer in the second half of this year,” up from $0.2 million over the last four quarters. Given the size of the revenue guide raise at just $8 million implied, this comment raises some questions about growth in 2H from other core customers. 

Largest Customer Accounts for 58% of Revenue 

Innodata provided only a brief update on customer progress this quarter, one with its largest customer and the other being the $10 million revenue opportunity discussed above.  

With its largest customer, Innodata said that it won “several new projects,” with some of these being under the second scope-of-work (SOW) signed last quarter. Management added that there are other projects in the pipeline with the customer that are not yet included in its forecast, but are “reasonably likely” to be signed in the future.  

Innodata’s largest customer accounted for 58% of revenue in Q2 and 59% of revenue for 1H, implying contributions of ~$33.9 million in Q2 and $68.9 million in 1H. This represents no change from Q4 (ie. no expansion) when it was stated the customer was at a $135 million annualized run rate, or ~$34 million quarterly. 

Innodata also had no other >10% customers, implying the remaining customers are not spending more than $5.8 million per quarter with the company. The forecast for $10 million in 2H from another customer would likely make said customer Innodata’s second largest and a second >10% customer.  

AI Segment Grew 99% YoY on Top of Tough Comps 

DDS remains the key driver of Innodata’s growth due to its role in handling AI data preparation, labeling and annotation, AI training and related services.  

DDS revenue grew 99% YoY to $50.58 million, though this was slightly down sequentially from $50.83 million in Q1. Although the segment’s growth barely dropped out of the triple-digit range, what’s impressive is that revenue still practically doubled YoY against a 93% growth comp. 

  • Synodex revenue rose 4% YoY to $2.06 million, slowing from nearly 8% growth in Q1. 
  • Agility revenue rose 11.5% YoY to $5.75 million, flat with growth from Q1. 

Margins and Adjusted EBITDA expand significantly YoY 

Innodata’s margins have significantly expanded YoY, which helps set Innodata apart from stocks in the $1B or $2B market cap range (Innodata is at $1.5B market cap). There was a marginal sequential decline QoQ yet not enough to matter in terms of the overall improvement seen from strong margin and adjusted EBITDA expansion over the past few quarters. 

For example, GAAP operating margin was up 14 points YoY from 1.3% to 15.3% in the current quarter.  

  • Q2 GAAP gross margin was 39.4% in Q2, down nearly half a point sequentially but up nearly 11 points YoY. Adjusted gross margin was 42.9%, down slightly from Q1 but up more than 9.5 points YoY. 
  • Q2 GAAP operating margin was 15.3%, up 1.1 points sequentially and up more than 14 points YoY. 
  • Q2 GAAP net margin was 12.4%, down 1 point sequentially but up from approximately 0% in the year ago quarter. 

Turning to adjusted EBITDA — Innodata saw a slight sequential improvement in adjusted EBITDA margin in Q2, though on a YoY basis, adjusted EBITDA margin expanded more than 14 points. Innodata had guided for YoY growth in adjusted EBITDA with no further clarity, and has currently reported nearly $26 million for 1H ’25 versus $34.6 million for all of FY24.  

  • Consolidated adjusted EBITDA margin was 22.7%, up from 21.8% in Q1 and 8.6% in the year ago quarter. 
  • DDS adjusted EBITDA margin was 24.2%, up from 22.7% in Q1 and just 5% in the year ago quarter. Tracking DDS’ adjusted EBITDA is important considering the segment accounts for more than 92% of consolidated adjusted EBITDA. 
  • Synodex adjusted EBITDA margin was 22.3%, up from 20.8% in Q1 but down from 26.3% in the year ago quarter 
  • Agility adjusted EBITDA margin was 9.7%, faring the worst out of the three segments as this was down 4 points from Q1 and down nearly 10 points YoY. 

EPS Beat by 80% yet EPS expected to decelerate in coming quarters 

Innodata handily beat on EPS in Q2, reporting $0.20 in GAAP EPS versus consensus estimates for $0.11. Looking ahead, Q3 EPS estimates are following revenue in moving slightly lower, while Q4 estimates have moved slightly higher. Since our last report, Innodata: Early-Stage AI Data Engineering; Lumpy Growth, here’s how estimates have changed: 

  • Q3 EPS has been revised $0.03 lower, from $0.17 to $0.14, for a YoY decline of more than (73%), though as a reminder the year-ago comp is technically inflated from a $5.9 million income tax benefit.  
  • Q4 EPS has been revised $0.02 higher, from $0.19 to $0.21, for a YoY decline of (31.2%). 

For FY25, Innodata is expected to report EPS of $0.76, down (14.6%) YoY before rebounding to 34.5% growth in FY26 to $1.02. To note, FY26’s EPS estimate is still unchanged since June’s writeup.  

Cash Flow Declines 60% QoQ 

Another blemish in Q2’s report were cash flows, which declined more than (60%) sequentially. Innodata’s balance sheet remains healthy, and the company still has the entirety of its $30 million credit line available.  

  • Operating cash flow was $4.23 million, down (61%) QoQ. OCF margin was 7.3%, down more than 11 points QoQ. For 1H, operating cash flow was $15.1 million, up more than 139% YoY. 
  • Free cash flow was $2.5 million, down more than (70%) QoQ. Free cash flow margin was 4.3%, down more than 10 points QoQ. For 1H, free cash flow was $11.0 million, up nearly 5x YoY.  
  • Cash and equivalents totaled $59.8 million, and debt remained zero. 
  • Deferred revenue was $6.5 million, down from $8.0 million in Q1.

Earnings Call Q&A 

There were two topics on the earnings call Q&A session worth highlighting. The first was questions about Scale AI and if Innodata will see more customers onboard as a result of Meta’s large investment of $14.3 billion. The second was why agentic AI will drive more uses cases for the simulation data solutions such as what Innodata and its competitors offer. 

Scale AI’s investment is a potential/speculative tailwind: 

We covered why Scale AI’s investment could be a potential/speculative tailwind in our prior analysis stating: " Following Meta’s investment, it was rumored that Google, OpenAI and Tesla are looking elsewhere to avoid strengthening Meta at the cost of their proprietary data. Although it’s speculative, the exodus of major players from Scale AI could become a tailwind for Innodata. “ 

An analyst asked something similar on the Q2 earnings call. The CEO remained vague yet did state that something could materialize in the next couple of months: 

George Frederick Sutton, Craig-Hallum Capital Group: 

Nice results. Congratulations. So I wondered if we could talk about during the quarter, your largest competitor, Scale AI was a large majority purchased by Meta. And we've had a few of the large tech companies come out and say they would no longer work with Scale AI. These ostensibely would be tech companies that you have statements of work with. So I'm just curious if you can kind of give us the after effect of that acquisition as you've seen it.  

Jack S. Abuhoff, President, CEO & Director 

[…] We have, in light of this stepped up that effort with certain companies and there are certain conversations that are going on and are now planned to be happening over the next couple of months that I think could be very exciting for us. I don't know that I can get into particulars much beyond that, but I'll reiterate that we do see an opportunity to accelerate our market presence.” 

Agentic AI to drive forward major use cases: 

Although agentic AI may still be a few years out before it’s commercially viable, the CEO pointed out the future of large language model (LLM) improvements lies in the quality of data. In order to have agentic AI that can tackle multivariant problems, training data will need to be supplemented with simulation training data.  

The CEO stated the following on the call: 

“We believe agent-based AI is going to serve as the cornerstone technology that unlocks the full value of large language models and generative AI for enterprises. Moreover, we believe that progress on Agentic AI is likely to soon result in a ChatGPT moment for robotics. Within the next several years, we believe Agentic AI will be served at the edge in hardware devices with which we will commonly interact in many respects in our lives. We believe the market for simulation data services and evaluation services to drive Agentic AI and robotics is likely to dwarf the market for frontier model post-training data.” 

Conclusion:

We pointed out in our original analysis that Innodata has many competitors, and we provided an overview of how Innodata must find a path to compete with AI-native startups for data-as-a-service for AI training data. As proven by Scale AI, the market for data labeling and supervised learning is only going to grow in importance – but will Innodata be able to compete? That is a question this earnings report did not answer for investors. For an opportunity like this, we rely heavily on technicals. 

Discovery Members: You are invited to join Knox Ridley on Monday, August 18th at 4:30 pm EST for a special Discovery webinar where he will discuss technical setups on Discovery stocks.a special Discovery webinar where he will discuss technical setups on Discovery stocks.

Damien Robbins, Equity Analyst at I/O Fund contributed to this analysis.

Please note: The I/O Fund conducts research and draws conclusions for the Fund’s positions. We then share that information with our readers. This is not a guarantee of a stock’s performance. Please consult your personal financial advisor before buying any stock in the companies mentioned in this analysis.

Recommended Reading:
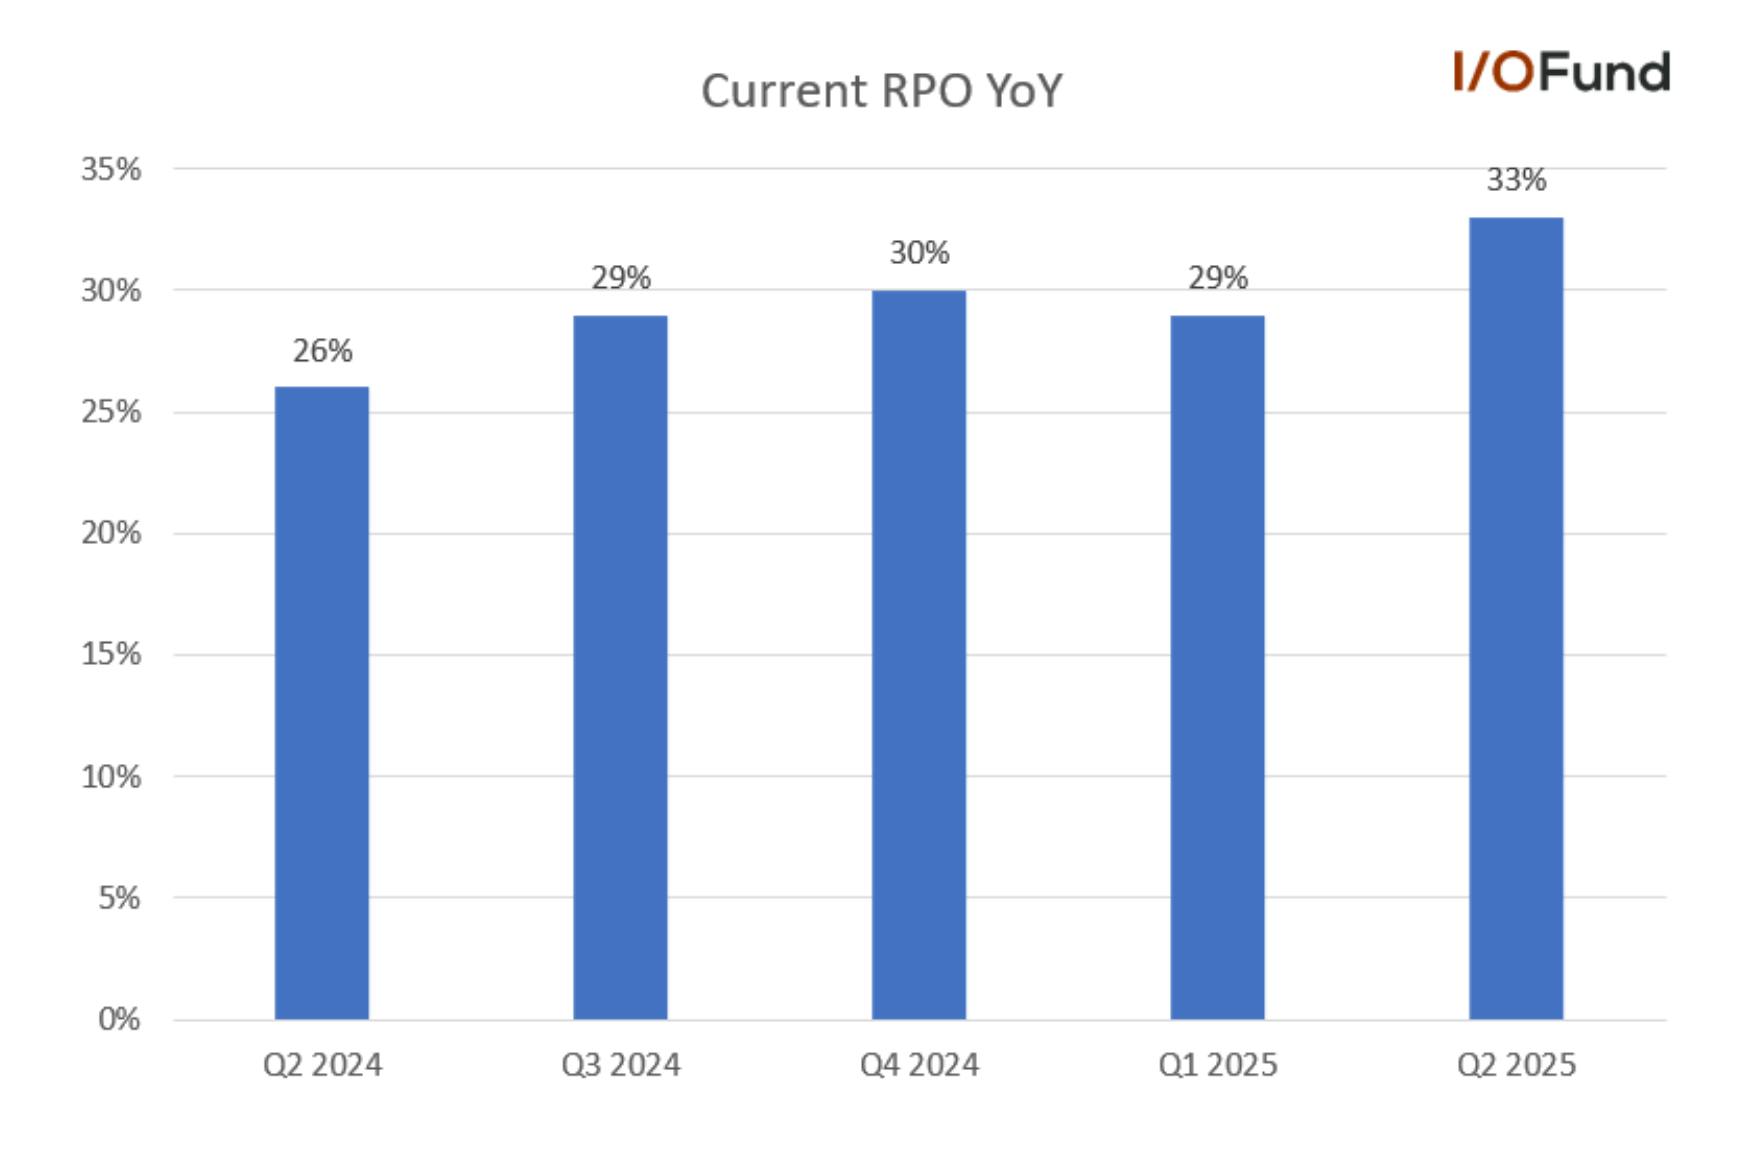
Innodata: FY25 Revenue Growth Raised to >45%, yet Largest Customer Revenue is Flat for Two Quarters

Innodata boosted its full-year revenue growth outlook by five points in Q2, now forecasting more than 45% growth this year, driven by strong demand, significant new deal wins and a large pipeline geared toward the second-half of the year. 

However, digging into the details reveals that Innodata’s largest customer has not expanded over the last two quarters, and remains at the $135 million annualized rate as stated in Q4. This comes despite Innodata discussing expansion opportunities with this customer and a second SOW signed in Q1, with growth not yet materializing. 

The CEO offered an update in Q2 that they’ve won “several new projects” with their largest customer and have others in the pipeline: 

 “We recently won several new projects with our largest customer and we have others in pipeline that are not yet included in our forecast, but which we think are reasonably likely. Several of these new projects are under the second SOW we reported signing with this customer last quarter. We believe that the second SOW potentially gives us access to an even larger generative AI revenue pool with this customer.” 

Innodata is a $1.5B market cap stock highly dependent on the announcement of new customer wins and expanding its projects with the largest customer. Our strategy is to watch price closely for the best risk/reward on an entry; and any entry will have a tight stop. 

We’ve discussed in the past that Innodata appears to have a low valuation when compared to peers. Our previous analysis also went into the details of Innodata’s products, market positioning and can be found here: “Innodata: Early-Stage AI Data Engineering; Lumpy Growth

Revenue up 79.4% YoY 

Innodata reported a slight revenue beat in Q2, with revenue coming in 3.6% ahead of estimates to $58.4 million, up 79.4% YoY. This did mark a more than 40 point deceleration in growth sequentially, yet that was expected coming into the quarter. 

However, there have been some shifts in forward estimates for Q3 and Q4. For Q3, revenue estimates have been revised nearly $2 million lower since June, now projecting revenue of $59.8 million for growth of just 14.5% YoY. Q4 revenue has been revised more than $5.5 million higher to $70.9 million, for growth of almost 20% YoY. This suggest Q3 is now expected to see be a bottom of sorts before rebounding and reaccelerating into 2026. 

For the full-year, Innodata raised its revenue growth guidance from 40% to >45%, now implying revenue of >$247 million, up from $239 million as of Q1. It is important to keep in mind the fluid nature of Innodata’s business, and that any new contractual agreements or expansions could have a large and/or immediate impact on revenue.  

Management stated that the guidance hike was driven by “significant new deals that have been finalized since our last call as well as several deals that we believe are highly likely to close in the near term.” Any of these new deals could easily boost growth depending on how quickly they scale.  

One key point that could be behind the post-earnings sell-off was some comments made by management around customer engagement and deal sizes. CEO Jack Abuhoff said that with one Big Tech customer, Innodata was “recently awarded a number of significant engagements… enabling us to forecast $10 million of revenue from this customer in the second half of this year,” up from $0.2 million over the last four quarters. Given the size of the revenue guide raise at just $8 million implied, this comment raises some questions about growth in 2H from other core customers. 

Largest Customer Accounts for 58% of Revenue 

Innodata provided only a brief update on customer progress this quarter, one with its largest customer and the other being the $10 million revenue opportunity discussed above.  

With its largest customer, Innodata said that it won “several new projects,” with some of these being under the second scope-of-work (SOW) signed last quarter. Management added that there are other projects in the pipeline with the customer that are not yet included in its forecast, but are “reasonably likely” to be signed in the future.  

Innodata’s largest customer accounted for 58% of revenue in Q2 and 59% of revenue for 1H, implying contributions of ~$33.9 million in Q2 and $68.9 million in 1H. This represents no change from Q4 (ie. no expansion) when it was stated the customer was at a $135 million annualized run rate, or ~$34 million quarterly. 

Innodata also had no other >10% customers, implying the remaining customers are not spending more than $5.8 million per quarter with the company. The forecast for $10 million in 2H from another customer would likely make said customer Innodata’s second largest and a second >10% customer.  

AI Segment Grew 99% YoY on Top of Tough Comps 

DDS remains the key driver of Innodata’s growth due to its role in handling AI data preparation, labeling and annotation, AI training and related services.  

DDS revenue grew 99% YoY to $50.58 million, though this was slightly down sequentially from $50.83 million in Q1. Although the segment’s growth barely dropped out of the triple-digit range, what’s impressive is that revenue still practically doubled YoY against a 93% growth comp. 

  • Synodex revenue rose 4% YoY to $2.06 million, slowing from nearly 8% growth in Q1. 
  • Agility revenue rose 11.5% YoY to $5.75 million, flat with growth from Q1. 

Margins and Adjusted EBITDA expand significantly YoY 

Innodata’s margins have significantly expanded YoY, which helps set Innodata apart from stocks in the $1B or $2B market cap range (Innodata is at $1.5B market cap). There was a marginal sequential decline QoQ yet not enough to matter in terms of the overall improvement seen from strong margin and adjusted EBITDA expansion over the past few quarters. 

For example, GAAP operating margin was up 14 points YoY from 1.3% to 15.3% in the current quarter.  

  • Q2 GAAP gross margin was 39.4% in Q2, down nearly half a point sequentially but up nearly 11 points YoY. Adjusted gross margin was 42.9%, down slightly from Q1 but up more than 9.5 points YoY. 
  • Q2 GAAP operating margin was 15.3%, up 1.1 points sequentially and up more than 14 points YoY. 
  • Q2 GAAP net margin was 12.4%, down 1 point sequentially but up from approximately 0% in the year ago quarter. 

Turning to adjusted EBITDA — Innodata saw a slight sequential improvement in adjusted EBITDA margin in Q2, though on a YoY basis, adjusted EBITDA margin expanded more than 14 points. Innodata had guided for YoY growth in adjusted EBITDA with no further clarity, and has currently reported nearly $26 million for 1H ’25 versus $34.6 million for all of FY24.  

  • Consolidated adjusted EBITDA margin was 22.7%, up from 21.8% in Q1 and 8.6% in the year ago quarter. 
  • DDS adjusted EBITDA margin was 24.2%, up from 22.7% in Q1 and just 5% in the year ago quarter. Tracking DDS’ adjusted EBITDA is important considering the segment accounts for more than 92% of consolidated adjusted EBITDA. 
  • Synodex adjusted EBITDA margin was 22.3%, up from 20.8% in Q1 but down from 26.3% in the year ago quarter 
  • Agility adjusted EBITDA margin was 9.7%, faring the worst out of the three segments as this was down 4 points from Q1 and down nearly 10 points YoY. 

EPS Beat by 80% yet EPS expected to decelerate in coming quarters 

Innodata handily beat on EPS in Q2, reporting $0.20 in GAAP EPS versus consensus estimates for $0.11. Looking ahead, Q3 EPS estimates are following revenue in moving slightly lower, while Q4 estimates have moved slightly higher. Since our last report, Innodata: Early-Stage AI Data Engineering; Lumpy Growth, here’s how estimates have changed: 

  • Q3 EPS has been revised $0.03 lower, from $0.17 to $0.14, for a YoY decline of more than (73%), though as a reminder the year-ago comp is technically inflated from a $5.9 million income tax benefit.  
  • Q4 EPS has been revised $0.02 higher, from $0.19 to $0.21, for a YoY decline of (31.2%). 

For FY25, Innodata is expected to report EPS of $0.76, down (14.6%) YoY before rebounding to 34.5% growth in FY26 to $1.02. To note, FY26’s EPS estimate is still unchanged since June’s writeup.  

Cash Flow Declines 60% QoQ 

Another blemish in Q2’s report were cash flows, which declined more than (60%) sequentially. Innodata’s balance sheet remains healthy, and the company still has the entirety of its $30 million credit line available.  

  • Operating cash flow was $4.23 million, down (61%) QoQ. OCF margin was 7.3%, down more than 11 points QoQ. For 1H, operating cash flow was $15.1 million, up more than 139% YoY. 
  • Free cash flow was $2.5 million, down more than (70%) QoQ. Free cash flow margin was 4.3%, down more than 10 points QoQ. For 1H, free cash flow was $11.0 million, up nearly 5x YoY.  
  • Cash and equivalents totaled $59.8 million, and debt remained zero. 
  • Deferred revenue was $6.5 million, down from $8.0 million in Q1.

Earnings Call Q&A 

There were two topics on the earnings call Q&A session worth highlighting. The first was questions about Scale AI and if Innodata will see more customers onboard as a result of Meta’s large investment of $14.3 billion. The second was why agentic AI will drive more uses cases for the simulation data solutions such as what Innodata and its competitors offer. 

Scale AI’s investment is a potential/speculative tailwind: 

We covered why Scale AI’s investment could be a potential/speculative tailwind in our prior analysis stating: " Following Meta’s investment, it was rumored that Google, OpenAI and Tesla are looking elsewhere to avoid strengthening Meta at the cost of their proprietary data. Although it’s speculative, the exodus of major players from Scale AI could become a tailwind for Innodata. “ 

An analyst asked something similar on the Q2 earnings call. The CEO remained vague yet did state that something could materialize in the next couple of months: 

George Frederick Sutton, Craig-Hallum Capital Group: 

Nice results. Congratulations. So I wondered if we could talk about during the quarter, your largest competitor, Scale AI was a large majority purchased by Meta. And we've had a few of the large tech companies come out and say they would no longer work with Scale AI. These ostensibely would be tech companies that you have statements of work with. So I'm just curious if you can kind of give us the after effect of that acquisition as you've seen it.  

Jack S. Abuhoff, President, CEO & Director 

[…] We have, in light of this stepped up that effort with certain companies and there are certain conversations that are going on and are now planned to be happening over the next couple of months that I think could be very exciting for us. I don't know that I can get into particulars much beyond that, but I'll reiterate that we do see an opportunity to accelerate our market presence.” 

Agentic AI to drive forward major use cases: 

Although agentic AI may still be a few years out before it’s commercially viable, the CEO pointed out the future of large language model (LLM) improvements lies in the quality of data. In order to have agentic AI that can tackle multivariant problems, training data will need to be supplemented with simulation training data.  

The CEO stated the following on the call: 

“We believe agent-based AI is going to serve as the cornerstone technology that unlocks the full value of large language models and generative AI for enterprises. Moreover, we believe that progress on Agentic AI is likely to soon result in a ChatGPT moment for robotics. Within the next several years, we believe Agentic AI will be served at the edge in hardware devices with which we will commonly interact in many respects in our lives. We believe the market for simulation data services and evaluation services to drive Agentic AI and robotics is likely to dwarf the market for frontier model post-training data.” 

Conclusion:

We pointed out in our original analysis that Innodata has many competitors, and we provided an overview of how Innodata must find a path to compete with AI-native startups for data-as-a-service for AI training data. As proven by Scale AI, the market for data labeling and supervised learning is only going to grow in importance – but will Innodata be able to compete? That is a question this earnings report did not answer for investors. For an opportunity like this, we rely heavily on technicals.

Damien Robbins, Equity Analyst at I/O Fund contributed to this analysis.

Please note: The I/O Fund conducts research and draws conclusions for the Fund’s positions. We then share that information with our readers. This is not a guarantee of a stock’s performance. Please consult your personal financial advisor before buying any stock in the companies mentioned in this analysis.

Recommended Reading:
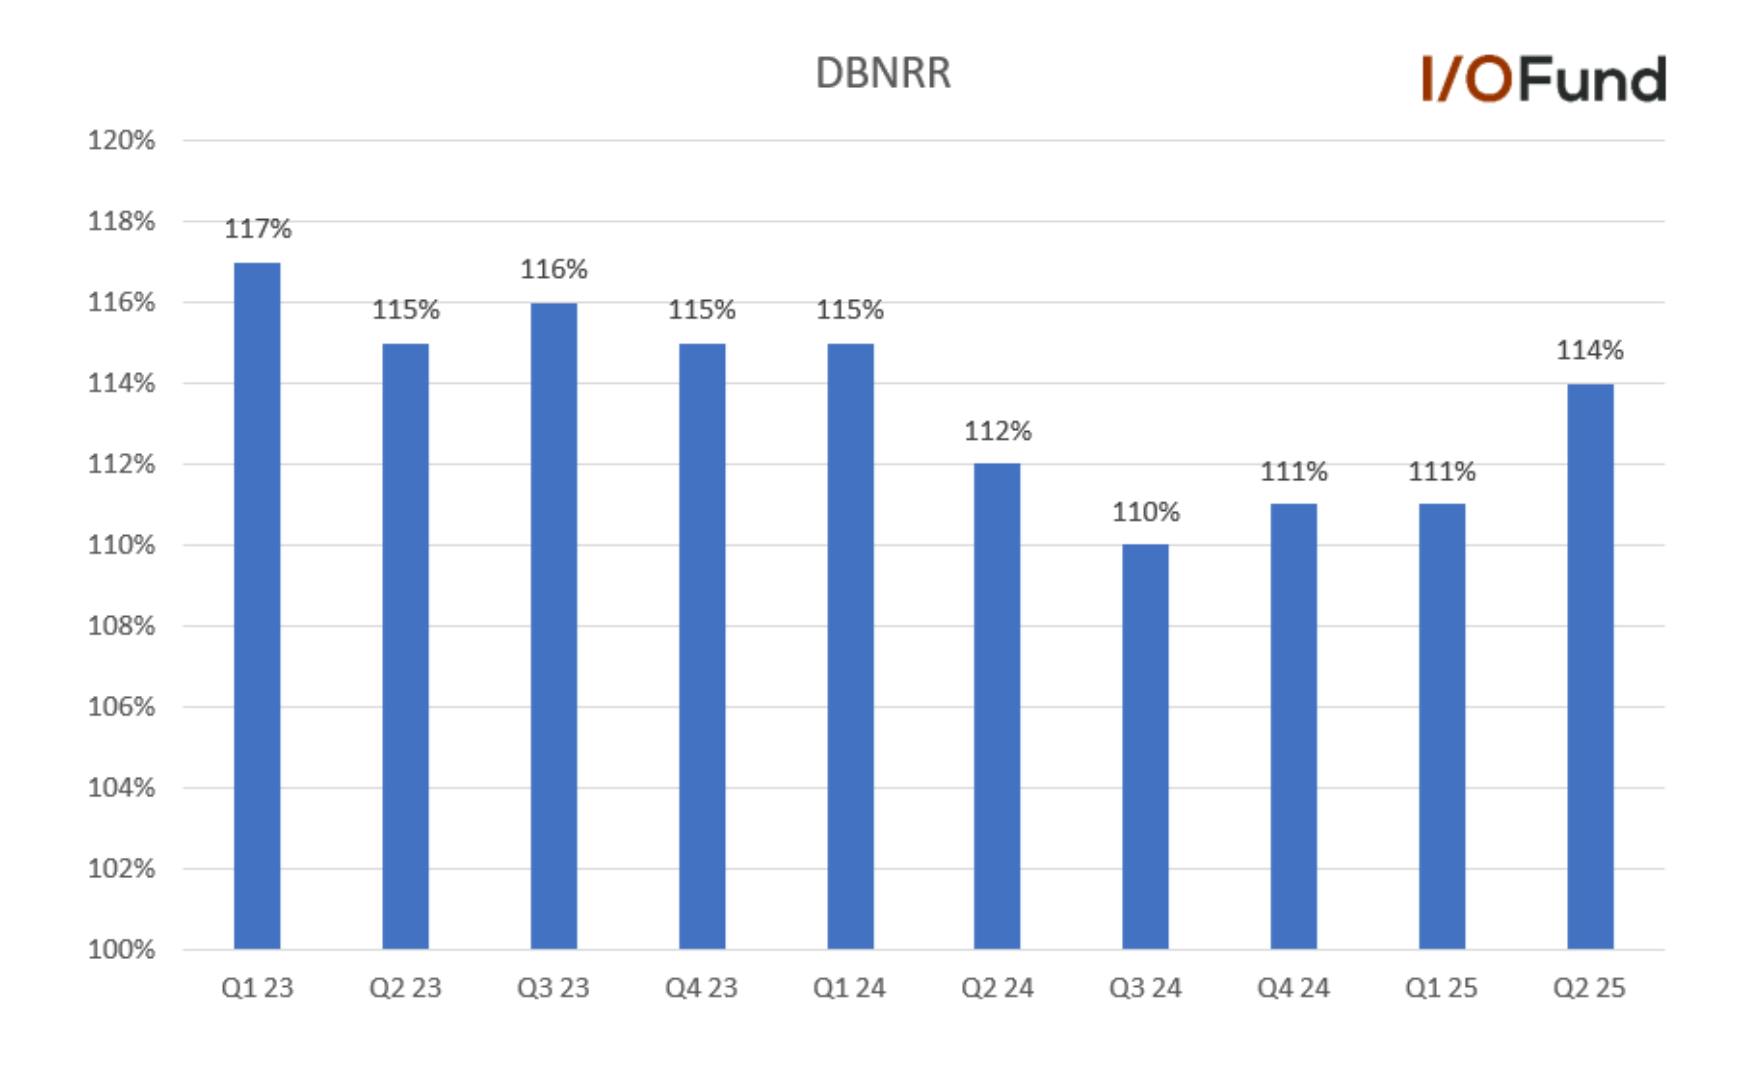
Vertiv Q2: Margins to Rebound by Q4, Yet Growth is Decelerating 

Vertiv offered a mixed report this quarter with stronger commentary about Q4 as opposed to Q3, along with a slight miss on adjusted operating margin. Considering the margins are already thin for many AI hardware stocks, any miss tends to be amplified. With that said, the stock has been on a tear off the Apri lows – up 130% since early April. Given the report was not a blowout, a cooling off may be in order regardless of the earnings numbers. 

Notably, Vertiv will not win any hypergrowth stock awards, especially as management has previously offered CAGR guidance of 15% to 17% through 2029. Rather, it’s where Vertiv is positioned as an AI infrastructure partner especially as the trend turns toward modular infrastructure that makes this a stock to watch.  

Essentially,  all roads point toward Vertiv’s power and thermal solutions becoming increasingly important for future generations of rack scale solutions. Personally, I’d like to see material evidence the current CAGR guidance through 2029 will end up 2-3X higher before we add VRT to our portfolio. This is AI, so anything is possible. I've outlined important information on how Vertiv can achieve this under the Q&A section below. 

Specifically for this earnings report, the following are a few key items: 

  • Vertiv reported a large beat this quarter with 35% revenue growth in Q2 due to the America geo reporting very strong YoY growth while EMEA lagged. 
  • Vertiv missed on adjusted operating margin, largely due to impact of tariffs and operational inefficiencies. The company lowered their adjusted operating margin for the year despite QoQ adjusted operating margin increases through Q4. 
  • However, if management meets their margin guidance for Q4, it will represent the strongest margins since the company has been on the public markets with adjusted operating margin of 23.6%  
  • EPS growth surpassed top line growth at 42% 
  • Modular AI infrastructure remains Vertiv’s top catalyst and makes this stock one to watch 

We’ve covered Vertiv in the past here “AI Data Center Direct Liquid Cooling Stock” and “Vertiv Q1: Inflection Point Muted, AI Factories Catalyst for 2026” 

Revenue Rises 35% in Q2, FY25 Hiked to $10B 

Vertiv reported 35.4% YoY growth in revenue in Q2 to $2.64 billion, with organic growth of 34% on continued strength in the Americas and APAC, noting that demand remains strong with its order pipeline expanding in all regions. 

Supported by these demand signals and favorable pricing, Vertiv hiked its full year revenue guidance to $9.925 to $10.075 billion ($10 billion at midpoint), up $550 million from its prior view for $9.325 to $9.575 billion. This points to YoY growth of 24.8% YoY, more than 7 points higher than its prior guidance. Organic growth was raised to 23% to 25%, up 6 points from its prior guidance at midpoint. 

Despite the FY25 raise, Vertiv is still guiding for a rather swift topline deceleration through Q4. 

  • Q3 revenue was guided between $2.51 to $2.59 billion, or 23% YoY growth at the $2.55 billion midpoint. Organic growth was guided to be 20% to 24%. This sequential decline goes against typical seasonality for VRT. 
  • Q4 revenue was guided at $2.735 to $2.815 billion, or 18.3% YoY at the $2.775 billion midpoint. Organic growth was guided at 16% at midpoint. This would represent a ~17 point deceleration in growth in the second half of the year. 

If we zoom out, then Q2 represents the largest beat Vertiv has seen in recent years. As we look forward, the guide for Q4 represents a $200M increase between Q3-Q4. 

Source: Seeking AlphaSeeking Alpha 

America Region Reports Strong Growth of 43% 

As noted previously, the Americas and APAC drove Q2’s outperformance, with Americas growth accelerating more than 14 points sequentially. This is the strongest growth in the Americas region we’ve recorded since covering the stock for 2.5 years.  

  • Americas revenue increased 42.9% YoY and 43.2% organic to $1.60 billion. Growth was driven by hyperscale and colocation markets with strength in switchgear, busway, liquid cooling, and infrastructure solutions. 
  • APAC revenue accelerated slightly to 36.9% YoY and 36.8% organic to $560.2 million. Growth was primarily driven by hyperscale and colocation markets in China. 
  • EMEA revenue accelerated back into the double digit range after a soft Q1, up 12.5% YoY and 7% organic to $475.6 million. Vertiv said its EMEA pipeline remains strong with continued sequential growth. 

For Q3: 

  • Americas growth is expected to be in the mid-30% range. 
  • APAC growth is expected to be in the low 20% range. 
  • EMEA growth is expected to be down high single digits. 

Backlog, Orders Growth Slows 

Though Vertiv’s backlog increased to $8.5 billion, growth is decelerating, now at 21% YoY versus 25% in Q1 and 30% in Q4. This is also the slowest growth for Vertiv’s backlog since Q4 2023.  

TTM organic orders growth also decelerated more than 9 points sequentially, from 20% in Q1 to 11% in Q2.  

Margins to Expand Through Q4, Yet FY25 Operating Margin Lowered Slightly 

Margins expanded sequentially in Q2, with net margin moving into the double-digit range. Vertiv forecast Q3 and Q4 adjusted operating margin to expand sequentially, yet lowered its full-year guidance to account for tariff countermeasures and other factors. 

Vertiv expects to be back to normal on adjusted operating margin by Q4, stating they will expect to see a margin of 23%+: 

“Full year adjusted operating margin is projected to be approximately 20% at the midpoint, 60 basis points higher than last year despite tariff headwinds, and 50 basis points lower than prior guidance. We continue to drive margin improvement, including positive price/ cost and productivity. And implied in our guidance is fourth quarter adjusted operating margin in excess of 23%, once again, keeping us on track to attain our long-term target by 2029.” 

  • Gross margin was 34%, down 4 points YoY but up 0.3 points QoQ. 
  • GAAP operating margin was 16.8%, down 0.4 points YoY but up 2.5 points QoQ. 
  • Adjusted operating margin was 18.5%, down 1.1 points YoY but up 2 points QoQ. Vertiv said the YoY decline stemmed from accelerated R&D investments, high supply chain and manufacturing transition costs stemming from tariff mitigation efforts, and operational inefficiencies from stronger than anticipated growth. Vertiv said it expects these factors to resolve by year-end. 
  • GAAP net margin was 12.3%, up 3.2 points YoY and 4.2 points QoQ. Adjusted net margin was 14.1%, up 0.9 points YoY and 1.8 points QoQ. 

For Q3 to see slight margin inflection from disappointing Q2 margins: 

  • GAAP operating margin was guided to be 18.2% at midpoint, up 0.3 points YoY and 1.4 points QoQ. 
  • Adjusted operating margin was guided to be 19.75% to 20.25%, or approximately flat YoY and up 1.5 points QoQ at the 20% midpoint. Vertiv said the QoQ improvement will stem from moderating operational inefficiencies. 
  • GAAP net margin was guided to be 13.1%, up 4.6 points YoY and 0.8 points QoQ. Adjusted net margin was guided to be 14.9% at midpoint, up less than 1 point YoY and QoQ. 

Q4 to see a return to higher margins: 

  • GAAP operating margin was guided to be 22%, up 2.5 points YoY and 3.8 points QoQ.  
  • Adjusted operating margin was guided to be 23.6% at midpoint, up 3 points YoY and 3.6 points QoQ. 
  • GAAP net margin was guided to be 15.8% at midpoint, up 9.5 points YoY and 2.5 points QoQ. Adjusted net margin was guided to be 17.4%, up 1 point YoY and 2.5 points QoQ. 

Should Q4 margin guidance materialize … 

It’s important to note that if the Q4 margin guidance materializes, then Vertiv will be reporting the best margins since going public in 2020. This is visible in the adjusted operating margin chart listed above. 

The proverbial “seeing the forest through the trees” is that Q2 was weaker than expected yet Vertiv’s management is guiding quite strong as we exit the year. 

FY25 Margins to see impact from tariffs and operational inefficiencies: 

  • GAAP operating margin was guided to be 18.1% at midpoint, up 1 point YoY.  
  • Adjusted operating margin was lowered slightly to 19.7% to 20.3%, or 20% at midpoint, down half a point from its Q1 guidance for 19.75%-21.25%, or 20.5% at midpoint. This reflects the operational inefficiencies from tariff mitigation, accelerated R&D investments and capacity expansion efforts. 
  • GAAP net margin was guided to be 12.6%, up 6.4 points YoY. Adjusted net margin was 14.8%, up 1 point YoY. 

EPS growth exceeded revenue growth at 42% 

While adjusted EPS growth was rather robust in Q2, growth is expected to the mid 20% level by Q4, mirroring revenue growth. 

  • Q2 adjusted EPS of $0.95 beat estimates for $0.84, increasing 41.8% YoY. GAAP EPS of $0.83 beat estimates for $0.71. 
  • Q3 adjusted EPS was guided at $0.94 to $1.00, or up 28% YoY at the $0.97 midpoint. This was marginally ahead of estimates for $0.96. 
  • Q4 adjusted EPS was guided at $1.23 at midpoint, up 24.2% YoY and ahead of estimates for $1.14. 

For FY25, Vertiv boosted its adjusted EPS outlook from $3.55 to $3.80 at midpoint, pointing to YoY growth of 33%. Heading into Q2’s report, FY26 growth was projected at 23%, though this may be revised higher given the improvement in net margin through year-end.   

Cash Flows and Balance Sheet 

Cash flow margins dipped slightly sequentially, and remain lower than last year. However, Vertiv also boosted its FY25 adjusted free cash flow guidance by $100 million this quarter. 

The company offered the following commentary regarding cash flows being lumpy but directionally positive: 

“And finally, on this page, adjusted free cash flow was down $60 million from last year's second quarter, primarily due to favorable trade working capital timing last year. But year-to-date adjusted free cash flow is up 24%. And as you will see in a few slides, we are raising our full year guidance by $100 million to $1.4 billion. In short, you can likely check the box on free cash flow.” 

  • Operating cash flow was $322.9 million in Q2 for a 12.2% margin, down more than 7 points YoY and nearly 3 points QoQ. 
  • Adjusted free cash flow was $277 million in Q2 for a 10.5% margin, down more than 6.5 points YoY and 2.5 points QoQ. For FY25, Vertiv guided for $1.375 to $1.40 billion in adjusted FCF, up from its prior view for $1.25 to $1.35 billion. This implies that Vertiv is expecting ~$859 million in adjusted FCF in 2H to reach the midpoint of its guide. 
  • Cash and equivalents rose to $1.74 billion, while debt remained steady at $2.9 billion. Net leverage was 0.6x in Q2, versus 0.8x in Q1. 

Earnings Q&A: 

Weak Q2 margins set to significantly rebound by Q4 

Vertiv’s margins fall into the “fair” category when compared with other AI hardware peers. Across the sector, we see a wide spectrum — Nvidia and Broadcom deliver “excellent” margins, while Dell and Supermicro are at the “weak” end. Vertiv consistently sits in the middle: not low enough to be concerning, but not high enough to command a premium valuation.  

For AI hardware investors, it’s important to recognize that earnings reactions are often driven more by margins than by top-line growth—a sharp contrast to hypergrowth and software stocks, where revenue acceleration tends to be the primary catalyst. 

Starting in 2023, Vertiv began a period of critical margin expansion, as the company had a negative GAAP operating margin in 2022 prior to the AI boom. The GAAP operating margin was 17% in the last quarter, up from 14.5% last quarter – yet the margins were flat from the year ago quarter and down from 19.5% in Q4. 

The CEO offered more color regarding margins, stating the executional challenges were primarily in the EMEA region: “The temporary costs of the supply chain and manufacturing transition to tariff-optimized footprint are higher than we initially estimated. We're also experiencing some temporary costs to deliver a steeper growth than expected and some executional challenges in EMEA. We expect all these factors will significantly moderate during the year, and we believe they will be materially resolved by year-end.” 

He also concluded the call stating: “We are vigorously addressing the temporary margin challenges. This has my and my team's full attention. I'm confident we will see constant improvement.” 

Quite a few analysts asked about margins during the Q&A, showing how nervous analysts can get about this line item even when management guides for healthy margins by year-end. Of the many questions on margins, the following Q&A exchange stood out as it discusses why management has confidence margins can expand into H2.  

Nicole Sheree DeBlase, Deutsche Bank  

I just had a question on margin. So the guidance implies like a 10 basis points year-on-year decline in margins in the third quarter, and then a pretty big step-up to like over 200 basis points of expansion in the fourth quarter. So probably a question for David. But can we kind of walk through some of the puts and takes that give you guys confidence in that step-up?  

David J. Fallon, CFO: 

Yes. I think it's 2 things, Nicole. Number one is the benefit of operational leverage. And you can get our exact Q4 numbers in the appendix, but there's over $200 million increase in sales expected in Q4 versus Q3. So that definitely provides the benefits of operational leverage.  

And the other bucket is simply addressing the operational inefficiencies and execution challenges that we've seen in Q2 into Q3. Once again, we believe all of these should be resolved in Q4. So it may be oversimplifying things, but I think those are the 2 buckets that drive the improvement from Q3 to Q4.” 

New Reporting Metric Starting in Q4 

Vertiv will no longer report on quarterly orders and backlog information, and instead will report a new metric “projected full year orders.” 

The following was stated on the call: “Beginning on our Q4 and full year 2025 earnings call, we will provide projected full year orders rather than quarterly orders and backlog information. We believe this better aligns with how we run our business. We will provide updates on the full year projections quarterly as we progress through the year and as we deem necessary.” 

This could create a boost to Vertiv’s stock to remove the lumpiness from quarterly reports and to also be more forward looking in terms of visibility offered to investors. 

AWS announcement sent shares tumbling in early July 

Recently, an announcement that AWS is pursuing their own thermal management solutions caused weak price actionin the stock.  

Management used the words “co-engineering” when asked about the announcement, implying they stand to profit regardless of how each hyperscaler uniquely approaches cooling solutions. 

“So I don't think there should be any scare. This is not an anomaly in the way the market works. And we are here to scale with our hyperscale customers. We are here to co-engineer with them.” 

Great Lakes Acquisition  

Vertiv’s is acquiring Great Lakes Data Racks & Cabinetsfor $200 million for its portfolio of high-end rack solutions, including custom racks, integrated cabinets, heavy-duty designs, and advanced cable-management systems. The acquisition will help Vertiv to deliver AI-ready solutions to hyperscalers and neoclouds. According to Vertiv, they are paying 11.5X projected 2026 EBITDA.  

Perhaps most importantly, the deal will be able to increase Vertiv’s capacity quite quickly: 

“With manufacturing and assembly facilities in the U.S. and Europe, we anticipate Great Lakes will enhance our ability to serve customers with speed and scale.” 

The deal is expected to close in Q3. Vertiv has $1.7B in cash on its balance sheet and $2.9B in debt. 

DCD Modular AI Infrastructure 

In a previous analysis we pointed toward AI factories as a catalyst for Vertiv: 

“Prefabricated infrastructure where the thermal management and power specialists assemble the infrastructure could become a path to faster, more successful deployments.  

Per Vertiv’s comments: “Now let me share some exciting news about our projects with iGenius. Here, NVIDIA and Vertiv are delivering a fully prefabricated AI factory. This is a very important sovereign AI supercomputer and we provide everything infrastructure from liquid cooling to heat rejection, grid to chip power in a very rapidly deployable modular infrastructure. All leveraging our NVIDIA codeveloped AI reference designs. What makes this truly special is how it brings together all our core Vertiv strengths. Our ability to deliver complex solutions at scale, our deep technical expertise and our commitment to innovation. We're not just providing infrastructure, we are enabling iGenius to deploy advanced AI models in a highly regulated industry.”  

Often times, CEOs use earnings calls as a marketing tactic and it can be difficult to sort through dozens of product releases to identify which ones are important catalysts. I believe the iGenius deployment will (in time) prove to be an important deployment for Vertiv – perhaps the largest catalyst ever for the company – as it transitions Vertiv from being a solutions supplier to building end-to-end modular infrastructure with substantial cross-sell opportunities. These modular AI factories also serve the massive market of sovereign AI by reducing the dependency on cloud providers such as Amazon, Google or Microsoft.” 

DCD stands for data center dynamics and refers to modular infrastructure that is desirable for its rapid and efficient data center buildouts. The pre-engineered and factory-built modules offer power, cooling and IT equipment that can be deployed much faster than traditional data centers. 

In this earnings report, the CEO discussed DCD modular AI infrastructure, stating: “That is certainly a trend that we see. We know that the industry needs speed, and speed in construction is paramount, full success for our customers. But also, as I said several times, this is a construction industry. And if you have to build very, very complex systems like data centers, on site, at speed, then there certainly are challenges, shortages, manpower, skilled labor shortages, and surely things can be done better in a prefabrication setup and mode.” 

For AI, where compute density and thermal loads are significantly higher, modular solutions are particularly ideal as they offer optimized power distribution, advanced liquid cooling integration, and scalable “white space” that can be expanded in phases without disrupting existing operations.  

Ultimately, this reduces deployment from years to months and positions Vertiv as a choice partner for the physical layer (power and cooling) for those that specialize in the logic layer (compute and networking). 

Conclusion: 

Given the margin improvement expected in Q4, Vertiv will likely see a second wind come H2 – especially if the top line holds a surprise or two as it did this past quarter with an 11% top line beat.  

Modular AI infrastructure continues to be a primary catalyst for Vertiv, and a viable path for the company to exceed the stated CAGR of 15% to 17% through 2029 (and potentially make its way into the I/O Fund’s portfolio).

Please note: The I/O Fund conducts research and draws conclusions for the Fund’s positions. We then share that information with our readers. This is not a guarantee of a stock’s performance. Please consult your personal financial advisor before buying any stock in the companies mentioned in this analysis.

Recommended Reading:
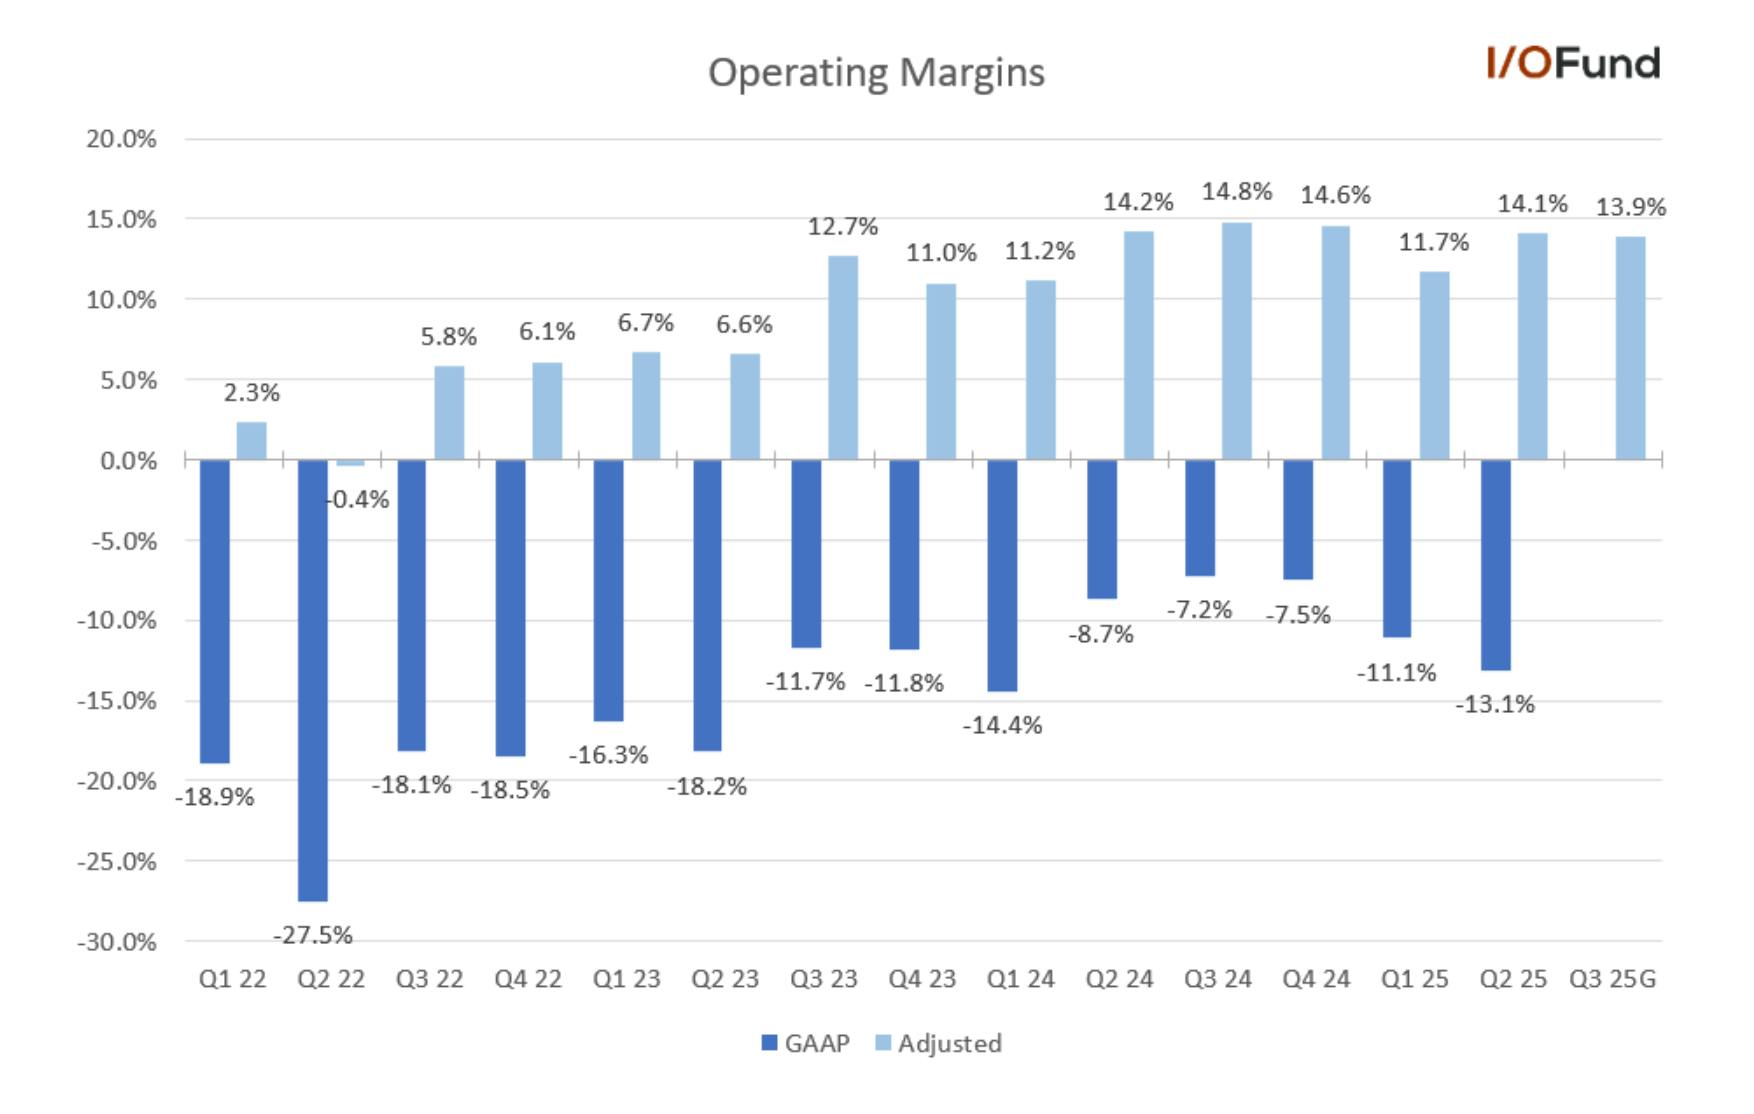
ServiceNow Q2 Earnings: Inside the AI Push Toward $1 Billion ACV by 2026

In this post, we examine the AI platform, products, and other driving forces behind ServiceNow’s (NOW) beat-and-raise earnings results for Q2, plus: 

  • ServiceNow’s evolution from a provider of SaaS solutions for IT service management to an agnostic AI platform aspiring to impact nearly every facet of the enterprise. 
  • The company’s impressive QoQ acceleration across subscription revenue, margins, RPO, and large deal activity. 
  • The cost of meeting AI demand through cloud infrastructure costs, and the news of a deal for multi-billions in cloud commitments through 2030. 
  • Plus, who’s really winning the race in AI enterprise. 

Last month, after ServiceNow reported second quarter results that exceeded expectations on multiple fronts, shares of NOW rose by 6%. The company is attempting to reposition itself beyond a provider of cloud-based digital workflows to what they are calling “the AI-powered operating system for enterprise transformation.”  

Yet, the market is cautious as the stock is down nearly 20% YTD and lags other AI software stocks – our analysis below looks at the puts and takes weighing on the stock. 

ServiceNow’s Q2 Results Help to Sustain AI Narrative 

As CEO Bill McDermott enthusiastically delivered highlights from his company’s second quarter on the call, he echoed the company’s marketing with repeated use of the word “any,” as in the ServiceNow platform’s ability to integrate with any data, any workflow, any tech stack, any cloud and hyperscaler, any AI agent and LLM, any system across the enterprise, in any industry. McDermott is confident that his firm is delivering the unified solution to what he says is the #1 focus of leading enterprises and CEOs—AI transformation. 

Many tech companies talk about their all-in-one platform as the be-all, end-all solution for every challenge facing the enterprise, but ServiceNow has the metrics to warrant watching the stock closely in future quarters. Most notably, Q2 2025 total revenue of $3.215 billion, representing 21.5% YoY growth in constant currency, up from 20% last quarter for an acceleration of 150 bps. The 150 bps acceleration in total revenue gives credence to McDermott’s statements that the company is seeing increased customer demand for AI transformation solutions, as well as strong execution across sales and product teams.    

In addition, ServiceNow reported subscription revenues of $3.1 billion representing 21.5% YoY growth. This is up from $3.01 billion last quarter for QoQ growth of 3.3%. The current RPO of $10.9 billion represents growth of 21.5% YoY and is up from $10.3 billion last quarter for QoQ growth of 5.8%. Total RPO was $23.9 billion up from $22.1 billion last quarter for YoY growth of 25.5% and QoQ growth of 8.1%. 

In Q2, ServiceNow guided for growth of 20% to 20.5% on subscription revenues yet current RPO growth is expected to lag at 18.5%. Typically, it’s best if cRPO growth exceeds subscription revenue growth. Notably, free cash flow is lumpy between quarters yet the company has a sizable free cash flow margin regardless at 48% last quarter and 16.5% this quarter. In both quarters, FCF expanded on a YoY basis. 

For full year guidance, guidance was reaffirmed for subscription gross margin to hold steady at 83.5%, operating margins at 30.5%, and free cash flow margin at 32%—indicating confidence in long-term profitability and efficiency. 

Now Assist Sees AI Deals Grow 50% QoQ 

ServiceNow also delivered strong numbers showcasing momentum in large deals and increased annual contract value (ACV). In Q2, AI deals were up 50% QoQ, including 89 deals with $1 million in net new ACV. There are 528 customers that now have more than $5 million in ACV, a 19.5% YoY increase. The number of customers with more than $20 million ACV grew by 30% YoY, representing strong relationships with top customers. ServiceNow has also shared that 85% of the S&P 500 are actively using ServiceNow’s platform or services. 

The primary driver of the increases in deal size and volume is Now Assist, the company’s flagship generative AI suite of applications, agents, LLM, and customizable tools built directly into the NOW platform. Now Assist drastically simplifies AI integrations and makes it easy for non-technical people to work with, talk to, manage, and customize all the AI capabilities available on the platform. The key components are Skills, which can be thought of as customizable building blocks for performing tasks like summarizing incidents or suggesting next steps in processes; AI Agents, which are autonomous agents with reasoning and planning capabilities extending far beyond chatbots, including the ability to automate tasks, solve problems, and proactively manage workflows; and Agentic AI Orchestrator, which acts as a coordinator with and manager of other agents and systems, not just from ServiceNow but from other companies, too. 

Here is what was stated on the earnings call: 

“Our beat and raise quarter showcases the mission critical nature of the ServiceNow AI Platform. Every business process in every industry is being refactored for agentic AI. ServiceNow has never been more differentiated as a full-stack agentic operating system for the enterprise.” 

ServiceNow confidently reiterated its goal of reaching $1 billion in ACV from Now Assist by 2026. The I/O Fund foresees this being an important moment for the stock as few AI midcap software stocks have reached this scale. The company has this confidence due to agentic AI, and also due to Now Assist unifying additional solutions, workflows and data across multiple enterprise productivity tools—ITSM, CSM/CRM, HRSM, DevOps, Sales, and more.  

Another key product in the generative AI suite is AI Control Tower, a centralized command center and single-pane-of-glass orchestration layer for managing, optimizing, and governing AI across the enterprise. Launched earlier this year, AI Control Tower allows third-party applications to integrate seamlessly into the ServiceNow platform, and it provides the business context organizations need to connect AI initiatives to core business services and technologies in the rest of the tech stack. It provides AI lifecycle management, real-time reporting, risk and compliance monitoring to help organizations scale AI responsibly and efficiently.  

McDermott referenced AI Control Tower during the earnings call Q&A when he was asked to explain the success the company is having at the C-level and to define the one asset that will help ServiceNow win in the long run. He described AI Control Tower as the governance piece that unifies so many of the other apps and AI solutions organizations are juggling, minimizing the pain and complexity of integration including vendor management that enterprises have been facing for the past 50 years.  

As today’s enterprises race to transform and consolidate every aspect of their business through AI, leaders are struggling to choose, let alone integrate, 10, 15, 20 or more components of the tech stack, with new AI offerings rolling out and vying for inclusion every day. AI Control Tower can manage systems and other agents from other companies, not just ServiceNow’s. The agents need managing just like people do, McDermott added.   

Within two months of its launch, AI Control Tower surpassed the company’s internal targets for the entire year.  

ServiceNow’s Stock Sells Off Due to Cost of Scaling AI 

The day after its Q2 earnings release, shares of NOW retracted 3% as a regulatory filing revealed the company is set to spend $4.8 billion in total commitments for cloud infrastructure through 2030. The largest partner among the cloud providers is Google, for $1.2 billion over the next five years. 

With leadership bullish on Now Assist reaching its goal of $1 billion in ACV by 2026, the company appears to be preparing to report AI revenue independent of other revenue sources. Given the run rate above and assuming no acceleration, we consider the spend net neutral as the ACV would net very little ($800M in 4 years). The market will want to see ACV higher than this to offset the spend. 

The disclosure of $4.8 billion in cloud commitments share a similar narrative as the $85 billion annual cloud capex lift that Alphabet guided to last week —AI demand is skyrocketing, and so are the costs of meeting it. This is a dynamic that investors should factor in when assessing any stock in the AI sector. 

Find out the Top Enterprise AI stock we like better … 

This quarter, one enterprise AI stock reported commercial RPO that was so high, it’s nearly inconceivable. Commercial RPO represents the value of contracted commitments; so, in other words it’s revenue that has not yet been recognized but is in the pipeline to be recognized over the next few years.  

The reported Commercial RPO from this Top Stock coupled with its growth rates puts this company on track to see anywhere from $100 billion to $200 billion in AI revenue by the close of the decade — which would represent a significant milestone that only Nvidia has reached. Find out what the Top Stock is below. 

Sign up for free below to get Beth’s latest write-up on the world’s leading AI software stock.

To access more in-depth analysis and AI growth stock recommendations, join tens of thousands of investors who are already following Beth and the I/O Fund.

Microsoft FYQ4: One of the Strongest Earnings Reports in Multi-Decade History 

Recently, in the Top 15 AI Stocks analysis it was stated “If Nvidia holds the crown in the AI hardware arena, then Microsoft holds the crown in the AI enterprise arena.” Tonight, Microsoft proved why the AI Enterprise crown is rightfully theirs. 

Management came out swinging this evening on multiple fronts. First off, the acceleration in Azure and Other Services to 39% up from 35% last quarter was significantly higher than expected, with the Street calling for growth of 33.7%. To grow nearly 40% at this scale is impressive.  

Microsoft also revealed its Azure revenue number for the first time of $75 billion for FY2025 (although not entirely surprising as we were modeling for Azure to be hitting $80 billion very soon). From there, the CFO guided for 37% growth in Azure for next quarter – indicating continuing a high growth rate at scale will not be a problem in the near-term (note, H2 is expected to see lower growth than H1). 

However, if we look at Commercial RPO, it’s clear something big is going on. Last quarter, we pointed out that Commercial RPO was the one key metric we were watching, stating: “Commercial RPO growth above 30% suggests that Microsoft’s stock could (finally) resume strength again.” At the time, RPO was at $315 billion, up 34% and 33% on a constant currency (CC) basis.  
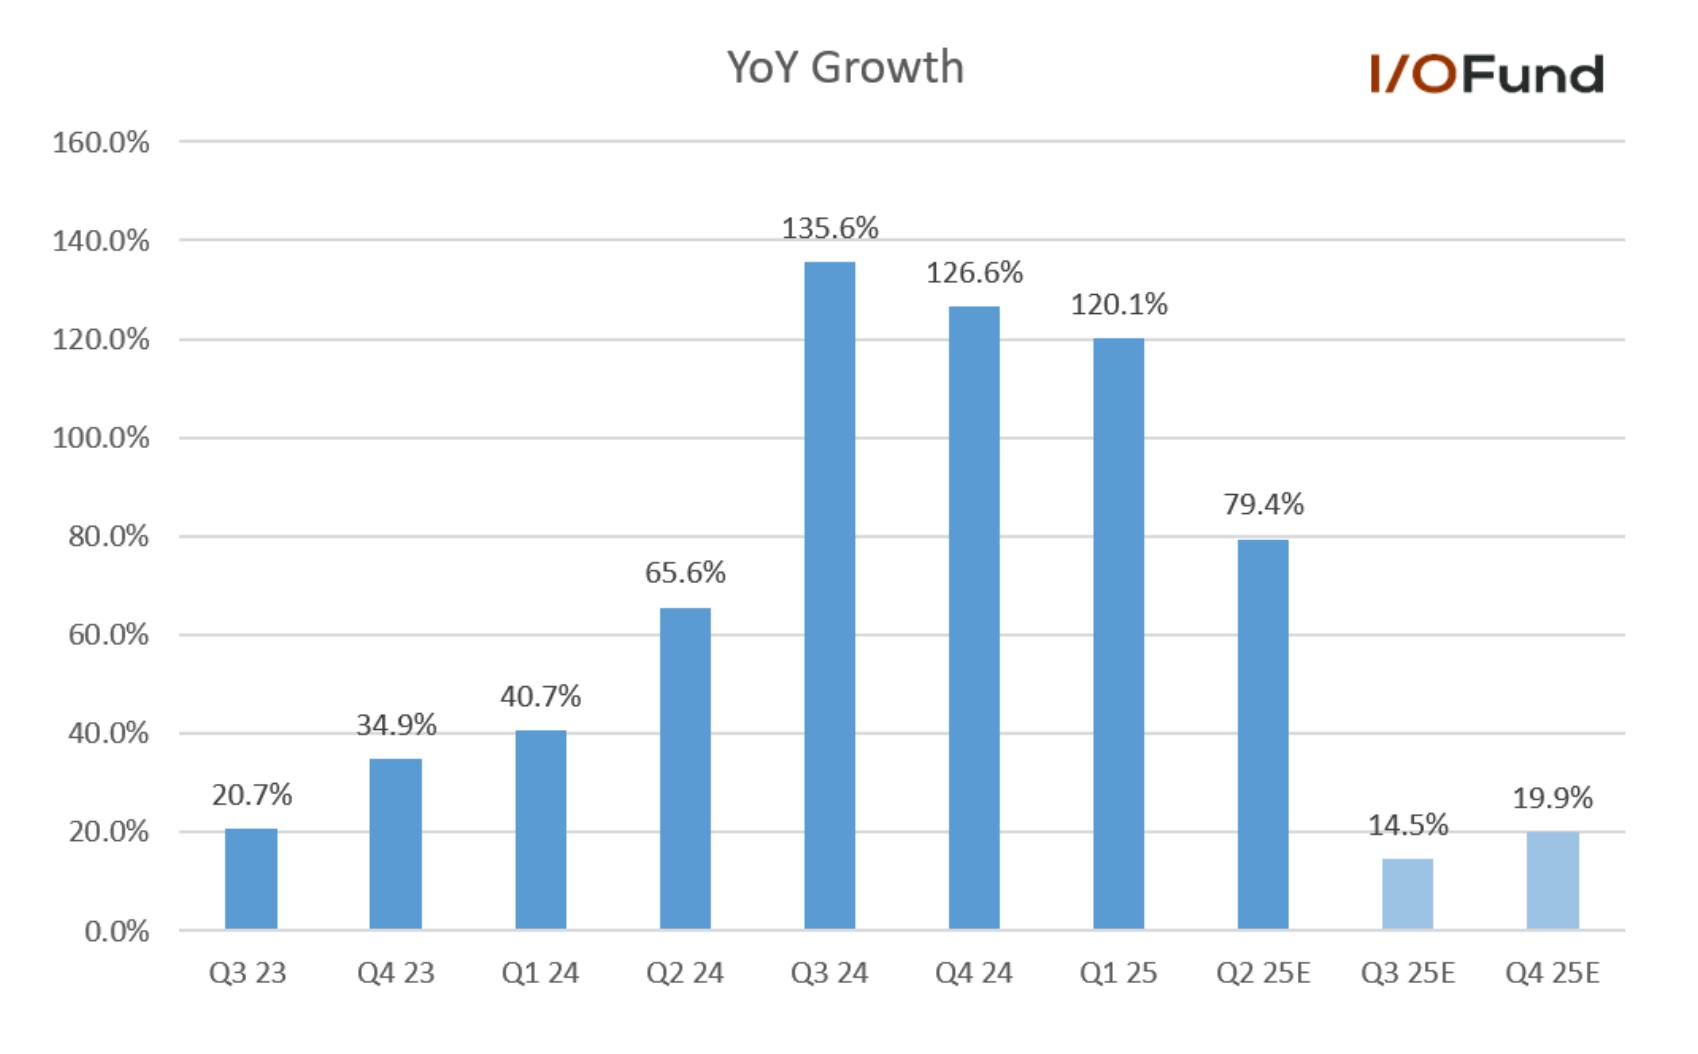
This quarter, Commercial RPO has accelerated to $368 billion, up 37% and 35% on CC basis. Microsoft’s Commercial RPO was in the mid-$100 range in 2022-2023 period to help illustrate how quickly contracted revenue has grown. Wow. We do not typically see such large growth rates on such a large RPO base. It’s almost inconceivable.  

A few years back, I described in detail why AI is first and foremost an enterprise technology, specifically calling out Microsoft’s path to $100 billion in AI revenue by 2027. We are seeing this materialize now. Microsoft is putting formidable distance between itself and best-of-breed cloud players. To illustrate, stocks like Confluent are down 27% after hours following the loss of a large customer.  

In addition to the key metrics stated above, management carries a sense of confidence  when analysts question the ROI on capex. And when Mark Zuckerburg boasted about building a gigawatt-plus cluster called Prometheus next year, Satya made sure to lead his introduction by saying “We stood up more than 2 gigawatts of new capacity over the past 12 months alone.” You’ll find more commentary on this below. 

Revenue – Azure reported as standalone segment for first time 

Revenue was up $76.4 billion for growth of 18% or 17% in constant currency. This is up from last quarter with growth of 13% or 15% in constant currency and beat consensus of $73.83 billion. For the fiscal year ending in June, the company reported revenue of $281.7 billion, up 15%.  

Azure revenue was reported as a standalone metric for the first time, being stripped out of “Azure and Other Services.” The company stated Azure saw $75 billion in revenue or growth of 34%. For comp purposes, the original segment grew 39% up from 33% / 35% on CC basis last quarter.  

Below, you can see the visible acceleration in overall revenue

Bar chart showing Microsoft’s year-over-year revenue growth from Q1 FY24 to Q4 FY25, ranging from 12.3% to 17.6%.

Below you can see that 39% is the highest growth rate we’ve seen in some time for Azure and Other Services:

Bar chart showing Microsoft Azure year-over-year growth in constant currency from Q1 FY2024 to Q1 FY2026, rising from 30% to a peak of 39% in Q4 FY2025 before easing to 37% in Q1 FY2026.

Looking forward, management guided for revenue of $75.25B at the midpoint, beating consensus of $74.15B. This would represent growth of 14.7%. 

According to the CEO, Microsoft is ahead of other hyperscalers in speed of data center buildouts: “We continue to lead the AI infrastructure wave and took share every quarter this year. We opened new DCs across 6 continents and now have over 400 data centers across 70 regions, more than any other cloud provider. There is a lot of talk in the industry about building the first gigawatt and multi-gigawatt data centers. We stood up more than 2 gigawatts of new capacity over the past 12 months alone. And we continue to scale our own data center capacity faster than any other competitor.” 

Revenue segments – Cloud has highest growth rates since 2022 

Cloud reported some of its highest growth in three years. The CEO stated: “Through software optimizations alone, we are delivering 90% more tokens for the same GPU compared to a year ago” as well as “ 

  • Microsoft Cloud was up 27% and up 25% on CC basis for revenue of $46.7B. This marks the highest quarterly growth rate since CY2022 
  • Gross margin was 70% up 100 basis points from 69% last quarter 
  • Productivity and other Businesses was $33.1 billion, up 16% and 14% on CC basis.  
  • Intelligent Cloud was up 26% and up 25% on CC basis for revenue of $29.9 billion. This was the highest growth rate since CY2022 
  • More Personal Computing was up $13.5B for growth of 9% 

Commercial Bookings Surpasses $100 Billion for the first time 

To help support the case for future growth, both commercial bookings and commercial RPO came in surprisingly strong.  

The CFO stated that for the first time commercial bookings surpassed the $100 billion mark, increasing 30% on CC basis. Commercial RPO increased to $368 billion, up 35% on CC basis with 35% recognized in revenue in the next 12 months. 

Additional key metrics: 500 trillion tokens processed last year; 800M AI Product Users 

Azure is always the main metric looked at, yet we should pause and share a few more important key metrics in this banner report. 

  • Copilot apps have surpassed 100 million monthly active users across commercial and consumer.  
  • Across broader AI features, there are over 800 million monthly active users. 
  • Foundry Agent Service is now being used by 14,000 customers to build agents.  
  • 80% of Fortune 500 use Foundry, processing 500 trillion tokens, up 7X YoY.  
  • Microsoft Fabric is a data and analytics platform for AI workloads, with revenue up 55% year-over-year and over 25,000 customers. According to management: “It's the fastest-growing database product in our history.” 
  • There are 20 million GitHub Copilot users. GitHub Copilot enterprise customers increased 75% quarter-over-quarter and 90% of the Fortune 100 use GitHub Copilot.

Margins & Earnings 

EPS of $3.65 beat consensus estimates of $3.38.  

  • Gross margin was 68.5% up from 68.1% last quarter for gross profit of $52.4B. 
  • Operating margin of 44.9% was up from 44% for operating profits of $34.3B. 
  • Net margin was 35.6% up from 34.9% last quarter for net profits of $27.2B. 

Cash flows & capex raised to eye-watering $30B per quarter  

  • Operating cash flow of $42.6B was up 15% YoY 
  • Free cash flow of $25.6B was up 10% YoY 
  • Capex of $24.2 billion was up 27% YoY with management guiding for capex of $30 billion next quarter.

Earnings Call Q&A: 

Capex Spend Correlates to $368B in RPO: 

Every Big Tech company will be asked about ROI on capex spending, and the CFO handled the question quite well, stating: “when you think about the full year comments I've made on CapEx as well as the Q1 guidance of over $30 billion, you first have to ground yourself in the fact that we have $368 billion of contracted backlog we need to deliver, not just across Azure but across the breadth of the Microsoft Cloud. 
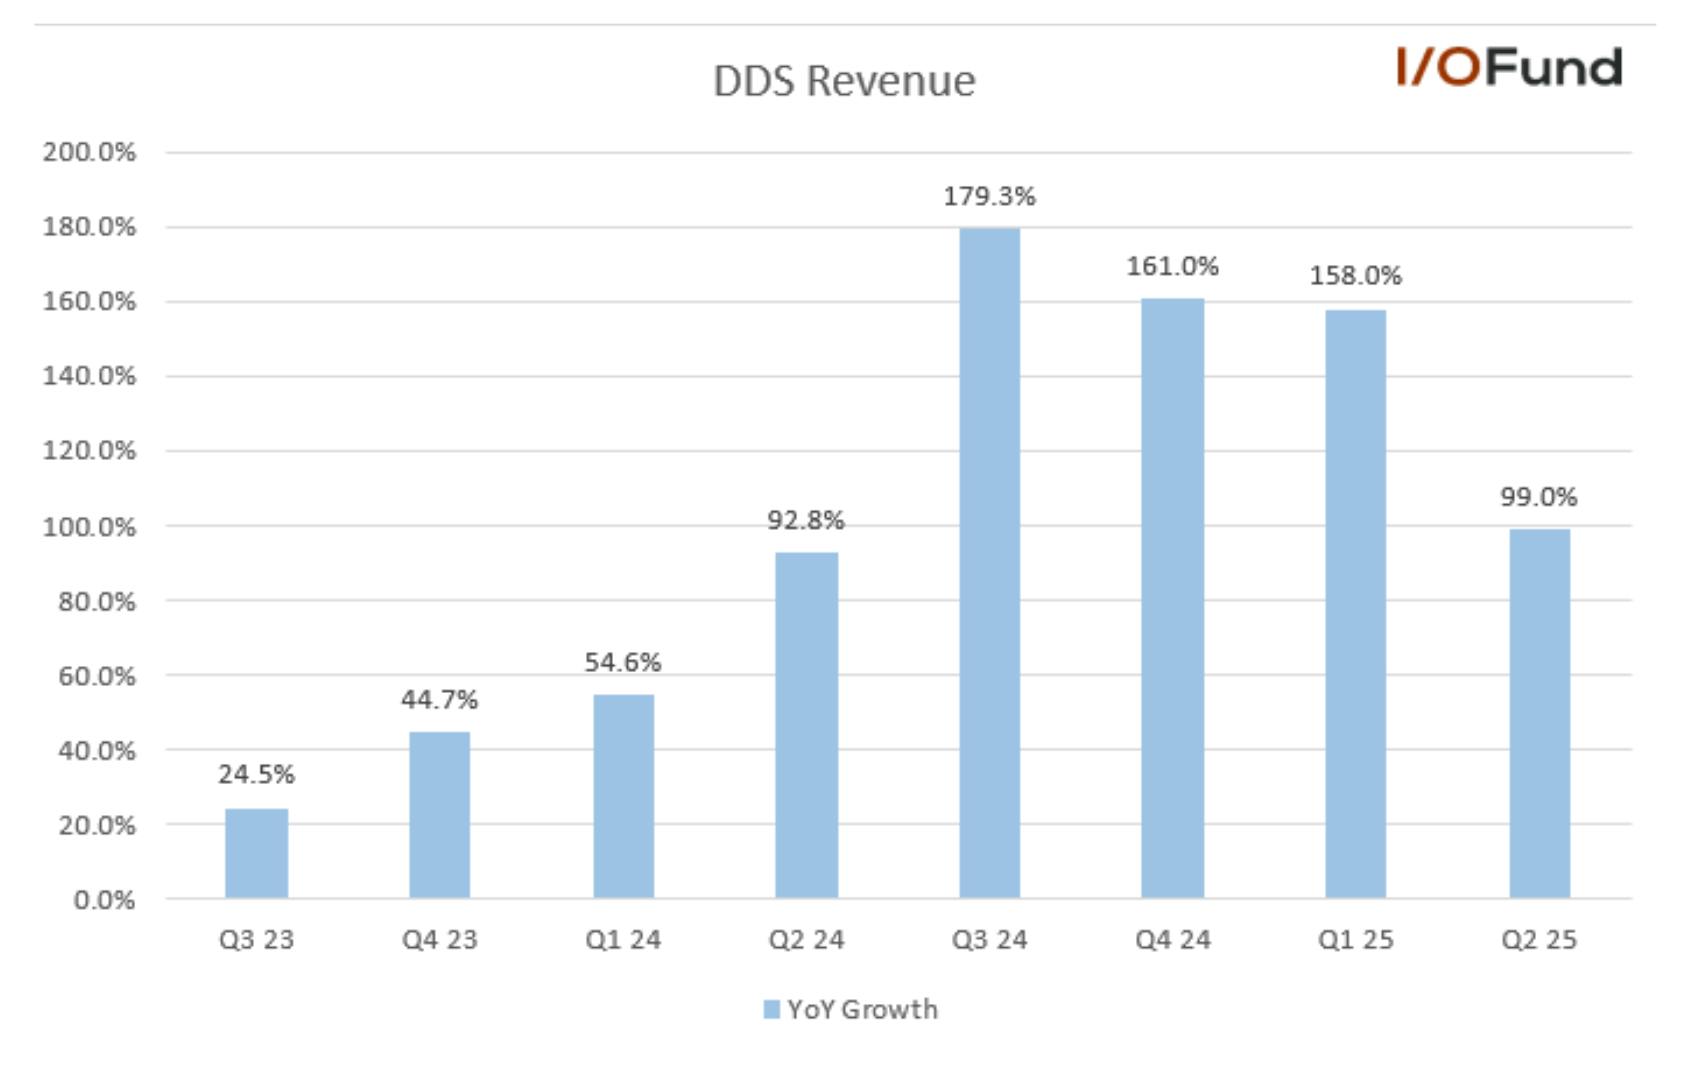
So in terms of feeling good about the ROI and the growth rates and the correlation, I feel very good that the spend that we're making is correlated to basically contracted on the books business that we need to deliver and we need the teams to execute at their very best to get the capacity in place as quickly and effectively as they can. 

And so when you look, and we've talked about the growth rate [of capex] will decline year-over-year, but at its core, our investments, particularly in short-lived assets like servers, GPUs, CPUs, networking storage, is just really correlated to the backlog we see and the curve of demand. And I talked about, my gosh, in January and said I thought we'd be in better supply demand shape by June. And now I'm saying I hope I'm in better shape by December.”

Conclusion: 
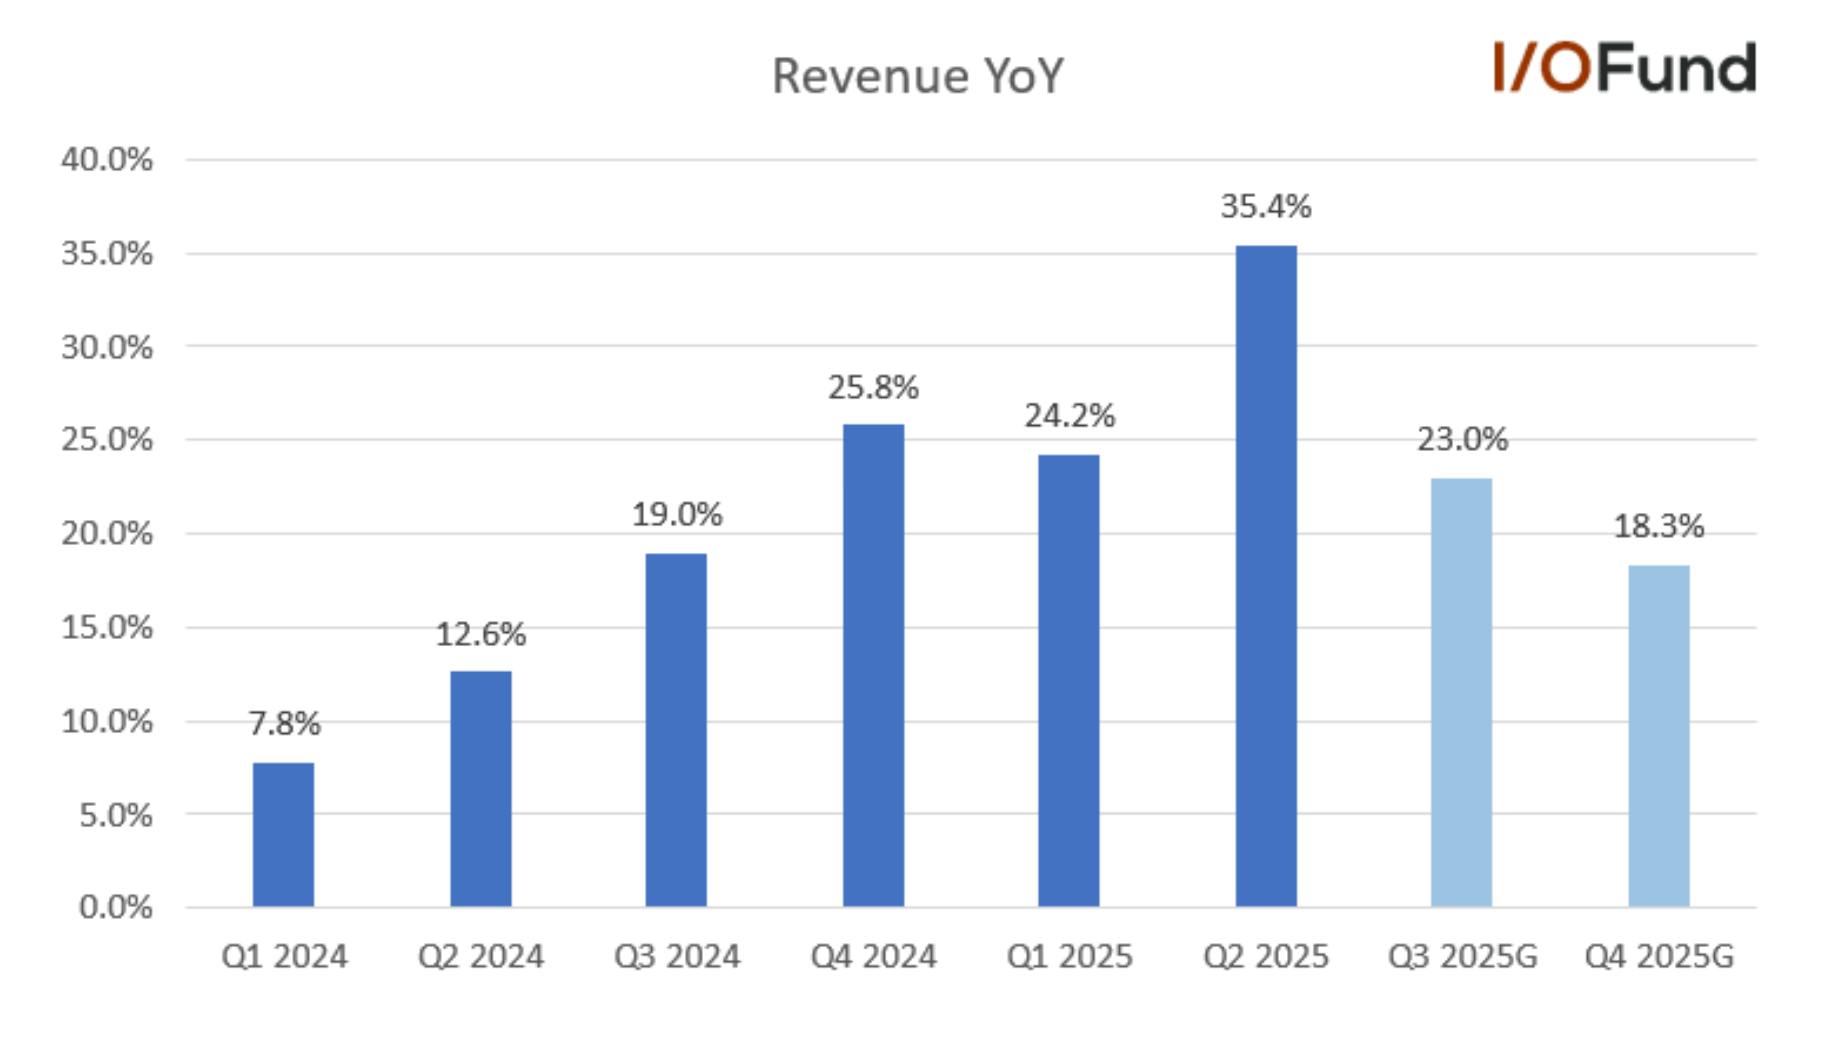
This was an earnings report for the ages – simply because the Commercial RPO is massive, and Microsoft is proving they can grow at a scale we haven't seen yet in AI software. Earlier today, I had stated on Bloomberg that Microsoft could see $40 billion in AI revenue sometime in 2026 – which is a massive number, but what's most important is the rapid ascent in reaching that number.  

If you zoom-out, a few years back I've made the case that Microsoft could see as much as $100 billion in AI revenue by 2027 and then I upped it to $200 billion by 2028.  Should we see this ballpark figure, it would mark a rapid ascent hard to fathom a few years back. This earnings report is a step in the right direction to meet that mark.

Our five-year cumulative returns of 210% would place us as #2 if we were a hedge fund and #5 if we were an ETF. Learn more here 210% would place us as #2 if we were a hedge fund and #5 if we were an ETF. Learn more here

Please note: The I/O Fund conducts research and draws conclusions for the Fund’s positions. We then share that information with our readers. This is not a guarantee of a stock’s performance. Please consult your personal financial advisor before buying any stock in the companies mentioned in this analysis.

Recommended Reading: