
Applied Optoelectronics delivered its fifth consecutive quarter of record revenue in Q2, however, the more important story is what lies ahead. Management shared details on a very steep 800G and 1.6T ramp with production capacity expected to rise from 200K units per month to 650K units per month by year-end. The company expects Q3 revenue to increase roughly 42% QoQ at the midpoint, with nearly all of the growth coming from 800G. Management also indicated that Q4 revenue could exceed $500 million, compared to current analyst estimates of $410 million. From there, as we look into 2027, 1.6T is expected to become a meaningful growth driver alongside continued strength in 800G growth. While the word “China ban” typically leads to a selloff in those companies closest to the affected supply chain, reports earlier this week that the United States may restrict imports of Chinese optical modules sent stocks like AAOI sharply higher. Below, we look at how 800G is taking off, 1.6T is moving into position and a potential China ban could be a tailwind for little-known AAOI. AAOI Stands Out in One Key Area: InP Supply The CEO stated on the call, he estimates that demand is 20% to 40% higher than their already-aggressive forecasts, stating “And actually, we are getting this kind of [request] from several customers, almost every week, every month to speed up our delivery schedule.” Like networking peers, AAOI is capacity constrained, but the details matter quite a bit, as many optical suppliers are limited by access to lasers, which can take 21 to 24 months to bring into high-volume production. To contrast, AAOI manufactures its own indium phosphide (InP) lasers and develops production equipment internally. This has led to AAOI securing InP capacity through year-end 2027 already: “You know, going back into last year and continuing even until very recently, we feel we feel pretty good about the substrate supply situation. I would say it's incrementally better […] So I would say that right now we're in inventory. We [have] supply until end of next year.” From there, AAOI has plans to transition four-inch substrates and increase supply relationships to secure larger substrate volumes for 2028 and 2029. In addition, AAOI is expanding its facilities at a rapid and unusual pace. Their Houston facility has grown about 3X to 1.6M square feet in one year. Initial production at a new plant with 210K square feet will begin in Q3. Here is what was stated about how this new plant will indirectly facilitate more InP capacity: “While this will not directly increase our indium phosphide wafer capacity, we plan to move the existing transceiver production from our current headquarters facility to this new building, which will allow expansion of our indium phosphide capacity.” There’s a lot going on here, as AAOI is essentially bringing transceiver assembly capacity online quickly, and then relocating transceiver production from its headquarters to the new plant to prioritize InP wafer and laser capacity. However, it’s worth noting that AAOI may have a strategic advantage on InP, yet must source DSPs and TIAs, which management specifically called out as their primary constraint for 1.6T shipments. The Optical Cold War Through our longstanding research on AAOI (and a bit of sweat on our brow), the I/O Fund may have serendipitously found the strongest beneficiary should there be an Optical Cold War (which is highly likely). Earlier this week, major news hit the wires that the United States is considering a ban on the import of Chinese optical transceiver modules. Chinese companies such as Innolight and Eoptolink dominate this market, while also relying heavily on companies like Lumentum and Coherent to supply laser chips like EMLs and the optical components that go inside the modules. Against this backdrop, Lumentum and Coherent are attempting to expand and assemble their own 800G and 1.6T pluggable units although this could take time. Enter AAOI, a company that could immediately benefit from the geopolitical shift. The market is catching on as the stock was up as much as 20% when the news broke – the biggest move among the optical stocks. AAOI is unique because manufacturing in-house and then sells the finished modules. In this case, AAOI is not selling its laser chips to Chinese module giants. Between Texas and Taiwan, AAOI has a supply chain that is completely removed from mainland China. Therefore, Big Tech could (theoretically) move orders to AAOI if the ban takes effect. There were two key discussions about this on the call. The comments were very subtle and hard to miss, but given the recent announcement, it lines up nicely the way management was emphasizing U.S. manufacturing. Here is what the CFO said: “I think a U.S. manufacturing presence has been a very important, probably the most important element of our appeal to our customers. And clearly that announcement, you know, heightens that appeal. As we said in our prepared remarks earlier, we believe that we are and expect to remain the largest manufacturer domestically of optical transceivers for AI. So certainly anything that you know, would heighten interest in that is good for us. But it's hard to point to any specific, you know, ramifications at this point since it's still kind of early.” The CEO stated the following: “This is really not news at all. I think that's a discussion for quite a while […] We have been working very closely with three customers for the long-term agreement, especially making our laser. And we are maybe the only company committed to really invest heavily in U.S. manufacturing—not only laser, including the transceiver.” Perhaps the strongest comment on the call regarding the Optical Cold War was the following: “Some early feedback, I would say, customers more aggressively will give us much more share, especially for U.S. manufacturers.” Financials Revenue Accelerates to 86.4% YoY, Fifth Straight Quarter of Record Revenue Applied Optoelectronics reported Q2 revenue of $191.9 million, slightly above the midpoint of guidance of $189 million and barely squeaking out ahead of estimates for $190.5 million. YoY growth accelerated 35 points to 86.4% YoY, while sequential growth also accelerated 14.4 points to 27% QoQ. This marked the company's fifth consecutive quarter of record revenue. For Q3, AAOI guided for revenue between $255 to $290 million, or $272.5 million at the midpoint, just 3% above the consensus estimate of $264.5 million. This points to revenue growth accelerating more than 43 points to 129.7%, while QoQ growth would accelerate another 15 points to 42%. However, it should be noted that this QoQ pace of 42% sits quite a ways below management’s commentary from Q1 for Q3 to see 60-80% growth from Q2 – with this growth rate looking to be pushed back to Q4 instead. Management stood by guidance for $1.1 billion in FY26 revenue, which at the midpoint would suggest $484.5 million in Q4, though management later stated Q4 would see revenue of $500 million. At the low end of $484.5 million, this would imply QoQ growth of 78%, while YoY growth would double to 260%. Segment Breakdown: Data Center Growth Accelerating to 32% QoQ Data Center revenue, AAOI's largest segment, was $107.7 million in the quarter. This represented YoY growth of 140.4%, a 14 point deceleration from 154% in Q1, though sequential growth accelerated 23.6 points to 32.3% QoQ. Rough back-of-napkin math for Q3, using the $105 million guided for CATV and minimal revenue contribution from other segments could see Data Center revenue of $163.5 million, accelerating to ~52% QoQ and 272% YoY. Revenue from 10/40G products remained minimal at $4.7 million, roughly flat QoQ and contributing <5% of revenue. The “phase-out” of 100G is more visible – despite revenue rising roughly 31% YoY and 21% QoQ to $41.2 million, its share of Data Center revenue was just 38.3%, down from 70% a year ago. 200G/400G revenue remains strong, up nearly 438% YoY and more than 27% QoQ to $48.4 million, or 45% of segment revenue. 800G revenue remains in its early stages of ramping, contributing just $12.8 million, or ~12% of revenue, up more than 178% QoQ. Management pointed to total manufacturing capacity for 800G and 1.6T products approaching 200,000 units per month, ahead of commentary last quarter for 150,000 per month, while the year-end target remains at roughly 650,000 per month. Management also said it expects demand for 800G and 1.6T products to continue to outpace production capacity through mid-2027. CATV revenue was $80.6 million, up 20.6% QoQ and 43.8% YoY, benefiting from strong adoption of AAOI's 1.8 GHz CATV products from its leading customer in the segment. As noted above, management guided for CATV revenue between $100-$110 million in Q3, accelerating to 30.3% QoQ and 48.7% YoY. Telecom revenue was $3.4 million, up 33.3% QoQ and 75.8% YoY, while Other revenue was negligible at $0.3 million. Margins Pressured Across the Board Margins were a soft spot for AAOI’s Q2 report: gross margins contracted, dragging GAAP operating and net margins lower sequentially despite the step-up in revenue; however, AAOI did report adjusted profitability on the bottom line. Gross margins contracted in Q2, with GAAP gross margin down 2.6 points YoY and 1.4 points QoQ to 27.7%. Adjusted gross margin was 29.9%, similarly down 0.6 points YoY but improving 0.7 points QoQ; for Q3, management guided for adjusted gross margin of ~29.8% at midpoint, down 1.2 points YoY and flat QoQ, indicating that margin tailwinds from higher-ASP 800G+ products are yet to kick in. GAAP operating margin was (12.9%), widening 4.3 points QoQ from (8.6%) in Q1, though still improving from (15.5%) in Q2 2025. Adjusted operating margin was (5.4%), also widening slightly from (4.8%) in Q1 and improving from (10.5%) a year ago. This trajectory reflects operating expenses scaling ahead of the broader 800G ramp, up 37% QoQ. GAAP net margin was (11.9%), widening from (9.4%) in Q1 and (8.8%) a year ago. Notably, adjusted net margin was a positive but thin 2.9%, up from (3.3%) last quarter and (8.6%) a year ago, and marking the first positive print since Q4 2023. Adjusted EPS Beginning to Improve in Q3 Adjusted EPS came in at $0.06 in Q2, coming in ahead of the $0.02 estimate and swinging positive from ($0.07) in Q1 and ($0.16) a year ago. Tracking margin trajectories, GAAP EPS was ($0.28), widening from ($0.19) in Q1 and ($0.16) in Q2 2025. For Q3, AAOI guided adjusted EPS to a range of $0.11 to $0.26, or $0.185 at the midpoint, implying continued sequential improvement. Notably, this comes in below the prior Street estimate near $0.28, suggesting consensus may have been running a bit ahead of the pace of margin recovery. Free Cash Flow Plunges on Elevated Capex to Support Ramp Operating cash flow returned to positive territory in Q2, yet free cash flow plunged as AAOI is preparing for its 400G+ ramp: “We made a total of $565.5 million in capital investments in the second quarter, including $280 million in prepayments on equipment we have on order. These expenditures are mainly for manufacturing capacity expansion for our 400G, 800G, and 1.6 terabit transceiver products.” Operating cash flow was $11.6 million for a 6% margin, improving significantly from a (56.5%) margin last quarter and (63.6%) a year ago. Free cash flow was ($265.3 million) excluding the pre-payment for a (138.2%) margin, widening from (95.1%) in Q1 and (88.4%) a year ago, driven by ~$227 million in capex. Management added that capex intensity would increase in 2H to support the production ramp, with this being funded by cash flows, cash on hand, as well as additional equity and debt raises. Cash, cash equivalents and restricted cash totaled $508.8 million, with AAOI having raised $538.8 million via its ATM offering since initiating the program in May (and with most of this going to Q2’s capex and equipment prepayments). Debt was $220.3 million. Inventories jumped 35.2% QoQ to $278.8 million due to increasing raw materials for near-term production. Conclusion: 800G is expected to contribute nearly all of the Q3 growth before 1.6T begins contributing in Q4 and takes the reins in 2027. What could be better than two catalysts? Three catalysts. The third catalyst is AAOI’s fortuitous supply chain position, which is not dependent on Mainland China. Although AAOI does not need the China ban for its product-driven trajectory, its Taiwan and Texas footprints could attract even more demand than the current aggressive forecasts already suggests. Please note: The I/O Fund conducts research and draws conclusions for the company’s portfolio. We then share that information with our readers and offer real-time trade notifications. This is not a guarantee of a stock’s performance and it is not financial advice. Please consult your personal financial advisor before buying any stock in the companies mentioned in this analysis. Beth Kindig and the I/O Fund own shares in AAOI at the time of writing and may own stocks pictured in the charts. Damien Robbins, Equity Analyst at I/O Fund contributed to this analysis. Recommended Reading: SanDisk FQ4: Inference to Drive Demand and Visibility for Years AMD Q2: Venice Meets Helios in 2H26 and 2027 Astera Labs Q2: Scorpio is Locked and Loaded Applied Optoelectronics Q1: Management Guides to 141% YoY Growth; Execution Comes Next
Author: io-fund
SiTime Q2: Blowout Growth from Timing; Rising Density
The I/O Fund’s positions appear to be competing over which stock will have the biggest blowout quarter, with SiTime being a strong contender in Q2. This evening the company reported revenue of $157.4 million for YoY growth of 126.5% compared to estimates for $146.4 million. Gross margin also expanded nearly 9 points to 67.1% and operating margin was 34% compared to a 10% operating margin a year ago. For next quarter, the company guided to revenue of $285M to $295M, including approximately $85 million from the newly acquired Timing Products Division (TPD). Excluding the acquisition, SiTime revenue is expected to reach $200M to $210M, representing 30% sequential growth at the midpoint. Driving this beat is SiTime’s precision timing solutions moving from being a discrete component located around the system to a technology in the “heart of the system” through chiplets, advanced substrates and modules. Timing is Moving into the Heart of the System We’ve covered in the past how SiTime’s discrete components are becoming more integrated into AI systems. This is best illustrated in the rising content opportunities from inference, estimated to be 2X to 4X. Our previous analysis stated the following: “In terms of the holistic dollar content per rack, management has explained that for training platforms where they have a high penetration across the system and networking topology, content opportunities “can be multiple hundreds of dollars in a fully integrated rack,” with opportunities potentially scaling larger in networking fabrics. Translating this ‘multiple hundreds of dollars’ to the 2X to 4X increase with inference roughly estimates that SiTime could see content above $1,000 in fully integrated racks for inference deployments — this was also mentioned by analysts in Q1’s call that content “certainly sounds like it could reach into the $1,000+ range.” This is supported by timing products and oscillators playing a critical role in helping to improve GPU utilization rates, which places emphasis on higher ASPs and high-margin products. When asked what led the growth, management echoed similar reasons as last quarter – which is well-worth the time to revisit: “One is the inference infrastructure, all the XPUs, the switches, the inference workloads, those are growing as well as our content is growing in units, but also the ASPs are growing. The second one is, of course, the networking bandwidth within the data center, in other words, optical modules and everything connectivity, including active cabling, especially with the growth of the 1.6 terabit optical modules, which is growing, as we said the last time at a higher rate than we had anticipated last year.” To help quantify the opportunity, management believes the transition could add $2.5 billion to SiTime’s serviceable addressable market by 2030. This compares to CED reporting $101.2 million this quarter. CED Growth of 181% YoY from Several Drivers The Communications, Enterprise and Data Center (CED) segment is reporting its ninth consecutive quarter of triple-digit growth from a few different drivers. The largest structural driver is synchronization, which is increasing density and adding higher dollar content per rack. This is how the CEO described it in terms of how density and higher ASPs are combining to keep the CED segment elevated, “On the density issue, you’re absolutely right. It’s not just about adding more oscillators around GPUs, TPUs and CPUs. Timing is also increasing throughout the subsystem—across the rack, in switches and on accelerator cards. If a signal cannot afford to fall out of sync anywhere as it moves through the rack, it needs highly accurate timing at every point along the way. “There is also a shift toward higher-value products. We offer TCXOs, super-TCXOs and emerging clock products that combine these capabilities at higher ASPs […] We expect greater timing density, higher ASPs and broader usage to all contribute to growth in this business.” The 1.6T transition is also expected to add another layer of growth with management expecting 1.6T to grow approximately 100% in 2027: “The move to 1.6 T terabit in optical modules is driven by the need for more networking in the data center. In 2027, we expect our 1.6 T revenue to grow by 100%.” SiTime closed the acquisition of Renesas timing business on July 1st and renamed it Timing Products Division. According to commentary on the call, approximately 70% to 75% of TDP revenue will be under the CED segment. Management had previously estimated $300 million in revenue during the first 12 months, yet TDP is now expected to contribute $85 million in the first quarter, placing it on an annualized run rate of $340 million. 2027 to be a Year of Significant Growth As inference continues to drive market demand for AI systems, SiTime’s timing products will assist in higher throughput and lower latency by delivering timing “precisely where it’s needed without signal degradation.” The CEO stated this could add billions of dollars to their opportunity: “We see this coming whether timing is integrated at the wafer level or through some form of vertical timing delivery, and SiTime is pioneering parts of that transition. ASPs may increase, but more importantly, the density of use is rising because more timing components are required throughout the system. We believe this opportunity could add billions of dollars by 2030.” When pressed about the growth rate of the company in the years to come, the CEO would not budge above the previously stated 30% per year, but offered strong commentary specifically on 2027: “So I think it is fair to view 30%, or perhaps slightly higher, as our growth rate over a five- to eight-year period. Looking specifically at 2027, we see no signs of a slowdown. AI is benefiting not only our CED business, but also TPD, where roughly 70% of revenue is tied to data center and other AI-related applications. We also expect continued growth across our other businesses, making 2027 another year of significant growth.” These are important words for a company that is seeing its CED segment grow triple digits for eight consecutive quarters, as the concern is typically will the growth slow soon. So far, so good according to the CEO in terms of next year. Financials Revenue to Inflect in Q3 as Timing Acquisition Contributes SiTime reported Q2 revenue of $157.4 million, coming in a solid 7.5% above the consensus estimate for $146.4 million. Growth accelerated more than 38 points to 126.5% YoY, marking SiTime’s first triple-digit growth quarter in five years. Sequentially, revenue increased a sharp 38.6% QoQ following Q1’s seasonally soft 0.2% QoQ and a meaningful improvement from the 15.2% QoQ in the year ago quarter. For Q3, SiTime guided for revenue of $285 to $295 million, which implies a rapid acceleration to 84.2% QoQ and 247.1% YoY, though this guide includes an inorganic contribution of ~$85 million from the newly closed Timing Business acquisition. Excluding the acquisition, the organic guide of $200 to 210 million still implies a robust 30.2% QoQ increase and a 19-point YoY acceleration to roughly 145%, underscoring that underlying demand trends remain strong even without the deal. CED Leads with 181% Growth, Passing $100 Million Milestone Communications, Enterprise and Data Center (CED) revenue was $101.2 million in Q2, up 33.7% QoQ and 181.1% YoY, accelerating from 17.2% QoQ and 158.4% YoY growth in Q1. The acceleration in CED’s run rate is quite visible, as this quarter it surpassed the $100 million milestone, or $400 million annualized, up nearly 7X from a $60 million run rate two years ago. CED accounted for 64% of revenue in the quarter, up from ~52% a year ago. Automotive, Industrial and Aerospace revenue was $24.8 million, up 17.0% QoQ and 50.3% YoY, rebounding from a (13.5%) QoQ decline in Q1 as YoY growth remained steady at 50%. Mobile, IoT and Consumer revenue was $31.4 million, up a sharp 88.0% QoQ and 84.7% YoY, a dramatic reversal from Q1's 31.0% QoQ decline. Segment growth was driven largely by its leading customer, which accounted for ~73% of segment revenue in Q2 with $22.8 million. Margins Expand Ahead of Guidance, GAAP Profitable on Bottom Line Q2 saw SiTime’s adjusted gross and operating expand ahead of guidance, while GAAP profitability emerged with GAAP net margin in the double-digit range. GAAP gross margin was 63% in Q2, expanding 4 points QoQ and 11.1 points YoY. Adjusted gross margin was 67.1%, up 2.5 points QoQ and 8.9 points YoY, coming in ahead of management's guidance for 65%. For Q3, adjusted gross margin was guided to expand to 68% as the Timing acquisition layers in. GAAP operating margin swung to positive 5.2% in Q2, a sharp 16.1 point QoQ and 40.6 point YoY expansion. Adjusted operating margin was 34%, up 5.9 points QoQ and 23.7 points YoY, beating management's 30% guidance by 4 points. For Q3, adjusted operating margin was guided to be 39.6%, up 5.6 points QoQ and more than 21 points YoY. Not only did GAAP net margin move profitable once again (after briefly entering positive territory in Q4), but it hit double digits at 11.5%, up 16.1 points QoQ and 40.6 points YoY. Adjusted net margin was 41.7%, up 7.4 points QoQ and 25.0 points YoY. Q2 Adjusted EPS Beats by 20%, Q3 Guide 43% Above Estimates Driven by Q2’s operating leverage, adjusted EPS beat estimates by a solid 20%, yet Q3’s guidance was more impressive as management guided more than 43% above estimates, aided by the step-up in revenue from the Timing business. GAAP EPS was $0.66 in Q2, improving from a loss of ($0.20) in Q1 and a loss of ($0.84) in the year-ago quarter, and beating management's guidance of $0.58 by 13.8%. Adjusted EPS was $2.34, up 63.1% QoQ from $1.44 and up 397.2% YoY from $0.47, beating guidance of $1.95 by 20%. For Q3, SiTime guided for adjusted EPS to be $3.50 to $3.65, aided by the Renesas Timing Business contribution and continued margin expansion, coming in more than 43% ahead of estimates for $2.49. Cash Flows Remain Steady, FCF Positive for Fourth Consecutive Quarter Cash flows were healthy in Q2 as SiTime recorded its fourth consecutive quarter with FCF in positive territory, while the company did add more than $1.3 billion in debt related to convertible notes to fund its Timing acquisition. Operating cash flow was $40.0 million in Q2 for a 25.4% margin, down 2.1 points QoQ but up 3.3 points YoY. Free cash flow was $27.1 million for a 17.2% margin, up 1.7 points QoQ and a full 21.4 points YoY. Cash, equivalents and investments totaled $1.92 billion at quarter-end, up sharply from $788.7 million in Q1, with the increase reflecting net proceeds from a new convertible senior notes offering used for the Timing acquisition. This brought debt to $1.32 billion. Accounts receivable rose 61.3% QoQ to $88.7 million, and inventories increased 14.0% QoQ to $103.9 million, both consistent with the acceleration in revenue and a business scaling to meet demand. Conclusion: Precision timing is moving from a discrete component into the heart of the system, with timing needed across GPUs, CPUs, switches and accelerator cards. As the CEO stated: “We sell to GPUs, XPUs, TPUs and then we sell into the switches in the AI business and then finally, in the connectivity part of it with more than 15 to 20 module makers and others that are involved in this technology.” If I were to give SiTime a coined name, as I like to do, it would be “Triple Digits.” Let’s see how long SiTime can extend its streak of triple-digit growth in the CED segment. One thing is clear; the company is reaping the rewards of higher density and higher ASPs—a powerful combination for a small, little-known AI supplier. There is no rest for the weary, as the I/O Fund heads into our busiest earnings day of the quarter tomorrow. Stay tuned as we look for more beats and raises to join the growing list of strong reports from our portfolio companies. Please note: The I/O Fund conducts research and draws conclusions for the company’s portfolio. We then share that information with our readers and offer real-time trade notifications. This is not a guarantee of a stock’s performance and it is not financial advice. Please consult your personal financial advisor before buying any stock in the companies mentioned in this analysis. Beth Kindig and the I/O Fund own shares in SITM at the time of writing and may own stocks pictured in the charts. Recommended Reading: Positions Report – July 2026 SanDisk FQ4: Inference to Drive Demand and Visibility for Years AMD Q2: Venice Meets Helios in 2H26 and 2027 Corning: Glass Manufacturing Powerhouse Pivoting Hard into AI Networking Macom: Data Center Revenue Accelerating to 35% QoQ in FQ3
Seagate Q4: Price per Exabyte to Double While Cost Per TB Falls
Seagate’s earnings report ticked a lot of boxes with accelerating revenue growth of 49% YoY and 17% QoQ, margins that are expanding with a significant step-up on GAAP operating margin, and a free cash flow margin that is leading to an important reduction in debt. On the technology roadmap side, Seagate's Mozaic 3+ platform is now qualified and operating in production environments across all major cloud customers. Mozaic 4+ is ramping with the two largest global CSPs, with additional customer qualifications underway, while Mozaic 5+ qualification shipments are set to begin in late calendar 2027 — positioning the areal-density roadmap to support exabyte demand growth into the back half of the decade. In the more near-term, management stated that price per exabyte grew approximately 10% in the June quarter, yet an analyst asserted the guidance implies this will reach 20% YoY growth by the September quarter. Meanwhile, the transition to higher-density HAMR products is simultaneously lowering cost per terabyte and expanding margins. Seagate is Seeing Better Unit Economics from HAMR Seagate reported price per exabyte growth of about 10% yet an analyst challenged management to provide more visibility into the guide as it implies 20% as soon as next quarter. Here was the question on the call: “You just reported 10% year-over-year price per exabyte growth in June. I think the September quarter guide implies pricing growth closer to maybe 20% year-over-year or even above that. Can you maybe just provide an update for us on how we should be thinking about pricing looking forward? Why this trend we're seeing in the September quarter shouldn't sustain or maybe even accelerate, just given supply-demand imbalance, customer demand strength, delivering more value to customers, et cetera.” Management did not confirm the exact percentage, but the response was favorable, with the CFO expecting “every quarter revenue to improve and every quarter gross margin and profitability in general to increase. Of course, pricing is a part of this sequential improvement through the fiscal year.” Meanwhile, the shift to 3TB to 4TB is helping to improve margins with the CFO stating: “Of course, moving the mix from 3 TB to 4 TB per disk is, of course, giving us another boost in terms of profitability” – referring to the increase in storage that Seagate can sell from each drive, as the disc count can carry about 1/3 more capacity. According to an analyst on the call, the reduction is in the mid-teens: “Two, how do you think about the cost down execution as we move through Mozaic 3+ to Mozaic 4+, you've been operating at a mid-teens kind of cost down per year on a per terabyte basis.” When combining both sides of the equations with increasing capacity while driving down costs, it ultimately results in more revenue per drive and lower cost per terabyte (TB). HAMR is also increasing in product mix with Seagate expecting 50% of its HAMR exabytes to come from Moziac 4+ by end of calendar year 2026. To further support better unit economics, the company is driving more exabyte growth with 218 exabytes shipped in Q4, up 34% YoY and of this, 195 exabytes were from data centers. Meanwhile, it was pointed out on the call that drive-unit output was essentially flat, with the growth instead coming from more heads, disks per drive and more capacity per disk: “Now, for example, if you look our last year, and if you look at the number of disk and the number of heads inside the box, they probably grew between 15% and 20%, and the units were absolutely flat” and it was also stated: “These investments enable us to maintain relatively stable drive unit output as customers mix up to higher capacity drives and manufacturing cycle time increase.” The strategy described in the discussion on drive-unit output is centered on the increasing areal density rather than expanding hard-drive unit capacity. Management discussed that increasing the amount of data stored on every disk is the fastest and most capital-efficient path to achieve exabyte growth while maintaining stable unit output. We discussed more on heat-assisted magnetic recording (HAMR) in our write-up on Seagate in March of 2026 stating: “Seagate has developed heat-assisted magnetic recording (HAMR) tech for substantial areal density gains, which refers to how many bits can be packed onto each square inch of disk platter (where data is stored). HAMR uses a laser diode to heat a small spot on the disk, enabling polarity of a single bit to be flipped to allow data to be written.” We also discussed on our Discovery tier additional information on peer Western Digital, stating: “The first is to increase areal density from 32TB to eventually 100TB as we end the decade. By packing more capacity into the same footprint, Western Digital delivers improved economics to alleviate surging capex. The company’s UltraSMR-enabled JBOD platforms offer TB per drive, lower cost per TB and lower power (and space) per TB, delivering not only increased capacity but also lower total cost of ownership.” Financials Revenue Rises 48% YoY to a Record $3.63 Billion Seagate reported FQ4 revenue of a record $3.63 billion, coming in above the upper end of guidance for $3.55 billion. YoY growth accelerated slightly more than 4 points to 48.5% in the quarter, capping off FY26 with a 27 point acceleration since FQ1’s 21.3% growth. QoQ growth accelerated 6.4 points to 16.6% QoQ, marking Seagate’s fastest sequential growth print since 2012, as cloud and enterprise data center demand continues to outstrip available nearline supply. For fiscal Q1 2027, Seagate guided for revenue of $4.1 billion, +/- $100 million, a level that sits well above the pre-print estimate of $3.75 billion for the quarter. Q1’s guide implies YoY growth accelerating further to approximately 56%, while sequential growth would moderate slightly to 13% QoQ at the midpoint. Data Center Accelerates to 17.3% QoQ, Pricing Power More Evident: Seagate’s Data Center revenue was $2.93 billion, up 57.4% YoY and 17.3% QoQ. Growth accelerated slightly from 54.8% YoY in Q3, while QoQ stepped up from 12.4% in Q3, a nearly five point acceleration. The pace of growth on a YoY and QoQ basis for revenue versus exabyte shipments suggests that Seagate is capturing more pricing power this quarter. For comparison, nearline exabyte shipments rose 11.4% QoQ and decelerated slightly to 42.3%, creating a 15-point delta for YoY revenue growth over exabyte growth. This expanded from a roughly 9-point delta for YoY revenue and exabyte growth in Q3, at 54.8% versus 45.8%, implying pricing tailwinds likely strengthened during the quarter. Management noted that nearline exabyte supply is now largely allocated into calendar 2028, with customers extending their planning horizons into calendar 2029 and beyond, a strong signal of forward visibility into the demand backlog. Cloud remains the primary nearline demand driver, now with three full years of sequential quarterly exabyte growth, while Enterprise/OEM data center customers also posted strong double-digit YoY revenue and exabyte growth, per Seagate, pointing to a broadening customer base beyond the largest hyperscalers. Edge IoT revenue was $697 million, up 20% YoY and 13.9% QoQ, a notable acceleration from 1.8% QoQ in FQ3. However, Edge IoT represents 19% of total revenue, down from 24% a year ago, as Data Center growth continues to outpace the legacy business. This is reflected in non-nearline exabyte shipments, which declined (11.5%) YoY and (4.2%) QoQ. Rough back of napkin math for FQ1’s guide suggests Data Center growth could moderate slightly – assuming a slight increase in mix to 81.5% of total revenue, Data Center would project to $3.34 billion, maintaining 58% YoY growth while decelerating slightly to 13.9% QoQ. This would project roughly $759 million in Edge IoT revenue, also marking a deceleration to 8.8% QoQ though YoY growth would accelerate 27 points to 47.3% YoY against a soft comp. Margins Expand to Record Levels on Mix and Pricing One of the key highlights of the report was margins expanding to record levels, with operating and net margins showing strong YoY and QoQ expansion as Seagate saw opex decline sequentially. GAAP gross margin reached a company record of 52.3%, up 14.9 points YoY and 5.8 points QoQ. GAAP operating margin also hit a record 43%, up 19.8 points YoY and 10.9 points QoQ. Adjusted operating margin was 44.6%, up 18.4 points YoY and 7.1 points QoQ. The magnitude of sequential expansion points to continued favorable mix shift toward higher-value nearline capacity alongside disciplined cost control, as opex actually declined (2%) QoQ even as revenue grew 17%. Seagate guided for FQ1 2027 adjusted operating margin of 50% at midpoint, implying further sequential expansion of 5.4 points from Q4, an aggressive guide that underscores management's confidence that favorable pricing and mix will persist into fiscal 2027. GAAP net margin was 35.7%, up 15.7 points YoY and 13.7 points QoQ. Adjusted net margin was 36.3%, up 13.6 points YoY and 6.3 points QoQ. For fiscal 2026, GAAP gross margin reached 45.6%, up 10.4 points YoY. GAAP operating margin hit 33.6%, up 12.8 points YoY, while adjusted operating margin was 36.5%, up 13.1 points, offering a clear demonstration of operating leverage as revenue grew 34% YoY while operating expenses rose less than 12% for the year. Adj EPS More Than Doubles YoY to a Record $5.71 GAAP EPS rose 149% YoY to a record $5.58, accelerating from 108% growth in Q3 and 68% in Q2. Adjusted EPS was a record $5.71, up 121% YoY and accelerating from 115% growth in Q3 and 53% growth in Q2; this also handily beat estimates for $5.09 by more than 12%. For FQ1 2027, Seagate guided for adjusted EPS of $7.30 +/- $0.20, representing a further acceleration to 179% YoY growth. This also came in meaningfully above the $5.85 estimate for the quarter heading in to the report. For fiscal 2026, GAAP EPS more than doubled to $13.90, up 105% YoY, while adjusted EPS was $15.58, up 92% YoY. Free Cash Flow Rises More than 2.5X in Q4 as Balance Sheet Strengthens Cash flow generation was robust in the quarter, but perhaps more important is the progress Seagate has made in strengthening its balance sheet, with net leverage substantially improving throughout the year as debt has been paid off. Operating cash flow increased 157% YoY to $1.3 billion for a 36.0% margin, up 15.2 points YoY and roughly flat QoQ. For FY26, operating cash flow more than tripled to $3.67 billion for a 30.1% margin, expanding substantially from 11.9% in FY25. Free cash flow rose more than 2.5X in Q4 to $1.1 billion for a 30.8% margin, up 13.4 points YoY and roughly flat QoQ. For FY26, free cash flow rose nearly 4X to $3.1 billion for a 25.5% margin, a significant improvement from 9% in FY25. Seagate continued to strengthen its balance sheet, ending the quarter with $1.7 billion in cash and $3.6 billion in debt, for net debt of $1.9 billion. In Q4, Seagate reduced its gross debt by $302 million and $1.4 billion for the full year, bringing its net leverage down to 0.4X from 1.8X a year ago. Subsequent to quarter-end, Seagate also extinguished $1 billion of high-yield senior notes in July 2026 and plans to retire the remaining balance on its convertible notes in September 2026, continuing its deleveraging trajectory. Conclusion: In addition to reporting strong across nearly every financial metric, Seagate’s future growth is being supported by better underlying unit economics rather than only a rebound in hard-drive demand. The takeaway is that exabytes are growing faster than physical drive volumes, and the pricing is favorable. HAMR is increasing areal density for higher revenue while resulting in improved cost per terabyte. Although lesser-known Seagate was in SK Hynix’s shadow yesterday evening, this earnings report has captured our attention. As AI investors brace for more Big Tech capex surprises today and tomorrow, this report proves that lesser-known suppliers are quietly crushing it. Please note: The I/O Fund conducts research and draws conclusions for the company’s portfolio. We then share that information with our readers and offer real-time trade notifications. This is not a guarantee of a stock’s performance and it is not financial advice. Please consult your personal financial advisor before buying any stock in the companies mentioned in this analysis. Beth Kindig and the I/O Fund own shares in STX at the time of writing. Damien Robbins, Equity Analyst at I/O Fund contributed to this analysis. Recommended Reading: CoreWeave: Revenue Inflecting in 2H, Margin and Profit Questions Arm: Computex Update, CPU Core Demand Hinted at Being Higher Macom: Data Center Revenue Accelerating to 35% QoQ in FQ3 Corning: Glass Manufacturing Powerhouse Pivoting Hard into AI Networking
SanDisk FQ4: Inference to Drive Demand and Visibility for Years
SanDisk’s revenue reached $8.97 billion, up 51% sequentially and 372% year-over-year, with approximately one-third of the QoQ increase coming from higher bit shipments and two-thirds from pricing. Data center revenue doubled QoQ to nearly $3 billion, for an increase of 437% for the fiscal year. The elephant in the room is the durability of the cycle. Is memory topping or is this a multi-year secular trend? SanDisk’s guidance for revenue of $10.55B for next quarter slightly missed estimates for $10.82B, somewhat fueling this debate. From my vantage point, it seems highly improbable a leading NAND supplier would be topping before the inference market fully matures. This is because the shift toward inference and agentic AI leads to more storage-intensive architectures. On that note, this quarter, SanDisk signed another five New Business Model (NBM) agreements, with three new customers and an expansion with two previous customers bringing the total customer count to eight. SanDisk expects NBMs will represent 50% of bit shipments in fiscal year 2027 and approximately two-thirds in fiscal year 2028. It was also noted in the slide deck that management expects Datacenter's share of the total TAM to expand from ~30% in CY25 to ~50% in CY26, and to continue outpacing the market in CY27. Looking beyond revenue, SanDisk is also a cash cow. Inference and KV Cache are Expanding NAND’s Role SanDisk’s management team discussed in the opening remarks why inference will sustain demand for years to come. Primarily, that AI inference is fundamentally a memory-bound and storage-intensive problem, stating: “Underlying our performance is the most important force in our market: The era of inference. AI is fundamentally a memory centric, storage intensive problem, and it is reshaping the demand equation for Nand, the shift to inference in agentic AI is generating data at a scale that is redefining storage requirements. Every AI interaction creates content that must be stored, retrieved, and served at low latency, and each of these steps relies on data storage products, including our high capacity enterprise SSDs.” KV cache stores information generated by the model, as these context windows grow and inference workloads scale globally, and as the cache grows larger, there is an opportunity to move the workload from the more expensive HBM into NAND storage. Here is what was stated: “But we just continue to get more optimistic on the requirements for Nand as AI gets more sophisticated, models get bigger, context lengths get longer, and then Agentic is just a big multiplier on top of that.” New Business Models Extend Visibility from Months to Years Last April, SanDisk announced five New Business Model agreements, yet this quarter signed another five deals. The CFO stated the agreements last for up to five years and have a weighted average duration of more than four years. The total minimum revenue associated with the signed agreements is now $93.9 billion based on floor pricing, although it was stated realized revenue will be higher: “The total expected revenue from all our NBMs we have signed is a minimum of $93.9 billion. Assuming floor pricing, we believe actual revenue will be above that minimum. The remaining performance obligations, or RPO at the end of the quarter was $59.8 billion and would be $91.1 billion, including the two NBMs signed after the quarter closed.” The contracts also include $16.5 billion in financial guarantees through deposits and other financial instruments, providing protection in the event a customer does not fulfill their purchase obligations. In our write-up last quarter, we noted how management had made it clear NBM pricing is variable and not fixed, which means SanDisk will not be price capped like a more traditional long-term agreement: “These agreements are tailored to meet the needs of our customers and in aggregate, provide us with demand certainty and financials that we expect will be consistent with our fiscal fourth quarter guidance. The duration of this agreement varies, with the longest contract extending to 5 years. In aggregate, volume commitments increased during the life of the contracts with quarterly commitments and a combination of fixed and variable pricing. This agreement with variable pricing allow us to capture upside if prices rise while allowing our customers some upside if prices decline over time.” There were a few anecdotal points that show how far SanDisk has come this year in terms of negotiation strength. The first is that management stated they used to have visibility of about three months, but now have visibility of four years: “So we feel like we've just made incredible progress here on, you know, taking, you know, a year ago, we were talking about visibility in this business of three months.. Now we're talking over four years of committed financials and understanding the mix and working with, as Luis said, some of the most enviable companies in the world.” It was also pointed out that customers are coming back for a second round of NBMs about one quarter in: “I think one of the one of the most interesting dynamics is our, you know, some of our biggest customers are already coming back and wanting more right from just what they thought they needed three months ago.” BiCS8 is the Gold Standard, HBF is Incoming During the quarter, BiCS8 ramped to become the majority of the company’s bit production. Management stated it was becoming the “gold standard for NAND” stating: “Our technology leadership is how we are capturing this opportunity. Bics has become recognized as an industry gold standard for NAND, and this year we ramped Bics8 to the majority of our bit production, delivering industry leading performance, density and power efficiency across both TLC and QLC.” This particular product has allowed NAND to expand from just adding more layers to also offer newer technologies such as hybrid wafer bonding to improve performance and cost, while also setting up future generations to scale. As discussed in a write-up from January, “BiCS8 is the duo’s eighth-generation BiCS (bit cost scalable) 3D NAND architecture, which stacks NAND cells vertically, creating more layers and reducing costs per bit. BiCS8 scales to 218 layers from 162 layers in BiCS6, with SanDisk saying that BiCS8 increases memory density by more than 50%, program and read bandwidth by 35% and 26%, and data transfer speeds by more than 80% versus BiCS6. The two also have previewed the next generation of BiCS, scaling to 332 layers and further improving interface speeds by ~33%. Additionally, SanDisk believes that its BiCS8 QLC (quad-level cell) die underpinning its Stargate data center SSDs delivers substantial performance, latency and efficiency advantages over competitors: 11% to 67% faster input/output speeds in Gb/s, along with 27% to 34% lower latency. Management expects its BiCS8 QLC line to go from ~20% to 40% of its data center business by the end of FY26.” The mix shift is visible with data center representing 12% of SanDisk’s bit shipments a year ago to now 38% exiting FY26, easily becoming the company’s fastest growing end market. Looking further down the road, high-bandwidth flash addresses AI workloads when traditional memory reaches capacity or cost constraints – known as the memory wall. According to the press release last year from SanDisk, HBF could relieve inference bottlenecks by bringing the higher-capacity flash closer to the compute layer. The company is expected to offer more announcements this next week. Financials Revenue Accelerates 120 Points to 372% YoY, Q1 Guided Below Estimates SanDisk's FQ4 revenue came in at a record $8.97 billion, nearly $1 billion ahead of its $8 billion guide and beating the consensus estimate for $8.39 billion by a solid 6.9%. On a YoY basis, revenue growth accelerated 120 points to 371.6% YoY, while QoQ growth remained robust at 50.7% following FQ3’s 96.7% QoQ print. Management noted that roughly one-third of the QoQ increase came from higher volumes and two-thirds from higher pricing. For FQ1 2027, SanDisk guided for revenue of $10.30 billion to $10.80 billion, notably coming in below consensus for $10.82 billion and implying a substantial deceleration to 17.7% QoQ at midpoint. While part of the deceleration can be chalked up to the larger revenue base, sequential dollar growth points to a deceleration to $1.6 billion QoQ growth, down from Q4’s $3 billion. YoY growth would remain relatively steady at 357.1%, decelerating 14.5 points. For FY26, revenue hit $20.25 billion, up 175.3% YoY, driven by both revenue nearly tripling in Edge to $12.16 billion, SanDisk’s largest end market, as Data Center revenue rose 437% to $5.15 billion. Initial estimates for FY27 project revenue growth remaining strong at 146.3% YoY to $49.87 billion. Segment Breakdown: Data Center Follows FQ3’s 233% QoQ Growth with 103% QoQ in FQ4 Data Center once again was a standout performer in FQ4, with the segment now accounting for one-third of revenue after recording two consecutive quarters of triple-digit sequential growth. Data Center revenue increased 102.9% QoQ to $2.98 billion in FQ4, a remarkable achievement following FQ3’s 233.4% QoQ print and accounting for more than 33% of revenue. YoY growth was roughly 1,298% coming off a small comparable base, accelerating 653 points. For some perspective on how quickly Data Center growth has compounded, revenue was $269 million in Q1, so it exited the year 11X higher. As noted above, FY26 Data Center revenue was $5.15 billion, up nearly 437% YoY from $960 million in FY25. For the full-year, Data Center contributed 25.4% of revenue. Edge remains SanDisk’s largest end market by dollars, spanning smartphones, PCs, tablets, and other emerging physical AI use cases. Revenue was $5.43 billion in Q4 or 60.6% of revenue, with YoY growth accelerating more than 97 points to 392.5%. QoQ growth decelerated 70 points from 118.3% QoQ to 48.3% QoQ, though this was mostly a function of the larger revenue base as sequential dollar growth was fairly similar at $1.77 billion versus $1.99 billion in Q3. For FY26, Edge revenue rose 194.6% YoY to $12.16 billion, accounting for 60.1% of revenue. SanDisk noted that PC and smartphone is going through a “period of adjustment” in the near term (growth headwinds) but are expected to return to growth in CY27. Consumer revenue was the glaring negative of the report, with revenue down (32%) QoQ and (5%) YoY to $556 million, likely due to higher NAND pricing and downstream product price hikes impacting overall consumer product demand. SanDisk Appears to be Approaching Peak Margin Profile At first glance, SanDisk’s margins and expansion across the board are hard to argue against, as few companies are ever able to recognize margins of this degree. However, the company appears to be hitting its peak margin profile before NBM agreements begin to layer in fully. This suggests surprises on the bottom line could be harder to come by, as seen in Q1, as margins appear to hit a max ceiling. GAAP gross margin was 84.6% in Q4, up 58.4 points YoY and 6.2 points QoQ. Q1 GAAP gross margin was guided to be roughly 84% at midpoint, up 54.2 points YoY and down less than one point QoQ. GAAP operating margin was a whopping 78.5%, up 77.6 points YoY and 9.4 points QoQ. This capped off a rather transformational year as SanDisk started FY26 with just a 7.6% operating margin in Q1. Adjusted operating margin was 79.2%, up 73.9 points YoY and 8.4 points QoQ. For Q1 FY27, SanDisk guided for operating margins to remain at these levels, with GAAP operating margin guided at 78.3% and adjusted at 79%. GAAP net margin reached 77.0%, up 78.2 points YoY and 16.2 points QoQ. Adjusted net margin was 68.7%, up 66.5 points YoY and 6.9 points QoQ. The gap between GAAP and adjusted net margin stems from an $804 million mark-to-market gain on equity securities. For the full year, GAAP gross margin was 71.5%, up 41.4 points YoY. Q1’s trajectory, assuming it can be maintained above 80%, suggests further upside for gross margin in FY27 from FY26’s level. GAAP operating margin hit 61.2%, improving nearly 80 points; adjusted operating margin rose 53.3 points to 62.7%. Similar to gross margin, Q1’s guide around the 79% level suggests further expansion is doable in FY27. GAAP net margin was 56.5%, improving 78.8 points, while adjusted net margin was 54.3%, improving 48.3 points. GAAP EPS Expected to be $225+ in FY27 SanDisk’s margin profile is lending to strong earnings power, with quarterly GAAP EPS of $43.97 in Q4 and FY27 currently expected to be north of $225. As noted above, Q4 GAAP EPS was $43.97, up 90.9% QoQ and not comparable to the ($0.16) print from a year ago. Adjusted EPS was $39.25, meaningfully ahead of guidance for $30-33 and representing 13,434% growth against the small $0.29 comp. For Q1, SanDisk guided for adjusted EPS to be $44-46, marginally above estimates for $44.21 as margins are hitting a ceiling. For FY26, GAAP EPS was $73.76, swinging from the split-off impacted ($11.32) loss in FY25. Adjusted EPS was $70.88, up 2,271% YoY from just $2.99 in FY25. Looking ahead to FY27, SanDisk is projected to see earnings triple: GAAP EPS is estimate to rise more than 206% to $225.94, while adjusted EPS is estimated at 200.4% YoY to $212.95. Cash Flow Margins Approach 80% Boosted by NBM Deposits. Cash flows matched operating margins at roughly 80% in Q4, a substantial expansion from Q3 around the 50-51% level, with this driven by NBM deposits and pre-payments. Q4 operating cash flow was $7.13 billion for a 79.5% margin, up roughly 28.4 points QoQ and 74.6 points YoY, boosted by $1.94 billion in NBM deposits and pre-payments, up from $538 million in pre-payments in Q3. Free cash flow was $7.08 billion for a 79.0% margin, up 28.7 points QoQ and 76.4 points YoY. Stripping out the NBM impacts, adjusted Free Cash Flow was $5.04 billion, a 56.2% margin — still very strong compared to FQ3’s 40.6%, but a more conservative read on core, recurring cash generation than the headline OCF/FCF figures this quarter. For FY26, operating cash flow was $11.67 billion for a 57.6% margin, versus just $84 million or a 1.1% margin in FY25. FY26 free cash flow was $11.49 billion for a 56.8% margin, versus $281 million or a 3.8% margin in FY25. Adjusted free cash flow for FY26 was $8.74 billion, a 43.2% margin, versus just $238 million in FY25 or a 3.2% margin.. Cash and equivalents totaled $4.76 billion at quarter-end, while debt remained at zero, having been fully repaid earlier in the year. Accounts receivable rose 72.7% sequentially to $4.71 billion, notably outpacing the 51% sequential revenue growth, while inventories rose 20.6% sequentially to $2.70 billion; management indicated inventory days are being held intentionally higher to support NBM commitments and account for higher component costs. Conclusion: There is no gain without some pain, and SanDisk may embody this more than most stocks. Despite its strong fundamental profile and the clear thematic tailwind from inference and KV cache, both of which decisively point toward greater NAND demand, we expect memory stocks to remain a wild ride. We will continue to use technicals to reduce risk while maximizing upside (to the best of our ability) on this very clear beneficiary of the incoming inference boom. Please note: The I/O Fund conducts research and draws conclusions for the company’s portfolio. We then share that information with our readers and offer real-time trade notifications. This is not a guarantee of a stock’s performance and it is not financial advice. Please consult your personal financial advisor before buying any stock in the companies mentioned in this analysis. Beth Kindig and the I/O Fund own shares in SNDK at the time of writing and may own stocks pictured in the charts. Damien Robbins, Equity Analyst at I/O Fund contributed to this analysis. Recommended Reading: AMD Q2: Venice Meets Helios in 2H26 and 2027 Astera Labs Q2: Scorpio is Locked and Loaded Silicon Motion Q2: Boot Drives Lead to Strong Report; MonTitan Still to Ramp Meta Q2: Selling Compute Sends Mixed Messages
Big Tech’s AI Revenue Is Surging, but Suppliers Will Still Be the Bigger Winners
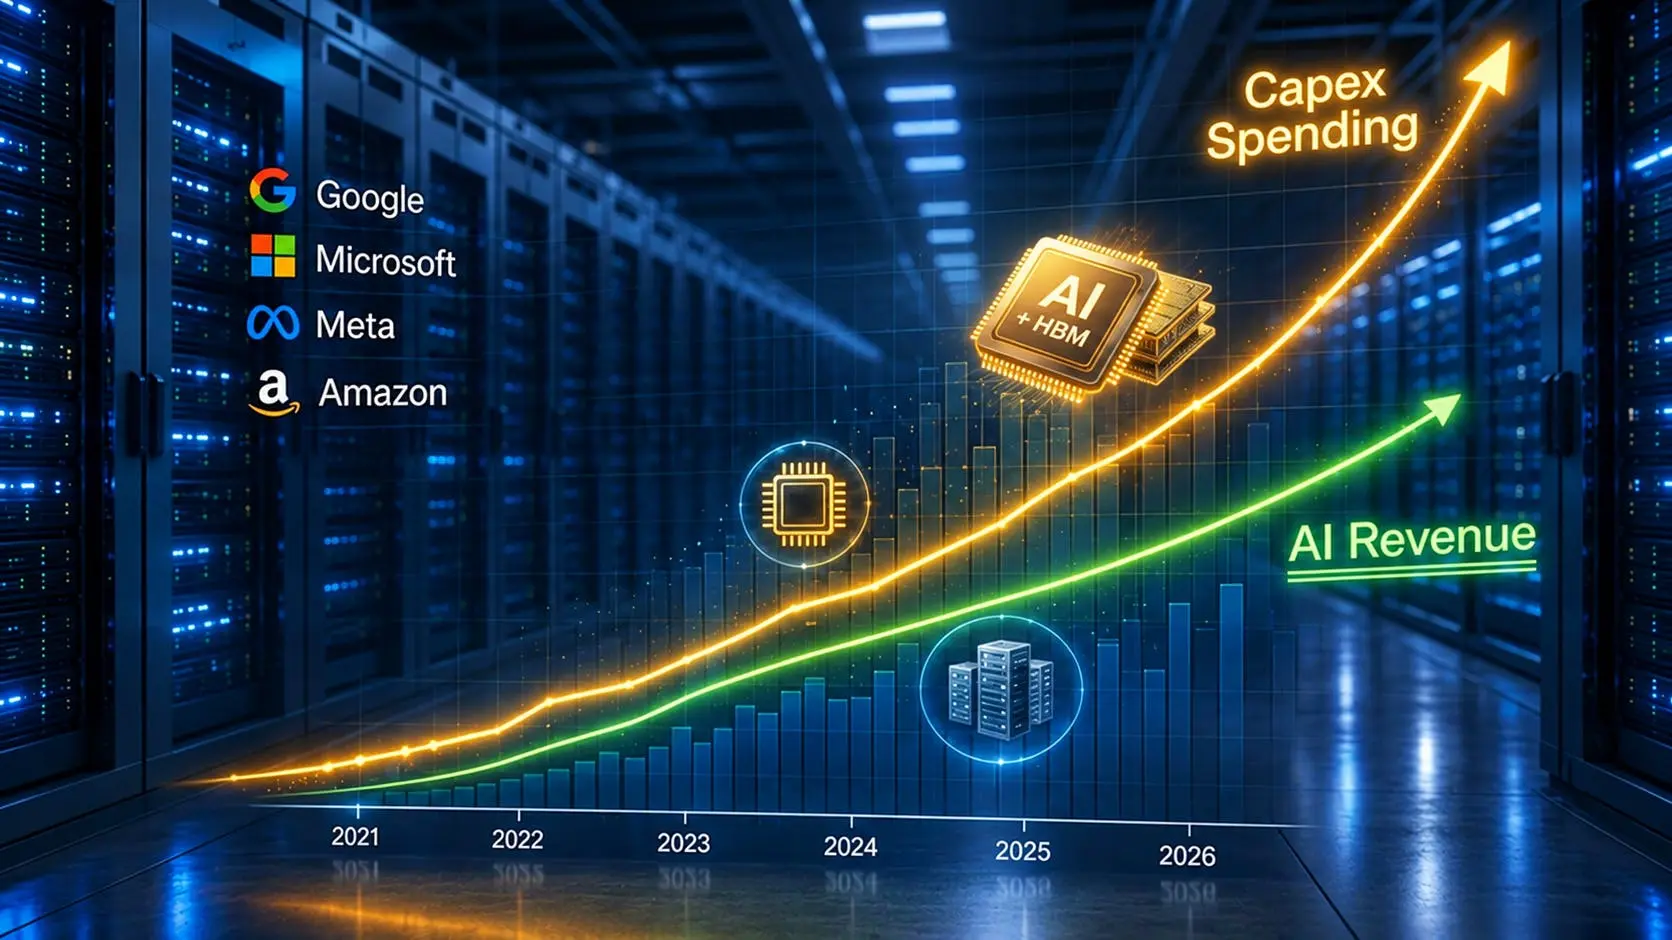
As analysts call for AI capex to hit $1 trillion in 2027, Big Tech showed strong progress on AI monetization in Q2. Despite strong increases for AI revenue un rates, Big Tech’s capex to AI revenue ratios remain elevated from 1.5X to 4X. Higher AI capex extends the demand tailwind for suppliers which have already seen earnings growth multiples higher than the market and hyperscalers. Big Tech is finally proving that AI can generate meaningful revenue. Azure, Google Cloud and AWS all accelerated in Q2, reaching tens of billions in dollars in annualized revenue. Meanwhile, as is well-reported by now – Google and Amazon have posted negative free cash flow in Q2, as capex continues to rise faster than the cash generated from these investments. As discussed in the article AI Capex to Hit $1 Trillion – And Estimates Are Still Too Low, improving AI economics may not reduce spending, rather it could accelerate it to $7.6 trillion spent between 2026-2031. This creates a question the market will be debating for years – if AI monetization is getting better, then why are Big Tech’s cash flows getting worse? In other words, why can’t monetizing AI offset these investments? That is the kind of question that short sellers will salivate over, yet remember; short sellers are not the winners of the AI boom. Instead, the stock market winners have decisively been those who positioned in lesser-known suppliers. In the analysis below, we spell out this important dynamic for AI investors. And as the I/O Fund has done for years and years, we also connect the dots as to who the real AI beneficiaries will be. Cloud Growth Accelerates Across the Board in Q2 Driven by AI Last week’s Q2 earnings provided several important pieces of evidence that AI is driving cloud accelerations at Azure, Google Cloud and AWS, as AI run rates and key metrics continue to tick higher. Microsoft Azure Growth Accelerates as AI Demand Outstrips Capacity Starting with Microsoft, we noted in our Q2 Big Tech earnings preview that its AI business hit a $37 billion run rate in Q3 FY2026, up 123% YoY and a nearly 3X increase versus early 2025. Despite that, Azure had failed to accelerate with growth consistently sitting near 39%-40%. We noted that accelerating Azure growth would be key to beating expectations, and this is exactly what transpired. Azure accelerated to 43% growth, above guidance for 39-40%, with Microsoft expecting Azure to accelerate further to 45% growth next quarter. mid Microsoft also disclosed that the number of Foundry customers operating at 1 trillion token run rates rose 4X YoY. Paid Copilot seats rose to 30 million, with net additions doubling QoQ. Microsoft also added $51 billion in commercial RPO, with no contribution this quarter from frontier labs, with the overall RPO figure hitting $678 billion, up 84% YoY. Google Cloud Growth Accelerates to 82% YoY Google also put up impressive growth metrics, with Google Cloud accelerating to 82% YoY growth. This was a sharp acceleration compared to 63% growth in the prior quarter, with growth also over 2.5X higher than the 32% YoY achieved in Q2 2025. Meanwhile, Cloud operating profit soared 214% YoY to $8.8 billion as operating margin expanded 1,490 basis points YoY and 270 basis points QoQ to 35.6%. Cloud backlog increased over $50 billion sequentially and 385% YoY to $514 billion. Additionally, as we recently noted in our latest piece on token processing, Google processed 3.2 quadrillion tokens in May, up 7X in one year and up a whopping 330X in two years. The company also said its first-party model token processing hit 22 billion per minute in Q2, matching Q1’s growth rate at a 6 billion increase sequentially. AWS Posts Fastest Growth in Over 4 Years, Chips + AI Run Rate Hits $50B Combined The trend of accelerating cloud growth continued with Amazon’s AWS, which marked its fastest growth rate in more than 18 quarters in Q2. Revenue increased by 36.7% YoY to $42.2 billion, more than double the 17.5% growth in Q2 2025, and a more than 8 point acceleration versus 28% in Q1. AWS operating income also rose 58.9% YoY to $16.6 billion, while operating margin expanded 630 basis points YoY and 160 basis points QoQ to 39.4%. In just one quarter, AWS’s AI business saw its annual revenue run rate increase from $15 billion to over $25 billion, growing triple digits YoY. Additionally, the run-rate of its chips business eclipsed $25 billion, also growing triple-digits YoY and 25% QoQ and led by its Trainium accelerators and Graviton CPUs. Combined, this represents a $50 billion run rate across chips and AI services, or 30% of AWS’s total $169 billion annualized run rate. Notably, CEO Andy Jassy said there is a “real chance” that Amazon will sell Trainium chips to third-party data centers in the future, opening the door to increase its chips run rate further as the company indicated in April that a third-party approach could’ve seen its run rate already hit $50 billion. Meta Advantage+ Reaches $75 Billion Run Rate Despite Slower Revenue Growth Of all the Big Tech reports, Meta was decidedly the least impressive growth-wise. Total revenue rose 28% YoY, decelerating considerably versus 33% in the prior quarter, while its Q3 guidance also implies a further deceleration to 22% growth. Still, this doesn’t mean that Meta isn’t seeing significant AI monetization. The company notes that its end-to-end AI-powered Advantage+ solutions hit a $75 billion annual run rate during the quarter. This marks a 16.7% increase versus Q3 2025, and a 3.75X increase versus Q4 2024. AI Capex-to-Revenue Ratios Are Sky High Across Big Tech Looking at quarterly AI revenue run rates versus capex as a simple barometer for AI ROI across Big Tech shows a marked improvement in ROI over the last two years, though run rates still lag capex by a wide degree. As noted above, AWS saw its AI services and chips businesses both hit a $25 billion run rate in Q2, or ~$6.25 billion per quarter each (assuming run rate is calculated quarterly). Combined, both AI-driven businesses would be contributing $12.5 billion in quarterly run rate revenue in Q2, versus capex at $53.1 billion, or a 4.25X capex to AI revenue ratio. Looking back to Q1 2024 when Amazon revealed it reached a multi-billion run rate for AI, and assuming this would be roughly $4 billion annualized or $1 billion quarterly, this would give a 13.9X capex to AI revenue ratio. This suggests AWS has meaningfully improved its AI ROI over the last two years as its AI businesses ramp despite quarterly capex scaling 4X from $13.9 billion to $53.1 billion. For Microsoft, no new update was given for its exact AI run rate in Azure, though extrapolating from FQ3’s update of reaching a $37 billion run rate projects FQ4’s run rate to be around the $45 billion range. This would correspond to quarterly AI revenue of $11.2-11.3 billion, giving a capex to revenue ratio of 3.64X this past quarter. Looking back to FQ2 2024 (ending Jan 2024), Microsoft’s AI run rate is estimated to be around $4.75 billion, or around $1.19 billion quarterly, while capex was $11.5 billion. This corresponds to a capex to AI revenue ratio of 9.75X. Unlike peers, Alphabet has not been very upfront with its AI run rate, though assuming AI contributed a similar proportion of YoY growth as Microsoft in Q2, this would roughly project Google Cloud’s AI run rate to be ~$47 billion, or ~$11.7 billion per quarter. This would correspond to a capex to AI revenue ratio of 3.84X. Looking back to Q2 2024 where Alphabet first disclosed its YTD AI revenue in the billions, and assuming this would be approximately $1.5 billion that quarter, this would give a capex to AI revenue ratio of 8.8X. For Meta, Advantage+ reached a $75 billion run rate, implying a quarterly run rate of $18.75 billion. Compared to Q2 capex of $31.1 billion, this corresponds to a capex to AI revenue ratio of 1.66X. Looking back to Q4 2024’s $20 billion run rate, or $5 billion quarterly, offers a capex to AI revenue ratio of 2.84X. Free Cash Flow Headwinds Mount as Infrastructure Spending Outpaces Revenue Prior to this earnings season, we published our two-part series on capex and free cash flows, Big Tech’s Free Cash Flow is Turning Negative – Who's Next?. In this, we discussed how capex growth was outpacing both operating cash flow growth and the scale of AI monetization, concluding that Big Tech was at high risk of going FCF negative this year and next. Q2’s reports showed this dynamic arise earlier than expected, as Google saw FCF go negative for the first time since its IPO, followed by Amazon the week after, while Meta held on by its fingertips this quarter. Looking ahead to 2027, FCF pressure remains, as both Google and Meta are forecast to see FCF drop deeper into negative territory with Amazon also on the brink of negative FCF. On the flipside, Microsoft is expected to be relatively well-insulated with FCF remaining resilient through next year at $46.2 billion estimated in 2027. This chart compares Q2 2026 free cash flow (FCF) with 2027 forecasts across four hyperscalers. Microsoft is expected to remain the strongest cash flow generator, with FCF rising from $19.6B to $46.2B. Amazon improves from negative $8.8B to positive $1.2B. Google declines from negative $7.6B to negative $18.4B, while Meta falls from positive $0.8B to negative $16.2B. Combined FCF is projected to increase from $4.0B in Q2 2026 to $12.8B in 2027, driven primarily by Microsoft's growth. Source: MarketScreener; visualization by I/O Fund. In Q2, Amazon put it rather bluntly to investors – short term FCF headwinds are necessary and being incurred as capacity must be built out to meet demand, but this is expected to create stronger long-term FCF growth once it hits the break-even point for servers. Semiconductor and Hyperscaler Earnings Growth Is Rapidly Diverging As hyperscalers spend massive sums on AI capex, I/O Fund’s strategy has centered around investing in the companies that are receiving that cash rather than those spending it. Looking at the growth of semiconductor earnings versus hyperscalers and the overall market provides strong validation as to why we have taken this approach. Data from JP Morgan shows that annual semiconductor earnings growth has outpaced hyperscalers for multiple years, and that divergence is only widening over time. Semiconductor earnings growth moderately exceeded the ~40% among hyperscalers in 2024, but then increased to ~50% in 2025, more than 2.5X the 19% growth hyperscalers achieved. That gap is expected to become much larger in 2026, with semiconductor earnings expected to rise by 97%, nearly 6X faster than hyperscaler earnings. This chart compares annual earnings per share (EPS) growth for the S&P 500, U.S. hyperscalers, and U.S. semiconductor companies between 2024 and 2026. Semiconductor earnings growth leads throughout the period, increasing from 48% in 2024 to 52% in 2025 and 97% in 2026. By comparison, hyperscaler earnings growth slows from 41% in 2024 to 19% in 2025 and 17% in 2026, while the S&P 500 grows from 12% to 14% and 24%, respectively. The data highlights a widening earnings growth gap between semiconductor suppliers and hyperscalers during the AI infrastructure buildout. Source: LSEG Datastream, S&P Global, J.P. Morgan Asset Management; visualization by I/O Fund. Semiconductor PEG Ratio Drops Steeply, Supporting AI Supplier Thesis While shares of many semiconductor stocks have soared, soaring earnings have also put significant downward pressure on valuations. This is demonstrated through the trailing PEG ratio, which divides P/E ratios by EPS growth to help assess whether multiples are in line with earnings growth. The trailing PEG ratio among chip stocks has fallen from well above 2 to nearly 1 over the past year, lower than other subsectors tied to the AI buildout. While these estimates are as of early June, semiconductor benchmarks are down meaningfully in that span, likely pushing trailing PEG ratios down further. As inference demand is likely to lead to even higher levels of capex, semiconductor earnings can receive another strong tailwind in 2027, reinforcing the merits of our semiconductor-focused approach. This chart compares trailing PEG ratios for five U.S. equity subsectors one year ago and currently. Semiconductor valuations show one of the largest improvements, with the PEG ratio falling from 2.6x to 1.2x, reflecting stronger earnings growth relative to share prices. Software PEG ratios also declined from 3.0x to 2.0x. In contrast, hardware increased from 4.8x to 6.5x and communications equipment rose sharply from 2.7x to 9.6x, while electrical equipment remained relatively stable at 5.9x versus 5.7x. The data suggests semiconductor stocks have become more attractively valued despite strong gains driven by the AI investment cycle. Source: LSEG Datastream, S&P Global, J.P. Morgan Asset Management; visualization by I/O Fund. Conclusion Big Tech is finally proving that AI can generate meaningful revenue, but Q2 also showed why stronger monetization may not translate into stronger near-term cash flows. Azure, Google Cloud, and AWS all accelerated, and AI businesses across both cloud and core products are reaching run rates well into the tens of billions. The key takeaway is that improving AI economics may reinforce the spending cycle rather than slow it down. From what is being communicated from Big Tech management teams, revenue will be reinvested into more data center capacity. This could lead to a few more years of elevated capex and free cash flow pressure. From our vantage point, however, the focus on Big Tech is a distraction. While hyperscalers grab the flashy headlines, the more compelling opportunities are the enabling technologies standing directly in the path of a nearly $1 trillion wind tunnel of annual capex. Our latest 90-page Top 20 AI Stocks for Q3 2026 report offers investors a comprehensive deep dive into the AI stack, mapping out the companies best positioned to capture capex spend. Previous winners identified in the report include Bloom Energy up 1150% since our first entry, Micron up 210% since our entry a few months ago, a lesser-known networking stock up 370% since November. All of this from the team that first identified Nvidia as an AI stock in 2018, up 6700% since our first entry. Don’t miss out on the AI trade. Subscribe Now. Please note: The I/O Fund conducts research and draws conclusions for the company’s portfolio. We then share that information with our readers and offer real-time trade notifications. This is not a guarantee of a stock’s performance and it is not financial advice. Please consult your personal financial advisor before buying any stock in the companies mentioned in this analysis. Leo Miller, AI and Semiconductor Investment Writer at I/O Fund, contributed to this analysis. 👉🏻 Share with a Fellow Investor
Help someone else benefit from this insight. Recommended Reading: Token Growth is Surging – Here Are the Beneficiaries AI Token Demand is Shattering Forecasts Nvidia and Google Are Crowding TSMC’s N3 Node – Can Intel Fill the Gap? Intel vs TSMC: How CoWoS Packaging Constraints Could Create an Opportunity for Intel Foundry
Astera Labs Q2: Scorpio is Locked and Loaded
Astera Labs Q2 offered 27% sequential growth and 104% year-over-year growth, driven by record Aries revenue and a faster ramp in Scorpio. The acceleration is more pronounced next quarter with a guide for $550M, at the midpoint, implying 40% sequential growth and 138.5% growth YoY. This compares to analyst estimates for $417M next quarter – marking one of the biggest beat/raises we’ve seen this quarter. The Q3 beat is being driven by the 320-lane Scorpio X-Series entering a large production ramp – a launch that our team has been highly following quite closely. The more important update this quarter is that Scorpio is expected to become the largest product by revenue one quarter early in Q3 (versus previous commentary it would be in Q4). To sweeten the deal, management stated their scale-up switch dollar content is expected to well exceed $1,000 per XPU, which could result in a significant revenue opportunity per AI system as these systems scale-up. There was additional commentary on how ALAB is moving beyond higher lane count and switching bandwidth with their COSMOS software platform, which is finding some traction by helping to orchestrate workloads. Not only does this increase the revenue opportunity but introduces multi-generational vendor lock-in. There is a lot to unpack with Astera’s report, especially as the company prepares to seize the scale-up networking market with a product portfolio that is locked and loaded. Scorpio-X Proves Astera is Pure Innovation One thing investors should watch closely with Astera Labs is the company’s ability to re-accelerate growth following its IPO. Specifically, achieving this rare milestone points to a company that can innovate after going public; and that is exactly what we want to see. According to management, the merchant scale-up switch market is estimated to be $20 billion: “These capabilities are driving exceptional demand for our Scorpio XE Smart Fabric switches to address the $20 billion merchant scale up switching TAM.” There are a few reasons that Astera believes they can claim a sizable portion of the switching market, one being their switches are high radix, which refers to more high-speed ports per lane on the switch. As AI clusters get larger, and as each accelerator communicates with more peers, there is a higher switch count and more ports. In our previous write-up last quarter, we had stated in the article Astera’s Product Road Map is Loaded, that the Scorpio-X Series 320 Lane is the largest open, memory semantic fabric switch on the market with 5.12 TB/s bidirectional bandwidth in a single ASIC. The 320 Lane variant offers 16 lanes per device and 20 accelerators per switch, which is roughly “2x the radix in a single hop,” which means twice the number of GPUs are connected on the same switch. With Scorpio-X, only one switch is needed for 320 GPUs, and fewer switch hops means lower latency.” However, perhaps most interesting, Astera will recognize the total value of the switches on an XPU basis. For example, as noted above, in a 20-XPU configuration at 16 lanes per XPU, and at $1,000 per XPU, then Astera’s content per accelerator would imply $20,000 in switching content. This is due to a combination of the higher radix, which reduces the number of hops and replaces many smaller legacy switches, combined with the increased bandwidth per XPU, which increases total switching content per XPU. We’ve covered this many times in the past here. The bigger news from the call this evening was the emphasis that Scorpio-X could well exceed $1,000 per XPU, which was repeated many times. Here is one example: “Looking ahead, we expect the content opportunity for Scorpio X series solutions alone to grow well beyond $1,000 per XPU in future generations of AI platforms.” In the Q&A, this was also discussed at length: “Scale up switch itself, offering over $1,000 per XPU. And this is, you know, already starting to happen, of course, with the high switch that we are shipping right now. But at the same time, this is just the beginning of it. Because when you start adding, you know, several other features that are, that are,, important in terms of,, optical, for example,, or adding more signal conditioning because of the,, the higher speed and the higher attach rate. We do believe that this number will continue to scale up. And that is what we focusing our investment right now, which is how do we ensure a, we keep increasing the dollar content we get per export targeting multiple thousands of dollars.” This makes sense as the inference market represents a new trajectory for Astera Labs, given its physical positioning near direct memory access. For example, we’ve pointed out in the past the X-Series is timed to the inference market as Mixture of Experts (MoE) inference requires very fast accelerator-to-accelerator communication. MoE requires frequent routing of tokens and data across expert models, which places more emphasis on the scale-up fabric. Hypercast and In-Network Compute Scorpio-X also officially transitions the company from selling connectivity components to an “intelligent connectivity platform” with Astera’s physical positioning also being advantageous for its software to be used for orchestration with management stating: “While previously COSMOS was mainly responsible for optimization, telemetry, diagnostics, now we are becoming part of the orchestration layer. The XPUs are talking directly to our COSMOS platform to run the workloads. This drives a lot more stickiness into our solution. Many customers that have adopted our platform in this generation will continue to use this for the next generation.” Hypercast allows Astera to distribute data across XPUs while in-network compute offloads some operations to the switch. According to management, this leads to a 2X improvement in the collective operations for training: “A lot of it is also stemming from the advanced capabilities that we built in, I think this is what you refer to when you talk about software, which is the in-network compute as well as HyperCast. Both of these are very important technologies that really set us apart and enable very low latency inferencing as well as very high efficiency for in-network compute. Almost 2x improvement in the collective operations that are required for training. All of these are hardware-based features, but they are enabled through software, and this software resides in our COSMOS platform.” It was also stated that Hypercast and in-network compute lead to “very low-latency inferencing” due to the XPU directly talking to the switch to orchestrate the workloads. Here is what was stated: “Actually, that is what I was trying to say when I answered the question earlier: that with the advancement of the in-network compute and Hypercast features in our latest Scorpio 320-lane device, we are indeed crossing over that line where the XPU is directly talking to the switch to orchestrate the workloads, to reduce the latency, and increase the throughput for both inferencing as well as training workloads. That's a very important development for our COSMOS platform, where not only are we doing the traditional optimization, customization, diagnostic, and telemetry, but we are really helping to improve the workload and directly improve the utilization of the GPUs that are connected to our switch.” CXL Memory Controllers to Ship in Volume in 2027 In the opening remarks, Astera pointed to a few reasons their Leo CXL memory controllers are expected to see higher volumes across two hyperscalers. This extends Astera’s opportunity to include memory pooling and connectivity – especially important as the high cost of memory is driving strong motivation to find alternatives. Here is how it was framed on the earnings call: “For a growing set of memory-intensive inference and agentic AI workloads, memory capacity and utilization are increasingly becoming system constraints, and CXL-attached memory can offer attractive cost performance relative to local HBM.” Astera explained their opportunity to address the memory scarcity as two-fold. The first is a “KV cache accelerator type function” that improves latency and performance for inference applications. It was stated last quarter that Microsoft is using Astera for its Azure M-Series virtual machines. The second is using CXL to add more memory to the CPU, when more memory is needed for intensive workloads. Specifically, Astera Labs stated they have been working with SAP’s Hana on this use case. In addition to these customers, it was stated there was a new design win this past quarter with Leo CXL memory controllers shipping in volume in 2027 with a hint this will include GPUs, as well as XPUs: “During Q2, we closed a new design win with our standard Leo memory controller at a U.S. hyperscaler. Looking into 2027, we expect to ship both standard and custom Leo CXL memory controllers in volume across general-purpose compute and AI inferencing applications to two U.S. hyperscalers.” Note on Key Revenue Drivers: Aries and Taurus Despite Scorpio being the primary focus as the key catalyst, followed by CXL in 2027, the core product Aries retimers also delivered record quarterly revenue as ALAB was unchallenged on PCIe 5 and has first mover advantage on PCIe6. We covered this in 2024 here. The company’s smart cable modules product line, Taurus, is shipping in preproduction 100G per lane for 800G active electric cables. Astera expects Taurus to accelerate in 2H as the market moves from 400G to 800G, driving both higher attach rates and higher ASPs. Financials Revenue Reaccelerates to 104% YoY, Q3 Guide Crushes Estimates by 32% Astera Labs reported record revenue of $392.4 million in Q2, up 27.3% QoQ and up 104.5% YoY, beating the $360.8 million consensus estimate by 8.8%. Growth accelerated on both a YoY and QoQ basis, aided by its Scorpio X-Series ramp and record quarterly revenue for its Aries product line. YoY growth reaccelerated from two consecutive quarters in the 90%-range, while QoQ growth saw a strong 13.3 point acceleration from 14% QoQ in Q1. Astera’s Q3 guidance blew estimates out of the water, with management guiding for revenue between $540 to $560 million, coming in 31.9% above consensus estimates for $417 million. This points to QoQ continuing its sharp acceleration to 40.2% QoQ, another 13 point acceleration, while YoY growth would accelerate 34 points to 138.5%. Management tied the Q3 inflection to the production ramp of its Scorpio X-Series 320-lane fabric switch, with Scorpio now expected to become Astera’s largest product family in Q3, a full quarter ahead of prior expectations. Astera did not guide beyond Q3 or for the full year, though management added that new design wins across a broadening customer base and its expansion into optical and custom solutions positions the company for strong growth in 2027. Gross Margin Compressing as Operating Margin Expands Astera’s margins are dancing a bit of a tango in Q2 and Q3, as gross margin is facing some pressure while operating margins are seeing an accelerated expansion into Q3 as GAAP operating margin pushed towards 30%. GAAP gross margin was 73.3% in Q2, down 3.0 points QoQ and down 2.6 points YoY. For Q3, GAAP gross was guided at 72%, down 1.3 points QoQ and 4.2 points YoY, and what would mark a second consecutive quarter of gross margin compression should it materialize. Despite the gross margin compression, operating margins are expanded, with Q3 expected to see this expansion accelerate. GAAP operating margin expanded 2.6 points QoQ and 2 points YoY to 22.7% in Q2, while adjusted operating margin was 39.1%, up 2.9 points QoQ but roughly flat YoY. Based on opex guidance for Q3, GAAP gross margin is expected to expand 6.8 points QoQ and 5.5 points YoY to 29.5%. Adjusted operating margin is expected to be 43.3%, up 4.2 points QoQ and just 1.6 points YoY, as Astera benefits from operating leverage with sequential revenue growth outpacing opex growth. GAAP net margin was 39.0% in Q2, up 13.0 points QoQ and up 12.3 points YoY, but it should be noted that this jump was driven largely by a $50.3 million income tax benefit rather than core operating performance, so the reported net margin overstates the quarter's underlying profitability improvement. Adjusted net margin was 37.2%, up a more modest 1.5 points QoQ but down 3.5 points YoY. EPS Beat Driven Largely by the Tax Benefit; Adjusted EPS Growth More Measured GAAP diluted EPS was $0.83, up 188.6% YoY, beating the $0.45 consensus estimate by 84.4%, again inflated by the tax benefit rather than purely operational strength. Adjusted diluted EPS of $0.80 provides a cleaner read, up 82.6% YoY, beating the $0.69 consensus estimate by a still-healthy 15.9%. This marked a marginal acceleration from 81.5% YoY growth in Q1. For Q3, Astera guided GAAP diluted EPS of $0.87 to $0.92, up 77% YoY. Adjusted EPS was guided to be $1.16 to $1.21, beating the $0.89 estimate by 33% and implying a sharp 60 point acceleration to 143% YoY. Cash Flow Margins Decline, Inventories and Accounts Receivable Surge Cash flow margins declined on both a QoQ and YoY basis in Q2, as inventories nearly doubled QoQ and accounts receivable also rose significantly, supporting the revenue inflection in Q3 and beyond. Operating cash flow was $87.7 million for a 22.3% margin, down 1.8 points QoQ and down 48.2 points YoY (Q2 2025's OCF margin was an elevated 70.5% on favorable working capital timing). Free cash flow was $67.2 million for a 17.1% margin, down 4.6 points QoQ and down 52.3 points YoY on the same basis. The sequential decline in cash flow margins alongside accelerating revenue is worth monitoring if cash flow margins continue to fall in Q3 despite the guided revenue acceleration. Astera’s balance sheet remains healthy with zero debt, and cash and marketable securities of $1.25 billion. Accounts receivable rose 42.8% QoQ to $192.5 million and inventories rose 89.1% QoQ to $113.8 million — both sizable sequential builds supportive of the sharp Q3 revenue ramp management is guiding to. Conclusion: In the past, Astera was largely tied to the number of servers and PCIe links being deployed. With Scorpio and COSMOS (and eventually optical), the opportunity is shifting to be more aligned with rising content per XPU. Beyond the dollar content opportunity, Astera is combining hardware and software to reduce latency, orchestrate workloads and improve GPU utilization; which are all things hyperscalers needed yesterday. The innovation coming out of this company is astounding if you think about it. To have the foresight to combine hardware and software to participate directly in the collective operations and workload orchestration is quite visionary, and I have a hunch this will create a strong runway for the company. This marks a meaningful shift in Astera’s model, one the market clearly did not pick up on tonight (which is why you have the I/O Fund). Regarding the reversal on the stock price after hours, this quarter, the market appears to be displaying tall poppy syndrome with strong networking reports. Even with an enormous beat/raise, my read is that the market is selling the report based on management not raising full year guidance. But given we like to buy low and sell high, we will try to take advantage of this as the market sorts itself out. Please note: The I/O Fund conducts research and draws conclusions for the company’s portfolio. We then share that information with our readers and offer real-time trade notifications. This is not a guarantee of a stock’s performance and it is not financial advice. Please consult your personal financial advisor before buying any stock in the companies mentioned in this analysis. Beth Kindig and the I/O Fund do not own shares in ALAB at the time of writing and may own stocks pictured in the charts. Damien Robbins, Equity Analyst at I/O Fund contributed to this analysis. Recommended Reading: Bloom Q2: Backlog is Growing Faster than Revenue at 166% YoY Growth Meta Q2: Selling Compute Sends Mixed Messages Silicon Motion Q2: Boot Drives Lead to Strong Report; MonTitan Still to Ramp The I/O Fund’s Top 20 Stocks for Q3 2026
AMD Q2: Venice Meets Helios in 2H26 and 2027
AMD’s Q2 revenue reached a record $11.5 billion, up 50% year-over-year, while data center more than doubled to $6.7 billion. As a percentage of revenue, data center is at 58% of total revenue up from 42% a year ago. The company guided for Q3 revenue of approximately $13 billion, implying 41% YoY growth and 13% sequential growth. Management now expects server CPU to grow more than 70% next year while total data center revenue will grow “well over 100%.” The difference is being driven by data-center AI, where Helios and the MI450 will grow materially faster than the strong CPU growth, stating: “And we do expect the overall data center business to be well over 100%. And the well over 100% comes because the data-center AI business is going to be well over 100% just given the strength of our strategic, customers, the ramp of Helios and all of the things that we've talked about.” Consider that two important, strategic product releases will arrive around the same time: the new Venice CPUs and the highly anticipated Helios MI400 Series. Venice CPUs “Demand Stronger than any Prior EPYC Generation” The headline above are important words as AMD’s EPYC generations are responsible for crushing Intel on the company’s home turf. Whether it was Rome, Milan, Genoa or Turin, the Zen architecture has an enviable, historic growth record. Yet, management stated Venice CPU demand is the strongest they’ve seen yet: “Customer demand for Venice is stronger than for any prior EPYC generation and we expect to continue growing market share across cloud and enterprise in the coming quarters.” Built on the new Zen 6 architecture and 2nm process technology, Venice is said to deliver 2x the performance per watt as leading x86 CPUs and up to 3.3x the performance per watt as leading Arm-based CPUs. Here is what was stated about the strong positioning of Venice: “What we're seeing is when we go into Venice, the workloads actually expand. So there are more workloads that are going to be run on the next generation of EPYC than are run on the previous generation. And that's what gives us the confidence to say that we can grow substantially ahead of the market, given the product positioning.” It was also stated that higher core counts will support higher ASPs: “We're seeing just very strong demand from an overall market standpoint on the ASP growth. We have ASP growth as we go to higher core counts. But as we go forward, you should expect both unit and ASP growth.” Helios to Ramp in 2H26 and 2027 – Let's GO! The best nugget on the call tonight was the clear indication that GPUs will overtake CPU growth rates next year. Personally, I cannot wait for the day that Lisa Su begins her opening remarks with commentary on GPUs instead of CPUs. I think that day is coming, if not with the MI400 Series then with the MI500s. Helios combines Venice CPUs, MI450 GPUs, and Pensando networking with RocM software to attack Nvidia’s margins (if we’re being blunt about it). The more spec-driven explanation is that Helios will deliver up to 15% more throughput at the same rack power and up to 30% more tokens per dollar than competing systems. Helio will ramp near the end of Q3, then become more meaningful into Q4 with management stating: “The Helios ramp is just starting at the end of Q3 and it'll be much more substantial in Q4. So that should give you the picture of we think Q3 is certainly a strong quarter as we look at the strong, very strong double digit growth going into data-center segment and in Q4 it will be higher than that.” From there, it’s expected Helios will sharply ramp in 2027: "And we believe the overall segment will grow by over 100%. So we'll more than double due to the data-center AI ramping. So we do see a very significant ramp into 2027.” When pressed, the CEO acquiesced that data center will "be well over 100%” – with it well understood that Helios will carry the growth above the 70% expected from CPUs: “And we do expect the overall data center business to be well over 100%. And the well over 100% comes because the data-center AI business is going to be well over 100% just given the strength of our strategic, customers, the ramp of Helios and all of the things that we've talked about.” Chiplets Reduce Yield Risk for the 2nm Ramp Both Venice and Helios depend on AMD successfully ramping advanced-node products at substantial scale, which leads to 2nm yields and wafer capacity as being central to the thesis. Although management acknowledged that bringing up large amounts of capacity on a new node is challenging, AMD’s chiplet architecture offers an advantage as only portions of the product that most benefit from the leading-edge nodes need to be manufactured on 2nm. Here is what was stated: “I think what makes our approach a little bit special and different is that because we're using the chiplet technology, we actually ramp in fewer wafers in the new node. And so that gives us the opportunity to. Again, we're working very hard on ensuring that we get the supply necessary to meet the very strong customer demand.” As Lisa Su stated, AMD “can ramp in fewer wafers in the new node,” which means less product uses the 2nm process. AMD Raises Addressable Market Forecast Notably, management raised the addressable forecast for its AI segments: Data center AI accelerators raised to $1.4T by 2030, up from $1T previous estimate for a 40% increase. Server CPUs estimate of $220B by 2030 compared to a previous estimate of $120B, or about 83% increase. Overall high-performance and AI compute raised to $2T by 2030 up from $1T, so basically doubled. Financials Revenue Growth Accelerates to 50% YoY, But Q3 Guide Points to Deceleration Ahead AMD reported its fastest YoY growth in four years at 50.1% as it reported Q2 revenue of $11.54 billion, a modest 2% beat to estimates for $11.31 billion. This marked a 12.3 point acceleration from 37.8% YoY growth in Q1, while sequential growth was 12.5% QoQ, a substantial improvement from prior seasonality of 6.6% and 3.3% QoQ in 2024 and 2025 off a larger base. For Q3, AMD guided for revenue of $13 billion, +/- $300 million, representing growth of approximately 41% YoY and 13% QoQ at the midpoint. While QoQ growth is expected to hold roughly steady, the 9.5 point guided deceleration to 40.6% YoY could be a point of concern for the market considering the timing just ahead of the Helios rack-scale ramp, with 1GW of shipments to OpenAI and shipments to Microsoft and other customers expected in 2H. Data Center revenue was the primary growth engine in the quarter, more than doubling YoY, while both Client and Embedded also contributed, though with more mixed trends discussed below. Segment Breakdown Data Center Revenue More Than Doubles YoY on EPYC and Instinct Strength Data Center segment revenue was $6.72 billion, up 107.3% YoY, a sharp 50-point acceleration from 57.3% YoY growth in Q1, driven by strong demand for AMD EPYC processors and AMD Instinct GPUs. Sequential growth stepped up to 16.3% QoQ, a 9 point acceleration from the 7.3% QoQ growth registered in Q1. As noted above, the Helios ramp remains on deck for 2H and 2027, setting a backdrop for strong potential Data Center growth; the first 1GW for OpenAI’s 6GW deal is slated for shipment in 2H, and the first 1GW deployment with Anthropic on deck for early 2027 along with other customer ramps. Data Center operating income was $2.10 billion for a 31.3% operating margin, rebounding from a softer 27.7% in Q1. For context, the year-ago quarter saw an operating loss of ($155 million) or a (4.8%) margin due to inventory charges tied to U.S. export controls on Instinct MI308 shipments to China. Client and Gaming Growth Decelerates Sharply as Gaming Weighs Client and Gaming segment revenue was $3.84 billion, up just 6.1% YoY, decelerating more than 16 points from 22.6% YoY growth in Q1 and over 66 points from the 72.8% YoY growth AMD posted in Q3 2025. Sequentially, the segment grew 6.5% QoQ, a rebound from the (8.5%) QoQ seasonal decline in Q1. Within the segment, Client business revenue was $3.06 billion, up 6.1% QoQ and 22.5% YoY, primarily driven by strong demand for AMD Ryzen processors. Gaming business revenue was $779 million, up 8.2% QoQ but down (30.6% YoY) due to lower semi-custom revenue. Client and Gaming operating margin was 15.2%, down less than a point sequentially and down 6 points YoY, as the weaker Gaming mix weighed on segment profitability. Embedded Segment Continues Its Return to Growth Embedded segment revenue was $977 million, up 18.6% YoY and up 11.9% QoQ, as demand strengthened across multiple end markets, marking a continuation of the segment's recovery after a stretch of YoY declines through much of 2025. Embedded operating margin was 39.5%, up less than a point sequentially and up 6.1 points YoY. Gross Margin Steady, Operating Leverage Continues to Build Gross margin is remaining relatively steady heading into Q3, while some signs of slight operating leverage emerge ahead of the Helios ramp, which could add a stronger tailwind to operating margin through 2027. GAAP gross margin was 53.8% in Q2, less than one point QoQ and 14 points YoY, though the YoY comp is skewed by export-related charge embedded in last year's result. Adjusted gross margin was 56.2%, up less than one point QoQ and up nearly 13 points YoY, and in line with management's guidance for approximately 56%. For Q3, AMD guided adjusted gross margin to remain steady at approximately 56%, up 2 points YoY. GAAP operating margin was 17.3%, up 2.9 points QoQ and up nearly 19 points YoY (again skewed by last year's export charge). Adjusted operating margin was 26.8%, up 2 points QoQ and up more than 15 points YoY; for Q3, AMD guided for adjusted operating margin at 27.9%, up 1.1 points QoQ and 3.7 points YoY, exhibiting a slight degree of operating leverage. GAAP net margin was 19.9%, up 6.4 points QoQ and 8.6 points YoY, aided in part by a $483 million gain on long-term investments recognized in the quarter. Adjusted net margin was 23.9%, up 1.8 points QoQ and 13.7 points YoY. EPS Growth Accelerates Sharply, Q3 a Bump in the Road GAAP diluted EPS was $1.38, up 156% YoY, comfortably ahead of the $1.05 prior estimate for the quarter, with a portion of the outsized growth stemming from the long-term investment gain referenced above. Adjusted EPS was $1.66, up 246% YoY, marginally edging out the $1.61 prior estimate and accelerating more than 200 points from 43% YoY in Q1. However, this triple-digit growth is not expected to persist next quarter, with Q3 serving as a bump in the road ahead of the Helios ramp. Current estimates point to GAAP EPS of $1.34, up 79% YoY, while adjusted EPS is expected to be $1.86, up just 55% YoY. Growth is expected to begin reaccelerating in Q4 and Q1 2027 as Helios ramps: adjusted EPS is seen at $2.63 and $2.83, respectively, for growth of 72% and 107% YoY. Cash Flow Margins Pull Back, Purchase Commitments Rising Ahead of Inventories AMD’s cash flow margins showed a rather steep sequential contraction, primarily driven by stronger accounts receivable growth in the quarter. Interestingly, AMD also is showing a sharp increase in unconditional purchase commitments, primarily for wafers, substrates and components, though without this sharp growth being reflected yet in inventories. Operating cash flow was $2.37 billion for a 20.5% margin, down sharply from a 28.8% margin in Q1, though up modestly from 19.0% in the year-ago quarter. The QoQ decline was driven by a large working-capital swing, most notably a $1.25 billion increase in accounts receivable. Free cash flow was $1.56 billion for a 13.5% margin, down roughly 11.5 points QoQ from 25.0% in Q1 and down modestly from 15.4% in the year-ago quarter. Capital expenditures more than doubled sequentially to $808 million from $389 million in Q1, compounding the pressure from the working-capital build to pull free cash flow margin lower. Cash, cash equivalents and short-term investments totaled $13.11 billion, while total debt was roughly flat at $3.23 billion. Accounts receivable rose approximately 20.7% QoQ to $7.28 billion, a notably faster pace than revenue growth, while inventories rose more moderately, up about 5.3% QoQ to $8.47 billion. The lack of inventory growth ahead of the Helios ramp is interesting especially when factoring in the strong growth in purchase commitments AMD has been seeing over the last few quarters. Primarily for wafers, substrates and components, AMD’s purchase commitments more than doubled QoQ in Q1 to $25.66 billion, and increased further to $30.28 billion in Q2, with $17.39 billion due in the remainder of 2026. This indicates AMD is preparing for a sharper ramp in volumes heading into 2027. Conclusion: In the coming months, Venice and Helios will converge at the same time. What could be better than one major catalyst? Two major catalysts. For about six years now, I have called AMD The Dark Horse as it’s not a company or a management team that should be underestimated. There could always be something outside of AMD’s control, like securing enough HBM4, but otherwise this is not a company I would bet against. Quite the opposite. Please note: The I/O Fund conducts research and draws conclusions for the company’s portfolio. We then share that information with our readers and offer real-time trade notifications. This is not a guarantee of a stock’s performance and it is not financial advice. Please consult your personal financial advisor before buying any stock in the companies mentioned in this analysis. Beth Kindig and the I/O Fund own shares in AMD at the time of writing and may own stocks pictured in the charts. Damien Robbins, Equity Analyst at I/O Fund contributed to this analysis. Recommended Reading: Meta Q2: Selling Compute Sends Mixed Messages Silicon Motion Q2: Boot Drives Lead to Strong Report; MonTitan Still to Ramp Astera Labs Q2: Scorpio is Locked and Loaded The I/O Fund’s Top 20 Stocks for Q3 2026
AI Capex to Hit $1 Trillion – And Estimates Are Still Too Low
Analysts have persistently underestimated Big Tech AI spending, with guided 2026 spending now over 150% higher than initial estimates. JP Morgan and Goldman Sachs are now forecasting AI capex of $1 trillion or more in 2027, and trillions more in the coming years. Several Big Tech names continue to point to undercapacity compared to demand. Big Tech capex is the driving force behind the AI infrastructure trade, yet Wall Street has repeatedly underestimated the sheer scale of the buildout. Looking back to 2024, actual spending exceeded early forecasts by roughly 25%, and then exceeded forecasts by a whopping 62% in 2025. Currently, in 2026, the guidance for $732.5 billion is now 158% higher than forecasts issued two years ago. Last week, the market received confirmation that Microsoft, Meta, Amazon and Google are expected to deploy approximately $432 billion in the second half of 2026 alone. This means the flashy forecast that capex will reach $1 trillion in 2027 is now firmly within reach. Because of the outsized increase in 2026, capex will need to grow by only 36.5% next year – meaning, Big Tech could cut its capex growth rate by more than half and still reach the $1 trillion threshold. For investors tracking this trend, capex-related selloffs have created opportunities to generate alpha in key suppliers. Below, we review the single most important line item to the AI trade and what it’s communicating regarding the strength of the AI market in the coming months. AI Capex Estimates Have Consistently Underestimated Big Tech Spending Historical trends offer strong evidence that actual capex spending far exceeded analyst estimates. For example, we noted that analysts initially expected Big Tech capex to come in at around $200 billion in 2024, or growth of 30% YoY. This ended up being well below actual capex outlays, which came in at just over $250 billion, or growth of 62% YoY, more than double initial growth expectations. In September 2024, initial estimates from Goldman Sachs placed 2025 Big Tech capex at $253 billion, before moving to $280 billion in early 2025. Estimates began to move up to $308 to $325 billion by mid-2025, yet Big Tech would end 2025 at $410 billion, coming in 62% above the initial estimate as growth accelerated to 64% YoY. Initial expectations for 2026 of $284 billion — just 12% YoY growth versus the initial 2025 figure of $253 billion — would prove laughably low. By November 2025, 2026 capex forecasts had surged to $527 billion, an 86% increase over early estimates. Goldman Sachs data shows analysts repeatedly raising AI hyperscaler capex forecasts. Estimates for 2025 increased from approximately $253 billion to nearly $394 billion, while 2026 forecasts surged from about $284 billion to more than $525 billion. The trend highlights growing expectations for AI infrastructure and data center investment. Source: FactSet, Goldman Sachs Research Where Big Tech Capex Stands After Q2 2026 Capex spending in the first half of 2026 already hit $301 billion across Microsoft, Meta, Amazon and Google, with updated guidance from the four pointing to annual capex of $732.5 billion this year. For comparison, this latest figure is 39% higher than expectations from Nov. 2025, and 158% higher than expectations from Sept. 2024. At $732.5 billion, 2026 capex growth would be 79% YoY, a 15 point acceleration from 2025, and notably 6.5X higher than early forecasts off a much larger base than was previously expected. It also implies a strong acceleration into 2H, with ~$432 billion in spending on deck over the next two quarters. Here is where Big Tech’s 2026 spending stands so far in 2026, and their guidance for the full year: As seen in the chart above, capex intensity on a dollar basis is increasing substantially in into 2H. All four are currently expected to see 2H spending between $27 to $39 billion higher than 1H, adding more than $10 billion to quarterly capex bills. Sign up for our free newsletter where our next article will discuss what this capex intensity means for Big Tech’s cash flows heading into 2027. AI Capex Could Reach $7.6 Trillion Between 2026 and 2031 Based on current guidance of $732.5 billion, Big Tech capex would need to rise by 36.5% YoY to hit $1 trillion next year, representing a rather stark deceleration from 2026’s guided 79% growth. In dollar terms, Big Tech would need to add just $267.5 billion in 2027 to reach $1 trillion, less than the $332.5 billion increase guided for 2026. At present, current consensus estimates point to Big Tech spending around $934.5 billion in capex in 2027, or only 7% below the $1 trillion threshold with sixteen months to go. Multiple banks are already penciling in capex to easily surpass $1 trillion next year, and commentary from management teams and signals across the supplier ecosystem suggest this is easily doable. The table displays consensus 2027 capital expenditure forecasts for the four largest hyperscalers. Google is expected to spend $284.8 billion, followed by Amazon at $256.5 billion, Microsoft at $207.6 billion, and Meta at $185.6 billion. Combined, the companies are projected to invest $934.5 billion in 2027, putting Big Tech AI and infrastructure spending within reach of the $1 trillion milestone. Source: MarketScreener For example, JP Morgan currently expects total hyperscaler capex to rise from its estimate of $800 billion in 2026, which may include other players outside of the big four tech companies, to $1 trillion next year. Goldman Sachs is forecasting capex of $1.01 trillion in 2027, rising 32% from its 2026 estimate of $765 billion; overall, the firm is forecasting an astronomical $7.6 trillion in cumulative AI capex from 2026 to 2031, with capex hitting nearly $1.64 trillion by 2031 – exceeding the GDP of many smaller countries. This infographic summarizes Goldman Sachs' baseline estimate for AI-related capital expenditures from 2026 through 2031. Total annual AI capex is projected to grow from $765 billion in 2026 to $1.64 trillion in 2031, with cumulative spending reaching $7.6 trillion. Spending is divided across three categories: compute, data centers, and power infrastructure, with compute representing the largest share throughout the forecast period. The projections illustrate the scale of investment expected to support continued AI infrastructure expansion. Source: Goldman Sachs Global Institute, Goldman Sachs Global Investment Research Hyperscalers Continue to Face AI Capacity Constraints Overall, the key themes delivered in Q2’s earnings reports across Big Tech underscore future capex increases as a rather necessity, with demand continuing to outpace capacity delivered as supply constraints layer into the picture. Alphabet explicitly noted that it expects capex to increase “significantly” in 2027, explaining that despite its substantial capacity investments of the past three years, demand still outpaces these investments and that it continues to be supply constrained. mid When asked about the risk of overcapacity on its earnings call, Microsoft said the current “situation is obviously that demand exceeds available supply in a sort of relatively extreme moment.” This indicates that Microsoft could be planning substantial capex increases into 2027 and beyond as it expects to double its total data center capacity from FY2025 to FY2027. Even after adding $20 billion to its capex outlook to account for rising memory costs, Amazon CEO Andy Jassy said AWS “will still not have enough capacity to meet all the demand we have in 2026, and I believe this dynamic will also be true in 2027 too.” Similar to Microsoft, Amazon also expects to double its data center power capacity by the end of 2027 versus 2025 as capacity reservations for 2028 enter the mix, implying capex intensity is likely to remain elevated as its data center footprint gets built out Meta is floating the idea of selling “excess capacity” to third parties. However, the company still says “our current plans are geared towards maximizing 2026 and 2027 capacity," signaling that the firm does not expect to slow its spending in the near term. Higher Than Expected Capex Translates to Supplier Sales Revisions As analysts have underestimated the scale of Big Tech capex, we can see that subsequent capex guidance has led to huge jumps in sales expectations for suppliers. Nvidia provides the cleanest example of this. The chart tracks analyst estimates for Nvidia's revenue in the next fiscal year from mid-2025 through August 2026. Forecasts increase consistently over the period, rising from approximately $245 billion to $561.5 billion. Several sharp upward revisions occur in early and mid-2026, reflecting growing expectations for Nvidia's AI-related revenue growth. The trend highlights strengthening demand for AI infrastructure and continued optimism surrounding Nvidia's position in the AI semiconductor market. Source: YCharts Nvidia’s revenue estimates for FY2027 now sit near $561.5 billion, a 123% jump compared to estimates at the beginning of Q2 2025. The largest jump pictured comes in early February 2026, which corresponded with Google, Amazon and Meta releasing their capex guidance for 2026. The combined midpoint of capex guidance among these names was $505 billion, or around 36% higher than the $371 billion analyst had modeled. Nvidia’s 2027 revenue estimates would then rise by approximately $90 billion in one week, or an over 27% increase. Following higher capex, sales estimates of Broadcom and AMD, also led to strong growth in the following quarters. Over the course of 2026, the next fiscal year estimates for Broadcom and AMD’s sales have increased by 32% and 29%, respectively. Additionally, AMD has raised its server CPU market CAGR forecast to over 50% from now through 2030, up over 2.7X from its 18% CAGR forecast in November 2025. We can also see downstream markets, such as memory and networking, benefiting immensely as capex surpasses expectations. Higher Capex Foreshadowed Memory Boom; Networking Boom The memory boom is directly related to the higher capex we’re seeing in 2026 as memory content is rising 2X in AI systems and 4X next year, accounting for more than half of AI chip component costs. Networking also sits downstream as another key beneficiary of rising capex, with both component markets showing a disproportionate flow-through with growth far outpacing capex growth. Looking back to 2023, the memory market bottomed at $89.9 billion, declining (36%) YoY. In 2026, spurred by increasing content in GPU systems and supply shortages driving prices significantly higher, the global memory market is forecast to hit $889.3 billion – or nearly 10X growth in just three years. Current projections for 2027 estimate the market hitting $1.28 trillion next year, or a 94% CAGR from 2023. Not only is this above current capex estimates for 2027 at $1.01 trillion, but it also outpaces the four-year capex CAGR of 61% by 33 points. Networking is more fragmented than memory, yet if we look at 2025-2027, we see that optical transceiver growth far outpaced capex growth. From 2025 through 2027, shipments of >800G transceivers are forecast to rise at a 104% CAGR, versus a 57% CAGR for capex, while certain subsegments of the optical networking landscape are projected to see more than 4X growth next year to over $30 billion next year. This illustrates the importance of identifying the beneficiaries that are downstream from capex spend. Conclusion Top Wall Street forecasters are now eyeing more than $1 trillion in AI capex for 2027. Given the expected growth rates from giants like Nvidia, Broadcom, along with AMD’s forecasts for the CPU market forecast, this level of spending appears easily obtainable. The real question is how far Wall Street will underestimate the AI buildout this time. However, the most important question for investors is who are the beneficiaries? If we look at previous years, we see that increased capex was correlated to a chip boom (Nvidia, Broadcom), a memory boom (Micron, SK Hynix) and significant gains across lesser-known networking names in the year following an acceleration in spending. Astonishingly, many high-profile hedge funds and Tech ETFs took the easier path with their AI allocations by concentrating in the relative laggards of the AI buildout, which is Big Tech. This creates immense opportunity cost when a tech bull market is led by memory and networking winners, and meanwhile, tech portfolios with significant AuM see their tech positions sit out the bull run. In sharp contrast, the I/O Fund has identified some of the strongest beneficiaries of the AI trade over the past several years – leading to a performance that would rank #1 if we were a hedge fund and #3 if we were a tech ETF. Our latest 90-page Top 20 AI Stocks for Q3 2026 report offers investors a comprehensive deep dive into the AI stack, mapping out the companies best positioned to capture capex spend. Previous winners identified in the report include Bloom Energy up 1150% since our first entry, Micron up 210% since our entry a few months ago, a lesser-known networking stock up 370% since November. All of this from the team that first identified Nvidia as an AI stock in 2018, up 6700% since our first entry. Don’t miss out on the AI trade. Subscribe Now. Please note: The I/O Fund conducts research and draws conclusions for the company’s portfolio. We then share that information with our readers and offer real-time trade notifications. This is not a guarantee of a stock’s performance, and it is not financial advice. Please consult your personal financial advisor before buying any stock in the companies mentioned in this analysis. Beth Kindig and the I/O Fund own shares in NVDA, MU at the time of writing and may own stocks pictured in the charts. Leo Miller, AI and Semiconductor Investment Writer at I/O Fund, contributed to this analysis. 👉🏻 Share with a Fellow Investor
Help someone else benefit from this insight. Recommended Reading: Token Growth is Surging – Here Are the Beneficiaries AI Token Demand is Shattering Forecasts Nvidia and Google Are Crowding TSMC’s N3 Node – Can Intel Fill the Gap? Intel vs TSMC: How CoWoS Packaging Constraints Could Create an Opportunity for Intel Foundry
Lam Research: Deposition and Etch Intensity Rising with More Complex Chips
TSMC’s Q2 earnings report and our 3nm thematic both came to the same conclusion: advanced packaging and advanced node capacity is increasingly overwhelmed, and the primary method to find relief comes down to new cleanroom space, or more WFE spending. TSMC boosted its 2026 capex by $8 billion in Q2 to $62 billion, with Lam positioned downstream as a key WFE beneficiary. Lam’s earnings calls in Q3 and Q4 have highlighted one major upcoming growth driver lying within one of its smaller segments, NAND. Back in Q3, management noted that their previously-forecast $40 billion in NAND equipment spending is now arriving at an accelerated rate as data center bit mix increases, creating dual tailwinds for growth via tool upgrades and new greenfield builds: “We said in early 2025 that roughly $40 billion in conversion spending would be required over several years to enable existing NAND installed wafer capacity to produce devices with more than 200 layers. We now anticipate that this conversion will be pulled forward with the majority of spending occurring before the end of calendar year 2027.” One of Q4’s key reveals leaned into that $40 billion figure and Lam’s served addressable market (SAM) in NAND, as the upgrade cycle from 200-layer to 300-layer and eventually 500-layer NAND could double Lam’s NAND SAM per wafer on a larger installed base (hinting that the $40 billion upgrade cycle will get even larger). However, NAND is not expected to be the growth driver for Lam in 2027, with management placing it as the third fastest next year, following DRAM and Foundry. More on this below. Recapping Q3’s Accelerated $40B NAND Forecast It’s important to touch upon Lam’s commentary from Q3 surrounding the recent shift in memory and storage architectures towards adopting NAND via QLC-based enterprise SSDs, as this was central to management pulling forward their NAND conversion spending forecast. It’s also important as Lam supplies the major memory players in Micron, SK Hynix, Samsung and Kioxia. For context, in early 2025, Lam estimated that the NAND industry would need $40 billion in conversion spending over several years to enable 200+ layer device manufacturing, which supports most enterprise grade QLC SSDs. In Q3, management accelerated that forecast, stating they now expect the majority of that spending to occur prior to the end of calendar year 2027, or the next six quarters. Primary drivers of this are manufacturers who underinvested in NAND over the last few years, who now must either convert/upgrade old tools to 200-layer for enterprise SSD production, or build new greenfield fabs for 200-layer from the ground up. Conversions or upgrades were pointed out as the quickest way to reach 200-layer capabilities, but management emphasized that greenfield capacity is necessary to get the higher growth needed to meet demand – greenfield was stated to be “materializing as a significant opportunity now on the revenue side for Lam and looks to be so for quite some time.” Within Q3’s call, analysts also implied that there could be a disconnect between the $40 billion in spending and Lam’s NAND growth, which could be starting to flow through in FQ4 as NAND revenue more than doubled sequentially, up 118% QoQ to ~$977 million. Looking ahead, this disconnect appears to exist, as consensus estimates currently only model Lam to generate cumulative NAND revenue of $6.78 billion through the end of 2027, including FQ4’s $977 million. This would represent roughly 17% share of the $40 billion in spending, which sits below Lam’s estimated deposition and etch share of 25%. Assuming Lam can capture 25% of that $40 billion, in line with its estimated market share, this would project $10 billion in cumulative NAND revenue, or $3.3 billion/50% upside over current estimates. If Lam can capture a larger share of spending, such as 33%, as its 3D memory tools help customers maximize yields (management pointed out that one customer switched to its Kiyo tool mid-production ramp due to higher yields), this could project Lam capturing $13.2 billion in NAND spending, or nearly double current estimates. Capturing this NAND-driven opportunity will require strong execution, but Lam has the product suite and expertise in NAND to do so, along with the visibility of working with customers several years in advance of technologies reaching production. NAND SAM to Double with 500-Layer Devices, Upgrade Cycle Growing While the accelerated $40 billion NAND spending is a positive for Lam, the bigger picture arising in Q4 was management expecting its NAND SAM per wafer to double from 128-layer devices to 500-plus layer devices, as stack sizes increase and complexity rises. It should be noted that this is a much longer-term opportunity for Lam — 300-layer NAND is currently in development, with Kioxia expected to reach mass production of its 332-layer BiCS10 in 2027 with 500-layer further in the future. However, the progression from 200-layer to 300-layer and ultimately 500-plus-layer NAND means a rather continuous upgrade cycle for NAND tooling, with BofA analyst Michael Mani questioning about how this progression would unfold relative to the $40 billion tied to the 200-layer upgrade. Lam stated that each new cycle builds off of a larger base of installed tools, hinting that the upgrade cycle could get bigger with each new generation: “Whatever has been upgraded to 200 layers eventually has to migrate to 300 layers and above, which could trigger another wave of spending for NAND where are we in that kind of second phase of upgrades? And is there a way to kind of contextualize how big that opportunity could be relative to the initial $40 billion upgrade opportunity you saw in the last couple of years? Timothy Archer, President and CEO “Most of that $40 billion we had previously said would likely occur — and upgrades would likely occur before the end of 2027 but then as you pointed out, it kind of all starts again. But the key is since greenfield additions have been made in that period of time, the next time it rolls through, you go from 200 to 300 plus or 400 plus, it's an even bigger installed base. And so while we haven't quantified that, but it's a good action item for us to get to you into the future. But you can imagine that as you go, we've described from 200 to 300 to 400 to 500 layers, I made — I said that our SAM will double from the 200-plus layer to the 500-plus layer on a per wafer basis. And that's a combination of longer process times to process the taller stacks plus additional tools that get added in to deal with all the complexity of all that stacking.” The longer process time could be the cornerstone for NAND SAM doubling – all else equal, longer process times imply lower output per month, so in order to maintain output at similar levels to prior technologies (or even increase output), more chambers and deposition and etch tools are needed. This suggests the upgrade cycle is more continuous in nature, and the doubling of its NAND SAM on the path towards 500-layer devices offers Lam a solid foundation for growth over the next couple of years. However, management still listed NAND as the third fastest growth driver next year, behind DRAM and Foundry/logic, with a few reasons explaining this split – DRAM capex is outpacing NAND capex, with previous expectations for it to be ~3X higher in 2026 at roughly $60 billion, the shift to HBM4 driving more content, and Advanced packaging and rising chip complexity driving Foundry growth, whereas the NAND cycle beyond 200-layer is longer-term in nature. HBM4 Requires More Equipment, Driving Content Growth through 2027 On the topic of 3D stacked memory, HBM cannot be ignored, as the shift towards HBM4 and 4E, kicking off with Nvidia’s Rubin later this year and ramping through 2027, presents an opportunity for Lam to increase its content, layering into growth. As management commented in Q3: “When you look at HBM3 going to HBM4 with the higher layer count, I think 50% higher. Is there a way to look at what your content uplift is for 100,000 wafers or something as HBM3 goes to HBM4 or 4E? Douglas Bettinger, CFO Yes, clearly, it goes up. We haven't given specific numbers around it. But obviously, the higher stack requires — the higher stack requires more equipment.” This comment was reiterated in Q4, though management put more pen to paper on the tooling side, explaining that its newest etch tool, Akara, was seeing growing momentum in advanced DRAM, supporting a view for its installed base to double again YoY in 2027. Additionally, Lam is leaning on its product and platform strength in co-optimizing tooling processes to deliver improved yield and cost savings, which could become increasingly important to customers as bit costs rise with HBM4. Lam explained that DRAM customers are adopting its VECTOR hard mask deposition platform and co-optimized conductor etch, which could improve transistor performance and yield with up to 20% cost savings. Structural Opportunities to Outgrow WFE, SAM Accelerating Faster than Anticipated This quarter, Lam stated that it is continuing to approach its SAM target of the high-30% range faster than anticipated, underpinned by increasing complexity in chip architectures in NAND and DRAM, as well as increasing complexity in advanced nodes (such as 2nm and gate-all-around) and packaging. In the Q&A, management hinted that its current SAM is estimated to sit around 36% of the WFE market, suggesting it is almost to its target level. When factoring in Lam’s $10 billion raise to its 2026 WFE forecast to the low $150 billion range, in line with Q3’s commentary for upside bias from $140 billion, this would project its SAM to be roughly $54 billion this year. Looking ahead to 2027, Lam foresees an “extraordinary” setup for WFE growth, as customers continue to offer unprecedented long-term visibility into equipment demand while actively working to secure orders to fill incremental cleanroom space. Assuming roughly 30% growth in the WFE market in 2027, a bit faster than current industry estimates for 22% growth, this would project the WFE market to reach $195 billion, and Lam’s SAM to hit $72 billion with a slight step up to 37%. Supporting this SAM expansion is the NAND cycle, upgrades to HBM4 and expansion of advanced node and packaging capacity at TSM, among other factors, with Lam actively investing in R&D labs for new product development to further accelerate its SAM expansion. Such a growth forecast for WFE and this SAM, which would be ~33% for Lam from $54 to $72 billion, sets up a strong picture for continued growth heading into FY28 (starting July 2027). Advanced Packaging Growth Raised to 70%+ from 50% Visibility into Advanced Packaging revenue is cloudy, as Lam does not break this out separately as a line item but instead keeps it under Foundry revenue. However, management raised its advanced packaging growth forecast by 20 points, now expecting 70%+ growth in calendar 2026, up from 50% guided in Q3, suggesting an acceleration over the next two quarters. Management added that the longer-term opportunity within advanced packaging is “even more compelling as AI performance will increasingly depend less on transistor density scaling and instead on integrating more chiplets, more HBM stacks and greater memory bandwidth within a single package.” Management added that long-term growth is harder to predict as adoption of newer technologies is occurring across the landscape. This 70%+ growth in advanced packaging suggests it could potentially emerge as a key factor in helping drive a reacceleration in Foundry growth (as discussed below). Growth is emerging across the packaging landscape, from HBM and CoWoS to 2.5D packaging to panel-level packaging, with Lam expecting to lead that transition as future AI chip packages approach 9X reticle sizes, 3X larger than current chips. For another point supporting this growth, TSMC is stepping up packaging-related capex ~50% YoY to roughly $9.3 billion this year. Financials Revenue to Accelerate to 20% QoQ, 52% YoY Next Quarter Lam Research's FQ4 2026 (June quarter) revenue was $6.72 billion, up 15.1% QoQ and 30.0% YoY, accelerating from 23.8% YoY growth in FQ3 2026 and coming slightly ahead of management's guidance of $6.60 billion. This marks LRCX's third consecutive quarter of YoY growth acceleration. Looking to FQ1 2027, this acceleration is set to continue, with Lam guiding for September quarter revenue to be $8.1 billion at midpoint. This would represent a more than five point acceleration to 20.5% QoQ, or $1.4 billion in dollar terms, while YoY growth would accelerate 22 points to 52%, well above growth rates seen in FY26 and representing the fastest growth since early 2021. For FY26, revenue was $23.23 billion, up 26.0% YoY, ahead of the 23.7% YoY growth reported in FY25. Initial estimates for FY27 point to a robust growth year ahead for Lam, currently projected to be 49.8% YoY to $34.79 billion, suggesting Q1’s growth pace is maintained throughout the year. Systems Breakdown: NAND More than Doubles QoQ, Logic Rebounds Systems revenue (Lam’s equipment sales) grew 13.9% QoQ and 23.6% YoY to $4.25 billion, a minor acceleration from 11.1% QoQ and 22.9% YoY in FQ3. Within Systems, Foundry remained the largest end market at 44% of the mix, though growth has decelerated sharply, coming in at 4.6% YoY in FQ4 to $1.87 billion, versus 38.3% YoY in FQ3 and 115.6% YoY two quarters ago. DRAM was mixed, declining (3%) QoQ after two consecutive quarters with sequential growth above 30%, though revenue more than doubled YoY, up 103% to $977 million. NAND (Non-Volatile Memory or NVM) revenue more than doubled sequentially, up 118.3% QoQ to $977 million (roughly matching DRAM at 23% of Systems revenue), though YoY growth was just 5.3%. Logic/IDM/Other, the smallest bucket at 10% of Systems revenue, showed a sharp recovery in FQ4, rising 62.7% QoQ and 76.6% YoY to $425 million after five straight quarters of YoY declines. For FY2026, Systems revenue rose 29.5% YoY to $14.89 billion, with Foundry’s fiscal 1H strengths leading growth, up 55.4% YoY to $7.99 billion. DRAM followed with 36.5% growth to $3.32 billion, while NAND was roughly flat at $2.43 billion. Logic/IDM/Other was athe lone segment to see a (23.5%) YoY decline to $1.13 billion. Customer Support Revenue Accelerates, Early Innings for AI-Driven Services Offerings Customer Support (CSBG) revenue rose 17.1% QoQ and a much stronger 42.6% YoY to $2.47 billion, supported by record upgrade revenue, while spare parts remained consistent with strong FQ3 growth. This also marked a sharp acceleration from 6.2% QoQ and 25.3% YoY in FQ3. Lam is taking a unique approach within its Customer Support business to further drive growth, leveraging AI via Equipment Intelligence and Dextro cobots to help customers accelerate ramp timelines and improve yields. Management outlined the two as future growth drivers, stating that many of its Equipment Intelligence and Dextro solutions for NAND are now expanding to DRAM, opening up additional service revenue opportunities over the next two quarters. Management emphasized that it is still the “very early stages” of a multi-year rollout for these offerings across its installed base, suggesting the two could layer in to growth over the coming years. Additionally, high utilization across the industry is driving higher consumption of spares and services, two key factors in helping CSBG maintain a faster growth rate through FY27 and into FY28. Operating Margin Reaches Record High on Pricing, Mix Margins expanded slightly across the board, with some signs of operating leverage appearing as opex growth lagged revenue growth by more than 16 points; however, the bigger picture is that gross margins reached the highest level in nearly 20 years while operating margin reached a record high. GAAP gross margin was 51.7% in FQ4, up 1.7 points YoY and 1.9 points QoQ, marking the company’s highest gross margin since 2007, with management attributing the strength to pricing, operational and scale efficiencies and mix. GAAP operating margin was a record high 37.4%, expanding 3.7 points YoY and 2.4 points QoQ. Adjusted operating margin was 38.4%, up 4 points YoY and 3.4 points QoQ, coming in well above the 36.5% guided for the quarter. For FQ1, management guided for adjusted operating margin to strengthen further to 39.5%, +/-1%. GAAP net margin was 33.9%, up less than a point YoY and 2.6 points QoQ. Management provided a quick view on the long-term vision for margins as its SAM progresses towards the high-30% range of WFE: “we intend to drive gross margins to the mid-50% level and operating margins to the mid-40% level over the next several years.” UBS’ Tim Arcuri prodded about the timeline for when Lam expects to reach this margin profile, with management standing firm on the multi-year timeline: “How long will it take for you to move that up? Is it like a revenue thing? Or is it a time thing? Douglas Bettinger, EVP and CFO A little bit of both, Tim, honestly, right? Part of it is scale and scope and revenue growth. Part of it is new product introduction and getting fairly paid for the value we're delivering. I expect, Tim, this is over the next several years that we'll continue to drive it on an annual basis for sure, but it's going to take several years, I think, to get to those levels, Tim.” EPS Growth to Accelerate Sharply in FQ1 Despite the acceleration in revenue and expansion in margins, FQ4 Lam saw Lam deliver its slowest quarterly EPS growth of the fiscal year; however, Q1 is expected to see a sharp 35 point acceleration for adjusted EPS. FQ4 GAAP EPS was $1.81, up 34.6% YoY, while adjusted EPS came in at $1.82, up 36.5% YoY, decelerating slightly from the 40-42% growth delivered in FQ3. For FQ1 2027, management guided for adjusted EPS to be $2.15, which would represent an acceleration to roughly 70% YoY, versus the $1.26 adjusted EPS reported in FQ1 2026. For FY26, GAAP EPS was $5.76, up 38.7% YoY, and adjusted EPS was $5.82, up 40.8% YoY. Initial estimates for FY27 show EPS growth roughly matching revenue growth, implying minimal margin expansion through the year – GAAP EPS is projected to grow 52.4% YoY to $8.77 while adjusted EPS is estimated to grow 48.1% YoY to $8.62. Cash Flow Margins Drop Against a Tough Comp Cash flow margins were down quite substantially YoY, as FQ4 2025 presented a tough comp that appears to have been inflated by favorable working-capital timing rather than representing a sustainable run-rate. Operating cash flow was $1.46 billion in FQ4 for a 21.7% margin, down from 49.4% a year ago but up from 19.5% in FQ3. Free cash flow was $1.27 billion for an 18.9% margin in FQ4, down similarly from 46.1% a year ago but up from 13.9% in FQ3. For FY26, operating cash flow totaled $5.86 billion for a 25.2% margin, down from a 33.5% margin in FY25. Free cash flow was $4.89 billion for a 21.1% margin, down from a 29.4% margin, with declines driven by the outsized FY25 working-capital benefit rather than any deterioration in underlying cash generation. Cash and equivalents totaled $5.60 billion at quarter-end, while total debt was $3.73 billion, down from $4.48 billion a year ago. Inventories rose $276 million QoQ to $4.3 billion, with management noting that they “clearly are going to need to build inventory as we get into revenue growth like we're seeing but we'll also be focused on efficiency and making sure we're managing the cash for the company well.” Conclusion Lam is positioned to help improve yields in a market constrained for years to come, which is DRAM and HBM. The market is not only growing in size but complexity as HBM4 arrives, driving increased content opportunities for Lam as it holds an edge as its co-optimized tools can offer up to 20% cost savings for customers as bit costs rise. On the NAND front, the $40 billion in accelerated spending remains a key tailwind for Lam over the next six quarters. The larger trend and opportunity in play lies in the path towards 500-layer devices, which management believes could double its NAND SAM per wafer, creating significant upgrade cycles off larger installed bases. Fundamentally, Lam is ticking many boxes as FQ1 was guided to see the company’s fastest QoQ growth rate in more than five years at 20%, with operating margin continuing to advanced to record levels. Please note: The I/O Fund conducts research and draws conclusions for the Fund’s positions. We then share that information with our readers. This is not a guarantee of a stock’s performance. Please consult your personal financial advisor before buying any stock in the companies mentioned in this analysis. Damien Robbins, Equity Analyst at I/O Fund contributed to this analysis. Recommended Reading: Seagate Q4: Price per Exabyte to Double While Cost Per TB Falls Marvell: Strong Interconnect Growth, but Really an FY28 Story Corning: Glass Manufacturing Powerhouse Pivoting Hard into AI Networking Credo: Reliability Leader Aggressively Moves into Optics
Silicon Motion Q2: Boot Drives Lead to Strong Report; MonTitan Still to Ramp
Silicon Motion is transitioning from being a consumer-focused NAND controller supplier to a more broader AI storage company, resulting in its third quarter of 100% YoY revenue. In our Top 20 report, Silicon Motion was listed third behind heavyweights Micron and SanDisk, yet it carries a higher allocation than both in our portfolio. Oddly enough (and quite exciting too) the bigger AI-related catalyst for SIMO will not meaningfully ramp until 2027. Instead, SIMO is gaining share in traditional mobile and client SSD markets, along with strong growth in boot drives including Ferri automotive storage. Whereas the NAND shortage would typically be a headwind for SIMO as the company is heavily exposed to smartphones and PCs, the shortage is instead allowing SIMO to gain share as NAND manufacturers are outsourcing controllers on these end markets. This resulted in eMMC and UFS controller sales to rise 15% to 20% QoQ and nearly double YoY, even with smartphone volumes declining. Client and enterprise SSD client controller sales increased 50% to 55%, with market share gains in PCs. If you know our team well, then by now you are likely wondering – why is the I/O Fund holding a stock exposed this heavily to mobile and PCs? The bigger picture is that the NAND shortage is surfacing new beneficiaries. Silicon Motion can benefit from scarcity on the consumer side right now while preparing to ramp for much larger opportunities on the AI side next year. Boot drives especially are emerging as a major AI catalyst, with additional products preparing for growth in 2027-2028 – detailed for you below. Boot Drives are the “Crown Jewel” Boot drives are the bigger story this quarter as Ferri automotive doubled sequentially to roughly 30% of revenue, up from only 4% of revenue a year ago. This offers additional evidence that SIMO is shifting from a consumer-based controller supplier to more of an AI supplier. On the Q2 call, it was stated its boot drives wins have extended to include Google’s TPUs, alongside Nvidia’s DPUs, plus telecom customers and server makers. When asked about the Nvidia partnership, the CEO stated: “We do have a pretty large share for BlueField supply for the boot drive, so we're very happy when they ramped up in the second half this year.” You can read more about the Nvidia partnership here. The CEO also stated the number of boot drives per server rack can exceed 30 to 40, while capacity per drive is also increasing. This means both unit volumes and content per rack will scale as new AI systems deploy. Here is what he stated: “As for the rest of the other sector, like DPU, like TPU, NPU, like a PCIe switch, like a NVLink switch, like Ethernet switch, there is a boot drive they need. Today they favor DRAM-less, because the cost is better without DRAM. We have a specific security support and performance also very good. As long we can secure the NAND supply, that portion is really our crown jewelry to grow in the next few years. We do see the demand is stronger because, see, the boot drive number per server rack, that's a huge. That's more than 30, 40. It depends the server rack. This is a really great opportunity we see. Not only the number of boot drive, but the capacity might be increased in the next few years, right? This really can boost our sale revenue growth in the top line and the bottom line.” Regarding DRAM-less controller architecture with hardware-level security, SIMO has an edge here as there are very few competitors. The CEO is referring to this as the crown jewel because in what can be a crowded memory market, they are the majority leader in DRAM-less, with the company excelling at combining the controller, firmware and security for the boot drives that offer less storage. Perhaps most importantly, boot drives carry a higher ASP than MonTitan as they sell both the controller and NAND: “Really to NAND maker, because the density is really 256 GB compared with the enterprise drive, 16 TB, 30 TB, is much more smaller. We don't see competition from NAND maker come here. We are largest on merchant company. We also don't see the competition from module maker either.” As described above, boot drives carrying a higher ASP because SIMO sells the complete storage solution, which is why boot drives quickly became a large portion of revenue. MonTitan’s Expands from QLC to TLC/KV-Cache Offloading The 2027 opportunity for MonTitan has shifted from QLC to TLC/KV-cache offloading in response to NAND prices surging 5-10X over the past year. Due to the very high-capacities of QLC-based SSDs, including the 128TB range and above, the 2-terabit QLC NAND dies needed to support these products is too constrained for a broader ramp across the market (including SIMO). As that sorts itself out, which the CEO has stated should eventually result in a very large TAM for them, the nearer-term opportunity in 2027 is coming from TLC-based CMX compute and KV-cache SSDs. In fact, management pointed toward TLC qualification starting one quarter earlier than expected, with two customers in production now, and five additional Tier-1 CSPs (three from Asia two from the U.S.) expected to ramp later this year. We’ve covered the differences between TLC and QLC NAND, with the shift toward TLC NAND being more favorable to Silicon Motion in the near-term given that smaller-capacity TLC configurations require more SSDs, and therefore, more controllers: “While we anticipate more initial revenue contribution to come from TLC configurate MonTitan solution, we believe QLC configure solution will begin contributing more meaningful later this year and long term.” However, for the longer-term thesis, QLC is a desirable use case as it offers the bigger TAM. Last quarter, the shift toward TLC was discussed along with QLC having a bigger TAM down the line: “So we're seeing more and more customers moving to TLC with a smaller capacity like 8, 4 and 16 terabyte. And this is really a benefit for Silicon Motion because we ship more controller. But for QLC, we also still have 2 customers continue and ramping later this year, and they are able — we can help — we help them to secure NAND supply because the QLC 2 terabit today only have 3 NAND maker can provide the production. I think wait for 1 more year, we see all the NAND maker can produce QLC, availability will be better. We will see more demand for high-capacity QLC and supply will become more normal. So that situation we see.” Later it was stated: “High-capacity warm storage SSD leveraging QLC NAND will represent the largest addressable market for MonTitan [..]” However, it’s really a win-win as the TLC/KV-cache offload is gaining strong traction per management commentary as although TLC results in more controllers, QLC has the larger TAM. One important distinction is that MonTitan carries a lower ASP than the boot-drive solutions because MonTitan is sold as a controller, whereas boot drives include the controller and the NAND. Therefore, MonTitan is driven more by controller volume and market share rather than higher-per-unit revenue. Per the CFO: “our solutions business in boot drive, just a reminder, it's controller plus NAND. ASPs are going to be naturally much higher than what you're going to see on a controller only. While certainly we're excited about the scale and opportunity of MonTitan, just keep that difference in mind, where ASPs are going to be certainly lower on MonTitan than relative to the boot drive side.” These are important pieces to put together because although the exact path Silicon Motion was expected to take has shifted, it shows that SIMO is positioned across both sides of the AI storage opportunity. Revenue Accelerates to 127% YoY, FY26 Guide of 100%+ Silicon Motion's Q2 revenue came in at $451.0 million, up 31.8% QoQ and 127.0% YoY, marking the fifth consecutive quarter of YoY acceleration and the second consecutive quarter with triple-digit growth. QoQ growth also accelerated roughly nine points from 22.9% in Q1, as SIMO delivered a substantial increase in sequential dollar growth off a larger base, at $109 million in Q2 versus $64 million in Q1. For Q3, management guided revenue to $519-$541 million, representing 15% to 20% QoQ growth and 114% to 124% YoY growth, representing a notable 23% beat to estimates for $431 million in the quarter. It should be noted that Q3’s growth rates are both moderating from Q2, with YoY pointed to decelerate 8 points and QoQ guided to decelerate roughly 14 points, though sequential dollar growth is still strong at ~$79 million. Management also provided guidance for FY26, expecting strong top-line growth to continue through year-end and positioning the company to record 100%+ revenue growth, its highest annual revenue in history. This would correspond to revenue above $1.77 billion, ahead of estimates for $1.6 billion for 80% growth. Taking in to account Q1 commentary for sequential growth in each quarter, there is a chance for revenue to land closer to $1.9 billion. Segment Breakdown: Ferri & Boot Drive Doubles QoQ after Tripling QoQ in Q1 All three product lines grew both sequentially and year-over-year, but growth was highly uneven, with the newer, smaller businesses growing fastest off a low base. SSD controller sales increased 5% to 10% QoQ and 50% to 55% YoY, rebounding from a QoQ decline of (5-10%) in Q1 while YoY growth accelerated from 40-45%. SIMO’s MonTitan SSD controller development platform has now sampled with more than a dozen target customers, including tier-1 datacenter and enterprise storage customers, NAND flash manufacturers, and module makers. Volume production ramps are set to begin in Q2 2026 with multiple customers, and management expects sales to begin in the second half of 2028 with three Asian tier-1 customers and two US tier-1 customers. eMMC+UFS controller were a key driver in the quarter as revenue grew 15-20% QoQ and 95-100% YoY. However, this marked a deceleration on a both a YoY and QoQ basis, from 30-35% QoQ and 140-145% YoY in Q1. Ferri & Boot Drive growth remained robust as revenue more than doubled sequentially after tripling sequentially in Q1. Revenue rose 110-115% QoQ and 1,690-1,695% YoY in Q2, following 205-210% QoQ and 755-760% YoY growth in Q1. Although the elevated growth rates suggest that Ferri & Boot Drive growth continues to scale off a small base, the pace of the sequential ramp suggests that growth is scaling quickly. There were a handful of updates on the product side for Boot Drives that suggest growth could remain robust heading into 2027. Outside of its ramp with Nvidia for BlueField DPUs, NVLink and Ethernet switches with expansion in 2H, Silicon Motion is now separately engaged with a leading telecom infrastructure maker for boot drive solutions with a ramp expected in late 2026. Silicon Motion added that Alphabet is sampling boot drive solutions for inclusion in its next-gen TPU architecture, though that ramp is likely geared towards late 2027 to 2028 and inclusion is not guaranteed. Operating Margin Showing Signs of Life Margins were an area of strength in Q2 for Silicon Motion, as gross margin surpassed 50% and operating margin finally showed signs of life with Q3 guided to see an expansion deeper into the 20% territory, after much of the last three years had been spent in the teens to single digits. GAAP gross margin was 50.2%, up 2.5 points YoY and 3 points QoQ, with Q3 guided to see marginal expansion to 50.4%. Operating leverage was visible as operating margin displayed strong expansion in Q2. GAAP operating margin crossed above 20%, reaching 22.4% in the quarter, up 11.2 points YoY and 7.1 points QoQ. Adjusted operating margin was 23.1%, up 10.3 points YoY and 4.9 points QoQ. Guidance for Q3 points to continued operating leverage: GAAP operating margin was guided to be ~25.1% at midpoint, up 13 points YoY and 2.7 points QoQ, while adjusted operating margin was guided to hit 28%, up 12.2 points YoY and 4.9 points QoQ. Net margin has a bit of a caveat and is not reflective of SIMO’s true operations. GAAP net margin was 30.2%, up 22 points YoY and 10.7 points QoQ, though this was inflated by a $74.7 million gain on investments. Stripping this out, adjusted net margin was 18.4%, up a modest 6.9 points YoY and 2.7 points QoQ. GAAP EPS Beat Driven by Investment Gains Q2’s GAAP EPS beat lends itself to those investment gains, coming in at $3.99, up 721.4% YoY from $0.49, and well ahead of estimates for $2.04. Adjusted EPS was $2.43, up 254.3% YoY from $0.69, and handily beating the $2.11 estimate by roughly 20%. Considering the sizable revenue beat and further expansion projected for operating margin in Q3, the current adjusted EPS estimate for 127% growth to $2.28 appears far too low. Cash Flow and Balance Sheet: First Debt Drawn as Cash Flows Slip Further Negative The place to nitpick SIMO’s report lies within the balance sheet, as not only did cash flows fall deeper into negative territory, but cash on hand declined while SIMO drew on debt in the quarter. Cash flows are worth flagging as a watch item should Q3 not show a meaningful recovery considering the topline strength. Operating cash flow was ($63.8 million), more than doubling QoQ from Q1’s ($31.2 million) and marking the third consecutive quarter of negative operating cash flow. OCF margin was (14.1%), widening from (9.1%) last quarter despite the larger revenue base and from (8.7%) a year ago. Free cash flow was ($71.5 million) for a (15.9%) margin, widening from (14.5%) in Q1 but improving marginally from (16.5%) a year ago. The cash burn traces directly to working capital: accounts receivable grew roughly 47% QoQ to $323.6 million and inventories grew roughly 31% QoQ to $673.0 million, both consistent with a company scaling shipments rapidly ahead of revenue recognition and building inventory to support forward demand, but a trend that bears watching moving forward. Cash and equivalents (including restricted cash) fell to $181.8 million from $210.9 million in Q1 2026 and $331.7 million a year ago, but backing out restricted cash shows a tighter picture, with cash and equivalents at $74.4 million versus $135.7 million just last quarter. Notably, SIMO drew a $59.2 million bank loan during the quarter, a meaningful shift in capital structure for a company that has historically operated debt-free, and is worth monitoring in future quarters. Conclusion: Silicon Motion is not an easy thesis to nail down, and is a stock you are unlikely to see in many high-profile portfolios. However, SIMO’s AI opportunity is broader than one might expect, as the company is benefiting from share gains in consumer controllers, but also seeing strong uptake on enterprise boot drives. If all goes well, MonTitan should offer a welcome boost to growth in the coming quarters. If you are newer to the I/O Fund, welcome to the immense volatility in the sector we specialize in. As you have seen this week, the AI supplier market can be a wild ride, but rest assured, we do this day in and day out and remain entirely unfazed. Our goal is to have such defensible research, that we do not worry about a selloff or become overly celebratory on a green day. Rather, we want to position early and review those positions often—which is exactly what we did for you with SIMO today. Keep an eye on your inbox as we enter our busiest earnings week of the quarter next week. This week was just the warm-up! Please note: The I/O Fund conducts research and draws conclusions for the company’s portfolio. We then share that information with our readers and offer real-time trade notifications. This is not a guarantee of a stock’s performance and it is not financial advice. Please consult your personal financial advisor before buying any stock in the companies mentioned in this analysis. Beth Kindig and the I/O Fund own shares in SIMO at the time of writing and may own stocks pictured in the charts. Damien Robbins, Equity Analyst at I/O Fund contributed to this analysis. Recommended Reading: Bloom Q2: Backlog is Growing Faster than Revenue at 166% YoY Growth The I/O Fund’s Top 20 Stocks for Q3 2026 Google Earnings Q2: Free Cash Flow in the Red; Purchase Commitments Balloon MaxLinear Beats on All Fronts with Keystone; Rushmore Ramping in 2027