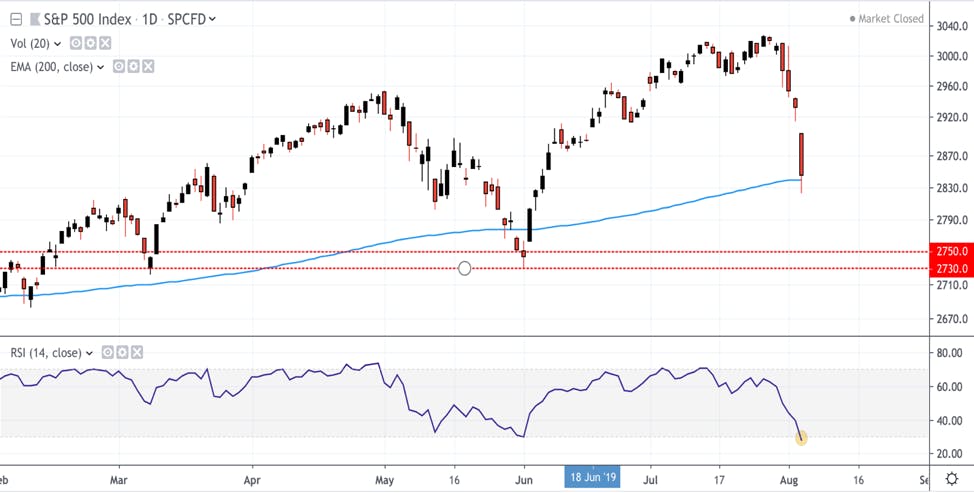
Information Technology led the losses today with XLK down -4.17% compared to other sector ETFs down 2-3%. Losses in the NASDAQ of 3.47% outpaced the Dow and S&P 500 at 2.90% and 2.97% respectively. Futures are trading at negative 2% on news that the U.S. declared China is a “currency manipulator.”
The market closed on its 200-day exponential moving average. After hours, it broke through and will likely gap down to open tomorrow, while futures are currently showing the market trading into the 2790 region. The market is over-sold based on the RSI index and we are approaching key supports. A bounce is likely. The RSI is currently (as of the close today) lower than the RSI low in the May/June correction of this year. Furthermore, we are approaching a major price cluster (red dotted lines). This has acted as major support and resistance in the past.
The list of Huawei suppliers provided on Research Services is a decent list to hedge your long positions. It’s unlikely there is a resolution with Huawei for some time. I had written this in the Apple update, as well. The damage done to Huawei suppliers over the current trade war news should exceed what we saw in May.
Most investors can agree that technology stocks are expensive right now. Our most likely scenario on the MongoDB report was an entry below the $141 support between $95 and $128. We will keep you posted on this.
Snap is likely to break the final support on our most recent trade at $16.20 and we will be releasing information on entry for this stock again for anyone who exited. I’ve chosen to keep some of my position as there is room for a bull run on Snap due to monetization through Audience Network.
We also have a lengthy 12-page report coming out tomorrow on one of my favorite trends for the next 2-3 years – Connected TV Advertising. We will be guiding premium subscribers on entry for TTD and Roku. The latter is a stronger pure play, but this trend is critical to have in your portfolio, and there is room for both stocks to perform well in the near term of 2-3 years. TTD and Roku report earnings this week.
Uber and Lyft also report earnings this week – my two least favorite IPOs this year.
In case a trade war intensifies, want to give you a short list of Huawei suppliers that had a rough few weeks in May during the last trade war scare. Huawei suppliers are battling both trade war tensions and national security concerns as opposed to solely trade war tensions.
Broadcom
Skyworks
Qualcomm
NeoPhotonics
Lumentum
AMD
Flex
Intel
Seagate
Qorvo
Micron, Nvidia and Xilinx have some exposure
Keep a close eye in case they break support.
If Huawei is a threat to national security, the ban may not be officially lifted. There were mixed signals in June from the United States as the US Commerce Department placed five more Chinese entities on its so-called Entity List with an announcement on June 21st– one week before the G20 Summit.
The five newly listed companies included Chengdu Haiguang Integrated Circuit, Chengdu Haiguang Microelectronics Technology, Higon, Sugon, and Wuxi Jiangnan Institute of Computing Technology. Included in the list is one of Higon’s five affected aliases, Tianjin Haiguang Advanced Technology Investment Co. (THATIC), THATIC is a joint venture Advanced Micro had set up with the Chinese government in 2016. AMD works with THATIC to license its microprocessor technology to Chinese firms, including Higon.
To improve accuracy and lock-in more gains, Research Services combines fundamental analysis and technical analysis on tech stocks.
The market broke through the 21-day and 50-day exponential moving averages, which is a psychological shift for the rally we’ve been experiencing. 2940 is an important number. If we close below 2940, which is may happen based on today’s actions, we should see 2900 rather quickly.
We are still in the probability of extremes. According to the methodologies I use, the market could go to as low as 2100-2300, which would be a reversion to the mean, or it can take us to the 3700-4200 region, and possibly higher, for one final bull push. I believe the bull market that began in 2009 has one final push left, and will do one of the three:
Most likely scenario is we retreat to 2600 before the last push towards 3700-4200
Lower probability: see SPX visit 2100-2300 and then resume the rally to 3700-4200
Lower probability: we go directly to 3700-4200 from here with normal corrections along the way.
Technicals Summary:
More comments on these stocks are located in the forum. It’s important that you follow the forum if you are interested in a specific stock.forum. It’s important that you follow the forum if you are interested in a specific stock.
Snap: If we break $16.20 we will likely retest $14. Snap has been strong at the $17 support. I closed out my calls after earnings and am staying long in my other position for now. If we break the $16.20, I’ll sell half my long position and maintain a 35% trailing stop on the remainder. I usually do not like to time my entire position twice (selling and buying again) if my plan is to buy again. However, with the market behaving the way it is this week, coupled with other metrics I follow, I want to lock in gains. A wide trailing stop is a good idea and buying Snap on a market pullback is also a good idea.
Google: We still can see Google as low as $900 or as high as $1300 – follow me on the forum for updates. We think the privacy and anti-trust creates a lot of risk in this stock.
Apple: Apple is behaving weaker than the earnings beat calls for and this is likely due to the smartphone saturated outlined in the fundamental blog we sent prior to earnings. Apple is testing the $200 support as we speak.
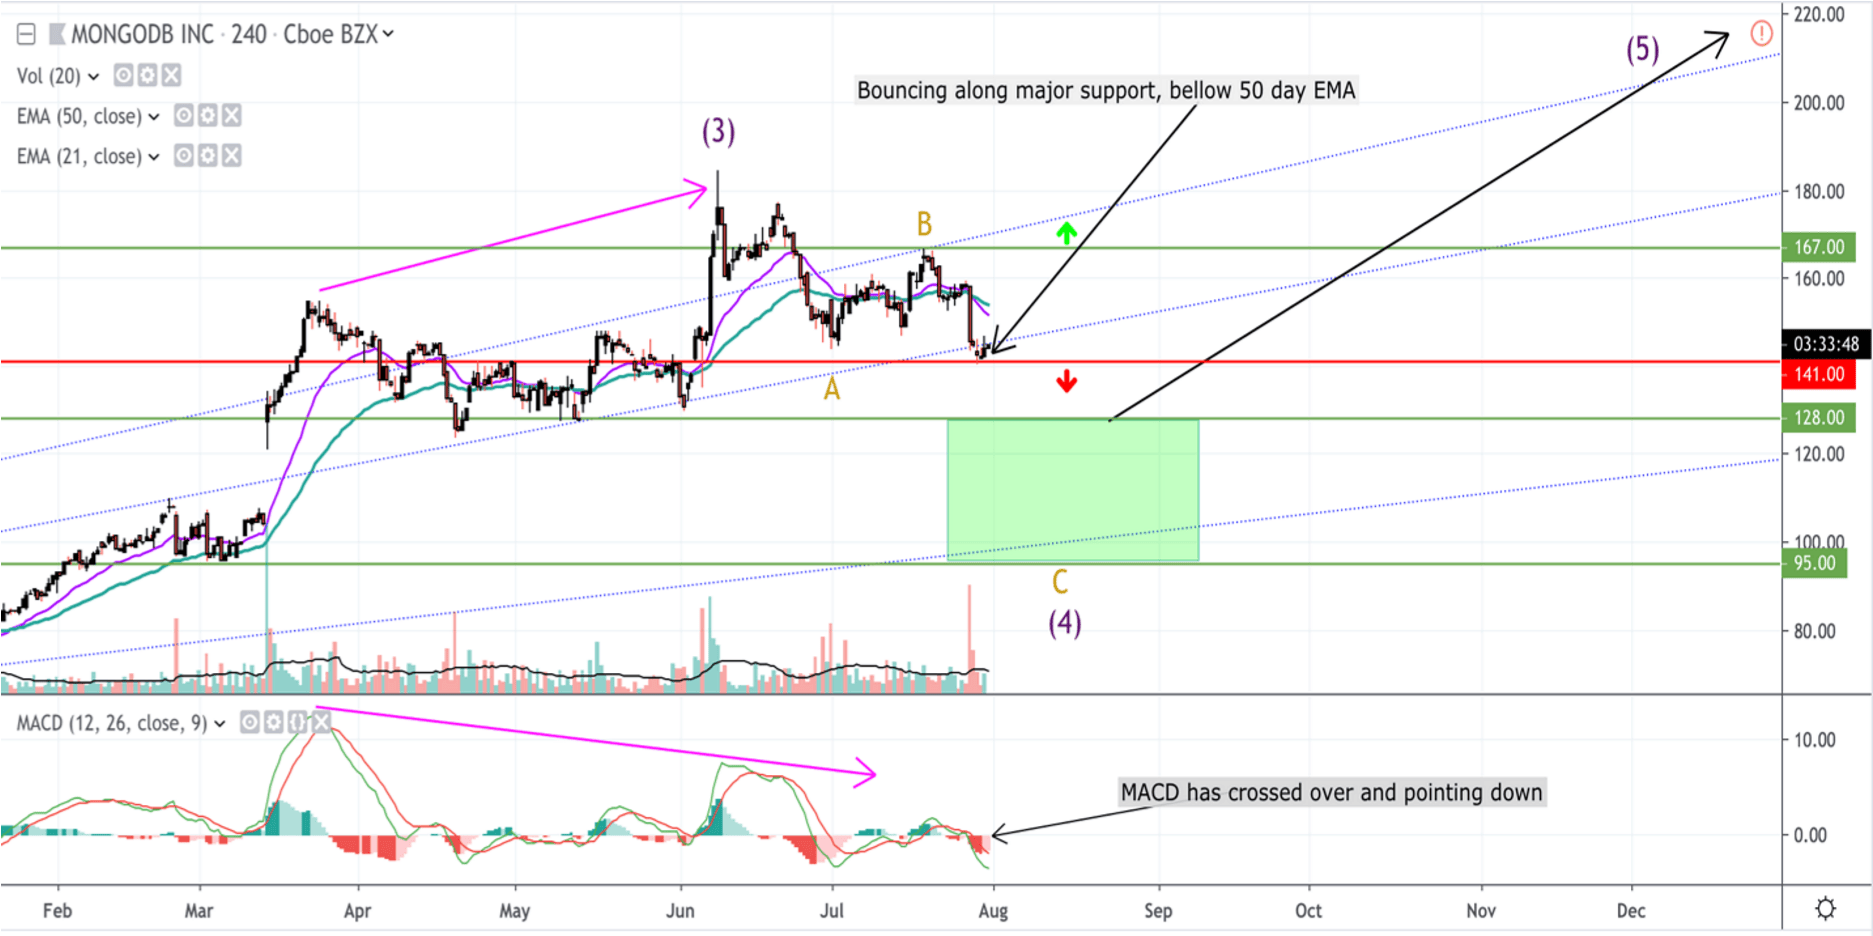
MongoDB: MDB is tightly trading at the $141 region we highlighted. It is currently trading just below this support as we had predicted in the MongoDB PDF analysis, and if we close below, I expect further weakness before initiating a position.
Bitcoin: We see an entry opportunity in the $4200-$7800 range. Fundamentals to follow in the coming weeks.
My Background:
I’ve been trading on Beth’s fundamental analysis for about two years. I’ve made over 300% on Roku from the IPO by keeping some of my position in the stock during the pullback based on her analysis, plus another 200% by initiating a new Roku position and buying the dip in Q4 2018. I did not sell my position even when it lost 50% of its value bc of Beth’s high conviction.
I also made decent money on Microsoft during the Q4 pullback based on her conviction, Alibaba, Nvidia and Zoom’s IPO. I shorted Uber and Lyft based on her analysis and made roughly 20% and 15% (options weren’t available) and the only time I’ve successfully shorted Tesla was based on her analysis (I tried a few times prior) for a return of over 100% on options when price fell from $260 to $190. Overall, I’m averaging 120% returns in the last two years on my tech allocation based off Beth’s fundamentals.
We believe Beth’s fundamental analysis combined with my technical analysis will increase gains quite a bit as we can help you find a good entry. We will offer you a shopping list if we see a pullback and we will also have a good idea of what stocks will keep winning if we see the bull market resume.
Ideally, what I look for is to initiate entries into tech companies that are positioned to capitalize on emerging tech trends not known to the broader markets because true life changing gains can take place in the tech sector over time. I personally will trade options, short weak stocks and hedge my longs when we are at valuation extremes, but my primary goal is to buy and hold solid tech companies at great prices. Buy and hold remains the winning strategy with one caveat – you have to be ahead of a major tech trend and choose the right company.
Data storage is the invisible layer to the back-end that large-scale applications rely on to store passwords, product data, files, content, and accounting information. Website and applications are made of files containing data and this data needs to be stored and easily retrieved. NoSQL stands for Not only SQL, referring to relational databases that define and manipulate data based on structured query language (SQL).
The drawback to SQL databases, which MongoDB’s NoSQL database competes with, is that SQL databases are restrictive and require you to use predefined schemas. The data must follow the same structure with SQL databases, whereas MongoDB’s NoSQL database allows you to store data with dynamic schema for unstructured data, such as document-oriented, column-oriented, graph-based and as a key-value store.
MongoDB is a popular and well-supported NoSQL database that offers a database-as-a-service (DBaaS) product to reduce the operational complexity of on-premise databases. As an open source database, MongoDB has many competitors outlined below. The moat, if you will, comes from the time it requires for software developers to learn a new database platform. Platforms that are known universally, like MongoDB, are desirable as it is not a requirement to learn a new platform if a software developer changes employment. The friction in changing databases for companies is also very costly.
1A: MongoDB Products:
MongoDB Enterprise Advanced runs in the cloud, on-premise, and in a hybrid environment. This subscription package represented between 56-65% of revenue subscriptions over the past three years. In June of 2016, a cloud-hosted database-as-a-service (DBaaS) product was introduced, MongoDB Atlas, which recently represented 23% of revenue up from 7% of revenue in the year prior.
Community Server is a free-to-download database that has seen over 60 million downloads over the past ten years with 20 million downloads occurring in the last year.
1B. Market Opportunity:
IDC updated its forecast and expects the worldwide database software market to grow from $64 billion in 2019 to $98 billion in 2023. There are six segments in the big data management space: enterprise data warehouse, NoSQL, Hadoop, big data integration, data virtualization, and in-memory data fabric.
The NoSQL market is growing quickly and outpacing overall IT, but the market size is small compared to other big data segments. Some estimates place the NoSQL market at $1.6 billion in 2021 while other sources state the near-term opportunity is $4 billion.
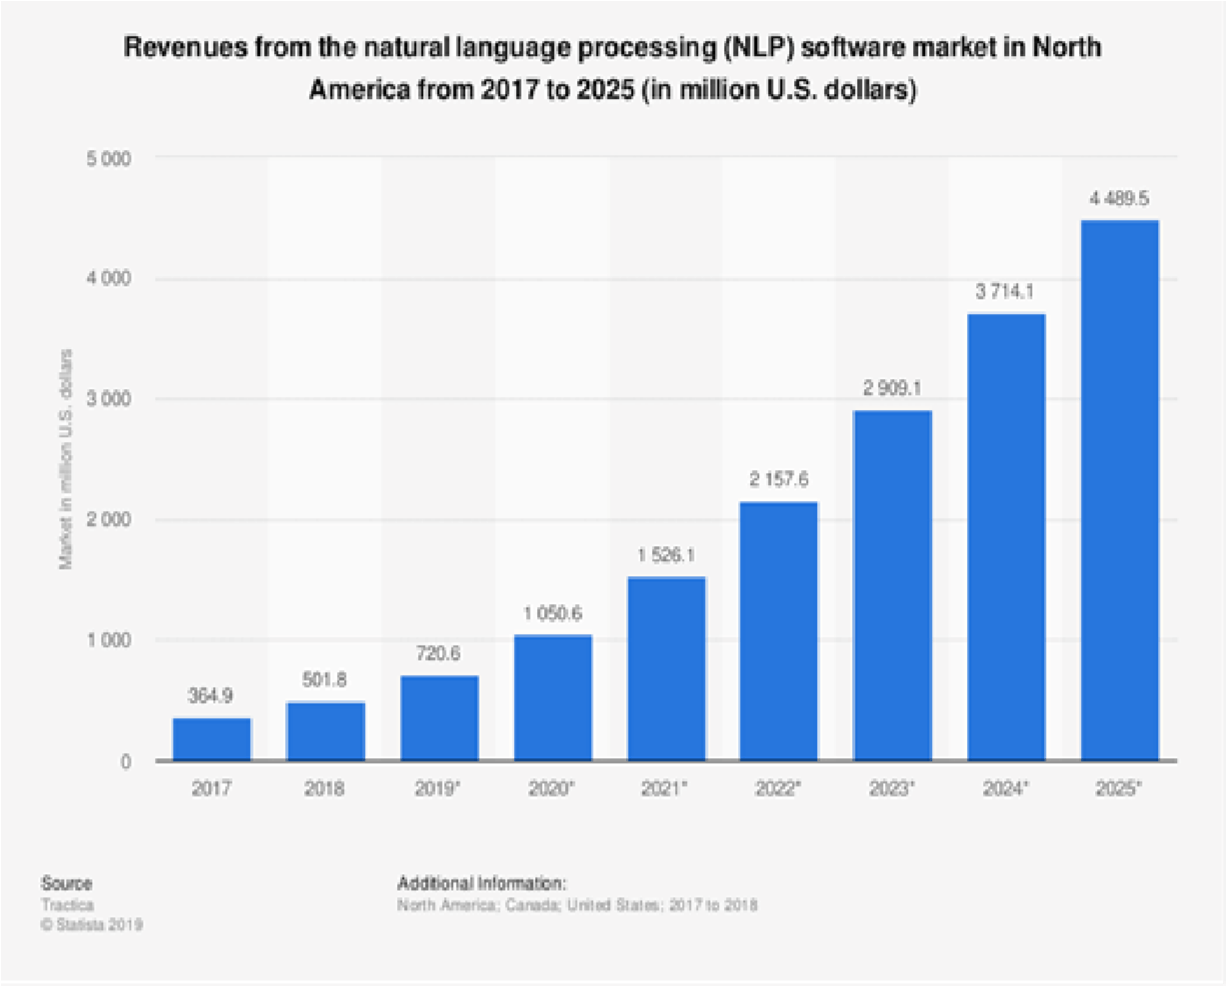
Here’s a glimpse of the growth from natural language processing (NLP), growing from $720 million in 2019 to over $4 billion by 2025. MongoDB is well situated to capitalize on this specific software segment. You can add another $1 billion to the market potential for deep learning. IoT data may also become a driver for NoSQL, adding to the trajectory.
To complicate addressable market, up to 25% of databases are entirely open source and unpaid without licensing fees, such as PostreSQL. MongoDB is also open source, however, competing corporations must license the code and the company charges for enterprise-level products, cloud database-as-a-service products and analytics.
It’s important to remember we are in a transition as indicated by the developer survey. Big data has evolved over the last decade and will face more complex challenges that go beyond predictive modeling to include natural language processing, deep learning, IoT connectivity and new methods, such as data lakes.
1C. Competitors:
MongoDB has competitors from all sides. As stated, the moat in software platforms and languages is established by becoming universal as there is a time prohibitive learning curve in switching to new platforms/languages/frameworks which prevents customers from switching frequently.
Tech companies also need to hire based on universal database skills. There cannot be too much fragmentation or it will impede technological progress.
This works both ways as MongoDB may be the better product, yet many companies may find it hard to switch from Oracle or another legacy, relational database.
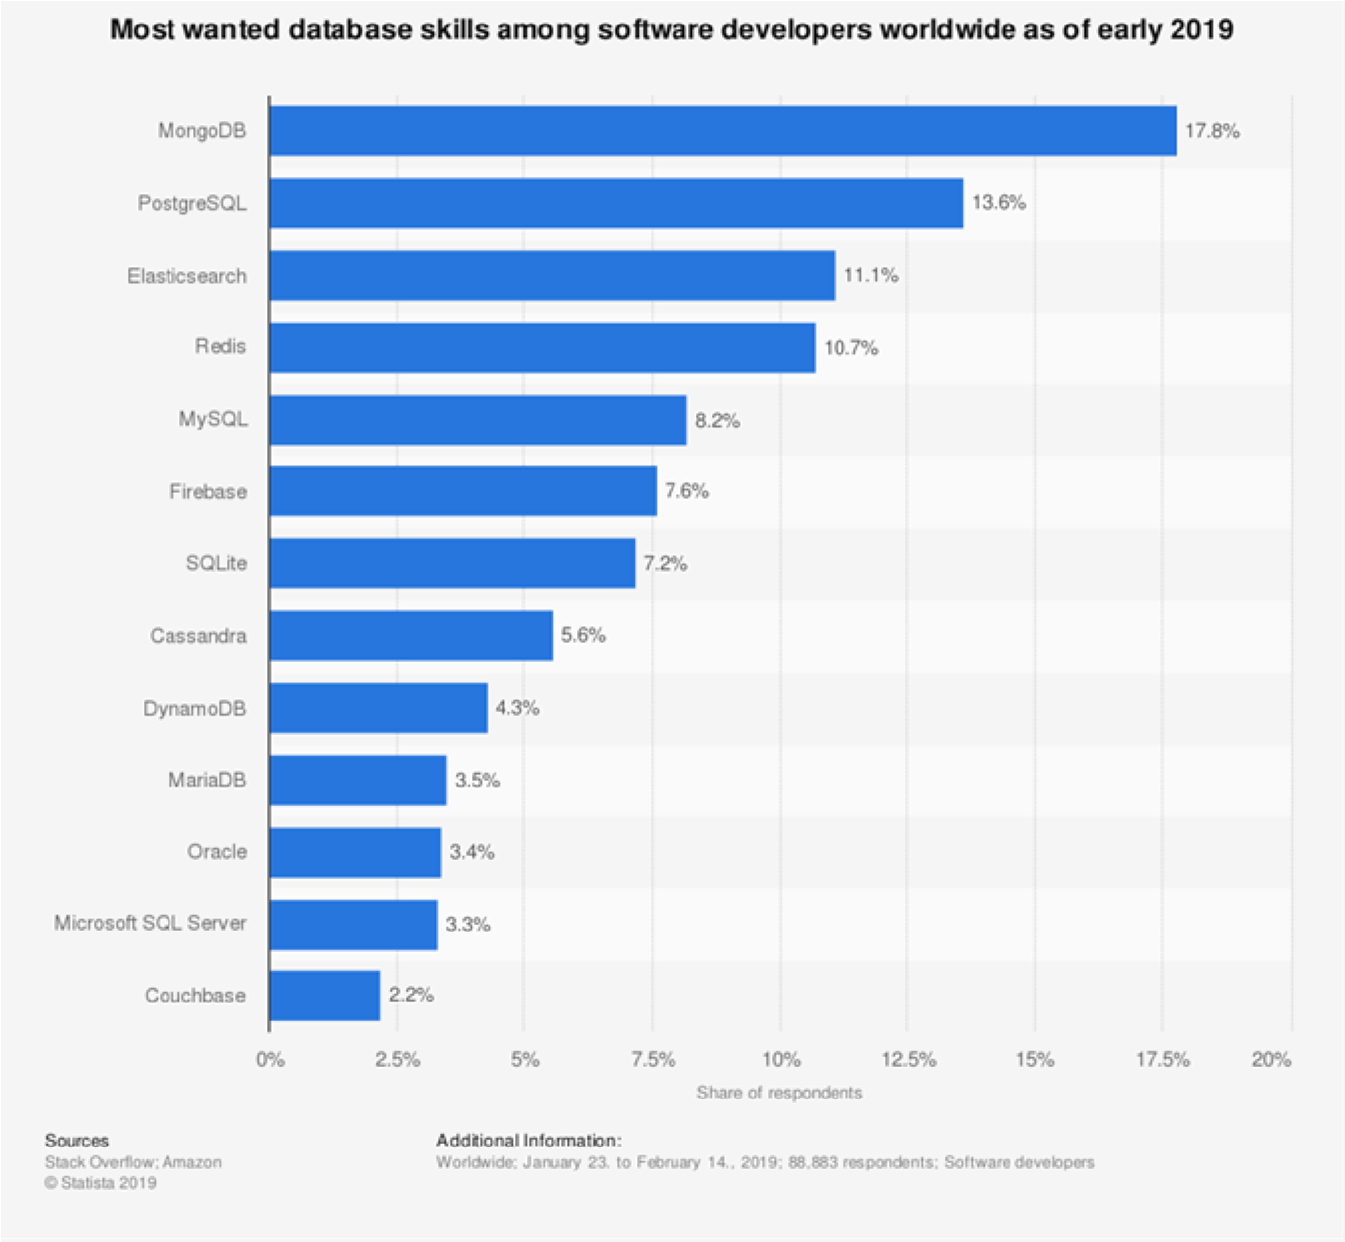
Due to becoming a universal NoSQL option, MongoDB is in the lead for most wanted database skills as of early 2019. Being agnostic certainly helps, meaning that the competition between Oracle-owned MySQL, Microsoftowned SQL Server and Amazon-owned DynamoDB helps MongoDB because it is neutral and does not compete with these companies across other, more lucrative revenue segments. When Microsoft hires, they will not advertise for DynamoDB experience but they will seek MongoDB experience, helping MongoDB establish itself as a universal database program.
1D. MySQL Still Dominates the Market
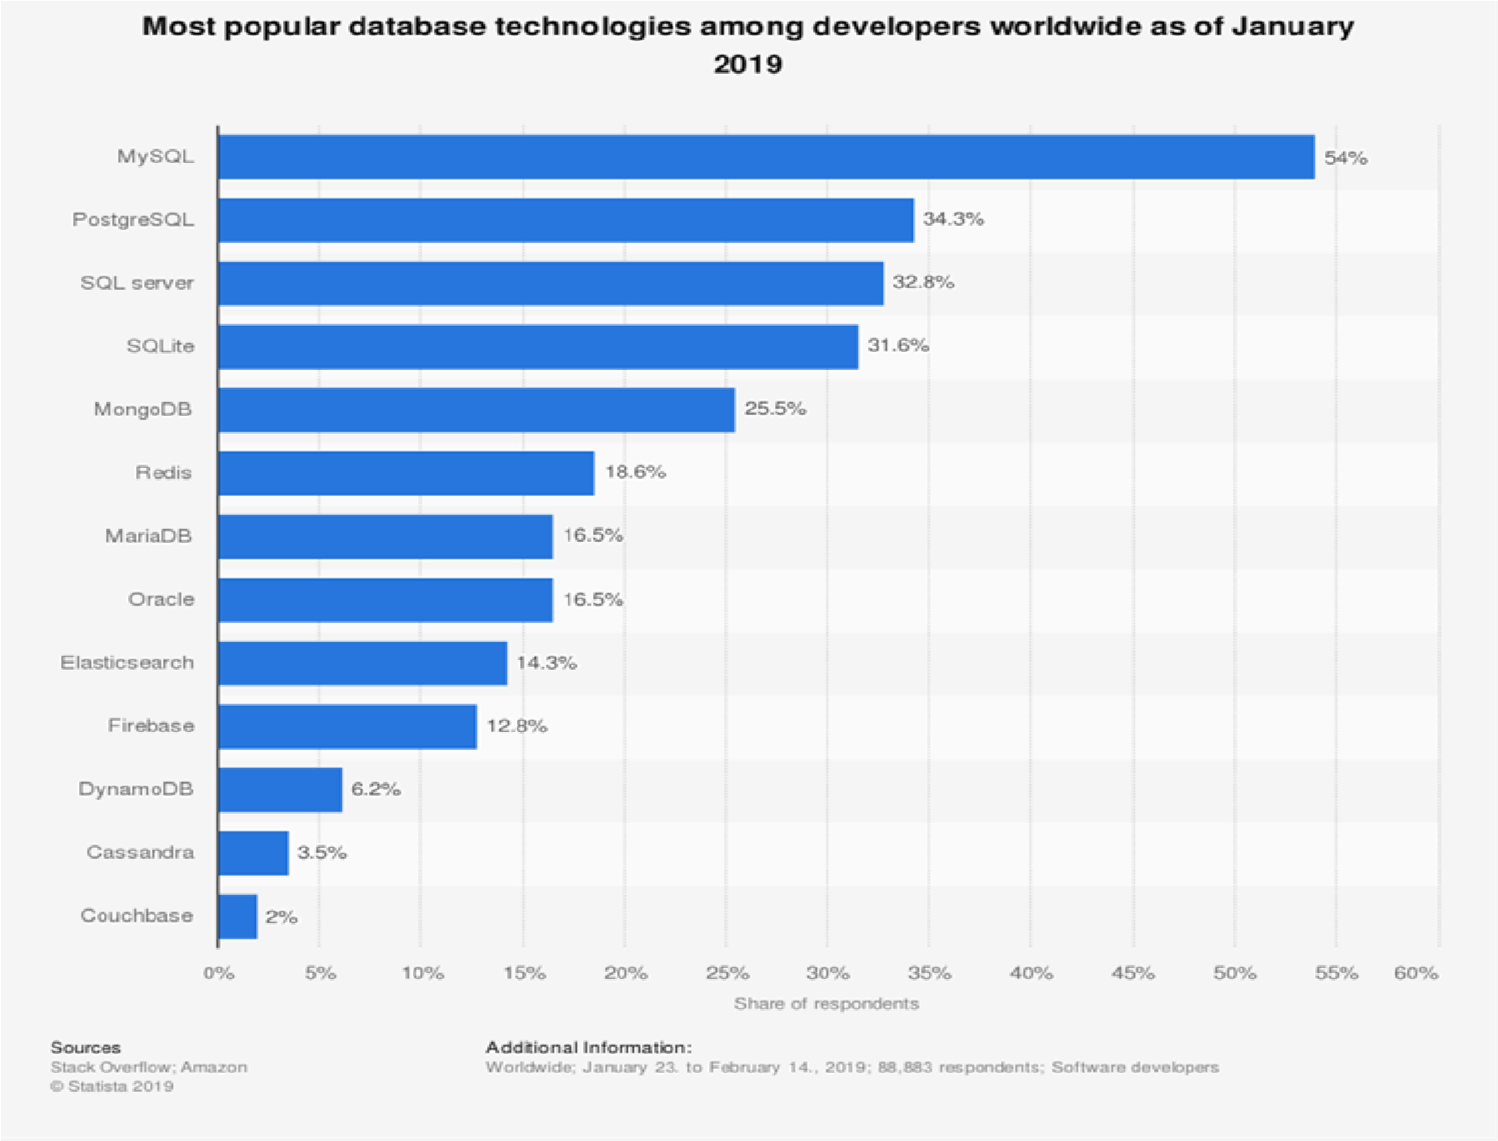
MySQL is the leading database technology with nearly 55% of developers responding they use it or have used it.
The free and open-source software was bought by Sun Microsystems, which in turn, was bought by Oracle in 2010. The founders of MySQL decided to fork the project and create MariaDB, most likely as a rebuttal against Oracle. MariaDB now competes with MySQL.
The debate between SQL and NoSQL is still very heated, but as we can see from the skills most sought-after, NoSQL has a bright future ahead. The best growth stocks are at the beginning of a trend with future market share dwarfing current market share. Not only is MongoDB the leading NoSQL database (current market), it is also the most in demand database (future market).
“When I joined MongoDB, about 5 percent of all projects were relational (SQL) migrations – now it’s 30 percent as companies look to transform.
Cost can be a factor, but more often it’s development speed and running at scale. It’s not unusual to see developer productivity up 3 to 5x after switching [from a SQL database], coupling MongoDB with a shift to cloud, microservices, and agile/devops.”
– Mat Keep, director of product marketing at MongoDB, 2018
MongoDB’s growth depends on converting developers from SQL databases (relational) and also convincing developers to pay for features when open source is traditionally free. Startups also compete with MongoDB, such as YugaByte, which raised $16 million last year to combine SQL and NoSQL into a single database.
Within the segment of NoSQL, MongoDB has a few competitors, as well – hence the reason I stated there were competitors from all sides (from free open source, SQL and also NoSQL). MongoDB is the leading NoSQL database although Redis, Cassandra, and Couchbase are competitive NoSQL products that vie for market share.
According to Stack Overflow, Redis is the closest competitor to MongoDB. Forrester positions Couchbase as a more serious contender than Statista indicates, although Statista is more insightful as over 80,000 developers were polled on the Stack Overflow survey as opposed to 26 vendors from Forrester.
Section 2: Fundamentals
MongoDB has reported solid revenue growth YoY of $65 million, $114 million, $186 million and $267 million in the most recent year. The revenue growth of MongoDB YoY is nearly 70% from a fairly mature company that was founded in 2007.
As a percentage of revenue, net losses decreased from 62% to 51% to 38% revenue in the most recent year ending January 31st, 2019. Gross profit margins were lower in the most recent quarter at 68% gross margin, compared to 73% gross margin in the year-ago period.
Free cash flow improved in the most recent quarter to $2.8 million compared to negative $8.4 million in the year-ago period.
Sales and marketing costs are over 50% of revenue and R&D costs are over 30% of revenue; this represents an increase of 36% in sales and marketing costs YoY and an increase of 44% in R&D.
The company is choosing to not be profitable and instead is going after market share, and this strategy will likely continue over the next few quarters. Dismissing profitability for critical early-trend growth should pay off as we are in an important window of opportunity for AI and ML development. Also, once customers are converted, there is too much friction to switch, and therefore, time is of the essence to win this market.
Despite strong earnings reported in June (fiscal Q1 2020) that beat estimates on all accounts, MongoDB stock has dipped from the $165 range to the $145 range, currently, due to revised guidance on expected losses for the full year to $1.04 to $1.11. Wall Street had expected a full-year loss of $1.01 per share.
Most notably, MongoDB is courting Google Cloud Platform, which should further its compatibility with Kubernetes, a container system that originated from Google, and Tensorflow, a machine learning framework and language that is rising in popularity.
I’ve reached out to MongoDB, who stated MongoDB 4.2 will be released in a few weeks, which should strengthen fundamentals with increased Kubernetes functionality and more competitive features for Atlas, including full-text search to take on Elastic. Kubernetes has gained in popularity from 10% of survey respondents using container orchestration in 2015 to over 71% respondents using Kubernetes in 2017.
For these reasons, I expect MongoDB’s growth to continue its trajectory.
2A. Amazon Endorses MongoDB as Segment Winner
Amazon has been a leading cause of MongoDB stock dropping two times this year. In January, MDB lost over
15% of its value in one day following the announcement of Amazon’s competing database-as-a-service product DocumentDB. In March, the news that Lyft was leaving MongoDB for Amazon was enough to shake the stock by 5%. Therefore, further analysis of Amazon is required to forecast the fundamental strength of MDB.
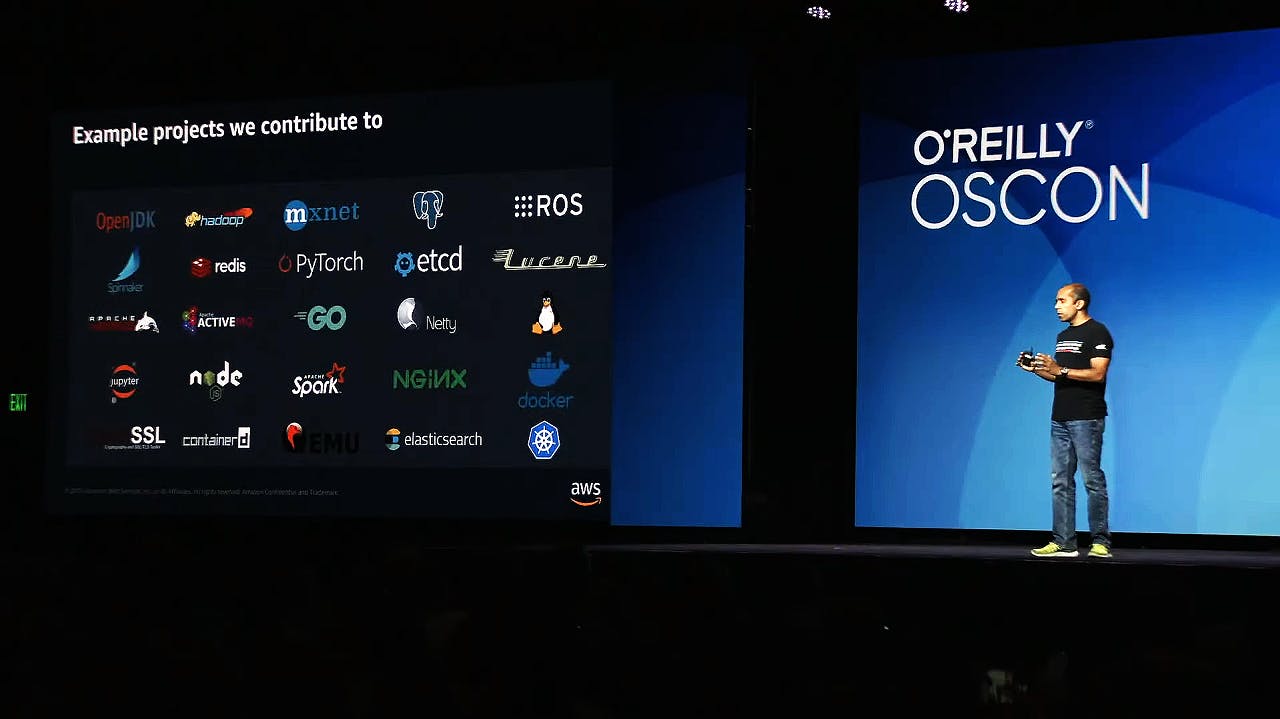
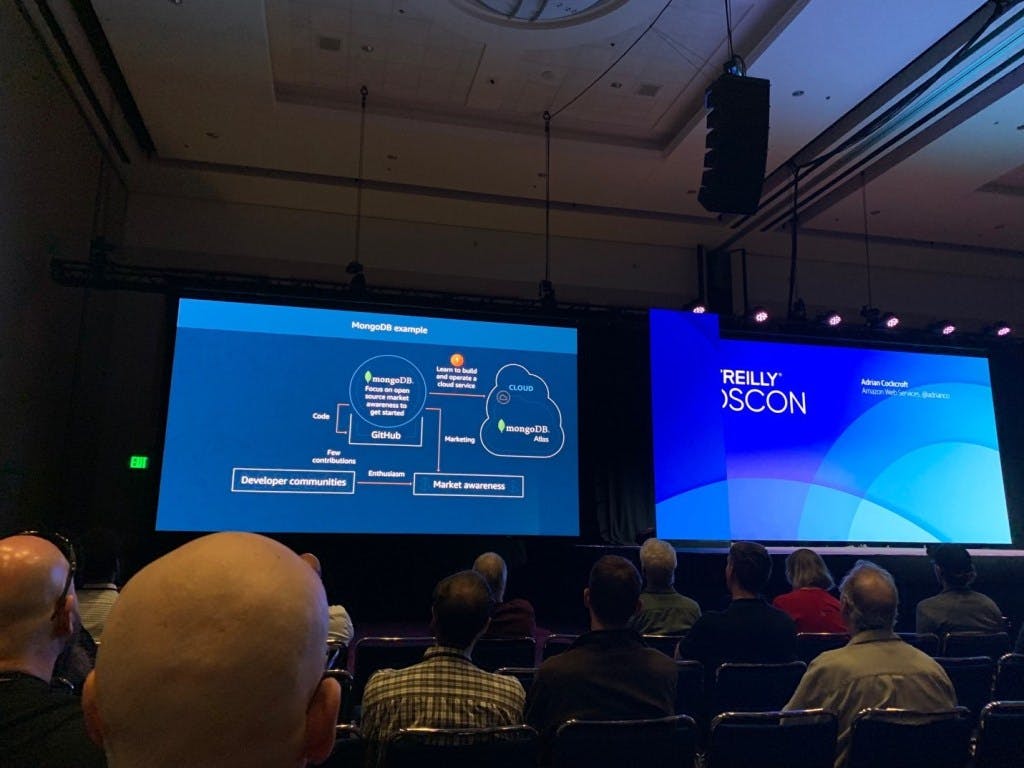
Last week, I wrote a public article about Amazon’s keynote at O’Reilly’s open source conference, OSCON. There was a disproportionate amount of endorsement for MongoDB coming from Amazon, stating “AWS effectively endorses MongoDB Atlas as the segment winner” and that MongoDB Atlas is an “AWS reinvent 2019 top level sponsor.” The speaker also made it clear that Amazon and Microsoft have cloned MongoDB’s Atlas but this has not slowed down growth from Atlas.
There was a slide that shows MongoDB’s growth from 22% as a percentage of revenue to 35%, despite DocumentDB’s launch in January. This matches the reported 400%growth of Atlas to account for 34% of MDB’s revenue in fiscal Q4 2019 and 35% in fiscal Q1 2020 (reported in June 2019).
One concern is if the Atlas growth of 34% of revenue in fiscal Q4 to 35% of revenue QoQ in fiscal Q1 was due to DocumentDB. According to Amazon’s presentation, MongoDB is still dominating, and this was welcomed intel directed towards NoSQL and SQL software developers, who Amazon is not likely to lead astray.
You can read my public article here. Here’s a video of Amazon’s presentation that I attended that was shared on our RS Forum.
Product and Fundamental Analysis Conclusion:
As of now, customer or competitor statements have a positive outlook on MongoDB. Developers are preferring MongoDB as the most wanted database skills in early 2019, per a survey of over 80,000 developers. Atlas’ growth was light QoQ compared to previous quarters, yet Amazon recently conceded that MongoDB remains the segment winner. Although this endorsement was based on industry insider information rather than from actual fiscal Q2 2020 results, I do not believe this would be in a keynote if Amazon did not truly believe MongoDB is currently the segment winner at the time of the keynote.
MongoDB is spending its resources on gaining market share. The company may not be profitable in the near future as it attempts to cement itself as the universal NoSQL option with a major ramping up in R&D and sales and marketing. I believe you can play this to your advantage as a buy and hold investor as the market is likely to penalize MongoDB for losses now to hold its position for the future. To build a buy and hold position, wait for a pullback.
I place the addressable market on the high end of estimates as charging for commercial open source software is a new trend that is gaining traction. Enterprises will pay if the tools are faster and cheaper for their teams. Database-as-a-service is a newer category that is also likely to grow faster than current analyst estimates.
MongoDB is a volatile stock as seen from the Amazon news and revised guidance for EPS. From my research, MongoDB will continue to perform well in the competitive landscape and buying the stock on perceived weakness is a good strategy.
3. TECHNICAL ANALYSIS
Technical Analysis provided by Knox Ridley.
Shortly after its IPO in October of 2017, MDB began an uptrend of a breathtaking 300%. With less than two years of trading, we have enough data to gauge major support and resistance levels, as well as gauge the strength of the current trend, which can give us a reasonable guess at the best entry.
3A. Internals:
The MACD is in a very weak state. It’s made lower highs as the stock has made higher highs, indicating negative divergence, which we usually see leading up to a pullback. You’ll also notice the volume decreasing as the price is rising, which is characteristic of weakening buying pressure.
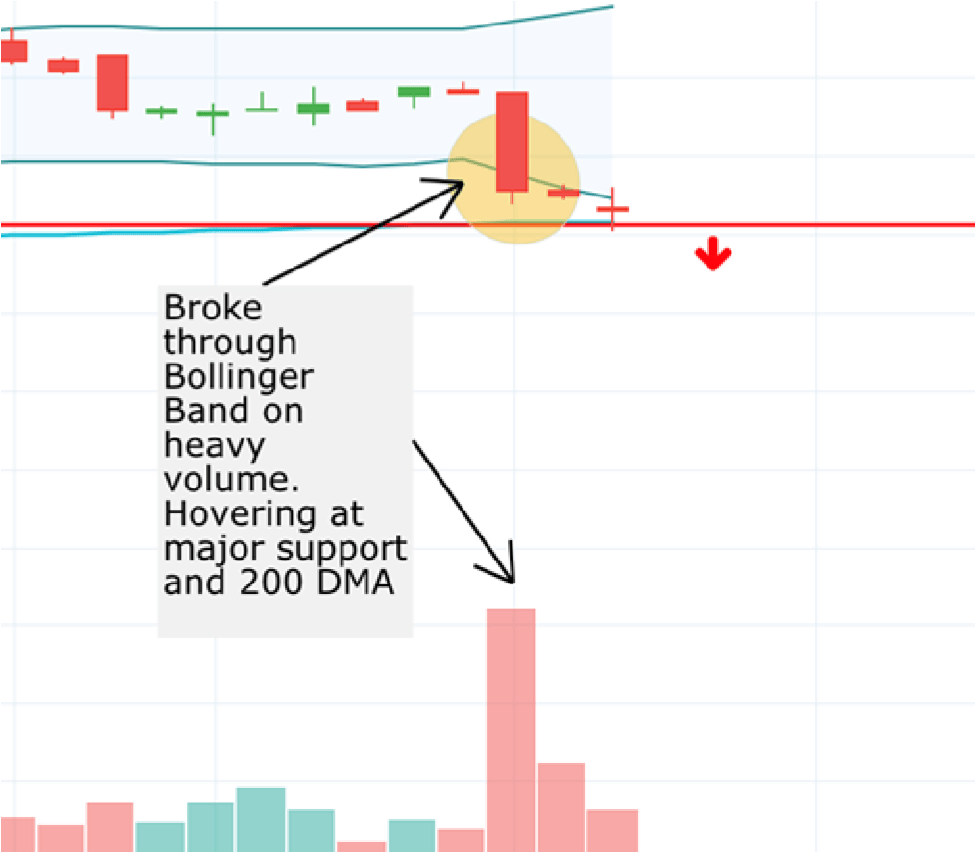
However, the biggest warning to me is the puncturing of the Bollinger Bands, which can be seen below:
You can see the move initiated on high volume, broke straight through the bottom band with a widening upper band. This is followed by 2 days of lower lows on higher than average volume. This move confirms that MDB is in a downtrend (making lower highs and now lower lows).
Also, MDB is comfortably below it’s 50-day moving average, with that average now pointing down. It has respected this moving average through-out its bull run, so to see it break through with force and comfortably staying below it is something to watch carefully.
It is currently touching the line in the sand support at $141, bouncing around for 3 days. The more a stock tests the support, the more likely it is to break that support. Bellow this support and I think we will visit the 200-day moving average, which is around $115. The 200-day sits directly in the middle of our entry target in the green box between $128 and $95
3B. Scenarios:
• The more likely scenario is that MongoDB will break the $141 support and our entry will be between $95 and $128. There is a saying, “The market abhors a vacuum.” More times than not, the market will attempt to fill a gap up or down. If we break the $141 support, that will be the target region, which also line up with a Wave 4 (ABC) retrace. This is the most likely scenario if the 200-day moving average breaks.
• It’s lower risk to wait and buy MongoDB when/if it reclaims it’s 50-day moving average. Depending on how quickly MDB regains its 8, 21, 50-day EMA, we may enter before the $167 resistance.
• If MDB breaks $167, we will buy with the assumption of a broader bull market.
Website update: Check out the beta version of our forum for discussion with other members. We’ve got some great discussion going on there on Snap, MongoDB and more. our forum for discussion with other members. We’ve got some great discussion going on there on Snap, MongoDB and more.
Last week, Google had a strong earnings report with 19% growth from $32.6 billion in Q2 2018 to $38.9 billion in Q2 2019. Net income also rose from $12.6 billion to $16.6 billion compared to the year-ago quarter. The leading drivers, according to the earnings call, were mobile search and YouTube, followed by desktop search. Google Cloud Platform has an annual run rate of $8 billion.
As of now, the thesis published in “Google: 2019 Analysis” has not changed. From an industry perspective, Google is between the rock of privacy and the hard place of anti-trust. For Google to have uninterrupted returns, the ad environment will have to remain tilted in its favor. The headlines around these issues are causing fatigue – not to mention complacency (that is warranted) as Google continues to remain a strong stock in the face of these risks.
My next update on these companies will come in early October after I spend a week with advertising professionals at AdvertisingWeek in NYC – one of the biggest ad industry events of the year with a lot of industry intel. I’ll get the scoop on Apple’s ITP 2.2 and update you on anything else I come across.
Apple Earnings:
At risk of being overly contrarian, I am also not excited about Apple as a long-term buy and hold in 2019 and 2020. Mobile saturation is a risk, and secondly, the trade war could potentially compound the cycle of hardware saturation. I don’t see the United States officially lifting a Huawei ban and I wrote about this both before and after the G20 Summit.
On a separate note, watch your Huawei suppliers carefully (QCOM, AVGO, SWKS, XLNX, etc).
Smartphone Saturation:
The smartphone market contracted in 2017 to 1.462 billion units and in 2018 to 1.42 billion units, and is expected to return to minimal yet positive growth percentages at a CAGR of 2.5%. While 1.5 billion smartphones per year is substantial, the law of saturation is likely to drive prices down, with Android owning 85% of the market today, and we see decreasing iPhone penetration in China where lower-priced competitors gain market share.
IDC estimated Apple will sell 242 million smartphones by 2022 up from 221 million in 2018. The issue with these estimates is that IDC does not break down the percentage of potential decline between 2018 to 2022. The most up to date number available from IDC is an anticipated decline of 0.8% in worldwide smartphone sales in 2019, published on March 6th.
We saw China decline 10% last year in global shipments of smartphones. Taiwanese company, TSMC, is the sole supplier of iPhone core processor chips and told Nikkei Asian Review that the company is cautious about demand for high-end smart phones, which is a nod toward Apple from a main supplier. Samsung Electronic’s Vice President Lee Myung-jin told investors in late January that “demand for memory chips has declined in the fourth quarter as external circumstances worsened and customers adjusted their orders” and he believes the decline “will continue in the first quarter, as key customers keep adjusting their orders.” This was before Samsung’s operating profit fell off a 60% cliff.
Conclusions: I do not believe Apple’s operating profit will fall off a cliff like Samsung but I wouldn’t be surprised if we see the stock trading sub-190 this year. With that said, the cash pile and buybacks keep a lot of investors in the stock.
Status: Hold with potential of downside risk over next two quarters.
Facebook reported its first decline between Q4 and Q2 in its history of being a public company. The headlines did not catch that but it seems some investors did as the stock is down about 2.5%, as of time of writing. I was quoted in MarketWatch for calling Facebook an all-or-nothing stock – great financials in the middle of regulatory risk. My opinion is there is lower hanging fruit.
Nobody can predict earnings with 100% clarity, however, Facebook’s decent earnings report followed by a decline in stock price helps our case with the Google thesis. Despite what Google reports today, we believe the browser changes that Apple is implementing will cause revenue erosion into the second half of the year and early 2020. The technicals are also weak on Google.
Regarding Facebook’s technicals, as FB makes new highs, the RSI is making lower highs, which is the type of negative divergence we see just before a correction. While the RSI is still in a bullish trading range, if it breaks 50 and begins to trade below 50, it will indicate a bearish change in sentiment accompanied by lower price action in the stock.
Fundamentally, Facebook is harder to shake from Apple’s browser changes because the majority of its revenue comes from mobile native applications (as opposed to the mobile web). This is an important distinction. For instance, you do not access Google search through an app on your phone – you access Google through a browser. This is why I’m more focused on Google with the browser changes although both show weak technicals.
The scenarios from the PDF provided are below for your convenience.
Scenarios:
• If you are long on Google, put a disciplined trailing stop on the stock and re-enter when the technicals and fundamentals agree on a more bullish outlook.
• If you want to trade conservatively, wait for Google to miss on revenue a second time between Q2-Q4 2019 and enter a short position or long-dated put. Especially watch for the effects of Apple’s ITP 2.2 as if/when effects are reported in Q2 or Q3, they will worsen over the course of the year.
• Higher risk scenario would be to purchase OOM puts that end in March of 2020 prior to earnings.
• Any short positions should be closed if Google makes all new highs around the 1300 mark. Shorting stock is all about timing and discipline. We will update as we go along if support or resistance is broken.
The fundamental analysis and technical analysis provided prior to earnings played out nicely this week. Snap crushed on DAU (daily active users), as our data had indicated the company would. For ad companies, DAU plays into higher revenue. The bigger story for Snap this year has not officially launched – Audience Network.
We will keep you updated if anything changes fundamentally.
Technical Update:
Provided by TA contributor, Knox Ridley:
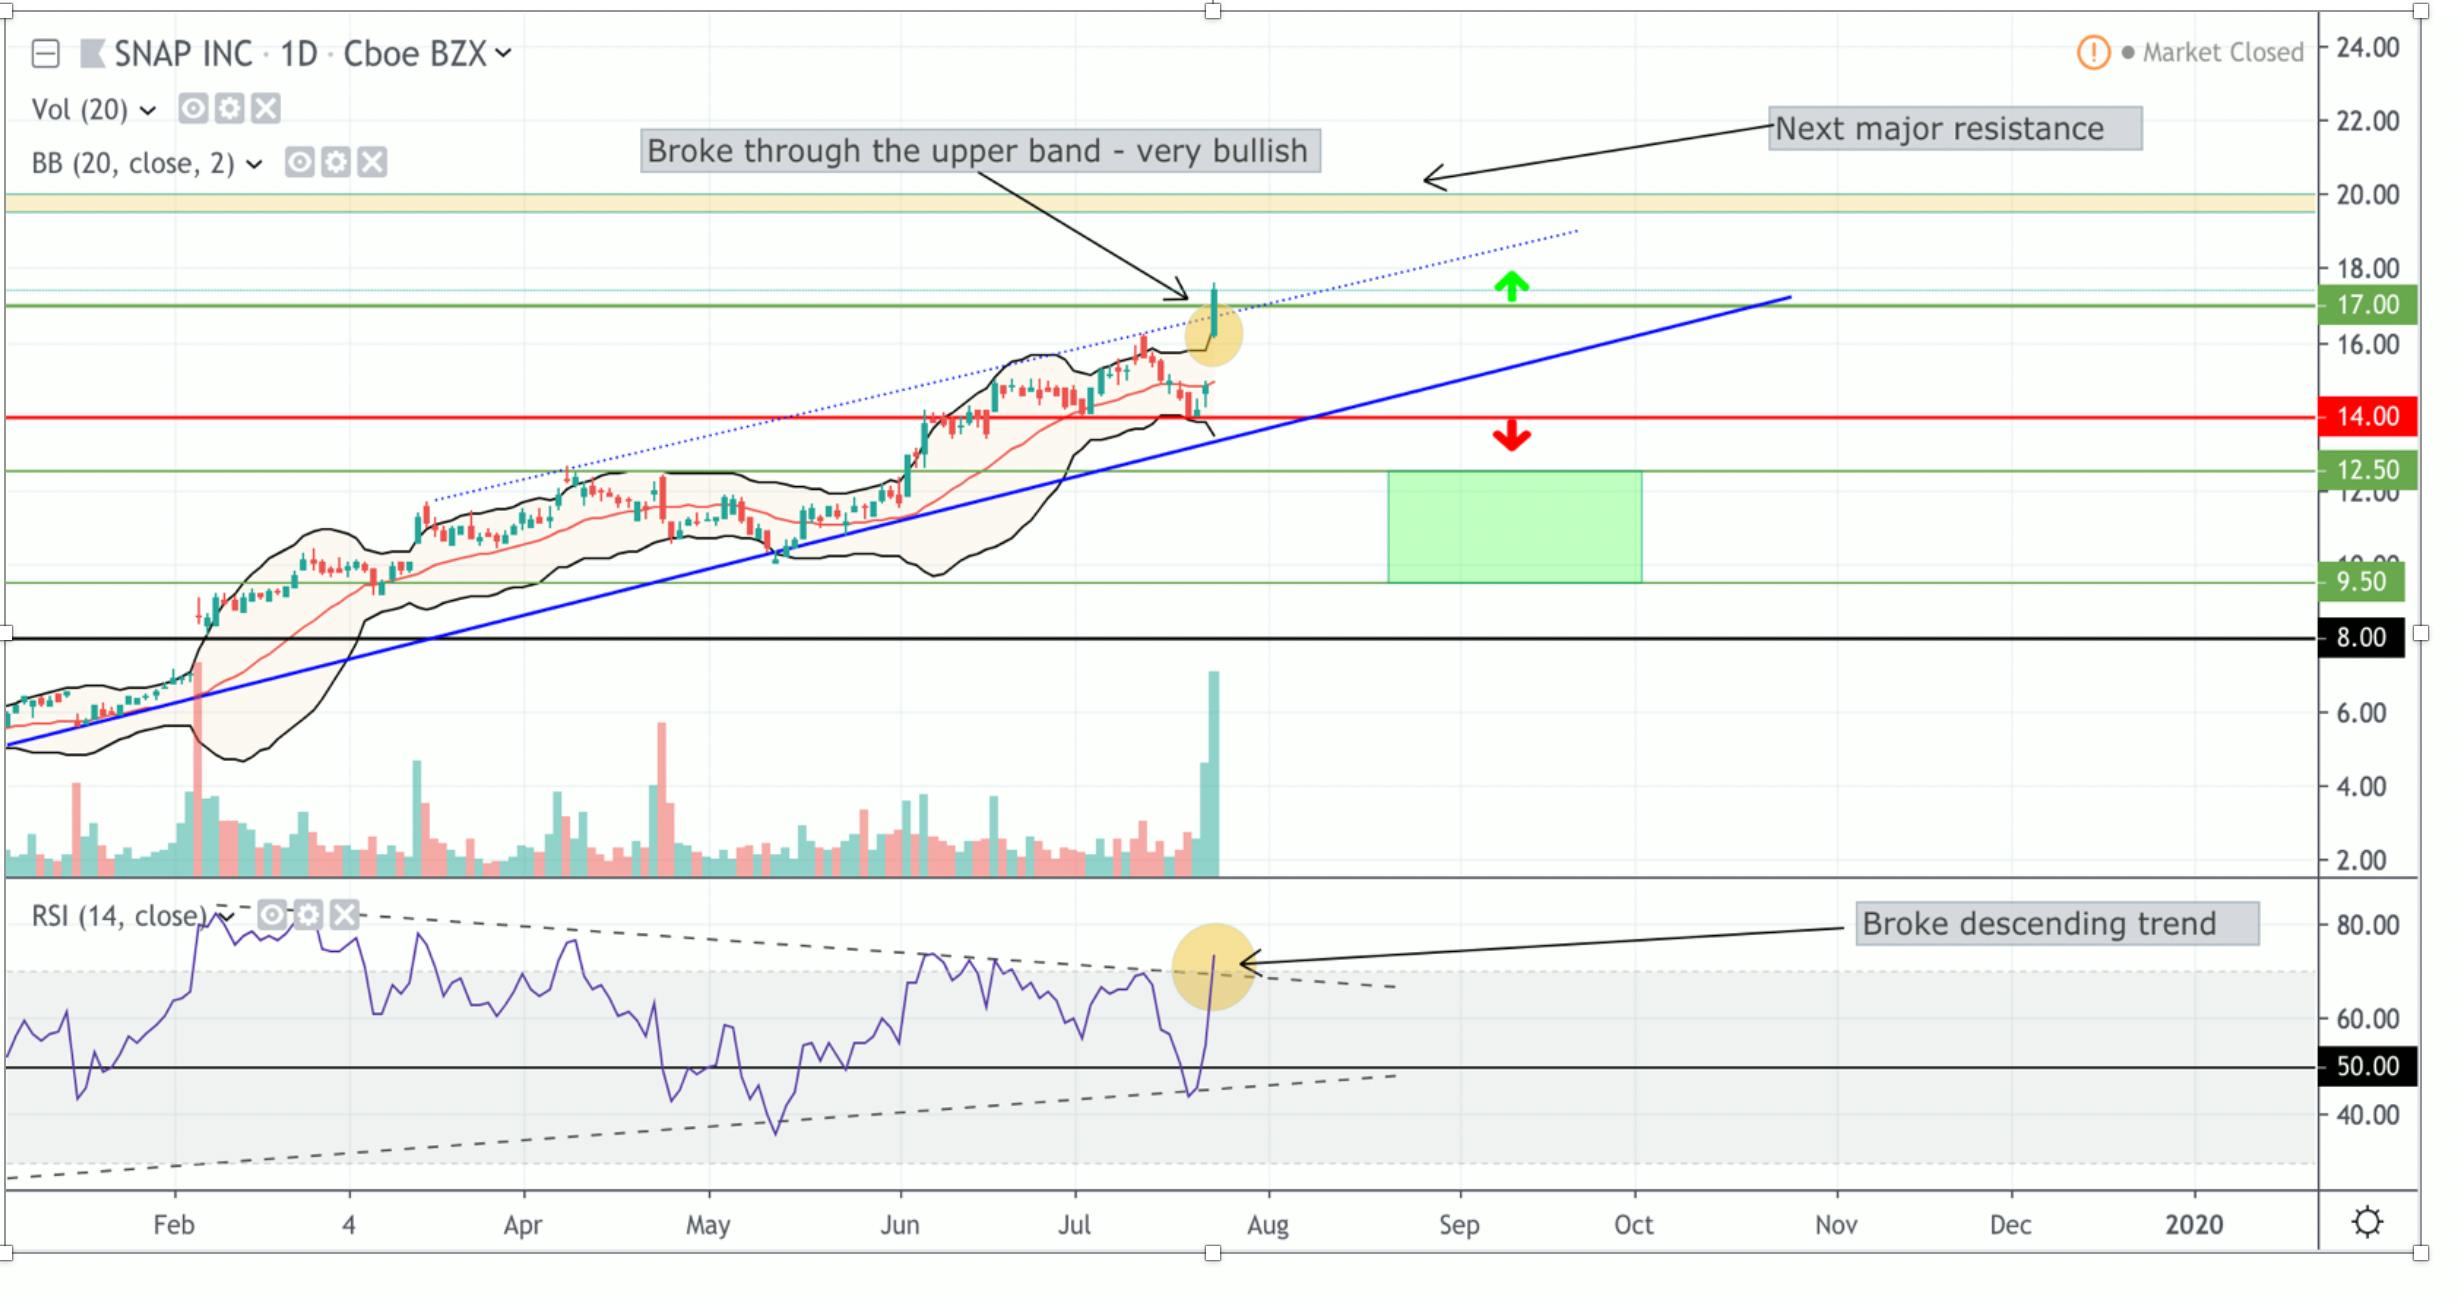
Snap broke out yesterday. As you can see in the chart above, Snap was following a steady trend channel (in blue), bouncing between this channel until today.
Our previous TA noted that Snap’s support was $14 and resistance was $17. Snap retraced, closed just above $14 on Friday/Monday and then sky rocketed above $17 the day following earnings. It not only closed above $17 but did so with high volume.
This is always a bullish sign. We will likely see it retest the upper trend channel (outlined in the lite blue dotted line, trending up), before testing the $20 resistance level above (in yellow). As long as Snap stays within this upward trend (outlined by the lower blue line), Snap should continue it’s upward movement.
Regarding the internals of Snap – notice the top yellow circle. This is highlighting the current price breaking through the upper Bollinger Band, while the lower Bollinger Band moves down. This is a very bullish indicator, which is supportive of higher prices.
Further supporting the internal strength, the RSI closed above the descending trend line, showing some new found buying pressure. As long as Snap holds the 55-50 region on the RSI, we should continue upward. However, keep in mind that broad market forces can raise and sink all ships, regardless of fundamentals. If the $14 support region is broken due to a weakening broader market, we could see the price fall into the green box on the chart ($12.50-$9.50).
Per Beth’s analysis, fundamentals are strong. The should be seen as a long term hold that will benefit from Audience Network in the second half of the year. If you’re in, mind your stops if the broader market moves downward. If you have yet to make a position, follow Snap’s retrace to the upper trend channel previously mentioned. That would be a good time to enter.
SNAP Forum:
Please check out our forum and post there if you traded Snap or have questions on Snap for community discussion. One user posted some great information on the number of funds moving into the stock over the past two quarters. Here’s the post:
Institutions have been moving into SNAP over the last 2 quarters:
Date # funds:
Sep 2018, 177 funds
Dec 2018, 168 funds
Mar 2019, 198 funds
Jun 2019, 321 funds
MongoDB outperformed the tech sector a few times over the past 12 months, most notably during Q4, when MongoDB managed to trade between $65 and $80. The stock recouped losses by early December, when MongoDB reached new highs at $90 per share. By March, MongoDB had gained more than 50% off its new highs to $152 in March.
MongoDB’s Atlas has proven to defy gravity even in the face of AWS launching a competing product called Amazon DocumentDB in January. This sent shares of MongoDB down 15 percent, with a few larger investors exiting based on the news, but the company quickly shrugged it off.
The first quarter results reported a 78% year-over-year increase in total revenue with a 82% increase in subscription revenue. Notably, the company reported first-quarter net losses of $33.2 million, or 61 cents a share, compared with losses of $26.6 million, or 53 cents per share, in the year-ago period. Adjusted losses were 22 cents a share.
AWS Pitches MongoDB Atlas at OSCON
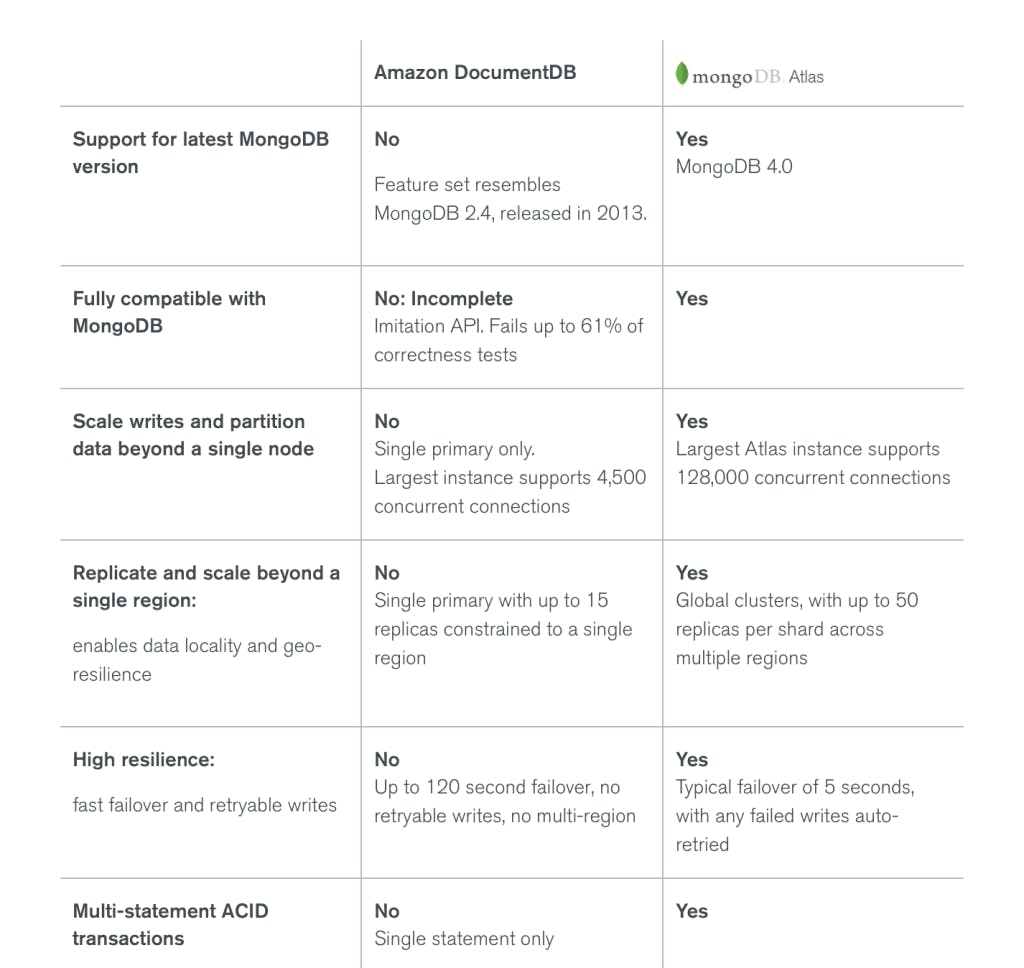
Amazon’s DocumentDB advertises MongoDB compatibility in its headline throughout the AWS website while MongoDB’s Atlas website focuses on the differences between the two products. AWS wants to be seen as a friend, but MongoDB thinks they are more of a foe.
Amazon’s NoSQL JSON document database is not based on the MongoDB server, however, and there are key differences which AWS’s product is unlikely to compensate for.
Here are a few:
AWS walks a razor edge between capturing the NoSQL database revenue segment or disrupting the customer base, who now have many options in cloud, including Microsoft and Google Cloud – both motivated to compete with AWS from any angle. Trying to disrupt MongoDB’s Atlas could have the opposite effect on AWS as developers are notoriously tribal.
Not surprisingly, last quarter, MongoDB announced a new business partnership with Google Cloud Platform with MongoDB’s Atlas integrated into the GCP console. MongoDB also announced new product features, including Atlas Data Lake, Atlas Full-Text Search and increased availability of MongoDB Charts. These upgrades will be hard for larger, more diversified tech companies (like AWS) to keep up with.
Needless to say, I was on the edge of my seat at OSCON when Amazon presented a keynote and pitched MongoDB Atlas to the crowd. At OSCON, Amazon stated that “AWS effectively endorses MongoDB Atlas as the segment winner” and that MongoDB Atlas is an “AWS reinvent 2019 top level sponsor.” Amazon also stated that Atlas growth has continued on the platform after the AWS DocumentDB release.
Takeaway:
The financial markets guessed wrong about AWS’s ability to compete with MongoDB. We see very little evidence that AWS’s DocumentDB has been a success with Amazon changing its tone at a recent software developer conference. One area that I have written extensively about is developer mindshare, as software developers are not easy to convince. You can access my analysis on Nvidia and developer mindshare here – the time to learn a new AI and ML platform is one reason I remained long on Nvidia during the crypto sell-off.
“Imitation is the sincerest form of flattery, so it’s not surprising that Amazon would try to capitalize on the popularity and momentum of MongoDB. However, developers are savvy enough to distinguish between the real thing and a poor imitation,” Dev Ittycheria, MongoDB’s CEO
In addition, IDC updated its forecast and expects the worldwide database software market to grow from $64 billion in 2019 to $98 billion in 2023. MongoDB’s Atlas is positioned to capitalize on this growth, especially as a flexible option for running applications on-premise, in a private cloud, or a private cloud, without being locked into any one cloud vendor.
After gaining 200% in the past two quarters, is MongoDB still a buy? Premium research members receive updated recommendations and entry/exit scenarios on tech stocks. Learn more here.Learn more here.
The O’Reilly Open Source Convention (OSCON) is an annual convention for the discussion of free and open source software. Open source has seen tremendous support over the last decade after going through a dark winter of software commercialization in the 80s and 90s. A historical turning point was when Netscape released the Netscape Communicator internet suite as free software in 1998 and the source code was used to spur Mozilla Firefox, Thunderbird, SeaMonkey and KompoZer.
Background on Open Source:
Proponents of Free and Open Source (FOSS) during the 90s included heavy weight Microsoft, Oracle and IBM. For instance, a Microsoft executive stated in 2001 that “open source is an intellectual property destroyer. I can’t imagine something that could be worse than this for the software business and intellectual-property business.” Fast forward nearly two decades, and Microsoft has reversed direction, and is pining for the open source community to accept the company as a contributor and supporter of open source.
Tim O’Reilly of O’Reilly Media, and the founder of OSCON, was at the strategy session in April of 1998 when the term open source was coined. Open source software today has won the war with most software development containing open source code and many previously opposed corporations changing their stance to support FOSS. According to the Open Source Initiative, the movement has caused a $60 billion loss for proprietary software, which correlates to $60 billion in customer savings per year.
This year’s conference reflected the relative calm confidence around open source development with most keynotes used for marketing purposes to win over the attendees on using their services rather than anything news breaking. Google, Amazon, Microsoft and IBM were among those bidding for the crowd in the keynotes.
Blockchain Technology Decline: False Signal?
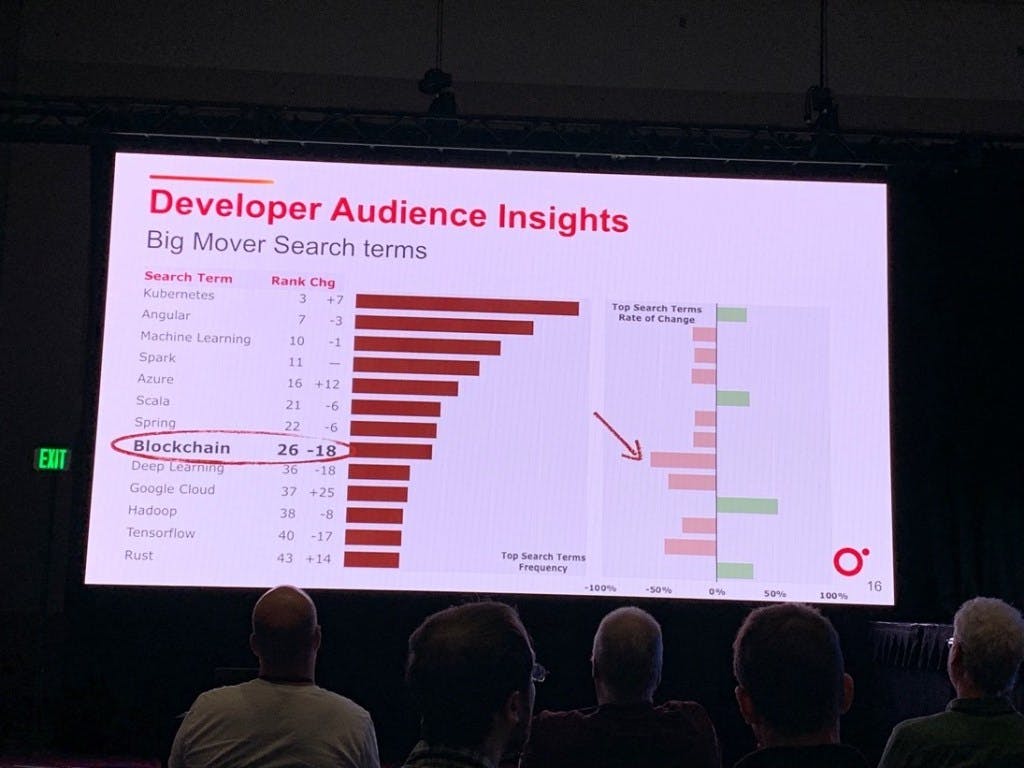
Interesting enough, O’Reilly’s insights showed blockchain technology losing interest from software developers in the keynote on developer audience insights. The term fell 18 points in their rank points to number 26 on search terms. Kubernetes, the open source container framework, was effectively number 1.
According to Brian Behlendorf of Hyperledger, blockchain technology is not likely to create the next Amazon or Google as it’s more of a cooperative consortium. In his session, “2019: Year of professionalization for open source blockchain,” he pointed out that 45% of companies stated they would join with their competitor on blockchain technology development.
With that said, 80% of companies have not put blockchain technology into production and the market is very early. Many mistakenly think blockchain technology is synonymous with crypto, however, some of the most compelling use cases today include traceability with the food supply chain, judicial consortium chain, routing and settling insurance claims, and digital identity within businesses and government agencies. These uses are currently being explored by companies, such as Wal-mart with FoodTrust, LegalX Chain, the Intelligent Health Care Network and the OrgBook.
Here are a few more companies putting blockchain technology into use:
NASA for secure flight data
Honeywell for used aircraft parts market
Chinese Central Bank’s has processed $4.36 billion on blockchain trade platform
Malta is using smart contracts to initiate and register rent remittance
Visa is planning to join a growing list of blockchain-based international payment providers
Behlendorf also pointed out that the United States is more averse to centralized technologies overall. Intermediaries in finance, such as SWIFT, are more comfortable for people in the United States compared to other countries around the world. Therefore, the trends presented by O’Reilly may not be reflective of blockchain’s use globally.
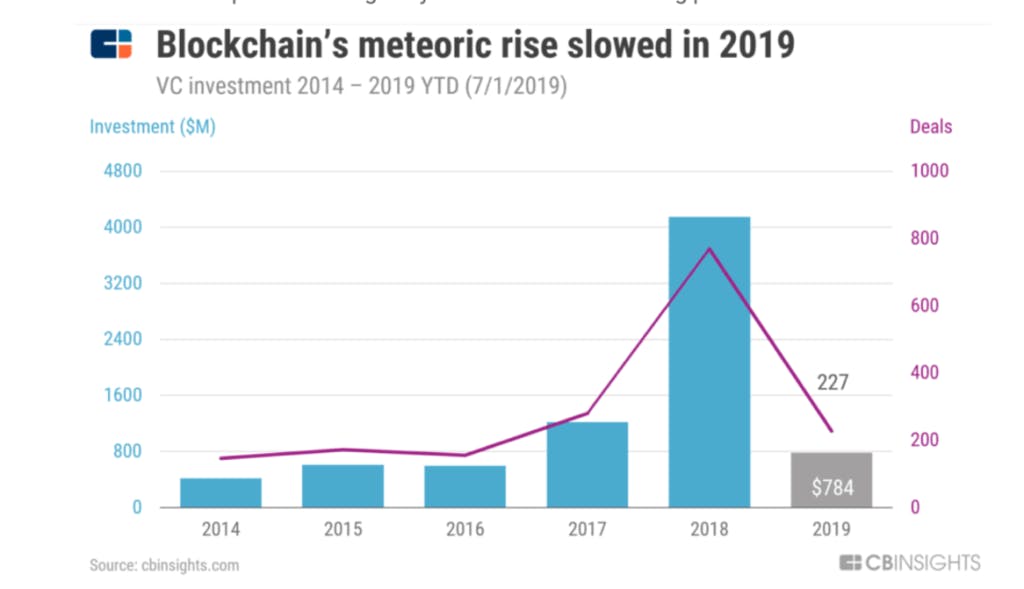
In addition, venture funding in blockchain technology has reportedly tumbled 60% in 2019 from $1.6 billion, down from $4.1 billion in venture funding in 2018, according to CB Insights. Taking a closer look, CB Insights reported an increase in early stage funding from 80% of equity deals in 2017 to 88% of equity deals in 2019, with funding nearly non-existent at Series D and E.
There are a few conclusions you can draw from this information:
Blockchain technology is incipient and not able to stand up to the premature pressure that initial coin offerings placed on the technology. With ICOs now fizzling, there is more wariness around blockchain than what is deserved (and scaring off VCs)
Blockchain technology is less of a venture-funded effort and more of a development effort, like a programming language or an internet protocol, with not much ROI to offer investors
Blockchain technology will be developed in-house at companies rather than requiring a startup ecosystem (similar to a new programming language)
Crypto is consolidating and other industries will need to be the impetus for blockchain’s commercialization
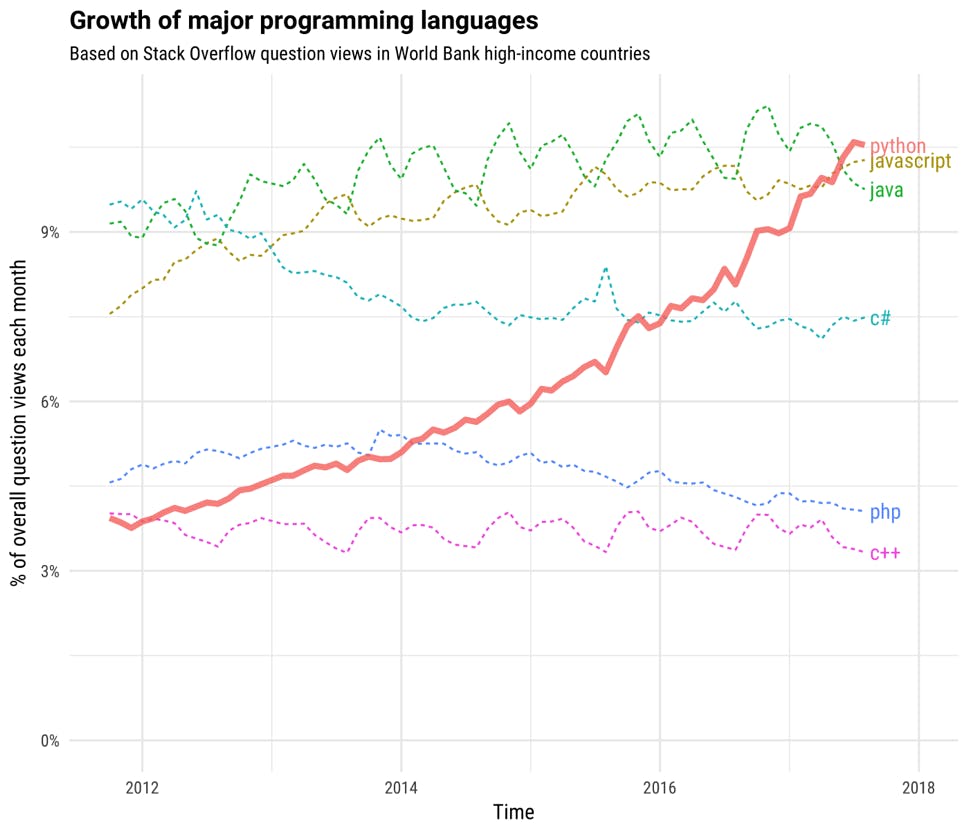
In the early 2000s, Python was a neglected programming language. Today, Python is the most widely used programming language, with the majority of the growth in the last five years. I think we are very early on blockchain and its potential should not be dismissed.
Conclusion:
Blockchain databases are revolutionary and will disrupt the way many industries record and share data (beyond the financial industry). The recent withdraw of blockchain development interest is very common for new technologies. You can think of disruptive technology products like an ocean wave that comes in stronger with each attempt. Crypto pushed blockchain too hard, too soon. The market saw dollar signs rather than carefully architecting sustainable blockchain applications. We will be keeping an eye on companies for cheap, early investments in this area.
Want to know my best alt-coin recommendation? Out of 1,500 coins, I believe this is the winner. Premium research members receive recommendations and entry/exit scenarios on my favorite alt-coin, bitcoin and tech stocks. Learn more.
Financial analysts and journalists continue to question why Google missed in Q1 2019. Without properly identifying the cause of the revenue miss, which was the slowest sales growth since Q4 2015, it is nearly impossible to predict how Google will perform in the future. Google executives offered very little on the earnings call.
“Alphabet Inc.’s growth is slowing, and analysts don’t have a clue as to why because executives aren’t talking … After releasing disappointing first-quarter results in late April, executives were vague, if not outright unresponsive, about slowing growth.” -Marketwatch, July 19th, 2019
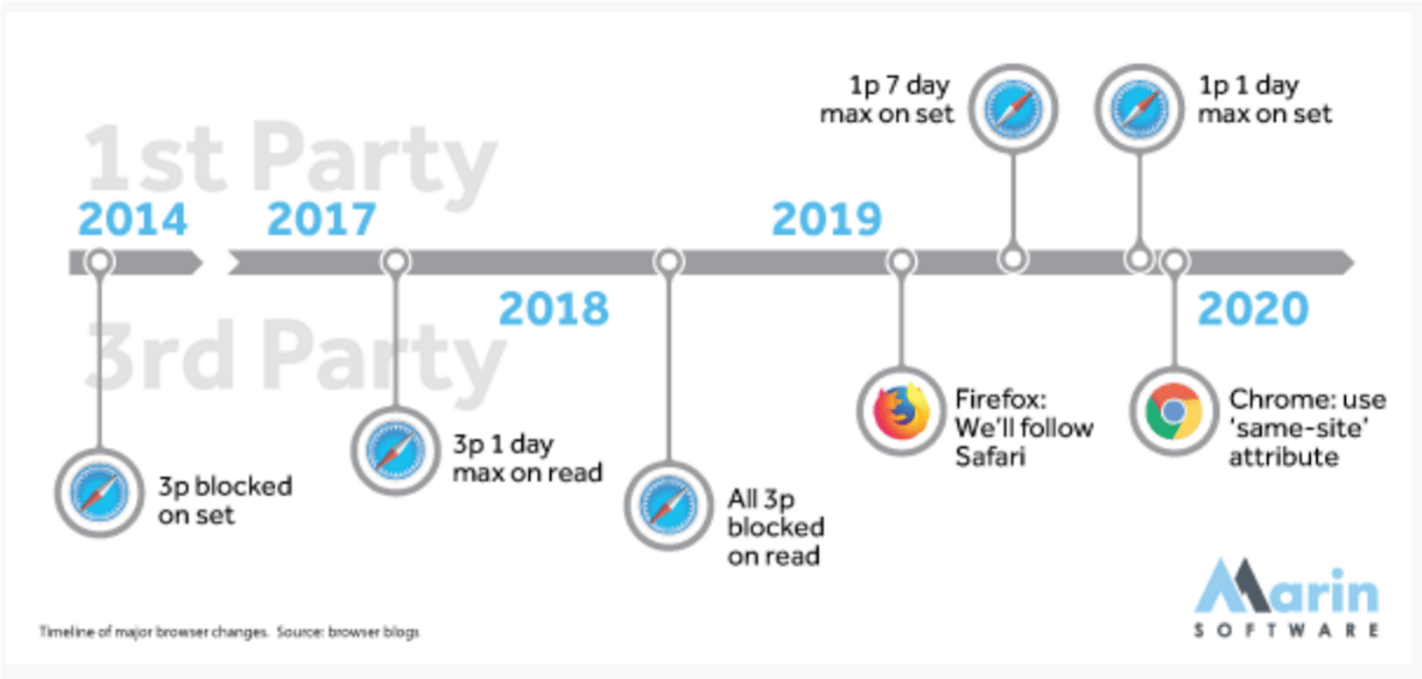
Deciphering exactly why Google missed is impossible to prove, although we believe the quiet contention between Apple and Google on browser ad-tracking may have played a role. The Safari browser captures 58% of overall mobile traffic in the United States with Chrome capturing 33.3%. In the UK, 45% of users use Safari and Mozilla. Therefore, Google’s revenue is susceptible to Apple’s Intelligent Tracking Prevention (ITP), with tighter restrictions going into effect throughout 2019.
There is also evidence of weakening fundamentals that extend beyond any one change to the way ads are targeted and monetized. We lay out these details below.
SECTION 1: PRODUCT OVERVIEW
1A. Apple’s Intelligent Tracking Prevention (ITP 2.1 and ITP 2.2)
Launched in 2017, Apple’s Intelligent Tracking Prevention (ITP) places a limit on how long cookies are available for third-party contexts. ITP restricts cross-site tracking for targeted advertising purposes by removing cookies after 24 hours. Login cookies are available for up to 30 days, however, login cookies do little for targeting purposes as they do not track a user’s activity. After 30 days, the login cookie is purged.
When Apple first introduced ITP in 2017, it did not have an effect on Google as users of Google’s search service and other properties visit these sites daily. ITP 2.0 was aimed towards third-party trackers, such as Criteo and Doubleclick. Some critics state ITP strengthened Google as one of few remaining options to target niche audiences at scale.
Apple continued to battle data collection on the Safari browser in 2018 by shutting down finger printing, a method of triangulating who a user is through fonts, screen dimensions and plugins.
We’ve seen statistics from publishers where they get half the CPM value as a result of ITP’s impact. If they can’t have good targeting, some of their sites become less worthwhile for their advertisers.” – Google, CES 2019
In March of 2019, Apple announced ITP 2.1, which prevents third-party cookies from being stored as first-party cookies. This update also puts a limit on how long first-party cookies can be stored of up to 7 days. To put this in perspective, a Google Analytics cookie, in theory, would last for up to two years. Safari can now delete it within 7 days.
The final hammer was dropped in May of 2019, when Apple announced ITP 2.2. This update is intended to limit any workarounds by limiting all tracking to 24 hours. This includes Google and Facebook. The result will be weakened attribution, which in turn, lowers CPMs due to weakened ad targeting.
Here’s a description from Digiday that puts into context how ITP 2.2. works:
“ITP 2.2 cuts the first-party cookie’s lifespan from seven days to one day. As a result, the first-party cookies that Facebook and Google have introduced in order to continue measuring site traffic and attributing ads will be deleted after 24 hours. As a result, if a person clicks on an ad for a product on Friday and decides to take the weekend to think about buying, then the cookie wouldn’t be around on Monday to register when the person returns directly to the site to buy the product.” -DigiDay, May 2019
ITP 2.2 will have more of an effect on Google and Facebook than the previous ITP releases. This release will prevent Facebook’s pixel and Google’s tag from using unique identifiers to store information. These tracking mechanisms allow Facebook and Google to track a person’s visits long after they have clicked on an initial link, as the first-party cookie had not expired due to their strong first-party relationships (most people use Google and Facebook every 7 days).
As DigiDay states, Google and Facebook are the companies most affected by ITP 2.2.
1B. GOOGLE’S CHROME BROWSER
The privacy changes implemented to the Safari browser and Mozilla’s Firefox puts Google between a rock and a hard place on the privacy terms and conditions for the Chrome browser. Either Google proactively follows Apple and Mozilla, or Google risks Chrome’s reputation.
On April 9th, 2019, an insider leak in Adweek stated Google is “contemplating a number of changes to its consumer and advertiser-facing tools.” The translation is that Google may follow ITP 2.0 by disallowing thirdparty ad tracking software across browsing sessions. The market penalized Criteo with a 30% stock pullback, TradeDesk with a 15% pullback, and Alphabet’s stock was penalized with a 5% pullback.
“According to sources, certain Google teams want to placate the growing zeitgeist around the protection of consumers’ data privacy, which has grown ever louder since the Cambridge Analytica scandal last year. These internal discussions also follow the implementation of third-party tracking restrictions on Apple’s web browser, Safari, and similar moves from Mozilla’s Firefox and Brave’s offering in recent months. Although the various businesses within Google advocate similar measures, the breadth of the company’s interests (i.e., the dominance of its Chrome browser and ad-tech stack) make its decision-making process more complex.” -Adweek article Google Mulls Third-Party Ad-Targeting Restrictions:
And as part of that, we will have more changes through the course of this year, be it Chrome — Chrome is super committed to making sure it's best-in-class in privacy and security, and we always put user experience first and follow through. -Q1 2019 earnings call
Privacy restrictions have not been implemented for Chrome, however, we are watching this closely.
PRODUCT OVERVIEW CONCLUSION:
Google’s revenue is susceptible to stricter browser ad-tracking policies. Due to some iterations occurring in Q1, this may have affected the decrease in revenue that was reported. Regardless, Apple’s ITP 2.2 is specifically aimed at Google and Facebook.
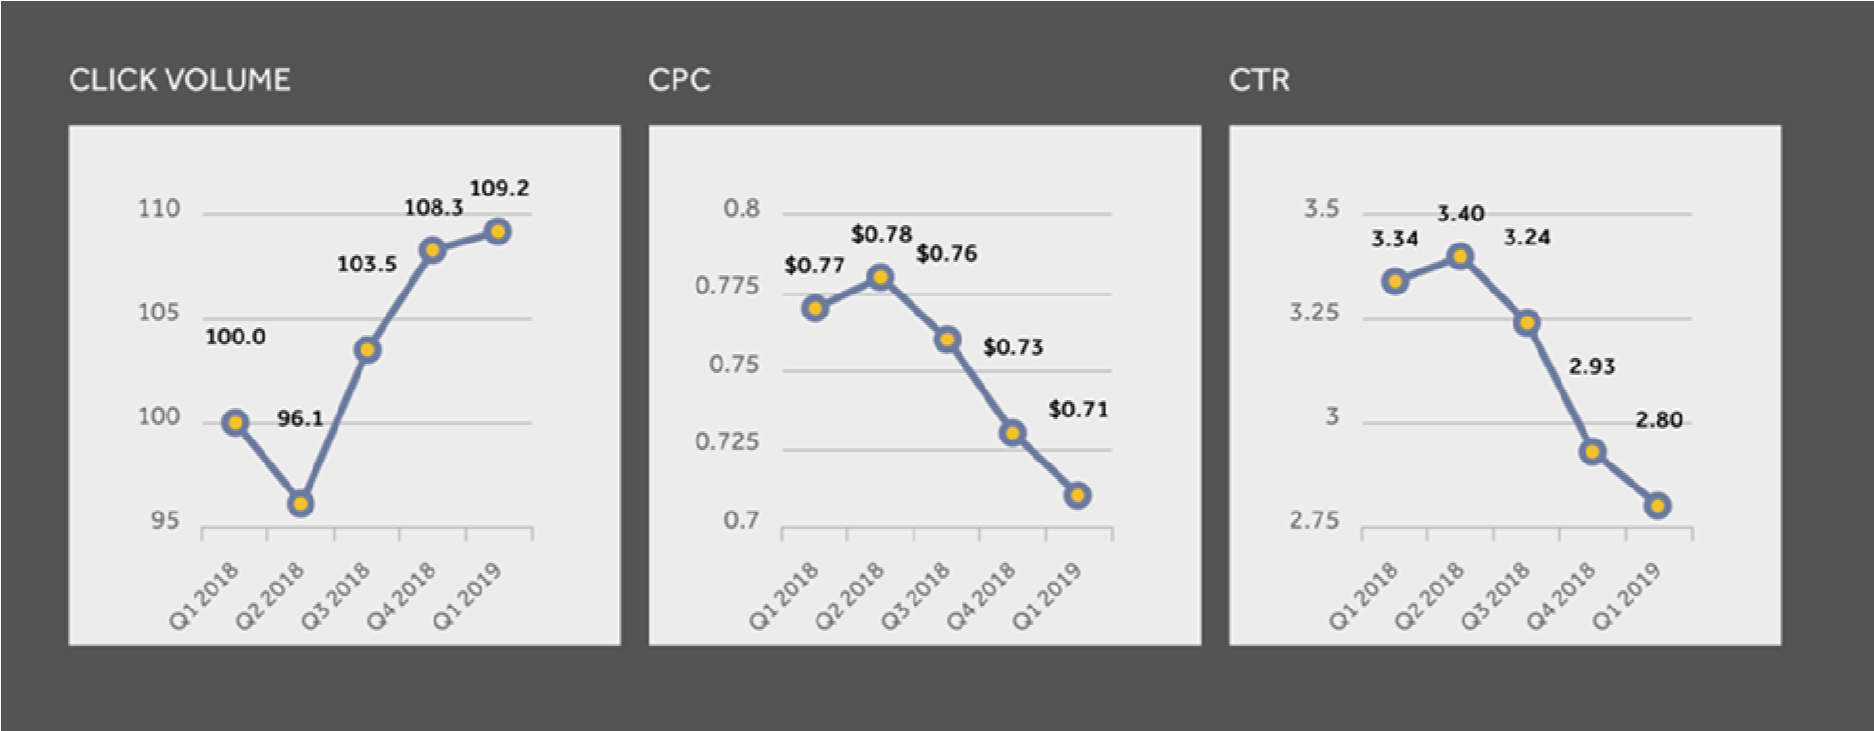
We know that ITP 2.0 affected third-party ad companies by reducing CPMs by nearly 50%. If targeting is weakened through ITP 2.2, we will see a decline in click-through rates (CTRs) and CPMs as the people seeing the ads are not as likely to engage with the ad due to a lack of tracking/targeting. There is evidence that ITP 2.0 and ITP 2.1 may have already affected CPMs and CTRs (see below).
If this is the cause of the minor revenue miss, the situation should surface by Q3 – and most certainly by Q4.
Recommended Reading: Fallout from Apple’s ITP is Severe
SECTION 2: FUNDAMENTALS
2A. Q1 EARNINGS
Google is transitioning into a slower-growth company across most metrics. Earnings per share are expected to grow 4% to $45.46 although analysts are calling for a rebound of 18% EPS to $53.65 per share in 2020[1].
Google on April 29 reported earnings that topped expectations, excluding a $1.7 billion European Union fine. However, revenue fell short of estimates. Google’s advertising revenue rose 18% to $30.7 billion, missing estimates of $31.5 billion. This caused Google’s stock to sell off, falling below 1,236.54.
Analysts have a consensus of $11.49 EPS for the upcoming quarter (source: NASDAQ). Notably, Google beat on earnings but missed on revenue in the last quarter.
· Google’s 2019 revenue is expected to grow 17.3% to $160.5 billion from 23% sales growth in 2018.
· Revenue is projected to slow to 16.7% to $187.3 billion in 2020.
· Operating margin fell 21% in the December 2018 quarter, down from 26.5% in the first quarter of 2017.
· Capital spending rose to 18% of revenue in December 2018 quarter, up from 10% two years earlier.
Notably, EBIT, EBITDA and FCF were all stronger than expected, but the concerns around slowing growth in the Websites revenue segment is likely to affect stock price in the near-term.
"As expected, Google ad revenue growth has been slowing amid downward pressure on ad prices, especially for revenue coming from international markets," -Monica Peart, senior forecasting director at eMarketer.
“We appreciate quarterly results can be volatile and acknowledge the company’s long-term focus, but the magnitude of the deceleration on a constant-currency basis marked the largest sequential move down since 3Q12,” -Deutsche Bank’s Lloyd Walmsley.
“Overall, we expect GOOGL shares to be under pressure in the near-term given sub-20% revenue growth & downward earnings revisions. As noted above, the exact drivers of GOOGL’s slowing topline are unclear, & we believe frustration around GOOGL’s lack of transparency will only increase.” – JP Morgan
SECTION 2.2: Key Metrics
Aside from regulatory pressure, Google is already seeing some weakness in its core business with ad click volume rising but cost-per-click (CPC) growth trending downward. According to Marin Software and Merkle, CPC has slowed over the past five quarters.
Source: Marin Software
According to last quarter’s earnings, paid clicks on Google properties grew 39 percent, down from 66 percent in Q4 2018. The cost of the clicks also declined by 19 percent.
FUNDAMENTAL ANALYSIS CONCLUSION:
From an analyst’s perspective, it is very difficult to say a debt free company with $110 billion in cash that is growing at a rate of around 17% is at high risk over the next 2-3 earnings seasons. There are plenty of ways the product issues noted above could be alleviated. Placing ads in Google Maps could make up for lost revenue from browser changes, with one estimate valuing ads in Google Maps at $9 billion by 2023.
However, we feel that the changes to Apple’s Safari browser and Mozilla’s Firefox will have an effect on both Google and Facebook. Combined with weak technicals, I am placing a Hold on these two stocks with the anticipation they may enter a Sell recommendation over the next two quarters.
PART TWO: TECHNICAL ANALYSIS
Time Frame Comparison
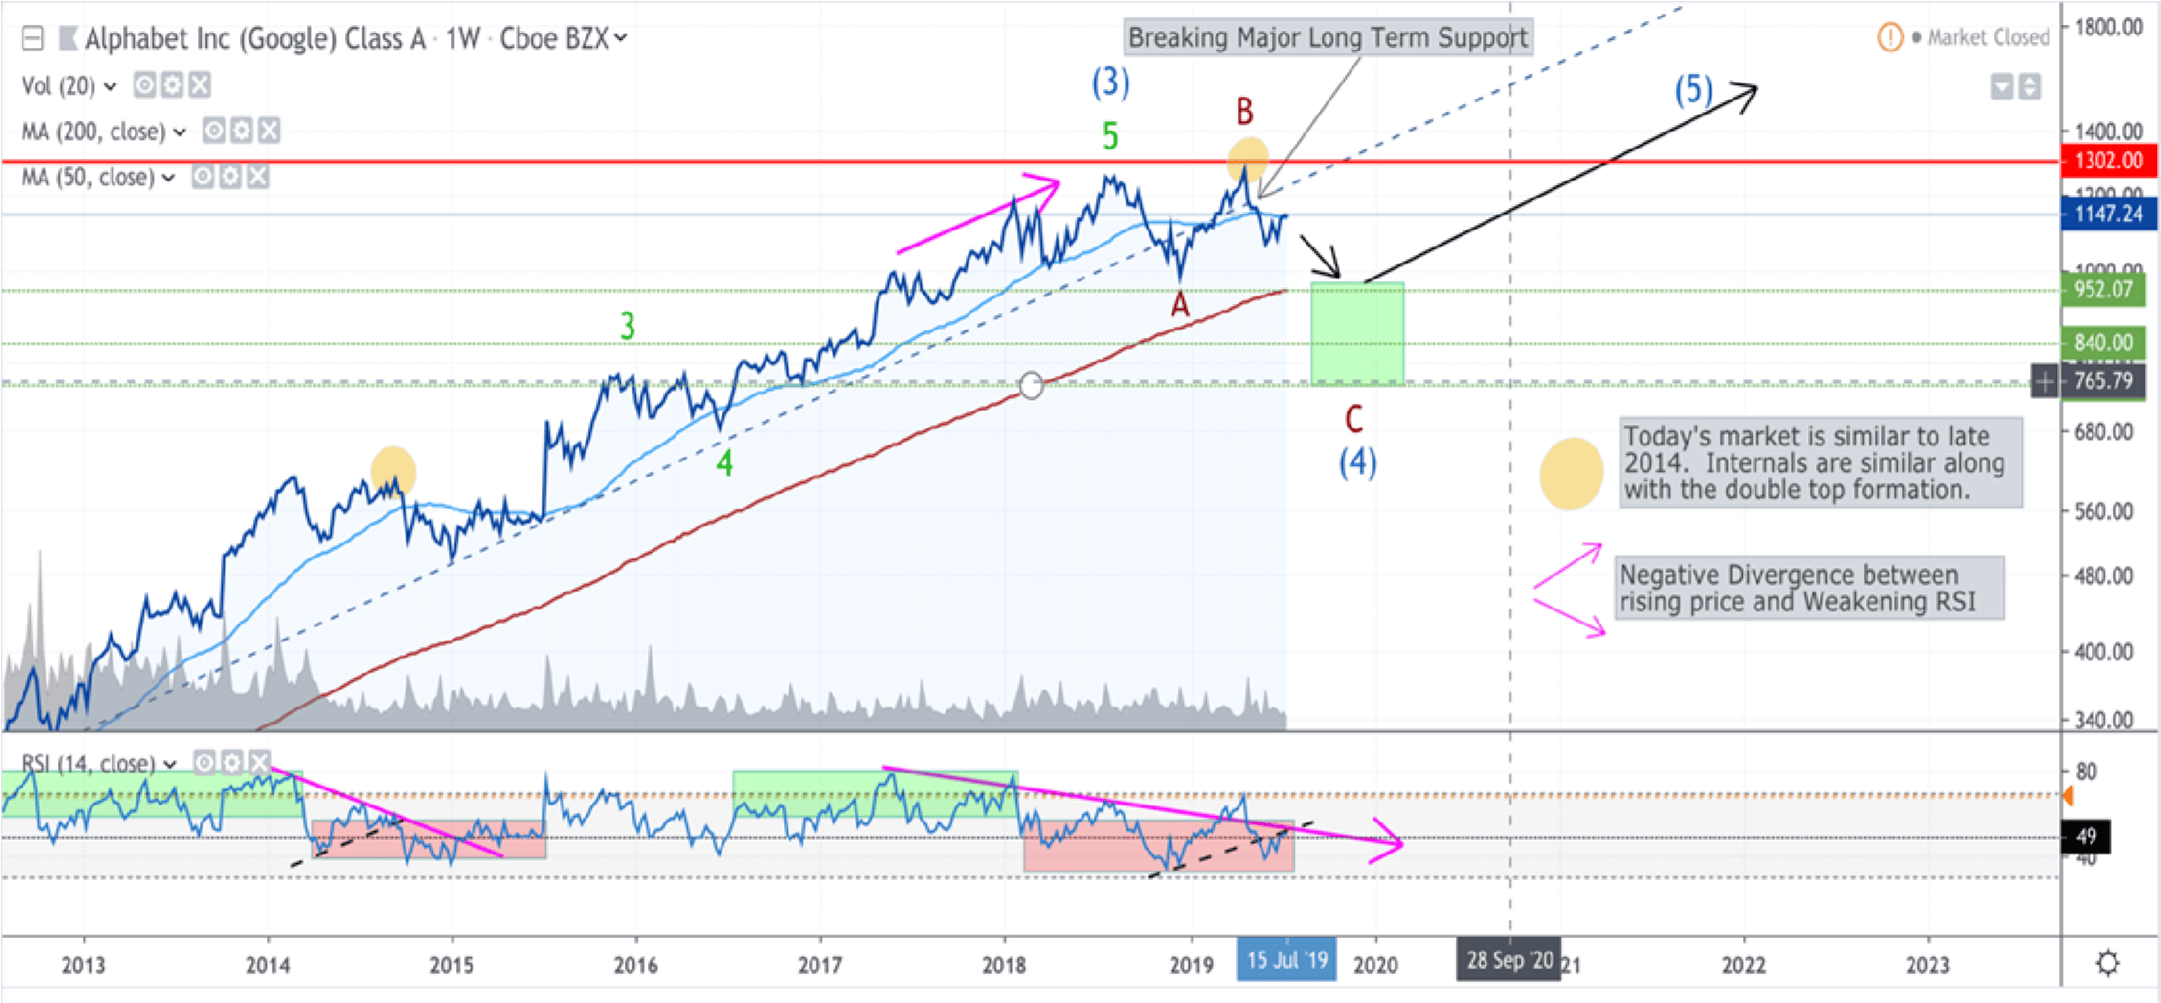
Currently, Google’s price action is in a weakened state that warrants caution for longs. Some have likened Google’s current price movements to 2011, which a case could be made. I believe its price is eerily similar to late 2014, which is highlighted in the yellow circle in the chart.
That yellow circle shows where we are today vs. where we were in late 2014. What you’ll notice is that in both time frames, we completed a double top pattern on decreasing volume (where the yellow circle highlights the completion of that pattern). The initiation move down then took us below the 50 Day Moving Average.
Also, you’ll notice the similarity of the internals, as outlined in the RSI. Google, on higher volume, was in a strong uptrend in 2014, which can be seen in the elevated RSI levels in green. Then, as volume began to decrease, the RSI suddenly drops below 50 and starts to make lower highs, unable to break back above 60. In fact, at the double top peak in 2014, you’ll notice the RSI dropped below 50 and began the bearish internal pattern in red.
There is similarity between 2014 and today. We have the same double top confirmation with light volume, and very similar RSI changes from bullish in green to bearish in red.
Today, we have broken the 50 line on RSI, attempted to retest it, and broke below it again.
Further evidence of weakness in Google is found in the pink arrows. You’ll notice as the price of Google increased, the RSI was making lower highs, which is negative divergence – and usually indicates weakness in buying pressure and signals a drop in the near future.
And finally, the blue dotted line indicates long term support, which started at the beginning of this cycle uptrend in March of 2009. This is very strong support, which did not break in 2015 or 2016. Today, we are comfortably below this support, which, once again, is not a good sign for the near term.
Elliot Wave Analysis
According to Elliot Wave Theory, the 5 waves up/3 waves down framework is fractal. So, this is happening on multi-decade super cycles to minute moves in the market. In interpreting where we are, the 5-wave impulsive move up started in March 2009 and has completed its Wave 3 (July of 2018), and we are currently in the 4th Wave retrace.
Google, being a major part of the broad market, mimics the same movements. Thus, Google is currently in the middle of an A-B-C, Wave 4 retrace, which began in Late 2018 and appears to end in late 2019/early 2020. I believe we have completed the B wave and are now beginning the C wave down, which has the potential to take us sub $1,000, and in a worst case scenario, as low as the mid $700 region.
Based on my primary count using Elliot Wave as well as the internal structure of Google, I believe a retrace is likely. What would invalidate this count, which would force me to reassess a new count, would be if Google makes new highs – around $1300. An update will be provided if this occurs.
Scenarios:
• If you are long on Google, put a disciplined trailing stop on the stock and re-enter when the technicals and fundamentals agree on a more bullish outlook.
• If you want to trade conservatively, wait for Google to miss on revenue a second time between Q2-Q4 2019 and enter a short position or long-dated put. Especially watch for the effects of Apple’s ITP 2.2 as if/when effects are reported in Q2 or Q3, they will worsen over the course of the year.
• Higher risk scenario would be to purchase OOM puts that ends in March of 2020 prior to earnings.
• Any short positions should be closed if Google makes all new highs around the 1300 mark. Shorting stock is all about timing and discipline. We will update as we go along if support or resistance is broken.