Market Update: April 26th

Broad Market Levels

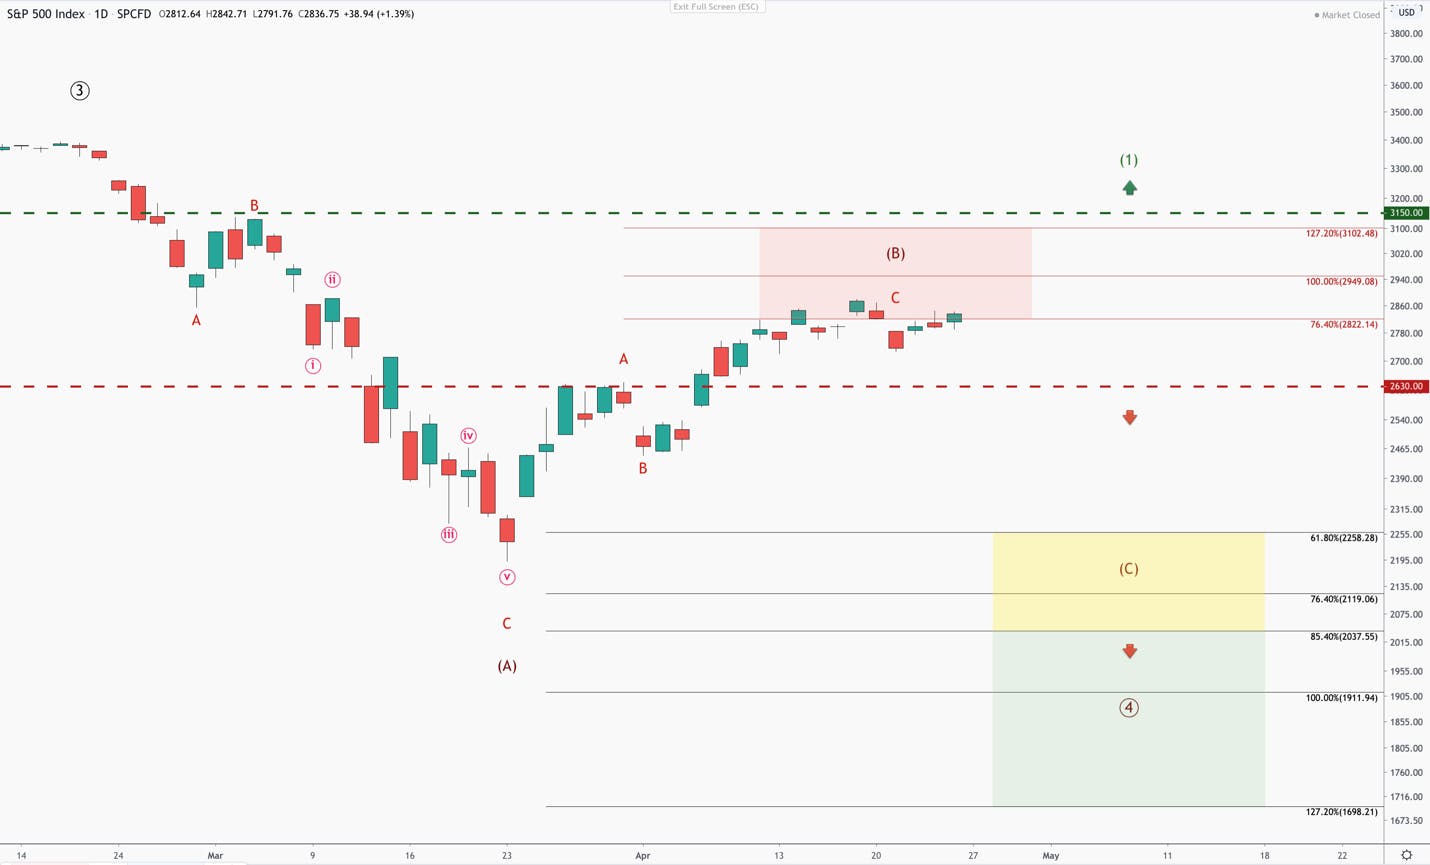
The broad market is currently range bound between 2900 and 2700. The last couple of weeks has been a notable back and forth between the bulls and bears in an attempt to breakthrough this range. From a purely technical perspective, this is what I’d want to see before saying which way this will go:

  • For a bullish trend to resume, I want to see the S&P 500 break above 2950 and then finally 3150 for me to believe that we are in a new bull market. If this is the case, that will likely be the end of 1 of 5 large degree waves off the March low. So, I will look to add to my longs in the wave-2 drawdown, which I see taking us back to the 2800-2600.

Wealth is built in bull market, and if this scenario plays out, we will likely have several years of an uptrend to profit from.

  • For the bears, they will need to break below 2630 for me to believe that what we have witnessed over the last month was in fact a bear market rally. If this is the case, my initial target will be between 2250 – 2050. If 2050 breaks, expect a prolonged bear market.

If 2630 is broken, expect tech to be the leaders down this time around. There has been an extraordinary concentration of new assets both directly from retail as well as in passive strategies in tech, which has made the top 6 mega-cap tech names account for over 20% of the S&P 500. With such narrow leadership, the direction of these names will lead the market. As of now, we are positioned for both scenarios.

The below chart offers a visual of the above outlook
Stock Updates

Roku (ROKU)
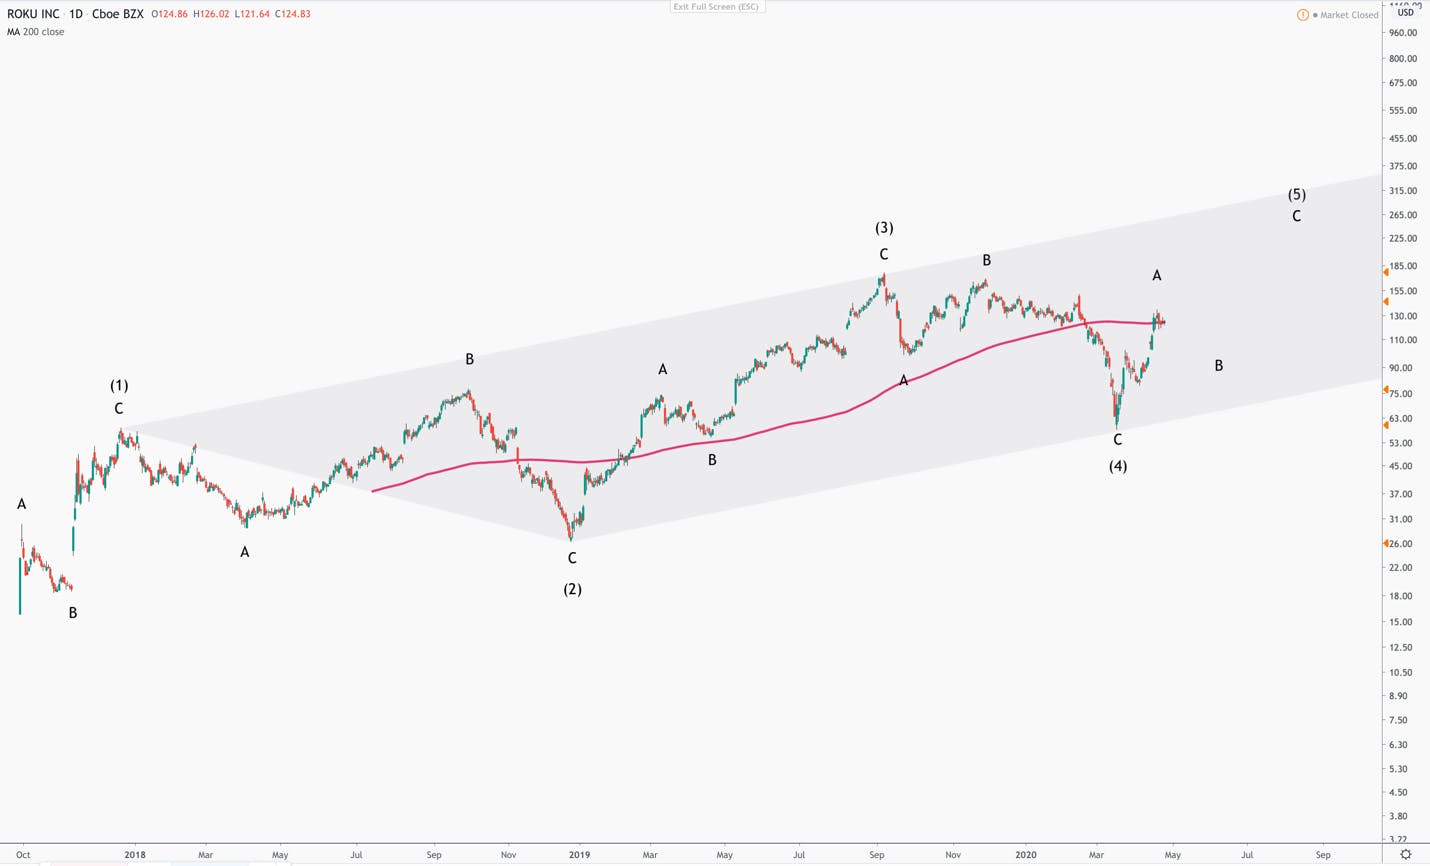
The above chart shows the long-term structure of Roku since its IPO. It has clearly been trading in a larger degree “leading diagonal” pattern. This pattern is a 5-wave pattern that travels within a trend channel (in gray). Furthermore, each of the 5 waves has an internal structure of 3-waves (A, B, C).

With Roku’s fall in March, it tagged the bottom of the lower channel, and began a 3-wave move up. Once it broke above the 200-day SMA (in red), the probability shifted that the low is in for Roku.

If this is true, it should give way to a B-wave correction back to the $102-$86 region. If the correction holds above this region, and begins a 5-wave pattern up, it is likely that we will no longer see this price range again with Roku. However, if Roku breaks below the $86 region, we will retest the lower end of the gray trend channel and possibly the lows from March.
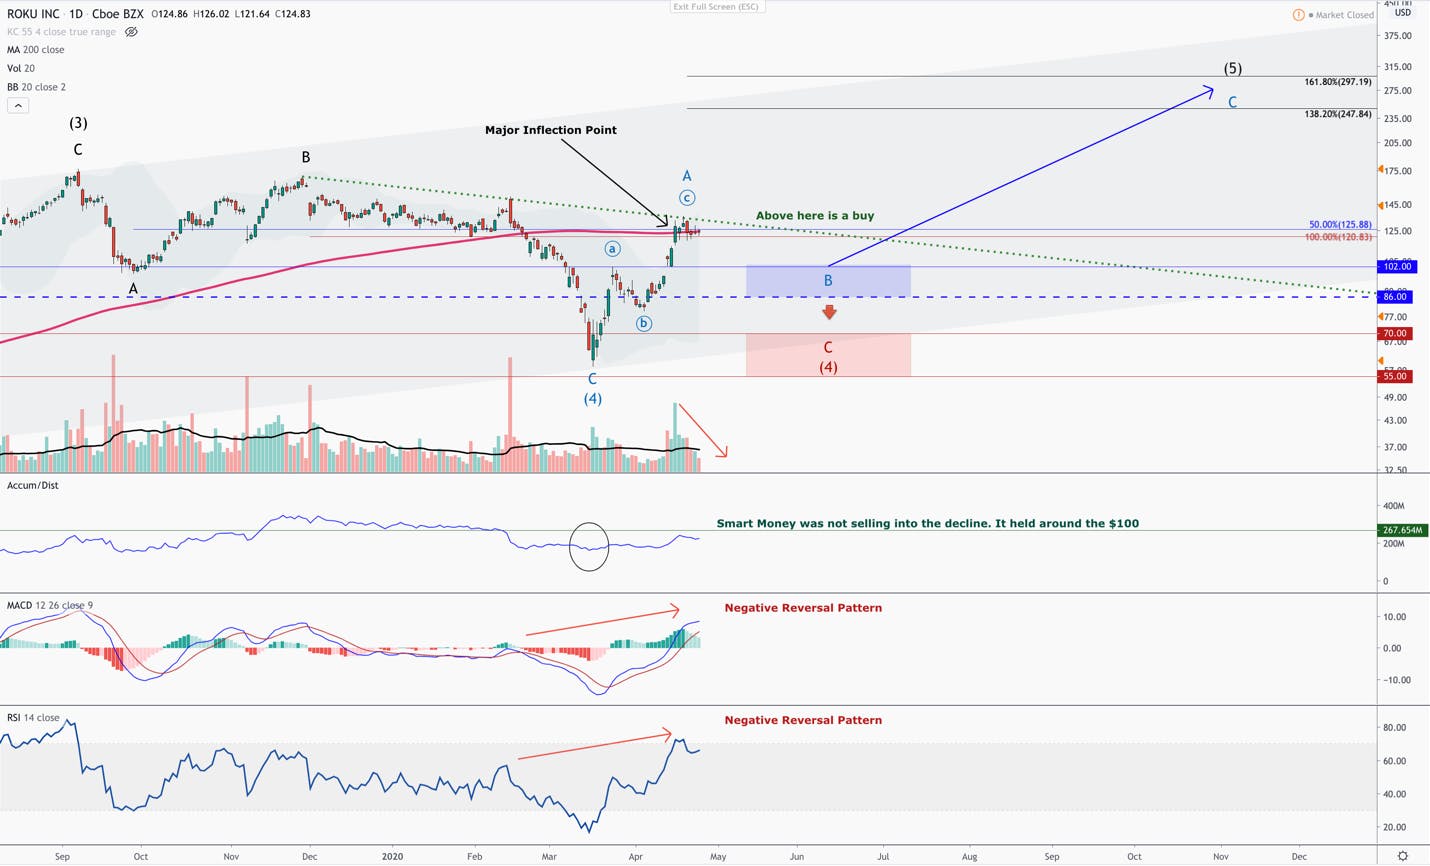
This chart shows a close-up of where we are. The price is currently at an inflection point. It’s trading at the 200-day SMA, bouncing below a trend line and also trading between key Fibonacci price clusters.

If Roku can break above this region with heavy volume, I’d consider it a buy with a stop just below the $120 region. However, the internals are suggesting that the momentum is weakening while at this key level. I will look to add to Roku on the next pullback if it can hold the blue price box between $102-$86.

One final note – the Accumulation/Distribution line tracks, loosely, what “smart money” is doing. In other words, it factors in the closing price vs. the highs, assuming that the smart money makes allocations in the final hour of trading. As Roku’s price collapsed, notice how the Accumulation/Distribution line held up. The $102-$86 price region seems to be an area that smart money is accumulating, so it should act as strong support.  

Slack (WORK)
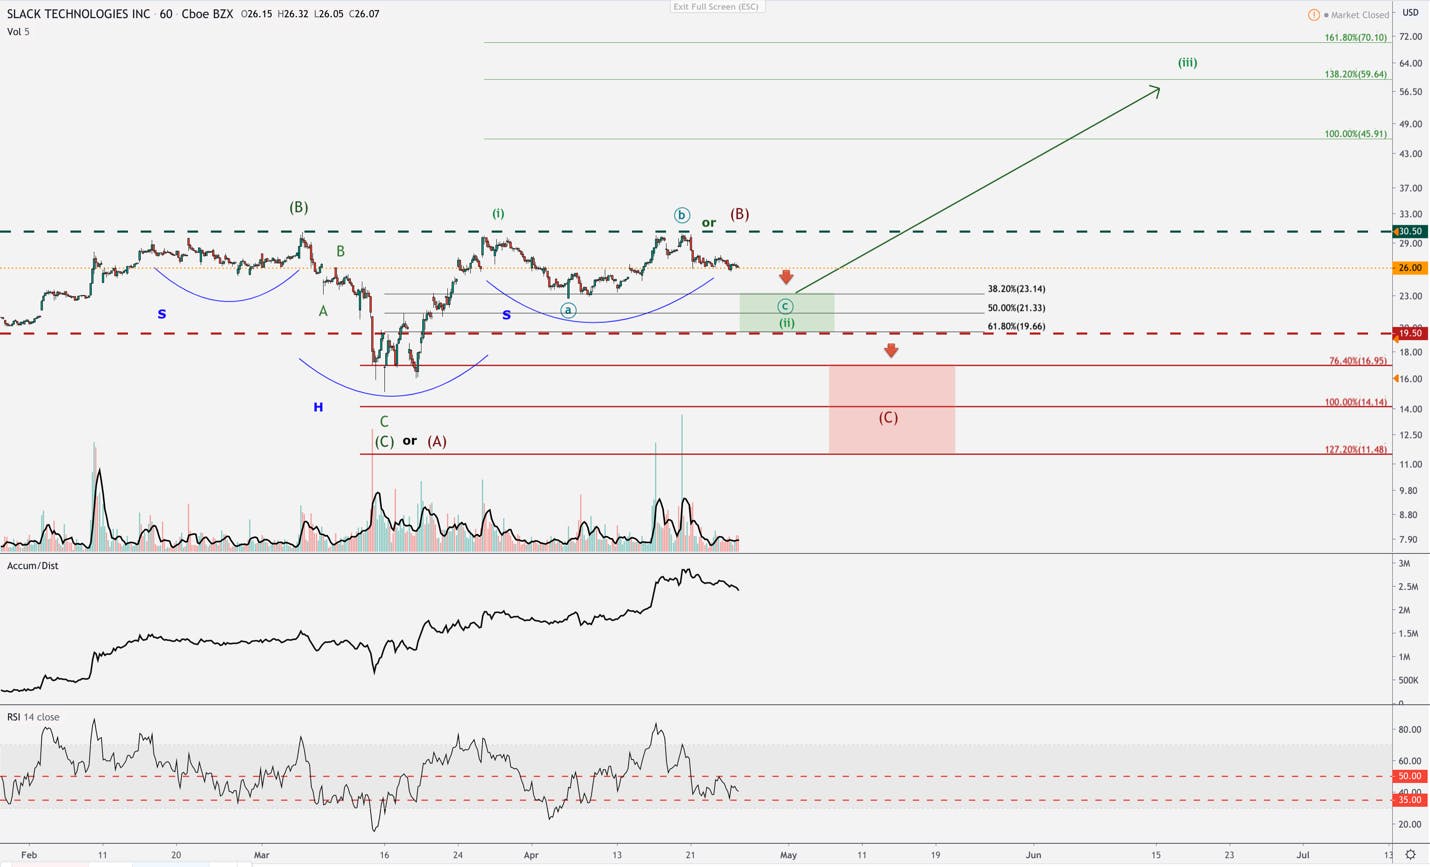
Slack is forming a head and shoulders pattern as it continues to attempt a breakout above $30.50. However, until this is confirmed with a breakout on heavy volume, the pressure is still down.

The above structure is suggesting that two scenarios could be playing out:

Red count: WORK is stopping out in a B-wave, and about to give way to the final C-wave down, which should take us to the $17-$14 region. I will want to see the RSI break below 35 and price break below the $19.50 region with force, before making this scenario the most probable. Regardless, we consider Slack within this target zone a buy and hold for many years to come.

Green count: This count has Slack pulling back to the $24-$20 region, holding and then breaking through the $31.50 region to confirm the head and shoulders pattern. If this is confirmed, Slack will be in a larger degree wave-3, which I will target between $60-$70 before completing. We will want to see the RSI break above the 50 line to suggest this scenario is in play.

As of now, if the green count is active, we are in a wave-2, which could be shallow like Zoom’s wave 2 before breaking out over $70. So, if you want to go long, a good stop would be under the $19.50 region. If price closes below $19.50, the red count is in play.

Zoom (ZM)
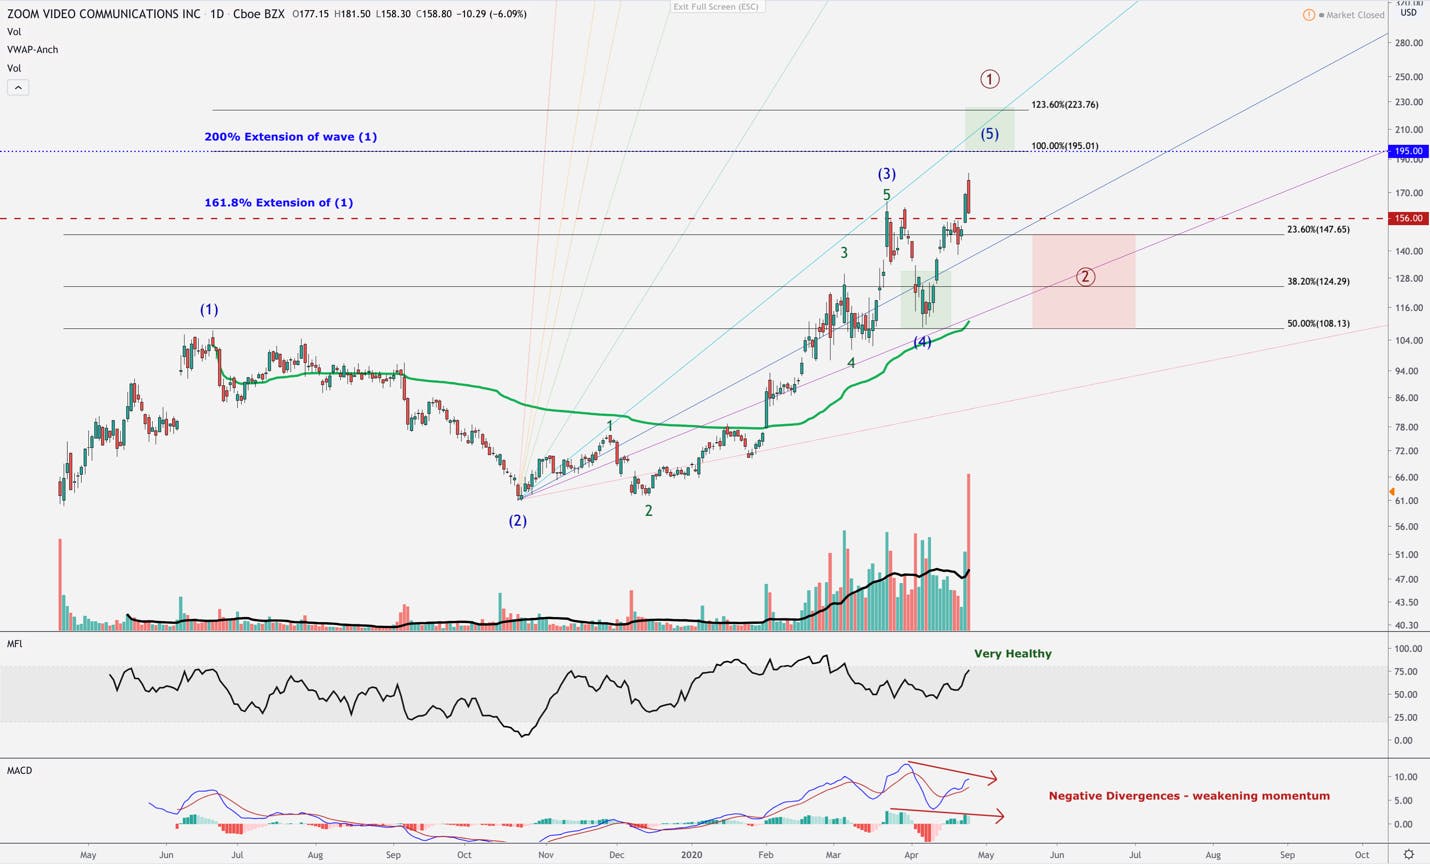
Zoom has clearly bottomed in its wave-4 and is actively in the final 5th wave (in blue).

Considering this 5-wave impulse has been a textbook impulse, I’m expecting the 5th wave to top out between $195-$225.

We’re starting to see some divergences in the MACD histogram, which is very common in the 5th wave. The MFI, on the other hand, still has room to go and is not showing overbought conditions yet. So, even though we have enough in place for the final 5th wave to be complete, I think it’s likely we tag at least the $195 region.

This will complete the large degree wave 1, and give way to a large degree 2nd wave pullback, which I believe should hold the $100 region. We are now holding our position with no stops.

Datadog (DDOG)
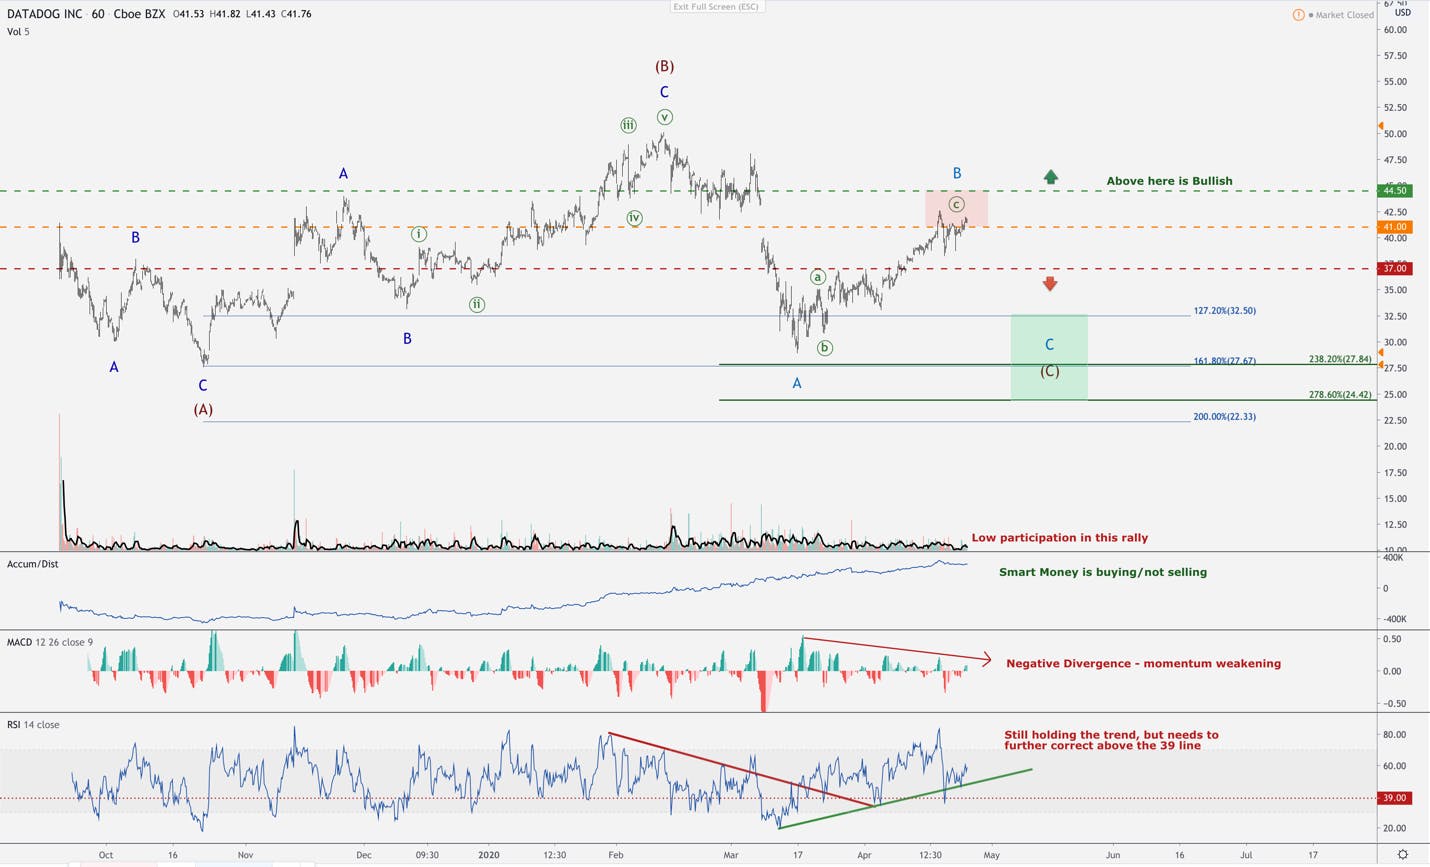
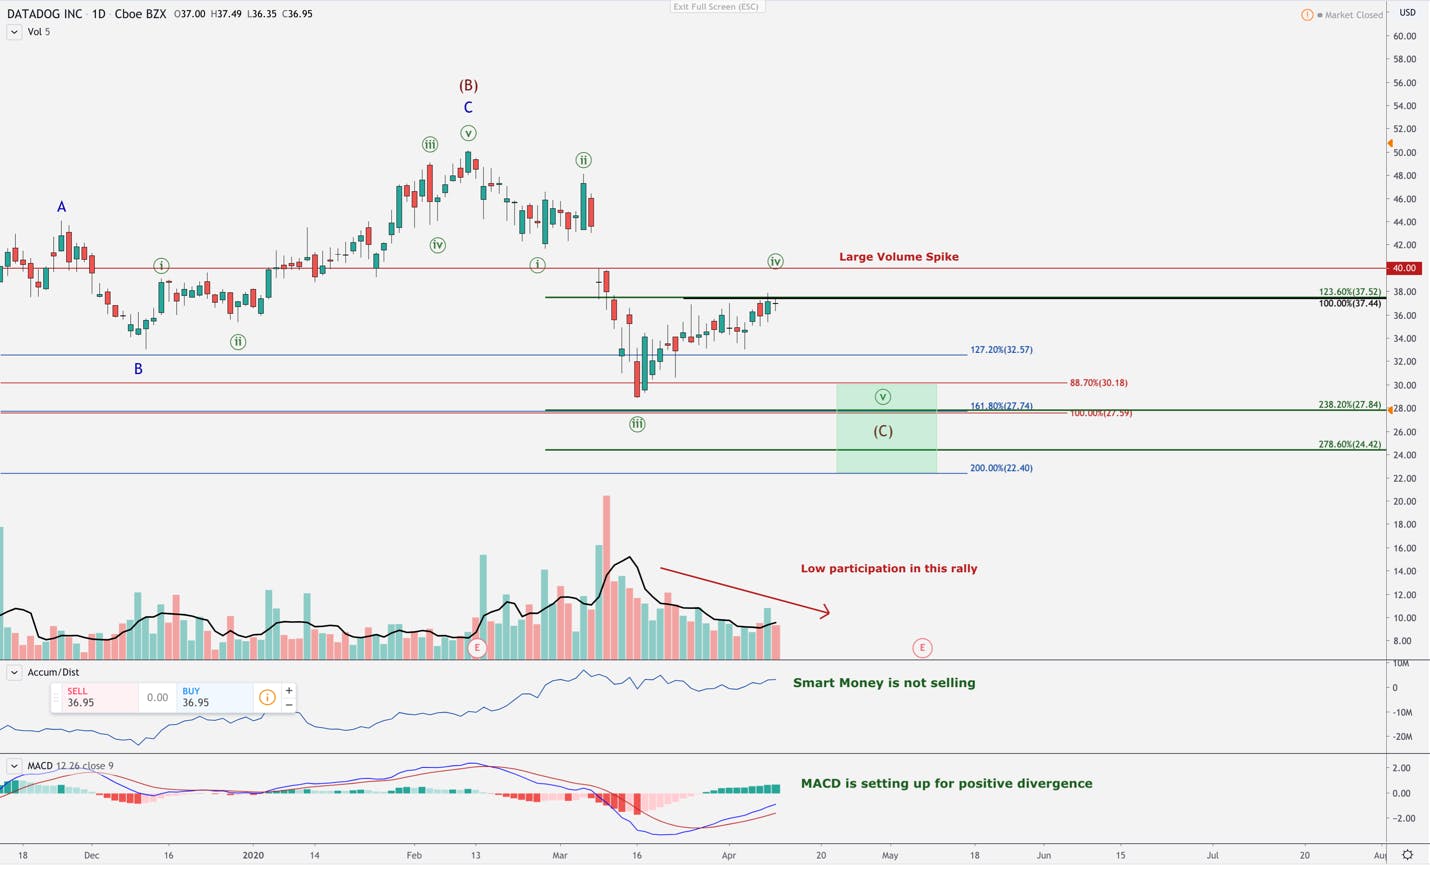
Our trade, so far in Datadog is up about 20%. The structure of DDOG is suggesting that we are in a corrective, larger degree B-wave (in green on the chart). If the price can break above $44.50 on heavy volume, I will be leaning towards the low being in for DDOG and scrap the B-wave count for a more bullish one.

The momentum in the MACD histogram is weakening as price increases. It will be difficult for Datadog to break this resistance on the current attempt with weak momentum. The RSI is also showing a clear trend in green. If this trend fails, and falls below 39, we will likely hit the $37 region.

If price breaks below the $37 region, the green box will be in play, and we will look to add to our position between the $32-$22 region.

Okta (OKTA)
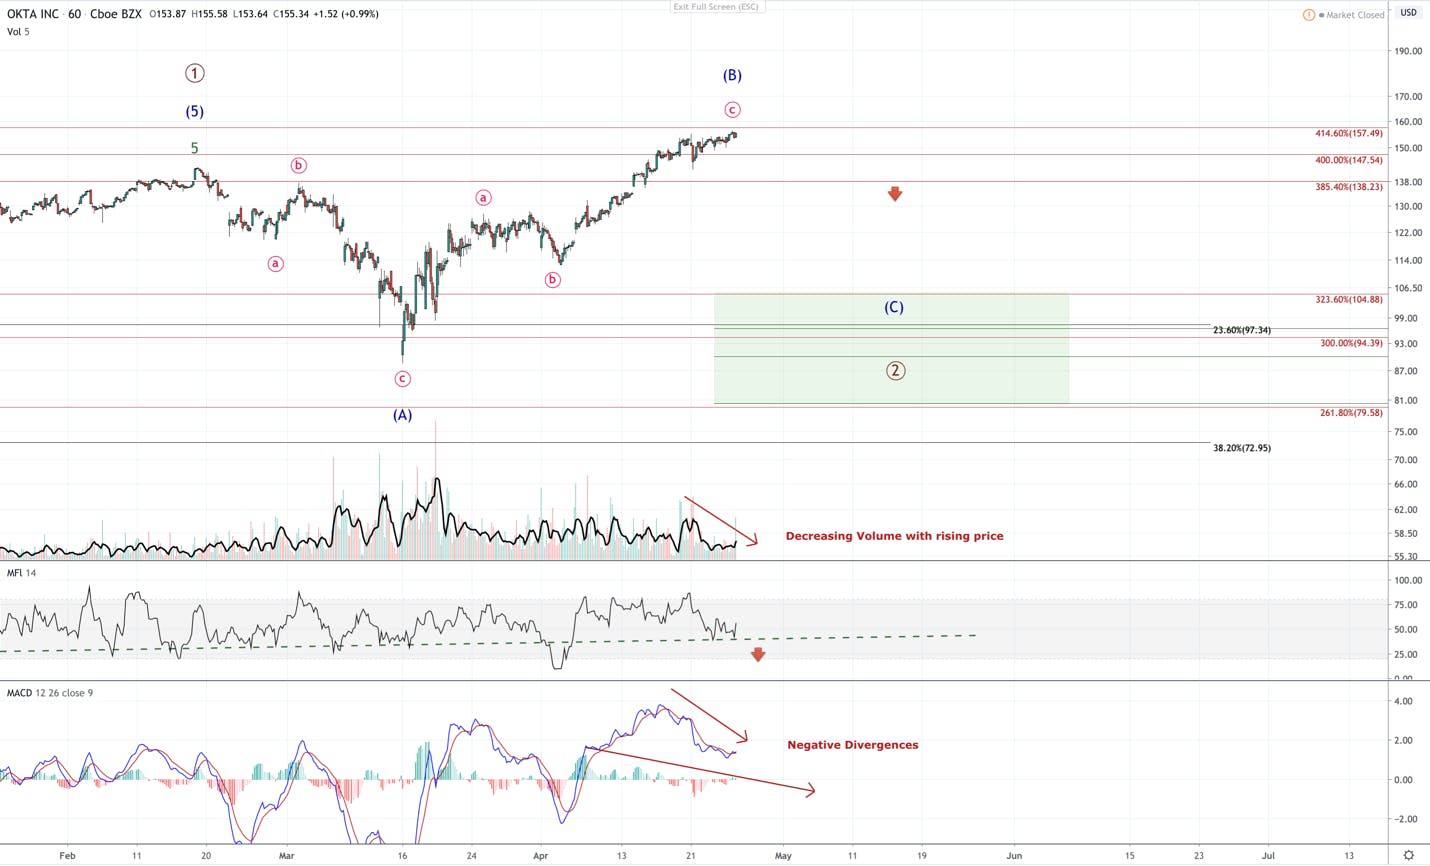
Okta’s price has broken out to new highs. However, we have not initiated on this move. The reason being is that the internal indicators are suggesting a false breakout.

The divergence in the MFI, and MACD are quite large. These 2 indicators act as leading indicators for price on the hourly chart. Also, the volume is not increasing with price, so there is low participation at current prices.  I’m expecting price to either retest the $146 region, hold and then move up with more healthy internals, or it will breakdown, beginning a new downtrend.

If price breaks below $138, the green target boxes will be in play.

We have Okta as a high conviction play, so we will not be too picky with the price we get. However, we do believe that a breakout is premature right now.

Inseego (INSG)
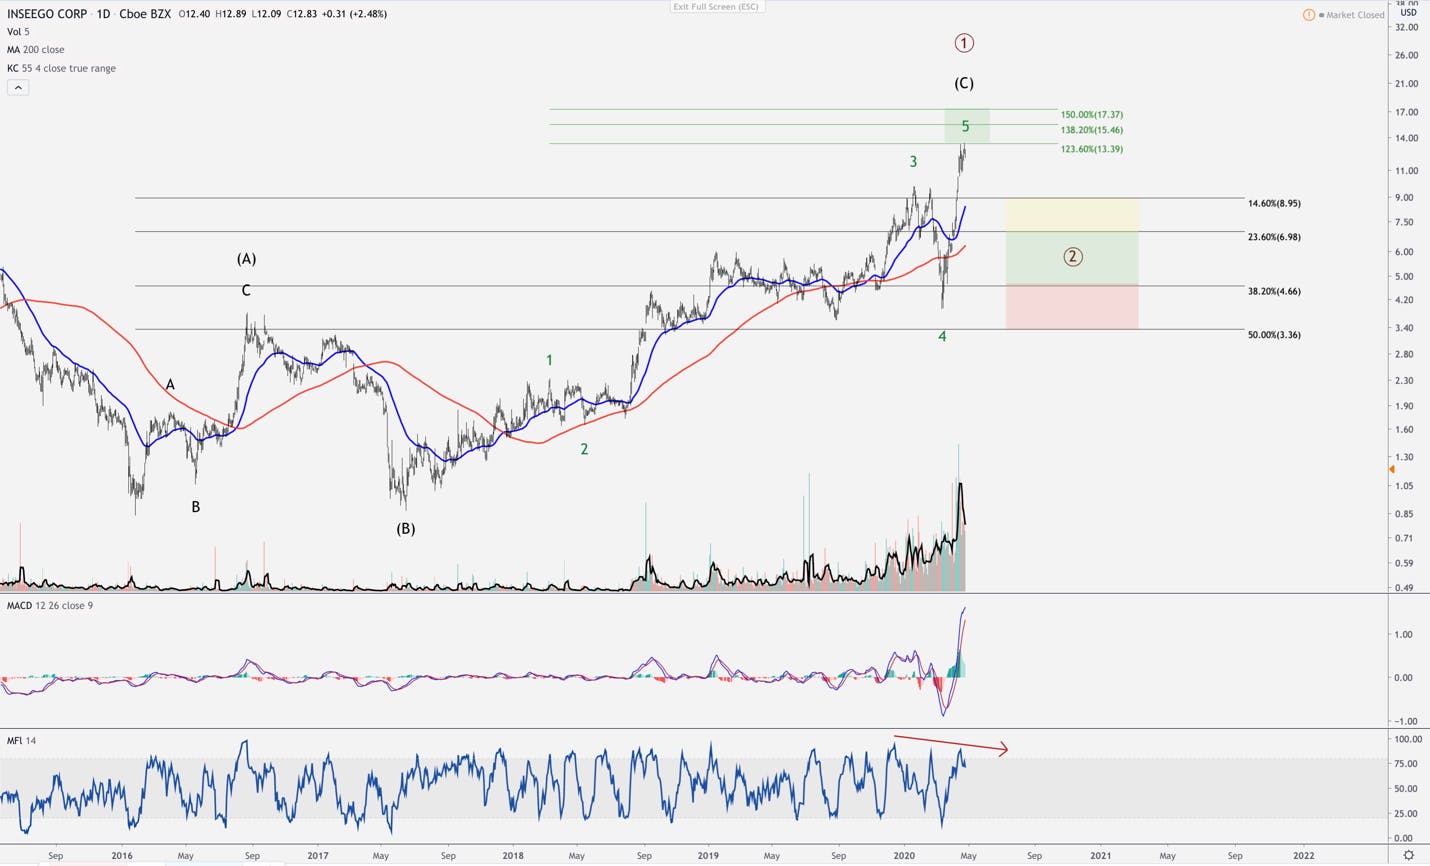
Inseego has had a tremendous run off the March low. The March low tagged the lower level of the wave 4 target we were tracking prior to the sell-off in prior market updates. It has now moved rapidly into the final 5th wave. I can see this 5th wave topping anywhere between $14-$23 before we see the larger degree wave-2 pullback. This pullback should respect the March lows when it plays out.

Dynatrace (DT)
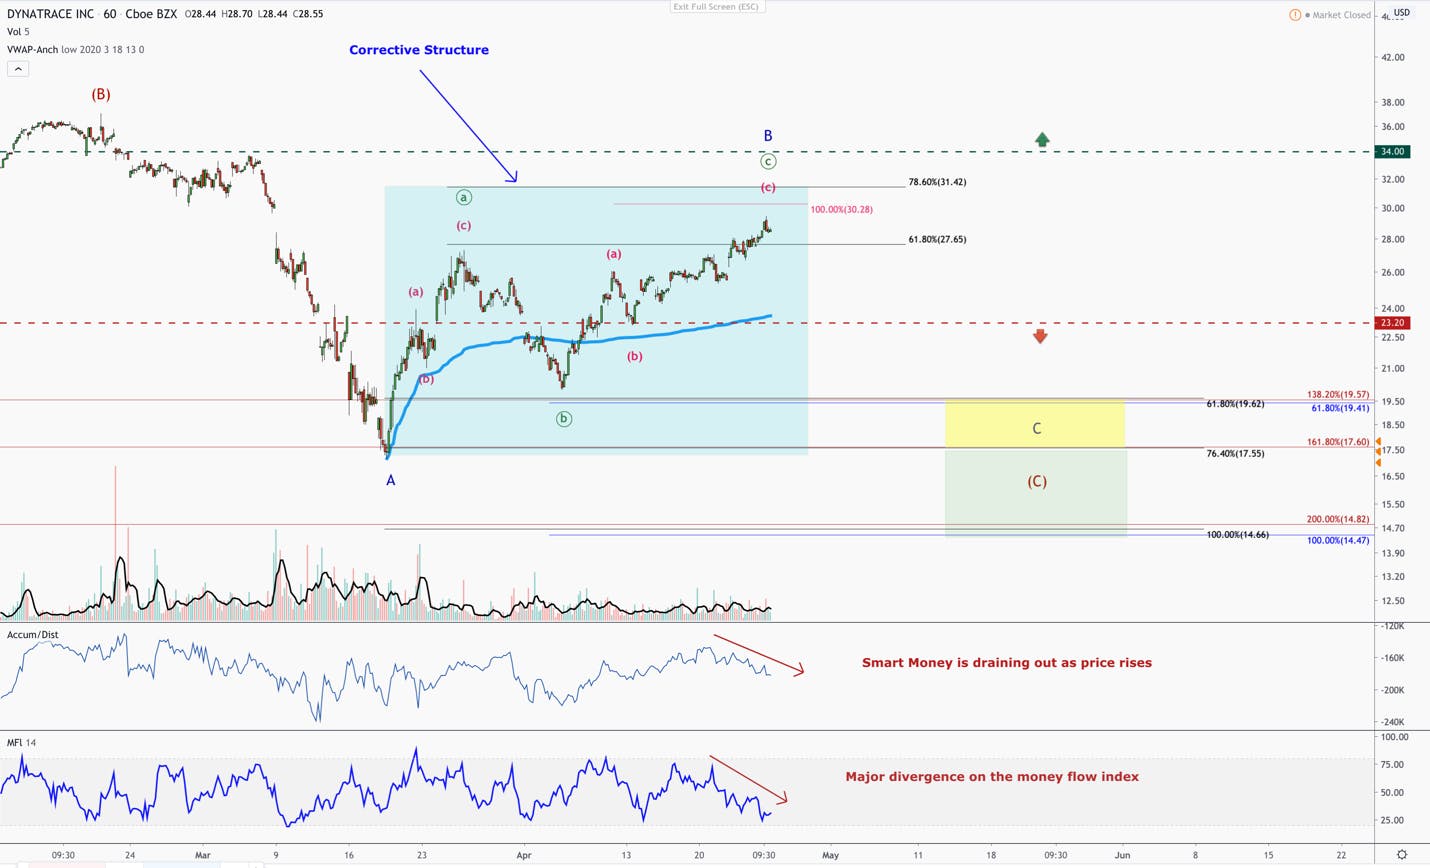
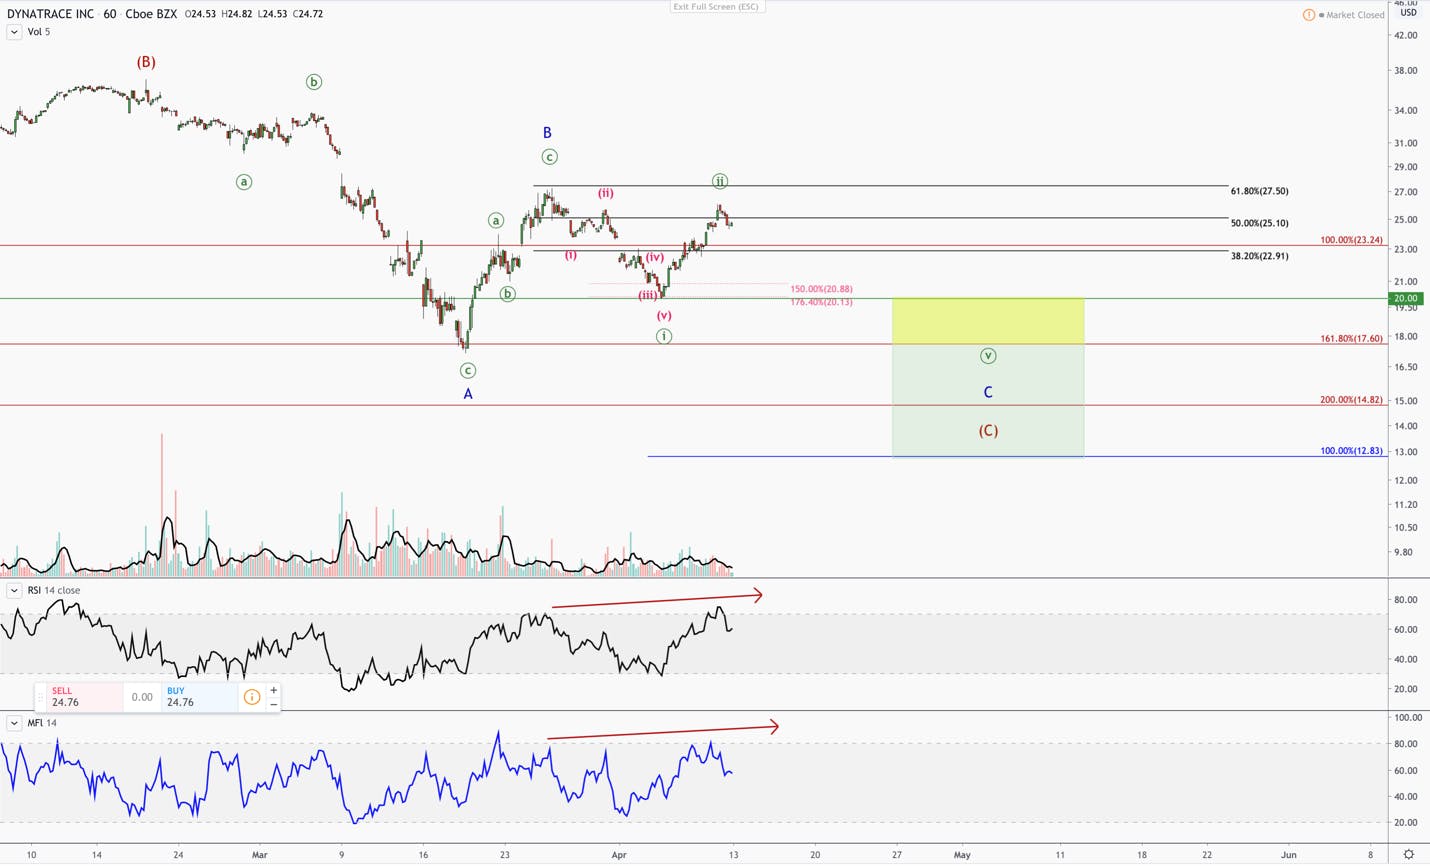
Our position in Dynatrace is currently up 25%. Like Datadog, DT is moving in a clearly corrective pattern. The internals on the hourly chart are diverging sharply as it approaches the $30 resistance region.  If DT breaks below the $23.20 support in red, the (C) wave target boxes will be in play.

On the other hand, if DT can close above $34 with heavy volume, it will signal that the bottom is likely in for this stock. As of now, we are holding our position without a stop, and will look to add in strength or weakness.

Shopify (SHOP)
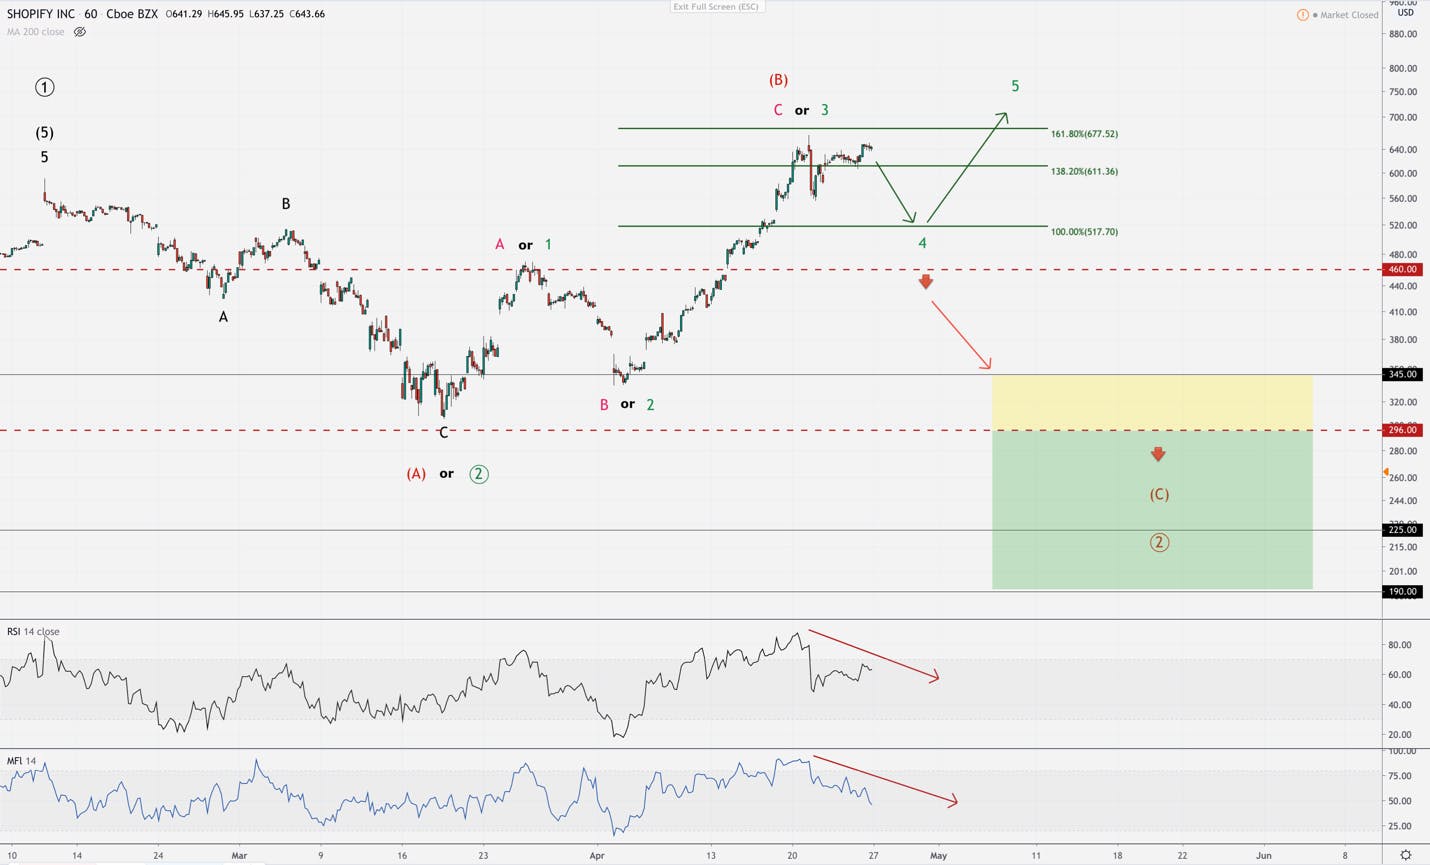
Shopify is in an interesting position. After falling back to the $296-$280 support zone in March, a region that has held 3 major tests over the last year, it has moved in what appears to be a clear corrective uptrend – i.e., 3-waves and overlapping. However, a 3-wave pattern can turn into a 5-wave pattern, especially when the 3-wave tags the 161.8% extension of wave-1, like Shopify has done. So, to keep it simple, there are two scenarios I see playing out:

Green count: SHOP pulls back to $517-$460 region and holds. It will then move up in a 5-wave pattern to new highs. If this happens, we will be in a renewed 5-wave uptrend, and it will signal that the lows will likely be in.

Red count: if Shop breaks down below the $460 region and holds below this price. Then the prior uptrend to new highs was a very large B-wave, and the C-wave should take down to the prior target box.

The internals on the hourly chart are suggesting weakness, so we should know what count we are in within the next week or two.

Lyft (LYFT)
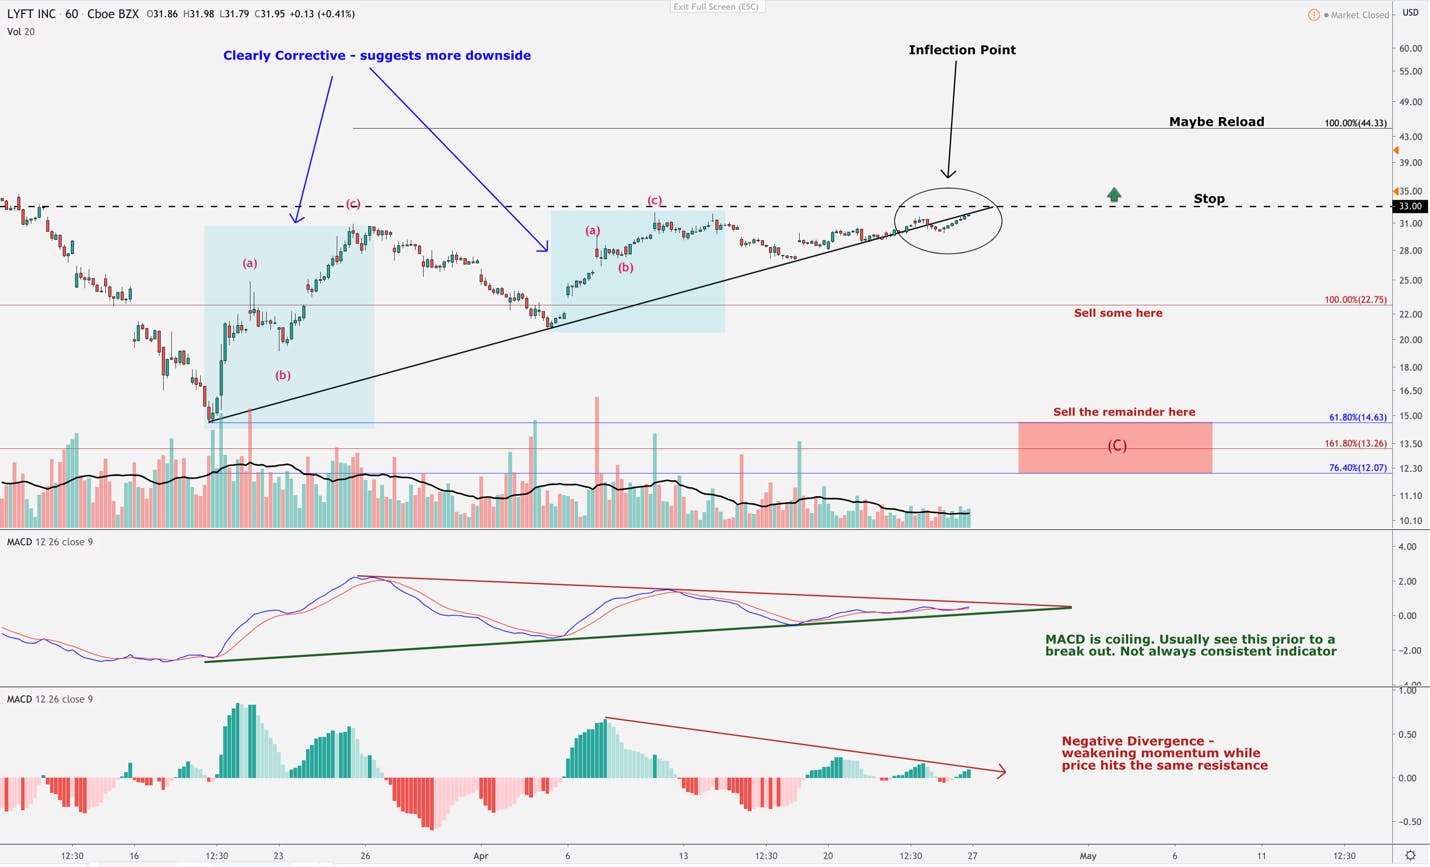
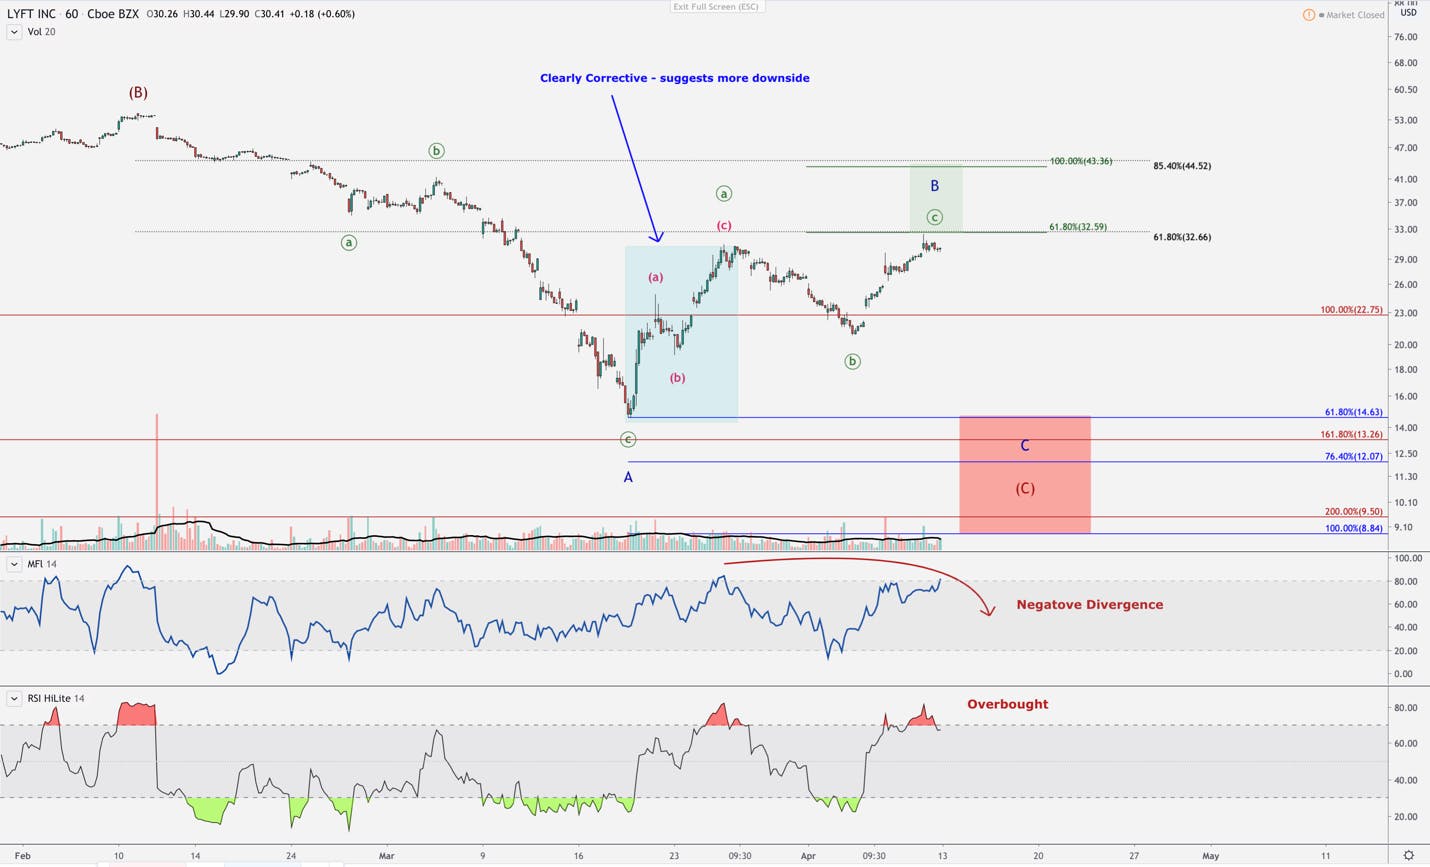
There is nothing encouraging about Lyft’s chart if you are long. Each up move in the 3-leg uptrend off the bottom is clearly corrective – i.e., overlapping and 3 waves. 

The internals are mixed. For one, the MACD is forming a coiling pattern, which is typically what we see prior to a breakout. It’s building strength for a move up. It’s not always a bullish pattern, but it’s worth noting. The MACD histogram is showing a notable divergence with price. Each time price makes a new highs, it’s doing so with less force.

I see the $33 resistance as the main resistance overhead, and it will also be where we are placing a reduced stop. We’ve made a combined 70% in our two Lyft shorts, so far, and I want to protect those gains. The easy money in shorting is over, so if we get stopped out with a small loss, we will look to reload at higher levels or when the downtrend commences.

Snap (SNAP)
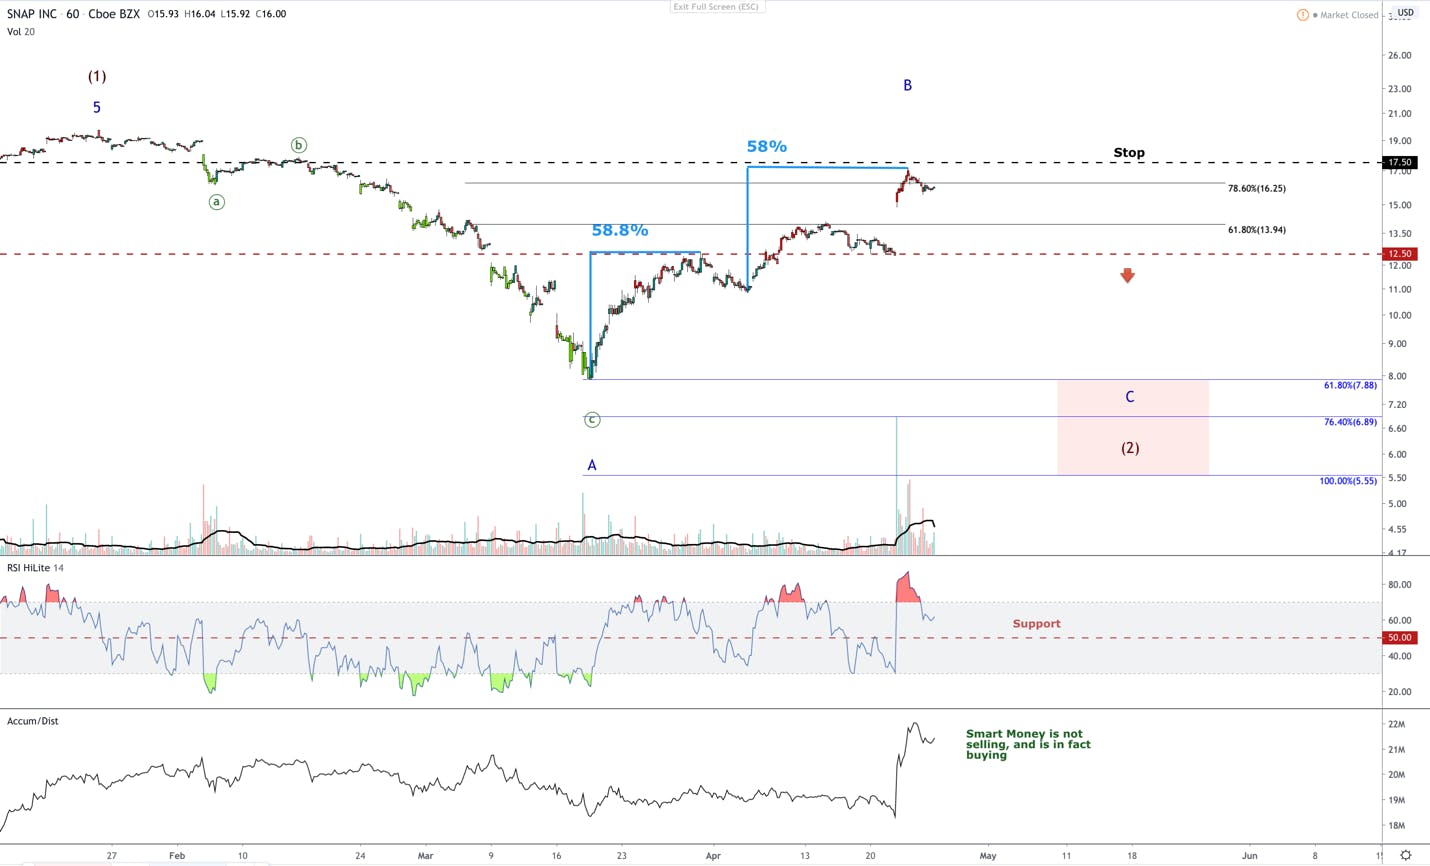
Our short in Snap is currently down about 15% as we speak. We are early to what we believe will be a reset of the ad-tech market’s valuations, but we do believe this will play out. Snap traded just below our stop and then began to trade down. If our stop is triggered, we will close this position and look to reload with further confirmation. I will want to see Snap close above $17.50 before stopping out the following day.

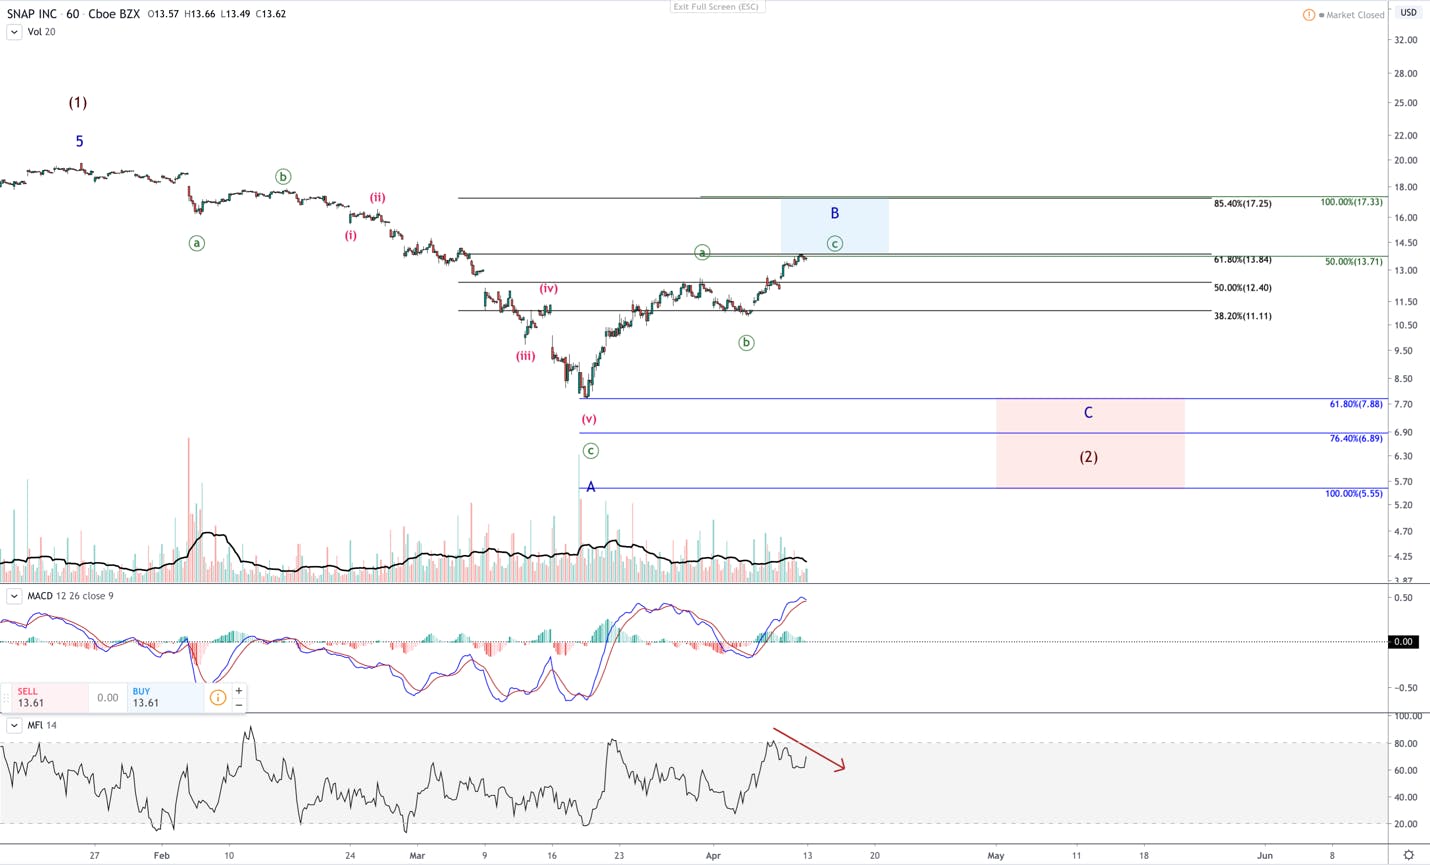
What’s interesting is the symmetry of Snap’s move up. Corrections are counter moves in a larger trend. What we know about corrections is that they tend to be symmetrical in nature, and move in a 3-wave with overlapping pattern. Look at the 3-wave move in Snap’s move off the low. The first leg went up 58.8%. The 3rd leg, or final move up, went up 58%. It doesn’t get more symmetrical than this.

The same trading plan is in place as we last outlined. But, we believe it is likely Snap has topped, and the final C-wave down has just begun.

Q1 2020 Earnings Coverage

This is an especially important earnings season as we hear from executives for the first time since the pandemic. I’ve provided a summary of the earnings reports from this week and my takeaways.

In this update, I cover Texas Instruments, SAP, Lam Research, and Xilinx and the insights they provide on the data center. I also cover Snap’s earnings report and Netflix. I’ll cover Intel’s report on the forum tomorrow evening.

Main Takeaways:

  • Data center is coming in strong as we forecasted. There are many instances that confirm this below.
  • Despite Snap’s breakout, I don’t see anything that invalidates what I’ve published about ads being weak post-covid. In fact, Snap saw significant drop off between Jan/Feb ad revenue and April. I detail this below.
  • Pay attention to SAP’s guidance around software. I had mentioned that instead of guessing on the various software players that it may be stronger to go to the infrastructure level and SAP could be the beginning of a few reports in weakening software. 
  • I cover Netflix below. Roku will see solid user growth while revenue in Q2 for Roku could go either way.

Texas Instruments:

Per the earnings call, Texas Instruments believes there is a “significant chance for a recession” and is modeling their forward guidance on the 2008 recession. In summary, the 2008 recession snapped back in two quarters time. 

TI plans to run factories in Q2 2020 and Q3 2020 in the same way the company ran in Q1 2020 with the expectation they will be sitting on inventory when the demand returns in an effort to maximize optionality for customers who may not be able to forecast at this time. 

Q1 revenue was $3.3 billion, down 7% from a year ago, with EPS of $1.24 per share. Texas Instruments guided for Q2 revenue in the range of $2.61 billion to $3.19 billion and earnings per share to be in the range of $0.64 to $1.04. 

Although the company did not provide much insight into how Covid-19 affected various revenue segments, TI did confirm that “enterprise systems increased double digits based on strong data center demand.” The company also stated that Industrial and PCs increased while Automotive and Mobile decreased. Communications equipment declined 50% year-over-year but there was an increase quarter-over-quarter. 

SAP:

SAP missed on revenue by about $10 million with Q1 revenue at 6.52 billion Euro. The company stated that cloud revenue is expected to continue with rapid growth in 2020 backed by a 25% expansion in the current cloud backlog. 

Regarding Covid-19, the company stated that a “significant amount” of new business is being postponed and with software licenses revenue most impacted and falling 31% year-over-year. As of now, the company is guiding for revenue in 2020 to be in the range of 27.8 to 28.5 billion Euros down from 29.2 billion to 29.7 billion Euros.

JP Morgan came out with downgrades to software in a similar category as SAP this week.  

Netflix:

Netflix added 15.7 million new subscribers compared to expected 8.2 million. The company reported mixed results, however, with EPS of $1.57 and $5.77 billion in revenue compared to expected EPS of $1.65 and sales of $5.76 billion. Earnings rose 107% and sales rose 28%. Netflix is guiding for new subscribers of 7.5 million compared to estimates of 4.1 million. The second half of the year is expected to be light on subscriber growth. 

Some of Netflix’s strength is the company’s arsenal of content, which interesting enough, the debt load to create this content is what has fueled criticism of Netflix for the past few years. Free cash flow will improve from negative $2.5 billion to negative $1 billion. 

I’ve covered Netflix’s additional strengths in previous editorials. 

Snap:

Snap is up 35% on strong Q1 subscriber growth and a revenue beat. The company reported $462 million in revenue compared to analyst estimates of $428.8 million. Average revenue per user was at $2.02 versus $1.68 per user in the year-ago quarter. Daily active users are up 11 million users to 229 million total. In the past, Snap reported relatively flat DAU growth so the 11 million stands out despite being quite low compared to other social sites from Covid-19 usage. For comparison purposes, Pinterest is expected to add 30 million users from 335 at end of Q4 to 365 million users in Q1.

In the earnings call, management discussed the lower levels of ad demand in more detail. Revenue growth was very strong in January and February at 58% year-over-year before falling to 25% year-over-year in March – essentially slashing revenue in half.

In April, the decline continued at 3-4% per week to 15% year-over-year growth through April 19th and 11% year-over-year growth in the current week. This means revenue growth was slashed by 80%. 

If the decline continues, this will put Snap at negative YoY revenue by May. 

“Like everyone, we’re hearing from advertisers that the global outbreak has dramatically shifted the way that they’re thinking about marketing. Some have paused while they’re rethinking their messaging and others are cutting funding to save jobs.” -Jeremi Gorman, Co-founder and Chief Business Officer, Snap

Meanwhile, Twitter guided for negative revenue in March so it makes sense Snap would join Twitter on this trajectory. 

Despite the weak forecast for Snap based on April growth, the stock surged 35%. Knox will be updating the forum on the chart and status of the short position. We may have been early on this one but I don’t see anything in the earnings report that invalidates the thesis.

Lam Research

Previously, Lam withdrew fiscal Q3 guidance in March stating it may not reach previously announced targets. Some of this was due to factories in Malaysia being shut due to government directives to shut businesses. Lam missed slightly on revenue at $2.5 billion compared to $2.58 billion expected from the December quarter. EPS of $3.98 was in-line with the revised consensus. The company has $5.6 billion in cash after drawing $1.25 billion from its revolving credit facility. 

Most importantly, Lam Research confirmed that cloud and enterprise-demand remains strong while consumer markets are weak. 

“The need for equipment and capacity to support work from home initiatives is causing cloud service providers to increase CapEx, creating the potential for a surge in server demand. Third-party estimates suggest that cloud capacity would need to increase 10-fold to service the peak workloads seen as shelter-in-place rules went into effect. Although these heightened workloads are likely a short-term phenomenon, this event will underscore the need for companies to invest more in infrastructure and business continuity capabilities as the daily economy and our dependence on technology continues to expand over time.”  -Tim Archer, CEO

The company is exiting March with record backlog as the demand environment is strong yet the supply is constrained. 

“And we haven’t seen those plans change and that demand remains kind of at the same level it was in January. And which means that we have a full order book, and we’re – really, our challenge is how to get these tools to customers. And I would say 100% of my conversation with customers right now are about how to get the tools they need to them. And I think that will continue for some period of time. And as Doug said, we will reassess after that period to see how demand is being affected.” -Tim Archer, CEO

Lam is forecasting for June revenues in fiscal Q4 to be higher than March with current operational performance. With that said, Lam is not providing exact financial guidance due to covid uncertainties. 

Xilinx

Xilinx beat earnings but issued soft guidance. Revenue came in at $833 million and EPS of $0.94 cents compared to expectations of $827 million and $0.92 cents EPS. Revenue growth was 12% year-over-year and EPS growth of 8%.

Xilinx guided for revenue of $660 million to $720 million in the current quarter, down 19% year-over-year and down 9% QoQ. This is due to weakening demand for communications products and “macro-related weakness.” Xilinx did note there was strong overall growth in the data center. The company is guiding for full year revenue of $3.21 billion to $3.28 billion compared to previous full-year sales of $3.4 billion. 

Xilinx is seeing issues with demand. We should know more with Intel’s report if this is a trend across semis or unique to Xilinx. Areas of weakness for Xilinx include Automotive, Broadcast and Consumer. Areas of strength included data center and wired/wireless group.

“The Data Center Group performed as expected with strong sequential growth primarily due to contributions from compute acceleration, driven by a mix of both cloud and high performance compute customers. We saw notable strengths from a hyperscaler deployment of a FPGA-based SmartNIC and our DCG opportunity pipeline continues to grow at double digits, particularly in video, HPC, database and fintech applications.” -Victor Peng, CEO

Google And Facebook Stock: Is Weak Ad Demand Priced In?

This article was originally published on Forbes on Apr 13, 2020,01:14am EDTForbes on Apr 13, 2020,01:14am EDT

Facebook, Google and Twitter have warned that Q1 is going to be lower than originally forecast. Media analysts have also weighed in with a consensus that ad demand will be weakened this year. Meanwhile, little has been provided for future guidance, which will test the belief that the effects of the Coronavirus has been priced in.

There is no doubt that many of these companies will have a comeback. The timing of this relies on many factors, especially consumer spending, which is intricately tied to unemployment. In other words, ad demand will return but the path may be as the fickle the advertisers who fuel the industry.

First, the Good News for AdTech stocks …

Usage across mobile and over-the-top television has been skyrocketing. Facebook reported an increase of 50% in messaging in countries where the coronavirus was hit the hardest. In Italy, there was 70% more time spent across apps. This was reported on March 24th and one can only imagine what the United States’ usage has been over the past few weeks as some of this usage falls into the second quarter. Group calling increased over 1,000% – which is no surprise for anyone work-from-home trends. (I wrote a full length analysis on Zoom Video here).

Pinterest delivered some positive news this week stating first-quarter sales and user growth were better than expected. The company stated first quarter revenue will be between $269 million to $272 million. Monthly active users in Q1 of 365 million to 367 million are well above the consensus of 352.7 million users.

Along with its social media peers, Twitter reported an increase in total monetizable daily active users (mDAU) of 23% year-over-year and an increase of 8% quarter-over-quarter.

Over-the-top media usage has also received a lot of attention from investors and for good reason. With more people spending time indoors, nearly every application has increased its footprint. Total streaming hours were up 24% between March 1st to March 16th from a year ago, according to Comscore, with Roku and Amazon up 16%.

According to a survey from Consumer Technology Association, 26% of American households started using online streaming services for the first time during the coronavirus pandemic. Meanwhile, 48% are watching streaming services more often than before.

Live TV is also benefiting from the surge in usage with viewership up 102% from a year ago across the seven channels surveyed.

Now, the Not-So-Good News for Adtech Stocks …

Typically, an increase in usage is linear with an increase in ad revenue. It makes sense that the bigger the audience, the more ad space (especially on mobile) and the higher the ad rates. In this rare quarantine situation, however, major advertisers have closed for business, are reporting layoffs and cutting costs in unison, leading to lower ad spend despite the increase in eyeballs.

There is simply no frame of reference for the effects a quarantine can have on advertisers. As of now, we only have reports that skyrocketing usage is not correlating to more ad spend.

Twitter has stated first quarter revenue will be down compared to the year-ago quarter after the company pulled guidance. In the press release, the company stated, “the near-term financial impact of this pandemic is rapidly evolving and hard to measure.”

This means Twitter could see a loss of 10-15% of revenue from its previous guidance of $825 to $885 million despite mDAU being up 23%. This is calculated based on the company stating revenue will be down slightly from the year-ago quarter, which was $786 million.

For a frame of reference, Twitter reported 21% growth in mDAU in Q4 which correlated to 11% increase in revenue. This further supports impact for Q1 falling in the the 10-15% range if “revenue is slightly down” year-over-year.

Mark Shmulik of Bernstein raised his price target for Twitter to $29 from $27 while stating he is on the sidelines partly due to concerns about Twitter’s ability to monetize its active user base. According to MarketWatch, Shmulik recently stated “We caution about placing too much stock into engagement as (1) everyone has seen a spike in engagement (2) unclear what happens to engagement levels post-COVID, and (3) it’s valueless if you can’t monetize.”

Facebook did not offer many details in their release other than to state “we don’t monetize many of the services where we’re seeing increased engagement, and we’ve seen a weakening in our ads business in countries taking aggressive actions to reduce the spread of COVID-19.”

According to LightShed partners, 12 of the top 50 advertisers are ailing auto makers; another 11 are quick-serve restaurant chains. This matches channel checks by Needham that showed lower spending in travel, retail, consumer packaged goods and entertainment, which represents 30 to 45% of Facebook’s total revenue.

Sign up for I/O Fund's free newsletter with gains of up to 403% – Click hereSign up for I/O Fund's free newsletter with gains of up to 403% – Click hereClick here

MarketWatch recently covered the revised analyst estimates on the outlook for Facebook, including statements from Needham and a variety of analysts. Q1 is being revised from $18.56 billion to $17.99 billion with EPS of $1.95 revised to $1.85 a share, according to FactSet as of April 6.

EMarketer released data showing a decline of $20 billion in ad revenue. As Twitter pointed out, the situation is evolving rapidly and this estimate is already insufficient as the data was collected up until March 6th, prior to San Francisco and New York going into a quarantine. The data also did not take into account the Olympics being postponed until 2021.

Cowen & Company estimates Google and Facebook will see “$44 billion in worldwide ad revenue evaporate.” This reflects a 18% decline in revenue for Google and a decline of 19% for Facebook compared to Cowen’s previous forecast. Cowen believes the ad business will bounce back in 2021. In a trickle-down effect, Cowen predicts Twitter will also see a decline of 18% and Snap a decline of 30%.

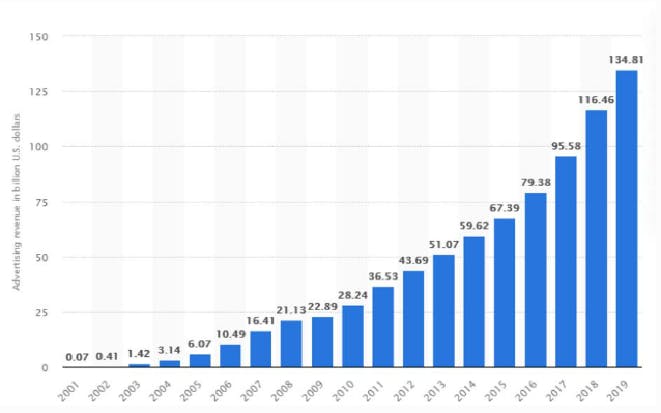
If Cowen’s forecasts are correct, this will be the first time that Google and Facebook will report negative revenue year-over-year since the companies were founded in 2001 and 2004, respectively. Google’s annual revenue last year was $160.7 billion with Cowen currently forecasting $127.5 billion this year in revenue. Facebook’s revenue last year was $69.66 billion with Cowen forecasting $67.8 billion for the upcoming year.

Google and Facebook have plenty of cash, yet smaller ad-tech companies may be more exposed to the spiraling effects of losing business rapidly.

Snap has not released a formal statement in regards to guidance but there’s evidence the company is not entirely insulated. In support of Cowen’s estimates, some of Snap’s largest advertisers are exposed to reduced ad spend, such as movie and media brands Disney, Comcast and AT&T, and also consumer brands Coca-Cola and Hershey’s.

Roku is harder to determine as the company generates revenue from ads and also licensing fees and/or commissions from other content apps. Most analysts believe the lower ad demand will not offset the other segments with a forecast of 15% decline this year. Michael Pachter of Wedbush lowered estimates for Roku’s average revenue per user (ARPU) from 30% to 21% in Q1 and from 40% to 26% in Q2. For the rest of the year Pachter sees a recovery with FY20 only decreased from 24% to 20%.

Notably, LightShed pointed out that digital ad spend will see the effects more immediately while television ads will see more of the effects in Q2. This is because advertisers make commitments to buy from big TV networks months in advance.

Conclusion:

In my opinion, the situation is hard to quantify. We are on the brink of earnings reports, where more will be revealed, yet these earnings will show minimal impact as ad spend was likely reduced only at the end of the quarter in March.

Next quarter is where the majority of the effects will be felt. If companies decline to provide forward guidance, which seems to be the trend thus far, the market will have to rely on sell-side analysts for guidance. I think this is a disadvantage as companies have a more sobering outlook.

For instance, JP Morgan is predicting 23% GDP growth in Q3 of this year, yet Apple is rumored to be delaying the 5G iPhone release in September. This information does not line up. Similarly, ad-tech companies must consider that revenue growth and earnings growth will require travel, sports, restaurants and consumer packaged goods returning to their former state of a 10+ year economic boom. In other words, JP Morgan has the liberty to withdraw bold predictions as the situation evolves while tech companies cannot so easily release new information.  

I personally believe we will not see ad spend return to pre-Coronavirus levels until 2021 at the earliest and 2022 at the latest. Many advertisers are under extreme conditions of balancing a lack of demand for their products, furloughed work forces, and will need to hoard cash to sustain the recovery period until demand returns.

As of now, there is an undeniable red flag in ad-tech as usage is not linear to revenue. This has not occurred in the history of any ad company currently only on the market. The next three months will split the market into two camps: those who believe the market has “priced in” the full effects of the Coronavirus and those who believe there is too little information to price and predict the length of the recovery.

No camp is right or wrong, we simply haven’t been here before.

Please note: The I/O Fund conducts research and draws conclusions for the Fund’s positions. We then share that information with our readers. This is not a guarantee of a stock’s performance. Please consult your personal financial advisor before buying any stock in the companies mentioned in this analysis.

Okta Technical Analysis and Checking In

I will be offline for a few days. The website and responses may be a little slower prior to earnings coming in at the end of April. Pablo is our admin and will be checking email if there are any technical concerns. He can be reached: pablo@beth.technology. Knox will continue to be available on the forum and email knox@beth.technology . There will be premium blog updates as we go through earnings and updates on technicals if the market makes any major moves.

The blog post I published for the April spreadsheet sums up my fundamental thesis for Q2.

As published in January, one major thesis for 2020 has been hybrid cloud and and the migration of larger enterprise and B2B budgets. This thesis hasn’t changed and the work-from-home trend will support the growth already being predicted in this category. Behind every Docusign, Slack, Zoom Video, Netflix, Ring Central, etcetra is cloud infrastructure and cloud monitoring. You’ll notice the top 7 or so stocks on the April conviction list are at the cloud infrastructure/data center level. We also added Okta to this coverage recently. 

I believe ad-tech has an adjustment in its future. You’ve seen me cover this quite extensively. The current ad demand is highly unusual and with sports, live events, and travel being slow to comeback, advertising companies have a long year ahead of them. Typically, in the past, ad exchanges feel a lull in ad demand the most (i.e. The Trade Desk and Rubicon). We could get some positive spins on Q1 but look for a withdrawal of guidance as these companies try to get a handle on the situation. I’ve asked Knox to hold out longer on these companies for any new positions and I know he discussed a Snap short. We think Snapchat is particularly weak. We may look at hedging with The Trade Desk.

Regarding tech growth valuations, I would be cautious in thinking that tech will be immune to the current situation. We are seeing significant layoffs across startups. Also, institutional investors who perform channel checks are forecasting for higher software churn rates. Estimates right now are higher churn rates from enterprises of 3%-5% and higher churn rates of SMBs of 20%. Blended would be about 10%-12% higher churn rates. Effects from enterprises will be felt in the cross-sell and up-sell. Net new bookings may see a softening of 30% or more. Here’s some more information from Gainsight about the expected increase in churn. The companies who use Gainsight include Anaplan, Tableau, VMWare, Splunk, RingCentral, Yext, SailPoint, MuleSoft, Workday and Citrix.

Our Coronavirus picks are Zoom Video, Slack and DocuSign for their strength over the long haul. Institutional and funds also like Smartsheets, Ring Central, and Teladoc. 

In the most recent April update, we did indicate that Inseego was getting positive press. It’s due to 4G hotspot demand from governments and schools.

We’ve seen reports that Twilio and ServiceNow are continuing to hire. Zoom Video and DocuSign are hiring, as well. This may be an indication of strength in these companies.

Knox’s technical analysis of Okta is below. Thanks, Beth

Okta Technical Analysis

By Knox Ridley

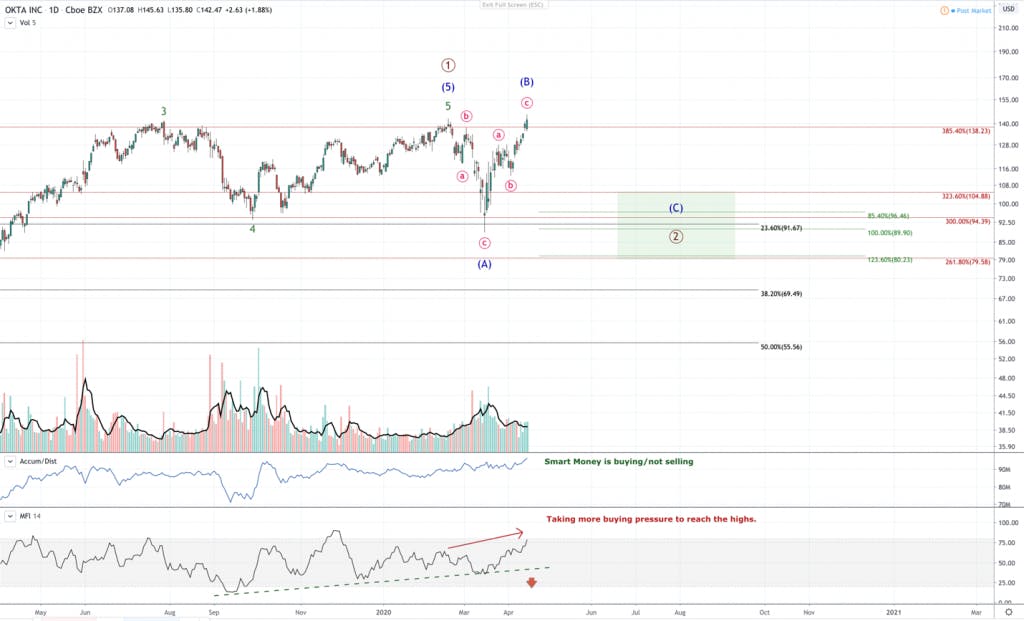
Looking at the daily chart, Okta has been trading within a range for several months. The $140 range and the $95 range is where the price is bound. The volume spikes give a clear sign at the price at which institutions are liquidating shares and also accumulating shares.

So far, between $100-$90, we see heavy volume spikes, indicating that institutional money is defending this level. On the sell side, we see heavy volume spikes between $120-$145. Until we can get volume spikes breaking through one of these 2 ranges, we will stay range bound.

From the prior lows, we see weaker volume push the stock back up to the upper end of this range. This indicates potential retail investors bidding the stock back up.

Over the last several months, this range has formed a cup & handle pattern. If we can see a breakout above the $146 on heavy volume, followed by a retest and hold of that level, that would be an indication that institutions are willing to pay higher prices and we will initiate a long position.

Furthermore, the RSI is showing weakness. We are approaching oversold levels. If you track where the RSI was last time the price was this high, it was at a lower level. This means that we needed more buying pressure to reach the same price level. Also, notice the RSI trend outlined by the green dashed line. If this breaks, that will be an early tell that we may get a local top and continued drawdown.

As of now, my primary count is that we are in a B-wave, within a larger A,B,C pattern. It would be rare to see a larger degree 2nd wave only tag the 23.6% retrace level off the all-time lows. It usually targets the 50% – 61.8% retrace levels. But, with the potential for growth being minimal in this market, coupled with the runway in front of Okta, we believe a retest of the 23.6% retrace level, which is around the $95 region, is a strong buy.

Weekly Chart

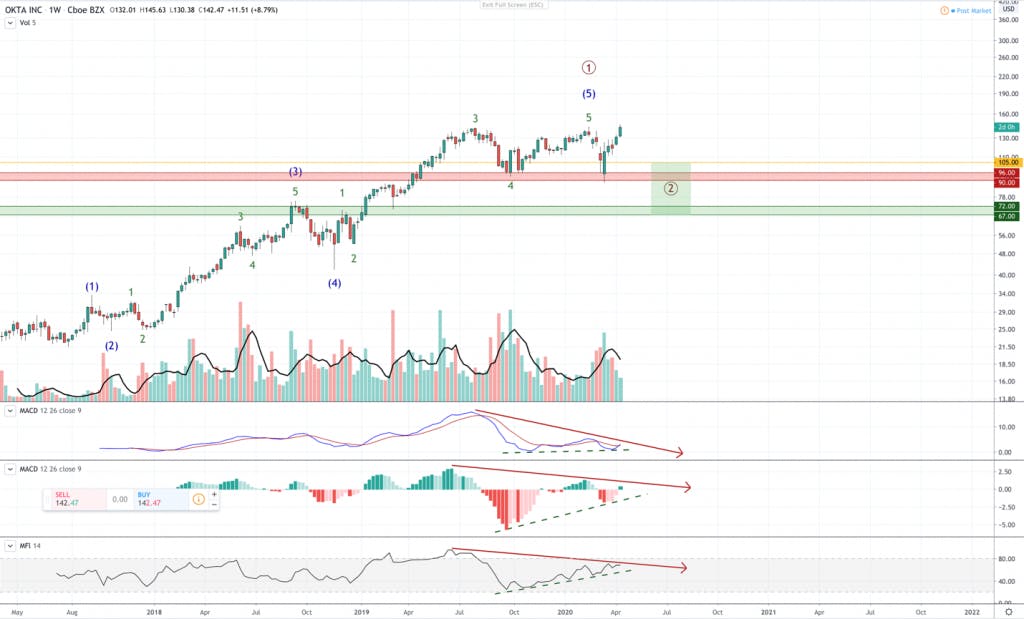
The bigger the pattern, the more significance it holds. The weekly trend is much more ominous than the daily trend, and because it’s a longer length of time, it holds more weight than the daily patterns.

We can see the clear uptrends noted by the green dashed lines on all of the momentum indicators – MFI, MACD.

At the same time, we can see large negative divergences on the MFI and MACD. As the price is making higher highs, the momentum indicators are making lower highs. This is also confirmed by the lack of volume in the current uptrend and shows  that the current rise in price is being built on shaky ground.

This does not support a breakout. In fact, it tends to support a breakdown. I’d be careful buying around the highs as long as we stay below the $146 region without a breakout on heavy volume.

My Elliott Wave count is also present from the all-time low. I see us topping out and completing the larger degree first wave in red. This would put us in the 2nd wave as discussed prior. The price regions I’d look to begin layering in are colored on this chart: $105 (yellow), $96-$90 (red), $72-$67 (green). We do not see the green zone coming into play, but think it likely we see the yellow and red.

Can Uber Become Profitable This Year? Deep-Dive Analysis

This article was originally published on Forbes on Mar 25, 2020,09:10am EDTForbes on Mar 25, 2020,09:10am EDT

Uber burns over $4 billion annually yet the company is stating it will be profitable by the end of 2020. 

Further analysis is required to look deeper into whether Uber is able to accomplish what it has promised or if the company is buying time and appealing for a more promising valuation before it has to raise more cash. The latter is something Uber is incredibly skilled at as the company now trades well below its last private valuation of $76 billion with a current market cap of $35 billion.

Despite the coronavirus causing the company to cut back operations nation-wide with declines of up to 80% in ride-sharing volume, Uber is receiving analyst upgrades based on the company’s variable cost structure. These analyst upgrades come despite slowing growth and $7 billion in debt on the balance sheet while being deeply unprofitable with record-setting adjusted net losses of $4 billion in 2019.

The overall financial performance defies the CEO’s statements, which are based on a single non-GAAP reporting measure “Rides Adjusted EBITDA.” This non-GAAP reporting measure is new to Uber as of Q3 2019 and replaces the less favorable contribution margin.

Overview of Uber:

Uber’s revenue in the fourth quarter of 2019 grew 37% to $4.07 billion. However, it reported a net loss of -$1.1 billion compared to a net loss of -$887 million in the same period last year. EPS was negative -$0.49 compared to -$0.52 expected.

Full-year 2019 revenue grew 26% to $14.1 billion and net loss was -$8.5 billion compared to a net profit of $997 million for 2018. Stock-based compensation was $4.6 billion in 2019 for a net loss of $4.1 billion and adjusted EBITDA of negative -$2.73 billion.

Notably, Uber sold some operations in Russia and Asia, which provided one-time income, and caused the company to post the $1 billion in net income in 2018. In 2017, Uber posted similar losses at $4 billion.

Monthly Active Users (MAU) increased 22% to 111 million in the fourth quarter of 2019 helping to boost the company’s revenues. The Uber Eats promotional expenses continue to drag the company’s profits despite being the segment with the most growth.

Earlier this year, the company sold its food-ordering business in India to a local company Zomato in exchange for a stake in the company.

Uber investors are encouraged by the non-GAAP Rides Adjusted EBITDA metric, which breaks out the profitability of Uber’s ridesharing business separate from Uber Eats and other bets, such as autonomous vehicles. Uber reported a 281% increase in Rides Adjusted EBITDA from $195 million to $742 million in Q4 and a 34% increase from $1.54 billion to $2.07 billion in full year 2019. The company’s overall EBITDA margin is -57.58% compared to the sector median of 12.99%.

The company stated on a recent call to investors that they have $10 billion in unrestricted cash. Uber carries long-term debt of $5.7 billion and a capital lease obligation of $1.5 billion, or about $7 billion total in obligations. Despite the combination of steep losses and ample debt, the CEO stated the balance sheet is “incredibly strong” due to the absence of short-term debt. 

There is clearly a sharp contrast between the financials and the CEO’s statements, which means Uber has a lot to accomplish this year in the face of coronavirus shutdowns. 

Analysis of Adjusted Rides EBITDA:

Uber has been opportunistic in breaking out adjusted EBITDA for rides as a means for reaching profitability. In the 10Q details, Uber does not break out the number of ridesharing trips and monthly active users separately from Uber Eats and Freight although there is a statement in the summary that Gross Bookings grew 20% and Eats grew 73% year-over-year.

Gross Bookings is defined as “the total dollar value” including taxes, tolls, fees and without an adjustment for consumer discounts and refunds. Essentially, Gross Bookings is similar to Ride Revenue, the metric that Lyft reports. Uber’s Gross Bookings growth is actually quite low at 20% compared to Lyft’s Ride Revenue at 52%.

Some of Uber’s weaknesses and risks are known to the market. This is one reason the price-to-sales ratio is very low at 2.3 with a forward price to sales of 1.7. Compare this to other companies that went public last year, such as Zoom Video with price to sales of 53 and a forward price to sales of 39, or Slack with a price to sales of 17 and a forward price to sales of 14.

Uber may look attractive to some investors at this current valuation given the risks. However, this is a company that is far from true profitability across all revenue segments.

Subsidies Inflate Demand

I’ve been critical of the ride-sharing business model since pre-IPO when the media speculated Uber would reach $100 per share.

The problem with the ridesharing business model is that the more money the business makes, the more the business loses. This is reflected in the past three years of financials between 2017-2019. Essentially, Uber and Lyft used private funding to subsidize rideshare demand in the year leading up to their public filings.

In 2017, Reuters published that Uber passengers pay only 41% of the actual cost of their trips, citing research from transportation consultant Hubert Horan. At the time, Reuters warned that this creates an “artificial signal about the size of the market” after Uber had released limited financial data as a private company that showed losses of $708 million per quarter.

The cost of the ride is not high enough to cover the cost of the ride, therefore, we see unusual losses. However, if the companies raise prices, demand will decrease. These companies must chose between subpar growth in order to become profitable or subpar earnings in order to drive demand.

The markets did not reward Uber for driving demand at the expense of its bottom line. Instead, Uber became the biggest IPO loss in history. Uber is attempting a new path, which is to pare back on losses while accepting lower demand and revenue at 20%. This is most evident in the  

The problem with this scenario is that the market may not like slowing growth either. In fact, we see “Trips” growing 32% year-over-year, which is much lower than the 100% growth reported in the S-1 Filing when trips had doubled from 5 billion trips in September of 2017 to 10 billion trips in September of 2018. (Revenue should be aligned with number of trips, and also doubled, unless subsidies were very steep.)

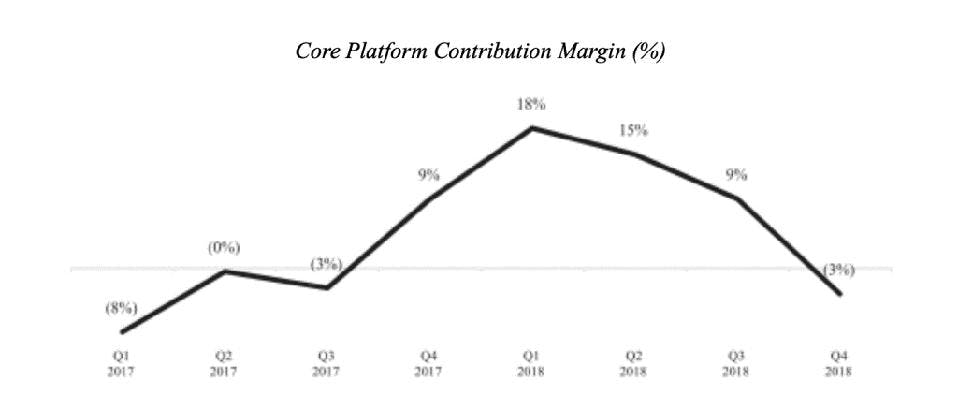
It’s also important to note that Uber removed the original non-GAAP measurement “Contribution Profit (Loss)” and replaced it with Adjusted Rides EBITDA. This is because the Contribution Margin was too revealing of Uber’s losses with a declining rate from 14.7% in Q2 2018 to 8.2% in Q2 2019.

In an effort to appear profitable in the ridesharing segment, Uber has stopped reporting on contribution margin. – UBER

Lyft: Pureplay Model

Lyft provides a model for a pureplay ridesharing company with a reported 52% year-on-year increase in its fourth-quarter 2019 revenue to $1.01 billion up from $669 million. This is much higher growth than the 20% Uber reported for its ridesharing segment.  

For the full-year 2019, revenues increased 68% year-over-year to $3.6 billion

Net loss increased to $356 million from a net loss of $248.9 million in the same period last year, yet on an adjusted basis, the net loss margin was slightly higher in the current year at 35% compared to 37.2%.

Adjusted EBITDA loss margin improved from 37.5 percent in Q4 2018 to 12.9 percent in Q4 2019. More importantly, Lyft has remained consistent with its non-GAAP metrics and reports a contribution margin of 54% up from 45.5%.

In my opinion, Lyft’s financials are more straight forward in how the ridesharing model can achieve profitability while maintaining enough growth to satisfy tech investors.

Beware of a Changing Story

The last thing to note, which is quite important, is the story for Uber is changing frequently. Uber Eats is driving the growth and is the more stable part of the business in the current coronavirus economy, yet a portion was sold off in India to lower expenses and achieve profitability. 

Autonomous vehicles were a major part of Uber’s story due to concerns around drivers who bring never-ending legal battles on the misclassification of employment. In as recent as January, autonomous driving was the most likely path to profitability for Uber. This story has changed entirely in two months’ time, yet it will be quite challenging for Uber to separate autonomous vehicle R&D from its financials.

CEO Dara Khosrowshahi highlights the “variable cost structure” of the business, which translates to not having to pay drivers employment benefits. Notably, the misclassification of employment is receiving renewed criticism with the ride-sharing business shut down from the Coronavirus.

The workforce of 5 million drivers have no unemployment, sick leave or health care. Although company is offering sick pay for drivers who test positive for the coronavirus, this does little for the majority of the drivers who are ordered to stay home to avoid the spread of the virus. Now, the company is now asking the government to offer the drivers benefits while Uber highlights its variable cost structure to investors.

Conclusion

The statement that Uber will be profitable is confusing at best as the company cannot simply separate the ride-sharing segment in order to make this claim. Even if this was possible, the ride-sharing growth is the lowest across all segments at 20% and ignores the catalysts of Uber Eats and the autonomous driving division.

In a recent call, Khosrowshahi stated the company has $10 billion in unrestricted cash, yet the CEO also stated the company could lose up to $6 billion from the Coronavirus quarantines. I believe Uber will need to raise more money in the near future and will do (and say) whatever necessary to raise its market cap before doing so.

New Age Of Stock Market Volatility Driven By Machines

This article was originally published on Forbes on Apr 10, 2020,04:05pm EDTForbes on Apr 10, 2020,04:05pm EDT

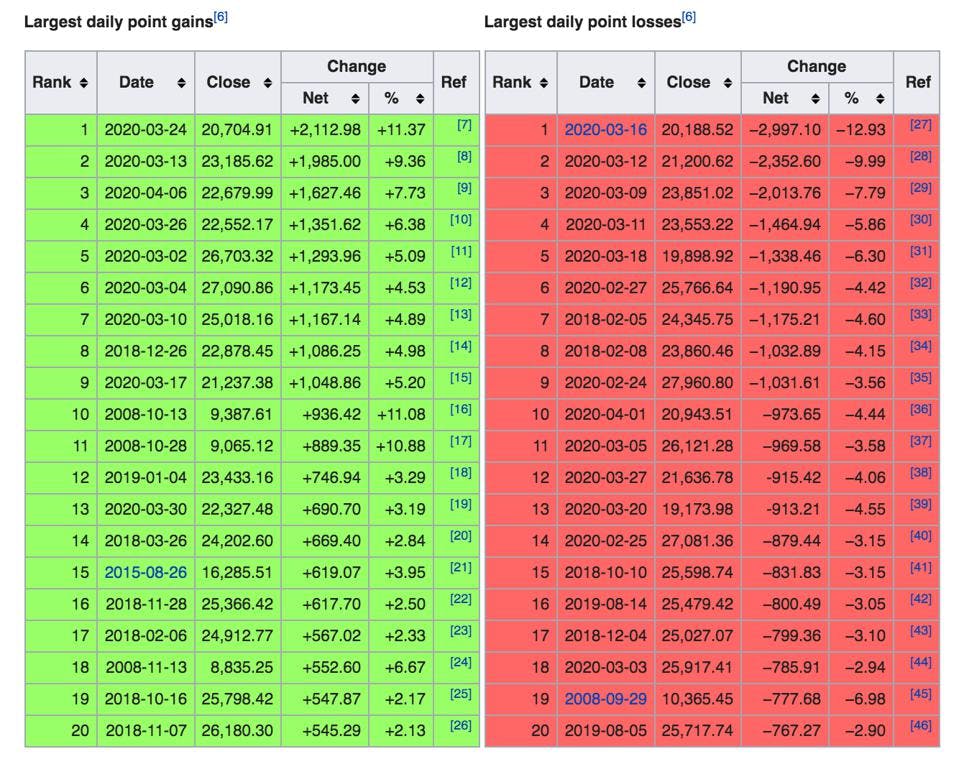
The Dow broke many records in March of 2020. We saw the fastest bear market in history, the largest one-day gain in history, and the Dow had its worst first quarter since 1987.

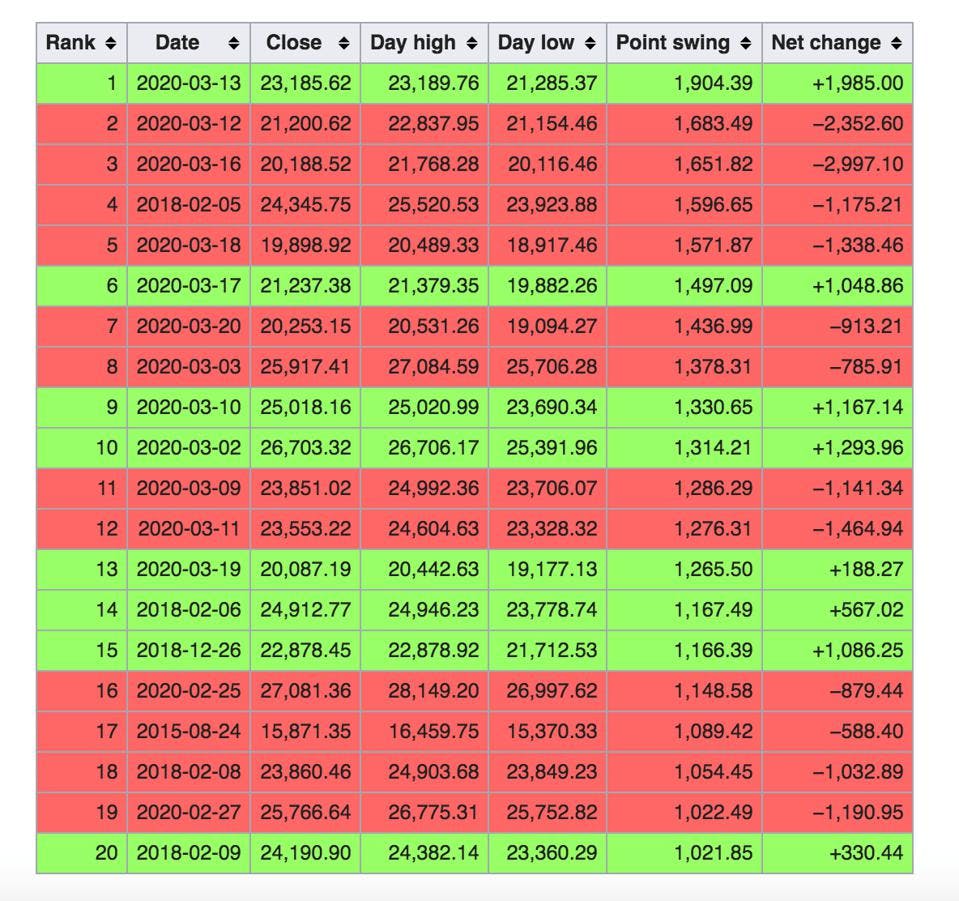
Many more records were broken on the intraday level. For instance, fourteen trading days between February 25th and March 20thmade the top twenty list for largest intraday swings. According to Wikipedia, nine of the top ten positions occurred in a span of three weeks between March 2nd and March 20th.

Throughout the generations, there have been world wars, depressions, recessions and financial market implosions, but this is the first market to be whipsawed by machines. What’s driving the intensity is algorithms which puts wealth preservation at stake as retirement funds compete against quant traders.

Flash rallies and flash crashes are occurring as I write this, with yet another record-breaking day of the Dow gaining 1,627 points on April 6th. Following the fastest bear market and worst first-quarter since ‘87, we have now closed out our best week on the Dow in 45 years on April 9th.

The full effects of this much machine trading is yet to be seen, especially as forward-looking markets must reconcile with double-digit unemployment and other economic uncertainties. While machines can change their allocation in the blink of an eye, many average Americans must grapple with the effects these swings may have on their livelihood.

Wikipedia

Source: Wikipedia, List of largest daily changes in Dow JonesWikipedia, List of largest daily changes in Dow Jones

March 2020: Fastest Bear Market in History

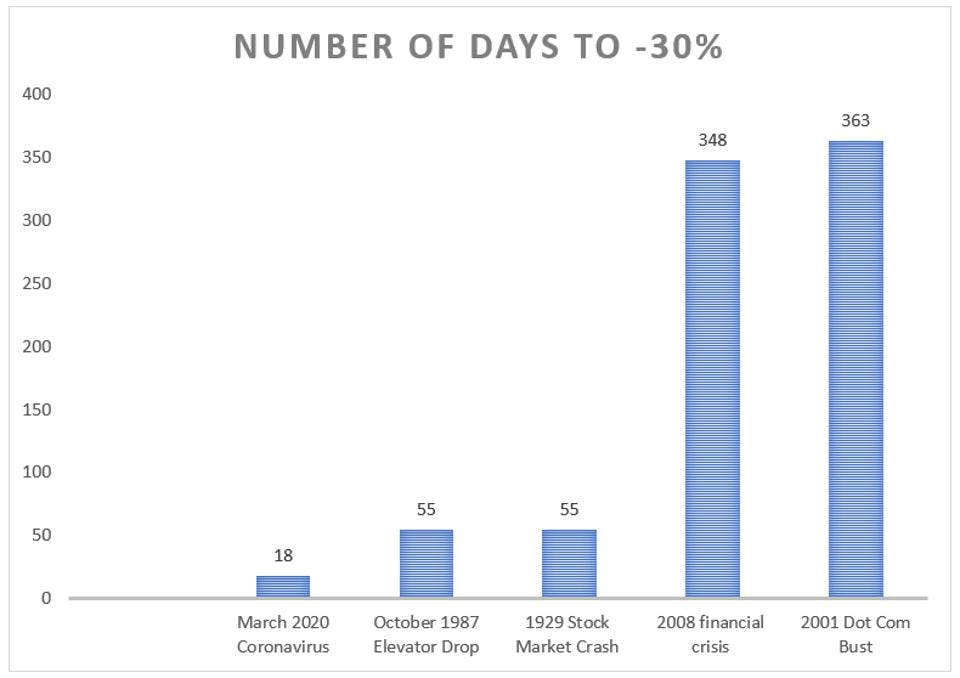
Last month holds the record for how quickly the market plummeted into a bear market at only 16 days starting on February 19th. The contrast is even more severe when calculating how quickly the March 2020 crash hit 30%'

KNOX RIDLEY

Source: Knox RidleyKnox Ridley

Last month was not for the faint of heart. The bear market of March of 2020 took 19 days to drop 30% while all other black swan events took 55 days or longer. Meanwhile, the economic backdrop includes a health care crisis, high unemployment, canceled school years, and state mandates to “shelter in place.” Machines driving record gains last week are clearly not in a quarantine.

The Fed recently warned that the country could face an unemployment rate of 32%, or 47 million. This would exceed the Great Depression at 24.9%. As we saw in 2008, massive unemployment forces the middle class to withdraw their 401Ks to pay bills. This could cause major unintended consequences from the Federal Reserve policy that pushed retirement accounts into equity markets in order to keep up with inflation.

Despite evidence of negative consequences, rampant algorithmic trading in the financial markets has become accepted as the new norm. However, this will be the first time that algorithmic trading could compound an economic recession as 401Ks have been squandered by the sheer speed of stock market machines. This, of course, depends which way the wind blows next week and how machines react to news headlines with natural language processing (NLP).

Machines Behaving Badly: Faster than “Blink of an Eye”

High-frequency trading costs regular investors up to $5 billion per year, according to a recent study released in January of 2020. The practice of “latency arbitrage” involves arbitraging prices extracted by lower latencies. Better prices are then quickly bought by machines that can move quickly.

The FCA found the machines racing against one another is faster than “the blink of an eye” at 79 millionths of a second. The FCA study tracked 2.2 billion transactions over 43 trading days and found 20% of trading volume was from latency arbitrages. The FCA concluded that latency eliminating latency arbitrage would reduce the cost of trading by 17%. Six firms won the arbitrages 82% of the time.

Sign up for I/O Fund's free newsletter with gains of up to 403% – Click hereSign up for I/O Fund's free newsletter with gains of up to 403% – Click hereClick here

In 2011, electronic inter-dealer broker ICAP had introduced a fifth decimal point to its EBS foreign exchange platform so that its currency pairs such as euro/dollar read as $1.24980, instead of the standard $1.2498. The fifth decimal attracted high-frequency computers, which disrupted the flow of liquidity on the EBS platform. This upset the banks with slower technology as they could not execute large transactions when super-fast computers sliced them into smaller trades. Notably, Deutsche Bank and Barclays had already offered tenth pricing to their customers.

In 2014, The Securities and Exchange Commission sanctioned a New York City based high frequency trading firm Athena Capital Research for placing a high number of aggressive, rapid-fire trades. The trades occurred in the final two seconds of nearly every trading day during the six-month period with an intent to manipulate the closing prices of thousands of NASDAQ-listed stocks. The Company had to pay a $1 million penalty to settle the SEC’s charges.

Tower Research Capital paid $67 million to settle spoofing charges. On thousands of occasions, between 2012 and 2013, the company manipulated the futures contracts on the Chicago Mercantile Exchange and the Chicago Board of Trade.

Evidence of Recent Algorithmic Damage

Over the last 10 years, commodity trading assets (CTAs) have collectively risen by about 36% to roughly $360 Billion. Because they are hedge funds, they are likely leveraged anywhere between 2-5 times this amount, putting the total amount of assets anywhere between $1-2 trillion dollars. These software driven funds tend to be crowded in the same trade together, which can make for violent swings.

Nearly a decade ago, there was a flash crash that occurred on May 6, 2010. This “flash crash” caused the Dow Jones to drop 998.5 points (about 9%) within minutes, only to recover a large part of the crash later in the day. According to the Commodity Futures Trading Commission (CFTC), high frequency trading “did not cause the Flash Crash, but contributed to it by demanding immediacy ahead of other market participants.”

Flash crashes and flash rallies of 1000 points are now the new normal with sixteen occurring since March 1st. Four of these historical daily gains were above 9%. Trading curbs, known has circuit breakers, were hit four times last month.

Wikipedia

Source: Wikipedia, List of Largest Daily Changes in the Dow JonesSource: Wikipedia, List of Largest Daily Changes in the Dow Jones

Can’t Beat Them, Join ‘Em

During the Q4 2018 sell-off, Guy De Blonay, a fund manager at Jupiter Asset Management stated 80% of the stock market is controlled by machines. In 2017, JP Morgan stated that “fundamental discretionary traders” accounted for only 10 percent of stock trading volume.

Billionaire Steven A Cohen’s hedge fund had to focus more on quant trading in 2017 when it lost money in most of its traditional trading strategies in that year, while its quant investors made money. For example, Steven Cohen’s $12-billion hedge fund, Point 72 Asset Management, is moving about half of its portfolio managers to a “man plus machine” approach.

According to Wells Fargo, robots will replace 200,000 banking jobs over the next 10 years. Citigroup has formed a lab to cross-train traders and developers for machine learning and artificial intelligence. The programming language, Python, is especially in high demand at leading banks, such as JP Morgan and Goldman Sachs.

Conclusion:

Daniel Pinto, JP Morgan’s Co-President, stated that investors may have to get used to big, sudden moves in the stock market due to fewer institutions pushing equities to attractive valuations while hedge funds reach unprecedented levels of employing computerized momentum-based strategies. The result will be “faster and deeper” corrections.

The problem with “faster and deeper” corrections is there is essentially no time for the average investor to adjust. Perhaps we will get a coronavirus vaccine or antiviral tomorrow, and business will go on as usual. Or, the opposite could happen, and things will get worse. One thing is certain: Until there is regulation, the machines will profit either way.

Okta: Premium Research

0722c012-6ea6-4805-ba0e-87e05efb29a2_Okta-Premium-Research.pdf

Okta Premium Research

IAM Overview

Identity and access management (IAM) helps to make sure the appropriate people access the appropriate networks and applications. Features include authentication, authorization, trust and security auditing for both onpremise and cloud-based systems. 

Defining and managing roles is needed for both customers and employees. The goal is to have one digital identity per user, and to maintain, modify and monitor this digital identity to allow access to the appropriate assets and in the right context. This may include onboarding or offboarding the user. IAM systems allow for the administration of user access across an enterprise and ensures compliance.

IAM became more complicated once employee’s began to use their own devices and as companies transitioned to the cloud. This is because there was no longer a perimeter. Today there are on-site employees, off-site contractors, hybrid cloud environments, software-as-a-service applications, bring-your-own-device users, UNIX, Windows, Mac, iOS, Android – and soon there will be billions of machine to machine connections (internet of things) communicating through APIs. 

IAM is important because these devices, user credentials and access points are where the majority of security breaches occur. According to IBM, 60% of data breaches are caused by an organization’s own employees.  

According to Forrester, IAM is broken down into six technologies that have high business value. 

•       API Security: Allows for easy, single sign-on (SSO) access for B2B ecommerce and API integrations. This is especially useful for IoT, or the internet of things, device authorization as many devices must communicate seamlessly. This is important for machine-to-machine communication.  

•       Customer identity and access management (CIAM) enables organizations to capture and manage customer identity and profile data. Features include customer registration, self-service account management, access management, and directory services. Customer retention is much higher when there is less sign-on friction and fewer required steps. This is also important for omnichannel sign-in, such as switching from mobile to laptop.  

•       Identity Analytics (IA): Identity analytics evolved from the use of cloud and allows behavior analytics to identify usage and access patterns in data collected from the IAM. This creates risk profiles for the user behaviors and helps manage risk profiles based on application usage.

•       Identity-as-a-Service (IDaaS): This provides single-sign on and identity management as a software service. The benefit is to remove servers, purchase/upgrade/install software, data backups and hosting fees from the provisioning process.  

•       Identity Management and Governance (IMG): IMG helps to minimize the risk of data breaches and improve end user productivity. Offers control and visibility into inappropriate access or policy violations. Helps to achieve compliance.

•       Risk-based authentication (RBA): Allows for a variation of single-sign on and two-factor authentication.  

Overview of Okta:

Okta is the preferred name brand in identity access management (IAM). When speaking to security professionals, the company is highly regarded. Okta’s Identity Cloud is an independent and neutral cloud-based identity platform that allows its customers to integrate with any application or scalable platform. One obvious benefit is that Okta does not lock customers into an ecosystem, like Microsoft or Salesforce, hence the word “independent” is frequently used in their marketing materials. 

Workforce Identity simplifies the way an organization’s employees, contractors and partners connect to its applications and data from any device. This is the majority of the business. 

Customer Identity Cloud enables organizations to transform their own customer’s experience making use of API- level access and seamless customer experiences. There is a large product range including Universal Directory, Single Sign-On, Adaptive Multi-Factor Authentication, Lifecycle Management and API Access Management.

The company recently launched new products, such as Access Gateway or advanced server access Dynamic Scale. This helps enterprises handle traffic bursts with up to 500,000 authentications per minute. 

This month, the company announced end-to-end passwordless access with Okta FastPass. This will allow for a passwordless login experience across iOS, iPadOS, macOS, Android and Windows. The goal is to reduce friction while increasing security. The company believes that early access to FastPass will be available in Q4 2020.

There are a few reasons companies are more likely to go with a proven brand like Okta for identity access management. For one, IAM allows access to the company’s most critical systems and assets. Also, in order for IAM to work effectively, Chief Information Security Officers (CISOs) must put all of their eggs into one basket, as One Identity points out. Therefore, they will lean towards the independent solution that is also best in breed. 

There are additional concerns and costs to integrating IAM with both on-premise and the cloud, and whether internal admins can properly work with IAM. Once IAM is implemented, CISOs and security teams want a solution that works effectively and does not duplicate workloads. In other words, this isn’t the place where a company cuts corners or goes with discounted solutions. 

On the larger corporate-level, Microsoft is one of Okta’s main competitors. However, Microsoft’s goal of locking businesses into Azure, Skype and Office 365 is not ideal for all companies. Many prefer the freedom of multi-cloud and multiple vendors/cloud software solutions. Ping Identity is a competitor on the SMB level, yet does not have near the revenue growth or suite of products/solutions. Salesforce also has their hat in the ring but similar to Microsoft requires vendor lock-in with their software suite.

Addressable Market & Customer Use Cases

When Okta went public in 2017, the Workforce Identity addressable market was at $18 billion. According to Okta’s

Investor Day Presentation, Workforce Identity has now grown to $30 billion and Customer Identity has grown to $25 billion. Over the past three years, Okta’s revenue has grown at a CAGR of 54% from FY 2017 to FY 2020.  

Okta derived 84% of its total annual revenue from the United States. The company believes that global demand will be a long-term opportunity.

Use cases for Okta:

•       New Corp put 75% of its computer power into the public cloud and extended their workforce operations with applications like Google Apps and Dropbox. There are a total of 150 apps across all of News Corp’s digital sites and work flows. News Corp uses Okta’s single-sign on (SSO) access for easy access to applications, secure access with multi-factor authentication, and automates provisioning for new employees to onboard quickly.

•       In the third quarter, the company won a workforce identity contract for Berry global, a Fortune 500 manufacturing and packaging company with tens of thousands of employees. The company wanted to protect itself from modern security threats. The company will improve the sign on experience for employees, reduce helpdesk request by enabling self-service password requests and enhanced security with multi-factor authentication.

•       A Fortune 50 telecommunications company for its business customers to securely access key business services. Okta was selected over Microsoft to lower maintenance and infrastructure costs and provide faster time to value.

•       Recently, Autodesk selected Okta Identity Cloud to centralize identity and access management for its customers. AutoDesk is the global leader in design and engineering software (Source: 4Q FY 2020 Earnings call transcript).

•       Fortune 500 financial services company upgraded to Okta’s Access Gateway to UniFi access to both cloud and on-premise applications and enhanced security for its over 10,000 employees.

•       For customer identity, a European film and television studio and distributor with over 8 million subscribers was recently onboarded. 

•       NTT data, a global top 10 global business and IT services provider, was a notable upsell in the quarter. 

Coronavirus Effects

Although Okta has stated that billings will face headwinds this year, the company is not revising Q1 revenue guidance of $171 to $173 million. As of now, revenue guidance for fiscal 2021 ending  January remains at $770 million to $780 million. The FY 2021 loss per share is slightly improved from $0.37-$0.42 to $0.31-$0.36.

The company expects slightly improved earnings per share of negative $0.16 to $0.17 compared to $0.23-$0.24 due to the reduced costs in Sales and Marketing from Okta’s employees working from home.  

Despite the strength in Okta’s product during the work from home trend, a few analysts have placed a hold on the stock due to valuation concerns. Canaccord Genuity states they are on the sidelines due to valuation and Needham analyst Alex Henderson recently downgraded Okta due to little room for improvement in valuation. 

Financials:

On March 5th, Okta reported Q4 and fiscal year 2020 results. Total revenue in the recent quarter grew 45% yearover-year to $167.3 million. In the previous quarter, revenue grew 45% YoY to $153 million. 

Subscription revenue grew 46% to $158.5 million. Remaining Performance Obligations (or subscription revenue backlog) grew 66% YoY to $1.21 billion and calculated billings grew 42% YoY to $225 million.

Subscription revenue makes 94% of FY 2020 revenue while professional services and others make up 6%.

Okta is not profitable yet with non-GAAP loss per share of negative $0.01 EPS in the recent quarter compared to negative $0.04 EPS in the year-ago quarter.  

Full year revenue grew 47% YoY to $586.1 million. Subscription revenue grew 49% YoY to $552 million and calculated billings grew 44% YoY to $703 million. Non-GAAP EPS was negative $0.31 EPS compared to negative $0.32 EPS in the previous year. 

Revenue guidance for fiscal 2021 ending January remains at $770 million to $780 million. The FY 2021 loss per share is slightly improved from $0.37-$0.42 to $0.31-$0.36. This will represent a growth rate of 31% to 33%.

Consensus estimates for Okta is $771.65 million in FY 2021 and $1.0 billion in FY 2022.  

In the earnings call, CEO and Co-Founder Todd McKinnon stated the company is investing in growing its base of large enterprise customers. The company added 142 customers with annual contract value greater than $100,000 bringing the total number figure to 1,467 – or an increase of 41% y-o-y. Total customer base is 7,950. 

Operating cash improved 266% from $15.2 million to $55.6 million. Free cash flow also saw a big improvement from negative -$6.8 million to $36.3 million for fiscal year 2020. The company ended the year with $1.4 billion in cash, cash equivalents and short-term investments. Okta carries current liabilities of $546 million and long term debt of $837 million.

The company has been expanding internationally over the past two years, namely, Stockholm, Munich, Amsterdam, Paris, and Toronto. 

Prior to the Coronavirus, the company’s operating expenses were expected to rise due to an increase in headcount. The company’s headcount rose 40% in the first half of FY 2020 and 44% in the second half of the year.  

Valuation:

As stated, a few analysts pointed out that Okta is reaching maximum valuation. I believe most tech growth stocks will go through a valuation adjustment this year. Okta will not be an exception, although the company should fare better than most. 

By my estimation, Okta will fare better than most because its core business of IAM for the cloud is a stable market (comparatively to others right now). We know Okta is not reducing guidance as of yet and I imagine this will be an anomaly come May/June when the majority of companies will have revised guidance or will decline to offer guidance. 

When considering Okta’s valuation, it’s important to note that Okta spends more than 50% of its revenue on sales and marketing. I’ve been critical of this in the past and continue to question the runway of a few cybersecurity companies. Some companies spend heavily to stave off competition (this is my thesis for cybersecurity). Others move very quickly and spend heavily to gain market share while the opportunity is nascent. This is essentially what Amazon did and Netflix has been doing. I am initiating coverage on Okta because of the company’s name brand status in the B2B/enterprise world and because I believe it will be the de facto IAM company. 

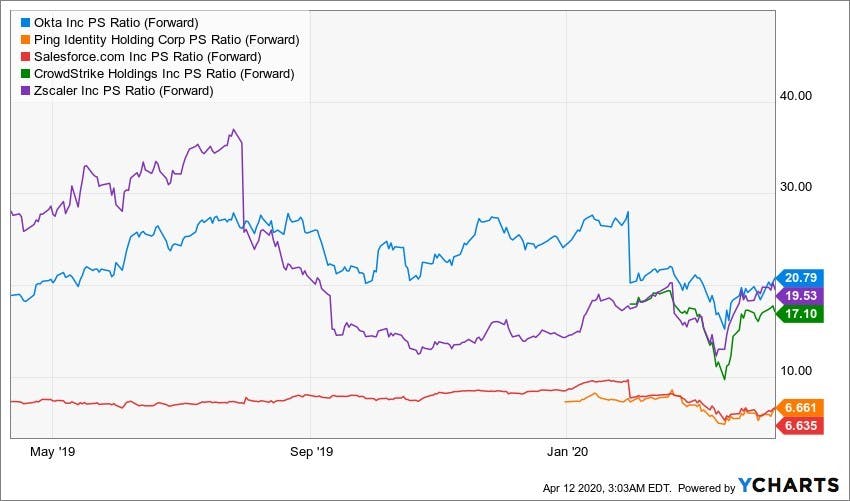
Okta has a current price to sales of 26 and a forward price to sales of 20.7. During the Q4 2018 selloff, Okta was at a current price to sales of 14-15 and its lowest forward price to sales has been 17. This would place Okta at a market cap of $12 to $13 billion with an addressable market around $50 billion (combining both workplace and customer identity markets).

Keep in mind, a $12-$13 billion market cap places Okta where the stock traded during the momentum rotation in Sep/Oct 2019; which was a 1-year low for many cloud stocks. Therefore, this is not a drastic discount given the current economic uncertainty. 

However, you have to balance the fact that Okta’s customer base and market is more likely to stay intact this year compared to other tech companies. Assuming forward revenue will remain in the $770M range in the current fiscal year (as the company has stated it will) and $1 billion in the next fiscal year, then Okta will stand apart from companies that are lowering guidance.

Catalysts and Competitors:

Ping Identity carries a much cheaper valuation yet the low growth reveals a company that struggles to compete. Ping is forecasting full year revenue growth of 9%-11% from $242 million to $263 million. This growth is too low for me to personally consider, especially considering total addressable market in IAM has been growing rapidly.

It’s important to note that Gartner and Forrester place Okta above the competition. This matches the overall reputation of Okta in the tech industry. When I speak to companies about products, Okta is well received and spoken of very highly.  

Regarding Salesforce, Microsoft, IBM and Oracle, many of these companies require vendor lock-in and are not able to innovate as quickly. Okta’s FastPass is a good example of how Okta is innovating.  

On the topic of catalysts, Okta is a Coronavirus shopping list stock. Millions of employees will work from home this year and this will present operational challenges. Products like Okta will ensure only authorized users access their cloud applications. The CEO, Todd McKinnon, stated in a recent interview that the company is seeing an 80% increase in the amount of strong authentications. 

We are covering Okta as a buy-and-hold due to hybrid cloud migrations, the popularity of multi-cloud (which prevents vendor lock-in) and the company’s future potential in blockchain. These are the more important catalysts, in my opinion, as valuing companies based on the Coronavirus is beyond my scope. 

I feel fairly confident that blockchain will take off in the financial markets within a reasonable time span of 1-3 years and that Okta will be very well positioned when this occurs. Gartner and a few others place 2023 as the year when blockchain will be mainstream. The market will reach $3 trillion by 2030 (not all of this will be IAM, of course). Basically, I like Okta now for hybrid and multi-cloud and the $50 billion TAM …. but I really like Okta for the much bigger TAM that includes blockchain down the line.

Technical Analysis by Knox Ridley to follow this week.

Market Update: April 12th

Last week was eventful. Unemployment rose by another 6 million claims on Friday bringing the estimated unemployment rate anywhere between 10-14%. The Federal Reserve announced an unprecedented program, which included shoring up the high yield bond market. Standard & Poor’s is projecting a default rate in this cycle to be around 10% by year end, with some estimates approaching 13%. This is higher than what we saw in 2008. The SPX also broke the 2750 level, an important level we have been tracking since the expected bounce off the March lows.

We have been tracking a 5-wave pattern down, where the current bounce was the 4th wave bounce. This would eventually lead the final 5th wave to new lows. This was the game plan, as long as the market stayed below the 2750 mark, which failed on Friday.

Please note, we have been discussing more on this topic in the forum under predicting bottoms. predicting bottoms

The 4th wave scenario topping out from current levels, and thus taking us down to the 2100 region in a quick fashion is still technically valid below the next resistance price of 2855; however, the probability of this has become much lower than the other potential scenarios at this point, one of which is now the possibility of a renewed bull market.

I find this scenario has low probability as long as we stay below 3150 on SPX. And if we do confirm this pattern, it will not be a straight shot, so there will be plenty of time and room to adjust. However, any responsible technician has to acknowledge this potential.

For one, it can’t be understated the amount of stimulus thrown at this market. Both the treasury and the Fed have and will continue to unload as much stimulus into this event. This event will be the ultimate test for the popular phrase, “don’t fight the FED.”

Considering the record breaking outflows from equities, the large short interest in the market, coupled with the elevated put/call ratio being tilted towards purchasing more puts right now, the “pain trade” for the larger market would be a continued move upward.

We will monitor the market this week and release an update on the technicals once we have more information. However, the scenario I am now tracking has us in a more complex bear market and I personally believe there will be a re-test of the lows. Of course, feel free to invest as you see fit and what matches your investment thesis for this market.

A few things Beth has been watching and wants to make you aware of:

  • She wrote an article for Forbes on weakening ad demand that has similar information that she had published prior on the premium site. Recently, there was a report by Gupta Media that she did not include in the editorial. The report states, “As of data available Tuesday, Facebook’s worldwide CPM fell an all-time low of $1.95, according to data analyzed by Boston-based agency Gupta Media.data analyzed by Boston-based agency Gupta Media.The article comes from MediaPost, a reliable source. Keep in mind, Facebook usage is up so this should help some. However, her concern is for the smaller players in ad-tech, notably TTD, RUBI, PINS, SNAP and perhaps Roku although Roku has licensing fees/commissions from content apps.
  • May is going to be a pivotal month for the tech industry. As of now, we saw startup layoffs increase 4X from 4,000 to 16,000. Per RBC Capital, “We view May as a critical month – if the majority of the workforce is not back to business as usual, we believe significant cuts (of people, not just numbers) are increasingly likely in software.”
  • If the shelter in place continues into May, net bookings for Q2 and Q3 could be cut between 20-50% on average.

As of now, these are the major points to acknowledge:

  • Now that we have closed above 2750, The next major resistance level will be the 2855.
  • If we clear this zone, look for a topping pattern between 2950 -3100. The 2950 resistance will be the price region that I will look to build up my short positions (if we reach it), with a stop at the 3130 area.
  • If we close above 3130, the probability that we are in a new bull market shifts.
  • If the market closes below 2500, the bear market will continue.
  • The bear market targets are still the same as of now.
  • A final leg in this bear market is still the higher probability outcome.

Stock Updates

Dynatrace (DT)

Dynatrace is a position we recently started to build out along with our hedge in a Lyft short. The structure still suggests that the target box we outlined will likely be hit. We are witnessing weakening internals as outlined by the MFI and RSI, which are both making higher highs while price makes a lower high. We like this company and are raising the price range.

Datadog (DDOG)

We recently went long on Datadog, as posted on the forum. Per reader feedback, we are working on a system that differentiates between trades and buy and holds. Our targets on the spreadsheet are our buy and hold targets.

Like DT, we like this stock for the long haul. The structure of the stock is suggesting that we will retest the lows, after likely failing to close the gap above around $40. We are raising our target entry for DDOG to $30.

Chainlink (LINK)

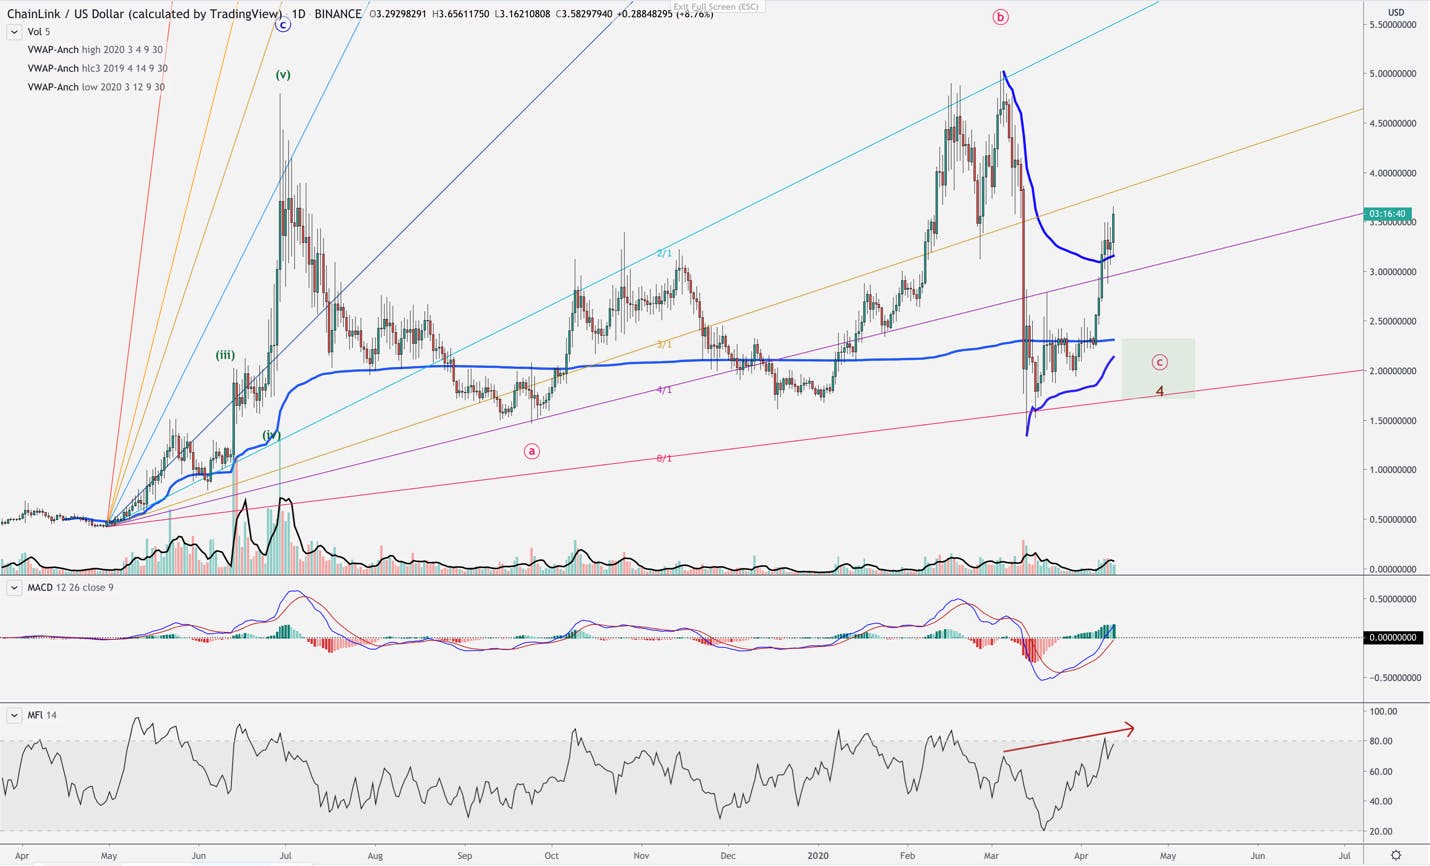
Chainlink has had another impressive run recently. I offered my recent chart in terms of Elliott Wave analysis, which is still expecting the opportunity to pick up shares sub-$2 once the corrective move we are in completes. However, I wanted to show you what my Gann analysis is suggesting, as well.

Notice how the price reacts to the Gann ratios. We have several tops at various ratios as well as supports. We bottomed on the 8/1 in red, and pushed through the 4/1 in purple. I believe we will test the 3/1 in gold, which will likely mark a top to this move. If we can close above the 3/1 in gold, I will likely look to go long with tight stops.

Snap – short position

On weakening momentum and volume, Snap keeps pushing higher in a clear corrective pattern. It has found resistance at the 61.8% retrace level from the entire drawdown. This level also coincides with the 50% extension of the A wave within the corrective move off the March lows. Another Fibonacci confluence zone is the 100% extension of the C-wave equaling the length of the A-wave, which will also coincide with the 85.4% retrace level around $17.25.

We believe that Snap will find a top within this range, and give way to the final C-wave down. The first target for this drawdown will be $11. Below $11, and the $8 region comes into play. I will look to hold a stop at $17.50. If we close above this level, I will close my position the next day.

With shorts, I target between 20% – 40% as the target gain. Shorts gains can turn into losses in a matter of days while the VIX is this elevated.

Lyft – short position

The setup with Lyft is very similar to Snap. We are in an even more clearly recognized corrective structure, which I believe could push as high as $45 before finally giving way to a new downtrend.

The internals are supporting a weakening uptrend, with less participation as noted by the volume. Like with Snap, once we hit the $23 range, I will look to cover some of the position. If we break below $22, expect the recent lows to come back into play. If we close above $45, the next day I’ll close my position.

April 2020: Spreadsheet

The link for April’s spreadsheet is below.

Please reference the forum for Knox’s updates and charts to supplement the spreadsheet and also the blog we wrote yesterday to supplement the spreadsheet.

We increased the rank for cloud infrastructure and data center companies while also raising cloud infrastructure monitoring. For now, we adtech is ranked lower as there are too many unknowns as to when demand will return. These are great companies so we will continually monitor as we go along.

ACCESS APRIL 2020 SPREADSHEET HERE

Please ping us on the forum if you have any questions.

Thanks, Beth 

Spreadsheet Update: April 2020

Please note: April Spreadsheet coming tomorrow! Please note: April Spreadsheet coming tomorrow! 

Nobody knows how the pandemic will play out. Many of our readers have said on the forum that “finding the bottom” is not the goal, and we couldn’t agree more. 

If you were to press me for an answer, my belief is that a recovery in Q3 is being very optimistic. I know that some banks and institutions have forecast this. In my perspective, the demand in tech is unknown – will buyers resume at previous levels? The employment situation in tech is certainly not immune either. A few more cracks appeared this week with a report of 4,000 layoffs in the startup sector. Startups are big consumers of cloud software, so it has a domino effect. 

Our approach is to make educated decisions based on product knowledge/competitive positioning (my analysis) and probabilities (Knox’s technical analysis). We do not have strong bear or bull opinions. I personally get fatigued with the “buy buy buy my portfolio” analysts and the “world is ending” analysts. That’s part of why Knox is so instrumental. He presents the index numbers and the stock movements, uses a methodology to manage risk and remove emotions, and we go from there. 

When looking at the month ahead, our company’s portfolio has this general plan:

  • Buy at the high end of the targets for data center stocks: cloud at the infrastructure level and cloud at the platform level should do well. One of the reasons I focused on cloud for the premium site during the sell-off is that it’s insulated from trade wars and recessions. My article at the time said, “My prediction is this may be one of the last cycles when tech is considered less safe than value stocks. As the market will find out (the hard way), cloud software is actually very safe. It is insulated from trade wars and overseas manufacturing issues. It reduces costs for enterprises, which is ideal for a recession. Lastly, cloud software is at the beginning of a rapid growth cycle compared to its counterparts in tech — such as mobile, e-commerce and advertising — which are reaching saturation, are finding themselves in the crosshairs of anti-trust and are susceptible to consumer spending changes.”

On that note, I think a solid cloud coronavirus portfolio would include: Nvidia, AMD, Microsoft, Alibaba, Datadog, and Dynatrace. I plan to add Okta this month. I’m not a fan of Intel myself as their innovation lags, but I would listen to an argument here. You could make an argument for Amazon too, as the e-commerce, grocery and data center are all strong segments right now. 

We covered LAM recently, which is more on the memory side. I’m looking for cash-cow havens that position well for a renewed trend and can also weather the year ahead. LAM has impressive levels of cash. There is some crossover with the data center but mainly powers mobile and electronics. That last part could be stalled but I’d like to get into the stock during this year’s respite from the semiconductor rally.

  • Buy at the mid-low end of the targets for ad-tech: This may take through next quarter (Q2) to see the full effects. I’ll be listening closely on the earnings calls. This is Pinterest, Roku, The Trade Desk, Snap, Twitter, Google, Facebook, Rubicon/Telaria. Here is some follow up information in addition the premium blog post I wrote recently:
    undefinedundefinedundefined

To recap, ad-tech companies could have a positive earnings surprise but it’s not probable they will get through the three long months of Q2 unscathed. Patience here is going to pay off. Usage going up well over double digits and revenue being flat to down is not something to get hasty with. 

Disney is a great example of a big brand having to furlough workers. You can imagine what this did to Disney’s ad spend, and we know Roku was a favored ad platform for Disney. Basically, whatever we see for Q1, we can expect this impact to double or triple in Q2. 

You’ll see some conviction downgrades across ad-tech for April.

  • Buy at the mid-low end of the targets for consumer related stocks. Apple, of course, falls into the consumer category. On another note, Inseego was on CNBC this past week on seeing an increase in demand for hotspots. This boost could be a one-time event. 
  • Buy at the high end of the target for enterprise stocks with excellent cost-benefit ratios: Alteryx is very expensive, so it’ll be interesting to see if they can maintain the $4500 product cost as we (potentially) face more layoffs in tech.As stated, I plan to look closer at Okta as identity access management is likely doing well in the current environment. They’ve got the special sauce with the product, and in times of stress, companies will go with the brand name that works well rather than undercut with cheaper competitors. Identity management could go under the data center category, as well. 

Cloud work-from-home: As you know, I like Slack. The market will likely question Slack bc the company is bottom heavy with it’s freemium model; meaning paid accounts aren’t offsetting the free accounts. “Will the product monetize?” — this is what financial institutions are unsure of. I am not as worried about this. It’s common to gain as much traction as possible and give up gains in the beginning stages. Monetizing is easier than building a product that works well and can scale. 

Docusign should have some staying power too this year. Really great product for legal, real estate, and finance industries who are now working from home. These industries don’t typically work from home so a true growth opportunity and perhaps a change or reinforcement around documents for digital management. We will be covering Docusign soon and officially adding this company to our coverage and portfolio. 

Regarding Zoom Video, don’t get confused about this company as the press starts to lump it into a Coronavirus fad. The company has a rare combination of strong financials and perfect product-market fit. I also covered the security issues on the forum – not concerned with this and actually quite common (and easily fixable). 

Please subscribe to any chat rooms on the forum where you’d like more information. forum where you’d like more information. 

Regarding Knox’s targets, he is holding fast on the ranges, and will update if he sees a need to raise them. Also, if the market is signaling a potential turn, and our stocks have not hit the respective targets, we will update you in a blog post. 

Our goal is utilize this opportunity to setup great long-term positions. However, due to the uncertainty in the global economy, we will lean towards being cautious. What this translates to, is that we feel the 2300-2750 region in the S&P 500 carries too much risk. If a vaccine hits the market tomorrow, we will get back in with more confirmation of an upward trend. Please keep in mind, if we do re-enter a bull market, our projections of where that will take us will make up for being a little late. If we continue to see the ripple effects of closed businesses and (mind-blowing) unemployment, then we will look below 2300.

Thanks!