In this report we analyze: Zoom, Slack, Marvell, Teladoc, Bitcoin and Chainlink
Please note the glossary of terms and techniques here and herehere and here
You can access our portfolio here. You can also track in real time our buys/sells/position updates in the forum. If you want to track us in real time, we recommend that you set up alerts to these 3 chat rooms, which can be done by clicking the link in the top corner of each chat room called, “subscribe for new topics.” here. You can also track in real time our buys/sells/position updates in the forum. If you want to track us in real time, we recommend that you set up alerts to these 3 chat rooms, which can be done by clicking the link in the top corner of each chat room called, “subscribe for new topics.”
In this week’s report, we look at the number of buys we’ve made over the recent correction. Almost all of the positions we bought corrected in a symmetrical, 3-wave pattern, which we used to our advantage.
We also take a look at our two cryptocurrency plays – Bitcoin and Chainlink. From a long term perspective, both are setting up for extended uptrends. However, in the short to intermediate-term basis, there could be some volatility ahead. We outline the path we are taking with both.
Zoom (ZM)
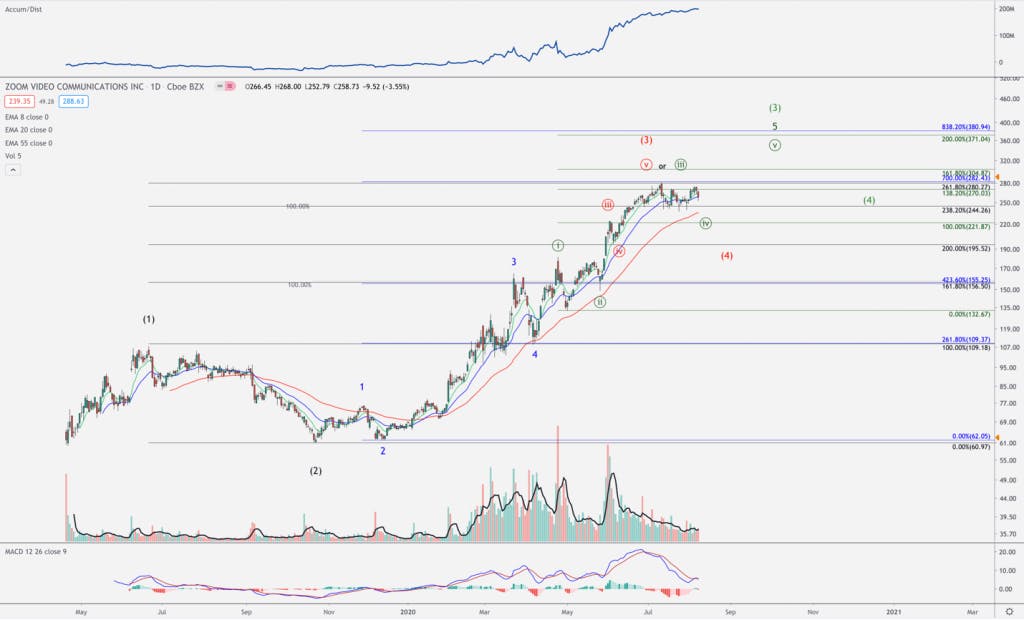
On August 10th, as it appeared to be setting up for a pullback, we laid out two potential paths that Zoom could take. The red path assumed that the large degree 3rd wave had topped. This was setting up for a relatively deep pullback. The green path assumed that we were only going to see a minor pullback and that the large degree 3rd wave had more room to run.
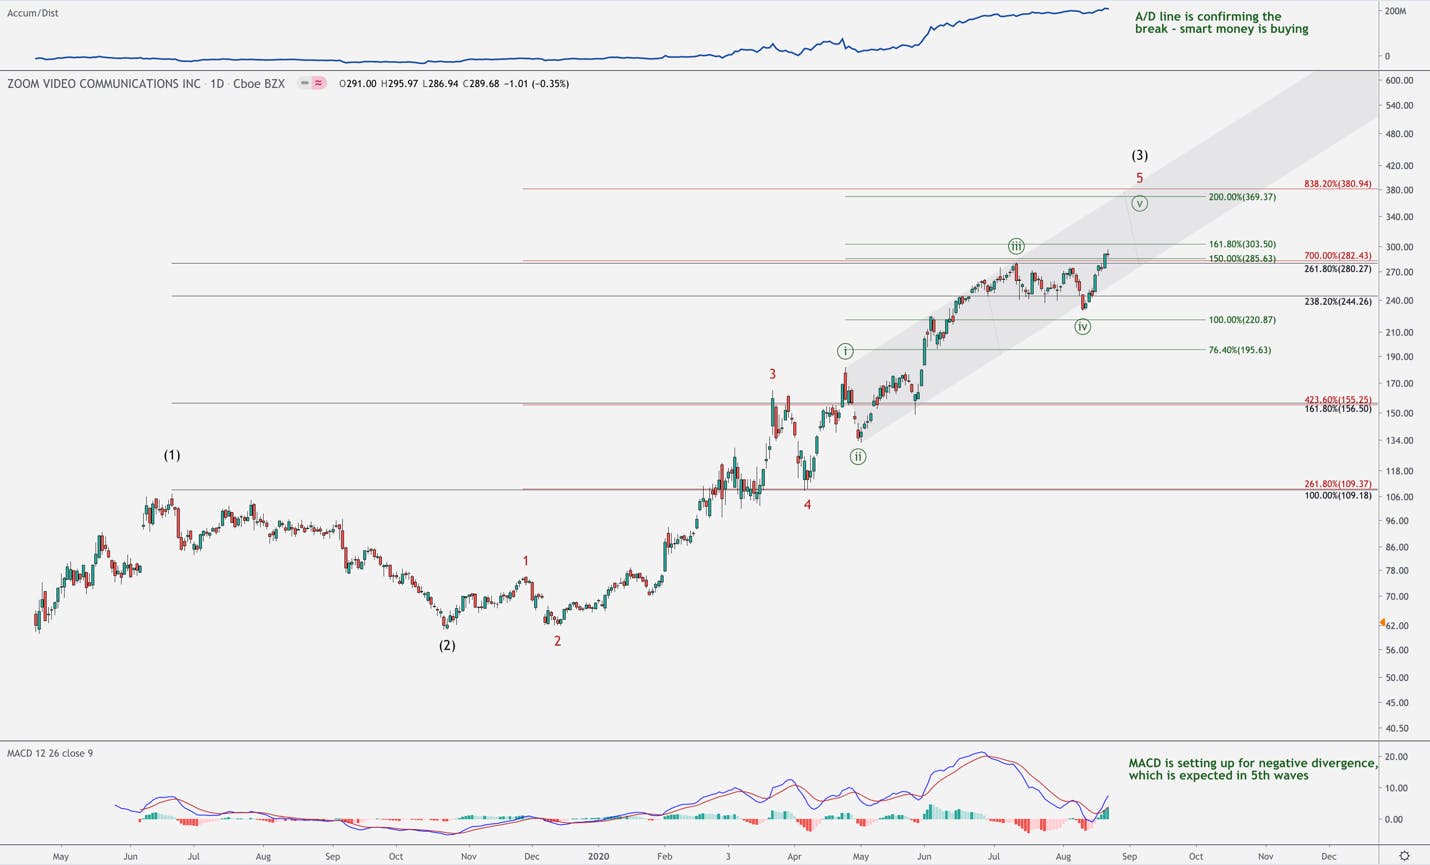
Based on where Zoom bottomed, and how it broke out to new highs, it appears that the probabilities have shifted towards the green path. The below chart outlines this path.
We will want to see Zoom’s recent breakout zone between $280-$285 hold. So far, it has closed 2 days above this zone and it did so on heavy volume, which is an encouraging sign. The Accumulation/Distribution line (A/D line) is also encouraging. It’s suggesting that smart money was buying into the correction as it continues to make new highs with the price.
By focusing on the green count in the above chart, we can get an idea of why it is likely this will be the path Zoom will take going forward.
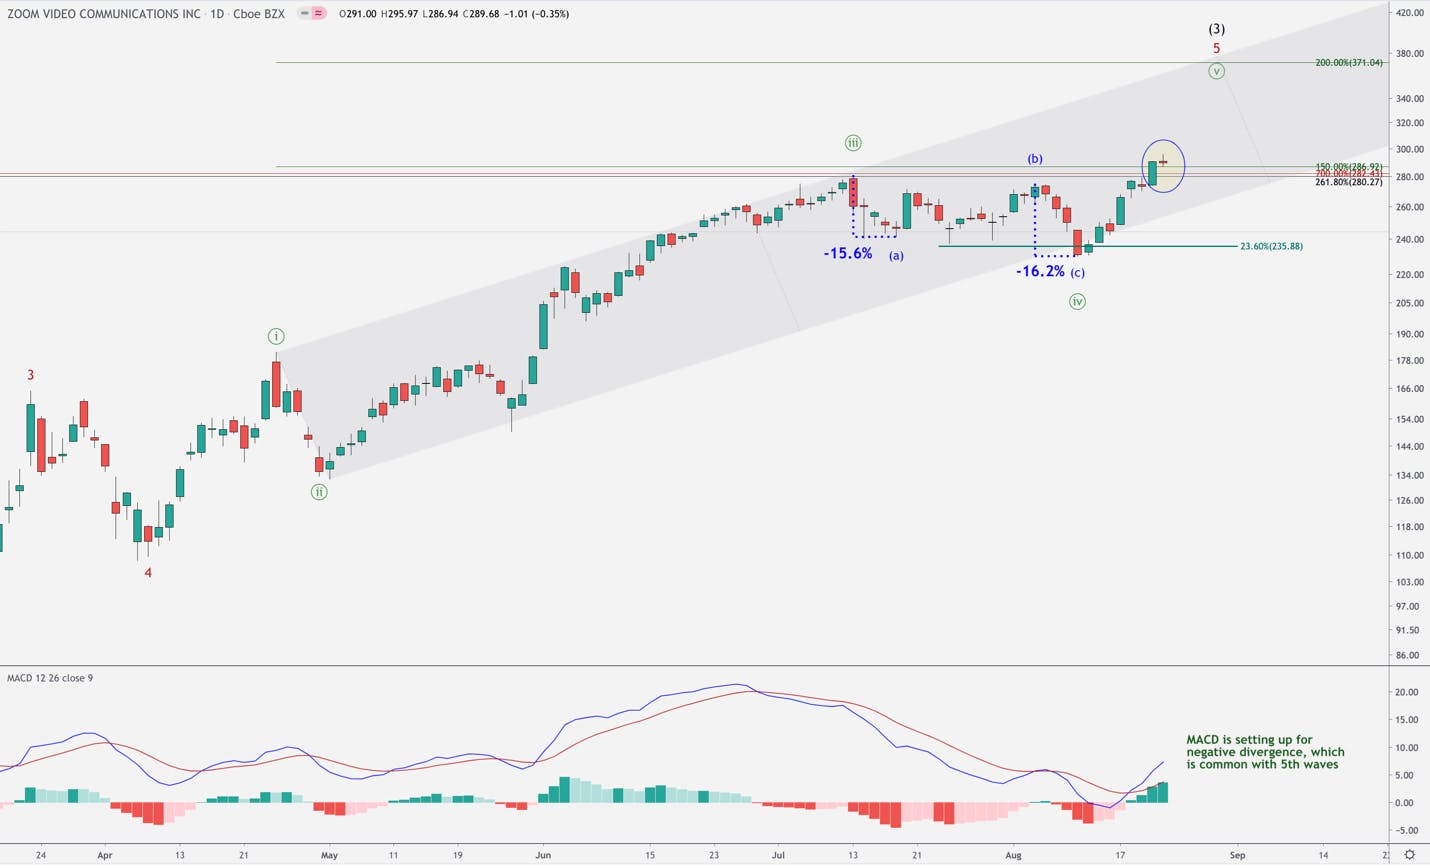
Since bottoming in April, ZM appears to be tracing an ending diagonal pattern. This is a series of 5 waves that tracks a trend channel (in gray). That would make the recent downtrend the 4th wave, and setting us up for the final 5th wave in this move. The evidence that the 4th wave in this pattern is over is:
Note how correction unfolded in three legs (blue a,b,c). The length of the first leg (blue a), fell 15.6%. The length of the 3rd leg (blue c), fell 16.2%. We commonly see corrections unfold in a symmetrical fashion, where the length of the 3rd leg down (C) is within a few percentages away from the length of the first leg down (A).
The correction tagged a common retrace level for 4th wave corrections, which for Zoom is around $235.
The correction found support on the outer regions of the trend channel.
The price has made new highs.
This would put us in the final 5th wave, which is targeting the upper region of the trend channel. There is still a chance that Zoom could fail this breakout and make a lower low; however, the probabilities are not in favor of this scenario as of now. We have guided five successful entries with Zoom so far. We believe that when this move completes, we will have an opportunity for the 6th.
Slack (WORK)
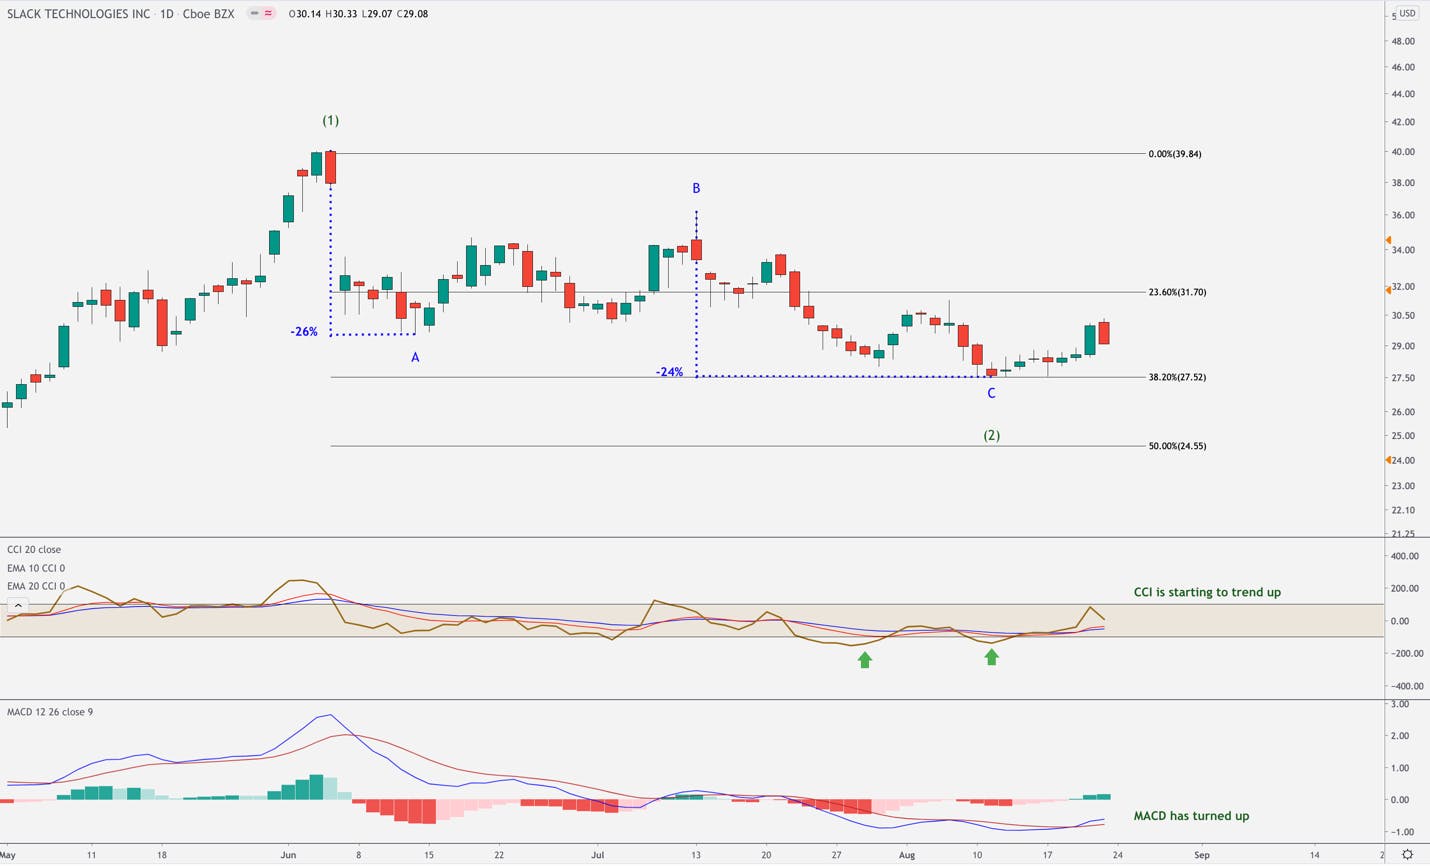
Slack is a position we recently added to, as well. Like Zoom, note the three leg correction (blue A,B,C). Though it’s not perfect symmetry, the length of the C wave came within 2% of the length of the A wave.
The price found strong support on the 38.2% retrace level of the 1st wave from the March low. This was confirmed by the positive divergence we saw in the CCI.
Because of these signs, we added to our WORK position.
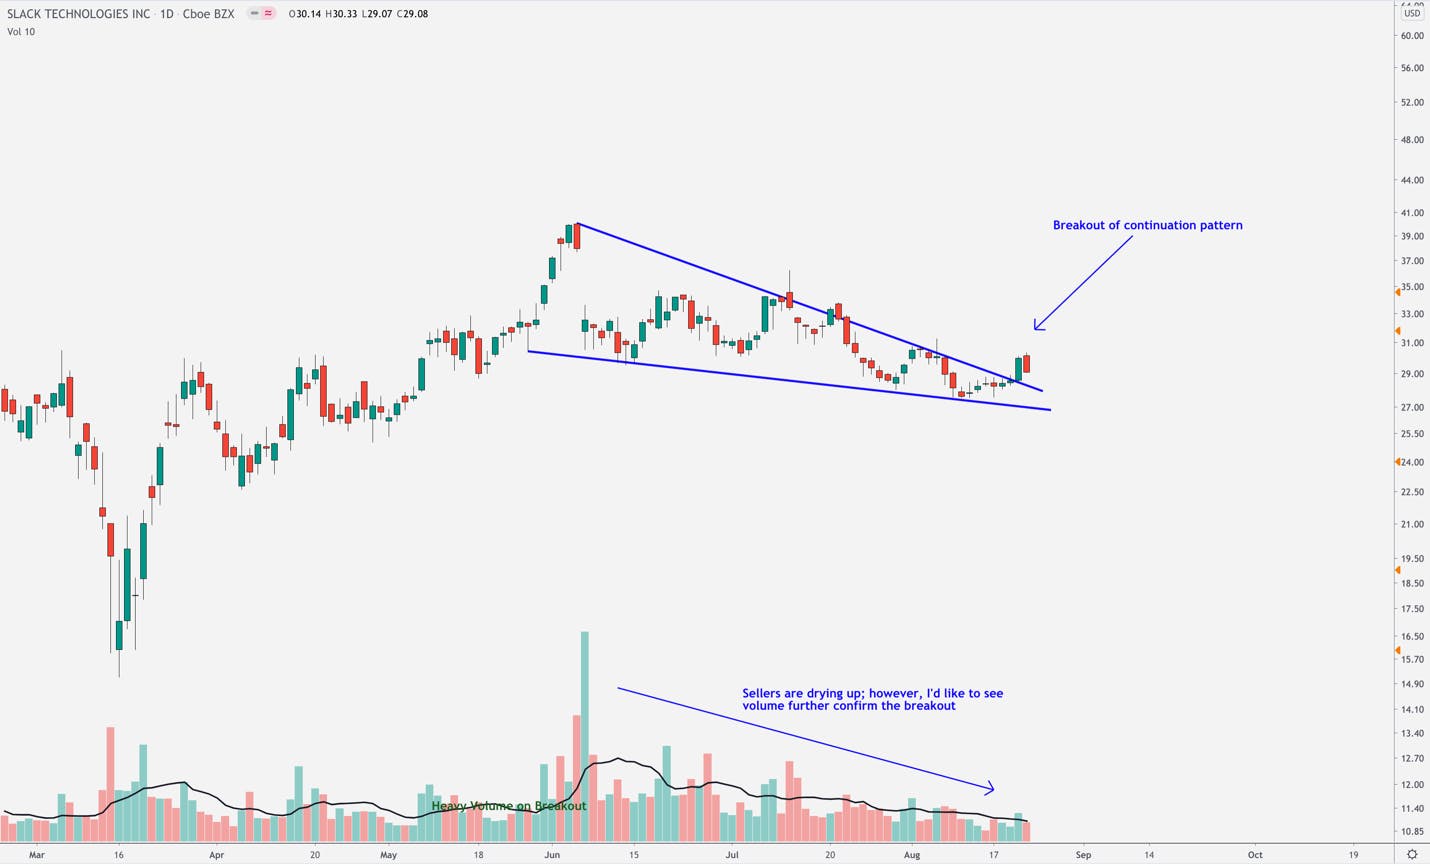
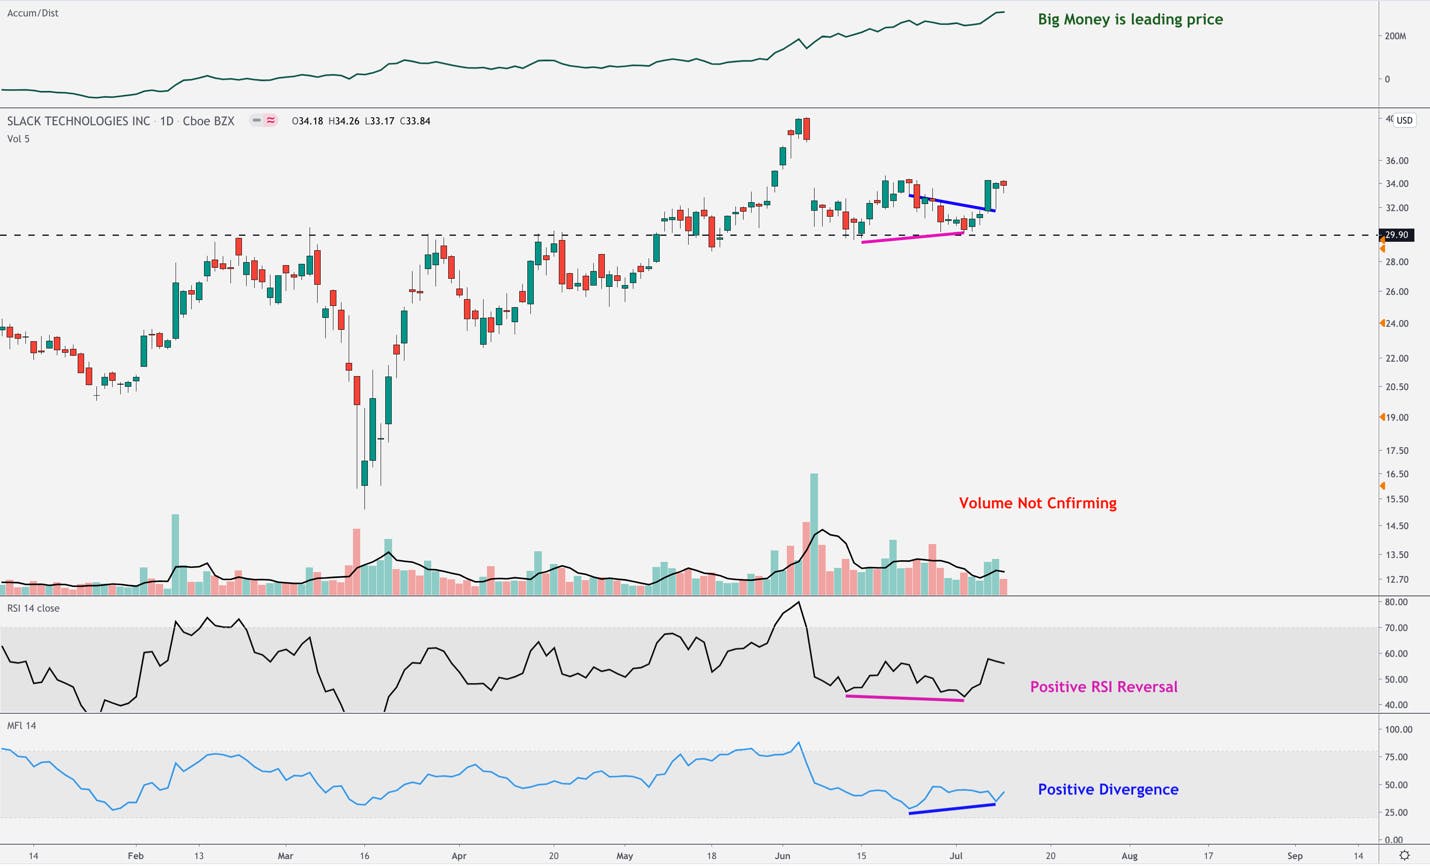
The confirmation we have received so far is in the MACD crossing over, for one. The second confirmation comes from classic technical analysis in the image below.
Slack has traced a classic continuation pattern known as a pennant. The price has zig-zagged within this pattern on decreasing volume, then broke out, followed by a retest of the breakout zone.
The only concern here is the lack of volume confirming the breakout. This isn’t as crucial as some might think. It’s always a great confirmation, but price can increase simply by sellers drying up. We will want to see the price hold above the breakout zone, and move higher, or else the correction may not be over.
Marvell (MRVL)
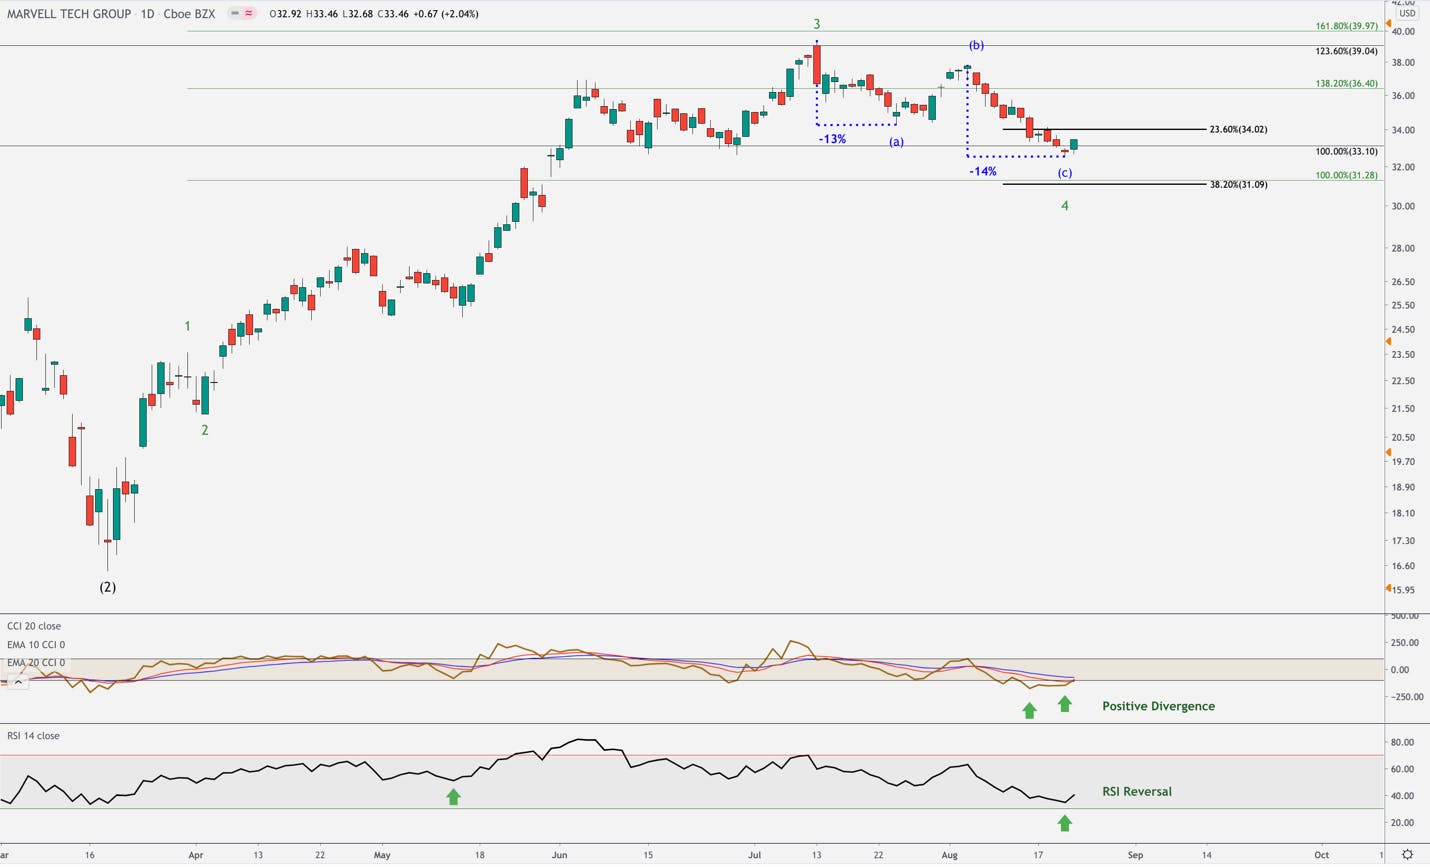
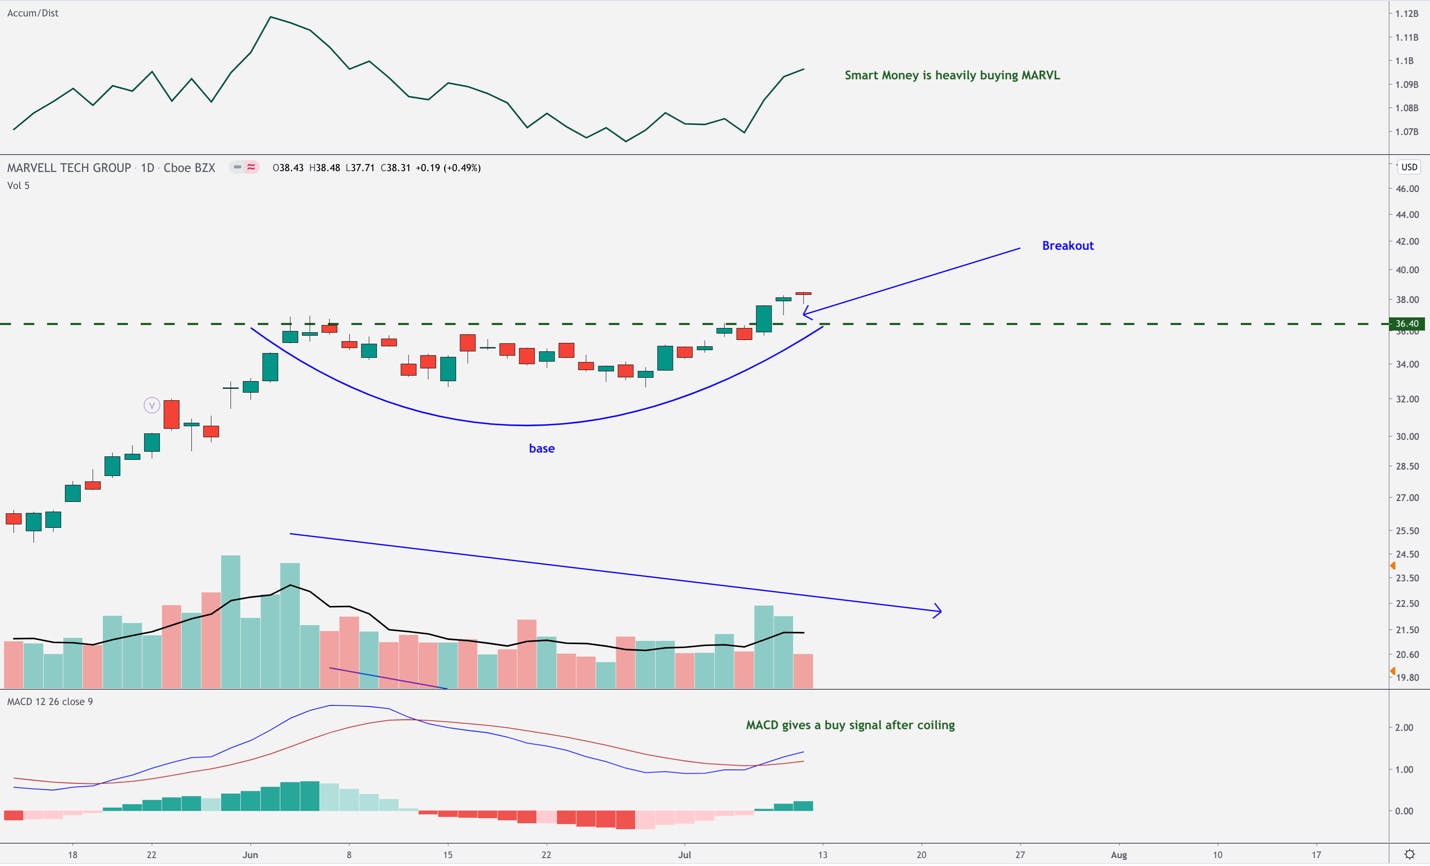
So far, Marvell has played out exactly as we planned from last week’s analysis. It appears to be in a 4th wave correction, which we typically see bottom at or between 2 specific regions. For MRVL, these regions are $34 and $31 regions.
Within this region, you’ll notice symmetry at work again. The length of the first leg down (blue a) is -13%. Then, the length of the 3rd leg down (blue b) is -14%. This, coupled with two buy signals that formed in the internals, had us add to our current position in MRVL.
We are expecting a bounce from current levels. We will want to see this bounce unfold in a 5 wave pattern on a smaller timeframe chart, like the 30 minute or hourly chart. If this does not happen, and instead gives way to another leg lower, we will happily add again to this position as long-term investors.
Teladoc (TDOC)
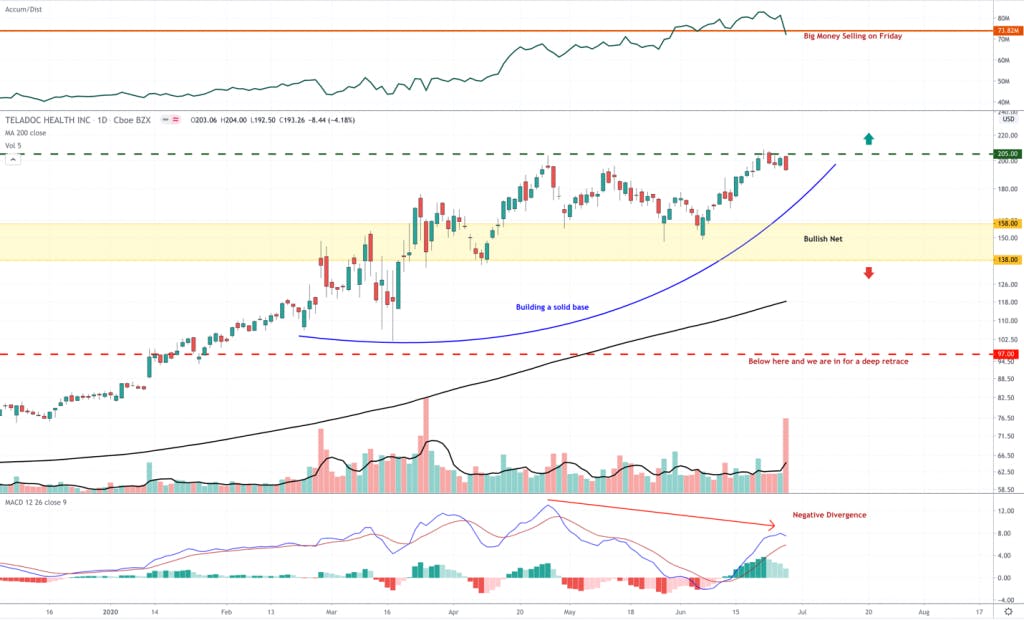
Teladoc had a sharp drawdown after announcing the acquisition of LVGO. Based on the information given to us in the structure of the drawdown, we identified two support regions in prior reports, the first of which is around the $174-$173 region. It seemed probable that we would see the price hit this level. However, in technical analysis, you have to be prepared to change your thesis in real time if evidence begins to suggest otherwise.
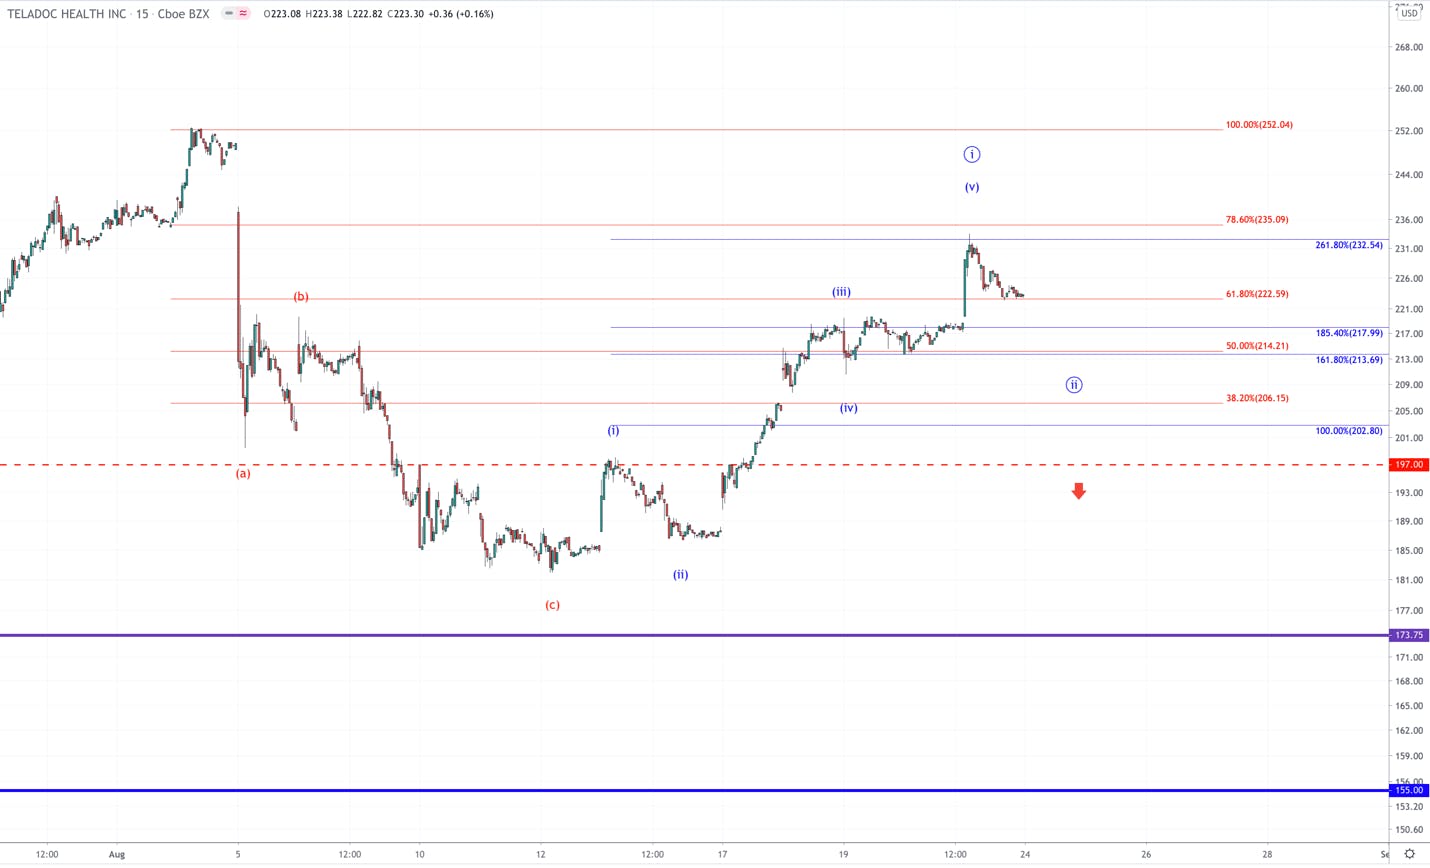
This, we believe, is what happened with Teladoc last week. If Teladoc was to hit the $174 region, it would have to do so in a C-wave. That would make the current uptrend the B wave. What we know about B waves is that they unfold into 3 wave patterns, symmetrical fashions. This, as of now, is not what we are seeing.
Instead, what we have in blue is a 5 wave pattern pointing up. If this is the case, we have just completed the first wave of 5 to new highs. As long as the 2nd wave holds the $197 region, I will look to add as TDOC begins a new leg higher.
If $197 breaks, the probabilities shift that we may have another leg lower before finding a bottom. This is why I always start small when building a position. If this is the case, we will continue to add in tranches as we approach below support levels.
Bitcoin (BTCUSD)
In June, we announced that we are shifting our strategy with Bitcoin from a more active approach to buy and hold. The reasons for this shift was, for one, Bitcoin trades 24/7, which makes executing on identified setups quite challenging. We also believe in the long-term story to an extent that we are OK with the volatility.
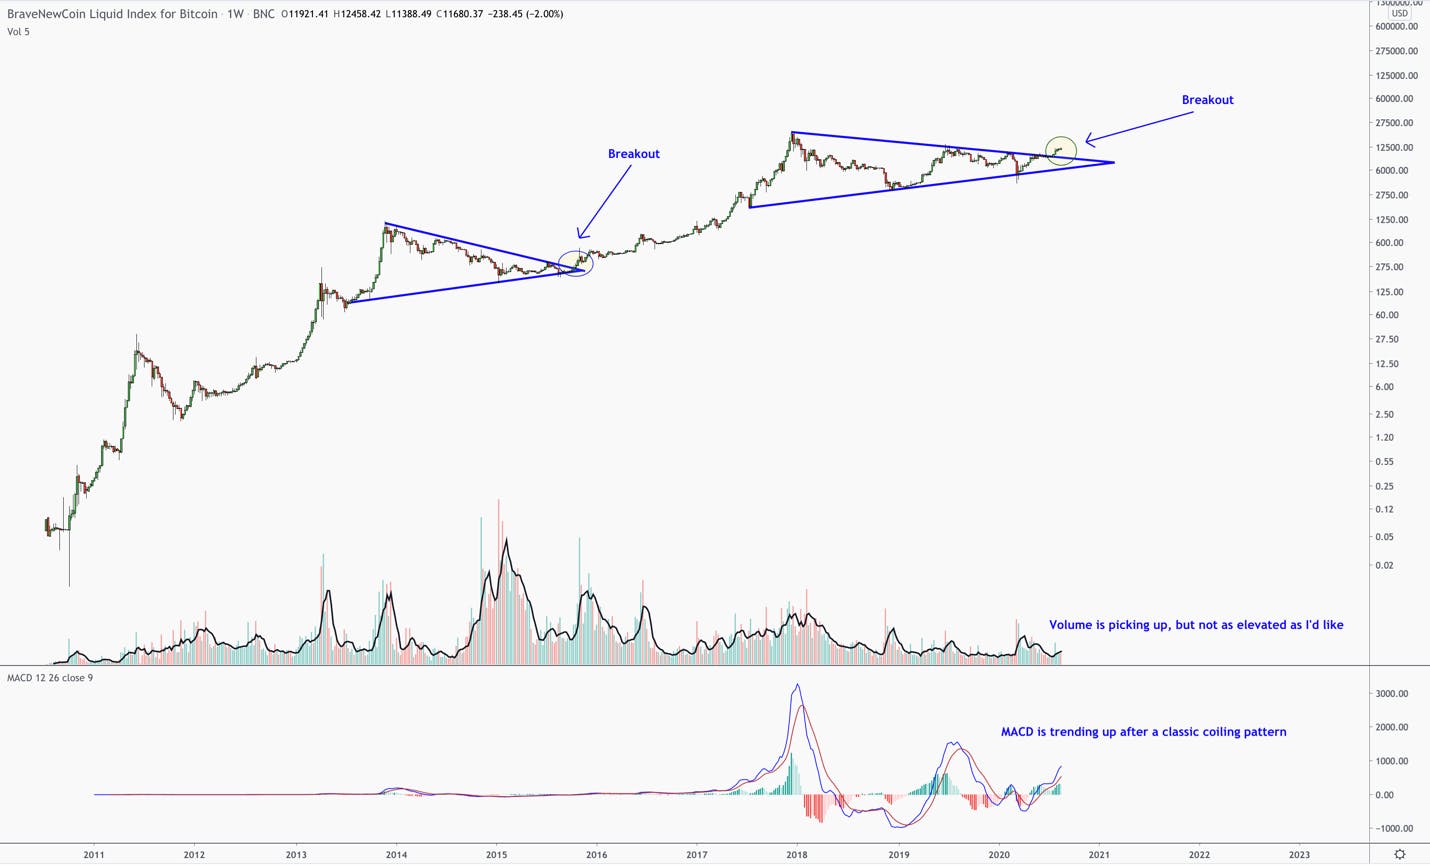
Furthermore, from the perspective of technical analysis, the below chart is a rare gem that also bolsters our decision to buy and hold the asset.
This chart is the percentage growth of Bitcoin from its inception. Using classic technical analysis, there are two continuation patterns highlighted in blue. These are periods of consolidation that follow strong uptrends, and precede the next leg in the trend. The bigger the pattern, the more meaningful it is, and both of these patterns took years to play out.
Where we are today is in the breakout of the second, multi-year continuation pattern, also known as a pennant. The weekly MACD supports this move with a classic coiling pattern following by a steep uptrend. This is the kind of long-term pattern that I search for.
In short, the technicals are aligned with the fundamentals. We will continue to seek out entries with stops for our members who are looking for a position and may not already have one.
Chainlink (LINKUSD)
Chainlink recently became the 5th largest crypto currency in terms of market cap, taking over Bitcoin Cash. Since we covered the coin in August, editorially, LINK is up over 500%. After navigating 2 entries below $1.80, we stopped out of both trades for greater than 40% gains each time. On this last entry, we began a buy and hold position at $4.
Chainlink is not just another alt coin. Instead, it fulfills a unique and needed role within the blockchain stack regarding smart contracts. We encourage you to read Beth’s analysis on it here.
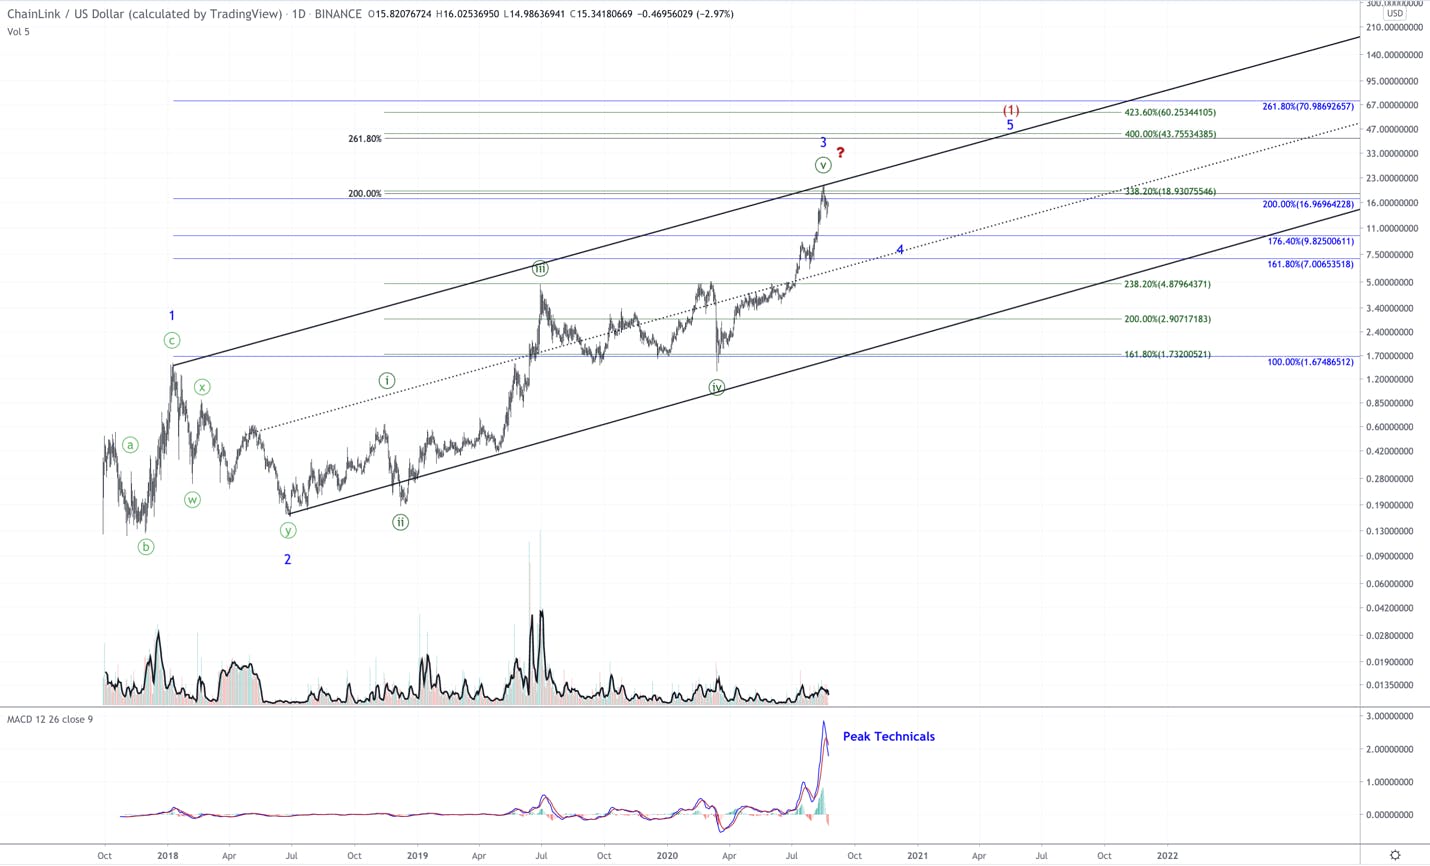
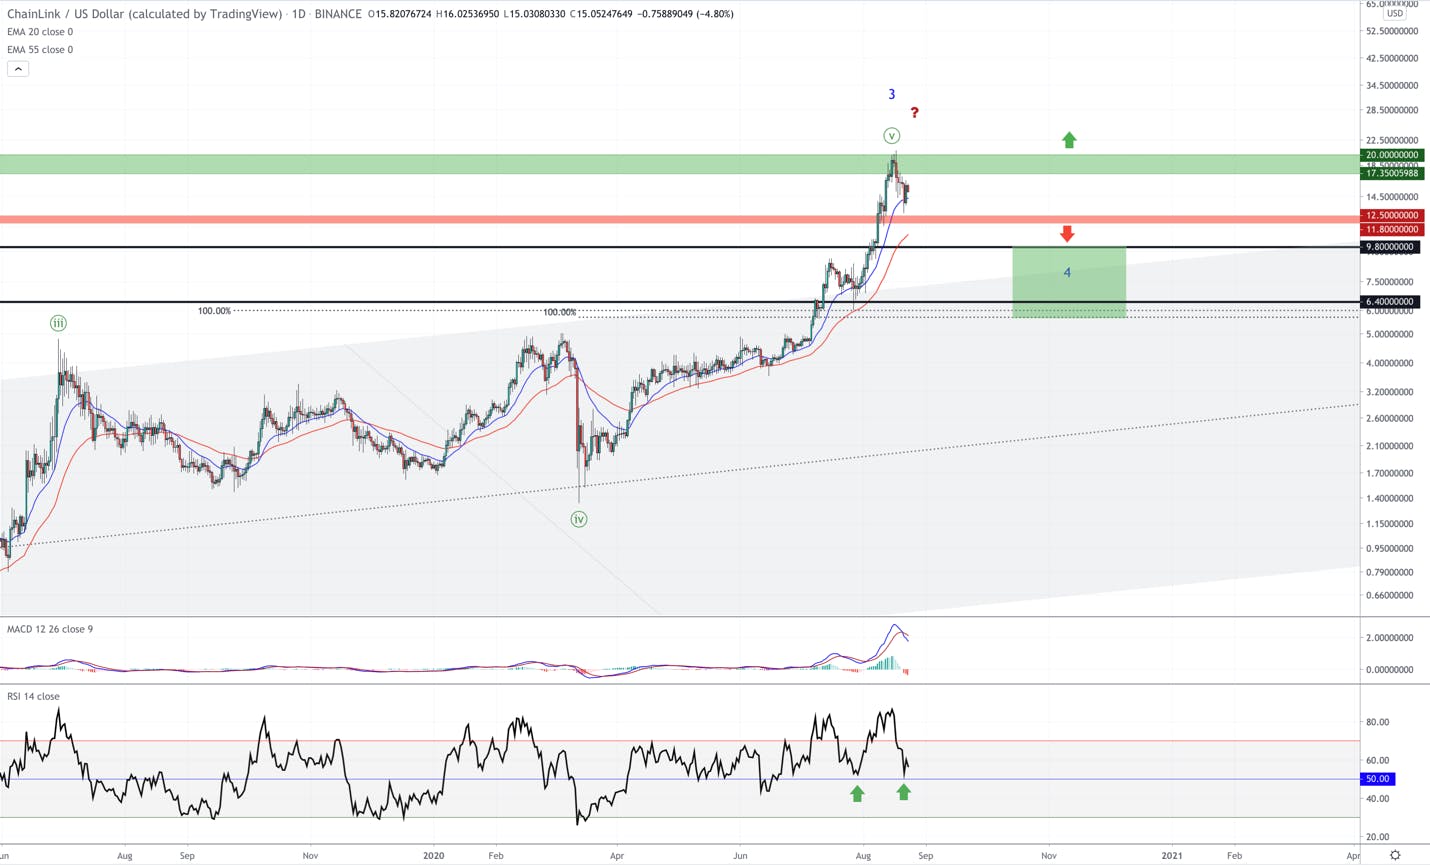
Technically, Chainlink’s price structure is quite complex. It is trending up; however, with numerous drawdowns, the overlapping structure appears to be in a large degree leading diagonal pattern. The below chart outlines the count that LINK appears to be following.
The only question to answer is the end of the 3rd wave. We typically see the MACD hit peak levels on the 3rd wave. The fact that it has rolled over hard supports that the 3rd wave may be over and we are in the early stages of a deeper pullback.
However, Link is finding support on the 20-day EMA in blue and holding (look at the chart below). If Link can hold, then break above $20, it supports that the 3rd wave can extend further, which we will want to be part of.
So, we have created a basic plan of action, outlined below.
If LINK cannot hold the 20-day EMA in blue, the final level the 3rd wave must hold is the $12.50-$11.80 support. If these levels hold, and we then break above $20, the 3rd wave has more room to run.
However, if the $12.50-$11.80 region breaks, we are in the 4th wave correction and should expect a deeper pullback. The first area of support in this scenario is the $9.80
For those that may think a drawdown of this magnitude is extreme, I encourage you to look at LINK’s relatively short history. In less than three years, there have been 21 drawdowns greater than 30%. Of those 21, eight are greater than 45%, five have been greater than 70%, and one was an 89% drawdown.
Chainlink is a volatile asset. Furthermore, it’s contribution to the blockchain microtrend is necessary, but still early. We consider this a long-term hold and expect a choppy ride. We do not believe that anyone has missed the uptrend, and that there will be many opportunities for entry. We will continue to add to this position when we see the setups forming.
This article was originally published on Forbes on Aug 13, 2020,11:01pm EDTForbes on Aug 13, 2020,11:01pm EDT
Shelter-in-place has led to a surge for many stocks across e-commerce, online streaming, video conferencing and gaming as these subsectors are seen as the primary beneficiaries of covid-19. In many cases, this boost in usage is temporary as it requires people to spend an unnatural amount of time indoors, not to mention the effects of covid are fully priced-in to most of these stocks.
The market can be myopic due to the sheer number of swing traders and machines driving the market. Therefore, strong consideration should be given to the long-term effects of covid even if the gains are not immediate or overnight. One trend I am monitoring closely for the more permanent effects is the disruption of telecom hardware systems through cloud-native communications.
Cloud-native voice customers will be permanent and won’t revert back post-covid because it’s cheaper, can be scaled depending on immediate needs, and can also be built into collaboration platforms for increased productivity or used as a stand-alone. Session Initiation Protocol (SIP) enables reliable voice over a Tier-1 Network with a phone line as cheap at $0.35 compared to the typical phone bill that ranges between $20 to $30 per phone line.
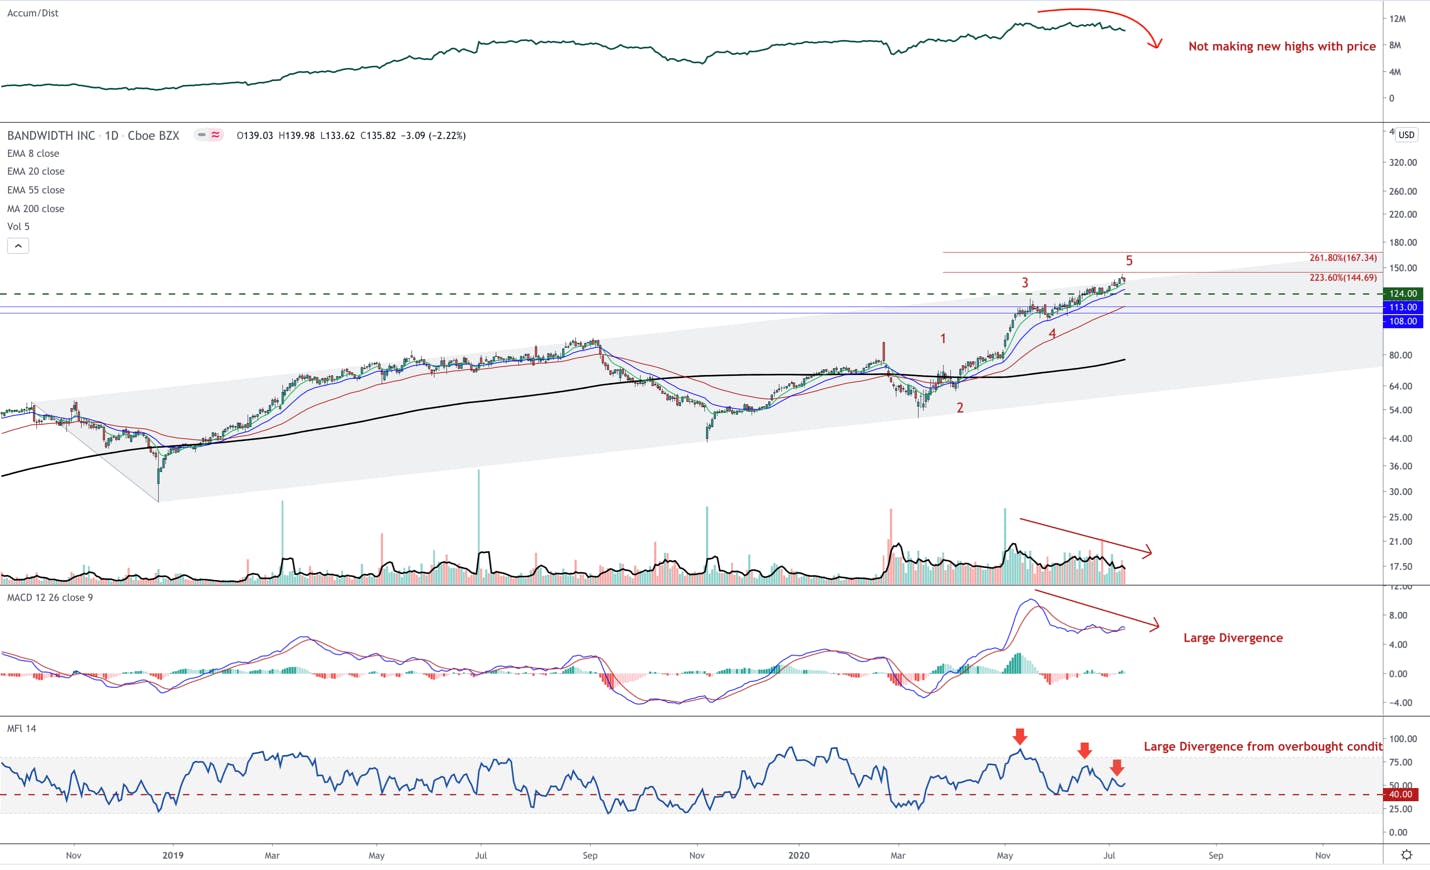
Although there are many tech giants with products in the cloud-native communications space, such as Microsoft, Google and up-and-comer Zoom, the Tier 1 Network powering many of these voice features is offered by a little-known company called Bandwidth.
Hardware-as-a-Service Powered by Tier 1 Network
Where dedicated, daily user behavior within enterprises around VoIP and cloud native conferencing apps may have been many years out, covid-19 has sped up this more permanent trend. We were looking at growth of about $1.7 billion in 2017 to $6.7 billion in 2022 for this market. According to IDC, the global market will reach $17.2 billion by 2023.
Corporations have been announcing permanent work-from-home policies with many discussions on earnings calls about the improvement in margins that is caused by not providing physical space. With many empty office buildings across metropolises, the common concern is what will happen to real estate prices and commercial rent. However, inside the buildings are miles of telecom wires that lay dormant at $20 to $30 per line per month.
This need to re-envision the post-covid office extends beyond enterprises to also include SMBs, who will want to cut costs as stay-orders are extended, such as retail outlets, attorneys, dentists and insurance agents, to name a few.
The company Bandwidth delivers SIP that enables voice-over-internet-protocol (VoIP) by defining the messages sent between endpoints and managing the actual elements of a call. SIP supports voice calls, video conferencing, instant messaging and media distribution. Bandwidth works with the very largest VoIP and video/audio conferencing companies with some important catalysts: (1) work-from-home migrating budgets (i.e. the customers), (2) large investments and innovation from Bandwidth’s customers including Zoom and Microsoft (i.e. the providers), and (3) the potential for global expansion. Phone lines offered by Bandwidth are as low as $0.35.
Major customers for Bandwidth include Zoom, Google, Cisco, Microsoft, Skype, RingCentral and Square. In this case, we do not need to predict or speculate who will take market share from the telecom hardware systems as all of the bigger players use Bandwidth (we do need to have conviction that cloud-native will replace telecom hardware).
Bandwidth offers a Voice over Internet Protocol (VoIP) network of 70 million phone numbers. The category of Communications Platform as-a-service (CPaaS) is cloud-based middleware that facilitates cloud-based hosting and management of application programming interfaces (APIs). This helps simplify the programming process for real-time communication by embedding voice and messaging APIs into enterprise applications.
While Twilio’s strength comes from native mobile applications with a loyal following of mobile application developers, Bandwidth’s strength and customer base comes from cloud-native companies.
The difference between these companies is important to review. Twilio enables communications for mobile applications, such as voice or text. When you text or make a call inside of a mobile application, you are likely using Twilio’s APIs. The company works with over 1,000 mobile carriers in over 150 countries for voice and text/SMS services. The features that come pre-packaged with Twilio are ideal for companies who want to cut down on development time, such as startups or pureplay apps. Examples include customer service calls on Zendesk and messaging home owners inside the AirBnB app.
However, large companies in the video and phone conferencing space (including business apps), with a primary focus on communications, are unlikely to incorporate an expensive third-party for out-of-the box development. As a network carrier, Bandwidth undercuts Twilio on pricing with cheaper outgoing and incoming calls plus free incoming SMS. This option is entirely focused on voice and SMS while its customers develop any additional features in-house. Twilio costs $1 for a dedicated number while Bandwidth costs $0.35 per dedicated number. This is why Bandwidth is the network provider for Google, Microsoft enterprise apps and Skype, and also Zoom.
Bandwidth’s product differentiation comes from the national IP network platform, which in turn, delivers reliability for audio calls. Bandwidth makes a fraction of a penny for every call or message that is sent over the Tier 1 network. Therefore, Bandwidth’s revenue is not up to par with Twilio’s at about $300 million on an annual run rate compared to $1.5 billion. Another contributing factor is that the mobile app economy has been fully built-out while cloud communications is very nascent. Therefore, as the trend grows, this should help deliver acceleration across Bandwidth’s financials.
Bandwidth owns the network and can serve enterprises who are seeking price efficiency. As stated in the IDC MarketScape analysis: Worldwide Cloud Communications PaaS analysis, this allows a high-level of reliability and quality. The companies who choose Bandwidth over Twilio are looking for “mission-critical” communications.
According to Gartner, Bandwidth’s direct competitor is actually AT&T when it comes to being a network provider with APIs, such as 911 access. Bandwidth recently announced Duet for Microsoft Teams, which provides direct routing with 911 capabilities as emergency calling is something CIOs must provide for in the event an employee needs to contact first responders. Bandwidth is one of two providers with E911.
More on Bandwidth (stock ticker: BAND):
This quarter highlighted Bandwidth’s ability to service the increasing communications needs of enterprises. The company accelerated revenue in Q2 to $76.8 million, up 35% year-over-year. This beat the consensus of 22% year-over-year growth, or $69.4 million. This is the best growth rate the company has ever recorded, up from 29% in Q1.
Dollar-based net retention rate improved from 113% to 133%. Forward guidance for Q3 came in above Street estimates and the company raised its full year outlook to 28% year-over-year at the midpoint.
The company highlighted broad-based growth across existing enterprise customers as they continue to elevate usage in their cloud-based communications services. Demand for messaging services was especially strong at 108% in Q2. The outperformance was due to higher A2P messaging surcharges, which are application-to-person messages that come from chatbots, appointment reminders or marketing messages.
Sign up for I/O Fund's free newsletter with gains of up to 403% – Click hereSign up for I/O Fund's free newsletter with gains of up to 403% – Click hereClick here
Management estimates the net impact of covid to be about 6% of revenue in Q2: “While it is becoming increasingly difficult to differentiate COVID-19-related usage from organic usage growth, we estimate that COVID-19 revenue impact in the second quarter to be in the range of $4.5 to $5 million.”
Despite management guiding for lower contribution from covid in the second half of the year, they raised the FY outlook 5.5% above the number they gave after Q1. With that said, momentum is on Bandwidth’s side after the company announced record total revenue growth (+35%), record CPaaS revenue growth (+40%), and a record dollar-based net retention rate (133%).
There are a number of growth drivers in place for Bandwidth to see sustainable 25%+ growth over the next year:
1. Existing enterprise customers continuing to scale usage:
Bandwidth prices its services per API connection (i.e. per minute on calls or per message) so they will continue to grow with any permanent migrations.
Last month, Zoom announced two hardware-as-a-service options including hardware for “Zoom Phone” and “Zoom Rooms” and has announced ServiceNow will be using Zoom as hardware-as-a-service to displace its current phone system and legacy hardware. In the July announcement, ServiceNow stated, “Going forward, with the addition of Zoom Phone, we're getting a head start on an even more robust experience with Zoom— one-touch communication and collaboration features, plus Zoom-connected conference rooms.”
The two HaaS options Zoom launched allow companies working remotely (or in the office) to consolidate Zoom software and hardware for one consistent experience. Bandwidth is downstream from these products as they will increase the number of minutes and messages on its Tier 1 network.
Microsoft Teams competes with Zoom on both audio and video while using Bandwidth for audio. Aternity’s Productivity Tracker released a study in Mid-June showing that Microsoft Teams usage grew by 894% as of June 14th, compared with its base usage during the week of February 17th.
As more enterprises and businesses seriously consider replacing legacy phone systems, I believe they will go with the direct routing and E911 option in Microsoft Teams for reliability and safety concerns as the price is very competitive. Microsoft Teams competes with Zoom on both audio and video while offering Bandwidth for direct routing and E911. Aternity’s Productivity Tracker released a study in Mid-June showing that Microsoft Teams usage grew by 894% as of June 14th, compared with its base usage during the week of February 17th.
2. Enterprises increasingly migrating to the cloud from on-premise legacy solutions:
Only 7 percent of Americans worked from home prior to covid-19. This number is likely to be much higher even after shelter-in-place is over. According to Sarah Walas, VP of Investor Relations at Bandwidth, calls over the voice network spiked 30 percent overall in March, with meeting-solutions clients like Zoom increasing usage by as much as 66 percent.
Bandwidth management announced a significant customer win in Q2 – a five-year multimillion-dollar agreement with a Fortune 100 company that is one of the nation’s 10 largest banks. The announcement between ServiceNow and Zoom Phone also point towards long-term or permanent hardware replacement.
Overall, the company ended Q2 with 1,900 active CPaaS customers (+30% YoY). Bandwidth is in an ideal position to continue to win large new customers looking for a migration partner with an attractive pricing model. We may see more growth here as the year goes on. Twilio released a survey in July that showed enterprise decision makers stating they believe their digital communications strategy has been accelerated by an average of 6 years.
Analyst Estimates May Be Too Low
Wall Street consensus estimates are calling for FY21 revenue growth of 14.6% YoY. Just as Bandwidth blew past Street estimates in Q2 by 11%, estimates for 2021 remain very beatable. Bandwidth is ideally positioned to be a sustained beneficiary of the digital transformation, even as the covid tailwind dissipates.
As mentioned, management estimated that covid had a 6% impact on Q2 revenue, meaning they recorded a 26.4% purely organic growth rate, a number that would have still beat consensus estimates comfortably. Management also guided for less expected contribution from covid in the second half of 2020 and is still expecting 28% growth YoY.
The following year (2021) will present tougher comps, but with the trends driving Bandwidth’s growth firmly in place for the future, I think they can beat these low projections.
Conclusion:
As office buildings remain empty, traditional phone bills will be challenged by cloud-native phone systems. Not only is there a shift away from physical offices placing pressure on telecom hardware but companies are wanting to improve margins by cutting costs. Many trends are temporary or covid-dependent while telecommunications equipment could be permanently eradicated.
Twilio has benefited from the mobile app ecosystem. However, with the mega-trend driven by Zoom, Slack and Microsoft Teams, we may be transitioning towards a boom in unified communications and cloud productivity tools. If this is the case, Bandwidth could become a solid stock as their customer roster is full of large competitors in need of an independent Tier 1 network.
In this report we take a look at AMD, MRVL, LRCX, QCOM, NVDA
Please note the glossary of terms and techniques here and herehere and here
You can access our portfolio here. You can also track in real time our buys/sells/position updates in the forum. If you want to track us in real time, we recommend that you set up alerts to these 3 chat rooms, which can be done by clicking the link in the top corner of each chat room called, “subscribe for new topics.” here. You can also track in real time our buys/sells/position updates in the forum. If you want to track us in real time, we recommend that you set up alerts to these 3 chat rooms, which can be done by clicking the link in the top corner of each chat room called, “subscribe for new topics.”
In 2019, cloud was the best performing sector before it began to show weakness in July. Cloud stocks led the market out of the December 2018 selloff, providing sizable outperformance for just over seven months in the first part of the year. Then, with no exogenous catalyst, a rotation began out of cloud/SaaS names and into underperforming value names.
This rotation saw the average cloud stock drop around 35-40%. Mega cap names in this space that were not pure plays, like Microsoft and Salesforce, stayed flat during this rotation. However, pure plays, such as Zoom and Twilio, saw drawdowns greater than 40%, while other names, like Crowdstrike and Zscaler, saw drawdowns greater than 50%. The value rotation, as it was called in 2019, took about three months to bottom. During this three month span, the S&P 500 gained about 2%.
Last week, on August 5th, the market began a new rotation out of cloud stocks and into value oriented sectors. Since the rotation began, the average cloud stock is down approximately 8-10%, while financials are up 3.5%, industrials are up 5.8% and transports are up 6.5%. Just like in 2019, this rotation is hardly noticeable in the broad market, with the NASDAQ100 being up 0.3% and the S&P 500 being up 1.4% over the same period.
No one knows how this year’s rotation will play out – whether it will bottom this Monday or be as deep as the rotation in 2019. Regardless, the cloud microtrend still has a few years to play out, so, if this rotation continues to deeper levels, we view it as a buying opportunity regardless of the prevailing sentiment at the time.
However, instead of focusing on the popular stocks that are taking a breather, I’d like to focus on a theme we began working towards prior to this rotation: semiconductors.
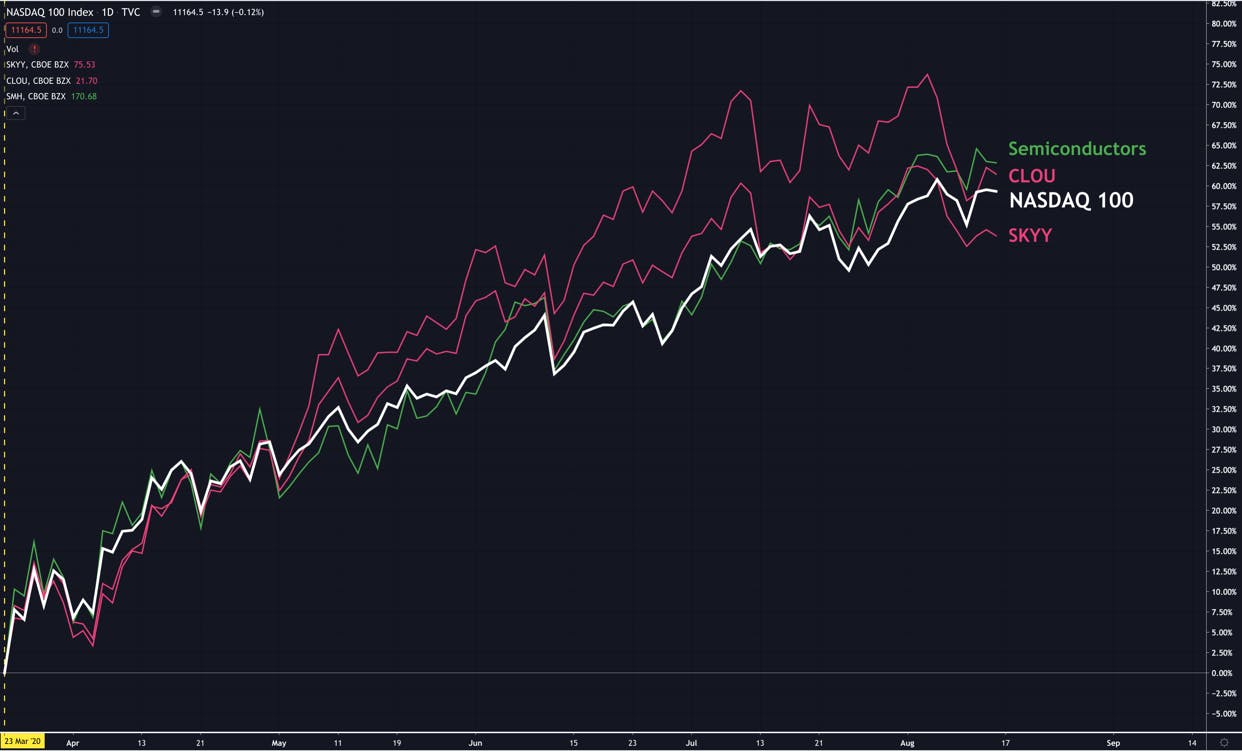
The two cloud ETFs, SKYY and CLOU, are a reasonable gauge for the cloud sub-sector. The ETF, SKYY, has an overweight to mega cap names like Amazon, Microsoft and Alibaba, while CLOU is focused on the small to medium sized pure plays, like Twilio, Zoom and Zscaler. Since the market bottomed on March 23 and began a new uptrend this year, the top performing sub-sector within tech is semiconductors.
Furthermore, if we look at our active portfolio, we can see being diversified by including semiconductors, as well as chainlink and bitcoin, has put us in a relatively stronger position than if we were solely focused on the momentum cloud names.
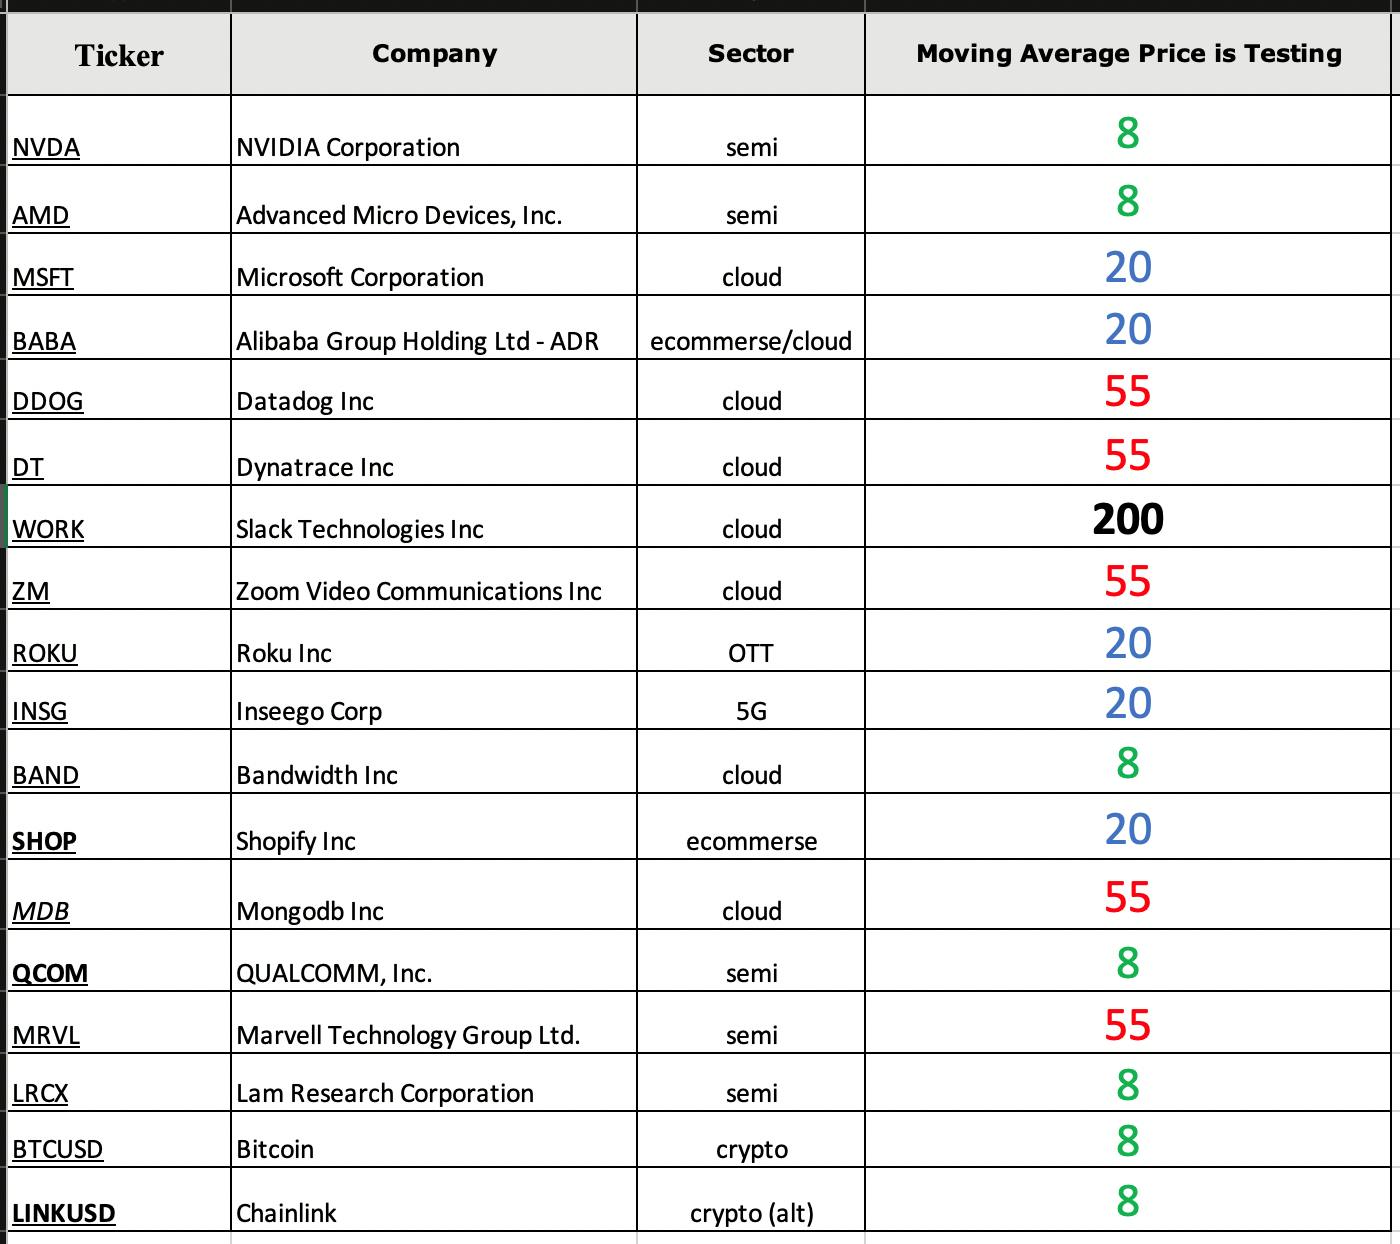
The above graph is our active portfolio, broken down into sub-sectors of tech. Most importantly, we show the current moving average that each position is testing. We currently have seven positions above their 8-day moving average in green – 1 in cloud, 2 cryptos, and 4 semis.
Furthermore, you’ll notice that we have five positions testing their 55-day moving average in red are all cloud names, with one semi. The vast majority of cloud names are testing their 55-day moving average right now. This is evident by the two cloud ETFs, SKYY and CLOU, which are both below their 20-day moving averages and testing the upper bounds of their 55-day moving averages.
In this report, we will focus on the sector that is not only holding up, but showing unnoticed strength behind the noise in the market. Semiconductors will likely never be as buzzworthy because you can’t directly use the products, like you can with Zoom, Netflix, and Shopify. They are also much more complicated to understand, which is why so few analysts cover them relative to other areas of tech.
However, as Beth has laid out over the last two years, semis will likely be the primary beneficiary of the upcoming microtrends in 5G and AI. For this reason, we have been positioning for this transition when very few were talking about it because of the cloud frenzy between April-June.
Immediate Setups
Advanced Micro Device (AMD)
SummarySummary
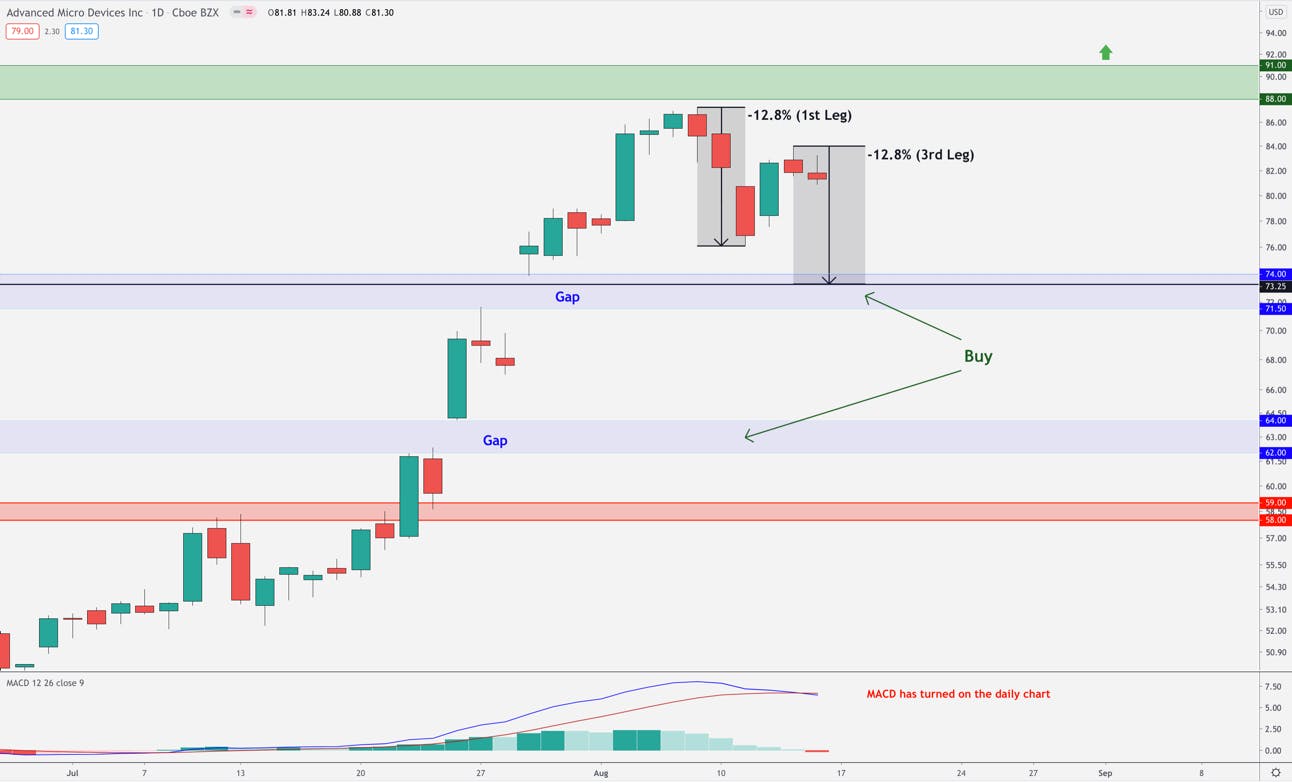
If price falls into the $73-$70 range, we will look to buy.
If price breaks out above the $88-$91 price range, we will also buy with tight stops.
So far, we guided three entries around AMD – two below the breakout zone at $48 and $55, and one on the retest of the breakout zone around $61. I believe the stock is setting up to provide another entry, which we will look to take today.
The Long-Term Trend (Weekly Chart)The Long-Term Trend (Weekly Chart)
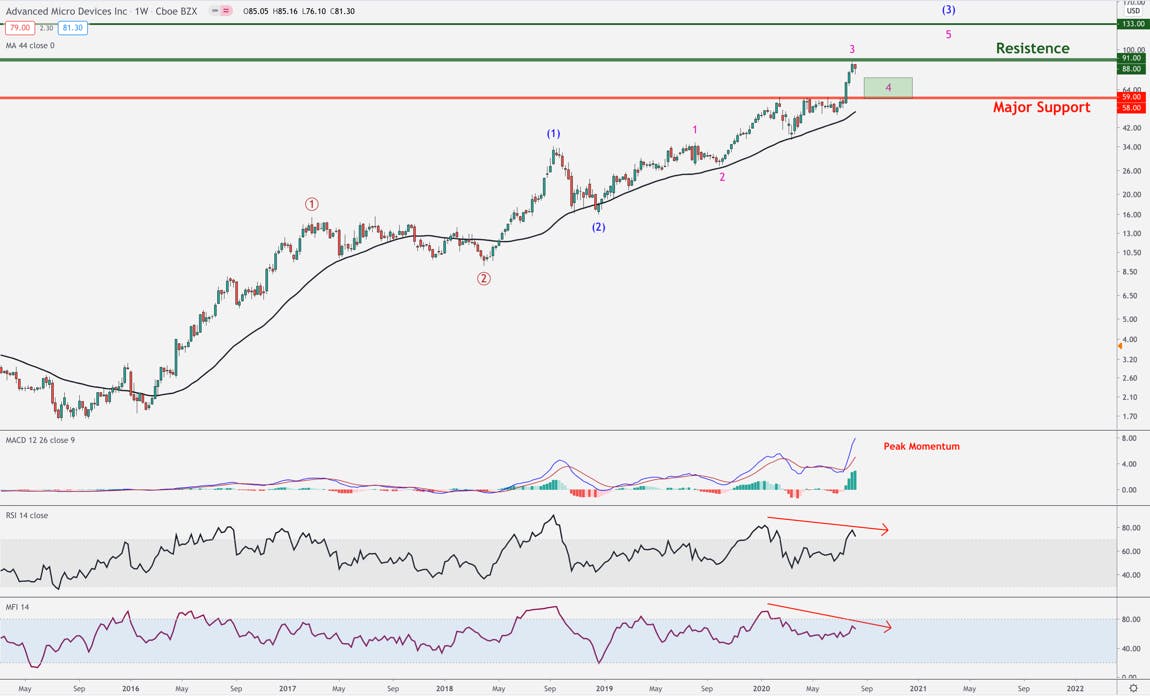
Since bottoming in 2015, AMD has been in a strong uptrend, returning over 5000% from its low at $1.61. Even after such impressive gains, according to Beth’s fundamental theses (here and here), the future growth in AMD is something we want to continue participate in.
By analyzing the structure of uptrend in the weekly chart above, we can get an idea of the long-term trend in play from a technical perspective. For one, the trend appears to be healthy and is confirming Beth’s fundamental theses. Over a long-term timeframe, both the fundamentals and technicals are suggesting higher prices, which is always encouraging. However, over the short to intermediate term time frame, the technicals are seeing some apparent risk in AMD at current prices.
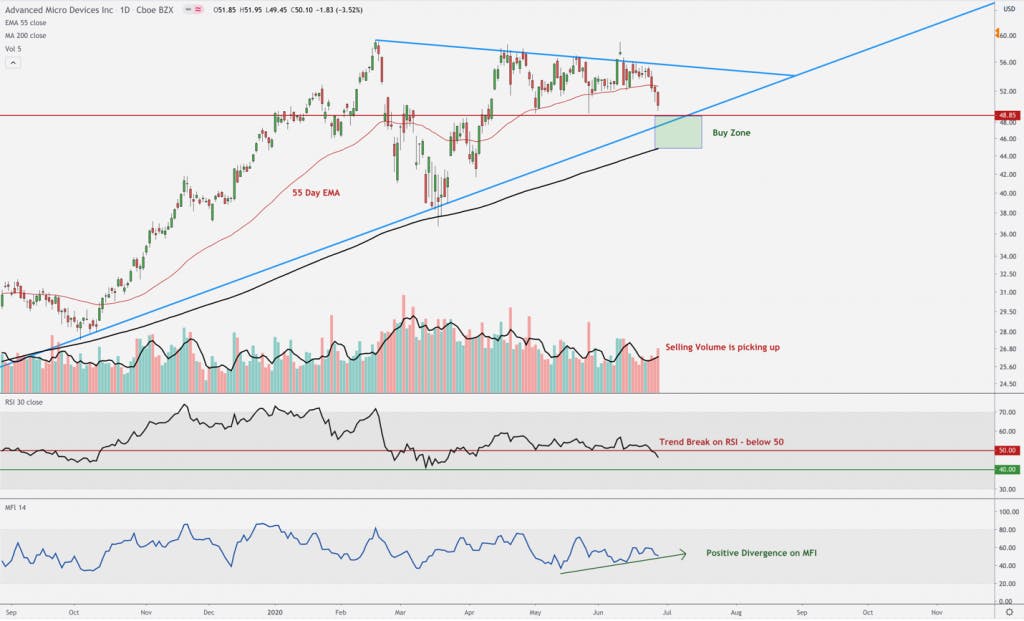
This is evident not only by the price failing to breakout of the $88-$91 price range, which is where an important cluster of prices is acting as resistance, but also by the internal momentum indicators. The MACD is at peak levels on the weekly chart, which usually accompanies a 3rd wave top, and on the daily chart that is discussed below, the MACD has already turned down. Also, notice the negative divergence on the MFI and RSI. This may take weeks to play out, but as long as this divergence is forming, there is risk of a correction.
The Setup (Daily Chart)The Setup (Daily Chart)
By looking at AMD on a shorter time frame, there appears to be 2 potential buying zones, if the price continues to show weakness.
The above chart is a close-up of the recent daily moves in AMD. Note the strength of the uptrend after breaking out of the $58-$59 resistance region – the price went nearly parabolic, with two large gaps in the chart.
After such a move, it is not uncommon for the stock to correct before the next leg higher. With the divergences in the weekly chart, which we just pointed out, coupled with the MACD rolling over in the daily chart above, it appears that AMD is setting up for one more leg lower.
If this is the case, there are two forces at play that should create strong support between the $73-$70 region:
Gaps – Gaps are powerful forces in technical analysis. Once a gap is made, it is likely that it will be filled in the future. In short, these are areas of intense buying/selling. I’ve outlined the two gaps in blue with the prices on the right.
Symmetry – Corrections typically unfold in three legs. The length of the 3rd and final leg is usually the length of the first leg down. The first leg down for AMD fell – 12.8%. If we track – 12.8% from the top of the most recent top, or the beginning of a potential 3rd leg down, it falls right in the middle of the first gap at $73.25.
We want to be fully allocated to AMD sooner rather than later. Therefore, if AMD falls between $73-$70, I will add. If AMD falls to the lower gap at $64-$62, I will also look to add. Also, if price pushes higher, never touching the $73 target, and instead breaks out above the $90-$91 region, I will look to add.
Marvell (MRVL)
Summary
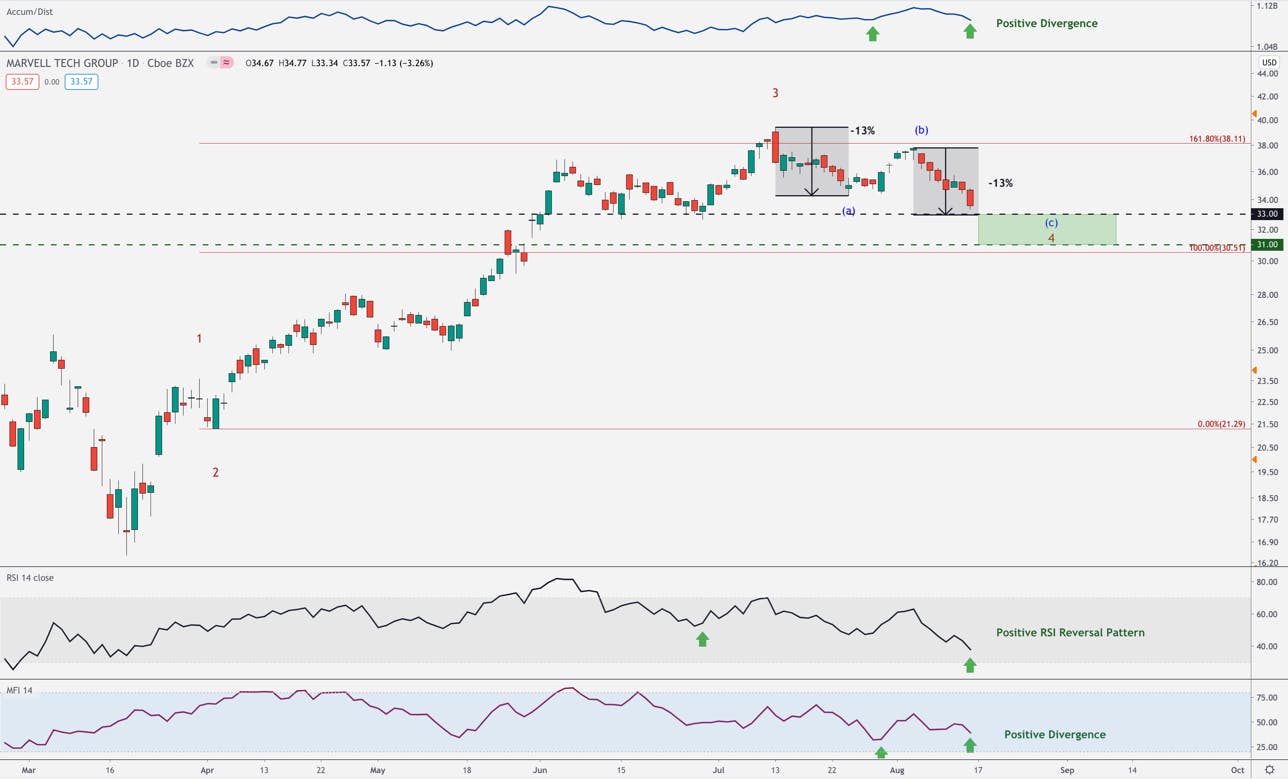
If price falls at or below the $33 in the current correction, we will look to buy.
If the correction is over and price instead breaks out above $38 on elevated volume, we will look to buy.
Since bottoming in March, Marvell has been in, what appears to be, the middle of a standard 5-wave uptrend to all new highs. One of the key tells is that the 3rd wave in this pattern has topped exactly at the price extension we most commonly see 3rd waves top. For MRVL, this level is the $38 resistance.
Since Marvell topped at this region, it has been in a standard 3-wave correction, as shown by the blue letters. Like with AMD, we can use symmetry to help gauge a buying zone. For the first leg down in MRVL, price dropped -13% from the all time high. After the bounce, price then began another decline, stopping just short of another -13% drop and just above the $33.
Also, note the internal signals, as well. We are seeig positive divergence on the A/D line as well as the MFI. Also, we have a positive RSI reversal pattern, where the RSI makes a lower low and price makes a higher high. This is a rare signal that suggests the uptrend will likely continue.
With so many buying signals in the internals, there is a good chance that the correction for MRVL is either over, or will catch a nice bounce. If Marvell trades into the $33 region (or close to it), I will add to our positon. Also, if price continues higher from here, we will look into adding on the breakout above $38. Either way, we are looking to add to our position in Marvell.
Lam Research (LRCX)
SummarySummary
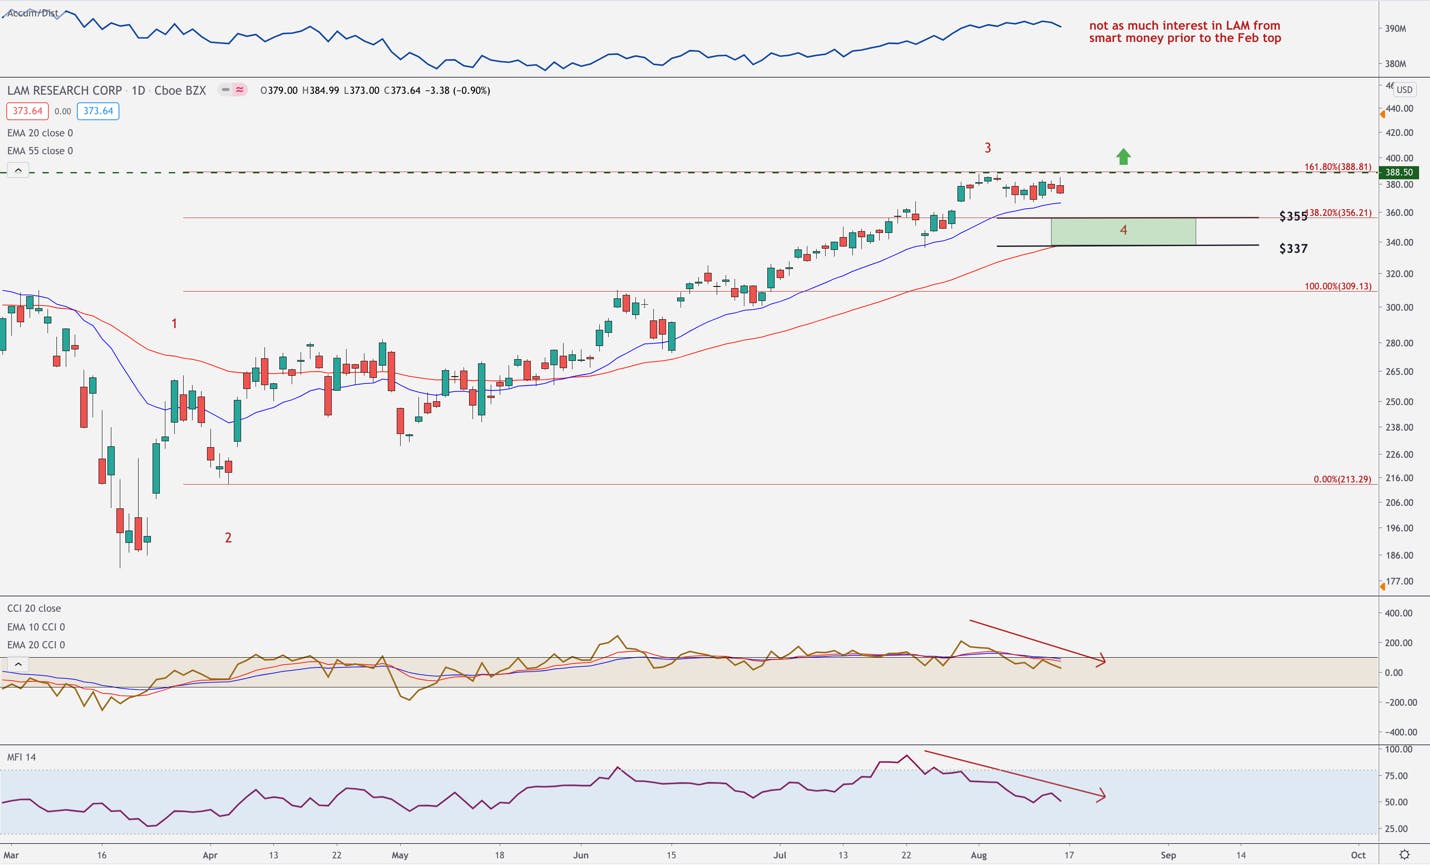
If the price continues to correct into the $355-$337 price range, we will look to buy.$355-$337 price range, we will look to buy.
We will not buy if price breaks out above the $388.50 resistance.
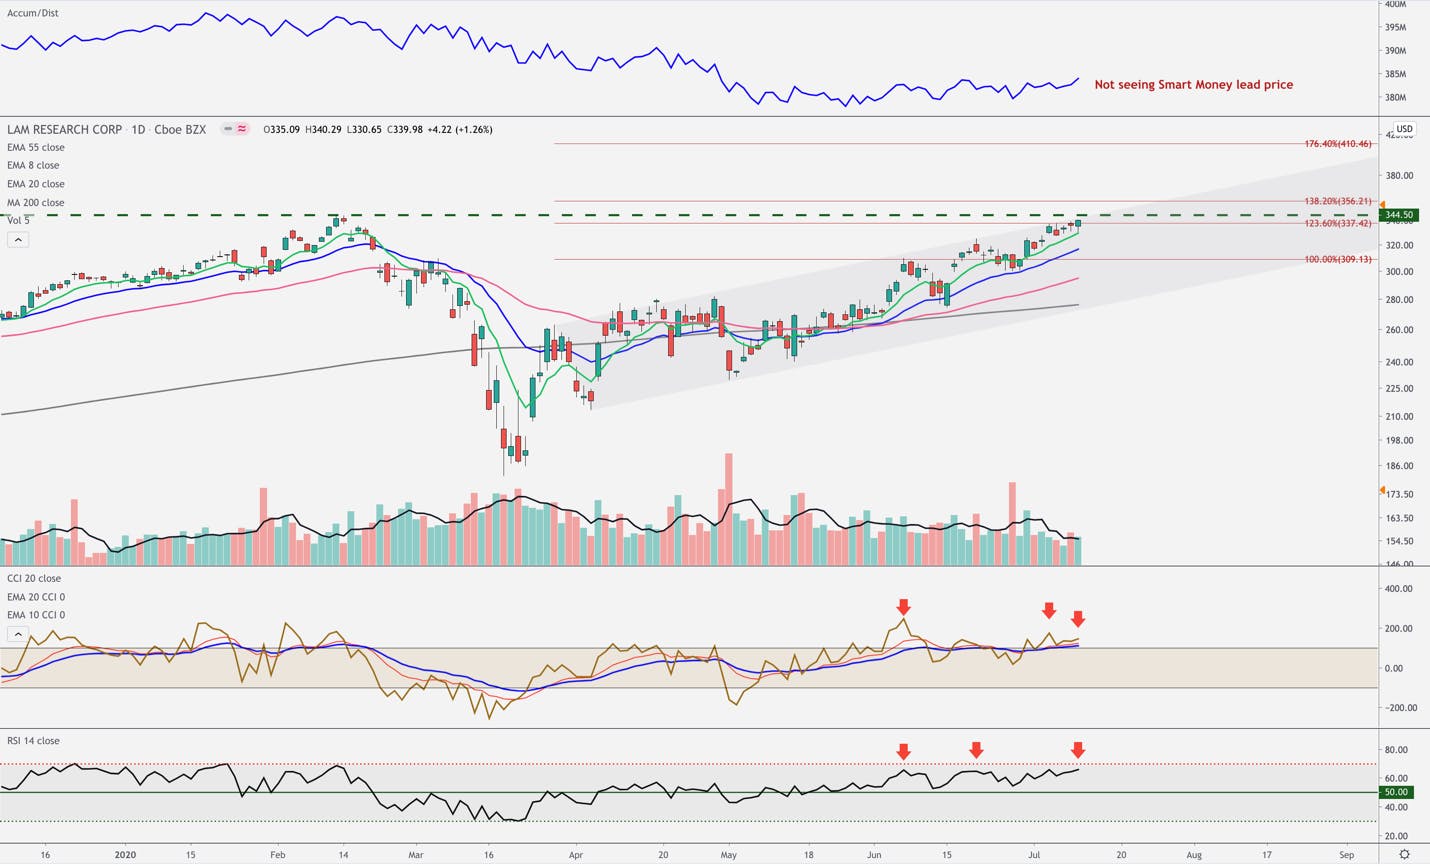
Like Marvell, Lam Research has provided what appears to be a standard 5-wave uptrend off the March lows, as outlined by the red count on the chart above. Also, like MRVL, Lam Research recently stalled at the exact extension where 3rd waves typically end, which for LRCX is the $388.50 resistence.
Also, with the CCI and MFI showing strong signs of negative divergence, it is likely that LRCX further corrects before completing the 5-wave pattern to new highs. The most likely regions of support for a 4th wave, which also coincides with the 55-day EMA in red and a number of important price clusters, is between the $355 and $337 region. This will be the region I will look to add to our position
Adversely, if LAM does find the momentum to break to new highs above $388.50, then its 3rd wave can extend further. We will likely wait for a pullback to add to this position if the breakout scenario does happen.
Waiting for a Setup
Qualcomm (QCOM)
Summary
There is no immediate buy setup I’m seeing at current prices.
The charts are suggesting the QCOM is likely to correct soon, which we will use to add to our position.
If you haven’t read Beth’s recent analysis on Qualcomm, you can do so here. We recently bought a new position for our long-term portfolio on the breakout above the $93-$100 resistance zone that has kept Qualcomm bottled up for two decades.
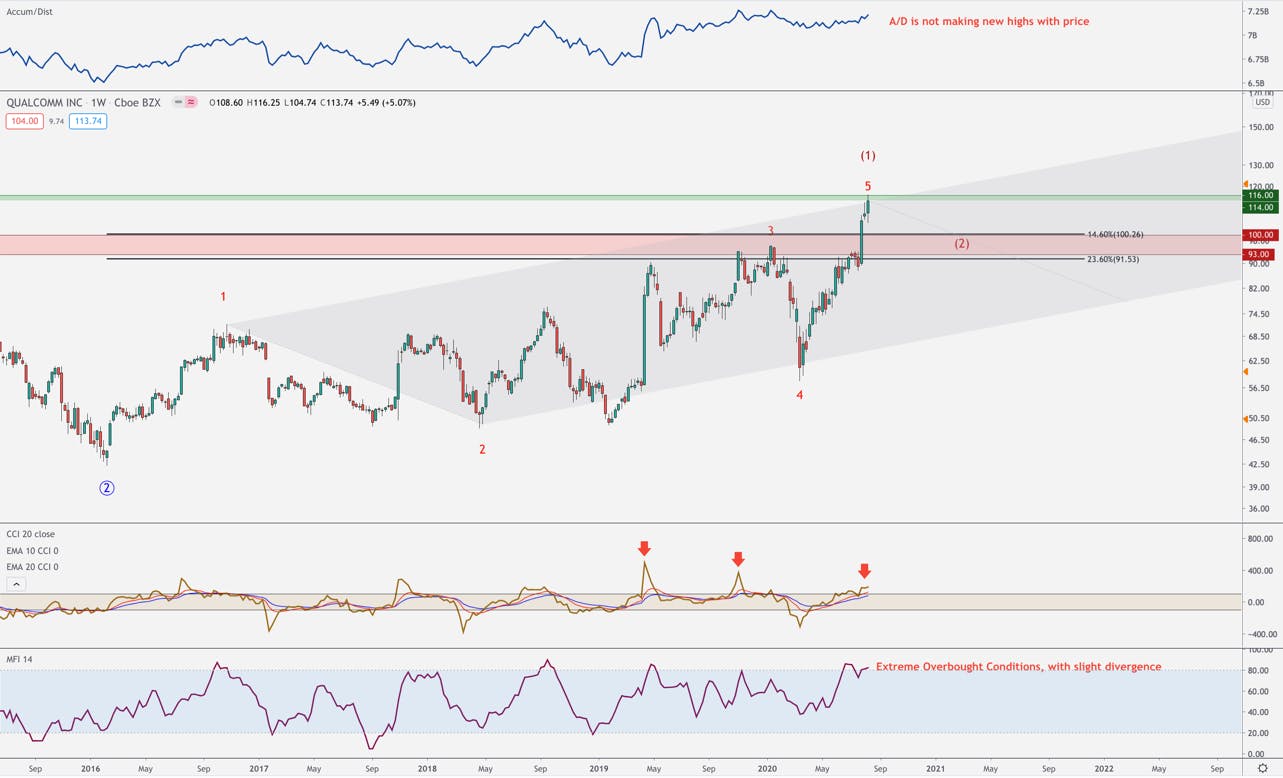
Like Microsoft, Qualcomm has over two decades of price data to analyze. With that comes multiple trends on very large timescales at play. With that in mind, we will focus on the trend that is governing the short to intermediate timeframe, which is outlined in the chart below.
The above uptrend started in early 2016, which is around the same time that AMD began the long-term trend that we point out above. If we compare the structure of Qualcomm’s trend to AMD, you should notice a stark difference. Note the very choppy/overlapping pattern in Qualcomm compared to AMD’s near parabolic trend that has very little overlap.
With QCOM, even though the pattern is choppy, it has technically been in an uptrend, making a series of higher highs and lower lows. The structure appears to be a large degree leading diagonal pattern, which is a series of 5 overlapping waves that usually tracks a trendline. When the 5th wave in the structure completes, we usually see a correction.
Keep in mind, this is over the short to intermediate time-frame. Regarding the long-term trend, once again, the fundamentals and technicals are lining up. Technically, this large degree leading diagonal is likely the first wave in a large 5-wave uptrend. That being said, the next correction will likely be a fantastic buying opportunity.
What makes me cautious on adding at current levels and instead waiting for a pullback is:
Qualcomm is stalling at the $114-$116 price region, which is an important zone to clear if QCOM will resume its uptrend.
The price has an established 5-waves where the 5th wave is at the upper boundary of the trend channel.
The MFI is at an extreme overbought condition, while showing slight negative divergence.
The CCI and Accumulation/Distribution line are also diverging from price, suggesting weakness.
If we do get a drawdown, the likely target for retrace will be a retest of the breakout zone between $93-$100. Coincidentally, this area lines up with two important retrace levels. If price does pullback to this region, we will add to QCOM in our long-term portfolio. However, if the current uptrend decides to breakout to new highs – above $114-$116, we will continue to buy into the strength with tight stops to protect us. But for now, we will remain patient for the next setup.
Nvidia (NVDA)
SummarySummary
With a long-term timeframe, we are not conservative with adding to our position in Nvidia, taking every buying setup that forms.
There is no clear buy setup right now in Nvidia.
Nvidia is showing considerable strength going into earnings this week, while at all-time highs, and trading above its 8-day EMA.
However, the weekly chart, which tracks the long-term trend, is suggesting Nvidia could see a pullback in the short to intermediate timeframe, which, if happens, we will use to add to our position.
Nvidia is one of our favorite stories over the next 5+ years. As long-term investors, we are taking every setup we see in Nvidia. However, eventually, Nvidia will have to take a breather, which we will use to add to our position.
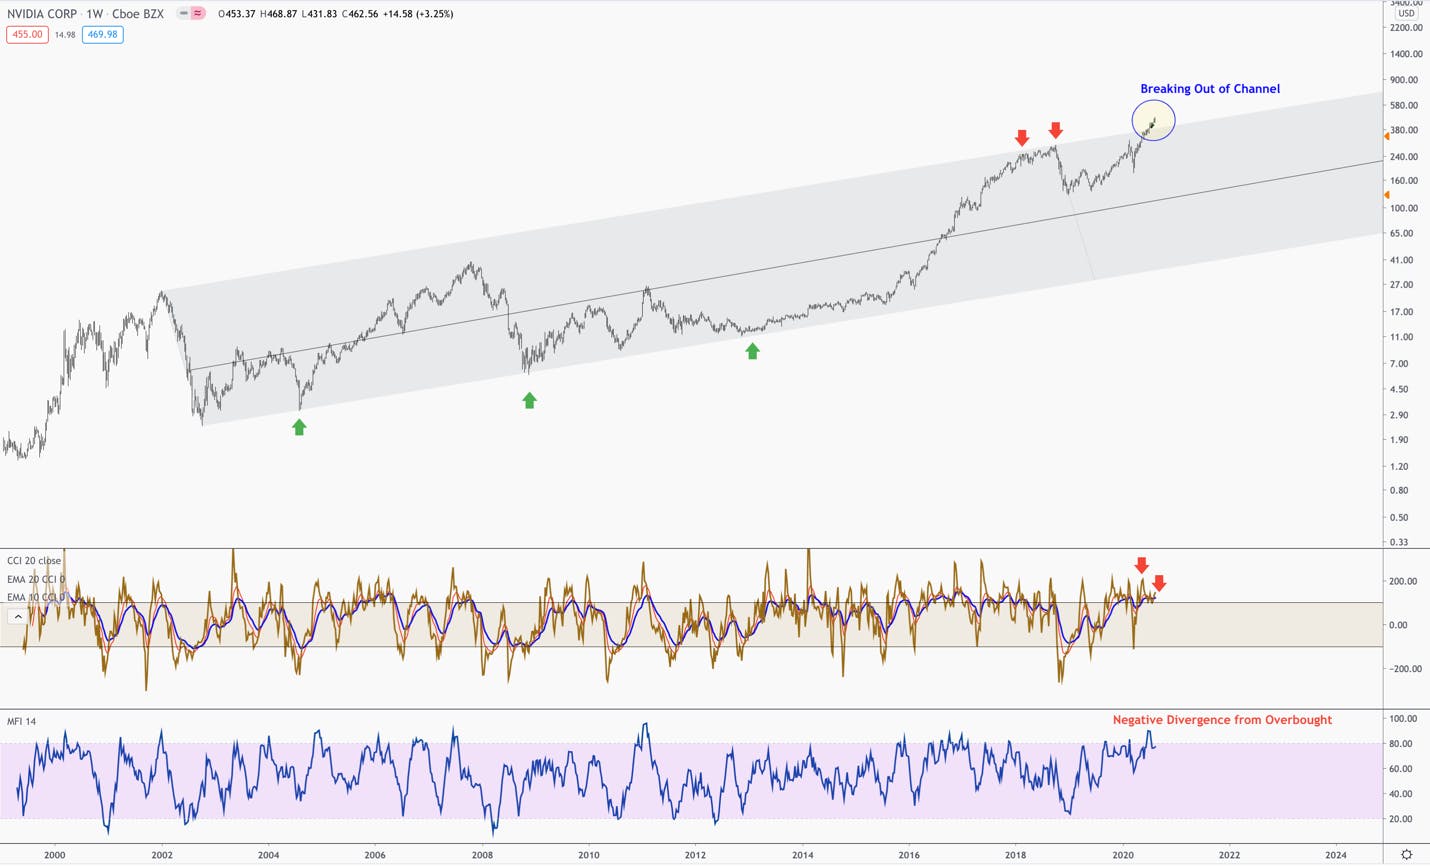
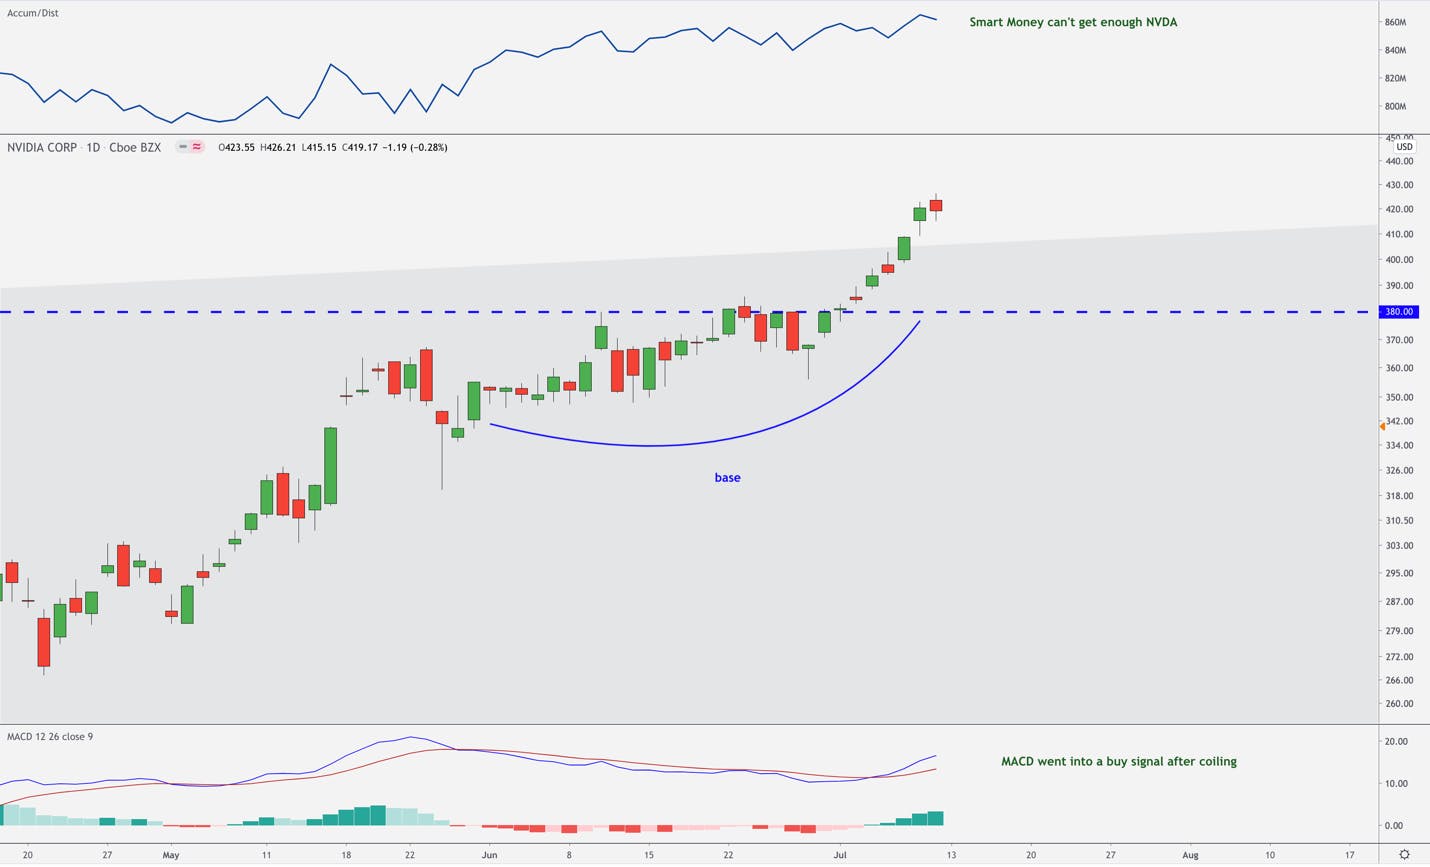
The above chart tracks the weekly moves in NVDA since it first started trading in 1999. Note the trend channel in gray. Rarely, do we see a stock successfully trading within, and respecting the boundaries of, a trend channel for so long. Notice the significant bottoms that occurred at the base of the channel, and also how price topped out when touching the top of the channel.
Today, Nvidia has successfully broken out of the upper boundaries of the channel, which is typically a very bullish sign. We added two new entries on this breakout for our long-term portfolio.
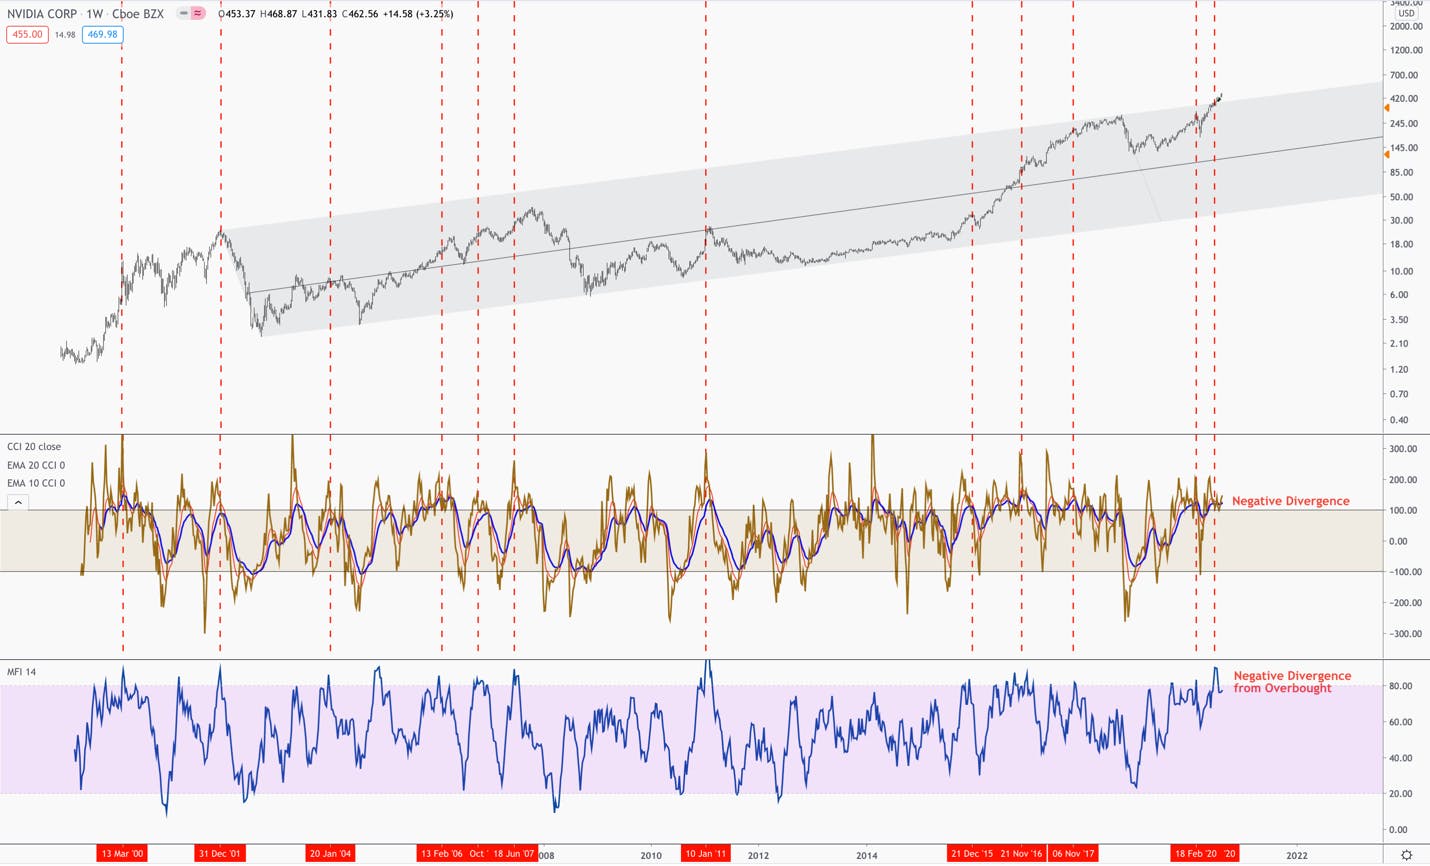
However, for anyone with a short to intermediate time frame, what gives me slight pause are the internal signals flashing. Note the negative divergence in the weekly CCI while the weekly MFI is at overbought conditions.
If you look back throughout the history of Nvidia’s price action, when you see these two patterns in unison on a weekly chart (marked by the horizontal red dotted lines), it always preceded a pullback of some degree. Some of these pullbacks were large and some were quite small, but it has been a solid indicator with Nvidia’s price action so far.
Keep in mind, the above chart is tracking the weekly moves in Nvidia. So, we could see higher levels from here before any pullback develops. We do not expect any weakness in Nvidia to be deep. Likely, we will get a retest of the upper trend channel. We will take any opportunity to add to this company.
Pullbacks are inevitable, and we will take any pullback from current prices as a gift with a long-term time frame in mind. In the meantime, we will keep tracking Nvidia for more break outs.
In this report we analyze: Teladoc, Twilio, Zoom, Roku, Dynatrace, Docusign, Inseego, Shopify, Microsoft, Slack
Please note the glossary of terms and techniques here and herehere and here
You can access our portfolio here. You can also track in real time our buys/sells/position updates in the forum. If you want to track us in real time, we recommend that you set up alerts to these 3 chat rooms, which can be done by clicking the link in the top corner of each chat room called, “subscribe for new topics.” here. You can also track in real time our buys/sells/position updates in the forum. If you want to track us in real time, we recommend that you set up alerts to these 3 chat rooms, which can be done by clicking the link in the top corner of each chat room called, “subscribe for new topics.”
In this week’s report, we look at the number of buys/sells we made in our active portfolio. There were more breakouts last week than usual, setting up for a potential next leg higher. We added to ZM, ROKU, DT and began positions in DOCU and SHOP based on this trend following strategy.
Taking trend following setups has treated us well over the last 4 months. In light of our emotions, talking heads and public fund managers, to the contrary, we’ve taken bullish setups as they’ve formed. Because of this, we’ve locked in a solid long-term cost basis in WORK, DT, DDOG, MRVL, AMD, ZM, to name a few. We’ve also been stopped out of some positions with reasonable gains and some minimal losses along the way.
However, when we start seeing leaders in an uptrend provide setups and then fail all at once, it tells me that we should be a little cautious moving forward. Trend following works, until it doesn’t for a period of time, and for this reason we use stops on recent positions so that we can step aside if sentiment shifts.
So far, all but Shopify have failed or are on the verge of failing. We explain how we will manage risk in these new positions, just in case we are on the verge of a deeper correction.
We also take a deeper dive into Roku, Teladoc, and Zoom, explain why we are looking to pick up more shares at lower levels.
We then explain why we sold out positions in Twilio and half our position in Inseego, as well as outline a potential plan to pick up shares at lower prices.
Finally, we outline two potential setups with Microsoft and Slack
Last Week’s Portfolio Activity
Breakout Buys
Roku (ROKU)
Summary
Roku broke out of a clear bull flag pattern on elevated volume.
Like all setups over the last several months, we bought into this rally.
It appears to be breaking down; however, based on our analysis of the price structure, we have decided to hold Roku without stops, and look to enter if price continues to slide.
Key Price Levels
A break above $169.15 will signal that the correction is over, and the uptrend will likely resume.
A break below the 20-day SMA, which is currently around $151.50, will be the first warning of a trend change.
A break below $142 will confirm this trend change.
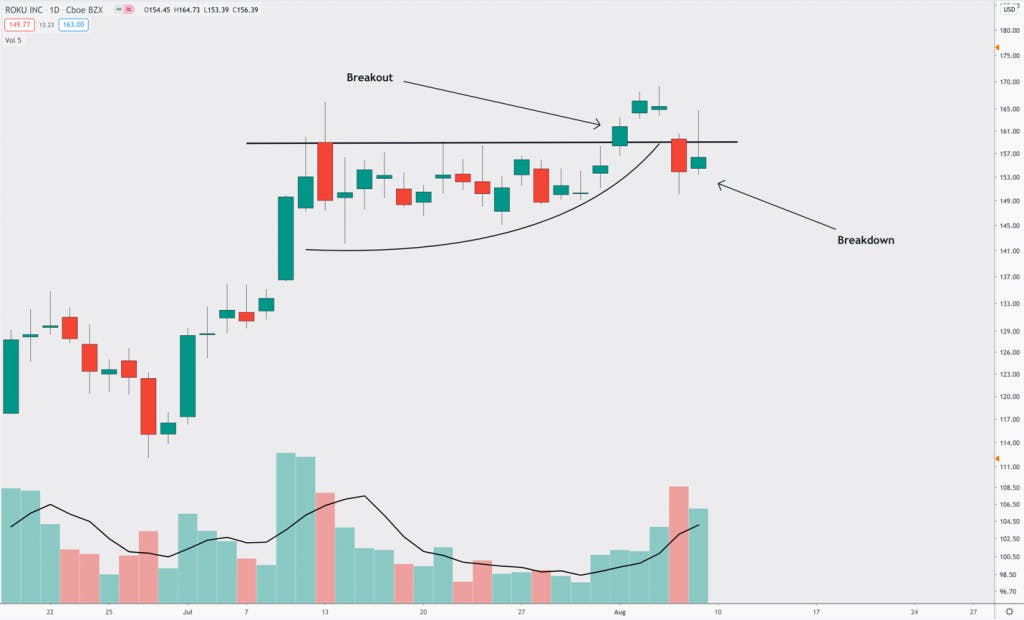
Last week, we had a beautiful setup in Roku. A base was forming on decreasing volume, with a clear breakout price above $158. On elevated volume, we bought shares into this breakout around $160.
After Roku reported their earnings, which were quite strong on revenue compared to other ad-tech companies, shares broke down below $158. Now, they are threatening to break below the base created around $142.
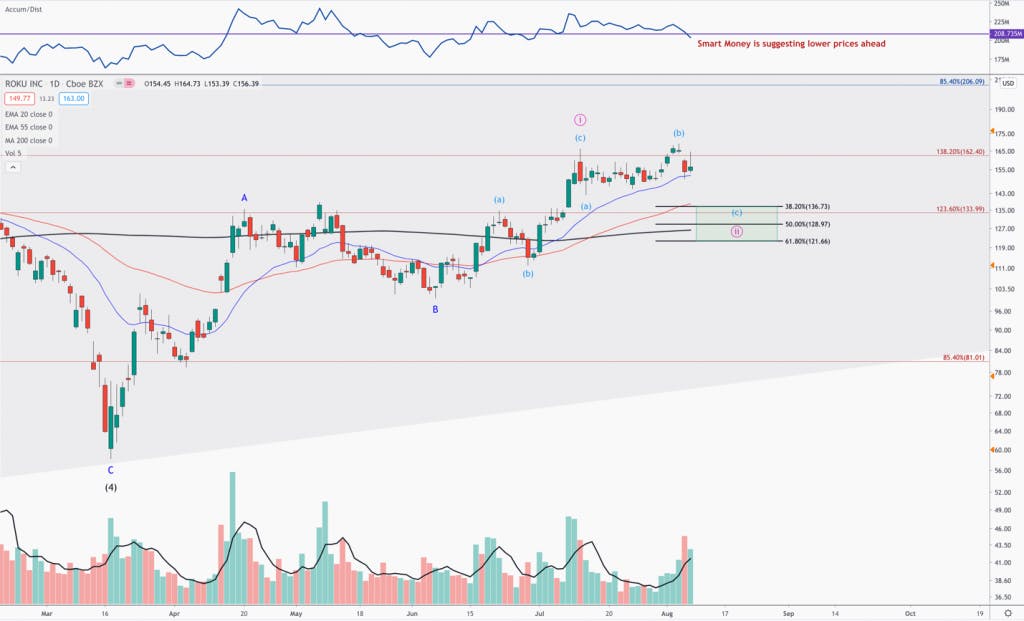
After further analysis over the weekend, I have concluded that it is likely Roku is in the 2nd wave within a new uptrend. In other words, after a correction, we will likely see price break to new highs.
The above chart lays out this path. First off, the Accumulation/Distribution Line (A/D) is suggesting that more downside is likely. A clean break of the 20-day EMA (in blue) will be the first confirmation. A break below the base at $142 will be the final confirmation that we are in the 2nd wave, which will lead to a trend change.
The targets are between $137 – $121 (~15% – ~25% drawdown from our cost basis). It is possible that the 2nd wave can retrace the entirety of the 1st wave, which would put our current position at a ~35% drawdown. I find this unlikely, considering the ignored growth Roku continues to produce. Relative to other ad tech names, Roku’s runway and positioning is much stronger, yet the relative price has been mostly subdued (read Beth’s recent blog on Q2 Earnings)
We are removing the stop from this recent open-trade, because we can take the worst case scenario of a 35% drawdown on such a small piece of our portfolio. However, the likely targets will be a 15% – 25% drawdown, if the $142 region breaks and we enter a confirmed second wave.
For anyone that wants to use a stop, the 20-day EMA is the most conservative, and more liberal stop would be at the $141.40 closing price.
Dynatrace (DT)
Summary
Dynatrace had a solid setup, with two internal buy signals and price tracing a bull flag.
It broke down, invalidating the setup, and found support of the $37 region.
Our stop is placed just below this zone.
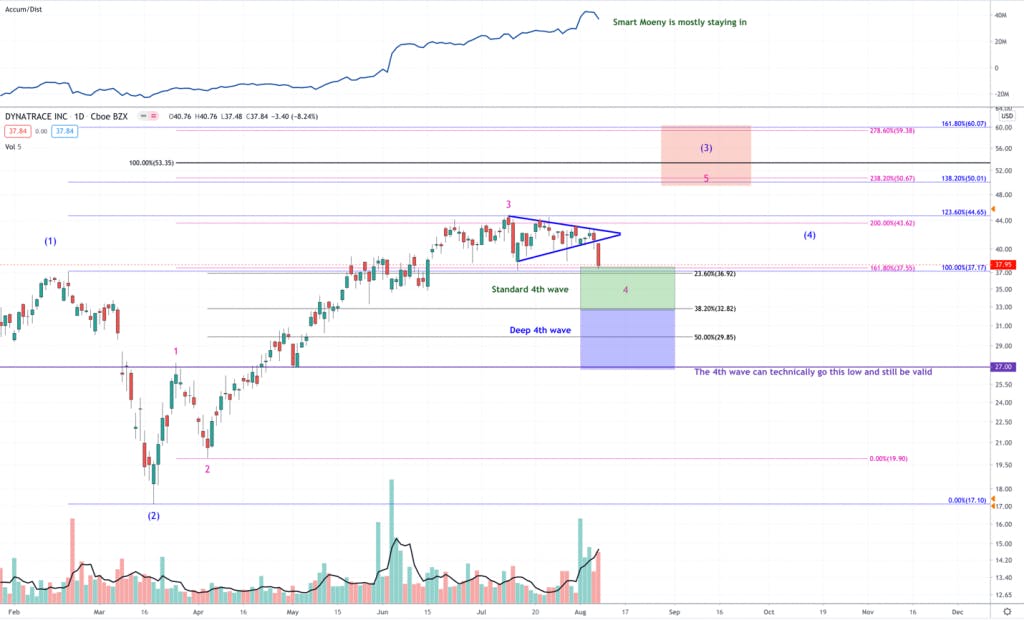
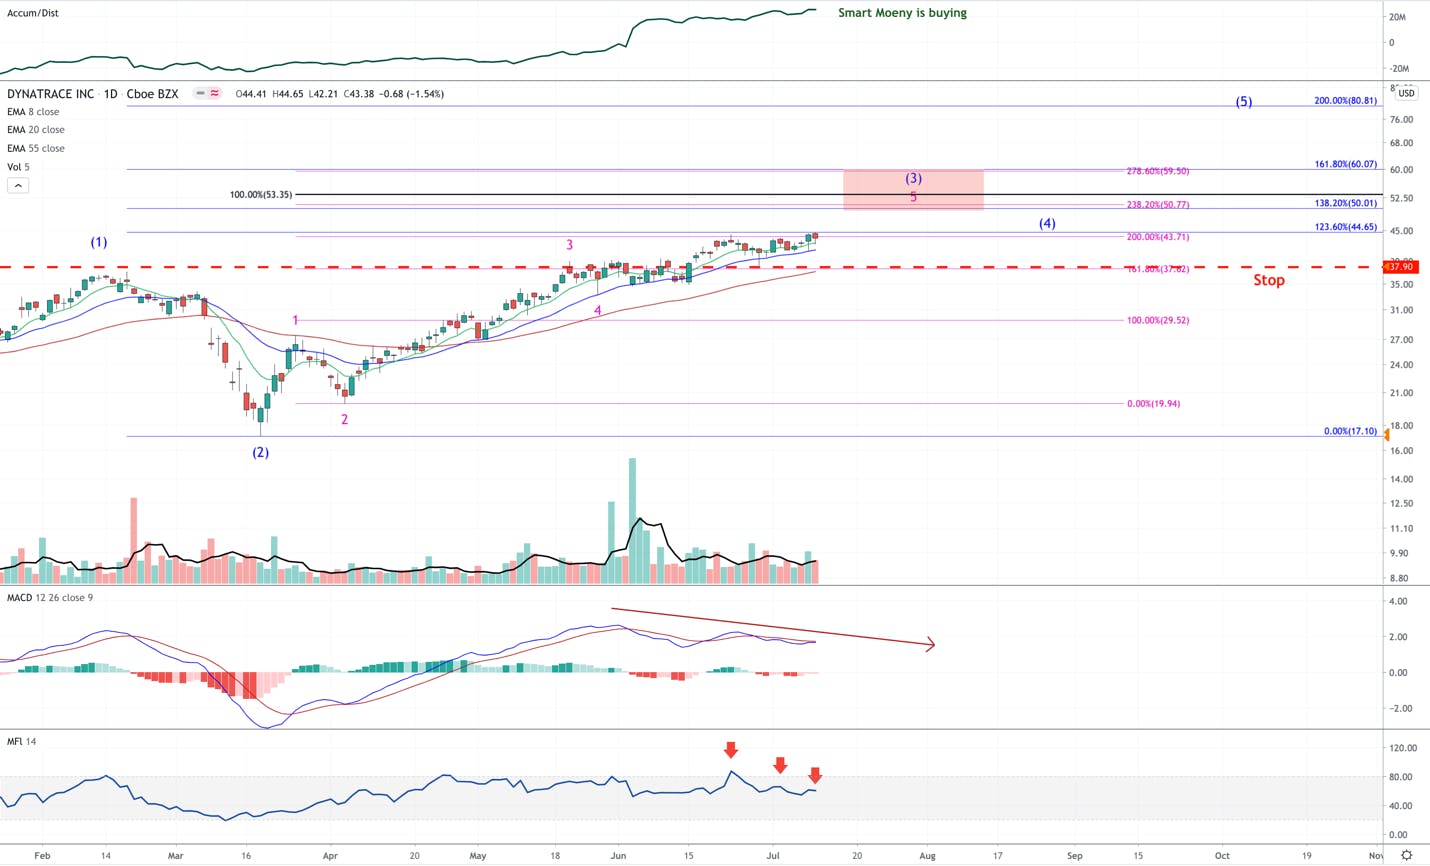
I believe DT is in a 4th wave pullback, which can be as shallow as $37 or as deep as $27. We consider any price below $33 to be a strong buy.
Dynatrace is relatively undervalued compared to many of the SaaS names, so we do not expect the correction in DT to be as deep.
Key Price Levels
Below $37 will confirm the $32 level is in play.
A break above $45 will signal the 4th wave is over and the uptrend will resume.
Dynatrace is another stock we bought on a potential breakout. The Accumulation/Distribution line was making new highs, suggesting that smart money was heavily buying the correction. Also, there was a positive divergence signal in the CCI.
These 2 buy signals, when coupled with price tracking a noticeable bull flag pattern, more times than not, it leads to the beginning of the next leg up. Unfortunately, Dynatrace fell after Datadog reported their earnings. This move invalidated the buy setup we were following.
Dynatrace has, once again, found support on the $37 region. As you can see in the chart above, this price region has a tight cluster of important prices and has held up DT for 2 months. For this reason, we placed our stop just under it at $36.70 (closing price). If this level breaks, and we get stopped out, the next likely target will be the $32 region.
My count suggests that we are entering the 4th wave in red on the chart. The green box represents the most likely targets for a 4th wave correction. The blue box represents a deep 4th wave pullback.
I find the blue targets unlikely considering that DT is largely unknown and has escaped some of the stretched valuations we’ve seen in the more popular names. However, if the price does retrace into this region, we consider it a steal and will likely buy in volume.
Shopify (SHOP)
Summary
Shopify broke out of a solid base on elevated volume.
Unlike many of the SaaS names, it is holding up above the breakout zone.
This is a company we want to own for the long-term; however, we do not want to overpay.
Our stop on this attempt to participate in the uptrend is set at $969.80 (closing price).
Key Price Level
A break above $1105 will signal the that the uptrend will continue.
$987 will close the first gap – first level of support.
$929 will close the second gap – second level of support.
Below $920 is a failed base, and will signal the likelihood of a trend change.
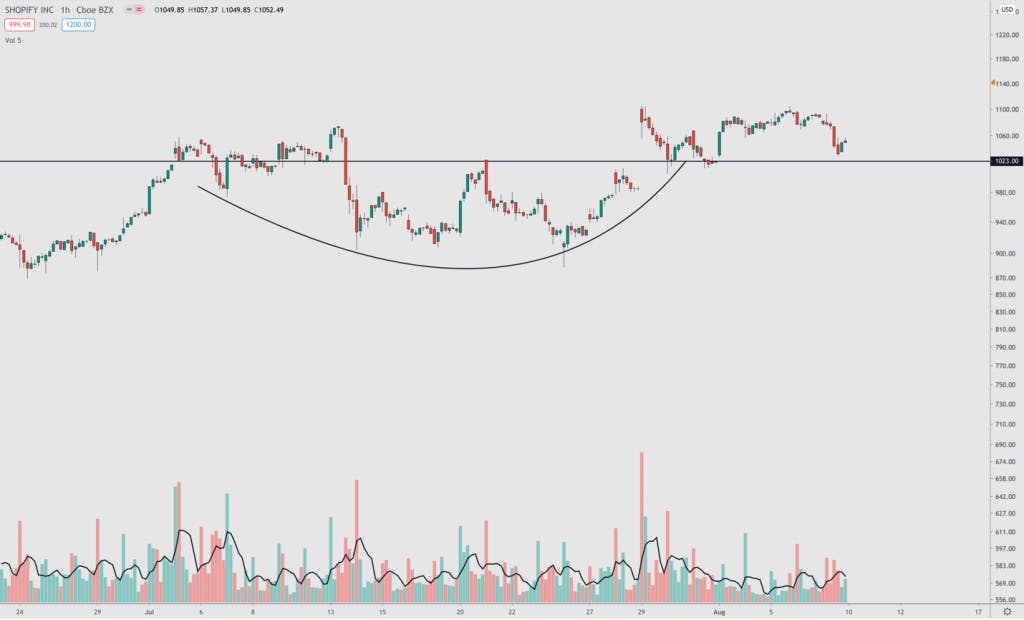
Shopify has formed a classic base with decreasing volume leading into the breakout zone at $1023. It gaped up through this zone on heavy volume, which was our signal to buy.
Even in light of Friday’s SaaS selloff, Shopify held up relatively well. It has not broken back down below $1023, so the breakout is still valid. If we are at the beginning of a deeper selloff, our stop will protect us, and we can hopefully pick up long-term shares at lower prices.
Docusign (DOCU)
Summary
Like Shopify, Docusign formed a solid base and price broke out on elevated volume.
After three consecutive days of selling, DOCU has found support at the $200 region.
Our stop is placed just below this level.
Key Price Levels
Above $230 will signal that the uptrend has more room to run.
Below $190 signals a failed base and the likelihood of a trend change.
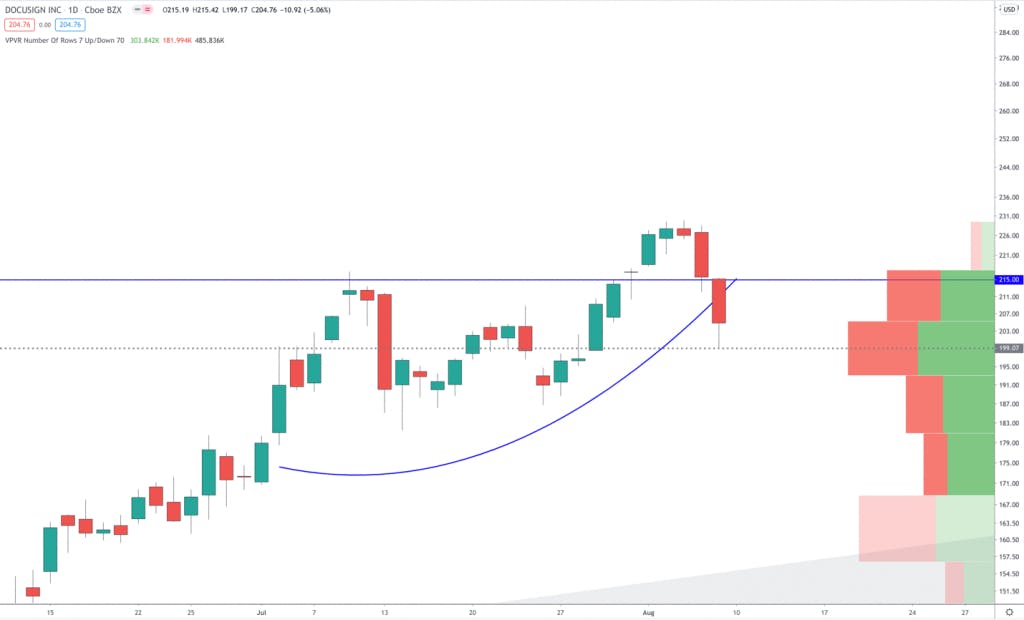
Docusign, like Shopify, was developing a solid base with a clear breakout price. After breaking out, we bought a small amount of a starter position. Like many SaaS names, it sold off sharply, with three consecutive days selling.
We have raised our stop to just under the $200-$199 support region. There is a large amount of volume at this support zone. If DOCU breaks it and closes below $198.50, we will log ~10% loss and look for the next setup.
Keep in mind, like Shopify and Zoom, this stock is overpriced for a reason. We want to own this stock and forget about it; however, we don’t want to overpay. I
For those that want a wider stop, $189.90 (closing price), Below that is the $161.80 price (closing).
Zoom Video (ZM)
Summary
Zoom is on the verge of confirming a failed breakout.
The correction could be shallow or deep, based on the 2 counts I believe are potentially active.
Regardless, we are taking the stops off Zoom, and will look to keep adding in any further weakness.
Key Price Levels
Above $281 will signal that the uptrend is still intact.
A break below $240 will put the two correction scenarios in place.
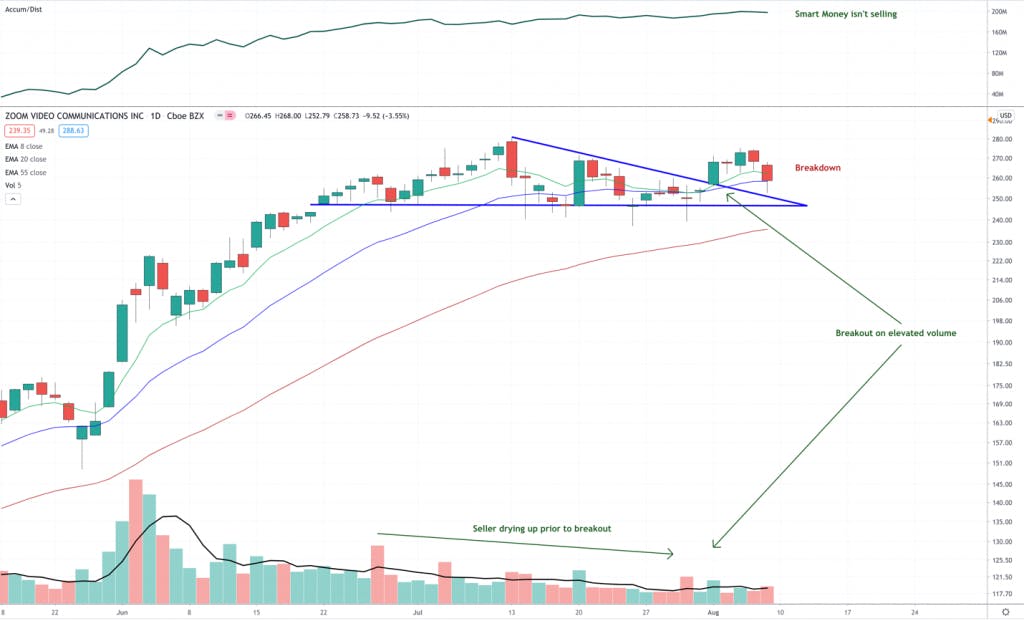
Zoom is another stock that was providing a breakout buy. Note the pennant forming in blue – a classic trend continuation pattern. This was confirmed with decreasing volume, then a breakout on elevated buying volume.
However, like almost every bullish setup we took this week, it appears to be in the early stages of breaking down. The below chart provides my analysis on the two paths Zoom can take if the price breaks below the $240 line.
Below $240, and there are two scenarios that could play out:
Zoom has a shallow correction, likely finding support between the $242 – $220 region.
Zoom has a deep correction, which can take us as low as $205-$196.
The Accumulation/Distribution line is suggesting that smart money is buying into this correction, as are we. We put Zoom in a high conviction category along with Roku, Nvidia and AMD. These are stocks we want to own with a long-term frame of mind. If the market does give us a deeper correction than we think possible, we will buy more.
Closed Positions
Teladoc (TDOC) and Livongo (LVGO)
Summary
We closed our positions in LVGO for two very nice gains.
Teladoc has confirmed a trend change with a clean 5 wave drop from all-time highs.
We closed our position in TDOC around the breakeven point.
There are 3 scenarios for where this correction will likely find a bottom.
If TDOC bottoms at the $192 region and makes new highs, we will look to continue our trend following strategy, buying in on a new breakout.
Key Price Levels
Above $240 signals the uptrend will likely resume.
A break below $192 will put a correction scenario in play.
Because TDOC is purchasing LVGO, and the payment to shareholders will be in TDOC shares (plus cash), we will focus our attention mostly on TDOC going forward.
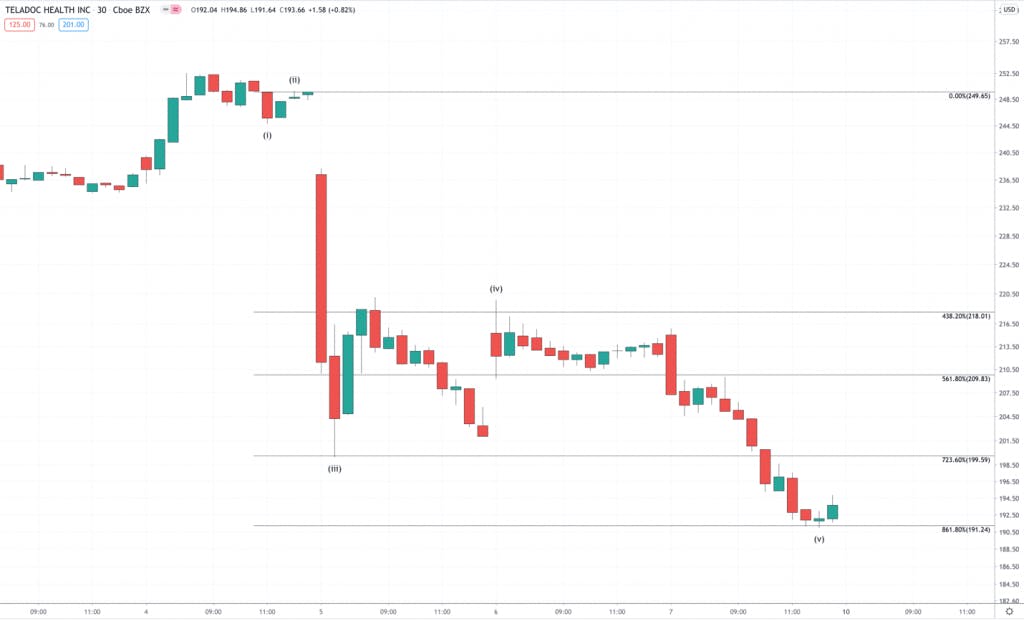
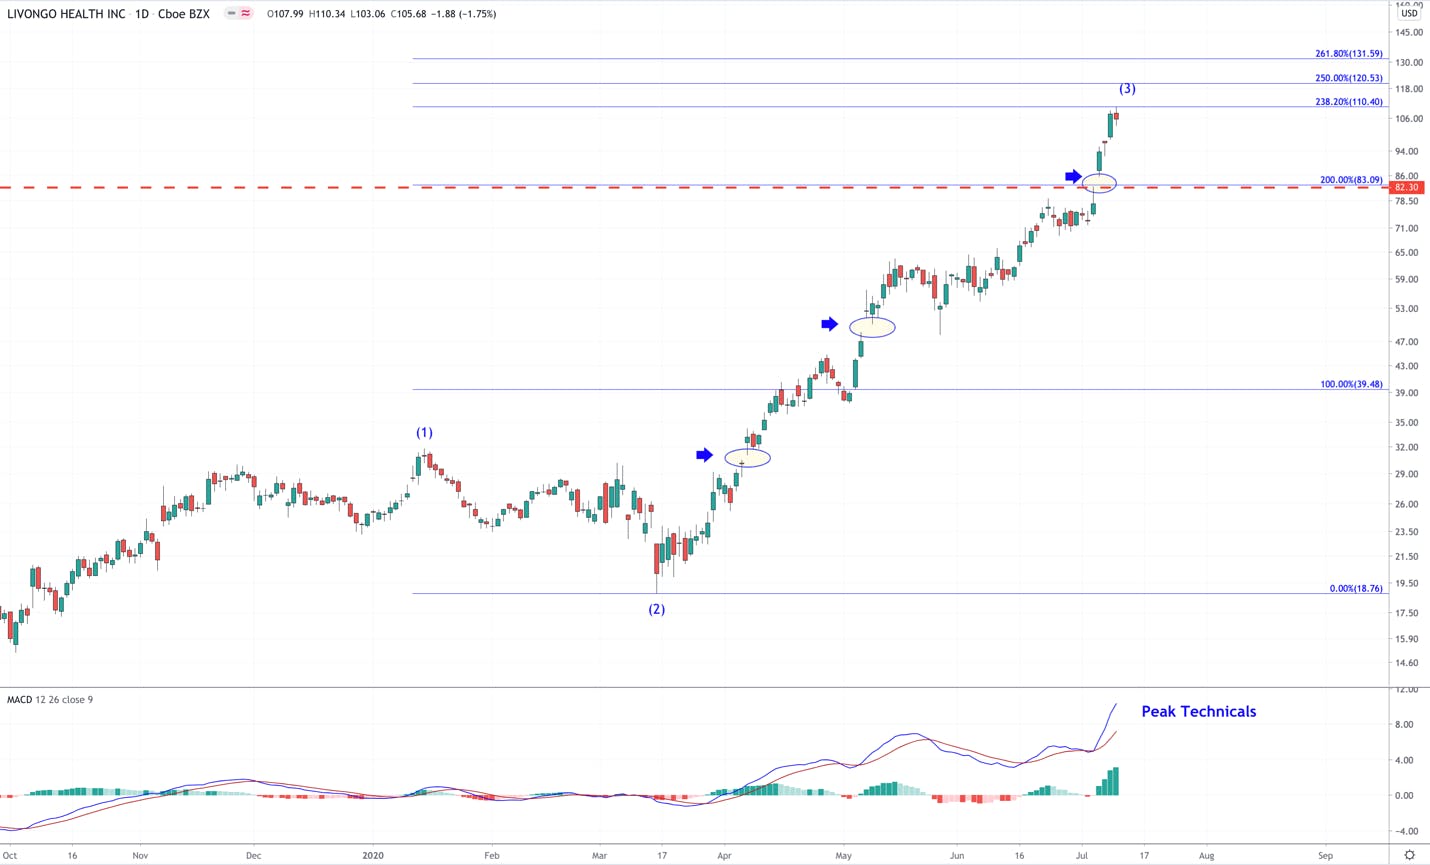
After announcing the buyout of Livongo, Teladoc shares fell nearly 20% in 1 day while Livongo fell about 11%. The following day, price recovered slightly, only to make a lower low, which completed a symmetrical 5 waves down from their all-time high.
The above chart is a close up of this pattern. Seeing a clean 5 waves down from an all-time high, more times than not, signals a trend change, the extent of which is yet to be known.
After a discussion, we decided to close our position in TDOC on the 4th wave bounce, which ended up being around the breakeven point of our cost basis. We also closed our combined positions in LVGO – one for 81% gain and the other for a 19% gain.
We don’t believe that this sentiment shift in Teladoc is over. As of now, we still believe it will be the primary beneficiary in the telehealth microtrend. However, once sentiment shifts, it can move much farther than most realize, which governed our decision to not ride it out while we could still avoid logging a loss.
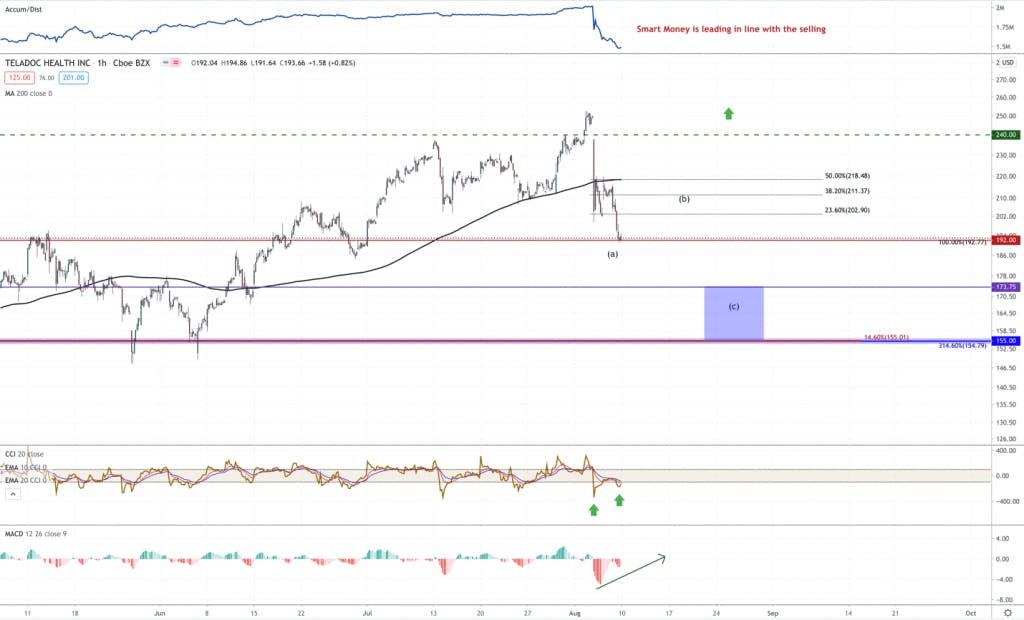
The below chart is our current game plan for picking up shares at a lower cost basis.
After completing 5 waves down, note the CCI and the MACD histogram. Both are showing positive divergence. This is also present on the RSI as well. Also, the price has tagged a key Fibonacci extension at $192. I believe this will be the end of the A wave, and the B wave retrace will likely test the 200-hour SMA in black, which happens to fall in line with the 50% retrace of the A wave.
If price breaks below the $192 level, the next supports that could be potential bottoms for the C-wave:
The $174-$172 support. A large amount of volume has accumulated in this region. This will be a tough area for price to break through, and we will first look to this area for a buying opportunity (~30% drawdown).
$155 is an area that has a tight cluster of key Fibonacci prices. It’s also the 14.6% retrace of the entire uptrend that started in 2016 (~38% drawdown).
Since Teladoc has been trading, we have seen a drawdown greater than 75%, one around 54%, and 3 drawdowns greater than 30%.
Also, there is a chance the bottom is in at $192 and the uptrend resumes. If this is the case, we will treat TDOC like our other trend following stocks – look for a base, buy in with a stop and ride the trend.
Inseego (INSG)
Summary
Inseego failed breaking out to all new highs, confirming a double top.
The extent of the correction is yet to be seen.
We closed our open-trade in INSG on the bounce, logging an 8% gain.
We still own a position without stops because we like the 5G story for last mile connectivity
Key Price Levels
Above $15 will confirm a breakout, and the uptrend can resume.
A break below $11 puts the $9 support in play.
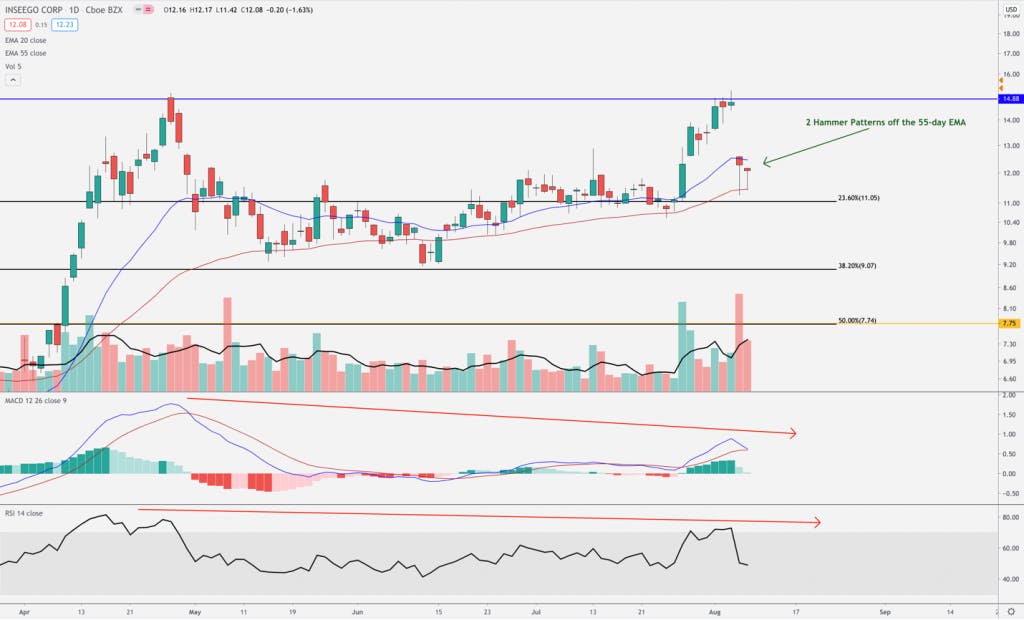
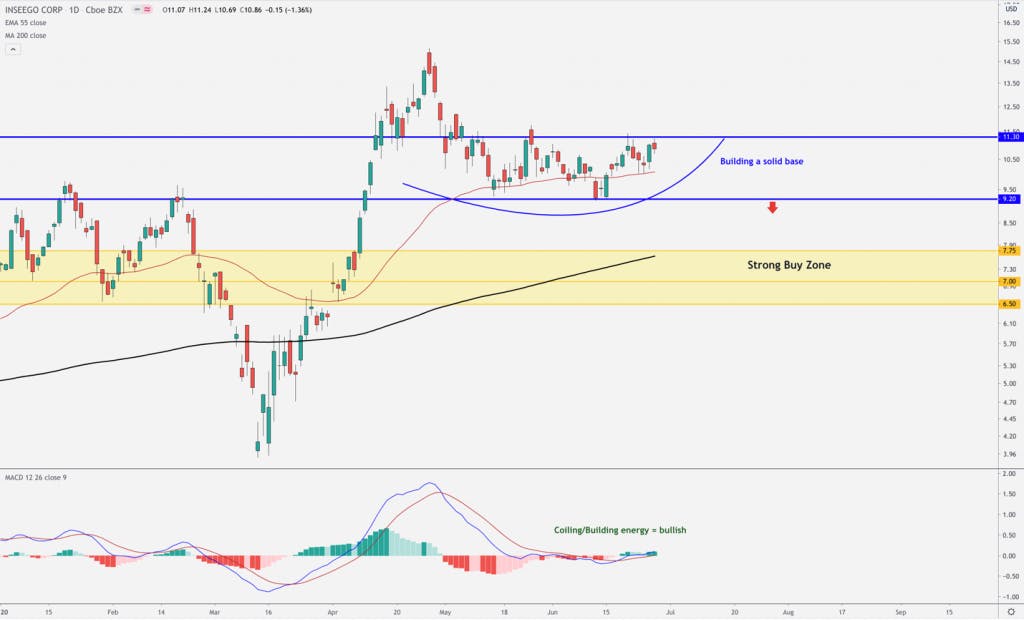
Inseego was another position we closed for a slight gain of 8% last week. As you can see, the price built a solid, multi-month base leading up to the breakout zone around $14 – $15. There were warning signs present as price approached the $15 breakout zone, as evidenced by the negative divergence in the MACD and RSI.
However, the increased buying pressure, coupled with a strong report can negate these signs, resetting the internals for a new leg. This was the bet we took going into earnings.
Inseego’s report did not impress, it gapped down below the 20-day EMA (blue), and found strong support on the 55-day EMA (red). This is shown by the two daily hammer patterns.
There are two obvious paths Inseego can take, of which we will add some detail:
INSG holds support and builds a new base back up to the $15 resistance, followed by a break out. This would look like a Cup & Handle Pattern. If this happens, the large degree 5-wave pattern that started off the March low will extend further to new highs, and we will participate in this breakout.
Price breaks down below $11, which is the 23.6% retrace of the uptrend off the March low. If this happens, it will signal the first wave is over, and we are in the larger degree 2nd wave. If this is the case, we could see price hit the $9 region.
We are holding the position we acquired at $9.70 without stops. We do believe it’s only a matter of time before INSG moves to new highs while riding the 5G microtrend and we are comfortable riding out the volatility present in the small cap space.
Twilio (TWLO)
Summary
We closed our position in TWLO for a 17% gain.
So far, it is tracking our Elliott Wave count perfectly.
We will look to lower levels to re-enter TWLO, while it plays out a 4th wave decline.
Key Price Levels
A break above $290 will confirm that the uptrend can resume.
Below $252 will confirm a trend change.
Potential 4th Wave target/bottoms are $217, $203, $170.
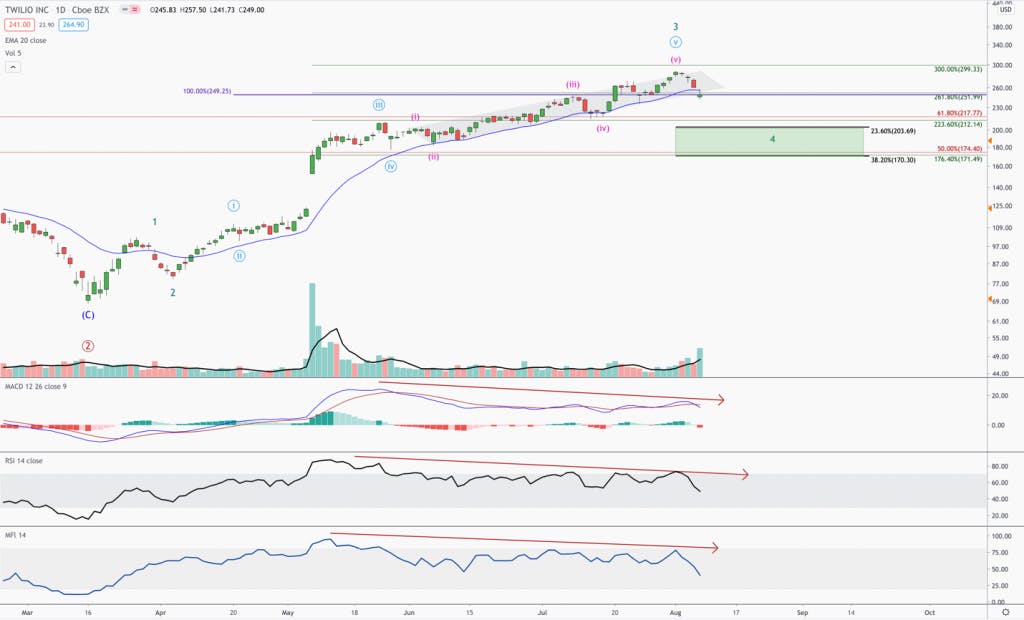
On Friday, Twilio closed below the 20-day EMA (in blue), which was our stop for this position. We logged a 17% gain and raised some cash going into the potential SaaS sell off. However, anyone following us in this trade noticed that we raised our stop two weeks ago. The reason we raised our stop is due to how closely TWLO was tracking the Elliott Wave count we believe is active. In short, after completing an ending diagonal with negative divergence in all the major momentum indicators, we believe that the 3rd wave off the March low has completed.
Regarding the standard targets for a 4th wave, we should see TWLO trade into the $217 – $170 region. We will look to this region, or evidence of a bottom forming around this region, to get back in.
Like Teladoc, there is the potential that we find a quick bottom and start trading back into new highs. If this happens, like with TDOC, we will look to re-enter on the next breakout. However, we will do so with 17% more capital to invest.
Potential Setups
Microsoft (MSFT)
Summary
Microsoft is the canary in the coal mine regarding the broad market.
The weight of evidence supports a relatively shallow 4th wave.
However, a deeper correction cannot be ruled out as long as MSFT stays below the $218-$220 price zone.
Key Price Levels
Above $220 confirms the low is in for this correction, and the uptrend can resume.
Below $205 puts the $198 and $187 price regions in play.
Below $180 and the deep correction scenario becomes a real possibility.
Microsoft is an interesting case. We did a deep dive into the technicals last week, which you can review here. As of today, the direction Microsoft goes is the way the market goes. For this reason, I keep this chart active on a daily basis and have put more thought into this chart than almost any other that we track.
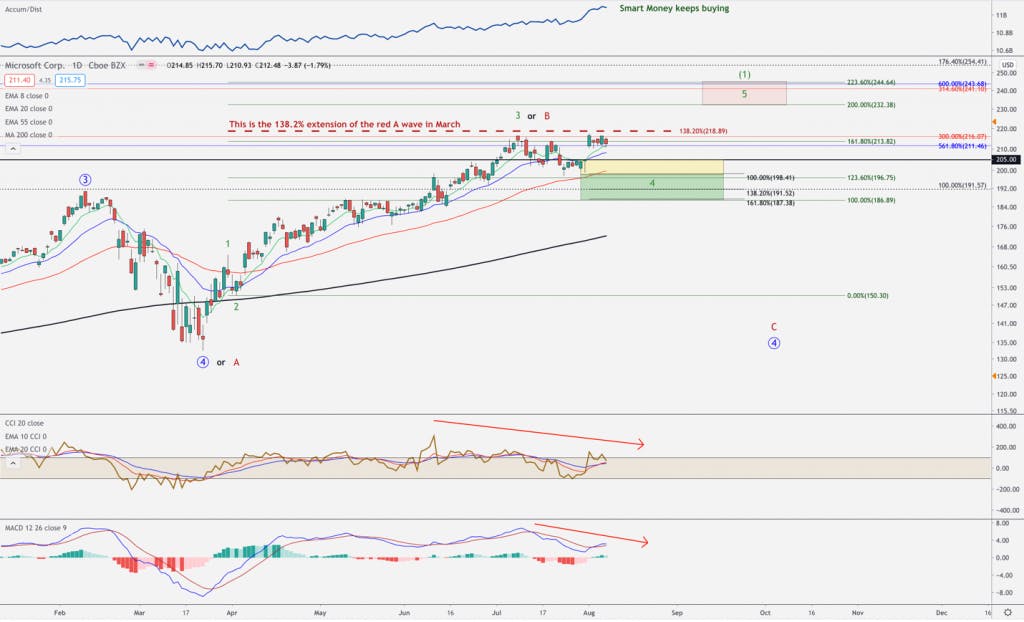
I believe MSFT is actually in its 4th wave off the March lows. It’s setting up for a buy between $205, which will close the gap, and $187, which is the lower target for a 4th wave. Note the heavy confluence of important price clusters on the chart, one of which the price is currently trading within – $218-$211. These zones will be likely bottoming areas that we will analyze for entries in real time.
If you read my report last week, you’ll remember that as long as price remains below the $218-$220 mark, there is the slim possibility for a deeper pullback on the table. This level is the 138.2% extension of the March selloff (or, in the bearish count, the A wave). That would make the current uptrend the B wave.
The limit a B wave can stretch beyond an A wave, in my experience, is the 138.2% extension. For MSFT, this is the $218-$220 level. I find it interesting that this is the very level that MSFT stalled and cannot break through. For this reason, we will use stops with our new position in Microsoft, until it clears the $218-$220 price point.
Slack (WORK)
Summary
Slack is a high conviction play that we are eagerly waiting to grab more shares of for our long-term portfolio.
The evidence suggests that Slack is in a wave 2 off the March lows.
The likely targets are between $27.50 – $24.50. However, we could be in for a correction as deep as $21.
Key Price Levels
A break above $31 on elevated volume suggests that Slack may have found a bottom in this correction off the highs.
Below $24 puts the $21 level in play.
The two levels of volume that are keeping the price range bound are between $31-$30 and $21-$20.
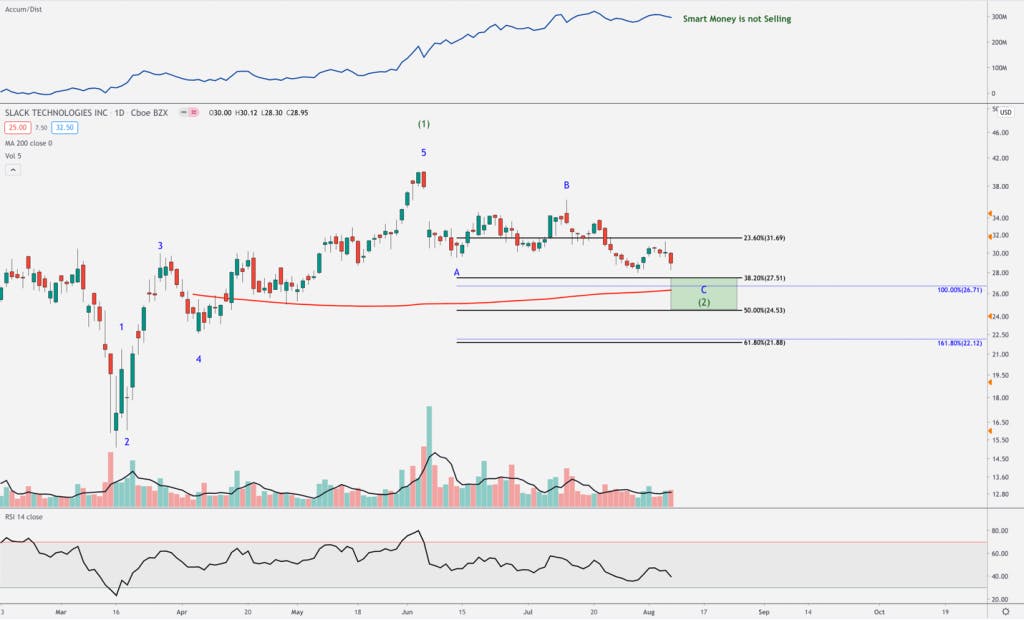
Slack has moved below the wall of volume between the $31-$30 price range. Based on the structure, I believe Slack is in the stage of its 2nd wave in a 5-wave uptrend that started off the March lows.
We believe this stock is undervalued, and we will look to grab shares for our long-term portfolio between $27.50 and $24.50. This region has a number of symmetrical price points, the 200-day SMA as well as the most common retrace levels for a 2nd wave. It is possible that this correction tags the $21 region; however, we find this to be unlikely. Regardless, we will look to re-enter our position in Slack without stops soon.
BigCommerce priced today on August 4th and is scheduled to trade tomorrow, August 5th. You can view the S-1 Filing here.
Overview
Investors who missed out on Shopify will be eyeing the BigCommerce IPO although there are some important differences to consider. For the most part, the differences are seen in the financials.
Shopify has an annual run rate of $2.8 billion compared to BigCommerce at $151 million based on current quarter’s earnings. This is roughly 20 times more revenue.
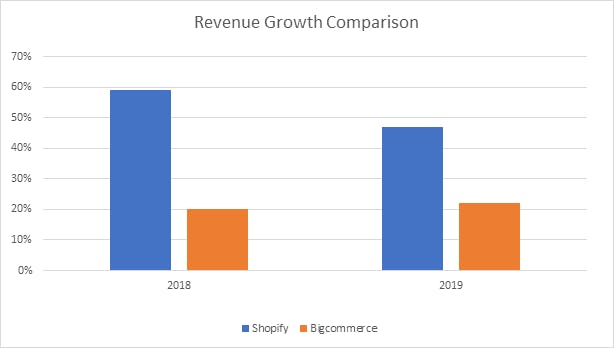
Despite Shopify having 20X higher revenue, the company is also growing 3X faster at 97% year-over-year compared to BigCommerce at 31-32% year-over-year through end of June. Before covid-19, Shopify was posting growth between 45-70% compared to BigCommerce in the low 20% range – so again, about 3X more growth for Shopify.
When we look historically at Shopify, the company was growing 95% year-over-year in 2015 when reporting $200 million in revenue. Therefore, no matter how we compare the two companies, whether it’s historically during similar revenue size, pre-covid in 2019, and also post-covid in 2020, Shopify has remained nearly 3X more growth than BigCommerce and is continuing to do so at high revenue run rates.
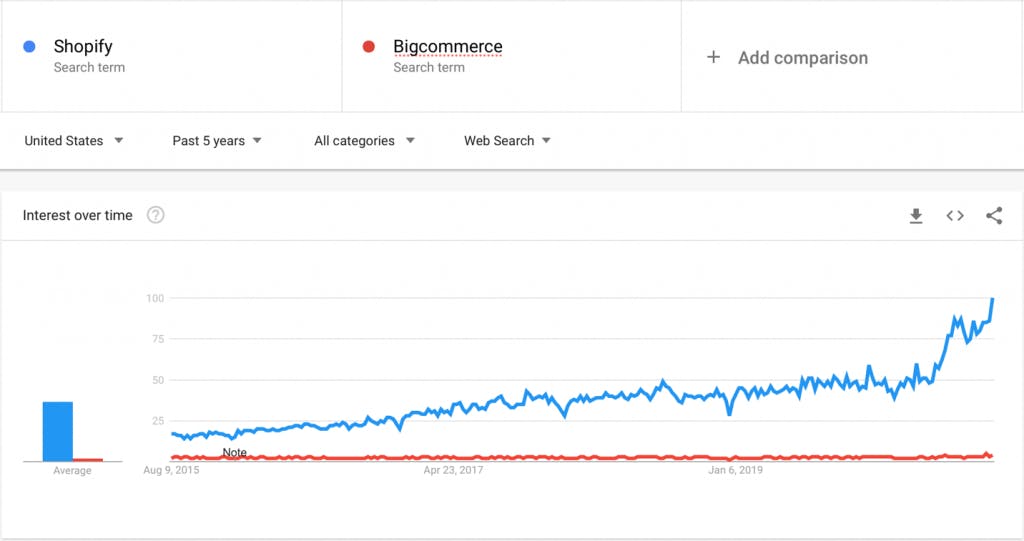
One way to determine customer demand between competing products is to look at Google Trends. Below we can visualize the popularity of Shopify compared to BigCommerce. It’s interesting to see that BigCommerce search trends have not ticked up much in 2020.
According to the S-1 Filing, BigCommerce will report 30% to 32% revenue growth for the quarter ending June 30th with revenue expected to be between $35.5 million and $35.8 million compared to $27.2 million in the previous year. Net losses will slightly improve from $11 million same-quarter last year to between $9.4 and $9.0 million this year.
The company had a gross margin of 76.1% in 2018, 75.9% in 2019, and 76.8% and 77.5% for the three months ended March 31, 2019 and 2020, respectively. The company had a net losses of $38.9 million in 2018, $42.6 million in 2019, and $10.5 million and $4.0 million in the three months ended March 31, 2019 and 2020, respectively.
The company is reporting ARR to be roughly $151 million, which is higher than the $144 million ARR if calculated off the current quarter. This will represent an increase of 31.5% at the mid-way point, up from $115 million ARR from June 30th last year.
BigCommerce saw Essentials plans increase 33% in March, 106% in April and 86% in May. The enterprise plans increased only 14% and 13% in March and April before showing a marked improvement of 60% in May. Interesting enough, BigCommerce did not match Shopify’s offer of extending a free trial from two weeks to three months to incentivize covid conversions.
According to the filing, BigCommerce ranks second to Shopify from third-party reviews: “As of June 1, 2020, BuiltWith.com (“BuiltWith”) ranked us the world’s second most-used SaaS ecommerce platform and top five overall among the top one million sites globally by traffic, which we believe consists primarily of established SMBs.
We also were ranked the second most-used SaaS ecommerce platform among the top 100,000 sites globally by traffic, which we believe consists primarily of mid-market and large enterprise businesses.”
Ecommerce Market
There were quite a few statistics provided by BigCommerce in the S-1 filing that support growth of e-commerce, such as: “In June 2020, eMarketer predicted that U.S. brick and mortar retail spending will decline by 14% in 2020, whereas U.S. consumer ecommerce spending will increase by 18%, the highest growth rate since their coverage began in 2008.”
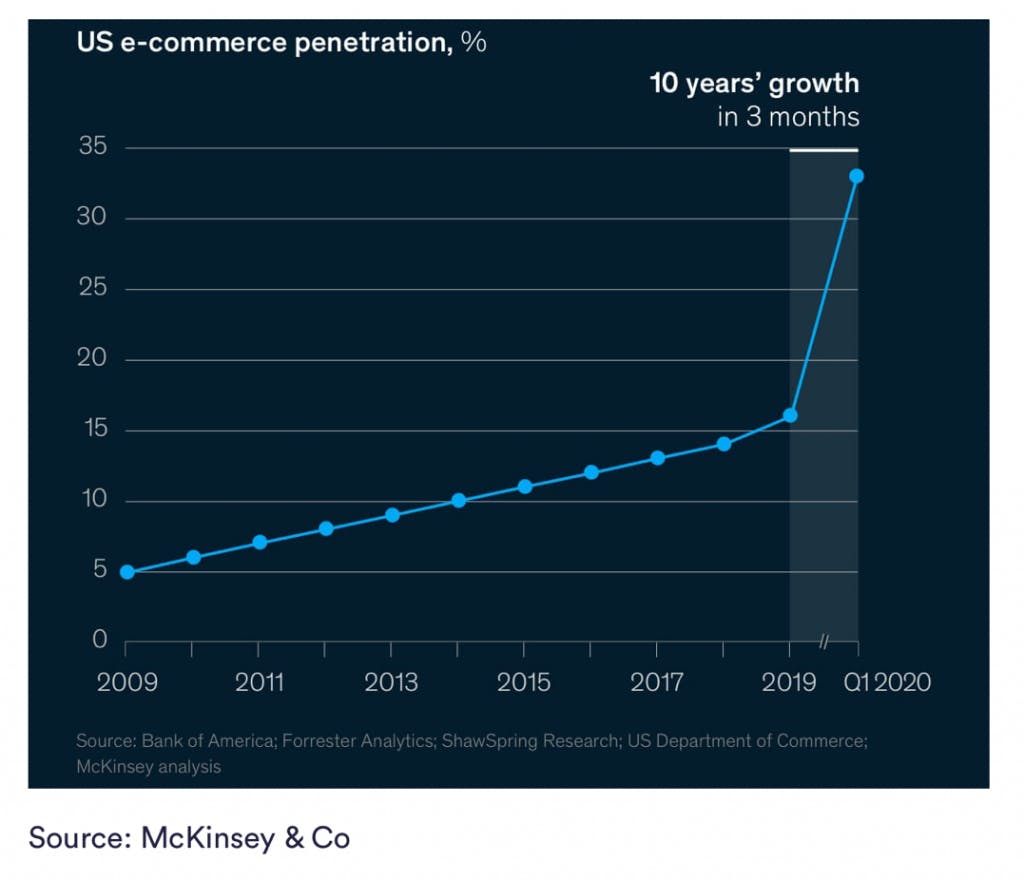
According to McKinsey & Company, 10 years of growth has occurred in e-commerce in the last three months with the microtrend showing hockey stick growth in Q1 2020. Evidence of this was seen in Shopify’s most recent earnings report yet BigCommerce has only accelerated from mid-20% growth to mid-30% growth.
One notable positive for BigCommerce is that Tiger Global plans to buy up to 20% of the shares. This is one reason Fastly has done well; Abdiel Capital owned a significant amount of shares relative to float helping to prop the stock price. Tiger Global Management’s interest was disclosed at the beginning of the S-1 filing.
Company Background:
The company was founded by Eddie Machalaani and Mitch Harper in 2009. It was spun off from their email marketing Software Company called Interspire which was started in 2003 by a chance meeting in an online chatroom. It also relocated the company from Sydney to Texas in 2009.
The company announced a $15 million Series A funding led by General Catalyst in August 2011. It acquired Zing, a provider of mobile retail technologies in April 2015. Later that year, the company leadership transitioned from the original founders to the current CEO and management team. In May 2018 it raised $64 million Series F investment round led by Goldman Sachs. It also opened the London office in the same year.
Growth Opportunities:
BigCommerce is focused on international expansion. The company pointed out in the S1 filing that 25% of their stores are located outside of the United States compared to 58% of ecommerce sites located outside the United States. In July of 2018, BigCommerce launched their first European team in London, and in 2019, their first Asian office in Singapore. Revenue grew 20% in EMEA and 28% in APAC in 2019.
According to BuiltWith as of January 2020, 42% of all ecommerce websites are based in the United States, and 58% are outside of the U.S. IDC estimates that the Americas, Europe, Middle East and Africa (EMEA), and the Asia Pacific region (APAC) will represent 61%, 22%, and 17% of total global spend on ecommerce platform technology in 2020, respectively, with EMEA and APAC growing at CAGR’s of 8% and 17% through 2024, respectively.
In the Alibaba PDF, we covered the importance of the B2B ecommerce trend (as opposed to the B2C trend). Last year, 10% of BigCommerce’s customers came from B2B sales. In addition, Forrester rated BigCommerce as a “strong performer” for B2B Commerce Suites in Q2 2020. The management has noted this is an area of focus for them. This is an important area to watch as Shopify and other B2C competitors are not listed here.
Facebook Shops launched in May of 2020 as a headless commerce option where various backend services are presented to social media users. For instance, a consumer may be finishing a purchase with Shopify, BigCommerce, Woocommerce, or a few others and the product description will look the same. This eliminates the need for a website in order to sell products. BigCommerce already had previous Facebook integrations. Facebook’s long game is to integrate the cyptocurrency Libra.
Note on Valuation:
BigCommerce has increased its shares from 6.85 million to 9.02 million. The estimated price range is $21 to $23 as of 12 pm ET on August 4th. This puts the market value at $1.7 billion, fully diluted. If we take the ARR the company has represented at $151 million, then the price to sales is 11.2. At the actual ARR of $144 million, the price-to-sales is 11.8. As pointed out by Nasdaq.com, BigCommerce calculates ARR differently than Shopify.
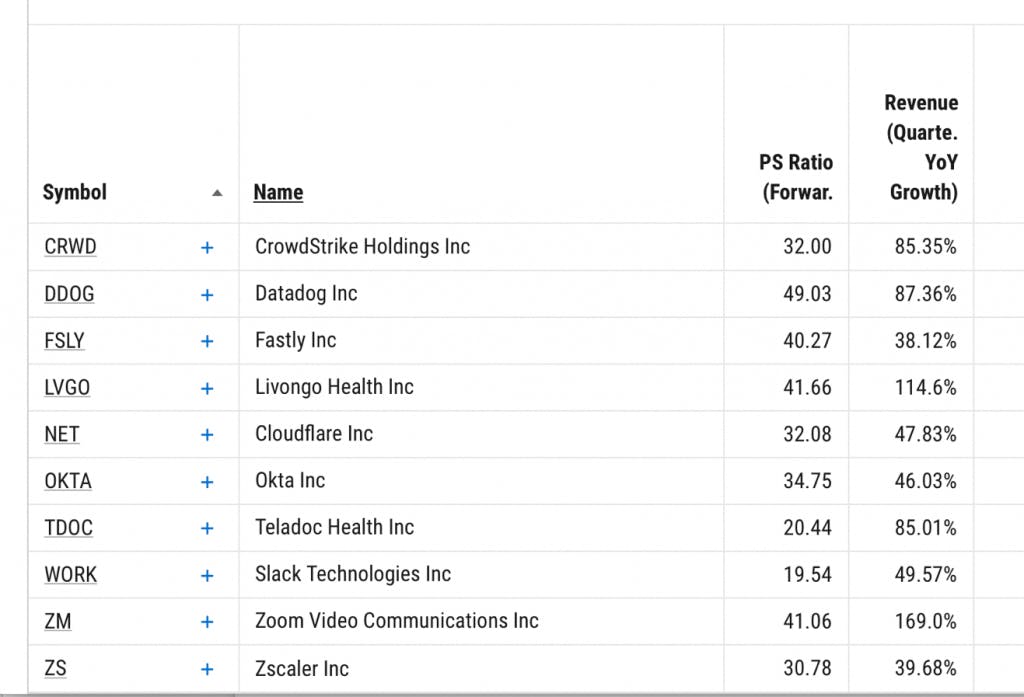
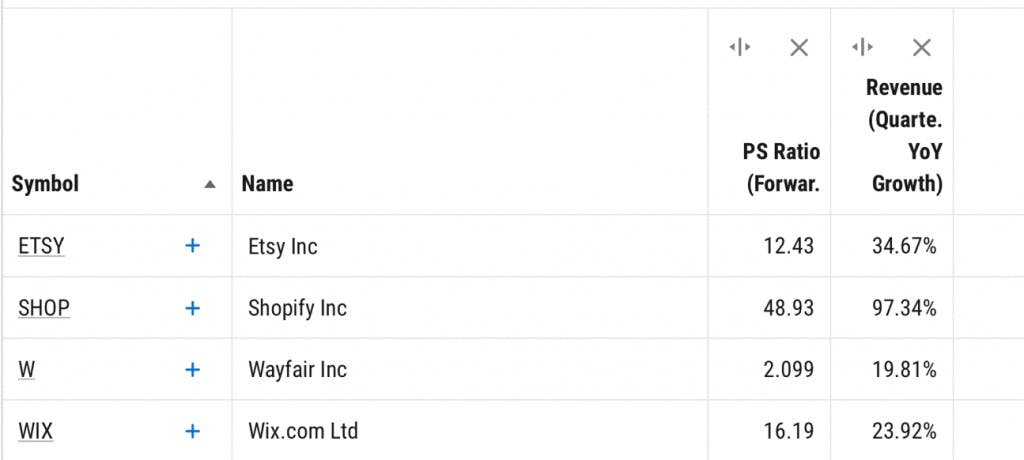
There are very few SaaS companies trading at a forward 11-12 price-to-sales. Shopify is trading at a forward PS ratio of 48. This is why you should expect the opening price to be much higher for retail investors.
Pictured above: Fast-growing SaaS companies can attract a forward price-to-sales around 30 with forward growth of 40%. BigCommerce has forward growth of 32%.
I think it’s important to point out that most IPOs settle below or at their opening price within the first year (assuming BigCommerce opens at a 30-40 price-to-sales).
When Zoom Video went public, they had an immaculate S-1 filing with sizable growth and had a clear and straight path to profitability. We saw this company come down and trade at its opening IPO price within the first year. Pinterest traded below its IPO price many times. Slack has not fully recovered its opening IPO price. Roku began to shoot up very nicely with earnings beats and so this was an exception where the company’s IPO opening was a good deal and buying in the first quarter of its trading history created gains.
BigCommerce has chosen this time to go public for a reason as ecommerce has serious momentum. It’s impossible to predict where the stock will open for retail investors.
BigCommerce will hope to ride Shopify’s coattails. It’s important to consider that we’ve been given a glimpse of how covid has re-accelerated revenue and BigCommerce is posting 32% growth compared to Shopify’s most recent quarter of 97% growth.
The listing’s price-to-sales is very reasonable of 11-12 but once we are in the 30-40 price-to-sales for the opening price, we are confronted with risks as BigCommerce will need to maintain the growth of other popular SaaS products that had competitive growth pre-covid. The question truly becomes “what company do I want at the 30-40 price-to-sales and what companies are worth the risk at the 50 more more price-to-sales?”
IPO frenzies can cause investors to forego rational thinking. I can’t imagine paying a Shopify valuation for a company with 1/3 the growth and 1/20 the revenue. However, there’s a possibility we see it near this valuation tomorrow due to ecommerce being a hot trend. If Bigcommerce shoots up to this level, I will be respectfully on the sidelines. Not because I’m not willing to pay high valuations but because I require above average growth for high valuations.
Conclusion:
BigCommerce is centered in a massive trend yet is not showing as much revenue growth as its competitor, Shopify. Although BigCommerce will certainly open higher than the list price which is at a 12 price-to-sales; how high and if the company is a good value becomes questionable at around the 30 price-to-sales range and even more questionable at the 40 price-to-sales range as the excitement of the IPO would place BigCommerce up against companies that have reported excellent growth for quite a while (rather than one quarter).
We could see BigCommerce accelerate revenue beyond the 32% mark that is being reported after the first full quarter of covid. That’s the gamble – is this quarter and perhaps next quarter an outlier or are they indicative of a more permanent trend and revenue growth trajectory. This is a bigger gamble than Shopify, Zoom Video, and others that had strong growth prior to covid.
The narrowing losses are a major plus. Also, Tiger Global is looking to invest up to 20% because the likelihood of BigCommerce being an acquisition target is high (in my opinion, this is one reason why Tiger Global would take a large stake). It’s easy to think of a few companies that would acquire a $2-$3 billion competitor to Shopify: Amazon, Wal-mart, Facebook, for example. BigCommerce has 60,000 online stores in 120 countries and the fulfillment centers that Amazon and Wal-mart have would be a good match for BigCommerce’s features. Customers include Avery Dennison, Ben & Jerry’s, Burrow, SC Johnson, SkullCandy, Sony, and Woolrich.
We will try to enter up to 30 price-to-sales but may need to back off beyond this and feel that 40 price-to-sales is the cutoff for our portfolio. If the stock trades between 30 to 40, it’ll be up to Knox’s discretion and he will post this in the Buys chat room on the forum.
Ecommerce is hot right now and the market has shown some irrational behavior in other hot trends. We are okay trying to capitalize on hot trends but we prefer to have more consistent growth than one outlier quarter as part of our thesis. We also think the growth should be higher than 32% given the effects of the pandemic. In this case, it’s not worth the 48 price-to-sales ratio that Shopify is trading at but we will see what the (sometimes irrational) market decides tomorrow.
This article was originally published on Forbes on Jul 27, 2020,11:44pm EDTForbes on Jul 27, 2020,11:44pm EDT
This earnings season promises to be a wild ride across the tech sector as initial impact from the coronavirus will be reported while a few outliers will seem impervious. Ad-tech stocks are especially vulnerable to other sectors with Google expected to have its first decline year-over-year in company history. Facebook boycotts that came late in June could affect future quarters. We’ve seen Twitter report 23% lower revenue and entertain new methods of monetization. However, these well-known risks will be rivaled if not exceeded by the effects of the lesser-known announcement from Apple last month in regards to the required opt-in for the ID for Advertisers (IDFA).
The IDFA is a number tied to the device that allows ad exchanges to track user interactions and behavior. The primary function is very similar to cookies in that it helps ad companies store data profiles and preferences for personalized messaging, regardless of which device you are logged into. In addition to targeting, the IDFA also helps with attribution and measurement.
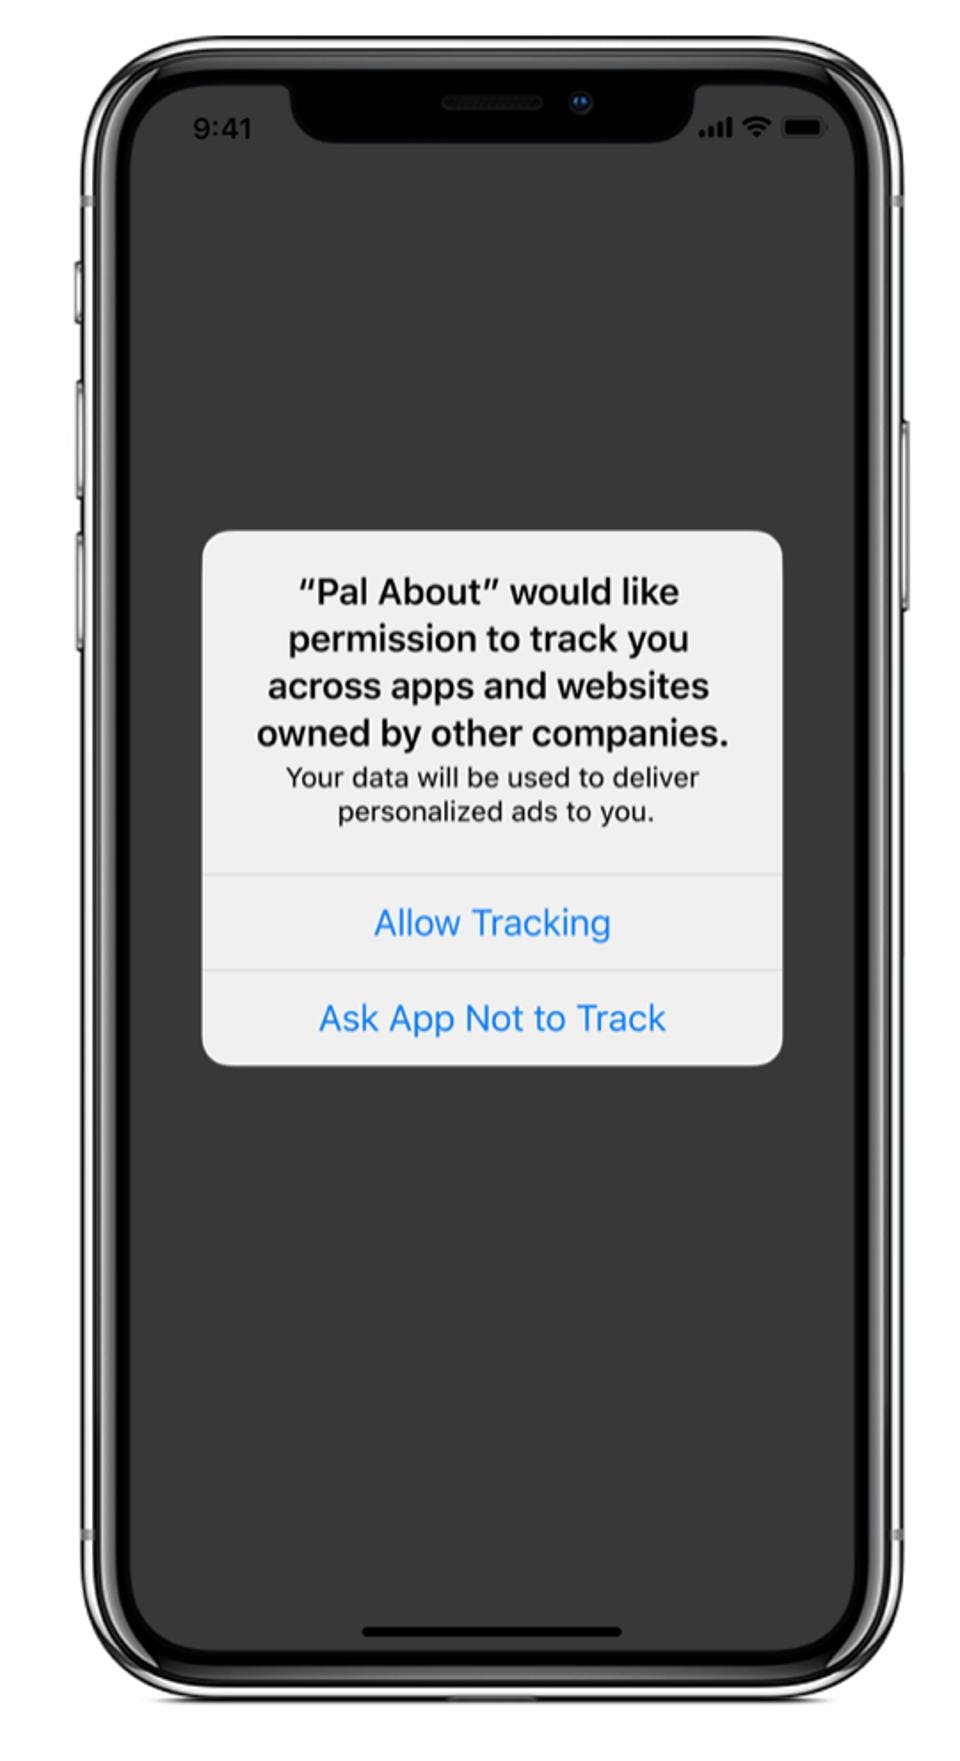
If you’ve never heard of the IDFA or are not aware that a number is assigned to your iOS device to help track you, it’s because this has been opt-out in the past and been hidden inconspicuously in your Settings. In the upcoming release of iOS 14 in September, Apple will make this an opt-in for every single application. This means a message will appear for every application using a mobile device ID asking for permission.
Pictured above:Apple will require opt-in permission to track for displaying targeted ads, sharing device location, sharing a list of emails, ad IDs or other IDs used to retarget and/or placing a third-party SDK in the app that combines user data from your app with user data to target advertising. See the full list here on Developer.Apple.ComPictured above:Apple will require opt-in permission to track for displaying targeted ads, sharing device location, sharing a list of emails, ad IDs or other IDs used to retarget and/or placing a third-party SDK in the app that combines user data from your app with user data to target advertising. See the full list here on Developer.Apple.Com
Below, I go over the background that led to Apple’s decision and the public companies this might affect. As noted below, this should affect companies who offer mobile targeting, such as Google, Facebook, Twitter/MoPub and The Trade Desk. In the interim, it could also affect any applications that use aggressive growth tactics. This list is harder to identify, but Uber and Lyft, for example, are known for spending heavily on user acquisition to drive installs.
For instance, Snap beat on revenue recently yet some of this beat came from direct response ads, such as TikTok driving user acquisition on mobile. In this case, there will be less information about who is taking an action if Snap users do not opt-in on the warning screen. Twitter, as well, pointed towards direct response ads holding up revenue during the pandemic while brand ads have weakened. Yet again, direct response has a new and very serious obstacle.
The silence on this topic from financial analysts on Twitter’s earnings call when many ad-tech companies including two of the world’s most valuable companies rely on the IDFA for a sizable chunk of revenue is odd to say the least. AppsFlyer places mobile app install spend at $80 billion in 2020 and estimates this will reach $118 billion by 2022. This is compared to the total mobile advertising industry worth $241 billion in 2019 and $368 billion in 2022.
The changes will not take effect until September with most devices running the iOS update by October, so no financial impact will be seen until Q4. However, if brand ad spend remains low from the pandemic, and direct response campaigns will now be blind due to an aggressive move against mobile ad targeting, then investors should expect a significant shift in the ad industry by the latter part of the year.
I first covered this in October for MarketWatch with the article, “Governments can’t stop Google and Facebook but Apple can.” The changes to the IDFA are being done under a privacy guise, however, it could be an attempt for Apple to reclaim valuable revenue streams from its ecosystem as iPhone penetration is maxed out. How this would work is not evident right now but its unlikely that a $118 billion market in iOS app install spend has gone unnoticed.
Sign up for I/O Fund's free newsletter with gains of up to 403% – Click hereSign up for I/O Fund's free newsletter with gains of up to 403% – Click hereClick here
Apple and its operating system is the most important governor in the mobile industry with two-thirds of mobile acquisition spend compared to Android’s one-third. If Apple is playing the long-game on reclaiming iOS attribution and measurement to generate revenue, then Google, Facebook, Twitter, Snap and The Trade Desk have plenty to worry about as Apple can undeniably claim this turf.
Background on Apple’s Stance
Apple rarely markets at tech events outside of its own conferences, such as the Worldwide Developers Conference held annually in June. A very rare exception to this policy was made at CES 2019 in Las Vegas when large billboards hung outside the entrance stating, “What happens on your iPhone, stays on your iPhone.”
This was a nod towards Facebook, who Tim Cook has publicly criticized, with its software development kit “Audience Network” installed in 300,000 applications on iOS and Android combined and has seen nearly 200 billion downloads. Google’s AdMob is even worse with installation in 1.5 million applications and 375 billion downloads. (Now consider that users did not authorize or download this software on purpose!)
Photo from CES 2019: Source Beth KindigBeth Kindig
The advertisement was a bold and clear statement on Apple’s stance. Yet, anyone in ad-tech could tell you that what happens on the iPhone most certainly does not stay on the iPhone. Mobile has become a free-for-all in data collection over the past ten years. The device leaks volumes of information through software development kits (SDKs) installed inside every application. Most applications have 18 SDKs, which extends beyond Facebook and Google to include a mix and match of ad software companies although the most pervasive being Google and Facebook who are inside the far majority due to the depth of their data for cross-targeting.
We’ve seen Congress attempt to understand Facebook’s business model (which is not simply social media – you can view my past coverage here around Cambridge Analytica, the Q2 2018 earnings miss, and why free cash flow isn’t enough), we’ve seen the European Union blast anti-trust fines of up to $5 billion and also enforce the General Data Privacy Regulations for their citizens (you can view my previous coverage on this here). These efforts have proven futile software remains pervasive across applications. The conclusion in my October analysis is that privacy depends on an equal and opposite force, and there is only one who remains advertising-free who can possibly take on this challenge, which is Apple.
The concept of Apple pioneering privacy at the client level is not new. Apple began to restrict tracking on the Safari browser through iterations of Intelligent Tracking Prevention (ITP) from 2017 to 2019. As I covered previously in depth, Apple implemented strict requirements, such as having a relationship with the customer within the last 24 hours to place a cookie, and companies have continued to find loop holes.
Unlike cookies on the web, where there is a tag on the browser, mobile identifiers have much stronger tracking capabilities. Apple’s IDFA enables the following: user tracking, marketing measurement, attribution, ad targeting, ad monetization, programmatic advertising including DSPs, SSPs and exchanges, device graphs, retargeting of individuals and audiences.
What investors may not realize is these advertising cash machines are largely dependent on tracking software for the high CPMS (cost per thousand views) and CPIs (cost per install) they charge because they can track actions on a granular level even days after a mobile user has seen an advertisement. The mobile users are not aware they are being tracked by many companies they do not have a first-party relationship with (but the developer or publisher does). These developers and publishers must now obtain permission. Without permission, the inventory on mobile becomes less valuable.
Mobile applications, such as Spotify, Uber, Lyft, and mobile gaming, for example, are also dependent on the ability to track and identify cohorts for user acquisition. This is one reason we see the top line grow rapidly in ridesharing at the expense of the bottom line; these companies are crunching customer acquisition costs and lifetime value (LTV) across specific demographics and then using lookalike modeling to target the demographics with the best LTV.
The ad exchanges who deliver this are paid a handsome premium. Google and Facebook can clearly deliver this as they sit on mountains of data but there are others who use unique identifiers in a similar purpose to target and track across multiple devices, such as The Trade Desk with a unique identifier that will likely come under this restriction: “Sharing a list of emails, advertising IDs, or other IDs with a third-party advertising network that uses that information to retarget those users in other developers’ apps or to find similar users.”
Twitter/MoPub will also be affected as MoPub’s software is inside over 60,000 apps across both iOS and Android. Snap will be to some degree as direct response is critical to the company’s revenue.
Sign up for I/O Fund's free newsletter with gains of up to 403% – Click hereSign up for I/O Fund's free newsletter with gains of up to 403% – Click hereClick here
The opt-in changes to Apple’s IDFA are impossible to quantify but independent mobile analysts, such as Eric Seufert, have called this an apocalypse with opt-in rates likely to hit 0-20% with an article stating that “deterministic, user-level app attribution will cease to exist once [Apple’s] SKADNetwork adoption reaches critical mass.”
Some of this will rely on Google following Apple on opt-in tracking, which did occur in January of this year with the browser restrictions. Notably, iOS sees double the revenue as Android with App Annie reporting $15 billion was spent on iOS in Q1, or $60 billion at an annual revenue run rate, compared to Android’s $8.3 billion in Q1.
More on SKAdNetwork
The new privacy framework from Apple is called the SKADNetwork. Apple’s SKADNetwork API was first introduced in 2018. The concept was to rely on an API to attribute installs rather than the IDFA. Instead, app publishers will receive aggregated, anonymized data from Apple to track the install directly, such as the ad network ID and campaign ID and publisher name.
Apple’s SKADNetwork API represents a new data flow for measuring ad campaigns. Source:Developer.Apple.comDeveloper.Apple.com
As AdExchanger points out, what’s missing will be impressions, creative, remarketing, in-app events, lookback windows, user lifetime value, ROI, retention [and] cohort analysis. Oren Kaniel, CEO of mobile attribution company AppsFlyer says “advertisers will be practically blind.”
There will not be any personally identifiable information or device IDs passed along because the iOS operating system will send the postback rather than the application. This is important for privacy because specific installs will not be attributed to device IDs or personally identifiable information. This also removes the need for mobile measurement partners (MMPs) for campaign performance as they are now redundant (in their current state) with Apple now the arbiter of analytics. Notably, MMPs may evolve to help advertisers sort the attribution data they are receiving in Apple’s new data flow.
Conclusion:
Apple is requiring users to opt-in on every application for the IDFA under the guise of privacy. In 2018, Tim Cook was referencing Facebook when he said, “We shouldn’t sugarcoat the consequences. This is surveillance and these stockpiles of data serve only to make rich the companies that collect them. This should make us uncomfortable.”
Privacy in this age of “data everywhere” is a valiant mission, yet there could be more to Apple’s decision as the company has built a very cash efficient ecosystem with many companies profiting from the $100 billion+ industry of mobile app installs.
There is clear evidence as to the importance of direct response in this quarter’s earnings calls thus far, yet mention of the IDFA has been absent from analyst questions despite being one of the biggest threats the mobile ad industry has ever faced. There is a major disconnect between the first few earnings calls in ad-tech talking up the strength of direct response ads and how people who work daily in the mobile ad industry view the IDFA being deprecated. John Koetsier, a journalist and consultant for Singular who covers this space extensively, believes this is a “huge problem for a massive industry.”
This is a problem for the ad industry because it goes well beyond personal sentiments and niceties around privacy and slow-moving government regulations and pits tech giant against tech giant in the black box world of ad software, user tracking and engineered loop holes. There is little question who will win as Apple goes up against Google, Facebook and many others. After all, it’s Apple’s device, Apple’s operating system and Apple’s app store. The only question is why this hasn’t happened sooner.
In this report we analyze: FFIV, NVDA, MRVL, WORK, BAND, DT, LVGO, LRCX
Please note the glossary of terms and techniques here and here.here and here.
You can access our portfolio here. You can also track in real time our buys/sells/position updates in the forum. If you want to track us in real time, we recommend that you set up alerts to these 3 chat rooms. here. You can also track in real time our buys/sells/position updates in the forum. If you want to track us in real time, we recommend that you set up alerts to these 3 chat rooms.
Last week, we sold our position in FFIV and shifted those funds into MRVL and NVDA. We are buying into strength, and the semiconductor sector had a large breakout signal last week. This will likely be the focus of our attention in the coming weeks.
Also, in this report, we take a look at three potential buy setups forming in DT, WORK and LRCX. We then analyze the uptrend in BAND and LVGO.
The technicals are not as strong as we’d like to see in a tech driven bull market.
We believe we are early to the fundamental story, as well, so will keep this stock on our radar.
Key Price LevelsKey Price Levels
Above $153.50 signals a large breakout to the upside.
Below $120 signals a breakdown of the recent uptrend off the March lows.
We closed our position in FFIV for two reasons: 1) we believe we are early to the fundamental thesis playing out – perhaps a year or more; 2) the technicals are not as strong as other names we track. Overall, other tech names are much more attractive to us right now.
Regarding the technicals, FFIV is struggling to make much progress above the 200-day SMA in black. Also, the Accumulation/Distribution line is still trending down, which signals that smart money is not yet buying into FFIV at current prices.
However, and most importantly, the relative strength indicator is the key tell. This indicator is comparing the price of FFIV to the price of the NASADQ 100. Notice how much stronger the NASDAQ is to FFIV. The same is true of the S&P 500. We simply aren’t seeing the kind of reaction I was hoping to see in such a heavy tech driven uptrend.
For these reasons, we decided to sell out position for a small gain and deploy our capital elsewhere. We will keep an eye on FFIV going forward. If price does break out in a meaningful way, we’ll look to get back in.
Marvell (MRVL)
SummarySummary
Marvell broke out of its base on strong internals.
Smart Money seems to be buying this semiconductor play and so are we.
A retest of the recent breakout zone around $36 would be a healthy move before the next leg up.
Key Price LevelsKey Price Levels
$36 support is key for the recent breakout to hold. Below here and we will have a false breakout.
Below $33 will signal a larger correction could play out.
We placed our stop at $32.60.
Last week, our system flashed a breakout in the semiconductor sector. This had us on the lookout for a similar move in a solid semi choice given infrastructure challenges right now. We added to MRVL just before it broke to the upside because the internals were suggesting this.
The selling volume was drying up as the price made a nice cup pattern up to the breakout price at $36.40. The Accumulation/Distribution line confirmed this move as did the MACD.
We could see a false breakout below $36. To be safe, we placed our stop below the base at $32.60.
Nvidia (NVDA)
SummarySummary
Like MRVL, Nvidia recently broke out from another base.
The MACD flipped to a buy signal.
Considering we are long-term investors and NVDA is one of our favorite stocks, we want to take every opportunity to own this position.
Key Price LevelsKey Price Levels
Below the $380 region signals a false breakout.
We placed our stop for this attempt below the recent base at $355.10.
Nvidia is without question the stock we are most excited about. Our aim is to make this our largest holding, and we began that process last week. There was a small base and breakout at the $380 region. We took this trade with a wider stop just under the base at $355.10.
Potential Buying Opportunities
Slack (WORK)
SummarySummary
Slack is holding the key support level at $31-$30.
There are three buy signals flashing, which support higher prices.
Key Price LevelsKey Price Levels
Staying above $31-$30 is crucial
Above $34.50 will signal a breakout.
Above $40 will signal a large breakout.
Slack is probably my favorite setup going into next week. Notice how the price has respected the $31-$30 region. This level is incredibly important for WORK to hold. Below here, and Slack will have to start over in building a breakout move.
However, for those looking to go long, WORK is providing us with one of my favorite setups – buying just above a key support and placing a stop underneath that support, with internals giving us positive buy signals.
Regarding the positive buy signals, there are currently three signaling within the internals. For one, the RSI is signaling a positive RSI reversal pattern. This signal typically appears in an uptrend, and tells us that the uptrend is not over. Since the March low, we are technically in an uptrend. Furthermore, the MFI is showing positive divergence while the Accumulation/Distribution line is making new highs.
The internals are strong and price is just above a key support. Going long at Friday’s closing prices and placing a stop just below the $30 region will put about 11% at risk.
Dynatrace (DT)
SummarySummary
DT has created a small base, which is setting up for a low risk buying opportunity.
A stop just below the base at $38.90 risks about 10% in case our timing is wrong.
The momentum seems to be diverging from price, but smart money is buying this stock.
Key Price LevelsKey Price Levels
Above $44-$45 signals a breakout of the recent base.
Below $37.90 and the base fails.
$34.50 is the line in the sand for the uptrend.
The above count shown in the chart is the most probable scenario that DT is playing out. If so, it is quite bullish and I believe it is giving us an opportunity to buy more shares. Notice how the price on the daily chart has created a base just below two key Fibonacci levels – around the $43.50-$44.50 region. A break above these levels will signal that the 3rd wave is not over, which is providing us a reasonable risk/reward setup.
This is backed up by the Accumulation/Distribution line making new highs before price. This is a sign that smart money is buying into DT at current prices, and is almost always a great leading indicator.
The only points of concern are the diverging momentum indicators. The MACD is trending slightly down, which is the opposite direction of price. I’m not too concerned about this, because it is not a large divergence. However, we do see a concerning divergence in the MFI. Because the MFI factors in volume, it also can act as a leading indicator.
When the internal signals I use give mixed signals, I tend to focus on price. For those looking to go long, if we get a break out, I’d place a stop at $37.90. If DT hits this level, which is just below the base it created, it could be the beginning of a larger correction. However, a breakout helps confirm the bullish count outlined on the chart.
Lam Research (LRCX)
Summary:Summary:
Lam Research is close to confirming a large breakout.
If the price does break out to new highs at $344.50, we will look to add to our current position.
However, I’m expecting a pullback first, considering the patterns we are seeing within the internals of the stock.
Key Price Levels:Key Price Levels:
$344.50 will be a breakout to new highs.
The below support to monitor is $309.
LRCX has been tracking a trend channel since the March lows. Today, LRCX is sandwiched between the 8-day EMA in green and the $344.50 breakout price to new highs, which also coincides with the upper region of the trend channel. We are at a tight inflection point where price will break out, signaling a buy, or we will get a correction before this breakout occurs.
There are notable divergences within the internals. The CCI is making lower highs while price makes higher highs. Also, the RSI cannot breakout above the 70 line as price keeps rising.
If we look at our volume indicators, the buy volume is decreasing as prices rise, which is telling us that buyers are drying up at current prices. Also, the Accumulation/Distribution line is signaling that smart money has moved on from LRCX at current prices, based on the participation at the February highs.
We love LRCX, and expect big things from this semi in the future. However, based on what the internals are telling us, I’d expect LRCX to pullback, creating a nice cup and handle pattern before giving a clear buy signal above new highs. However, if we do get a clear breakout above $344.50, we will happily take that signal to buy, as well.
Analyzing the Trends
Bandwidth (BAND)
Summary:Summary:
There are numerous signals flashing warning signs for Bandwidth right now.
The one bullish signal is how price has broken above the upper trend channel.
Until we see the internals reset or price breakout with force, I will be hesitant to add.
Key Price Levels:Key Price Levels:
Resistance levels to track: $145, $167
Key support that must hold for a continued uptrend is $124
We initiated our first entry with Bandwidth last month. Since then it has been in a steady climb in the right direction, returning a little over 10%. However, it’s been doing so on weakening internals, which gives me pause to add until we see a pullback.
First off, BAND is tracking a clear trend channel in gray. Notice how succinctly the price has tracked this channel. After bouncing along the upper range of this channel, BAND has briefly broken out.
A breakout of a trend channel can go two ways: 1) it can be a brief spill over just before a notable correction. Or, like Docusign, it can move parabolically above the channel, making a new trend channel to track. I’m leaning towards the former simply because of the internals flashing weakness.
For one, the Accumulation/Distribution line is not making new highs with Bandwidth. In fact, it is trending down. Volume patterns along with the MACD and MFI are providing strong negative divergence signals. This suggests that the price at current levels is on weak ground.
Anything is possible in this market, and if we see, for example, BAND gap up from current levels, resetting the internals, we will buy into that strength. But, until this signal, or one similar in strength occurs, I’d look to lower levels to either add.
Livongo (LVGO)
SummarySummary
We are up 40% in one week on LVGO.
We are taking the stops off this position and looking to build.
There are several warning signs that are giving me pause to add more right now.
Key Price LevelsKey Price Levels
$110-$111 is the resistance level that is bottling up LVGO right now.
A break above here and we will look for the $120 then $131 region for the next resistance zones.
The recent gap between $85.50-$82.30 will be the key support for a continued uptrend.
Last week, Livongo was flashing a number of buy signals. We used these signals to go long just before LVGO jumped 40% to the upside. We are now using this cost basis to build a long-term position. This is a stock that we want own going forward and we will use our recent entry to build this position. That means we are removing the stops on LVGO, and will look to build into strength or on the next pullback.
This week, I am not seeing an entry worth the risk. In fact, there are a number of warning signs that we could be close to peaking. For one, notice the three gaps within the uptrend off the lows. In technical analysis, we regularly see patterns occur in 3’s. Regarding Gaps, there are three types of gaps: the breakaway gap, which happens at the beginning of the uptrend, the runaway gap, which happens around the middle of the move, and the exhaustion gap, which happens around the end of the move.
We definitely have a breakaway gap and a runaway gap with LVGO. The question remains, did we just see the exhaustion gap? I never bet against strength, but seeing these three gaps, symmetrically shown on the chart does give me pause.
Secondly, LVGO is clearly in a 3rd wave, hence the strength of the move, on peak technical strength with very few places for entry. This is the key sentiment of a 3rd wave move – and it’s what we always want to participate in. Another key feature of 3rd waves is that they typically peak between the 138.2 – 176.4% extension of wave 1.
Today, LVGO has stretched to the 238.2%, which is not uncommon in high flying tech stocks, but it is worth noting how stretched it is. If price does break above this extension at $111, the above resistance to note above is first the $120 region and then the $131 region.
However, price has struggled for two days to break above this extension at $111. If we do get a pullback at this point, the $82-$83 region will be the crucial line in the sand for a continued uptrend. Below this level will signal that we are in a 4th wave, which we will use to load up on LVGO.
Over the past month or so, we’ve been building an index for our coverage. We realize there is a lot of research on this site and also quite a few trades. Fundamental analysis and all entries/exits are indexed by stock ticker and company name here. The index is fairly exhaustive and we refresh it every two weeks.
Quick Note on Apple’s IDFA:
Before I go into July convictions, I want to mention some news from Apple this month that is quite important for all ad-tech investors to know. The “Identifier for Advertisers” known as IDFA was changed in the recent iOS release to where it will now be more difficult to target and track users. This is much big news than the ad boycotts.
The moat that Google and Facebook have enjoyed comes from having first-party relationships with nearly every user who has a smartphone. This is called first-party data and is a loophole used to collect data even after a user is on another property where there is no relationship. For instance, Facebook uses first-party data to power ads on streaming service Hulu, but at this point, the first-party relationship does not exist with Facebook’s social network once someone is on Hulu, and this is done without explicit consent (by both Facebook and Hulu). Easy-to-navigate opt-ins are not offered, as it’s unlikely Hulu viewers, who pay for the app, would want Facebook accessing their viewing data if they had to opt-in.
Another snippet here …
As of now, Apple has no plans to remove the IDFA, although for a company that insists it is a protector of privacy, at the very least, there should be better opt-ins. The changes made with ITP on the browser may not have had a big effect. However, the implications of Apple restricting IDFAs on iOS becomes more serious with the iPhone having a global penetration of up to 20% of smartphone sales.
Even companies that have fancier IDs, such as Trade Desk with its Unified ID, relies on IDFA to some extent, and any changes to IDFA would limit the ability to collect and stitch together fragments about the user.
That said, perhaps Apple should have addressed those issues before hyping its privacy efforts. As of now, Apple is enabling a lot of tracking with the IDFA, and this may not be an appropriate compromise for attribution as users are completely unaware their activity can be tracked across the entire device.
Furthermore, users don’t have any method for approving the software development kits, from Facebook’s Audience Network or Google’s AdMob.
I also covered Apple’s Intelligent Tracking Prevention for the Safari browser in the Google PDF here.
This is not good news for Google and Facebook. How this affects The Trade Desk is something I will make sure to look into. When first predicting this would happen, it seemed The Trade Desk would also be affected but now that this did happen, I need to review the iOS 14 changes before making any hard and fast conclusions. It would be inconsistent for Apple to allow TTD’s unique identifier long-term as the goal is to get rid of these tracking IDs without explicit consent.
There are also some apps this could potentially affect. I need to look into Spotify, for instance, and any others that rely on advertising. Basically, advertisers may not want to pay as much if there’s less information on who they are targeting.
I’ve covered Facebook’s unauthorized tracking methods for a few years including around the Facebook’s Cambridge Analytica fall-out and followed up a few times here and here.
July Update: Reiterating Two Trends
If you are newer to the site and haven’t read our May Convictions Update, you can find this blog here as it expands on a few more stocks on our coverage list and trends we are following. Quite a bit from this update is still pertinent.you can find this blog here as it expands on a few more stocks on our coverage list and trends we are following. Quite a bit from this update is still pertinent.
After the fantastic run-up we saw off March lows, even the most opportunistic tech growth investors are bracing for a pull back. We may get one or we could march onward to new highs. My goal is not to make predictions but to be prepared for all scenarios.
Despite cloud software being a hot category, it helps to break this down as we move into the second half of the year with elevated valuation multiples, which are at a record median of 12.9 EV/Forward Revenue (typically the median SaaS is around 10 EV/Forward Revenue, at most). Shopify and the top 10 are averaging 35.3.
Below, I shed some light on two major trends that I think still have some runway left (regardless of bear or bull market). I’m choosing one trend in the high valuation category and another more varied trend that should gather strength as we go along this year.
The first trend is productivity and also cloud-native communications. I did cover this in the May update but the mark of a good thesis is that it shouldn’t change very often.
This is more of an offensive group with rapid top-line growth. I also discuss infrastructure stocks across the board (not only cloud) and some of the strategies around those recommendations as a defense for longer-term horizons.
When I say offense, what I mean is that I think it’s great to continue advancing in trends where there is momentum but it’s also good to look at trends that aren’t in play yet as a means of generating more gains on a long-term portfolio.
Productivity or Cloud Communications: Offense/Momentum
When you think of productivity tools, you should think of eliminating the need to endlessly look for an email you can’t find, engage on long threads with many people CC’d in nested messages, when you have to dig up contact information, switch between apps to reference conversations, or when teams are attempting to collaborate but things get lost, forgotten, or become disorganized and siloed.
There is such a clear need for this on a cost-benefit level, that this category is leading all of cloud right now including cloud infrastructure on spending. This is because the products are cheap compared to what productivity tools and cloud communications can save in regards to time and efficiency.
Cloud productivity tools claim the majority of cloud budget allocations, and will increase from 10% in 2019 to 14% in 2020. The percentages are even higher among smaller businesses with up to 18% spent on cloud productivity tools in companies with under 500 employees.cloud budget allocations, and will increase from 10% in 2019 to 14% in 2020. The percentages are even higher among smaller businesses with up to 18% spent on cloud productivity tools in companies with under 500 employees.
Meanwhile, the media and anyone who missed out on this trend will have you believe the growth is random or temporary. There are obvious stocks such as Zoom Video and Slack that fall into this category. I’ve also covered Microsoft Teams although obviously not a pure play. However, when I feel strongly about a trend, then I will expand to include more stocks within that category.
This prompted us to include Twilio (PDF from December but reiterating this) and Bandwidth (new coverage in June). Twilio has underlying financial strength that institutions can get comfortable with. The company also has a strong moat evidenced by its high retention rate and revenue growth (that goes beyond the 10% accretive revenue from SendGrid that rebounded from 38% to 58% from Twilio alone).
Twilio’s moat is high switching costs as to switch from Twilio, you might have to port numbers, negotiate contracts with a new carrier, determine if the carrier covers all of the countries needed for your applications and whether the call quality and sending SMS is reliable. Uber might have the capability to do this in-house and/or to source many different vendors in different regions very few applications will have this size of team.
Regarding Bandwidth, if the company can beat and raise on the next earnings report, then I think we will see quite a bit of momentum here due to the company being perfectly situated across all three mega players in cloud native communications at scale. You can read this PDF here. Not only does Bandwidth serve every competitor, but all three (Microsoft, Zoom and Google) companies are capable of competing with telcos for B2B voice.
Notably, Bandwidth requires the video conferencing trend to extend to audio calls, which I believe it will. When I drive by the empty office buildings in San Francisco including high rises and SMB shops, like attorneys or dental offices, I wonder why any of them would have a traditional phone bill rather than a cloud-native phone system. There is really no need for communications equipment or telecommunications services. Cloud voice is cheaper, can be scaled depending on immediate needs, and can be built into collaboration platforms or used as a stand-alone.
On that note, I also covered Teladoc recently and this was put on the top of the list for entry. When I look at the momentum list, this one stands out to me.
Telehealth is the trend that shows the most evidence of overnight, digital transformation ushered forth from covid-19. According to a new report from S&P Global, telehealth patient volume has increased 3,000 to 4,000 percent during the early months of the Covid-19 outbreak.
In times of indiscriminate buying and indiscriminate selling, things can get noisy. As we continue to focus our efforts on breakouts that become buy and holds, we believe this is a trend that will outperform and are eying an entry despite a run-up in some names.
According to the report from S&P Global, providers that rarely employ remote care options have switched over to telehealth services. Facilities such as NYU Langone Health saw 7,000 video visits per day or about 100,000 video visits in April compared to 300 visits per month pre-pandemic.
The company also has a large and immediate addressable market with competitors attempting to quickly pivot. I’m actually encouraged by this because venture capitalists are great at identifying trends with long runways (i.e. I am not discouraged by the competition here at all). I think Teladoc has too much of a first mover advantage and there is a need for a company with credibility due to the urgency of the situation.
Livongo makes sense too, especially for growth around the behavioral health and inroads to remote monitoring. Similar to the above, we have a company moving into a new market and innovating on new territory.
Regarding Slack, I covered this in-depth on the May Convictions blog and my thoughts on this haven’t changed. (Getting a lot of questions on Slack). Please read that update for more information on why the lack of momentum right now doesn’t bother me long-term.
Infrastructure: Defense/Diversification
The one area where I am very bullish is infrastructure and the need for better connectivity. There are many ways to look at this microtrend but the way I’ve chosen to do this is all encompassing. Whether it’s hyperscalers, edge computing, virtualizing networks, lower latency/faster application delivery, increased internet speeds for the end user or if you choose to think of this in buzzier words like “5G” and “Artificial Intelligence” … all of the above is very interesting to me right now from a longevity perspective (i.e. not sure what the July returns will be but looking for returns next year or next five years).
There are two reasons why this is important right now. The first reason is that we have maxed out our capacity and what we are capable of with 4G and our current wireless infrastructure. In July, I will dedicate more time to covering edge computing. This is a topic where I began holding interviews in Q1 2019 with companies like Mutable and Schneider Electric – Mutable is the AirBnB for hyperscalers and Schneider is tackling the power and cooling issues edge computing will need to overcome with micro data centers.
In a nutshell, the purpose of edge computing is to bring the power of cloud computing closer to the device. This goes beyond delivering content faster or small edge applications. This is about opening up new use cases with an overhaul to the current paradigm to bring data and compute closer. No company today is truly doing edge computing the way this will be done to open up new use cases in the next three to five years. I plan to cover this in-depth both editorially and also for my premium readers, as well – probably mid-to-late July.
The second reason infrastructure is important is that we will lag China if we are not careful about upgrading our infrastructure for new use cases; most especially artificial intelligence. For about a decade now, leaders at security conferences have been discussing why wars will no longer be fought on the ground, rather they would be fought in cyberspace. Improving our infrastructure is not simply a convenience for streaming faster Netflix movies, rather it’s a matter of the United States remaining a world super power. Regardless of political opinions, China is gaining strength through infrastructure. This is what the Huawei ban is about.
Therefore, we should see serious pressure from a wide range of demand: the government for defense purposes, enterprises who want to stay competitive, SMBs who want to scale, startups who want to innovate including a new class of graduates who develop AI applications, and the end user who will consume a wide range of products and solutions that come from the new AI and 5G hype cycle.
What lies beyond the bigger infrastructure players (Amazon, Google, Microsoft) is a big mess of hardware companies, semiconductors, price wars, high capex, exposure to trade wars and geopolitical tensions and earnings that can often miss the mark. No wonder everyone likes cloud software!
With that said, it’s a bit contrarian to recommend companies with 7% or 10% year-over-year revenue growth to tech investors who are accustomed to a minimum of 40% and upwards to 100% revenue growth for their top performers. I explain below why my counter-trend analysis on individual stocks may be bold in this momentum-frenzy environment but important to consider.
Keep in mind that when an infrastructure company does well, it can become a 10-bagger with many restful nights. These typically aren’t momentum stocks and that has some major benefits. You can think of cloud software as hitting singles and doubles that keep the game going but a great infrastructure stock is a grand slam that creates a lasting and rewarding impact.
For example, I can rest easy with my Nvidia and Microsoft calls from 2018 knowing these companies will stand the test of time. In fact, I believe they will both be among the world’s most valuable companies in ten years from now. The switching costs are so high and moat so defensible that there’s little question or debate as to where the returns will go (i.e. up and to the right). I covered a similar concept in my recent Microsoft article that pointed out how hundreds of cloud software stocks funnel into cloud infrastructure (it’s like the neck of a funnel).
Point being, imagine if we can pick the right infrastructure stocks this year with 5G, artificial intelligence and cloud computing applications built on these companies over the next decade? That’s what I’m doing when I cover some of the stocks below and what I’m doing when I cover stocks that show very little revenue growth now but have a serious shot at being a foundational piece to the new paradigm.
Keep in mind that out of ten infrastructure stocks, maybe I will nail five and the other five will need to be considered part of the process. This stuff isn’t obvious basically and it’s complicated. If you want a higher success rate, then momentum stocks and more temporary gains are the only way to go. This can be accessed through my most recent cloud update: “Top Cloud Stocks for H2 2020.”
Marvell:
Marvell is at the center of many important trends with a $23 billion market cap. One thing to keep your eye on is Nokia and Samsung ramping up to provide telecom infrastructure where Huawei has been banned.
Here’s a recent press release from Nokia and its partnership with Marvell. The new partnership will provide customized chips based on processor designs by ARM. The new chipsets will be placed in Nokia’s 5G radio access technology. These chipsets will replace the field programmable gate arrays (FPGAs) that Nokia chose for its products and turned out to be very expensive. According to Barclays, Nokia was also affected by Intel’s delay on the 10-nanometer (which we covered on the AMD report on this site – see below). This led to the nasty $6 billion post-earnings plunge Nokia saw in the its market cap.
Nokia’s products based on its system-on-a-chip technology made up 10% of shipments in 2019 and are expected to grow to 35% by the end of 2020. By 2021, Nokia’s SoC and infrastructure processors, currently branded as ReefShark, is expected to reach 70%.
In addition to Nokia, I outlined that Samsung could also grow quite rapidly from the fallout with Huawei and included the following chart.
Samsung looks tiny here but that doesn’t tell the full story as Samsung reportedly took first position in global sales in the first part of 2019 with 36% sales compared to Huawei’s 28% and Nokia’s 14%. Also, Huawei and Samsung are the only end-to-end providers of 5G infrastructure.
Marvell supplies components for 5G base stations and both Nokia and Samsung are customers. In turn, Samsung works with Verizon, AT&T, SK Telecom, and KT. Samsung has been able to capture business that Huawei has lost, and the level of this future growth is an important catalyst.
According to Gary Mobley of Wells Fargo, Marvell can generate $600 million in incremental revenue from 5G base station customers compared to the $2.9 billion over the past four quarters (20%) of revenue.
Marvell management confirmed they expect $600 million per year from 5G revenue on the last earnings call. The speed of this growth depends on Samsung and Nokia’s market share.
Marvell worked with Samsung on 4G infrastructure. These two companies are now collaborating on delivering compute power for massive MIMO beamforming. You can access more information on this in the 5G Part 1 PDF.
“Massive Multiple Input and Multiple Output (MIMO) sends the data through multiple data streams called layers, which increases parallelism and throughput. MIMO helps avoid lost signals with multipathing, which allows the base station to send multiple copies of the same signal for increased redundancy. Note: The antenna array is one fundamental change to 5G infrastructure. The initial 5G rollout will use existing cell towers, however, newer, dedicated 5G network infrastructures will require many more antennas than used in previous generations.
Beamforming: Rather than broadcast all of the signals in all directions, telecommunications beamform the signal towards the receiver. This helps to minimize interference and increase the data rate. Wi-Fi routers employ beamforming now, and this will become an essential component for 5G. The FD-MIMO uses both horizontal (Azimuth) and vertical beamforming (Elevation).”
Intel plans to also extend from the core through access to the edge to compete with Marvell, yet Marvell is more experienced in the access network. According to this analyst from Moor Insights and Strategy, the decision between the x86-based SoC from Intel and the Arm-based SoC from Marvell will “last for multiple generations” due to 5G being more software based and written for one or the other.
In my opinion, the reward for owning Marvell is taking a calculated chance the company locks up the 5G access network with Arm-based SoC. To me, there is enough evidence this can happen and is well worth the risk – especially as Nokia has already experienced a setback from Intel.
AMD:
AMD has accomplished a feat of innovation and progress against the 800-lb gorilla, Intel. This company is exhilarating by crushing the competitor on performance and price (in my little world, it’s exhilarating, anyways!). Here’s what I said in the AMD PDF Report:
“Intel is playing catch-up with a comparable 10nm release planned for Q2 or Q2 2020. The Ice Lake Xeon Scalable Processor with 38 and 48-core options could be pushed into 2021, according to a Wells Fargo note. By the time Intel catches up to AMD’s August 2019 release of the 7nm Radeon and Rome processors, AMD will likely be releasing its next feature line codenamed Milan.
It’s important to note that Intel’s upcoming 10nm can be comparable to a 7nm chip, as stated by Taiwan Semiconductor as the naming of chips is becoming less important over time. One area where Intel’s chips outperform is they can draw up to 300 watts compared to AMD’s maximum of 225 watts.
However, marketing names aside, AMD has blatantly stated the second-generation EPYC server processors had 1.8 to 2 times the performance advantage of Intel’s Xeon processor line and is half the cost in some instances. Companies like Hewlett-Packard, Google and Twitter were part of this launch.”
There are a few reasons AMD could become the “it” stock again. The first is the launch of the 7 nm EPYC CPUs which are expected to hit in August. Mercury Research believes AMD can grow market share from the low single digits to the low teens. Next Platform thinks AMD could hit 20 percent of market by 2021:
An article in Next Platform frames AMD’s forward data center revenue well: ‘The question is can [AMD] double it again in 2021 and get what would be its rightful share of datacenter CPU capacity, which should be somewhere around 20 percent of the pie … We think that given the desire for competitive pricing in the datacenter and the issues that Intel has had in getting its 10 nanometer “Ice Lake” processors in the field, there is a very good chance for AMD to have that 20 percent share in 2021.’
AMD’s forward revenue guidance for 2020 is very strong at $8.68 billion under the assumption the data center will be about $1 billion. In the financial analyst day that took place earlier this year, AMD provided projections of $14 billion in annual revenue by 2023 based on 20% CAGR (slide 11). The company placed the projection for data center revenue at 30% of total sales by 2023 (slide 12). Compare this to $6.73 billion in revenue for 2019.
This summarizes my thoughts:
To recap, I like cloud infrastructure and chips powering cloud IaaS for the current public cloud market (now), the near-term growth in the hybrid market (next 1-2 years) and the AI market (3-5 years). To me, this is well diversified across budgets and enterprise needs.
F5 Networks:
The analysis on F5 Networks hinges on the company expanding beyond the partnership with Rakuten Mobile to virtualize radio access for reduced capex. Here’s what the PDF said about this partnership:
“Rakuten is Japan’s biggest mobile virtual network operator (MVNO). In early 2019, the company announced plans to build a network in 12 months without significant capex. The reduced capex is made possible through a cloud- native network.
The goal is to shift towards Network Functions Virtualization (NFV) technology, which uses the principles of cloud computing to create service delivery platforms “with greater agility and customization.” The end result is a Radio Access that is virtualized and running as a virtual network function on a private cloud. You can read more here and the press release regarding Rakuten’s partnership with F5 here.more here and the press release regarding Rakuten’s partnership with F5 here.
What F5 proposes is to use a mix of public and private cloud (i.e. hybrid) to optimize networks through the concept of network slicing. Network slicing is the practice of running multiple networks as virtual independent operations on common infrastructure.
The main thing to understand here is that our current infrastructure does not allow for computational-intensive tasks and workloads to deploy with low latency. The solution is network slicing, which is a way of using multiple operators and dedicated or shared resources to deliver processing power, storage and bandwidth.
This will help 5G networks serve customers with different needs ranging from automotive to manufacturing.
Connected vehicles
Robotics automation
Enhanced security can occur with authentication at the network slicing level
IoT can have different slices for different IoT users
Live broadcasts including AR/VR – or even just cloud gaming
Network slicing can help continuity in a fashion similar to international roaming. Rakuten is getting a head start by using a software-defined cloud network to decrease capex and scale quickly. This moves away from high-capex hardware infrastructure to more of a cloud computing architecture. F5 is essentially working at the telco level to help further the footprint for 5G service.
This month, according to F5’s more recent announcement, Rakuten mobile was increasing the partnership to include application security services.
The takeaway is that what Rakuten and F5 are doing is quite ambitious. If they nail this, expect others to follow. This sums up F5 well from the PDF:
However, as companies seek to scale application deployment, there are infrastructure-level issues that cloud software companies will struggle to solve. F5’s experience with hardware and a pivot towards software could be a winning combination. This goes beyond end-to-end application infrastructure, where the company already has a solid reputation (i.e. Datadog and IBM’s RedHat both favor F5 as a partner here). F5 is also doing a good job of staying in front of the trends of microservices and the Kubernetes platform.
Lam Research:
Lam Research is a cash flow machine and has serious top-line growth potential, as well. The market right now is driven by momentum but when bottom lines start to matter again, Lam Research will make for excellent diversification in high growth portfolios.
“Applied Materials reported $14.6 billion in revenue last year yet similar cash reserves of $3 billion as Lam Research with $9.6 billion revenue. The 5-year free cash flow growth rate for Lam Research is 38.12% compared to Applied Materials at 12.47%. The 5-year free cash flow growth rate for KLA is 7.52%. This is a significant spread on free cash flow and the comparables.”
And regarding top line growth:
According to the recent investors day presentation, the company expects revenue to reach $14.5 billion to $15.5 billion for 2023/2024. This assumes a water fab equipment market assumption of $60 billion up from a market of $46 to $47 billion in the current year. If the market is more bullish by this time frame, the addressable market estimate for WFE is $70 billion with Lam Research’s revenue at $17 billion and EPS of $36.
In 2019, Lam outperformed water fab equipment growth (WFE) 2:1 with CAGR of 16%.
The markets that Lam serves are set to rebound:
“According to IC Insights, NAND Flash sales declined 27% in 2019 and will rebound at 19% in 2020. DRAM sales declined 37% in 2019 and will rebound 12% in 2020.”
Future catalysts for Lam include the Sense.i platform that produces a 50% improvement in etch output density. Upgrades to 3D NAND have been an ongoing catalyst.
Lam’s moat comes from the lead the company has with service contracts and customer collaboration. Lam’s customers include Micron, Samsung, SK Hynix, Toshiba and TSMC.
Datadog and Dynatrace:
Although Datadog and Dyntrace are lumped in with cloud software right now, I view their revenue as more resilient as it’s tied to infrastructure monitoring. These are companies I reiterated in April in two updates that I was keen on them for the solid trend of cloud IaaS.
In addition to the productivity and cloud communications trend above, these two stand out from the H2 Cloud Stocks momentum list as they fall into the infrastructure trend, as well.
Inseego creates more connectivity between the device and the tower. The fixed wireless access market is expected to grow 98% CAGR between 2019 and 2026. That growth is eye-popping. We originally covered Inseego for 5G but the coronavirus and stay-at-home have ignited the company for 4G uses. About two weeks ago, we wrote at the top of the market update that Inseego will do well if stay-at-home ordinances are implemented again. I
“The HEROES Act was passed by the House and the bill is now moving towards the Senate, where the $3 trillion may not pass. Regardless, a bipartisan provision in the bill is the “Emergency Connectivity Fund” with $1.5 billion going towards the funding for “Wi-fi hotspots, other equipment, connected devices, and advanced telecommunications and information services to schools and libraries.” There’s another $4 billion to be allocated to emergency broadband service.”
The takeaway is that Inseego should be a nice hedge if states start to implement stay-at-home orders again. Will that lead to a bear or bull market? I’m not sure but Inseego should do well either way.
Atomera and Boingo:
These companies are high risk-high reward as they are dependent on partnerships. Atomera is very volatile as it’s based on Phase 4 contracts. This is an all-or-nothing situation with a decent management team trying to solve engineering challenges for enhancing transistor capabilities and reducing chip size. The Investors Presentation in March stated the company is engaged with 50% of the world’s top semiconductor market.
Management stated on the recent earnings call that the Phase 4 deals could be delayed. This is one to watch. High risk/reward would be entering prior to Phase 4. Lower risk/reward would be waiting for a Phase 4 deal. I favor the second scenario because if the team can make this happen, then there will be a lot of runway left for the stock.
Boingo defies financial analysis and relies entirely on product. Essentially, Boingo solves the issue of indoor connectivity for 5G for arenas and large spaces. Boingo’s main competitor was Huawei, who admittedly had a better product but at the cost of security concerns. Now that Huawei is out of the picture, Boingo becomes an even more obvious choice for Verizon, AT&T and T-Mobile. The risk here is if the ordinances against big group gatherings from the coronavirus has shelved this concern (i.e. arenas are closed for now).
On that note, Qualcomm can charge more for 5G chips. Analysts estimate 5G smartphones will offer Qualcomm the opportunity to sell 50% more dollar chip content per device versus the prior 4G generation, due to the increasing complexity and higher pricing. Dollar chip content refers to the dollar value of chips that a device holds. (source: Barrons).50% more dollar chip content per device versus the prior 4G generation, due to the increasing complexity and higher pricing. Dollar chip content refers to the dollar value of chips that a device holds. (source: Barrons).
There are debates over how significant 5G will be for consumers and if they’re prepared to pay for upgraded smartphones. Regardless, Qualcomm is well-diversified across 5G modem chips, 5G New Radio (NR) mmWave private networks, XR devices for AR and VR, and cellular vehicle-to-everything (C-V2X) for autonomous driving.
Micron:
We’ve covered Micron on this site. The company had a nice earnings beat this week with strong guidance. The company forecast adjusted fiscal fourth-quarter earnings of $0.95 to $1.15 EPS on revenue of $5.75 to $6.25 billion. Analysts were expecting earnings of $0.79 EPS on $5.46 billion revenue in the upcoming quarter.
In the current quarter, the company beat on revenue and missed on EPS. Revenue came in at $5.44 billion with EPS of $0.71 EPS compared to analyst expectations of $5.27 billion in revenue and EPS of $0.75.
My main hesitation with Micron is that the company is third behind Samsung and SK Hynix on NAND/DRAM. With that said, the company is priced better when looking at PE ratios and EV/sales compared to Lam Research.
As most of you know, I’ve covered Roku very (very) extensively. We are early to this trend and the market is confused by this. I had said on a previous occasion the stock could become a 10-bagger. You have to think very long-term as Roku does advertising-on-demand (AVOD). The market is confused because Netflix does SVOD (subscription video-on-demand) which has been around for 10-15 years. AVOD has been around for 2-3 years.
Here is a message I recently wrote on Roku explaining some of the more recent questions:
The reason I mention Pay TV ad dollars is because the market mistakenly thinks OTT is very mature bc Netflix has been around awhile. The AVOD market is quite nascent. Rather than look at cord cutters, I am looking at the migration of ad dollars to judge where we are in the cycle (i.e. very early).
My understanding is Roku is covering all angles from the OS to the app channel to the demand-side ad platform. It’ll be tough to outsmart Roku’s management from a strategy perspective. If Google just throws a lot of weight into this (and cash) then I am okay with Roku being number two due to the size of the opportunity as a pure play.
Regarding global, Roku has a really solid OS for very cheap. They put TCL on the map not the other way around by providing TCL with a super solid connected TV operating system. I don’t think Roku needs one manufacturer that badly.
Globally, there are lots of cheap television manufacturers that should view Roku as an asset to boost sales.
On the topic of Netflix, I think this company could become very strong through the coronavirus situation at a time when Disney is relatively weak. If you have questions on Netflix, feel free to ping me on the forum under the stock category.
If you’re new to the site, check out Chainlink for blockchain. Might be trading a bit high right now but blockchain smart contracts are very interesting and a trend we are very early to cover.
Thanks everyone! Really appreciate the readership and your support for this website.
About a week ago, Dan Shvartsman from Seeking Alpha interviewed Knox Ridley and I about the Zoom call we made last Fall, the trade made In January in the low-$60s, and the subsequent trades made in March in the low $100s and mid-$100s on our premium site. We discuss whether the company’s valuation matters now, and how our research site determines if we should hold on or add to the position amidst the rally.
We also discuss the hard questions about Zoom, including the security issues the company faced in April and why removing friction from video conferencing is what led to my high conviction prior to the coronavirus.
The interview touches on the cloud software market as a whole, where I discuss why I’m cautious on Fastly for its edge computing product despite the stock price being neck-to-neck with Zoom Video. I also expand on my strategy for analyzing tech stocks, including why I lead with product first, as well as understanding early adopters and user behavior.
Knox explains his technical strategy regarding Zoom and the importance of letting your winners run. He also discusses other topics, including the effects of the coronavirus, the cloud sector, and also touches on Datadog.
Knox’s strategy is to open trades on breakouts, while maintaining a very tight stop loss. He sets up a 5% to 10% risk stop loss, but does not put trailing stop losses on winning stocks.
In this report we analyzed: INSG, TWLO, DT, ROKU, AMD, LVGO, TDOC
Please note the glossary of terms and techniques here and here.here and here.
You can access our portfolio here. You can also track in real time our buys/sells/position updates in the forum. If you want to track us in real time, we recommend that you set up alerts to these 3 chat rooms. here. You can also track in real time our buys/sells/position updates in the forum. If you want to track us in real time, we recommend that you set up alerts to these 3 chat rooms.
Twilio (TWLO)
We will look to add on the coming pullback, which we expect to be relatively shallow as of now.
Summary
Twilio has shown great relative strength in spite of broad market weakness.
Negative divergence in the MACD is suggesting a pullback is near.
I’m expecting the pullback to be relatively shallow and to bottom well above the earnings gap.
We will lower our stop to $186.90.
Key Price Levels
Below Support levels to monitor: $211-$210, $190, $177-174.
A break below $152.40 will make closing the large gap a likely outcome – we want to avoid this which is why we have the stop outlined above.
While the S&P 500 is down over 7% since it recently topped, Twilio is up about 16% in the same time frame. This is the type of relative strength we look for in market downturns. Furthermore, it’s worth noting the base that Twilio has built during this period of market weakness. We have noted this base in the chart by the green dotted arc below the recent price movements.
Since gapping up on its last earnings report, TWLO has slowly drifted higher towards the $211 resistance on decreasing selling volume. It then broke through this level, and has had a tight consolidation above the now $211 support region. Volume is starting to spike up as Twilio reached new highs above this consolidation point. We will now want to see a strong follow through for confirmation.
Regarding the Elliott Wave count, which can provide a general path forward, It is possible that TWLO is in the final 5th wave (light blue) within the larger degree 3rd wave (dark blue). This would explain the negative divergences we are seeing in the MACD, and it’s what I believe is actually going on. In short, if this is true, it helps support a relatively shallow pullback.
TWLO is due for a minor pullback that should consolidate above the gap. We will lower our stop on TWLO to the closing price of $186.90 in order to give it a little more room to breathe.
Inseego (INSG)
A strong break above $11.30 and we will add to our position in INSG.strong break above $11.30 and we will add to our position in INSG.
SummarySummary
Inseego has built a solid base, which I noted by the blue arc below the recent price movements.
It’s formed an inverse head and shoulders pattern just below $11.30.
A strong break above $11.30 will confirm the next leg up.
We will look to add on the breakout.
Key Price LevelsKey Price Levels
$11.30 is the primary resistance level to watch.
Below $9.20 signals a break of the base INSG built and lower levels ahead.
If $9.20 breaks, look to $7.75, $7, $6.50 for a potential bottom.
In our May 17th report, we noted the positive divergence forming in INSG. Because of this, we went long, and since then we are up about 16%. Further encouragement has followed due to the solid base INSG has formed above the 55-day EMA (in red).
The price is now approaching the $11.30 resistance while the MACD is coiling. This is the type of internal pattern we see before the next move up. Furthermore, the price has formed an inverse head and shoulder pattern below this level, to further build the bull case.
We are in a period of market weakness, which will be a hurdle Inseego will need to continue to overcome. As long as it holds the $9.20 support, the base INSG has built will remain intact. Below this level, and the yellow band will come into play between $7.75 – $6.50.
Roku (ROKU)
A strong break above $131.50 is a new signal to go long. A break below $113 is the signal to target the $102-$89 support.strong break above $131.50 is a new signal to go long. A break below $113 is the signal to target the $102-$89 support.
SummarySummary
Roku has spent 7 days above the previously noted resistance levels, which is now support.
Roku is also forming a solid cup and handle pattern.
It is retesting these levels now and setting up for a breakout move above $131.50.
A break below $113 signals a failed uptrend.
Key Price LevelsKey Price Levels
$131.50 is the primary resistance to watch now.
$113 is the main support.
Below $113, and $102 – $89 region comes into play.
Roku has broken above the downward trendline in red and the 200-day SMA in black. These two levels have kept Roku bottled up for most of this year. Recently, it has closed 7 days above these key levels and stayed between 14%-4% above these levels. This lends to the case that this recent move up is not another fake-out.
The recent move has also given us the final confirmation level to signal a large cup and handle pattern that will be confirmed on a break above $131.50.
As long as the $113 support level holds on any pullback, the bull case for Roku can hold. However, below $113, and the green target box comes back into play.
AMD (AMD)
AMD is setting up for another buy around the $49-$47 range.
SummarySummary
AMD is reaching an inflection point between a relatively large breakout or breakdown.
It is approaching a large cluster of important supports with positive divergence showing up on the MFI.
We will look to take advantage of this setup.
Key Price LevelsKey Price Levels
Key resistance that will signal a potential breakout – around $57.
Key support that will signal a breakdown is the 200-day SMA, which is around the $44.50 region today.
Primary target zone for a favorable risk/reward trade will be in the high $48 region.
We recently stopped out of AMD as the price closed below the 55-day EMA. We closed the position around the breakeven price. As you can see in the above chart, AMD is trading in between two major trendlines in blue. The above trendline has acted as resistance, bottling up the price from making a substantial move up. The below trendline is a four-year trendline that AMD has tested and held 5 times so far, not including the potential test we will likely see soon. One of these levels will give way to a sizable move.
Regarding trendlines, the longer it remains in place and the more times it holds a test, the more meaningful it is. This should put into focus the importance of the below trendline. Furthermore, the 200-day SMA in black just below this trendline. This will be the final support for AMD’s impressive uptrend since 2016.
However, the strength in the internals of AMD gives credence to the bull case. The RSI has broken the 50 line, which leaves the 40 line as the next support. This level held in the March selloff, and we expect it to hold in the coming selloff. However, note the MFI. It is showing clear positive divergence, signaling a bottom is near.
The $49-$48 region is a large cluster of Fibonacci prices levels as well as symmetry points. This should coincide with the below trendline, as well. We will look to try again on AMD, which will setup a favorable risk/reward trade, which we hope will turn into a long term position in AMD.
Dynatrace (DT)
Still largely unknown by the market, DT is expected to have a shallow pullback within a much larger uptrend. This pullback is another buyable event.
SummarySummary
We will target the $37-$32 region to add to our current position.
Below $29 and the uptrend is in jeopardy.
As long as the $29 region holds, the 5 wave pattern we are tracking is projecting a big move.
Key Prices to WatchKey Prices to Watch
$37-$32 is the buy zone.
Below $29 and the uptrend is in jeopardy.
Dynatrace appears to be completing its 3rd wave (red) within a larger degree 3rd wave (blue). We are seeing negative divergence in the MACD, which is characteristic of 5th waves. This also supports our case, because we are likely completing the 5th wave within the 3rd wave right now.
If this where we are in the current count, we should see DT bottom between $37-$32. We will look to add within this price range. If the $32 level breaks, the final level in the uptrend will be $29. We will use this level to place our stop on this new trade.
Teladoc (TDOC)
As extended as TDOC appears, this is a stock that could continue to out-perform this year. We will look to make our first attempt soon.
SummarySummary
Teladoc has built a good base as it attempts to breakout above the $205 resistance.
The internals are weak, supporting a retest of support first.
We will look to go long on the breakout, or target the yellow band between $158-$138.
Key Price LevelsKey Price Levels
Above $205 signals a breakout.
If $197-$190 breaks below, it will put the yellow band in play between $158-$138.
Teladoc has formed a solid base, as noted by the blue arc on the chart just below the recent price movements. The selling volume has stayed subdued as the price approached the breakout zone at the $205 resistance. A clear break above this price and we will go long with a very tight stop.
There are some concerning signs that need to be pointed out. First, note the negative divergence on the MACD – it is making lower highs while price continues to climb. Also, the Accumulation/Distribution line noted a rather large dump at the end of the trading day on Friday. This coincides with a large selling spike in volume, which made a bearish engulfing pattern on the daily chart. All of these together will make a tough barrier for TDOC in the coming days.
If Teladoc fails at the current level, we will look between the $158-$138 for entry.
Livongo (LVGO)
LVGO is signaling a top is near, which should give way to a notable pullback that we will use to enter the stock.
SummarySummary
This stock, like Teladoc, could have a large runway ahead of it due to remote health care
It will likely be choppy considering that it is relatively small and a momentum darling.
If the 20-day EMA breaks in blue, we will target the $56-$38 region for an entry.
Key Price LevelsKey Price Levels
If we break to new highs, the next resistance region for a potential top will be $85.
If the 20-day EMA in blue gives, the green target box comes into play between $56-$38
A break below $30 signals an end to the uptrend we are tracking.
Livongo is another stock that has had an epic run this year. This is a stock we will keep an eye on for future trades this year, especially as the stock could be dumped by momentum traders taking gains and/or causing big swings. We will use these swings to trade the stock.
I believe we are approaching one of those moments. We are seeing notable negative divergences between the MACD, RSI and the price. Furthermore, the RSI is holding the 60 line. Once this level gives, it will signal the pullback we are targeting.
Assuming LVGO does not make a higher high, my current Elliott Wave count has us completing the larger degree 3rd wave in blue. The 4th wave targets will be between $56-$38. This is a larger target area than normal, due to the small market cap of Livongo and recent popularity.
We are not sure where within this target region we will initiate. So, we will use basic technical analysis to assist us along the way. For long term buy and hold investors, please review Beth’s recent pdf. The growth in this segment (LVGO and TDOC) could outperform other cloud software this year. So, we may not get too picky with our cost basis if we hit the upper regions of our target box.