Q3 Earnings: Zoom Video, Okta, Snowflake, Crowdstrike And Elastic

This article was originally published on Forbes on Dec 10, 2020,11:25pm ESTForbes on Dec 10, 2020,11:25pm EST

In this analysis, we review the recent earnings reports from Zoom Video, Okta, Snowflake, Crowdstrike, ZScaler and Elastic.

Zoom Video Q3 Earnings

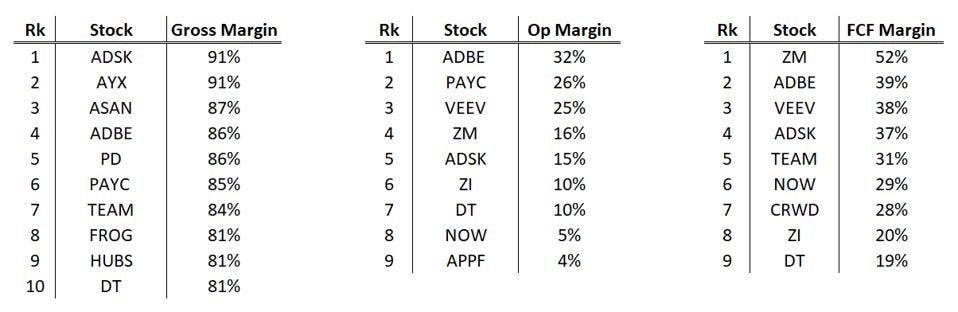
Zoom Video provided a nearly flawless earnings report for the first full quarter that followed initial work-from-home orders. The company reported lower-than-expected churn and market-leading growth on both an annual and quarterly basis. Notably, margins were thinner on both a YoY and QoQ basis due to free accounts. Regardless, it's hard to find fault with Zoom Video's current level of profitability in relation to other tech growth stocks (outlined below).

Strong forward guidance also provides a glimpse into Zoom's traction as the company expects revenue growth to continue at a similar rate year-over-year and also quarter-over-quarter. Revenue grew 367% in Q3 with customers that have more than 10 employees growing 485% year-over-year.

Quarterly revenue is at $777 million or a $3 billion run rate – or 500% growth from FY2019 revenue. Quarterly revenue beat the top-end of guidance at $690 million with the company reporting "lower-than-expected" churn. Customers generating more than $100,000 in trailing 12-months revenue grew 136% year-over-year for an increase of more than 300 customers compared to Q2.

The blend of Zoom Video having virality across consumers from its freemium model combined with enterprise is the company's strength strategically as the competitors do not have the virality component. In Q3, customers with more than 10 employees represented 62% of revenue with net dollar expansion rate of 130%. Globally, Zoom exhibits strong growth, as well, with revenue from APAC and EMEA growing 629% year-over-year.

Gross margins were a weakness in the report at 68.2% compared to 82.9% last year and 72.3% last quarter. The company is providing the service for free to many users including K-12 schools during the pandemic. From my perspective, the temporary margin hit in exchange for virality and establishing consumer behavior is a good trade-off.  

Adjusted operating margins improved year-over-year but were slightly down quarter-over-quarter at 37.4%. Adjusted EPS was $0.99 which exceeded guidance by $0.25. RPO totaled $1.6 billion, up 215%, from $517 million year-over-year which is a strong sign the growth will continue. The company ended Q3 with $1.9 billion in cash (nearly unheard of for a tech growth company at this stage).

Guidance for the next quarter is in the range of $806 million to $811 million with adjusted earnings of $0.77 to $0.79 EPS. Fiscal year guidance is for revenue of $2.57 billion to $2.58 billion, representing 314% year-over-year growth (currently company is in Fiscal Year Q3 2021 and the fiscal year ends next quarter). The adjusted operating income for FY2021 is forecast to be $865 million to $870 million for nearly 900% growth and equal to $2.85 to $2.87 EPS.

The Gartner report that Zoom Video references canbe found here. The bigger revelation is not that Zoom Video is listed as a leader but that Gartner forecasts only 25% of enterprise meetings will take place in-person compared to 60% today. The analyst firm also predicts that 74% of companies plan to shift to more remote work — (keyword here is more – not entirely shift)

Chart showing Zoom Video leads enterprise players Microsoft and Cisco

Source: Gartner (2020)

The interesting piece about the chart above is that Zoom Video leads enterprise players Microsoft and Cisco but is also in a wide lead for consumer. The consumer traction may be Zoom's biggest tailwind as consumer behavior will be hard for a competitor to change.

The strengths that Gartner sees include zoom's user-centric design, service reliability and flexible consumption model. Zoom is also moving into verticals, such as healthcare and financial services, to add to its popularity in education.

The primary risk for Zoom Video is security. As I've stated a few times, it's common for an enterprise to not offer end-to-end encryption as the employer prefers to access the data on their employees. In response to the criticism, Zoom Video offers end-to-end encryption for accounts with more than 200 users.

In another Gartner report for Unified Communications-as-a-Service, Zoom appears for the first time due to the recent launch of Zoom Phone and receives a leadership position with its first mention in the UCaaS report. That's a significant entry. Zoom Video offers Zoom Phone at no additional charge and has secured a partnership with ServiceNow. The company is also partnered with Pinterest on hobbyist classes. Despite the Zoom Phone service being relatively new, it offers a 99.999% availability SLA target.
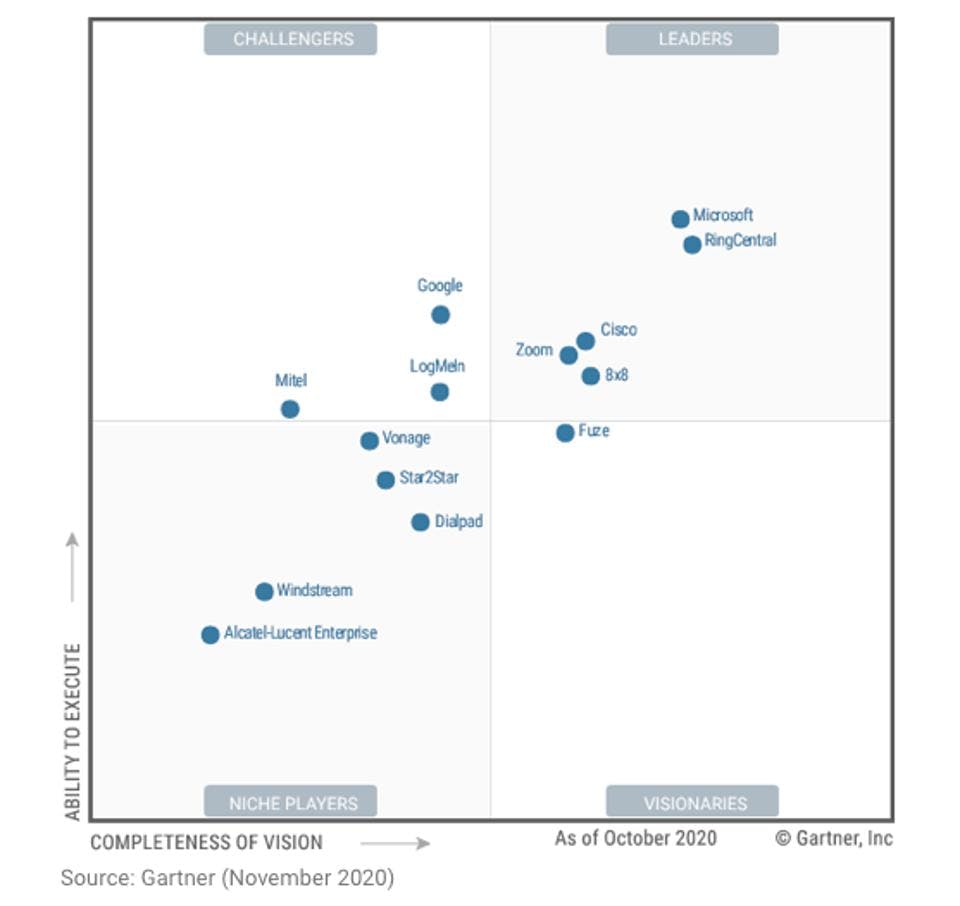
Gartner report: Zoom appears for the first time due to the recent launch of Zoom Phone and receives a leadership position

Source: Gartner (2020)

Visionary CEOs tend to better than competitors who lag because they have a vision for what the space will need next. We see many products rolling out of Zoom that challenge the way video conferencing is done today. As pointed out in the earnings call, Rakuten has partnered with Zoom for the broader UCaaS offering of Rooms and Phone. This is a leader in internet services with 1.4 billion members globally.

OnZoom is a product in beta that will help creators monetize fitness classes, concerts and music lessons. There is also an event discovery feature. Recently, Pinterest has announced a partnership to help creators on their platform reach a larger audience with Zoom.

Analysts on the recent earnings call seemed especially excited about Zoom's ability to sell into the Global 2K with international expansion being a large focus. From Rakuten's recent partnership, plus Lumen/Centurylink and Deutsche Telecom, these larger partnerships with tech providers are my favorite catalyst moving into next year. Essentially, they see Zoom as the best product available (and least threatening) to integrate for unified communications and voice. This is the best evidence that Zoom Video is not a fleeting pandemic stock as large telecommunications providers shift towards cloud.  

Zoom Rooms is a software-defined video conferencing system. Eric Yuan is likely tapping into his experience at Cisco as this will be one of the main competitors he takes on with this move to eradicate conference hardware.

The software-defined solution also extends to kiosks for virtual receptionists, will allow for voice control including an Alexa integration and advanced AWS console. The Smart Gallery will use AI to create a gallery-view of participants for hybrid workforces to where the viewpoint of the camera creates the best imaging possible and other whiteboard features are coming in 2021.

Okta

According to most standards, Okta's earnings report was solid and resulted in an uptick in the stock price. However, the growth has been flat for most of this year.

Revenue rose 42% to $217.4 million ahead of estimates for $202.7 million. Bookings (remaining performance obligations) are growing faster than revenue at 53% to $1.58 billion. Calculated billings were up 44% year-over-year. This was a re-acceleration of calculated billings from the previous quarters in FY2021 where the pandemic weighed on budgets.

The company is profitable on an adjusted basis with EPS of $0.04 and free cash flow of $41.6 million, up from $9 million a year ago. Highlights include a growing number of customers in the financial services sector and government.

The guidance was conservative at $221 million to $222 million, representing a growth rate of 32% to 33% year-over-year. The company is also guiding for an adjusted loss of $0.02 to $0.01 EPS. The fiscal year 2021 offered stronger guidance of 40% growth year-over-year for $822 million in revenue with adjusted EPS of $0.04 to $0.05.

According to the investors deck, the company has a combined addressable market of $55 billion across Workforce Identity and Customer Identity. The contribution margins at 70% for fiscal 2017 cohort analysis on page 14 was impressive. The net retention rate is 123% with adjusted gross margins of 78% and adjusted operating margins of 2.5% and free cash flow margins of 19%. The net retention rate saw a re-acceleration to its highest level in two years. Typical NRR is in the 119-121% range. Free cash flow margin was also its highest in two years.
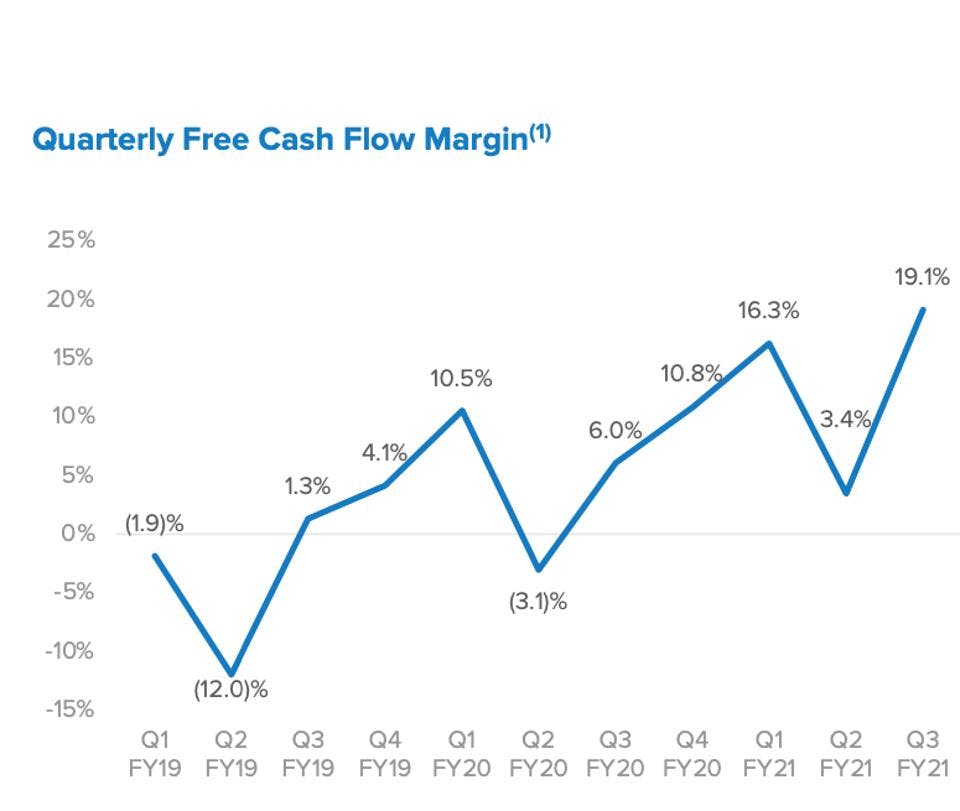
Quarterly Free Cash Flow Margin Graph

BETH.TECHNOLOGY

Total customer count was up 27% and annual contract value was up 34%. The current outlook for the company is 30-35% CAGR through FY 2024 and free cash flow margins in FY 2024 of 20-25%. The total number of $100,000 plus customers stands at 1780, an increase of 34%. The base of customers with annual contract value of greater than $500,000 grew 50%.

Okta's management pointed to three trends in driving business: Cloud and Hybrid IT, Digital Transformation and Zero Trust security. There is a partnership across Proofpoint, Netskope and CrowdStrike which is classified as a deep product integration for an enhanced product stack.

Okta was also recently introduced to the AWS marketplace and is the only identity vendor in the products for Control Tower, which allows for the management of more complicated AWS environments.

Notably, Okta was given a lower-ranking spot in the leader category of the 2020 Gartner Magic Quadrant for Identity and Access Management. One could argue too much attention is given to Gartner at times as Okta has been through a challenging and anomalous year. However, it should be noted that Okta was in a wide lead on the leader quadrant for 2019 and has been bumped down to equal standing with Microsoft and Ping Identity.

Snowflake

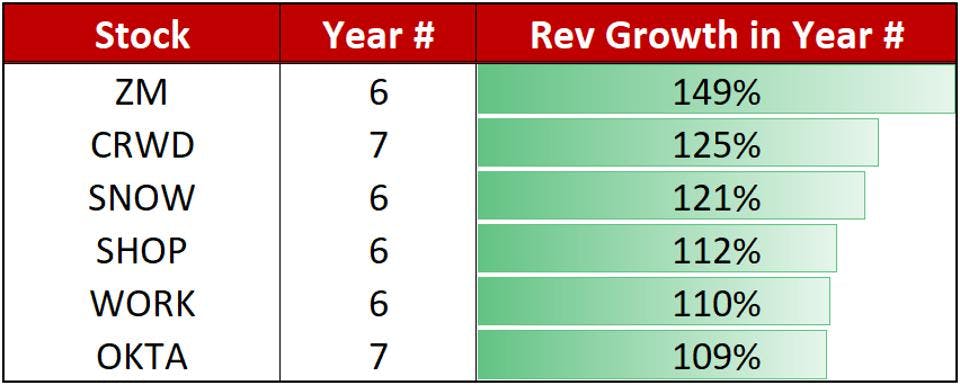
Snowflake grew 119% year-over-year to $159.6 million with remaining performance obligations of $927.9 million, or 240% year-over-year growth. Product revenue grew 115% year-over-year. The net revenue retention rate of 162% is impressive although other companies have exceeded this in their 6th year (Snowflake was founded in 2012 but was in stealth mode until 2014 when it began to work with customers).  

Graphs: Showing Stocks Revenue Growth in Year #

BETH.TECHNOLOGY

Gross margins are between 58% to 63%, which it's normal for a cloud company to be lower than a SaaS company on margins. However, operating margins were negative (30%) with FCF margins of negative (23%). Probably the biggest issue that Snowflake faces are the sales and marketing costs. In the previous two quarters, they were near or exceeded total revenue and in this quarter they were about 90% of revenue at $134 million compared to the $159 million in revenue.

The issue here is the rapid growth is being paid for in sales and marketing dollars and could slow when the bottom line becomes prioritized. Growth marketing tactics like this can often skew the true growth rate of a company at the expense of the bottom line. When equilibrium is sought, the top line suffers (or the alternative is that profitability is a long way off). Oddly enough, the bleeding operating and FCF margins weren't mentioned by the analysts in the Q&A on the earnings call.

The bigger product announcements on the earnings call include Snowflake expanding from semi-structured to unstructured data (which will be helpful for machine learning), SnowPark which enables users to query in their language of choice (Java, Python, etc). The overarching goal is to consolidate workloads and meet the demand for data governance purposes.

The company issued forward guidance for FY 2021 of revenues between $538 million and $543 million for YoY growth of 113% to 115%. Margin will be decent for adjusted gross at 68% compared to negative (40%) operating margin and negative (18%) adjusted FCF margin.

Snowflake is a strong company. In my opinion, the valuation is a major risk and continues to be considering the high sales and marketing costs that are causing an imbalance between the top line and bottom-line growth. Net retention rate of 169% is impressive although is a consumption model and cannot be compared to SaaS.

CrowdStrike

CrowdStrike beat consensus estimates on both the top and bottom lines and raised Q4 guidance. Revenue grew 86% YoY, representing an 8% beat above Wall Street estimates. Subscription revenue increased 87% YoY while annual recurring revenue advanced 81% compared to a year ago. The company also achieved its most impressive quarter ever in terms of profitability, earning $0.08 per share on the bottom line. This was CrowdStrike's third consecutive quarter of positive EPS and its highest total yet. Free-cash-flow margin increased to 33% and gross margin improved to 76%.

Here is how CrowdStrike's FCF margin compared last quarter:

How CrowdStrike FCF margin compared last quarter

BETH.TECHNOLOGY

In the quarter, CrowdStrike added 1,186 net new subscription customers, representing growth of 85% YoY. CrowdStrike also continues to drive new module adoption in existing customers, as 44% of the company's subscription customers have adopted five or more modules versus 39% in the previous quarter. Management guided for $248M in revenue for Q4 (+63% YoY), representing a 7% raise above expectations.  

This was an impressive quarter for CrowdStrike both in terms of increased usage of existing customers and the addition of new customers. As previously mentioned, CrowdStrike continues to excel in its ability to drive new module adoption with 61% of the company's customers adopting 4 or more modules versus 52% in the same period a year ago. 

In the quarter, CrowdStrike announced the addition of three new modules to the Falcon Platform, covering cloud security posture, dark web threats, and incident response investigations. The Falcon Platform now encompasses 16 modules in total. 

CEO George Kurtz highlighted new module adoption as a key to the company's growth strategy in its Q3 Earnings Call: "I'm pleased to announce that in Q3 we reached a new milestone with 22% of our subscription customers having adopted six or more modules. Driving adoption of our expanding module lineup is a keystone to our growth strategy as it increases the strategic value we provide to customers, which also translates to higher retention rates." 

This quarter indicates CrowdStrike is successfully executing on this growth strategy.     

The second key to CrowdStrike's growth hinges on its ability to add new customers, a metric that increased 85% YoY in Q3. One key customer win in the quarter was signing Target, which displaced Symantec and deployed Falcon completely across its footprint in less than 10 days. 

CEO George Kurtz discussed the marquee win in its earnings call: "a win with Target that highlights how our single agent cloud-native architecture, intuitive console, and rapid re-bootless deployment capabilities continue to be significant differentiators for us. Target Corporation was looking to rapidly move away from Symantec and transition to a single agent cloud solution that could be deployed in days, not months or years." 

Zscaler

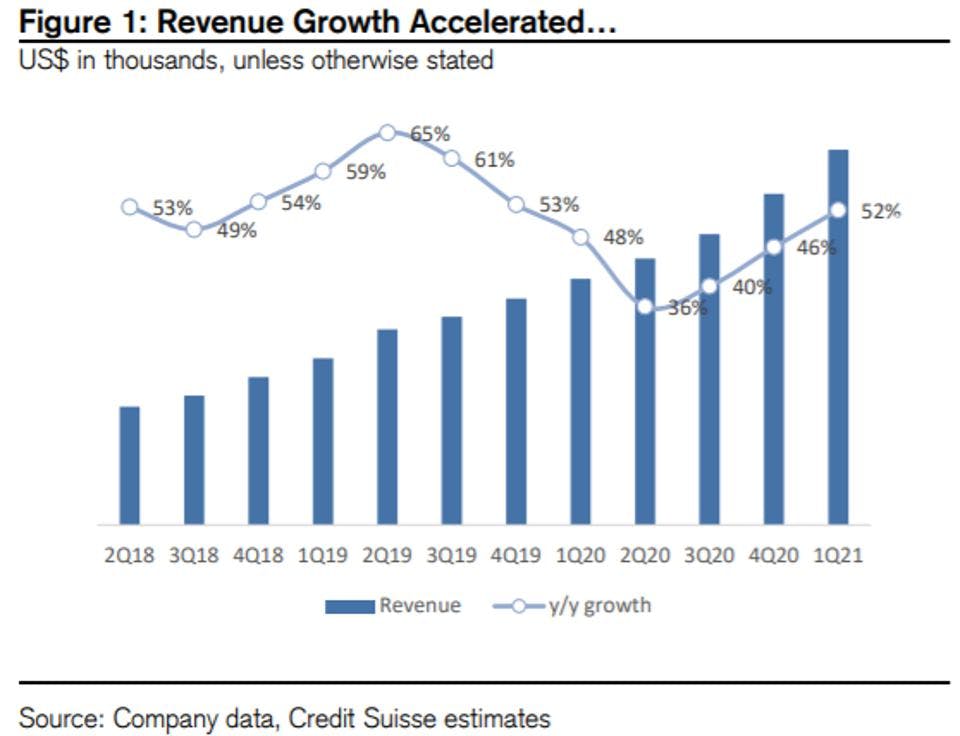
ZScaler announced Fiscal Q1 2021 results that easily cleared analysts' expectations. Revenue growth accelerated to 52% YoY, which represents the company's third consecutive quarter of growth acceleration.

Adjusted billings growth increased 64% YoY, far surpassing the consensus expectation calling for 39% growth. This beat was driven in part by a record quarter of seven-figure deals. The company's net retention rate of 122% advanced from 120% last quarter and 119% the quarter before. Non-GAAP EPS of $0.14 was 8 cents better than expectations while the company also announced an impressive 30% FCF margin. Non-GAAP operating margin of 14% far exceeds the consensus of 2.9%.

Graph shows one of the best quarters for ZScaler free cash flow

CREDIT SUISSE

The acceleration in growth coupled with the record quarter of operating profits and free cash flows makes this one of the best quarters ZScaler has announced.

CEO Jay Chaudry discussed the three main factors that allowed his company to outperform this quarter: "One, building on our growing traction with large enterprises. We closed a record number of seven-figure ACV deals… two, our optimized go-to-market engine is driving significant velocity… Last year, we doubled down on our investment in our sales organization. These efforts are also bearing fruit in two big ways. One, our newly hired sales reps are contributing at a faster pace. And two, our sales productivity is higher than a year ago, despite a high percentage of ramping sales reps… Three, the power of our Zero Trust Exchange platform is resonating with CxOs."

Looking ahead, ZScaler believes that the strong business momentum they have exhibited in the last several quarters will continue. Management raised guidance over 5% for FQ2, now expecting $147M of revenue at the midpoint (+45% YoY). Management attributed the strong FQ1 in part to stronger than expected deal activity and expects these trends to continue into the next quarter. 

In its FQ1 Earnings Call, CEO Jay Chaudry touted the company's position amongst a growing opportunity: "I believe in the current challenging environment and in the post-COVID economy, Zscaler will be the go-to-platform for vendor consolidation, cost-saving, increased user productivity, and better cyber protection.."

Elastic

Elastic announced strong FQ2 earnings on 12/2. Total revenue increased 43% YoY, representing an 11% beat above consensus. Total billings grew 42% YoY while SaaS revenue increased 81% versus the same period a year ago. The company's losses also improved significantly, with non-GAAP EPS of -$0.03 coming in 17 cents better than expected. Non-GAAP operating loss improved to -$1.9 million, representing a -1% operating margin versus -10% projected. Gross margins also came in better than expected with 77% versus a consensus of 75%. FCF margin was -13% for the quarter. 

Subscription revenue totaled 93% of Elastic's total revenue in the quarter, with 45% of total revenue coming from outside the US. Management views this geographical distribution as a strength in the company's business model. Elastic's net retention rate ticked down several points from last quarter but still remained modestly above 130%. Elastic now has a total of 12,900 subscription customers with 650 of those (5%) having annual contract values exceeding $100K. 

At the start of its fiscal year, Elastic's management discussed how COVID-19 would likely create headwinds to calculated billings for a couple of quarters and that they would then see gradual improvement beyond that. 

In its FQ2 Earnings Call, management confirmed that the first half of fiscal 2021 played out as expected. The company has observed longer sales cycles and many customers are looking to conserve cash as spending patterns have not recovered to pre-COVID levels. Management updates its outlook for the second half of the year, noting that they expect the trends they observed in the last two quarters to continue in the next two: "given the global situation with the pandemic, our current assumption is that the mixed demand environment that we experienced in the first half will continue for the rest of the fiscal year. Previously we were expecting the environment to gradually improve during the second half." Still, Elastic's strong execution in the first half of its fiscal year gave management the confidence to increase its guidance for the next quarter. Management raised guidance 4% for FQ3, now expecting $146M of revenue (+29%). However, the company expects EPS to decline to -$0.15 on a -7% operating margin for FQ3.     

Elastic's management ultimately expects the demand environment to return to pre-COVID levels in fiscal 2022, which would align with the summer of 2021. While the company is certainly facing some headwinds due to the pandemic, the digital transformation has provided tailwinds that have allowed growth to remain strong. Management expects these tailwinds to continue beyond the rest of their fiscal year: "the tailwinds of cloud and our solutions adoption position us well for the rest of this fiscal year and beyond."

Please note: The I/O Fund conducts research and draws conclusions for the Fund’s positions. We then share that information with our readers. This is not a guarantee of a stock’s performance. Please consult your personal financial advisor before buying any stock in the companies mentioned in this analysis.

Shopify Premium Analysis for 2021

2536843c-2d08-4b42-8fa9-d362f83f8268_Shopify-Premium-Analysis-for-2021.pdf

Shopify Premium Analysis for 2021

Introduction:

As the market attempts to sort the companies that have temporary covid tailwinds from the more permanent and long-lasting growth, we want to separate Shopify from the pack. You can view our October 2019 analysis here where we discussed the strength of the company’s product-market fit and the catalyst of the Fulfillment Center. 

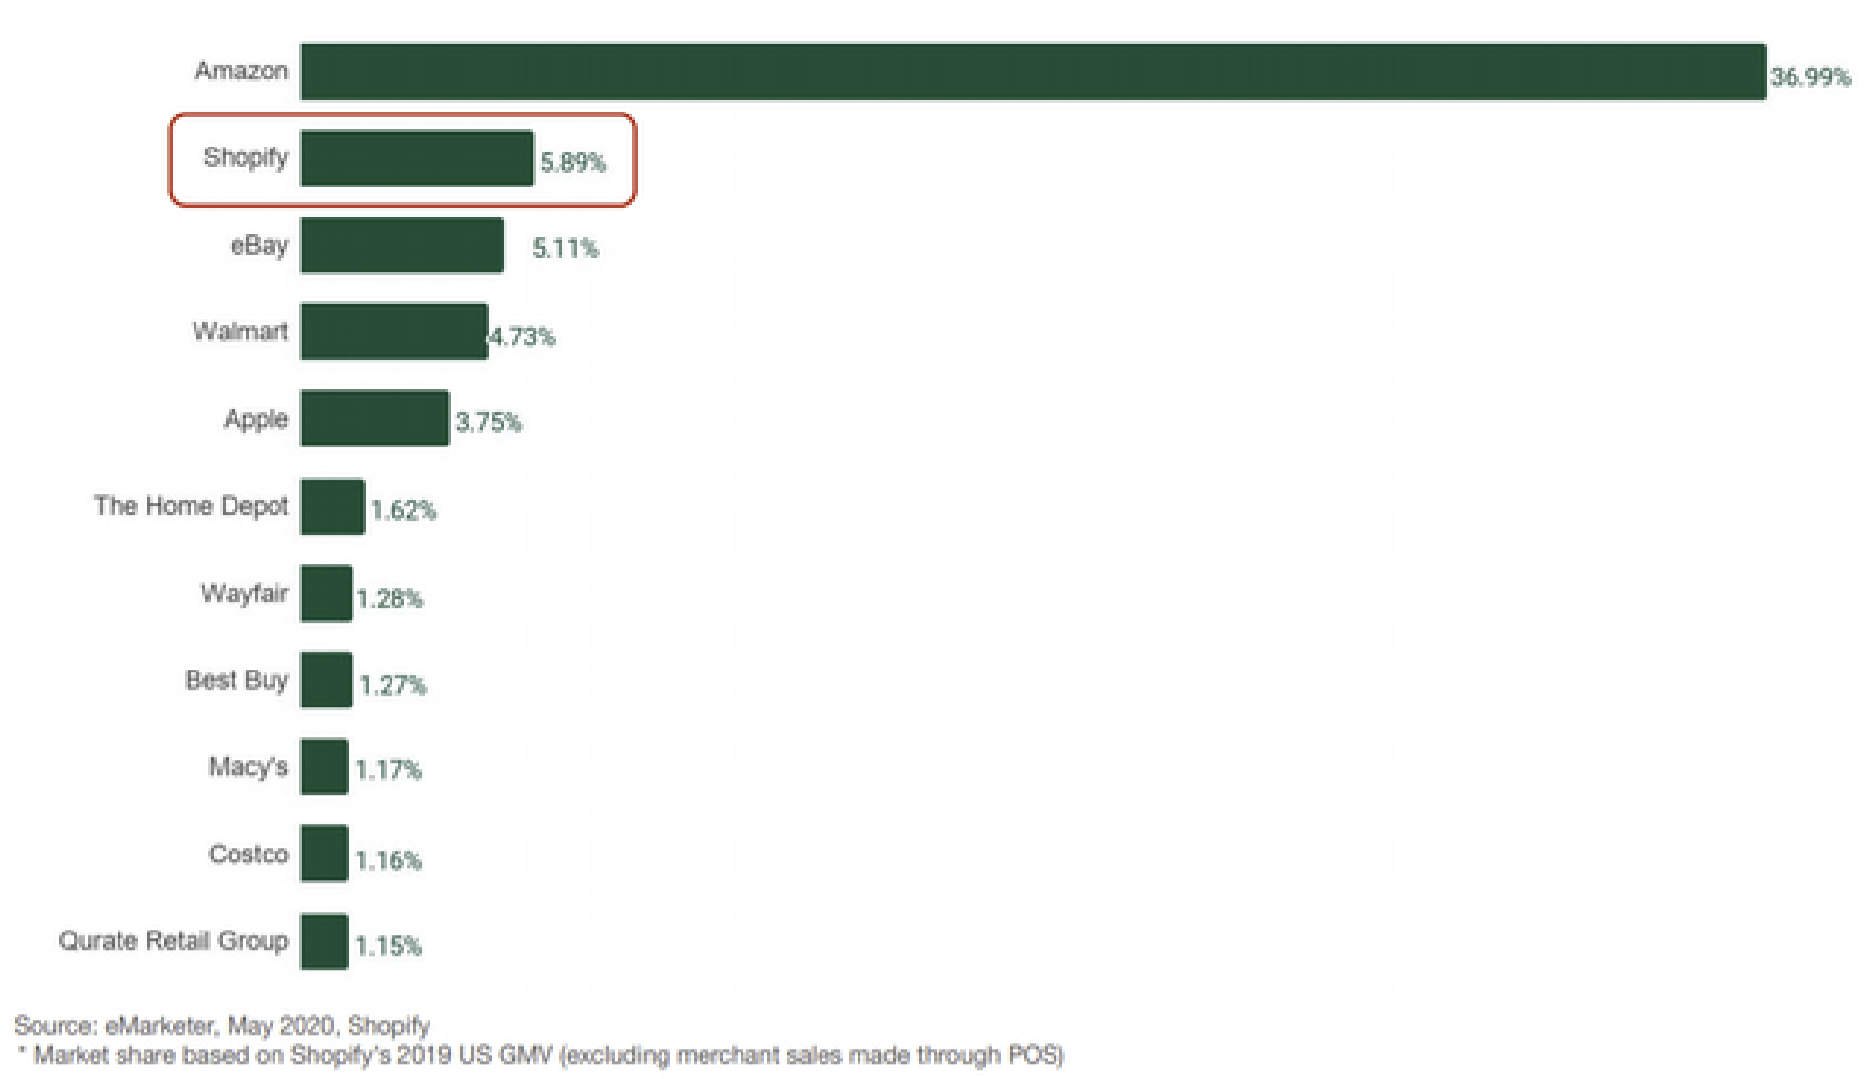
One major update from the last report is that Shopify overtook eBay as the largest online retailer in the United States. When our last report was written, Shopify was the third largest retailer and a sizable portion of our analysis focused on eBay as the one to overtake. 

I think we will see Shopify significantly close the gap due to Shopify's global opportunity. Shopify is more localized by allowing the merchant to have a localized domain rather than weaken under one domain as detailed in the October 2019 analysis. 

Amazon is customer-centric which sacrifices the merchant-side of the equation. We covered this in 2019 when we stated:

Shopify counts over 800,000 merchants as customers compared to Amazon’s 5 million marketplace sellers. Shopify charges the sellers 2-3% compared to 26.5%. Amazon is also predominantly a United States presence with about 3⁄4 of sales occurring domestically. Shopify does not break out these numbers but it is widely understood to have a global strategy.  

As mentioned previously, an important distinction between Shopify and Amazon is that Shopify places the importance on the merchant while Amazon places the importance on the retail customer. While Amazon builds out 1-day shipping, Shopify is building out tools for platforms and tools for merchants.  

Amazon’s main value proposition is the convenience, which is why we will likely see Shopify attack this at various angles over the next few years (starting with the Fulfillment Network). Amazon’s e-commerce moat is about the same as Wal-mart’s retail moat; they are behemoths but these behemoths can be disrupted. Amazon took market share from Wal-Mart, and nearly two decades later, we think Shopify is a serious contender to Amazon. 

However, it should be noted by not providing the traffic for the merchant, Shopify’s GMV is substantially lower than Amazon’s. We noted this before in the 2019 write-up:

Shopify makes 2.63% of GMV, or $361M of the $13.8 billion. Compare this to Amazon.com who makes 26.7% of GMV ($42.7 billion on $160 billion GMV, in 2018) and eBay who makes 11.7% of GMV ($10.86 billion on $92.6 billion, in 2018). 

Percentage of GMV illustrates the power of owning the domain …  

How will Shopify catch-up to Amazon? Two specific ways.

1.       International Growth: Globally, Shopify has a better chance of penetrating various regions as the merchants (and lack of walled garden) localizes the content and offerings. There is also stigmatism towards Big Tech globally and Shopify works quietly in the background while letting the merchants remain in the spotlight. This will be popular globally — and perhaps even domestically if Shopify can deliver on the Fulfillment Center and close the gap on convenience. Point being, keep an eye on Shopify’s international growth. 

The best evidence for this is Shopify’s recent partnership with AliPay. Although this does not meaningfully contribute to revenue right now, it could by next year across the key markets mentioned the press release: The new Alipay payment gateway is available now to Shopify merchants in the U.S., with more markets to come in the future, including Hong Kong, India, South Korea, Indonesia, the Philippines, Malaysia, Thailand, Pakistan, and Bangladesh.

Right now, it’s hard to predict Shopify’s success with AliPay in these regions but it’s easy to see that Shopify is welcomed in geographies where Amazon is not. Therefore, we see global as an important piece to our thesis as merchants who want to reach global audiences will likely choose Shopify over Amazon. We think this is an important competitive edge. 

2.       The merging of social media and e-commerce as a means for monetization. We’ve belabored the point of Apple’s IDFA changes to first-party vs third-party ads. For social media companies, the answer to weaker data will be to move away from behavioral targeting for ads and move towards direct response and e-commerce. Amazon is weak here as social media companies don’t partner with the behemoth (see below for SHOP’s partnerships). Expect to see additional tailwinds from social media driving more e-commerce traffic. 

Market Forces: e-Commerce is eating Retail

There are two market forces driving the success of Shopify right now. The first is the covid pandemic grew ecommerce penetration in the United States from 15% to nearly 35% representing the same level of growth (3X) as the previous ten years combined (5% to 15%). Retailers are now online in an unprecedented number and are able to successfully compete with Amazon. 

The more permanent trend will be driven by Millennials and Gen Z with 91% and 89% stating that they shop online, respectively, according to a survey conducted in June. Additionally, data from Morgan Stanley shows Millennials and Gen Z will overtake Baby Boomers as the dominant US spenders in the coming years, meaning the major US consumers of the future will prefer to shop online.

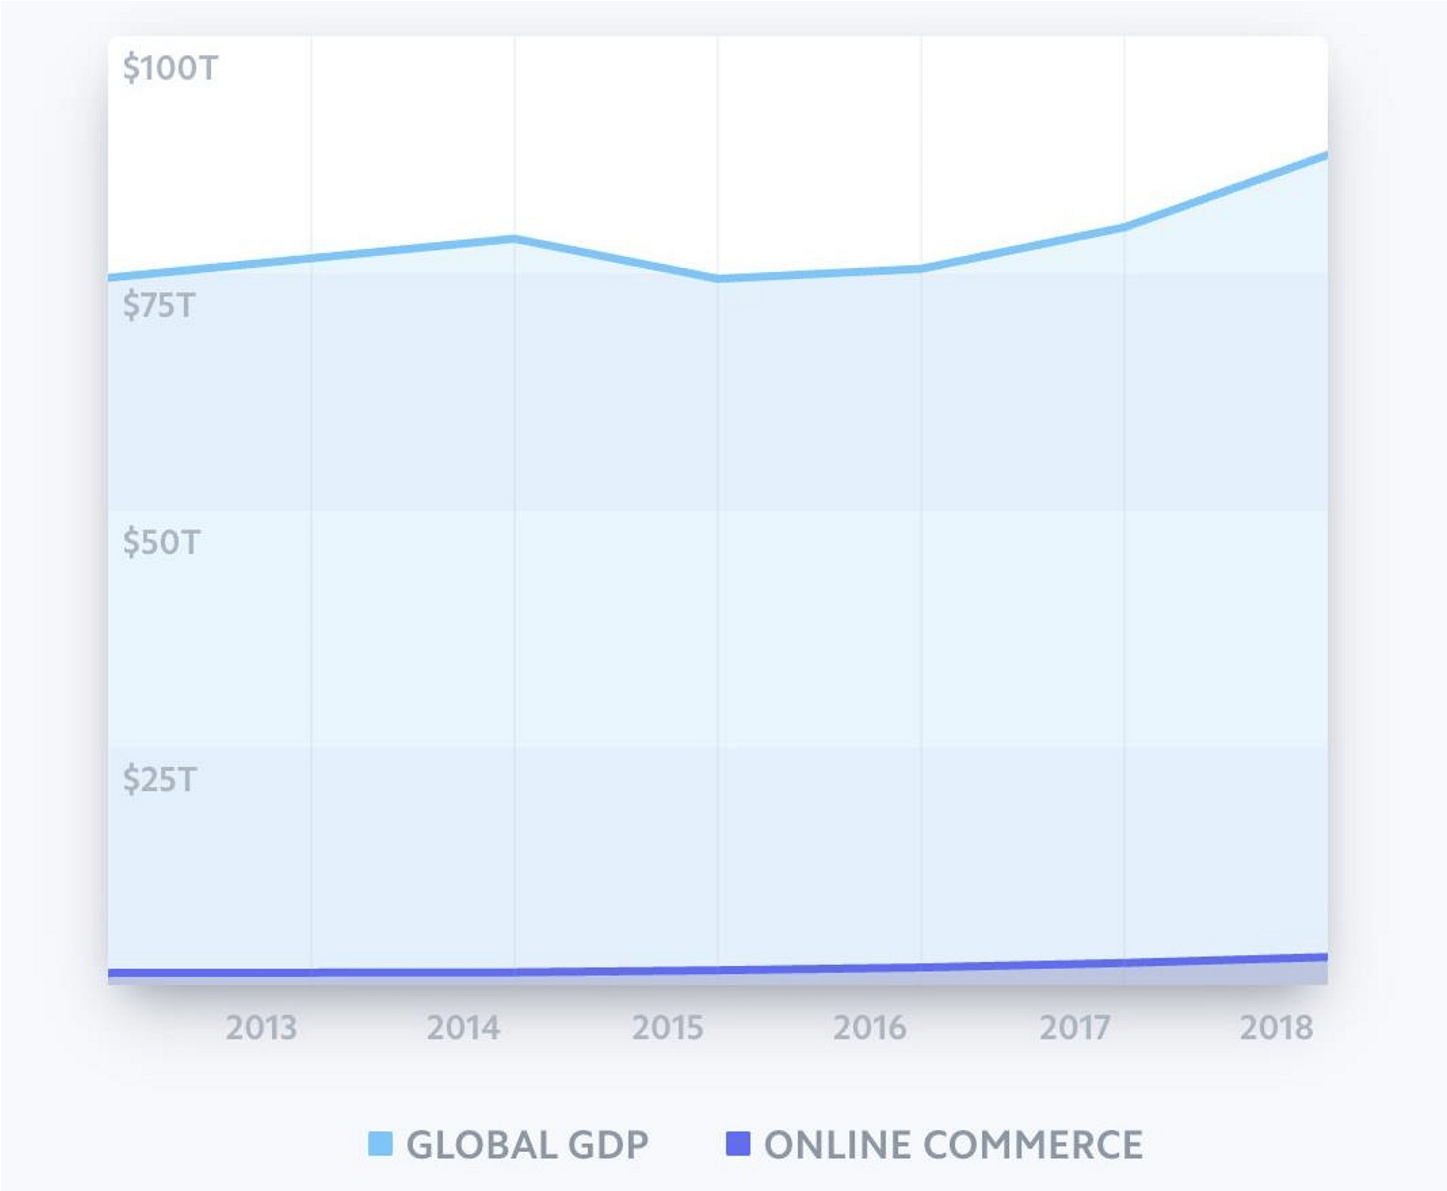
The additional outside force is the remaining addressable market. The statistics above suggest e-commerce will overtake retail while data from Stripe suggests only 5% of global commerce happens online today. This will be compounded by the overall growth in retail. 

To summarize, we think the transition towards e-commerce is more permanent long-term than the market is pricing in at this time as retailers have been forced to adopt online stores and younger generations prefer this method. 

Below you can see what product-market fit looks like as Shopify takes over eBay in a banner year for e-commerce. 

Fundamentals:

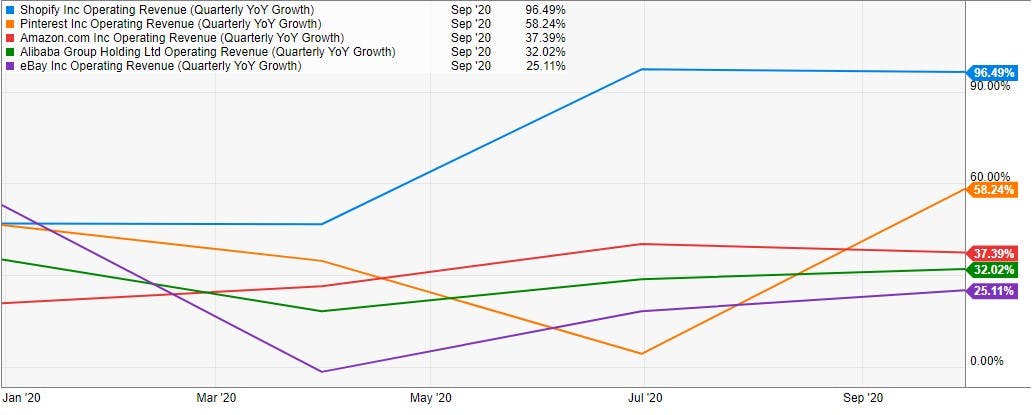
In its most recent quarter, Shopify grew revenue 96% YoY to $767.4 million up from $714.3 million in the previous quarter and $390.6 million in the year-ago quarter. GMV grew 109% which was slightly down from the previous quarter of 119% GMV growth. 

Merchant solutions revenue increased 132% YoY while subscription solutions advanced 48%. EPS of $1.13 came in 122% above the consensus estimate calling for $0.13 as the company showed its ability to earn sizable profits. Adjusted operating margins of 17% and is up from 3% in the year-ago quarter. 

TTM revenue was $2.5 billion, net income of $196.5 million, and adjusted net income of $342.5 million. Here is the company’s growth over the last few quarters:

Q3 2019                Q4 2019                Q1 2020                Q2 2020                Q3 2020

GMV $14.8 billion $20.6 billion $17.4 billion $16.3 billion $30.9 billion

GMV Growth (y-o-y) 48% 47% 46% 119% 109 %

Revenue $390.6 million $505.2 million $470 million $714.3 million $767.4 million

Revenue Growth (y-o-y) 45% 47% 47% 97% 96% 

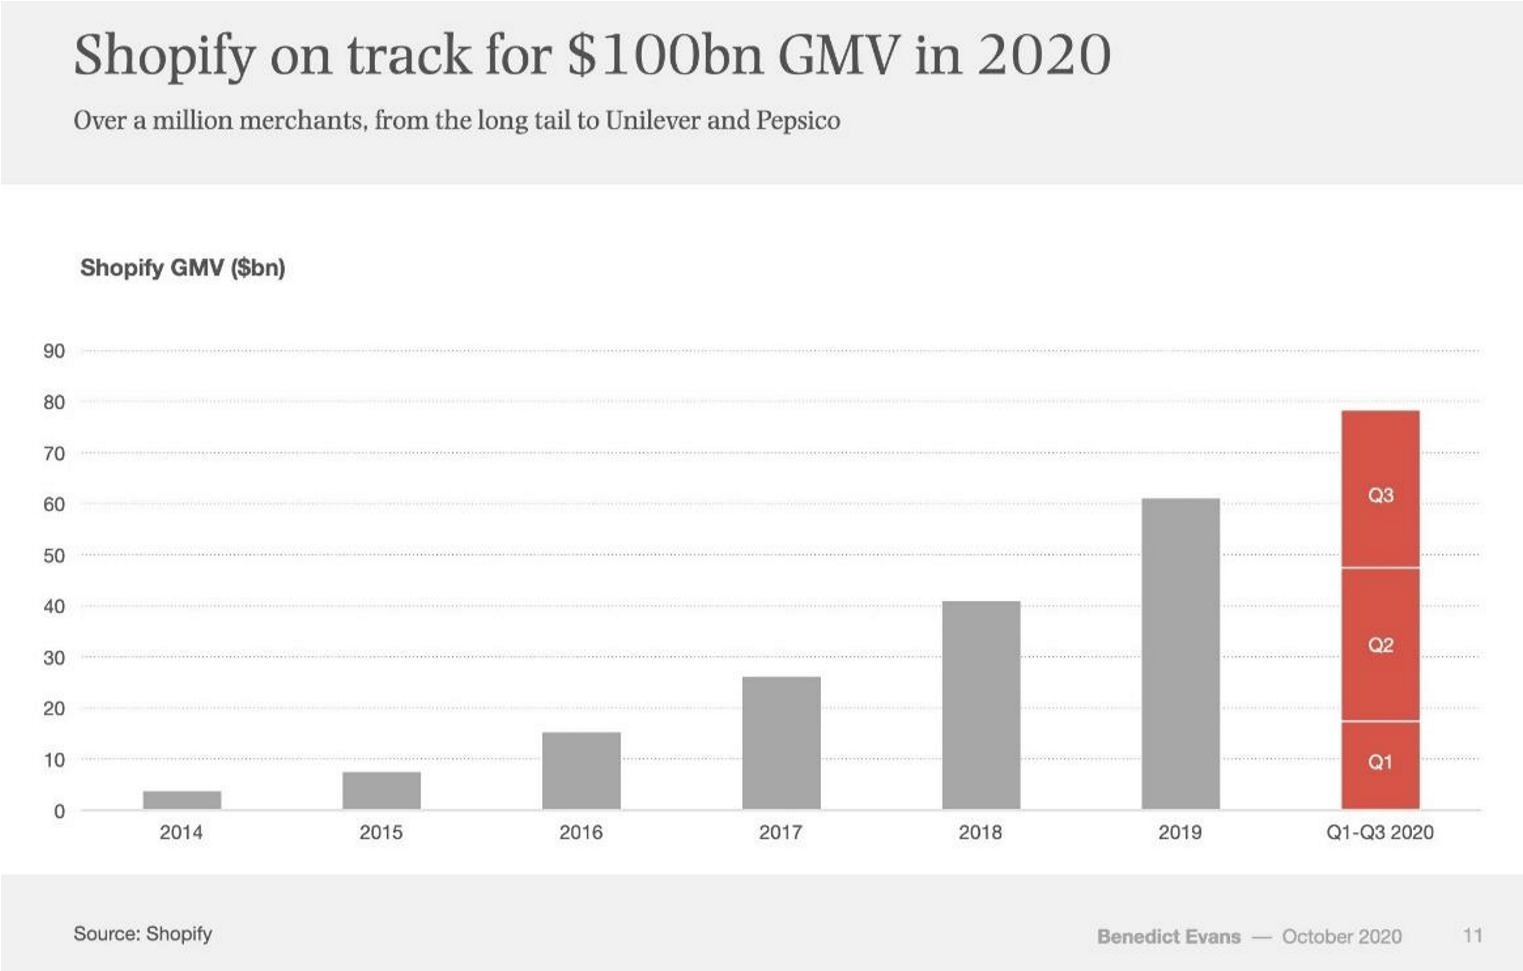
Heading into Q4, Shopify is on pace to record over $100B in GMV in 2020. The company has over 1 million merchants in 175 countries with a breakdown of United States of America 52%, United Kingdom 7%, Canada 6%, Australia 6%, and 29% rest of the world.

Monthly recurring revenue as of September 30, 2020 was $74.4 million. The company has cash and marketable securities of $6.12 billion and debt of $750.5 million. 

The increase in cash was due to $2.03 billion of net proceeds from Shopify’s offering of Class A subordinate voting shares and convertible notes in the third quarter of 2020 and $1.46 billion of new proceeds from Shopify’s offering of Class A subordinate voting shares in the second quarter of 2020.

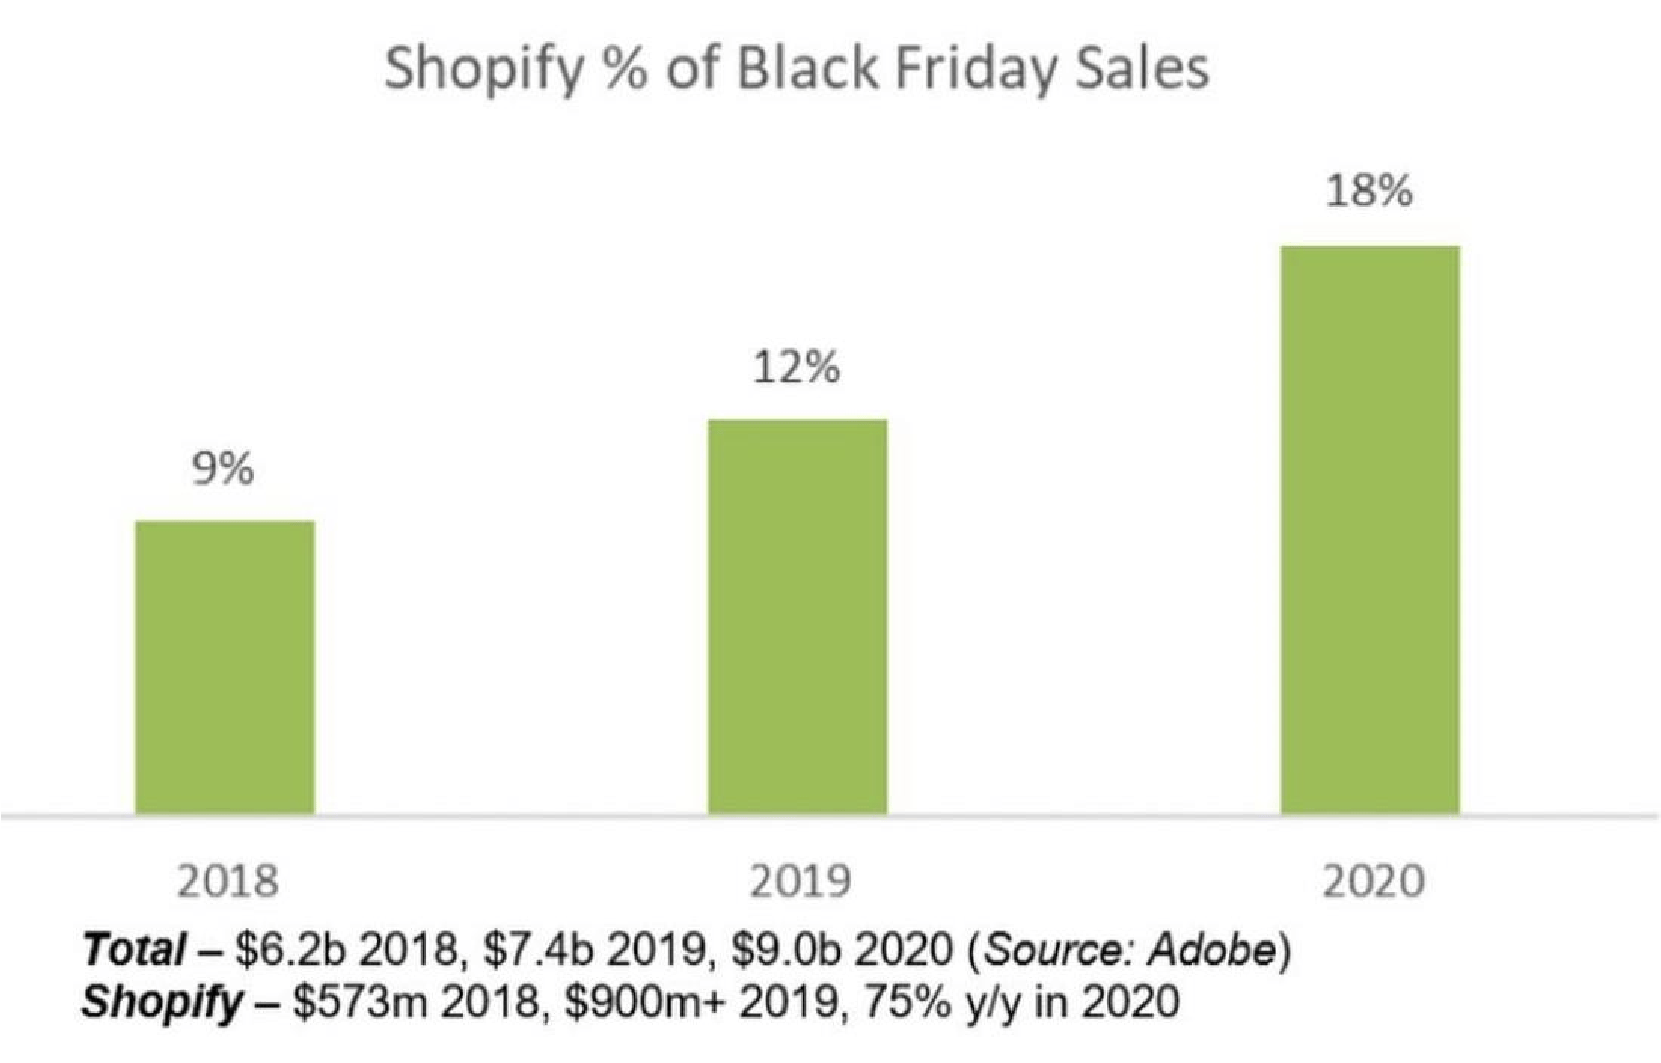
An early glimpse into Q4 shows Shopify is likely to have a big quarter as the holiday shopping season unfolds. The company announced record Black Friday sales of $2.4B, up 75% from Black Friday 2019.  

Over the past two years, Shopify has doubled its share of Black Friday sales. Most impressive is the acceleration of market share gains the company demonstrated this year.    

The median analyst forecast for FY 2020 is $2.85 billion (up 81% YoY) and for FY 2021 is $3.74 billion (up 31% YoY). The median analyst’s EPS estimate for FY 2020 is $3.70 to $3.31.  

The harder comps for next year is one reason the stock has cooled off but I suspect that we will see stronger forward guidance as the year goes on. 

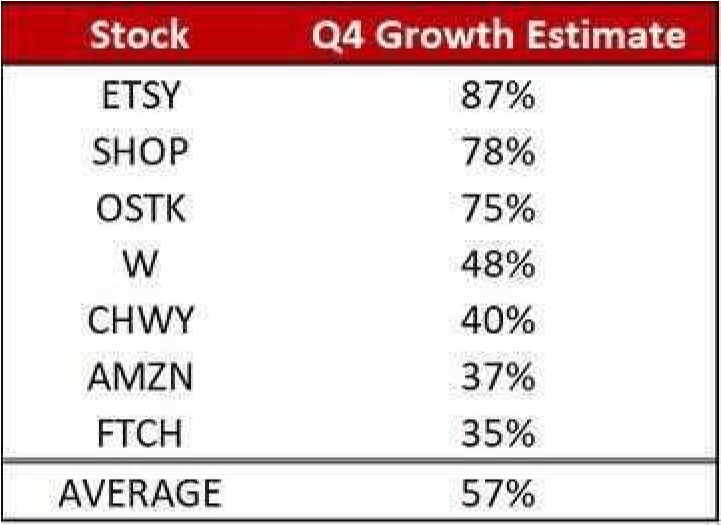
Here is how Shopify’s forward growth next quarter compares to other popular e-commerce companies:

Fulfillment Center

In June 2019, Shopify introduced the Shopify Fulfillment Network, a fulfillment network that will offer timely deliveries, lower shipping costs, and provide a better customer experience for merchants and customers  Last year, the company acquired 6 River Systems to help build out its warehouse automation technology.  

The Shopify Fulfillment Network is a 5-year build process for Shopify that remains in the product market fit phase.  At this point, Shopify is focused on building out the software but management expects to prioritize the build out into 2021.

COO Harley Finklestein remarked in the company’s Q3 Earnings Call: 

“our focus in 2020 around SFN is to achieve product market fit, which we plan to continue up to — into 2021. We want to ensure that the foundation of the fulfillment network is strong and the merchants experience is outstanding before we enter sort of the scale phase.” 

Shopify is focused on the long-term opportunity and does not expect to accelerate its SFN investment, as they want to take their time on such a large venture ($1B). 

Ultimately, the Shopify Fulfillment Network will utilize machine learning to improve supply chain economics and logistics. The company believes a significant portion of US GMV is addressable by the Shopify Fulfillment Network.  

This will help Shopify compete with Amazon as a value add for merchants to make deliveries more streamlined and cost-effective, and will also improve the customer experience for buyers by ensuring faster deliveries.       

Other tools and services that Shopify provides includes Shop Pay and Shop Email. Shop Pay allows customers to check out faster the next time they shop by saving the email address and credit card information. More than 60 million buyers opted-in at the end of Q3. Keep an eye on this for an indication of strength under-the-hood.

Shop Email lets subscription plans send emails through Shopify’s system rather than adding another vendor for email. 

Notable Partnerships including Social Media

Shopify has several major partnerships that differentiate its platform from competitors. One is Shopify’s sales channel integration with Instagram that allows merchants to sell directly to consumers through product tagging.  This allows shoppers to discover and purchase products all within the Instagram app, shortening the path to purchase.  

Instagram is a crucial component of a successful ecommerce marketing strategy as it is the 5th most popular app in the US. Shopify’s integration with Instagram allows merchants to market their products and sell those products directly through the app.  

Shopify is also partnered with Wal-Mart which was recently announced in June.  The deal opens Walmart's Marketplace to Shopify's small business sellers, giving these merchants access to sell their products on the 4th largest ecommerce marketplace in the US.  

Early indications show that Walmart Marketplace seller additions have increased 3x from January, demonstrating that Shopify merchants are eager to take advantage of this new opportunity. 

A third major partnership Shopify has is with Facebook, recently announced in May. In Facebook’s expansion into ecommerce, they partnered with Shopify to launch Facebook Shops. Facebook Shops is a free tool designed to help merchants create customized online storefronts for Facebook and Instagram.  This partnership allows Shopify merchants to control customization and merchandising for their storefronts inside Facebook and Instagram while managing their products, inventory, orders, and fulfillment directly from within Shopify.  

Shopify is also partnered with TikTok which was announced in October. Shopify’s new channel integration with TikTok allows sellers to connect their TikTok for Business account and feature in-feed shoppable video ads within Shopify.  

Shopify merchants can easily download the TikTok channel app from Shopify’s app store and begin to run and optimize TikTok marketing campaigns straight from the Shopify platform.  For now, the TikTok channel is available in the US, but sellers in other North American countries as well as Europe and Southeast Asia will be able to access the service in early 2021. 

TikTok was the 2nd most downloaded free app in 2020 with a surging young audience that ecommerce companies covet.  Shopify merchants are now able to tap into that global audience.    

These partnerships represent a tremendous value-add for merchants and prospective merchants, giving Shopify a big advantage over competitors. At this point, an entrepreneur looking to sell products online is likely to choose Shopify for the reach the company offers, as well as the tools Shopify is frequently releasing (SFN, Shop Pay, Shop Email, etc). 

Valuation 

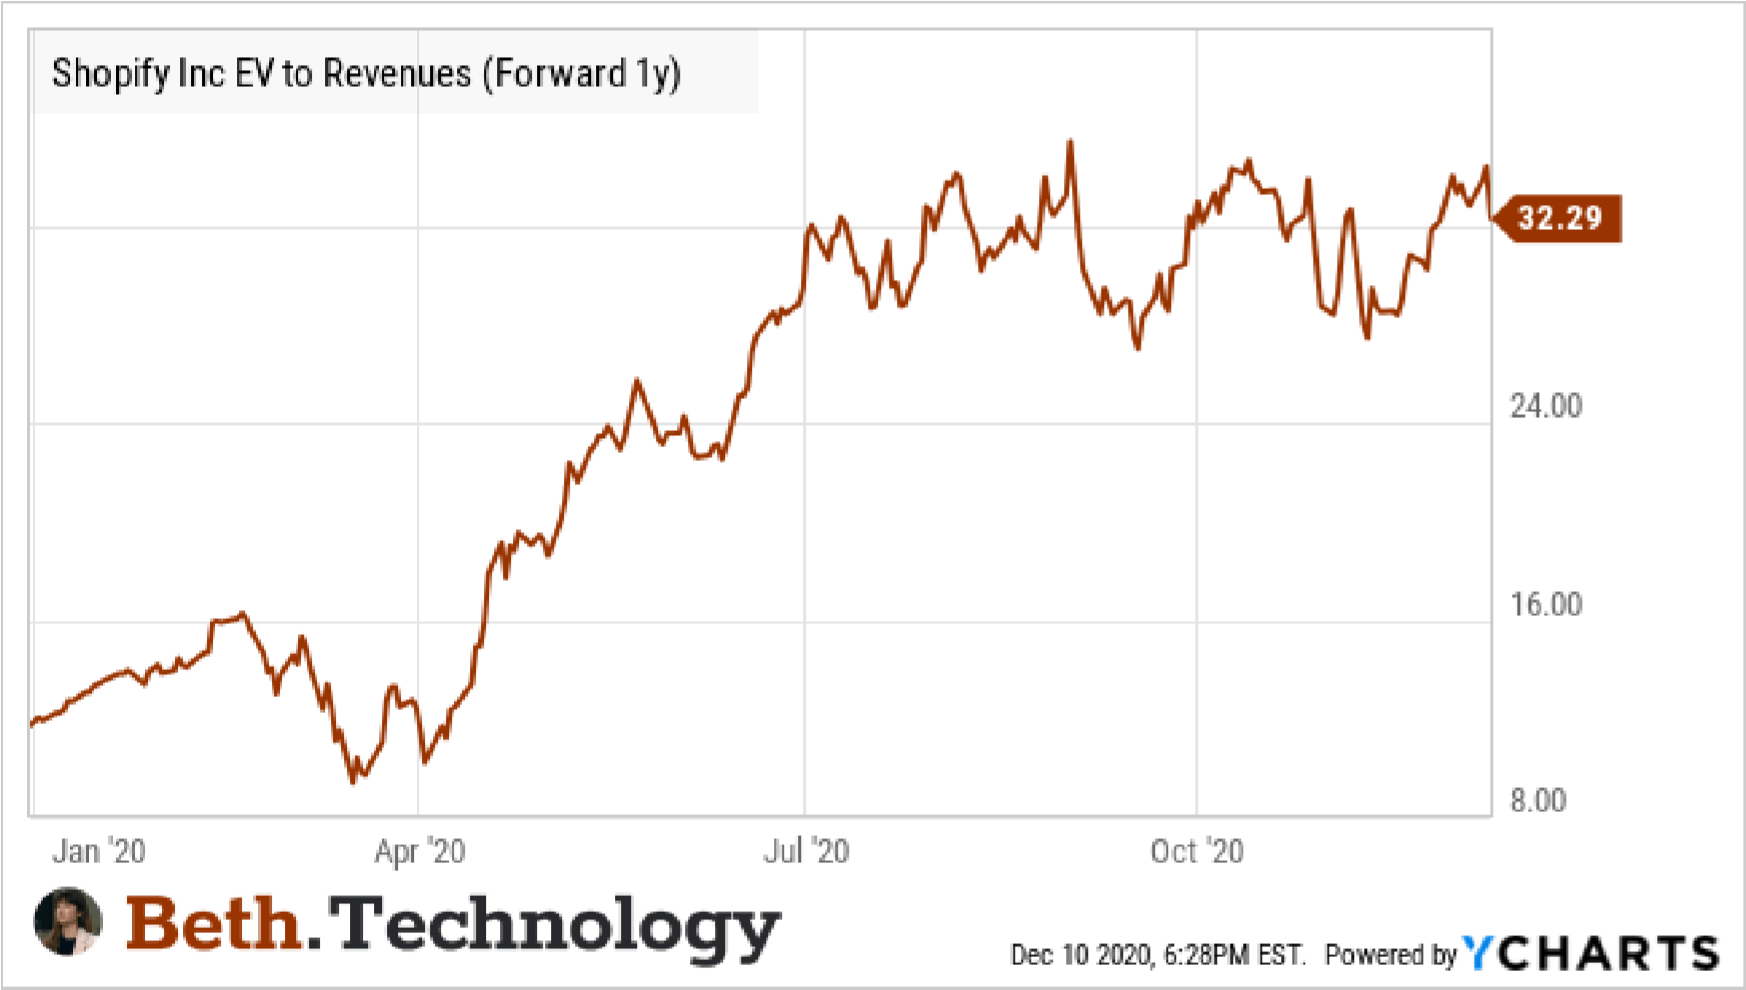
SHOP continues to trade at a premium – 32x 2021 revenue, which has remained relatively stagnant over the last five months. In comparison to peers, many of which have seen their valuations continue to climb, Shopify has become more attractive.  

In July, SHOP briefly had the highest forward multiple among SaaS stocks. It is now outside the top 10. 

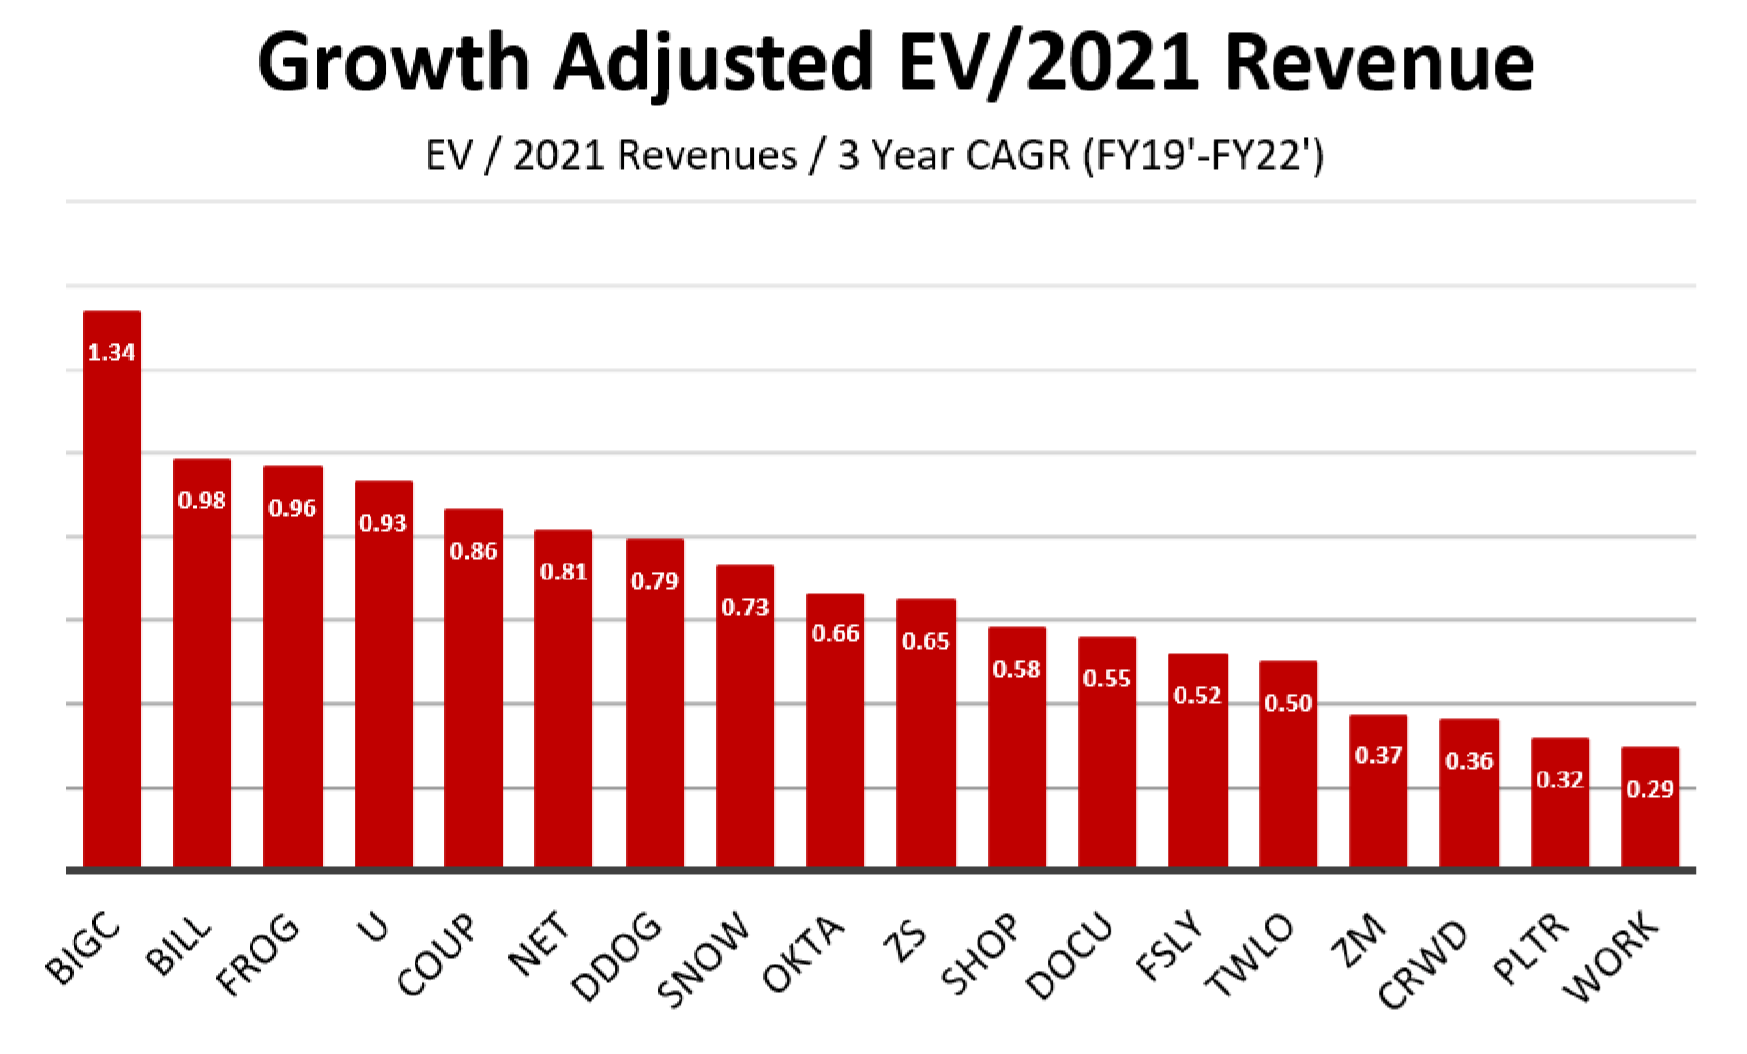
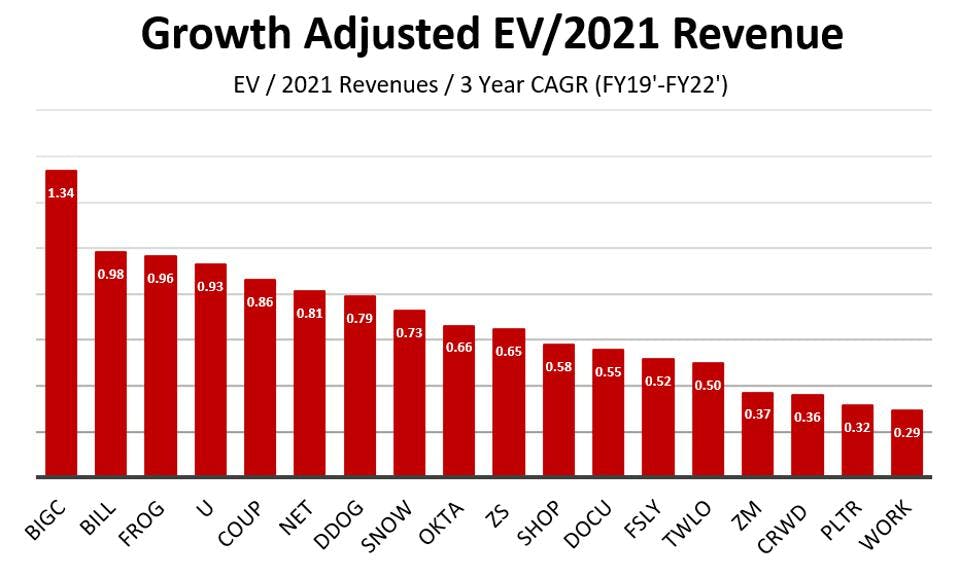
Here is the adjusted valuation EV/1-year forward revenue when adjusted for the 3-year growth rate. This helps to put the valuation in better perspective for Shopify.

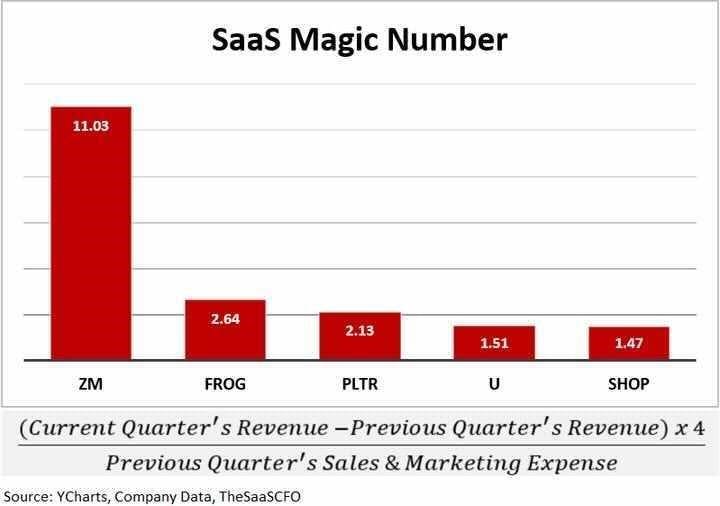
Below is how Shopify compares on sales efficiency which measures the output of sales and marketing compare to annual recurring revenue. A ratio above 1 indicates a sustainable business model. 

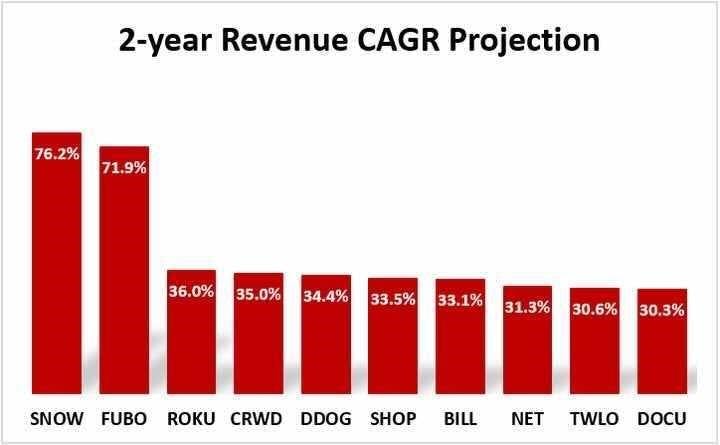
Also, here is a comparison looking at consensus projections 2 years out. We feel that Shopify can easily clear these 2-year projections.

Analyst Statements:

SHOP has 14 buy/outperform recommendations, 18 hold recommendations, and 3 underperform/sell recommendations.  

Wedbush analyst Ygal Arounian raised the PT of Shopify to $1,300 from $998 in September. “We continue to like the short-term trends and Shopify’s position to capture them, but this call is a longer-term one in addition to those trends, driven by Shopify’s position to capture share of the total retail [addressable market] as it builds out its retail OS,” he wrote.

KeyBanc Capital Markets analyst Josh Beck, who has an overweight rating on the stock, raised the PT from $1,150 to $1,250, said the Shopify Fulfillment Network, which was launched last year, "is a full-fledged, tightly integrated fulfillment solution for Shopify merchants and includes order/inventory management solutions, branding and data controls, and access to scalable, flexible warehousing space to sell across multiple channels."

Morgan Stanley analyst Keith Weiss said “We see SHOP growing the merchant base from 1 million today to 4.6 million by 2030 (Subscription Solutions reaching $4.2 billion), while also expanding the take rate and further powering the Merchant Flywheel (GMV reaches $737B, Merchant Solutions grows to $21 billion),” he said.

12/4 – Cleveland Research Initiated Shopify with a Buy. The analyst expects Subscription Solutions and Merchant

Solutions to experience growth better than consensus expectations in FY22

12/2 – Susquehanna Initiates Shopify at a Hold stating, “The company’s two revenue units of Subscription Solutions and Merchant Solutions have different revenue drivers and can be compared to (mostly) pure-plays in the market. For each business unit, we use a price-to-sales growth valuation given SHOP's high revenue growth levels vs. peers. We value Subscription Solutions at $200 per share and Merchant Solutions at $750 per share."

12/1 – Credit Suisse Rates Shopify Neutral with $1,100 PT, stating “Our $1,100 target price and Neutral rating for SHOP is based on our DCF analysis and implies a 2021 EV/Revenue multiple of 33x. While we remain positive on SHOP given numerous LT drivers, including: the secular shift to eCommerce, Shopify Plus, International, and adoption of additional merchant services (such as Fulfillment) we see risk reward more balanced at these levels.” 11/19 – Jefferies Upgrades to Buy from Hold stating: "We have a greater appreciation for SHOP's ability to deliver robust growth for the next several years and reach ~$10B of revenue in 2025 powered by a structural pull forward in e-commerce activity and better monetization of gross margin value."

10/30 – Argus Rates Shopify Buy with $1,200 PT stating “Although SHOP has run up sharply year-to-date, the company has a strong runway for growth in the small to mid-sized merchant market, which is only lightly penetrated.”


Podcast with Motley Fool: Big Tech Plus the 1 Stock I’d Buy Right Now

I had the privilege of joining Tim Beyers and Brian Feroldi on The Motley Fool podcast earlier this month.  In the hour-long interview, we cover topics such as big tech, my research process, tech valuations, and we also cover a number of individual stocks including Twilio, Bandwidth, Zoom, Facebook, and Palantir.

The discussion starts off with big tech and why I believe Google Cloud Platform has missed an opportunity to catch up to Microsoft Azure and Amazon Web Services on cloud IaaS. With that said, all three players are aggressively pursuing edge computing and how to combine the compute and storage from hypescalers with the low latency and speed offered by 5G connectivity. This is primarily being accomplished through partnerships between the hyperscalers and telecoms which are best described as “frenemies.”

Later in the interview, we dive into my research process and how I go about finding the top tech stocks.  One example of a trend that I think the market is misunderstanding is telehealth. The market is pricing the opportunity as a covid tailwind rather than pricing and evaluating the opportunity for early innings – especially as AI will merge with telehealth in the near future.

We also chat about what’s on everyone’s mind – which is whether tech valuations are in a bubble right now. I give some guidelines on what I consider to be attractive valuations versus unattractive valuations in the tech space and I break this down by annual revenue growth rates. 

Towards the end of the interview, they ask what is the one stock I’d buy right now and the one stock I’d sell right now. My answers include a lesser-known stock in the OTT advertising space that I am bullish on.

You can access my full interview with the Motley Fool podcast below

Access the interview here:

Interview timestamps:

0:00 – Introduction

4:40 – Discussion on Big Tech

7:40 – Does Google (GOOGL) need Google Cloud Platform to work out for the company to do well?

13:40 – Opinion on Fastly (FSLY)

19:20 – What is your process on researching stocks?

22:40 – Is it time to start talking about Salesforce (CRM) as a big tech company?

23:00 – Discussion about Twilio (TWLO)

28:00 – Thoughts on Bandwidth (BAND)

30:00 – How much potential does Twilio (TWLO) have?

35:00 – Is tech in a bubble right now?

37:00 – Guidelines on valuations for tech stocks

38:45 – What do you consider high growth, medium growth, and low growth?

39:30 – Discussion about Zoom (ZM) and its long-term outlook post-COVID

42:30 – What does product-market fit mean?

45:45 – 1 stock to buy and 1 stock to sell

49:50 – Top public stock pick in telehealth

50:55 – What private tech investors do you like to follow?

52:20 – Current state of hybrid cloud versus multi-cloud and the future of hybrid cloud

53:20 – Discussion about Datadog (DDOG) and the partnership with Microsoft Azure

56:40 – Thoughts on Palantir (PLTR)

Tech Growth Earnings Review for Q3 2020 – Part 3

In the 3rd part of my Q3 earnings analysis, I review reports from Zoom Video, Okta, Snowflake, Crowdstrike, ZScaler and Elastic.

Zoom Video

Zoom Video provided a nearly flawless earnings report for the first full quarter that followed initial work-from-home orders. The blend of Zoom Video having virality across consumers from its freemium model combined with enterprise is the company’s strength strategically as the competitors do not have the virality component. In Q3, customers with more than 10 employees represented 62% of revenue with net dollar expansion rate of 130%. Globally, Zoom exhibits strong growth, as well, with revenue from APAC and EMEA growing 629% year-over-year.

However, gross margins were a weakness in the report at 68.2% compared to 82.9% last year and 72.3% last quarter. The company is providing the service for free to many users including K-12 schools during the pandemic. From my perspective, the temporary margin hit in exchange for virality and establishing consumer behavior is a good trade-off.

Okta

According to most standards, Okta’s earnings report was solid and resulted in an uptick in the stock price. However, the growth has been flat for most of this year.

Revenue rose 42% to $217.4 million ahead of estimates for $202.7 million. Bookings (remaining performance obligations) are growing faster than revenue at 53% to $1.58 billion. Calculated billings were up 44% year-over-year. This was a re-acceleration of calculated billings from the previous quarters in FY2021 where the pandemic weighed on budgets.

The company is profitable on an adjusted basis with EPS of $0.04 and free cash flow of $41.6 million, up from $9 million a year ago. Highlights include a growing number of customers in the financial services sector and government.

Snowflake

Snowflake grew 119% year-over-year to $159.6 million with remaining performance obligations of $927.9 million, or 240% year-over-year growth. Product revenue grew 115% year-over-year. The net revenue retention rate of 162% is impressive although other companies have exceeded this in their 6th year (Snowflake was founded in 2012 but was in stealth mode until 2014 when it began to work with customers).
Gross margins are between 58% to 63%, which it’s normal for a cloud company to be lower than a SaaS company on margins. However, operating margins were negative (30%) with FCF margins of negative (23%). Probably the biggest issue that Snowflake faces are the sales and marketing costs. In the previous two quarters, they were near or exceeded total revenue and in this quarter they were about 90% of revenue at $134 million compared to the $159 million in revenue.

CrowdStrike

CrowdStrike beat consensus estimates on both the top and bottom lines and raised Q4 guidance. Revenue grew 86% YoY, representing an 8% beat above Wall Street estimates. Subscription revenue increased 87% YoY while annual recurring revenue advanced 81% compared to a year ago. The company also achieved its most impressive quarter ever in terms of profitability, earning $0.08 per share on the bottom line. This was CrowdStrike’s third consecutive quarter of positive EPS and its highest total yet. Free-cash-flow margin increased to 33% and gross margin improved to 76%.

In the quarter, CrowdStrike added 1,186 net new subscription customers, representing growth of 85% YoY. CrowdStrike also continues to drive new module adoption in existing customers, as 44% of the company’s subscription customers have adopted five or more modules versus 39% in the previous quarter.

Zscaler

ZScaler announced Fiscal Q1 2021 results that easily cleared analysts’ expectations. Revenue growth accelerated to 52% YoY, which represents the company’s third consecutive quarter of growth acceleration.

Adjusted billings growth increased 64% YoY, far surpassing the consensus expectation calling for 39% growth. This beat was driven in part by a record quarter of seven-figure deals. The company’s net retention rate of 122% advanced from 120% last quarter and 119% the quarter before. Non-GAAP EPS of $0.14 was 8 cents better than expectations while the company also announced an impressive 30% FCF margin. Non-GAAP operating margin of 14% far exceeds the consensus of 2.9%.
Elastic

Elastic announced strong FQ2 earnings on 12/2. Total revenue increased 43% YoY, representing an 11% beat above consensus. Total billings grew 42% YoY while SaaS revenue increased 81% versus the same period a year ago. The company’s losses also improved significantly, with non-GAAP EPS of -$0.03 coming in 17 cents better than expected. Non-GAAP operating loss improved to -$1.9 million, representing a -1% operating margin versus -10% projected. Gross margins also came in better than expected with 77% versus a consensus of 75%. FCF margin was -13% for the quarter.

Subscription revenue totaled 93% of Elastic’s total revenue in the quarter, with 45% of total revenue coming from outside the US. Management views this geographical distribution as a strength in the company’s business model. Elastic’s net retention rate ticked down several points from last quarter but still remained modestly above 130%. Elastic now has a total of 12,900 subscription customers with 650 of those (5%) having annual contract values exceeding $100K.

Read the Full Article at Forbes

Google Cloud Will Not Be Able To Overtake Microsoft Azure

This article was originally published on Forbes on Dec 3, 2020,11:03pm EST

Google Cloud certainly has the technical chops and engineering talent to compete with Microsoft Azure and Amazon’s AWS when it comes to cloud infrastructure, edge computing – and especially inferencing/training for machine learning models. However, Google may lack focus due to Search and YouTube being the main revenue drivers. This is seen from the company’s inability to ignite revenue growth in the cloud segment during a year when digital transformation has been accelerated by up to six years due to work-from-home orders.

In this analysis, we discuss why Google (Alphabet) may have missed a critical window this year for the infrastructure piece. We also analyze how Microsoft directed all of its efforts to successfully close the wide lead by AWS. Lastly, we look at how all three companies will bring the battle to the edge in an effort to maintain market share in this secular and fiercely competitive category.

Cloud IaaS Overview:

The three leading hyperscalers in the United States have diverse origins. Amazon found itself serendipitously holding server space year-round that it could rent out and was first to market by a wide lead. Amazon continues to release customization tools and cloud services for developers at a fast clip and this past week was no exception.  

Microsoft’s roots in enterprise created a direct path to upsell on-premise and become the leader in hybrid. The majority of the Fortune 500 is on Azure as they want seamless security and APIs regardless of the environment.

Google is one of the largest cloud customers in the world due to its search engine and mass-scale consumer apps, and therefore, is often first to create cloud services and architectures internally that later lead to widespread adoption, such as Kubernetes. Machine learning is another piece where Google was one of the first to require ML inference for mass-scale models.

Despite all three having very talented teams of engineers and various areas of strength, we see AWS maintain its lead and Microsoft Azure firmly hold the second-place spot. Keep in mind that Azure launched one year after Google Cloud yet has 3X the market share and is growing at a higher percentage.

Google cloud vs microsoft

CANALYS

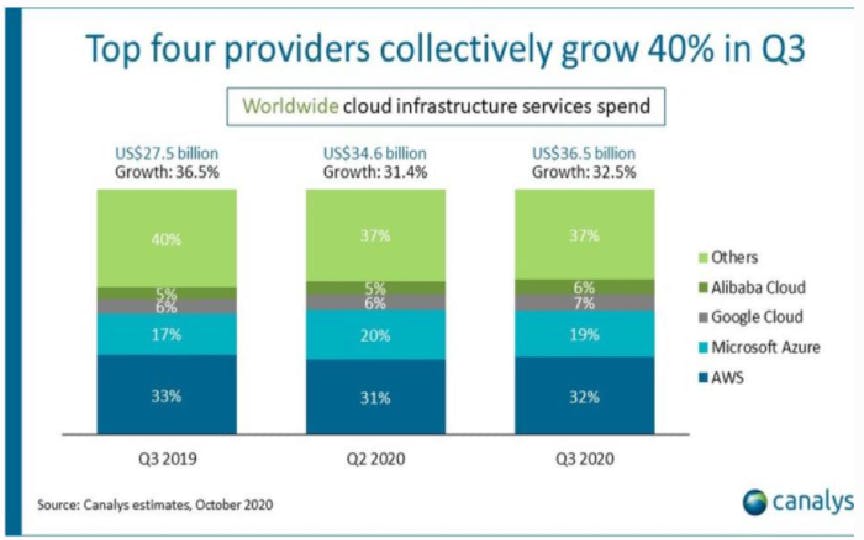
Google Cloud grew two percentage points from 5% to 7% since 2018 while Azure grew four percentage points from 15% to 19% in the same period. In the past year, Google Cloud saw a 1% gain compared to Azure’s 2% gain, according to Canalys.

Azure is under Intelligent Cloud but the company does break down the growth rate which was 48%. Although Google Cloud Is not specifically broken down, the Google Cloud segment grew 45% year-over-year compared to Microsoft Azure up 48% year-over-year.

Amazon Web Services is growing at 29%, which is substantial considering the law of large numbers. In the past two quarters, Google Cloud reported 43% year-over-year growth and 52% in the quarter before that. Microsoft has seen a slightly less deceleration from 51% and this is down from the 80%-range almost two years ago.

The key thing here is that when Microsoft held the percentage of market share that GCP currently holds, Azure was growing in the 80-90% range. This is the range we should be seeing from Google Cloud if the company expects to catch up to Azure.

Sign up for I/O Fund's free newsletter with gains of up to 403% – Click hereSign up for I/O Fund's free newsletter with gains of up to 403% – Click hereClick here

In 2020, the term “digital transformation” has become a buzzword with cloud companies seeing up to six years of acceleration. Nvidia is a bellwether for this with triple-digit growth in the data center segment in both Q2 and Q3. Despite this catalyst, Google has lagged the category in Q2 and Q3 in terms of both growth and percentage share of market. If there were any year that Google Cloud could pull ahead, it should have been this year.

Alphabet has emphasized that GCP is a priority and the company will be “aggressively investing” in the necessary capex. However, the window of opportunity was wide open this year and aggressive investments would ideally have been allocated during the years of 2017-2018 to stave off Azure’s high-growth years with 80-90%.

Google is Capable but Lacks Focus

There is no argument that Alphabet is an innovator within cloud and a leader in its own right. Across public, private and hybrid cloud, containers are used by 84% of companies and 78% of those are managed on Kubernetes – which has risen in popularity along with cloud-native apps, microservices architectures and an increase in APIs. Kubernetes was first created by Google engineers as the company ran everything in containers internally and this was powered by an internal platform called Borg which generated up to 2 billion container deployments a week. This led to automated orchestration rather than manual and also forced a new architecture away from monolithic as server-side changes were required.

Kubernetes also helps with scaling as it allows for scaling of the container that needs more resources instead of the entire application. Microservices dates back to Unix, while Kubernetes, the automation piece around containers, is what Google engineers invented before releasing it to the Cloud Native Foundation for widespread adoption.

Just as Google was one of the first to need automated orchestration for containerization of cloud-native apps, the company was also one of the first to require low-power machine learning workloads. The compute intensive workloads were running on Nvidia’s GPUs for both training and inferencing until Google made their own processing unit called Tensorflow (TPUs) to perform the workload at a lower cost and higher performance.

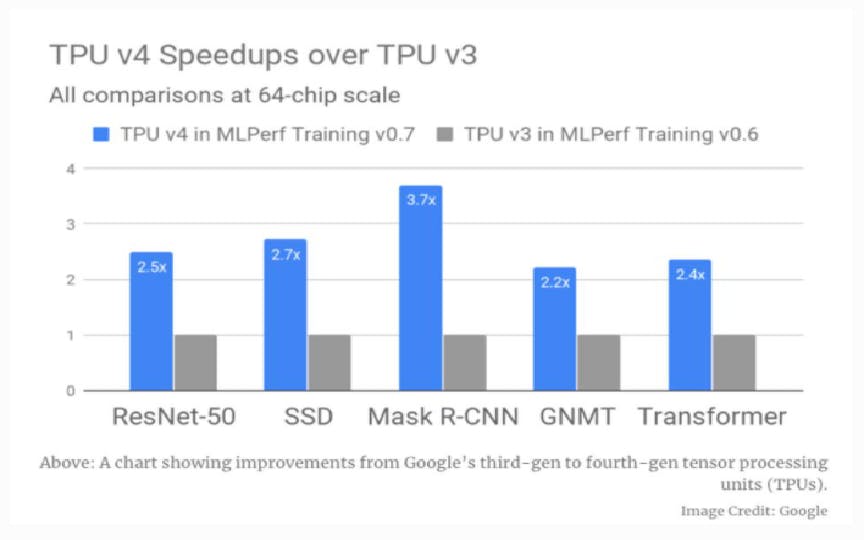
Performance between TPUs and GPUs is often debated depending on the current release (A100 versus fourth-generation TPUs is the current battle). However, the TPU does have an undisputed better performance per watt for power-constrained applications. Notably, some of this comes with the territory of being an ASIC, which is designed to do one specific application very well whereas GPUs can be programmed as a more general-purpose accelerator. In this case, the benchmarks where TPUs compete are object detection, image classification, natural language processing and machine translation – all areas where Google’s product portfolio of Search, YouTube, AI assistants, and Google Maps, for example, excels.

Google Cloud

GOOGLE

Notably, TPUs are used internally at Google to help drive down the costs and capex of its own AI and ML portfolio and they are also available to users of Google’s AI cloud services. For example, eBay adopted TPUs to build a machine learning solution that could recognize millions of product images.

Unless Google releases an internal technology as open-source, it won’t be adopted by the competitors. This is where Nvidia’s agnosticism becomes a positive as it’s universally used by Amazon, Microsoft, Google —- and Alibaba, Baidu, Tencent, IBM and Oracle. Meanwhile, TPUs create vendor lock in which most companies want to avoid in order to get the best capabilities across multiple cloud operators (i.e. multi-cloud). eBay is the exception here as the company needs Google-level object detection and image classification.

In a similar vein of Google being early to the company’s internal requirements, BigQuery is also a superior data warehouse system that competes with Snowflake (I cover Snowflake with an in-depth analysis here). BigQuery has a serverless feature that makes it easier to begin using the data warehouse as the serverless feature removes the need for manual scaling and performance tuning. Dremel is the query engine for BigQuery.

BigQuery has a strong following with nearly twice the number of companies as Snowflake and is growing around 40%. Due to AWS being a first mover and having a large cloud IaaS market share, Redshift has the biggest market presence but growth is nearly flat at 6.5%.

Point being, Google has important areas of strength and first-hand experience – whether it’s in data analytics, machine learning/inference or cloud-native applications at scale. Google’s search engine and other applications are often the first globally to challenge current architectures and inferencing capabilities.

However, as we see in the contrast between Google and Microsoft in the most recent earnings calls, Google has a hard time prioritizing cloud over the bigger revenue drivers. Meanwhile, Microsoft has a no holds barred approach with one, singular focus: Azure.

Q3 Earnings Calls

The most recent earnings calls from both Microsoft and Google could not have carried more contrast. Google focused primarily on search and YouTube while adding towards the last half of the call that GCP is where the majority of their investments and new hires were directed. Notably, one analyst wondered if the capex investments would eat at margins and produce enough returns. 

Microsoft, on the other hand, held an hour-long call that was nearly all-Azure including what the company is doing right now to capture more market share, a laundry list of large enterprises coming on board and strategic partnerships to strengthen its second place standing. The company’s beginning, middle and end was Azure and cloud services.

Here is a preview of how the two opened:

Thanks for joining us today. This quarter, our performance was consistent with the broader online environment. It's also testament to the investment we've made to improve search and deliver a highly relevant experience that people turn to for help in moments big and small. We saw an improvement in advertiser spend across all geographies, and most of verticals, with the world accelerating its transition to online and digital services. In Q3, we also saw strength in Google Cloud, Play and YouTube subscriptions.

This is the third quarter we are reporting earnings during the COVID-19 pandemic. Access to information has never been more important. This year, including this quarter showed how valuable Google's founding Product Search has been to people. And importantly, our products and investments are making a real difference as businesses work [indiscernible] and get back on their feet. Whether it's finding the latest information on COVID-19 cases in their area, which local businesses are open, or what online courses will help them prepare for new jobs, people continue to turn to Google search.

You can now find useful information about offerings like no contact delivery or curbside pickup for 2 million businesses on search and maps. And we have used Google's Duplex AI Technology to make calls to businesses and confirm things like temporary closures. This has enabled us to make 3 million updates to business information globally.

We know that people's expectations for instant perfect search results are high. That's why we continue to invest deeply in AI and other technologies to ensure the most helpful search experience possible. Two weeks ago, we announced a number of search improvements, including our biggest advancement in our spelling systems in over a decade. A new approach to identifying key moments and videos, and one of people's favorites hum to search which will identify a song noticed based on the humming. -Sundar Pichai, Q3 2020 Earnings CallSundar Pichai, Q3 2020 Earnings Call

Compare this to the tone for Microsoft’s earnings call …

We’re off to a strong start in fiscal 2021, driven by the continued strength of our commercial cloud, which surpassed $15 billion in revenue, up 31% year-over-year. The next decade of economic performance for every business will be defined by the speed of their digital transformation. We’re innovating across the full modern tech stack to help customers in every industry improve time to value, increase agility, and reduce costs.

Sign up for I/O Fund's free newsletter with gains of up to 403% – Click hereSign up for I/O Fund's free newsletter with gains of up to 403% – Click hereClick here

Now, I’ll highlight examples of our momentum and impact starting with Azure. We’re building Azure as the world’s computer with more data center regions than any other provider, now 66, including new regions in Austria, Brazil, Greece, and Taiwan. We’re expanding our hybrid capabilities so that organizations can seamlessly build, manage, and deploy their applications anywhere. With Arc, customers can extend Azure management and deploy Azure data services on-premise, at the edge, or in multi-cloud environments.

With Azure SQL Edge, we’re bringing SQL data engine to IoT devices for the first time. And with Azure Space, we’re partnering with SpaceX and SES to bring Azure compute to anywhere on the planet.

Leading companies in every industry are taking advantage of this distributed computing fabric to address their biggest challenges. In energy, both BP and Shell rely on our cloud to meet sustainability goals. In consumer goods, PepsiCo will migrate its mission critical SAP workloads to Azure. And with Azure for Operators, we’re expanding our partnership with companies like AT&T and Telstra, bringing the power of the cloud and the edge to their networks. Just last week, Verizon chose Azure to offer private 5G mobile edge computing to their business customers.  -Satya Nadella, Fiscal Q1 2021 Earnings (Calendar Year Q3 2020)Fiscal Q1 2021 Earnings (Calendar Year Q3 2020)

The calls continue in a similar manner with Microsoft making it clear they have their entire weight behind cloud while Google must continue to cater to its largest revenue drivers – search and consumer. The main takeaway we get from the call is that Google is investing in GCP rather than a takeaway of market dominance or growth. Here are a few examples:

As we’ve told you on these calls, given the progress we’re making, and the opportunity for Google Cloud in this growing global market, we continue to invest aggressively to build our go-to-market capabilities, execute against our product roadmap, and extend the global footprint of our infrastructure … And another: An obvious example is Cloud. We do intend to maintain a high level of investment, given the opportunity we see. That includes the ongoing increases in our go-to-market organization, our engineering organization, as well as the investments to support the necessary capex. So, hopefully, that gives you a bit more color there. And, also here … And the point that both Sundar and I have underscored is that we are investing aggressively in Cloud, given the opportunity that we see. And, frankly, the fact that we were later relative to peers, we're encouraged, very encouraged, by the pace of customer wins and the very strong revenue growth in both GCP and Workspace. We do intend to maintain a high level of investment to best position ourselves. And I kind of went through some of those items, the go-to-market team, the engineering team, and capex. And so we describe this as a multi-year path because we do believe we're still early in this journey.

The question remains if aggressively investing will have the same impact after the digital transformation has been accelerated by up to six years. Nobody could have predicted covid and the work-from-orders but we see from the growth rates on large revenue bases that AWS and Azure were better positioned to answer the demand.

Edge Computing: No rest for the weary

The race for cloud IaaS dominance is only beginning and the hyperscalers are not resting on their laurels as they compete for the edge. Major strategic partnerships are being struck with telecom companies to break open new uses cases for decentralized applications and increased connectivity. Google mentioned Nokia in their earnings call while Microsoft mentioned AT&T, Verizon and Telstra. Amazon also has partnerships with Verizon and Vodafone. (For brevity sake, you can assume every telecom company is either partnered or will be partnering with multiple hyperscalers for edge computing).

Here is a breakdown of the buildout and how these strategic partnerships plan to profit from 5G. The result will be new use cases, such as remote surgery, autonomous vehicles, AR/VR and a significant number of internet of things devices that aren’t feasible with 4G and/or with the current centralized cloud IaaS servers.

AWS Wavelength:

Amazon’s edge computing technologies are being rapidly built-out. For example, Wavelength is being embedded in Vodafone’s 5G networks throughout Europe in 2021 after being in beta for two years. This will provide ultra-low latency for application developers enabled by 5G. On Vodafone’s end, they have developed multi-access edge computing (MEC) to fit both 4G and 5G networks to process data and applications at the edge. This lowers processing time from about 50-200 milliseconds to 10 milliseconds. Amazon is also expanding its Local Zones to offer low-latency in metro areas from L.A. to about a dozen cities in 2021.

In order to support its retail business, AWS built out 200 points of presence where serverless processing like Lambda can run. The network latency map will be enhanced by telco partnerships who have about 150 PoPs per telco.

Microsoft Azure with Edge Zones:

Azure has the largest global footprint across the cloud providers. Where AWS has been the long-standing developer preference, Microsoft is the C-suite/enterprise preferred company across the Fortune 500. Microsoft’s goal will be to move compute closer to end users and to offer Azure-hosted compute and storage as a single virtual network with security and routing.

Microsoft excelled at hybrid as a strategy for taking market share (which I also detailed as the investment thesis for my position in Microsoft after the company missed Q3 2018 earnings and prior to winning the JEDI contract). Azure Edge Zones extends the current hybrid network platform to allow distributed applications to work across on-premise, edge data centers both public and private, Azure IaaS both public and private. This allows the same security and APIs to work seamlessly across these hybrid environments. The overarching performance will attempt to combine the range of compute and storage capabilities of Azure with the speeds/low-latency of the edge.

Google Cloud with Global Mobile Edge Cloud (GMEC):

Google is also partnering with telecom companies such as AT&T to deploy Google hardware inside AT&T’s network edge to run AI/ML models and other software for 5G solutions. Similar to AWS and Azure, the goal is to open up new use cases for industries, such as retail, manufacturing and transportation.

Anthos for Telecom is a Kubernetes-orchestrated infrastructure that can be deployed anywhere including an AWS cluster. In this way, the strategy for Google continues to amplify its strengths which is containerized network functions to merge edge and core infrastructure. This helps with decentralized applications and could potentially compete with “network slices” to where AT&T could potentially use local breakouts to offer a cloud service tier in a few years from now.

Conclusion:

We’ve seen Google build some of the best products for developers in terms of automating microservices and container-orchestration with Kubernetes and also ASIC chips (TPUs) that compete with the likes of Nvidia. I’m not betting against Google’s talented engineers by any means, rather I’m simply observing that the infrastructure piece is leaning towards more of a duopoly at this time. Cloud is expensive on a capex level, so if Google doesn’t find its footing, the margins driven by ads could take a hit in the near-term.

Who will lead software and AI applications is impossible to predict (and when) as the main competitors will be hundreds (if not thousands) of startups. With that said, I personally own Amwell because Google is a backer and I think health care is an example of a vertical where Google’s experience with data can deliver a serious competitive edge. To be clear, Alphabet may have an advantage with AI/ML software whereas this analysis is about the infrastructure. Perhaps there will be a catalyst in the future for Google Cloud to take more share but the strategy is not evident at this time.

Please note: The I/O Fund conducts research and draws conclusions for the Fund’s positions. We then share that information with our readers. This is not a guarantee of a stock’s performance. Please consult your personal financial advisor before buying any stock in the companies mentioned in this analysis.
Why It’s Too Late for Google Cloud to Overtake Microsoft Azure

In our latest Forbes report, we discuss why Google (Alphabet) may have missed a critical window this year for the infrastructure piece. We also analyze how Microsoft directed all of its efforts to successfully close the wide lead by AWS. Lastly, we look at how all three companies will bring the battle to the edge in an effort to maintain market share in this secular and fiercely competitive category.

Google Cloud grew two percentage points from 5% to 7% since 2018 while Azure grew four percentage points from 15% to 19% in the same period. In the past year, Google Cloud saw a 1% gain compared to Azure’s 2% gain, according to Canalys.

Azure is under Intelligent Cloud but the company does break down the growth rate which was 48%. Although Google Cloud Is not specifically broken down, the Google Cloud segment grew 45% year-over-year compared to Microsoft Azure up 48% year-over-year.

Amazon Web Services is growing at 29%, which is substantial considering the law of large numbers. In the past two quarters, Google Cloud reported 43% year-over-year growth and 52% in the quarter before that. Microsoft has seen a slightly less deceleration from 51% and this is down from the 80%-range almost two years ago.

The key thing here is that when Microsoft held the percentage of market share that GCP currently holds, Azure was growing in the 80-90% range. This is the range we should be seeing from Google Cloud if the company expects to catch up to Azure.

In 2020, the term “digital transformation” has become a buzzword with cloud companies seeing up to six years of acceleration. Nvidia is a bellwether for this with triple-digit growth in the data center segment in both Q2 and Q3. Despite this catalyst, Google has lagged the category in Q2 and Q3 in terms of both growth and percentage share of market. If there were any year that Google Cloud could pull ahead, it should have been this year.

Alphabet has emphasized that GCP is a priority and the company will be “aggressively investing” in the necessary capex. However, the window of opportunity was wide open this year and aggressive investments would ideally have been allocated during the years of 2017-2018 to stave off Azure’s high-growth years with 80-90%.

This analysis is about the infrastructure, not software. Perhaps there will be a catalyst in the future for Google Cloud to take more share but the strategy is not evident at this time.

Read the full article on Forbes

Kingsoft Cloud (KC)

On Friday, we initiated in Kingsoft Cloud. Please keep in mind, KC carries risk as the company has disclosed its earnings statements are not audited. As stated on the forum by our readers, the United States House is set to consider a measure this week to force U.S. listed Chinese companies to comply with audit terms. We cover additional risks below and Knox goes into the levels he is watching and how he plans to manage risk for this particular position.

We want to give a few bullet points here as to why we initiated despite the fact KC.

Overview:

We like Cloud IaaS in China and this is the basis for our Alibaba position. I mentioned this on the forum here. The United States cloud IaaS market is about $45 to $50 billion while China recently surpassed $5 billion – which reveals an important gap for this massive population.

According to some numbers, Kingsoft Cloud is the #3 cloud provider second to Alibaba and Tencent. According to others, Kingsoft Cloud is a close tie with Baidu in the #4 spot. Here is the quote from the S-1 filing: “We are the third largest internet cloud service provider in China with a market share of 5.4% in terms of revenue from Infrastructure as a Service, or IaaS, and Platform as a Service, or PaaS, public cloud services in 2019, according to Frost & Sullivan.”

Kingsoft could see multi-cloud as a tailwind due to being the largest independent cloud provider. Also, companies like Bytedance and iQIYI use KC to avoid using Tencent (direct competitor). The concentration of Bytedance and others is a risk.

Although market is undecided about Xiaomi’s involvement due to large customer concentration, we see this particular customer/backer as a positive. We like the Xiaomi has done well in China and we also like the focus on 5G, video content and health care/medical IoT to help KC find an edge against Alibaba, Tencent and Baidu. Xiaomi is the number two smartphone in China ahead of Apple and we think this resilience is a positive. In fact, we would not have invested without a strong backer in either AI or 5G so Xiaomi as an early investor, co-chairman and 14% of revenue is primary to our interest.

Kingsoft is focused on verticals, such as video streaming, gaming and health care. We like this approach as it shows an understanding of competitive positioning and clear differentiation from the larger competitors.

Kingsoft Cloud is scheduled be added to the MSCI China All Shares Index on November 30th at market close.

Net dollar retention rate is 155% in FY 2019

Revenue increased 72.6% year-over-year. This represents 48.1% growth from public cloud services and 257.3% growth from enterprise cloud services. Some of this was a rebound in enterprise from a covid deceleration. The company is expected to grow revenue 62% next year to $1.62 billion. To compare, Tencent Cloud is in the $3 billion range.

Adjusted gross profit was $16.9 million and adjusted EBITDA of -$3.9 million.


Risks

There are currently over 200 Chinese companies that are listed on U.S. exchanges. However, unlike U.S. companies that must comply with strict regulatory requirements, China-based audit firms are not in compliance with the U.S. Public Company Accounting Oversight Board (PCAOB) inspections required under the Sarbanes-Oxley Act of 2002 (SOX Act), which is supposed to apply to all U.S. listed publicly traded companies.  

The NASDAQ is requiring additional listing requirements for Chinese firms, while the U.S. Senate passed S. 945, the Holding Foreign Companies Accountable Act. This Act requires foreign companies to prove that they are not owned by governments, as well as requiring them to disclose to the SEC information that allows the PCAOB to perform inspections.

This change in U.S. regulations was soon followed by the Luckin Coffee fraud. The Chinese competitor to Starbucks admitted to falsifying their sales by roughly $2.2 billion yuan. This not only led to a sharp selloff in the stock, but also caused the NASDAQ to delist the stock.

The above reasons led to valuations in Chinese tech companies that are hard to come by in today’s markets. Because of the above risks, we will still invest in ideas we like, but with risk controls in place. Our two Chinese positions are Alibaba (BABA) and Kingsoft (KC), both of which now have stops in place. This will allow us to participate in the growth stories, while at the same time minimize our exposure to the macro and regulatory risks going on within China today.

The national debt to GDP ratio of the U.S. economy is estimated to be around 98% of GDP by the end of 2020, with the largest increase in government debt. In a similar response to the GFC, the Chinese government also attempted to stimulate their economy through debt, and is currently looking an unsustainable debt to GDP ratio of 317%, with the largest focus in corporate debt.

Basic Technical Analysis

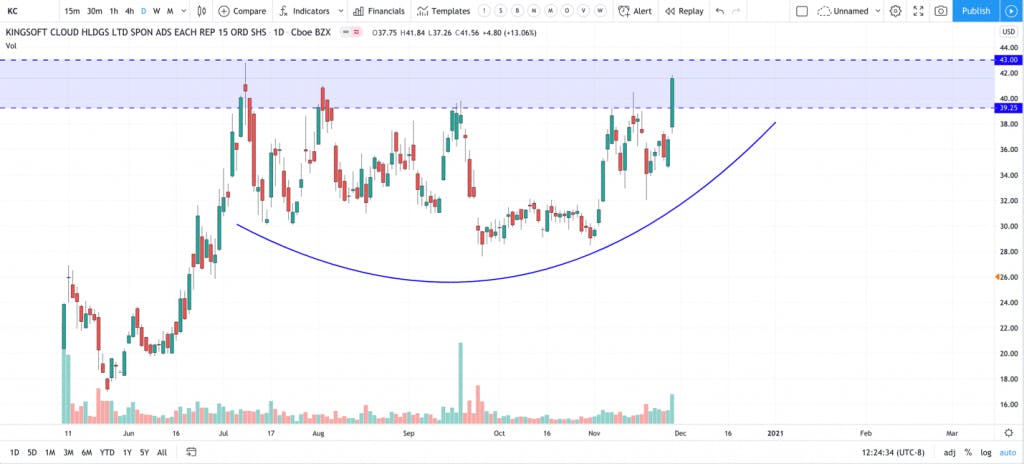
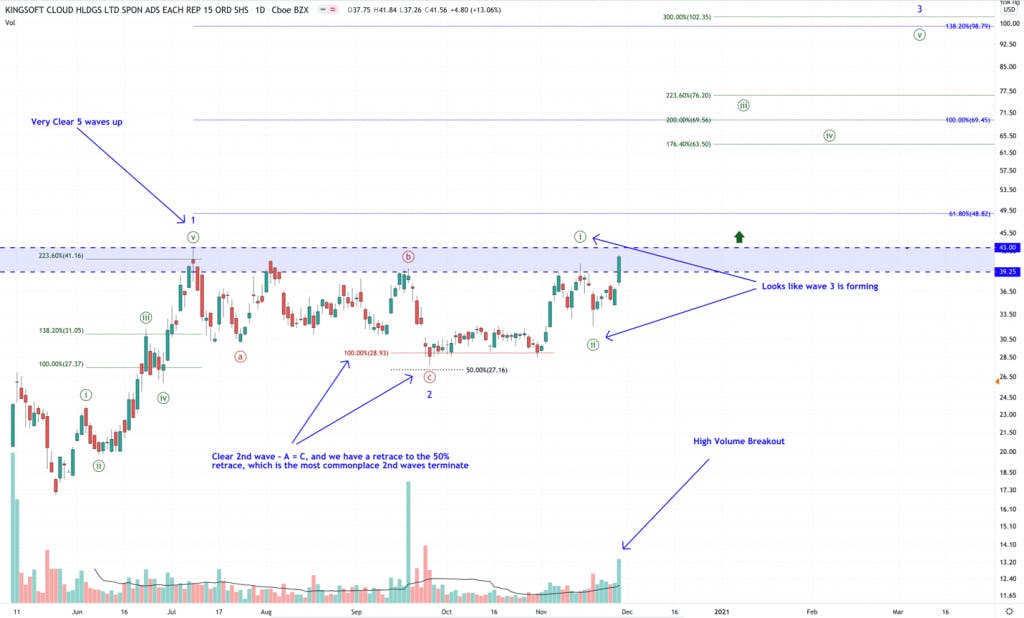
From a basic Technical Analysis perspective, we have a nice base that has formed, which provides a clear breakout zone.

Note the large volume spike accompanied by a long green candle. This suggests that the sellers have dried up, leading to a rush of buyers. Seeing Friday close above $39.25 is promising. The next level of resistance will be $43.

Elliott Wave Analysis

If we dived deeper into the price structure, we can get further support of a potential breakout on the horizon.

The above chart outlines my structural analysis of the current price action in KC. First off, from its all-time low, we have a clear 5 wave move to the ended just below the $43 level. Each wave within this structure (in green on the left), moved along standard extensions, further supporting a wave 1 within a larger uptrend (in blue).

We then saw a symmetrical retrace to the 50% retrace level of the first wave. Once again, we typically see 2nd waves terminate around the 50% retrace level. The structure of this retrace also was symmetrical.  In other words, the length of the c wave in red was around the same length of the a wave in red.

This retrace was then followed by another 5 wave move up, and smaller retrace, suggesting that we are in the early stages of the larger degree 3rd wave in blue. The move on Friday further supported this thesis when we saw a high volume breakout above the $39.25 resistance. If we see a further breakout above the $43 level the above targets will be in effect.

We will use a wider stop than normal in this starter position. We always start small, and if we analyze a trend accurately, which is confirmed by an increase in price, we tend to build on that position along the uptrend. We will have a stop at $31.90 based on the closing price.

Q3 2020 Earnings: Datadog, Roku, Square, The Trade Desk and JFrog

This article was originally published on Forbes on Nov 12, 2020,09:01pm ESTForbes on Nov 12, 2020,09:01pm EST

Roku

Roku reported Q3 earnings on November 5th. The 73% year-over-year revenue growth the company announced was 23% above consensus expectations. Gross profit rose 81% YoY while gross margin rose 216 basis points in total to 47.6%. 

Roku added 2.9M active accounts in the quarter (+43% YoY). Total streaming hours increased by 0.2 billion hours over the last quarter to 14.8B (+54% YoY), while ARPU grew 20% YoY to $27.

Roku was a beneficiary of the rebound in ad spend, as the company saw Q3 monetized video ad impressions grow 90% YoY vs. 50% YoY growth last quarter. Roku is anticipating that Q4 revenue growth will likely be in the mid-40% range, similar to the growth rate seen in the last few holiday seasons. Per the earnings call, the company is being cautious about holiday spending with this forecasted guidance. 

ROKU shares briefly hit all-time highs immediately following the announcement of these results.

Brands like DraftKings are shifting budgets especially as TV sports have been canceled and delayed. Roku also pointed towards CPG brands as a large driver for ad revenue in the current quarter.

We have got brands like DraftKings, for example, who is a big sports spender, had to shift budgets out of TV as sports were canceled and delayed. Has moved a significant portion of their budget into OTT.

In the earnings call, management felt confident the migration from linear TV would be a long-lasting trend after COVID.

We are not going back to the way it was to be clear. I mean, I think, COVID did — COVID triggered a lasting durable change in how CMOs and marketers are thinking about their TV ad spend. In Q3, we saw a 17% drop in linear viewing, Roku was up 54%, 92% of Roku cord-cutters are very satisfied with their decision to cut the cord and aren't planning to go back.

So I really think this is a one-way transfer function. We don’t go back to the older spending patterns, because the audience isn’t there, marketers need to follow the audience into OTT. And they stay, they stay because of the enhanced capabilities.

Roku also tackled the question of Wal-Mart and Comcast partnering. The CEO reiterated that Roku is the #1 TV operating system and software operating system in the United States and now Canada with a world-class team of software engineers. He also emphasized that Walmart is a large partner with Roku and has carried many Roku OEMs: 

In terms of Walmart, I will just say a few words. I mean, Walmart is a big retailer, a very strong partner of Roku’s. We have a great relationship with them. They sell millions of Roku players a year. They sell millions of Roku TVs for various Roku OEMs, including TCL, Hisense, RCA, Philips, JVC.

We build — we help them build on branded, which is their house brand, Roku TVs, smart TVs, and that’s a business that’s been growing extremely well for them. So, it’s a great partnership and it’s a long-standing partnership, and we have put a lot of work into making sure that it stays strong.

Square

Square announced blowout Q3 results with huge beats on both the top and bottom lines. Non-GAAP EPS of $0.34 beat consensus expectations by $0.18. The company saw revenue grow 140% YoY to $3.03B, beating the consensus estimate by $950M or 46%. 

Gross payment volume of $31.7B was 6% above expectations. In total, Square saw gross profit rise 59% YoY, while Cash App gross profit soared 212% YoY. 

In the quarter, the number of average daily transacting Cash App customers nearly doubled from the same period last year. Square did not provide guidance for Q4, but noted in its shareholder letter that the trends they observed in Q3 remained strong through October.

Sign up for I/O Fund's free newsletter with gains of up to 403% – Click hereSign up for I/O Fund's free newsletter with gains of up to 403% – Click hereClick here

Square’s Seller Ecosystem revenue grew 5% YoY as regions began to reopen. More impressive was the growth of Square’s Cash App Ecosystem, which saw an increase of 23% in daily active users and 574% YoY growth in revenue. 

Bitcoin revenue for Square grew 11x last year’s total, but even excluding Bitcoin transactions, Square grew Cash App revenue 174% YoY this quarter. This is an acceleration from the 140% Cash App growth (excluding bitcoin revenue) Square recorded last quarter, and 98% growth previous to that. 

Square is focused on expanding Cash App’s utility beyond peer-to-peer payments, CEO Jack Dorsey remarked in the company’s shareholder letter“We remain focused on increasing daily utility for our Cash App customers to products beyond peer-to-peer payments, which helps drive higher engagement and monetization.” 

Square’s investments into increasing Cash App engagement continue to pay off as the company’s Cash App Ecosystem displayed an acceleration in growth across the board this quarter. 

Chart: Cash App shows an acceleration in growth across the board this quarter

BETH.TECHNOLOGY

Jack Dorsey noted that Square is positioned to benefit in both segments moving forward:

“We continue to believe that our Seller and Cash App ecosystems are well-positioned to benefit from the acceleration of secular shifts, such as omnichannel commerce, contactless payments, and digital wallets for consumers.” 

The company did not give Q4 guidance due to uncertainties yet did discuss what they have seen so far through Q4. Square's Seller Ecosystem saw a modest acceleration from Q3 in October:

“Seller GPV was up 8% year over year, which improved modestly compared to year-over-year results in the third quarter.” 

Cash App has seen a modest decrease in transaction volume in October, which management attributes to the end of government stimulus programs and unemployment benefits:

“Gross profit growth in October moderated compared to the third quarter, driven by a decrease in transaction volume per active customer. We believe this was partly a result of the end of government stimulus programs and unemployment benefits at the end of July, as stored funds in Cash App have decreased since July.”.

The Trade Desk

The Trade Desk announced Q3 results that easily cleared analysts’ expectations. Revenue grew 32% YoY, beating consensus estimates by 19%. Non-GAAP EPS of $1.27 was a big beat on the consensus bottom-line expectation of $0.45. The company noted that it saw Connected TV grow over 100%, Mobile video spend grow 70% and Audio spend grow 70%. 

Management issued an upbeat outlook for Q4, expecting $289M in revenue at the midpoint vs. expectations of $255.1M. At the midpoint of this estimate, The Trade Desk is expecting roughly 34% YoY revenue growth in Q4. TTD shares traded over $700 for the first time immediately following the announcement of these results. 

Most impressive from TTD’s report was exceeding 100% YoY growth in their Connected TV segment. CEO Jeff Green remarked in the company’s press release that COVID has accelerated advertising innovation across the board:

"So far in 2020, we've seen several years of advertising disruption and innovation compressed into a few months. As a result, advertisers have become more deliberate and data-driven with every advertising dollar." 

In the Q3 earnings call, Green talked more about how companies are adapting data-driven measurement strategies for justifying marketing budgets:

“We recently surveyed more than 200 top advertisers, around 85% of them said they are under new pressure from CFOs to justify marketing spend and to measure against business goals.” 

Despite The Trade Desk’s beat, the company did not report the numbers that Snap or Pinterest did (32% growth versus 50-60% growth). TTD’s stock is trading at a valuation that has been historically very hard to sustain in ad-tech.

Rarely, does ad-tech trade over 20 forward price-to-sales even during high-growth periods. Not only is The Trade Desk well exceeding the mean but is trading roughly 200% higher than peers even though Roku, Pinterest and Snap had a better current quarter and are forecasting stronger forward guidance. 

Charts: The Trade Desk stock trading 2x more expensive than ad-tech peers

The Trade Desk stock trading 2x more expensive than ad-tech peers that reported much higher revenue growth. – YCHARTS

TTD’s forward PE Ratios (not pictured) is also outsized at 168 compared to Facebook’s 30 forward PE Ratio. Facebook’s PE Ratio has never exceeded 119 even during its high-growth quarters of 100%+ growth and/or with low EPS (law of large numbers). 

Facebook’s current P/S has also never exceeded 20 even during its high-growth quarters. 

This is despite The Trade Desk facing headwinds with Apple’s changes to IDFA. Apple extended the iOS update from September to an undetermined time “early next year.”

BETH KINDIG Tweet about Apple's iOS change

On September 3rd, Apple delays IDFA changes until early next year – @BETH_KINDIG

Although the risks are hard to quantify right now, most advertising experts are in agreement this will affect the entire mobile ad industry on iOS. Facebook has stated they would shut down Audience Network as most ad exchanges need some kind of identifier for targeting and attribution. Here is a great write-up from mobile analyst Eric Seufert on how this could affect ad prices. 

The Trade Desk has stated only 10% of its inventory uses the IDFA but has made no clarifications on how it will run mobile attribution and measurement without an identifier, whether that’s Apple’s or their own. There are efforts from a collective federation of ad companies to use encrypted emails, although there is no guarantee would Apple would allow this on iOS and Safari even if the ad industry agrees to pursue this method. ATS requires users to authenticate which is another unproven factor in the work flow.

Sign up for I/O Fund's free newsletter with gains of up to 403% – Click hereSign up for I/O Fund's free newsletter with gains of up to 403% – Click hereClick here

Overall, the risk is an unknown and we will get real answers it looks like “early next year.” For The Trade Desk, it’s a risk investors need to be aware of.  Notably, publisher segments can help augment targeting but this will come from the supply-side.

Datadog announced strong Q3 results and an upside outlook that cleared analyst expectations. The company grew revenue 61% YoY to $155M, representing a 7% beat above consensus estimates.  

The company grew customer count by 38% in the quarter versus consensus expectations of 32% and added 92 new customers with over $100K ARR (+52% YoY), slightly above the consensus estimate of 90. 

Datadog

In Q3, Datadog recorded its 13th consecutive quarter with a dollar-based net retention rate exceeding 130%. Operating margin improved to 9% in the quarter versus expectations of 0.6%, while gross margin improved 3% to 79%.  

Q4 guidance was issued for $163M in revenue at the midpoint (+43% YoY) which was 5% above the consensus outlook. Datadog shares initially sold off as much as 14% on these results, but the stock pared its losses to close trade on Wednesday. The stock rebounded Thursday and is now up over 11% off Wednesday’s lows.  

In its Q3 earnings call, Datadog’s CEO Olivier Pomel commented on the recovery in usage trends the company observed after a weak Q2. “Throughout the quarter, usage growth of existing customers was robust which was a return to more normalized levels after slower usage expansion in Q2…the pace of usage growth in Q3 was broadly in line with pre-COVID historical levels.”  

After a period of cloud spend conservation among Datadog’s enterprise customers in Q2, the company added a record amount of ARR in the quarter. The company managed to do so profitably, as operating income, cash flow and FCF all came in above expectations. 

Notably, Datadog’s CAC payback period decreased to ~12 months from ~18 months sequentially despite adding over 400 more customers in Q3 versus Q2.  

The ~12 month payback period recorded in Q3 is more in line with pre-COVID levels, as last quarter is looking more like an outlier given the aforementioned headwinds the company faced in Q2.

Datadog’s platform has proven to be easily adaptable and sticky for enterprise customers migrating to the cloud, as evidenced by the increasing number of existing customers using more Datadog products. CEO Olivier Pomel remarked on this in the company’s earnings call when he said: “our platform strategy continues to resonate and win in the market. As of the end of Q3, 71% of customers are using two or more products, which is up from 50% last year. Approximately 20% of customers are using four or more products which is up from only 7% a year ago.”  

CEO Olivier Pomel also commented on the partnerships Datadog announced in Q3 with Microsoft Azure and Google Cloud Platform, noting that the flow of revenue from these partnerships will not be immediate: “there's not going to be an immediate impact, but we see that as being potentially meaningful contribution in the mid to long-term.” 

The partnerships with Microsoft Azure and Google Cloud Platform that Datadog announced in the quarter, along with the existing alliance with Amazon Web Services, validates the company’s leadership in cloud-native-observability and establishes its collaborative relationship with the world’s top public hyperscalers. Over the long term, Datadog expects that these partnerships will become meaningful sources of revenue growth.  

Looking ahead to Q4, Datadog is confident the rebound in usage trends the company observed in Q3 will continue.  CFO, David Obstler alluded to this expectation in the conference call: “Throughout the quarter, we saw usage growth that was more in line with pre-pandemic historical levels. The trend was broad-based and sustained throughout the quarter. This provides us with confidence that what we experienced in Q2 was a transitory optimization effort that were related to the challenging macro environment.”  

With the normalization of customer usage trends and secular tailwinds related to digital transformation and cloud migration, management continues to believe that Datadog is very well positioned to capture a “large and growing long-term market opportunity.” 

JFrog

JFrog announced earnings for Q3 in its first quarter as a public company. The company grew revenue 40% YoY, beating consensus expectations by 3%. JFrog also announced Non-GAAP EPS of $0.05, beating expectations by 5 cents. 

Gross margins came in at an impressive 83% while FCF margin improved to 25% in Q3. For Q4, JFrog expects $41.4M in revenue at the midpoint vs. consensus of $40.52M. The stock has initially sold off up to 10% on the results, as the 40% revenue growth represents a deceleration from the 46% growth recorded last quarter. Even after today's sell-off, FROG still trades at approximately 30x 2021 revenue, which remains among the highest valuations in the software industry.

Here is what the Analysts ratings for the recent string of IPOs and where JFrog ranks:

Graphs: New IPO Analyst Ratings

 Here is what the Analysts ratings for the recent string of IPOs and where JFrog ranks – BETH.TECHNOLOGY

When factoring in how fast some software names are growing, we see that JFrog still remains relatively expensive. With the deceleration, it’s likely we see an adjustment to JFrog’s valuation over the next quarter.

Growth Adjusted EV/2021 Revenue Chart

Growth Adjusted EV/2021 Revenue – BETH.TECHNOLOGY

We will be covering earnings again next week so consider giving us a follow.

Disclosure: Beth Kindig owns shares of Roku and Datadog, may purchase shares of Square in the near future and and she has owned shares of The Trade Desk and may again in the future. The information contained herein is not financial advice.

Tech Growth Earnings Review for Q3 2020 – Part 2

In the second part of my Q3 2020 tech earnings review series, I covered Roku, Square, The Trade Desk, Datadog and JFrog.

Roku

Roku reported Q3 earnings on November 5th. The 73% year-over-year revenue growth the company announced was 23% above consensus expectations. Gross profit rose 81% YoY while gross margin rose 216 basis points in total to 47.6%.

Roku added 2.9M active accounts in the quarter (+43% YoY). Total streaming hours increased by 0.2 billion hours over the last quarter to 14.8B (+54% YoY), while ARPU grew 20% YoY to $27.

Roku was a beneficiary of the rebound in ad spend, as the company saw Q3 monetized video ad impressions grow 90% YoY vs. 50% YoY growth last quarter. Roku is anticipating that Q4 revenue growth will likely be in the mid-40% range, similar to the growth rate seen in the last few holiday seasons. Per the earnings call, the company is being cautious about holiday spending with this forecasted guidance.

Square

Square announced blowout Q3 results with huge beats on both the top and bottom lines. Non-GAAP EPS of $0.34 beat consensus expectations by $0.18. The company saw revenue grow 140% YoY to $3.03B, beating the consensus estimate by $950M or 46%.

Gross payment volume of $31.7B was 6% above expectations. In total, Square saw gross profit rise 59% YoY, while Cash App gross profit soared 212% YoY.

In the quarter, the number of average daily transacting Cash App customers nearly doubled from the same period last year. Square did not provide guidance for Q4, but noted in its shareholder letter that the trends they observed in Q3 remained strong through October.

Square’s Seller Ecosystem revenue grew 5% YoY as regions began to reopen. More impressive was the growth of Square’s Cash App Ecosystem, which saw an increase of 23% in daily active users and 574% YoY growth in revenue.

The Trade Desk

The Trade Desk announced Q3 results that easily cleared analysts’ expectations. Revenue grew 32% YoY, beating consensus estimates by 19%. Non-GAAP EPS of $1.27 was a big beat on the consensus bottom-line expectation of $0.45. The company noted that it saw Connected TV grow over 100%, Mobile video spend grow 70% and Audio spend grow 70%.

Management issued an upbeat outlook for Q4, expecting $289M in revenue at the midpoint vs. expectations of $255.1M. At the midpoint of this estimate, The Trade Desk is expecting roughly 34% YoY revenue growth in Q4. TTD shares traded over $700 for the first time immediately following the announcement of these results.

Datadog

In Q3, Datadog recorded its 13th consecutive quarter with a dollar-based net retention rate exceeding 130%. Operating margin improved to 9% in the quarter versus expectations of 0.6%, while gross margin improved 3% to 79%.

Q4 guidance was issued for $163M in revenue at the midpoint (+43% YoY) which was 5% above the consensus outlook. Datadog shares initially sold off as much as 14% on these results, but the stock pared its losses to close trade on Wednesday. The stock rebounded Thursday and is now up over 11% off Wednesday’s lows.

In its Q3 earnings call, Datadog’s CEO Olivier Pomel commented on the recovery in usage trends the company observed after a weak Q2. “Throughout the quarter, usage growth of existing customers was robust which was a return to more normalized levels after slower usage expansion in Q2…the pace of usage growth in Q3 was broadly in line with pre-COVID historical levels.”

JFrog

JFrog announced earnings for Q3 in its first quarter as a public company. The company grew revenue 40% YoY, beating consensus expectations by 3%. JFrog also announced Non-GAAP EPS of $0.05, beating expectations by 5 cents.

Gross margins came in at an impressive 83% while FCF margin improved to 25% in Q3. For Q4, JFrog expects $41.4M in revenue at the midpoint vs. consensus of $40.52M. The stock has initially sold off up to 10% on the results, as the 40% revenue growth represents a deceleration from the 46% growth recorded last quarter. Even after today’s sell-off, FROG still trades at approximately 30x 2021 revenue, which remains among the highest valuations in the software industry.

Read the Full Article on Forbes

Marvell and Inphi: Acquisition Analysis

Previous Analysis Referenced in this Report:

b69daa12-bd66-49dd-b78b-e97240767c9f_Marvell-and-Inphi-Acquisition-Analysis.pdf

Marvell and Inphi: Acquisition Analysis

It’s not every day that we see this level of consolidation across key players in the semiconductor industry.  

As stated in the AMD-Xilinx PDF, Marvell’s ASICs were becoming favored in 5G for various reasons, including power consumption and lower cost over time. The 5G product-market fit compliments Inphi’s recent trials with Verizon, which were deemed successful in September for supplying interconnects across its content delivery network. 

Many of my readers ask me about edge computing in relation to momentum stocks. Marvell-Inphi with customers like Samsung and Nokia on infrastructure and Verizon or AT&T for the network are at the center of edge computing. 

On that note, Marvell-Inphi promises to be a challenging acquisition to analyze. For one, it is not a common household name or even among the most recognized in semiconductor names (although we have already tackled both separately). For two, Marvell’s fundamentals do not show its potential – and this is key to understanding the opportunity. Three, Marvell is taking on a sizable debt load to acquire Inphi. Fourth, the market may take time to figure out the potential of this acquisition as the synergy is forward-looking.

The conclusion here is that we are very bullish and this PDF serves as our investment thesis.

The $10 Billion Strategy Behind Inphi

I’ve seen editorials written by some journalists believe that Nvidia “wants it all” as the Arm acquisition takes the GPU-leader outside of the data center for AI and ML workloads. 

Well, AMD-Xilinx and Marvell-Inphi are here to say that Nvidia will not “have it all.” Perhaps Nvidia will lead in general artificial intelligence use cases, and now edge devices with Arm if the acquisition is approved, but AMDXilinx will be a serious player in more complex AI and ML computing tasks, for example space and autonomous vehicles. These are two areas where Xilinx shows strong growth and AMD can lower the barrier to entry for developers. The exact use cases and demand for AMD-Xilinx would be hard to predict but will be greater than the two parts of owning CPUs and AI acceleration with FPGAs. 

However, for Marvell, the door is wide open on 5G and this has been confirmed by customers in the critical hour for 5G infrastructure. The Nokia Q3 2019 earnings call, which I have referred to many times, is not to be taken lightly as it sets the stage for an important shift in the chip of choice for major 5G players. Below, we see Intel’s ongoing stock price decline and AMD and Marvell’s positive price action.  

Due to the timing of this acquisition and the product road map for both Marvell and Inphi, I see this as a big move by Marvell to own 5G base stations and compute plus now photonics for edge computing (intricately linked to the 5G buildout). 

The majority of analysis written on this acquisition will discuss how it strengthens Marvell’s position for the data center due to silicon photonics as Marvell is mainly copper right now. Data centers are a core market to help stabilize Marvell against competitors but the growth opportunity for Marvell (and the reason I am investing) is for the lead Marvell currently has in 5G.

We have covered both Marvell and Inphi on this site with full-length reports. You can access them here:  

Marvell Technology: 2019 Analysis

Inphi: Premium Analysis

Acquisition Overview:

Last week, Marvell announced an agreement to acquire Inphi in a cash and stock transaction for $10 billion for a combined enterprise value of $40 billion. The transaction will generate an annual run-rate of $125 million within 18 months after the transaction closes. 

The deal is expected to be accretive to Marvell’s adjusted EPS by the end of the first year after the transaction closes with an anticipated date in the first half of 2021. Ownership will be 83% Marvell and 17% Inphi.

Inphi is expected to add more than $750 million in annual revenue with operating-EBITDA margins in the mid-30% range. The proforma gross margins will be an estimated 63.5%. 

Marvell will finance part of the transaction through JP Morgan Chase which will increase the debt on the balance sheet. The proposal is for $4 billion of new debt with $1.5 million in a committed term loan and $2.5 billion in a bridge loan commitment. Despite this, Marvell has stated in the Investors Presentation that the company plans to maintain the current dividend policy.

The new addressable market is placed at $23 billion with an acceleration in market growth of 12% CAGR. 

Source: Investor Presentation

Financials:

Marvell:

Marvell released Q2 results on August 27 with revenue growth of 11% year-over-year to $727.3 million. EPS was $0.21 on adjusted income of $140.4 million compared to $0.16 EPS on $110 million last year. 

For Q2, the company had cash of $831 million and debt of $1.4 billion. Free cash flow in Q2 was at $205.2 million. The company stated Q3 revenue would be $750 million +/- 5%. The next earnings release will be on December 3rd.

TTM revenue was $2.80 billion with net income of $1.41 billion and EPS of $2.09.

Inphi:

Inphi released results on October 29th. Revenue grew by 92% year-over-year to $180.7 million. Adjusted EPS was $0.88 on adjusted income of $47.9 million compared to $0.45 EPS on $21.5 million last year. 

Management forecasted Q4 revenue to be in the range of $185 million to $189 million. Adjusted net income in the range of $47.2 million to $50.6 million at $0.85-$0.91 EPS.

TTM revenue was $598.1 million with an adjusted loss of $61 million for EPS of ($1.29).

Inphi had cash and marketable securities of $223 million and debt of $508 million as of September 30th. Free cash flow in Q3 of $13.4 million. 

More on Valuation …  

The acquisition to acquire Inphi will be paid in 60% stock, with the remaining 40% in cash.  The transaction will include $66 in cash and 2.323 shares of the combined company for current Inphi shareholders.  

The cash and stock deal will value Inphi at approximately $10B at its purchase price. Marvell shareholders will have an 83% stake in the combined company and Inphi shareholders will command a 17% stake on a fully-diluted basis.  

Marvell plans to close the acquisition in H2 2021, financing the deal with current cash on hand and obtained debt financing. At the $10B purchase price, Marvell will be paying 12.4x 2021 revenue to acquire Inphi. This valuation is on the steeper side, but Inphi recorded 92% YoY sales growth in its most recent quarter compared to just 11% growth for Marvell. In this sense, the deal will be accretive to revenue growth, gross margins, and operating margins.  

On a Pro Forma basis, the acquisition of Inphi will improve Marvell’s growth rate, gross margin, operating margin, and EBITDA margin. The acquisition will also double Marvell's number of $100M+ cloud & networking customers to 8.  

Marvell currently trades at 7.4x 2021 revenue and the acquisition of Inphi to drive higher growth should eventually lead to a higher multiple. As stated under Financials, the deal is expected to expand Marvell’s TAM to $23B in 2023 and accelerate market growth to 12% CAGR.  

1-year returns for Inphi and Marvell:

1-year forward price-to-sales across semiconductors:

What Analysts Have to Say:

10/30: Marvell upgraded to Buy from Hold at Craig-Hallum Craig-Hallum analyst Christian Schwab upgraded Marvell (MRVL) to Buy from Hold with a price target of $48, up from $44 following the company's announcement to acquire Inphi (IPHI). Schwab agrees with management that the acquisition of Inphi will help transform Marvell into a faster growing cloud and 5G player. The acquisition improves Marvell's long term growth outlook to 12%16%, from 10%-15% alone, Schwab says, adding that with synergies, the combined company offers long-term investors an attractive long-term model.

10/29: Morgan Stanley downgrades Inphi, raises Marvell price target after takeover deal.  As previously reported, Morgan Stanley analyst Joseph Moore downgraded Inphi (IPHI) to Equal Weight from Overweight with a price target of $159, down from $162, following Marvell's (MRVL) announcement of a cash and stock deal to acquire the company. Moore, who thinks the two businesses "fit together nicely," raised his price target on Marvell shares to $40 from $37 following the deal announcement. He keeps an Equal Weight rating on Marvell shares, stating that although the company has used M&A to put themselves in a better position, its legacy Marvell businesses are "struggling."

10/20: Keybanc analyst John Vinh resumed Marvell coverage with overweight rating and $55 price target due to $1 billion 5G revenue potential stating "MRVL is one of the best-positioned companies to benefit from the inflection in 5G infrastructure deployments." The analyst cites 35%+ operating margins and believes Marvell will achieve over $1 billion in 5G revenues by FY23-24.

Note: this analyst is guiding up from $600M in annual 5G revenue that Marvell’s management guided previously.  

Fitch: In addition to the analyst comments, Fitch Ratings revised Marvell from Positive to Stable with a credit rating of BBB-. The outlook takes into consideration that the combined revenue growth “may fall short of forecasts, and provide insufficient profitability and cash flow to return elevated leverage metrics.”  

Despite Fitch expecting strong design wins and annualization of acquisitions during fiscal 2020 that drives the FCF margin into the teens from 4.2%, the debt to operating EBITDA will nearly double from 1.9X to 3.5X pro forma. 

Fitch believes Marvell is stronger in market position than both Micron and Broadcom and is in-line with NXP. The key assumptions include strong design wins for Marvell especially in networking, driving growth acceleration to mid-to-high single digits compared to the overall semiconductor industry growing at low-single digits in the forecast period. Fitch also forecasts operating EBITDA and cash flow margins to expand. The company also forecasts shareholder returns to be “flattish” until debt-to-operating EBITDA returns to 2X. 

Patrick Moorhead, a semiconductor specialist for Moor insights, has positive things to say about the data center opportunity with Marvell’s strong positioning in copper networking and now adding Inphi’s silicon photonics for networking. He references Marvell’s DPU and storage networking as a solid synergy with Inphi’s photonics interconnects. 

Product Overview:

Inphi will add silicon photonics to Marvell’s copper-based networking. Both companies are in the networking layer with Inphi stronger on data centers and Marvell stronger in 5G (competitively speaking). Together, they will expand the footprint in both the data center and 5G arenas. 

Some analysts critiqued AMD as having less-than-desirable M&A history. Marvell, on the other hand, pushed into 5G very successfully following the Cavium acquisition. This leads many analysts to believe the Marvell-Inphi acquisition will follow the same path to strengthen Marvell’s positioning in the data center.  

However, as stated, I believe the impetus could be Marvell’s 5G and edge networking strategy. Networks like Verizon badly need Inphi’s interconnects to drive high-speed connections between its content delivery network servers, which are expanding their footprint for 5G. The data center is an all-out battleground with lots of big tech throwing around muscle. However, specifically in 5G, Inphi can help solidify Marvell’s lead and perhaps help dig a moat for Marvell’s ASICs.  

When it comes to data center networking, however, there is no moat of any kind to be had. For example, Mellanox is a competitor on networking ethernet and has the 800-pound weight of Nvidia behind the company. Therefore, did Marvell take on a 3.5X debt-to-EBITDA ratio to be a small fish in a big pond? I don’t think so when Marvell can be the big fish in the 5G pond. 

Data Center:

We discussed Inphi at length in this PDF but will summarize a few points below. You can access the Inphi full-length report here. e Inphi full-length report here.

Inphi is the leader in PAM4 electro-optics. This market has seen tailwinds due to data center spending and the need for more bandwidth from COVID’s streaming and traffic usage. As stated in the PDF, we expected Inphi’s growth to continue on an investable trajectory due to its aggressive product road map for fiber optics that connect both short distances (PAM4 DSP) and long distances (coherent DSP). 

Regarding the product road map, Inphi currently supplies 400-gigabit PAM4 pluggables that are made with a 7nm process compared to a 16 nm process which reduces power consumption. Artificial intelligence and data center switching will drive the demand for 800-gigabit PAM4 modules to increase the speed of input-output and to process the data flows. Inphi announced the industry’s first 800-gigabit client-side pluggable modules earlier this year. 

Part of the 2021 story for Inphi is the release of the Spica DSP (the aforementioned 800-gigabit PAM4) which is expected to be deployed in volume. This will double the throughput (bandwidth) due to an 8x100Gpbs optical transceiver. The main application for the 2021 story is the transition of optical connectivity inside and between AI clusters. 

COLORZ II is the other half to the 2021 story for Inphi as the silicon photonics technology increases metro-access bandwidth to facilitate edge computing through a “network fabric.” COLORZ allows regional data centers to be linked together in the same metro region to function as one single mega data center. Verizon recently completed an important trial using Inphi’s COLORZ II optics.    

In March of 2019, Marvell released a new Ethernet switch solution for edge and private data centers. The solution uses compostable infrastructure, which allows for compute, storage and networking to be managed by software and removes the need to configure by hardware. This is one example of how Inphi and Marvell can complement one another. 

To elaborate more on PAM4-based connectivity …  

Hyperscalers are going through an ongoing upgrade cycle that requires high bandwidth and port density. PAM4 connects networking ASICs and machines, like servers and AI machines. Digital-based PAM4 uses analog-to-digital converters to clean up the signal in the digital domain before converting it back to analog to transmit. This allows developers to configure various deployment scenarios via software. This software configurability is a compatible match with Marvell’s ASICs.  

Semiconductor experts will tell you that silicon photonics connecting hyperscalers and network carriers are the future. This is the primary architecture for edge computing — hyperscalers and 5G networks connected regionally with solutions like what Inphi offers.

We mentioned in the PDF that Microsoft is a large customer for Inphi’s COLORZ DCI product including for global build-outs related to the Pentagon contract. I’ll place the quote here from the Inphi PDF – which should be strengthened under Marvell: 

“As I discussed on our prior earnings call, we're still consistently expecting our ZR solution to go to production in the first half of 2021 and ramp into volume starting in the mid-2021. And so you should expect the second half of 2021 to be a significant revenue driver coming from the 400-gig ZR solution at multiple cloud data centers as well as telecom operators.” And so you should expect the second half of 2021 to be a significant revenue driver coming from the 400-gig ZR solution at multiple cloud data centers as well as telecom operators.”  

Marvell supplies the data center with Thunder X2 Arm-based processors which provides the computational performance of an Arm server with I/O connectivity, memory bandwidth and capacity. Nvidia partnered with Marvell to port the CUDA-X AI libraries and tools to the platform. 

Marvell also offers DPUs, which require an analysis of their own as Nvidia plans to compete here. Briefly, DPUs stand for Data Processing Unit and will become more commonplace in the future as they move data around the  data center. Its roots are a system-on-a-chip (SoC) and is software programmable. Marvell will become a major player here and this is a future bull thesis for Marvell in addition to the current thesis outlined here.

5G Infrastructure:

As stated in the Investors Presentation, Marvell leads with base station compute. This sets the bandwidth bar and cadence while Inphi adds the fronthaul and backhaul interconnect. 

Marvell supplies components for 5G base stations with Nokia and Samsung as customers. Although Marvell has exposure to Huawei, these two suppliers can make up for this exposure in time. 

We have covered ASICs in detail in both the Marvell PDF and the AMD-Xilinx PDF. ASICs stands for applicationspecific integrated circuit and are customized to perform one very specific function. Recently, 5G infrastructure has favored ASICs over FPGAs – which is key to the success that Marvell has seen in 2020 and beyond. One driving factor is that ASICs cost less over time while rivaling FPGAs on efficiency and power.  

The main point here is that Marvell has a serious opportunity to be the front-runner in 5G infrastructure. The 5G network will soon rival cloud infrastructure on data and processing, and therefore, I believe quite a bit of Marvell’s strategy with Inphi resides in the interconnects increasing the speed of the 5G network and reducing capex by removing steps in the network layer. 

As stated in the Marvell PDF, the company is attempting to offer end-to-end network infrastructure with baseband DSPs, Arm multi-core SoCs (system on chips), purpose- built hardware accelerators, Ethernet connectivity engines and system-level security solutions. 

Although Marvell aims to offer specific-use ASICs and semi-custom ASICs, the 5G platform that Marvell offers will be adaptable for many use cases to expand on any ASIC limitations. Adding Inphi to this will strengthen the endto-end network infrastructure offering by Marvell. 

This matters when you analyze supply and demand. To me (as an investor), the data center with DPUs/Liquid IO, Thunder X Arm-based platform and now Inphi’s silicon photonics are the core business but the demand for 5G and edge networking are the tailwind and growth opportunity that I am primarily keen on for 2021. With that said, I don’t want to overlook Marvell’s potential with DPUs in 2022-ish. 

With Inphi, Marvell has the potential to own edge networking with very few competitors on ASICs and silicon photonics in this arena whereas the data center is highly competitive. Inphi’s solutions connect edge switches (and core switches) over both short and long distances (the long distances being more important for 5G), which along with Marvell’s lead on base stations, is a strong combination for the 5G build-out.